Descargar PDF - Nutrición Hospitalaria
264
Órgano Oficial Sociedad Española de Nutrición Parenteral y Enteral ❙ Sociedad Española de Nutrición ❙ Federación Latino Americana de Nutrición Parenteral y Enteral ❙ Federación Española de Sociedades de Nutrición, Alimentación y Dietética Nutrición Hospitalaria Volumen 35 Número 5 Septiembre-Octubre Páginas 1003-1253 ISSN (versión papel): 0212-1611 ISSN (versión electrónica): 1699-5198 Factor de impacto: 0,747 (2016) www.nutricionhospitalaria.org Editorial Productos lácteos suplementados y salud ósea................................................ 1003 Trabajos Originales Nutrición artificial Colocación de catéteres centrales de inserción periférica (PICC) mediante control electrocardiográfico intracavitario (ECG-IC) de la punta del catéter ........................... 1005 Límites de precipitación en nutriciones parenterales pediátricas con fuentes de calcio y fosfato orgánicas ........................................................................................... 1009 Paciente crítico Effects of intravenous fluid overload on caloric and protein deficit in critically ill patients ...... 1017 Pediatría Características maternas e infantiles asociadas a obesidad en lactantes menores de un año de edad del norte de México .............................................................. 1024 Somatotypes of schoolchildren from Chile: higher endomorphic components among adolescent girls..................................................................................... 1033 Relación entre la lactancia materna exclusiva los primeros seis meses de vida y el desarrollo de resistencia a la insulina en niños y adolescentes de Bucaramanga, Colombia........................................................................................................ 1042 Asociación entre conducta alimentaria y estado nutricional en preescolares chilenos ......................................................................................................... 1049 Study on the nutritional status and feeding habits in school-children in Madrid City (Spain) during the economic crisis ................................................................ 1054 Nutrición en el anciano Association between adductor pollicis muscle thickness and nutritional parameters in hospitalized elderly patients ............................................................................ 1059 The association between obesity and vitamin D status among older adults in Ecuador: analysis of the SABE survey ................................................................ 1066 Obesidad y síndrome metabólico Vitamin A deficiency is associated with body mass index and body adiposity in women with recommended intake of vitamin A ..................................................... 1072 Causas y componentes del síndrome metabólico en receptores de trasplante renal, desde una perspectiva de género ...................................................................... 1079 Diabetes mellitus tipo 2 podría predecir una pérdida subóptima de peso después de una cirugía bariátrica .................................................................................... 1085 Estudio de investigación cualitativa sobre las diferencias entre hombres y mujeres en la percepción de la obesidad, sus causas, abordaje y repercusiones para la salud........ 1090 Evaluation of factors that may influence in the insufficient weight loss in patients after two years of Roux-en-Y gastric bypass ........................................................ 1100 Valoración nutricional Serum vitamin D level and its relation to thyroid hormone, blood sugar and lipid profiles in Iranian sedentary work staff ................................................................ 1107 Self-perception of weight and physical fitness, body image perception, control weight behaviors and eating behaviors in adolescents............................................ 1115 Poor dietary intake and low nutritional knowledge in adolescent and adult competitive athletes: a warning to table tennis players ........................................... 1124 The influence of the aesthetic body shape model on adolescents with eating disorders ..... 1131 Agreement between Graz Malnutrition Screening (GMS) with subjective nutritional assessment instruments in hospitalized patients .................................................... 1138 Epidemiología y dietética Parasitic infections, malnutrition and anemia among preschool children living in rural areas of Peshawar, Pakistan........................................................................ 1145 Prevalence and factors associated with fat-soluble vitamin deficiency in adolescents .. 1153 Desarrollo de una herramienta de tamizaje para consumo elevado de sodio en una población adulta mexicana ................................................................................ 1163 In vivo randomized trial of three marketed milk preparations enriched with calcium and vitamins (D and K) on bone mass and bone turnover markers from biological fluids in premenopausal Caucasian women .......................................................... 1174 Dietary intake and adequacy in Mexican preschool children: National Health and Nutrition Survey 2012 ................................................................................ 1186 Otros Effect of L-arginine intake on exercise-induced hypotension ................................... 1195 The risk of eating disorders and academic performance in adolescents: DADOS study ...... 1201 Health-related physical fitness of normal, stunted and overweight children aged 6-14 years in Macedonia.................................................................................. 1208 Vitamin A nutritional status in patients with coronary artery disease and its correlation with the severity of the disease .......................................................................... 1215 Revisión Tamizaje nutricional en paciente pediátrico hospitalizado: revisión sistemática ............ 1221 Artículo Especial Aceite de palma y salud cardiovascular: consideraciones para valorar la literatura ...... 1229 Grupo de Trabajo SENPE Manejo nutricional de la esclerosis lateral amiotrófica: resumen de recomendaciones .... 1243 In Memoriam Pilar Marco Garde (1944-2018) ......................................................................... 1252
-
Upload
khangminh22 -
Category
Documents
-
view
1 -
download
0
Transcript of Descargar PDF - Nutrición Hospitalaria

NU
TR
ICIÓ
N H
OS
PIT
ALA
RIA
Vo
l. 35
, N.º
5, S
EPTI
EMBR
E-OC
TUBR
E 20
18
Órgano Oficial
Sociedad Española de Nutrición Parenteral y Enteral ❙ Sociedad Española de Nutrición ❙ Federación Latino Americana de Nutrición Parenteral y Enteral ❙ Federación Española de Sociedades de Nutrición, Alimentación y Dietética
NutriciónHospitalaria
Volumen 35 Número 5 Septiembre-Octubre Páginas 1003-1253
ISSN (versión papel): 0212-1611 ISSN (versión electrónica): 1699-5198 Factor de impacto: 0,747 (2016)
www.nutricionhospitalaria.org
EditorialProductos lácteos suplementados y salud ósea ................................................ 1003
Trabajos OriginalesNutrición artificialColocación de catéteres centrales de inserción periférica (PICC) mediante control electrocardiográfico intracavitario (ECG-IC) de la punta del catéter ........................... 1005
Límites de precipitación en nutriciones parenterales pediátricas con fuentes de calcio y fosfato orgánicas ........................................................................................... 1009
Paciente críticoEffects of intravenous fluid overload on caloric and protein deficit in critically ill patients ...... 1017
PediatríaCaracterísticas maternas e infantiles asociadas a obesidad en lactantes menores de un año de edad del norte de México .............................................................. 1024
Somatotypes of schoolchildren from Chile: higher endomorphic components among adolescent girls ..................................................................................... 1033
Relación entre la lactancia materna exclusiva los primeros seis meses de vida y el desarrollo de resistencia a la insulina en niños y adolescentes de Bucaramanga, Colombia ........................................................................................................ 1042
Asociación entre conducta alimentaria y estado nutricional en preescolares chilenos ......................................................................................................... 1049
Study on the nutritional status and feeding habits in school-children in Madrid City (Spain) during the economic crisis ................................................................ 1054
Nutrición en el ancianoAssociation between adductor pollicis muscle thickness and nutritional parameters in hospitalized elderly patients ............................................................................ 1059
The association between obesity and vitamin D status among older adults in Ecuador: analysis of the SABE survey ................................................................ 1066
Obesidad y síndrome metabólicoVitamin A deficiency is associated with body mass index and body adiposity in women with recommended intake of vitamin A ..................................................... 1072
Causas y componentes del síndrome metabólico en receptores de trasplante renal, desde una perspectiva de género ...................................................................... 1079
Diabetes mellitus tipo 2 podría predecir una pérdida subóptima de peso después de una cirugía bariátrica .................................................................................... 1085
Estudio de investigación cualitativa sobre las diferencias entre hombres y mujeres en la percepción de la obesidad, sus causas, abordaje y repercusiones para la salud ........ 1090
Evaluation of factors that may influence in the insufficient weight loss in patients after two years of Roux-en-Y gastric bypass ........................................................ 1100
Valoración nutricionalSerum vitamin D level and its relation to thyroid hormone, blood sugar and lipid profiles in Iranian sedentary work staff ................................................................ 1107
Self-perception of weight and physical fitness, body image perception, control weight behaviors and eating behaviors in adolescents............................................ 1115
Poor dietary intake and low nutritional knowledge in adolescent and adult competitive athletes: a warning to table tennis players ........................................... 1124
The influence of the aesthetic body shape model on adolescents with eating disorders ..... 1131
Agreement between Graz Malnutrition Screening (GMS) with subjective nutritional assessment instruments in hospitalized patients .................................................... 1138
Epidemiología y dietéticaParasitic infections, malnutrition and anemia among preschool children living in rural areas of Peshawar, Pakistan ........................................................................ 1145
Prevalence and factors associated with fat-soluble vitamin deficiency in adolescents .. 1153
Desarrollo de una herramienta de tamizaje para consumo elevado de sodio en una población adulta mexicana ................................................................................ 1163
In vivo randomized trial of three marketed milk preparations enriched with calcium and vitamins (D and K) on bone mass and bone turnover markers from biological fluids in premenopausal Caucasian women .......................................................... 1174
Dietary intake and adequacy in Mexican preschool children: National Health and Nutrition Survey 2012 ................................................................................ 1186
OtrosEffect of L-arginine intake on exercise-induced hypotension ................................... 1195
The risk of eating disorders and academic performance in adolescents: DADOS study ...... 1201
Health-related physical fitness of normal, stunted and overweight children aged 6-14 years in Macedonia.................................................................................. 1208
Vitamin A nutritional status in patients with coronary artery disease and its correlation with the severity of the disease .......................................................................... 1215
RevisiónTamizaje nutricional en paciente pediátrico hospitalizado: revisión sistemática ............ 1221
Artículo EspecialAceite de palma y salud cardiovascular: consideraciones para valorar la literatura ...... 1229
Grupo de Trabajo SENPEManejo nutricional de la esclerosis lateral amiotrófica: resumen de recomendaciones .... 1243
In MemoriamPilar Marco Garde (1944-2018) ......................................................................... 1252

© Copyright 2018. SENPE y © ARÁN EDICIONES, S.L.Reservados todos los derechos. Ninguna parte de esta publicación puede ser reproducida, transmitida en ninguna forma
o medio alguno, electrónico o mecánico, incluyendo fotocopias, grabaciones o cualquier sistema de recuperación de almacenaje de información, sin la autorización por escrito del titular del Copyright.
La editorial declina toda responsabilidad sobre el contenido de los artículos que aparezcan en esta publicación.Publicación bimensual con 6 números al año
Tarifa suscripción anual (España): profesional 240 € + IVA - Instituciones 275 € + IVATarifa suscripción anual (Internacional): profesional 400 € + IVA - Instituciones 514 € + IVA
Esta publicación se encuentra incluida en EMBASE (Excerpta Medica), MEDLINE (Index Medicus), Scopus, Chemical Abstracts, Cinahl, Cochrane plus, Ebsco, Índice Médico Español, preIBECS, IBECS, MEDES, SENIOR, Scielo, Science Citation Index Expanded
(SciSearch), Cancerlit, Toxline, Aidsline y Health Planning Administration.
La revista Nutrición Hospitalaria es una revista open access, lo que quiere decir que todo su contenido es accesible libremente sin cargo para el usuario individual y sin fines comerciales. Los usuarios individuales están autorizados a leer, descargar, copiar, distribuir, imprimir, buscar o enlazar a los textos completos de los artículos de esta revista sin permiso previo del editor o del autor, de acuerdo
con la definición BOAI (Budapest Open Access Initiative) de open access.
Esta revista se publica bajo licencia CC BY-NC-SA (http://creativecommons.org/licenses/by-nc-sa/4.0/).
La reutilización de los trabajos puede hacerse siempre y cuando el trabajo no se altere en su integridad y sus autores sean adecuadamente referenciados o citados en sucesivos usos, y sin derecho a la producción de obras derivadas.
Suscripciones
C/ Castelló, 128, 1.º - 28006 Madrid - Tel. 91 782 00 30 - Fax: 91 561 57 87e-mail: [email protected]
Publicación autorizada por el Ministerio de Sanidad como Soporte Válido, Ref. SVP. Núm. 19/05-R-CM. ISSN (versión papel): 0212-1611. ISSN: (versión electrónica): 1699-5198
Depósito Legal: M-34.850-1982
ARÁN EDICIONES, S.L.
C/ Castelló, 128, 1.º - 28006 Madrid - Tel. 91 782 00 30 - Fax: 91 561 57 87e-mail: [email protected]
www.grupoaran.com
Órgano Oficial
Sociedad Española de Nutrición Parenteral y Enteral ❙ Sociedad Española de Nutrición ❙ Federación Latino Americana de Nutrición Parenteral y Enteral ❙ Federación Española de Sociedades de Nutrición, Alimentación y Dietética
NutriciónHospitalaria
www.nutricionhospitalaria.org

Volumen 35 Número 5 Septiembre-Octubre Páginas 1003-1253
ISSN (versión papel): 0212-1611 ISSN (versión electrónica): 1699-5198 Factor de impacto: 0,747 (2016)
Órgano Oficial
Sociedad Española de Nutrición Parenteral y Enteral ❙ Sociedad Española de Nutrición ❙ Federación Latino Americana de Nutrición Parenteral y Enteral ❙ Federación Española de Sociedades de Nutrición, Alimentación y Dietética
NutriciónHospitalaria
Director
José Manuel Moreno VillaresDepartamento de Pediatría. Clínica Universidad de Navarra. Madrid
Subdirector
Gabriel Olveira FusterUGC de Endocrinología y Nutrición. Hospital Regional Universitario de Málaga
Director Emérito
Jesús M. Culebras FernándezDe la Real Academia de Medicina y Cirugía de Valladolid y del Instituto de
Biomedicina (IBIOMED), Universidad de León. Ac. Profesor Titular de Cirugí[email protected]
Coordinadores del Comité de RedacciónAlicia Calleja FernándezUniversitat Oberta de Catalunya (Barcelona)[email protected]
Ángel M. Caracuel GarcíaHospital Regional Universitario de Málaga (Málaga)[email protected]
Álex González de AgüeroUniversidad de Zaragoza (Zaragoza)[email protected]
Ignacio Jáuregui LoberaUniversidad Pablo de Olavide (Sevilla)[email protected]
Rosa Angélica Lama MoréCentro Médico D-medical (Madrid)[email protected]
Luis Miguel Luengo PérezH. U. Infanta Cristina (Badajoz)[email protected]
Daniel de Luis RománH. U. de Valladolid (Valladolid)[email protected]
Isabel Martínez del RíoCentro Médico Nacional 20 de noviembre. ISSSTE (México)[email protected]
Miguel A. Martínez OlmosC. H. U. de Santiago (Santiago de Compostela)[email protected]
M.ª Dolores Mesa GarcíaUniversidad de Granada (Granada)[email protected]
Consuelo Pedrón GinerSección de Gastroenterología y Nutrición. H. I. U. Niño Jesús (Madrid)[email protected]
María Dolores Ruiz LópezCatedrática de Nutrición y Bromatología Universidad de Granada (Granada)[email protected]
Francisco J. Sánchez-MunizDepartamento de Nutrición y Ciencias de los Alimentos. Facultad de Farmacia. Universidad Complutense (Madrid)[email protected]
Alfonso Vidal CasariegoC. H. U. de Ferrol (A Coruña) [email protected]
Carmina Wanden-BergheHospital Gral. Univ. de Alicante ISABIAL-FISABIO (Alicante)[email protected]
Comité de RedacciónJulia Álvarez Hernández (H. U. de Alcalá. Madrid)
M.ª Dolores Ballesteros Pomar (Complejo Asis. Univ. de León. León)
Teresa Bermejo Vicedo (H. Ramón y Cajal. Madrid)
Patricia Bolaños Ríos (Inst. de Ciencias de la Conducta. Sevilla)
Irene Bretón Lesmes (H. G. U. Gregorio Marañón. Madrid)
Rosa Burgos Peláez (H. Vall d’Hebrón. Barcelona)
Miguel Ángel Cainzos Fernández (Univ. de Santiago de Compostela. Santiago de Compostela)
Miguel Ángel Carbajo Caballero (H. Campo Grande. Valladolid)
José Antonio Casajús Mallén (Universidad de Zaragoza. Zaragoza)
Sebastián Celaya Pérez (H. C. U. Lozano Blesa. Zaragoza)
Ana I. Cos Blanco (H. U. La Paz. Madrid)
Cristina Cuerda Compés (H. G. U. Gregorio Marañón. Madrid)
Ángeles Franco-López (H. U. del Vinalopó. Elche, Alicante)
Raimundo García García (H. San Agustín. Avilés, Asturias)
V. García Mediavilla (IBIOMED, Universidad de León. León)
Pilar García Peris (H. G. U. Gregorio Marañón. Madrid)
Carmen Gómez-Candela (H. U. La Paz. Madrid)
Javier González Gallego (Instituto de Biomedicina (IBIOMED). Universidad de León. León)
Marcela González-Gross (Univ. Politécnica de Madrid. Madrid)
Francisco Jorquera Plaza (Complejo Asist. Univ. de León. León)
Miguel León Sanz (H. U. 12 de Octubre. Madrid)
Gonzalo Martín Peña (Hospital de La Princesa. Madrid)
María Cristina Martín Villares (H. Camino de Santiago. Ponferrada. León)
José Luis Máuriz Gutiérrez (IBIOMED, Universidad de León. León)
Alberto Miján de la Torre (Hospital General Yagüe. Burgos)
Juan Carlos Montejo González (H. U. 12 de Octubre. Madrid)
Paloma Muñoz-Calero Franco (H. U. de Móstoles. Madrid)
Juan José Ortiz de Urbina González (Complejo Asist. Univ. de León. León)
Carlos Ortiz Leyba (Hospital Virgen del Rocío. Sevilla)
Pedro Pablo García Luna (H. Virgen del Rocío. Sevilla)
Venancio Palacios Rubio (H. Miguel Servet. Zaragoza)
José Luis Pereira Cunill (H. Virgen del Rocío. Sevilla)
Antonio Pérez de la Cruz (Universidad de Granada. Granada)
Nuria Prim Vilaró (H. Vall D’Hebron. Barcelona)
Pilar Riobó Serván (Fundación Jiménez Díaz. Madrid)
José Antonio Rodríguez Montes (H. U. La Paz. Madrid)
Inmaculada Ruiz Prieto (Inst. de Ciencias de la Conducta. Sevilla)
Jordi Salas Salvadó (H. U. de Sant Joan de Reus. Tarragona)
Jesús Sánchez Nebra (Hospital Montecelo. Pontevedra)
Javier Sanz Valero (Universidad de Alicante. Alicante)
Ernesto Toscano Novella (Hospital Montecelo. Pontevedra)
M.ª Jesús Tuñón González (Instituto de Biomedicina (IBIOMED). Universidad de León. León)
Gregorio Varela Moreiras (Univ. CEU San Pablo. Madrid)
Clotilde Vázquez Martínez (H. Ramón y Cajal. Madrid)
Salvador Zamora Navarro (Universidad de Murcia. Murcia)
Consejo Editorial IberoamericanoCoordinadorA. Gil HernándezUniv. de Granada (España)
C. Angarita (Centro Colombiano de Nutrición Integral y Revista Colombiana de Nutrición Clínica. Colombia)
E. Atalah (Universidad de Chile. Revista Chilena de Nutrición. Chile)
M. E. Camilo (Universidad de Lisboa. Portugal)
F. Carrasco (Asociación Chilena de Nutrición Clínica y Metabolismo. Universidad de Chile. Chile)
A. Criveli (Revista de Nutrición Clínica. Argentina)
Jesús M. Culebras (Instituto de Biomedicina (IBIOMED). Universidad de León. España)
J. Faintuch (Hospital das Clinicas. Brasil)
M. C. Falçao (Revista Brasileña de Nutrición Clínica. Brasil)
A. García de Lorenzo (Hospital Universitario La Paz. España)
D. H. De Girolami (Universidad de Buenos Aires. Argentina)
A. Jiménez Cruz (Univ. Autónoma de Baja California. Tijuana, Baja California. México)
J. Klaasen (Revista Chilena de Nutrición. Chile)
G. Kliger (Hospital Universitario Austral. Argentina)
L. Mendoza (Asociación Paraguaya de Nutrición. Paraguay)
Luis A. Moreno (Universidad de Zaragoza. España)
S. Muzzo (Universidad de Chile. Chile)
L. A. Nin Álvarez (Universidad de Montevideo. Uruguay)
F. J. A. Pérez-Cueto (Universidad de la Paz. Bolivia)
M. Perman (Universidad Nacional del Litoral. Argentina)
J. Sotomayor (Asociación Colombiana de Nutrición Clínica. Colombia)
H. Vannucchi (Archivos Latino Americanos de Nutrición. Brasil)
C. Velázquez Alva (Univ. Autónoma Metropolitana. Nutrición Clínica de México. México)
D. Waitzberg (Universidad de São Paulo. Brasil)
N. Zavaleta (Universidad Nacional de Trujillo. Perú)

J U N T A D I R E C T I V A D E L A S O C I E D A D E S P A Ñ O L AD E N U T R I C I Ó N P A R E N T E R A L Y E N T E R A L
Coordinadora
Cristina Cuerda Compés
Secretaria
Pilar Matía Martín
Vocales
Laura Frías SorianoMaría Dolores Ruiz LópezClara Vaquerizo Alonso
Pilar Gomis MuñozCleofé Pérez-Portabella Maristany
Coordinador Grupos de Trabajo SENPE
Alfonso Vidal Casariego
COMITÉ CIENTÍFICO-EDUCACIONAL
Presidencia
Dr. Miguel León Sanz
Vicepresidencia
Lluisa Bordejé Laguna
Secretaria
Rosa Burgos Peláez
Coordinador Comité Científico-Educacional
Cristina Cuerda Compés
Tesorera
Mercedes Cervera Peris
Vocales
Miguel Ángel Martínez OlmosCarmina Wanden-Berghe Lozano
María José Sendrós MadroñoRosana Ashbaugh Enguinados
w w w . s e n p e . c o m
NutriciónHospitalaria


sum
ario
SumarioVol. 35 Septiembre-Octubre N.º 5
Editorial
Productos lácteos suplementados y salud óseaM. Muñoz Torres y A. Muñoz Garach ........................................................................................................................... 1003
Trabajos Originales
Nutrición artificialColocación de catéteres centrales de inserción periférica (PICC) mediante control electrocardiográfico intracavitario (ECG-IC) de la punta del catéterE. Santacruz, R. Mateo-Lobo, B. Vega-Piñero, J. Riveiro, G. Lomba, R. Sabido, F. Carabaña y J. I. Botella-Carretero .................. 1005
Límites de precipitación en nutriciones parenterales pediátricas con fuentes de calcio y fosfato orgánicasA. Lázaro Cebas, S. Pablos Bravo, P. Gomis Muñoz, M. Á.l Orbaneja, S. Spiers, M. Shinn y J. M. Ferrari Piquero ....................... 1009
Paciente críticoEfectos de la sobrecarga de líquidos por vía intravenosa en el déficit calórico y proteico en pacientes críticamente enfermosS. S. Arantes, J. M. Silva Jr, J. E. de Aguilar-Nascimento y D. B. Dock-Nascimento ............................................................... 1017
PediatríaCaracterísticas maternas e infantiles asociadas a obesidad en lactantes menores de un año de edad del norte de MéxicoV. M. Cárdenas Villarreal, R. E. Ortiz Félix, E. Cortés-Castell, P. Edina Miranda Félix, M. C. Guevara Valtier y M. M. Rizo-Baeza ............... 1024
El somatotipo de escolares chilenos: altos componentes endomórficos en mujeres adolescentesP. A. Lizana, M. C. Simpson, P. Farías y F. J. Berral .......................................................................................................... 1033
Relación entre la lactancia materna exclusiva los primeros seis meses de vida y el desarrollo de resistencia a la insulina en niños y adolescentes de Bucaramanga, ColombiaN. Serrano, A. Robles Silva, D. Paola Suárez, E. Gamboa-Delgado y D. C. Quintero-Lesmes .................................................. 1042
Asociación entre conducta alimentaria y estado nutricional en preescolares chilenosF. Henríquez Konings, F. Lanuza Rilling, L. Bustos Medina, A. González San Martín y J. Hazbún Game ..................................... 1049
Órgano Oficial
Sociedad Española de Nutrición Parenteral y Enteral ❙ Sociedad Española de Nutrición ❙ Federación Latino Americana de Nutrición Parenteral y Enteral ❙ Federación Española de Sociedades de Nutrición, Alimentación y Dietética
NutriciónHospitalaria

SumarioVol. 35 Septiembre-Octubre N.º 5
Impacto de la crisis económica en el estado nutricional y en los hábitos alimentarios de escolares de Madrid (España)J. M. Moreno Villares, M. Sáenz de Pipaón, Á. Carrasco Sanz, J. J. Díaz Martín, S. Redecillas Ferreiro, A. Moráis López, F. Sánchez Valverde, V. Navas López, M. Á. San José González, R. Leis Trabazo, M. Gil-Campos, L. C. Blesa Baviera y C. Campoy Folgoso ................................................................................................................................................. 1054
Nutrición en el ancianoAsociación entre el espesor del músculo aductor del pulgar y parámetros nutricionales en pacientes ancianos hospitalizadosR. M. El Kik, T. C. Dorneles y C. H. A. Schwanke ............................................................................................................. 1059
La asociación entre obesidad y el estatus de vitamina D entre los adultos mayores en Ecuador: análisis de la encuesta SABEC. H. Orces ............................................................................................................................................................... 1066
Obesidad y síndrome metabólicoLa deficiencia de vitamina A se asocia con el índice de masa corporal y la adiposidad corporal en mujeres con ingesta recomendada de vitamina AC. Bento, A. C. Matos, A. Cordeiro y A. Ramalho ............................................................................................................. 1072
Causas y componentes del síndrome metabólico en receptores de trasplante renal desde una perspectiva de géneroA. Martín Salvador, R. Fernández Castillo, I. García García, M. J. Aguilar Cordero y J. Bravo Soto ............................................ 1079
Diabetes mellitus tipo 2 podría predecir una pérdida subóptima de peso después de una cirugía bariátricaM. A. Núñez-Núñez, M. G. León-Verdín, N, Muñoz-Montes, J. Rodríguez-García, J A. Trujillo-Ortiz y C. Martínez-Cordero ..................... 1085
Estudio de investigación cualitativa sobre las diferencias entre hombres y mujeres en la percepción de la obesidad, sus causas, abordaje y repercusiones para la saludR. Barragán, L. Rubio, O. Portolés, E. M. Asensio, C. Ortega, J. V. Sorlí y D. Corella ............................................................... 1090
Evaluación de factores que pueden influenciar en la pérdida de peso insuficiente en pacientes después de dos años de bypass gástrico en Y de RouxM. C. M. B. Furtado, K. M. Vermeulen, P. E. N. R. Bellot, C. M. A. Godoy, D. Coelho, E. P. Godoy, A. M. G. Oliveira y J. M. Campos ...... 1100
Valoración nutricionalNivel sérico de vitamina D y su relación con la hormona tiroidea, el azúcar en sangre y los perfiles lipídicos en personal sedentario en IránB. Mansorian, M. Mirza-Aghazadeh Attari, D. Vahabzadeh e I. Mohebbi .............................................................................. 1107
Autopercepción del peso y forma física, percepción de la imagen corporal y conductas de control de peso y alimentarias en adolescentesI. Jáuregui-Lobera, A. Iglesias Conde, J. Sánchez Rodríguez, J. Arispon Cid, C. Andrades Ramírez, G. Herrero Martín y P. Bolaños-Ríos ....................................................................................................................................................... 1115
Ingesta alimentaria inadecuada y bajo conocimiento sobre nutrición en atletas de competición adolescentes y adultos: una llamada de atención para los jugadores de tenis de mesaD. Argôlo, J. Borges, A. Cavalcante, G. Silva, S. Maia, A. Ramos, E. Oliveira y M. Nascimento ................................................. 1124
s um a r i o
NutriciónHospitalaria

SumarioVol. 35 Septiembre-Octubre N.º 5
La influencia del modelo estético corporal en los trastornos de conducta alimentaria en la adolescenciaB. Barajas-Iglesias, I. Jáuregui-Lobera, I. Laporta-Herrero y M. Á. Santed-Germán ............................................................... 1131
Concordancia entre el Graz Malnutrition Screening (GMS) con instrumentos subjetivos de evaluación nutricional en pacientes hospitalizadosE. M. B. Lima, B. L. Almeida, H. B. Gomes, J. A. B. Bartochevis, T. S. Toniato, T. R. Lazzarini, T. S. S. Pereira y V. R. Guandalini...................................................................................................................................................... 1138
Epidemiología y dietéticaInfecciones parasitarias, desnutrición y anemia en niños en edad preescolar que viven en áreas rurales de Peshawar, PakistánZia ud Din, L. Pervez, A. Amir, M. Abbas, I. Khan, Z. Iqbal y M. Iqbal .................................................................................. 1145
Prevalencia y factores asociados a la deficiencia de vitaminas liposolubles en adolescentesR. P. Paes-Silva, M. T. O. Tomiya, R. Maio, C. M. M. B. de Castro, I. K. G. Arruda y A. S. Diniz ................................................. 1153
Desarrollo de una herramienta de tamizaje para consumo elevado de sodio en una población adulta mexicanaP. V. Miranda-Alatriste, E. Colín Ramírez, M. Guillén Hernández, S. Rivera Mancía, R. Cartas Rosado, Á. Espinosa-Cuevas, R. Correa-Rotter y M. Vallejo ...................................................................................................................................... 1163
Ensayo clínico aleatorizado del efecto sobre la masa ósea de tres preparados lácteos comercializados enriquecidos con calcio y vitaminas (D y K)M. D. Barnuevo, J. Marhuenda, M. Aldeguer, M. S. Abellán, P. Zafrilla Rentero, C. J. Contreras, I. Guillén, M. Hernández y F. J. López ............................................................................................................................................................ 1174
Ingesta dietética y adecuación en preescolares mexicanos: Encuesta Nacional de Nutrición y Salud 2012A. Jiménez Aguilar, D. González Castell, M. Flores Aldana, V. Mundo Rosas, S. Hernández Cordero y R. García Feregrino ............................................................................................................................................... 1186
Otros
Efecto de la ingestión de L-arginina en la hipotensión inducida por el ejercicioF. F. Lima, T. F. Silva, M. M. Neto, L. T. Toscano, C. S. O. Silva y A. S. Silva ........................................................................... 1195
Riesgo de padecer trastornos de la conducta alimentaria y rendimiento académico en adolescentes: proyecto DADOS M. Adelantado-Renau, M. R. Beltran-Valls, M. Toledo-Bonifás, C. Bou-Sospedra, M. C. Pastor y D. Moliner-Urdiales .................. 1201
Condición física relacionada con la salud de niños normales, con retraso en el crecimiento y con sobrepeso de 6 a 14 años en Macedonia S. Gontarev, R. Kalac, L. A. Velickovska, D. S. Stojmanovska, A. Misovski y J. Milenkovski ..................................................... 1208
Estado nutricional de la vitamina A en pacientes con enfermedad coronaria y su correlación con la gravedad de la enfermedad A. Matos, V. M. S. Gonçalves, G. Souza, S. P. Cruz, S. Cruz y A. Ramalho ............................................................................ 1215
s um a r i o
NutriciónHospitalaria

SumarioVol. 35 Septiembre-Octubre N.º 5
Revisión
Tamizaje nutricional en paciente pediátrico hospitalizado: revisión sistemáticaA. D. Aponte Borda, O. L. Pinzón Espitia y P. A. Aguilera Otalvaro ...................................................................................... 1221
Artículo Especial
Aceite de palma y salud cardiovascular: consideraciones para valorar la literaturaE. Gesteiro, J. Galera-Gordo y M. González-Gross ........................................................................................................... 1229
Grupo de Trabajo SENPE
Manejo nutricional de la esclerosis lateral amiotrófica: resumen de recomendacionesM. D. del Olmo García, N. Virgili Casas, A. Cantón Blanco, F. M. Lozano Fuster, C. Wanden-Berghe, V. Avilés, R. Ashbaugh Enguídanos, I. Ferrero López, J. B. Molina Soria, J. C. Montejo González, I. Bretón Lesmes, J. Álvarez Hernández y J. M. Moreno Villares, miembros del Grupo de Trabajo de Ética de la Sociedad Española de Nutrición Clínica y Metabolismo (SENPE) ................................................................................................................... 1243
In Memoriam
Pilar Marco Garde (1944-2018)Jesús M. Culebras y Abelardo García de Lorenzo ........................................................................................................... 1252
s um a r i o
NutriciónHospitalaria
summary
SummaryVol. 35 September-October No. 5
Editorial
Supplementary dairy products and bone healthM. Muñoz Torres and A. Muñoz Garach ........................................................................................................................ 1003
Originals Papers
Artificial nutritionIntracavitary electrocardiogram (IC-ECG) guidance for peripherally inserted central catheter (PICC) placementE. Santacruz, R. Mateo-Lobo, B. Vega-Piñero, J. Riveiro, G. Lomba, R. Sabido, F. Carabaña and Jose I. Botella-Carretero ....................................................................................................................................... 1005
Precipitation limits in pediatric parenteral nutritions with organic sources of calcium and phosphateA. Lázaro Cebas, S. Pablos Bravo, P. Gomis Muñoz, M. Á.l Orbaneja, S. Spiers, M. Shinn and J. M. Ferrari Piquero ................... 1009
Critical patientEffects of intravenous fluid overload on caloric and protein deficit in critically ill patientsS. S. Arantes, J. M. Silva Jr, J. E. de Aguilar-Nascimento and D. B. Dock-Nascimento ............................................................ 1017
PediatricsMaternal and infant characteristics associated with obesity in infants under one year of age in northern MexicoV. M. Cárdenas Villarreal, R. E. Ortiz Félix, E. Cortés-Castell, P. Edina Miranda Félix, M. C. Guevara Valtier and M. M. Rizo-Baeza ...................................................................................................................................................... 1024
Somatotypes of schoolchildren from Chile: higher endomorphic components among adolescent girlsP. A. Lizana, M. C. Simpson, P. Farías and J. Berral.......................................................................................................... 1033
Relationship between exclusive breastfeeding the first six months of life and development of insulin resistance in children and adolescents in Bucaramanga, ColombiaN. Serrano, A. Robles Silva, D. Paola Suárez, E. Gamboa-Delgado and D. C. Quintero-Lesmes ............................................... 1042
Association between eating behavior and nutritional status in Chilean preschoolersF. Henríquez Konings, F. Lanuza Rilling, L. Bustos Medina, A. González San Martín and J. Hazbún Game ................................. 1049
Órgano Oficial
Sociedad Española de Nutrición Parenteral y Enteral ❙ Sociedad Española de Nutrición ❙ Federación Latino Americana de Nutrición Parenteral y Enteral ❙ Federación Española de Sociedades de Nutrición, Alimentación y Dietética
NutriciónHospitalaria

SummaryVol. 35 September-October No. 5
Study on the nutritional status and feeding habits in school-children in Madrid City (Spain) during the economic crisisJ. M. Moreno Villares, M. Sáenz de Pipaón, Á. Carrasco Sanz, J. J. Díaz Martín, S. Redecillas Ferreiro, A. Moráis López, F. Sánchez Valverde, V. Navas López, M. Á. San José González, R. Leis Trabazo, M. Gil-Campos, L. C. Blesa Baviera and C. Campoy Folgoso .............................................................................................................................................. 1054
Nutrition in the elderlyAssociation between adductor pollicis muscle thickness and nutritional parameters in hospitalized elderly patientsR. M. El Kik, T. C. Dorneles and C. H. A. Schwanke ......................................................................................................... 1059
The association between obesity and vitamin D status among older adults in Ecuador: analysis of the SABE survey C. H. Orces ............................................................................................................................................................... 1066
Obesity and metabolic syndromeVitamin A deficiency is associated with body mass index and body adiposity in women with recommended intake of vitamin AC. Bento, A. C. Matos, A. Cordeiro and A. Ramalho .......................................................................................................... 1072
Causes and components of the metabolic syndrome in renal transplant recipients from a gender perspectiveA. Martín Salvador, R. Fernández Castillo, I. García García, M. J. Aguilar Cordero and J. Bravo Soto ........................................ 1079
Type 2 diabetes mellitus could predict a sub-optimal weight loss after bariatric surgeryM. A. Núñez-Núñez, M. G. León-Verdín, N. Muñoz-Montes, J. Rodríguez-García, J A. Trujillo-Ortiz and C. Martínez-Cordero ................. 1085
Qualitative study of the differences between men and women’s perception of obesity, its causes, tackling and repercussions on healthR. Barragán, L. Rubio, O. Portolés, E. M. Asensio, C. Ortega, J. V. Sorlí and D. Corella ........................................................... 1090
Evaluation of factors that may influence in the insufficient weight loss in patients after two years of Roux-en-Y gastric bypassM. C. M. B. Furtado, K. M. Vermeulen, P. E. N. R. Bellot, C. M. A. Godoy, D. Coelho, E. P. Godoy, A. M. G. Oliveira and J. M. Campos ...... 1100
Nutritional evaluationSerum vitamin D level and its relation to thyroid hormone, blood sugar and lipid profiles in Iranian sedentary work staff B. Mansorian, M. Mirza-Aghazadeh Attari, D. Vahabzadeh and I. Mohebbi ........................................................................... 1107
Self-perception of weight and physical fitness, body image perception, control weight behaviors and eating behaviors in adolescentsI. Jáuregui-Lobera, A. Iglesias Conde, J. Sánchez Rodríguez, J. Arispon Cid, C. Andrades Ramírez, G. Herrero Martín and P. Bolaños-Ríos ................................................................................................................................................... 1115
Poor dietary intake and low nutritional knowledge in adolescent and adult competitive athletes: a warning to table tennis playersD. Argôlo, J. Borges, A. Cavalcante, G. Silva, S. Maia, A. Ramos, E. Oliveira and M. Nascimento ............................................. 1124
s umma r y
NutriciónHospitalaria

SummaryVol. 35 September-October No. 5
The influence of the aesthetic body shape model on adolescents with eating disordersB. Barajas-Iglesias, I. Jáuregui-Lobera, I. Laporta-Herrero and M. Á. Santed-Germán ........................................................... 1131
Agreement between Graz Malnutrition Screening (GMS) with subjective nutritional assessment instruments in hospitalized patientsE. M. B. Lima, B. L. Almeida, H. B. Gomes, J. A. B. Bartochevis, T. S. Toniato, T. R. Lazzarini, T. S. S. Pereira and V. R. Guandalini .................................................................................................................................................. 1138
Epidemiology and dieteticsParasitic infections, malnutrition and anemia among preschool children living in rural areas of Peshawar, PakistanZia ud Din, L. Pervez, A. Amir, M. Abbas, I. Khan, Z. Iqbal and M. Iqbal............................................................................... 1145
Prevalence and factors associated with fat-soluble vitamin deficiency in adolescents R. P. Paes-Silva, M. T. O. Tomiya, R. Maio, C. M. M. B. de Castro, I. K. G. Arruda and A. S. Diniz ............................................. 1153
Development of a screening tool for a high sodium intake in an adult Mexican populationP. V. Miranda-Alatriste, E. Colín Ramírez, M. Guillén Hernández, S. Rivera Mancía, R. Cartas Rosado, Á. Espinosa-Cuevas, R. Correa-Rotter and M. Vallejo ................................................................................................................................... 1163
In vivo randomized trial of three marketed milk preparations enriched with calcium and vitamins (D and K) on bone mass and bone turnover markers from biological fluids in premenopausal Caucasian womenM. D. Barnuevo, J. Marhuenda, M. Aldeguer, M. S. Abellán, P. Zafrilla Rentero, C. J. Contreras, I. Guillén, M. Hernández and F. J. López ......................................................................................................................................................... 1174
Dietary intake and adequacy in Mexican preschool children: National Health and Nutrition Survey 2012A. Jiménez Aguilar, D. González Castell, M. Flores Aldana, V. Mundo Rosas, S. Hernández Cordero and R. García Feregrino ........................................................................................................................................... 1186
OthersEffect of L-arginine intake on exercise-induced hypotensionF. F. Lima, T. F. Silva, M. M. Neto, L. T. Toscano, C. S. O. Silva and A. S. Silva ................................................................ 1195
The risk of eating disorders and academic performance in adolescents: DADOS study M. Adelantado-Renau, M. R. Beltran-Valls, M. Toledo-Bonifás, C. Bou-Sospedra, M. C. Pastor and D. Moliner-Urdiales .............. 1201
Health-related physical fitness of normal, stunted and overweight children aged 6-14 years in Macedonia S. Gontarev, Ruzdija Kalac, L. A. Velickovska, D. Shukova Stojmanovska, A. Misovski and J. Milenkovski ................................. 1208
Vitamin A nutritional status in patients with coronary artery disease and its correlation with the severity of the disease A. Matos, V. M. S. Gonçalves, G. Souza, S. P. Cruz, S. Cruz and A. Ramalho ........................................................................ 1215
s umma r y
NutriciónHospitalaria

SummaryVol. 35 September-October No. 5
NutriciónHospitalaria
Review
Nutritional screening in hospitalized pediatric patients: systematic reviewA. D. Aponte Borda, O. L. Pinzón Espitia and P. A. Aguilera Otalvaro .................................................................................. 1221
Special Article
Palm oil and cardiovascular health: considerations to evaluate the literature criticallyE. Gesteiro, J. Galera-Gordo and M. González-Gross ....................................................................................................... 1229
SENPE Working Group
Nutritional management of amyotrophic lateral sclerosis: summary of recommendationsM. D. del Olmo García, N. Virgili Casas, A. Cantón Blanco, F. M. Lozano Fuster, C. Wanden-Berghe, V. Avilés, R. Ashbaugh Enguídanos, I. Ferrero López, J. B. Molina Soria, J. C. Montejo González, I. Bretón Lesmes, J. Álvarez Hernández and J. M. Moreno Villares, members of the Grupo de Trabajo de Ética de la Sociedad Española de Nutrición Clínica y Metabolismo (SENPE) ................................................................................................................... 1243
In Memoriam
Pilar Marco Garde (1944-2018)Jesús M. Culebras and Abelardo García de Lorenzo ........................................................................................................ 1252
s umma r y

NutriciónHospitalaria
ISSN (electrónico): 1699-5198 - ISSN (papel): 0212-1611 - CODEN NUHOEQ S.V.R. 318
DOI: http://dx.doi.org/10.20960/nh.2292
©Copyright 2018 SENPE y ©Arán Ediciones S.L. Este es un artículo Open Access bajo la licencia CC BY-NC-SA (http://creativecommons.org/licenses/by-nc-sa/4.0/).
El calcio y la vitamina D son dos nutrientes esenciales para la salud ósea en todas las etapas de vida por mecanismos fisiológicos bien conocidos (1). Así, estos nutrientes favorecen tanto la adquisición como el mantenimiento de la masa ósea y su integridad estructural, lo que confiere una resistencia óptima a las cargas mecánicas habituales. Sin embargo, los beneficios de la ingesta de preparados lácteos enriquecidos en calcio, suplementados con vitamina D y otros micronutrientes en poblaciones sin déficits nutricionales significativos, no se encuentran bien establecidos. Barnuevo y cols. (2), en este número de la revista Nutrición Hospitalaria, realizan un ensayo clínico aleatorizado en 114 mujeres premenopáusicas (edad media 39,2 años) que fueron seguidas durante 18 meses administrando tres preparados lácteos diferen-tes. Los resultados muestran un discreto efecto favorable sobre la densidad ósea en columna lumbar, sin diferencias significativas entre los tres preparados, y cambios de difícil interpretación en los marcadores de remodelado óseo. En este estudio las dosis aportadas de calcio (160-240 mg/día) y vitamina D (1 µg/día) fueron bajas y esto hace difícil encontrar cambios clínicamente significativos. En cualquier caso, las concentraciones de 1,25 dihidroxivitamina D aumentaron al finalizar el estudio aunque hubiera sido más interesante evaluar los cambios en 25 hidroxivitamina D que es el mejor marcador de las reservas corporales de vitamina D.
La aparente epidemia global de insuficiencia de vitamina D justifica que el Grupo de Trabajo de Osteoporo-sis y Metabolismo Mineral de la Sociedad Española de Endocrinología y Nutrición publicara recientemente un documento de consenso sobre recomendaciones de vitamina D para la población general (3). La definición de los valores óptimos de 25 hidroxivitamina D circulante es objeto de debate y el grupo español propone unos valores entre 30-50 ng/ml, algo superiores a lo propuesto por el Instituto de Medicina de Estados Unidos (IOM) para población sana. En cuanto a la suplementación con vitamina D en población general se recomienda un aporte de vitamina D de 800-1.000 UI/día en personas mayores de 65 años y en personas institucionalizadas para mejorar su salud ósea y reducir el riesgo de fractura no vertebral. Para adultos mayores de 50 años se sugieren, al menos, 800 UI/día junto con una adecuada ingesta de calcio (1.000-1.200 mg/día). Sin embargo, este documento realiza una evaluación de la evidencia disponible y concluye que no existen datos para recomendar la suplementación sistemática en adultos menores de 50 años con el objeto de mejorar la salud ósea.
Para alcanzar estas recomendaciones de forma sencilla el uso de preparados lácteos enriquecidos en calcio y suplementados con dosis apropiadas de vitamina D es una opción atractiva, particularmente en mujeres post-menopáusicas o sujetos ancianos. Así, en un estudio reciente de intervención nutricional Reyes-García y cols. (4) evalúan el efecto de 3 preparados lácteos enriquecidos en calcio (900 mg/día) y diferentes dosis de vitamina D (150 o 600 UI/día) en 500 mujeres postmenopáusicas sanas seguidas durante 2 años. Las mujeres que con-sumieron el preparado lácteo con dosis más altas de vitamina D optimizaron las concentraciones séricas de 25 hidroxivitamina D, mejoraron la densidad ósea en cuello de fémur y mostraron un perfil glucémico y lipídico más favorable.
Aunque los resultados de estos estudios son prometedores, no conocemos con exactitud el impacto de estas intervenciones nutricionales a largo plazo y como influirán sobre la fragilidad ósea en edades avanzadas que es el
Productos lácteos suplementados y salud óseaSupplementary dairy products and bone health

1004 M. Muñoz Torres y A. Muñoz Garach
[Nutr Hosp 2018;35(5):1003-1004]
e d i t o r i a l momento en el que la osteoporosis presenta sus complicaciones más letales. Por lo tanto necesitamos más estu-dios con muestras poblaciones grandes y seguimiento muy prolongado para poder responder a esta interrogante.
Manuel Muñoz Torres1 y Araceli Muñoz Garach2 1UGC de Endocrinología y Nutrición. Hospital Universitario San Cecilio. Granada. Departamento de Medicina. Universidad de Granada. Instituto de Investigación Biosanitaria ibs.GRANADA. Granada. 2UGC de Endocrinología y Nutrición. Hospital
Universitario Virgen de la Victoria. Málaga
Bibliografía
1. Kilim HP, Rosen H. Optimizing calcium and vitamin D intake through diet and supplements. Cleve Clin J Med 2018; 85(7):543-50.2. Barnuevo MD, Marhuenda J, Aldeguer M, Abellán MS, Zafrilla Rentero P, Contreras CJ, et al. In vivo randomized trial of three marketed
milk preparations enriched with calcium and vitamins (D and K) on bone mass and bone turnover markers from biological fluids in premenopausal Caucasian women. Nutr Hosp 2018;35(5):1174-85.
3. Varsavsky M, Rozas Moreno P, Becerra Fernández A, Luque Fernández I, Quesada Gómez JM, Ávila Rubio V, et al.; en representación del Grupo de Trabajo de Osteoporosis y Metabolismo Mineral de la Sociedad Española de Endocrinología y Nutrición. Recommended vitamin D levels in the general population. Endocrinol Diabetes Nutr 2017;64(Suppl 1):7-14.
4. Reyes-Garcia R, Mendoza N, Palacios S, Salas N, Quesada-Charneco M, Garcia-Martin A, et al. Effects of Daily Intake of Calcium and Vitamin D-Enriched Milk in Healthy Postmenopausal Women: A Randomized, Controlled, Double-Blind Nutritional Study. J Womens Health (Larchmt) 2018;27(5):561-8.

NutriciónHospitalaria
Trabajo Original Nutrición artificial
ISSN (electrónico): 1699-5198 - ISSN (papel): 0212-1611 - CODEN NUHOEQ S.V.R. 318
Colocación de catéteres centrales de inserción periférica (PICC) mediante control electrocardiográfico intracavitario (ECG-IC) de la punta del catéterIntracavitary electrocardiogram (IC-ECG) guidance for peripherally inserted central catheter (PICC) placement
Elisa Santacruz1, Raquel Mateo-Lobo1, Belén Vega-Piñero1, Javier Riveiro1, Gema Lomba1, Raquel Sabido1, Fátima Carabaña1 y José I. Botella-Carretero1,2
1Servicio de Endocrinología y Nutrición. Hospital Universitario Ramón y Cajal - IRyCIS. Madrid. 2Centro de Investigación Biomédica en Red de Fisiopatología de la Obesidad y Nutrición (CIBERobn). Madrid
Palabras clave:
Catéteres centrales de inserción periférica. Electrocardiograma intracavitario. Nutrición parenteral.
ResumenIntroducción: recientemente se ha planteado la posibilidad de comprobar la colocación de los catéteres centrales de inserción periférica (PICC) mediante control electrocardiográfico intracavitario (ECG-IC) ya que permitiría disminuir el tiempo de colocación y evitaría el control radiológico.
Objetivo: evaluación de dicho método frente al control radiológico habitual.
Métodos: estudio prospectivo en el que se incluyeron 532 pacientes de forma consecutiva. Se excluyeron aquellos pacientes con arritmias o en tratamiento con fármacos antiarrítmicos. En todos los casos se comprobó la colocación de la punta del PICC mediante control ECG-IC y mediante la realización de una radiografía de tórax, que fue considerada método de referencia.
Resultados: la colocación del PICC gracias al control ECG-IC (aplicabilidad) fue del 96,8%. La correcta colocación del PICC gracias a la interpre-tación del ECG-IC se confirmó en un 94% de los casos con la radiografía de tórax (precisión). En 13 pacientes (2,7%) se requirió la recolocación del catéter tras el control radiológico. El índice κ de concordancia fue de 0,356 (p < 0,001). La sensibilidad del método ECG fue de 0,98, con un VPP de 0,97 y un cociente de probabilidad positivo de 1,5. Sin embargo, la especificidad fue solo del 0,35 con un VPN de 0,41 y un cociente de probabilidad negativo de 0,06.
Conclusión: la comprobación de la colocación de los PICC mediante ECG-IC es plausible, segura, presenta unos índices de validez/fiabilidad adecuados y permitiría disminuir el tiempo de colocación del catéter. Sin embargo, la comprobación radiológica sigue siendo necesaria, espe-cialmente en los casos de ECG negativo o dudoso.
Key words:
Peripherally inserted central catheter. Intracavitary electrocardiogram. Parenteral nutrition.
AbstractIntroduction: intracavitary electrocardiogram (IC-ECG) guidance has been recently proposed for peripherally inserted central catheter (PICC) placement since it may reduce the time of placement and avoid radiological control.
Objective: to evaluate IC-ECG compared to conventional radiological control.
Methods: prospective study of 532 consecutive patients. Those with arrhythmias or on antiarrhythmic drugs were excluded. In all cases, PICC tip placement was checked by IC-ECG guidance and by a chest X-ray, which was considered as the reference test.
Results: PICC placement with IC-ECG guidance was achieved in 96.8% of patients (applicability). PICC correct placement according to IC-ECG guidance was confirmed by chest X-ray in 94% of patients (accuracy). In 13 patients (2.7%) the catheter had to be repositioned after radiological control. The κ concordance index was 0.356 (p < 0.001). The IC-ECG sensitivity was 0.98, with a PPV of 0.97 and a positive likelihood ratio of 1.5. However, the specificity was only 0.35 with a NPV of 0.41 and a negative likelihood ratio of 0.06.
Conclusion: PICC placement by IC-ECG guidance is plausible, safe, presents adequate indexes of validity and reliability, and allows reducing the time of catheter placement. However, radiological verification is still necessary, especially in cases of negative or uncertain ECG.
Correspondencia: José I. Botella-Carretero. Servicio de Endocrinología y Nutrición. Hospital Universitario Ramón y Cajal – IRyCIS. Ctra. de Colmenar Viejo, km 9,100. 28034 Madride-mail: [email protected]
Santacruz E, Mateo-Lobo R, Vega-Piñero B, Riveiro J, Lomba G, Sabido R, Carabaña F, Botella Carretero JI. Colocación de catéteres centrales de inserción periférica (PICC) mediante control electrocardiográfico intracavitario (ECG-IC) de la punta del catéter. Nutr Hosp 2018;35(5):1005-1008
DOI: http://dx.doi.org/10.20960/nh.1847
Recibido: 17/02/2018 • Aceptado: 04/03/2018
©Copyright 2018 SENPE y ©Arán Ediciones S.L. Este es un artículo Open Access bajo la licencia CC BY-NC-SA (http://creativecommons.org/licenses/by-nc-sa/4.0/).
1006 E. Santacruz et al.
[Nutr Hosp 2018;35(5):1005-1008]
INTRODUCCIÓN
Los catéteres centrales de inserción periférica (PICC) juegan un papel decisivo en el manejo de pacientes que requieren la administración de terapias intravenosas, entre las que se incluyen la nutrición parenteral, el tratamiento quimioterápico y la medicación intravenosa como antibióticos. La colocación de los PICC se lleva a cabo por radiólogos intervencionistas, anes-tesistas y más frecuentemente en nuestro medio por enfermeras especializadas (1).
La correcta colocación de la punta del catéter central es funda-mental, siendo la unión del tercio inferior de la vena cava superior (VCS) con la aurícula derecha la posición recomendada por la mayoría de consensos (2). Esta posición permite evitar la aparición de posibles complicaciones relacionadas con los PICC como la trombosis en caso de punta de catéter situada en la parte superior de la VCS o en vena subclavia y arritmias y disfunción de la válvula tricuspídea en caso de que la punta del catéter se encuentre en la aurícula. El taponamiento cardiaco es una complicación muy infrecuente hoy en día pero con una alta mortalidad (3).
Dada la importancia de la correcta posición de la punta de los PICC, es preciso disponer de métodos fiables para la comprobación de su adecuada colocación. Las últimas guías de la European Society of Parenteral and Enteral Nutrition (ESPEN) (2) recomiendan realizar radiografía (Rx) de tórax de control en caso de técnica con riesgo de neumotórax o si no se puede verificar la correcta posición del catéter durante su colocación. Así pues, la combinación de una técnica sin riesgo de complicación pleuropulmonar (colocación de catéter central con canulación de vena periférica o vena central con control ecográfico) junto con un método de verificación durante el propio procedimiento podría permitir evitar la realización de una Rx de tórax de control (4).
Las técnicas más sensibles para comprobar la posición de la punta del catéter son la ecografía transtorácica y la tran-sesofágica. Sin embargo, su uso se ve limitado ya que se trata de técnicas caras y poco accesibles. La colocación con visualización fluoroscópica también se ha utilizado, pero esta requiere de personal experto y una sala de radiología, y pre-senta también un elevado coste (5). Más frecuentemente en la práctica clínica diaria, la comprobación de la posición de la punta del PICC se realiza con una Rx de tórax (6), sin embar-go, esta técnica presenta importantes limitaciones: coste al implicar la participación de distintos profesionales, exposición a radiación y mayor tiempo del procedimiento y variabilidad interobservador (7).
En los últimos años se ha planteado en la literatura la posibili-dad de comprobar la colocación de los catéteres PICC mediante control con electrocardiograma intracavitario (ECG-IC) de la punta del catéter (5). Ello permitiría disminuir el tiempo de colocación, evitar el uso de control radiológico en todos los pacientes y dis-minuir los costes globales a pesar de un mayor precio de este tipo de catéteres. En el presente estudio nos proponemos la eva-luación de dicho método frente al control radiológico habitual en nuestro centro.
MATERIAL Y MÉTODO
PACIENTES
El estudio se llevó a cabo en la Unidad de Terapia Intravenosa del Servicio de Endocrinología y Nutrición del Hospital Universi-tario Ramón y Cajal de Madrid, centro de referencia de un área sanitaria de 566.445 pacientes. Se realizó un estudio prospectivo en el que se incluyeron de forma consecutiva 532 pacientes a los que se les iba a colocar un PICC.
Se excluyeron aquellos pacientes de edad menor a 18 años, con antecedente de arritmias cardiacas previas, portadores de marcapasos o en tratamiento con fármacos antiarrítmicos que impidieran un correcto uso del método ECG-IC.
Los objetivos del presente estudio fueron: a) la aplicabilidad técnica del método ECG-IC, es decir, la aparición de una onda P y la posibilidad de interpretar sus variaciones; b) la seguridad evaluada según la incidencia de alteraciones del ritmo cardiaco u otros efectos adversos; y c) la precisión establecida como la coincidencia entre la colocación de la punta del PICC gracias al ECG-IC y la correcta posición en la Rx de tórax.
MÉTODOS DE COMPROBACIÓN DE COLOCACIÓN DE CATÉTERES
El método ECG-IC utiliza el propio catéter como electrodo intra-cavitario gracias a una columna de suero salino (8). Se utilizaron catéteres de 4 y 5 Fr Medcom®, PolCook® y Vygon®. Para la comprobación de la adecuada colocación de la punta del PICC con ECG-IC se utilizó el software Nautilus® (Romedez, Vygon), que permite monitorizar la lectura del ECG-IC gracias a otros cuatro electrodos colocados en el paciente. Este método de comproba-ción se basa en las variaciones de onda P según la posición de la punta del catéter debido a los cambios de polarización en la aurícula derecha. A medida que el catéter avanza por el tercio inferior de la VCS, la onda P aumenta su amplitud, siendo máxima en la unión cavo-auricular. En caso de seguir avanzando el catéter hacia la aurícula derecha, la amplitud de la onda P disminuye y aparece un componente negativo con una onda bifásica. A la sali-da de la aurícula derecha la onda P será totalmente negativa (9).
Además del control ECG-IC, en todos los casos se procedió a la comprobación de la colocación de la punta del PICC mediante la realización de Rx de tórax postero-anterior y lateral en bipedes-tación o anteroposterior en decúbito supino, según la situación clínica del paciente.
ANÁLISIS ESTADÍSTICO
Los resultados de variables cuantitativas han sido expresados en media ± DE, mientras que los resultados de variables cualita-tivas se presentan como porcentaje. Se compararon ambos méto-dos mediante el índice kappa de concordancia y se calcularon los índices de validez/fiabilidad considerando la radiología como
1007COLOCACIÓN DE CATÉTERES CENTRALES DE INSERCIÓN PERIFÉRICA (PICC) MEDIANTE CONTROL ELECTROCARDIOGRÁFICO INTRACAVITARIO (ECG-IC) DE LA PUNTA DEL CATÉTER
[Nutr Hosp 2018;35(5):1005-1008]
método de referencia para la localización de la punta. El análisis se realizó utilizando SPSS 18 (SPSS Inc., Chicago, Illinois). Una p < 0,05 fue considerada como estadísticamente significativa.
RESULTADOS
Se estudiaron de forma consecutiva 532 pacientes, con una edad media de 63,5 ± 16,1 años. El 51,7% (n = 275) de los pacientes fueron varones y el 48,3% (n = 257) fueron mujeres. En un 16,5% (n = 88) la indicación para la colocación de PICC fue la administración de nutrición parenteral; en un 26,7% (n = 142), la antibioterapia intravenosa; y en un 56,8% (n = 302), la quimioterapia.
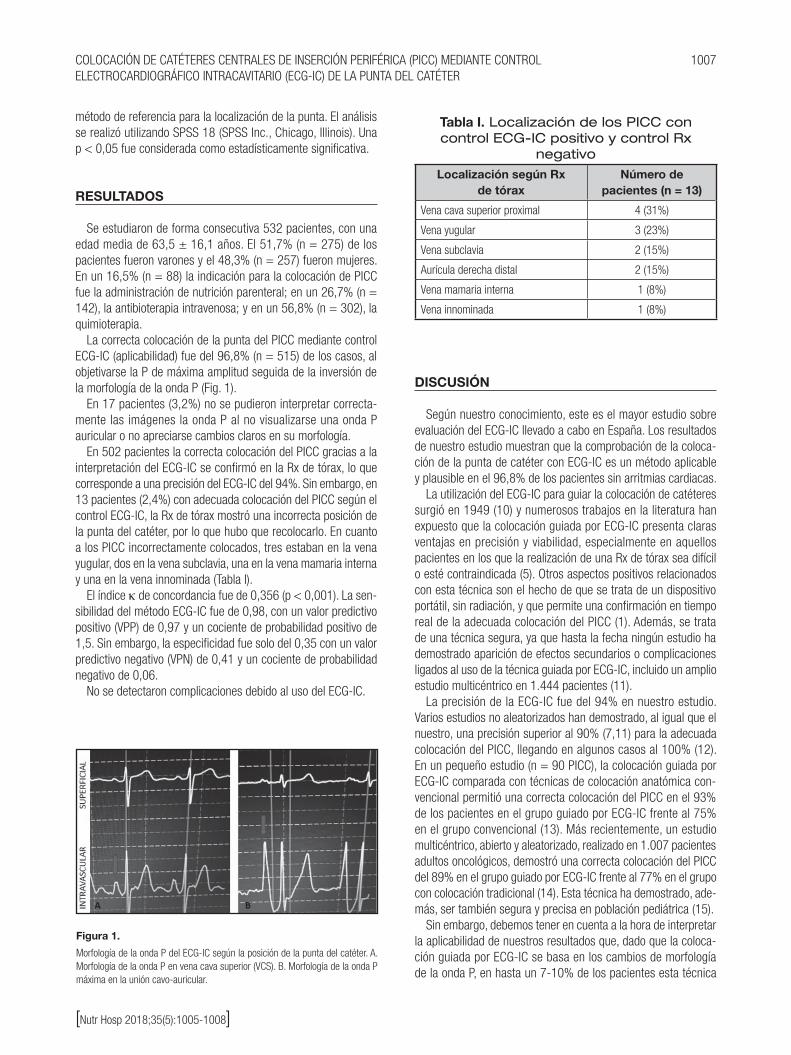
La correcta colocación de la punta del PICC mediante control ECG-IC (aplicabilidad) fue del 96,8% (n = 515) de los casos, al objetivarse la P de máxima amplitud seguida de la inversión de la morfología de la onda P (Fig. 1).
En 17 pacientes (3,2%) no se pudieron interpretar correcta-mente las imágenes la onda P al no visualizarse una onda P auricular o no apreciarse cambios claros en su morfología.
En 502 pacientes la correcta colocación del PICC gracias a la interpretación del ECG-IC se confirmó en la Rx de tórax, lo que corresponde a una precisión del ECG-IC del 94%. Sin embargo, en 13 pacientes (2,4%) con adecuada colocación del PICC según el control ECG-IC, la Rx de tórax mostró una incorrecta posición de la punta del catéter, por lo que hubo que recolocarlo. En cuanto a los PICC incorrectamente colocados, tres estaban en la vena yugular, dos en la vena subclavia, una en la vena mamaria interna y una en la vena innominada (Tabla I).
El índice κ de concordancia fue de 0,356 (p < 0,001). La sen-sibilidad del método ECG-IC fue de 0,98, con un valor predictivo positivo (VPP) de 0,97 y un cociente de probabilidad positivo de 1,5. Sin embargo, la especificidad fue solo del 0,35 con un valor predictivo negativo (VPN) de 0,41 y un cociente de probabilidad negativo de 0,06.
No se detectaron complicaciones debido al uso del ECG-IC.
DISCUSIÓN
Según nuestro conocimiento, este es el mayor estudio sobre evaluación del ECG-IC llevado a cabo en España. Los resultados de nuestro estudio muestran que la comprobación de la coloca-ción de la punta de catéter con ECG-IC es un método aplicable y plausible en el 96,8% de los pacientes sin arritmias cardiacas.
La utilización del ECG-IC para guiar la colocación de catéteres surgió en 1949 (10) y numerosos trabajos en la literatura han expuesto que la colocación guiada por ECG-IC presenta claras ventajas en precisión y viabilidad, especialmente en aquellos pacientes en los que la realización de una Rx de tórax sea difícil o esté contraindicada (5). Otros aspectos positivos relacionados con esta técnica son el hecho de que se trata de un dispositivo portátil, sin radiación, y que permite una confirmación en tiempo real de la adecuada colocación del PICC (1). Además, se trata de una técnica segura, ya que hasta la fecha ningún estudio ha demostrado aparición de efectos secundarios o complicaciones ligados al uso de la técnica guiada por ECG-IC, incluido un amplio estudio multicéntrico en 1.444 pacientes (11).
La precisión de la ECG-IC fue del 94% en nuestro estudio. Varios estudios no aleatorizados han demostrado, al igual que el nuestro, una precisión superior al 90% (7,11) para la adecuada colocación del PICC, llegando en algunos casos al 100% (12). En un pequeño estudio (n = 90 PICC), la colocación guiada por ECG-IC comparada con técnicas de colocación anatómica con-vencional permitió una correcta colocación del PICC en el 93% de los pacientes en el grupo guiado por ECG-IC frente al 75% en el grupo convencional (13). Más recientemente, un estudio multicéntrico, abierto y aleatorizado, realizado en 1.007 pacientes adultos oncológicos, demostró una correcta colocación del PICC del 89% en el grupo guiado por ECG-IC frente al 77% en el grupo con colocación tradicional (14). Esta técnica ha demostrado, ade-más, ser también segura y precisa en población pediátrica (15).
Sin embargo, debemos tener en cuenta a la hora de interpretar la aplicabilidad de nuestros resultados que, dado que la coloca-ción guiada por ECG-IC se basa en los cambios de morfología de la onda P, en hasta un 7-10% de los pacientes esta técnica
Figura 1.
Morfología de la onda P del ECG-IC según la posición de la punta del catéter. A. Morfología de la onda P en vena cava superior (VCS). B. Morfología de la onda P máxima en la unión cavo-auricular.
Tabla I. Localización de los PICC con control ECG-IC positivo y control Rx
negativo
Localización según Rx de tórax
Número de pacientes (n = 13)
Vena cava superior proximal 4 (31%)
Vena yugular 3 (23%)
Vena subclavia 2 (15%)
Aurícula derecha distal 2 (15%)
Vena mamaria interna 1 (8%)
Vena innominada 1 (8%)

1008 E. Santacruz et al.
[Nutr Hosp 2018;35(5):1005-1008]
puede no ser útil y la mayoría de trabajos sobre esta técnica han excluido los pacientes con arritmias cardiacas (5). Además, al tratarse de una técnica observador-dependiente, el uso de ECG requiere una curva de aprendizaje, tal y como se demostró en un estudio a 15 meses (16).
Asimismo, a la hora de comparar el ECG-IC con la Rx de tórax debemos también tener en cuenta el diferente momento en el que estos se realizan (el ECG-IC durante la colocación y la Rx de tórax tras la colocación, con un retraso variable según la disponibilidad del centro sanitario) y las variaciones de la posición de la punta del catéter dependiendo de la respiración, la posición del paciente y la posición de la extremidad superior, entre otras (11).
Por otro lado, debemos señalar que la precisión del ECG-IC vista en nuestro estudio, así como en la mayoría de los publicados hasta la fecha, no ha sido obtenida al comparar el ECG-IC con la técnica más precisa para determinar la localización del PICC (ecografía transtorácica o transesofágica) debido al coste en la práctica clínica, sino con la técnica más frecuentemente utiliza-da, la Rx de tórax, tomada habitualmente como referencia. Cabe recordar que la Rx de tórax no es una técnica muy precisa para detectar la unión cavo-auricular comparada con otras técnicas como la ecografía transesofágica o la resonancia magnética (17), por lo que, más que de precisión, deberíamos hablar de concor-dancia entre la ECG-IC y la Rx de tórax, al no ser esta última un patrón de oro real.
A pesar de la alta sensibilidad del método ECG-IC, es impor-tante señalar que en un 2,4% de los casos la colocación del PICC fue incorrecta en nuestro estudio, siendo de especial relevancia clínica los tres PICC localizados en vena yugular, dos en vena subclavia y uno en vena mamaria interna. La utilización del ECG-IC sin comprobación radiológica posterior en estos pacientes habría podido suponer complicaciones secundarias al uso del PICC que se evitaron gracias a la comprobación radiológica y la recoloca-ción posterior.
En conclusión, la comprobación de la correcta colocación de los catéteres PICC mediante un método ECG-IC en la práctica clínica es plausible, segura, presenta unos índices de validez/fiabilidad adecuados y permite disminuir el tiempo de colocación del catéter en pacientes que no presenten arritmias ni tratamiento con fár-macos antiarrítmicos. Sin embargo, la comprobación radiológica sigue siendo necesaria, especialmente en los casos de ECG-IC negativo o dudoso.
BIBLIOGRAFÍA
1. Barton A. Confirming PICC tip position during insertion with real-time infor-mation. Br J Nurs 2016;25(2):17-21.
2. Pittiruti M, Hamilton H, Biffi R, MacFie J, Pertkiewicz M. ESPEN Guidelines on Parenteral Nutrition: central venous catheters (access, care, diagnosis and therapy of complications). ESPEN Clin Nutr 2009;28(4):365-77.
3. Oliver G, Jones M. ECG or X-ray as the “gold standard” for establishing PICC-tip location? Br J Nurs 2014;23(Suppl 19):10-6.
4. Antonaglia V, Ristagno G, Berlot G. Procedural and clinical data plus electro-cardiographic guidance greatly reduce the need for routine chest radiograph following central line placement. J Trauma 2008;64(4):1146.
5. Pittiruti M, La Greca A, Scoppettuolo G. The electrocardiographic method for positioning the tip of central venous catheters. J Vasc Access 2011;12(4):280-91.
6. Oliver G, Jones M. Evaluation of an electrocardiographbased PICC tip verifi-cation system. Br J Nurs 2013;22(14):S24-8.
7. Ortiz-Miluy G, Sánchez Guerra C. Intracavitary electrocardiogram during the insertion of peripherally inserted central catheters. Enferm Clin 2013;23(4):148-53.
8. Pawlik MT, Kutz N, Keyl C, Lemberger P, Hansen E. Central venous catheter placement: comparison of the intravascular guidewire and the fluid column electrocardiograms. Eur J Anaesthesiol 2004;21(8):594-9.
9. Ender J, Erdoes G, Krohmer E, Olthoff D, Mukherjee C. Transesophageal echocardiography for verification of the position of the electrocardio-graphically-placed central venous catheter. J Cardiothorac Vasc Anesth 2009;23(4):457-61.
10. Hellerstein HK, Pritchard WH, Lewis RL. Recording of intracavity potentials through a single lumen, saline filled cardiac catheter. Proc Soc Exp Biol Med 1949;71(1):58-60.
11. Pittiruti M, Bertollo D, Briglia E, Buononato M, Capozzoli G, De Simone L, et al. The intracavitary ECG method for positioning the tip of central venous cathe-ters: results of an Italian multicenter study. J Vasc Access 2012;13(3):357-65.
12. Liu YJ, Dong L, Lou XP, Miao JH, Li XX, Li XJ, et al. Evaluating ECG-aided tip localization of peripherally inserted central catheter in patients with cancer. Int J Clin Exp Med 2015;8(8):14127-9.
13. Baldinelli F, Capozzoli G, Pedrazzoli R, Marzano N. Evaluation of the correct position of peripherally inserted central catheters: anatomical landmark vs. electrocardiographic technique. J Vasc Access 2015;16(5):394-8.
14. Yuan L, Li R, Meng A, Feng Y, Wu X, Yang Y, et al. Superior success rate of intracavitary electrocardiogram guidance for peripherally inserted central catheter placement in patients with cancer: a randomized open-label con-trolled multicenter study. PLoS One 2017;12(3).
15. Rossetti F, Pittiruti M, Lamperti M, Graziano U, Celentano D, Capozzoli G. The intracavitary ECG method for positioning the tip of central venous access devices in pediatric patients: results of an Italian multicenter study. J Vasc Access 2015;16(2):137-43.
16. Moureau N, Dennis G, Ames E, Sevre R. Electrocardiogram (EKG) guided peripherally inserted central catheter placement and tip position: results of a trial to replace radiological confirmation. JAVA 2010;15:8-14.
17. Hsu JH, Wang CK, Chu KS, Cheng KI, Chuang HY, Jaw TS, et al. Comparison of radiographic landmarks and the echocardiographic SVC/RA junction in the positioning of long-term central venous catheters. Acta Anaesthesiol Scand 2006;50(6):731-5.

NutriciónHospitalaria
Trabajo Original Nutrición artificial
ISSN (electrónico): 1699-5198 - ISSN (papel): 0212-1611 - CODEN NUHOEQ S.V.R. 318
Límites de precipitación en nutriciones parenterales pediátricas con fuentes de calcio y fosfato orgánicasPrecipitation limits in pediatric parenteral nutritions with organic sources of calcium and phosphate
Andrea Lázaro Cebas1, Siria Pablos Bravo1, Pilar Gomis Muñoz1, Miguel Ángel Orbaneja2, Samantha Spiers2, Martyn Shinn2 y José Miguel Ferrari Piquero1 1Servicio de Farmacia. Hospital Universitario 12 de Octubre. Madrid. 2Pall Corporation. Alcobendas, Madrid
Palabras clave:
Nutrición parenteral. Precipitación. Glicerofosfato sódico. Gluconato cálcico. Primene®. Filtración.
ResumenObjetivo: conocer si hay precipitación en nutriciones parenterales (NP) con gluconato cálcico y glicerofosfato sódico en las cantidades límites del documento de consenso español de preparación de nutrición parenteral SENPE/SEGHNP/SEFH 2008.
Métodos: se prepararon por triplicado siete NP: cinco de 100 ml con concentraciones de aminoácidos, calcio y fósforo similares a las con-centraciones máximas de precipitación del documento consenso SENPE/SEGHNP/SEFH y dos controles, uno sin calcio y fósforo y otro con alto contenido de calcio y fósforo y baja concentración de aminoácidos. Las NP no contenían lípidos. Las NP se almacenaron 20 horas a temperatura ambiente y cuatro horas a 35 °C, y se filtraron con un filtro de 0,2 micras. Estos filtros se transportaron y observaron parcialmente por micros-copía electrónica. Los cristales observados se analizaron por espectrometría por dispersión de rayos X a 1.000 aumentos. Al observarse gran cantidad de precipitados, que no se correspondían a los estudios publicados, se realizaron estudios complementarios para conocer su origen.
Resultados: en todos los casos, a excepción del control sin calcio y fósforo, se observaron precipitados. Sin embargo, estos cristales, según nuestros estudios, se produjeron después de la filtración y en su composición está el calcio, pero no el fósforo. También se observaron partículas provenientes de la preparación de nutrición parenteral.
Conclusiones: en nuestro estudio no encontramos precipitados de fosfato cálcico en los límites recogidos en el documento consenso SENPE/SEGHNP/SEFH. Sin embargo, es posible que se formen microprecipitados con calcio en su composición. Es importante filtrar las NP previamente a su administración.
Key words:
Parenteral nutrition. Precipitation. Sodium glycerophosphate. Calcium gluconate. Primene®. Filtration.
AbstractObjective: to determine if precipitation processes occur in parenteral nutrition solutions (PNs) with calcium gluconate and sodium glycerophosphate in the precipitation threshold limits of the Spanish SENPE/SEGHNP/SEFH 2008 consensus document of PN preparation.
Methods: seven PNs with different composition were prepared in triplicate: five 100 ml PNs with different concentrations of amino acids, cal-cium and phosphorus similar to consensus document maximum concentrations for precipitation, and two control PNs: one without calcium and phosphorus and other with high calcium and phosphorus content and low concentration of amino acids. All PNs did not contain lipids to allow correct detection of precipitates. The no lipid PNs were stored at room temperature for 20 hours, and at 35 °C for four hours. Subsequently, they filtered through a 0.2 µm filter, which was observed by electron microscopy. Because a large amount of not expected precipitates was observed, complementary studies were carried out.
Results: precipitates were observed in all PNs except in the control solution without calcium and phosphorus; many of them were greater than 10 µm. However, according to our studies, these crystals were produced after filtration and calcium was found in their composition, but not phosphorus. Particles from the preparation of parenteral nutrition were also observed.
Conclusions: in our study we did not find calcium phosphate precipitates in the limits included in the consensus document SENPE/SEGHNP/SEFH. However, it is possible that micro precipitates with calcium are formed. It is important to filter PNs prior to their administration.
Correspondencia: Pilar Gomis Muñoz. Servicio de Farmacia. Hospital Universitario 12 de Octubre. Ctra. de Andalucía, s/n, km 5,400. 28041 Madride-mail: [email protected]
Lázaro Cebas A, Pablos Bravo S, Gomis Muñoz P, Orbaneja MA, Spiers S, Shinn M, Ferrari Piquero JM. Límites de precipitación en nutriciones parenterales pediátricas con fuentes de calcio y fosfato orgánicas. Nutr Hosp 2018;35(5):1009-1016
DOI: http://dx.doi.org/10.20960/nh.1861
Recibido: 24/02/2018 • Aceptado: 27/03/2018
©Copyright 2018 SENPE y ©Arán Ediciones S.L. Este es un artículo Open Access bajo la licencia CC BY-NC-SA (http://creativecommons.org/licenses/by-nc-sa/4.0/).

1010 A. Lázaro Cebas et al.
[Nutr Hosp 2018;35(5):1009-1016]
INTRODUCCIÓN
Una de las principales limitaciones de la administración de la nutrición parenteral (NP) cuando se utilizan fuentes inorgánicas de calcio y fosfato es la imposibilidad de administrar cantidades sufi-cientes de estos iones sin formación de precipitados. El problema de la precipitación calcio-fosfato resulta sustancialmente limitante en la elaboración de nutriciones parenterales pediátricas debido a los requerimientos elevados de calcio y fósforo (1,2) y a la mayor temperatura ambiente, especialmente en las incubadoras.
En abril de 1994 la Food and Drug Administration (FDA) publicó una alerta debido a la comunicación de dos muertes por distrés respiratorio en pacientes con nutrición parenteral cuyas autopsias revelaron embolia microvascular pulmonar con presencia de precipitados de fosfato cálcico. Las fuentes de calcio y fósforo utilizadas habían sido gluconato cálcico y fosfato potásico, respectivamente. A raíz de esta alerta, la FDA reco-mienda la administración de las nutriciones parenterales con filtro de 1,2 µm cuando las mezclas contengan lípidos (mezclas ternarias) y 0,2 µm cuando se trate de mezclas dos en uno que contienen solo glucosa y aminoácidos como macronutrientes (mezclas binarias) (3).
La formación de precipitados de fosfato cálcico depende de diversos factores como temperatura, pH, fuente de aminoácidos, concentración de aminoácidos y glucosa, presencia de otros elec-trolitos, orden de adición de los componentes y fuente de calcio y fosfato (4-11).
Diversos estudios han tratado de determinar la cantidad máxi-ma de calcio y fosfato que puede añadirse a una nutrición paren-teral sin que se produzca riesgo de precipitación; sin embargo, los trabajos son muy heterogéneos en cuanto a las fuentes de aminoácidos, las temperaturas de conservación de las nutriciones parenterales, los métodos para la detección de precipitados y las fuentes de calcio y, sobre todo, de fosfato. Los métodos de análisis mayoritariamente utilizados para la detección de precipitados son los visuales, recuento de partículas, espectrofotometría y micros-copía óptica (6-10,12-19).
Las fuentes orgánicas de calcio y fosfato son menos proclives a precipitar ya que se disocian menos que las inorgánicas (15,17,20). Su introducción ha permitido aportar todas las necesidades de calcio y fósforo en las poblaciones pediátricas, lo que era imposi-ble con fuentes inorgánicas. Existen diversos estudios que eviden-cian la estabilidad de estos compuestos en NP (10,13,17,18,20-22). Sin embargo, aunque estas sales orgánicas se introdujeron hace más de 20 años, el número de estudios es todavía pequeño y heterogéneo.
En el documento de consenso de preparación de nutrición parenteral pediátrica SENPE/SEGHNP/SEFH 2008 (23) se incluyen aportes máximos de calcio y fosfato orgánico basados en la poca bibliografía que había en ese momento (10,13,20,21,24). Recien-temente se han publicado más estudios que avalan esta estabilidad
(17,18,22), sin embargo, la mayoría de los artículos no utilizan los mismos productos que se utilizan actualmente en España. Otros artículos recientes sugieren que incluso a dosis habituales podría producirse precipitación (15,25).
Debido a esa posible precipitación y a que pocos estudios han sido elaborados empleando las fuentes de aminoácidos, calcio y fósforo que se utilizan actualmente en nuestro país, se diseñó este estudio cuyo objetivo es conocer si se producen procesos de preci-pitación en soluciones de nutrición parenteral que contengan calcio y fosfato orgánicos en las cantidades límites del documento de consenso de preparación de nutrición parenteral pediátrica SENPE/SEGHNP/SEFH (Tabla I).
MATERIAL Y MÉTODOS
ESTUDIO PRELIMINAR
Para conocer si los resultados de este estudio se podrían extra-polar a NP con lípidos, se realizó un estudio para comparar el pH de las NP con y sin lípidos (Tabla II). Se prepararon cuatro NP, dos de ellas con lípidos y las otras dos sin lípidos, para estudiar la diferencia de pH entre ellas. Se tomaron 20 ml de cada una y se midió el pH por triplicado (Tabla II) con un pHmetro Crison® micropH 2001 calibrado previamente a su uso.
ESTUDIO PRINCIPAL
Preparación de las mezclas de nutrición parenteral (NP)
Se prepararon NP de 100 ml con distintas concentraciones de aminoácidos, calcio y fósforo para que se asemejasen a las concentraciones máximas recogidas en el documento consenso de preparación. Las NP no contenían lípidos para poder detec-tar correctamente los precipitados. Se utilizaron dos soluciones control, una sin calcio y fósforo como “control sin precipitación”
Tabla I. Límites del documento de consenso de preparación de nutrición parenteral pediátrica SENPE/SEGHNP/
SEFH
AminoácidosFósforo
(glicerofosfato) Calcio
0,5-1,25% 25 mmol/l 20 mmol/l (40 mEq/l)
1,25-2,5% 30 mmol/l 35 mmol/l (70 mEq/l)
> 2,5% 48 mmol/l56 mmol/l
(112 mEq/l)

1011LÍMITES DE PRECIPITACIÓN EN NUTRICIONES PARENTERALES PEDIÁTRICAS CON FUENTES DE CALCIO Y FOSFATO ORGÁNICAS
[Nutr Hosp 2018;35(5):1009-1016]
Tabla II. Diferencia de pH en dietas con y sin lípidosDieta A sin lípidos Dieta A con lípidos Dieta B sin lípidos Dieta B con lípidos
Volumen 100 100 100 100
Aminoácidos (g) 2 2 2,5 2,5
Glucosa (g) 11 11 11 11
Lípidos (g) 0 3 0 3,5
Sodio (mEq) 9,6 9,6 9,6 9,6
Potasio (mEq) 2 2 2 2
Cloro (mEq) 2 2 2 2
Magnesio (mEq) 0,4 0,4 0,4 0,4
Calcio (mEq) 11 11 11 11
Fósforo (mmol) 4,8 4,8 4,8 4,8
pH1 6,55 6,67 6,61 6,58
pH2 6,78 6,81 6,69 6,67
pH3 6,71 6,74 6,65 6,74
Media 6,68 ± 0,12 6,74 ± 0,07 6,65 ± 0,04 6,66 ± 0,08
y otra con alto contenido de calcio y fósforo y baja concentración de aminoácidos como “control de precipitación”. La preparación de las NP se realizó en cabina de flujo laminar siguiendo la nor-mativa de trabajo de nuestro hospital. Los productos utilizados se pueden ver en la tabla III. Los componentes se fueron añadiendo en el siguiente orden: solución de aminoácidos, gluconato cálcico, glucosa, sulfato magnésico, sales de sodio, sales de potasio, vita-minas hidrosolubles, oligoelementos y glicerofosfato sódico. Como contenedor de la solución fueron utilizadas bolsas EVA® multicapa
de 250 ml. Cada NP se elaboró por triplicado y posteriormente se midió el pH de cada una de ellas. La composición de las mezclas estudiadas se recoge en la tabla IV.
Almacenamiento
Con el objetivo de simular una condición real de uso de las NP en neonatos dentro de incubadoras, se almacenaron a una temperatura ambiente media de 24,5 ± 0,7 °C durante 20 horas.
Tabla III. Componentes utilizados en la preparación de las NP
Nutriente Nombre Presentación Laboratorio
Aminoácidos Primene® 10% 250 ml Clintec Parenteral, S.A.
Glucosa
Glucosa 5% 250-500 m Laboratorios PHYSAN S.A.
Glucosa 50%100 ml 500 ml
Laboratorios Grifols, S.A. Baxter S.L.
Lípidos Smoflipid® 20% 100-250 ml Fresenius Kabi España S.A.U
Electrolitos
Suplecal® 10 ml B. Braun Medical, S.A.
Sulfato de magnesio 150 mg/ml 10 ml GENFARMA laboratorio, S.L.
Cloruro de Sodio 20% 10 ml B. Braun Medical, S.A.
Acetato sódico 1M 10 ml Fresenius Kabi España S.A.U
Cloruro potásico 1M 10 ml B. Braun Medical, S.A.
Acetato potásico 1M 50 ml Fresenius Kabi España S.A.U
Glycophos® 20 ml Fresenius Kabi España S.A.U
Oligoelementos Peditrace® 10 ml Fresenius Kabi España S.A.U
Vitaminas Soluvit® Lyophilised mixture Fresenius Kabi España S.A.U
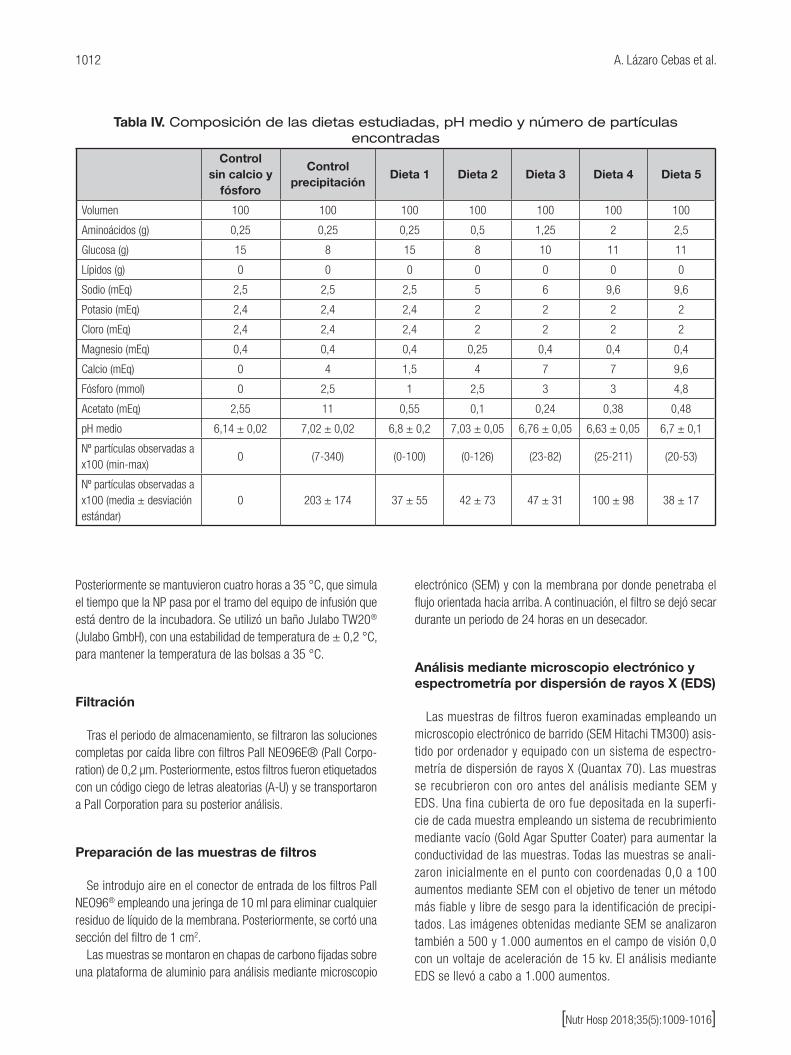
1012 A. Lázaro Cebas et al.
[Nutr Hosp 2018;35(5):1009-1016]
Posteriormente se mantuvieron cuatro horas a 35 °C, que simula el tiempo que la NP pasa por el tramo del equipo de infusión que está dentro de la incubadora. Se utilizó un baño Julabo TW20® (Julabo GmbH), con una estabilidad de temperatura de ± 0,2 °C, para mantener la temperatura de las bolsas a 35 °C.
Filtración
Tras el periodo de almacenamiento, se filtraron las soluciones completas por caída libre con filtros Pall NEO96E® (Pall Corpo-ration) de 0,2 µm. Posteriormente, estos filtros fueron etiquetados con un código ciego de letras aleatorias (A-U) y se transportaron a Pall Corporation para su posterior análisis.
Preparación de las muestras de filtros
Se introdujo aire en el conector de entrada de los filtros Pall NEO96® empleando una jeringa de 10 ml para eliminar cualquier residuo de líquido de la membrana. Posteriormente, se cortó una sección del filtro de 1 cm2.
Las muestras se montaron en chapas de carbono fijadas sobre una plataforma de aluminio para análisis mediante microscopio
electrónico (SEM) y con la membrana por donde penetraba el flujo orientada hacia arriba. A continuación, el filtro se dejó secar durante un periodo de 24 horas en un desecador.
Análisis mediante microscopio electrónico y espectrometría por dispersión de rayos X (EDS)
Las muestras de filtros fueron examinadas empleando un microscopio electrónico de barrido (SEM Hitachi TM300) asis-tido por ordenador y equipado con un sistema de espectro-metría de dispersión de rayos X (Quantax 70). Las muestras se recubrieron con oro antes del análisis mediante SEM y EDS. Una fina cubierta de oro fue depositada en la superfi-cie de cada muestra empleando un sistema de recubrimiento mediante vacío (Gold Agar Sputter Coater) para aumentar la conductividad de las muestras. Todas las muestras se anali-zaron inicialmente en el punto con coordenadas 0,0 a 100 aumentos mediante SEM con el objetivo de tener un método más fiable y libre de sesgo para la identificación de precipi-tados. Las imágenes obtenidas mediante SEM se analizaron también a 500 y 1.000 aumentos en el campo de visión 0,0 con un voltaje de aceleración de 15 kv. El análisis mediante EDS se llevó a cabo a 1.000 aumentos.
Tabla IV. Composición de las dietas estudiadas, pH medio y número de partículas encontradas
Control
sin calcio y fósforo
Control precipitación
Dieta 1 Dieta 2 Dieta 3 Dieta 4 Dieta 5
Volumen 100 100 100 100 100 100 100
Aminoácidos (g) 0,25 0,25 0,25 0,5 1,25 2 2,5
Glucosa (g) 15 8 15 8 10 11 11
Lípidos (g) 0 0 0 0 0 0 0
Sodio (mEq) 2,5 2,5 2,5 5 6 9,6 9,6
Potasio (mEq) 2,4 2,4 2,4 2 2 2 2
Cloro (mEq) 2,4 2,4 2,4 2 2 2 2
Magnesio (mEq) 0,4 0,4 0,4 0,25 0,4 0,4 0,4
Calcio (mEq) 0 4 1,5 4 7 7 9,6
Fósforo (mmol) 0 2,5 1 2,5 3 3 4,8
Acetato (mEq) 2,55 11 0,55 0,1 0,24 0,38 0,48
pH medio 6,14 ± 0,02 7,02 ± 0,02 6,8 ± 0,2 7,03 ± 0,05 6,76 ± 0,05 6,63 ± 0,05 6,7 ± 0,1
Nº partículas observadas a x100 (min-max)
0 (7-340) (0-100) (0-126) (23-82) (25-211) (20-53)
Nº partículas observadas a x100 (media ± desviación estándar)
0 203 ± 174 37 ± 55 42 ± 73 47 ± 31 100 ± 98 38 ± 17

1013LÍMITES DE PRECIPITACIÓN EN NUTRICIONES PARENTERALES PEDIÁTRICAS CON FUENTES DE CALCIO Y FOSFATO ORGÁNICAS
[Nutr Hosp 2018;35(5):1009-1016]
Contaje de partículas
El número de partículas cristalinas observado en cada muestra a 100 aumentos se contabilizó de manera visual para dar una cifra aproximada del número de partículas. La superficie del filtro estudiada fue de 3,72 mm2, que se corresponde con un 2,25% de la superficie total del filtro.
ESTUDIOS COMPLEMENTARIOS
Ante la gran cantidad de precipitados encontrados, que no con-cordaban con los estudios publicados y en los que no intervenía el fósforo, se realizaron varios estudios complementarios:
1. Análisis de una NP por triplicado sin fósforo y otra sin calcio: para determinar si el fósforo tenía algún papel en la formación de los precipitados.
2. Análisis de una NP por triplicado, en cuya elaboración se filtra-ron todos los componentes con un filtro de cinco micras: para descartar que los precipitados proviniesen de los productos con los que se habían elaborado las nutriciones parenterales.
3. Análisis de una NP por triplicado elaborada añadiendo pri-mero el glicerofosfato sódico y, al final de la preparación, el gluconato cálcico: para descartar que al añadir primero el glicerofosfato hubiera mayor formación de precipitados.
4. Análisis de una solución saturada de bifosfato cálcico: para asegurar que el sistema de espectrometría de dispersión de rayos X medía la cantidad de fósforo de la muestra.
5. Análisis de una NP por triplicado filtrada por un filtro de 1,2 micras y posteriormente por otro de 0,2 micras: para ver si el filtrado evitaba el paso al paciente de precipitados.
6. Análisis de una NP por triplicado en la que inmediatamente después de filtrar se infunde aire en el filtro: para descartar que los precipitados se formen posteriormente al filtrado, durante el transporte del filtro.
7. Análisis de una NP por triplicado donde el secado y la observa-ción por microscopia electrónica se realizaron inmediatamente después de la filtración: para descartar que los precipitados se formasen posteriormente al filtrado.
RESULTADOS
En la tabla II se puede ver el pH de las soluciones estudiadas con y sin lípidos. Las NP con lípidos presentaron un pH ligeramente más básico que las NP sin lípidos.
Los valores de pH de las distintas dietas se recogen en la tabla IV. Todos los valores oscilaron entre 6 y 7, siendo el más ácido el control sin calcio y fósforo. Los valores más básicos fueron los registrados para la dieta 2 y el control de precipitación, con baja concentración de aminoácidos y elevado aporte de calcio y fósforo.
En la mayoría de los filtros observados se visualizaron gran canti-dad de precipitados con 100 aumentos que tenían un tamaño entre 5 y 15 µm (Tabla IV).
Aunque en algún filtro se visualizaron partículas amorfas com-patibles con restos de goma procedentes de viales, cristales procedentes de ampollas o fibras procedentes de gasas (Fig. 1), la mayoría de las partículas encontradas fueron precipitados cristalinos con forma rectangular (Figs. 2-6). En la NP control, sin calcio ni fósforo, no se observó precipitado alguno y en el control de precipitación se encontraron numerosos precipitados (Fig. 7). Por otra parte, en todos los casos en los que se observaron estos precipitados cristalinos, en los análisis de composición por EDS, se detectó la presencia de calcio y un aumento del porcentaje de oxígeno, pero no se detectó fósforo.
Figura 1.
Partículas amorfas compatibles con goma.
Figura 2.
Filtro perteneciente a dieta 1 a x1000.

1014 A. Lázaro Cebas et al.
[Nutr Hosp 2018;35(5):1009-1016]
Figura 3.
Filtro perteneciente a dieta 2 a x1000.
Figura 6.
Filtro perteneciente a dieta 5 a x1000.
Figura 4.
Filtro perteneciente a dieta 3 a x1000.
Figura 7.
Filtro perteneciente al control de precipitación a x1000.
Figura 5.
Filtro perteneciente a dieta 4 a x1000.
ESTUDIOS COMPLEMENTARIOS
1. Análisis de una NP sin fósforo y otra sin calcio: solo se encon-traron precipitados en la NP que contenía calcio.
2. Análisis de una NP elaborada filtrando todos los componentes con un filtro de cinco micras: no se observaron partículas compatibles con fibras, cristales o goma. Se encontró igual número de precipitados en las NP en las que se filtraban los componentes que en las que no se filtraban.
3. Análisis de una NP elaborada añadiendo primero el glicero-fosfato sódico y, al final de la preparación, el gluconato cálcico: se encontraron precipitados en ambas NP.
4. Análisis de una solución saturada de bifosfato cálcico: el sis-tema de espectrometría de dispersión de rayos X detectó fósforo y calcio.

1015LÍMITES DE PRECIPITACIÓN EN NUTRICIONES PARENTERALES PEDIÁTRICAS CON FUENTES DE CALCIO Y FOSFATO ORGÁNICAS
[Nutr Hosp 2018;35(5):1009-1016]
5. Análisis de una NP filtrada por un filtro de 1,2 micras y, poste-riormente, por otro de 0,2 micras: se detectaron precipitados en los dos tipos de filtros, pero en mayor cantidad en el de 1,2 micras.
6. Análisis de una NP en la que inmediatamente después de fil-trar se infunde aire en el filtro: se encontraron muchos menos precipitados y de distinto tipo.
7. Análisis de una NP donde el secado y la observación por microscopia electrónica se realizaron inmediatamente des-pués de la filtración: no se observaron precipitados cristalinos.
DISCUSIÓN
Aunque se han encontrado gran cantidad de precipitados de forma cristalina, estos se han formado, con mucha probabilidad, posteriormente a su filtración ya que, cuando se deseca y observa el filtro inmediatamente después de su filtración, estos cristales no aparecen. No podemos conocer la naturaleza de estos precipitados, pero en su composición están presentes el calcio y el oxígeno y, por la forma de los cristales, podría tratarse de oxalato cálcico.
La causa de la formación de estos precipitados requiere más estudio. Es posible que en la solución retenida en el filtro hubiera microprecipitados que, al evaporarse el agua lentamente en los 2-4 días que duró el transporte, diera lugar a la cristalización de las partículas observadas. Cuando se introduce aire en el filtro antes del transporte el número de cristales disminuye mucho. Aunque en su composición interviene el calcio, en ninguna muestra se ha encon-trado fósforo, por lo que parece que los precipitados encontrados no son de fosfato cálcico, que era el objetivo de nuestro estudio.
MacKay y cols. (18) tampoco encontraron precipitados mayores de 5 µm a concentraciones de hasta 50 mEq/l de calcio y 50 mmol/l de fósforo empleando gluconato cálcico y glicerofosfato sódico y a concentraciones de aminoácidos de 4 y 1,5 %. Estas concentracio-nes de calcio, fósforo y aminoácidos son similares a las de nuestro estudio. Estos autores estudian la precipitación producida después de 24 horas a 37 °C para simular las condiciones de la incuba-dora, temperatura y tiempo superiores a los de nuestro estudio. A diferencia de nuestro estudio, en el que utilizamos como fuente de aminoácidos Primene®, en este estudio utilizan Trophamine®, con adición de cisteína en algunos casos, lo que hace que los pH de las soluciones sean en su mayoría más bajos que los nuestros (5,4-6,38), incluso cuando alcalinizan hasta el pH de las soluciones con lípidos (6,07-6,91).
Por otro lado, Chaieb y cols. (15) encuentran precipitados con glucosa-1-fosfato (40 mmol/l de fósforo y 31,5-60 mEq/l de calcio) utilizando microscopio óptico y analizando la concentración de calcio antes y después de la filtración.
Para evitar problemas con la detección de partículas por micros-copia, no hemos incluido lípidos en las NP. La adición de lípidos a la NP aumenta el pH de la mezcla y, como ya hemos comentado, la
precipitación calcio-fosfato aumenta en medio básico. En nuestro estudio, esta disminución de pH debida a los lípidos fue pequeña. Y, además, está descrito que los lípidos podrían aumentar la compati-bilidad calcio-fosfato (25). Consideramos como hipótesis más pro-bable que la adición de lípidos no tiene influencia en la precipitación.
Al no haber filtrado las NP en la elaboración, hemos encontrado partículas que podrían haberse generado en la preparación de la NP, como la figura 1, que posiblemente se ha formado al perforar un vial con una aguja.
Generalmente, las soluciones intravenosas contienen partículas en suspensión y su infusión no produce síntomas graves inmediatos en la mayoría de los casos (27). Sin embargo, su infusión a largo plazo se ha relacionado con aumento del riesgo de flebitis (28) y se han encontrado lesiones de los capilares en necropsias que podrían ser la causa de hipertensión pulmonar (29). Recientemente, diversos estudios (30-32) han demostrado una disminución de complicacio-nes graves en pacientes pediátricos críticos con el uso de filtros para la retención de partículas, apoyando la hipótesis del efecto nocivo de infusión de las mismas.
Las NP analizadas en nuestro estudio estarían dirigidas a niños recién nacidos, en muchos casos prematuros. Como se indica en varios estudios, el diámetro de los capilares neonatales puede ser inferior a 10 µm (33,34), por lo que existe el riesgo de que pudieran ser obturados con partículas o precipitados de estos tamaños. Es por ello que se recomienda filtrar en la administración de la NP o, al menos, filtrar los productos en la preparación de la NP.
CONCLUSIONES
En nuestro estudio no hemos encontrado precipitados de fosfato cálcico en los límites actualmente recogidos en el documento consenso de preparación SENPE/SEGHNP/SEFH. Sin embargo, es posible que se formen microprecipitados de algún compuesto con calcio en su composición. Cuando no se filtran los compo-nentes en la preparación, la NP puede contener partículas de goma, cristal, etc. Por ello es importante la utilización de filtros en la administración de NP y/o en la preparación de la NP para asegurar que este tipo de precipitados queden retenidos en la membrana y no pasen al niño.
BIBLIOGRAFÍA
1. Knight PJ, Buchanan S, Clatworthy HW. Calcium and phosphate require-ments of preterm infants who require prolonged hyperalimentation. JAMA 1980;243(12):1244-6.
2. Nehra D, Carlson SJ, Fallon EM, Kalish B, Potemkin AK, Gura KM, et al. ASPEN clinical guidelines: nutrition support of neonatal patients at risk for metabolic bone disease. JPEN J Parenter Enter Nutr 2013;37(5):570-98.
3. McKinnon BT. FDA safety alert: hazards of precipitation associated with parenteral nutrition. Nutr Clin Pract 1996;11(2):59-65.
4. Eggert LD, Rusho WJ, MacKay MW, Chan GM. Calcium and phosphorus compatibility in parental nutrition solutions for neonates. Am J Hosp Pharm 1982;39(1):49-53.

1016 A. Lázaro Cebas et al.
[Nutr Hosp 2018;35(5):1009-1016]
5. Poole RL, Rupp CA, Kerner JA. Calcium and phosphorus in neonatal parente-ral nutrition solutions. JPEN J Parenter Enteral Nutr1983;7(4):358-60.
6. Fitzgerald KA, MacKay MW. Calcium and phosphate solubility in neonatal parenteral nutrient solutions containing trophamine. Am J Hosp Pharm 1986;43(1):88-93.
7. Fitzgerald KA, MacKay MW. Calcium and phosphate solubility in neonatal parenteral nutrient solutions containing aminosyn PF. Am J Hosp Pharm 1987;44(6):1396-400.
8. Lenz GT, Mikrut BA. Calcium and phosphate solubility in neonatal parenteral nutrient solutions containing aminosyn-PF or trophamine. Am J Hosp Pharm 1988;45(11):2367-71.
9. Dunham B, Marcuard S, Khazanie PG, Meade G, Craft T, Nichols K. The solubility of calcium and phosphorus in neonatal total parenteral nutrition solutions. JPEN J Parenter Enteral Nutr 1991;15(6):608-11.
10. Ronchera-Oms CL, Jiménez NV, Peidro J. Stability of parenteral nutri-tion admixtures containing organic phosphates. Clin Nutr Edinb Scotl 1995;14(6):373-80.
11. MacKay M, Jackson D, Eggert L, Fitzgerald K, Cash J. Practice-based vali-dation of calcium and phosphorus solubility limits for pediatric parenteral nutrition solutions. Nutr Clin Pract 2011;26(6):708-13.
12. MacMahon P, Mayne PD, Blair M, Pope C, Kovar IZ. Calcium and phos-phorus solubility in neonatal intravenous feeding solutions. Arch Dis Child 1990:352-3.
13. Raupp P, Von Kries R, Pfahl HG, Manz F. Glycero- vs glucose-phosphate in parenteral nutrition of premature infants: a comparative in vitro eva-luation of calcium/phosphorus compatibility. JPEN J Parenter Enteral Nutr 1991;15(4):469-73.
14. Prinzivalli M, Ceccarelli S. Sodium D-fructose-1, 6-diphosphate vs. sodium monohydrogen phosphate in total parenteral nutrition: a comparative in vitro assessment of calcium/phosphate compatibility. J Parenter Enter Nutr 1999;23(6):326-32.
15. Chaieb SD, Chaumeil JC, Jebnoun S, Khrouf N, Hedhili A, Sfar S. Calcium and phosphate compatibility and stability studies in different neonatal parenteral nutrition mixtures. Eur J Hosp Pharm Sci 2006;12(2):35-45.
16. Wong JC, McDougal AR, Tofan M, Aulakh J, Pineault M, Chessex P. Doubling calcium and phosphate concentrations in neonatal parenteral nutrition solutions using monobasic potassium phosphate. J Am Coll Nutr 2006;25(1):70-7.
17. Bouchoud L, Fonzo-Christe C, Sadeghipour F, Bonnabry P. Maximizing calcium and phosphate content in neonatal parenteral nutrition solutions using organic calcium and phosphate salts. JPEN J Parenter Enter Nutr 2010;34(5):542-5.
18. MacKay M, Anderson C. Physical compatibility of sodium glycerophosphate and calcium gluconate in pediatric parenteral nutrition solutions. JPEN J Parenter Enter Nutr 2015;39(6):725-8.
19. Anderson C, MacKay M. Physical compatibility of calcium chloride and sodium glycerophosphate in pediatric parenteral nutrition solutions. JPEN J Parenter Enter Nutr 2016;40(8):1166-9.
20. Hanning RM, Mitchell MK, Atkinson SA. In vitro solubility of calcium glycero-phosphate versus conventional mineral salts in pediatric parenteral nutrition solutions. J Pediatr Gastroenterol Nutr 1989;9(1):67-72.
21. Mandrile M. Estabilidad y compatibilidad de sales de calcio y fósforo en soluciones de aminoácidos destinadas a mezclas de nutrición parenteral. Tesis doctoral. Córdoba: Facultad de Ciencias Químicas, Departamento de Farmacia, Universidad Nacional de Córdoba; 2014.
22. Ribeiro D, Lobo B, Volpato N, Da Veiga V, Cabral L, De Sousa V. Influence of the calcium concentration in the presence of organic phosphorus on the phy-sicochemical compatibility and stability of all-in-one admixtures for neonatal use. Nutr J 2009;8(1):51.
23. Cardona D, Cervera M, Fernández M, Gomis P, Martínez MJ, Rodriguez J, et al. Consenso español sobre preparación de mezclas nutrientes parenterales 2008. Grupo de Nutrición de la SENPE-SEFH. Farm Hosp 2009;33(Supl. 1):81-107.
24. Corriol O, Crauste-Manciet S, Arnaud P, Brion F, Brossard D, Causse R, et al. Recommandations pour la préparation des mélanges de nutrition parentérale. Nutr Clin Métabolisme 2005;19(1):30-55.
25. Chaieb DS, Chaumeil JC, Jebnoun S, Khrouf N, Hedhili A, Sfar S. Effect of the intravenous lipid emulsions on the availability of calcium when using organic phosphate in TPN admixtures. Pharm Res 2008;25(11):2545-54.
26. EDQM Council of Europe. Particulate contamination: sub-visible particles. En : European Pharmacopoeia. 8a ed. Strasbourg: EDQM Council of Europe; 2013. pp. 321-3.
27. Ball PA. Intravenous in-line filters: filtering the evidence: Curr Opin Clin Nutr Metab Care 2003;6(3):319-25.
28. Allcutt DA, Lort D, McCollum CN. Final inline filtration for intravenous infu-sions: a prospective hospital study. Br J Surg 1983;70(2):111-3.
29. Puntis JW, Wilkins KM, Ball PA, Rushton DI, Booth IW. Hazards of parenteral treatment: do particles count? Arch Dis Child 1992;67(12):1475-7.
30. Jack T, Boehne M, Brent BE, Hoy L, Köditz H, Wessel A, et al. In-line filtra-tion reduces severe complications and length of stay on pediatric intensive care unit: a prospective, randomized, controlled trial. Intensive Care Med 2012;38(6):1008-16.
31. Boehne M, Jack T, Köditz H, Seidemann K, Schmidt F, Abura M, et al. In-line filtration minimizes organ dysfunction: new aspects from a prospective, ran-domized, controlled trial. BMC Pediatr 2013;13(1):1.
32. Sasse M, Dziuba F, Jack T, Köditz H, Kaussen T, Bertram H, et al. In-line filtration decreases systemic inflammatory response syndrome, renal and hematologic dysfunction in pediatric cardiac intensive care patients. Pediatr Cardiol 2015;36(6):1270-8.
33. Dornan JC, Meban C. The capillary plexus in the gas exchange zone of human neonatal lung: an ultrastructural study. Thorax 1985;40(10):787-92.
34. Ruef P, Stadler AA, Poeschl J. Flow behavior of fetal, neonatal and adult RBCs in narrow (3-6 μm) capillaries - Calculation and experimental application. Clin Hemorheol Microcirc 2014;58(2):317-31.

NutriciónHospitalaria
Trabajo Original Paciente crítico
ISSN (electrónico): 1699-5198 - ISSN (papel): 0212-1611 - CODEN NUHOEQ S.V.R. 318
Correspondence: Diana Borges Dock-Nascimento. Department of Food and Nutrition and Health Sciences Postgraduate Course. Federal University of Mato Grosso (UFMT). Av. Fernando Corrêa da Costa, 2367. Bairro Boa Esperança. 78060-900 Cuiabá, Mato Grosso. Brazile-mail: [email protected]
Arantes SS, Silva Jr JM, de Aguilar-Nascimiento JE, Dock-Nascimiento DB. Effects of intravenous fluid overload on caloric and protein deficit in critically ill patients. Nutr Hosp 2018;35(5):1017-1023
DOI: http://dx.doi.org/10.20960/nh.1839
Effects of intravenous fluid overload on caloric and protein deficit in critically ill patientsEfectos de la sobrecarga de líquidos por vía intravenosa en el déficit calórico y proteico en pacientes críticamente enfermos
Suzana Souza Arantes1, João Manoel Silva Jr2, José Eduardo de Aguilar-Nascimento3 and Diana Borges Dock-Nascimento4
1Nutrition. Centro Universitario de Varzea Grande (UNIVAG). Cuiabá, Mato Grosso. Brazil. 2Physics. Institute for Medical Assistance for State-Level Government Employees (IAMSPE). São Paulo, Brazil. 3Graduate Program in Health Sciences. Federal University of Mato Grosso (UFMT). Cuiabá, Mato Grosso. Brazil. Brazilian Society of Parenteral and Enteral Nutrition (BRASPEN, SBNPE). UNIVAG Medical School. Várzea Grande, Mato Grosso. Brazil. 4Department of Food and Nutrition and Health Sciences Postgraduate Course. Federal University of Mato Grosso (UFMT). Cuiabá, Mato Grosso. Brazil
Palabras clave:
Cuidados intensivos. Líquidos intravenosos. Nutrición enteral. Déficit calórico. Déficit de proteínas.
Resumen Introducción: la sobrecarga de líquidos por vía intravenosa puede provocar dismotilidad que puede afectar el suministro de nutrición enteral temprana en pacientes críticos.
Objetivos: este estudio tuvo como objetivo comparar el volumen de líquidos por vía intravenosa (IF) con la aparición de déficit calórico y proteico en pacientes de la Unidad de Cuidados Intensivos (UCI).
Métodos: este estudio de cohorte incluyó a pacientes críticamente enfermos con ventilación mecánica que recibían nutrición enteral temprana (target: 25-30 kcal/kg/día y 1,25-2,0 g de proteína/kg/día. Durante los primeros cinco días calculamos el volumen de IF y el déficit calórico/proteico.
Resultados: ochenta y seis pacientes críticamente enfermos (SAPS III: 62 ± 10) con una edad media de 68 (18-91) años fueron estudiados. Los pacientes recibieron una mediana de 2.969 (920-5.960) ml/día de IF, que correspondió a una mediana de 41,6 (17,0-88,2) ml/kg/día y a 10,7 (3,31-21,45) g de sodio/día. Todos los pacientes tenían déficit calórico (media: 1.812 ± 850 kcal en cinco días) y en 23 (27%) este déficit excedía las 480 kcal/día. El déficit medio de proteínas fue de 94,6 ± 5,9 g en cinco días y 34 pacientes (40%) tuvieron más de 20 g de déficit/día. Los pacientes con un déficit calórico superior a 480 kcal/día recibieron aproximadamente 1,5 l de IF y 10 g de NaCl más que los otros pacientes. De forma similar, los pacientes con un déficit de proteínas mayor de 20 g/día recibieron aproximadamente 3 l de IF y 25 g de NaCl más que los otros pacientes. La mortalidad fue mayor en pacientes con déficit proteico crítico (69% vs. 41,1%; p = 0,01).
Conclusión: en pacientes críticamente enfermos que reciben nutrición enteral, el volumen de líquidos intravenosos infundidos afecta el suministro de nutrición y aumenta el déficit de calorías y proteínas.
Key words:
Critical care. Intravenous fluid. Enteral nutrition. Caloric deficit. Protein deficit.
Abstract Introduction: intravenous fluid overload may lead to dysmotility that may impair early enteral nutrition delivery in critically ill patients.
Objectives: this study aimed to compare the volume of intravenous fluids (IF) with the occurrence of caloric and protein deficits in Intensive Care Unit (ICU) patients.
Methods: this cohort study included critically ill patients with mechanical ventilation and receiving early enteral nutrition (target: 25-30 kcal/kg/day and 1.25-2.0 g of protein/kg/day). Over the first five days the volume of IF infused and caloric/protein deficits were calculated.
Results: eighty-six critically ill patients (SAPS III score: 62 ± 10) with a mean age of 68 (18-91) years were enrolled. Patients received a median of 2,969 (920-5,960) ml/day of IF, which corresponded to a median of 41.6 (17.0-88.2) ml/kg/day and 10.7 (3.31-21.45) g of sodium/day. All patients had a caloric deficit (mean: 1,812 ± 850 kcal over five days) and in 23 (27%) this deficit exceeded 480 kcal/day. The mean protein deficit was 94.6 ± 5.9 g over five days, and 34 patients (40%) had more than 20 g of deficit/day. Patients with caloric deficit greater than 480 kcal/day received approximately 1.5 l of IF and 10 g of NaCl more than the other patients. Similarly, patients with protein deficit greater than 20 g/day received approxi-mately 3 l of IF and 25 g of NaCl more than the other patients. Mortality was greater in patients with critical protein deficit (69% vs 41.1%; p = 0.01).
Conclusion: in critically ill patients receiving enteral nutrition, the volume of intravenous fluids infused affected nutrition delivery and increased caloric and protein deficits.
Received: 11/02/2018 • Accepted: 02/05/2018
©Copyright 2018 SENPE y ©Arán Ediciones S.L. Este es un artículo Open Access bajo la licencia CC BY-NC-SA (http://creativecommons.org/licenses/by-nc-sa/4.0/).

1018 S. S. Arantes et al.
[Nutr Hosp 2018;35(5):1017-1023]
INTRODUCTION
Patients with systemic inflammatory responses experience intense catabolism that aggravates their clinical and nutritional status, and the consequences of these events are high compli-cation and mortality rates (1,2). The optimization of intravenous fluid management and nutritional intake is fundamental in the care of critically ill patients. The objective of intravenous fluid therapy is to maintain adequate intravascular volume and pre-vent tissue hypoperfusion and organ dysfunction (3,4). Howev-er, continued and repeated infusion of fluids results in edema, electrolyte imbalance, and inadequate weight gain, all of which contribute to worse outcomes including increase of mortality (5-7). In addition, patients also receive fluids through diluents, medications, nutrition, and maintenance fluids (8). Therefore, similar to other medications, fluids have qualitative and quanti-tative adverse effects (9,10).
Strategies to prevent fluid overload are beneficial after hemody-namic stability (11). Enteral nutrition is one of the recommended methods for feeding critically ill patients (12). Enteral nutrition provision and fluid therapy should be balanced as continuous fluid infusion may lead to edema of the mesentery and intestinal wall, which results in dysmotility, vomiting, and ileus, all of which compromise the provision of enteral nutrition (13). According to the guidelines of the Surviving Sepsis Campaign (14), patients with septic shock should receive fluid resuscitation with an initial administration of 30 ml of fluid/kg of body weight. In line with this recommendation, the British Consensus Guidelines on Intravenous Fluid Therapy for Adult Surgical Patients suggests a more restric-tive fluid volume (15,16).
Because no study has assessed the relationship between fluid administration and enteral nutrition infusion, the present study aimed to evaluate the effect of intravenous fluid administration on caloric and protein deficits in critically ill patients on mechanical ventilation and exclusively receiving enteral nutrition.
MATERIAL AND METHODS
This prospective cohort study was conducted between June 2014 and December 2015 in a tertiary hospital. The study was approved by the Human Research Ethics Committee of the Júlio Müller Hospital and was conducted according to the 1975 Dec-laration of Helsinki, revised in 2000. The relatives or guardians of the included patients provided informed consent, if the own patient could not sign the term.
INCLUSION AND EXCLUSION CRITERIA
The study included consecutive critically ill non-surgical pa-tients who were admitted for a minimum of five days for clinical treatment, who were on mechanical ventilation in the intensive care unit (ICU), and who received exclusive enteral nutrition. The study excluded pregnant patients, patients with late introduction
to enteral feeding (> 48 h after admission), patients who received parenteral nutrition associated or not to enteral nutrition, and pa-tients who died within the first five days of hospitalization.
INSTITUTIONAL NUTRITIONAL THERAPY PROTOCOL
Enteral feeding was initiated within 24 h after hemodynamic stability was reached and after the confirmation of the feeding tube position in the X-ray. Caloric and protein requirements were calculated according to the guidelines from the European Society for Parenteral and Enteral Nutrition (12). The targets were 25-30 kcal/kg of body weight and 1.25-2.0 g of protein/kg of body weight. The goal was to reach the targets on the third or fourth day of the nutrition regimen. To achieve this goal, either one-third or one-fourth of the calculated daily enteral feeding requirements was prescribed per day.
DEMOGRAPHIC, CLINICAL, NUTRITIONAL, BIOCHEMICAL AND MORTALITY-RELATED DATA
Age, sex, body weight, and nutritional status during the first 24 h of hospitalization were recorded. The illness severity score was determined using the Simplified Acute Physiology Score 3 (SAPS 3) in the ICU. The five-day caloric and protein require-ments and deficits were calculated. Levels of C-reactive protein (mg/l), albumin (g/dl), lactate (mg/dl), and serum glucose (mg/dl) were measured daily. The serum albumin level was dichotomized into ≥ 3.5 g/dl or < 3.5 g/dl. Mortality at 28 days and length of hospital stay were recorded. Each patient’s nutritional status was evaluated using the Subjective Global Assessment (SGA), which divides patients into the categories of SGA A (eutrophic), SGA B (at risk of malnutrition or moderate malnutrition), or SGA C (severe malnutrition).
CALORIC AND PROTEIN DEFICITS
Caloric and protein deficits were calculated on the fifth day of hospitalization. These calculations determined the difference between the prescribed amounts of calories and protein and the amount received over the course of the five days. All prescrip-tions of calories and protein followed the guidelines cited above (12). For statistical analysis, the patients were divided into two groups according to caloric and protein deficits: a) those with a caloric deficit (i.e., ≥ 480 kcal/day) and/or with a critical protein deficit (i.e., ≥ 20 g of protein/day); and b) those with no caloric deficit and/or critical protein deficit (deficits which did not reach the aforementioned levels). These parameters were based on a previous study (17) that showed that these limits of caloric and protein deficits are significantly sensitive for predicting the risk of mortality.

1019
[Nutr Hosp 2018;35(5):1017-1023]
EFFECTS OF INTRAVENOUS FLUID OVERLOAD ON CALORIC AND PROTEIN DEFICIT IN CRITICALLY ILL PATIENTS
VOLUME OF INTRAVENOUS FLUIDS AND SODIUM
The volumes of intravenous fluids administered to the patients during the first five days of hospitalization were recorded. These fluids included crystalloid fluids (0.9% saline solution; simple Ringer’s solution, lactated Ringer’s solution, or glucose solution), colloid fluids of any type, distilled water/drug diluting solution, medications, and blood or blood products. In addition, the total volumes of sodium infused intravenously on the first day and over the five days of hospitalization were calculated using the information on the products’ leaflets.
PRIMARY ENDPOINT
The primary endpoint consisted in comparing the volume of intravenous fluids received by patients with or without caloric and/or protein deficits (according to the previously described limits). The volumes of sodium and sodium chloride administered to the two groups of patients were also compared.
STATISTICAL ANALYSIS
Continuous variables were initially analyzed using Levene’s test to assess homogeneity, followed by the Kolmogorov-Smirnov test to determine normality. Student’s t-test was used to compare continuous variables. Dichotomous variables were compared us-ing the Fisher’s exact test or the Chi-square test with Yates’ cor-rection. Data are expressed as mean ± standard deviation or as median and minimum-maximum. Statistical significance was set at 5% (p < 0.05). Statistical Package for the Social Sciences, ver-sion 17.0 (IBM Corp., Armonk, NY) was used to analyze the data.
RESULTS
Eighty-six patients hospitalized for a minimum of five days and on mechanical ventilation and on exclusively enteral therapy were prospectively studied. The patients’ data are shown in table I. Mortality was 41.9% (n = 36) and median SAPS 3 score was 63 (interquartile range: 52.7-79).
INFUSION OF INTRAVENOUS FLUIDS AND SODIUM
The patients received 2,969 (range: 920-5,958) ml of in-travenous fluid/day in the first five days, which is equivalent to 41.6 (range: 17.0-88.2) m/kg/day. On the first day, 3,015 (range: 1,195-9,280) ml/day and 44.4 (range: 16-168) ml/kg/day of intravenous fluids were administered. During this period, the patients received 134 (range: 41-268) ml of sodium chlo-ride/day and 10.7 (range: 3.3-21.4) g of sodium/day. Sixty-five
patients (76.5%) received more than 30 ml of fluid/kg of body weight/day over the five days.
INFUSION OF ENTERAL NUTRITION
Enteral nutrition was initiated up to 48 h after admission in all patients. The mean percentage of enteral feeding infusion during the first five days was 67 ± 19.8% of the prescribed volume. Only 24.4% of the patients (n = 21) received ≥ 80% enteral feeding and 20.9% (n = 18) received < 50% enteral feeding in the first five days of hospitalization.
CALORIC AND PROTEIN DEFICITS
All patients exhibited caloric deficits, with the mean of 1,812 ± 850 calories over five days and 362 ± 170 kcal/day. Similarly, all patients had protein deficits (mean: 94.6 ± 45.9 g over five days and 18.9 ± 9.2 g/day). Twenty-three patients (27.0%) exhibited critical caloric deficits (≥ 480 kcal/day) and 34 (40%) exhibited critical protein deficits (≥ 20 g per day). Mortality was greater in patients with critical protein deficit (69% vs 41.1%; p = 0.01) but did not differ in patients with critical caloric deficit (58.7% vs 56.5%; p = 0.85) compared to patients without critical deficits.
Table I. Demographic, clinical, nutritional and biochemical data of the patients
Variable Median Range
Age (years) 68 18-91
Sex (n; %) Female Male
4739
54.745.3
Weight (kg) 70 40-130
Malnourished (n; %) 22 25.6
SAPS 3 63 29-94
Length of hospital stay (days) 21 5-202
Death (n; %) 50 58.8%
Caloric requirements (kcal) 1,750 1,000-2,500
Protein requirements (g) 95 48-165
Caloric deficit (kcal) 1,635 146.5-4,215
Protein deficit (g) 87 6.5-251
CRP (mg/l) 125 17-323
Albumin (g/dl) 2.9 1.5-4.8
Lactate (mg/dl) 24 10-68
Glucose (mg/dl) 182 94-353
SAPS 3: Simplified Acute Physiology Score 3; CRP: C-reactive protein. Data expressed as median, minimum-maximum, or number of cases and percentage.

1020 S. S. Arantes et al.
[Nutr Hosp 2018;35(5):1017-1023]
Table II shows the comparison between the volume of intrave-nous fluids, sodium chloride, and sodium infused to patients and the extent of their caloric deficits. Table III shows the comparison between these infused fluids and the extent of the patients’ pro-tein deficits. Critical protein deficits and critical caloric deficits were associated with a higher volume of infused fluids, sodium, and sodium chloride (p < 0.01 in all comparisons).
CLINICAL AND LABORATORY VARIABLES AND INTRAVENOUS FLUID
Tables IV and V show the comparison between the clinical, demographic, and laboratory variables and the extent of caloric and protein deficits, respectively. The level of serum albumin was significantly lower in patients with critical caloric deficits than in those without. There was no difference in the clinical and bio-chemical results between the patients with and those without critical protein deficits (Table V).
DISCUSSION
The findings of this study indicate that excessive infusion of in-travenous fluids and sodium is associated with caloric and protein deficits in critically ill patients receiving exclusive enteral nutrition. A positive fluid balance of fluids in critically ill patients may disturb gastrointestinal function by causing edema of the intestinal wall, gastroparesis, and ileus, all of which are associated with worse outcomes (1,18). Complications such as pulmonary edema, poor wound healing, and intestinal dysmotility can be reduced with fluid restriction (19,20).
In the present study, some patients received more than 80 ml of intravenous fluids/kg/day. This may have resulted in unrecorded gastrointestinal complications, which may have contributed to the caloric and protein deficits.
An increased mortality rate may be expected in patients who received aggressive fluid therapy (21). Since the publication of the early goal-directed therapy study (22), there have been significant changes in approaches to fluid resuscitation in case of critical
Table II. Comparison of the extent of caloric deficits and the infusion of intravenous fluids, sodium chloride and sodium
VariableCritical caloric deficit
(≥ 480 kcal/day) (n = 23)
Non-critical caloric deficit(< 480 kcal/day)
(n = 62)p
Fluids accumulated within five days (ml) 16,234 ± 4,816 14,908 ± 5,249 0.01
Fluids accumulated per day (ml) 3,246 ± 963 2,981 ± 1,049 0.01
Fluids accumulated on the first day (ml) 3,853 ± 1,611 3,225 ± 1,312 0.01
NaCl (g) 146 ± 43 134 ± 47 0.01
Na+ (g) 58.4 ± 17.3 53.7 ± 18.9 0.01
Na+ (g)/day 11.7 ± 3.4 10.7 ± 3.8 0.01
Data expressed as mean ± standard deviation.
Table III. Comparison of the extent of protein deficits and the infusion of intravenous fluids, sodium chloride and sodium
VariableCritical protein deficit
(≥ 20 g/day)(n = 34)
Non-critical protein deficit(< 20 g/day)
(n = 51)p
Fluids accumulated within five days (ml) 16,945 ± 4,717 14,147 ± 5,150 0.01
Fluids accumulated per day (ml) 3,389 ± 943 2,829 ± 1,030 0.01
Fluids accumulated on the first day (ml) 3,842 ± 1,649 3,100 ± 1,167 0.01
NaCl (g) 152 ± 42 127 ± 46 0.01
Na+ (g) 61.0 ± 16.9 50.9 ± 18.5 0.01
Na+ (g)/day 12.2 ± 3.4 10.2 ± 3.7 0.01
Data expressed as mean ± standard deviation

1021
[Nutr Hosp 2018;35(5):1017-1023]
EFFECTS OF INTRAVENOUS FLUID OVERLOAD ON CALORIC AND PROTEIN DEFICIT IN CRITICALLY ILL PATIENTS
illness. Several studies have indicated that the conservative use of fluids is more beneficial than liberal use (23-25). In most cases, approximately 30 ml/kg/day is sufficient for maintenance.
In the present study, an infusion of more than 30 ml/kg/day was recorded in up to 75% of the patients, which may have contributed to the lower infusion of enteral nutrition and increased caloric and protein deficits. This present study confirmed a previous study in our ICU (17) relating protein deficit in critically ill patients receiving enteral nutrition to greater mortality. Several studies have shown that the mean percentage of infused enteral nutrition is 50% to 70% of the prescribed volume (2,26-28). The excessive administration of
fluids and sodium may have a role with that. In this context, caloric and protein deficits result in increased mechanical ventilation-free days, and increased length of hospital stay; these deficits represent an independent factor for death (18,29). Moreover, when caloric and protein targets are met, the result is reduced mortality rates (30,31). The adequate infusion of proteins reduces protein catabo-lism by 50%, improves nitrogen balance (32), and reduces days on mechanical ventilation and (33) mortality (34). In the present study, the mean percentage of infused enteral nutrition was approximately 70% of the prescribed volume. Patients improve when the percent-age of infused enteral nutrition is higher than 80 (35).
Table V. Comparison of the extent of protein deficits and the patients’ data
VariableCritical protein deficit
(≥ 20 g/day)(n = 23)
Non-critical protein deficit(< 20 g/day)
(n = 62)p
Sex (n; %) Male Female
14 (29.8)20 (51.3)
33(70.2)19 (48.7)
0.07
Age (years) 62.4 ± 18.0 66.8 ± 16.2 0.25
Nutritional status (n; %) Well nourished Malnourished
29 (45.3)5 (22.7)
35 (54.7)17 (77.3)
0.10
SAPS 3 64.2 ± 15.9 64.9 ± 16.9 0.92
Lactate (mg/dl) 22.6 ± 6.9 24.5 ± 13.3 0.48
CRP (mg/l) 119.8 ± 78.9 129.5 ± 87.1 0.60
Serum albumin (g/dl) 2.84 ± 0.52 2.94 ± 0.57 0.10
SAPS 3: Simplified Acute Physiology Score 3; CRP: C-reactive protein. Data are expressed as mean ± standard deviation or number of cases and percentage.
Table IV. Comparison of calorie deficits and patients’ data
VariableCritical caloric deficit
(≥ 480 kcal/day)(n = 23)
Non-critical caloric deficit(< 480 kcal/day)
(n = 62)p
Sex (n; %) Male Female
9 (19.1)14 (35.9)
38 (80.2)25 (64.1)
0.09
Age (years) 62.8 ± 19.2 65.8 ± 16.2 0.47
Nutritional status (n; %) Well nourished Malnourished
19 (29.7)4 (18.2)
45 (70.3)18 (81.8)
0.40
SAPS 3 60.9 ± 13.7 66.0 ± 17.1 0.45
Lactate (mg/dl) 24.3 ± 10.9 23.5 ± 11.3 0.75
CRP (mg/l) 132.7 ± 84.3 122.9 ± 83.4 0.63
Serum albumin (g/dl) 2.69 ± 0.49 2.98 ± 0.56 0.03
SAPS 3: Simplified Acute Physiology Score 3; CRP: C-reactive protein. Data are expressed as mean ± standard deviation or number of cases and percentage.
1022 S. S. Arantes et al.
[Nutr Hosp 2018;35(5):1017-1023]
The results involving the total sodium volume administered to patients were very relevant. Sodium contributes to the occurrence of edema and anasarca. The infusion of saline solution is common but 0.9% sodium chloride is proven to be inadequate and “non-physi-ological” (36). Some patients receive up to ten times the adequate sodium volume (37) solely through the intravenous route, and sodi-um infused through enteral feeding needs to be added. According to a study, patients who receive more than 3 l of fluids and 154 mmol of sodium/day remain hospitalized for a longer period of time and exhibit delayed recovery of intestinal function (38).
The results of the present study show that the sodium volume may also have contributed to the observed caloric and protein deficits. Although the present study adds new data to the current literature on the topic, its limitations include the size and homoge-neity of the sample. However, the overall results showed that over-load of fluid infusion may impact the success of enteral nutrition infusion. These findings pave the way for further research on the topic. The current belief is that only gastrointestinal disorders and enteral nutrition formulation lead to enteral nutrition intolerance with subsequent caloric and protein deficits. To conclude, critical caloric and protein deficits are associated with a higher volume of fluids, sodium chloride, and sodium when these products are infused to critically ill patients on mechanical ventilation and re-ceiving exclusively enteral nutrition.
FINANCIAL SUPPORT
JEA-N received a grant of the CNPq-Brazil as a researcher.
REFERENCES
1. Giner M, Laviano A, Meguid MM, Gleason JR. In 1995, a correlation between malnutrition and poor outcome in critically ill patients still exists. Nutrition 1996;12(1):23-9.
2. Petros S, Engelmann L. Enteral nutrition delivery and energy expenditure in medical intensive care patients. Clin Nutr 2006;25(1):51-9.
3. Angus DC, Van der Poll T. Severe sepsis and septic shock. N Engl J Med 2013;369(9):840-51.
4. Packman MI, Rackow EC. Optimum left heart filling pressure during fluid resuscitation of patients with hypovolemic and septic shock. Crit Care Med 1983;11(3):165-9.
5. ARISE Investigators, ANZICS Clinical Trials Group, Peake SL, Delaney A, Bailey M, Bellomo R, et al. Goal-directed resuscitation for patients with early septic shock. N Engl J Med 2014;371(6):1496-506.
6. Rehm M, Hulde N, Kammerer T, Meidert AS, Hofmann-Kiefer K. State of the art in fluid and volume therapy: A user-friendly staged concept. Anaesthesist 2017;66(3):153-67. DOI: 10.1007/s00101-017-0272-x
7. Rosenberg AL, Dechert RE, Park PK, Bartlett RH; NIH NHLBI ARDS Network. Review of a large clinical series: association of cumulative fluid balance on outcome in acute lung injury: a retrospective review of the ARDS net tidal volume study cohort. J Intensive Care Med 2009;24(1):35-46. DOI:10.1177/0885066608329850
8. Silversides JA, Major E, Ferguson AJ, Mann EE, McAuley DF, Marshall JC, et al. Conservative fluid management or deresuscitation for patients with sepsis or acute respiratory distress syndrome following the resuscitation phase of critical illness: a systematic review and meta-analysis. Intensive Care Med 2017;43(2):155-70. DOI: 10.1007/s00134-016-4573-3
9. Boyd JH, Forbes J, Nakada T-A, Walley KR, Russell JA. Fluid resuscitation in septic shock: a positive fluid balance and elevated central venous pressure are associated with increased mortality. Crit Care Med 2011;39:259-65.
10. Raghunathan K, Murray PT, Beattie WS, Lobo DN, Myburgh J, Sladen R, et al. Choice of fluid in acute illness: what should be given? An inter-national consensus. Br J Anaesth 2014;113(5):772-83. DOI: 10.1093/bja/aeu301
11. Hoste EA, Maitland K, Brudney CS, Mehta R, Vincent JL, Yates D, et al. ADQI XII Investigators Group. Four phases of intravenous fluid therapy: a conceptual model. Br J Anaesth 2014;113(5):740-7. DOI: 10.1093/bja/aeu300
12. Kreymann KG, Berger MM, Deutz NE, Hiesmayr M, Jolliet P, Kazandjiev G, et al; ESPEN (European Society for Parenteral and Enteral Nutrition). ESPEN Guidelines on Enteral Nutrition: Intensive Care. Clin Nutr 2006;25(2):210-23.
13. Lobo DN. Fluid, electrolytes and nutrition: physiological and clinical aspects. Proc Nutr Soc 2004;63(3):453-66.
14. Dellinger RP, Levy MM, Rhodes A, Annane D, Gerlach H, Opal SM, et al.; Surviving Sepsis Campaign Guidelines Committee including the Pediatric Subgroup. Surviving sepsis campaign: international guidelines for mana-gement of severe sepsis and septic shock, 2012. Intensive Care Med 2013;39(2):165-228.
15. Soni N. British Consensus Guidelines on Intravenous Fluid Therapy for Adult Surgical Patients (GIFTASUP): Cassandra’s view. Anaesthesia 2009;64(3):235-8.
16. Woodcockm TE, Woodcock TM. Revised Starling equation and the glycocalyx model of transvascular fluid exchange: an improved paradigm for prescribing fluid therapy. Br J Anaesthesia 2012;108(3):384-94.
17. Siqueira-Paese MC, Dock-Nascimento DB, De Aguilar-Nascimento JE. Critical energy deficit and mortality in critically ill patients. Nutr Hosp 2016;33(3):253. DOI: 10.20960/nh.253
18. Gabay C, Kushner I. Acute-phase proteins and other systemic responses to inflammation. N Engl J Med 1999;340(6):448-54.
19. Brandstrup B, Tonnesen H, Beier-Holgersen R, Hjortsø E, Ørding H, Lindor-ff-Larsen K, et al. Effects of intravenous fluid restriction on postoperative complications: Comparison of two perioperative fluid regimens: a randomized assessor-blinded multicenter trial. Ann Surg 2003;238:641-8.
20. Lobo DN, Bostock KA, Neal KR, Perkins AC, Row-lands BJ, Allison SP. Effect of salt and water balance on recovery of gastrointestinal function after elective colonic resection: a randomised controlled trial. Lancet 2002;359:1812-8.
21. Kelm DJ, Perrin JT, Cartin-Ceba R, Gajic O, Schenck L, Kennedy CC, et al. Fluid overload in patients with severe sepsis and septic shock treated with early goal-directed therapy is associated with increased acute need for fluid-related medical interventions and hospital death. Shock 2015;43:68-73.
22. Rivers EP, Nguyen B, Havstad S, Ressler J, Muzzin A, Knoblich B, et al. Early goal-directed therapy in the treatment of severe sepsis and septic shock. N Engl J Med 2001;345:1368-77.
23. Mitchell KH, Carlbom D, Caldwell E, Leary PJ, Himmelfarb J, Hough CL. Volume overload: prevalence, risk factors, and functional outcome in survivors of septic shock. Ann Am Thorac Soc 2015;12(12):1837-44. DOI: 10.1513/AnnalsATS.201504-187OC
24. Rehm M, Hulde N, Kammerer T, Meidert AS, Hofmann-Kiefer K. State of the art in fluid and volume therapy: a user-friendly staged concept. Anaesthesist 2017;66(3):153-67. DOI: 10.1007/s00101-017-0272-x
25. Glassford NJ, Myles P, Bellomo R. The Australian approach to perioperative fluid balance. Curr Opin Anaesthesiol 2012;25:102-10.
26. De Jonghe B, Appere-De-Vechi C, Fournier M, Tran B, Merrer J, Melchior JC, et al. A prospective survey of nutritional support practices in intensive care unit patients: what is prescribed? What is delivered? Crit Care Med 2001;29(1):8-12.
27. Heyland DK, Heyland RD, Cahill NE, Dhaliwal R, Day AG, Jiang X, et al. Crea-ting a culture of clinical excellence in critical care nutrition: the 2008 “Best of the Best” award. JPEN J Parenter Enteral Nutr 2010;34(6):707-15.
28. Lee ZY, Barakatun-Nisak MY, Noor Airini I, Heyland DK. Enhanced pro-tein-energy provision via the enteral route in critically ill patients (PEP uP Protocol): a review of evidence. Nutr Clin Pract 2016;31(1):68-79.
29. Villet S, Chiolero RL, Bollmann MD, Revelly JP, Cayeux RNMC, Delarue J, et al. Negative impact of hypocaloric feeding and energy balance on clinical outcome in ICU patients. Clin Nutr 2005;24(4):502-9.
30. Weijs PJ, Stapel SN, De Groot SD, Driessen RH, De Jong E, Girbes AR, et al. Optimal protein and energy nutrition decreases mortality in mechanically ven-tilated, critically ill patients: a prospective observational cohort study. JPEN J Parenter Enteral Nutr 2012;36(1):60-8. DOI: 10.1177/0148607111415109
31. Allingstrup MJ, Esmailzadeh N, Wilkens Knudsen A, Espersen K, Hartvig Jen-senT, Wiis J, et al. Provision of protein and energy in relation to measured requirements in intensive care patients. Clin Nutr 2012;31(4):462-8. DOI: 10.1016/j.clnu.2011.12.006

1023
[Nutr Hosp 2018;35(5):1017-1023]
EFFECTS OF INTRAVENOUS FLUID OVERLOAD ON CALORIC AND PROTEIN DEFICIT IN CRITICALLY ILL PATIENTS
32. Ishibashi N, Plank LD, Sando K, Hill GL. Optimal protein requirements during the first 2 weeks after the onset of critical illness. Crit Care Med 1998;26(9):1529-35.
33. Trials N, Wiedemann HP, Wheeler AP, Bernard GR, Thompson BT, Hayden D, et al. Comparison of two fluid-management strategies in acute lung injury. N Engl J Med 2006;354:2564-75.
34. Weijs PJ, Looijaard WG, Beishuizen A, Girbes AR, Oudemans-van Straaten HM. Early high protein intake is associated with low mortality and ener-gy overfeeding with high mortality in non-septic mechanically ventilated critically ill patients. Crit Care 2014;18(6):701. DOI: 10.1186/s13054-014-0701-z
35. Wei X, Day AG, Ouellette-Kuntz H, Heyland DK. The association between nutritional adequacy and long-term outcomes in critically ill patients requiring prolonged mechanical ventilation: a multicenter cohort study. Crit Care Med 2015;43(8):1569-79. DOI: 10.1097/CCM.0000000000001000
36. Allison S. Fluid, electrolytes and nutrition. Clin Med (Lond) 2004;4(6):573-8.37. World Health Organization (WHO). Healthy ageing profiles. Guidance for
producing local health profiles of older people: report of OMS consultation. Geneva: WHO; 2006.
38. Lobo DN, Bostock KA, Neal KR, Perkins AC, Rowlands BJ, Allison SP. Effect of salt and water balance on recovery of gastrointestinal function after elective colonic resection: a randomised controlled trial. Lancet 2002;359(9320):1812-8.
NutriciónHospitalaria
Trabajo Original Pediatría
ISSN (electrónico): 1699-5198 - ISSN (papel): 0212-1611 - CODEN NUHOEQ S.V.R. 318
Características maternas e infantiles asociadas a obesidad en lactantes menores de un año de edad del norte de MéxicoMaternal and infant characteristics associated with obesity in infants under one year of age in northern Mexico
Velia Margarita Cárdenas Villarreal1, Rosario Edith Ortiz Félix2, Ernesto Cortés-Castell3, Patricia Edina Miranda Félix2, Milton Carlos Guevara Valtier1 y María Mercedes Rizo-Baeza4
1Facultad de Enfermería. Universidad Autónoma de Nuevo León. Nuevo León, México. 2Escuela Superior de Enfermería Mochis. Universidad Autónoma de Sinaloa. Sinaloa, México. 3Departamento de Pediatría. Universidad Miguel Hernández. Sant Joan, Alicante. 4Departamento de Enfermería. Universidad de Alicante. Alicante
Palabras clave:
Obesidad pediátrica. Peso corporal. Percepción del peso. Relaciones madre/hijo. Duración de sueño. Predictores. Percepción parental peso del niño.
ResumenIntroducción: a pesar de que la obesidad infantil es un problema de salud serio, poco se sabe de los factores relacionados con esta en la primera infancia.
Objetivo: evaluar qué factores maternos, cognitivos y del lactante influyen en la ingesta energética del lactante y si estos a la vez influyen en su estado nutricional antes del año.
Métodos: estudio descriptivo de correlación. Participaron 267 diadas (madre/hijo). Los cuestionarios consistieron en cuatro instrumentos para las variables cognitivas de la madre (autoeficacia materna, actitud en la alimentación, percepción sobre señales de hambre, saciedad y peso del hijo), aporte energético mediante recordatorio de 24 horas y datos sociodemográficos y antropométricos de la madre y del niño, mediante los que se han calculado el índice de masa corporal (IMC) materno y Z-score de peso/talla del lactante.
Resultados: el modelo fue significativo para la ingesta de kcal/kg peso (F = 8,624; p < 0,001; R2 = 0,104), correlacionando negativamente con la percepción materna del peso del hijo (B = -9,73; p = 0,002), las horas de sueño (B = -2,19; p = 0,044) y la edad del hijo (B = -2,26; p = 0,001). También para el Z-score (peso/longitud) (F = 68,979; p < 0,001; R2 = 0,564), y se explicó de manera positiva con percepción del peso del hijo (B = 1,133; p < 0,001) y edad del hijo (B = 0,054; p = 0,006) y negativamente con horas de sueño de la madre (B = -0,07; p = 0,040) e ingesta calórica (B = -0,004; p = 0,027).
Conclusión: las madres de hijos lactantes que subestiman el peso de su hijo y duermen menos horas proporcionan más ingesta calórica y sus niños presentan mayor Z-score del peso/longitud.
Key words:
Childhood obesity. Body weight. Weight perception. Mother and child relations. Sleep duration. Predictors. Parental perception child weight.
AbstractIntroduction: despite the fact that childhood obesity is a serious health problem, little is known about its related factors in early childhood.
Objective: to evaluate which maternal, cognitive and infant factors influence the infant’s energy intake and if these influence their nutritional status before the year.
Methods: descriptive study of correlation. Two hundred and sixty-seven dyads (mother/child) participated. The questionnaires consisted of four instruments for the cognitive variables of the mother (maternal self-efficacy, attitude in the diet, perception of signs of hunger, satiety and weight of the child), energy intake through a 24-hour reminder and sociodemographic and anthropometric data of the mother and child, through which maternal body mass index (BMI) and Z-score of infant weight/height have been calculated.
Results: the model was significant for the intake of kcal/kg weight (F = 8.624, p < 0.001, R2 = 0.104), negatively correlating with the maternal perception of the weight of the child (B = -9.73, p = 0.002), hours of sleep (B = -2.19, p = 0.044) and age of the child (B = -2.26, p = 0.001). Also for the Z-score (weight/length) (F = 68.979, p < 0.001, R2 = 0.564) and explained positively with perception of the weight of the child (B = 1.133, p < 0.001) and age of the child (B = 0.054, p = 0.006) and negatively with hours of sleep of the mother (B = -0.07, p = 0.040) and caloric intake (B = -0.004, p = 0.027).
Conclusion: mothers of nursing infants who underestimate their child’s weight and sleep fewer hours provide more caloric intake and their children have a higher Z-score weight/length.
Correspondencia: Ernesto Cortés Castell. Departamento de Pediatría. Universidad Miguel Hernández. Campus de San Juan. 03550 San Juan de Alicante, Alicantee-mail: [email protected]
Cárdenas Villareal VM, Ortiz Félix RE, Cortés-Castell E, Miranda Félix PE, Guevara Valtier MC, Rizo-Baeza MM. Características maternas e infantiles asociadas a obesidad en lactantes menores de un año de edad del norte de México. Nutr Hosp 2018;35(5):1024-1032
DOI: http://dx.doi.org/10.20960/nh.1720
Ernesto Cortés-Castell y María Mercedes Rizo-Baeza tienen igual contribución y responsabilidad en el presente estudio.
Recibido: 13/12/2017 • Aceptado: 22/01/2018
©Copyright 2018 SENPE y ©Arán Ediciones S.L. Este es un artículo Open Access bajo la licencia CC BY-NC-SA (http://creativecommons.org/licenses/by-nc-sa/4.0/).

1025CARACTERÍSTICAS MATERNAS E INFANTILES ASOCIADAS A OBESIDAD EN LACTANTES MENORES DE UN AÑO DE EDAD DEL NORTE DE MÉXICO
[Nutr Hosp 2018;35(5):1024-1032]
INTRODUCCIÓN
Se considera a los lactantes un grupo importante en la pre-vención de la obesidad, presente en etapas cada vez más tem-pranas de la vida (1). La adiposidad antes de los 24 meses de vida se asocia con un aumento significativo en el riesgo de padecer obesidad posterior, incluso en la edad de adulto (2). Así mismo, el primer año de vida se considera un punto clave en la adquisición de hábitos nutricionales en el ser humano. Es cuando se desarrolla el gusto por cierto tipo de alimentos y el modo de consumirlos y cuando las interacciones madre e hijo tienen un impacto de por vida en la regulación del apetito y en el desarrollo de la obesidad actual y futura. De ahí la importancia de examinar las interrelaciones de este binomio (madre-hijo) desde la concepción, embarazo y posparto (3).
En todo el mundo, y en concreto en México, en los últimos años se ha producido un aumento constante del sobrepeso y la obesidad hasta alcanzar tasas alarmantes en todos los grupos de edad (4). En niños menores de cinco años en México la prevalencia de sobre-peso y obesidad aumentó del 7,8% en 1988 al 9,0% en 2012 (5). Este hecho plantea importantes consecuencias económicas y de salud a corto y largo plazo, por lo que se ve la necesidad de abordar la prevención de la obesidad desde la primera infancia (0-2 años), además de ser un grupo de edad poco estudiado (6).
Existen múltiples factores asociados a la obesidad en la primera infancia. Los más estudiados han sido los factores socioculturales y relacionados con el periodo gestacional y pregestacional de las madres, como menor nivel de educación y bajo nivel socioeconó-mico, obesidad materna, incremento excesivo de peso gestacional de la madre, multiparidad, peso del recién nacido, etc. (7). Otros factores importantes estudiados han sido las prácticas de alimen-tación maternas, las cuales resultan, por sí solas o asociadas a los factores antes mencionados, un detonante para la aparición de obesidad en edades tempranas (8). Algunas de estas prácticas son la baja duración de la lactancia materna, la edad y las carac-terísticas del inicio de la alimentación complementaria, así como el consumo de alimentos con alta densidad energética (9,10).
Recientemente se han considerado variables cognitivas de las madres (conocimientos, actitudes y autoeficacia relacionadas con la alimentación y la percepción del peso del hijo), al considerar que estas pueden influir en la toma de decisiones y acciones de las madres ante la alimentación de sus hijos lactantes (11,12). Al saber la repercusión de estos conocimientos, se podría incidir en los mejores hábitos para disminuir el riesgo de obesidad en estos niños. Sin embargo, la mayoría de estudios sobre estas variables cognitivas se han realizado en diadas de madres e infantes preescolares y escolares (12,13). En los pocos estudios realizados en madres con menores de dos años de edad, se han identificado como factores de riesgo para llevar a cabo una bue-na alimentación el poseer una baja autoeficacia materna sobre el crecimiento y la alimentación del hijo (14), actitudes erróneas sobre alimentación de niños pequeños (15,16), no percibir las señales de hambre y saciedad que emite el hijo durante la alimentación (17-19) y no tener una percepción adecuada del peso del hijo (20).
La limitación más importante de estos estudios es que han sido realizados en países muy desarrollados, lo que impide su generaliza-ción a las mujeres de países en vías de desarrollo como es el caso de México, donde la mayoría de su población es de recursos económicos bajos y culturas diferentes sobre la alimentación. Así mismo, no se han identificado estudios que integren en conjunto estas variables y, dado que la obesidad es multicausal, es muy importante identificar el máximo número de posibles factores de riesgo que contribuyan a explicar el fenómeno de la obesidad a temprana edad. Conocer esta información en población mexicana arrojará claridad sobre los factores que inciden en el control alimentario que las madres ejercen sobre sus hijos y podría permitir diseñar programas preventivos y de intervención enfocados a generar prácticas familiares de alimentación saludables.
De este modo, se plantea como objetivo del presente trabajo determinar si los factores personales maternos (edad, estado civil, escolaridad, ingreso económico mensual, trabajo externo, número de hijos, índice de masa corporal actual y horas de sueño) y cognitivos maternos (autoeficacia materna hacia el crecimiento y la alimentación del hijo, actitud en la alimentación, percepción de las señales de ham-bre y saciedad del hijo y percepción del peso del hijo) se relacionan con el consumo energético diario (kcal/d) del hijo y si estos a la vez influyen en el estado nutricional del niño de dos a 12 meses de edad.
MATERIAL Y MÉTODOS
DISEÑO DEL ESTUDIO, POBLACIÓN Y PARTICIPANTES
Se ha realizado un estudio descriptivo de correlación. Participaron diadas (madre-hijo de 2-12 meses de edad) que acudieron al pro-grama Enfermera Materno Infantil en cuatro unidades de Medicina Familiar del Instituto Mexicano del Seguro Social, ubicadas en cuatro municipios del Área Metropolitana de Monterrey. Se seleccionaron las unidades que registraban mayor población de lactantes menores de 12 meses, según el Análisis Estratégico de la Delegación Regional de Nuevo León. Referente al muestreo, fue probabilístico sistemático de los niños 1-5 registrados en la lista de consulta diaria de cada unidad.
CRITERIOS DE INCLUSIÓN Y EXCLUSIÓN
Se incluyeron mujeres que se declararon como madres del lactante, con habilidad de lectura y escritura que les permitiera contestar los cuestionarios.
Fueron excluidos los lactantes gemelos y niños con enfer-medades que podrían alterar su crecimiento o peso corporal (intolerancia a la lactosa, reflujo gastroesofágico, enfermedades metabólicas congénitas).
CÁLCULO DEL TAMAÑO MUESTRAL
La muestra se calculó para un modelo de regresión lineal múltiple con 18 variables predictivas para un variable criterio, con un nivel de significación de 0,05 y una potencia del 90%. Determinando

1026 V. M. Cárdenas Villarreal et al.
[Nutr Hosp 2018;35(5):1024-1032]
un tamaño muestral de 275 diadas, se consideró una tasa de no respuesta del 5%, por lo cual se invitó a participar a 289 diadas. La cantidad se distribuyó equitativamente por cada unidad. Al final de la colecta de datos se contó con 264 diadas. Algunas encuestas se eliminaron por no contar con todos los indicadores.
VARIABLES Y MEDIDAS
Se aplicó una cédula de datos maternos-infantiles que incluyó edad (años), escolaridad (años), estado civil (vive con o sin pareja), ocupa-ción (trabaja externamente o no), número de hijos para la madre e ingreso económico familiar (pesos/mes). Del lactante se solicitó su fecha de nacimiento, la edad en meses y el sexo. El personal de enfermería materno-infantil realizó las medidas antropométricas en los lactantes. El peso se midió con la báscula digital infantil (Seca® Medical) y se registró en kg; la longitud se midió con un infantómetro y se registró en cm. El estado de nutrición se evaluó con el programa Antho de la Organización Mundial de la Salud (OMS) (21). Se esti-maron las puntuaciones Z del índice longitud-peso y se clasificaron como sigue: malnutrición severa (< -3 DE), malnutrición (< -2 DE a -3 DE), peso normal (< +1 DE a > -2 DE), riesgo de sobrepeso (SP) (> +1 DE a +2 DE), SP (> +2 DE a +3 DE) y obesidad (OB) (> +3 DE).
En las madres, se midió la talla con un estadiómetro Seca® 214 y el peso, con la báscula Seca® 804, equipo con una precisión de 0,1 kg. Posteriormente, se calculó el IMC y de acuerdo a la OMS (22) se clasificaron cómo: bajo peso (< 18,5), peso normal (18,5 a 24,9), pre-obesidad (25,0 a 29,9), OB I (30,0 a 34,9), OB II (35,0 a 39,9) y OB III (> 40).
La percepción materna de las “señales de hambre y saciedad” en el lactante se midieron mediante las preguntas adaptadas de la Escala de Respuesta a las Señales de Hambre y Saciedad (RCFCS, por sus siglas en inglés) (23). Esta herramienta indaga si las madres perciben las señales de alimentación que comunica el bebe durante la alimentación y si estos indican hambre o saciedad y en qué momento se da esta percepción (temprana, activa o tardía). Fue aplicado a través de entrevista a la madre. La escala consta de 24 reactivos, divididos en dos dimensiones:
1. Señales de hambre: en esta parte se plantea la pregunta “¿Si su hijo tiene hambre…?”, seguida de diez frases que hacen referencia a las señales de hambre que puede mos-trar un niño sano durante un periodo típico de alimentación; por ejemplo, “se lleva a la boca los dedos de las manos, pies, juguetes o cualquier objeto”.
2. Señales de saciedad: se inicia planteando la pregunta “¿Si su hijo esta saciado…?”, seguida de 14 frases que hacen referen-cia a las señales de saciedad que puede mostrar un niño sano durante un periodo típico de alimentación; por ejemplo, “abre la boca hasta que la cuchara o alimento toca sus labios”. Las opciones de respuesta son tipo Likert, van de 0 (nunca) hasta 4 (siempre). La puntuación que se puede obtener es de 0 a 96. Para su interpretación, mayores puntuaciones indican mejor percepción materna de las señales de hambre y saciedad. La consistencia interna de la escala obtenida en este estudio fue de un alpha de Cronbach de α = 0,72.
Para medir la “percepción materna del peso corporal del lactante”, las madres contestaron la pregunta “¿Creo que mi niño(a) está…?” con las opciones de respuesta: a) más o menos de bajo(a) de peso; b) más o menos con el peso adecuado; y c) más o menos con sobrepeso u obesidad (24). Se consideró percepción adecuada: a) cuando las madres de niños con bajo peso refirieron las opciones bajo de peso; b) cuando las madres de niños con peso normal lo refirieron como peso adecuado; y c) cuando las madres de niños con sobrepeso u obesidad lo refirieron como con sobrepeso u obesidad. Se considero subestimar o sobreestimar el peso cuando la madre percibió el peso como menor o mayor al peso que verdaderamente tenía el hijo, respectivamente.
Para medir las “actitudes maternas de alimentación” se aplicó el Cuestionario de Actitudes Maternas en la Alimentación (MIFPQ, por sus siglas en inglés) (25), adaptado para este estudio. Mide las creen-cias alimentarias que posee la madre y está compuesto por 12 reac-tivos divididos en cuatro áreas: a) alimentación temprana del infante, integrada por dos reactivos; b) saciedad del infante, compuesta por dos reactivos; c) salud infantil y obesidad, conformada por cuatro reactivos; y d) alimentación complementaria en el infante, integrada por cuatro reactivos. Las opciones de respuesta para la totalidad de los reactivos van de 1 (totalmente en desacuerdo) a 5 (totalmente de acuerdo). La puntación posible a obtener es de 12-60, indicando una mayor puntuación mayores actitudes erróneas relacionadas con la alimentación de bebes. La consistencia interna reportada de la escala total para este estudio fue de un alfa de Cronbach de α = 0,78.
La variable “horas de sueño nocturno de la madre” se indagó en base a cuatro preguntas que a continuación se describen: ¿usualmente a qué hora se acuesta a dormir por la noche?, ¿a qué hora se levanta por la mañana?, ¿cuántas veces se despierta por la noche? y ¿cuánto tiempo permanece despierta cada vez? A partir de estos reactivos se calculó el tiempo de sueño nocturno.
La “autoeficacia materna” se midió adaptando la subescala auto-eficacia materna del cuestionario de Actitudes Maternas hacia el Crecimiento Infantil y Prácticas de Alimentación con Leche (26). La subescala evalúa la confianza de la madre para llevar un control sobre el crecimiento y la alimentación para que su bebe no gane demasiado peso. La subescala incluyó seis reactivos. Cuatro de ellos valoran aspectos del crecimiento del bebe (por ejemplo, “estoy confiada en que puedo llevar a que revisen a mi bebé si estuviera preocupada sobre su peso”) y dos preguntas valoran la confianza para la alimen-tación del hijo (por ejemplo, “¿estoy confiada en que puedo alimentar a mí bebé para que no gane demasiado peso?”). Las opciones de respuesta son tipo Likert de cinco puntos y van de 1 (muy de acuerdo) a 5 (totalmente en desacuerdo). El puntaje a obtener oscila entre 6 y 30, correspondiendo mayor puntuación a mejor autoeficacia. La consistencia interna de la escala de autoeficacia materna obtuvo un alpha de Cronbach para la escala total de α = 0,76.
Para medir la “energía ingerida” (kcal/24 horas) se utilizó un recor-datorio de 24 horas, para lo cual se solicitó a la madre que detallara la alimentación consumida por su hijo el día anterior (frecuencia, tipo y cantidad de leche, alimentos sólidos y semisólidos y bebidas). Cuando fue preparada en casa, se le solicitó modo de preparación y si era comprada, marcas comerciales. Posteriormente, la información fue procesada mediante el programa de nutrición NutriKcal®VO para calcular la energía consumida. Los datos se interpretaron de acuerdo

1027CARACTERÍSTICAS MATERNAS E INFANTILES ASOCIADAS A OBESIDAD EN LACTANTES MENORES DE UN AÑO DE EDAD DEL NORTE DE MÉXICO
[Nutr Hosp 2018;35(5):1024-1032]
a los criterios de la OMS sobre alimentación del lactante (27), donde los requerimientos de energía son acordes a la edad de los lactantes: de 0 a 2 meses el lactante requiere 400 kcal/día; de 3 a 5 meses, 500 kcal/día; de 6 a 8 meses, 600 kcal/día; de 9 a 11 meses 700 kcal/día; y de 12 a 23 meses, 900 kcal/día.
PROCEDIMIENTO
Para la recolección de los datos, tres miembros del equipo de investigación abordaron a la madre en la sala de espera del servicio de EMI, se le explicaron los objetivos del estudio y se solicitó su participación voluntaria. Todas las participantes firmaron el consen-timiento informado y se procedió a la aplicación de instrumentos. Posteriormente se realizaron las mediciones antropométricas a madres y lactantes. Los datos han sido tratados de forma totalmen-te anónima y no filiable y exclusivamente como datos estadísticos.
ANÁLISIS ESTADÍSTICO
Los datos se capturaron y analizaron en el paquete estadístico Statistical Package for Social Sciences (SPSS) versión 24.0 para Windows. Se obtuvieron estadísticas descriptivas con la finalidad de conocer las características de los participantes del estudio a través de frecuencias, proporciones y medidas de tendencia cen-tral. Se aplicó regresión lineal múltiple, con la finalidad de conocer la contribución de cada factor materno (personal, cognitivo, estado de salud, prácticas maternas) y características de lactante con el estado nutricional del lactante.
CONSIDERACIONES ÉTICAS
El proyecto fue revisado y aprobado por la institución de salud y por el Comité de Ética de la Facultad de Enfermería de la Uni-versidad Autónoma de Nuevo León (FAEN-P- 1260). Se siguió lo dispuesto en el Reglamento de la Ley General de Salud en Materia de Investigación para la Salud (28).
RESULTADOS
DESCRIPCIÓN DE LA MUESTRA
En la tabla I se muestran las variables cuantitativas en la segunda columna y las cualitativas en la tercera, de la madre en dos bloques, variables sociales y antropométricas y cognitivas sobre la alimen-tación de su hijo y en el tercer bloque las variables del lactante.
El promedio de edad de las madres fue de 27,1 años (DE = 6) y refirieron contar con un ingreso económico mensual familiar de $ 6.806 pesos mexicanos (DE = 4.293). Se identificaron pobres actitudes maternas en alimentación (X = 21,6; DE = 6,2), baja autoeficacia materna (X = 8,6; DE = 2,7) y baja percepción de señales de hambre y saciedad (X = 5,29: DE = 6,31). El 35,6% de
__
_
las madres subestima el peso del hijo y el 8,3% lo sobreestima, y en promedio duermen 7,4 (DE = 1,7) horas por noche. Se observó un altísimo porcentaje de madres que presentan sobrepeso y obesidad (56,1%), frente a un bajo porcentaje con bajo peso (3,0%). En los
Tabla I. Datos descriptivos de la madre y del lactante
VariableMedia (DE)
(rango)n (%)
Edad (años) 27,1 (6,0) (18-43)
Ingreso económico (pesos/mes)
6.806 (4.293) (1.000-30.000)
Escolaridad (años) 13,1 (3,5) (6-20)
Número de hijos 1,8 (0,9) (1-4)
Horas de sueño nocturno 7,4 (1,7) (3-11)
Vive con su pareja 253 (95,5)
Trabajo remunerado 74 (28,0)
IMC (kg/m2) 26,8 (5,1) (16-45)
Estado nutrición: Bajo peso Normal Sobrepeso Obesidad (I, II y III)
8 (3,0)108 (40,9)76 (28,8)72 (27,3)
Percepción del peso: Subestima Adecuada Sobreestima
93 (35,2)144 (54,5)27 (10,2)
Autoeficacia (6-30) 8,6 (2,7) (6-16)
Percepción de hambre (0-40) 2,2 (3,8) (0-24)
Percepción de saciedad (0-84)
1,4 (3,5) (0-24)
Percepción hambre y saciedad (0-96)
3,6 (6,4) (0-48)
Actitudes de alimentación (12-60)
21,6 (6,2) (10-42)
Ingesta diaria (kcal/kg peso) 92,0 (32,5)
(31,4-212,2)
Sexo (niñas) 124 (47,0)
Edad (meses) 7,0 (2,8) (2-12)
Menores de 6 meses 72 (27,3)
Z-score peso/longitud0,63 (1,27) (-2,11-3,01)
Estado nutrición según Z- score peso/longitud: Malnutrición severa (< -3 DE)Malnutrición (-3 DE a -2 DE)Peso normal (-2 DE a 1 DE)Riesgo de sobrepeso (1 DE a 2 DE)Sobrepeso (2 DE a 3 DE)Obesidad (> 3 DE)
011 (4,2)
159 (60,2)
54 (20,5)26 (9,8)14 (5,3)
DE: desviación estándar; IMC: índice de masa corporal.

1028 V. M. Cárdenas Villarreal et al.
[Nutr Hosp 2018;35(5):1024-1032]
Tab
la II
. M
od
elo
s li
neale
s u
niv
ariad
os y
elim
inació
n d
e v
ariab
les p
or
niv
el d
e s
ignifi
cancia
p
ara
ing
esta
de k
cal d
e h
ijo
Vari
able
M
1 pM
2 pM
3 pM
4 pM
5 pM
6 pM
7 pM
8 pM
9 pM
10 pM
11 pM
12 pM
13 p
Sexo
del
hijo
0,47
70,
476
0,47
40,
468
0,46
80,
453
0,44
10,
451
0,43
7x
xx
x
Edad
del
hijo
(m
eses
)0,
002
0,00
20,
002
0,00
20,
001
0,00
10,
001
0,00
10,
001
0,00
10,
001
0,00
10,
001
Edad
mad
re
(año
s)0,
501
0,50
00,
504
0,50
20,
516
0,55
50,
489
xx
xx
xx
Esta
do c
ivil
0,97
8x
xx
xx
xx
xx
xx
x
Ocup
ació
n 0,
405
0,40
10,
396
0,39
20,
343
0,32
70,
362
0,40
10,
367
0,33
6x
xx
Perc
epci
ón
del p
eso
del
hijo
0,00
40,
004
0,00
30,
003
0,00
30,
002
0,00
20,
002
0,00
20,
002
0,00
20,
002
0,00
2
Esco
larid
ad
(año
s)0,
727
0,72
70,
731
0,73
3x
xx
xx
xx
xx
Ingr
eso
econ
ómic
o m
ensu
al
(pes
os)
0,57
90,
577
0,56
70,
564
0,62
30,
628
xx
xx
xx
x
Núm
ero
de
hijo
s0,
233
0,23
20,
231
0,23
10,
242
0,23
80,
210
0,29
20,
271
0,28
00,
357
xx
IMC
(kg/
m2 )
mad
re0,
712
0,71
20,
714
0,71
50,
735
xx
xx
xx
xx
Hora
s su
eño
de la
mad
re0,
177
0,17
60,
175
0,17
40,
168
0,16
00,
154
0,17
00,
179
0,17
80,
065
0,05
30,
044
Auto
efica
cia
0,92
50,
925
xx
xx
xx
xx
xx
x
Seña
les
de
ham
bre
0,25
90,
256
0,25
70,
161
0,13
80,
136
0,13
20,
145
0,14
70,
157
0,18
40,
185
x
Seña
les
de
saci
edad
0,96
00,
959
0,95
9x
xx
xx
xx
xx
x
Actit
udes
de
alim
enta
ción
0,53
60,
535
0,53
90,
532
0,44
50,
441
0,47
90,
478
xx
xx
x
F = 1,
90p =
0,00
2R2 =
0,0
84
F = 2,
617
p = 0,
001
R2 =
0,084
F = 3,
04p <
0,00
1R2 =
0,0
92
F = 3,
04p <
0,00
1R2 =
0,0
92
F = 3,
266
p < 0,
001
R2 =
0,094
F = 3,
936
p < 0,
001
R2 =
0,100
F = 3,
949
p < 0,
001
R2 =
0,100
F = 4,
343
p < 0,
001
R2 =
0,103
F = 4,
83p <
0,00
1R2 =
0,1
04
F = 5,
445
p < 0,
001
R2 =
0,106
F = 6,
199
p < 0,
001
R2 =
0,106
F = 7,
27p <
0,00
1R2 =
0,1
07
F = 8,
62p <
0,00
1R2 =
0,1
04
lactantes, también se apreció un alto porcentaje de sobrepeso y obesidad (33,7%) y de bajo peso severo y moderado (9,3%). En promedio, el consumo energético fue de 819,3 (DE = 24,1) kcal/d para todos los lactantes analizados.
VARIABLES QUE CORRELACIONAN CON LA INGESTA DEL LACTANTE
Para conocer la relación de la ingesta del lactante (kcal/kg peso) frente a las variables de la madre (edad, estado civil, escola-
ridad, ocupación, ingreso económico, número de hijos, IMC, horas de sueño nocturno) cognitivas (autoeficacia materna, actitudes de alimentación, percepción de señales de hambre y saciedad y percepción del peso del hijo) y del hijo (sexo y edad), se ajustó un modelo lineal general univariado. Para ello, se fueron anali-zando diferentes ajustes con la técnica de Backward (Tabla II). El modelo final (13) conservó tres variables (F = 8,624, p < 0,001, R2 = 0,104) y mostró que la percepción del peso del hijo, el total de horas de sueño y la edad (meses) del hijo fueron variables significativas con efecto negativo. Los valores están representa-dos en la tabla III.

1029CARACTERÍSTICAS MATERNAS E INFANTILES ASOCIADAS A OBESIDAD EN LACTANTES MENORES DE UN AÑO DE EDAD DEL NORTE DE MÉXICO
[Nutr Hosp 2018;35(5):1024-1032]
Tabla III. Variables maternas-infantiles que presentan correlación mediante el modelo lineal general univariado con la
ingesta del lactante (kcal/kg/peso)Variable B (IC 95%) p
Percepción del peso del hijo :NormalSobreestimadaSubestimada
-9,73 (-22,60 a 3,13)-21,39 (-34,96 a -7,82)
1
0,1380,002
Sueño madre (horas) -2,19 (4,32 a -0,06) 0,044
Edad lactante (meses) -2,26 (-3,63 a -0,89) 0,001
Modelo: F = 8,624, p < 0,001, R2 = 0,104.
VARIABLES QUE CORRELACIONAN CON EL ESTADO NUTRICIONAL DEL LACTANTE
Con el fin de conocer la relación de la situación nutricional del lactante, cuantificada mediante el Z-score del peso/longitud, se ha realizado un análisis análogo frente a todas las variables, ana-lizando diferentes ajustes con la técnica de Backward (Tabla IV). Se ha obtenido un modelo lineal general univariado significativo (F = 68,978, p < 0,000, R2 = 0,564) que conservó cuatro varia-bles, presentadas en la tabla V.
DISCUSIÓN
En nuestro trabajo, apreciamos que tienen influencia muy negativa sobre la cantidad diaria de kcal/kg de peso ingeridas por el lactante la impresión de la madre de que su hijo está en sobrepeso y en menor medida, y también con efecto negativo, las horas que duerme la madre y la edad del lactante. Al analizar los factores que inciden sobre el estado de nutrición del niño, este es mayor cuando la madre lo ve como normal y lo sobreestima y aumenta con la edad, pero disminuye con el sueño y moderada-mente con la ingesta en kcal/kg peso.
En este estudio participaron madres jóvenes, de escolaridad media y, según el ingreso económico mensual familiar (promedio de 450 dólares), se caracterizan por pertenecer a una clase social media-ba-ja, la cual es representada por el 25% de la población mexicana (29), así como por una alta prevalencia de sobrepeso y obesidad, superior a la reportada en la última encuesta de salud México (4).
En relación con las variables cognitivas estudiadas, mostraron no ser percibidas adecuadamente en las madres mexicanas, lo que concuerda con estudios previos realizados en mujeres que proceden de países desarrollados. Con respecto a las actitudes sobre alimentación en lactantes, la mayoría de las madres reportan creencias erróneas: “cree que es importante darle biberón al bebé lo más pronto posible para evitar que después lo rechace” o “cree que los bebés necesitan otros alimentos antes de los cuatro meses para que el bebé aprenda a aceptar nuevos alimentos” (15,16,30). En cuanto a autoeficacia materna, la mayoría de las madres no
se perciben competentes para alimentar a su hijo para que no gane demasiado peso, y no se sienten capaces de identificar si el crecimiento de su hijo es el adecuado (14,31). De acuerdo a la per-cepción materna de las señales de hambre y saciedad, las madres perciben pobremente estas señales y son más propensas a identi-ficar las señales de hambre que las de saciedad (17,18,23,32). Lo anterior es importante dado que los niños muy pequeños poseen la capacidad para ajustar el aporte alimentario en función del con-tenido energético de los alimentos que se les ofrece y esta puede desaparecer cuando entra en juego el control parental (33). En cuanto a la percepción materna del peso del lactante al señalar que la mayoría de las madres de niños con SP-OB no perciben de forma adecuada el peso de su hijo, tienden a subestimarlo (25,34). Los hallazgos pueden ser atribuidos a las creencias falsas de las madres respecto a la obesidad: tener un hijo “llenito” es sinónimo de buena salud y de buenas prácticas de crianza; incluso en algunas familias es aceptable tener sobrepeso (35). Los resultados antes expuestos sugieren un área de oportunidad para el desarrollo de intervencio-nes que permitan modificar y mejorar estas variables cognitivas.
En el presente estudio, las variables maternas: percepción del peso del hijo, horas de sueño nocturno de la madre y edad del lactante, predijeron el consumo energético en 24 horas del hijo y todas estas a la vez con el estado nutricional del lactante. Pocos estudios hasta la fecha se han enfocado en revisar la relación de la percepción materna del peso del hijo y la alimentación en la primera infancia. En estos, se ha visto que la percepción materna no adecuada del peso del hijo influye en las decisiones sobre el tipo de alimento, lo que conduce a que las madres se inclinen por una conducta alimentaria no saludable (20,36).
Así mismo, no se han identificado estudios que valoren directa-mente el sueño de la madre con el consumo total de calorías o el estado nutricional en lactantes. Sin embargo, se ha reportado que las mujeres en el posparto temprano presentan cambios significa-tivos con el tiempo total de sueño, relacionado con la alimentación nocturna, la atención y los patrones de sueño del hijo, y que esta disminución de sueño puede afectar a la capacidad psicológica de la madre, como la voluntad para actuar adecuadamente, la moti-vación, la concentración y el pensar con claridad (37). Por lo tanto, pensamos que las madres que duermen menos tiempo pudieran verse afectadas para la toma de decisiones sobre el qué, cuánto y la frecuencia de alimentación que proporcionan a su hijo, y esto, a la vez, repercute en el estado nutricional del hijo. Más aún, suponemos que esta alteración del sueño no solo está afectando a los hijos, sino que quizás esté impactando también en el peso corporal actual de la madre, dado que casi la mitad de las madres estudiadas pre-sentaron sobrepeso u obesidad y se ha documentado que el sueño tiene una relación con el balance energético y la obesidad (39).
En nuestro estudio no se identificó relación de las variables actitudes de la alimentación, percepción de señales de hambre y saciedad y autoeficacia. Una posible explicación sería que, muy posiblemente, más que ser variables causales para explicar el peso del hijo serían variables mediadoras que se asocian con cier-tas prácticas de alimentación, como tipo y estilos de alimentación, como se ha identificado ya en estudios previos (11,12,14-16,18). Estas prácticas no se han revisado en el presente estudio.

1030 V. M. Cárdenas Villarreal et al.
[Nutr Hosp 2018;35(5):1024-1032]
Tab
la IV
. M
od
elo
s li
neale
s u
niv
ariad
os y
elim
inació
n d
e v
ariab
les p
or
niv
el d
e s
ignifi
cancia
para
esta
do
de n
utr
ició
n d
el
lacta
nte
seg
ún e
l Z-score
del p
eso
/lo
ng
itud
Vari
able
s M
1 pM
2 pM
3 pM
4 pM
5 pM
6 pM
7 pM
8 pM
9 pM
10 pM
11 pM
12 pM
13 p
Sexo
del
hijo
0,47
50,
473
0,46
50,
467
0,46
40,
456
0,49
10,
537
xx
xx
x
Edad
del
hijo
(m
eses
)0,
003
0,00
30,
003
0,00
30,
003
0,00
30,
003
0,00
50,
005
0,00
50,
004
0,00
50,
006
Edad
mad
re
(año
s)0,
969
xx
xx
xx
xx
xx
xx
Esta
do c
ivil
0,67
80,
677
0,68
7x
xx
xx
xx
xx
x
Ocup
ació
n0,
865
0,86
4x
xx
xx
xx
xx
xx
Ingr
eso
econ
ómic
o m
ensu
al (p
esos
)0,
663
0,66
30,
674
0,68
00,
653
xx
xx
xx
xx
Núm
ero
de h
ijos
0,55
50,
548
0,53
80,
532
0,53
90,
522
0,53
0x
xx
xx
x
Esco
larid
ad (a
ños)
0,30
80,
307
0,31
30,
321
0,31
00,
201
0,22
90,
293
0,29
40,
300
0,39
0x
x
IMC
(kg/
m2 )
mad
re0,
491
0,48
30,
492
0,49
40,
492
0,46
00,
479
0,52
50,
552
xx
xx
Hora
s su
eño
de la
m
adre
0,03
50,
034
0,02
00,
020
0,02
20,
022
0,02
00,
032
0,03
20,
037
0,04
00,
040
0,04
0
Perc
epci
ón d
el
peso
del
hijo
< 0
,001
< 0
,001
< 0
,001
< 0
,001
< 0
,001
< 0
,001
< 0
,001
< 0
,001
< 0
,001
< 0
,001
< 0
,001
< 0
,001
< 0
,001
Auto
efica
cia
0,68
00,
673
0,66
50,
670
xx
xx
xx
xx
x
Seña
les
de
saci
edad
0,37
30,
151
0,15
30,
147
0,14
60,
152
0,17
620
10,
211
0,22
20,
232
0,23
1x
Seña
les
de
ham
bre
0,55
40,
551
0,56
30,
574
0,58
90,
577
xx
xx
xx
x
Actit
udes
de
alim
enta
ción
0,15
20,
373
0,37
30,
366
0,40
40,
409
0,44
10,
0,48
30,
471
0,48
6x
xx
Inge
sta
kcal
/pes
o 0,
039
0,03
80,
038
0,03
70,
037
0,03
90,
041
0,03
00,
032
0,03
00,
032
0,02
90,
025
F =
21,
95p
< 0
,001
R2 = 0
,556
F =
23,
05p
< 0
,001
R2 = 0
,557
F =
24,
65p
< 0
,001
R2 = 0
,558
F =
26,
59p
< 0
,001
R2 = 0
,560
F =
34,
736
p <
0,0
01R2 =
0,5
60
F =
30,
423
p <
0,0
01R2 =
0,5
52
F =
38,
557
p <
0,0
01R2 =
0,5
62
F= 3
7,37
8p
< 0
,001
R2 = 0
,555
F =
43,
83p
< 0
,001
R2 = 0
,563
F =
49,
61p
< 0
,001
R2 = 0
,564
F =
56,
309
p <
0,0
01R2 =
0,5
58
F =
57,
434
p <
0,0
01R2 =
0,5
65
F =
68,
62p
< 0
,001
R2 = 0
,564

1031CARACTERÍSTICAS MATERNAS E INFANTILES ASOCIADAS A OBESIDAD EN LACTANTES MENORES DE UN AÑO DE EDAD DEL NORTE DE MÉXICO
[Nutr Hosp 2018;35(5):1024-1032]
Tabla V. Variables maternas-infantiles que presentan correlación mediante el modelo lineal general univariado con el
estado de nutrición del lactante según el Z-score del peso/longitud
Variable B (IC 95%) p
Percepción del peso del hijo: Normal Sobreestimada Subestimada
1,13 3(0,779 a 1,487)2,647 (2,269 a 3,026)
1
< 0,001< 0,001
Sueño madre (horas) -0,06 (-0,11 a -0,00) 0,040
Edad lactante (meses) 0,07 (0,02 a 0,11) 0,002
Ingesta (kcal/kg peso) -0,004 (-0,007 a 0,000) 0,027
Modelo: F = 68,978, p < 0,001, R2 = 0,564.
FORTALEZAS Y LIMITACIONES
Como máxima fortaleza del presente trabajo contamos con la novedad del análisis de todas las variables en conjunto median-te modelos multivariantes, tanto variables socioeconómicas de la madre y antropométricas, como variables cognitivas sobre la alimentación de su hijo y los propios datos del lactante en edades comprendidas dentro del primer año de vida. Esto da una idea clara de la influencia de las mismas al eliminar las variables confusoras, quedándonos con las que realmente intervienen en el proceso.
Las variables reportadas por las madres, aunque podrían tener el sesgo inherente a la apreciación de la misma, han presentado altos niveles de consistencia interna al presentar todas ellas un alpha de Cronbach superior a α= 0,70 (artículo en revisión).
Como limitaciones, hay que apuntar el tamaño de la muestra, aunque el mismo ha sido calculado para los objetivos trazados. Quizás un número superior de casos pudiese incluir un mayor número de variables en los modelos, aunque pensamos que la contribución de las mismas estaría en el mismo orden. También es importante resaltar que, para su generalización, se debería replicar en otros entornos, dado que las maternidades en las que se ha realizado no son utilizables por el total de la población, al ser el de México un sistema mixto de Sanidad Pública y con aseguradoras.
REPERCUSIONES PARA LA INVESTIGACIÓN Y LA PRÁCTICA
El presente estudio abre la puerta a nuevas investigaciones, en las que se estudie el estado de nutrición de los niños lac-tantes menores de un año en relación a todas las variables al mismo tiempo, en diferentes entornos y con un número superior de casos, buscando semejanzas o diferencias según creencias y situaciones socioeconómicas y culturales diversas.
Con respecto a su repercusión a nivel de prevención de la obesidad infantil y su posterior incidencia en los futuros adul-tos, se aprecia que es muy importante la imagen que la madre tiene de su propio hijo en cuanto a su estado de nutrición, siendo el factor más importante de los analizados. Por ello, es de gran importancia incidir en este aspecto en programas de prevención.
CONCLUSIÓN
Las madres de hijos lactantes que subestiman el peso de su hijo y duermen menos horas proporcionan más ingesta calórica y sus niños presentan mayor Z-score peso-longitud.
BIBLIOGRAFÍA
1. Reidy KC, Squatrito C. Programming long-term health: nutrition and diet in toddlers. En: Saavedra JM, Dattilo A, eds. Early Nutrition and Long-Term Health. Estados Unidos; 2017. pp. 537-60.
2. Smego A, Woo JG, Klein J, Suh C, Bansal D, Bliss S, et al. High body mass index in infancy may predict severe obesity in early childhood. J Pediatr 2017;183:87-93.
3. Dattilo AM. Programming long-term health: effect of parent feeding approa-ches on long-term diet and eating patterns. En: Saavedra JM, Dattilo A, eds. Early Nutrition and Long-Term Health. Estados Unidos; 2017. pp. 471-97.
4. Organización Mundial de la Salud. Centro de prensa. Obesidad y sobrepeso. Nota descriptiva nº 311; 2017. Disponible en: http://www.who.int/media-centre/factsheets/fs311/es/.
5. Gutiérrez JP, Rivera-Dommarco J, Shamah-Levy T, Villalpando-Hernández S, Franco A, Cuevas-Nasu L, et al. Encuesta Nacional de Salud y Nutrición 2012. Resultados Nacionales. Cuernavaca, México: Instituto Nacional de Salud Pública (MX); 2012.
6. Kroker-Lobos MF, Pedroza-Tobias A, Pedraza LS, Rivera JA. The double bur-den of undernutrition and excess body weight in Mexico. Am J Clin Nutr 2014; 100(6):1652S-8S.
7. Blake-Lamb TL, Locks LM, Perkins ME, Woo Baidal JA, Cheng ER, Taveras EM. Interventions for childhood obesity in the first 1,000 days: a systematic review. Am J Prev Med 2016;50:780-9.
8. Reilly JJ, Armstrong J, Dorosty AR, Emmett PM, Ness A, Rogers I, et al. Early life risk factors for obesity in childhood: cohort study. BMJ 2005;330(7504):1357-65.
9. Rajmil L, Díez E, Peiró R. Social inequalities in child health. En: Growing up in the UK ensuring a healthy future for our children. Reino Unido; 2013. pp. 37-54.
10. Oribe M, Lertxundi A, Basterrechea M, Begiristain H, Santa Marina L, Villar M, et al. Prevalence of factors associated with the duration of exclusive breastfeeding during the first 6 months of life in the INMA birth cohort in Gipuzkoa. Gac Sanit 2015;29:4-9.
11. Lucas CT, Messito MJ, Gross RS, Tomopoulos S, Fierman AH, Cates CB, et al. Characteristics associated with adding cereal into the bottle among immigrant mother-infant dyads of low socioeconomic status and Hispanic ethnicity. J Nutr Educ Behav 2017;49:27-34.
12. Oria MO, Ximenes LB, De Almeida PC, Glick DF, Dennis CL. Psychometric assessment of the Brazilian version of the Breastfeeding Self-Efficacy Scale. Public Health Nurs 2009;26:574-83.
13. Barker DJ. Obesity and early life. Obes Rev 2007;8:45-8. 14. Otsuka K, Dennis CL, Tatsuoka H, Jimba M. The relationship between
breastfeeding self-efficacy and perceived insufficient milk among Japanese mothers. J Obstet Gynecol Neonatal Nurs 2008;37:546-55.
15. Jessri M, Farmer AP, Maximova K, Willows ND, Bell RC. Predictors of exclu-sive breastfeeding: observations from the Alberta pregnancy outcomes and nutrition (APrON) study. BMC Pediatrics 2013;13(1):13-77.
16. Berisha M, Ramadani N, Hoxha R, Gashi S, Zhjeqi V, Zajmi D, et al. Knowledge, attitudes and practices of mothers in Kosova about complementary feeding for infant and children 6-24 months. Med Arch 2017;71:37-41.

1032 V. M. Cárdenas Villarreal et al.
[Nutr Hosp 2018;35(5):1024-1032]
17. McNally J, Hugh-Jones S, Caton S, Vereijken C, Weenen H, Hetherington M. Communicating hunger and satiation in the first 2 years of life: a systematic review. Matern Child Nutr 2016;12:205-28.
18. Shloim N, Vereijken C, Blundell P, Hetherington MM. Looking for cues - Infant communication of hunger and satiation during milk feeding. Appetite 2017;108:74-82.
19. Hager ER, Candelaria M, Latta LW, Hurley KM, Wang Y, Caulfield LE, et al. Maternal perceptions of toddler body size: accuracy and satisfaction differ by toddler weight status. Arch Pediatr Adolesc Med 2012;166:417-22.
20. Tompkins CL, Seablom M, Brock DW. Parental perception of child’s body weight: a systematic review. J Child Fam Stud 2015;24:1384-91.
21. World Health Organization (WHO). WHO Anthro for personal computers, ver-sion 3.2.2, 2011. Software for assessing growth and development of the world’s children. Ginebra: OMS; 2010. Disponible en: http://www.who.int/childgrowth/software/en/index.html
22. World Health Organization (WHO). Obesity: preventing and managing the glo-bal epidemic, report of a WHO Consultation on Obesity. Ginebra: OMS; 2000.
23. Hodges EA, Johnson SL, Hughes SO, Hopkinson JM, Butte NF, Fisher JO. Development of the responsiveness to child feeding cues scale. Appetite 2013;65:210-29.
24. Eckstein KC, Mikhail LM, Ariza AJ, Thomson JS, Millard SC, Binns HJ, et al. Parents’ perceptions of their child’s weight and health. Pediatrics 2006;117:681-90.
25. Boyington JA, Johnson AA. Maternal perception of body size as a determinant of infant adiposity in an African-American community. J Natl Med Assoc 2004;351-96.
26. Lakshman RR, Landsbaugh JR, Schiff A, Hardeman W, Ong KK, Griffin SJ. Development of a questionnaire to assess maternal attitudes towards infant growth and milk feeding practices. Int J Behav Nutr Phys Act 2011;8:1-10.
27. Organización Mundial de la Salud (OMS). La alimentación del lactante y del niño pequeño: capítulo modelo para libros de texto dirigidos a estu-diantes de medicina y otras ciencias de la salud. Ginebra: OMS; 2010. Disponible en: http://www.who.int/maternal_child_adolescent/docu-ments/9789241597494/es/
28. Secretaría de Salud. Reglamento de la Ley General de Salud en Materia de Investigación para la salud. México: Diario Oficial de la Federación; 1987.
Disponible en: http://www.salud.gob.mx/unidades/cdi/nom/compi/rlgs-mis.html
29. López-Romo H. Los niveles socioeconómicos y la distribución de gastos. México: Instituto de Investigaciones Sociales; 2009. Disponible en: https://www.academia.edu/7014402/Los_Niveles_Socioecon%C3%B3micos_y_la_distribuci%C3%B3n_del_gasto
30. Aggor BJ, Johnson AA. Maternal perception of body size as a determinant of infant adiposity in an African-American community. J Natl Med Assoc 2004;351:362-96.
31. Salarkia N, Omidvar N, Zaeri F, Zeinab HE, Neyestani TR. Mother’s self-effica-cy mediates the relationship between household food insecurity and maternal infant feeding styles. Matern Child Health J 2016;20:602-12.
32. Hetherington MM. Understanding infant eating behaviour - Lessons learned from observation. Physiol Behav 2017;176:117-24.
33. Lipps L, Deysher M. Calorie compensation and sensory specific satiety: evidence for self-regulation of food intake by young children. Appetite 1986;323:331-7.
34. Flores-Peña Y, Aguado-Barrera ME, Cerda-Flores RM, Cortés-Gutiérrez EI, Dávila-Rodríguez MI. Percepción materna del peso del hijo y de niños no emparentados menores de un año. Atenc Prim 2016;48:579-85.
35. Watkins MG, Clark KM, Foster CM, Welch KB, Kasa-Vubu JZ. Rela-tionships among body mass index, parental perceptions, birth weight and parental weight after referral to a weight clinic. J Natl Med Assoc 2007;99:908-13.
36. Alexander MA, Sherman JB, Clark L. Obesity in Mexican-American preschool children - A population group at risk. Public Health Nurs 1991;8:53-8.
37. Tobback E, Behaeghel K, Hanoulle I, Delesie L, Loccufier A, Van Holsbeeck A, et al. Comparison of subjective sleep and fatigue in breast- and bottle-feeding mothers. Midwifery 2017;47:22-7.
38. Tikotzky L. Postpartum maternal sleep, maternal depressive symptoms and self-perceived mother-infant emotional relationship. Behavioral Sleep Med 2016;14:5-22.
39. Spiegel K, Tasali E, Penev P, Van Cauter E. Brief communication: sleep cur-tailment in healthy young men is associated with decreased leptin levels, elevated ghrelin levels, and increased hunger and appetite. Ann Intern Med 2004;141:846-50.

NutriciónHospitalaria
Trabajo Original Pediatría
ISSN (electrónico): 1699-5198 - ISSN (papel): 0212-1611 - CODEN NUHOEQ S.V.R. 318
Correspondence: Pablo A. Lizana. Laboratory of Morphological Sciences. Instituto de Biología. Pontificia Universidad Católica de Valparaíso. . Valparaíso, Chilee-mail: [email protected]
Lizana PA, Simpson MC, Farías P, Berral FJ. Somatotypes of schoolchildren from Chile: higher endomorphic components among adolescent girls. Nutr Hosp 2018;35(5):1033-1041
DOI: http://dx.doi.org/10.20960/nh.1749
Somatotypes of schoolchildren from Chile: higher endomorphic components among adolescent girlsEl somatotipo de escolares chilenos: altos componentes endomórficos en mujeres adolescentes
Pablo A. Lizana1, María Cristina Simpson2, Pamela Farías2 and Francisco J. Berral3
1Laboratory of Morphological Sciences. Instituto de Biología. Pontificia Universidad Católica de Valparaíso. Valparaíso, Chile. 2Instituto de Estadística. Pontificia Universidad Católica de Valparaíso. Valparaíso, Chile. 3Departamento de Deporte e Informática. Universidad Pablo de Olavide. Sevilla, Spain
Palabras clave:
Somatotipo. Adiposidad. Biotipo. Endomorfía. Adolecentes mujeres.
Resumen Objetivo: esta investigación tiene por objetivo describir los componentes del somatotipo en niños y adolescentes chilenos.
Métodos: se realizó un estudio transversal en la región de Valparaíso, Chile. Se evaluó el somatotipo de 1.409 escolares (747 hombres) de 6 a 18 años de edad utilizando el método antropométrico de Heath-Carter. Los análisis comparativos por componentes (endomorfía, mesomorfía y ectomorfía) fueron realizados mediante pruebas t. Para analizar el somatotipo como un todo se realizó el cálculo en dos y tres dimensiones, se utilizaron la distancia de dispersión del somatotipo medio (DSM) y la dispersión morfogénica media (DMM) respectivamente, además de una representación en la somatocarta.
Resultados: el somatotipo de la muestra masculina mostró un marcado biotipo mesomorfo-endomorfo (4,9-4,8-2,1), mientras que el de la muestra femenina mostró una clasificación meso-endomórfica (5,8-4,3-1,8). Las muestras difirieron significativamente según sexo, con un elevado componente endomórfico observado en mujeres de 13 a 18 años de edad. Estas diferencias en adolescentes por sexo también fueron observadas en el análisis del somatotipo en dos y tres dimensiones (DSM ≥ 3,0, DMM ≥ 1,2), lo que indica una alta dispersión entre grupos. Además, las somatocartas mostraron un desplazamiento hacia componentes endomórficos para ambos sexos, principalmente en mujeres.
Conclusiones: los resultados proporcionan una fuerte evidencia de que los cambios en los biotipos han aumentado, principalmente en términos de adiposidad relativa (componente endomórfico) y predominantemente en adolescentes mujeres.
Key words:
Somatotype. Adiposity. Biotype. Endomorph. Female adolescent.
Abstract Objective: this investigation describes the somatotype components and somatotype as a whole in Chilean children and adolescents.
Methods: a cross-sectional study was conducted in Valparaiso, Chile. The somatotypes of 1,409 schoolchildren (747 males) aged 6 to 18 years were assessed using the Heath-Carter anthropometric method. Comparative category analyses (endomorph, mesomorph, and ectomorph) were performed using t-tests. To analyze whole somatotypes along two and three dimensions, the somatotype dispersion mean (SDM) and somatotype attitudinal mean (SAM), respectively, were used in addition to a somatochart representation.
Results: the somatotype of the male sample showed a marked mesomorph-endomorph biotype (4.9-4.8-2.1), whereas that for the female sample showed a mesomorphic endomorph classification (5.8-4.3-1.8). The samples differed significantly by sex, with an increased endomorphic component observed in females aged 13 to 18 years old. These sex differences were primarily evident in adolescents with high somatotype values in two or three dimensions (SDM ≥ 3.0; SAM ≥ 1.2), indicating high between-group dispersion. The somatocharts showed displacement of the endomorphic components for both sexes, particularly females.
Conclusions: the results provide strong evidence that biotype changes have increased, primarily in terms of relative adiposity (i.e., the endo-morphic component) and predominantly in adolescent girls.
Received: 26/12/2017 • Accepted: 27/02/2018
©Copyright 2018 SENPE y ©Arán Ediciones S.L. Este es un artículo Open Access bajo la licencia CC BY-NC-SA (http://creativecommons.org/licenses/by-nc-sa/4.0/).

1034 P. A. Lizana et al.
[Nutr Hosp 2018;35(5):1033-1041]
INTRODUCTION
In recent decades, trends of overweight and obesity have been identified in most of the population worldwide, particularly among youth (1-4). A rapid increase in overweight children has been reported in most Latin American countries (5), and Chile is no exception (6,7).
Governments and researchers have focused on a variety of nutritional variables to overcome these issues. The most com-monly used variables in Chile are size, weight, and body mass index (BMI). There are even technical standards in the country issued by the Nutrition Unit of the Ministry of Health (8). However, certain aspects of body composition are undervalued, particular-ly somatotype, even though studies throughout the world have shown that these factors are highly valuable in contributing to the understanding of diet, growth, development, physical exercise, physical self-concept, and disease in different age groups (9-14).
Somatotype corresponds to the estimation of body shape and composition, and it is expressed with three numeric values that correspond to the endomorphic, mesomorphic, and ectomorphic components, providing information on relative adiposity, musculo-skeletal development, and relative linearity, respectively, thus pro-viding the morphological characteristics of individuals as a whole (15). Several methods are used for calculating the somatotype; the Heath-Carter anthropometric method is the most commonly used method (12,15,16).
Somatotype is highly correlated with the physical condition and body composition of athletes and with the identification of their physical characteristics (9, 17) and health-related risk factors (18). In addition, several researchers have acknowledged the value of somatotypological characteristics in developing and maturing pop-ulations, as well as their sexual dimorphism (10,11,14,18-20).
In Chile, somatotype studies are scarce, and they have been primarily performed by a group from Valparaíso, Temuco, and the Metropolitan Region (12). Recent studies have shown higher scores in the adolescent endomorphic component (14,18,19). In this sense, somatotype has helped characterize specific pop-ulations of children. Therefore, this investigation describes the somatotype components and somatotype as a whole in youth from Valparaiso, Chile, and contrasts them with previous Chilean somatotype data obtained using the same methodology.
METHODS
PARTICIPANTS
This study applied a cross-sectional study design. The popu-lation included students from Primary and Secondary Education levels (6 to 18 years old) from public, subsidized private, and private schools. The participants came from the cities of Valparaí-so, Viña del Mar, and Concón, Region of Valparaiso, Chile. The following selection criteria were applied: students enrolled in the school systems of the previously mentioned cities (i.e., Primary, scientific-humanist, commercial, industrial, and technical educa-
tional programs), with informed consent provided by their parents or guardians. Adult schools or special schools (e.g., schools for children with motor, sensory, and/or mental disorders), individ-uals with illnesses (as reported by the parent or guardian) that affected their body composition, students outside the age range of the study, and pregnant students were excluded. To calculate the number of schoolchildren to be included in the study in order to guarantee a representative sample of the Valparaíso region, Chile (n = 185,896 according to data from the Ministry of Edu-cation of Chile), obesity (by BMI) was selected as the variable with greatest variance for this age group (21.2%; 21). Sampling was performed with 95% reliability and a 3% sample error. The minimum established sample size was n = 888. Thus, to guar-antee the representativeness of each age group, the final sample included 1,409 schoolchildren (male 47.05%; female 52.95%).
ANTHROPOMETRICAL SOMATOTYPE
The Heath-Carter method was used to evaluate the anthropomet-ric somatotype. This method comprises ten variables: height; body mass, four skinfolds (triceps, subscapular, supraspinal, and medial calf); two bone breadths (biepicondylar humeral and femoral); and two limb girths (arm flexed and maximum tensed [at maximum] and maximum perimeter of the calf) (15). All training and measurements were performed following the recommendations of the International Society for the Advancement of Kinanthropometry (22).
Evaluations were performed with the students standing in bare feet and wearing light clothes. All measurements were performed three times, by the first author, with the median value used as the final result.
This study was performed in the morning at the educational institutions, between 2011 and 2012. Anthropometric measure-ments were taken on the right side of the body.
EQUIPMENT
Body mass was measured with precision scales (Seca® 813, Hamburg, Germany) with a sensitivity of 100 g. Height was regis-tered using a stadiometer (Seca® 217, Hamburg, Germany) with a sensitivity of 0.1 cm. Breadths were taken with a flexible and inextensible metric tape (model W606PM-Lufkin®, Houston, TX, USA). Girths were evaluated using a small sliding caliper Campbell 10, and skinfolds were measured with a Slim Guide caliper (both from the anthropometrical Gaucho pro kit with Rosscraft® license).
ETHICAL ASPECTS
The process of anthropometric assessments was orally explained to and authorized by the guardians, educational estab-lishments, and each child. Informed consent was signed by the parents/legal guardians, school education directors, or the stu-dents themselves. This consent (for adolescents aged 14 to 18)

1035
[Nutr Hosp 2018;35(5):1033-1041]
SOMATOTYPES OF SCHOOLCHILDREN FROM CHILE: HIGHER ENDOMORPHIC COMPONENTS AMONG ADOLESCENT GIRLS
and assent (referring to a simplified and compressible text for children aged six to 13) was approved by the Ethics Committee of the Pontificia Universidad Católica de Valparaíso, Chile, in accor-dance with the policies outlined by the Declaration of Helsinki.
STATISTICAL ANALYSIS
Both descriptive and inferential statistics were applied, and the assumptions of normality (via the Shapiro-Wilk test) and homoscedasticity (i.e., equal variance) for continuous variables were confirmed. Significant differences in somatotype compo-nents between the male and female schoolchildren of 2012 were evaluated using Student’s t-test.
Estimation of somatotype comprised the following factors: a) mean somatotype; b) a calculation of the three components of the somatotype (endomorphic, mesomorphic, and ectomorphic); c) somatotype dispersion mean (SDM), which is the average distance of individual somatotypes over a two-dimension-al somatotype mean (this is a measure of dispersion; this distance is statistically significant at p < 0.05, when SDM is equal to or greater than 2 [23]); and d) the somatotype attitudinal mean (SAM), which is the average of the distance of the somatotypes from the mean in three dimensions. A small SAM indicates a tight cluster around the somatotype mean, whereas a large SAM indicates a wide scatter. A higher SAM value corresponds to lower group homogeneity. For this study, SAM was defined as high (SAM ≥ 1.0), moderate (SAM between 0.80 and 0.99), and low (SAM ≤ 0.79) (24). The somatochart representation was used to present the stud-ied samples. For the somatotype categories, the categories proposed by Carter (13 categories; 15) and the description ratings of each component (low, 1-2.5; moderate, 3-5; high, 5.5-7; and extremely high, > 7.5) were used (15). Statistical calculations were performed using STATA version 12.0, and p < 0.05 was considered as significant.
RESULTS
Table I shows the anthropometric characteristics of height, mass, and somatotype means (endomorphic, ectomorphic, and mesomorphic components, SDM, and SAM) for male and female samples. The height and mass analyses indicated significant dif-ferences between males and females, primarily in the adolescent group. Male adolescents were taller than their female counterparts (at 13-18 years old). An exception was observed at ten years old, when girls were taller than boys. An analysis of the somatotype components found differences among adolescents (i.e., 13- to 18-year-olds): females demonstrated significantly higher endo-morphic values than males. The mesomorphy values of males were higher than those of females, and significant differences were observed at 9-15 and 17 years old. The SDM was high (all values over 2.0) for all male and female adolescents, indicating large differences in both 11-year-olds and 13- to 18-year-olds.
Differences in the SAM were observed among 13- and 18-year-olds (Table I). The SAM showed heterogeneity across sex.
The mesomorphic endomorph category predominated in the male and female samples (males: 36.20%, females: 64.48%) (Table II), followed by endomorphic mesomorph category in males (20.81%) and mesomorph-endomorph category in females (7.91%). Mesomorphic endomorph category prevailed among male children (39.09%). Among male adolescents, endomorphic mesomorph was the predominant category (28.93%), closely fol-lowed by mesomorphic endomorph category (27.04%). Among female children and adolescents, mesomorphic endomorph cate-gory predominated, but was greater among adolescents (73.87%) than in children (58.61%).
Figure 1 shows the somatochart with the mean somatoplots by age and sex across the assessed samples. The somatocharts showed the displacement of the endomorphic components for both sexes, particularly females.
DISCUSSION
Over time, the somatotype of Chilean youth has changed from mesomorphic category to the endomorphic category, particularly in females (10). Compared to the latest study in Temuco, Chile, a foothill area (in southern Chile), an endomorphic trend was observed at 15 years old, with a numerical value of 5.6 (18); this component was exceeded by females of the same age during the 2009-2010 period (6.64; 10).
Figure 1.
Comparative distribution of mean somatopoints for Chilean children and adoles-cents by age and sex. The male sample is represented with black circles, and the female sample is represented with gray circles. The total group of mean somatotype in males is represented with black circles and a white center (4.91-4.82-2.06; n = 663). The female total sample is represented with a gray circle with a white center (5.83-4.26-1.76; n = 746).
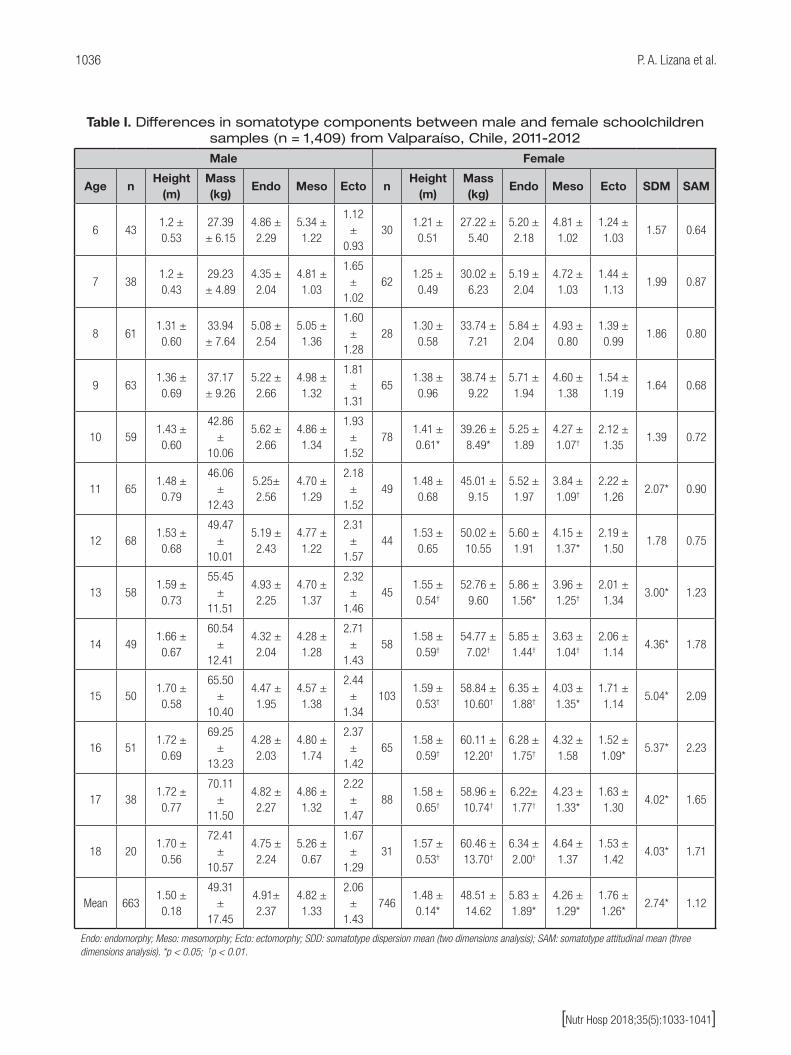
1036 P. A. Lizana et al.
[Nutr Hosp 2018;35(5):1033-1041]
Table I. Differences in somatotype components between male and female schoolchildren samples (n = 1,409) from Valparaíso, Chile, 2011-2012
Male Female
Age nHeight
(m)Mass (kg)
Endo Meso Ecto nHeight
(m)Mass (kg)
Endo Meso Ecto SDM SAM
6 431.2 ± 0.53
27.39 ± 6.15
4.86 ± 2.29
5.34 ± 1.22
1.12 ±
0.9330
1.21 ± 0.51
27.22 ± 5.40
5.20 ± 2.18
4.81 ± 1.02
1.24 ± 1.03
1.57 0.64
7 381.2 ± 0.43
29.23 ± 4.89
4.35 ± 2.04
4.81 ± 1.03
1.65 ±
1.0262
1.25 ± 0.49
30.02 ± 6.23
5.19 ± 2.04
4.72 ± 1.03
1.44 ± 1.13
1.99 0.87
8 611.31 ± 0.60
33.94 ± 7.64
5.08 ± 2.54
5.05 ± 1.36
1.60 ±
1.2828
1.30 ± 0.58
33.74 ± 7.21
5.84 ± 2.04
4.93 ± 0.80
1.39 ± 0.99
1.86 0.80
9 631.36 ± 0.69
37.17 ± 9.26
5.22 ± 2.66
4.98 ± 1.32
1.81 ±
1.3165
1.38 ± 0.96
38.74 ± 9.22
5.71 ± 1.94
4.60 ± 1.38
1.54 ± 1.19
1.64 0.68
10 591.43 ± 0.60
42.86 ±
10.06
5.62 ± 2.66
4.86 ± 1.34
1.93 ±
1.5278
1.41 ± 0.61*
39.26 ± 8.49*
5.25 ± 1.89
4.27 ± 1.07†
2.12 ± 1.35
1.39 0.72
11 651.48 ± 0.79
46.06 ±
12.43
5.25± 2.56
4.70 ± 1.29
2.18 ±
1.5249
1.48 ± 0.68
45.01 ± 9.15
5.52 ± 1.97
3.84 ± 1.09†
2.22 ± 1.26
2.07* 0.90
12 681.53 ± 0.68
49.47 ±
10.01
5.19 ± 2.43
4.77 ± 1.22
2.31 ±
1.5744
1.53 ± 0.65
50.02 ± 10.55
5.60 ± 1.91
4.15 ± 1.37*
2.19 ± 1.50
1.78 0.75
13 581.59 ± 0.73
55.45 ±
11.51
4.93 ± 2.25
4.70 ± 1.37
2.32 ±
1.4645
1.55 ± 0.54†
52.76 ± 9.60
5.86 ± 1.56*
3.96 ± 1.25†
2.01 ± 1.34
3.00* 1.23
14 491.66 ± 0.67
60.54 ±
12.41
4.32 ± 2.04
4.28 ± 1.28
2.71 ±
1.4358
1.58 ± 0.59†
54.77 ± 7.02†
5.85 ± 1.44†
3.63 ± 1.04†
2.06 ± 1.14
4.36* 1.78
15 501.70 ± 0.58
65.50 ±
10.40
4.47 ± 1.95
4.57 ± 1.38
2.44 ±
1.34103
1.59 ± 0.53†
58.84 ± 10.60†
6.35 ± 1.88†
4.03 ± 1.35*
1.71 ± 1.14
5.04* 2.09
16 511.72 ± 0.69
69.25 ±
13.23
4.28 ± 2.03
4.80 ± 1.74
2.37 ±
1.4265
1.58 ± 0.59†
60.11 ± 12.20†
6.28 ± 1.75†
4.32 ± 1.58
1.52 ± 1.09*
5.37* 2.23
17 381.72 ± 0.77
70.11 ±
11.50
4.82 ± 2.27
4.86 ± 1.32
2.22 ±
1.4788
1.58 ± 0.65†
58.96 ± 10.74†
6.22± 1.77†
4.23 ± 1.33*
1.63 ± 1.30
4.02* 1.65
18 201.70 ± 0.56
72.41 ±
10.57
4.75 ± 2.24
5.26 ± 0.67
1.67 ±
1.2931
1.57 ± 0.53†
60.46 ± 13.70†
6.34 ± 2.00†
4.64 ± 1.37
1.53 ± 1.42
4.03* 1.71
Mean 6631.50 ± 0.18
49.31 ±
17.45
4.91± 2.37
4.82 ± 1.33
2.06 ±
1.43746
1.48 ± 0.14*
48.51 ± 14.62
5.83 ± 1.89*
4.26 ± 1.29*
1.76 ± 1.26*
2.74* 1.12
Endo: endomorphy; Meso: mesomorphy; Ecto: ectomorphy; SDD: somatotype dispersion mean (two dimensions analysis); SAM: somatotype attitudinal mean (three dimensions analysis). *p < 0.05; †p < 0.01.

1037
[Nutr Hosp 2018;35(5):1033-1041]
SOMATOTYPES OF SCHOOLCHILDREN FROM CHILE: HIGHER ENDOMORPHIC COMPONENTS AMONG ADOLESCENT GIRLS
Table II. Distribution of 13 somatotype categories at school-age Chilean children and adolescents from Valparaíso, Chile for sex (n = 1,409), 2011-2012
Category somatotype Total sample Male (n = 663) Female (n = 746)
Balanced endomorph 2.56 (36) 1.51 (10) 3.49 (26)
Mesomorphic endomorph 51.17 (721) 36.20 (240) 64.48 (481)
Mesomorph-endomorph 8.87 (125) 9.95 (66) 7.91 (59)
Endomorphic mesomorph 13.70 (193) 20.81 (138) 7.37 (55)
Balanced mesomorph 3.90 (55) 6.94 (46) 1.21 (9)
Ectomorphic mesomorph 3.69 (52) 7.09 (47) 0.67 (5)
Mesomorph-ectomorph 1.56 (22) 1.96 (13) 1.21 (9)
Mesomorphic ectomorph 4.33 (61) 8.45 (56) 0.67 (5)
Balanced ectomorph 1.63 (23) 1.21 (8) 2.01 (15)
Endomorphic ectomorph 2.48 (35) 2.56 (17) 2.41 (18)
Endomorph-ectomorph 1.14 (16) 0.60 (4) 1.61 (12)
Ectomorphic endomorph 3.05 (43) 0.60 (4) 5.23 (39)
Central 1.92 (27) 2.11 (14) 1.74 (13)
Male Total sample Children Adolescents
Balanced endomorph 1.51 (10) 1.59 (8) 1.26 (2)
Mesomorphic endomorph 36.20 (240) 39.09 (197) 27.04 (43)
Mesomorph-endomorph 9.95 (66) 9.92 (50) 10.06 (16)
Endomorphic mesomorph 20.81 (138) 18.25 (92) 28.93 (46)
Balanced mesomorph 6.94 (46) 7.14 (36) 6.29 (10)
Ectomorphic mesomorph 7.09 (47) 7.54 (38) 5.66 (9)
Mesomorph-ectomorph 1.96 (13) 1.79 (9) 2.52 (4)
Mesomorphic ectomorph 8.45 (56) 8.53 (43) 8.18 (13)
Balanced ectomorph 1.21 (8) 0.99 (5) 1.89 (3)
Endomorphic ectomorph 2.56 (17) 2.58 (13) 2.52 (4)
Endomorph-ectomorph 0.60 (4) 0.20 (1) 1.89 (3)
Ectomorphic endomorph 0.60 (4) 0.40 (2) 1.26 (2)
Central 2.11 (14) 1.98 (10) 2.52 (4)
Female Total sample Children Adolescents
Balanced endomorph 3.49 (26) 3.05 (14) 4.18 (12)
Mesomorphic endomorph 64.48 (481) 58.61 (269) 73.87 (212)
Mesomorph-endomorph 7.91 (59) 9.59 (44) 5.23 (15)
Endomorphic mesomorph 7.37 (55) 9.80 (45) 3.48 (10)
Balanced mesomorph 1.21 (9) 1.74 (8) 0.35 (1)
Ectomorphic mesomorph 0.67 (5) 1.09 (5) 0.00 (0)
Mesomorph-ectomorph 1.21 (9) 1.96 (5) 0.00 (0)
Mesomorphic ectomorph 0.67 (5) 0.87 (4) 0.35 (1)
Balanced ectomorph 2.01 (15) 2.61 (12) 1.05 (3)
Endomorphic ectomorph 2.41 (18) 2.61 (12) 2.09 (6)
Endomorph-ectomorph 1.61 (12) 1.31 (6) 2.09 (6)
Ectomorphic endomorph 5.23 (39) 4.14 (19) 6.97 (20)
Central 1.74 (13) 2.61 (12) 0.35 (1)
Values are expressed as percentage and (frequency). Higher values are shown in italics.

1038 P. A. Lizana et al.
[Nutr Hosp 2018;35(5):1033-1041]
The latter value remained relatively stable in the present study (6.35), which suggests that the predominantly endomorphic bio-type of the female population is maintained in that condition. In males, a mesomorphic biotype at 15 years old has been observed in the population of Temuco (4.8; 18), in contrast to the present study, where males are less mesomorphic at the same age (4.47).
Silva et al. (2008) recorded the somatotypes of overweight and obese students 16 to 18 years of age (7.4-4.0-0.6 males, 8.1-4.1-0.4 females) in the city of Temuco, Chile (25). The highest endomorphic values were recorded at the age of 16 for men and 17 for women, thus confirming a high adiposity in adolescents, an aspect that coincides with our study, in which high endomor-phy values were recorded in females between ages 15 and 17. Conversely, in males, high values were reported from an early age for the endomorphic component. Despite these high endomor-phic component values in males, the highest values are record-ed during childhood (5.62 at age 10), which indicates that from childhood, males have a high load of adiposity that remains during adolescence, thus contributing to the development of overweight and obese adults in addition to associated health consequences.
For the third somatotype component, ectomorphism, both males and females reported low values, indicating the large volumes and rounded shapes that are typical of people with increased relative adiposity (15).
Tables III and IV show the comparative somatotypes across the SDM and SAM of the male and female samples from 1996, in which Almagià et al. (1996) evaluated a large sample from Valparaíso and reported three somatotype components by sex, and the data from the present study. Males from the 1996 sample showed a predominant
mesomorphic shape at all ages, and the ectomorphic component was more dominant than the endomorphic component (ectomorphic mesomorph). The dominant mesomorphic shape was classified as a “balanced mesomorph” at six to nine years old, as a “mesomorphic ectomorph” at ten to 12 years old, as an “ectomorphic mesomorph” at 13 to 14 years old, and as an “ectomorphic mesomorph” at 15 to 18 years old. Females predominantly showed a mesomorphic shape at all ages in 1996, except at eleven years old, when an ectomorphic shape was more common. However, this exception did not exceed one unit; thus, they shared similar mesomorphic components. When classifying using the Heath-Carter criteria, the 1996 female sample primarily showed a balanced mesomorph profile (7-10 and 12 years old) and was classified as “central” at 13 and 14 years old. Mesomorphic and endomorphic shapes (i.e., mesomorph-endomorph) predominate at the beginning of adolescence (15 to 18 years old). Elevated SDM and SAM values were observed for both study periods and sexes (all scores were over 2.0 and 1.0, respectively), indicating a high dispersion of scores. Our analysis by sex revealed a high dispersion (two- and three-dimensional analyses), which is similar to the compar-ative work performed among adolescents from Valparaíso, Chile from 1985 to 2010 (10). In addition, figures 2 and 3 show the comparative somatochart with the mean somatoplots by age and sex. These soma-tocharts show displacement toward the endomorphic shape for both sexes. The 1996 female sample (26) is located in the middle of the somatochart; conversely, the females of the present study showed a marked displacement toward an endomorphic shape. These results show that adolescents experienced an important biotype change over time, particularly adolescent females with an increased endomorphic component.
Table III. Comparative differences in somatotype components between male schoolchildren samples of 1996 and the present study from Valparaíso, Chile
1996 (n = 518)
Present study(n = 663)
Age n Endomorphy Mesomorphy Ectomorphy n Endomorphy Mesomorphy Ectomorphy SDM SAM
6 12 1.48 ± 0.35 4.54 ± 0.54 1.84 ± 1.22 43 4.86 ± 2.29 5.34 ± 1.22 1.12 ± 0.93 7.17 3.54
7 32 2.07 ± 0.34 4.51 ± 0.54 2.21 ± 1.16 38 4.35 ± 2.04 4.81 ± 1.03 1.65 ± 1.02 5.05 2.37
8 32 2.00 ± 0.35 4.18 ± 0.50 2.57 ± 1.19 61 5.08 ± 2.54 5.05 ± 1.36 1.60 ± 1.28 7.03 3.35
9 34 2.08 ± 0.35 4.25 ± 0.50 2.38 ± 1.09 63 5.22 ± 2.66 4.98 ± 1.32 1.81 ± 1.31 6.52 3.27
10 30 2.03 ± 0.28 4.30 ± 0.50 2.75 ± 1.03 59 5.62 ± 2.66 4.86 ± 1.34 1.93 ± 1.52 7.82 3.73
11 32 1.82 ± 0.25 3.94 ± 0.50 3.20 ± 0.86 65 5.25± 2.56 4.70 ± 1.29 2.18 ± 1.52 7.76 3.66
12 32 1.80 ± 0.24 4.24 ± 0.52 3.37 ± 1.03 68 5.19 ± 2.43 4.77 ± 1.22 2.31 ± 1.57 7.82 3.60
13 25 1.79 ± 0.23 3.87 ± 0.63 3.38 ± 1.10 58 4.93 ± 2.25 4.70 ± 1.37 2.32 ± 1.46 7.28 3.41
14 8 1.68 ± 0.23 4.06 ± 0.71 3.83 ± 1.16 49 4.32 ± 2.04 4.28 ± 1.28 2.71 ± 1.43 6.60 2.87
15 19 2.45 ± 0.25 4.34 ± 0.69 3.41 ± 1.16 50 4.47 ± 1.95 4.57 ± 1.38 2.44 ± 1.34 5.22 2.26
16 95 2.43 ± 0.24 4.68 ± 0.64 3.23 ± 1.20 51 4.28 ± 2.03 4.80 ± 1.74 2.37 ± 1.42 4.76 2.05
17 113 2.34 ± 0.23 4.43 ± 0.64 3.35 ± 1.20 38 4.82 ± 2.27 4.86 ± 1.32 2.22 ± 1.47 6.27 2.76
18 54 2.33 ± 0.95 4.49 ± 0.74 3.20 ± 1.24 20 4.75 ± 2.24 5.26 ± 0.67 1.67 ± 1.29 6.87 2.96
SDM: somatotype dispersion mean (two dimensions analysis); SAM: somatotype attitudinal mean (three dimensions analysis).

1039
[Nutr Hosp 2018;35(5):1033-1041]
SOMATOTYPES OF SCHOOLCHILDREN FROM CHILE: HIGHER ENDOMORPHIC COMPONENTS AMONG ADOLESCENT GIRLS
In this study, increased sex differences in endomorphy were observed in women compared with men; conversely, males had a higher mesomorphic component than females. However, both sex-es moved toward endomorphy. This change toward an increased
endomorphy (higher in girls than in boys) has been observed over time in several populations in Chile (10,14,18,19,25-27). The change in males moved the relative adiposity limit to between moderate and high. Similar to young boys, girls have shown
Table IV. Comparative differences in somatotype components between female schoolchildren samples of 1996 and the present study from Valparaíso, Chile
1996 (n = 460)
Present study(n = 746)
Age n Endomorphy Mesomorphy Ectomorphy n Endomorphy Mesomorphy Ectomorphy SDM SAM
6 12 2.31 ± 0.88 4.28 ± 0.95 2.39 ± 1.65 30 5.20 ± 2.18 4.81 ± 1.02 1.24 ± 1.03 7.03 3.16
7 42 2.29 ± 1.00 4.11 ± 0.86 2.32 ± 1.34 62 5.19 ± 2.04 4.72 ± 1.03 1.44 ± 1.13 6.60 3.09
8 30 2.13 ± 0.86 3.89 ± 0.74 2.51 ± 1.13 28 5.84 ± 2.04 4.93 ± 0.80 1.39 ± 0.99 8.38 4.01
9 35 2.36 ± 1.12 3.77 ± 0.97 2.27 ± 1.21 65 5.72 ± 1.97 4.43 ± 1.48 1.69 ± 1.68 7.13 3.53
10 23 2.89 ± 0.98 3.79 ± 1.05 2.63 ± 0.99 78 5.25 ± 1.89 4.27 ± 1.07 2.12 ± 1.35 5.05 2.46
11 21 2.03 ± 0.81 3.01 ± 1.03 3.75 ± 1.53 49 5.52 ± 1.97 3.84 ± 1.09 2.22 ± 1.26 8.70 3.90
12 39 2.48 ± 1.18 3.68 ± 1.46 2.86 ± 1.48 44 5.60 ± 1.91 4.15 ± 1.37 2.19 ± 1.50 6.74 3.23
13 23 2.65 ± 0.97 3.48 ± 0.97 3.03 ± 1.53 45 5.86 ± 1.56 3.96 ± 1.25 2.01 ± 1.34 7.43 3.40
14 11 2.72 ± 1.25 2.89 ± 0.86 2.54 ± 1.28 58 5.85 ± 1.44 3.63 ± 1.04 2.06 ± 1.14 6.36 3.25
15 21 4.45 ± 0.99 4.79 ± 1.19 2.11 ± 1.18 103 6.35 ± 1.88 4.03 ± 1.35 1.71 ± 1.14 5.00 2.09
16 71 4.54 ± 1.44 4.78 ± 1.37 2.10 ± 1.14 65 6.28 ± 1.75 4.32 ± 1.58 1.52 ± 1.09 4.52 1.89
17 81 4.45 ± 1.24 4.87 ± 1.23 1.91 ± 1.00 88 6.22± 1.77 4.23 ± 1.33 1.63 ± 1.30 4.50 1.91
18 51 4.71 ± 1.37 4.79 ± 1.38 1.89 ± 1.18 31 6.34 ± 2.00 4.64 ± 1.37 1.53 ± 1.42 3.79 1.68
SDM: somatotype dispersion mean (two dimensions analysis); SAM: somatotype attitudinal mean (three dimensions analysis).
Figure 2.
Comparative distribution of the mean somatopoints in Chilean male children and adolescents by year and age (6 to 18 years old). The 1996 sample is represented by black circles (n = 518) and the 2012 sample is represented by gray circles (n = 663).
Figure 3.
Comparative distribution of the mean somatopoints in Chilean female children and adolescents by year and age (6 to 18 years old). The 1996 sample is represented by black circles (n = 460) and the 2012 sample is represented by gray circles (n = 746).

1040 P. A. Lizana et al.
[Nutr Hosp 2018;35(5):1033-1041]
decreased relative fatness; however, girls start to increase in rel-ative fatness again during adolescence, unlike boys, who increase in muscle mass (28). One of the causes of increased fat tissue in adolescents may be sex hormones, which contribute to an accumulation of a higher percentage of dermal fat; therefore, adolescents are more prone to obesity during this period (28). However, a normal level of adipose tissue can be differentiated from that contributing to chronic diseases. Chile has reported some causes of obesity, such as the excessive consumption of hypercaloric food (29), differences in socioeconomic status (14), and/or decreased physical activity (1,30). This profile of high rel-ative adiposity increases the likelihood that this population suf-fers from chronic non-transmissible and cardiovascular diseases extending into adulthood (31).
The limitations of this study include the selection of data pub-lished in 1996 for comparison with our results in the discussion section. The small sample sizes of 6-, 14-, and 15-year-old males and 6-, 10-, 11-, and 14-year-old females compared with the present study make it difficult to generalize trends in somatotype components. Future studies should explore the Chilean somato-type trends in youth. Nevertheless, in most ages, it was possi-ble to show a displacement of the endomorphic components for both sexes, particularly females. Another limitation of the previous study was that their participants were sampled from one region of Chile, and therefore might not represent other localities. How-ever, the region of Valparaíso is the third most populated, and the sample only represents schoolchildren.
In summary, this study reflects an important sexual dimorphism in which the mesomorphic component associated with muscu-lature decreased and the endomorphic component increased in Chilean schoolchildren, particularly in female adolescents. In addi-tion, this study shows a displacement of the higher endomorphic components in schoolchildren compared with studies from three decades ago.
ACKNOWLEDGMENTS
The authors are grateful to the Research Direction, the Vice-Chancellor’s Office for Research and Advanced Studies and the Institute of Biology of the Faculty of Sciences of Pontificia Uni-versidad Católica de Valparaíso, Chile, for their constant support.
FUNDING
Grant sponsorship: this research was supported by Grant SA10I20005 from the National Fund for Health Research and Development of Chile (FONIS/MINSAL of CONICYT).
REFERENCES
1. Lizana PA, Cisternas-Vallejos P, Araya L, Aguilera F, Mora M. Obesity, body fat distribution, and physical activity in school-age children: an urban and rural
comparison in Valparaíso, Chile. Biomed Environ Sci 2016;29:834-9. DOI: 10.3967/bes2016.112
2. Lobstein T, Baur L, Uauy R, IASO International Obesity TaskForce. Obesity in children and young people: a crisis in public health. Obes Rev 2004;5:4-104. DOI: 10.1111/j.1467-789X.2004.00133.x
3. Orden AB, Bucci PJ, Petrone S. Trends in weight, height, BMI and obesity in schoolchildren from Santa Rosa (Argentina), 1990-2005/07. Ann Hum Biol 2013;40:348-54. DOI: 10.3109/03014460.2013.778329
4. Ogden CL, Carroll MD, Lawman HG, Fryar CD, Kruszon-Moran D, Kit BK, et al. Trends in obesity prevalence among children and adolescents in the United States, 1988-1994 through 2013-2014. JAMA 2016;315:2292-9. DOI: 10.1001/jama.2016.6361
5. Rivera JÁ, De Cossío TG, Pedraza LS, Aburto TC, Sánchez TG, Martorell R. Childhood and adolescent overweight and obesity in Latin America: a sys-tematic review. Lancet Diabetes Endocrinol 2014;2:321-32. DOI: 10.1016/S2213-8587(13)70173-6
6. Kain J, Uauy R, Lera L, Taibo M, Albala C. Trends in height and BMI of 6-year-old children during the nutrition transition in Chile. Obes Res 2005;13:2178-86. DOI: 10.1038/oby.2005.270
7. Lizana PA, Almagià AA, Simpson MC, Binvignat O, Ivanovic D, Berral FJ. Aproximación a la tendencia secular del estado nutricional y composición corporal en escolares de enseñanza secundaria, V Región, Chile: 1985-2010. Int J Morphol 2011;29:473-8. DOI: 10.4067/S0717-95022011000200028
8. Pizarro T, Rodríguez L, Benavides X, Atalah E, Mardones F, Rozowski J, et al. Norma técnica de evaluación nutritional del niño de 6 a 18 años. Rev Chil Nutr 2004;31:128-37.
9. Carter JE, Ackland TR, Kerr DA, Stapff A. Somatotype and size of eli-te female basketball players. J Sports Sci 2005;23:1057-63. DOI: 10.1080/02640410400023233
10. Lizana PA, Almagiâ A, Simpson C, Ivanovic D, Binvignat O, Berral FJ. Changes of somatotype in high school students, V region, Chile: 1985-2010. Nutr Hosp 2012;27:270-5. DOI: 10.1590/S0212-16112012000100036
11. Ventrella AR, Semproli S, Jürimäe J, Toselli S, Claessens AL, Jürimäe T, et al. Somatotype in 6-11-year-old Italian and Estonian schoolchildren. Homo 2008;59:383-96. DOI: 10.1016/j.jchb.2007.07.001
12. Lizana PA, Olivares R, Berral FJ. Somatotype tendency in Chilean adolescents from Valparaíso: review from 1979 to 2011. Nutr Hosp 2014;31:1034-43. DOI: 10.3305/nh.2015.31.3.8425
13. Zsakai A, Karkus Z, Utczas K, Bodzsar EB. Body structure and physical self-concept in early adolescence. J Early Adolesc 2017;37:316-38.
14. Lizana PA, González LL, Lera L, Leyton B. Association between body com-position, somatotype, and socioeconomic status according to school levels in Chilean children and adolescents. J Biosoc Sci 2018;50:53-69. DOI: 10.1017/S0021932017000025
15. Carter JE, Heath B. Somatotyping. Development and applications. Cambridge: Cambridge University Press; 1990.
16. Beaulieu M, Allard P, Hinse S, Simoneau M, Rivard C. Somatotyping mor-phology. Crit Rev Phys Rehabil Med 2005;17:317-30. DOI: 10.1615/CritRe-vPhysRehabilMed.v17.i4.50
17. Liiv H, Wyon M, Jürimäe T, Purge P, Saar M, Mäestu J, et al. Anthropo-metry and somatotypes of competitive dance sport participants: a com-parison of three different styles. Homo 2014;65:155-60. DOI: 10.1016/j.jchb.2013.09.003
18. Silva M, Collipal L, Martínez C, Bruneau JC. Evaluación de los componentes del somatotipo e índice de masa corporal en escolares del sector precordi-llerano de la IX Región, Chile. Int J Morphol 2005;23:195-9. DOI: 10.4067/S0717-95022005000200015
19. Martínez C, Silva H, Collipal E, Carrasco SV. Descripción del somatotipo e IMC en una muestra de adolescentes de colegios municipalizados de la ciudad de Temuco - Chile. Int J Morphol 2008;26:653-7. DOI: 10.4067/S0717-95022008000300023
20. Ruderman A, Navarro T, Mangeaud A, Cejas V, Bajo JM. Somatotipos de adolescentes escolarizados de Córdoba (Argentina). Rev Arg Antrop Biol 2017;19:1-11. DOI: 10.17139/raab.2017.0019.02.05
21. Junta Nacional de Auxilio y Becas. Situación nutricional de escolares de 1º básico de establecimientos subvencionados del país. Situación de obesidad por región en primero básico. Chile: Gobierno de Chile; 2011.
22. Marfell-Jones MJ, Olds T, Stewart AD, Carter L. International Standards for Anthropometric Assessment. Adelaida: International Society for the Advan-cement of Kinanthropometry; 2006.
23. Hebbelinck M, Carter JE, De Garay A. Body build and somatotype of Olympic swimmers. In: Lewillie L, Clarys JP (eds.). Swimming. Baltimore: University Park Press; 1975.

1041
[Nutr Hosp 2018;35(5):1033-1041]
SOMATOTYPES OF SCHOOLCHILDREN FROM CHILE: HIGHER ENDOMORPHIC COMPONENTS AMONG ADOLESCENT GIRLS
24. Carter JE, Mirwald RL, Heath-Roll BH, Bailey DA. Somatotypes of 7- to 16-year-old boys in Saskatchewan, Canada. Am J Hum Biol 1997;9:257-72. DOI: 10.1002/(SICI)1520-6300(1997)9:2<257::AID-AJHB12>3.0.CO;2-L
25. Silva M, Collipal L, Martínez C, Torres I. Análisis del IMC y somatotipo en una muestra de adolescentes con sobrepeso y obesidad en Temuco-Chile. Int J Morphol 2008;26:707-11. DOI: 10.4067/S0717-95022008000300032
26. Almagià A, Toro T, Binvignat O, Cabrera E, Marinao A. Aproximación al perfil morfoestructural y dismorfismo sexual de jóvenes de ambos sexos de edad de 6 a 23 años de edad caracterizados por el somatotipo. Rev Chil Anat 1996;14:189-97.
27. Silva H, Bruneau JC, Reyno HP, Bucarey S. Somatotipo e índice de masa corporal en una muestra de adolescentes de ambos sexos de la ciudad de Temuco, Chile. Int J Morphol 2003;21:309-13. DOI: 10.4067/S0717-95022003000400009
28. Wells JCK. Sexual dimorphism of body composition. Best Pract Res Clin Endocrinol Metab 2007;21:415-30. DOI: 10.1016/j.beem.2007.04.007
29. Olivares CS, Bustos ZN, Lera ML, Zelada ME. Nutritional status, food con-sumption and physical activity in female school children of different socioe-conomic levels from Santiago, Chile. Rev Med Chil 2007;135:71-8. DOI: 10.4067/S0034-98872007000100010
30. Burrows R, Correa-Burrows P, Orellana Y, Almagiá A, Lizana P, Ivanovic D. Scheduled physical activity is associated with better academic performance in Chilean school-age children. J Phys Act Health 2014;11(8):1600-6. DOI: 10.1123/jpah.2013-0125.
31. Berenson GS, Srinivasan SR, Xu JH, Chen W. Adiposity and cardiovascular risk factor variables in childhood are associated with premature death from coronary heart disease in adults: the Bogalusa Heart Study. Am J Med Sci 2016;352(5):448-54. DOI: 10.1016/j.amjms.2016.08.006.

NutriciónHospitalaria
Trabajo Original Pediatría
ISSN (electrónico): 1699-5198 - ISSN (papel): 0212-1611 - CODEN NUHOEQ S.V.R. 318
Relación entre la lactancia materna exclusiva los primeros seis meses de vida y el desarrollo de resistencia a la insulina en niños y adolescentes de Bucaramanga, ColombiaRelationship between exclusive breastfeeding the first six months of life and development of insulin resistance in children and adolescents in Bucaramanga, Colombia
Norma Serrano1,2,3, Adriana Robles Silva4, Diana Paola Suárez4, Edna Gamboa-Delgado5 y Doris Cristina Quintero-Lesmes1
1Fundación Cardiovascular de Colombia (FCV). Floridablanca, Colombia. 2Hospital Internacional de Colombia (HIC). La Parcela, Piedecuesta. Santander, Colombia. 3Fundación Universitaria (FCV). La Parcela, Piedecuesta. Santander, Colombia. 4Unión Temporal CARDIECOL (Conocimiento y Acción para Reducir la Dimensión de la Enfermedad Cardiovascular en Colombia). Universidad Autónoma de Bucaramanga-UNAB. Floridablanca, Colombia. 5Escuela de Nutrición y Dietética. Universidad Industrial de Santander-UIS. Bucaramanga, Colombia
Palabras clave:
Resistencia a la insulina. Lactancia materna. Síndrome metabólico.
ResumenIntroducción: la lactancia materna exclusiva (LME) es un factor protector contra el desarrollo de resistencia a la insulina (RI) como causa del síndrome metabólico.
Objetivo: el objetivo del estudio fue evaluar la relación entre la LME los primeros seis meses de vida y el desarrollo de RI, mediante los índices Homeostasis Model Assessment (HOMA-IR) y Quantitative Insulin Sensitivity Check Index (QUICKI).
Material y métodos: estudio de cohorte de tipo poblacional; se incluyeron 494 participantes adolescentes, de los cuales se evaluaron variables sociodemográficas, antropométricas y factores cardiometabólicos mediante los índices HOMA-IR y QUICKI para determinar el grado de asociación entre la LME y el desarrollo de RI. Los resultados fueron expresados en medianas.
Resultados: la prevalencia de LME fue del 42%. Los resultados sugieren un efecto protector de la LME sobre la resistencia a la insulina, de tal manera que por cada mes más de duración de LME, disminuye en 0,32 (p = 0,005) el índice HOMA-IR y aumenta en 0,70 (p = 0,008) el índice QUICKI. Para la circunferencia de cintura, el índice de masa corporal (IMC) y el índice-cintura talla (ICT) esta relación no fue significativa.
Conclusión: los análisis bivariados y multivariados, indican una relación epidemiológicamente significativa que demuestra un efecto protector de la Lactancia Materna Exclusiva sobre el índice HOMA-IR y el QUICKI.
Key words:
Resistance to insulin. Breastfeeding. Metabolic syndrome.
AbstractIntroduction: exclusive breastfeeding (EB) is a protective factor against the development of insulin resistance (IR) as mainstay of the metabolic syndrome.
Objective: the objective of the study was to evaluate the relationship between EB during the first six months of life and the development of IR through the Homeostasis Model Assessment (HOMA-IR) and Quantitative Insulin Sensitivity Check Index (QUICKI) indexes.
Material and methods: a population-based cohort study included 494 adolescent participants, from whom socio-demographic, anthropometric, and cardiometabolic variables were assessed using the HOMA-IR and QUICKI indexes to determine the degree of association between EB and the development IR. The results were expressed in medians.
Results: the prevalence of EB was 42%. The results suggest a protective effect of EB on IR, in such a way that for each extra month of EB, the HOMA-IR index decreases in 0.32 (p = 0.005) and the index QUICKI increases in 0.70 (p = 0.008). Regarding waist circumference, body mass index and waist size index, this relationship was not significant.
Conclusion: the bivariate and multivariate analyses indicate an epidemiologically significant relationship that demonstrates a protective effect of EB on the HOMA-IR and QUICKI indexes.
Correspondencia: Doris Cristina Quintero Lesmes. Fundación Cardiovascular de Colombia. C/ 155A, 23-58. Urbanización El Bosque. Oficina Diseño y Desarrollo. Bucaramanga, Colombiae-mail: [email protected]; [email protected]
Serrano N, Robles Silva A, Suárez DP, Gamboa-Delgado E, Quintero-Lesmes DC. Relación entre la lactancia materna exclusiva los primeros seis meses de vida y el desarrollo de resistencia a la insulina en niños y adolescentes de Bucaramanga, Colombia. Nutr Hosp 2018;35(5):1042-1048
DOI: http://dx.doi.org/10.20960/nh.1754
Financiación: Proyecto subvencionado en parte por Colciencias contrato 376-2011.
Recibido: 03/01/2018 • Aceptado: 22/02/2018
©Copyright 2018 SENPE y ©Arán Ediciones S.L. Este es un artículo Open Access bajo la licencia CC BY-NC-SA (http://creativecommons.org/licenses/by-nc-sa/4.0/).

1043RELACIÓN ENTRE LA LACTANCIA MATERNA EXCLUSIVA LOS PRIMEROS SEIS MESES DE VIDA Y EL DESARROLLO DE RESISTENCIA A LA INSULINA EN NIÑOS Y ADOLESCENTES DE BUCARAMANGA, COLOMBIA
[Nutr Hosp 2018;35(5):1042-1048]
INTRODUCCIÓN
La lactancia materna exclusiva (LME) es parte fundamental de la “Estrategia Mundial para la alimentación del lactante y del niño pequeño” de la Organización Mundial de la Salud (OMS), debido a los beneficios conocidos de la lactancia como la forma natural de proporcionar un alimento ideal (1). Por este motivo, la OMS recomienda que la lactancia materna (LM) debe ser exclu-siva los primeros seis meses de vida, para lograr un crecimiento, desarrollo y salud óptimos, puesto que esta cumple a cabalidad los requerimientos nutricionales de esta etapa. Solo a partir de los seis meses de edad se recomienda introducir gradualmente alimentos sólidos como complemento a la LM. Esta estrategia mundial se soporta en que, además de los beneficios inmediatos, existe evidencia clínica que señala que los adolescentes y adultos que fueron amamantados tienen menor tendencia a desarrollar alteraciones cardiometabólicas (2).
Aunque la mayoría de los recién nacidos inician la lactancia temprana, la prevalencia mundial de LME oscila alrededor del 14% (3). Sin embargo, esta cifra varía entre países de 7,7% a 68,3%, ocurriendo lo mismo con la duración mediana de la lac-tancia, que varía de 6,3 a 21,7 meses (4). Las mayores tasas de LME las presentan los países del sur de Asia con un 60%, segui-dos por el este y sur de África, con un 57%. No se conoce con detalle cuál es la situación en los países con mayores ingresos, pero la información disponible es preocupante. En el año 2010, en Australia, alrededor del 90% de las mujeres iniciaban LM, pero a los seis meses solo el 2% continuaba con LME. En Esta-dos Unidos, en 2013, el inicio de la LM era del 76% y a los seis meses la LME se reducía hasta el 16%, mientras que en Europa, según datos de la Organización para la Cooperación y Desarrollo Económicos (OCDE) del año 2005, los mejores resultados de inicio de LM los presentaban los países nórdicos, con cifras cercanas al 100%, pero los porcentajes de LME a los seis meses disminuían por debajo del 20%, muy lejos del objetivo de la OMS (50% de LME a los seis meses) (5). Así mismo, según la Organización Panamericana de la Salud (OPS), de acuerdo a cifras disponibles para el año 2014, la prevalencia de LME en los países de América Latina y el Caribe era del 38,76%. Los países con mayores tasas fueron: Perú, con un 68%; Bolivia, con el 60%; y Argentina, con el 55%, contrario a los datos obtenidos en República Dominicana (7,7%), México (14,5%) y Cuba (26,4%) (4). En Colombia, los datos para el año 2015 indican un inicio temprano de lactancia en el 72,7% de los niños, con una prevalencia de LME del 36,1% y una mediana de duración de la lactancia de 14,4 meses (6).
Con base en estos datos epidemiológicos, es clave destacar el papel que tiene la LME en el desarrollo de alteraciones cardiome-tabólicas (7-10), tales como la resistencia a la insulina (RI). Los resultados basados en estudios observacionales han sido contro-versiales. Algunos investigadores han evidenciado la existencia de un efecto protector entre la LM y la prevención del desarrollo de RI, así como también se ha propuesto la relación entre la LM y el menor grado de desarrollo de sobrepeso u obesidad (8,9,11), siendo destacadas las publicaciones de Arenz y cols., en 2004 (12), y la revisión de literatura de Dewey en el año 2001 (13).
Con base en estos resultados, se han esbozado varias hipóte-sis acerca del papel que podría tener la LM en el desarrollo de alteraciones cardiometabólicas, las cuales incluyen mecanismos de comportamiento alimentario y mecanismos hormonales. En efecto, los lactantes alimentados con fórmulas artificiales pre-sentan concentraciones más altas de insulina. Este factor se asocia a mayor depósito de tejido adiposo, que contribuye a la ganancia de peso, siendo las altas concentraciones de insulina el resultado de la mayor cantidad de proteínas en las formulas artificiales. Así mismo, entre las hormonas presentes en la leche materna que influyen en el metabolismo y desarrollo corporal, destacan la ghrelina, la adiponectina, la resistina, la obestina y la leptina; esta última, precisamente, se sintetiza en el tejido adiposo y en las glándulas mamarias y su función consiste en regular la ingesta y el gasto energético, además de tener adi-cionalmente un efecto anorexígeno ya que activa señales de saciedad y disminuye la sensación de hambre. Por lo tanto, los niños alimentados con leche materna presentan concentracio-nes más elevadas de leptina que los alimentados con fórmulas lácteas artificiales. De la misma manera, vale la pena mencionar la acción de la adiponectina, la cual es una hormona produci-da en el tejido adiposo cuya función consiste en aumentar la sensibilidad a la insulina e incrementar el metabolismo de los ácidos grasos, con posible implicación en el crecimiento y el desarrollo infantil (14).
De igual forma, es preciso destacar la contraparte en la relación bidireccional entre la obesidad y la RI, dados los mecanismos fisiopatológicos anteriormente descritos, ya que la obesidad se considera un estado proinflamatorio que genera una cantidad importante de radicales libres, los cuales incrementan a su vez el estrés oxidativo, llevando a la interrupción de las señales de traducción de la insulina, lo que finalmente puede dar como resul-tado el establecimiento de RI (15). En síntesis, la RI y particular-mente la obesidad abdominal constituyen los principales factores de riesgo que contribuyen a las manifestaciones del denominado síndrome metabólico (7,16-18).
Por consiguiente, la creciente epidemia de obesidad infantil está asociada con un incremento en la prevalencia de enfer-medades cardiometabólicas, puesto que los niños obesos con circunferencia de cintura elevada tienen un riesgo 2,3 veces mayor de desarrollar RI y, subsecuentemente, SM en compa-ración con los niños que tienen circunferencia de cintura en rango de normalidad (7,15). No obstante, la magnitud del SM en pediatría es variable, entre el 3 y el 4% (19), dependiendo de las características de la población estudiada y de los criterios diagnósticos considerados, que en su mayoría han sido pro-puestos por la OMS, el Programa Nacional de Educación sobre el Colesterol y el Panel III de Tratamiento del Adulto (National Cholesterol Education Program-Adult Treatment Panel III [NCEP-ATP III]) y la Federación Internacional de Diabetes (International Diabetes Federation [IDF]) (7,18).
Con base en lo anteriormente expuesto, el objetivo del presente estudio consiste en evaluar la relación entre la LME los primeros seis meses de vida y el desarrollo de RI, mediante los índices HOMA-IR y QUICKI (13).

1044 N. Serrano et al.
[Nutr Hosp 2018;35(5):1042-1048]
MATERIAL Y MÉTODOS
TIPO DE ESTUDIO Y CRITERIOS DE SELECCIÓN
Se trata de un estudio de cohorte de tipo poblacional. La pobla-ción de estudio incluyó niños y niñas con edades comprendidas entre los seis y los diez años residentes de la ciudad de Bucara-manga, que hace parte de la cohorte SIMBA I: “Prevalencia de síndrome metabólico en la población de seis a diez años residente en Bucaramanga, durante el periodo comprendido entre abril de 2006 y abril de 2007.” En esta cohorte se incluyeron todos los niños y niñas entre seis y diez años con residencia mayor de un año en Bucaramanga. Además, tuvo los siguientes criterios de exclusión: antecedente de menarquia o estadio de Tanner ≥ 2, diagnóstico de diabetes mellitus u otra enfermedad endocrina y/o tratamiento hormonal en el último mes (excepto tratamiento con levotiroxina sódica).
Posteriormente, esta población fue recontactada con un 38,53% de éxito y evaluada nuevamente en el marco del estu-dio SIMBA fase II, “Ensamblaje de una cohorte para evaluar la aparición temprana de disfunción cardiovascular y metabólica en adolescentes con síndrome metabólico”, durante el periodo com-prendido entre el año 2012 y 2016. Su objetivo fue determinar la relación entre los criterios diagnósticos de SM y la aparición temprana de disfunción cardiovascular y metabólica en población adolescente, permitiendo el análisis de mayor número de factores de riesgo, tales como antecedente de LME y su relación con el desarrollo de RI asociado con el SM.
TAMAÑO DE MUESTRA
La población SIMBA fase II (2012-2016), objeto del presente estudio producto del recontacto de la muestra inicial de población en edad escolar (n = 1.282), correspondió a un total de 494 participantes en edad adolescente.
RECOLECCIÓN DE DATOS LÍNEA DE BASE
El proceso de recolección de datos se efectúo en dos fases por profesionales médicos, enfermeras y nutricionistas entrenados previamente por los investigadores del estudio.
Para la recolección de la muestra en su fase inicial (SIMBA I), se utilizaron mapas y estadísticas locales y se realizó un proceso de muestreo en dos etapas; en la primera se realizó una selección aleatoria de barrios con al menos 50 niños y en la segunda etapa se realizó una selección aleatoria de un máximo de 50 casas en cada barrio, con la debida invitación a participar en el estudio a todos los niños que cumplieron los criterios de inclusión.
Durante la primera fase (SIMBA I), llevada a cabo en el periodo comprendido entre el mes de julio de 2006 y octubre de 2007, se realizó una visita domiciliaria para la recolección de informa-ción con relación a variables sociodemográficas, nutricionales y
de actividad física, y posteriormente, una segunda visita para la realización de una completa valoración clínica y toma y análisis de muestras sanguíneas (glicemia, perfil lipídico e insulina).
La segunda fase (SIMBA II) se llevó a cabo entre los años 2012 y 2016. En ella se realizó el recontacto telefónico o mediante visita domiciliaria de 494 participantes de la cohorte inicial de 1.282 niños, mediante el cual se obtuvo información sociodemográfica de seguimiento. Así mismo, se realizaron la respectiva valoración clínica y la toma y análisis de muestras sanguíneas (glicemia, per-fil lipídico e insulina) en una institución de salud especializada en atención a eventos cardiovasculares en Bucaramanga, Colombia.
VARIABLES DE ESTUDIO
La variable dependiente de este estudio corresponde a la resis-tencia a la insulina, expresada mediante los índices:
– HOMA-IR: fue obtenido de un modelo matemático usando la siguiente fórmula: ([IF*GF]/22.5), en donde IF representa los niveles de insulina en ayunas (por sus siglas en inglés) en µU/ml y GF, los niveles de glucosa en ayunas (por sus siglas en inglés) en mmol/l). Punto de corte riesgo cardiovascular ≥ percentil 90.
– QUICKI: fue obtenido de un modelo matemático usando la siguiente formula: 1/(Log IF + Log GF), en donde Log IF representa el logaritmo de los niveles de insulina en ayunas (por sus siglas en inglés) en mUl/ml y Log GF, el logaritmo de los niveles de glucosa en ayunas en mg/dl (por sus siglas en inglés) en mg/dl. Punto de corte riesgo cardiovascular ≥ percentil 90.
Además, se analizaron los siguientes factores cardiometabó-licos:
– Glucosa alterada en ayuno ≥ 100; diabetes ≥ 126 mg/dl (Standards of Medical Care in Diabetes, ADA 2016).
– Sobrepeso u obesidad: sobrepeso = IMC para la edad (IMC/E) entre los percentiles 85 a 95%; obesidad = ≥ per-centil 95 del IMC/E (Expert Panel on Integrated Guidelines for Cardiovascular Health and Risk Reduction in Children and Adolescents. National Heart, Lung and Blood Institute, NHI. USA, 2012).
– Hipertensión arterial: presión arterial sistólica (PAS) o diastó-lica (PAD) ≥ percentil 95 para la edad, género y talla medida en tres o más ocasiones.
– Prehipertensión arterial: PAS o PAD ≥ percentil 90 < p95 para la edad, género y talla (The Fourth Report on the Diag-nosis, Evaluation and Treatment of High Blood Pressure in Children and Adolescents).
– Dislipidemia. Alteración de triglicéridos: 10-19 años, ≥ 130 mg/dl. Alteración en colesterol HDL: < 40 mg/dl. Alteración en colesterol LDL: ≥ 130 mg/dl (Expert Panel on Integrated Guidelines for Cardiovascular Health and Risk Reduction in Children and Adolescents. National Heart, Lung and Blood Institute, NHI. USA, 2012).
– Índice cintura-talla (ICT): perímetro de la cintura (cm)/estatu-ra (cm). Punto de corte obesidad abdominal ≥ 0,50.

1045RELACIÓN ENTRE LA LACTANCIA MATERNA EXCLUSIVA LOS PRIMEROS SEIS MESES DE VIDA Y EL DESARROLLO DE RESISTENCIA A LA INSULINA EN NIÑOS Y ADOLESCENTES DE BUCARAMANGA, COLOMBIA
[Nutr Hosp 2018;35(5):1042-1048]
La principal variable independiente de este estudio fue la duración de la lactancia materna exclusiva (meses). También se analizaron otras variables como:
– Variables sociodemográficas: sexo, edad, nivel socio econó-mico y lactancia materna total.
– Variables antropométricas: peso, talla, IMC, circunferencia de cintura, circunferencia de la cadera, ICT e índice cintu-ra-cadera (ICC).
CALIDAD DE LOS DATOS
La calidad de los datos fue revisada para asegurar que los datos estuvieran completos. Se realizó digitación por duplicado en el programa Excel (Microsoft Corp., Redmond, Washington) y las bases de datos fueron comparadas usando el programa Epi-Info 2000. Todas las discrepancias en las dos bases de datos fueron corregidas usando los formatos originales de captura de datos.
ANÁLISIS ESTADÍSTICO
Se realizó un análisis descriptivo en el cual las variables cate-góricas fueron presentadas como proporciones y las continuas, como mediana y rango intercuartílico, según la distribución que presentaban. Si las variables continuas tenían distribución nor-mal, las diferencias fueron determinadas usando la prueba U de Mann-Whitney. La asociación entre las variables dependientes de este estudio y las independientes fue evaluada mediante modelos de regresión lineal múltiple, así como la bondad del ajuste de cada modelo. En los modelos multivariados se mantuvieron las variables que obtuvieron una p < 0,2 en el análisis bivariado. Todos los valores de p fueron considerados a dos colas, conside-rando significancia estadística a p < 0,05. Todos los datos fueron analizados en el programa estadístico Stata, versión 14.0 (College Station, TX: Stata Corporation).
CONSIDERACIONES ÉTICAS
Este estudio fue revisado y aprobado por los miembros del Comité de Ética en Investigaciones (CEI) de la Fundación Cardio-vascular de Colombia. El consentimiento fue obtenido por parte de los participantes del estudio y/o los padres o cuidadores de los participantes y, adicionalmente, todos los menores de edad (menor de 18 años cumplidos en Colombia) dieron su asentimien-to verbal y por escrito para la realización de las pruebas.
RESULTADOS
Fueron evaluados 494 participantes, producto del recontacto de la cohorte inicial de SIMBA I (n = 1282), de los cuales el 48,58% (n = 240) eran del sexo masculino y el 51,41% (n = 254) eran del sexo femenino, con una mediana de edad de 16,64 años (RI 3,08) (Tabla I).
Con relación a la antropometría y a los valores de presión arte-rial, el 10,14% (n = 50) del total de los participantes tuvieron IMC/E en rango de sobrepeso (percentiles 85 a 95%) y el 15,82% (n = 78) tuvieron IMC/E en rango de obesidad (≥ percentil 95), p 0.003. El 42,51% de la población (n = 210) presentó riesgo de ICT (≥ 0,5), p 0,001, del cual el 58,57% fue de sexo femenino (n = 123). La mediana de PAS (mmHg) fue de 107,33 (RI 13,67) y la de PAD (mmHg) fue de 63,67 (RI 10,67). La mediana obtenida de los biomarcadores evaluados como criterios diagnósticos fue: triglicéridos (mg/dl) 79,14 (RI 49,52), p 0.223; colesterol HDL (mg/dl) 50,5 (RI 14,9), p 0,000; glucosa en ayunas 91 (RI 8,8), p < 0,0001; e insulina (µU/ml) 9,8 (RI 6,1) (Tabla I).
En cuanto al antecedente de LM, el 87% (n = 430) de las madres de los participantes respondió a esta pregunta (13% de la muestra sin información), de lss cuales el 43,27% (n = 209) res-pondió afirmativamente a la cuestión lactancia materna “exclusiva (primeros seis meses solo leche materna)”, y el restante 45,76% (n = 221) respondió de forma negativa (Tabla II).
En cuanto a los índices HOMA-IR y QUICKI, se obtuvieron las siguientes medianas y rango intercuartílico (RI): HOMA-IR 2,05 (RI 1,56) y QUICKI 0,33 (RI 0,03).
Finalmente, se encontró que por cada mes de duración de la lactancia materna exclusiva se disminuye en 0,32 el HOMA-IR y aumenta en un 0,70 el QUICKI. Para la circunferencia de cintura, el IMC y el ICT esta relación no fue significativa (Tabla III).
DISCUSIÓN
Los resultados en una muestra de adolescentes colombianos residentes en la ciudad de Bucaramanga muestran una prevalen-cia de LME del 42%. La LME sugiere un efecto protector sobre la resistencia a la insulina; por cada mes más de duración de LME, disminuye en 0,32 (p = 0,005) el índice HOMA-IR y aumenta en 0,70 (p = 0,008) el índice QUICKI.
Nuestros resultados son similares a los obtenidos en otras poblaciones latinoamericanas y europeas (13,20-22). Resulta-dos similares han sido recientemente publicados para población china, para la cual se encontró asociación como efecto protector entre la LME (por los primeros tres meses de vida) con el índice HOMA-IR y los bajos niveles de insulina (23). Así mismo, en una publicación realizada por Wang J y cols. derivada de un trabajo realizado en el sur de China, se concluyó una relación inversa-mente proporcional entre la LME mayor a seis meses y la asocia-ción con SM, en una población de 1.770 de niños y adolescentes de entre siete y 17 años de edad (24).
El estudio SIMBA es una cohorte que ha sido evaluada durante más de diez años, condición que aporta mayor fiabilidad a los resultados obtenidos. Por otro lado, se emplearon los índices de medición de RI de mayor uso en la práctica clínica, por lo que los resultados pueden ser extrapolados a la práctica clínica. A pesar de no ser estos índices el estándar de oro para el diagnóstico de RI (clamp hiperinsulinémico-euglucémico), sí son los de mayor aplicación en la práctica clínica, por tratarse de métodos sencillos que se derivan de la interacción de la función de la célula β pan-

1046 N. Serrano et al.
[Nutr Hosp 2018;35(5):1042-1048]
creática y la sensibilidad a la insulina en un modelo matemático donde se utilizan las concentraciones de glucosa e insulina en ayuno (25).
Dentro de las limitaciones del estudio, vale la pena mencionar que aún no existe consenso en cuanto a los puntos de corte en las mediciones y análisis del índice QUICKI. Además, existe la posibilidad de errores en la clasificación de LME debido al sesgo de memoria de la madre.
El presente estudio evidencia una asociación entre el efecto protector de la LME y la ausencia de desarrollo de RI soportada en la correlación con el índice HOMA-IR. Estos resultados soportan y ratifican la importancia en el desarrollo de políticas de salud
Tabla I. Descripción de las características sociodemográficas, estado nutricional y factores de riesgo cardiometabólico
CaracterísticasTodosn = 494n (%)
Mujeresn = 254n (%)
Hombresn = 240n (%)
p
Nivel socioeconómico
Bajo 296 (59.92) 156 (61.42) 140 (58.33) 0.714*
Medio 193 (39.07) 96 (37.80) 97 (40.42)
Alto 5 (1.01) 2 (0.79) 3 (1.25)
Estado nutricional según IMC/E
Bajo peso (< -2 DE IMC/E) 65 (13.18) 28 (11.02) 37 (15.48) 0.003†
Peso normal (-2-0.99 DE IMC/E) 300 (60.85) 160 (62.99) 140 (58.58)
Sobrepeso (1-1.99 DE IMC/E) 50 (10.14) 29 (11.42) 21 (8.79)
Obesidad (≥ 2 DE IMC/E) 78 (15.82) 37 (14.57) 41 (17.15)
Edad (años) (mediana [RI]) 16.64 (3.08) 16.58 (3.2) 16.66 (2.91) 0.469†
Talla (cm) (mediana [RI]) 163.02 (12.9) 158.5 (7.55) 169.87 (8.65) 0.000†
Peso (kg) (mediana [RI]) 56.8 (17.8) 53.1 (14.2) 60.37 (17.15) 0.000†
Circunferencia de cintura (cm) (mediana [RI]) 74.8 (12.1) 73.7 (11.1) 75.7 (13.25) 0.003†
Circunferencia de la cadera (cm) (mediana [RI]) 92 (12.35) 93.35 (11) 91.25 (13) 0.007†
Índice cintura-cadera (mediana [RI]) 0.81 (0.11) 0.79 (0.11) 0.83 (0.09) 0.000†
Índice cintura-talla (mediana [RI]) 0.45 (0.07) 0.46 (0.07) 0.44 (0.07) 0.001†
Colesterol total (mg/dl) (mediana [RI]) 156.65 (36.3) 158.1 (37.8) 155.4 (36.3) 0.074†
Colesterol LDL (mg/dl) (mediana [RI]) 92 (33) 95.84 (27.47) 92.17 (25.68) 0.215†
Colesterol HDL (mg/dl) (mediana [RI]) 47.70 (15.1) 50.5 (14.9) 44.4 (14.66) 0.000†
Triglicéridos (mg/dl) (mediana [RI]) 79.14 (49.52) 78.17 (45.06) 81 (52.68) 0.223†
Glucosa en ayunas (mg/dl) (mediana [RI]) 91 (8.8) 89.79 (6.06) 93.08 (7.00) 0.000†
Insulina (µU/ml) (mediana [RI]) 9.8 (6.1) 10.75 (5.6) 8.78 (6.3) 0.000†
HOMA-IR (uUI/ml) (mediana [RI]) 2.05 (1.56) 2.03 (1.46) 2.08 (1.61) 0.006†
Índice QUICKI (mediana [RI]) 0.33 (0.03) 0.33 (0.02) 0.34 (0.03) 0.000†
Presión arterial sistólica (mmHg) (mediana [RI]) 107.33 (13.67) 103.33 (10) 114 (15) 0.000†
Presión arterial diastólica (mmHg) (mediana [RI]) 63.67 (10.67) 63.33 (9.66) 64.16 (11.67) 0.024†
IMC/E: índice de masa corporal para la edad; RI: rango intercuartílico; LDL: lipoproteínas de baja densidad; HDL: lipoproteínas de alta densidad; HOMA: Homeostasis Model Assessment; QUICKI: índice cuantitativo de comprobación de la sensibilidad de la insulina. *Valor p determinado mediante prueba exacta de Fisher. †Valor p determinado mediante prueba U de Mann-Whitney.
Tabla II. Antecedente de lactancia materna exclusiva
Lactancia materna exclusiva
Todosn = 494
Mujeresn = 254
Hombresn = 240
p
n (%) n (%) n (%)
No221
(45.76)104 (44.83) 117 (46.61) 0.963*
Sí209
(43.27)100 (43.10) 109 (43.43)
*Valor p determinado mediante prueba Chi-cuadrado.
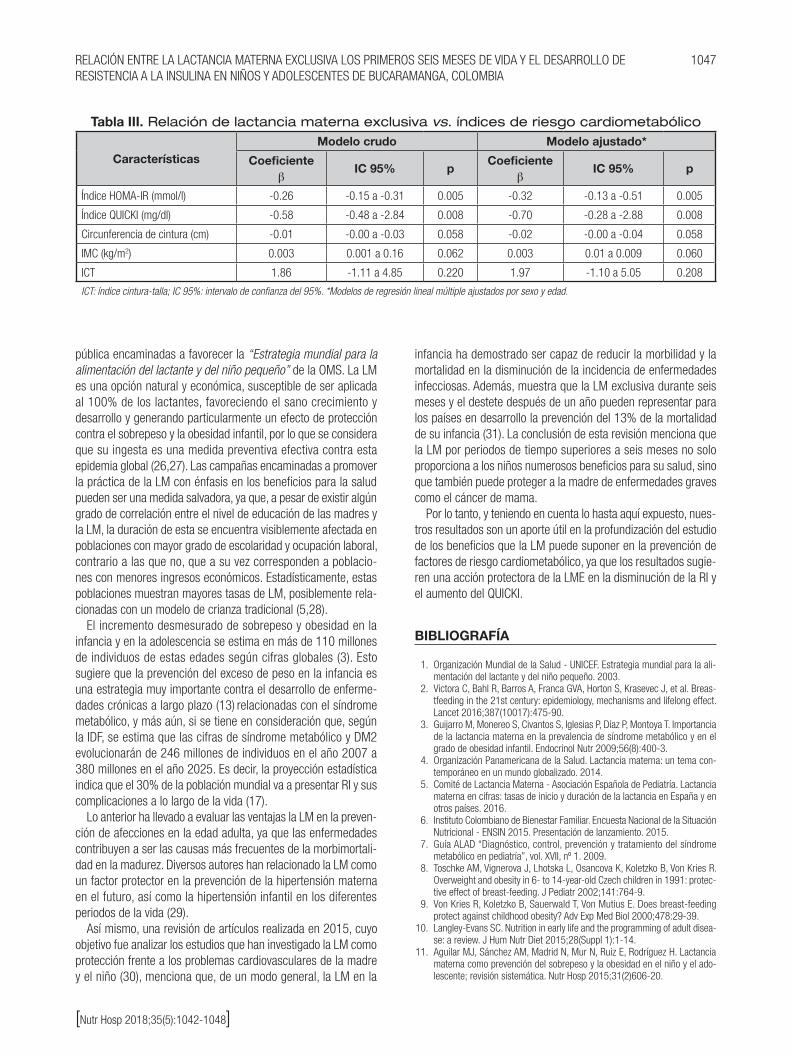
1047RELACIÓN ENTRE LA LACTANCIA MATERNA EXCLUSIVA LOS PRIMEROS SEIS MESES DE VIDA Y EL DESARROLLO DE RESISTENCIA A LA INSULINA EN NIÑOS Y ADOLESCENTES DE BUCARAMANGA, COLOMBIA
[Nutr Hosp 2018;35(5):1042-1048]
pública encaminadas a favorecer la “Estrategia mundial para la alimentación del lactante y del niño pequeño” de la OMS. La LM es una opción natural y económica, susceptible de ser aplicada al 100% de los lactantes, favoreciendo el sano crecimiento y desarrollo y generando particularmente un efecto de protección contra el sobrepeso y la obesidad infantil, por lo que se considera que su ingesta es una medida preventiva efectiva contra esta epidemia global (26,27). Las campañas encaminadas a promover la práctica de la LM con énfasis en los beneficios para la salud pueden ser una medida salvadora, ya que, a pesar de existir algún grado de correlación entre el nivel de educación de las madres y la LM, la duración de esta se encuentra visiblemente afectada en poblaciones con mayor grado de escolaridad y ocupación laboral, contrario a las que no, que a su vez corresponden a poblacio-nes con menores ingresos económicos. Estadísticamente, estas poblaciones muestran mayores tasas de LM, posiblemente rela-cionadas con un modelo de crianza tradicional (5,28).
El incremento desmesurado de sobrepeso y obesidad en la infancia y en la adolescencia se estima en más de 110 millones de individuos de estas edades según cifras globales (3). Esto sugiere que la prevención del exceso de peso en la infancia es una estrategia muy importante contra el desarrollo de enferme-dades crónicas a largo plazo (13) relacionadas con el síndrome metabólico, y más aún, si se tiene en consideración que, según la IDF, se estima que las cifras de síndrome metabólico y DM2 evolucionarán de 246 millones de individuos en el año 2007 a 380 millones en el año 2025. Es decir, la proyección estadística indica que el 30% de la población mundial va a presentar RI y sus complicaciones a lo largo de la vida (17).
Lo anterior ha llevado a evaluar las ventajas la LM en la preven-ción de afecciones en la edad adulta, ya que las enfermedades contribuyen a ser las causas más frecuentes de la morbimortali-dad en la madurez. Diversos autores han relacionado la LM como un factor protector en la prevención de la hipertensión materna en el futuro, así como la hipertensión infantil en los diferentes periodos de la vida (29).
Así mismo, una revisión de artículos realizada en 2015, cuyo objetivo fue analizar los estudios que han investigado la LM como protección frente a los problemas cardiovasculares de la madre y el niño (30), menciona que, de un modo general, la LM en la
infancia ha demostrado ser capaz de reducir la morbilidad y la mortalidad en la disminución de la incidencia de enfermedades infecciosas. Además, muestra que la LM exclusiva durante seis meses y el destete después de un año pueden representar para los países en desarrollo la prevención del 13% de la mortalidad de su infancia (31). La conclusión de esta revisión menciona que la LM por periodos de tiempo superiores a seis meses no solo proporciona a los niños numerosos beneficios para su salud, sino que también puede proteger a la madre de enfermedades graves como el cáncer de mama.
Por lo tanto, y teniendo en cuenta lo hasta aquí expuesto, nues-tros resultados son un aporte útil en la profundización del estudio de los beneficios que la LM puede suponer en la prevención de factores de riesgo cardiometabólico, ya que los resultados sugie-ren una acción protectora de la LME en la disminución de la RI y el aumento del QUICKI.
BIBLIOGRAFÍA
1. Organización Mundial de la Salud - UNICEF. Estrategia mundial para la ali-mentación del lactante y del niño pequeño. 2003.
2. Victora C, Bahl R, Barros A, Franca GVA, Horton S, Krasevec J, et al. Breas-tfeeding in the 21st century: epidemiology, mechanisms and lifelong effect. Lancet 2016;387(10017):475-90.
3. Guijarro M, Monereo S, Civantos S, Iglesias P, Díaz P, Montoya T. Importancia de la lactancia materna en la prevalencia de síndrome metabólico y en el grado de obesidad infantil. Endocrinol Nutr 2009;56(8):400-3.
4. Organización Panamericana de la Salud. Lactancia materna: un tema con-temporáneo en un mundo globalizado. 2014.
5. Comité de Lactancia Materna - Asociación Española de Pediatría. Lactancia materna en cifras: tasas de inicio y duración de la lactancia en España y en otros países. 2016.
6. Instituto Colombiano de Bienestar Familiar. Encuesta Nacional de la Situación Nutricional - ENSIN 2015. Presentación de lanzamiento. 2015.
7. Guía ALAD “Diagnóstico, control, prevención y tratamiento del síndrome metabólico en pediatría”, vol. XVII, nº 1. 2009.
8. Toschke AM, Vignerova J, Lhotska L, Osancova K, Koletzko B, Von Kries R. Overweight and obesity in 6- to 14-year-old Czech children in 1991: protec-tive effect of breast-feeding. J Pediatr 2002;141:764-9.
9. Von Kries R, Koletzko B, Sauerwald T, Von Mutius E. Does breast-feeding protect against childhood obesity? Adv Exp Med Biol 2000;478:29-39.
10. Langley-Evans SC. Nutrition in early life and the programming of adult disea-se: a review. J Hum Nutr Diet 2015;28(Suppl 1):1-14.
11. Aguilar MJ, Sánchez AM, Madrid N, Mur N, Ruiz E, Rodríguez H. Lactancia materna como prevención del sobrepeso y la obesidad en el niño y el ado-lescente; revisión sistemática. Nutr Hosp 2015;31(2)606-20.
Tabla III. Relación de lactancia materna exclusiva vs. índices de riesgo cardiometabólico
CaracterísticasModelo crudo Modelo ajustado*
Coeficienteβ
IC 95% pCoeficiente
βIC 95% p
Índice HOMA-IR (mmol/l) -0.26 -0.15 a -0.31 0.005 -0.32 -0.13 a -0.51 0.005
Índice QUICKI (mg/dl) -0.58 -0.48 a -2.84 0.008 -0.70 -0.28 a -2.88 0.008
Circunferencia de cintura (cm) -0.01 -0.00 a -0.03 0.058 -0.02 -0.00 a -0.04 0.058
IMC (kg/m2) 0.003 0.001 a 0.16 0.062 0.003 0.01 a 0.009 0.060
ICT 1.86 -1.11 a 4.85 0.220 1.97 -1.10 a 5.05 0.208
ICT: índice cintura-talla; IC 95%: intervalo de confianza del 95%. *Modelos de regresión lineal múltiple ajustados por sexo y edad.

1048 N. Serrano et al.
[Nutr Hosp 2018;35(5):1042-1048]
12. Arenz S, Rückerl R, Koletzko B, Von Kries R. Breastfeeding and childhood obesity. Int J Obesity 2004;28(10)1247-56.
13. Grummer-Strawn L, Mei Z. Does breastfeeding protect against pediatric overwei-ght? Analysis of longitudinal data from the Centers for Disease Control and Pre-vention Pediatric Nutrition Surveillance System. Pediatrics 2004;113(2):81-6.
14. García B, García C, Jiménez C, González A, Calvo C, Alcázar MJ, et al. Índice HOMA y QUICKI, insulina y péptido C en niños sanos. Puntos de corte de riesgo cardiovascular. An Pediatr (Barc) 2007;66(5):481-90.
15. Venzano M, Ramírez L. Resistencia a la insulina en niños y adolescentes con obesidad de Asunción, Paraguay. Rev Salud Pública Parag 2013;3(1):23-9.
16. Laclaustra M, Bergua C, Pascual I, Casasnovas J. Síndrome metabólico. Concepto y fisiopatología. Rev Esp Cardiol 2005;5:3-10.
17. Ros Pérez M, Medina-Gómez G. Obesidad, adipogénesis y resistencia a la insulina. Endocrinol Nutr 2011;58(7):360-9.
18. Grundy S, Brewer H, Cleeman J, Smith S, Lenfant C. Definition of metabolic syndrome. Circulation 2004;109:433-8.
19. Barrera J, Llanas J. Epidemiología del síndrome metabólico en pediatría. Evidencia Médica Investigación Salud 2013;6(3):89-94.
20. González R, Llapur R, Rubio D. Caracterización de la obesidad en los adoles-centes. Rev Cubana Pediatr 2009;81(2).
21. Kwok MK, Schooling CM, Lam TH, Leung GM. Does breastfeeding protect against childhood overweight? Hong Kong’s “Children of 1997” birth cohort. Int J Epidemiol 2010;39(1):297-305.
22. Shields L, Mamun AA, O’Callaghan M, Williams GM, Najman JM. Breastfeeding and obesity at 21 years: a cohort study. J Clin Nurs 2010;19(11-12):1612-7.
23. Hui LL, Kwok MK, Nelson EAS, Lee SL, Leung GM, Schooling CM. The association of breastfeeding with insulin resistance at 17 years: prospecti-
ve observations from Hong Kong’s “Children of 1997” birth cohort. Matern Child Nutr 2017;e12490.
24. Wang J, Zhu Y, Cai L, Jing J, Chen Y, Mai J, et al. Metabolic syndro-me and its associated early-life factors in children and adolescents: a cross-sectional study in Guangzhou, China. Public Health Nutr 2016;19(7):1147-54.
25. Martínez A, Maldonado J, López M. Métodos diagnósticos de la resis-tencia a la insulina en la población pediátrica. Bol Med Hosp Infant Mex 2011;68(5):397-404.
26. Organización Mundial de la Salud (OMS). La Comisión para acabar con la obesidad infantil insta a adoptar medidas de alto nivel para hacer frente a un importante problema sanitario. Ginebra: OMS; 2016.
27. Li L, Parsons TJ, Power C. Breast feeding and obesity in childhood: cross sectional study. BMJ 2003;327:904-5.
28. Choi BY, Lee DC, Chun EH, Lee JY. The relationship between metabolic syn-drome and childhood maternal education level, job status findings from the Korean National Health and Nutrition Examination, 2007-2009. Korean J Fam Med 2014;35(4):207-15.
29. Owen CG, Whincup PH, Cook DG. Breast-feeding and cardiovascular risk factors and outcomes in later life: evidence from epidemiological studies. Proc Nutr Soc 2011;70(4):478-84. DOI: 10.1017/S0029665111000590
30. Aguilar MJ, Madrid N, Baena L, Mur Villar N, Guisado R, Sánchez AM. Lactancia materna como método para prevenir alteraciones cardiovascu-lares en la madre y el niño. Nutr Hosp 2015;31:1936-46. DOI:10.3305/nh.2015.31.5.8810.
31. Naviglio S, Ventura A. The science of breastfeeding: time for a change? Acta Paediatr 2013;102(8):797-8. DOI: 10.1111/ apa.12269. ISSN 0803-5253.)

NutriciónHospitalaria
Trabajo Original Pediatría
ISSN (electrónico): 1699-5198 - ISSN (papel): 0212-1611 - CODEN NUHOEQ S.V.R. 318
Asociación entre conducta alimentaria y estado nutricional en preescolares chilenosAssociation between eating behavior and nutritional status in Chilean preschoolers
Fabiola Henríquez Konings1, Fabián Lanuza Rilling1,2, Luis Bustos Medina3,4, Andrea González San Martín1 y Julia Hazbún Game1
Departamentos de 1Pediatría y Cirugía Infantil y 4Salud Pública. Facultad de Medicina. Universidad de La Frontera. Temuco, Chile. 2EPICYN - Centro de Epidemiología Cardiovascular y Nutricional. Universidad de La Frontera. Temuco, Chile. 3CIGES - Centro de Excelencia, Capacitación, Investigación y Gestión para la Salud. Universidad de La Frontera. Temuco, Chile
Palabras clave:
Conducta alimentaria. Estado nutricional. Obesidad. Preescolares.
ResumenIntroducción: la conducta alimentaria se asocia con el estado nutricional en edades tempranas. Sin embargo, en Chile aún no existen estudios que evalúen esta relación en la etapa preescolar.
Objetivo: asociar el estado nutricional y la conducta alimentaria de preescolares chilenos.
Método: estudio de corte transversal en 247 preescolares (2-4 años) de la Región de la Araucanía, Chile. Se evaluó el estado nutricional a través del índice antropométrico peso/talla y perímetro de cintura/edad. Se aplicó la encuesta Child Eating Behaviour Questionnaire (CEBQ) a las madres para evaluar la conducta alimentaria de sus hijos.
Resultados: ciento treinta fueron hombres y 117 fueron mujeres, con una malnutrición por exceso del 58,6% y 49,6%, respectivamente. Las puntuaciones de conducta alimentaria (CA) proingesta presentaron una asociación positiva y significativa con el estado nutricional y la dimensión respuesta a los alimentos. En cuanto a las puntuaciones de CA antiingesta, se observó una tendencia inversa no significativa con el estado nutricional; sin embargo, existe una asociación negativa y significativa en las dimensiones respuesta a la saciedad y lentitud para comer.
Conclusión: la conducta alimentaria proingesta se asocia directamente con el estado nutricional y la conducta antiingesta, de manera inversa solo con ciertas dimensiones.
Key words:
Eating behavior. Nutritional status. Obesity. Preschools.
AbstractIntroduction: the eating behavior is associated with the nutritional status at early ages. However, in Chile there are still no studies that evaluate this relationship in the preschool stage.
Objective: to associate the nutritional status and eating behavior of Chilean preschoolers.
Methods: cross-sectional study in 247 preschoolers (2-4 years) from the region of Araucanía, Chile. The nutritional status was evaluated through the anthropometric index weight/height and waist circumference/age. The Child Eating Behavior Questionnaire (CEBQ) survey was applied to mothers to assess their children’s eating.
Results: one hundred and thirty were men and 117 were women with an overweight/obese percentage of 58.6% and 49.6%, respectively. Eating behavior scores pro-intake (food approach) have a positive and significant association with nutritional status) and in the food responsiveness sub-scale in the total sample. Regarding the anti-intake score (food avoidant), an inverse trend with nutritional status is shown; however, there is a negative and significant association in the satiety responsiveness scale and slowness in eating.
Conclusion: the pro-intake eating behavior is directly associated with nutritional status, and anti-ingest score is inversely related only to certain sub-scales.
Correspondencia: Fabiola Henríquez Konings. Departamento de Pediatría y Cirugía Infantil. Facultad de Medicina. Universidad de La Frontera. Av. Francisco Salazar, 01145. Casilla 54-D. Temuco, Chilee-mail: [email protected]
Henríquez Konings F, Lanuza Rilling Fabián, Bustos Medina L, González San Martín A, Hazbún Game J. Asociación entre conducta alimentaria y estado nutricional en preescolares chilenos. Nutr Hosp 2018;35(5):1049-1053
DOI: http://dx.doi.org/10.20960/nh.1803
Autoría: FH y FL contribuyeron de igual manera al manuscrito, por ende son considerados como primer autor compartido.
Recibido: 25/01/2018 • Aceptado: 01/03/2018
©Copyright 2018 SENPE y ©Arán Ediciones S.L. Este es un artículo Open Access bajo la licencia CC BY-NC-SA (http://creativecommons.org/licenses/by-nc-sa/4.0/).
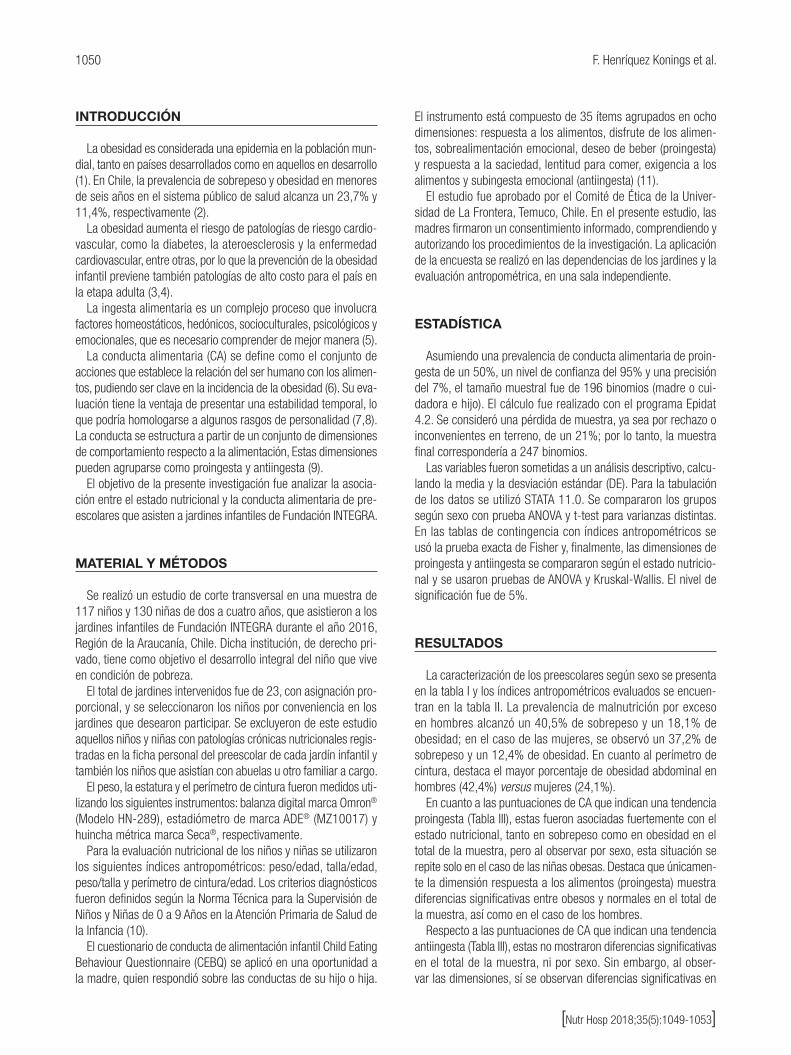
1050 F. Henríquez Konings et al.
[Nutr Hosp 2018;35(5):1049-1053]
INTRODUCCIÓN
La obesidad es considerada una epidemia en la población mun-dial, tanto en países desarrollados como en aquellos en desarrollo (1). En Chile, la prevalencia de sobrepeso y obesidad en menores de seis años en el sistema público de salud alcanza un 23,7% y 11,4%, respectivamente (2).
La obesidad aumenta el riesgo de patologías de riesgo cardio-vascular, como la diabetes, la ateroesclerosis y la enfermedad cardiovascular, entre otras, por lo que la prevención de la obesidad infantil previene también patologías de alto costo para el país en la etapa adulta (3,4).
La ingesta alimentaria es un complejo proceso que involucra factores homeostáticos, hedónicos, socioculturales, psicológicos y emocionales, que es necesario comprender de mejor manera (5).
La conducta alimentaria (CA) se define como el conjunto de acciones que establece la relación del ser humano con los alimen-tos, pudiendo ser clave en la incidencia de la obesidad (6). Su eva-luación tiene la ventaja de presentar una estabilidad temporal, lo que podría homologarse a algunos rasgos de personalidad (7,8). La conducta se estructura a partir de un conjunto de dimensiones de comportamiento respecto a la alimentación, Estas dimensiones pueden agruparse como proingesta y antiingesta (9).
El objetivo de la presente investigación fue analizar la asocia-ción entre el estado nutricional y la conducta alimentaria de pre-escolares que asisten a jardines infantiles de Fundación INTEGRA.
MATERIAL Y MÉTODOS
Se realizó un estudio de corte transversal en una muestra de 117 niños y 130 niñas de dos a cuatro años, que asistieron a los jardines infantiles de Fundación INTEGRA durante el año 2016, Región de la Araucanía, Chile. Dicha institución, de derecho pri-vado, tiene como objetivo el desarrollo integral del niño que vive en condición de pobreza.
El total de jardines intervenidos fue de 23, con asignación pro-porcional, y se seleccionaron los niños por conveniencia en los jardines que desearon participar. Se excluyeron de este estudio aquellos niños y niñas con patologías crónicas nutricionales regis-tradas en la ficha personal del preescolar de cada jardín infantil y también los niños que asistían con abuelas u otro familiar a cargo.
El peso, la estatura y el perímetro de cintura fueron medidos uti-lizando los siguientes instrumentos: balanza digital marca Omron® (Modelo HN-289), estadiómetro de marca ADE® (MZ10017) y huincha métrica marca Seca®, respectivamente.
Para la evaluación nutricional de los niños y niñas se utilizaron los siguientes índices antropométricos: peso/edad, talla/edad, peso/talla y perímetro de cintura/edad. Los criterios diagnósticos fueron definidos según la Norma Técnica para la Supervisión de Niños y Niñas de 0 a 9 Años en la Atención Primaria de Salud de la Infancia (10).
El cuestionario de conducta de alimentación infantil Child Eating Behaviour Questionnaire (CEBQ) se aplicó en una oportunidad a la madre, quien respondió sobre las conductas de su hijo o hija.
El instrumento está compuesto de 35 ítems agrupados en ocho dimensiones: respuesta a los alimentos, disfrute de los alimen-tos, sobrealimentación emocional, deseo de beber (proingesta) y respuesta a la saciedad, lentitud para comer, exigencia a los alimentos y subingesta emocional (antiingesta) (11).
El estudio fue aprobado por el Comité de Ética de la Univer-sidad de La Frontera, Temuco, Chile. En el presente estudio, las madres firmaron un consentimiento informado, comprendiendo y autorizando los procedimientos de la investigación. La aplicación de la encuesta se realizó en las dependencias de los jardines y la evaluación antropométrica, en una sala independiente.
ESTADÍSTICA
Asumiendo una prevalencia de conducta alimentaria de proin-gesta de un 50%, un nivel de confianza del 95% y una precisión del 7%, el tamaño muestral fue de 196 binomios (madre o cui-dadora e hijo). El cálculo fue realizado con el programa Epidat 4.2. Se consideró una pérdida de muestra, ya sea por rechazo o inconvenientes en terreno, de un 21%; por lo tanto, la muestra final correspondería a 247 binomios.
Las variables fueron sometidas a un análisis descriptivo, calcu-lando la media y la desviación estándar (DE). Para la tabulación de los datos se utilizó STATA 11.0. Se compararon los grupos según sexo con prueba ANOVA y t-test para varianzas distintas. En las tablas de contingencia con índices antropométricos se usó la prueba exacta de Fisher y, finalmente, las dimensiones de proingesta y antiingesta se compararon según el estado nutricio-nal y se usaron pruebas de ANOVA y Kruskal-Wallis. El nivel de significación fue de 5%.
RESULTADOS
La caracterización de los preescolares según sexo se presenta en la tabla I y los índices antropométricos evaluados se encuen-tran en la tabla II. La prevalencia de malnutrición por exceso en hombres alcanzó un 40,5% de sobrepeso y un 18,1% de obesidad; en el caso de las mujeres, se observó un 37,2% de sobrepeso y un 12,4% de obesidad. En cuanto al perímetro de cintura, destaca el mayor porcentaje de obesidad abdominal en hombres (42,4%) versus mujeres (24,1%).
En cuanto a las puntuaciones de CA que indican una tendencia proingesta (Tabla III), estas fueron asociadas fuertemente con el estado nutricional, tanto en sobrepeso como en obesidad en el total de la muestra, pero al observar por sexo, esta situación se repite solo en el caso de las niñas obesas. Destaca que únicamen-te la dimensión respuesta a los alimentos (proingesta) muestra diferencias significativas entre obesos y normales en el total de la muestra, así como en el caso de los hombres.
Respecto a las puntuaciones de CA que indican una tendencia antiingesta (Tabla III), estas no mostraron diferencias significativas en el total de la muestra, ni por sexo. Sin embargo, al obser-var las dimensiones, sí se observan diferencias significativas en

1051ASOCIACIÓN ENTRE CONDUCTA ALIMENTARIA Y ESTADO NUTRICIONAL EN PREESCOLARES CHILENOS
[Nutr Hosp 2018;35(5):1049-1053]
la dimensión respuesta a la saciedad entre los normales con sobrepeso y normales con obesidad en el total de la muestra. La dimensión lentitud para comer (antiingesta) muestra diferencia significativa entre los normales y los obesos, tanto en el total de la muestra como también en el caso de las niñas. En el caso de los niños no hubo diferencias significativas en ninguna dimensión antiingesta.
DISCUSIÓN
La población estudiada muestra un alto porcentaje de sobrepe-so y obesidad en ambos sexos, destacando un mayor porcentaje de malnutrición por exceso y obesidad abdominal en hombres. Estos resultados concuerdan con lo encontrado en otras investi-gaciones en las cuales niños pertenecientes a familias de meno-res ingresos presentan mayores porcentajes de malnutrición por exceso (12,13).
Existen diversos estudios que han aplicado el CEBQ a pobla-ción infantil, mostrando una directa relación entre dimensiones proingesta y obesidad (14).
La mayoría de estos estudios se han realizado en población escolar y solo recientemente han aparecido estudios en preesco-lares, donde se ha replicado la estructura original del CEBQ vali-dando su uso en grupos etarios más pequeños, lo que permitiría evaluar la conducta alimentaria a más temprana edad con el fin de poder pesquisar en forma precoz conductas proingesta y, así, intentar realizar acciones de prevención antes de la edad escolar (15). Sin embargo, no hay estudios aún que evalúen la conducta alimentaria en preescolares chilenos.
Al analizar los puntajes de proingesta en el total de la muestra y según sexo, se observó una relación directamente proporcional en la dimensión respuesta a los alimentos y estado nutricional, situa-ción que puede ser explicada por una alteración en la regulación de la ingesta alimentaria influenciada tanto por señales internas como externas (5,16). Un estudio evaluó la conducta alimentaria en 294 escolares chilenos de seis a 12 años, confirmando la mis-ma tendencia y asociación encontrada en este estudio en cuanto a la relación directa e inversa de las dimensiones proingesta y antiingesta, respectivamente. Sin embargo, no hubo diferencias significativas en todas las dimensiones de conducta alimentaria en ambos estudios (11).
Tabla I. Caracterización de los preescolares según sexo
VariablesHombres
X ± DE (n)Mujeres
X ± DE (n)p
Edades (años) 3,24 ± 0,63 (117) 3,23 ± 0,65 (130) 0,8768*
Peso (kg) 16,36 ± 2,31 (117) 15,81 ± 2,80 (130) 0,0927†
Talla (m) 0,97 ± 0,11 (117) 0,95 ± 0,11 (130) 0,2715*
PC (cm) 52,55 ± 6,39 (114) 52,86 ± 6,67 (125) 0,7132*
X: promedio; DE: desviación estándar; n: total de la muestra; PC: perímetro de cintura. *Prueba ANOVA. †Prueba t-test para varianzas distintas.
Tabla II. Índices antropométricos de los preescolares según sexo
VariablesHombres
frecuencia/totalMujeres
frecuencia/totalp*
PC/Edad Con ob. abd. Sin ob. abd.
48/11365/113
30/12494/124
0,004
PT/Edad Normal Sobrepeso Obesidad
48/11647/11621/116
65/12948/12916/129
0,298
T/Edad Normal Talla baja Talla alta
108/1163/1165/116
121/1293/1295/129
1
PC: perímetro de cintura; ob. abd.: obesidad abdominal; PT: peso-talla; T: talla. *Prueba exacta de Fisher. Cabe mencionar que en la toma de datos antropométricos no se logró medir el perímetro de cintura para todos los niños y niñas.

1052 F. Henríquez Konings et al.
[Nutr Hosp 2018;35(5):1049-1053]
Tabla III. Dimensiones de proingesta y antiingesta de los preescolares según estado nutricional
NormalX ± DE (n)
SobrepesoX ± DE (n)
ObesidadX ± DE (n)
p
Total
Proingesta 10,63 ± 2,45abc 11,33 ± 2,01b 12,10 ± 2,72c 0,0026*
Disfrute de los alimentos 3,30 ± 0,84 3,51 ± 0,76 3,43 ± 0,82 0,1742*
Respuesta a los alimentos 2,01 ± 0,85ac 2,24 ± 0,86b 2,59 ± 1,12c 0,0031*
Sobrealimentación emocional 1,88 ± 0,69 1,91 ± 0,65 2,24 ± 0,94 0,1721†
Deseo de beber 3,42 ± 1,16 3,65 ± 0,91 3,83 ± 1,03 0,0799*
Antiingesta 12,33 ± 2,24 11,76 ± 2,05 11,80 ± 2,01 0,1280*
Respuesta a la saciedad 3,39 ± 0,61abc 3,09 ± 0,63b 3,08 ± 0,75c 0,0020*
Lentitud para comer 3,31 ± 0,81ac 3,1 ± 0,74b 2,84 ± 0,67c 0,0039*
Subalimentación emocional 2,70 ± 0,97 2,69 ± 0,85 2,93 ± 0,84 0,3381*
Exigencia a los alimentos 2,92 ± 0,80 2,86 ± 0,77 2,94 ± 0,80 0,8121*
Niños
Proingesta 10,82 ± 2,51 11,43 ± 2,01 12,07 ± 2,70 0,1203*
Disfrute de los alimentos 3,38 ± 0,86 3,56 ± 0,73 3,28 ± 0,88 0,3394*
Respuesta a los alimentos 1,97 ± 0,78ac 2,30 ± 0,87b 2,62 ± 1,06c 0,0149*
Sobrealimentación emocional 1,85 ± 0,63 1,93 ± 0,64 2,28 ± 0,96 0,0666†
Deseo de beber 3,61 ± 1,23 3,62 ± 0,89 3,87 ± 0,91 0,6134
Antiingesta 12,30 ± 2,17 11,40 ± 2,17 11,90 ± 2,28 0,1390*
Respuesta a la saciedad 3,40 ± 0,59 3,00 ± 0,64 3,01 ± 0,75 0,4270*
Lentitud para comer 3,23 ± 0,77 2,96 ± 0,76 2,94 ± 0,66 0,7340*
Subalimentación emocional 2,73 ± 0,84 2,68 ± 0,88 2,90 ± 0,94 0,8610*
Exigencia a los alimentos 2,93 ± 0,83 2,74 ± 0,77 3,03 ± 0,84 0,3134*
Niñas
Proingesta 10,48 ± 2,41ac 11,23 ± 2,02b 12,15 ± 2,84c 0,0260*
Disfrute de los alimentos 3,24 ± 0,82 3,45 ± 0,80 3,62 ± 0,71 0,1601*
Respuesta a los alimentos 2,05 ± 0,90 2,19 ± 0,86 2,55 ± 1,23 0,1622*
Sobrealimentación emocional 1,90 ± 0,72 1,90 ± 0,66 2,18 ± 0,93 0,3629*
Deseo de beber 3,28 ± 1,09 3,68 ± 1,93 3,79 ± 1,21 0,0709*
Antiingesta 12,35 ± 2,31 12,11 ± 1,89 11,67 ± 1,65 0,4961*
Respuesta a la saciedad 3,38 ± 0,64 3,19 ± 0,62 3,16 ± 0,78 0,2209*
Lentitud para comer 3,36 ± 0,83ac 3,22 ± 0,70b 2,71 ± 0,67c 0,0124*
Subalimentación emocional 2,67 ± 1,05 2,70 ± 0,84 2,98 ± 0,72 0,5016*
Exigencia a los alimentos 2,92 ± 0,77 2,98 ± 0,76 2,81 ± 0,74 0,7379*
X: promedio; DE: desviación estándar; n: total de la muestra; PC: perímetro de cintura. *ANOVA, †Kruskal Wallis. aNormalidad. bSobrepeso. cObesidad.
En el análisis de los puntajes antiingesta, en el total de la muestra y por sexo se observó una relación inversa en la dimensión lentitud para comer y el estado nutricional. Este comportamiento puede estar asociado a una mayor ansiedad al momento de ingerir alimentos o bien a conductas compulsivas compensatorias (8), lo cual podría relacionarse con la influencia que tiene la emocionalidad sobre el
consumo alimentario (17). Por ejemplo, el consumo de dietas altas en azúcares y grasas se relaciona con niños con un nivel de estrés más alto, debido a la asociación de estos alimentos con sentimientos de recompensa y, por ende, su consumo en estas situaciones (18). Otros estudios plantean que alimentos altos en calorías y/o ricos en azúcares podrían tener un potencial adictivo (19,20). Por tanto, como

1053ASOCIACIÓN ENTRE CONDUCTA ALIMENTARIA Y ESTADO NUTRICIONAL EN PREESCOLARES CHILENOS
[Nutr Hosp 2018;35(5):1049-1053]
era de esperar, existe una relación inversamente proporcional entre la dimensión respuesta a la saciedad y estado nutricional.
Otra investigación con resultados similares evaluó la relación de comportamiento alimentario y estado nutricional en una gran muestra de 1.058 escolares, en la cual el índice de masa corporal se asoció positivamente con las puntuaciones de comportamiento alimentario proingesta y negativamente con los de antiingesta (21).
Otro estudio de validación del cuestionario encontró, al igual que este trabajo, una asociación positiva con la respuesta alimen-taria y se asoció negativamente con la lentitud en la comida y la respuesta a la saciedad (22).
En conclusión, se encuentra una asociación significativa entre estado nutricional (como indicador de P/T) y las puntuaciones de conducta alimentaria, mostrando que el P/T de preescolares de 2-4 años tiene una asociación positiva en puntuaciones de proin-gesta y una asociación negativa con antiingesta (especialmente en la dimensión de respuesta saciedad y lentitud para comer).
Dentro de las fortalezas del estudio, podemos mencionar el tamaño de muestra y su representatividad, ya que se seleccio-naron jardines infantiles de las zonas centro, costa y cordillera de la región de la Araucanía.
En futuras investigaciones, sería interesante considerar a las abuelas, ya que muchas de ellas permanecen a cargo de los nietos y pueden entregar información valiosa sobre su CA.
La aplicación de encuestas puede llevar a sesgos inherentes implicados en la realización de estas, tanto del entrevistador como del entrevistado.
La información obtenida en esta investigación refuerza lo docu-mentado en la literatura y lo extrapola a etapas más tempranas como la preescolar. Por tanto, es urgente trabajar con progra-mas de acción preventiva y tratamiento extensivo en población que acude a jardines infantiles, ya que, en Chile, el 54% de los menores de tres años y el 94% de los niños de entre cuatro y cinco años asiste a establecimientos de educación parvularia (21).
AGRADECIMIENTOS
Este estudio fue financiado por el Proyecto DIUFRO Nº 15-0003. No hay conflictos de interés en esta investigación.
BIBLIOGRAFÍA
1. Cecchini M, Warin L. Impact of food labelling systems on food choices and eating behaviours: a systematic review and meta-analysis of randomized studies. Obes Rev 2016;17(3):201-10.
2. Vigilancia del estado nutricional de la población bajo control y de la lactancia materna en el sistema público de salud de Chile. División Políticas Públicas Saludables y Promoción. Ministerio de Salud Gobierno de Chile; 2014.
3. Keane E, Layte R, Harrington J, Kearney PM, Perry IJ. Measured parental weight status and familial socio-economic status correlates with childhood overweight and obesity at age 9. PLoS One 2012;7(8):e43503.
4. Seidell JC, Halberstadt J. The global burden of obesity and the challenges of prevention. Ann Nutr Metab 2015;66(Suppl 2):7-12.
5. Hussain SS, Bloom SR. The regulation of food intake by the gut-brain axis: implications for obesity. Int J Obes 2013;37(5):625-33.
6. Santos JL, González A. Adaptación y aplicación del cuestionario de conducta de alimentación infantil CEBQ. En: Fundamentos de Nutrición y Dietética. Bases metodológicas y aplicaciones. 1ª ed. Martínez A, Portillo M (eds.). Madrid: Editorial Médica Panamericana; 2011. pp. 339-44.
7. Ashcroft J, Semmler C, Carnell S, Van Jaarsveld CHM, Wardle J. Con-tinuity and stability of eating behavior traits in children. Eur J Clin Nutr 2008;62(8):985-90.
8. Dubois L, Farmer A, Girard M, Peterson K, Tatone-Tokuda F. Problem eating behaviours related to social factors and body weight in preschool children: a longitudinal study. Int J Behav Nutr Phys Act 2007;4:9.
9. Domínguez-Vásquez P, Olivares S, Santos JL. Eating behaviour and childhood obesity: family influences. ALAN 2008;58(3):249-55.
10. Norma técnica para la supervisión de niños y niñas de 0 a 9 años en la aten-ción primaria de salud. Programa Nacional de Salud de la infancia. Ministerio de Salud Gobierno de Chile. Mayo 2014. Revisado marzo 2015.
11. Santos JL, Ho-Urriola J, González A, Smalley S, Domínguez-Vásquez P, Catal-do R, et al. Association between eating behaviour scores and obesity in Chilean children. Nutr J 2011;10:108-16.
12. Gil JM, Takourabt S. Socio-economics, food habits and the prevalence of childhood obesity in Spain. Child Care Health Dev 2017;43(2):250-8.
13. Aranceta J, Pérez C. Factores determinantes de la obesidad infantil: a propó-sito del estudio ANIBES. Nutr Hosp 2016;33(Supl 4):17-20.
14. Webber L, Hill C, Cooke L, Carnell S, Wardle J. Associations between child weight and maternal feeding styles are mediated by maternal perceptions and concerns. Eur J Clin Nutr 2010;64(3):259-65.
15. Svensson V, Lundborg L, Cao Y, Nowicka P, Marcus C, Sobko T. Obesity rela-ted eating behavior patterns in Swedish preschool children and association with age, gender, relative weight and parental weight-factorial validation of the Children’s Eating Behaviour Questionnaire. Int J Behav Nutr Phys Act 2011;8:134.
16. Gonzáles M, Ambrosio K, Sánchez S. Regulación neuroendocrina del hambre, la saciedad y mantenimiento del balance energético. Medigraphic Artemisa 2006;VIII(3):191-200.
17. Haycraft E, Farrow C, Meyer C, Powell F, Blissett J. Relationships between temperament and eating behaviours in young children. Appetite 2011;56(3):689-92.
18. Michels N, Sioen I, Braet C, Eiben G, Hebestreit A, Huybrechts I, et al. Stress, emotional eating behaviour and dietary patterns in children. Appetite 2012;59(3):762-9.
19. Avena NM, Rada P, Hoebel BG. Evidence for sugar addiction: behavioral and neurochemical effects of intermittent, excessive sugar intake. Neurosci Bio-behav Rev 2008;32(1):20-39.
20. Avena NM, Bocarsly ME, Hoebel BG. Animal models of sugar and fat bingeing: relationship to food addiction and increased body weight. Methods Mol Biol 2012;829:351-65.
21. Sánchez U, Weisstaub G, Santos JL, Corvalán C, Uauy R. GOCS cohort: children’s eating behavior scores and BMI. Eur J Clin Nutr 2016;70:925-8.
22. Behar A, Crespo N, García M, Ayala G, Campbell N, Shadron L, et al. Validation of a shortened version of the Children’s Eating Behavior Questionnaire and associations with BMI in a clinical sample of Latino children. J Nutr Educ Behav 2018;50(4):372-8.e1.

NutriciónHospitalaria
Trabajo Original Pediatría
ISSN (electrónico): 1699-5198 - ISSN (papel): 0212-1611 - CODEN NUHOEQ S.V.R. 318
Correspondence: José Manuel Moreno Villares. Comité de Nutrición. Asociación Española de Pediatría. C/ Aguirre, 1, bajo dcha. 28009 Madrid, Spaine-mail: [email protected]
Moreno Villares JM, Sáenz de Pipaón M, Carrasco Sanz A, Díaz Martín JJ, Redecillas Ferreiro S, Moráis López A, Sánchez VAlverde F, NAvas López V, San José González MA, Leis Trabazo R, Gil-Campos M, Blesa Baviera LC, Campoy Folgoso C. Study on the nutritional status and feeding habits in school-children in Madrid City (Spain) during the economic crisis. Nutr Hosp 2018;35(5):1054-1058
DOI: http://dx.doi.org/10.20960/nh.1824
Acknowledgements: We would like to thank Isabel Junco MD and José Manuel Díaz Olalla MD, at Madrid +, for their collaboration to perform the study and to the Madrid City Council for their economic support.
Study on the nutritional status and feeding habits in school-children in Madrid City (Spain) during the economic crisisImpacto de la crisis económica en el estado nutricional y en los hábitos alimentarios de escolares de Madrid (España)
José Manuel Moreno Villares, Miguel Sáenz de Pipaón, Ángel Carrasco Sanz, Juan José Díaz Martín, Susana Redecillas Ferreiro, Ana Moráis López, Félix Sánchez Valverde, Víctor Navas López, Miguel Ángel San José González, Rosaura Leis Trabazo, Mercedes Gil-Campos, Luis Carlos Blesa Baviera y Cristina Campoy Folgoso
Comité de Nutrición. Asociación Española de Pediatría. Madrid, Spain
Palabras clave:
Ambiente escolar en las comidas. Comedor escolar. Crisis económica. Obesidad infantil. Nutrición.
Resumen Introducción: la reciente crisis económica y financiera que ha afectado a los países occidentales ha sido especialmente más intensa en las familias con menos recursos económicos. Nos preguntamos si el empeoramiento de la situación económica se ha asociado a un aumento en la tasa de obesidad infantil.
Material y métodos: estudio transversal de una muestra ponderada que representase a los 290.111 niños de tres a 12 años matriculados en las escuelas públicas de Madrid en el curso 2014-2015. Se utilizó un cuestionario que incluía peso y talla (autorreportados), ingesta dietética (frecuencia semanal de consumo) y variables socioeconómicas.
Resultados: se evaluaron 1.208 cuestionarios de 64 clases, repartidos por igual entre niños y niñas. El 42% eran menores de cinco años, el 35% tenía entre seis y ocho años, y el 23% eran mayores de ocho años. Se presentó desnutrición en el 5,0% de la muestra, mientras que se halló exceso de peso (sobrepeso + obesidad) en el 36,7%. El bajo peso fue mayor en los niños < 6 años (9,1%), sin diferencias entre sexos. No se pudo encontrar ninguna correlación entre la desnutrición y las características de las familias, aunque fue ligeramente superior cuando ambos padres estaban en el paro. El exceso de peso fue mayor en hijos de padres no españoles (42% vs. 32%, p < 0,0001), así como en las familias con dificultades económicas (41% vs. 31%, p = 0,0005). La ingesta media semanal correcta solo se encontró en carne, cereales y lácteos.
Conclusiones: los niños de familias con un nivel socioeconómico bajo tienen mayor riesgo de padecer un exceso de peso. La participación en comedores escolares podría disminuir la inseguridad alimentaria, especialmente en tiempos de dificultades económicas.
Key words:
School food environment. School meals. Economic crisis. Childhood obesity. Nutrition.
Abstract Introduction: the recent economic and financial crisis has affected most Western countries, especially families of low socioeconomic classes. We speculate that worsening of socioeconomic condition associated with the crisis would increase obesity, mainly in disadvantaged families.
Material and methods: cross-sectional study of the 290,111 children aged three to 12 years old attending public school during the term 2014-2015 in Madrid City, by means of a stratified weighted sample randomly chosen, taking into account age (grade), city district and schools. The questionnaire included weight and height (auto-reported), dietary report (weekly frequency of intake), as well as socioeconomic variables.
Results: 1,208 questionnaires were evaluated from 64 classes. Half of participants were boys; 42% were younger than five years old, 35% were between six and eight years old, and 23% older than eight. Undernutrition was present in 5.0%, and excess of weight (overweight + obesity) in 36.7%. Undernutrition was higher in children under the age of six (9.1%). No relationship was found between undernutrition and the characteristics of the families but was slightly higher in families where both parents were unemployed. Excess of weight was higher in children of non-Spaniard parents (44% vs 32%, p < 0.0001), as well as in those families with economic problems (41% vs 31%, p = 0.0005). Only for meat, grains and dairy, the weekly intake was close to the recommendations.
Conclusions: children from lower income households were at a higher risk of being overweight compared with their peers. Participation in a school-based food aid program may reduce food insecurity for children and their families.
Received: 22/02/2018 • Accepted: 25/02/2018
©Copyright 2018 SENPE y ©Arán Ediciones S.L. Este es un artículo Open Access bajo la licencia CC BY-NC-SA (http://creativecommons.org/licenses/by-nc-sa/4.0/).
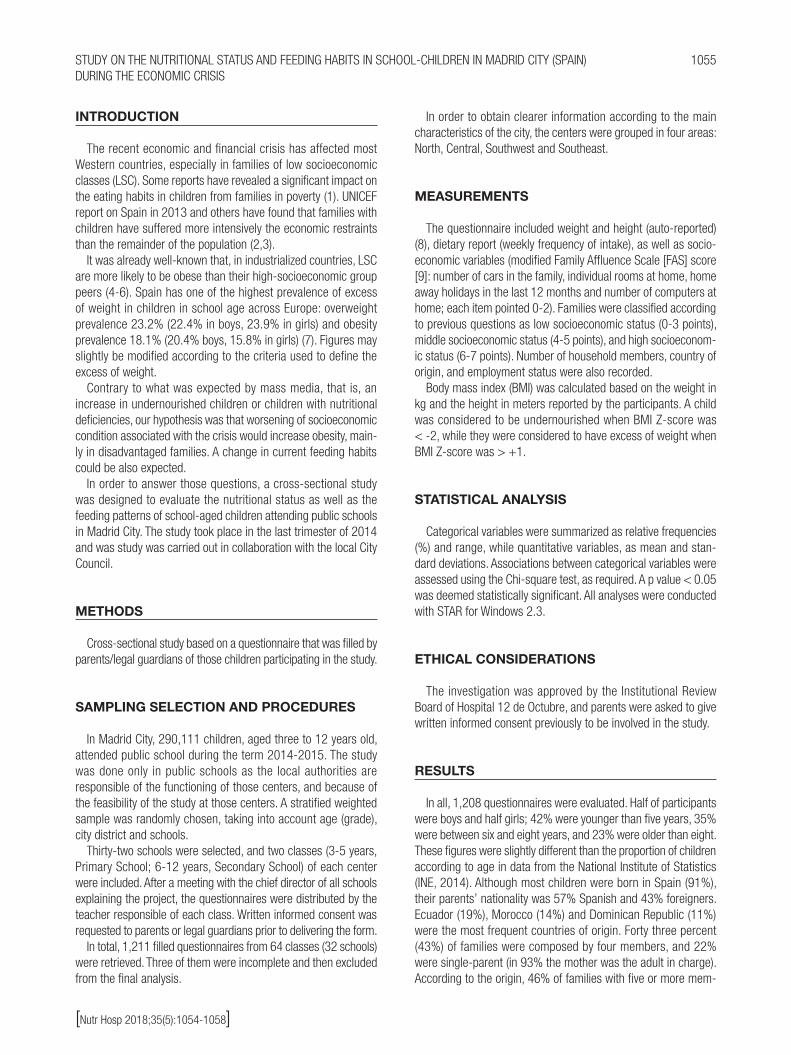
1055
[Nutr Hosp 2018;35(5):1054-1058]
STUDY ON THE NUTRITIONAL STATUS AND FEEDING HABITS IN SCHOOL-CHILDREN IN MADRID CITY (SPAIN) DURING THE ECONOMIC CRISIS
INTRODUCTION
The recent economic and financial crisis has affected most Western countries, especially in families of low socioeconomic classes (LSC). Some reports have revealed a significant impact on the eating habits in children from families in poverty (1). UNICEF report on Spain in 2013 and others have found that families with children have suffered more intensively the economic restraints than the remainder of the population (2,3).
It was already well-known that, in industrialized countries, LSC are more likely to be obese than their high-socioeconomic group peers (4-6). Spain has one of the highest prevalence of excess of weight in children in school age across Europe: overweight prevalence 23.2% (22.4% in boys, 23.9% in girls) and obesity prevalence 18.1% (20.4% boys, 15.8% in girls) (7). Figures may slightly be modified according to the criteria used to define the excess of weight.
Contrary to what was expected by mass media, that is, an increase in undernourished children or children with nutritional deficiencies, our hypothesis was that worsening of socioeconomic condition associated with the crisis would increase obesity, main-ly in disadvantaged families. A change in current feeding habits could be also expected.
In order to answer those questions, a cross-sectional study was designed to evaluate the nutritional status as well as the feeding patterns of school-aged children attending public schools in Madrid City. The study took place in the last trimester of 2014 and was study was carried out in collaboration with the local City Council.
METHODS
Cross-sectional study based on a questionnaire that was filled by parents/legal guardians of those children participating in the study.
SAMPLING SELECTION AND PROCEDURES
In Madrid City, 290,111 children, aged three to 12 years old, attended public school during the term 2014-2015. The study was done only in public schools as the local authorities are responsible of the functioning of those centers, and because of the feasibility of the study at those centers. A stratified weighted sample was randomly chosen, taking into account age (grade), city district and schools.
Thirty-two schools were selected, and two classes (3-5 years, Primary School; 6-12 years, Secondary School) of each center were included. After a meeting with the chief director of all schools explaining the project, the questionnaires were distributed by the teacher responsible of each class. Written informed consent was requested to parents or legal guardians prior to delivering the form.
In total, 1,211 filled questionnaires from 64 classes (32 schools) were retrieved. Three of them were incomplete and then excluded from the final analysis.
In order to obtain clearer information according to the main characteristics of the city, the centers were grouped in four areas: North, Central, Southwest and Southeast.
MEASUREMENTS
The questionnaire included weight and height (auto-reported) (8), dietary report (weekly frequency of intake), as well as socio-economic variables (modified Family Affluence Scale [FAS] score [9]: number of cars in the family, individual rooms at home, home away holidays in the last 12 months and number of computers at home; each item pointed 0-2). Families were classified according to previous questions as low socioeconomic status (0-3 points), middle socioeconomic status (4-5 points), and high socioeconom-ic status (6-7 points). Number of household members, country of origin, and employment status were also recorded.
Body mass index (BMI) was calculated based on the weight in kg and the height in meters reported by the participants. A child was considered to be undernourished when BMI Z-score was < -2, while they were considered to have excess of weight when BMI Z-score was > +1.
STATISTICAL ANALYSIS
Categorical variables were summarized as relative frequencies (%) and range, while quantitative variables, as mean and stan-dard deviations. Associations between categorical variables were assessed using the Chi-square test, as required. A p value < 0.05 was deemed statistically significant. All analyses were conducted with STAR for Windows 2.3.
ETHICAL CONSIDERATIONS
The investigation was approved by the Institutional Review Board of Hospital 12 de Octubre, and parents were asked to give written informed consent previously to be involved in the study.
RESULTS
In all, 1,208 questionnaires were evaluated. Half of participants were boys and half girls; 42% were younger than five years, 35% were between six and eight years, and 23% were older than eight. These figures were slightly different than the proportion of children according to age in data from the National Institute of Statistics (INE, 2014). Although most children were born in Spain (91%), their parents’ nationality was 57% Spanish and 43% foreigners. Ecuador (19%), Morocco (14%) and Dominican Republic (11%) were the most frequent countries of origin. Forty three percent (43%) of families were composed by four members, and 22% were single-parent (in 93% the mother was the adult in charge). According to the origin, 46% of families with five or more mem-

1056 J. M. Moreno Villares et al.
[Nutr Hosp 2018;35(5):1054-1058]
bers were from abroad, versus 23% in those of Spanish origin. According to the socioeconomic status, 34% had low, 41% had middle and 25%, high. Low socioeconomic status was more fre-quently present in families form non-Spanish origin, as well as in those living in the southern part of the city.
In 46% of the homes at least one of the parents was unem-ployed (40% in Spanish-origin families vs 54% in non-Spanish, p > 0.0001), and in 12% both parents were unemployed. Sin-gle-parent families reported “having trouble to make end of the month” in a higher percentage than the others (42% vs 32%, ns).
Nutritional status evaluation presented the following results: undernutrition was present in 5.0% of the sample, and excess of weight (overweight + obesity) in 36.7% (Fig. 1). Undernutri-tion was higher in children under the age of six (9.1%), with no differences between genders. We could not find any relationship between undernutrition and the characteristics of the families, or the perception of having economic problems at the end of the month, but it was slightly higher in those families where both parents were unemployed. Excess of weight was higher in chil-dren of non-Spaniard parents (44% vs 32%, p < 0.0001), as well as in those families with economic problems (41% vs 31%, p = 0.0005). There was a trend in increased excess of weight with age, both in boys and in girls.
Regarding feeding habits, 96% of the sample had breakfast daily, although only 88% were children from families where one of the parents was unemployed. A whole breakfast (grains, dairy and fruits) was taken only by 40%. Two thirds of the participants had lunch at school (63%), with a higher percentage (67%) in sin-gle-parent families as well as in families with economic difficulties. Only for meat, grains and dairy, the weekly intake was close to the recommendations (80% of the sample followed recommendations (Fig. 2). On the other hand, weekly intake of soda or soft drinks was clearly above recommendations: 2.3 times/week. This intake was higher in siblings of foreign couples (2.42), and in siblings from families where the father was unemployed (2.51), as well as in those with obesity in the anthropometric evaluation (2.42).
DISCUSSION
By the end of the 2000s, the economic situation in many Euro-pean countries started to deteriorate, leading to social insecurity and to worse health status. According to the UNICEF report, child poverty increased in Spain between 2007 and 2013, during the economic downturn that affected most part of Europe. This fact was associated with a decrease in family expenditure, changes
Figure 1.
Nutritional status of the whole sample. Malnutrition: BMI < -2 SD; overweight: BMI > +1 SD; obesity: BMI > +2 SD.

1057
[Nutr Hosp 2018;35(5):1054-1058]
STUDY ON THE NUTRITIONAL STATUS AND FEEDING HABITS IN SCHOOL-CHILDREN IN MADRID CITY (SPAIN) DURING THE ECONOMIC CRISIS
Figure 2.
Average weekly intake of each group of foods as percentage of recommendations.
in feeding habits, loss of housing and rising social inequity. Most studies suggested that the economic crisis has harmed children’s health, and disproportionately affected the most vulnerable groups (10). We chose to perform the study only in public schools in Madrid, as probably the highly risk population attend them.
In adults, a shift towards less healthy behaviors was noticeable after the starting of the economic crisis (11). In an Italian study with representative samples of the Italian population, comparing periods 2005-2007 and 2009-2012, a reduction of meat, fruit and vegetable consumption, increase on snacks and legumes fre-quencies and less fish and meat presence on diet were observed, but with wide differences according to social position, as well as geographical area (12).
Home environment is a key factor in the development of obe-sity in children (13). In our study, as well as in others performed in different parts of Spain (14) or in other countries (5,15,16), children from lower income households were at a higher risk of being overweight compared with their peers from higher-in-come households. It is well-known that there are clear differences among social classes when comparing food habits. Subjects from LSC have a higher trend to consume an unhealthy diet, and to eat less fruits and vegetables (17,18). This situation is called food poverty or food insecurity (19). In Spain, this trend was even pre-vious to the economic turndown, but highlighted in the last 10-12 years. At the same time, lower family income is usually associated with lower fitness score. Nevertheless, complex patterns in the association between socioeconomic status and overweight exist; age, country family precedence, as well as prevalence of obesity among parents, which were not addressed in our study and merit further research, have their influence.
This situation may even worsen during economic constraints. In Greece, food insecurity levels in low socioeconomic areas, mea-sured using the Food Security Survey Model, were as high as 64.2% in 2012-2013 (20), and similar data were obtained in Spain (13).
Sixty-three percent (63%) of children in our survey had lunch at school. Participation in a school-based food aid program may reduce food insecurity for children and their families. This may
be especially true in times of economic hardship (21). Thus, the results in our survey regarding feeding habits may be modified by the fact of having lunch at schools in near 2/3 of the sample. Although legislation on school lunch has a local scope in Spain, in 2010 a group of experts under the supervision of the Spanish Agency in Food Security agreed on the general guidelines that should be followed regarding foods to be served in schools (lunchrooms, cafeteria and vending machines) (22) (Table I). The school food environment plays an important role in children’s consumption pattern, so efforts to improve lunches at school or to facilitate the access to school lunch in families with eco-nomic difficulties may have a great impact on children’s health and well-being (23). Schools are a key setting for preventing childhood obesity (24).
The major strength in the study was the stratification in the whole city and all ages as well as the sample size. One of its major limitations was that weight and height were not measured but reported. Some studies indicate that children and adults tend to underestimate their weight and to underestimate their height, so the impact to our data will be that our figures of overweight and obesity should be biased towards an underestimation of the problem. In addition, the sample may not be representative of school children all over the country or even the city, as only public school attendants were considered. Nevertheless, it is a good start point to design strategies involving schools as well as families to improve dietary patterns and to fight against obesity in the same direction that V. Fuster pointed in the editorial of JACC early this year: “Communities and families need to band together to support each other when they attempt to improve their eating habits” (25).
Table I. Weekly frequency of foods in school lunch in Spain (22)
Group of foods Weekly intake
First course Rice Pasta Pulses Vegetables
11
1-21-2
Second course Meat Fish Eggs
1-31-31-2
Garnish Salad Others (potatoes, vegetables,
etc.)
3-4
1-2
Desert Fresh fruit Others (dairy, juice, etc.)
4-50-1

1058 J. M. Moreno Villares et al.
[Nutr Hosp 2018;35(5):1054-1058]
REFERENCES
1. Whitham G. Child poverty in 2012. It shouldn’t happen here. London: Save the Children; 2012.
2. González-Bueno G, Bellos A, Arias M. La infancia en España 2012-2013. El impacto de la crisis en los niños. Madrid: UNICEF España; 2012.
3. Navarro V, Clua-Losada M. El impacto de las crisis en las familias y la infancia. Barcelona: Observatorio Social de España; 2012.
4. Wang Y, Zhang Q. Are American children and adolescents of low socioe-conomic status at increased risk of obesity? Changes in the association between overweight and family income between 1971 and 2002. Am J Clin Nutr 2006;84:707-16.
5. Jin Y, Jones-Smith JC. Association between family income and children’s physical fitness and obesity in California, 2010-2012. Prev Chronic Dis 2015;12:140392. DOI: 10.5888/ped12,140392
6. Goisis A, Sacker A, Kelly Y. Why are poorer children at higher risk of obesity and overweight? A UK cohort study. Eur J Public Heath 2016;26(1):7-13.
7. Agencia Española de Consumo, Seguridad Alimentaria y Nutrición. Estudio Aladino 2015. Ministerio de Sanidad, Servicios Sociales y Educación; 2016. Accessed on Nov 12th, 2017. Available from:http://www.aecosan.msssi.gob.es/AECOSAN/docs/documentos/nutricion/observatorio/Estudio_ALADI-NO_2015.pdf
8. Martínez-Torres J, Bucheli Sánchez LM, Manrique Martínez LM, Edith Cruz R, Rojas Hoyos ZL, Pérez Buelvas JL. Concordancia del autorreporte de peso y talla para valoración nutricional en estudiantes universitarios de 18 a 25 años. Perspectivas en Nutrición Humana 2013;15:57-65.
9. Currie C, Molcho M, Boyce W, Holstein B, Torsheim T, Richter M. Resear-ching health inequalities in adolescents: the development of the Health Behaviour in School-Aged Children (HBSC) family affluence scale. Soc Sci Med 2008;66(6):1429-36.
10. Rajmil L, Fernández de Sanmamed MJ, Choonara I, Faresjö T, Hjern A, Kozyrs-kyj AL, et al. Impact of the 2008 economic and financial crisis on child health: a systematic review. Int J Environ Res Public health 2014;11:6528-46.
11. Foscolou A, Tyrovolas S, Soulis G, Mariolis A, Piscopo S, Valacchi G, et al. The impact of the financial crisis on lifestyle health determinants among older adults living in the Mediterranean Region: the Multinational MEDIS Study (2005-2015). J Prev Med Public Health 2017;50(1):1-9.
12. Marra M, Migliardi A, Costa G. Health inequalities and nutrition in Italy during crisis times. Epidemiol Prev 2015;39(5-6):322-31.
13. Strauss RS, Knight J. Influence of the home environment on the development of obesity in children. Pediatrics 1999;103.E85.
14. Rajmil L, Medina-Bustos A, Fernández de Sanmamed MJ, Mompart-Penina A. Impact of the economic crisis on children’s health in Catalonia: a before-after approach. BMJ Open 2013;3:e003286.
15. Ueda P, Kondo K, Fujiwara T. The global economic crisis, household income and pre-adolescent overweight and underweight: a nationwide birth cohort study in Japan. Int J Obes 2015;39:1414-20.
16. Rogers R, Eagle TF, Sheetz A, Woodward A, Leibowitz R, Song M, et al. The relationship between childhood obesity, low socioeconomic status, and race/ethnicity: lessons from Massachusetts. Chil Obes 2015;11:691-5.
17. De Irala-Estévez J, Groth M, Johansson L, Oltersdorf U, Prattala R, Mar-tínez González MA. A systematic review of socioeconomic differences in food habits in Europe: consumption of fruit and vegetables. Eur J Clin Nutr 2000;54:706-14.
18. Pinket AS, De Craemer M, Hybrechts I, De Bourdeaudhuij I, Deforche B, Cardon G, et al. Diet quality in Europena pre-schoolers: evaluation based on diet quality indices and association with gender, socio-economic status and overweight, the ToyBox-study. Public Health Nutr 2016;19:2441-50.
19. Riches G. Hunger, food security, and welfare policies: issues and debates in First World societies. Proceed Nutr Soc 1997;56(1A):63-74.
20. Petralias A, Papadimitriou E, Riza E, Karagas MR, Zagouras AB, Linos A; DIATROFI Program Research Team. The impact of a school food aid program on household food insecurity. Eur J Public Health 2016;26(2):290-6.
21. Dalma A, Kastorini CM, Zota D, Veloudaki A, Petralias A, Yannakoulia M, et al. Perceptions of parents and children, participating in a school-based feeding programme in disadvantaged areas in Greece: a qualitative study. Child Care Health Dev 2016;42(2):267-77.
22. Agencia Española de Consumo, Seguridad Alimentaria y Nutrición. Documen-to de consenso sobre la alimentación en los centros educativos. Ministerio de Sanidad, Servicios Sociales y Educación; 2016. Accessed on: Dec 4th, 2017. Available from: http://www.aecosan.msssi.gob.es/AECOSAN/docs/documentos/nutricion/educanaos/documento_consenso.pdf
23. Welker E, Lott M, Story M. The school food environment and obesity preven-tion: progress over the last decade. Curr Obes Rep 2016;5:145-55.
24. Okely AD, Hammersley ML. School-home partnerships: the missing piece in obesity prevention? Lancet Child Adolesc Health 2018. In press.
25. Fuster V. Changing our dietary habits. Emphasizing with Sisyphus. J Amer J Cardiol 2017;69:26657.

NutriciónHospitalaria
Trabajo Original Nutrición en el anciano
ISSN (electrónico): 1699-5198 - ISSN (papel): 0212-1611 - CODEN NUHOEQ S.V.R. 318
Correspondence: Carla H. A. Schwanke. Graduate Programe in Biomedical Gerontology. Institute of Geriatrics and Gerontology. Pontifical Catholic University of Rio Grande do Sul (PUCRS). Av. Ipiranga, 6681 - Prédio 81 - 7º andar, sala 703. 90619-900 Porto Alegre, Brazile-mail: [email protected]
El Kik RM, Dorneles TC, Schwanke CHA. Association between adductor pollicis muscle thickness and nutritional parameters in hospitalized elderly patients. Nutr Hosp 2018;35(5):1059-1065
DOI: http://dx.doi.org/10.20960/nh.1739
Association between adductor pollicis muscle thickness and nutritional parameters in hospitalized elderly patientsAsociación entre el espesor del músculo aductor del pulgar y parámetros nutricionales en pacientes ancianos hospitalizados
Raquel Milani El Kik1, Thamiris de Christo Dorneles2 and Carla Helena Augustin Schwanke1
1Graduate Programe in Biomedical Gerontology. Institute of Geriatrics and Gerontology. Pontifical Catholic University of Rio Grande do Sul (PUCRS). Porto Alegre, Brazil. 2Multiprofessional Integrated Health Residency Program. Pontifical Catholic University of Rio Grande do Sul (PUCRS). Porto Alegre, Brazil
Palabras clave:
Ancianos. Hospitalización. Antropometría. Desnutrición. Evaluación nutricional.
Resumen Introducción: la medida del espesor del músculo aductor del pulgar (EMAP) ha sido investigada como parámetro antropométrico, pero son escasos los estudios en ancianos hospitalizados.
Objetivo: analizar la asociación entre EMAP y parámetros nutricionales en ancianos hospitalizados.
Método: estudio transversal con 331 ancianos hospitalizados. Se evaluaron las siguientes variables: EMAP, Mini Nutritional Assessment® (MNA®), índice de masa corporal (IMC), circunferencia del brazo (CB), circunferencia de la pantorrilla (CP) y fuerza de prensión palmar (FPP).
Resultados: el promedio de edad fue de 78,4 ± 9,7 años y el 56,8% eran mujeres. Las mujeres tenían valores medios de EMAP significati-vamente menores que los hombres (12,67 ± 4,13 mm frente a 15,26 ± 4,01 mm), así como los ancianos ≥ 80 años tenían valores de EMAP inferiores a los más jóvenes (12,62 ± 4,38 mm frente a 14,83 ± 3,90 mm). En cuanto a la clasificación de la EMAP, las mujeres se encontraban con más frecuencia por debajo del P5 que los hombres (89,9% frente al 37,1%). En el análisis univariado, los niveles medios de la EMAP se mostraron mucho más pequeños en los ancianos con desnutrición (MNA®), delgadez (IMC), CB < 21 cm, CP < 31 cm y FPP < P5, independien-temente del sexo. En el análisis multivariado, la EMAP permaneció como factor independiente asociado a todos los parámetros nutricionales, incluso cuando se ajustó para edad y sexo.
Conclusiones: la EMAP se asoció con todos los parámetros nutricionales investigados, independientemente del sexo y de la edad, reforzando su aplicabilidad en la evaluación nutricional de ancianos.
Key words:
Aged. Hospitalization. Anthropometry. Malnutrition. Nutrition assessment.
Abstract Introduction: the measurement of the adductor pollicis muscle thickness (APMT) has been investigated as an anthropometric parameter; however, there are few studies related to hospitalized elderly patients.
Objective: to analyze the association between APMT and nutritional parameters in hospitalized elderly patients.
Method: cross-sectional study made in 331 hospitalized elderly patients. The following variables have been assessed: APMT, Mini Nutritional Assessment® (MNA®), body mass index (BMI), arm circumference (AC), calf circumference (CC) and handgrip strength (HGS).
Results: the mean age was 78.4 ± 9.7 years and 56.8% were women. The women had showed APMT mean values significantly lower than the men (12.67 ± 4.13 mm vs 15.26 ± 4.01 mm), as well as the elderly patients ≥ 80 years old showed APMT values lower than the younger patients (12.62 ± 4.38 mm vs 14.83 ± 3.90 mm). In relation to the APMT classification, the women were more frequently below P5 than the men (89.9% vs 37.1%). In the univariate analysis, the mean values of APMT were significantly lower in the malnourished elderly patients (MNA®), thinness (BMI), AC < 21 cm, CC < 31 and HGS < P5, regardless of gender. In the multivariate analysis, APMT remained as a factor independently associated with all nutritional indicators, even when adjusted to age and gender.
Conclusion: APMT has associated with all the nutritional parameters investigated, regardless of gender and age, reinforcing its applicability in the nutritional assessment of elderly people.
Received: 19/12/2017 • Accepted: 21/02/2018
©Copyright 2018 SENPE y ©Arán Ediciones S.L. Este es un artículo Open Access bajo la licencia CC BY-NC-SA (http://creativecommons.org/licenses/by-nc-sa/4.0/).

1060 R. M. El Kik et al.
[Nutr Hosp 2018;35(5):1059-1065]
INTRODUCTION
The prevalence of malnutrition in hospitalized elderly is high when compared to community elderly (1). Therefore, the investigation of ade-quate techniques for nutritional assessment in this population is para-mount for nutritional care, in order to support diagnosis and nutritional management (2). In this context, the Mini Nutritional Assessment® (MNA®) applied in its integral form (3) has been widely used for the evaluation of nutritional status of hospitalized elderly (1,3). However, some difficulties are associated with its application, e.g., when the elderly presents physical and mental limitations (1,3), in the absence of a companion to provide information for the application of the instru-ment or when the elderly receives enteral nutrition therapy (3). As such, with the aim of searching nutritional assessment instruments that are independent of the patient collaboration (4) in conjunction with rapid application and low cost, the adductor pollicis muscle thickness (APMT) measurement emerges as an anthropometric parameter (5). The adductor pollicis muscle is the only muscle that allows its direct thick-ness measurement in function of its anatomic characteristic (6). Many studies have been using this measurement in different populations and scenarios, such as community individuals (6-9), institutionalized elderly (10); different clinical conditions as in oncologic patients (11-13), chronic kidney disease and hemodialysis (14-16); and hospitalized clinical (17), surgical (17-21) and intensive unit care patients (22-24).
Nonetheless, specific studies regarding hospitalized elderly are scarce (5), with only two available studies (25,26). None of the aforementioned studies analyzed the association between APMT and the MNA®, which is a specific nutritional assessment instrument for the elderly. Therefore, the aim of the present study was to analyze the association between the APMT and nutritional parameters in the hospitalized elderly.
METHODS
STUDY DESIGN, POPULATION AND SAMPLE
This is a transversal study. Three hundred and thirty-one elderly patients (≥ 60 years old) hospitalized at the Hospital São Lucas from the Pontifical Catholic University of Rio Grande do Sul (HSL/PUCRS) were evaluated from May 2014 to December 2015. Suc-cessful obtainment of the APMT and further assessed nutritional parameters were used as inclusion criterions.
Regarding the sample size for the APMT evaluation, with an error margin of 5 mm (17), power of 80% and significance level of 5%, and considering the frequency risk of malnutrition and malnutrition in the studied population, a minimal sample size of 130 elderly was required.
INVESTIGATED VARIABLES
The variables investigated were sex, age, nutritional state (MNA®
and BMI), anthropometric variables (arm circumference [AC], calf circumference [CC] and APMT) and handgrip strength (HGS).
DATA COLLECTION LOGISTICS
Data was collected at the elderly admission through trained evaluators.
The MNA® was applied with the patient alone or with the aid of a companion, when there was lack of cognitive conditions to answer the questions independently (27).
Body weight was measured through the digital portable scale (Urâno, UPC 150 model, Brazil), and height was obtained with a portable stadiometer (Sanny®, Personal Caprice model, Brazil). When it was not possible to perform body and/or weight mea-surements, the information was collected with the patient or com-panion. The BMI was obtained as the body mass (kg)/squared estimated height (m2) (28).
The elderly patients were classified according to the estab-lished cut-off values described by Lipschitz (29): < 22 kg/m² (underweight), between 22 and 27 kg/m² (eutrophic) and > 27 kg/m² (overweight).
The AC was measured with an inelastic tape, positioned in the arm midpoint, between the acromion and olecranon. CC was assessed with the leg of the elderly flexed in a 90° angle, with an inelastic tape positioned in the maximum perimeter of the muscle, with an uncovered calf (30). AC ≤ 22 cm and CC < 31 cm values were considered as decreased, for both genders, following the cut-off values described at the MNA® (27).
The APMT was obtained in the dominant hand, and in case of obtainment impossibility, in the non-dominant hand. Details regarding APMT measurement method were previously published by El Kik and Schwanke (25). APMT was classified as decreased according to the percentile 5 values (18 mm for men and 14 mm for women) (8).
HGS was measured with the patient sitting, on the dominant hand, or in case of obtainment impossibility, on the non-dominant hand. The elbow was flexed at 90°, the forearm was in a neutral position, the grip was adjusted in the second position, and the patient held the maximum grip force during three seconds with 30 seconds to one-minute interval (31). Three measurements were performed and the average was considered for the HGS. HGS was classified according to the percentile 5 (18 kgf for men and 11 kgf for women) (9).
STATISTICAL ANALYSIS
Data was computed on a Microsoft Excel database and fur-ther analyzed with SPSS 21.0 (SPSS Inc. Chicago, IL, USA). Normality distribution of continuous data was assessed by the Kolgomorov-Smirnov test, with all data variables presenting a normal distribution. Descriptive analysis was performed by frequency means, central tendency and dispersion. In order to compare mean average of APMT in relation to sex, the Stu-dent’s t-test was applied. For the association between APMT classification with sex and age, the Pearson’s Chi-square was used. Comparison between the APMT averages was conducted with the Student’s t-test and analysis of variance (ANOVA),

1061
[Nutr Hosp 2018;35(5):1059-1065]
ASSOCIATION BETWEEN ADDUCTOR POLLICIS MUSCLE THICKNESS AND NUTRITIONAL PARAMETERS IN HOSPITALIZED ELDERLY PATIENTS
with a Bonferroni post-hoc correction. Multivariate analysis of Poisson regression was applied in order to assess the APMT effect over the investigated nutritional parameters due to the transversal study design and to correct for age and sex of the elderly. For this analysis, the polytomic variables were dichot-omized.
ETHICAL ASPECTS
The data presented in this article were obtained from the doctorate project entitled “Handgrip strength and adductor pol-licis muscle thickness as nutritional status, functional capacity and mortality assessment instruments in hospitalized elderly patients”, approved by the PUCRS Research Ethics Commit-tee (CAAE: 26825614.7.0000.5336, assessment 636.335 of 29/04/2014). Determinations from the National Heath Council resolution no. 466/2012 (32) were followed and all the partici-pants were instructed regarding the procedures involved in this research and signed the free and informed consent form.
RESULTS
The sample majority was composed by women (56.8%). Mean age was 78.4 ± 9.7 years old, ranging from 60 to 105 years old. Women are more frequently in the age group ≥ 80 years. The most frequent causes of hospitalization were respiratory diseases (n = 60, 17.9%) and gastroenterological (n = 53, 15.8%) and cardiac (n = 43, 12.8%) conditions.
Regarding nutritional parameters, MNA® nutritional status was normal (45.7%); patients were considered as eutrophic as mea-sured by the BMI (40.1%), AC > 22 cm (87.6%), CC > 31 cm (71.5%) and a HGS without depletion risk (64.8%) (Table I).
On table II, depicted average values of APMT were significantly lower in women as compared to men (12.67 ± 4.13 mm vs 15.26 ± 4.01 mm, p < 0.001). Elderly with over 80 years old had lower APMT values than younger elderly patients (12.62 ± 4.38 mm vs 14.83 ± 3.90 mm, p < 0.001), in men (14.36 ± 4.10 mm vs 15.76 ± 3.89 mm, p = 0.044) as well as in women (11.78 ± 4.28 mm vs 13.80 ± 3.66, p = 0.001).
As for the APMT classification, women were more frequently below the P5 when compared to men (89.9% vs 37.1%), regard-less of age (Table II).
At the univariate analysis, APMT was associated with all inves-tigated nutritional parameters, independent of age (Table III).
On table III, the comparison between the APMT according to the nutritional parameters classification is described. The APMT average value of elderly patients with normal nutritional status was higher than in elderly patients classified as malnourished or with risk of malnourishment (p < 0.001). No significant difference was observed between the APMT average values of malnourished elderly and at risk of malnourishment elderly patients. Elderly clas-sified as underweight by the BMI presented a lower mean APMT as compared to eutrophic and overweight elderly patients.
Elderly patients with AC > 22 mm presented a higher APMT than elderly with AC < 22 cm, as well as patients with CC ≥ 31 cm presented higher APMT as compared to CC < 31 cm.
Men with HGS ≥ 18 kgf had superior APMT in contrast with elderly patients with HGS < 18 kgf (p = 0.021).
At the multivariate analysis (Table IV), APMT proved to be an independent measurement associated to all nutritional parameters, even when adjusted for age and sex (p < 0.05). Increased APMT was related to a 4% lower chance of malnutrition/risk of malnutrition as classified by the MNA®, 11% in the BMI, 21% in the AC < 21 cm, 12% in the CC < 31 cm and 6% in the HGS < P5.
DISCUSSION
The present study evaluated the association between the APMT and nutritional parameters in hospitalized elderly in Porto Alegre, a city located in the south of Brazil. It is one of the few studies performed only in hospitalized elderly patients (25,26). Another important characteristic is that this study is the first one to evalu-ate the association between the APMT and diagnosed malnutrition
Table I. Nutritional status according to nutritional parameters of hospitalized
elderly patients
Nutritional parameters n (%)
Mini Nutritional Assessment®
Malnourished 42 (14.4)
Risk of malnutrition 116 (39.9)
Normal nutritional status 133 (45.7)
Body mass index
Underweight 86 (26.1)
Eutrophic 132 (40.1)
Overweight 111 (33.8)
Arm circumference
< 21 cm 19 (6.5)
21-22 cm 17 (5.9)
> 22 cm 255 (87.6)
Calf circumference
< 31 cm 82 (28.5)
≥ 31 cm 206 (71.5)
Handgrip strength
< P5 92 (35.2)
≥ P5 169 (64.8)
< P5: lower than percentile 5; ≥ P5: equal or higher than percentile 5. Note: 40 missing data were present for the MNA® and arm circumference analysis, two for the BMI, 43 for the calf circumference and 70 for the handgrip strength.

1062 R. M. El Kik et al.
[Nutr Hosp 2018;35(5):1059-1065]
Table II. Adductor pollicis muscle thickness classification of elderly hospitalized patients according to sex and age
APMTTotal sample
(n = 331)n (%)
Men(n = 143)
n (%)
Women(n = 188)
n (%)p
Total sample (n = 331)APMT in mm (mean ± SD) 13.79 ± 4.27 15.26 ± 4.01 12.67 ± 4.13 < 0.001*
Classification < P5 222 (67.1) 53 (37.1) 169 (89.9)
< 0.001†
≥ P5 109 (32.9) 90 (62.9) 19 (10.1)
60-79 years old (n = 175)APMT in mm (mean ± SD) 14.83 ± 3.90 15.76 ± 3.89 13.80 ± 3.66 0.001*
Classification < P5 101 (57.7) 28 (27.7) 73 (72.3)
< 0.001†
≥ P5 74 (42.3) 64 (86.5) 10 (13.5)
80 years old or more (n = 156)APMT in mm (mean ± SD) 12.62 ± 4.38 14.36 ± 4.10 11.78 ± 4.28 < 0.001*
Classification
< P5 121 (77.6) 25 (49.0) 96 (91.4)< 0.001†
≥ P5 35 (22.7) 26 (51.0) 9 (8.6)APMT: adductor pollicis muscle thickness; < P5: lower than percentile 5; ≥ P5: equal or higher than percentile 5. *Student t test; †Pearson’s Chi-square test.
Table III. Comparison of average adductor pollicis muscle thickness between sex, according to the classification of nutritional parameters of hospitalized elderly patients
Nutritional parametersAPMT (mm)
Total sampleMean ± SD
pMen
Mean ± SDp
WomenMean ± SD
p
Mini Nutritional Assessment® < 0.001* 0.001* 0.001*Malnourished 11.80 ± 4.40b 13.92 ± 4.41b 9.68 ± 3.28b
Risk of malnutrition 13.15 ± 4.02b 14.0 ± 3.73b 12.70 ± 4.12a
Normal nutritional status 14.89 ± 4.01a 16.60 ± 3.80a 13.39 ± 3.60a
Body mass index < 0.001* < 0.001* < 0.001*Underweight 11.71 ± 4.12b 13.60 ± 3.78b 10.41 ± 3.87b
Eutrophic 14.01 ± 4.09a 14.81 ± 3.65b 13.16 ± 4.38a
Overweight 15.14 ± 3.99a 17.44 ± 3.95a 13.90 ± 3.43a
Arm circumference < 0.001* < 0.001* 0.003*< 21 cm 9.63 ± 2.58b 10.00 ± 0.67b 9.56 ± 2.81b
21-22 cm 11.39 ± 5.01b 11.16 ± 2.75b 11.59 ± 6.60a,b
> 22 cm 14.21 ± 4.05a 15.73 ± 3.95a 13.02 ± 3.73a
Calf circumference < 0.001† < 0.001† < 0.001†
< 31 cm 11.16 ± 3.43 12.03 ± 2.96 10.78 ± 3.58
≥ 31 cm 14.74 ± 4.07 16.15 ± 3.93 13.51 ± 3.80
Handgrip strength‡ < 0.001† 0.021†
< P5 - 13.51 ± 3.91 12.01 ± 4.14
≥ P5 - 16.58 ± 3.65 13.51 ± 3.48MNA®: Mini Nutritional Assessment; APMT: adductor pollicis muscle thickness; HGS: handgrip strength. *Analysis of variance-ANOVA and Bonferroni post-hoc test (the mean values with different superscript letters are significally different). †Student’s t-test. ‡Information presented only between sex, since there is no cut-off value for the total sample (handgrip strength P5: for men = 18 kgf and for women = 11 kgf).

1063
[Nutr Hosp 2018;35(5):1059-1065]
ASSOCIATION BETWEEN ADDUCTOR POLLICIS MUSCLE THICKNESS AND NUTRITIONAL PARAMETERS IN HOSPITALIZED ELDERLY PATIENTS
by the MNA®, whereas other studies analyzed the relationship between APMT and the Subjective Global Assessment, and other nutritional parameters (13,15,20-22,24,33). It was possible to observe that the APMT was associated to all investigated nutri-tional parameters such as the MNA®, BMI, AC, CC and HGS.
According to the different nutritional parameters, the investi-gated elderly patients presented a risk of malnutrition/malnutrition frequency of 54.3% in the MNA®, 26.1% in the BMI, 12.3% in the AC, 64.4% in the CC and 35.2% in HGS.
Recent literature has demonstrated that malnutrition in the hospitalized elderly is frequent (1). The present results were sim-ilar to those of a study conducted with 89 elderly patients in a medium complexity hospital of Rio Grande do Sul, where 58% of malnutrition/risk of malnutrition was observed according to the MNA® (34). A systematic review with meta-analysis included 66 studies that evaluated hospitalized elderly patients by the MNA® and demonstrated higher malnutrition/risk of malnutrition values (67.5%) in this population (35). Even higher values were identified in a study conducted in a high complexity hospital of Rio Grande do Sul including 131 elderly patients (36), observing malnutrition in 73.7% of women and 89.1% of men.
Other similar studies with hospitalized elderly demonstrated higher values as compared to the present study concerning the BMI under-weight frequency, according to Lipschitz. We identified that 26.1% of the investigated elderly patients were underweight, whereas other studies observed values of 36.6% (36), 38% (37) and 41% (38).
The frequency of CC < 31 cm in the present study was 28.5%, whereas other studies identified even higher inadequacy values, such as 38.2% (36) and 59% (37).
Regarding AC, only 12.3% of the elderly patients were classi-fied below the recommended values, while others verified higher values as 63% (39) and 67.2% (36).
The difference between the obtained values might be attribut-ed to the epidemiological profile of the studied population. In the study performed by Zanchim et al. (36), the main cause of hospitalization was cancer. As for the study by Morais, Campos and Lessa (37), the most frequent cause of hospitalization was respiratory diseases.
Related to the anthropometric parameters, there was a per-ceived limitation regarding availability of data for comparative analysis. According to Fidelix, Santana and Gomes (39) in a narra-tive review, there are scarce number of studies providing updated data regarding hospitalized elderly population.
Besides being a functional capacity indicator and predictor of aggravated health status in the elderly, the HGS has been con-sidered to be a nutritional state indicator (40). However, it was not possible to identify studies which used the same cut-off value as the one applied in the current study, which was based on a population research that determined the cut-off value for Brazilian elderly population (9).
Differences in the APMT related to sex (6-8,14,16) and age (6,16) have been previously described. According to a previous published study with a lower sample size (25), women and elderly had a reduced APMT. Still, in the present study, women had a higher frequency of APMT < P5, whereas men had APMT > P5 (p < 0.001), even when correcting for age < 80 or ≥ 80 years old. A study with hospitalized candidates to surgical procedure also found a higher frequency of malnutrition through the APMT in women. Such finding can be explained by the bodily composition differences among men and women (19), and also due to the fact than women are older than men in this sample. Although women live longer, they experience worse health and present a greater chance than men to experience the typical diseases of the last phase of life (41).
Table IV. Multivariate analysis of Poisson regression in order to evaluate the adductor pollicis muscle thickness effect on nutritional parameters of hospitalized elderly patients
Nutritional parameters
APMT
PR(95% CI)
Not-adjustedp
PR(95% CI)
Adjusted*p
MNA®
Risk of malnutrition/malnutrition0.95
(0.92-0.97)< 0.001
0.96(0.93-0.99)
0.006
Body mass index< 22 kg/m2
0.88(0.84-0.92)
< 0.0010.89
(0.84-0.94) < 0.001
Arm circumference< 21 cm
0.74(0.65-0.83)
< 0.0010.79
(0.68-0.93) 0.004
Calf circumference< 31 cm
0.85 (0.81-0.89)
< 0.0010.88
(0.84-0.93) < 0.001
Handgrip strength< P5
0.91 (0.86-0.95)
< 0.0010.94
(0.90-0.99) 0.017
p: Poisson regression. *Adjusted for sex and age.

1064 R. M. El Kik et al.
[Nutr Hosp 2018;35(5):1059-1065]
The present study demonstrated higher mean values of APMT in elderly classified with a normal nutritional status (MNA®); eutro-phic by BMI, with a AC > 22 mm, CC ≥ 31 cm and HGS ≥ 18 kgf in men and FPP ≥ 11 kgf in women. Another study conducted in surgical patients observed a higher mean APMT value in patients classified as eutrophic by means of AC and BMI (19).
APMT demonstrated to be an independent factor associated to all parameters, even when corrected by age and sex, reinforc-ing its applicability in the clinical practice. Several studies have associated APMT to classic nutritional assessment parameters, such as anthropometric measures, highlighting its relation with malnutrition (6,14,15,18,19,21,24), as well as the HGS (15,40).
Karst, Vieira and Barbiero (24) assessed the correlation between APMT, BMI and CC in patients in a cardiologic intensive care unit. Oliveira et al. (14) observed a positive correlation between the APMT and BMI and also APMT and AC in hemodialysis patients.
In the study conducted by Pereira et al. (15) in hemodialysis patients, a positive correlation between the APMT and HGS was observed. This is in accordance with the study by Guerra et al. (40), conducted in hospitalized patients, where an association between APMT and HGS was also found.
Interestingly, one study conducted in hospitalized patients (17) and other in breast cancer patients (13) found a weak association between the APMT and anthropometrics parameters, and both studies related this finding to the fact that the studied population was predominantly overweight/obese.
Another study in hemodialysis patients (15) did not find a cor-relation among APMT and anthropometric parameters, relating this finding to possible hydric alterations in this population, as well as possible errors in the reproducibility of anthropometric measures related to the observer’s variability.
Even though several studies pointed towards an association between APMT measurement and classic nutritional parameters, results are still insufficient to promote APMT as a unique indicator of lean mass reserve (7). The nutritional assessment is considered as a complex process and it is wise to associate different methods in the pursuit of a more trustworthy and precise diagnosis (2).
The present study has some limitations, especially regarding its design (cross-sectional) and the low malnutrition frequency. In this context, further research is required with matching nutritional status condition.
In conclusion, APMT was associated with all the investigat-ed nutritional parameters, independent of sex and age, which reinforces its applicability in the nutritional assessment of elderly patients.
REFERENCES
1. Pereira DS, Oliveira ACS, Pereira MHQ, Pereira MLAS. Mini Avaliação Nutricio-nal: utilização e panorama nos diferentes cenários de atenção ao idoso. Rev Saúde Com 2017;13(1):824-32. DOI: 10.22481/rsc.v13i1.426
2. Fidelix MSP. Manual orientativo: sistematização do cuidado de nutrição. São Paulo: Asbran; 2014. Available from: http://www.asbran.org.br/arquivos/PRONUTRI-SICNUT-VD.pdf
3. Najas M. Consenso Brasileiro de Nutrição e Disfagia em Idosos Hospitaliza-dos. Barueri: Minha Editora; 2011.
4. Frangella VS. Avaliação do músculo adutor. In: Rossi L, Caruso L, Galante AP. Avaliação nutricional: novas perspectivas. 2nd ed. Rio de Janeiro: Guanabara Koogan; 2015. pp. 358-9.
5. Pereira CA, Moreno JG, El Kik RM. Utilização da espessura do músculo adutor do polegar na avaliação nutricional. Cienc Saude 2014;7(2):109-14. DOI: 10.15448/1983-652X.2014.2.16626
6. Lameu EB, Gerude MF, Campos AC, Luiz RR. The thickness of the adductor pollicis muscle reflects the muscle compartment and may be used as a new anthropometric parameter for nutritional assessment. Curr Opin Clin Nutr Metab Care 2004;7(3):293-301.
7. Bielemann RM, Horta BL, Orlandi SP, Barbosa-Silva TG, Gonzalez MC, Assunção MC, et al. Is adductor pollicis muscle thickness a good pre-dictor of lean mass in adults? Clin Nutr 2015;XX(y):1-5. DOI: 10.1016/j.clnu.2015.07.022
8. Gonzalez MC, Duarte RRP, Budziareck MB. Adductor pollicis muscle: reference values of its thickness in a healthy population. Clin Nutr 2010;29(2):268-71. DOI: 10.1016/j.clnu.2009.08.012
9. Budziareck MB, Duarte RRP, Silva MCGB. References values and determi-nants for handgrip strength in healthy subjects. Clin Nutr 2008;27:357-62. DOI: 10.1016/j.clnu.2008.03.008
10. Volpini MM, Frangella VS. Avaliação nutricional de idosos institucionalizados. Einstein 2013;11(1):32-40. DOI: 10.1590/S1679-45082013000100007
11. Poziomyck AK, Weston AC, Lameu EB, Cassol OS, Coelho LJ, Morei-ra LF. Preoperative nutritional assessment and prognosis in patients with foregut tumors. Nutr Cancer 2012;64(8):1174-81. DOI: 10.1080/01635581.2012.721157.
12. Silva JB, Maurício SF, Bering T, Correia MITD. The relationship between nutritional status and the Glasgow prognostic score in patients with can-cer of the esophagus and stomach. Nutr Cancer 2013;65(1):25-33. DOI: 10.1080/01635581.2013.741755
13. Bering T, Maurício SF, Braga da Silva J, Correia MITD. Nutritional and meta-bolic status of breast cancer women. Nutr Hosp 2015;31(2):751-8. DOI: 10.3305/nh.2015.31.2.8056
14. Oliveira CMC, Kubrusly M, Mota RS, Choukroun G, Neto JB, Silva CAB. Adductor pollicis muscle thickness: a promising anthropometric parameter for patients with chronic renal failure. J Ren Nutr 2012;22(3):307-16. DOI: 10.1053/j.jrn.2011.07.006
15. Pereira RA, Caetano AL, Cuppari L, Kamimura MA. Adductor pollicis muscle thickness as a predictor of handgrip strength in hemodialysis patients. J Bras Nefrol 2013;35(3):177-84. DOI: 10.5935/0101-2800.20130029
16. Machado AD, Rissotto CM, Martins CTB, Bazanelli AP. Associação entre o consumo energético e proteico e a espessura do músculo adutor do polegar em pacientes em hemodiálise. Cienc Saude 2017;10(1):3-9. DOI: 10.15448/1983-652X.2017.1.24111
17. Cobêro FE, Gomes MCB, Silva AP, Bernardi JLD, McLellan KCP. A medida do músculo adutor do polegar está associada com indicadores antropométricos de avaliação de massa magra e de massa gorda em pacientes hospitaliza-dos. Nutrire: Rev Soc Bras Alim Nutr 2012;37(2):174-82. DOI: 10.4322/nutrire.2012.014
18. Bragagnolo R, Caporossi FS, Dock-Nascimento DB, Aguilar-Nascimento JE. Espessura do músculo adutor do polegar: um método rápido e con-fiável na avaliação nutricional de pacientes cirúrgicos. Rev Col Bras Cir 2009;36(5):371-6. DOI: 10.1590/S0100-69912009000500003
19. Melo CYSV, Silva SA. Músculo adutor do polegar como preditor de desnu-trição em pacientes cirúrgicos. ABCD Arq Bras Cir Dig 2014;27(1):13-7. DOI: 10.1590/S0102-67202014000100004
20. Gonzalez CG, Duarte RRP, Orlandi SP, Bielemann RM, Barbosa-Silva TG. Adductor pollicis muscle: a study about its use as a nutritional parame-ter in surgical patients. Clin Nutr 2015;34(5):1025-9. DOI: 10.1016/j.clnu.2014.11.006
21. Valente KP, Silva NMF, Faioli AB, Barreto MA, Moraes RAG, Guandalini VR. Espessura do músculo adutor do polegar na avaliação nutricional de pacientes cirúrgicos. Einstein 2016;14(1):18-24. DOI: 10.1590/S1679-45082016AO3596
22. Caporossi FS, Caporossi C, Dock-Nascimento DB, Aguilar-Nascimento JE. Measurement of the thickness of the adductor pollicis muscle as a predic-tor of outcome in critically ill patients. Nutr Hosp 2012;27(2):490-5. DOI: 10.1590/S0212-16112012000200021
23. Ghorabi S, Ardehali H, Amiri Z, Shariatpanahi ZV. Association of the adductor pollicis muscle thickness with clinical outcomes in intensive care unit patients. Nutr Clin Pract 2016;31(4):523-6. DOI: 10.1177/0884533615621547
24. Karst FP, Vieira RM, Barbiero S. Relação da espessura do músculo adutor do polegar e avaliação subjetiva global em unidade de terapia intensiva car-

1065
[Nutr Hosp 2018;35(5):1059-1065]
ASSOCIATION BETWEEN ADDUCTOR POLLICIS MUSCLE THICKNESS AND NUTRITIONAL PARAMETERS IN HOSPITALIZED ELDERLY PATIENTS
diológica. Rev Bras Ter Intensiva 2015;27(4):369-75. DOI: 10.5935/0103-507X.20150062
25. El Kik RM, Raasch J, Rosa MC, Gomes I, Schwanke CHA. Espessura do músculo adutor do polegar em idosos hospitalizados: relação com sexo e idade. Cien Saude 2017.
26. Margutti KMM, Pereira LL, Schuch NJ, Blasi TC, Schwanke CHA. Espessura do músculo adutor do polegar e estado nutricional em idosos hospitalizados. Persp 2017;41(153):43-52.
27. Najas M. Consenso Brasileiro de Nutrição e Disfagia em Idosos Hospitalizados Barueri: Minha Editora; 2011.
28. Souza R, Fraga JS, Gottschall CBA, Busnello FM, Rabito EI. Avaliação antro-pométrica em idosos: estimativas de peso e altura e concordância entre classificações de IMC. Rev Bras Geriatr Gerontol 2013;16(1):81-90. DOI: 10.1590/S1809-98232013000100009.
29. Lipschitz DA. Screening for nutritional status in the elderly. Nutr In Old Age 1994;21:55-67.
30. Callaway CW, Chumlea WMC, Bouchard C, Himes JH, Lohman TG, Martin AD, et al. Circumferences. In: Lohman TG, Roche AF, Martorell R, eds. Anthro-pometric standardization reference manual. 15th ed. United States: Human Kinetics Books; 1988. pp. 39-54.
31. Innes E. Handgrip strength testing: a review of literature. Aust Occup Ther J 1999;46(3):120-40. DOI: 10.1046/j.1440-1630.1999.00182.x
32. Ministério da Saúde. Conselho Nacional de Saúde. Resolução n. 466, de 12 de dezembro de 2012. Dispõe sobre as diretrizes e normas regulamen-tadoras de pesquisas envolvendo seres humanos. Brazil; 2012. Accessed on Aug 10 2017. Available from: http://bvsms.saude.gov.br/bvs/saudelegis/cns/2013/res0466_12_12_2012.html
33. Hanusch FD, Da Silva MGB, Prado LVS, Costa MDS, Gadelha PCFP. Ava-liação nutricional de pacientes submetidos à cirurgia do trato gastrointes-tinal: associação entre avaliação subjetiva global, ferramentas de triagem
nutricional e métodos objetivos. Nutr Clin Diet Hosp 2016;36(2):10-9. DOI: 10.12873/362daysa
34. Soares ALG, Mussoi TD. Mini-avaliação nutricional na determinação do risco nutricional e de desnutrição em idosos hospitalizados. Rev Bras Nutr Clin 2014;29(2):105-10. Available from: http://www.sbnpe.com.br/wp-content/uploads/2016/12/03-Mini-avaliacao-nutricional.pdf
35. Cereda E, Pedrolli C, Klersy C, Bonardi C, Quarleri L, Cappello S, et al. Nutri-tional status in older persons according to healthcare setting: a systema-tic review and meta-analysis of prevalence data using MNA®. Clin Nutr 2016;35(6):1282-90. DOI: 10.1016/j.clnu.2016.03.008
36. Zanchim MC, Liberali R, Coutinho V. Estado nutricional de idosos hospitaliza-dos em um hospital geral de alta complexidade do Estado do Rio Grande do Sul. Rev Bras Nutr Clin 2013;28(4):292-9. Available from: http://www.sbnpe.com.br/wp-content/uploads/2016/12/07-Estado-nutricional-de-idosos.pdf
37. Morais FTD, Campos IC, Lessa NMV. Diagnóstico nutricional em idosos hos-pitalizados. Nutrir Gerais 2010;4(7):637-51. Available from: https://www.unilestemg.br/nutrirgerais/downloads/artigos/volume4/edicao_07/diagnos-tico-nutricional.pdf
38. Panissa CO, Vassimon HS. Risco de desnutrição de idosos hospitalizados: avaliando ingestão alimentar e antropometria. Demet 2012;7(1):13-22. Available from: http://www.e-publicacoes.uerj.br/index.php/demetra/article/view/3275/2270#.Wcmt-WhSyUk
39. Fidelix MSP, Santana AFF, Gomes JR. Prevalência de desnutrição hospitalar em idosos. Rasb 2013;5(1):60-8. Available from: https://www.rasbran.com.br/rasbran/article/view/8/10
40. Guerra RS, Fonseca I, Pichel F, Restivo MT, Amaral TF. Handgrip strength and associate factors in hospitalized patients. JPEN J Parenter Enteral Nutr 2015;39(3):322-30. DOI: 10.1177/0148607113514113
41. Camarano AA. Mulher idosa: suporte familiar ou agente de mudança? Estu-dos Avançados 2003;17(49):35-63.

NutriciónHospitalaria
Trabajo Original Nutrición en el anciano
ISSN (electrónico): 1699-5198 - ISSN (papel): 0212-1611 - CODEN NUHOEQ S.V.R. 318
Correspondence: Carlos H. Orces. Department of Medicine. Laredo Medical Center. 1700 East Saunders. 78041 Laredo, Texas e-mail: [email protected]
Orces CH. The association between obesity and vitamin D status among older adults in Ecuador: analysis of the SABE survey. Nutr Hosp 2018;35(5):1066-1071
DOI: http://dx.doi.org/10.20960/nh.1752
The association between obesity and vitamin D status among older adults in Ecuador: analysis of the SABE survey La asociación entre obesidad y el estatus de vitamina D entre los adultos mayores en Ecuador: análisis de la encuesta SABE
Carlos H. Orces
Department of Medicine. Laredo Medical Center. Laredo, Texas
Palabras clave:
Obesidad. Adultos mayores. Vitamina D. Ecuador.
Resumen Antecedentes: aunque está bien establecido que la masa adiposa corporal esta inversamente asociada con las concentraciones de vitamina D (25[OH]D), no se ha descrito si la obesidad aumenta el riesgo de insuficiencia de 25(OH)D entre los adultos mayores en Ecuador.
Métodos: el presente estudio utiliza datos de la Encuesta Nacional de Salud, Bienestar y Envejecimiento (SABE) para describir la prevalencia de la obesidad y la insuficiencia de 25(OH)D (< 20 ng/ml) entre los ecuatorianos de 60 años de edad o mayores. Modelos de regresión logística se usaron para examinar la asociación independiente entre la obesidad y la insuficiencia de 25(OH)D.
Resultados: un total de 2.270 individuos con un promedio de edad de 71,5 (DE 8,1) años participaron en el estudio, el cual representa un estimado de 1,1 millones adultos mayores en Ecuador. La prevalencia de obesidad fue del 19,2%, y el 14,0% de los hombres y el 34,6% de las mujeres fueron clasificados con insuficiencia de 25(OH)D. En general, la prevalencia de insuficiencia de 25(OH)D entre las mujeres se mantuvo aumentada a través de las categorías de índice de masa corporal (IMC). En contraste, las tasas de prevalencia de insuficiencia de 25(OH)D en los hombres aumentaron progresivamente a medida que las categorías de IMC también aumentaron. Por otra parte, los hombres obesos mayores (OR 2,04; IC 95%: 1,99-2,09) fueron dos veces más propensos a tener insuficiencia de 25(OH)D en comparación con los que tenían un peso ideal, incluso después del ajuste por factores de confusión. En las mujeres, esta asociación fue atenuada. Sin embargo, las tasas de prevalencia de insuficiencia de 25(OH)D fueron un 12,0% mayores en mujeres obesas (OR 1,12, IC 95%: 1,11-1,14) que en sus contrapartes de peso normal.
Conclusión: la obesidad en los adultos mayores se asocia con un aumento en el riesgo de insuficiencia de 25 (OH)D en Ecuador. Por lo tanto, los adultos mayores con obesidad deberían recibir suplementos de vitamina D y consejos acerca de modificaciones del estilo de vida para mejorar el estatus de 25(OH)D.
Key words:
Obesity. Older adults. Vitamin D. Ecuador.
Abstract Background: although it is well established that body fat mass is inversely associated with vitamin D (25[OH]D) concentrations, little is known whether obesity increases the risk of 25(OH)D insufficiency among older adults in Ecuador.
Methods: the present study used data from the National Survey of Health, Wellbeing, and Aging to describe the prevalence of obesity and 25(OH)D insufficiency (< 20 ng/ml) among Ecuadorians aged 60 years and older. Logistic regression models were used to examine the independent association between obesity and 25(OH)D insufficiency.
Results: a total of 2,270 participants with a mean age of 71.5 (SD 8.1) years comprised the sample size, representing an estimated 1.1 mil-lion older adults in Ecuador. Overall, the crude prevalence of obesity was 19.2% and 25(OH)D insufficiency was present in 14.0% of men and 34.6% of women. Moreover, the proportion of women with 25(OH)D insufficiency remained steady across BMI categories. In contrast, 25(OH)D insufficiency prevalence rates in men increased progressively as body mass index (BMI) categories also increase. Moreover, obese older men (OR 2.04; 95% CI: 1.99-2.09) were two times more likely to have 25(OH)D insufficiency compared with those defined as having an ideal weight, even after adjustment for potential confounders. In women, this association was attenuated. However, 25(OH)D insufficiency prevalence rates remained 12% higher in obese women (OR 1.12; 95% CI: 1.11-1.14) than their normal weight counterparts.
Conclusion: obesity is associated with increased risk of 25(OH)D insufficiency in Ecuador. Thus, obese older adults should be offered vitamin D supplementation and counseled regarding lifestyle modifications to improved their 25(OH)D status.
Received: 06/01/2018 • Accepted: 04/03/2018
©Copyright 2018 SENPE y ©Arán Ediciones S.L. Este es un artículo Open Access bajo la licencia CC BY-NC-SA (http://creativecommons.org/licenses/by-nc-sa/4.0/).

1067
[Nutr Hosp 2018;35(5):1066-1071]
THE ASSOCIATION BETWEEN OBESITY AND VITAMIN D STATUS AMONG OLDER ADULTS IN ECUADOR: ANALYSIS OF THE SABE SURVEY
INTRODUCTION
Vitamin D deficiency leads to alterations in calcium and phos-phorus homeostasis, resulting in secondary hyperparathyroidism with increased bone turnover, progressive bone loss, and increased risk of fractures (1,2). Numerous studies have demonstrated lower serum total 25-hydroxyvitamin D (25[OH]D) concentrations in obese subjects compared with their non-obese counterparts (3-10). Although the precise mechanism of decreased 25(OH)D levels in obesity has not been fully elucidated, research find-ings suggest that increased metabolic clearance and enhanced uptake of vitamin D by adipose tissue or decreased bioavailability of vitamin D once it is deposited in fat tissue may account for this finding (3,4). Moreover, Drincic et al. recently described that sim-ple volumetric dilution may be the most parsimonious explanation for the low vitamin D status in obesity (5).
Aging is characterized by a reduction of muscle, bone mass, and strength levels with a concomitant increase of body fat mass, especially visceral fat mass (11). Moreover, older adults are partic-ularly at higher risk of 25(OH)D deficiency because sunlight expo-sure is usually limited as a result of lifestyle changes. Likewise, the total production of previtamin D
3 after exposure to solar ultraviolet
B radiation also decreases considerably with aging (12,13). In Ecuador, despite abundant sunlight throughout the year, a recent study among older adults reported a high prevalence of 25(OH)D insufficiency predominantly in women, indigenous, and residents in the Andes Mountains region of the country. In addition, subjects defined as having obesity had lower 25(OH)D concentrations com-pared with their non-obese counterparts (14). Because obesity is potentially a modifiable risk factor of 25(OH)D insufficiency, the present study aimed to extend previous research findings by examining the association between obesity and 25(OH)D status in a nationally representative sample of older adults in Ecuador.
METHODS
The present study was based on data from the National Sur-vey of Health, Wellbeing, and Aging (Encuesta National de Salud, Bienestar, y Envejecimiento; SABE II). Briefly, this survey is a probability sample of households with a least one person aged 60 years or older residing in the Andes Mountains and coastal regions of Ecuador. The SABE survey complex sampling design has been described elsewhere (15). Between April and August 2010, participants had biochemical evaluation to determine their nutritional status, including 25(OH)D concentrations. The survey data, including operation manuals, are publicly available and can be downloaded from the SABE survey website (16).
CHARACTERISTICS OF SUBJECTS
Age, sex, and race (white, black, mestizo, mulatto, or indige-nous) were self-reported. Subjects were asked about their region (coastal vs mountains) and area of residence (urban vs rural). Lit-
eracy was defined by answering affirmatively to the question “Can you write and read a message”. Smoking status was classified as current, former and never, and physical activity was evaluated by the question “Do you exercise regularly such as jogging and dancing, or have you performed rigorous work at least three times weekly for the past year?” Participants who responded affirma-tively were considered to engage in vigorous physical activity. Self-reported general health was grouped as excellent to good or fair to poor.
Body height in centimeters and weight in kilograms were mea-sured and the body mass index (BMI) was calculated (kg/cm2). BMI was classified into three categories: under/normal (< 25 kg/m2), overweight (25-29.9 kg/m2), and obese (≥ 30 kg/m2) (17).
Subjects were defined as having diabetes according to the American Diabetes Association 2017 criteria if they reported a physician diagnosis of diabetes or had a fasting plasma glucose ≥ 126 mg/dl (18). Serum 25(OH)D was measured by liquid chro-matography at NetLab laboratory (Quito, Ecuador). The lowest limit of detection for the serum 25(OH)D assay was 4 ng/ml. A serum 25(OH)D < 20 ng/ml was the cut-off level to define subjects with 25(OH)D insufficiency as recommended by the Institute of Med-icine (19).
STATISTICAL ANALYSIS
The descriptive characteristics of participants were stratified by BMI categories and examined using the ANOVA and Chi-square test for continuous and categorical variables, respectively. Data for men and women were analyzed separately since the prevalence of 25(OH)D insufficiency and obesity differed by gender among older adults in Ecuador (14,20). Subsequently, sex-specific multivariate logistic regression models were assembled in stages to evaluate the independent associations between BMI categories and the prevalence of 25(OH)D insufficiency. The first model was adjusted for age, race, and area of residency. A second model was further adjusted for literacy, smoking status, physical activity, self-re-ported health, and diagnosis of diabetes. Of 2,375 participants who completed the biochemical evaluation, 105 subjects were excluded from this analysis because of missing data on 25(OH)D concentrations (n = 5) and BMI (n = 100) measurements. All analyses used sample weights to account for nonresponse and the unequal probability of selection of the SABE survey and thus provide estimates representative of the older adult population in Ecuador. Statistical analyses were performed using SPSS, version 17 software (SPSS Inc., Chicago, IL).
RESULTS
A total of 2,270 participants with a mean age of 71.5 (SD 8.1) years comprised the sample size, representing an estimated 1.1 million older adults in Ecuador. Table I shows the demographic, behavioral, and health characteristics of participants. In general, women and self-reported race as mestizo accounted for 55.1%

1068 C. H. Orces
[Nutr Hosp 2018;35(5):1066-1071]
Figure 1.
Prevalence of 25(OH)D insufficiency according to BMI categories.
Table I. Characteristics of participants in the SABE survey
Characteristics Participants Weighted % (SE)
Age (years)
60-69 1,069 47.5 (1.3)
70-79 754 33.7 (1.3)
≥ 80 447 18.8 (1.0)
Gender
Women 1,239 55.1 (1.3)
Men 1,031 44.9 (1.3)
Race
Indigenous 198 10.2 (0.9)
Black 75 3.4 (0.5)
Mestizo 1,524 68.9 (1.3)
Mulatto 80 3.5 (0.5)
White 253 12.1 (0.9)
Other 44 1.9 (0.3)
Area of residency
Urban Andes Mountains 663 30.2 (1.2)
Urban coast 827 36.5 (1.3)
Rural Andes Mountains 482 20.1 (1.0)
Rural coast 298 13.2 (0.9)
BMI (kg/m2)
Normal 947 42.7 (1.3)
Overweight 890 38.1 (1.3)
Obesity 433 19.2 (1.1)
Literacy
Yes 1,606 70.1 (1.2)
No 662 29.9 (1.2)
Vigorous physical activity
Yes 739 34.1 (1.3)
No 1,530 65.9 (1.3)
Smoking status
Current 239 11.1 (0.9)
Former 632 28.8 (1.2)
Never 1,349 60.0 (1.3)
Self-reported health
Good to excellent 544 25.2 (1.1)
Fair to poor 1,721 74.8 (1.1)
Diabetes
Yes 394 16.9 (1.0)
No 1,842 83.1 (1.0)
Vitamin D insufficiency
Yes 569 25.4 (1.1)
No 1,701 74.6 (1.1)
and 68.9% of the participants, respectively. In addition, the crude prevalence of obesity was 19.2% and 25.4% of subjects were defined as having 25(OH)D insufficiency.
Table II shows the characteristics of participants stratified according to BMI categories. Overall, women, residents in the urban Andes Mountains, and subjects defined as having diabetes had higher obesity prevalence rates than those without. Moreover, obese subjects had significantly lower 25(OH)D concentrations compared with their non-obese counterparts. Likewise, obesity prevalence rates were higher among older adults with 25(OH)D insufficiency than in those without. As shown in figure 1, the prev-alence of 25(OH)D insufficiency was considerably higher in women and remained steady across BMI categories. In contrast, 25(OH)D insufficiency prevalence rates in men increased progressively as BMI categories also increase.
As shown in table III, obese older men were two times more likely to have 25(OH)D insufficiency compared with those defined as having an ideal weight. Moreover, this strong association per-sisted even after adjusting for sociodemographic, behavioral, and health characteristics of the participants. In women, obesity was weakly associated with an inadequate 25(OH)D status. However, the prevalence of 25(OH)D insufficiency remained 12% higher in obese women compared with their normal weight counterparts.
DISCUSSION
The present findings indicate that obese older Ecuadorians had higher 25(OH)D insufficiency prevalence rates than their normal weight counterparts. This relationship was particularly evident in men. Indeed, older men with obesity had two-fold higher odds of having 25(OH)D insufficiency compared with those classified having a normal weight even after adjusting for sociodemographic characteristics previously associated with a high prevalence of 25(OH)D insufficiency nationwide (14). In contrast, obese women were not significantly associated with inadequate 25(OH)D status,

1069
[Nutr Hosp 2018;35(5):1066-1071]
THE ASSOCIATION BETWEEN OBESITY AND VITAMIN D STATUS AMONG OLDER ADULTS IN ECUADOR: ANALYSIS OF THE SABE SURVEY
which may have been be partly explained by a high prevalence of 25(OH)D insufficiency across BMI categories, but particularly among those defined as having a normal weight. Indeed, up to 36.3% of women with normal weight had evidence of 25(OH)D insufficiency in Ecuador. Similarly, overweight men and women had 11% and 13% lower risk of having 25(OH)D insufficiency than those with an ideal weight, respectively. Of relevance, a recent
study described significantly higher obesity prevalence rates nationwide in women than in men (20). Thus, it is possible that the increased prevalence of 25(OH)D insufficiency in older women may be related to gender differences in body fatness, which has been documented by other investigators (21,22).
The present study results are consistent with those from the Mexican Health and Aging Study in which obese older adults were
Table II. Characteristics of participants according to BMI categoriesNormal Overweight Obese p-value
Age, mean (SD) 72.5 (8.4) 71.1 (7.8) 70.0 (7.3) < 0.0001
Gender, % < 0.0001
Men 52.2 (2.0) 37.7 (1.9) 10.1 (1.1)
Women 35.0 (1.7) 38.4 (1.7) 26.5 (1.7)
Race, % < 0.0001
Indigenous 64.8 (4.2) 26.5 (3.9) 8.8 (2.0)
Black 51.3 (7.0) 35.1 (6.5) 13.4 (4.1)
Mestizo 39.2 (1.6) 39.5 (1.6) 21.2 (1.4)
Mulatto 43.3 (7.1) 37.1 (6.6) 19.5 (4.8)
White 41.3 (3.9) 43.2 (3.8) 15.6 (2.6)
Area of residency, % < 0.0001
Urban Andes Mountains 27.6 (2.2) 47.0 (2.5) 25.3 (2.2)
Urban coast 42.3 (2.2) 35.2 (2.0) 22.5 (1.8)
Rural Andes Mountains 61.2 (2.7) 20.5 (2.5) 22.5 (1.8)
Rural coast 50.1 (3.7) 37.4 (3.5) 12.5 (2.8)
Literacy, % < 0.0001
Yes 37.8 (1.5) 42.7 (1.5) 19.4 (1.2)
No 53.7 (2.5) 27.7 (2.1) 18.6 (2.2)
Vigorous physical activity, % 0.767
Yes 44.0 (2.2) 37.4 (2.2) 18.5 (1.8)
No 42.0 (1.6) 38.4 (1.5) 19.5 (1.3)
Smoking status, % < 0.0001
Current 59.4 (4.0) 29.0 (3.7) 11.6 (2.3)
Former 44.5 (2.5) 40.4 (2.4) 15.2 (1.7)
Never 38.7 (1.7) 38.7 (1.6) 22.5 (1.5)
Self-reported health, % 0.132
Good to excellent 39.6 (2.5) 42.4 (2.5) 18.0 (1.9)
Fair to poor 43.8 (1.6) 36.6 (1.5) 19.6 (1.3)
Diabetes, % < 0.0001
Yes 27.8 (2.9) 39.5 (3.0) 32.7 (3.1)
No 45.2 (1.5) 38.1 (1.4) 16.7 (1.1)
25(OH)D (ng/ml), mean (SD) 28.3 (18.4) 26.2 (10.1) 25.1 (10.9) < 0.0001
Vitamin D insufficiency, % 0.013
Yes 40.0 (2.6) 35.5 (2.4) 24.5 (2.2)
No 43.6 (1.6) 39.0 (1.5) 17.4 (1.2)

1070 C. H. Orces
[Nutr Hosp 2018;35(5):1066-1071]
1.7 times more likely to be associated with 25(OH)D concentrations in the lowest tertile (≤ 20.4 ng/ml) compared with their normal weight counterparts (22). Similarly, results of the Health, Aging and Body Composition Study demonstrated that older obese black and white were 1.5 and 1.3 times more likely to be defined as having 25(OH)D insufficiency, respectively (23). A previous study among participants of the Longitudinal Aging Study Amsterdam also report-ed that higher BMI, waist circumference, and skin folds were statis-tically significantly associated with lower 25(OH)D concentrations. However, the associations of total body fat with serum 25(OH)D lev-els were stronger than the associations of anthropometric measures (23). Furthermore, Young et al. demonstrated that among Hispanic and African-American, 25(OH)D levels were inversely associated with baseline BMI, and computed tomography derived measures of subcutaneous and visceral adipose tissue (25).
Notably, a recent study conducted to examine the effect of BMI categories on 25(OH)D concentrations and bone health demonstrated low free 25(OH)D levels in obesity, which were not due to differences in protein binding. Indeed, serum albumin and vitamin D binding proteins and genotype variation did not differ by BMI categories. Moreover, that particular study provided evidence that lower 25(OH)D concentrations in obesity were not due to more rapid metabolic clearance (9). Although 25(OH)D is fat soluble, and distributed into fat, muscle, liver, and serum, all of these compartments are increased in volume in obesi-ty. Consequently, lower 25(OH)D concentrations likely reflect a volumetric dilution effect, and whole body stores of 25(OH)D may be adequate (26). In a recent study, Carelli et al. reported
that 25(OH)D concentrations measured by mass spectroscopy in omental and subcutaneous adipose tissue did not signifi-cantly differ in obese and normal weigh women. However, total body vitamin D stores were significantly greater in obese women than in their normal weight counterparts. Thus, these findings also support the hypotheses that the enlarged adipose mass in obese individuals serves as a reservoir for vitamin D and that the increased amount of vitamin D required to saturate this depot may predispose obese individuals to inadequate serum 25(OH)D (27). Of relevance, a large study conducted among healthy volunteers in the province of Alberta, Canada, demonstrated that the differences in serum 25(OH)D between normal, overweight, and obese subjects significantly differed by supplementation dose. For instance, supplementation with 600 IU per day would achieve a mean serum 25(OH)D levels of 33.2, 30.4, and 26.4 ng/ml in normal weight, overweight, and obese participants, respectively. Moreover, a mean serum 25(OH)D concentration of 40 ng/ml in normal, overweight, and obese subjects, was estimated to require 2,080 IU, 3,065 IU, and 5,473 IU per day, respectively (28). However, as previously described, overweight and obese subjects were less likely to use any dietary or vitamin supplements compared with their normal weight counterparts (29). Therefore, it is possible that the increased prevalence of 25(OH)D insufficiency among obese Ecuadorians may be partly explained by the low use of vitamin D supplements. However, this hypothesis may not be confirmed because no previous study has reported the prevalence of vitamin D supplement use among older adults in Ecuador. Of interest, results of a recent system-atic review of randomized and nonrandomized control weight-loss trials reported that the effect of weight loss on circulating 25(OH)D levels, random assignment to weight loss compared with weight maintenance resulted in a small but significant-ly greater increase in serum 25(OH)D of 0.44 ng/ml. Similar results were found for nonrandomized trials (30). Thus, based on these findings, older obese subjects should be offered vitamin D supplementation and lifestyle modifications to improve their 25(OH)D status.
Several limitations should be mentioned while interpreting the pres-ent study results. First, the temporal relationship between obesity and 25(OH)D status may not be established due to the cross-sectional study design. Second, participants self-reported their demographic and certain behavioral characteristics, which may be a source of recall bias. Third, the dietary intake of and use of vitamin D supplements was not assessed in the survey. Fourth, participant’s sunlight exposure was not examined. Fifth, because traditional anthropometric measures of adiposity such as BMI are weaker than direct measures of adiposity, it is possible that the association between obesity and 25(OH)D may be underestimated in the present study (25). Finally, the present study findings may be generalized to older adults residing in the coastal and Andes Mountains regions of the country.
In conclusion, obesity is associated with increased risk of 25(OH)D insufficiency among older adults in Ecuador. Thus, obese older subjects should be offered vitamin D supplementation and counseled regarding lifestyle modifications to improve their 25(OH)D status.
Table III. Association between BMI categories and 25(OH)D insufficiency among older adults in Ecuador, SABE
survey
Normal Overweight Obese
Men
Reference OR (95% CI) OR (95% CI)
Model 1 1.00 0.84 (0.82-0.85) 1.83 (1.78-1.87)
Model 2 1.00 0.89 (0.87-0.91) 2.04 (1.99-2.09)
Women
Reference OR (95% CI) OR (95% CI)
Model 1 1.00 0.95 (0.93-0.96) 0.95 (0.93-0.96)
Model 2 1.00 0.87 (0.86-0.89) 1.12 (1.11-1.14)
Total
Reference OR (95% CI) OR (95% CI)
Model 1 1.00 0.93 (0.92-0.94) 1.23 (1.21-1.24)
Model 2 1.00 0.89 (0.88-0.90) 1.26 (1.24-1.27)
Model 1: adjusted for age, race, and place of residency. Model 2: Adjusted for model 1 and literacy, smoking status, physical activity, self-reported health, and diagnosis of diabetes.

1071
[Nutr Hosp 2018;35(5):1066-1071]
THE ASSOCIATION BETWEEN OBESITY AND VITAMIN D STATUS AMONG OLDER ADULTS IN ECUADOR: ANALYSIS OF THE SABE SURVEY
REFERENCES
1. Holick MF. Vitamin D deficiency. N Engl J Med 2007;357:266-81.2. Lips P. Vitamin D deficiency and secondary hyperparathyroidism in the elder-
ly: consequences for bone loss and fractures and therapeutic implications. Endocr Rev 2001;22:477-501.
3. Liel Y, Ulmer E, Shary J, Hollis BW, Bell NH. Low circulating vitamin D in obesity. Calcif Tissue Int 1988;43:199-201.
4. Wortsman J, Matsuoka LY, Chen TC, Lu Z, Holick MF. Decreased bioavailability of vitamin D in obesity. Am J Clin Nutr 2000;72:690-3.
5. Drincic AT, Armas LA, Van Diest EE, Heaney RP. Volumetric dilution, rather than sequestration best explains the low vitamin D status of obesity. Obesity (Silver Spring) 2012;20:1444-8.
6. Blum M, Dolnikowski G, Seyoum E, Harris SS, Booth SL, Peterson J, et al. Vitamin D(3) in fat tissue. Endocrine 2008;33:90-4.
7. Samuel L, Borrell LN. The effect of body mass index on optimal vitamin D status in U.S. adults: the National Health and Nutrition Examination Survey 2001-2006. Ann Epidemiol 2013;23:409-14.
8. Arunabh S, Pollack S, Yeh J, Aloia JF. Body fat content and 25-hydroxyvitamin D levels in healthy women. J Clin Endocrinol Metab 2003;88:157-61.
9. Walsh JS, Evans AL, Bowles S, Naylor KE, Jones KS, Schoenmakers I, et al. Free 25-hydroxyvitamin D is low in obesity, but there are no adverse asso-ciations with bone health. Am J Clin Nutr 2016;103:1465-71.
10. Shea MK, Houston DK, Tooze JA, Davis CC, Johnson MA, Hausman DB, et al. Health, Aging and Body Composition Study. Correlates and prevalence of insu-fficient 25-hydroxyvitamin D status in black and white older adults: the health, aging and body composition study. J Am Geriatr Soc 2011;59:1165-74.
11. Jura M, Kozak LP. Obesity and related consequences to ageing. Age (Dordr) 2016;38:23. DOI: 10.1007/s11357-016-9884-3.
12. MacLaughlin J, Holick MF. Aging decreases the capacity of human skin to produce vitamin D3. J Clin Invest 1985;76:1536-8.
13. Van der Wielen RP, Löwik MR, Van den Berg H, De Groot LC, Haller J, Moreiras O, et al. Serum vitamin D concentrations among elderly people in Europe. Lancet 1995;346:207-10.
14. Orces CH. Vitamin D status among older adults residing in the littoral and Andes Mountains in Ecuador. Sci World J 2015;2015:545297. DOI: 10.1155/2015/545297
15. Guevara PE, Andrade FC. Socioeconomic and lifestyle factors associated with chronic conditions among older adults in Ecuador. Rev Panam Salud Publica 2015;38:226-32.
16. Instituto Nacional de Estadística y Censos. Encuesta de Salud, Bienestar del Adulto Mayor. Quito, Ecuador. Accessed on Nov 23rd 2017. Available from: http://www.ecuadorencifras.gob.ec/encuesta-de-salud-bienestar-del-adulto-mayor
17. Centers for Disease Control and Prevention. About adult BMI. Accessed on Nov 23rd 2017. Available from: https://www.cdc.gov/healthyweight/asses-sing/bmi/adult_bmi/index.html
18. American Diabetes Association. 2. Classification and Diagnosis of Diabetes. Diabetes Care 2017;40:S11-S24.
19. Institute of Medicine. Dietary Reference Intakes for Calcium and Vitamin D. Washington DC: National Academies Press; 2010.
20. Orces CH, Montalvan M, Tettamanti D. Prevalence of abdominal obesity and its association with cardio metabolic risk factors among older adults in Ecua-dor. Diabetes Metab Syndr 2017;11:S727-33.
21. Van Dam RM, Snijder MB, Dekker JM, Stehouwer CD, Bouter LM, Hei-ne RJ, et al. Potentially modifiable determinants of vitamin D status in an older population in the Netherlands: the Hoorn Study. Am J Clin Nutr 2007;85:755-61.
22. Rontoyanni VG, Ávila JC, Kaul S, Wong R, Veeranki SP. Association between obesity and serum 25(OH)D concentrations in older Mexican adults. Nutrients 2017;31:9. pii: E97. DOI: 10.3390/nu9020097.
23. Shea MK, Houston DK, Tooze JA, Davis CC, Johnson MA, Hausman DB, et al. Health, Aging and Body Composition Study. Correlates and prevalence of insu-fficient 25-hydroxyvitamin D status in black and white older adults: the health, aging and body composition study. J Am Geriatr Soc 2011;59:1165-74.
24. Snijder MB, Van Dam RM, Visser M, Deeg DJ, Dekker JM, Bouter LM, et al. Adiposity in relation to vitamin D status and parathyroid hormone levels: a population-based study in older men and women. J Clin Endocrinol Metab 2005;90:4119-23.
25. Young KA, Engelman CD, Langefeld CD, Hairston KG, Haffner SM, Bryer-Ash M, et al. Association of plasma vitamin D levels with adiposity in Hispanic and African Americans. J Clin Endocrinol Metab 2009;94:3306-13.
26. Walsh JS, Bowles S, Evans AL. Vitamin D in obesity. Curr Opin Endocrinol Diabetes Obes 2017;24:389-394.
27. Carrelli A, Bucovsky M, Horst R, Cremers S, Zhang C, Bessler M, et al. Vitamin D storage in adipose tissue of obese and normal weight women. J Bone Miner Res 2017;32:237-42.
28. Ekwaru JP, Zwicker JD, Holick MF, Giovannucci E, Veugelers PJ. The impor-tance of body weight for the dose response relationship of oral vitamin D supplementation and serum 25-hydroxyvitamin D in healthy volunteers. PLoS One 2014;9:e111265.
29. Radimer K, Bindewald B, Hughes J, Ervin B, Swanson C, Picciano MF. Dietary supplement use by US adults: data from the National Health and Nutrition Examination Survey, 1999-2000. Am J Epidemiol 2004;160:339-49.
30. Mallard SR, Howe AS, Houghton LA. Vitamin D status and weight loss: a syste-matic review and meta-analysis of randomized and nonrandomized controlled weight-loss trials. Am J Clin Nutr 2016;104:1151-9.

NutriciónHospitalaria
Trabajo Original Obesidad y síndrome metabólico
ISSN (electrónico): 1699-5198 - ISSN (papel): 0212-1611 - CODEN NUHOEQ S.V.R. 318
Correspondence: Adryana Cordeiro. Department of Social Applied Nutrition - Micronutrients Research Center (NPqM). Federal University of Rio de Janeiro. Av. Brigadeiro Trompovwsky, s/n. Sub-solo, Bloco J. 21941-590 Ilha do Fundão, Rio de Janeiro. Brazile-mail: [email protected]
Bento C, Matos AC, Cordeiro A, Ramlaho A. Vitamin A deficiency is associated with body mass index and body adiposity in women with recommended intake of vitamin A. Nutr Hosp 2018;35(5):1072-1078
DOI: http://dx.doi.org/10.20960/nh.1630
Vitamin A deficiency is associated with body mass index and body adiposity in women with recommended intake of vitamin A La deficiencia de vitamina A se asocia con el índice de masa corporal y la adiposidad corporal en mujeres con ingesta recomendada de vitamina A
Claudia Bento1, Andréa C. Matos2, Adryana Cordeiro3 and Andréa Ramalho4
1Human Nutrition. University Federal of Rio de Janeiro (UFRJ). Rio de Janeiro, Brazil. 2Medical Clinic. University Federal of Rio de Janeiro (UFRJ). Department of Nutrition and Dietetics. University Federal Fluminense. Micronutrients Research Center (NPqM) of Institute of Nutrition Josué de Castro (INJC) Rio de Janeiro, Brazil. 3Faculty of Medicine. University Federal of Rio de Janeiro (UFRJ). Micronutrients Research Center (NPqM)/Federal University of Rio de Janeiro. Rio de Janeiro, Brazil. 4Public Health. Fundação Oswaldo Cruz (FIOCRUZ). Rio de Janeiro, Brazil. Social Applied Nutrition Department of UFRJ. Micronutrients Research Center (NPqM) of Institute of Nutrition Josué de Castro (INJC). Rio de Janeiro, Brazil
Palabras clave:
Sobrepeso. Obesidad. Retinol. β-caroteno. Ceguera nocturna. Adiposidad corporal.
Resumen Introducción: la evidencia indica que la vitamina A está involucrada en la regulación de la masa grasa. Un bajo consumo de vitamina A ha sido reportado en individuos con obesidad, ya que tienen concentraciones más bajas de esta vitamina que los individuos eutróficos a pesar de que su ingesta dietética de vitamina A no es significativamente diferente.
Objetivo: investigar el estado nutricional de la vitamina A y su asociación con el índice de masa corporal (IMC) y la grasa corporal en las mujeres que tienen la ingesta dietética recomendada de vitamina A.
Métodos: estudio transversal con 200 mujeres, emparejado por edad y por la ingesta dietética de vitamina A recomendada. Se dividieron en cuatro grupos, de acuerdo con el IMC. Los datos antropométricos fueron evaluados (peso, índice de masa corporal [IMC] y circunferencia de la cintura [CC]), así como el diagnóstico de ceguera nocturna (CN). Se midieron los perfiles lipídicos y glicémicos. Los puntos de corte para la deficiencia de las concentraciones séricas de retinol y β-caroteno fueron < 1,05 μmol/l y 40 μg/dl, respectivamente. La ingesta dietética recomendada de vitamina A fue de 700 μg/día.
Resultados: hubo una disminución significativa de las concentraciones de retinol según el IMC (p < 0,001) y CC (p < 0,001). Se observó un comportamiento similar del β-caroteno (p = 0,005, p < 0,001). Encontramos NB en el 7,5% de los casos con sobrepeso (OW) y el 20,0% de los casos con obesidad clase II (OII), y no encontramos alteración funcional en la UE. Niveles inadecuados de retinol y β-caroteno aumentaron la odds ratio para la ocurrencia de OW, obesidad clase I (OI) y OII, al igual que los niveles insuficientes de CC.
Conclusión: incluso con la ingesta recomendada de vitamina A, encontramos una deficiencia bioquímica y funcional del estado nutricional de vitamina A asociada al sobrepeso, la obesidad y la adiposidad corporal.
Key words:
Overweight. Obesity. Retinol. β-carotene. Night blindness. Body adiposity.
Abstract Introduction: evidence indicates that vitamin A is involved in regulating fat mass. A low consumption of vitamin A has been reported in individuals with obesity, as have lower concentrations of this vitamin, than in eutrophic individuals when their dietary intake of vitamin A is not significantly different.
Objective: to investigate vitamin A nutritional status and its association with body mass index (BMI) and body fat in women who have the recommended dietary intake of vitamin A.
Methods: cross-sectional study with 200 women, paired by age and by the dietary intake of vitamin A recommended. Participants were divided into four groups, according to BMI. Anthropometric data were evaluated (weight, BMI and waist circumference [WC]), as well as the diagnosis of night blindness (NB). Lipid and glycemic profiles were measured. The cut-off points for deficiency of serum concentrations of retinol and β-carotene were < 1.05 µmol/l and 40 µg/dl, respectively. The recommended dietary intake of vitamin A was 700 µg/day.
Results: there was a significant drop in retinol concentrations according to BMI (p < 0.001) and WC (p < 0.001). We found β-carotene to behave similarly (p = 0.005; p < 0.001). We found NB in 7.5% of overweight (OW) cases and 20.0% of obesity class II (OII), and no functional alteration was found in the eutrophic group (EU). Inadequate levels of retinol and β-carotene increased the odds ratio for the occurrence of OW, obesity class I (OI) and OII, as well as inadequate WC.
Conclusion: even with recommended intake of vitamin A, we found a biochemical and functional inadequacy of vitamin A nutritional status, associated with overweight, obesity and body adiposity.
Received: 10/10/2017 • Accepted: 02/06/2018
©Copyright 2018 SENPE y ©Arán Ediciones S.L. Este es un artículo Open Access bajo la licencia CC BY-NC-SA (http://creativecommons.org/licenses/by-nc-sa/4.0/).

1073
[Nutr Hosp 2018;35(5):1072-1078]
VITAMIN A DEFICIENCY IS ASSOCIATED WITH BODY MASS INDEX AND BODY ADIPOSITY IN WOMEN WITH RECOMMENDED INTAKE OF VITAMIN A
INTRODUCTION
Obesity is a disease of rising prevalence now considered as one of the greatest public health problems in modern society. It is esti-mated that 65% of the world‘s population lives in countries where overweight and obesity kill more people than malnutrition (1).
Over the last 20 years, the prevalence of female obesity has risen from 8% to 16.9% (2). Of total primary healthcare users, 89.7% are women, and 30.6% of those women are overweight, while 19.5% are obese, testament to the enormity of the socio-economic impact that obesity has in Brazil (3,4).
Obesity creates a predisposition to chronic, non-communi-cable diseases, which has a major impact on the health of the working-age population. There are well-established associations between a high BMI and increased morbidity, including from car-diovascular disease, type 2 diabetes mellitus, high blood pres-sure, stroke, and dyslipidemia (5). The key point is that obesity associated with insulin resistance is responsible for mechanisms that trigger the lipid abnormalities observed in individuals with obesity. These alterations may be responsible for increasing the risk of cardiovascular disease and also contribute to increasing oxidative stress in obesity (6).
There is evidence that vitamin A is involved in the regulation of body fat, which suggests that when vitamin A is deficient (VAD) there occurs an increase in the recruitment of preadipocytes into adipocytes, inhibition of apoptosis, and an increase of adaptive thermogenesis (7,8). Additionally, there are studies supporting that the increase of BMI can be associated with lowest concentrations of serum vitamin A, which suggests that VAD may play a part in the growth of obesity (9,10).
Using anthropometric indicators as predictors of antioxidant insufficiency, we found BMI and waist circumference to have an inverse association with retinol and β-carotene in humans (11). In some studies with adult participants, serum β-carotene was found to have a negative association with BMI, body fat percentage, waist circumference and waist-hip ratio (12,13).
There is also research assuming increased BMI to relate directly to oxidative stress, given that the greater the degree of obesity, the more intense the inflammatory condition to which these indi-viduals are exposed, due to the intra-abdominal adipose tissue increasing production of proinflammatory cytokines, which leads to an increase in oxidative stress and consequently, to greater demand for nutrients with antioxidant action, such as vitamin A (14,15). However, there is a dearth of research comparing serum retinol and carotenoid concentrations and standards for vitamin A intake and their relation to BMI and body adiposity. Some studies have demonstrated lower serum retinol and carotenoid concen-trations in individuals with obesity than in eutrophic individuals when their dietary intake of sources of these nutrients, as report-ed in food frequency questionnaires, is not significantly different (16,17).
The aim of this study was to analyze vitamin A nutritional status through biochemical and functional indicators and its association with anthropometric parameters in women from different BMI ranges with recommended intake of vitamin A.
MATERIAL AND METHODS
This is an analytical cross-sectional study with adult women, scheduled for nutritional care in a Nutrition Ambulatory in the referred Municipal Health Center of the city of Rio de Janeiro, in the period from January 2012 to October 2014. All women who attended inclusion criteria were invited to participate in the study. The research was previously approved by the Research Ethics Committee of the Hospital Universitário Clementino Fraga Filho of the Federal University of Rio de Janeiro (protocol of research no. 011/05).
After the initial approach and clarifications about the goals and procedures of the study, all the women who agreed to participate in the study gave a formal authorization by signing the informed consent, thus joining the first stage of the research that comprised an anthropometric assessment and a food intake survey.
The inclusion criteria were: female gender (aged 20-59 years), from all ethnic groups and social classes, scheduled for nutritional care of Health Unit. The following exclusion criteria were applied in the first phase of the research: inadequacy of vitamin A intake (evaluated in the first phase of research), pregnant women and/or nursing mothers, liver diseases (except for non-alcoholic liver disease), malabsorptive syndromes, acute infection, alcoholism, kidney insufficiency, HIV virus carriers, cancer, and use of vitamin A supplements over the last six months.
After the first phase, the sample was divided into four groups according to BMI ranges (18): eutrophic group (EU), overweight group (OW), obesity class I group (OI) and obesity class II (OII) group.
SAMPLE SIZE
A sample size calculation was performed on the basis of the study. It estimated the prevalence of Brazilian adults inadequacy intake of micronutrients (POF 2008-2009) that demonstrated ele-vated inadequacy of vitamin A intake in women about 78,5% in urban and rural areas studied (19). Consequently, the prevalence of adequacy was 21.5%.
To obtain a sample size with 95% of confidence interval, considering an adequacy prevalence of 21.5% with a sampling error of 6%, 155 women would be needed with a recommended dietary intake of vitamin A, according to the Institute of Medicine at the end of research. Based on this calculation, the number of attendance evaluated in a period of 18 months, considering the average weekly attendance in the six months prior to the accom-plishment of the present research, was 1,080 women (Fig. 1).
ANTHROPOMETRIC MEASURES
In this stage of the research, weight and height of the women participating in the study were measured and BMI was calculated according to the cut-off points recommended by the World Health Organization (WHO) (18). Additionally, waist circumference (WC) was measured, using inadequate the cut-off > 80 cm for women, as proposed by the International Diabetes Federation (IDF) (20).

1074 C. Bento et al.
[Nutr Hosp 2018;35(5):1072-1078]
research protocol and, to that aim, they were instructed to appear for the blood collection procedure after a 12-hour fast.
In the second phase of the research, only women who showed the recommended dietary intake of vitamin A were included in accordance with the results of the food intake survey conducted in the previous phase.
BIOCHEMICAL MEASURES OF VITAMIN A AND DIAGNOSIS OF NIGHT BLINDNESS (NB)
The nutritional status of vitamin A was assessed according to biochemical and functional parameters. For biochemical assess-ment of vitamin A, serum concentrations of retinol and β-carotene were quantified by high-performance liquid chromatography with ultraviolet detector (HPLC-UV), and the following cut-off points were used: < 1.05 µmol/l and 40 µg/dl to indicate inadequacy of retinol and β-carotene, respectively (23,24).
In the functional assessment of the nutritional status of vita-min A, the presence of NB was investigated through an interview standardized by the WHO (25).
The interview was composed of the following questions:1. Do you have difficulty to see during the day?2. Do you have difficulty to see in low light or at night?3. Do you have NB?Cases of NB were considered when the answer to question
1 was “No” and, at least, one answer to questions 2 or 3 was “Yes”. If the interviewed had any ophthalmic problem corrected by glasses or contact lens, he/she was asked about the ability to see with them.
DIAGNOSIS OF DM2
The diagnosis of DM2 took place in accordance with the American Diabetes Association (ADA) (26) guidelines previously endorsed by the Brazilian Society of Diabetes, which classifies the levels of blood glucose into ≥ 126 mg/dl (fasting) or > 200 mg/dl (one-off).
OTHERS BIOCHEMICAL MEASURES
For biochemical evaluation, a blood sample was obtained by venipuncture after a 12-hour fast period. Laboratory tests were conducted to evaluate: lipid profile (total cholesterol, triglycerides, high-density lipoprotein cholesterol [HDL-c], low density lipopro-tein cholesterol [LDL-c]) and the following concentrations were considered as normal values: total cholesterol < 200 mg/dl; tri-glycerides < 150 mg/dl; HDL-c > 50 mg/dl; LDL-c < 150 mg/dl. Determinations of triglycerides, total cholesterol and HDL-c were performed by the enzymatic colorimetric method. Reagents for these biochemical evaluations were purchased from Labtest Diagnóstica S.A., Minas Gerais, Brazil. LDL-c fraction was deter-mined in accordance with the Friedewald’s formula.
FOOD FREQUENCY QUESTIONNAIRE FOR VITAMIN A
Women involved in the study were asked separately to recall all the dishes, snacks, or other foods eaten in the 24 hours prior to the survey, regardless of whether the food was eaten inside or outside the house. During data collection, each woman was prompted to make sure that no meal or snack was forgotten. Next, a detailed list of all the ingredients of the dishes, snacks or other foods mentioned in the reported consumed food were collected from each woman via interview. The study participants were then asked to recall how many days they had consumed each of the 15 locally available vitamin A rich foods in the past seven days (21). During training of data collectors, it was stressed that small quan-tities of food eaten less than one tablespoon should be excluded. This was important as foods eaten below the aforementioned quantities would not contribute significantly to nutrient adequacy but would inflate the score. Minimum consumption of one table-spoon of food was better correlated with probability of adequacy. Food frequency questions were double coded and entered into a custom built spreadsheet, which calculated an overall mean daily intake of vitamin A using the vitamin A content of foods as published in the table of the Instituto de Nutrición de Centro América y Panamá (INCAP) (22). Portion size was assessed using a Photographic Atlas of Food Portion Sizes (21).
Vitamin A intake was compared to the values of the daily intake recommended by the Institute of Medicine in 2001. The cut-off point adopted for the recommended dietary intake of vitamin A was 700 µg/day.
A month after the first procedure, all the women participating in the first stage of the study were again scheduled to receive information about the nutritional diagnosis, including intake of vitamin A, in addition to receiving the relevant dietary guidelines. Women who had reached the recommended dietary intake of this vitamin were invited to follow up the previously established
Women considered for inclusion
Eligible to be included(n = 231)
Meeting any of the exclusion criteria
(n = 849)
Fill error and no delivery of records
(n = 31)Included in the
study(n = 200)
Figure 1.
Flow chart describing participant recruitment of the study.

1075
[Nutr Hosp 2018;35(5):1072-1078]
VITAMIN A DEFICIENCY IS ASSOCIATED WITH BODY MASS INDEX AND BODY ADIPOSITY IN WOMEN WITH RECOMMENDED INTAKE OF VITAMIN A
STATISTICAL ANALYSIS
In the statistical analysis, the measures of central tendency and dispersion were calculated and expressed as means and standard deviations for clinical, dietary and biochemical variables. The analysis of variance (ANOVA) and the Bonferroni test for mul-tiple comparisons were used. Pearson correlation coefficient was applied for serum concentrations of retinol and β-carotene with variables related to markers of oxidative stress. The odds ratio was estimated to evaluate the strength of the association between serum concentrations of retinol and β-carotene with biochemi-cal, clinical and anthropometric variables, either the association of inadequacy of serum concentrations of both micronutrients according to BMI ranges. The significance level adopted was 5% (p < 0.05). Statistical analysis was performed using the Statistical Package for the Social Sciences (SPSS) for Windows version 17.
RESULTS
The sample group comprised 200 adult women, who were divided into four groups according to their BMI. Their character-istics are described in table I.
A statistically significant difference between the classes was observed when considering the variable BMI (EU/OW p = 0.04; EU/OI p = 0.02; EU/OII p = 0.03; OW/OI p = 0.02; OW/OII p < 0.00; OI/OII p = 0.01).
Even with the recommended daily intake of vitamin A, the per-centage of vitamin A (retinol and β-carotene) inadequacy was, respectively, 7.5 and 8.8% in the EU, 12.5 and 17.5% in the OW, 17.5 and 25% in the OI and 22.5 and 27.5% in the OII.
When comparing the groups according to the occurrence of NB, a significant difference between them was found (p = 0.002). The breakdown for NB was as follows: 7.5% in overweight women and 12.5% and 20% in women with obesity class I and class 2, respectively. None noted in the eutrophic group of women. The number of women with NB increased in accordance with BMI: three women in the overweight group, seven in the OI group, and ten in the OII group.
The mean of serum retinol and β-carotene concentrations of the groups is presented in table II.
Overweight women were found to be 14.0, 5.1 and 3.5 times more likely to have inadequate retinol, β-carotene concentrations and NB, respectively. The odds ratio increased to 35.3, 17.0 and 7.4, respectively, in OI, and to 65.4, 26.7 and 9.2, respectively, in OII. Women in the overweight, OI and OII groups were 5.1, 7.2 and 8.0 times more likely to have an inadequate WC, respectively (Table III).
A negative correlation was found between the serum retinol and β-carotene concentrations with inadequate WC in the OW groups (r = -0.32/-0.46; p < 0.001), OI (r = -0.56/-0.70; p < 0.001) and OII (r = -0.68/-0.85; p < 0.001), respectively.
A strong correlation was found between serum retinol and β-carotene concentrations in all the groups studied. Proportion-
Table I. General characteristics of the sample stratified by BMI groups
Variables EU OW OI OII p-value
BMI (kg/m²) 22.8 ± 1.1 27.3 ± 1.1 33.0 ± 0.8 37.4 ± 2.6 0.003*
Age (years) 53.0 ± 2.2 52 ± 2.1 53.0 ± 2.3 54.0 ± 2.5 0.831
WC (cm) 79.3 ± 6.1 112.3 ± 10.2 120.3 ± 9.5 120.3 ± 9.5 0.005*
DAIVA (µg) 795.1 ± 49,9 781.5 ± 34.5 756.6 ± 33.7 732.3 ± 26.0 0.065
Mean and standard deviation. BMI: body mass index; DAIVA: daily intake of vitamin A; EU: eutrophic; OI: obesity class I; OII: obesity class II; OW: overweight; WC: waist circumference. *p ≤ 0.005.
Table II. Mean of serum retinol (μmol/l) and ß-carotene (µg/dl) concentrations in
the groups studied
Retinol (μmol/l)ß-carotene
(µg/dl)
Eutrophic 1.3 ± 0.2 61.2 ± 12.1
Overweight 1.0 ± 0.3 43.5 ± 5.9
Obesity class I 0.9 ± 0.3 37.1 ± 5.3
Obesity class II 0.7 ± 0.3 33.1 ± 4.9
p* < 0.001** < 0.005*
Mean and standard deviation. ANOVA test: *p ≤ 0.005; **p ≤ 0.001.
ately to the increase in BMI, the negative correlation with serum retinol and β-carotene levels increased (Table IV).
DISCUSSION
Our research showed an inverse relationship between an increase in BMI and alterations in vitamin A nutritional status, as identified in the women assessed to have lower levels of serum retinol and β-carotene, as well as through the diagnosis of NB. Researchers suggest an inverse association between intake and serum concentrations of antioxidant nutrients, such as vitamin A, in the presence of obesity (27,28). Our findings showed that

1076 C. Bento et al.
[Nutr Hosp 2018;35(5):1072-1078]
the biochemical and functional vitamin A profiles of overweight and women with obesity are in a much worse state than those of eutrophic women, even if their vitamin A intake falls within the recommended dietary guidelines. The findings draw attention to an important facet of VAD on which to reflect, by demonstrating that even while ingesting the recommended daily vitamin A allow-ance, the increased demand for the nutrient was found to relate to an increase in BMI and body adiposity, and in the midst of such weight increases, nutritional vitamin A requirements can be much higher than current recommended allowances.
We found serum retinol and β-carotene concentrations to be significantly higher in eutrophic women compared to women with overweight, obesity class I and obesity class II. In addition, the odds ratio were more elevated for serum retinol and β-carotene deficiency, night blindness and inadequate waist circumference in women with obesity class II. There is a research that compared eutrophic women with those with obesity and the last one had lower concentrations of β-carotene in the blood, a higher concen-tration of endothelial adhesion molecules and greater concentra-tions of blood sugar and insulin, confirming that a rise in body fat leads to increased resistance to insulin, endothelial dysfunction and oxidative stress, and these relate to the processes involved in obesity (29,30). Retinol binding protein 4 (RBP4), which has been referred to as an adipokine that is positively associated with BMI,
when analyzed in overweight women confirmed prior research that serum RBP4 is higher relative to ‘‘normal’’ levels in lean adults (31). Relatively high serum RBP4 in overweight subjects despite lower retinol levels suggested that some of the serum RBP4 in overweight individuals may be functioning unbound to retinol. Elevated RBP4 with excess body fat has been associated with insulin resistance mediated through suppressed GLUT4 trans-porter expression (32).
Otherwise, in a study developed by Nuss et al. (2017) (33), β-carotene was not significantly associated with any indicator of body composition (BMI, fat mass and lean mass) in a group of women. Although body composition influences serum nutrient profiles, parameters related to high body-fat mass, such as oxi-dative stress and inflammation may influence such changes in nutrient levels (33).
There is a study reporting low vitamin A intake as a factor causing VAD in overweight individuals (28). Indeed, inadequate vitamin A consumption was noted in 70% of the 738 women assessed during the first phase of our research, and these find-ings are in line with the most recent nationwide dietary survey, which revealed a 78.0% magnitude of inadequate vitamin A intake across all the regions studied, both in urban and rural Brazil. Such findings are a cause for concern, given the important role this nutrient plays in cellular metabolism.
Table III. Multiple logistic regression analysis of serum retinol and β-carotene deficiency, night blindness and inadequate waist circumference (> 80 cm) in the groups studied
VariablesOW/EU
OR†
OR95%*
OI/EUOR†
OR95%*
OII/EUOR†
OR95%*
Retinol(< 1.05 µmol/l)
14.0 7.0-27.3 35.3 17.6-68.8 65.4 32.7-127.5
β-carotene (< 40 µg/dl)
5.1 2.5-9.9 17.0 8.5-24.6 26.7 13.3-52.0
NB 3.5 1.7-6.8 7.4 3.7-14.4 9.2 4.6-17.9
Inadequate WC 5.1 2.5-9.9 7.2 3.6-14.0 8.0 4.0-15.6
O1/EU: obesity class I/eutrophic; O2/EU: obesity class II/eutrophic; OW/EU: overweight/eutrophic. †OR: odds ratio; OR 95%*: confidence interval of 95%; NB: night blindness; WC: waist circumference.
Table IV. Correlation between serum retinol and β-carotene concentrations in each group studied
Groups Retinol ß-carotene
r p r p
Eutrophic 0.52 < 0.001* 0.66 < 0.001*
Overweight -0.75 < 0.001* -0.81 < 0.001*
Obesity class I -0.74 < 0.001* -0.86 < 0.001*
Obesity class II -0.84 < 0.001* -0.90 < 0.001*
Pearson’s correlation. *p ≤ 0.001.

1077
[Nutr Hosp 2018;35(5):1072-1078]
VITAMIN A DEFICIENCY IS ASSOCIATED WITH BODY MASS INDEX AND BODY ADIPOSITY IN WOMEN WITH RECOMMENDED INTAKE OF VITAMIN A
We found that the percentages of β-carotene insufficiency were higher than those of retinol, and we also noted a mod-erate positive correlation between serum retinol and β-caro-tene concentrations in EU, and a negative strong one in the other groups (OW, OI and OII). Our findings corroborate those of Mecocci et al. (2008) (34), as they show a drop in serum β-carotene concentrations and, at the same time, a drop in circulating retinol values, suggesting more β-carotene is being mobilized for conversion to retinol. These findings may be relat-ed to the greater mobilization of β-carotene for conversion into retinol, since β-carotene is known to be a potent precursor to retinol. This finding is noteworthy given how a drop in serum β-carotene concentrations leads to a rise in oxidative stress (34), suggesting that this antioxidant could be being rerouted to other important functions, like combatting oxidative stress, in order to maintain an adequate retinol nutritional status. It is thus important to maintain serum retinol concentrations in order to keep β-carotene functioning as an antioxidant.
There are also studies showing that a buildup of visceral fat and increase in BMI are linked to an increase in lipid peroxidation and decrease in serum retinol and β-carotene concentrations, and thus accompanies a negative antioxidant system (35,36). Fur-thermore, existing research into vitamin A consumption shows, in such circumstances, vitamin intake to be below the recommended daily allowances (37-39).
The main limitation of this study is related to the assessment of dietary intake, the same limitations presented by all studies based on self-reported dietary recall, in particular, underestimation of consumption. Nevertheless, we see no reason to believe that underreporting could have been different between the groups we assessed.
This study demonstrated that even with the recommended intake of vitamin A, a biochemical and functional inadequacy of vitamin A nutritional status associated with overweight, obesity and body adiposity was found. The findings support the hypothe-sis that vitamin A deficiency in these individuals could arise from the higher metabolism of this nutrient, to which they are more exposed than eutrophic individuals. Demonstrating that these con-ditions may represent an important cause of vitamin A depletion, as well as aggravating factors for vitamin A deficiency.
ACKNOWLEDGMENTS
We thank the National Council of Technological for their research support to this study.
AUTHORSHIP
Bento C, Matos AC, Cordeiro A participated in the conception and design of the study and data analysis, and performed the statistical analysis. Matos AC, Cordeiro A, Ramalho A drafted the manuscript and performed the interpretation of data. Ramalho A coordinated the manuscript and gave final approval.
REFERENCES
1. World Health Organization (WHO). 10 Facts about obesity. Consulted May 2014. Accessed Feb 24th 2017. Available from: http://www.who.int/features/factfiles/obesity/facts/en/
2. Instituto Brasileiro de Geografia e Estatísitca. Pesquisa de Orçamentos Fami-liares. POF 2008-2009. Accessed March 22nd 2017. Available from: http://www.ibge.gov.br/home/presidencia/noticias/noticia_visualiza.php?id_noti-cia=1699&id_pagina=1
3. Ministério da Saúde. Indicadores e Dados Básicos do Brasil – DATASUS 2009. Accessed Dec 22nd 2016. Available from: http://www. datasus.gov.br/db
4. Ministério da Saúde. Sistema de Vigilância Alimentar e Nutricional – SISVAN 2012. Accessed March 23rd 2013. Available from: http://<www.saude.gov.br/nutricao
5. Campbell PT. Obesity: a certain and avoidable cause of câncer. Lancet 2014;384(9945):727-8.
6. Godala M, Materek-Kuśmierkiewicz I, Moczulski D, et al. The risk of plasma vitamin A, C, E and D deficiency in patients with metabolic syndrome: a case-control study. Adv Clin Exp Med 2017;26(4):581-6.
7. Schreiber R, Taschler U, Preiss-LandL K, et al. Retinyl ester hydrolases and their roles in vitamin A homeostasis. Biochim Biophys Acta 2012;23:113-23.
8. Pang XY, Wang S, Jurczak MJ, et al. Retinol saturase modulates lipid meta-bolism and the production of reactive oxygen species. Arch Biochem Biophys 2017;633:93-102.
9. Rumana Yasmeen R, Shanmugam M, Jeyakumar A, et al. The contribution of vitamin A to autocrine regulation of fat depots. Biochim Biophys Acta 2012;1821(1):190-7.
10. Vincenta H, Bourguignonb C, Weltmanc A, et al. Effects of antioxidant supple-mentation on insulin sensitivity, endothelial adhesion molecules, and oxi-dative stress in normal-weight and overweight young adults. Metabolism 2009;58(2):254-62.
11. Stenzel AP, Carvalho R, Jesus P, et al. Serum antioxidant associations with metabolic characteristics in metabolically healthy and unhealthy adolescents with severe obesity: an observational study. Nutrients 2018;10:150.
12. Canas J, Damaso L, Altomare J, et al. Insulin resistance and adiposity in relation to serum b-carotene levels. J Pediatr 2012;161(1):58-64.
13. Martínez-Tomás R, Pérez-Llamas F. Daily intake of fruit and vegetable soups processed in different ways increases human serum b-carotene and lycopene concentrations and reduces levels of several oxidative stress markers in healthy subjects. Food Chem 2012;127-33.
14. Syauqy A, Hsu CY, Rau HH, et al. Association of dietary patterns with com-ponents of metabolic syndrome and inflammation among middle-aged and older adults with metabolic syndrome in Taiwan. Nutrients 2018;10(2):143.
15. Bressan J, Hermsdorff L, Zulet A, et al. Impacto hormonal e inflamatório de diferentes composições dietéticas: ênfase em padrões alimentares e fatores dietéticos específicos. Arq Bras Endocrinol Metab 2009;572-81.
16. Nyyssonen K. Lycopene, lutein and B-carotene as determinants of LDL con-jugated dienes in serum. Atherosclerosis 2010;200:565-72.
17. Wei X, Peng R, Cao J, et al. Serum vitamin A status is associated with obesity and the metabolic syndrome among school-age children in Chongqing, China. Asia Pac J Clin Nutr 2016;25(3):563-70.
18. World Health Organization (WHO). Physical status: the use and interpretation of anthropometry: report of a WHO expert committee. Geneva: WHO; 1995.
19. Araujo MC, Verly Junior E, Junger WL, et al. Independent associations of income and education with nutrient intakes in Brazilian adults: 2008-2009 National Dietary Survey. Public Health Nutr 2014;17(12):2740-52.
20. International Diabetes Federation. The Consensus Worldwide Definition of the Metabolic Syndrome, 2006. Accessed June 20th 2017. Available from: http://www.idf.org/webdata/docs/MetS_def_update2006.pdf
21. Pinheiro ABV, Lacerda EM, Benzecry EH, et al. Tabela para avaliação de con-sumo alimentar em medidas caseiras. Vol. 5; 2001. p. 352.
22. Instituto de Nutrición Centro América y Panamá. Tabla de composición de alimentos para uso en América Latina, 2006. Accessed May 19th 2012. Available from: http://www .incap.org.gt
23. World Health Organization (WHO). Indicators for assessing vitamin A deficien-cy and their application in monitoring and evaluating intervention program-mes. Micronutrient Series, WHO/NUT. 10. Geneva: WHO; 1996.
24. IVACG (International Vitamin A Consultative Group). Improving the vitamin A status of populations. USAID-ILSI. 2003.
25. World Health Organization (WHO). Indicators for assessing vitamin A deficien-cy and their application in monitoring and evaluating intervention programs. WHO/NUT/96.10. Geneva: WHO; 1996.

1078 C. Bento et al.
[Nutr Hosp 2018;35(5):1072-1078]
26. American Diabetes Association (ADA). Classification and diagnosis of diabetes: standards of medical care in diabetes – 2018. Diabetes Care 2018;41(Suppl 1):S13- S27.
27. Kabat GC, Heo M, Ochs-Balcom HM, et al. Longitudinal association of mea-sures of adiposity with serum antioxidant concentrations in postmenopausal women. Eur J Clin Nutr 2016;70(1):47-53.
28. Lefebvre P, Letois F, Sultan A, et al. Nutrient deficiencies in patients with obesity considering bariatric surgery: a cross-sectional study. Surg Obes Relat Dis 2014;10(3):540-6.
29. França BK. Peroxidação lipídica e obesidade: métodos para aferição do estresse oxidativo em obesos. GE J Port Gastrenterol 2013;20(5)199-206.
30. Barbosa K, Bressan J, Zulet M, et al. Influence of dietary intake on plasma biomarkers of oxidative stress in humans. An Sist Sanit Navar 2008;31(3):259-80.
31. Comucci EB, Vasques AC, Geloneze B, et al. Serum levels of retinol binding protein 4 in women with different levels of adiposity and glucose tolerance. Arq Bras Endocrinol Metabol 2014;58(7):709-14.
32. Smith U, Kahn BB. Adipose tissue regulates insulin sensitivity: role of adipogenesis, de novo lipogenesis and novel lipids. J Intern Med 2016;280(5):465-75.
33. Nuss ET, Valentine AR, Zhang Z, et al. Serum carotenoid interactions in pre-menopausal women reveal B-carotene is negatively impacted by body fat. Exp Biol Med 2017;242(12):1262-70.
34. Paganini-Hill A, Kawas CH, Corrada MM. Antioxidant vitamin intake and mor-tality: The Leisure World Cohort Study. Am J Epidemiol 2015;181(2):120-6.
35. Burri B, NeidLinger T, Clifford A. Serum carotenoid depletion follows first-order kinetics in healthy adult women fed naturally low carotenoid diets. J Nutr 2001;131(8):2096-100.
36. Shaker O, Shehaby AA, Zakaria A, et al. Plasma visfatin and retinol binding protein-4 levels in patients with type 2 diabetes mellitus and their relationship to adiposity and fatty liver. Clin Biochem 2011;1457-63.
37. Matos AC, Souza GG, Ramalho A, et al. Effect of vitamin A supplementation on clinical evolution in patients undergoing coronary artery bypass grafting, according to serum levels of zinc. Nutr Hosp 2012;27(6):1981-6.
38. Berry D, Noy N. Signaling by vitamin A and retinol-binding protein in regu-lation of insulin responses and lipid homeostasis. Biochim Biophys Acta 2012;1821(1):168-76.
39. Wang L, Gaziano J, Norkus E, et al. Associations of plasma carotenoids with risk factors and biomarkers related to cardiovascular disease in middle-aged and older women. Am J Clin Nutr 2008;88(3):747-54.

NutriciónHospitalaria
Trabajo Original Obesidad y síndrome metabólico
ISSN (electrónico): 1699-5198 - ISSN (papel): 0212-1611 - CODEN NUHOEQ S.V.R. 318
Causas y componentes del síndrome metabólico en receptores de trasplante renal desde una perspectiva de géneroCauses and components of the metabolic syndrome in renal transplant recipients from a gender perspective
Adelina Martín Salvador1, Rafael Fernández Castillo1, Inmaculada García García1, María José Aguilar Cordero1 y Juan Bravo Soto2
1Departamento de Enfermería. Facultad de Ciencias de la Salud. Universidad de Granada. Granada. 2Servicio de Nefrología Unidad de Hemodiálisis. Hospital Universitario Virgen de las Nieves. Granada
Palabras clave:
Trasplante renal. Alteraciones lipídicas. Hiperlipidemia. Hipertrigliceridemia. Antropometría. Densidad mineral ósea.
ResumenIntroducción: la aparición del síndrome metabólico (SM) entre los receptores renales es una de las mayores complicaciones postrasplante y se asocia con un mayor riesgo de fracaso del injerto y altas tasas de obesidad y diabetes de nueva aparición.
Objetivo: el objetivo de este trabajo es identificar la relación entre la tasa de filtración glomerular medida por dos métodos distintos y los com-ponentes del síndrome metabólico y sus combinaciones en pacientes trasplantados renales según género.
Material y método: la muestra estuvo formada por 500 pacientes trasplantados renales, de los cuales 190 padecían SM, 121 hombres y 69 mujeres. Todos los sujetos se sometieron a evaluación clínica y toma de muestras de sangre para mediciones de laboratorio. El SM se determinó según los criterios del National Cholesterol Education Program Adult Treatment Panel III (NCEP-ATP-III). La función renal se estimó usando ecuaciones AMDRD y determinaciones de creatinina sérica (CrS).
Resultados: la media de edad fue de 55,5 años. La prevalencia del SM fue significativamente mayor en hombres (23,1% < vs. 9,8%). La hipertensión arterial (HTA) fue el componente del SM más observado. Se observaron correlaciones significativas (Pearson; p < 0,05) entre TFG-AMDRD y TFG CrS y marcadores metabólicos más en hombres que en mujeres. El índice de masa corporal (IMC) fue significativamente mayor en mujeres que en hombres.
Conclusiones: la disminución de la función renal asociada con los componentes del SM, la HTA y la obesidad representan un riesgo elevado de eventos cardiovasculares adversos y rechazos del injerto.
Key words:
Kidney transplantation. Lipid alterations. Hyperlipidemia. Hypertriglyceridemia. Anthropometry. Bone mineral density.
AbstractIntroduction: the appearance of metabolic syndrome (MS) among renal recipients is one of the greatest post-transplant complications and is associated with an increased risk of graft failure and high rates of obesity and new onset diabetes.
Objective: the objective of this work is to identify the relationship between the glomerular filtration rate measured by two different methods and the components of the metabolic syndrome and their combinations in kidney transplant patients according to gender.
Material and method: the samples consisted of 500 kidney transplant recipients, of whom 190 had MS, 121 men and 69 women. All sub-jects underwent clinical evaluation and blood sampling for laboratory measurements. The MS was determined according to the criteria of the National Cholesterol Education Program Adult Treatment Panel III (NCEP-ATP-III). Renal function was estimated using AMDRD equations and CrS determinations.
Results: the average age was 55.5 years. The prevalence of MS was significantly higher in men (23.1% < vs 9.8%). High blood pressure (HBP) was the most observed component of MS. Significant correlations (Pearson, p < 0.05) between TFG-AMDRD and TFG CrS and metabolic markers were observed more in men than in women. The body mass index (BMI) was significantly higher in women than in men.
Conclusions: the decrease in renal function associated with the components of MS, HBP and obesity represent a high risk of adverse cardio-vascular events and graft rejections.
Correspondencia: Rafael Fernández Castillo. Departamento de Enfermería. Facultad de Ciencias de la Salud. Parque Tecnológico de Ciencias de la Salud. Universidad de Granada. Av. de la Ilustración, 60. 18016 Granadae-mail: [email protected]
Martín Salvador A, Fernández Castillo R, García García I, Aguilar Cordero MJ, Bravo Soto J. Causas y componentes del síndrome metabólico en receptores de trasplante renal desde una perspectiva de género. Nutr Hosp 2018;35(5):1079-1084
DOI: http://dx.doi.org/10.20960/nh.1717
Recibido: 07/12/2017 • Aceptado: 05/03/2018
©Copyright 2018 SENPE y ©Arán Ediciones S.L. Este es un artículo Open Access bajo la licencia CC BY-NC-SA (http://creativecommons.org/licenses/by-nc-sa/4.0/).

1080 A. Martín Salvador et al.
[Nutr Hosp 2018;35(5):1079-1084]
INTRODUCCIÓN
El concepto de síndrome metabólico (SM) fue descrito por primera vez por Reaven (1) como una combinación de obesidad, dislipidemia, hipertensión e hiperglucemia. El síndrome metabólico aumenta el riesgo de padecer diabetes mellitus, enfermedades cardiovasculares y mortalidad. En la población general, la presencia de síndrome meta-bólico se asocia con un alto riesgo de sufrir diabetes y enfermedades cardiovasculares (2-4). Además, el síndrome metabólico se ha aso-ciado con proteinuria y reducción de la tasa de filtración glomerular (5,6), lo que sugiere que está directamente vinculado con la enfer-medad renal crónica. En la medida en que la diabetes (de aparición reciente después del trasplante), las enfermedades cardiovasculares y la proteinuria son complicaciones comunes del trasplante renal, el papel del síndrome metabólico en el trasplante renal ha atraído recientemente gran interés. Sin embargo, la relevancia del síndrome en el trasplante renal se confunde con el hecho de que la incidencia de enfermedad cardiovascular disminuye realmente después de un trasplante exitoso, en comparación con la observada en pacientes en diálisis en la lista de espera de trasplante (7). Además, no está claro si la presencia del síndrome metabólico predice la diabetes de nueva aparición tras el trasplante, en comparación con los factores de riesgo tradicionales como la edad, el origen étnico, los antecedentes familiares de diabetes y la obesidad (8). Por último, la fisiopatología del síndrome se altera dramáticamente por los efectos de los medica-mentos inmunosupresores en los receptores de trasplante de riñón. A pesar de la amplia literatura científica sobre la relación entre la EM y la ERC, se han realizado pocos estudios para identificar los factores de riesgo asociados con la enfermedad renal en trasplantados renales en ambos sexos. El objetivo de este trabajo es identificar la relación entre la tasa de filtración glomerular medida por dos métodos distintos y los componentes del síndrome metabólico y sus combinaciones en pacientes trasplantados renales según género.
MATERIAL Y MÉTODO
SUJETOS
Se recogieron datos de 500 pacientes trasplantados renales de ambos sexos que acuden de forma periódica a la consulta de Trasplante Renal en el Hospital Universitario Virgen de las Nieves de Granada. No fueron seleccionados mediante procedimientos de muestreo aleatorio y su participación en el estudio viene deter-minada por la asistencia a la consulta para su seguimiento y control. Se incluyeron todos los receptores de trasplante renal de cadáver realizados entre el 1 de junio de 2011 y el 30 de junio de 2016. Los pacientes cumplieron los siguientes criterios de inclusión: a) ausencia de diabetes mellitus antes del trasplante; b) función renal estable al año después del trasplante; y c) cinco años de seguimiento. Quedaron excluidos todos aquellos pacien-tes que no cumplían estos requisitos para la investigación.
Este estudio fue aprobado por el Comité de Ética de la Inves-tigación de Centro de Granada (CEI-GRANADA) y se condujo de acuerdo con sus criterios.
RECOPILACIÓN DE DATOS
Se les pidió a los sujetos que describieran sus hábitos tabáqui-cos (no fumador o fumador) y de consumo de alcohol (no bebedor o bebedor de cualquier cantidad de alcohol). Se obtuvieron carac-terísticas demográficas tales como edad, sexo, antecedentes de diabetes, hipertensión, etc. A todos los pacientes se les efectuaron mediciones antropométricas de peso y altura. El peso se midió mediante una balanza tallímetro Perperson 113481 en kilogramos y la altura se determinó en centímetros. El índice de masa corporal (IMC) fue calculado mediante la fórmula peso/talla² y agrupado según la clasificación de la Organización Mundial de la Salud (OMS) en IMC < 18,5 kg/m2: bajo peso; 18,5-24,99 kg/m2: peso normal; 25-29,99 kg/m2: sobrepeso; y ≥ 30 kg/m2: obesidad.
MEDIDA DE BIOMARCADORES
A todos los pacientes se les realizaron mediciones coincidiendo con los controles analíticos establecidos en nuestra unidad de: colesterol total, lipoproteínas de baja densidad (LDL), lipoproteí-nas de alta densidad (HDL) y concentración de triglicéridos. Las muestras de sangre periférica se extrajeron entre las 8:30 y las 9:00 h de la mañana; bioquímica: 6 ml de sangre en tubo Veno-jet® II (Terumo; autosep®). Las determinaciones de bioquímica se realizaron a 37 °C; se emplearon el analizador automático de química clínica Roche/Hitachi® 747 y los reactivos correspon-dientes, todos ellos suministrados por la compañía Roche. Todas las determinaciones se realizaron en el laboratorio general del Hospital General Virgen de las Nieves de Granada. Los hipoten-sores utilizados fueron betabloqueantes, diuréticos, inhibidores de la enzima convertidora de angiotensina (IECA) y antagonistas del calcio. El protocolo inmunosupresor consistió en una triple terapia a base de prednisona, ciclosporina (CsA) o tacrólimus y micofenaloto mofetilo (MMF) o azatriopina (AZA).
DEFINICIÓN DE SÍNDROME METABÓLICO
El SM se definió según el National Cholesterol Education Pro-gram Adult Treatment Panel III (NCEP-ATP-III) (9), que establece el diagnóstico por la presencia de al menos tres de los siguientes criterios: obesidad usando el IMC ≥ 30 kg/m2; triglicéridos (TG) ≥ 150 mg/dl o en tratamiento; colesterol HDL < 40 mg/dl para hombres o < 50 mg/dl para mujeres; presión arterial sistólica ≥ 130 mmHg, y diastólica ≥ 85 mmHg; y/o tratamiento antihiper-tensivo y determinación de glucemia en ayunas ≥ 100 mg/dl o en tratamiento diabético.
EVALUACIÓN DE LA FUNCIÓN RENAL
La función renal se midió mediante dos métodos de estimación de la tasa de filtración glomerular (TFG): ecuación modification of diet in renal disease (MDRD) y aclaramiento de creatinina sérica (CrS).

1081CAUSAS Y COMPONENTES DEL SÍNDROME METABÓLICO EN RECEPTORES DE TRASPLANTE RENAL DESDE UNA PERSPECTIVA DE GÉNERO
[Nutr Hosp 2018;35(5):1079-1084]
Se calculó la TFG según la ecuación MDRD: TFGe (ml/min/1,73 m2) = 175 x (CrS)-1,154 x (edad)-0,203 x (0,742 si es mujer).
El segundo método se realizó mediante la determinación en sangre la creatinina sérica (CrS) usando la reacción cinética de Jaffé: la creatinina reacciona en una solución alcalina con picrato formando un complejo de color rojo, se determina midiendo el aumento de absorbancia a 512 nm y la velocidad de formación del complejo es directamente proporcional a la concentración de creatinina. Un resultado normal es de 0,7-1,3 mg/dl para los hombres y de 0,6-1,1 mg/dl para las mujeres. Los valores nor-males son entre 0,8 y 1,4 mg/dl en general.
ANÁLISIS ESTADÍSTICO
Los resultados se expresaron como media + desviación están-dar (DE). Las diferencias entre géneros se evaluaron con la prueba t de Student y la prueba de Mann-Whitney, de acuerdo con la distribución de la muestra. La correlación y la regresión lineal múltiple se utilizaron para identificar las asociaciones entre las variables. Las relaciones entre los grupos se analizaron mediante la prueba de χ² cuadrado. Los valores de p inferiores a 0,05 se consideraron estadísticamente significativos. Todos los análisis estadísticos se realizaron utilizando el software SPSS 20 y Prism 7.0 (GraphPad Prism, San Diego, California, Estados Unidos).
RESULTADOS
De los 500 pacientes de la muestra 190 padecían SM (121 hombres y 69 mujeres). La edad media de los pacientes con SM
fue de 55,50 ± 11,06 años, y el IMC fue de 28,05 ± 4,79. Los datos de laboratorio se describen en la tabla I. El colesterol LDL fue significativamente mayor en hombres que en mujeres (p < 0,05), así como el ácido úrico (p < 0,001) y la tasa de filtración medida por CrS (p < 0,001), en cambio el colesterol HDL fue significativamente mayor en mujeres que en hombres (p < 0,001). Aunque el resto de valores fue mayor en hombres que en mujeres (glucosa elevada, triglicéridos, colesterol total y TFG-AMDRD), no presentaron diferencias estadísticamente significativas. Lo mismo ocurre con el IMC, que es significativamente mayor en mujeres que en hombres (p < 0,05).
La prevalencia del SM fue significativamente mayor en hombres (23,1% < vs. 9,8%). En la figura 1 se muestran las frecuencias de los componentes del SM según género.
Tabla I. Datos de laboratorio de los pacientes con SM (n = 190) y según género
ParámetrosTotal
(n = 190)Hombres(n = 121)
Mujeres(n = 69)
p
Edad 55,50 ± 11,06 56,38 ± 10,71 54,13 ± 11,7 NS
Glucemia % 100 61,9 38,1 NS
Triglicéridos 158,69 ± 64,69 158,63 ± 85,62 137,83 ± 65,48 NS
Colesterol total 203,46 ± 35,85 204,16 ± 33,31 202,35 ± 16,80 NS
LDL 117,34±39,9 123,15 ± 41,73 107,9 ± 35,29 < 0,05
HDL 55,5 ± 16,4 49,85 ± 9,7 60,11 ± 1,1 < 0,001
Ácido úrico 4,32 ± 1,23 5,09 ± 1,32 3,11 ± 0,84 < 0,001
TFG-AMDRD 62,74 ± 36,60 64,07 ± 36,7 60,70 ± 34,55 NS
TFG CrS 1,65 ± 0,50 1,77 ± 14,9 1,46 ± 16,2 < 0,001
IMC 28,05 ± 4,79 27,75 ± 3,71 28,53 ± 6,09 NS
TA % 100 63,2 36,8 NS
Los valores vienen expresados en media ± desviación estándar. LDL: lipoproteínas de baja densidad; HDL: lipoproteínas de alta densidad; TFG-AMDRD: tasa de filtrado glomerular - modification of diet in renal disease; TFG CrS: tasa de filtrado glomerular - aclaramiento de creatinina sérica; IMC: índice de masa corporal; TA: tensión arterial.
Figura 1.
Distribución de los componentes del síndrome metabólico para la población total y según el género. Los valores se expresan como % (SM: síndrome metabólico).

1082 A. Martín Salvador et al.
[Nutr Hosp 2018;35(5):1079-1084]
La hipertensión fue el componente observado más frecuente y alcanzó el 70% de los casos, seguido de niveles altos de triglicé-ridos, disminución de las cifras de HDL e IMC valores anormales de glucosa. La prevalencia de TA por encima del punto de corte fue estadísticamente diferente entre los géneros, con una mayor frecuencia entre los hombres. Sin embargo, los valores elevados de triglicéridos fueron más frecuentes en las mujeres, así como el IMC, que se muestra significativamente mayor en mujeres que en hombres (Fig. 2).
Se realizaron análisis de regresión múltiple para estudiar corre-laciones entre TFG CrS y las fórmulas MDRD, y las siguientes variables: IMC, triglicéridos, colesterol total, LDL, HDL, TA y gluco-sa. En la población total, observamos correlaciones significativas entre: TFG CrS e IMC; triglicéridos, colesterol total y LDL; TFG MDRD e IMC y triglicéridos. Cuando los análisis se realizaron según el sexo, se identificaron asociaciones más significativas en la población masculina que en la femenina. Los resultados se enumeran en la tabla II.
DISCUSIÓN
En este estudio, observamos el perfil metabólico de pacientes trasplantados renales de ambos sexos y su relación con los pará-metros de función renal evaluados por MDRD y niveles séricos de creatinina (CrS). Hemos encontrado una asociación significativa entre el SM y la disfunción renal, que ha sido respaldada por estudios previos (10-12).
La hipertensión es el principal factor de riesgo para el desarrollo y la progresión de la enfermedad renal crónica (ERC) y disfun-ción crónica del injerto (13). Esto ha sido confirmado por nuestro estudio, en el cual se ha observado una alta prevalencia del com-ponente HTA tanto en hombres como en mujeres tras cinco años de seguimiento tras el trasplante renal. Es este sentido, coinciden con el nuestro algunos estudios donde la hipertensión jugó un papel como factor predictor de la incidencia de la enfermedad renal y el riesgo de enfermedad cardiovascular después de 18,5 años de seguimiento en ambos sexos (14,16).
Figura 2.
Frecuencia de los componentes del síndrome metabólico en la población total y según el sexo. Las diferencias proporcionales entre los grupos se evaluaron mediante la prueba de Chi-cuadrado (IMC: índice de masa corporal; HDL: lipo-proteína de baja densidad; TG: triglicéridos; TA: tensión arterial. Los valores se expresan como %).
Tabla II. Correlaciones entre medidas de la función renal por CrS y AMDRD y parámetros metabólicos en los pacientes con SM y según género
Parámetros Cr MDRD
Total Hombre Mujer Total Hombre Mujer
IMCrp
0,1810,05
0,2360,05
0,2340,05
-0,1900,05
-0,1740,05
-0,201NS
Triglicéridosrp
0,2940,001
0,3090,001
0,159NS
-0,1460,05
-0,102NS
-0,2270,05
Colesteroltotal
rp
0,3260,001
0,2080,05
0,053NS
0,019NS
0,070NS
-0,18NS
LDLrp
0,3270,001
0,3880,001
0,045NS
0,010NS
0,048NS
-0,020NS
HDLrp
-0,085NS
0,063NS
-0,068NS
0,131NS
-0,114NS
0,3350,05
HTArp
-0,006NS
0,019NS
0,029NS
0,034NS
0,1970,05
-0,083NS
Glucemia %rp
-0,74NS
-0,115NS
0,004NS
0,118NS
0,157NS
0,093NS
Los valores vienen expresados en media ± Desviación estándar. LDL: lipoproteínas de baja densidad; HDL: lipoproteínas de alta densidad; TFG-AMDRD: tasa de filtrado glomerular - modification of diet in renal disease; TFG CrS: tasa de filtrado glomerular - aclaramiento de creatinina sérica; IMC: índice de masa corporal; TA: tensión arterial. Valores estadísticamente significativos en cursiva.

1083CAUSAS Y COMPONENTES DEL SÍNDROME METABÓLICO EN RECEPTORES DE TRASPLANTE RENAL DESDE UNA PERSPECTIVA DE GÉNERO
[Nutr Hosp 2018;35(5):1079-1084]
Los factores que pueden contribuir al desarrollo de la obesidad y al aumento del riesgo de enfermedades crónicas incluyen: alto consumo de alcohol; de tabaco; estrés; comportamiento alimen-tario deficiente (consumo de comida rápida y menos consumo de frutas y verduras), especialmente entre los hombres; y estilo de vida sedentario, especialmente entre las mujeres (17). Observamos que, en la población femenina, el valor medio del IMC se encontró por encima del punto de corte (IMC ≥ 30 kg/m2). Además, espe-rábamos diferencias significativas entre los géneros, teniendo en cuenta las diferencias fisiológicas en la composición corporal entre hombres y mujeres. Esto puede representar la creciente prevalencia de obesidad en mujeres. Algunos estudios ya han indicado que la ingesta de alimentos en las mujeres ha aumentado sustancialmente más de lo esperado e incluso fue independiente del aumento en los valores de IMC (14). En los hombres, los valores más altos de ácido úrico podrían explicarse por las diferencias fisiológicas entre ambos sexos (15,16). Corrobora también nuestros hallazgos el hecho de que algunos trabajos observaron que el IMC elevado era el componente más frecuente en el grupo de mujeres (16). También hemos observado una reducción en los niveles de HDL en el 33% entre hombres y mujeres; en la mayoría de los estudios que involucran a ambos sexos, este componente puede alcanzar el 60% de frecuencia (18). Por otra parte, la mayor prevalencia de HTA en varones es confirmada por muchos estudios (16,18). Este hecho podría explicarse por la acción vasodilatadora de los estrógenos, que atribuye cierta cardioprotección a las mujeres (14).
Los datos en los trabajos sobre la prevalencia del SM muestran resultados contradictorios, principalmente debido a los diferentes criterios de diagnóstico aplicados. Existen al menos ocho cri-terios diferentes ampliamente utilizados con variaciones en los puntos de corte y en los biomarcadores metabólicos que deben considerarse para el diagnóstico. Con los criterios NCEP-ATP-III, la prevalencia del SM en nuestra población fue del 13,3% (23,1% < vs. 9,8%). Similar a nuestros hallazgos, otros autores (15) encontraron un 9% de SM según los criterios del Joint Inte-rim Statement (JIS). En cuanto a las diferencias entre los sexos, algunos autores encontraron resultados similares, mostrando una mayor prevalencia del SM en hombres que en mujeres (16,17).
El análisis de regresión múltiple que evaluó la función renal y los componentes metabólicos reveló, para la población total, correlaciones significativas entre TFG CrS y los niveles de IMC, triglicéridos, colesterol total y LDL; entre TFG-AMDRD y IMC, tri-glicéridos, HTA y HDL.
Cuando se realizó la evaluación según el sexo, observamos correlaciones solo en la población masculina, con correlaciones significativas entre TFG CrS y los niveles de IMC, triglicéridos, colesterol total y LDL; y finalmente, entre TFG-AMDRD e IMC y HTA. No obstante, para ambos sexos cabe destacar las relaciones de ambas funciones con el IMC.
Varios autores estudiaron la asociación entre la obesidad y la disfunción crónica del injerto en trasplantados renales (19,20). El aumento en el IMC indica un riesgo un 80% mayor de recha-zo del injerto, conjuntamente con una disminución en la función renal, que también estaría influenciada por el aumento de peso, especialmente en hombres de 40 años en adelante (20). La aso-
ciación entre TFG CrS e IMC podría explicarse por la influencia de la masa magra en los niveles séricos de Cr (21,22), ya que el IMC es una medida antropométrica que no distingue entre la masa corporal magra y la grasa. Por lo tanto, el IMC parece ser el mejor indicador antropométrico para la evaluación de la disfunción renal relacionada con la obesidad, ya que refleja indirectamente la cantidad de grasa visceral (23-25). Esto puede ser confirmado por nuestros resultados, de acuerdo con las dos funciones estudiadas en esta investigación. Observamos, por tanto, la correlación entre TFG-AMDRD y TFG CrS e IMC.
En conclusión, hemos observado una correlación significativa entre el aumento en el número de componentes del SM y la disfunción renal en pacientes trasplantados renales con un alto IMC e HTA. La prevalencia del SM del 13,3% (23,1% < vs. 9,8%) encontrada es preocupante, ya que se refiere al riesgo elevado de futuros eventos cardiovasculares adversos y posibles rechazos del injerto. En cuanto a las diferencias de género, identificamos que los hombres tendrían más probabilidades de desarrollar una reducción en los valores de la tasa de filtración glomerular (TFG) en presencia de SM.
BIBLIOGRAFÍA
1. Reaven GM. Banting lecture 1988. Role of insulin resistance in human disea-se. Diabetes 1988;37(12):1595-607.
2. Sharif A, Moore R, Baboolal K. Influence of lifestyle modification in renal transplant recipients with postprandial hyperglycemia. Transplantation 2008;85:353-8.
3. Favaloro R, Peradejordi M, Bertolotti A, Díez M, Favaloro L, Gómez C, et al. Results of heart transplantation: 16 years’ experience in a center in Argentina. Transplant Proc 2010;42(1):321-3.
4. Fernández Castillo R, Fernández Gallegos R, Gómez Urquiza JL, Cañadas de la Fuente GA, Esteban de la Rosa RJ, Peña Amaro MP. Study and prevalence of post-transplant diabetes mellitus; analysis on a group of kidney transplant recipients. Nutr Hosp 2014;30(4):813-7.
5. Chang A, Greene TH, Wang X, Kendrick C, Kramer H, Wright J, et al. The effects of weight change on glomerular filtration rate. Nephrol Dial Transplant 2015;30(11):1870-7.
6. Fernández Castillo R, Fernández Gallegos R, Peña Amaro MP, Esteban de la Rosa RJ. Assessment of lipid profiles and bone mineral density in renal transplant patients. Nutr Hosp 2015;31(6):2503-10.
7. Chang A, Greene TH, Wang X, Kendrick C, Kramer H, Wright J, et al. The effects of weight change on glomerular filtration rate. Nephrol Dial Transplant 2015;30(11):1870-7.
8. Fernández Castillo R, De Alarcón RM, Esteban RJ, Haouari O, Planell E, Perán F, et al. Bone mineral density in patients with renal hyperparathyroidism undergoing surgery: relationship with bone parameters. Med Clin (Barc) 2010;135:156-9.
9. American Heart Association; National Heart, Lung and Blood Institute; Grundy SM, Cleeman JI, Daniels SR, Donato KA, et al. Diagnosis and management of the metabolic syndrome: an American Heart Association/National Heart, Lung, and Blood Institute Scientific Statement. Circulation 2006;112:2735-52.
10. Bouvet Y, Bouissou F, Coulais Y, Séronie-Vivien S, Tafani M, Decramer S, et al. GFR is better estimated by considering both serum cystatin C and creatinine levels. Pediatr Nephrol 2006;21(9):1299-306.
11. (KDIGO) CKD Work Group. Kidney Disease: Improving Global Outcomes. KDI-GO clinical practice guideline for the evaluation and management of chronic kidney disease. Kidney Int Suppl 2013;1-150.
12. Barcellos RC, Matos JP, Kang HC, Rosa ML, Lugon JR. Comparison of serum creatinine levels in different color/race categories in a Brazilian population. Cad Saude Publica 2015;31(7):1565-9.
13. Castillo RF, García Ríos MD, Peña Amaro P, García García I. Progression of alterations in lipid metabolism in kidney transplant recipients over 5 years of follow-up. Int J Clin Pract 2014;68(9):1141-6.

1084 A. Martín Salvador et al.
[Nutr Hosp 2018;35(5):1079-1084]
14. Xu S, Gao B, Xing Y, Ming J, Bao J, Zhang Q, et al. Gender differences in the prevalence and development of metabolic syndrome in Chinese population with abdominal obesity. PLoS One 2013;8(10):e78270.
15. Jadhav K, John R, Agrawal V, Samant P, Rai S. Prevalence of metabo-lic syndrome in college students in Navi Mumbai. Int J Med Allied Sci 2014;1(2):76-84.
16. Jha V, García-García G, Iseki K, Li Z, Naicker S, Plattner B, et al. Chronic kidney disease: global dimension and perspectives. Lancet 2013;382(9888):260-72.
17. Sarafidis PA, Lasaridis AN. Insulin resistance and endothelin: another pathway for renal injury in patients with the cardiometabolic syndrome? J Cardiometab Syndr 2008;3:183-7.
18. 18. Ferrannini E, Haffner SM, Mitchell BD, Stern MP. Hyperinsulinaemia: the key feature of a cardiovascular and metabolic syndrome. Diabetologia 1991;34:416-22.
19. Reynolds K, Gu D, Muntner P, Chen J, Wu X, Yau CL, et al. Body mass index and risk of ESRD in China. Am J Kidney Dis 2007;50:754-64.
20. Iseki K, Ikemiya Y, Kinjo K, Inoue T, Iseki C, Takishita S. Body mass index and the risk of development of end-stage renal disease in a screened cohort. Kidney Int 2004;65:1870-6.
21. Felizardo RJ, Da Silva MB, Aguiar CF, Câmara NO. Obesity in kidney disease: a heavyweight opponent. World J Nephrol 2014;3(3):50-63.
22. Hall ME, Do Carmo JM, Da Silva AA, Juncos LA, Wang Z, Hall JE. Obesity, hyper-tension, and chronic kidney disease. Int J Nephrol Renovasc Dis 2014;7:75-88.
23. Jadhakhan F, Marshall T, Gill P. A systematic review investigating the cumula-tive incidence of chronic kidney disease in young adults with impaired glucose tolerance. Syst Rev 2015;4:69.
24. Ji B, Zhang S, Gong L, Wang Z, Ren W, Li Q, et al. The risk factors of mild decline in estimated glomerular filtration rate in a community-based popula-tion. Clin Biochem 2013;46(9):750-4.
25. Hou X, Wang C, Zhang X, Zhao X, Wang Y, Li C, et al. Triglyceride levels are closely associated with mild declines in estimated glomerular filtration rates in middle-aged and elderly Chinese with normal serum lipid levels. PLoS One 2014;9(9):e106778.

NutriciónHospitalaria
Trabajo Original Obesidad y síndrome metabólico
ISSN (electrónico): 1699-5198 - ISSN (papel): 0212-1611 - CODEN NUHOEQ S.V.R. 318
Diabetes mellitus tipo 2 podría predecir una pérdida subóptima de peso después de una cirugía bariátricaType 2 diabetes mellitus could predict a sub-optimal weight loss after bariatric surgery
Mizael A. Núñez-Núñez1, M. Guadalupe León-Verdín2, Norberto Muñoz-Montes3, Judith Rodríguez-García3, J. Abraham Trujillo-Ortiz3 y Claudia Martínez-Cordero3 1Universidad de Guanajuato. Guanajuato, México. 2Instituto Mexicano del Seguro Social. Guanajuato, México. 3Hospital Regional de Alta Especialidad del Bajío. León, Guanajuato. México
Palabras clave:
Obesidad severa. Cirugía bariátrica. Bypass gástrico. DM2.
ResumenIntroducción: la cirugía bariátrica no beneficia a todos los pacientes. Identificar a los pacientes gravemente obesos que tendrán éxito después de la cirugía bariátrica sigue siendo un reto para el equipo transdiciplinario. El objetivo de este estudio retrospectivo fue analizar factores dietéticos preoperatorios que pudieran predecir una pérdida de peso exitosa después de la cirugía bariátrica.
Métodos: el estudio retrospectivo incluyó a pacientes sometidos a una cirugía de bypass gástrico laparoscópico en Y de Roux como procedi-miento para obesidad severa (n = 84). Datos demográficos del paciente, comorbilidades, factores dietéticos y los resultados de pérdida de peso se extrajeron de la historia clínica electrónica.
Resultados: la diabetes mellitus tipo 2 (DM2) se asoció con una pérdida subóptima de peso después de una cirugía de bypass gástrico lapa-roscópico en Y de Roux.
Conclusiones: aunque la cirugía bariátrica sigue siendo el tratamiento más efectivo para los pacientes con obesidad severa, es fundamental desarrollar estrategias para mejorar y mantener la pérdida de peso, especialmente en pacientes con DM2. Evaluar las características dietéticas de los candidatos a cirugía bariátrica es crucial.
Key words:
Severe obesity. Bariatric surgery. Gastric bypass. DM2.
AbstractIntroduction: bariatric surgery does not benefit all patients. Identifying severely obese patients who will succeed after bariatric surgery remains a challenge for the transdiciplinary team. The objective of this retrospective study was to analyze preoperative dietary factors that could predict a successful weight loss after bariatric surgery.
Methods: the retrospective study included patients undergoing laparoscopic Roux-en-Y gastric bypass surgery as a procedure for severe obesity (n = 84). Patient demographics, comorbidities, dietary factors, and weight loss results were extracted from the electronic medical record.
Results: type 2 diabetes mellitus (DM2) was associated with suboptimal weight loss after laparoscopic Roux-en-Y gastric bypass surgery.
Conclusions: although bariatric surgery continues being the most effective treatment for patients with severe obesity, developing strategies to improve and maintain weight loss, especially in patients with DM2, is fundamental. Assessing the dietary characteristics of candidates for bariatric surgery is crucial.
Correspondencia: Claudia Martínez-Cordero. Hospital Regional de Alta Especialidad del Bajío. Blvd. Milenio, 130. Col. San Carlos La Roncha. 37660 León, Guanajuato. Méxicoe-mail: [email protected]
Núñez-Núñez MA, León-Verdín MG, Muñoz-Montes N, Rodrígurz-García J, Trujillo-Ortiz JA, Martínez-Cordero C. Diabetes mellitus tipo 2 podría predecir una pérdida subóptima de peso después de una cirugía bariátrica. Nutr Hosp 2018;35(5):1085-1089
DOI: http://dx.doi.org/10.20960/nh.1750
Contribución a la autoría:Diseño: CMC, MANN, MGLV, JRG, NMM, JATOAnálisis: MGLV, CMC, MANN; Redacción: CMC, MGLVRevisión y aprobación: CMC, MGLV, NMM, JRG, MANN, JATO
Recibido: 28/12/2017 • Aceptado: 11/02/2018
©Copyright 2018 SENPE y ©Arán Ediciones S.L. Este es un artículo Open Access bajo la licencia CC BY-NC-SA (http://creativecommons.org/licenses/by-nc-sa/4.0/).

1086 M. A. Núñez-Núñez et al.
[Nutr Hosp 2018;35(5):1085-1089]
INTRODUCCIÓN
La obesidad es un problema de salud pública en México (1). La obesidad mórbida o grado III (> 40 kg/m2) impacta grave-mente la salud (2-4) y la recomendación médica es la cirugía bariátrica, que proporciona beneficios significativos a la salud de los pacientes. La cirugía bariátrica consiste en reducir el tama-ño del estómago y desfuncionalizar una porción del intestino, alterando tanto el tamaño como la función de ambos órganos (5-7). Estos cambios fisiológicos están encaminados a disminuir peso corporal y comorbilidades como DM2, hipertensión arterial sistémica (HAS), apnea obstructiva del sueño, dislipidemia, reflujo gastroesofágico, etc. (7-10).
A pesar de los efectos generalmente favorables sobre la pér-dida de peso después de la cirugía bariátrica, la respuesta de los pacientes varía dependiendo de las características de cada indivi-duo; la cirugía bariátrica no beneficia a todos los pacientes (11,12). La cirugía se considera fallida, en términos de pérdida de peso, cuando se reduce menos del 50% del exceso de peso, menos del 20% del peso inicial o el índice de masa corporal (IMC) final es mayor de 35 kg/m2 (7,13). Por ejemplo, estudios previos han encontrado que pacientes masculinos jóvenes y solteros presentan una mayor pérdida de peso posoperatoria (14). Sin embargo, cómo las características dietéticas preoperatorias predicen la pérdida de peso posoperatoria aún es incierto y, por lo tanto, es desafiante identificar los pacientes que tendrán éxito después de la cirugía bariátrica (12). El objetivo de este estudio retrospectivo fue analizar factores dietéticos preoperatorios que puedan predecir éxito en la pérdida de peso después de la cirugía bariátrica.
MATERIAL Y MÉTODOS
Estudiamos retrospectivamente una cohorte que incluyó pacientes adultos sometidos a bypass gástrico laparoscópico en Y de Roux del año 2010 a 2015 en el Hospital Regional de Alta Especialidad del Bajío (HRAEB) (n = 84). Los datos demográficos, los factores dietéticos y el peso de los pacientes se extrajeron del expediente médico electrónico (Klinic). Calculamos la pérdida de peso en cada visita y medimos la asociación con las comor-bilidades DM2 y HAS. La falta de información no se sustituyó con ningún método estadístico y, por lo tanto, la comparación de medias incluyo únicamente los valores existentes de cada grupo en la base de datos para cada tiempo posoperatorio (uno, tres, seis y 12 meses). Las variables preoperatorias de los pacientes se muestran en la tabla I: edad, género, estado civil, empleo, escolaridad, DM2, HAS, obesidad en la infancia, historia familiar de obesidad, historial de pérdida de peso y consumo de refresco.
ANÁLISIS ESTADÍSTICO
Los resultados se expresan como valores medios y desvia-ciones estándar. Para evaluar la pérdida de peso se usaron los siguientes parámetros:
1. Peso = peso corporal en kg2. ΔPeso = pérdida de peso (kg) comparado a tiempo inicial
= peso inicial - peso en posoperatorio3. IMC = peso en kg/ talla (m2)4. ΔIMC (%) = pérdida porcentual del exceso de IMC = (ΔIMC/
[Inicial IMC- 25*]) x 100, (*IMC ideal = 25 kg/m2)Comparamos medias de los grupos a los diferentes tiempos
posoperatorios en cada una de las variables calculadas utilizando pruebas t. Se graficaron el promedio de peso y la pérdida por-centual del exceso de IMC con respecto al tiempo posoperatorio y estratificado con las comorbilidades de DM2 y HAS (Fig. 1). Usamos el software de estadística SPSS 21.
Tabla I. Características de los pacientes antes de la cirugía bariátrica
Variable % (n)
Edad, años (media ± DS) 42,8 ± 9,8
Femenino 54,8 (46)
Casado 51,2 (43)
Grado universitario 39,3 (33)
Vida laboral 54,8 (46)
Previa obesidad infantil 59,5 (50)
Historia de obesidad familiar 51,2 (43)
DM2 17,9 (15)
HAS 42,9 (36)
Dieta yo-yo 72,6 (61)
Niegan dieta yo-yo 4,8 (4)
Nulo consumo de refresco 14,3 (6)
Disminución de consumo de refresco 70,2 (59)
DM2: diabetes mellitus tipo 2; HAS: hipertensión arterial sistémica.
Figura 1.
Asociación durante el primer año después de la cirugía bariátrica de: A. DM2 y peso corporal; B. DM2 y Δ%IMC; C. HAS y peso corporal; D. HAS y Δ%IMC.

1087DIABETES MELLITUS TIPO 2 PODRÍA PREDECIR UNA PÉRDIDA SUBÓPTIMA DE PESO DESPUÉS DE UNA CIRUGÍA BARIÁTRICA
[Nutr Hosp 2018;35(5):1085-1089]
RESULTADOS
Extrajimos del Klinic (expediente clínico electrónico del HRAEB) la información de 84 pacientes sometidos a cirugía de bypass gástrico laparoscópico en Y de Roux como procedimiento para obesidad severa. En total fueron 47 mujeres (55,9%) con edad media de 43 ± 10 años y 37 hombres (44,1%) con edad media de 42 ± 9 años; la media de peso e IMC preoperatorio fue de 132 ± 28 kg y 48 ± 10 kg/m2, respectivamente. Para el análisis, excluimos cinco pacientes debido a que sus datos en Klinic estaban ausentes o eran confusos.
Las tablas II y III muestran la pérdida de peso durante el primer año de seguimiento de los pacientes con cirugía bariátrica, presentando la mayor pérdida a los doce meses (72,7% de pérdida porcentual del exceso de IMC). La tabla IV muestra la pérdida de peso asociada a DM2 durante el primer año de seguimiento; a los seis meses, los pacientes sin DM2 bajaron significativamente más peso comparado con los que padecían DM2 (p.034), y también los pacientes sin DM2 perdieron mayor porcentaje de exceso de IMC (p.066). Al año de seguimiento, la muestra fue pequeña y, por lo tanto, la comparación no es confiable. La tabla V muestra la pérdida de peso asociada a HAS durante el primer año de seguimiento. Observamos que los pacientes con HAS presentaron peso corporal más elevado desde el
inicio hasta los 12 meses, pero no hubo diferencia significativa en la pérdida porcentual del exceso de IMC (Fig. 1).
DISCUSIÓN
Estudiamos retrospectivamente el valor pronóstico de factores dietéticos preoperatorios que pudieran predecir éxito en la pér-dida de peso en pacientes de un hospital público de México con obesidad severa durante el primer año de una cirugía de bypass gástrico laparoscópico en Y de Roux. La DM2 fue el único factor que asoció significativamente con una pérdida subóptima de peso después de esta cirugía.
Este hallazgo respalda resultados de otros estudios que también asocian DM2 y pérdida subóptima de peso (15), pero se contradice con el estudio de Melton y cols. (16) que concluyó que pacientes con DM2 tenían tres veces más probabilidades de lograr una dis-minución óptima de peso en comparación con los pacientes no diabéticos sometidos a una cirugía de bypass gástrico laparos-cópico en Y de Roux. Estas contradicciones de resultados podrían relacionarse con los esquemas de medicación hipoglucemiantes orales y el control de la dieta en pacientes con DM2.
Tabla II. Datos de peso e IMC durante el primer año después de cirugía bariátrica de los pacientes
Mesesposoperatorios
Variables n Mínimo Máximo Media DE
0
Edad (años) 84 19 68 42,8 9,8
Peso (kg) 84 83 211,8 131,9 28,1
Talla (m) 84 1,4 1,8 1,6 0,08
IMC (kg/m2) 84 33,5 70,7 48,6 8,4
1
Peso (kg) 79 74 182,8 118,5 25,3
ΔPeso (kg) 79 2,4 35,4 14,0 5,2
IMC (kg/m2) 79 29,8 60,9 43,7 7,6
ΔIMC (%) 79 7,5 57,9 22,8 7,7
3
Peso (kg) 78 62 169,4 106,6 23,6
ΔPeso (kg) 78 9,8 51,6 25,6 8,0
IMC (kg/m2) 78 26,5 59,1 39,2 7,2
ΔIMC (%) 78 19,2 89,7 42,7 13,5
6
Peso (kg) 60 59,5 146,4 95,7 20,4
ΔPeso (kg) 60 11,5 66,6 35,5 12,1
IMC (kg/m2) 60 24,0 51,1 35,6 6,2
ΔIMC (%) 60 31,4 111,5 58,1 15,4
12
Peso (kg) 14 52,1 135,6 88,4 21,7
ΔPeso (kg) 14 29,3 69,6 46,0 12,3
IMC (kg/m2) 14 23,4 44,7 32,6 6,3
ΔIMC (%) 14 36,4 110,2 72,7 20,0

1088 M. A. Núñez-Núñez et al.
[Nutr Hosp 2018;35(5):1085-1089]
Tabla III. Pérdida de peso durante el primer año después de la cirugía bariátrica
Meses posoperatorios
nPeso(kg)
∆Peso(kg)
IMC(kg/m2)
∆IMC(%)
1 79 118,5 ± 25,3 14,1 ± 5,3 43,7 ± 7,6 22,9 ± 7,7
3 78 106,6 ± 23,6 28,7 ± 8,1 39,3 ± 7,3 42,7 ± 13,6
6 60 95,8 ± 20,5 35,5 ± 12,2 35,6 ± 6,2 58,1 ± 15,5
12 14 88,5 ± 21,8 46,0 ± 12,4 32,6 ± 6,3 72,7 ± 20,1
p < 0,001 F4, 314 25,3 269,3 36,4 334,6
Tabla IV. Pérdida de peso asociada a DM2 durante el primer año después de la cirugía bariátrica
Mesesposoperatorios
DMPeso(kg)
∆Peso(kg)
IMC(kg/m2)
∆IMC(%)
n
1Sin 119,4 ± 24,7 13,8 ± 5,3 44,0 ± 7,6 22,2 ± 7,6 64
Con 115,1 ± 28,4 15,0 ± 5,0 42,7 ± 8,1 25,9 ± 7,9 15
3Sin 107,0 ± 23,0 25,8 ± 8,1 39,4 ± 7,3 42,4 ± 13,5 63
Con 104,7 ± 26,9 25,3 ± 8,6 38,8 ± 7,5 44,2 ± 14,3 15
6Sin 95,0 ± 18,9 35,9 ± 11,8* 35,0 ± 6,0 58,3 ± 13,7† 49
Con 99,2 ± 27,4 34,1 ± 14,4* 36,3 ± 7,2 57,3 ± 22,6† 11
12‡Sin 88,5 ± 23,6 46,0 ± 12,4 32,6 ± 6,9 73,6 ± 21,6 12
Con 88,4 ± 3,0 46,3 ± 17,6 33,0 ± 0,9 67,4 ± 6,0 2
*p = 0.034; †p = 0.066. ‡Comparación poco confiable porque la muestra es pequeña.
Tabla V. Pérdida de peso asociada a HAS durante el primer año después de la cirugía bariátrica
Mesesposoperatorios
HASPeso(kg)
∆Peso(kg)
IMC(kg/m2)
∆IMC(%)
n
1Sin 112,0 ± 21,5* 12,4 ± 4,2 41,9 ± 6,7 22,7 ± 6,9 43
Con 126,4 ± 27,5* 16,0 ± 5,8 45,9 ± 8,2 23,1 ± 8,7 36
3Sin 100,1 ± 19,2† 23,8 ± 6,5* 37,4 ± 6,1† 44,4 ± 13,1 43
Con 114,6 ± 26,3† 28,0 ± 9,3* 41,6 ± 8,0† 40,6 ± 14,0 35
6Sin 89,4 ± 15,8† 32,3 ± 11,0 33,8 ± 5,3 60,6 ± 16,7 35
Con 104,6 ± 23,2† 40,1 ± 12,5 38,2 ± 6,6 54,7 ± 13,2 25
12Sin 78,9 ± 15,8 45,9 ± 10,8 28,8 ± 3,7† 84,4 ± 17,1 7
Con 98,0 ± 23,7 46,1 ± 14,7 36,5 ± 6,1† 61,0 ± 16,2 7
*p < 0.1; †p < 0.05.

1089DIABETES MELLITUS TIPO 2 PODRÍA PREDECIR UNA PÉRDIDA SUBÓPTIMA DE PESO DESPUÉS DE UNA CIRUGÍA BARIÁTRICA
[Nutr Hosp 2018;35(5):1085-1089]
Los pacientes con DM2 que continúan requiriendo insulina exó-gena después de la cirugía bariátrica pueden experimentar menos pérdida de peso debido a los efectos anabólicos de esta hormona que promueve la lipogénesis y la síntesis muscular (15,16). También, se ha observado que la mayoría de los medicamentos hipogluce-miantes orales aumentan los niveles de insulina circulante y, por lo tanto, promueven sus efectos anabólicos (17). Las tasas de remi-sión y recaída para la DM2 después de la cirugía bariátrica parecen estar estrechamente relacionadas con la re-ganancia de peso (16). En nuestro estudio, los pacientes sin DM2 antes de la cirugía tuvie-ron la mayor pérdida de peso durante el primer año de seguimiento comparados con los pacientes que ya padecían la enfermedad; este hallazgo sugiere que el equipo bariátrico debe vigilar estrechamente a los pacientes con DM2 que se someten a la cirugía.
El historial de pérdida de peso se considera una variable predic-tora de éxito en la pérdida de peso después de la cirugía bariátrica (17); sin embargo, nosotros no pudimos obtener datos suficientes para este análisis. Otra variable preoperatoria que parece prede-cir el éxito de la cirugía bariátrica es el consumo de refresco; en este caso, obtuvimos los datos suficientes para el análisis, pero no encontramos asociación significativa entre la pérdida de peso y los pacientes que no tomaban refresco antes de la cirugía, quienes dejaron de consumir, o quienes solo disminuyeron el consumo. Fox et al. (14) encontraron que los pacientes que no consumieron refresco antes de la cirugía disminuyeron más peso en comparación con aquellos que continuaron el consumo de refresco antes de la cirugía. Se entiende que aquellos pacientes que no suspenden el consumo de refresco antes de la cirugía podrían ser menos discipli-nados para seguir las recomendaciones dietéticas posoperatorias. Aunque nosotros no encontramos asociación, el cese del consumo de refresco antes de la cirugía continúa siendo una parte importante del proceso de evaluación preoperatoria del paciente bariátrico.
Reconocemos que nuestro estudio tiene varias limitaciones. Los pacientes provenían predominantemente de un estrato socioeconómico medio-bajo, lo que limita la generalización de nuestros hallazgos. No investigamos los resultados después de otros tipos de cirugía bariátrica, incluida la gastrectomía en manga vertical o banda gástrica ajustable. Además, solo 14 pacientes tuvieron registro de datos a los 12 meses de seguimiento, así que no pudieron asociarse factores preoperatorios y el éxito en la pérdida de peso al año de la cirugía (18,19); de cualquier manera, asociamos todos los factores y la pérdida de peso en las diferentes etapas (tres, seis, nueve y 12 meses). Por otro lado, sería interesante estudiar los motivos del no cumplimiento con las citas médicas. Este es un tema importante porque influyen no solo factores personales de los pacientes sino también factores institucionales. Sabemos que los pacientes que no acuden a sus citas de seguimiento tienen un mayor riesgo de re-ganar peso (19), y por ello se debe trabajar en esa área de oportunidad.
Nosotros concluimos que los pacientes con DM2 son más pro-pensos a experimentar pérdida de peso subóptima después de una cirugía de bypass gástrico laparoscópico en Y de Roux. Es vital que el equipo transdisciplinario discuta con el paciente las expectativas realistas tratando de disminuir riesgos de frustración y probable rechazo al cambio de estilo de vida con la consecuente
re-ganancia de peso. Identificar a los pacientes gravemente obe-sos que tendrán éxito después de la cirugía bariátrica sigue siendo un reto. Aunque la cirugía bariátrica parece ser el tratamiento más efectivo para los pacientes con obesidad severa, es fundamental desarrollar estrategias para mejorar y mantener la pérdida de peso especialmente en pacientes con DM2. Evaluar las caracte-rísticas dietéticas de los candidatos a cirugía bariátrica es crucial.
BIBLIOGRAFÍA
1. Barquera S, Campos-Nonato I, Hernández-Barrera L, Pedroza-Tobías A, Rive-ra-Dommarco JA. Prevalence of obesity in Mexican adults, ENSANUT 2012. Salud Publica Mex 2013;55:S151-S60.
2. Ruano Gil M, Silvestre Teruel V, Aguirregoicoa García E, Criado Gómez L, Duque López Y, García-Blanch G. Nutrition, metabolic syndrome and morbid obesity. Nutr Hosp 2011;26(4):759-64.
3. Aguilar Cordero MJ, González Jiménez E, García López AP, Álvarez Ferre J, Padilla López CA, Guisado Barrilao R, et al. Obesity and its implication in breast cancer. Nutr Hosp 2011;26(4):899-903.
4. Ríos-Martínez BP, Rangel-Rodríguez G, Pedraza-Moctezuma LG. How do the obese persons perceive their overall health? Rev Med Inst Mex Seguro Soc 2013;51(4):390-5.
5. Csendes, A, Lembach J. Fisiopatología en la cirugía de la obesidad: gastrecto-mía vertical subtotal y bypass gastrico. Rev Chilena Cirugia 2010;62(5):525-31.
6. Quercia I, Dutia R, Kotler DP, Belsley S, Laferrere B. Gastrointestinal changes after bariatric surgery. Diabetes Metab 2014;40(2):87-94.
7. Brethauer SA, Kim J, El Chaar M, Papasavas P, Eisenberg D, Rogers A, et al. Standardized outcomes reporting in metabolic and bariatric surgery. Surg Obes Relat Dis 2015;11(3):489-506.
8. Aarts F, Geenen R, Gerdes VEA, Van de Laar A, Brandjes DPM, Hinnen C. Attachment anxiety predicts poor adherence to dietary recommendations: an indirect effect on weight change 1 year after gastric bypass surgery. Obes Surg 2015;25(4):666-72.
9. Adams TD, Gress RE, Smith SC, Halverson RC, Simper SC, Rosamond WD, et al. Long-term mortality after gastric bypass surgery. N Engl J Med 2007;357(8):753-61.
10. Driscoll S, Gregory DM, Fardy JM, Twells LK. Long-term health-related quality of life in bariatric surgery patients: a systematic review and meta-analysis. Obesity 2016;24(1):60-70.
11. Kinzl JF, Schrattenecker M, Traweger C, Mattesich M, Fiala M, Biebl W. Psychosocial predictors of weight loss after bariatric surgery. Obes Surg 2006;16(12):1609-14.
12. Kvalem IL, Bergh I, Sogg S, Mala T. Psychosocial characteristics associated with symptom perception 1 year after gastric bypass surgery - A prospective study. Surg Obes Relat Dis 2017;13(11):1908-13.
13. Johnson L, Wilks DC, Lindroos AK, Jebb SA. Reflections from a systematic review of dietary energy density and weight gain: is the inclusion of drinks valid? Obes Rev 2009;10(6):681-92.
14. Fox B, Chen E, Suzo A, Jolles S, Greenberg JA, Campos GM, et al. Dietary and psych predictors of weight loss after gastric bypass. J Surg Res 2015;197(2):283-90.
15. Campos GM, Rabl C, Mulligan K, Posselt A, Rogers SJ, Westphalen AC, et al. Factors associated with weight loss after gastric bypass. Arch Surg 2008;143(9):877-83;discussion 84.
16. Melton GB, Steele KE, Schweitzer MA, Lidor AO, Magnuson TH. Subopti-mal weight loss after gastric bypass surgery: correlation of demographics, comorbidities, and insurance status with outcomes. J Gastrointest Surg 2008;12(2):250-5.
17. Martínez-Ramos D, Salvador-Sanchís JL, Escrig-Sos J. Preoperative weight loss in bariatric surgery candidate patients. evidence-based recommenda-tions. Cir Esp 2012;90(3):147-55.
18. D’Hondt M, Vanneste S, Pottel H, Devriendt D, Van Rooy F, Vansteenkiste F. Laparoscopic sleeve gastrectomy as a single-stage procedure for the treatment of morbid obesity and the resulting quality of life, resolution of comorbidities, food tolerance, and 6-year weight loss. Surg Endosc 2011;25(8):2498-504.
19. Buchwald H, Avidor Y, Braunwald E, Jensen MD, Pories W, Fahrbach K, et al. Bariatric surgery: a systematic review and meta-analysis. JAMA 2004;292(14):1724-37.

NutriciónHospitalaria
Trabajo Original Obesidad y síndrome metabólico
ISSN (electrónico): 1699-5198 - ISSN (papel): 0212-1611 - CODEN NUHOEQ S.V.R. 318
Estudio de investigación cualitativa sobre las diferencias entre hombres y mujeres en la percepción de la obesidad, sus causas, abordaje y repercusiones para la saludQualitative study of the differences between men and women’s perception of obesity, its causes, tackling and repercussions on health
Rocío Barragán1,2, Llorenç Rubio3, Olga Portolés1,2, Eva M. Asensio1,2, Carolina Ortega1,2, José Vicente Sorlí1,2 y Dolores Corella1,2
1Unidad de Epidemiología Genética y Molecular. Departamento de Medicina Preventiva y Salud Pública, Ciencias de la Alimentación, Toxicología y Medicina Legal. Universidad de Valencia. Valencia. 2CIBER Fisiopatología de la Obesidad y Nutrición. Instituto de Salud Carlos III. Madrid. 3Departamento de Sociología y Antropología Social. Universidad de Valencia. Valencia
Palabras clave:
Obesidad. Género. Investigación cualitativa. Grupos de discusión. Dieta. Actividad física.
ResumenIntroducción: aunque la obesidad es un problema de salud multidimensional, pocos estudios de investigación cualitativa han analizado el discurso de personas obesas con perspectiva de género para conocer con mayor profundidad información difícilmente obtenible con técnicas cuantitativas.
Objetivo: analizar el discurso de personas obesas mediante grupos de discusión en cuanto a factores que subyacen en la obesidad, percepción del riesgo de patologías, pérdida peso y otros factores relevantes.
Métodos: se realizaron dos grupos de discusión en sesiones separadas, homogéneos por sexo, con un total de 14 participantes. Un moderador dirigió la sesión contemplando las distintas dimensiones del problema. Los grupos fueron grabados en audio y transcritos textualmente. Se analizó el discurso por métodos cualitativos.
Resultados: se observaron importantes diferencias en la perspectiva entre hombres y mujeres. Las causas autopercibidas de obesidad para las mujeres fueron el embarazo y el periodo menopáusico. Los hombres la atribuyeron a los hábitos alimenticios y costumbres culturales. Para los hombres la finalidad de disminuir el peso era mejorar su salud, sin embargo, las mujeres incluían también la estética. Ambos sexos pensaban que la obesidad puede acarrear grandes problemas. Ellas revelaron tener miedo a engordar, mientras que los hombres no lo expusieron. También se observaron diferencias en las estrategias de lucha contra la obesidad.
Conclusiones: las diferencias en la percepción de las causas y el abordaje de la obesidad entre hombres y mujeres nos indican la necesidad de considerar las medidas preventivas y terapéuticas teniendo en cuenta el sexo, así como aspectos ambientales que envuelven al paciente.
Key words:
Obesity. Gender. Qualitative. Focus groups. Diet. Physical activity.
AbstractIntroduction: although obesity is a multidimensional health problem, few qualitative research studies have analyzed the discourse of obese individuals from the gender perspective in order to better understand the hard come by information gathered from quantitative research.
Aim: to analyze the discourse of obese individuals in focus groups concerning factors underlying obesity, pathology risk perception, weight loss and other relevant factors.
Methods: two single-sex focus groups, with a total of 14 participants, were held in separate sessions. A moderator directed the session, addressing the different dimensions of the problem. The groups were recorded in audio and textually transcribed. The discourse was analyzed using qualitative methods.
Results: important differences were observed between male and female perspectives. The self-perceived causes of obesity for women were pregnancy and menopause. Men attributed obesity to eating habits and cultural customs. For men, the final aim of reducing weight was to improve their health, whereas women also included aesthetics. Both sexes believe that obesity can lead to greater problems. Women expressed their fear of putting on weight, but men did not. Differences were also observed in the strategies adopted for combating obesity.
Conclusions: differences in the perception of the causes and how to tackle obesity between men and women show us the need to consider therapeutic and preventive measures that take gender into account, in addition to the environmental aspects surrounding the patient.
Correspondencia: Dolores Corella. Departamento de Medicina Preventiva y Salud Pública. Facultad de Medicina. Av. Blasco Ibáñez, 15. 46010 Valenciae-mail: [email protected]
Barragán R, Rubio L, Portolés O, Asensio EM, Ortega C, Sorlí JV, Corella D. Estudio de investigación cualitativa sobre las diferencias entre hombres y mujeres en la percepción de la obesidad, sus causas, abordaje y repercusiones para la salud. Nutr Hosp 2018;35(5):1090-1099
DOI: http://dx.doi.org/10.20960/nh.1809
Contribución a la autoría:Diseño: OP, DC, RBAnálisis: RB, LR, JVS, DC, OPRevisión y aprobación: RC, LR, OP, CO, JVS, EMA, DC
Recibido: 29/01/2018 • Aceptado: 25/02/2018
©Copyright 2018 SENPE y ©Arán Ediciones S.L. Este es un artículo Open Access bajo la licencia CC BY-NC-SA (http://creativecommons.org/licenses/by-nc-sa/4.0/).

1091ESTUDIO DE INVESTIGACIÓN CUALITATIVA SOBRE LAS DIFERENCIAS ENTRE HOMBRES Y MUJERES EN LA PERCEPCIÓN DE LA OBESIDAD, SUS CAUSAS, ABORDAJE Y REPERCUSIONES PARA LA SALUD
[Nutr Hosp 2018;35(5):1090-1099]
INTRODUCCIÓN
La obesidad es un problema de salud en aumento (1), no solo en los países de mayor nivel de renta, sino que también está aumen-tando en los países en vías de desarrollo (2,3). La obesidad es un problema de salud complejo y multidimensional en el que no sola-mente influyen la ingesta de alimentos y la actividad física, sino que se imbrican otros muchos factores, entre ellos el estrés, la calidad del sueño, el nivel socioeconómico, la felicidad, etc. (4). Además, la obesidad es un importante factor de riesgo para otras enfermeda-des como las cardiovasculares, diabetes, cáncer, etc. (4,5). También existe una asociación entre una mala salud emocional y la obesidad. Se han descrito mayores tasas de depresión y ansiedad en perso-nas obesas en comparación con las no obesas en algunos estudios (6). Además, la obesidad puede conllevar problemas sociales como la discriminación, problemas de desempleo, de atención sanitaria y aislamiento social (7-9). A su vez, la percepción negativa del peso puede empeorar la alimentación y la realización de ejercicio físico o provocar problemas psicológicos (10).
Todos estos factores nos ponen de manifiesto que el estudio de la obesidad no puede ser abordado simplemente desde las técnicas de investigación cuantitativas, mayoritariamente utili-zadas, sino que también son imprescindibles los estudios con técnicas de investigación cualitativa que, mediante el análisis del discurso (11,12), nos permitirán conocer mejor las dimensiones personales, culturales, sociales y simbólicas que subyacen en la etiología de la obesidad y sus complicaciones.
Además de la necesidad de realizar más estudios de investigación cualitativa para conocer mejor las dimensiones de la obesidad, en la actualidad se está impulsando la investigación con perspectiva de género, ya que de manera tradicional los estudios en biomedicina no han investigado con profundidad las diferencias entre hombres y mujeres, o se han realizado mayoritariamente en hombres (13,14). Aunque la perspectiva de género en el sentido amplio va mucho más allá del estudio de las diferencias entre hombres y mujeres, ya que pretende identificar elementos que perpetúan desigualdades en salud entre hombres y mujeres agravadas al combinarse otras desigualda-des y factores específicos que contribuyen a una mayor vulnerabilidad (15), al menos el estudio de las diferencias por sexo es un comienzo importante hacia una profundización posterior. En este contexto, con-viene recordar que entre los factores más relevantes en la etiología de la obesidad, así como en la evolución de la misma y en su morbimor-talidad asociada, se encuentra el sexo (16,17). Por ello, además de intensificar la realización de estudios de investigación básica y clínica que examinen las diferencias metabólicas por sexo, tal como se ha recomendado a nivel internacional (18), es necesario también reali-zar estudios de investigación cualitativa que analicen las diferencias del discurso entre hombres y mujeres obesos para conocer mejor las variables difícilmente medibles en una aproximación cuantitativa. Por ello, el objetivo de nuestro trabajo es llevar a cabo un estudio de investigación cualitativa en hombres y en mujeres obesos de población adulta mediterránea española para conocer las diferencias por sexo en los factores relacionados con la obesidad y con las dificultades para perder peso en ambos grupos, mediante la percepción de esta enfermedad por parte de personas clínicamente obesas.
MÁTERIAL Y MÉTODOS
Hemos realizado un estudio de investigación cualitativa para captar el discurso de personas obesas en relación a las dimensiones más relevantes de la misma. Aunque la mayoría de estudios realizados para conocer los determinantes de la obesidad se han realizado desde la perspectiva de la investigación cuantitativa basada en la medición de hechos, cuantificación y realización de los análisis esta-dísticos correspondientes, en investigación cualitativa el elemento de estudio no son los hechos sino los discursos, y su herramienta no es la cuantificación sino el análisis y la interpretación del lenguaje (19). Aunque también existen distintas conceptualizaciones de lo que es un “discurso” (20), de manera general, entendemos el discurso como un texto (desde una palabra hasta una larga expresión oral o escrita) producido por alguien en situación de comunicación interpersonal. Es esta situación de comunicación interpersonal la que le aporta el valor añadido, ya que permite conocer cómo se usa el lenguaje en la realidad de los contextos sociales (20). Los discursos que la meto-dología cualitativa analiza e interpreta en situaciones de investigación tienen que surgir tras un cuidado diseño metodológico de las condi-ciones de producción de dichos discursos (19). Para generar estos discursos de acuerdo con nuestros objetivos de investigación hemos elegido la técnica cualitativa del denominado grupo de discusión, o grupo focal en inglés (21). Kitzinger (22) define el grupo de discusión como una forma de entrevista grupal que utiliza la comunicación entre participantes e investigador con el propósito de obtener información. Existen también otras definiciones de los grupos de discusión que varían en función de la metodología específica y de los objetivos de la investigación (23).
El grupo de discusión se basa en una interacción grupal don-de un número de personas dialoga en torno a los procesos y situaciones objeto de estudio. En general, el grupo de discusión está constituido por entre seis y ocho personas que cumplen los requisitos establecidos por los investigadores a partir de los objetivos determinados previamente. El grupo de discusión cons-tituye una herramienta eficaz de la vida social, ya que trata de reproducir el contexto interactivo que define y caracteriza la vida de los individuos (21,24,25). Los grupos de discusión pueden ser heterogéneos, es decir, formados por personas de distintas características que interaccionan en la diversidad de la realidad social, o pueden ser homogéneos, formados por personas de las mismas características para conseguir que no haya inhibiciones por la interacción heterogénea (21). En nuestro estudio hemos optado por la realización de dos grupos de discusión homogéneos por sexo, uno de mujeres (n = 8) y otros de hombres (n = 6) adul-tos, todos ellos con obesidad. Para ambos grupos se empleó la misma técnica de reclutamiento de participantes, así como para la organización y realización de la reunión y captación del discurso.
RECLUTAMIENTO DE LOS PARTICIPANTES
El muestreo en las técnicas cualitativas no es probabilístico, su incorporación se hace en forma iterativa, de acuerdo con la infor-mación que va surgiendo en el trabajo de campo. Lo importante

1092 R. Barragán et al.
[Nutr Hosp 2018;35(5):1090-1099]
no es el tamaño de muestra en sí, sino la riqueza de los datos provistos por los participantes y las habilidades de observación y análisis del investigador (26,27). El muestreo no probabilístico para la captación de los participantes en nuestro estudio se realizó mediante la técnica de la bola de nieve, también denominado muestreo por referidos (26). Para ello partimos de varios contac-tos con una persona de confianza de cada uno de los miembros del grupo investigador y, a partir de esta, se va proponiendo a otras personas, que a su vez proponen a otras personas, produ-ciendo un efecto acumulativo parecido a una bola de nieve. Con ello se consigue que las personas que finalmente asisten al grupo de discusión no sean conocidas entre sí y que puedan representar un amplio rango de perfiles en la sociedad. En total se incluyeron 14 personas adultas obesas (ocho mujeres y seis hombres), con una media de edad de 46,1 (10,6) años. Los criterios para selec-cionar a estas personas estaban basados en que fueran obesas, sin otras patologías graves asociadas y que pudieran asistir a la reunión en las fechas programadas. Se fijó la cifra de ocho en cada grupo de manera inicial, pero en hombres solo se pudo conseguir la participación de seis.
GUIÓN DEL GRUPO DE DISCUSIÓN
Dado que el grupo de discusión es una técnica que privilegia el habla con el interés de captar la forma de pensar, sentir y vivir de las personas que conforman el grupo, ambos grupos de discusión se llevaron a cabo en el marco de la temática especí-fica de la obesidad, configurando en primer lugar la guía de la entrevista en base a los objetivos del estudio (21). Para dirigir la conversación en los grupos de discusión se elaboró previamen-te una misma guía temática de entrevista semiestructurada con preguntas abiertas que contemplaban las distintas dimensiones del problema de la obesidad. Esta guía temática de nueve bloques de diferente duración se realizó basada en una amplia revisión bibliográfica y en la experiencia previa de los investigadores en obesidad desde un punto de vista multidisciplinar integrando psi-cólogos, médicos, enfermeras, dietistas, farmacéuticos y otros profesionales relacionados. Los nueve bloques incluyeron ocho áreas temáticas predeterminadas (salud, causas, hábitos de comi-da, ejercicio-sueño, creencias, estrés-ansiedad, motivación, con-trol del peso) y, por último, un bloque libre dirigido a captar lo que las personas quisieran expresar más sobre el tema de obesidad y que no se hubiera incluido en las áreas anteriores.
REALIZACIÓN DE LOS GRUPOS DE DISCUSIÓN
Los grupos de discusión se realizaron en una sala habilitada para ello en el Departamento de Medicina Preventiva de la Facul-tad de Medicina de la Universidad de Valencia. En primer lugar, se comenzó el grupo de discusión de mujeres y, a los pocos días, se realizó el grupo de discusión de hombres. El mismo investiga-dor, un psicólogo experto en metodología cualitativa, actuó como moderador de los dos grupos de discusión. Antes de cada grupo
de discusión, el moderador realizó las presentaciones y explicó el procedimiento y el objetivo del estudio a los participantes. El moderador experto dirigió ambos grupos de discusión utilizando la misma guía temática de entrevista semiestructurada con pregun-tas abiertas agrupadas en ocho bloques temáticos más un bloque libre (Tabla I) que contemplaban las distintas dimensiones del problema de la obesidad. El moderador dirigió el diálogo dando la palabra a los participantes y estimulando su participación, cono-ciendo bien el tema pero absteniéndose de opinar. Guio el diálogo con amabilidad, con sensibilidad, con capacidad de escuchar y de moderar y dando confianza a los participantes para captar lo mejor posible dentro de la temática del guion. Cada grupo de discusión duró aproximadamente 90 minutos, con un descanso de diez minutos en el que se obsequió a los participantes con una merienda y un regalo. Se solicitó autorización a los participantes para grabar las conversaciones y todo el proceso fue grabado y transcrito por los investigadores. El estudio fue aprobado por el Comité de Ética de la Universidad de Valencia. Al final de cada sesión se proporcionó a los participantes un cuestionario para obtener datos sobre las características sociodemográficas, ten-sión arterial, peso, altura, antecedentes y estilo de vida, ade-más de un cuestionario de adherencia a la dieta mediterránea. También se procedió a medir y pesar mediante bioimpedancia a los participantes para comparar con los datos referidos en el cuestionario.
ANÁLISIS DE DATOS
Para el análisis de los datos cuantitativos de las variables socio-demográficas, antropométricas y clínicas de los participantes se utilizaron estadísticos descriptivos como medias y medidas de dispersión (desviación típica) para variables cuantitativas y cálculo de porcentajes para variables categóricas. Se calcularon para el total de los participantes y estratificados en hombres y mujeres.
Los datos producidos por cada uno de los grupos de discusión consistieron en un discurso oral, que quedó registrado mediante una grabadora y fue analizado cualitativamente siguiendo la meto-dología general del análisis temático (28). Para este análisis, tras finalizar cada uno de los grupos de discusión, la conversación gra-bada fue transcrita literalmente por el moderador, lo cual dio como resultado un texto para analizar. Además de las transcripciones literales de la grabación del audio, se contó con la información adicional anotada por el moderador en cada grupo de discusión referente a la comunicación no verbal como las miradas, las son-risas, los asentimientos y otros gestos que se incorporaron como notas adicionales al texto de las transcripciones. Las transcripcio-nes se revisaron por tres investigadores y se aplicaron técnicas cualitativas para la extracción de la información más relevante del discurso, realizando un análisis comparado entre hombres y muje-res. En primer lugar se procedió a la numeración y codificación del texto, asignando también números a cada una de las personas participantes por su orden de intervención en el grupo correspon-diente, e indicando adicionalmente en la numeración si se trataba de un hombre o de una mujer para facilitar el análisis comparado

1093ESTUDIO DE INVESTIGACIÓN CUALITATIVA SOBRE LAS DIFERENCIAS ENTRE HOMBRES Y MUJERES EN LA PERCEPCIÓN DE LA OBESIDAD, SUS CAUSAS, ABORDAJE Y REPERCUSIONES PARA LA SALUD
[Nutr Hosp 2018;35(5):1090-1099]
Tabla I. Guión grupo de discusión “Obesidad” estructurado en nueve bloques
Bloque salud– ¿Piensa que la obesidad supone un problema de salud o es más bien una preocupación estética?– ¿Qué enfermedades cree que se relacionan más con la obesidad?– ¿Cree que es importante perder peso para estar más sano?
Bloque causas
– ¿Cuáles cree usted que son las principales causas de obesidad?– ¿Piensa que hay personas que comen mucho y no engordan y otras que comen menos y sí engordan?
¿Cómo se definiría usted?– ¿Piensa que el ser activo o tener una vida sedentaria influye mucho en la obesidad?
Bloque hábitos de comida
– ¿Ha comido a lo largo de su vida el mismo tipo de alimentos?– ¿Qué tipo de alimentos consume principalmente?– ¿Evita ciertos tipos de alimentos?– ¿Toma comida precocinada, industrial o comida rápida?– ¿Pica entre comidas? ¿Se levanta a comer a deshoras durante la noche?– ¿En qué periodo estacional o diario tiene más hambre?– ¿Qué comida del día realiza más fuerte?– ¿Cuánto tiempo tarda en comer?– ¿Realiza las celebraciones con comidas?– ¿Suele premiarse con alimentos?
Bloque ejercicio-sueño
– ¿Realiza ejercicio físico (andar), sola o acompañada?– Motivos por los que no realiza ejercicio físico.– ¿Considera que duerme suficientes horas? ¿Cuantas horas de sueño duerme? ¿Es un sueño reparador
(seguido)?– ¿Realiza siestas? ¿Cuándo las realiza (a diario, fines de semana…)?
Bloque creencias
– ¿Cree que el agua engorda? ¿Qué alimentos piensa que engordan más?– ¿Piensa que el asesoramiento profesional es importante?– ¿Quién tiene para usted mayor credibilidad al aconsejarles para realizar una dieta?– ¿Considera que la obesidad puede conllevar problemas sociales?
Bloque estrés-ansiedad– ¿Padece estrés y/o ansiedad?– ¿Cómo influyen la ansiedad, el estrés o la felicidad en el consumo de alimentos?– ¿Se siente bien con su imagen? ¿Es feliz con su peso?
Bloque motivación
– ¿Ha realizado algún tipo de dieta alguna vez en su vida?– ¿Han sido efectivos? ¿Ha tenido efecto rebote?– Motivación/desmotivación para realizar dieta. Personas que te apoyan al estar a dieta– ¿Qué te motivó a bajar de peso (en el caso en el que haya realizado alguna dieta)?– ¿Qué hecho es el más difícil a la hora de hacer dieta?– Problemas sociales, psicológicos y/o familiares que hacen que coma más– Miedo a aumentar de peso. ¿Piensa que es fácil disminuir de peso? ¿Y aumentar?
Bloque control del peso
– ¿Cuándo comenzó a engordar?– ¿Cuándo le resulta más difícil mantener el peso (periodos)? ¿Se pesa con regularidad?– ¿Cómo se da cuenta de que ha ganado peso (con la ropa, se lo indican las demás personas, se siente
pesado…)?– Ha mantenido su peso estable, ¿cómo lo ha hecho? En qué momento cambió– En caso de aumentar de peso, ¿come más cantidad de comida o comidas de alto contenido energético
porque piensa que no hay solución?Bloque libre – ¿Qué le gustaría añadir?
entre los dos grupos de discusión. Para la realización del análisis temático se siguieron las recomendaciones generales de Braun V y Clarke V (28), adaptadas a los nueve bloques temáticos previamente estipulados en nuestro guion y siguiendo procesos tanto inductivos como deductivos (28). Así, tras una lectura repetida de los datos se procedió a la búsqueda de patrones de respuesta y significados
semánticos y latentes. Posteriormente de la transcripción de cada grupo de discusión, se seleccionaron todos los extractos relevantes y se crearon temas dentro de cada uno de los nueve bloques temá-ticos iniciales, agrupándose los extractos en forma de subtemas dentro de cada tema relevante. Se elaboraron tablas de contenido para estos conceptos. La exposición ordenada de lo manifestado

1094 R. Barragán et al.
[Nutr Hosp 2018;35(5):1090-1099]
acerca de estos temas la apoyamos en la presentación de las citas textuales en las cuales quedan capturadas las ideas claves del discurso (Tablas III-VII). Además, establecimos relaciones entre dife-rentes temas y subtemas, no solo en cada grupo de discusión, sino añadiendo más profundidad al análisis del discurso comparando los hombres y las mujeres en la búsqueda de relaciones entre los elementos de significado para identificar tendencias o modelos que permitan comprender mejor el contexto de las diferencias por sexo.
RESULTADOS
En la tabla II se presentan las características de los hombres y las mujeres participantes en los dos grupos de discusión realiza-dos. Se trata de ocho mujeres y seis hombres adultos procedentes de población mediterránea española, todos ellos con obesidad y sin otra patología grave asociada. Su media de edad global fue de 46,1 (10,6) años, siendo de 44,6 (12,2) años en mujeres y muy similar en hombres (48,2 ± 7,7) años. El índice de masa corporal (IMC) medio fue de 33,3 (4,0) kg/m2 y fue también muy similar entre hombres y mujeres. El 42,8% del total de participantes realizó estudios secun-darios y un 28,57% manifestó no haber superado estudios primarios. Del resto, el 28,57% realizó formación universitaria (33% hombres y 25% mujeres), incluidas diplomaturas y licenciaturas.
Respecto al estilo de vida, dos de los 14 participantes manifesta-ron estar a dieta en ese momento para perder peso, mientras que otros declararon que habían seguido dieta en numerosas ocasiones. Del total de los participantes, nueve (64,28%) declararon haber recuperado el peso perdido tras alguna de las dietas realizadas.
Los grupos de discusión se realizaron consecutivamente (unos pocos días de diferencia) en el mismo lugar, moderados por el mismo experto y con el mismo guion de bloques temáticos (Tabla I). Sin embargo, se observaron importantes diferencias durante el desarrollo de la sesión del grupo de discusión entre hombres y mujeres. En el análisis temático del discurso las diferencias por sexos se encontraron en múltiples bloques. Aunque en algu-nas ocasiones también había disparidad de opiniones dentro del mismo sexo para el mismo tema, en general, existía más homo-geneidad intrasexo que intersexo. Así, comenzando por el primer bloque del guion centrado en la salud, en el que existían varias preguntas, se identificó como tema común en el análisis temático “la obesidad como preocupación estética o problemas de salud”. Prácticamente todas las mujeres coincidieron en señalar que la obesidad les causaba una preocupación estética más que un problema de salud, mientras que los hombres identificaron menos la estética y la consideraban un problema de salud. En la tabla III se recogen los extractos literales más relevantes del discurso, captados de los participantes en el grupo de discusión respecto a esta dimensión, indicando si proceden de hombres o de mujeres.
En el bloque de causas de la obesidad también se detectaron importantes diferencias entre hombres y mujeres. Las causas autopercibidas de obesidad para las mujeres fueron el embarazo y el periodo menopáusico: “En mi caso ha sido después de los partos, porque yo era muy delgada, me casé con 50 kg, y luego sí que después de los partos he engordado” (08, mujer). Los hábitos alimenticios y las costumbres culturales fueron las principales causas junto con la genética por parte del sector masculino: “Los usos y costumbres” (05, hombre).
Tabla II. Características de los participantes en los grupos de discusión*
Total Mujeres Hombres
Edad (años)† 46,1 (10,6) 44,6 (12,2) 48,2 (8,7)
Tensión arterial sistólica (mmHg) 141,8 (21,0) 134,0 (19,4) 152,2 (20,0)
Tensión arterial diastólica (mmHg) 84,7 (9,2) 84,5 (10,2) 85 (8,6)
Peso autorreferido (kg)† 89,2 (15,4) 83,5 (14,1) 97,0 (16,3)
Peso determinado (kg) 89,5 (15,1) 84,1 (15,2) 96,8 (12,9)
Altura (cm)† 165,2 (9,5) 159,4 (6,5) 170,7 (6,8)
Altura determinada (cm) 163,2 (9,1) 158,0 (6,4) 170,8 (6,5)
IMC calculado (kg/m2) 33,3 (4,0) 33,5 (4,6) 33,1 (3,2)
Antecedentes familiares de obesidad† 64,3% 75,0% 50,0%
Presencia de obesidad en infancia† 7,1% 12,5% 0%
Horas de sueño (horas)† 7,2 (1,1) 7,4 (1,1) 7,0 (1,1)
Picar entre comidas† 50,0% 62,5% 33,3%
Caminar diariamente† 64,3% 62,5% 66,6%
Deporte† 35,7% 25,0% 50,0%
mmHg: milímetros de mercurio; IMC: índice de masa corporal. *Se presentan los valores medios y desviación típica (entre paréntesis) para las variables cuantitativas y los porcentajes para las variables cualitativas. †Variables autorreferidas.

1095ESTUDIO DE INVESTIGACIÓN CUALITATIVA SOBRE LAS DIFERENCIAS ENTRE HOMBRES Y MUJERES EN LA PERCEPCIÓN DE LA OBESIDAD, SUS CAUSAS, ABORDAJE Y REPERCUSIONES PARA LA SALUD
[Nutr Hosp 2018;35(5):1090-1099]
La mayoría de las participantes dijeron observar el aumento de peso mediante la ropa, pero también destacaron, en su mayoría las mujeres, que la opinión de los demás les podía influir. Por el contrario, los hombres opinaron que nunca se percatarían del aumento de peso por la indicación de otra persona (Tabla IV).
De manera coincidente en hombres y mujeres, ambos grupos atribuyeron grandes problemas sociales a la obesidad, además de una discriminación de tipo laboral incrementada en la actualidad. Sin embargo, encontramos diferencias respecto a la amistad y a los sentimientos. Los hombres afirmaron perder amigos por el hecho de estar obesos y las mujeres opinaron tajantemente que la obesidad no influía en la amistad. Además, el grupo masculino destacó el buen carácter de las personas obesas. Los dos grupos coincidieron en que la obesidad en niños y adolescentes puede conllevar mayores problemas sociales que en los adultos (Tabla V).
Por otra parte, las mujeres manifestaron cómo los problemas cotidianos (psicológicos, laborales, familiares, etc.) podrían contri-buir a una ingesta mayor de alimentos: “Yo cuando estoy nerviosa como mucho” (01, mujer); “Hay muchas veces que te enfadas, estás más enfadada y dices ‘me cago en la leche’, me voy a la nevera” (06, mujer). Para los hombres, sin embargo, estos posi-bles hechos no influían en el consumo de alimentos: “Nunca me lo he planteado. Quizás te quite el hambre” (05, hombre).
La mayoría de las mujeres afirmaron haber realizado algún tipo de dieta a lo largo de su vida, mientras que los hombres, en la mayoría de los casos, expusieron haber modificado sus hábitos alimenticios para tener una alimentación más equilibrada, pero sin realizar dieta. Además, diez de los 14 individuos (71,4%) declararon realizar las comidas principales en poco tiempo (˂ 20 minutos). Las dificultades que encontraron ambos sexos al realizar
Tabla III. Agrupación temática y extractos relevantes de los participantes para el bloque salud
Tema Extractos de los participantes
Preocupación estética o problemas de salud
– “Para mí, de salud. Si yo estuviera gordo y estuviera bien me daría igual, pero para mí es por motivos de salud” (06, hombre)
– “Por estética, sí, un poco” (05, hombre)
– “Yo creo que es más por salud, es encontrarte tú mejor. Yo hay veces que subo las escaleras del metro y llego arriba fatigado” (04, hombre)
– “Por lo menos en mi caso es por salud” (06, mujer)
– “Vamos a ver, hoy en día es por salud y por estética. Para nosotras, las que tenemos hijas de 17, 20 o 22 años, es por estética” (01, mujer)
– “A mí me afecta, mucho. Yo he aprendido a llevarlo, pero no me gusta, no me gusto. Yo me miro en el espejo y no me gusta lo que veo. Lo que pasa es que me acostumbro a estar así” (03, mujer)
– “A mí no me gusta ir a comprar ropa porque, como me veo tan mal, me miro a los espejos y digo ‘nada’. Y luego no te sienta nada bien, digo ‘pues nada’” (08, mujer)
Tabla IV. Agrupación temática y extractos relevantes de los participantes respecto al bloque control del peso
Tema Extractos de los participantes
Cómo se percata del aumento de peso
– “Tú estás en un sitio y te dicen ‘uy, te veo mejor’, por no decirte ‘uy, te has puesto unos kilitos encima’, que a lo mejor es lo que te quieren intentar decir, y eso creo que psicológicamente es lo que más nos afecta” (04, mujer)
– “Cuando te vas haciendo mayor eso queda en un segundo plano, cuando se es más joven te afecta más” (07, mujer)
– “A mí no me hace falta que me digan que estoy gorda, yo ya lo sé. No me gusta que me digan que estoy gorda” (06, mujer)
– “Yo en mi entorno bromeo incluso de mí misma con la gente que yo quiero y dejo. No me importa para nada, me lo paso bien. Pero fuera de ahí, que me lo diga una persona que no conozco de nada o no dé pie a eso me puede hacer más daño que otra cosa. No me gusta” (02, mujer)
– “El que estás más gordo no te lo suelen decir, por educación o por lo que sea. Por cariño” (06, hombre)
– “Te pueden decir… ‘te veo hinchado’” (05, hombre)
– “Como te ven todos los días, el único que a lo mejor sí hace tiempo que no te ve… Lo que pasa es que no te dice ‘¡hombre, estás más gordo!’, porque queda un poco...” (04, hombre)
– “Si engordas no te dicen nada o casi nada, pero si adelgazas sí que te lo dicen” (02, hombre)

1096 R. Barragán et al.
[Nutr Hosp 2018;35(5):1090-1099]
la dieta fueron poder mentalizarse, empezarla y mantenerla en el tiempo. Muchas de nuestras participantes manifestaron padecer ansiedad y/o estrés al realizar cualquier tipo de dieta (Tabla VI).
Ante la pregunta “¿es feliz con su peso?”, ambos sexos manifes-taron sentir conformidad. Sin embargo, el sexo femenino se mostró
más a disgusto con su peso. Además, ellas aseguraron tener miedo a un posible aumento de peso, mientras que el sexo masculino sentía preocupación, pero en ningún momento miedo (Tabla VII).
Por último, se encontraron diferencias en la estación del año más difícil para mantener el peso y en la forma de premiarse
Tabla V. Agrupación temática y extractos relevantes de los participantes respecto al bloque creencias
Tema Extractos de los participantes
Problemas sociales de la obesidad
– “De cara al personal, antes cogerán a esta chica delgada que a mí” (02, mujer)
– “Laboral sobre todo. Y social, vas a hacer menos amistades o vas a hacer amistades más determinadas” (04, hombre)
– “Además, sentimentales, porque tú ves a una chica gorda o a un chico gordo y dices ¡buah! Siempre te gusta más una que sea delgadita” (06, hombre)
– “Si ahora pasara una Marilyn ya casi ni la mirarías. Estaría gorda con respecto a lo que está de moda” (05, hombre)
– “Sí, hay una cosa y es… Yo lo he percibido, que los obesos son personas de buen carácter, campechanas” (03, hombre)
– “El niño gordito de clase siempre va a ser señalado. La gente más adulta creo que no” (04, mujer)
– “Yo creo que tiene que ver con la edad de la persona. No es lo mismo un adolescente obeso y donde se mueva, que una persona más adulta y obesa” (05, mujer)
Tabla VI. Agrupación temática y extractos relevantes de los participantes respecto al bloque motivación
Tema Extractos de los participantes
Realización de dietas
– “Sí, yo me las sé de memoria” (03, mujer)
– “El hecho de estar a dieta no, es el hecho de comer mejor” (04, hombre)
– “A mí me lo han dado, pero no he llegado ni a empezarla” (02, hombre)
– “En cuanto te obligan a ponerte a dieta es cuando más hambre tienes. Y solo piensas en la comida” (01, hombre)
Tabla VII. Agrupación temática y extractos relevantes de los participantes respecto a los bloques estrés-ansiedad, motivación, control de peso y hábitos alimenticios
Tema Extractos de los participantes
Feliz con el peso
– “Yo quisiera estar más delgada, estaría mejor más delgada. A gusto no estoy” (02, mujer)
– “Lo lleva una, pero vamos, como que feliz no te encuentras. Feliz no te encuentras de tenerlo, lo que pasa es que como lo tienes, tampoco te vas a…” (06, mujer)
– “Digamos que lo aceptamos porque no nos queda más remedio” (03, hombre)
Miedo a aumentar de peso
– “Yo, ahora mismo, más de lo que estoy sí que no podría. Me negaría a mí misma pasarme. Es el límite ya” (02, mujer)– “Yo he estado sin pesarme ya dos o tres años” (08, mujer)
Estación del año más difícil para mantener
el peso
– “Se picotea más” (01, mujer)– “Hace más calor, te dan menos ganas de hacer ejercicio, de salir, de andar” (06, mujer)– “En verano los heladitos entran muy bien, la horchata” (01, mujer)– “Estás más activo” (01, hombre)– “Yo a lo mejor cenar, ceno dos rajas de sandía o de melón” (03, hombre)
Alimentos como premio
– “Yo, con el chocolate” (05, mujer)– “Yo más bien lo vería como una recompensa. Una recompensa que te haces a ti misma” (08, mujer)– “En mi casa los premios no son los alimentos” (04, hombre)– “Yo algunas veces con el salchichón, cuando llevo mucho tiempo sin comprarme” (06, hombre)

1097ESTUDIO DE INVESTIGACIÓN CUALITATIVA SOBRE LAS DIFERENCIAS ENTRE HOMBRES Y MUJERES EN LA PERCEPCIÓN DE LA OBESIDAD, SUS CAUSAS, ABORDAJE Y REPERCUSIONES PARA LA SALUD
[Nutr Hosp 2018;35(5):1090-1099]
entre hombres y mujeres. El verano fue el periodo más difícil para mantener el peso según las mujeres y el más fácil para el sexo masculino. A la pregunta de si utilizaban los alimentos como premio ante determinadas situaciones, solo dos de los hombres manifestaron premiarse con comidas, mientras que el total de las mujeres afirmaron realizarlo (Tabla VII).
DISCUSIÓN
En este trabajo hemos llevado a cabo la realización de dos gru-pos de discusión separados de hombres y mujeres como técnica de investigación cualitativa para conocer el discurso de ambos relacionado con la obesidad, sus causas, sus abordajes, sus con-secuencias y las repercusiones sobre la salud, y se han encon-trado diferencias importantes en las dimensiones analizadas. La realización de los grupos de discusión como técnica cualitativa nos permite comprender la percepción de personas clínicamente obesas sobre esta patología, el estilo de vida, el ambiente que les rodea, la autoestima y las dificultades que encuentran para bajar de peso (11). Esta técnica cualitativa es un apoyo y complemento importante a la investigación cuantitativa que mayoritariamente se está realizando actualmente en obesidad cuantificando hechos, ya que nos aporta una información más global de diferentes factores que pueden afectar a la obesidad y que hasta ahora no se han estudiado (27). Actualmente, varios ensayos clínicos y estudios de casos y controles y cohortes están aplicando técnicas cualitativas basadas en grupos de discusión para captar mejor el discurso de los participantes y poder mejorar las intervenciones, así como el diseño de instrumentos de medida basados en cuestionarios, ya que la información que facilita un grupo de discusión es suma-mente valiosa para todo ello (29,30).
Nuestro estudio nos ha permitido poner de manifiesto la exis-tencia de importantes diferencias entre los hombres y las muje-res en los nueve bloques en los que se ha dividido de manera semiestructurada el grupo de discusión. Estos resultados contri-buyen a aumentar la evidencia, incluso a nivel de dimensiones conceptuales y simbólicas, de la importancia de profundizar en la investigación de las diferencias por sexo en los problemas de salud, tal como se está insistiendo desde distintas asociaciones, expertos en el tema y organismos de investigación nacionales e internacionales (17,18,31).
En España se ha descrito desde hace varios años una inte-racción sexo-nivel socioeconómico de manera que las mujeres con menor nivel socioeconómico presentan una mayor preva-lencia de obesidad que los hombres de similar nivel (16). Así, en la Encuesta Nacional de Salud de 2006, realizada en más de 25.000 personas, no solamente se encontró que las mujeres de clase baja tenían un riesgo de sobrepeso un 49% mayor y un riesgo de obesidad un 96% mayor comparadas con las mujeres de clase alta, sino que las mujeres de clase baja, comparadas con los hombres de clase baja, tenían también un mayor riesgo de obesidad que ellos (16). Tanto los ingresos como el nivel de estudios influyen en la selección y compra de alimentos. Varios estudios muestran cómo personas con un mayor nivel educativo
presentan dietas de mayor calidad, con un alto consumo de frutas, verduras, pan integral y cereales de desayuno, y un menor consu-mo de azúcar, carnes rojas y comida procesada (8,32,33). Estas asociaciones son cada vez más frecuentes a nivel internacional, donde, claramente, niveles de educación más bajos se asocian con una mayor prevalencia de obesidad (34), lo cual, en parte, se podría relacionar con un menor conocimiento de la enfermedad (3). Además de esto, puede ser debido al mayor coste de los alimentos saludables, ya que en determinados lugares es más barato comprar comida procesada rica en grasas saturadas y en azúcares que fruta y verdura o productos desnatados (35).
La composición de la dieta y las facilidades o dificultades en poder seguir una alimentación saludable contribuyen, no solo al incremento del riesgo de obesidad, sino también al éxito de la pérdida de peso. La mayoría de las mujeres que han participado en nuestro estudio han realizado alguna dieta a lo largo de su vida, incluso alguna de ellas de forma continua, siendo en general superior el tiempo (en años de vida) que han pasado las mujeres siguiendo alguna dieta en comparación con los hombres. Además, las mujeres manifestaron que los problemas de la vida diaria les hacían ingerir una mayor cantidad de alimentos, y que solían utilizar la comida para premiarse. Recientes estudios fisiológicos en los que se han analizado el cerebro y el funcionamiento de las conexiones neuronales en distintas zonas apoyan las diferencias por sexos en este comportamiento alimentario, poniendo de mani-fiesto que las mujeres son más susceptibles de ser comedoras emocionales que los hombres (36). De acuerdo con ello, este discurso de que los problemas de la vida diaria hacen ingerir una mayor cantidad de alimentos no lo observamos en el caso del sexo masculino. De manera paralela a la existencia o no de esta situación de comedor emocional, varios estudios de investigación cualitativa han identificado posibles predictores del éxito en las dietas (37). Sin embargo, estos estudios no han profundizado lo suficiente en las diferencias entre hombres y mujeres, como se señala en nuestra investigación. Esto puede ser debido a la mayor presión social a la que están sometidas las mujeres desde la infancia, debido al estereotipo occidental en el cual las mujeres deben ser y estar perfectas. Ellas manifestaron claramente tener una mayor preocupación por las consecuencias estéticas de la obesidad que los hombres. En general, se ha descrito que las mujeres tienen una mayor presión y preocupación por la imagen corporal que los hombres incluso en ausencia de obesidad (38). Ello les lleva a tomar decisiones muy presionadas sobre restriccio-nes calóricas no realistas y seguimiento de dietas no saludables que inducen una rápida pérdida de peso pero también un acen-tuado efecto rebote con más ganancia de peso que al inicio de la intervención. Los hombres no están sujetos a dicha presión y su equilibrio y aceptación del peso corporal es más estable. Estas diferencias son más notables en edades jóvenes e intermedias de la vida, pero incluso en estudios realizados en personas de edad avanzada se puede detectar esta diferencia por sexo (39). Así, en un estudio realizado en personas ancianas sobre la aceptación de su imagen corporal, los hombres manifestaron una mayor aceptación de su sobrepeso-obesidad, mientras que las mujeres tenían un mayor rechazo y les costaba aceptar también más el

1098 R. Barragán et al.
[Nutr Hosp 2018;35(5):1090-1099]
proceso natural de envejecimiento (39). Es desde los medios de comunicación fundamentalmente desde donde nos transmiten el mensaje de que las mujeres deben estar delgadas y atractivas para los hombres y desde donde nos presentan una imagen irreal de la mujer, que puede dar lugar a sentimientos de inseguridad e insatisfacción (40). La divulgación y aceptación de una imagen corporal más real podría disminuir la presión sobre la necesidad de una pérdida de peso (41) y minimizar los altibajos en el peso más frecuentes en las mujeres que en los hombres.
Uno de los factores más importantes en los esfuerzos para perder peso son las relaciones con otros individuos y con el ambiente y el apoyo de familiares y amigos (40). Un estudio realizado en ado-lescentes afroamericanos asoció un mayor apoyo emocional de la familia con un aumento en la realización de ejercicio físico (42).
Por otro lado, resulta curiosa la parte del discurso donde se liga obesidad y amistad. Los participantes masculinos expusieron cómo la obesidad podía afectar a la amistad, incluso perdiendo amigos. Por el contrario, esto fue negado de manera tajante por las mujeres, ya que opinaban que la obesidad no influía a la hora de tener amigos verda-deros. Ello contrasta con el razonamiento anterior en el que la mujer sentía más presión para no estar obesa de cara a la sociedad o para el mundo laboral, pero esta mujer reitera que no es dificultad frente a los amigos verdaderos. De nuevo existen aquí dos aproximaciones contrapuestas: por una parte, tenemos los trabajos que indican que una relación de amistad estrecha con una persona obesa conduce a que la persona amiga tenga una percepción más suave del peso del obeso y que no lo perciba como tal (3); y por otra parte, existen traba-jos que indican que el entorno social del obeso favorece la obesidad, ya que el obeso tiende a relacionarse con otros obesos, perpetuando la situación de obesidad en ambientes obesogénicos (43).
En nuestro estudio hemos constatado que la opinión de los demás puede influir de diferentes formas según el sexo. Las mujeres se mostraron más sensibles al hecho de que personas ajenas las consideraran obesas, lo cual les podía afectar a nivel personal de forma negativa. Sin embargo, esta respuesta no fue homogénea y algunas mujeres, por el contrario, reaccionaban ignorando estos comentarios. Un estudio realizado por Cossrow mostró cómo las mujeres tenían mayores experiencias negativas respecto a su peso que los hombres: burlas, acoso, insultos o situaciones de discriminación, tanto en entornos cercanos (casa, amigos y trabajo) como ajenos a ellos (44). Existen estudios que manifiestan que la discriminación de las personas obesas puede motivarles a tener un estilo de vida saludable, evitando así situa-ciones de marginalidad. Sin embargo, esta estigmatización podría llevar a todo lo contrario, provocando el consumo de alimentos no saludables así como la realización de menos actividad física y/o a tener trastornos de la alimentación (8). Se presupone que las personas obesas no tienen voluntad y son perezosas, con lo cual el éxito en la pérdida de peso se niega desde el inicio (3). Algunos autores indican que son los propios obesos los que no están dispuestos a cambiar de hábitos debido a los intentos fallidos anteriores (45), ya sea mediante dietas o ejercicio físico.
Finalmente, ambos grupos indicaban que tenían preocupación por los problemas de salud que podrían suponerles el estar obe-sos, pero de nuevo encontramos diferencias entre sexos en cuan-
to a las motivaciones para adelgazar. Los hombres manifiestan que la principal motivación para adelgazar les vendría dada por mejorar su salud, mientras que las mujeres manifiestan que la principal motivación para perder peso sería la estética.
En conclusión, podemos afirmar que existen importantes diferen-cias entre el discurso de las mujeres y el de los hombres obesos en distintas dimensiones de la obesidad; entre ellas destacan la per-cepción de la obesidad y el abordaje de esta patología de manera más considerada. Destacamos una mayor preocupación estética en el caso de las mujeres y una mayor presión social por perder peso, que a su vez les lleva a realizar dietas más estrictas con gran efecto rebote en el que influye también su mayor susceptibilidad a comer emocionalmente que los hombres. Sin embargo, ambos sexos coinciden en los problemas sociales que puede conllevar la obesidad. Estos resultados nos permiten proponer el enfoque del tratamiento de la obesidad desde un punto de vista más multidi-mensional (46), teniendo en cuenta las diferencias por sexo, y no solo desde el punto de vista del contaje de calorías. Por ello, es necesario disponer de un equipo multidisciplinar que permita cono-cer distintos aspectos del ambiente social y familiar del individuo para la realización de intervenciones dietéticas personalizadas para cada sexo y prolongadas en el tiempo.
AGRADECIMIENTOS
Este estudio ha sido parcialmente financiado por las siguientes ayudas: Proyecto PROMETEO/2017/017 (Generalitat Valenciana), CIBEROBN (Instituto de Salud Carlos III), Fundació La Marato-TV3, programa VALi+d (Generalitat Valenciana) y EAT2BeNice (nº 728018. Horizon 2020).
BIBLIOGRAFÍA
1. Livingston EH. Reimagining obesity in 2018: a JAMA theme issue on obesity. JAMA 2018;319(3):238-40.
2. Friedrich MJ. Global obesity epidemic worsening. JAMA 2017;318(7):603.3. Sikorski C, Luppa M, Schomerus G, Werner P, König HH, Riedel-Heller SG.
Public attitudes towards prevention of obesity. PLoS One 2012;7(6):e39325.4. Upadhyay J, Farr O, Perakakis N, Ghaly W, Mantzoros C. Obesity as a disease.
Med Clin North Am 2018;102(1):13-33.5. Parto P, Lavie CJ. Obesity and cardiovascular diseases. Curr Probl Cardiol
2017;42(11):376-94.6. Rajan TM, Menon V. Psychiatric disorders and obesity: a review of association
studies. J Postgrad Med 2017;63(3):182-90.7. Lewis S, Thomas SL, Hyde J, Castle D, Blood RW, Komesaroff PA. “I don’t eat
a hamburger and large chips every day!” A qualitative study of the impact of public health messages about obesity on obese adults. BMC Public Health 2010;4;10:309.
8. Sikorski C, Luppa M, Kaiser M, Glaesmer H, Schomerus G, König HH, et al. The stigma of obesity in the general public and its implications for public health - A systematic review. BMC Public Health 2011;23(11):661.
9. Wu YK, Berry DC. Impact of weight stigma on physiological and psychological health outcomes for overweight and obese adults: a systematic review. J Adv Nurs 2018;74(5):1030-42.
10. Puhl RM, Heuer CA. Obesity stigma: important considerations for public heal-th. Am J Public Health 2010;100(6):1019-28.
11. García Calvente MM, Mateo Rodríguez I. The focus group as a qualitative research technic in health: its design and practical application. Aten Primaria 2000;25(3):181-6.

1099ESTUDIO DE INVESTIGACIÓN CUALITATIVA SOBRE LAS DIFERENCIAS ENTRE HOMBRES Y MUJERES EN LA PERCEPCIÓN DE LA OBESIDAD, SUS CAUSAS, ABORDAJE Y REPERCUSIONES PARA LA SALUD
[Nutr Hosp 2018;35(5):1090-1099]
12. Hartmann-Boyce J, Boylan AM, Jebb SA, Fletcher B, Aveyard P. Cognitive and behavioural strategies for self-directed weight loss: systematic review of qualitative studies. Obes Rev 2017;18(3):335-49.
13. Ostan R, Monti D, Gueresi P, Bussolotto M, Franceschi C, Baggio G. Gen-der, aging and longevity in humans: an update of an intriguing/neglected scenario paving the way to a gender-specific medicine. Clin Sci (Lond) 2016;130(19):1711-25.
14. Mauvais-Jarvis F, Arnold AP, Reue K. A guide for the design of pre-clinical studies on sex differences in metabolism. Cell Metab 2017;25(6):1216-30.
15. Gijsbers van Wijk CM, Van Vliet KP, Kolk AM. Gender perspectives and quality of care: towards appropriate and adequate health care for women. Soc Sci Med 1996;43(5):707-20.
16. Ortiz-Moncada R, Álvarez-Dardet C, Miralles-Bueno JJ, Ruiz-Cantero MT, Dal Re-Saavedra MA, Villar-Villalba C, et al. Social determinants of overweight and obesity in Spain in 2006. Med Clin (Barc) 2011;137(15):678-84.
17. Mauvais-Jarvis F. Sex differences in metabolic homeostasis, diabetes, and obesity. Biol Sex Differ 2015;6:14.
18. Reusch JEB, Kumar TR, Regensteiner JG, Zeitler PS; Conference Participants. Identifying the critical gaps in research on sex differences in metabolism across the life span. Endocrinology 2018;159(1):9-19.
19. Conde F, Pérez-Andrés C. La investigación cualitativa en salud pública. Rev Esp Salud Pública 1995;69:145-9.
20. Urra E, Muñoz A, Peña C. El análisis del discurso como perspectiva meto-dológica para investigadores de salud. Enfer Universitaria 2013;10(2):50-7.
21. Hamui-Sutton A, Varela-Ruiz M. La técnica de grupos focales. Inv Ed Med 2013;2(1):55-60.
22. Kitzinger J. Qualitative research: introducing focus group. BMJ 1995;311:299-302.
23. Pérez Andrés C. Qualitative methodology. Rev Esp Salud Publica 2002;76(5):373-80.
24. Lindsay AC, Wallington SF, Muñoz MA, Greaney ML. A qualitative study con-ducted in the USA exploring Latino fathers’ beliefs, attitudes and practices related to their young children’s eating, physical activity and sedentary beha-viours. Public Health Nutr 2018;21(2):403-15.
25. Sánchez-Moreno E. Capítulo 10: La investigación cualitativa en la investiga-ción en salud. Fundamentos y rigor científico. SEMERGEN 2008;34(2):75-9.
26. Martínez-Salgado C. Sampling in qualitative research: basic principles and some controversies. Cien Saude Colet 2012;17(3):613-9.
27. Draper AK. The principles and application of qualitative research. Proc Nutr Soc 2004;63(4):641-6.
28. Braun V, Clarke V. Using thematic analysis in psychology. Qual Res Psychol 2006;3(2):77-101.
29. Levitt HM, Bamberg M, Creswell JW, Frost DM, Josselson R, Suárez-Orozco C. Journal article reporting standards for qualitative primary, qualitative meta-analytic, and mixed methods research in psychology: the APA Publications and Communications Board task force report. Am Psychol 2018;73(1):26-46.
30. Scelzo A, Di Somma S, Antonini P, Montross LP, Schork N, Brenner D, et al. Mixed-methods quantitative-qualitative study of 29 nonagenarians and centenarians in rural Southern Italy: focus on positive psychological traits. Int Psychogeriatr 2018;30(1):31-8.
31. García-Calvente M del M, Ruiz-Cantero MT, Del Río-Lozano M, Borrell C, López-Sancho MP. Gender inequalities in research in public health and epi-demiology in Spain (2007-2014). Gac Sanit 2015;29(6):404-11.
32. Jarman M, Lawrence W, Ntani G, Tinati T, Pease A, Black C, et al. Low levels of food involvement and negative affect reduce the quality of diet in women of lower educational attainment. J Hum Nutr Diet 2012;25(5):444-52.
33. Martínez J, Powell J, Agne A, Scarinci I, Cherrington A. A focus group study of Mexican immigrant men’s perceptions of weight and lifestyle. Public Health Nurs 2012;29(6):490-8.
34. Hiilamo A, Lallukka T, Mänty M, Kouvonen A. Obesity and socioeconomic disadvantage in midlife female public sector employees: a cohort study. BMC
Public Health 2017;17(1):842.35. Kumar G, Jim-Martin S, Piltch E, Onufrak S, McNeil C, Adams L, et al. Heal-
thful nutrition of foods in Navajo Nation stores: availability and pricing. Am J Health Promot 2016;30(7):501-10.
36. Gupta A, Mayer EA, Labus JS, Bhatt RR, Ju T, Love A, et al. Sex commonalities and differences in obesity-related alterations in intrinsic brain activity and connectivity. Obesity (Silver Spring) 2018;26(2):340-50.
37. Rafiei N, Gill T. Identification of factors contributing to successful self-directed weight loss: a qualitative study. J Hum Nutr Diet 2018;31(3):329-36.
38. Dijkstra P, Barelds DP. Women’s meta-perceptions of attractiveness and their relations to body image. Body Image 2011;8(1):74-7.
39. Lipowska M, Lipowski M, Olszewski H, Dykalska-Bieck D. Gender differen-ces in body-esteem among seniors: beauty and health considerations. Arch Gerontol Geriatr 2016;67:160-70.
40. Fernández-Ramírez B, Esquirol E, Baleriola E, Rubio C. El discurso popular sobre la obesidad análisis de contenido de una discusión virtual. Aposta 2012;52.
41. Chen X, Wang Y. Is ideal body image related to obesity and lifestyle behaviors in African-American adolescents? Child Care Health Dev 2012;38(2):219-28.
42. St. George SM, Wilson DK. A qualitative study for understanding family and peer influences on obesity-related health behaviors in low-income Afri-can-American adolescents. Child Obes 2012;8(5):466-76.
43. Datar A, Nicosia N. Association of exposure to communities with higher ratios of obesity with increased body mass index and risk of overweight and obesity among parents and children. JAMA Pediatr 2018.
44. Cossrow NH, Jeffery RW, McGuire MT. Understanding weight stigmatization: a focus group study. J Nutr Educ 2001;33(4):208-14.
45. Chang CT, Chang KH, Cheah WL. Adults’ perceptions of being overweight or obese: a focus group study. Asia Pac J Clin Nutr 2009;18(2):257-64.
46. Cochrane AJ, Dick B, King NA, Hills AP, Kavanagh DJ. Developing dimensions for a multicomponent multidisciplinary approach to obesity management: a qualitative study. BMC Public Health 2017;17(1):814.

NutriciónHospitalaria
Trabajo Original Obesidad y síndrome metabólico
ISSN (electrónico): 1699-5198 - ISSN (papel): 0212-1611 - CODEN NUHOEQ S.V.R. 318
Correspondence: Mariana Câmara Martins Bezerra Furtado. Onofre Lopes University Hospital. Federal University of Rio Grande do Norte. Petrópolis, 59012-300. Natal-RN, Brazile-mail: [email protected]
Furtado MCMB, Vermeulen KM, Bellot PENR, Godoy CMA, Coelho D, Godoy EP, Oliveira AMG, Campos JM. Evaluation of factors that may influence in the insufficient weight loss in patients after two years of Roux-en-Y gastric bypass. Nutr Hosp 2018;35(5):1100-1106
DOI: http://dx.doi.org/10.20960/nh.1814
Evaluation of factors that may influence in the insufficient weight loss in patients after two years of Roux-en-Y gastric bypass Evaluación de factores que pueden influenciar en la pérdida de peso insuficiente en pacientes después de dos años de bypass gástrico en Y de Roux
Mariana Câmara Martins Bezerra Furtado1,2, Karina Marques Vermeulen³, Paula Emília Nunes Ribeiro Bellot4, Cynthia Meira de Almeida Godoy1, Daniel Coelho1, Eudes Paiva de Godoy1, Antonio Manuel Gouveia de Oliveira5 and Josemberg Marins Campos2
1Onofre Lopes University Hospital. Federal University of Rio Grande do Norte. Natal, Brazil. ²Graduate Program in Surgery. Federal University of Pernambuco. Recife, Brazil. ³Department of Nutrition. Federal University of Rio Grande do Norte. Natal, Brazil. 4Graduate student of the Nutrition course. Federal University of Rio Grande do Norte. Natal, Brazil. 5Health Sciences Center. Federal University of Rio Grande do Norte. Natal, Brazil
Palabras clave:
Obesity. Bariatric surgery. Food habits. Weight loss. Weight regain.
Resumen Introducción: la cirugía bariátrica es una opción favorable para el tratamiento de la obesidad, resultando a largo plazo en pérdida de peso.
Objetivos: analizar si el comportamiento alimentario, evaluado por la ingesta calórica, las preferencias y las tolerancias alimentarias, puede ser considerado un factor determinante de los resultados de pérdida de peso en pacientes obesos sometidos a bypass gástrico en Y de Roux (BPGYR).
Métodos: se realizó un estudio de cohorte retrospectivo con 105 pacientes sometidos a cirugía de BPGYR, con índice de masa corporal (IMC) preoperatorio ≥ 35 kg/m² y, como mínimo, dos años de postoperatorio. La ingesta calórica fue evaluada por el recordatorio alimentario de 24 horas y el registro alimentario de tres días. Para la evaluación de los hábitos alimentarios se empleó un cuestionario cualitativo de frecuencia alimentaria y para la tolerancia alimentaria, un cuestionario validado.
Resultados: la mayoría de los participantes eran del sexo femenino (84%). La edad promedio fue de 43,30 ± 11,39 años en el grupo éxito y de 43,39 ± 10,73 años en el grupo sin éxito. El IMC preoperatorio no presentó influencia sobre el resultado final. El promedio de ingesta calórica no mostró diferencia significativa entre los grupos estudiados (R 24 h, p = 0,27; registro del diario alimentario, p = 0,95). La frecuencia del consumo semanal de dulces fue dos veces mayor en el grupo éxito. Apenas dos pacientes del grupo éxito presentaban vómitos diarios.
Conclusión: los factores que determinan la falta de éxito en la pérdida de peso aún no están bien esclarecidos. La ingesta calórica no fue un factor determinante para no obtener éxito y la pérdida de peso insuficiente fue más prevalente en los pacientes que dejaron de perder peso más temprano.
Key words:
Obesidad. Cirugía bariátrica. Hábitos alimentarios. Pérdida de peso. Reganancia de peso.
Abstract Introduction: bariatric surgery is a favorable option for the treatment of obesity, resulting in long-term weight loss.
Objectives: to analyze whether feeding behavior, evaluated by caloric intake, dietary preferences and tolerance, can be considered as a deter-minant factor for weight loss in obese patients submitted to Roux-en-Y gastric bypass (RYGB).
Methods: cross-sectional study of 105 patients with at least two years post-RYGB surgery with a preoperative body mass index (BMI) of ≥ 35 kg/m². Caloric intake was evaluated by 24-hour dietary recall and 3-day dietary intake record; dietary habits, by a qualitative dietary frequency questionnaire; and food tolerance, with a validated questionnaire. Multiple logistic regression was used for statistical analysis.
Results: the majority of the 105 participants were female (84%). The mean age was 43.3 ± 11.4 years in the success group (n = 64) and 43.4 ± 10.7 years in the failure group (n = 41). Preoperative BMI was not associated with the outcome. Mean caloric intake did not show significant differences between groups: 24 hours recall, p = 0.27; 3-day record, p = 0.95. The frequency of weekly consumption of desserts was twice as high in the success group. Only two patients in the success group presented daily vomiting.
Conclusion: the factors that determine the failure of weight loss have not yet been fully elucidated. Caloric intake was not a determining factor of failure, and insufficient weight loss was more prevalent in patients who ceased to lose weight earlier.
Received: 30/01/2018 • Accepted: 09/06/2018
©Copyright 2018 SENPE y ©Arán Ediciones S.L. Este es un artículo Open Access bajo la licencia CC BY-NC-SA (http://creativecommons.org/licenses/by-nc-sa/4.0/).

1101
[Nutr Hosp 2018;35(5):1100-1106]
EVALUATION OF FACTORS THAT MAY INFLUENCE IN THE INSUFFICIENT WEIGHT LOSS IN PATIENTS AFTER TWO YEARS OF ROUX-EN-Y GASTRIC BYPASS
INTRODUCTION
The growing epidemic of obesity is associated with an increased demand for bariatric surgery to treat this condition. Currently, Roux-en-Y gastric bypass (RYGB) surgery is one of the most widely performed surgical techniques in the world (1). Bariatric surgery is the most efficient treatment for obese patients, resulting in long-term weight loss, and is associated with improvements in health and quality of life in most patients (2,3).
Weight loss success following RYGB surgery occurs due to the combination of restriction of the gastric corpus to a 15 to 30 ml pouch, malabsorption promoted by the derivation of the duo-denum and the proximal jejunum, and the change in the basal metabolic rate (4,5). Hormonal mechanisms are also involved in weight loss, such as reduction of ghrelin secretion (an orexigen hormone) and increased secretion of peptide YY and GLP-1 (glu-cagon-like peptide-1), both being anorexigenic hormones (6,7).
A common definition of successful postoperative outcome is a 50% loss of excess weight, where excess weight is defined as preoperative weight minus ideal weight. Maximum weight loss is usually achieved between 12 and 24 months postoperatively (8).
Although most patients have successful weight loss after bar-iatric surgery, a small group (20-30%) are unsuccessful in this objective. In this subpopulation, weight recovery tends to begin between 18 and 24 months postoperatively, leading to a decrease or the reverse of improvements in comorbidities and to a decline in quality of life (2).
The factors involved in weight recovery are still not very well elucidated. The literature suggests that they may be related to a higher preoperative body mass index (BMI), to gastric pouch dilatation caused by increased volume intake, and to a sedentary lifestyle (9,10). Another important factor, which may also be relat-ed to the failure of weight loss, is the presence of inadequate food habits, such as the high consumption of simple carbohydrates and the low consumption of high protein foods, since patients report more difficulty in ingesting this group of foods, and the consumption of highly caloric liquids and snacks, which lead to a progressive increase in caloric intake (11-13).
In view of the above, this study aims to analyze whether feeding behavior, evaluated by caloric intake, and dietary preferences and tolerances, can be considered as determinant factors of weight loss results in obese patients submitted to RYGB surgery.
MATERIAL AND METHODS
This is a cross-sectional study with retrospective and pro-spective data, approved by the Research Ethics Committee of the Onofre Lopes University Hospital (HUOL) under number 30955114.1.0000.5292. Prior to inclusion into the study, all par-ticipants signed the informed consent form.
The research was conducted with patients undergoing RYGB laparoscopic surgery, from the Obesity Surgery and Related Dis-eases Department (SCODE) at the HUOL, Federal University of Rio Grande do Norte (UFRN), in the Northeast of Brazil. The patients
were submitted to surgery according to the criteria established by the Brazilian Ministry of Health.
Data collection was performed at the SCODE nutrition depart-ment, in routine visits, from 2015 to 2016, and preoperative data, weight, height, and preoperative BMI, as well as the minimum BMI attained and its respective postoperative time, were collected retrospectively from the patients’ charts.
One hundred and five patients of both sexes were included in the study, aged between 18 and 70 years, and registered in the SCODE, with preoperative BMI of ≥ 35 kg/m² and at least two years postoperative, operated between 2006 and 2014. After the data collection, the patients were divided into two groups: the success group (64 patients), who had ≥ 50% of excess weight lost (EWL), and the failure group (41 patients), who had ˂ 50% EWL. EWL was calculated by dividing the weight loss (kg) by weight excess (preoperative weight minus ideal weight) and multiplying the result by 100.
Participants were weighted on a digital scale and had their height measured on a stadiometer (both from Filizola, São Paulo, Brazil). Obesity was defined according to the World Health Orga-nization (WHO) classification and based on BMI, defined as body weight (kg) divided by the square of height (m).
Patients diagnosed with psychiatric illness, pregnant women, patients with complications that could lead to food intolerance, such as stenosis, and other surgical procedures that could lead to weight loss were excluded from the study.
At the time of the consultation, a validated and structured questionnaire was applied to assess the existence and degree of food tolerance (12). Average calorie, micronutrients and diet composition were calculated by the Avanutri (Três Rios, RJ, Brazil) software, and as an instrument for data collection for this analysis, a 24-hour dietary recall was applied, where the patients reported all food and drink consumed during the day before the interview, with their respective home measurements. Also, for this analysis, a three-day food record was applied, where participants were advised to record all food and drink consumed and their respective home measurements on three sheets of paper (one for each day), with times and distribution of meals throughout the day. For the analysis of macro and micronutrients, the use of supplements was not considered.
For food preference evaluation, the qualitative food frequency questionnaire (QFFQ) was applied. The participants reported the average habitual frequency of consumption of each item, by its respective unit of time (times/week). For this study, the frequency of consumption of fruits, vegetables, fried foods, desserts and simple carbohydrates (CHO) (bread, pasta, rice, biscuits, potatoes and flour) was analyzed.
Practitioners of physical activity were those considered doing a minimum of 150 minutes per week, according to the WHO recommendation (14).
The Stata 11 program (Stata Corp., College Station, TX, USA) was used for statistical analysis. The Student’s t-test was used to compare demographic, anthropometric and nutritional variable aver-ages. For food journal record analysis, the three day record average was used. The Chi-square test was used to compare the proportion

1102 M. C. M. B. Furtado et al.
[Nutr Hosp 2018;35(5):1100-1106]
Figure 1.
Comparison of caloric intake between groups. Failure group: patients with EWL < 50%. Success group: patients with EWL ≥ 50%.
In multivariate analysis, the initial model included all the follow-ing variables: postoperative time, final BMI, minimum BMI attained, postoperative time of the minimum BMI, maximum EWL%, carbo-hydrate (24-hour dietary recall) and B12 vitamin (24-hour dietary recall). In the final model (Table IV), a lower final BMI was associated with weight loss success (OR 0.264, p < 0.001). In subjects with the same final BMI, a higher minimum BMI attained (OR 4.851, p < 0.001) and a higher maximum EWL% (OR 1.515, p < 0.001) were associated with greater likelihood of weight loss success.
DISCUSSION
Weight regain among patients after bariatric surgery is already a known fact among researchers. Some studies have shown that it usually occurs after the second postoperative year (15).
of subjects who practiced physical activity, and the Mann-Whitney test was used to compare the weekly consumption amount of the food groups. The significance level adopted was p < 0.05.
For multivariate analysis, a stepwise backward logistic regres-sion model that included all variables that have shown some evi-dence of association with the dependent variable in a univariate analysis at the p < 0.15 level was used. The final model retained only those variables significant at the p < 0.05 level. Results are presented as odds ratios with 95% confidence intervals.
RESULTS
Of the total of 105 patients, 84% were female and 16% were male. The mean age of the participants was 43.3 ± 11.4 years in the success group (n = 64), and 43.4 ± 10.7 years in the failure group (n = 41) (p > 0.99). The analysis showed no influence on the final weight loss result of the mean preoperative BMI compar-ison. The success group presented a mean of 48.8 ± 8.36 kg/m², and the failure group 49.9 ± 6.93 kg/m² (p = 0.47).
There was no statistically significant difference in mean postop-erative time between the success group (47.9 ± 25.0 months) and the failure group (56.2 ± 26.9 months) (p = 0.11). There was a sta-tistical difference in relation to minimum BMI achieved by the groups (p < 0.001), and in the period of time they achieved this minimum BMI (p = 0.01), as the failure group demonstrated to cease losing weight earlier than the success group, as we can observe in table I.
The analysis of mean caloric intake showed no significant dif-ference between the groups (R24h, p = 0.27) (food journal record, p = 0.95) (Fig. 1), as well as in the diet composition (Table II). The frequency of weekly consumption of desserts was twice as high in the success group as in the failure group (Table III).
The groups presented a good degree of food tolerance, the success group with a score of 22.9 ± 3.40 and the failure group with 22.5 ± 2.52, (p = 0.88). Only two patients in the success group reported daily vomiting (Fig. 2).
Only 18 patients from the success group (34%) performed physical exercise, and ten patients (32.3%) from the failure group (p = 0.87).
Table I. Characteristics of the study population
CharacteristicsFailure group Success group
p-valuen Mean ± SD n Mean ± SD
AgedPostoperative timePreoperative BMIFinal BMIExcess weight loss (%) Minimum BMI attained Postoperative time of the minimum BMI
41 41 41 41 41 41 41
43.29 ± 10.7356.20 ± 26.8549.94 ± 6.6340.09 ± 5.91
36.78 ± 11.6035.82 ± 5.78
16.71 ± 10.54
64 64 64 64 64 64 64
43.29 ± 11.3947.97 ± 24.9648.83 ± 8.3631.81 ± 4.59
66.55 ± 11.5630.49 ± 4.46
25.20 ± 18.13
1.000.110.47
< 0.001< 0.001< 0.001
0.01
BMI: body mass index. Failure group: patients with EWL < 50%. Success group: patients with EWL ≥ 50%. Postoperative time: months. Data are presented as mean ± standard deviation.

1103
[Nutr Hosp 2018;35(5):1100-1106]
EVALUATION OF FACTORS THAT MAY INFLUENCE IN THE INSUFFICIENT WEIGHT LOSS IN PATIENTS AFTER TWO YEARS OF ROUX-EN-Y GASTRIC BYPASS
Table II. Analysis of diet composition
Failure group Success groupp-value
n Mean ± SD n Mean ± SD
24-hour dietary recall
Macronutrient intake
Protein grams 38 63.45 ± 26.62 64 65.70 ± 32.69 0.72
Protein (% total kcal) 38 20 ± 5.61 64 18.81 ± 5.85 0.32
Carbohydrate (% total kcal) 38 52.36 ± 10.02 64 55.36 ± 10.69 0.10
Lipid (% total kcal) 38 27.64 ± 9.08 64 25.29 ± 8.67 0.20
Micronutrient intake Iron (mg) Calcium (mg) Vitamin B12-cyanocobalamin (mcg) Folic acid (mcg) Vitamin B1-thiamine (mg)
38 38 38 38 38
7.75 ± 4.16340.95 ± 243.31
1.92 ± 2.4564.49 ± 45.85
0.65 ± 0.36
64 64 64 64 64
7.84 ± 4.31 406.26 ± 306.80
6.03 ± 13.7470.70 ± 59.56
0.76 ± 0.54
0.920.270.070.580.27
3 day dietary intake record
Macronutrient intake
Protein grams 29 74.93 ± 28.47 39 69.53 ± 20.14 0.36
Protein (% total kcal) 29 23.17 ± 5.1 39 21.79 ± 5.25 0.30
Carbohydrate (% total kcal 29 54.27 ± 22.39 39 52.06 ± 9.0 0.58
Lipid (% total kcal) 29 26.30 ± 7.35 39 26.15 ± 6.1 0.93
Micronutrient intake Iron (mg) Calcium (mg) Vitamin B12-cyanocobalamin (mcg) Folic acid (mcg) Vitamin B1-thiamine (mg)
29 29 29 29 29
8.41 ± 3.72432.5 ± 276.66.24 ± 13.63
100.24 ± 60.620.797 ± 0.383
39 39 39 39 39
8.66 ± 2.97467.3 ± 254.9
9.3 ± 19.8787.20 ± 60.850.870 ± 0.458
0.760.590.480.380.46
Failure group: patients with EWL < 50%. Success group: patients with EWL ≥ 50%. Data are presented as mean ± standard deviation.
Table III. Frequency of weekly consumption per food groupFailure group Success group p-value
n Mean ± SD n Mean ± SD
Fruits Vegetables Fried foodsSweets Simple CHO
31 31 31 31 31
5.71 ± 2.105.65 ± 2.071.10 ± 1.781.03 ± 1.606.03 ± 1.64
52 52 52 52 52
6.12 ± 1.895.15 ± 2.670.85 ± 1.292.02 ± 2.325.75 ± 2.21
0.330.490.460.040.54
Simple CHO: bread, pasta, rice, biscuits, potatoes and flour. Failure group: patients with EWL < 50%. Success group: patients with EWL ≥ 50%.
Table IV. Patient factors associated with successful weight loss after RYGB
Predictors of successFailure group Success group Multivariate analysis
Mean ± SD Mean ± SD OR 95% CI p-value
Final BMI 40.1 ± 5.91 31.8 ± 4.59 0.264 0.140 0.498 < 0.001
Minimum BMI attained 35.8 ± 5.78 30.5 ± 4.46 4.851 2.198 10.707 < 0.001
Maximum EWL% 53.4 ± 14.9 72.2 ± 12.7 1.515 1.227 1.871 < 0.001
BMI: body mass index; EWL: excess weight loss; OR: odds-ratio; CI: confidence interval. Failure group: patients with EWL < 50%. Success group: patients with EWL ≥ 50%.

1104 M. C. M. B. Furtado et al.
[Nutr Hosp 2018;35(5):1100-1106]
The literature suggests that low postoperative dietary adher-ence is increasingly and consistently identified as a predictor of poor results of weight loss after surgery (16). However, our study did not find the same result since there was no statistical differ-ence in the average amount of calories consumed daily and diet quality in the studied groups.
Wardé-Kamar et al. (17) performed a study with 69 patients with a mean duration of 30 ± 8 months postoperative of RYGB, and observed a weight loss at the time of the study of 48 ± 17 kg (4 to 114 kg), with a %EWL of 58 ± 17%. It was also observed that 61% of the patients were successful in postoperative weight loss. Diet composition analysis showed that 22 ± 6% of the total calories were protein, 44 ± 11% were carbohydrates and 33 ± 11%, fat.
In relation to carbohydrate consumption, we observed a higher percentage of consumption than the Wardé-Kamar et al. study. (17). However, there is still no consensus regarding the mac-ronutrient standard to be followed for healthy weight loss after bariatric surgery (18).
Comparing successful and unsuccessful weight loss patients, one study found that patients with %EWL ≥ 50% consumed fewer calories than patients with %EWL < 50%, although this was not significant (1,657 ± 649 kcal vs 1,888 ± 600 kcal , p = 0.24) (17), corroborating our study.
Another study in patients with a mean of 4 ± 1.43 years post-operative reported that they had a daily calorie consumption of 1,885 ± 412 kcal (16).
Sjostrom et al. (19) also suggest that energy intake may influ-ence weight regain. They reported a mean daily intake of 2,900 kcal, 1,500, 1,700, 1,800, 1,900, 2,000 kcal/day: pre-surgery, six months, one year, two years, three years, and between four and ten years post-surgery, respectively.
Post-RYGB patients eat less and feel less hungry. These chang-es may represent a superior efficacy in weight loss compared to other surgical procedures. The exaggerated release of intestinal hormones (PYY and GLP-1) post-RYGB has been suggested as a potential mediator in changes in food preferences and weight loss. Their anorexigenic properties are already being explored to treat obesity (20). Changes in appetite are already evident a few days
after surgery, since postprandial PYY and GLP-1 levels already begin to increase two days after the operation, and they influence appetite reduction, which explains the lower intake of calories and the weight loss.
In patients with unsuccessful weight loss, postprandial PYY and responses to GLP-1 are attenuated in comparison to patients with good postoperative weight loss. Inhibition to respond to intestinal hormones, including PYY and GLP-1, after gastric bypass results in the return of appetite and increased food intake (20-22). This fact may justify the increase in food intake and the weight regain in many patients.
The literature suggests that preoperative BMI can be considered as a predictor of failure of surgery (23). However, in our study, no difference was observed between the groups in relation to initial BMI, corroborating with a study by Shantavasinkul et al. (24), who reported that preoperative BMI is not a predictor of postopera-tive weight regain. This same study observed that patients who ceased to lose weight earlier, on average one year postoperative-ly, presented weight gain. Our study also found this association, demonstrating that the patients in the failure group reached their minimum weight with a mean of 16 months postoperative, long before the patients in the success group, who reached minimum weight with a mean of 25 months postoperative.
In our study, we found no difference between people who do physical activity, and weight loss, even though it is an important factor in maintaining weight loss. This finding is in agreement with a study by Faria et al. (25), who observed that only 20% of the sample practiced physical activity, and found no correlation with weight loss. However, the use of different tools to evaluate physical activity makes it difficult to compare studies. The literature reports that higher levels of physical activity, which were not observed in our study, may be effective in improving and maintaining weight loss (26-28).
Patients undergoing bariatric surgery may present difficulties in dietary adaptation after surgery (11,29). In a study conducted by Pedrosa et al. (30), the occurrence of food intolerance in 205 patients submitted to RYGB was analyzed, and it was observed that vomiting was the main symptom associated with food intoler-ance. Valezi et al. (31) investigated the degree of food preference and tolerance according to the gender of patients after bypass, and observed that the only significant result was in relation to fruit consumption, which was higher among women. In our study, fruit and vegetables consumption was similar between groups, with a mean weekly consumption of 5.71 ± 2.10 in the failure group and 6.12 ± 1.89 in the success group (p = 0.33). A study by Wardé-Kamar et al. (17) showed that fruit and vegetables consumption reached approximately 180 kcal per day, which is equivalent to two servings of fruit and 2-3 servings of vegetables per day. This same group further reported a consumption of sug-ary drinks which corresponded to 7% of total calories consumed. In our study, the consumption of desserts was twice as high in the success group, not presenting an association with the final result of weight loss.
The elevated consumption of simple carbohydrates, and low consumption of dietary sources of protein, can be associated to
Figure 2.
Occurrence of regurgitation and vomiting among participants. Failure group: patients with EWL < 50%. Success group: patients with EWL ≥ 50%.

1105
[Nutr Hosp 2018;35(5):1100-1106]
EVALUATION OF FACTORS THAT MAY INFLUENCE IN THE INSUFFICIENT WEIGHT LOSS IN PATIENTS AFTER TWO YEARS OF ROUX-EN-Y GASTRIC BYPASS
unsuccessful results, since this last group of foods is considered to be difficult to ingest by the patients (11). In our study, patients presented a good dietary score (32) and reports of daily vomit-ing occurred in only 3% of the patients in the success group, corroborating the study by Godoy et al. (32). Furthermore, in a study conducted by Wardér-Kamar et al. (17), it was observed that 62% of the patients had spontaneous vomiting and 27% induced vomiting.
Dietary protein may influence some factors in the regulation of body weight such as satiety (33), energy expenditure and body composition (34). The patients in our study presented adequate protein intake, being greater than the established in the guidelines of the American Association of Clinical Endocrinologists, the Obe-sity Society, and the American Society for Metabolic and Bariatric Surgery that recommend at least 60 g of protein per day and up to 1.5 g/kg of ideal weight per day (35).
In a systematic review by Ito et al. (36), four studies were found where the patients had a protein intake lower than 60 g/day and significant loss of lean mass. Another study, with patients with a mean of 30 months postoperatively, reported a mean protein intake of 1.7 g/kg of ideal weight/day (17). Raftopoulos et al. (37) suggest an association between low protein intake and low lean mass, and report that a daily intake of protein greater than 1 g/kg per day is feasible and may provide benefits in increasing weight loss, reducing body fat and improving lean mass (37). This corroborates the present study, which suggests that a greater amount of daily calories originating from proteins may be related to greater weight loss (25).
There is no data in the literature that accurately evaluates the postoperative period of RYGB (38). This can underestimate the amount of food consumed by this population, since patients do not usually report their actual intake, which can imply a false result, reaching a variation of 20% to 50% in the total calories consumed (39) . Another limitation of the study was the non-standardization of the RYGB surgical technique due to the improvement of surgical technique over the years, change in size of the gastric pouch and of intestinal deviation.
CONCLUSION
The factors that lead to failure in weight loss after RYGB are still not well elucidated. Caloric intake, food tolerance and preoper-ative BMI were not associated with poor results, and insufficient weight loss was more prevalent in patients who ceased to lose weight earlier.
REFERENCES
1. Steenackers N, Gesquiere I, Matthys C. The relevance of dietary protein after bariatric surgery: what do we know? Curr Opin Clin Nutr Metab Care 2018;21(1):58-63.
2. Karlsson J, Taft C, Ryde’n A, Sjostrom L, Sullivan M. Ten-year trends in heal-th-related quality of life after surgical and conventional treatment for severe obesity: the SOS intervention study. Int J Obes (Lond) 2007;31(8):1248-61.
3. Adams TD, Davidson LE, Litwin SE, Kim J, Kolotkin RL, Nanjee MN, et al. Weight and metabolic outcomes 12 years after gastric bypass. N Engl J Med 2017;377:1143-55.
4. Flancbaum L, Choban PS, Bradley LR, Burge JC. Changes in measured res-ting energy expenditure after Roux-en-Y gastric bypass for clinically severe obesity. Surgery 1997;122(5):943-9.
5. Faintuch J, Matsuda M, Cruz ME, Silva MM, Teivelis MP, Garrido AB Jr, et al. Severe protein-calorie malnutrition after bariatric procedures. Obes Surg 2004;14(2):175-81.
6. Dowd J. Nutrition management after gastric bypass surgery. Diabetes Spectr 2005;18(2):82-4.
7. Terra M, Auguet T, Guiu-Jurado E, Berlanga A, Orellana-Gavaldà JM, Her-nández M, et al. Long-term changes in leptin, chemerin and ghrelin levels following different bariatric surgery procedures: Roux-en-Y gastric bypass and sleeve gastrectomy. Obes Surg 2013;23(11):1790-8.
8. Choban PS, Flancbaum L. The effect of Roux limb lengths on outcome after Roux-en-Y gastric bypass: a prospective, randomized clinical trial. Obes Surg 2002;12(4):540-5.
9. Freire RH, Borges MC, Álvarez-Leite JI, Toulson Davisson Correia MI. Food quality, physical activity, and nutritional follow-up as determinant of weight regain after Roux-en-Y gastric bypass. Nutrition 2012;28(1):53-8.
10. Keith Jr CJ , Gullick AA, Feng K, Richman J, Stahl R, Grams J. Predictive factors of weight regain following laparoscopic Roux-en-Y gastric bypass. Surg Endosc 2018;32(5):2232-8.
11. Moize V, Geliebter A, Gluck ME, Yahav E, Lorence M, Colarusso T, et al. Obese patients have inadequate protein intake related to protein intolerance up to 1 year following Roux-en-Y gastric bypass. Obes Surg 2003;13(1):23-8.
12. Suter M, Calmes JM, Paroz A, Giusti V. A new questionnaire for quick assess-ment of food tolerance after bariatric surgery. Obes Surg 2007;17(1):2-8.
13. Da Silva FB, Gomes DL, De Carvalho KM. Poor diet quality and postoperative time are independent risk factors for weight regain after Roux-en-Y gastric bypass. Nutrition 2016;32(11-12):1250-3.
14. World Health Organization (WHO). Global recommendations on physical acti-vity for health. Geneva: WHO; 2010.
15. Shah M, Simha V, Garg A. Review: long-term impact of bariatric surgery on body weight, comorbidities, and nutritional status. J Clin Endocrinol Metab 2006;91(11):4223-31.
16. Faria SL, De Oliveira Kelly E, Lins RD, Faria OP. Nutritional management of weight regain after bariatric surgery. Obes Surg 2010;20(2):135-9.
17. Wardé-Kamar J, Rogers M, Flancbaum L, Laferrère B. Calorie intake and meal patterns up to 4 years after Roux-en-Y gastric bypass surgery. Obes Surg 2004;14(8):1070-9.
18. Moizé VL, Pi-Sunyer X, Mochari H, Vidal J. Nutritional pyramid for post-gastric bypass patients. Obes Surg 2010;20(8):1133-41.
19. Sjöström L, Lindroos AK, Peltonen M, Torgerson J, Bouchard C, Carlsson B, et al. Lifestyle, diabetes, and cardiovascular risk factors 10 years after bariatric surgery. N Engl J Med 2004;351(26):2683-93.
20. Behary P, Miras AD. Food preferences and underlying mechanisms after bariatric surgery. Proc Nutr Soc 2015;74(4):419-25.
21. Le Roux CW, Welbourn R, Werling M, Osborne A, Kokkinos A, Laurenius A, et al. Gut hormones as mediators of appetite and weight loss after Roux-en-Y gastric bypass. Ann Surg 2007;246(5):780-5.
22. Zhao X, Han Q, Gang X, Lv Y, Liu Y, Sun C, et al. The role of gut hormo-nes in diet-induced weight change: a systematic review. Horm Metab Res 2017;49(11):816-25.
23. Costa ACC, Furtado MCMB, Godoy EP, Pontes ERJC, Tognini JRF, Ivo ML. Perda insuficiente de peso e ou ausência de remissão da diabete melito tipo 2 após a derivação gástrica em Y-de-Roux: fatores que podem influenciar os resultados insatisfatórios. Arq Bras Cir Dig 2013;26(2):112-6.
24. Shantavasinkul PC, Omotosho P, Corsino L, Portenier D, Torquati A. Predictors of weight regain in patients who underwent Roux-en-Y gastric bypass surgery. Surg Obes Relat Dis 2016;12(9):1640-5.
25. Faria SL, Faria OP, Lopes TC, Galvão MV, De Oliveira Kelly E, Ito MK. Relation between carbohydrate intake and weight loss after bariatric surgery. Obes Surg 2009;19(6):708-16.
26. Wing RR, Hill JO. Successful weight loss maintenance. Annu Rev Nutr 2001;21:323-41.
27. Bond DS, Phelan S, Wolfe LG, Evans RK, Meador JG, Kellum JM, et al. Becoming physically active after bariatric surgery is associated with improved weight loss and health-related quality of life. Obesity (Silver Spring) 2009;17(1):78-83.
28. King WC, Belle SH, Eid GM, Dakin GF, Inabnet WB, Mitchell JE, et al. Physical activity levels of patients undergoing bariatric surgery in the Longitudinal Assessment of Bariatric Surgery study. Surg Obes Relat Dis 2008;4(6):721-8.

1106 M. C. M. B. Furtado et al.
[Nutr Hosp 2018;35(5):1100-1106]
29. O’Brien PE, Dixon JB. Laparoscopic adjustable gastric banding in the treat-ment of morbid obesity. Arch Surg 2003;138(4):376-82.
30. Pedrosa IV, Burgos MGPA, Souza NC, De Morais CN. Aspectos nutricionais em obesos antes e após a cirurgia bariátrica. Rev Col Bras Cir 2009;36(4):316-22.
31. Valezi AC, De Brito SJ, Mali Junior J, De Brito EM. Estudo do padrão alimentar tar-dio em obesos submetidos à derivação gástrica com bandagem em Y- de-Roux: Comparação entre homens e mulheres. Rev Col Bras Cir 2008;35(6):387-91.
32. Godoy CM, Caetano AL, Viana KR, Godoy EP, Barbosa AL, Ferraz EM. Food tolerance in patients submitted to gastric bypass: the importance of using an integrated and interdisciplinary approach. Obes Surg 2012;22(1):124-30.
33. Veldhorst M, Smeets A, Soenen S, Hochstenbach-Waelen A, Hursel R, Diep-vens K, et al. Protein-induced satiety: effects and mechanisms of different proteins. Physiol Behav 2008;94(2):300-7.
34. Bray GA, Smith SR, De Jonge L, Xie H, Rood J, Martin CK, et al. Effect of dietary protein content on weight gain, energy expenditure, and body composition during overeating: a randomized controlled trial. JAMA 2012;307(1):47-55.
35. Mechanick JI, Youdim A, Jones DB, Garvey WT, Hurley DL, McMahon MM, et al. Clinical practice guidelines for the perioperative nutritional, metabolic,
and nonsurgical support of the bariatric surgery patient - 2013 update: cos-ponsored by American Association of Clinical Endocrinologists, the Obesity Society, and American Society for Metabolic & Bariatric Surgery. Endocr Pract 2013;19(2):337-72.
36. Ito MK, Gonçalves VSS, Faria SLCM, Moizé V, Porporatti AL, Guerra ENS, et al. Effect of protein intake on the protein status and lean mass of post-bariatric surgery patients: a systematic review. Obes Surg 2017;27(2):502-12.
37. Raftopoulos I, Bernstein B, O’Hara K, Ruby JA, Chhatrala R, Carty J. Protein intake compliance of morbidly obese patients undergoing bariatric surgery and its effect on weight loss and biochemical parameters. Surg Obes Relat Dis 2011;7(6):733-42.
38. Hill RJ, Davies PSW. The validity of self-reported energy intake as determined using doubly labeled water technique. Br J Nutr 2001;85(4):415-30.
39. Black AE, Prentice AM, Goldberg GR, Jebb SA, Bingham SA, Livingstone MB, et al. Measurements of total energy expenditure provide insights into the validity of dietary measurements of energy intake. J Am Diet Assoc 1993;93(5):572-9.

NutriciónHospitalaria
Trabajo Original Valoración nutricional
ISSN (electrónico): 1699-5198 - ISSN (papel): 0212-1611 - CODEN NUHOEQ S.V.R. 318
Correspondence: Iraj Mohebbi. Social Determinants of Health Research Center. Occupational Medicine Center. Urmia University of Medical Sciences. Resalat St. Urmia, Iran e-mail address: [email protected]
Mansorian B, Mirza-Aghazadeh Attari M, Vahabzadeh D, Mohebbi I. Serum vitamin D level and its relation to thyroid hormone, blood sugar and lipid profiles in Iranian sedentary work staff. Nutr Hosp 2018;35(5):1107-1114
DOI: http://dx.doi.org/10.20960/nh.1719
Serum vitamin D level and its relation to thyroid hormone, blood sugar and lipid profiles in Iranian sedentary work staff Nivel sérico de vitamina D y su relación con la hormona tiroidea, el azúcar en sangre y los perfiles lipídicos en personal sedentario en Irán
Behnam Mansorian1, Mohammad Mirza-Aghazadeh Attari2, Davoud Vahabzadeh3 and Iraj Mohebbi4
1Social Determinants of Health Research Center. Urmia University of Medical Sciences. Urmia, Iran. 2Medical Philosophy and History Research Center. Tabriz University of Medical Sciences. Tabriz, Iran. 3Maternal and Child Obesity Research Center. Urmia University of Medical Sciences. Urmia, Iran. 4Social Determinants of Health Research Center. Occupational Medicine Center. Urmia University of Medical Sciences. Urmia, Iran
Palabras clave:
Vitamina D. Personal sedentario. Hormonas tiroideas. Perfiles lipídicos.
Resumen Introducción: el estilo de vida sedentario está relacionado con la incidencia de diversas enfermedades y alteraciones metabólicas. El objetivo del presente estudio fue comprender la relación entre los niveles séricos de vitamina D, las hormonas tiroideas y los perfiles lipídicos de traba-jadores sedentarios iraníes.
Material y métodos: en este estudio transversal fueron incluidos 300 sujetos sanos con índice de masa corporal (IMC) normal y de edades comprendidas entre los 18 y los 65 años, cuyo estilo de vida es sedentario. Los niveles séricos de 25-hidroxivitamina D, hormona estimulante de la tiroides (TSH), azúcar en sangre en ayunas, colesterol total en plasma, lipoproteínas de alta densidad (HDL) y triglicéridos (G) se midieron con los métodos de laboratorio adecuados. Se calculó, además, la concentración de lipoproteínas de baja densidad (LDL) según la ecuación de Friedewald y se empleó un cuestionario elaborado ad hoc con distintas preguntas para evaluar la actividad física de los participantes.
Resultados: las medias de IMC y edad fueron 25,63 ± 10,25 y 36,69 ± 7,14 años, respectivamente. La prevalencia de déficit de vitamina D fue del 65,7%. Los resultados mostraron diferencias significativas entre los subgrupos con respecto a TG, HDL y tiroxina (T4). Los niveles séricos de 25-hidroxivitamina D presentaron una correlación negativa significativa con la triyodotironina (T3) y la T4 y una correlación positiva con el HDL. El análisis de regresión lineal mostró que las concentraciones de 25-hidroxivitamina D se asocian de forma significativa con el HDL y la T4 tras ajustar por sexo.
Conclusión: finalmente, los resultados del presente estudio revelan que, con una mejora en el estado de la vitamina D, cabe esperar un descenso en los niveles de TG, T3 y T4, así como un aumento del HDL. Por lo tanto, desde el punto de vista científico sería conveniente corroborar y detectar la existencia de una verdadera relación de causalidad mediante la realización de estudios de intervención.
Key words:
Vitamin D. Sedentary staff. Thyroid hormones. Lipid profiles.
Abstract Introduction: the sedentary lifestyle is related to the incidence of various diseases and metabolic disorders. The aim of the current study was to understand the link between serum vitamin D levels, thyroid hormones and lipid profiles among Iranian sedentary staff.
Material and methods: in this cross-sectional study, 300 healthy subjects with normal body mass index (BMI) and age between 18 and 65 years, with sedentary lifestyles, were included. Serum levels of 25-hydroxyvitamin D, thyroid stimulating hormone (TSH), fasting blood sugar, plasma total cholesterol, and high-density lipoprotein (HDL) and triglycerides (TG) were measured with qualified laboratory methods. Low-density lipoprotein (LDL) concentration was calculated based on the Friedewald equation. A self-made questionnaire with different questions was used to assess physical activity.
Results: the means of BMI and age were 25.63 ± 10.25 and 36.69 ± 7.14 years, respectively. The prevalence of vitamin D deficiency was 65.7%. Results showed significant differences for TG, HDL, and thyroxine (T4) between subgroup categories. Serum levels of 25-hydroxyvitamin D had a negative significant correlation with triiodothyronine (T3) and T4, and a positive correlation with HDL. Linear regression analysis showed a significant association of 25-hydroxyvitamin D concentrations with HDL and T4 after adjustments based on the sex.
Conclusion: finally, the results of this study show that with the improvement in vitamin D status, the decrease in the levels of TG, T3 and T4, with an increase in HDL can be expected. So, verification and detection of true causality through the interventional studies will be valuable, scientifically.
Received: 13/12/2017 • Accepted: 03/04/2018
©Copyright 2018 SENPE y ©Arán Ediciones S.L. Este es un artículo Open Access bajo la licencia CC BY-NC-SA (http://creativecommons.org/licenses/by-nc-sa/4.0/).
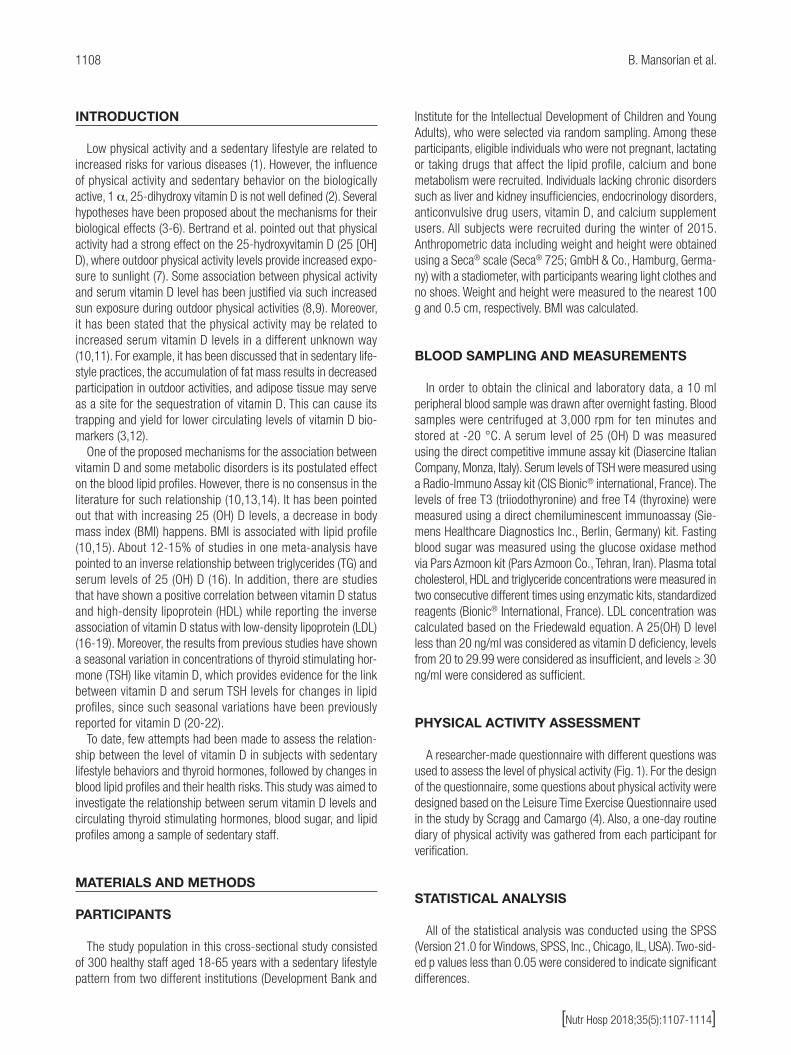
1108 B. Mansorian et al.
[Nutr Hosp 2018;35(5):1107-1114]
INTRODUCTION
Low physical activity and a sedentary lifestyle are related to increased risks for various diseases (1). However, the influence of physical activity and sedentary behavior on the biologically active, 1 α, 25-dihydroxy vitamin D is not well defined (2). Several hypotheses have been proposed about the mechanisms for their biological effects (3-6). Bertrand et al. pointed out that physical activity had a strong effect on the 25-hydroxyvitamin D (25 [OH] D), where outdoor physical activity levels provide increased expo-sure to sunlight (7). Some association between physical activity and serum vitamin D level has been justified via such increased sun exposure during outdoor physical activities (8,9). Moreover, it has been stated that the physical activity may be related to increased serum vitamin D levels in a different unknown way (10,11). For example, it has been discussed that in sedentary life-style practices, the accumulation of fat mass results in decreased participation in outdoor activities, and adipose tissue may serve as a site for the sequestration of vitamin D. This can cause its trapping and yield for lower circulating levels of vitamin D bio-markers (3,12).
One of the proposed mechanisms for the association between vitamin D and some metabolic disorders is its postulated effect on the blood lipid profiles. However, there is no consensus in the literature for such relationship (10,13,14). It has been pointed out that with increasing 25 (OH) D levels, a decrease in body mass index (BMI) happens. BMI is associated with lipid profile (10,15). About 12-15% of studies in one meta-analysis have pointed to an inverse relationship between triglycerides (TG) and serum levels of 25 (OH) D (16). In addition, there are studies that have shown a positive correlation between vitamin D status and high-density lipoprotein (HDL) while reporting the inverse association of vitamin D status with low-density lipoprotein (LDL) (16-19). Moreover, the results from previous studies have shown a seasonal variation in concentrations of thyroid stimulating hor-mone (TSH) like vitamin D, which provides evidence for the link between vitamin D and serum TSH levels for changes in lipid profiles, since such seasonal variations have been previously reported for vitamin D (20-22).
To date, few attempts had been made to assess the relation-ship between the level of vitamin D in subjects with sedentary lifestyle behaviors and thyroid hormones, followed by changes in blood lipid profiles and their health risks. This study was aimed to investigate the relationship between serum vitamin D levels and circulating thyroid stimulating hormones, blood sugar, and lipid profiles among a sample of sedentary staff.
MATERIALS AND METHODS
PARTICIPANTS
The study population in this cross-sectional study consisted of 300 healthy staff aged 18-65 years with a sedentary lifestyle pattern from two different institutions (Development Bank and
Institute for the Intellectual Development of Children and Young Adults), who were selected via random sampling. Among these participants, eligible individuals who were not pregnant, lactating or taking drugs that affect the lipid profile, calcium and bone metabolism were recruited. Individuals lacking chronic disorders such as liver and kidney insufficiencies, endocrinology disorders, anticonvulsive drug users, vitamin D, and calcium supplement users. All subjects were recruited during the winter of 2015. Anthropometric data including weight and height were obtained using a Seca® scale (Seca® 725; GmbH & Co., Hamburg, Germa-ny) with a stadiometer, with participants wearing light clothes and no shoes. Weight and height were measured to the nearest 100 g and 0.5 cm, respectively. BMI was calculated.
BLOOD SAMPLING AND MEASUREMENTS
In order to obtain the clinical and laboratory data, a 10 ml peripheral blood sample was drawn after overnight fasting. Blood samples were centrifuged at 3,000 rpm for ten minutes and stored at -20 °C. A serum level of 25 (OH) D was measured using the direct competitive immune assay kit (Diasercine Italian Company, Monza, Italy). Serum levels of TSH were measured using a Radio-Immuno Assay kit (CIS Bionic® international, France). The levels of free T3 (triiodothyronine) and free T4 (thyroxine) were measured using a direct chemiluminescent immunoassay (Sie-mens Healthcare Diagnostics Inc., Berlin, Germany) kit. Fasting blood sugar was measured using the glucose oxidase method via Pars Azmoon kit (Pars Azmoon Co., Tehran, Iran). Plasma total cholesterol, HDL and triglyceride concentrations were measured in two consecutive different times using enzymatic kits, standardized reagents (Bionic® International, France). LDL concentration was calculated based on the Friedewald equation. A 25(OH) D level less than 20 ng/ml was considered as vitamin D deficiency, levels from 20 to 29.99 were considered as insufficient, and levels ≥ 30 ng/ml were considered as sufficient.
PHYSICAL ACTIVITY ASSESSMENT
A researcher-made questionnaire with different questions was used to assess the level of physical activity (Fig. 1). For the design of the questionnaire, some questions about physical activity were designed based on the Leisure Time Exercise Questionnaire used in the study by Scragg and Camargo (4). Also, a one-day routine diary of physical activity was gathered from each participant for verification.
STATISTICAL ANALYSIS
All of the statistical analysis was conducted using the SPSS (Version 21.0 for Windows, SPSS, Inc., Chicago, IL, USA). Two-sid-ed p values less than 0.05 were considered to indicate significant differences.

1109
[Nutr Hosp 2018;35(5):1107-1114]
SERUM VITAMIN D LEVEL AND ITS RELATION TO THYROID HORMONE, BLOOD SUGAR AND LIPID PROFILES IN IRANIAN SEDENTARY WORK STAFF
Figure 1.
Physical activity assessment questionnaire.
Physical activity assessment questionnaireHow do you do the following exercises or their similar ones during a week?
Strenuous exercises
Activity TimesDuration (hour)
0.5 1 1.5 2 2.5 3 3< CommentsRunningJoggingHockeyFootballSoccerSquashBasketballCross country skiingJudoRoller skatingVigorous swimmingVigorous long distance bieyeling
Moderate exercises
Activity TimesDuration (hour)
0.5 1 1.5 2 2.5 3 3< CommentsFast walkingBasketballTennisEasy bicyclingVolleyballBadmintonEasy swimmingAlpine skiingPopular and folk dancing
Light exercises
Activity TimesDuration (hour)
0.5 1 1.5 2 2.5 3 3< CommentsYoga ArcheryFishing from river bankBowlingHorseshoesGolfSnow-mobilingEasy walking

1110 B. Mansorian et al.
[Nutr Hosp 2018;35(5):1107-1114]
The values for quantitative parameters were expressed as the mean value and standard deviation (SD), whereas the qualitative data were presented as numbers and percentages. One-way ANOVA and the Tukey’s post hoc test were used to identify the significant differences between the groups based on fasting blood sugar (FBS), total choles-terol, LDL, HDL, and triglycerides. Bivariate correlation analysis was used for testing the correlation status between each of the mentioned lipid profiles and vitamin D levels. Multiple linear regression analysis was performed to determine the association between vitamin D levels and the predicted serum lipid levels, after stepwise adjustment based on age, gender, BMI, and physical activity.
ETHICS STATEMENT
This study was approved by the Ethics Committee and the Insti-tutional Review Board of Urmia University of Medical Sciences (IR.umsu.rec.1395.165). The board waived the need for informed con-sent, as the subjects’ records and information were anonymous and de-identified prior to the analysis. All procedures performed in this study involving human participants were in accordance with the ethi-cal standards of the institutional and national research committee, and with the 1964 Declaration of Helsinki and ethical standards.
RESULTS
Our results demonstrated that the prevalence of vitamin D deficiency was 65.7%; vitamin D insufficiency and sufficiency was 18.6% and 15.7%, respectively. Table I presents detailed information about defi-ciency prevalence between the two genders. Participants were 209 (69.66%) men and 91 (30.33%) women. The mean serum levels of 25-hydroxyvitamin D and TSH in total population were 19.17 ± 11.72 ng/ml and 1.94 ± 1.91 µIU/ml, respectively. The mean BMI was 25.63 ± 10.25. The average age of participants in the study group was 36.69 ± 7.14 years. Sample population stratification by 25(OH) D levels as deficient, insufficient and sufficient showed that mean 25(OH) D levels for each group was 12.74 ± 4.03, 23.24 ± 2.44, and 41.28 ± 10.94 ng/ml, respectively. Results from statistical analysis for comparing the
three subgroups based on basic demographic variables showed no significant differences, except for serum vitamin D.
Results from ANOVA for comparing the means between the three groups showed that there were significant differences based on TG (F; 3.97, p = 0.02), HDL (F; 8.71, p < 0.001), and T4 (F; 8.88, p < 0.001). In comparison with the sufficient group, the deficient group had higher cholesterol, but in a statistically non-significant amount (F; 0.21, p = 0.80). The highest TG, T3, and T4 were seen in the deficient group. The insufficient group showed the highest HDL and lowest LDL values. The lowest triglyceride level was observed in the insufficiency group. Data revealed that the serum levels of 25(OH) D had an inverse but not significant association with LDL (F; 0.73, p = 0.47) and had a positive correlation with HDL (r = 0.20, p < 0.001). There was the highest LDL level and the lowest amount in the insufficient group. Meanwhile, the highest FBS and TSH in normal range values were seen in the vitamin D sufficient group (Table II).
The correlation analysis showed that among lipid profile frac-tions, just HDL had a significant correlation with serum vitamin D level (r = 0.2, p < 0.001). There was no significant correlation between LDL and vitamin D (r = 0.01, p = 0.81). Among the evaluated correlation for TG (r = -0.11, p < 0.04), T3 (r = -0.14, p = 0.04) and T4 (r = -0.29, p < 0.001), there was just a negative significant correlation for T3 with vitamin D. Figures 2 and 3 show the results of different correlation analyses among all participants. Moreover, a significant negative correlation between LDL and T4 was observed (r = -0.22, p = 0.002).
The results of the linear regression analysis showed that after adjust-ment for gender and age, there was a significant association between the 25 hydroxyvitamin D concentrations with HDL and T4. This means that with 10 ng/ml increasing units in 25 hydroxyvitamin D concen-trations, a 1.77 mg/dl increase in HDL and 0.51 µIU/ml decrease in T4 concentration can be expected within normal reference ranges.
DISCUSSION
There are controversies regarding the factors that could provide sufficient levels of vitamin D. Low physical activity and a sedentary lifestyle are related to increased risks for various diseases such as
Table I. Baseline demographic characteristics of the study population
Variable Deficiency group Insufficiency group Sufficiency group p-value
Age (mean ± SD) 36.46 ± 7.23 36.78 ± 6.58 37.53 ± 7.44 0.65
Sex (number [%]) Male Female
144 (73.1)53 (26.90)
39 (69.6)17 (30.4)
26 (55.31)21 (44.69)
0.05
Height (mean ± SD) 158.34 ± 17.45 163.71 ± 12.74 161.7 ± 14.75 0.06
Weight (mean ± SD) 64.70 ± 19.8 68.69 ± 19.09 65.93 ± 20.68 0.41
BMI (mean ± SD) 25.93 ± 11.86 25.37 ± 6.33 24.65 ± 5.80 0.76
Vitamin D (ng/ml) (mean ± SD) 12.74 ± 4.03 23.24 ± 2.44 41.28 ± 10.94 < 0.001
Activity Level (MET/min) (mean ± SD) 1.43 ± 0.29 1.38 ± 0.28 1.44 ± 0.31 0.51

1111
[Nutr Hosp 2018;35(5):1107-1114]
SERUM VITAMIN D LEVEL AND ITS RELATION TO THYROID HORMONE, BLOOD SUGAR AND LIPID PROFILES IN IRANIAN SEDENTARY WORK STAFF
Table II. Results from the one-way ANOVA and t-test for comparing means between groups with different levels of vitamin D status
Vitamin D status SubgroupDeficient
Mean ± SDInsufficientMean ± SD
SufficientMean ± SD
p-value*
FBS (mg/dl)
Men 89.38 ± 16.05 89.23 ± 17.25 86.30 ± 13.69 0.62
Women 93.19 ± 9.68 95.35 ± 7.24 97.09 ± 11.55 0.28
p-value† 0.047 0.16 0.006
Total 90.39 ± 14.71 91.08 ± 15.13 91.12 ± 13.76 0.92
Cholesterol (mg/dl)
Men 184.98 ± 37.60 176.05 ± 28.51 181.66 ± 35.81 0.12
Women 173.47 ± 33.54 185.76 ± 31.48 188.47 ± 34.34 0.15
p-value† 0.05 0.26 0.10
Total 181.88 ± 36.83 179 ± 29.5 179.21 ± 34.61 0.80
Triglyceride (mg/dl)
Men 206.52 ± 172.94 128.71 ± 79.56 181.61 ± 102.71 0.02
Women 123.09 ± 74.85 135.58 ± 74.90 106.47 ± 43.72 0.42
p-value† 0.001 0.76 0.002
Total 184.29 ± 157.14 130.80 ± 77.56 148.04 ± 89.39 0.02
HDL (mg/dl)
Men 42.43 ± 8.32 45.48 ± 10.83 46.46 ± 12.67 0.05
Women 44.13 ± 10.73 47.35 ± 7.31 52.04 ± 7.64 0.007
p-value† 0.24 0.52 0.08
Total 42.88 ± 9.03 46.05 ± 9.86 48.95 ± 10.98 < 0.001
LDL (mg/dl)
Men 104.98 ± 28.37 102.13 ± 31.01 94.42 ± 24.18 0.22
Women 96.94 ± 25.66 106.41 ± 23.49 101.33 ± 27.82 0.40
p-value† 0.07 0.61 0.37
Total 102.80 ± 27.83 103.43 ± 28.79 97.57 ± 25.85 0.47
TSH (µIU/ml)
Men 1.84 ± 2.16 1.68 ± 1.32 1.41 ± 0.99 0.55
Women 2.16 ± 1.79 2.02 ± 1.55 3.17 ± 2.05 0.07
p-value† 0.35 0.40 0.001
Total 1.93 ± 2.07 1.78 ± 1.39 2.20 ± 1.77 0.54
T3 (ng/ml)
Men 1.26 ± 0.30 1.14 ± 0.24 1.19 ± 0.29 0.26
Women 1.17 ± 0.29 1.18 ± 0.30 1.07 ± 0.26 0.40
p-value† 0.09 0.68 0.36
Total 1.22 ± 0.30 1.16 ± 0.27 1.10 ± 0.27 0.10
T4 (µg/dl)
Men 9.85 ± 2.40 8.17 ± 1.68 7.30 ± 1.57 0.002
Women 9.65 ± 2.06 9.25 ± 1.41 8.42 ± 1.28 0.03
p-value† 0.64 0.05 0.08
Total 9.77 ± 2.26 8.66 ± 1.63 8.17 ± 1.40 < 0.001
*One way ANOVA. †Independent sample t-test.
cardiovascular disorders, diabetes mellitus, hypertension, cancer, and multiple sclerosis. It has been proposed that most of these effects can be explained by the postulated effect of vitamin D on blood lipid profiles. Some previous studies have implicated that, in most instances, people with low physical activity have high-er weight and less physical activity that results in reduced sun exposure (1), but some studies such as Jerome et al. have shown
lower vitamin D level in subjects with higher physical activity level (2). Some reasons for such results can be related to the fact that students are mostly engaged in indoor activities.
The present study investigated the relationship between vitamin D status and lipid profiles in healthy subjects with a low level of activity and vitamin D deficiency. Vitamin D deficiency was observed in 65.7% of the studied subjects.
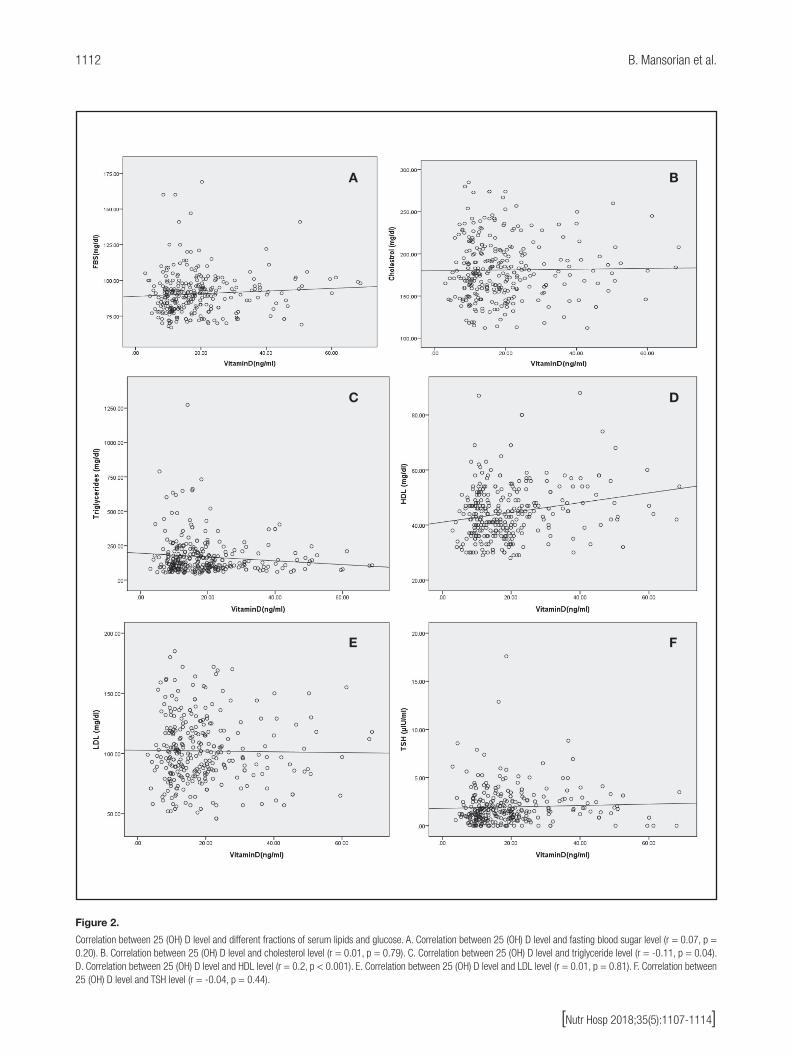
1112 B. Mansorian et al.
[Nutr Hosp 2018;35(5):1107-1114]
Figure 2.
Correlation between 25 (OH) D level and different fractions of serum lipids and glucose. A. Correlation between 25 (OH) D level and fasting blood sugar level (r = 0.07, p = 0.20). B. Correlation between 25 (OH) D level and cholesterol level (r = 0.01, p = 0.79). C. Correlation between 25 (OH) D level and triglyceride level (r = -0.11, p = 0.04). D. Correlation between 25 (OH) D level and HDL level (r = 0.2, p < 0.001). E. Correlation between 25 (OH) D level and LDL level (r = 0.01, p = 0.81). F. Correlation between 25 (OH) D level and TSH level (r = -0.04, p = 0.44).
A
C
E
B
D
F

1113
[Nutr Hosp 2018;35(5):1107-1114]
SERUM VITAMIN D LEVEL AND ITS RELATION TO THYROID HORMONE, BLOOD SUGAR AND LIPID PROFILES IN IRANIAN SEDENTARY WORK STAFF
The mean serum vitamin D in the total studied population was 19.17 ± 11.72 ng/ml. This amount is higher in comparison with that of other studies (7) that were conducted on subjects with light physical activity level or a sedentary lifestyle, and lower than the amount observed in some others such as the study by Hibler EA et al. (1). The highest FBS in the normal range values were seen in the sufficient vitamin D group, but with no significant differenc-es between groups. In this study, the correlation analysis showed no significant correlation between vitamin D level and FBS, while in other studies low 25 (OH) D levels have been associated with higher plasma glucose (19). Serum vitamin D levels have been inversely related to fasting glucose and insulin (10). In a similar study, no significant difference was proposed based on the different levels of vitamin D (23). Theoretically, several mechanisms have been proposed to explain the relationship between vitamin D and blood sugar via both genomic and non-genomic pathways, with its role in pancreatic beta cell function (18,19,24). Vitamin D recep-tors are present in pancreatic B-cells and skeletal muscles, which demonstrated that vitamin D can enhance insulin responsiveness for glucose transport (19).
There are various previous studies with different results regard-ing the vitamin D status effect on the blood lipid profiles (17-19,25). Direct and indirect effects of vitamin D to modify the lipid profile have been proposed. Vitamin D may decrease the TG serum levels through its regulatory action by increasing the lipoprotein lipase activity in adipose tissue (26). Additionally, its effect on the serum levels of total cholesterol and LDL may be mediated by its decreasing effect on the absorption of fat, particularly saturated fatty acids (27). Also, it has been suggested that it can be medi-ated via calcium, which increases the conversion of cholesterol to bile acids (18).
In the present study, a comparison based on the mean TG between the three groups showed significant differences plus a relatively significant inverse correlation with serum vitamin D con-centration (r = -0.112, p = 0.055). Lower TG levels accompanied higher serum vitamin D levels. These results are in accordance with the results from several previous studies that indicated an inverse correlation between vitamin D and TG. In some previous studies such as those of Ponda et al. (17) and Kelishadi et al. (16), similar results have been reported. There are few studies reporting no relationship between vitamin D status and serum TG levels (23,28).
Regarding the effect of vitamin D on HDL, Karhapa et al. (25) and other cross-sectional (10,12) and trial studies (23,28) have postulated that there is no association between 25 (OH) D levels and HDL, while other studies have proposed a positive association between vitamin D status and HDL. In some trial studies (29,30), an increase in HDL with vitamin D supplementation has been mentioned. In the current study, a positive and direct correla-tion between serum levels of 25 (OH) D and HDL was observed. Reviewing the previous literature revealed that some of the above relationships might be explained by the necessity of vitamin D presence for maintaining the adequate levels of apolipoprotein A-1, the main component of high-density lipoprotein (31).
The results of the present study counteract the findings of many others (17,25,28) with regard to the possible association between vitamin D status and LDL levels, as our results showed no signif-icant association between vitamin D and LDL. The highest LDL level was in the insufficient group and the lowest amount was in the sufficient group, but no significant differences were observed. Karhapaa et al. (25), who included in their study 909 healthy males between 45-70 years of age, found an inverse association
Figure 3.
Correlation between 25 (OH) D level and thyroid hormones. A. Correlation between 25 (OH) D level and triiodothyronine (T3) (r = -0.14, p = 0.04). B. Correlation between 25 (OH) D level and thyroxine (T4) level (r = -0.29, p < 0.001).
A B

1114 B. Mansorian et al.
[Nutr Hosp 2018;35(5):1107-1114]
between 25-hydroxyvitamin D and LDL, alongside with a lack of association between 1,25-hydroxyvitamin D and LDL.
In different studies, a positive relationship between TSH and lipid profiles has been discussed and it has been stated that such relation can predispose subjects to develop different types of diseases that are mediated by obesity. The positive correlation between weight gain and a progressive increase in serum TSH and elevated TSH levels in obesity over a 5-year period has been reported (24). Our study confirms the results of previous studies, which showed a positive inverse relationship between vitamin D and thyroid hormones, because vitamin D deficiency and lower serum levels of 1, 25-hydroxy vitamin D were accompanied by higher levels of T3 and T4, with a significant difference for T4. This study, unlike that of Barchetta (20), which pointed out a central action for the active form of vitamin D on TSH secretion, showed no significant association between vitamin D and TSH.
There were some limitations in our study. First, the cross-sec-tional design of the study. Second, no data about the dietary intake levels of participants has been gathered. Third, all participants were subjects with a sedentary lifestyle and there were no com-parable groups with other levels of physical activity.
CONCLUSION
Our results showed improvements in lipid profile fractions and thyroid hormones secretion, such as a decrease in the levels of TG, T3, and T4, and increments in HDL with favorable serum vita-min D status. The detection of causal relations needs the design of a well-controlled intervention or cohort studies to provide bench-mark evidence. The biochemical and physiological mechanisms, as well as molecular and genetic pathways for verification, will be as well an area for further research.
REFERENCES
1. Hibler EA, Molmenti CLS, Dai Q, Kohler LN, Anderson SW, Jurutka PW, et al. Physical activity, sedentary behavior, and vitamin D metabolites. Bone 2016;83:248-55.
2. Jerome SP, Sticka KD, Schnurr TM, Mangum SJ, Reynolds AJ, Dunlap KL. 25 (OH) D levels in trained versus sedentary university students at 64° north. Int J Circumpolar Health 2017;76(1):1314-414.
3. McCullough ML, Weinstein SJ, Freedman DM, Helzlsouer K, Flanders WD, Koenig K, et al. Correlates of circulating 25-hydroxyvitamin D cohort consortium vitamin D pooling project of rarer cancers. Am J Epidemiol 2010;172(1):21-35.
4. Scragg R, Camargo CA. Frequency of leisure-time physical activity and serum 25-hydroxyvitamin D levels in the US population: results from the Third National Health and Nutrition Examination Survey. Am J Epidemiol 2008;168(6):577-86.
5. Cliff DP, Okely AD, Burrows TL, Jones RA, Morgan PJ, Collins CE, et al. Objec-tively measured sedentary behavior, physical activity, and plasma lipids in overweight and obese children. Obesity 2013;21(2):382-5.
6. Mohebbi I, Shateri K, Seyedmohammadzad M. The relationship between working schedule patterns and the markers of the metabolic syndrome: comparison of shift workers with day workers. Int J Occup Med Environ Health 2012;25(4):383-91.
7. Bertrand KA, Giovannucci E, Liu Y, Malspeis S, Eliassen AH, Wu K, et al. Determinants of plasma 25-hydroxyvitamin D and development of prediction models in three US cohorts. Br J Nutr 2012;108(10):1889-96.
8. Van Dam RM, Snijder MB, Dekker JM, Stehouwer CD, Bouter LM, Heine RJ, et al. Potentially modifiable determinants of vitamin D status in an older popula-tion in the Netherlands: the Hoorn Study. Am J Clin Nutr 2007;85(3):755-61.
9. Ohta H, Kuroda T, Onoe Y, Orito S, Ohara M, Kume M, et al. The impact of lifes-tyle factors on serum 25-hydroxyvitamin D levels: a cross-sectional study in Japanese women aged 19-25 years. J Bone Miner Metab 2009;27(6):682-8.
10. Ha C-D, Cho J-K, Lee S-H, Kang H-S. Serum vitamin D, physical activi-ty, and metabolic risk factors in Korean children. Med Sci Sports Exerc 2013;45(1):102-8.
11. Wanner M, Richard A, Martin B, Linseisen J, Rohrmann S. Associations between objective and self-reported physical activity and vitamin D serum levels in the US population. Cancer Causes Control 2015;26(6):881-91.
12. Rusconi RE, De Cosmi V, Gianluca G, Giavoli C, Agostoni C. Vitamin D insu-fficiency in obese children and relation with lipid profile. Int J Food Sci Nutr 2015;66(2):132-4.
13. Kroll MH, Bi C, Garber CC, Kaufman HW, Liu D, Caston-Balderrama A, et al. Temporal relationship between vitamin D status and parathyroid hormone in the United States. PloS One 2015;10(3):e0118108.
14. Rodríguez-Rodríguez E, Ortega RM, González-Rodríguez LG, López-Sobaler AM. Vitamin D deficiency is an independent predictor of elevated triglycerides in Spanish school children. Eur J Nutr 2011;50(5):373-8.
15. Jorde R, Grimnes G. Vitamin D and metabolic health with special reference to the effect of vitamin D on serum lipids. Prog Lipid Res 2011;50(4):303-12.
16. Kelishadi R, Farajzadegan Z, Bahreynian M. Association between vitamin D status and lipid profile in children and adolescents: a systematic review and meta-analysis. Int J Food Sci Nutr 2014;65(4):404-10.
17. Ponda MP, Huang XX, Odeh MA, Breslow JL, Kaufman HW. Vitamin D may not improve lipid levels: a serial clinical laboratory data study. Circulation 2012;126:270-7.
18. Saedisomeolia A, Taheri E, Djalali M, Moghadam AM, Qorbani M. Association between serum level of vitamin D and lipid profiles in type 2 diabetic patients in Iran. J Diabetes Metab Disord 2014;13(1):1.
19. Johnson MD, Nader NS, Weaver AL, Singh R, Kumar S. Relationships between 25-hydroxyvitamin D levels and plasma glucose and lipid levels in pediatric outpatients. J Pediatr 2010;156(3):444-9.e1.
20. Barchetta I, Baroni M, Leonetti F, De Bernardinis M, Bertoccini L, Fontana M, et al. TSH levels are associated with vitamin D status and seasonality in an adult population of euthyroid adults. Int J Clin Exp Med 2015;15(3):389-96
21. Zhang Q, Wang Z, Sun M, Cao M, Zhu Z, Fu Q, et al. Association of high vita-min D status with low circulating thyroid-stimulating hormone independent of thyroid hormone levels in middle-aged and elderly males. Int J Endocrinol 2014;2014:631819.
22. Saeidlou SN, Vahabzadeh D, Babaei F, Vahabzadeh Z. Seasonal variations of vitamin D and its relation to lipid profile in Iranian children and adults. J Health Popul Nutr 2017;36(1):21.
23. Grimnes G, Figenschau Y, Almås B, Jorde R. Vitamin D, insulin secretion, sen-sitivity, and lipids results from a case-control study and a randomized contro-lled trial using hyperglycemic clamp technique. Diabetes 2011;60(11):2748-57.
24. Agbaht K, Mercan Y, Kutlu S, Alpdemir MF, Sezgin T. Obesity with and without metabolic syndrome: do vitamin D and thyroid autoimmunity have a role? Diabetes Res Clin Pract 2014;106(1):27-34.
25. Karhapää P, Pihlajamäki J, Pörsti I, Kastarinen M, Mustonen J, Niemelä O, et al. Diverse associations of 25-hydroxyvitamin D and 1, 25-dihydroxy-vitamin D with dyslipidaemias. J Intern Med 2010;268(6):604-10.
26. Wang J-H, Keisala T, Solakivi T, Minasyan A, Kalueff AV, Tuohimaa P. Serum cholesterol and expression of ApoAI, LXRβ and SREBP2 in vitamin D receptor knock-out mice. J Steroid Biochem Mol Biol 2009;113(3):222-6.
27. Christensen R, Lorenzen JK, Svith CR, Bartels E, Melanson E, Saris W, et al. Effect of calcium from dairy and dietary supplements on faecal fat excretion: a meta-analysis of randomized controlled trials. Obes Rev 2009;10(4):475-86.
28. Wang H, Xia N, Yang Y, Peng D-Q. Influence of vitamin D supplementation on plasma lipid profiles: a meta-analysis of randomized controlled trials. Lipids Health Dis 2012;11(1):1.
29. Qin XF, Zhao LS, Chen WR, Wang H. Effects of vitamin D on plasma lipid profiles in statin-treated patients with hypercholesterolemia: a randomized placebo-controlled trial. Clin Nutr ESPEN 2015;34(2):201-6.
30. Major GC, Alarie F, Doré J, Phouttama S, Tremblay A. Supplementation with calcium + vitamin D enhances the beneficial effect of weight loss on plasma lipid and lipoprotein concentrations. Am J Clin Nutr 2007;85(1):54-9.
31. John WG, Noonan K, Mannan N, Boucher BJ. Hypovitaminosis D is associated with reductions in serum apolipoprotein AI but not with fasting lipids in British Bangladeshis. Am J Clin Nutr 2005;82(3):517-22.

NutriciónHospitalaria
Trabajo Original Valoración nutricional
ISSN (electrónico): 1699-5198 - ISSN (papel): 0212-1611 - CODEN NUHOEQ S.V.R. 318
Correspondence: Ignacio Jáuregui-Lobera. Universidad Pablo de Olavide. Ctra. de Utrera, 1. 41013 Sevilla, Spaine-mail: [email protected]
Jáuregui-Lobera I, Iglesias Conde A, Sánchez Rodríguez J, Arispon Cid J, Andrades Ramírez C, Herrero Martín G, Bolaños-Ríos P. Self-perception of weight and physical fitness, body image perception, control weight behaviors and eating behaviors in adolescents. Nutr Hosp 2018;35(5):1115-1123
DOI: http://dx.doi.org/10.20960/nh.1726
Self-perception of weight and physical fitness, body image perception, control weight behaviors and eating behaviors in adolescents Autopercepción del peso y forma física, percepción de la imagen corporal y conductas de control de peso y alimentarias en adolescentes
Ignacio Jáuregui-Lobera1, Amalia Iglesias Conde2, Josefa Sánchez Rodríguez3, Juan Arispon Cid4, Cristina Andrades Ramírez5, Griselda Herrero Martín1 and Patricia Bolaños-Ríos3
1Universidad Pablo de Olavide. Sevilla, Spain. 2Nutritionist. Private Clinic. Sevilla, Spain. 3Instituto de Ciencias de la Conducta. Sevilla, Spain. 4Psychologist. Private Clinic. Sevilla, Spain. 5Norte Salud Nutrición. Sevilla, Spain
Palabras clave:
Percepción del peso. Percepción del estado de forma física. Dieta. Pesarse. Trastornos alimentarios. Adolescencia.
Resumen Introducción: la autopercepción del peso y de la forma física, razones estéticas para hacer dieta, pesarse como método para sentirse mejor y la percepción de la imagen corporal se han relacionado con una constelación de riesgos para desarrollar tanto insatisfacción corporal como alteraciones alimentarias, especialmente en adolescentes.
Objetivos: analizar la autopercepción del peso y de la forma física, explorar los vínculos entre estas variable y conductas de control de peso, explorar posibles relaciones entre la autopercepción del peso y de la forma física, realización de dietas, frecuencia con la que se pesan los adolescentes e índice de masa corporal (IMC)/imagen corporal, así como la relación de todo ello con diferentes conductas alimentarias.
Resultados: el IMC medio fue de 20,18 ± 3,58 y el 41,14% de los participantes presentaba sobrepeso/obesidad. Entre quienes se percibían con sobrepeso, el 76,92% eran chicas. Más del 70% de los participantes decían estar en una buena forma física o en la media y eran más los chicos los que decían estar en buena o excelente forma física. Casi el 60% de los participantes que planeaban hacer dieta por razones estéticas eran chicas y ellas más que los chicos se pesaban para sentirse mejor. El IMC correlacionó significativamente con la subescala imagen corporal/ingesta restrictiva.
Conclusiones: existen claros vínculos entre autopercepción ponderal, imagen corporal, realización de dietas, pesarse y conductas alimentarias en una edad que podría considerarse como un punto de partida para la presentación de alteraciones alimentarias.
Key words:
Weight misperception. Self-reported physical fitness. Diet. Self-weighing. Eating disorders. Adolescence.
Abstract Introduction: self-perception of weight and physical fitness, aesthetic reasons to diet, self-weighing as a way to feel better and body image perception have been related to a constellation of risks to develop both body image dissatisfaction and eating behavior disturbances, especially among adolescents.
Objectives: to analyze weight self-perception and self-reported physical fitness, to explore the links between these variables and weight control behaviors, to explore possible relations among weight self-perception, self-reported physical fitness, dieting, self-weighing frequency and body mass index (BMI)/body image and to analyze the relation between all these variables and different eating behaviors.
Methods: a total of 336 students (mean age of 12.46 ± 2.14; 47.62% females) took part in this study. Different scales were administered (weight self-perception and self-reported physical fitness, dieting, self-weighing frequency, body image perception, eating behaviors) and height and weight were measured in order to obtain the BMI.
Results: mean BMI was 20.18 ± 3.58 and 41.14% of participants had overweight/obesity. Among those who perceived themselves as overweight, 76.92% were girls. More than 70% of participants reported average or good physical fitness and more boys reported good or excellent physical fitness. Almost 60% of participants who planned to diet for aesthetic reasons were girls, and girls more than boys self-weighed to feel better. BMI was significantly correlated with body image dissatisfaction/restrictive eating.
Conclusions: there are clear links between weight self-perception, body image, dieting, self-weighing and eating behaviors at an age which might be considered as a starting point to eating behavior disturbances.
Received: 15/12/2017 • Accepted: 04/03/2018
©Copyright 2018 SENPE y ©Arán Ediciones S.L. Este es un artículo Open Access bajo la licencia CC BY-NC-SA (http://creativecommons.org/licenses/by-nc-sa/4.0/).

1116 I. Jáuregui-Lobera et al.
[Nutr Hosp 2018;35(5):1115-1123]
INTRODUCTION
Misperception of weight is defined as the discordance between an individual’s actual weight and the perception of his/her weight status. Weight perception and misperception might influence the healthy or unhealthy behaviors people engage in (1). In this regard, misperception has repeatedly been documented among overweight and obese adults, and it has been hypothesized that weight misper-ception among overweight and obese individuals may preclude the adoption of healthful attitudes and behaviors, perhaps as a result of lower weight loss motivation. Overweight and obese individuals who consider their weight healthy, for example, might not try to lose weight and might be less inclined to eat healthfully and to be physically active (2). On the other hand, some evidence indicates that weight misperception among overweight and obese individuals might be associated with healthful behaviors (e.g., better diet quality, more physical activity, and less sedentary behavior) (2,3). Perceiv-ing oneself as overweight-obese is relevant given the association between that perception and unhealthy weight-control behaviors (1).
It seems that overweight misperception varies according to gender (among other variables), females tending to perceive themselves as overweight more than males do, even at the same measured body mass index (BMI) (4-6). Misperception of overweight-obesity among adolescents of normal weight might have negative consequences. The combination of overweight-obesity misperception causing body dissatisfaction predicts dieting, and dieting is a clear risk factor for developing different eating disturbances (6). In addition, adolescents who have been engaged in dieting and other unhealthy weight-control behaviors have been found to be at risk of weight gain over time (7,8).
Besides the concept of weight misperception, one’s body shape and/or one’s body image play a relevant role in different behaviors (9). Both weight misperception and poor body image have nega-tive psychological and psychosocial effects (e.g., low self-esteem, anxiety, depression, isolation, discrimination, family conflicts, etc.). It is well known that people engaged in a process of self-evaluation (included body checking) comparing themselves to others who they believe have more desirable sociocultural traits tend to be involved in behaviors aimed to achieve those desired characteristics (10).
Self-reported physical fitness is another variable to consider as a starting point to different healthy or unhealthy behaviors. Perceived physical ability (i.e., the individual’s perception of physical abilities developed over time as a result of cumulative interactions with the environment) and perceived physical competence are two goal-ori-ented self-perception constructs (11). Recently, it has been shown that body dissatisfaction is a significant mediator of the effect of BMI on perceived physical activity (12). A large body of research has aimed to validate the idea that exercise improves body image through changes in physical fitness (13). However, it has been suggested that improvements in physical fitness play a minor role in changing body image, because the effects of physical exercise and activity on body satisfaction should be mediated by changes in individuals’ perceptions of their physical fitness and competence.
As a result, it seems that perceptions (weight, physical fitness) are core constructs to lead to healthy/unhealthy behaviors more than actual weight or actual physical fitness do.
Healthy or unhealthy behaviors as consequence of different per-ceptions and their corresponding psychological and psychosocial effects lead to the concept of emotional eating among other eating behaviors. Thus, it has been distinguished among restraint eating (conscious restriction of food intake aimed to control body weight and/or to promote weight loss), uncontrolled eating (inability to resist emotional cues, eating as a response to different negative emotions) and emotional eating (tendency to eat more than usual due to a loss of control over intake with a subjective feeling of hun-ger). Other authors have defined external eating as the tendency to overeat in response to external food-related cues like the sight, smell, and taste of palatable food, regardless of their physical need for food (14-16). Moreover, some authors have noted that different types of bingers and dieters may be found: bingers who are engaged in restraint-induced binging, and bingers general-ly disinhibited; dieters who eventually become disinhibited and overeat, and dieters who maintain the restrictive attitude (17,18).
It has been reported that BMI and negative emotional eating are highly related whereas positive emotional eating and external eating loaded onto another factor. In this regard, it is plausible that even though positive emotions may elicit eating, they do not necessarily mirror disordered eating. Eating in response to positive emotions might rather be related to hedonic or external eating (19,20).
Some models conceptualize eating disturbances as disorders of affect regulation, considering the impairment in the cognitive capacity to process and regulate emotions as the primary regu-latory disturbance (21). According to these models, some eating behaviors, such as binge eating and compensatory behaviors, as well as restricted food consumption, are interpreted as respons-es to cope with intense or relatively undifferentiated emotional states (22-24). These intense emotional states are usually linked to self-perceptions (weight, physical fitness, body shape/body image), especially among adolescents (25-28).
Based on the above-mentioned previous research, the objectives of this study, focused on preadolescents and adolescents, were: a) to analyze weight self-perception and self-reported physical fitness; b) to explore the possible relationship between these variables and some weight control behaviors (dieting, self-weighing frequency); to explore possible relations among weight self-perception, self-re-ported physical fitness, dieting, self-weighing frequency and BMI/body image; and d) to analyze the relation between all these vari-ables and different eating behaviors.
METHOD
PARTICIPANTS
The sample comprised 336 students, 160 females (47.62%) and 176 males (52.38%), with a mean age of 12.46 ± 2.14; they were all recruited from two public schools in Seville, repre-senting a middle socio-economic status. The participants have not any psychiatric history, which was assessed by means of a brief questionnaire at the time of obtaining the parents’ informed

1117
[Nutr Hosp 2018;35(5):1115-1123]
SELF-PERCEPTION OF WEIGHT AND PHYSICAL FITNESS, BODY IMAGE PERCEPTION, CONTROL WEIGHT BEHAVIORS AND EATING BEHAVIORS IN ADOLESCENTS
consent. None of the participants showed any comprehension and/or language difficulties. A total of 400 students were invited to take part in the study. Among them, 37 refused to participate and there were 27 students whose parents did not return the signed informed consent. Thus, the response rate was 84%.
INSTRUMENTS AND MEASURES
Weight self-perception and self-reported physical fitness
Following several previous studies, these measures were self-reported, so no infographics or any types of guidelines were used. Participants were classified as “very overweight”, “slightly overweight”, “about the right weight”, “slightly underweight” or “very underweight” after responding to the question “How do you think of yourself in terms of weight?” In addition, participants were asked about their self-reported physical fitness and they were classified as perceiving themselves as possessing a “poor”, “fair”, “average”, “good” or “excellent” physical fitness (27,28).
Dieting
Participants were asked whether or not they were dieting at the moment (yes/no), the reason or reasons for dieting (aesthetic reasons, the specific objective of losing weight, other healthy reasons, others), the origin of the diet (prescribed or self-im-posed) and the intention to keep on dieting or being about to do it (yes/no).
Self-weighing frequency
Participants indicated their self-weighing frequency, the possi-ble responses being: “several times a day”, “once a day”, “several times a week”, “once a week”, and “occasionally”. Then, partici-pants were asked about “What is the reason for being weighed?”: “controlling my weight”, “no fattening”, and “feel better”.
Body image perception
The body silhouettes method was used. This method is based on self-reporting where participants must choose the silhouette that most closely resembles the shape of their body. In this study, the nine Stunkard’s silhouettes were applied (29). Silhouettes numbered 1 represent the thinnest figure and number 9 represents the heaviest.
Body mass index (BMI)
BMI was calculated as the relationship between weight (in kg) and height squared (in m). Weight and height were taken in indi-
vidual sessions, with the participants in the standing position, barefoot, and in light garments. A stadiometer Añó-Sayol Atlántida S13 model was used. Overweight and obesity rates were deter-mined using the value of BMI-specific percentiles for age and sex in the reference population (30), considering the cut-off points of 85th and 97th for overweight and obesity, respectively.
Eating behaviors
Different eating behaviors were assessed by means of the Spanish version of the Three-Factor Eating Questionnaire-R18 (TFEQ-Sp) (31). The questionnaire measures three differ-ent aspects of eating behavior: a) restrained eating (defined as conscious restriction of food intake aimed to control body weight and/or to promote weight loss); b) uncontrolled eating (the tendency to eat more than usual due to a loss of control over intake with a subjective feeling of hunger); and c) emotional eating (inability to resist emotional cues, eating as a response to different negative emotions). The questionnaire comprises 18 items that are measured on a four-point response scale (defi-nitely true: 1, mostly true: 2, mostly false: 3, definitely false: 4) and items scores are summated into subscale scores: a, b and c. Previous studies have reported that TFEQ-R18 has adequate internal consistency reliability coefficients for the three sub-scales, as well as for the whole questionnaire (ranging between 0.74 and 0.87) (14,31). In addition, the Spanish version of the Eating Behaviors and Body Image Test for Preadolescent Girls (EBBIT) was used. This instrument was designed to measure behavioral indicators of dieting and binging and to be put in practice with preadolescent population trying to avoid some of the limitations of previous instruments. The content of this ques-tionnaire permits to be applied in samples of preadolescents and early years of adolescence. The internal consistency reliability coefficients of the EBBIT are 0.92 for the BIDRE subscale (body image dissatisfaction/restrictive eating), 0.82 for the BEB sub-scale (binge eating behaviors) and 0.90 for the total scale (18).
PROCEDURE
The study was approved by the direction of the Behavioural Sci-ences Institute (Seville, Spain). After having obtained the schools’ headmasters’ permission, the students’ approval and the parents’ informed consent, participants completed the aforementioned instruments in group sessions without time limits. A psychologist, a nutritionist and a teacher supervised the procedure, instructing the students about how to complete the questionnaires until they were completely sure about their full understanding of the instruc-tions. Data collection was developed in a suitable setting so the attainment of the task could be reached easily. All the participants volunteered to take part in the study and none of them received any kind of reward after fulfilling the task. The anthropometric measures were taken by trained nutritionists with enough expe-rience with working in these types of studies.

1118 I. Jáuregui-Lobera et al.
[Nutr Hosp 2018;35(5):1115-1123]
STATISTICAL ANALYSES
Data are expressed as means ± standard deviations. To study gender differences and others based on categorical variables, the proportions (percentages) were considered, the analysis being done by means of χ2. An analysis of variance (ANOVA) was con-ducted to study differences with respect to the different variables included in the study, after having applied the Kolmogorov-Smirn-off test in order to analyze whether the data fitted a normal distri-bution. The software used for the analyses was “R”, version 3.3.2 (2016-10-31), “Sincere Pumpkin Patch” (Copyright 2016, The R Foundation for Statistical Computing Platform: x86_64-apple-dar-win13.4.0 -64-bit-).
RESULTS
The sample comprised 336 students, 160 females (47.62%) and 176 males (52.38%), with a mean age of 12.46 ± 2.14. With respect to BMI, the mean was 20.18 ± 3.58. Considering the value of BMI-specific percentiles for age and sex, 57.65% of participants had normal weight, 14.41% had overweight and 26.73%, obesity. Thus, overweight + obesity (BMI ≥ 85th percen-tile) was 41.14%.
Considering weight self-perception, 66.02% of participants perceived themselves as normal weighted, 19.09% as overweight and 4.21% as obese. This way the perceived total overweight was
23.30%. No significant gender differences with respect to weight self-perception were found (χ2 = 8.04; p = 0.09). Overall weight misperception was 44.77%. Among those participants who had overweight, 69.23% misperceived their weight, mainly consid-ering that they had normal weight (62.82%). In case of obese participants, 88.63% misperceived their weight, 84.09% of them perceiving themselves as normal weight or slightly overweight. While 49.68% of boys misperceived their weight, in the case of girls that percentage was 39.58%. Nevertheless, among those who perceived themselves as very overweight, 76.92% were girls. On the contrary, among those who perceived themselves as very or slightly underweight, 62.5% and 60% respectively were boys.
Respecting self-reported physical fitness, most of participants reported an average (34.57%) or good (38.27%) physical fit-ness; poor (2.47%), fair (13.9%) and excellent (10.80%) were the reported physical fitness of the rest. Considering gender differ-ences, while 57.40% of men reported good and excellent physical fitness, in case of women that percentage was 40.52%. On the contrary, 28.40% of men reported average physical fitness while this percentage was 41.83% for women (χ2 = 14.59; p < 0.01).
Most participants who considered to have average, good or excellent physical fitness reported to be about the right weight (66.79%). When the reported physical fitness was poor or fair, there were more participants who perceived themselves as slightly or very overweight (55.32%). Bearing in mind the actual weight, we found similar results. Figure 1 represents the participants who considered their physical fitness as average, good or excellent and
Figure 1.
Actual weight, weight self-perception and self-reported physical fitness (average, good, excellent).

1119
[Nutr Hosp 2018;35(5):1115-1123]
SELF-PERCEPTION OF WEIGHT AND PHYSICAL FITNESS, BODY IMAGE PERCEPTION, CONTROL WEIGHT BEHAVIORS AND EATING BEHAVIORS IN ADOLESCENTS
the corresponding percentages related to weight self-perception and actual weight (classified as normal, overweight or obesity). Among boys, considering not weight perception but actual weight, good and excellent physical fitness was reported by 72.27%, 42.10% and 25.92% of participants at normal weight, overweight and obesity, respectively. In case of girls, these percentages were 45.34%, 38.63% and 16.66%.
With respect to dieting, 18.73% of participants were dieting at the moment, and 29% planned to diet in the future. Among those who planned to diet, 30.95% gave aesthetic reasons to do it, 57.14% of them being girls. Considering self-weighing frequency, the following percentages were obtained: several times a day (2.15%), once a day (3.38%), several times a week (5.54%), once a week (20.31%), and occasionally (66.77%). Only 1.85% of participants never self-weighed. The main reason to self-weighing was “controlling my weight” (67.71%), followed by “no fattening” (17.01%) and “feel better” (12.15%). There were no significant gender differences with respect to dieting and self-weighing frequency. Nevertheless, 57.14% of those who self-weighted to “feel better” were girls.
Body image perception was assessed by means of the body silhouettes method. Table I shows the results by sex with mention to the BMI linked (approximately) to each silhouette.
Bearing in mind the silhouettes which correspond to normal BMI (2-4), more girls (60.51%) than boys (51.42%) chose silhouettes 3-4. Overall, no gender differences with respect to body image perception were observed (Fig. 2).
Taking into account actual BMI and body perception, among those who chose silhouettes 2, 3 and 4 (these silhouettes are
usually associated to normal BMI), 1.25% had moderate denu-trition, 12.5% were overweight and 2.5% were obese in case of silhouette 2; with respect to silhouette 3, 0.95% had severe denutrition, 30.48% were overweight and 2.86% were obese; finally, in the case of silhouette 4, 35.90% were overweight and 20.51% were obese. As a result, when participants iden-tify their body image with silhouette number 2, 16.25% was misperceiving their weight; when participants chose silhouette number 3, the percentage of misperception was 34.29; and, finally, considering the silhouette number 4 the percentage of misperception was 56.41.
With respect to physical fitness, among those who identified themselves with silhouettes 2-4, self-reported physical fitness was “average”, “good” or “excellent” in 89.01%. When partici-pants chose silhouette number 1, that percentage was 85.71%. Finally, the percentage was 56.86% when participants identified themselves with silhouettes 5-9. It must be noted that poor phys-
Figure 2.
Silhouettes chosen by boys and girls.
Table I. Body image perception by sexSilhouettes
1 2 3 4 5 6 7 8 9
Boys 5 42 53 37 24 10 3 0 1
Girls 10 39 52 43 10 2 1 0 0
BMI 17 19 19 23 25 27 29 31 33χ2 = 13.50; p < 0.05.

1120 I. Jáuregui-Lobera et al.
[Nutr Hosp 2018;35(5):1115-1123]
ical fitness was considered by 0.78% when participants chose silhouettes 2-4 and 11.76% in case of silhouettes 5-9. Nobody referred poor physical fitness in case of silhouette number 1. Due to the fact that silhouette number 8 has not been chosen and number 9 only was chosen by one participant, these two silhouettes have been removed from figure 3.
Means of eating behaviors as measured by means of TFEQ-Sp and EBBIT are shown in table II. It must be noted that the original purpose of the EBBIT was to test the hypothesis that young girls at risk of eating disorders may exhibit problems in several areas. Nevertheless, there are no psychometric reasons not to use this instrument in boys so for this work it was applied.
Considering different nutritional states (severe denutrition [SD], moderate denutrition [MD], normal weight [NW], overweight [OW], obesity [OB]), there were no significant differences with respect to restrained eating, emotional eating, uncontrolled eating and binge eating behaviors. Significant differences were found in case of body image dissatisfaction/restrictive eating (BIDRE) subscale (p < 0.0001). Tukey mean-differences test revealed that scores were higher in overweight/obesity than in normal weight (p < 0.0001) and scores were also higher in obesity than in overweight (p < 0.0001) (Fig. 4).
Correlational analyses between scores on eating behaviors and BMI revealed a unique significant correlation between BIDRE and BMI (r = 0.47; p < 0.0001; 95% CI = 0.38-0.55), the rest being not significant. With respect to different subscales of EBBIT and TFEQ-Sp, BEB correlated negative a significantly with restrained eating (r = -0.23; p < 0.0.1), uncontrolled eating (r = -0.18;
p < 0.01) and emotional eating (r = -0.32; p < 0.01). No signif-icant correlations were found between BIDRE and uncontrolled eating and restrained eating. BIDRE correlated positively with emotional eating (r = 0.19; p < 0.05).
DISCUSSION
Weight misperception may be associated to healthful or unhealthy behaviors (1-3). Misperception of overweight or obesi-
Figure 3.
Distribution of self-reported physical fitness by silhouettes.
Table II. Means of TFEQ-Sp and EBBIT by sex
Boys Girls p
TFEQ-Sp
Restrained eating 14.31 15.51 < 0.05
Emotional eating 8.16 9.55 < 0.001
Uncontrolled eating 24.54 26.2 < 0.05
EBBIT
BIDRE 15.24 16.76 0.322
BEB 7.87 6.59 0.123
EBBIT: Eating Behaviors and Body Image Test; TFEQ-Sp: Three-Factor Eating Questionnaire-R18, Spanish version; BIDRE: body image dissatisfaction/restrictive eating; BEB: binge eating behaviors.

1121
[Nutr Hosp 2018;35(5):1115-1123]
SELF-PERCEPTION OF WEIGHT AND PHYSICAL FITNESS, BODY IMAGE PERCEPTION, CONTROL WEIGHT BEHAVIORS AND EATING BEHAVIORS IN ADOLESCENTS
ty among adolescents at normal weight is a clear risk factor for eating behavior disturbances. The sequence weight mispercep-tion, body dissatisfaction and dieting is prone to develop negative eating attitudes and finally high risk for different pathologies, eat-ing disorders being the most relevant among adolescents (6-8). It has been reported that females tend to perceive themselves as overweight more than males do (4-6). In the current study, despite no general differences were found considering the weight self-perception scale, it must be noted that among the participants who considered to be very overweight, 76.92% were girls. On the contrary, among those who perceived themselves as very or slightly underweight, 62.5% and 60% respectively were boys. These results are similar to others previously found in a similar study with a sample of adolescents with a mean age of 16.22, so a bit older (28). Other studies have reported that females tend to perceive themselves as overweight more than men usually do (4-6). Generally, the identification with larger silhouettes (e.g., from 2 to 4) increases the percentage of weight misperception.
Body dissatisfaction has been considered as a mediator on the effect of BMI on perceived physical activity (12), and body image is improved by changes in physical fitness (13). Recently, it has been shown that body dissatisfaction is a significant mediator of the effect of BMI on perceived physical activity (12). A large body of research has aimed to validate the idea that exercise improves body image through changes in physical fitness (13). However, Martin and Lichtenberger have suggested that improvements in physical fitness play a minor role in changing body image, because the effects of physical exercise and activity on body satis-faction should be mediated by changes in individuals’ perceptions of their physical fitness and competence (15). This study shows that most participants reported an average or good physical fit-ness (72.84%). Again, some gender differences appeared since 57.40% of boys reported good and excellent physical fitness, this percentage being 40.52% in case of girls. This difference has
been reported previously (28). In view of our results, boys tend to have a better perception of their physical fitness than girls, this result appearing at normal weight, overweight and obesity.
A worse self-reported physical fitness (regardless of actual weight) and a tendency to perceive themselves as overweight could lead girls to higher risk of developing body dissatisfaction. In addition, it must be noted that almost 31% of participants who planned to diet in the future had aesthetic reasons to do it, 57.14% of them being girls. The main reason for self-weigh-ing was “controlling my weight”, but when the reason was “feel better”, almost 58% of participants were girls. In this regard, a worse self-reported physical fitness, a worse weight perception, aesthetic reasons for planning to diet in the future and considering self-weighing as a way to feel better could yield a constellation of risks to develop both body image dissatisfaction and eating behav-ior disturbances. In fact, a previous study has reported that dieting for aesthetic reasons, weight misperception, worse self-reported physical fitness and the fact of being female perform a high-risk group of developing eating disorders (28).
Healthy or unhealthy behaviors as a consequence of different perceptions and their corresponding psychological and psycho-social effects lead to the concept of emotional eating, among other eating behaviors. Thus, it has been distinguished among restraint eating (conscious restriction of food intake aimed to control body weight and/or to promote weight loss), uncontrolled eating (inability to resist emotional cues, eating as a response to different negative emotions) and emotional eating (tendency to eat more than usual due to a loss of control over intake with a subjective feeling of hunger) (14). Other authors have defined external eating as the tendency to overeat in response to external food-related cues like the sight, smell, and taste of palatable food, regardless of their physical need for food (15,16). Moreover, some authors have noted that different types of bingers and dieters may be found: bingers who are engaged in restraint-induced binging, and bingers generally disinhibited; dieters who eventually become disinhibited and overeat, and dieters who maintain the restrictive attitude (17,18). Also, in the field of eating behaviors, the concept of dietary restraint is relevant, highlighting the regulation of food intake in order to control weight and body shape (32). That control based on restrictions may cause consequent overeating episodes and eating disorders, and overweight and obesity at long-term (14). Along with dietary restraint, other eating behaviors have been described such as loss of control over intake and overeating as a consequence of emotional distress (33).
It has been reported that BMI and negative emotional eating are highly related whereas positive emotional eating and external eating loaded onto another factor. In this regard, it is plausible that even though positive emotions may elicit eating, they do not necessarily mirror disordered eating. Eating in response to positive emotions might rather be related to hedonic or external eating (19,20).
Some models conceptualize eating disturbances as disorders of affect regulation, considering the impairment in the cognitive capacity to process and regulate emotions as the primary regulatory disturbance (21). According to these models, some eating behav-
Figure 4.
Differences in BIDRE scores considering several nutritional states (SD: severe denutrition; MD: moderate denutrition; NW: normal weight; OW: overweight; OB: obesity).

1122 I. Jáuregui-Lobera et al.
[Nutr Hosp 2018;35(5):1115-1123]
iors, such as binge eating and compensatory behaviors, as well as restricted food consumption, are interpreted as responses to cope with intense or relatively undifferentiated emotional states (22-24). These intense emotional states are usually linked to self-perceptions (weight, physical fitness, body shape/body image), especially among adolescents (25-28). Thereby, it has been reported that people with higher weight and those who perceive themselves as overweight usually show higher scores on cognitive restriction (31). In fact, the link between higher BMI and higher scores on cognitive restriction has been reported previously (34,35). In the current study we have not found any significant differences with respect to restrained eat-ing, emotional eating, uncontrolled eating and binge eating behav-iors when the actual weight has been considered. In this regard, as other studies have shown, cognitive dietary restraint is not consis-tently linked to body weight-adiposity (29). Nevertheless, scores on body image dissatisfaction/restrictive eating (BIDRE subscale) were different with regards to actual weight (normal weight, overweight and obesity). The fact that the difference is showed in this subscale but not in the BEB subscale indicates that it is possible to maintain a tendency to restrictive attitudes without binge eating behaviors in both obese and overweight participants. With respect to the asso-ciation, the correlation between BIDRE and BMI was 0.47. In fact, BIDRE and BEB suggest that these two factors might be considered as independent dimensions (18).
Another point to discuss refers to the instruments which aim to assess eating behaviors. Thus, BEB correlated negative a signifi-cantly with restrained eating, uncontrolled eating, and emotional eating. This result seems to indicate that binge eating behavior, restrained eating, uncontrolled eating and emotional eating are different constructs despite having possible shared elements. In addition, no significant correlations were found between BIDRE and uncontrolled eating and restrained eating. It seems that when there is a component linked to body image (e.g., BIDRE), correla-tions with uncontrolled and restrained eating are not significant but this changes with respect to emotional eating, in this case existing a positive correlation. In this regard, body image dissatis-faction could lead to eating disturbances through emotional more than restrained eating.
This study adds some new results to others previously pub-lished in the same field (25-28,32). Comparing to these others, we have studied a sample with the lowest age range which per-mits to study possible links between weight self-perception, body image (and related variables such as dieting or self-weighing) and eating behaviors in a stage of life which could be recognized, to some extent, as a starting point to develop eating disorders. Some conclusions emerge from the results. First, the majority of participants who perceive themselves as obese are girls and the majority of participants who perceive themselves as underweight are boys. Second, boys tend to perceive themselves with a better physical fitness than girls. Third, more girls than boys plan to diet in the future for aesthetic reasons. Fourth, when the reason to self-weighing is feel better, more girls than boys are involved. Finally, BMI is significant and positively correlated to BIDRE. When body image dissatisfaction is controlled for analysis, then BMI correlates with emotional eating.
In view of these results, it would be interesting to study in depth the reasons that lead girls to overestimate their weight and, on the contrary, underestimate it in case of boys.
The current study has some limitations. Different variables are self-reported at an age which could reflect doubts about reliabil-ity. Nevertheless, previous studies have followed a similar way to assess some information. Despite that EBBIT was designed for young girls at risk for eating disorders, after analyzing the content of the test no psychometric reasons have been found to avoid that instrument in the current study. Body dissatisfaction has not been assessed by means of a specific instrument apart from the BIDRE subscale of the EBBIT. The body silhouettes method is based on self-reporting where participants must choose the sil-houette that most closely resembles the shape of their body. Then, it is possible to analyze differences with respect to self-reported weight or actual weight as well as others measures. In this study, we emphasized some self-reported measures more than body image dissatisfaction scores as usually are measured by several questionnaires. Finally, precocious puberty is a risk factor clearly related to the onset of that puberty. Secondary sexual character-istics may lead to affective and psychosocial adaptive problems, which also lead to behavior disorders and a negative body image. Pubertal timing is a potentially significant factor when assessing psychopathological symptoms. Pubertal timing refers to the timing when pubertal development occurs in relation to peers, i.e., it relates to whether an adolescent is ahead of peers in pubertal development (early pubertal timing), in line with peers (on-time) or behind peers in pubertal development (late pubertal timing). In this regard, not having applied the pubertal stage categorization (e.g., by means of Tanner stages) is a limitation to take into account in future similar studies (36).
REFERENCES
1. Pash KE, Klein EG, Laska MN, Velázquez CE, Moe SG, Lytle LA. Weight mis-perception and health risk behaviors among early adolescents. Am J Health Behav 2011;35:797-806. DOI: 10.5993/AJHB.35.6.15
2. Duncan DT, Wolin KY, Scharoun-Lee M, Ding EL, Warner ET, Bennett GG. Does perception equal reality? Weight misperception in relation to weight-related attitudes and behaviors among overweight and obese US adults. Int J Behav Nutr Phys Act 2011;22:8-20. DOI: 10.1186/1479-5868-8-20.
3. Lynch E, Liu K, Wei GS, Spring B, Kiefe C, Greenland P. The relation between body size perception and change in body mass index over 13 years: the Coronary Artery Risk Development in Young Adults (CARDIA) study. Am J Epidemiol 2009;169:857-66. DOI: 10.1093/aje/kwn412.
4. Kilpatrick M, Ohannessian C, Bartholomew JB. Adolescent weight mana-gement and perceptions: an analysis of the National Longitudinal Study of Adolescent Health. J Sch Health 1999;69:148-52. DOI: 10.1111/j.1746-1561.1999.tb04173.x.
5. Hazzard VM, Hahn SL, Sonneville KR. Weight misperception and disordered weight control behaviors among U.S. high school students with overweight and obesity: associations and trends, 1999-2013. Eat Behav 2017;26:189-95. DOI: 10.1016/j.eatbeh.2017.07.001
6. Pritchard ME, King SL, Czajka-Narins DM. Adolescent body mass indices and self-perception. Adolescence 1997;32:863-80.
7. Bašková M, Holubčíková J, Baška T. Body-image dissatisfaction and wei-ght-control behaviour in Slovak adolescents. Cent Eur J Public Health 2017;25(3):216-21.
8. Ter Bogt TF, Van Dorsselaer SA, Monshouwer K, Verdurmen JE, Engels RC, Vollebergh WA. Body mass index and body weight perception as risk factors

1123
[Nutr Hosp 2018;35(5):1115-1123]
SELF-PERCEPTION OF WEIGHT AND PHYSICAL FITNESS, BODY IMAGE PERCEPTION, CONTROL WEIGHT BEHAVIORS AND EATING BEHAVIORS IN ADOLESCENTS
for internalizing and externalizing problem behavior among adolescents. J Adolesc Health 2006;39:27-34. DOI: 10.1016/j.jadohealth.2005.09.007
9. Neumark-Sztainer D. Preventing the broad spectrum of weight-related pro-blem: working with parents to help teens achieve a healthy weight and a positive body image. J Nutr Educ Behav 2005;37:S133-40. DOI: 10.1016/S1499-4046(06)60214-5
10. Stice E, Cameron RP, Killen JD, Hayward C, Taylor C. Naturalistic weight-re-duction efforts prospectively predict growth in relative weight and onset of obesity among female adolescents. J Consult Clin Psychol 1999;67:967-74. DOI: 10.1037/0022-006X.67.6.967
11. Cash TF, Jakatdar TA, Williams EF. The Body Image Quality of Life Inventory: further validation with college men and females. Body Image 2004;1:279-87. DOI: 10.1016/S1740-1445(03)00023-8.
12. Festinger LA. A theory of social comparison processes. Hum Relat 1954;7:117-40.
13. Feltz DL, Chow GM, Hepler TJ. Path analysis of self-efficacy and diving performan-ce revisited. J Sport Exerc Psychol 2008;30:401-11. DOI: 10.1123/jsep.30.3.401
14. Morano M, Colella D, Capranica L. Body image, perceived and actual physical abilities in normal weight and overweight boys involved in individual and team sports. J Sports Sci 2011;29:355-62. DOI: 10.1080/02640414.2010.530678
15. Martin KA, Lichtenberger CM. Fitness enhancement and body image change. In: Cash TF, Pruzinsky T, eds. Body image: a handbook of theory, research, and clinical practice. New York: Guilford Press; 2002. pp. 414-21.
16. Karlsson J, Persson LO, Sjöström L, Sullivan M. Psychometric properties and factor structure of the Three-Factor Eating Questionnaire (TFEQ) in obese men and women. Results from the Swedish Obese Subjects (SOS) study. Int J Obesity Relat Metab Disord 2000;24:1715-25.
17. Rodin J. Social and immediate environmental influences on food selection. Int J Obesity 1980;4:364-70.
18. Smith AD, Fildes A, Cooke L, Herle M, Shakeshaft N, Plomin R, et al. Genetic and environmental influences on food preferences in adolescence. Am J Clin Nutr 2016;104(2):446-53. DOI: 10.3945/ajcn.116.133983
19. Van Strien T, Schippers GM, Cox WM. On the relationship between emo-tional and external eating behavior. Addict Behav 1995;20:585-94. DOI: 10.1016/0306-4603(95)00018-8
20. Leigh SJ, Lee F, Morris MJ. Hyperpalatability and the generation of obesity: roles of environment, stress exposure and individual difference. Curr Obes Rep 2018 Feb. DOI: 10.1007/s13679-018-0292-0
21. Candy CM, Fee VE. Underlying dimensions and psychometric properties of the eating behaviours and body image test for preadolescent girls. J Clin Child Psychol 1998;27:117-27. DOI: 10.1207/s15374424jccp2701_13
22. Jáuregui-Lobera I, Pérez-Lancho C, Gómez-Capitán MJ, Durán E, Garrido O. Psychometric properties of the Spanish version of the Eating Behaviours and Body Image Test for preadolescent girls (EBBIT). Eat Weight Disord 2009;14:e22-8.
23. Macht M. Characteristics of eating in anger, fear, sadness and joy. Appetite 1999;33:129-39. DOI: 10.1007/BF03354624
24. Van Strien T, Donker MH, Ouwens MA. Is desire to eat in response to positive emotions an “obese” eating style: is Kummerspeck for some people a misnomer? Appetite 2016;100:225-35. DOI: 10.1016/j.appet.2016.02.035
25. Taylor CB, Altman T. Priorities in prevention research for eating disorders. Psychopharmacol Bull 1997;33:413-7.
26. Le LK, Barendregt JJ, Hay P, Mihalopoulos C. Prevention of eating disorders: a systematic review and meta-analysis. Clin Psychol Rev 2017;53:46-58. DOI: 10.1016/j.cpr.2017.02.001
27. Austin SB1. Accelerating progress in eating disorders prevention: a call for policy translation research and training. Eat Disord 2016;24(1):6-19. DOI: 10.1080/10640266.2015.1034056
28. Torres S, Guerra MP, Lencastre L, Roma-Torres A, Brandão I, Queirós C, et al. Cognitive processing of emotions in anorexia nervosa. Eur Eat Disord Rev 2011;19:100-11. DOI: 10.1002/erv.1046
29. Stunkard AJ, Sørensen T, Schulsinger F. Use of the Danish Adoption Register for the study of obesity and thinness. Res Publ Assoc Res Nerv Ment Dis 1983;60:115-20.
30. Corstorphine E, Mountford V, Tomlinson S, Waller G, Meyer C. Distress tole-rance in the eating disorders. Eat Behav 2007;8:91-7. DOI: 10.1016/j.eat-beh.2006.02.003
31. Jáuregui-Lobera I, García-Cruz P, Carbonero-Carreño R, Magallares A, Ruiz-Prieto I. Psychometric properties of Spanish version of the Three-Factor Eating Questionnaire-R18 (TFEQ-Sp) and its relationship with some eating- and body image-related variables. Nutrients 2014;6:5619-35. DOI: 10.3390/nu6125619
32. Ruiz-Prieto I, Carbonero-Carreño R, Jáuregui-Lobera I. Weight misperception and physical fitness perception in relation to the physical activity level, dietary behaviour and psychosocial well-being. Nutr Hosp 2014;31:203-16. DOI: 10.3305/nh.2015.31.1.8119
33. Hernández JD, Rodríguez M, Bolaños-Ríos P, Ruiz-Prieto I, Jáuregui-Lobera I. Eating habits, excess weight and weight self-perception at school. Nutr Hosp 2015;32:1334-43. DOI: 10.3305/nh.2015.32.3.9351
34. Jáuregui-Lobera I, Bolaños-Ríos P, Santiago-Fernández MJ, Garrido-Casals O, Sánchez E. Perception of weight and psychological variables in a sample of Spanish adolescents. Diabetes Metab Syndr Obes 2011;4:245-51. DOI: 10.2147/DMSO.S21009
35. Jáuregui-Lobera I, Ezquerra-Cabrera M, Carbonero-Carreño R, Ruiz-Prieto I. Weight misperception, self-reported physical fitness, dieting and some psychological variables as risk factors for eating disorders. Nutrients 2013;5:4486-502. DOI: 10.3390/nu5114486
36. Hernández M, Castellet J, Narvaiza JL, Rincón JM, Ruiz I, Sánchez E, et al. Curvas y Tablas de Crecimiento. Instituto de investigación sobre crecimiento y desarrollo. Fundación F. Orbegozo. Madrid: Ediciones Garsi; 1988.

NutriciónHospitalaria
Trabajo Original Valoración nutricional
ISSN (electrónico): 1699-5198 - ISSN (papel): 0212-1611 - CODEN NUHOEQ S.V.R. 318
Correspondence: Marcus Nascimento. Tiradentes University. Av. Murilo Dantas, 300. 49032-490 Aracaju, SE. Brazile-mail: [email protected]
Argôlo D, Borges J, Cavalcante A, Silva G, Maia S, Ramos A, Oliveira E, Nascimiento M. Poor dietary intake and low nutritional knowledge in adolescent and adult competitive athletes: a warning to table tennis players. Nutr Hosp 2018;35(5):1124-1130
DOI: http://dx.doi.org/10.20960/nh.1793
Poor dietary intake and low nutritional knowledge in adolescent and adult competitive athletes: a warning to table tennis playersIngesta alimentaria inadecuada y bajo conocimiento sobre nutrición en atletas de competición adolescentes y adultos: una llamada de atención para los jugadores de tenis de mesa
Dayane Argôlo1, Josefa Borges1, Andressa Cavalcante1, Gilvana Silva1, Sandra Maia1, Ayrton Ramos2, Eduardo Oliveira2 and Marcus Nascimento1
1Nutrition Course. Tiradentes University. Sergipe, Brazil. 2Physical Education Course. Tiradentes University. Sergipe, Brazil
Palabras clave:
Evaluación nutricional. Atletas. Conocimiento sobre nutrición. Adolescencia.
Resumen Introducción: una evaluación de la ingesta alimentaria de atletas puede ayudar a entender las principales inadecuaciones en la dieta y cómo otros factores como el conocimiento sobre alimentación y la edad pueden también influenciar en sus comportamientos alimentarios.
Objetivo: evaluar y comparar la ingesta alimentaria y el conocimiento sobre nutrición entre jugadores de tenis de mesa adultos y adolescentes.
Métodos: cuarenta y dos atletas de competición (25 adolescentes y 17 adultos) respondieron dos recordatorios de 24 horas de días no con-secutivos y un cuestionario validado de conocimiento sobre nutrición. Las variables numéricas y categóricas se compararon entre los grupos mediante el uso de pruebas t de Student para muestras independientes y la prueba de Chi-cuadrado de Pearson, respectivamente.
Resultados: los adolescentes mostraron menor consumo y mayor inadecuación en la ingestión de micronutrientes (p < 0,05). La mayoría de los adolescentes clasificaron su dieta como excelente/buena, mientras que la mayoría de los adultos clasificaron la calidad de su dieta como baja/muy baja (p < 0,05). Las fuentes de información nutricional más utilizadas por adolescentes y adultos fueron sus padres e internet, respectivamente. El análisis de las interacciones grupales mostró que los adultos tuvieron mejor conocimiento sobre nutrición que los adolescentes (p < 0,05).
Conclusión: los atletas mostraron hábitos alimentarios inadecuados, bajo conocimiento sobre nutrición y utilización de fuentes de información sobre nutrición de baja calidad. Los adolescentes tuvieron mayor prevalencia de ingesta inadecuada de nutrientes, menor conocimiento sobre nutrición y una peor percepción de la calidad de su dieta en comparación con los adultos.
Key words:
Nutrition assessment. Athletes. Nutrition knowledge. Adolescence.
Abstract Introduction: an evaluation of an athlete’s dietary intake may help to understand the dietary inadequacies that are found in athletes and how other factors, such as nutritional knowledge and age, might also influence their food behavior.
Objective: to evaluate and compare the dietary intake and the nutrition knowledge between adult and adolescent table tennis players.
Method: forty-two competitive athletes (25 adolescents and 17 adults) responded to two non-consecutive 24-hour recalls and a validated nutri-tional knowledge questionnaire. Numerical and categorical variables were compared between groups by using independent-sample Student’s t-tests and Pearson’s Chi-square test, respectively.
Results: the adolescents showed lower intakes and higher inadequacies in the ingestion of micronutrients (p < 0.05). Most of the adolescents rated their dietary quality as excellent/good, while a higher prevalence of the adults rated their dietary quality as being poor/very poor (p < 0.05). The nutritional information sources that were most used by the adolescents and the adults were their parents and the internet, respectively. The between-group analyses showed that the adults had a higher nutrition knowledge than the adolescents (p < 0.05).
Conclusions: the athletes showed poor dietary habits, low levels of nutritional knowledge, as well as the use of low quality nutritional infor-mation sources. The adolescents showed a higher prevalence of nutrient inadequacies, lower nutritional knowledge levels, as well as a worse self-perception of dietary quality than the adults.
Received: 21/01/2018 • Accepted: 20/04/2018
©Copyright 2018 SENPE y ©Arán Ediciones S.L. Este es un artículo Open Access bajo la licencia CC BY-NC-SA (http://creativecommons.org/licenses/by-nc-sa/4.0/).

1125
[Nutr Hosp 2018;35(5):1124-1130]
POOR DIETARY INTAKE AND LOW NUTRITIONAL KNOWLEDGE IN ADOLESCENT AND ADULT COMPETITIVE ATHLETES: A WARNING TO TABLE TENNIS PLAYERS
INTRODUCTION
Ever since it was introduced as an Olympic sport in Seoul, Korea, in 1988, competitive table tennis has grown in status at national and international levels and it is now played by more than 40 million people worldwide (1). Table tennis belongs to the racket sports group, as does badminton, squash, and tennis. It is characterized by continuous changes of rhythm and intensity, with repeated fast actions of short duration. It involves intermittent periods of explosive and high-intensity muscle activity, requiring significant energy from both the anaerobic alactic and aerobic energy systems (1).
Nutrition is considered to be an essential factor for success in sports, as it may affect a player’s ability to train, play and recover from exercise (2). Athletes should consume diets that provide adequate amounts of nutrients, by consuming a variety of foods and the recommended number of servings, as specified in the food guide pyramids (2). Adolescents that participate in sports competitions deserve even more attention, due to the psycho-logical and physiological stress to which they are exposed. Thus, additional care should be given to their diet, since the extra needs of their physical activities are additional to their nutritional needs for growth and development (3).
Previous studies have indicated that many athletes have sub-optimal dietary intakes (4,5). This might be related to their low levels of nutritional knowledge and the use of low quality nutritional information sources (4,5). It has also been argued that cultural backgrounds, taste preferences, together with appetite and cooking skills, may inhibit the implementation of appropriate dietary strategies by the athletes themselves (6). However, such food behavior might be differently influenced according to age. During adolescence, dietary habits are highly dependent on the food behavior of their parents (3), while in adulthood, despite having higher educational levels and greater health awareness, many athletes have difficulties in adapting to a healthier diet, due to the lack of time for meal preparation (7).
An evaluation of an athlete’s dietary intake may help to under-stand the principal dietary inadequacies that are found in ath-letes and how other factors, such as nutritional knowledge and age, might also influence their food behavior. However, only a few studies have evaluated the athletes of racket sports (8,9) and, to the best of our knowledge, none of them have been conducted on table tennis athletes. Therefore, the objective of the present study has been to evaluate and compare the nutritional knowledge and the dietary intake between adult and adolescent competitive table tennis players.
MATERIALS AND METHODS
STUDY SAMPLE
Table tennis players from three clubs in the State of Sergipe, Brazil, volunteered to participate in the research. To be eligible for the study, a participant had to be federated, had to have been
practicing table tennis, as well as to have participated in at least two tournaments in the previous year. Those individuals with a chronic or an acute disease, or who were on any medication, were excluded.
The data collection occurred during training and two state championships, between September and December of 2015. Forty-two athletes agreed to participate in the study. Thirty-three athletes from the regional training center team, together with nine athletes from two other smaller teams in the capital and from a city in the interior of the state, were all evaluated. During the previous year, 25 athletes participated in national competitions (20 were medalists) and 24 participated in regional competitions (13 were medalists). All of the participants were participating in state competitions.
Twenty-five athletes were adolescents (age range: 10-19 years) and 17 were adults (age range: 21-56 years). All of the adults were male, while two adolescents were female and 23 were male. There was no difference in the results when they were analyzed without the female athletes; thus, they were included. The ath-letes responded to a nutritional knowledge questionnaire and, in sequence, nutritional assessments were performed. Written informed consent was given by all participants and, if they were not of legal age, their parents. Inform assent was also obtained from the adolescents.
This study was conducted according to the guidelines as laid down in the Declaration of Helsinki and all of the proce-dures involving the human subjects were approved by the Research Ethics Committee of the Tiradentes University (C.A.A.E.53350316.5.0000.5371).
ANTHROPOMETRY AND DIETARY INTAKE ASSESSMENTS
The anthropometric measurements were performed following the techniques as proposed by Lohman et al. (10). The athlete’s height was measured to the nearest 0.1 cm by using a stadiom-eter (AlturaExata®) and their body weight was measured to the nearest 0.1 kg by using an electronic scale (LIDER®).
Their dietary intake was assessed by using two non-consecu-tive 24-hour food recalls (one day of the week and one weekend day). The data on the food that had been consumed, the weight information, the portion sizes, and the food preparation techniques were also collected.
The dietary intake was calculated by using the software AVA-NUTRI 4.0 (Avanutri Informática Ltda., Rio de Janeiro, Brazil). To increase data reliability, energy and nutrients were analyzed hier-archically based upon the following nutrient databases: Brazilian Food Composition Table (11), Brazilian Institute of Geography and Statistics Food Composition Table (12) and the National Nutrient Database for Standard Reference from the United States Depart-ment of Agriculture (13). For any processed foods for which the nutritional information was not available, the data was obtained from the nutritional fact labels that were available on the food companies’ websites.

1126 D. Argôlo et al.
[Nutr Hosp 2018;35(5):1124-1130]
ENERGY, NUTRIENT AND FOOD PORTION EVALUATIONS
The basal metabolic rate (BMR) was estimated using the Scho-field et al. (14) equation. The activity level factor was estimated according to the number of training hours (15). The proportions of energy intake and the basal metabolic rate (EI:BMR) were com-pared by using the Goldberg cut-off points method (16), which was aimed at assessing the underreporting magnitude.
The nutrient intake classification was performed after a compar-ison of the specific recommendations (2). The carbohydrate intake was compared to the recommendation of 5-7 g/kg/day, while to evaluate the protein ingestion, the recommendation of 1.2-2.0 g/kg/day was used. The World Health Organization (WHO) guidelines (17) were used in order to evaluate the ingestion of total fat, cholesterol, and the fatty acid compositions of the diets. In order to evaluate the fiber intake, the cut-off points as proposed by Williams, Bollella and Wynder (18) were used (adolescents: chronological age plus five grams of fiber; adults: at least 25 g of fiber/day).
The following criteria were adopted in order to calculate the percentages of inadequacy of the athletes (19). The individuals with intakes below the recommendations of carbohydrate, fiber, monounsaturated fat and polyunsaturated fat were considered as being inadequate. For total fat, cholesterol and protein, the athletes who consumed more than the recommended intake were also considered as inadequate.
The ingestion of micronutrients was classified following the Dietetic Reference Intakes Standard. According to the American Institute of Medicine (15), the intakes of vitamins and minerals under the estimated average requirement (EAR) were considered as inadequate. Since the mean intake of sodium in Brazil is ele-vated, the values of the tolerable upper intake level (UL) were used in order to determine the prevalence of individuals with an inadequate intake of this nutrient (15).
The consumption of food portions was compared to the recom-mendations as proposed by the Brazilian Food Pyramid (20). The percentages of inadequacy were calculated from the prevalence of those individuals below the proposed recommendations, except for oils, fats, sugars and sweets. For these groups, the inadequacy percentages were obtained from the prevalence of the individuals who were over the recommended portions number.
NUTRITIONAL KNOWLEDGE
A two-part questionnaire was distributed to all of the athletes. The first part of the questionnaire presented demographic ques-tions, including age, education level, hours of training/week, a rating of their own diet quality, reasons for not eating healthier food (responded only to those that rated their own diet quality as poor), as well as their nutritional information sources (21).
The second part of the questionnaire consisted of a validat-ed nutritional knowledge test (22,23). The questionnaire had 14 questions divided into three sections. The first section contained three multi-choice questions about the basic aspects of nutrition.
The second part consisted of a question that was related to the Brazilian Food Guide Pyramid, where the athletes had to fill in the pyramid with the correct food groups. The third section addressed the issue of sports nutrition and it was comprised of ten state-ments to which the athletes should mark “yes” if they agreed with the statement, “no” if they disagreed with the statement, or “do not know” if they were unsure. The correct issues were worth a plus point and the wrong or “do not know” answers received no points. The average percentages of the correct answers were calculated.
The questionnaire had its discriminative validity determined in a previous study by our research group (21). The test was applied to 19 graduates of the 4th period of nutrition and to 16 adolescent athletes. To be considered as valid, the questionnaire had to be able to differentiate the participants at different levels of knowledge. After the application, the students had a significantly higher mean percentage of correct answers (97.4%) than did the athletes (57%).
STATISTICAL ANALYSIS
The software SPSS, version 17.0 (SPSS Inc., Chicago, IL, USA) was used for the statistical analyses. The numerical variables have been presented as mean and standard deviations (SD). Non-nor-mally distributed variables were presented as medians and inter-quartile range (ICC). For the categorical data, absolute and relative prevalence were used. Continuous measurements were compared between the adolescents and the adults by using independent-sam-ple Student’s t-tests and the categorical data was compared by using Pearson’s Chi-square test. Non-normally distributed data were compared by the Mann-Whitney non-parametric test. Pearson’s correlation coefficients between the ingestion of key nutrients that are commonly used to analyze diet quality in nutrition knowledge studies (calcium, phosphorus, sodium, fiber, total fat, dairy, vege-tables, fruits, sweets, oils and fats) and the nutritional knowledge measurements were also calculated (6). Non-normally distributed variables were log-transformed before correlation analysis.
Due to underreporting, the residual method was used in order to obtain energy adjusted amounts of nutrients and food portion intakes (24). The method is an alternative to control for confound-ing the total energy intake and to remove the extraneous variations due to the total energy intake.
The internal consistency of the nutritional knowledge ques-tionnaire was obtained by Cronbach’s alpha coefficient (α). A minimum value of 0.70 was recommended by Rowland, Arkkelin and Crisler (25). For all analyses, a statistical significance was set at p < 0.05.
RESULTS
The adolescents and the adults had a mean of 13.8 ± 2.5 and 33.6 ± 10.8 years (p < 0.05), respectively. There was no difference between the athlete’s hours of training per week (ado-lescents: 6.4 ± 4, adults: 5 ± 1.5, p < 0.05).

1127
[Nutr Hosp 2018;35(5):1124-1130]
POOR DIETARY INTAKE AND LOW NUTRITIONAL KNOWLEDGE IN ADOLESCENT AND ADULT COMPETITIVE ATHLETES: A WARNING TO TABLE TENNIS PLAYERS
Most of the adolescents (92.8%) were at middle/high school, while all of the adults had completed a higher education degree. There were no differences between the groups in the prevalence of underreport-ing (adults: 58.8%, n = 10; adolescents: 36%, n = 9, p < 0.05).
The athletes from both groups showed a high prevalence of inadequacy in their ingestion of cereals, vegetables, dairy and sweets and more than half of the adolescents were inadequate in their ingestion of fruits and legumes (Fig. 1).
The adolescents showed a higher intake of carbohydrate and protein and a lower ingestion of vitamins A, B5, B6, C, calcium, zinc and phosphorus (Table I). Both groups showed a high prev-alence of inadequacy in the ingestion of nutrients. However, the adults were more inadequate in their ingestion of carbohydrate and protein, while the adolescents showed a higher inadequacy in vitamins B6, B9, C, and phosphorus (Table I).
A higher prevalence of adolescents rated their dietary quality as excellent/good, while a higher prevalence of adults rated their dietary quality as poor/very poor. The adults reported that habit
was the reason for not eating healthier. The nutritional information sources that were most used by the adolescents and the adults were their parents and the Internet, respectively (Table II).
The internal consistency values of the nutritional knowledge questionnaire showed an acceptable reliability for both groups (adults: 0.88; adolescents: 0.86). The between-group analyses showed that the adults had a higher nutritional knowledge than did the adolescents (Table III).
Negative correlations were found between adults’ total nutri-tional knowledge and their sodium intake (r = -485) (p < 0.05). There was no correlation between adolescents’ nutrition knowl-edge and dietary intake.
DISCUSSION
To the best of our knowledge, this is the first study that has evaluated the dietary intake and the nutritional knowledge of table
Table I. Nutrient intake and prevalence of inadequacy in adult and adolescent table tennis players (n = 42)
Nutrients Adolescents (n = 25) Adults (n = 17)
Median(ICC)
Inadequacy%
Median(ICC)
Inadequacy%
Carbohydrate (g/kg) 4.9 (4-6.6)* 48 3.2 (2.7-3.8) 88†
Protein (g/kg) 1.8 (1.4-2.3)* 24 1.1 (0.6-1.5) 64.7†
Fat (%) 25.4 (20-29) 16 26.6 (19-32) 35.3
SAF (%) 7.4 (6-11.6) 28 9.4 (6-13.1) 35.3
MUFA (%) 4.6 (3.3-6.6) 96 5.2 (3.3-10) 76.5
PUFA (%) 3 (2-4.6) 88 4.3 (2-5.1) 88.2
Fiber (g) 10.3 (7.7-19) 80 15 (10-17) 94.1
Vit. A (µg) 211 (134-377) 80 484 (326-882)* 70.6
Vit. C (mg) 93.7 (15-197) 36† 610 (553-628)* 0
Vit. B1 (mg) 1 (0.8-1.3) 24 1.2 (0.7-1.5) 53
Vit. B2 (mg) 1.4 (0.5-3.3) 40 1 (0.7-2.5) 41.2
Vit. B5 (mg) 2.3 (1.4-3.2) 96 3.4 (3-4.4)* 88
Vit. B6 (mg) 1 (0.4-1.5) 52† 7.2 (5.6-7.6)* 0
Vit. B9 (µg) 80.9 (55-107) 100† 108 (0-263) 76.5
Vit. B12 (µg) 1.8 (1.2-2.8) 52 3.2 (1.2-3.8) 35.3
Vit. E (mg) 7.7 (5-12) 72 8.1 (6-16) 58.8
Calcium (mg) 386 (243-667) 96 648 (603-696)* 100
Iron (mg) 13 (6-48) 40 10 (8.6-14.6) 53
Zinc (mg) 6.1 (3.9-7.8) 80 8.8 (7.5-13.8)* 58.8
Sodium (mg) 2,305 (660-3,897) 52 2,485 (1,940-3,981) 64.7
Phosphorus (mg) 711 (542-907) 84† 900 (898-904)* 0
Vit.: vitamin; SAF: saturated fatty acids. MUFA: monounsaturated fatty acids; PUFA: polyunsaturated fatty acids. *p < 0.05 by Mann-Whitney test. †p < 0.05 by Pearson’s Chi-square test or Fisher’s exact test.

1128 D. Argôlo et al.
[Nutr Hosp 2018;35(5):1124-1130]
tennis players. The table tennis game is characterized by periods of effort and rest. For the fast and powerful movements during a rally, it is the anaerobic system that is decisive, as it represents the difference between winning and losing (1). Therefore, mus-cle glycogen appears to be the main source of energy during the game (1). In the present study, the athletes showed a high prevalence of inadequacy in carbohydrate, which may negatively affect their performances. Fatigue by low glycogen levels may be manifested by decrements in power, stamina, poor positional play,
and mistimed or miss-hit strokes, which may lead to a decline in the accuracy of the shots played (26).
Athletes from both groups showed a poor quality of diet. This was demonstrated by the high prevalence of inadequacies in their ingestion of fruits, vegetables, sweets and dairy. The low variety of food groups may have contributed to the inadequate intake of important nutrients, such as fiber, unsaturated fat and vitamins. Fiber and unsaturated fat have a role in the prevention of metabolic diseases (17,18), while B-complex vitamins act as enzymes during the reactions of energy production. Antioxidants (i.e., vitamins E and A) may help in the prevention of oxidative damage that is caused by exercise (2).
Only a few studies have analyzed the dietary habits of athletes from the racket sports and most of them have been conducted on tennis athletes (9). As far as we know, this is the first study that has addressed the dietary behavior of table tennis play-ers. The inadequacies that were found were similar to those that have been observed in badminton athletes (8). These were higher than those that have been observed in the most stud-ied modalities, like endurance sports (27), together with other intermittent modalities, such as tennis (9). It should be noted that, different from table tennis, the sports cited above have been researched for more years and have detailed and practical guideline positions (28,29). This knowledge might have been transferred to athletes by health professionals and public poli-cies, thus, influencing the cultures of the sport. Therefore, the present study is relevant, as it may serve as a way of catching the attention of sports professionals and table tennis athletes to the importance of an adequate diet. Future studies should elaborate on sport-specific guidelines for this sport.
The results have shown that dietary inadequacies were found in both groups, however, the adolescents showed a high prevalence of inadequacy and lower nutrient intakes than the adults. Simi-lar results were found by Keppling et al. (30). Nutritional deficits and poor eating habits in adolescent athletes may compromise growth and contribute to the occurrence of injuries. Chiplonkar et al. (31) found that lower levels of calcium, zinc, folate and vitamin C were associated with a short stature and these lower levels may increase the risk of bone injuries. Low levels of zinc may affect a cognitive performance (32), which might influence those abilities that are decisive for achieving success in a table tennis game, such as motor control, coordination and decision making.
The adolescents also showed a worse self-perception of dietary quality than did the adults. This result might be related to the lower levels of nutritional knowledge found in this group. Studies reporting on the influence of age on nutritional knowledge have consistently found that younger participants score lower than mid-dle-aged individuals, possibly by the lack of interest in nutrition (adolescents consider nutritional knowledge less relevant) and differences in the participant’s levels of education (33). Levels of education have been associated with superior performances on other nutritional knowledge instruments and this has been more than likely supported by the capacity to use written material, in order to gain nutritional knowledge and then to implement favor-able lifestyle behaviors (34).
Table II. Self-perception of dietary quality and nutrition information sources
of adult and adolescent table tennis players (n = 42)
VariablesAdolescents
(n = 25)n (%)
Adults (n = 17)n (%)
Self-perception of dietary quality Excellent/Good Poor/Very poor
23 (92)*2 (8)
11 (64)6 (35)*
Reasons for not eating healthier†
Lack of time Habit Lack of interest in healthy food
01 (4)2 (8)
2 (11.8)5 (29.4)*3 (17.6)
Nutrition information sources Television Internet Parents Dietitian Athletic trainer Physician Do not seek information
3 (12)5 (20)
11 (44)2 (8)2 (8)2 (8)
7 (28)
6 (35.3)7 (41.2)3 (17.6)1 (5.9)1 (5.9)
4 (23.5)1 (5.9)
*p < 0.05. †Responded only by those that rated their own diet quality as poor/very poor. The other categories were not presented due to the lack of responses.
Table III. Mean (standard deviation) of the nutrition knowledge of adult and
adolescent table tennis players (n = 42)
Nutrition knowledgecategories
Adolescents (n = 25)
Mean (SD)
Adults (n = 17)
Mean (SD)
Total 55 (12) 66.7 (10)*
Basic nutrition 82.5 (23) 97 (9.4)*
Food pyramid 14 (8) 17.6 (10)
Sports nutrition 63.2 (20) 79.4 (21)*
*p < 0.05 by independent t-test.

1129
[Nutr Hosp 2018;35(5):1124-1130]
POOR DIETARY INTAKE AND LOW NUTRITIONAL KNOWLEDGE IN ADOLESCENT AND ADULT COMPETITIVE ATHLETES: A WARNING TO TABLE TENNIS PLAYERS
Nutritional knowledge is one of the few modifiable determinants of dietary behavior. Individuals with a higher nutritional knowledge are almost 25 times more likely to meet the present recommen-dations for fruit, vegetable and fat intakes, than those with a low knowledge (34) and have a healthier diet (6).
Differently from those studies involving adults, research regard-ing adolescents has found fewer, or no correlations, between nutritional knowledge and dietary practices (35,36). The scarcity of association may be due to the numerous barriers that can hinder adolescent athletes from translating nutritional knowledge into practice. The adolescents may have difficulties in achieving an appropriate intake of some nutrients, due to the increased needs that are related to growth. In addition, their search for identity, their struggle for independence and acceptance, which are character-istics of this phase, may be expressed through eating less healthy foods, or not eating as an act of parental defiance. The high vul-nerability to societal and peer pressure, often reinforced by the media, may also negatively influence their dietary practices (37).
The results of the present study have shown that the table tennis players had poor dietary habits and a low level of nutrition knowledge, thus, such nutritional interventions in this population are warranted. Nutritional education programs should specifically target gaps in the knowledge. In this way, an explanation of food pyramids would help to encourage and emphasize the importance of a healthy diet. Strong declarative knowledge, without procedural skills, may not translate to a healthier dietary intake, so specific nutritional advice about the ingestion of cereals, dairy foods, fruits and vegetables should be included. Future studies should also test the efficacy of nutritional education programs that involve trainers, parents and web-site interventions, as these are the most used nutritional information sources for athletes, and analyze the impact of these interventions on table tennis performance.
LIMITATIONS
Despite the relevance of the present study, some methodolog-ical limitations must be taken into consideration. The analysis of food intakes by using two 24-hour recall periods is a limiting fac-tor. However, it was necessary to use this particular method due to the operational difficulties in accessing the same participant more than twice. According to Magkos and Yannankolia (38), in these cases, the use of less than three 24-hour recall periods might be an alternative. Other works have also used this method (22). The low number of participants may also be a limitation since bigger samples reduce the inter-subject variability when assessing dietary intake.
CONCLUSION
The present study has shown that table tennis players have inadequate dietary habits and low levels of nutritional knowledge. They also use a low quality of nutritional information sources. When comparing the groups according to age, the adolescents
showed higher dietary inadequacies, a worse self-perception of dietary quality, as well as lower nutritional knowledge levels, than did the adults. There was only a negative moderate correlation between nutrition knowledge and sodium intake in adults.
REFERENCES
1. Kondrič M, Zagatto AM, Sekulić D. The physiological demands of table tennis: a review. J Sports Sci Med 2013;12(3):362.
2. Thomas DT, Erdman KA, Burke LM. Position of the Academy of Nutrition and Dietetics, Dietitians of Canada, and the American College of Sports Medicine: nutrition and athletic performance. J Acad Nutr Diet 2016;116(3):501-28. DOI: 10.1016/j.jand.2015.12.006
3. Desbrow B, McCormack J, Burke LM, Cox GR, Fallon K, Hislop M, et al. Sports Dietitians Australia position statement: sports nutrition for the adolescent athlete. Int J Sport Nutr Exerc Metab 2014;24(5):570-84. DOI: 10.1123/ijsnem.2014-0031
4. Spronk I, Kullen C, Burdon C, O’Connor H. Relationship between nutrition knowledge and dietary intake. Br J Nutr 2014;111(10):1713-26. DOI: 10.1017/S0007114514000087
5. Spronk I, Heaney SE, Prvan T, O’Connor HT. Relationship between general nutrition knowledge and dietary quality in elite athletes. Int J Sport Nutr Exerc Metab 2015;25(3):243-51. DOI: 10.1123/ijsnem.2014-0034
6. Heaney S, O’Connor H, Naughton G, Gifford J. Towards an understanding of the barriers to good nutrition for elite athletes. Int J Sports Sci Coach 2008;3(3):391-401.
7. Kearney J, McElhone S. Perceived barriers in trying to eat healthier - Results of a pan-EU consumer attitudinal survey. Br J Nutr 1999;81(S1):S133-S7.
8. Dos Santos DA, Dos Santos FBL, De Carvalho LMF. Perfil nutricional e inges-tão alimentar de cálcio e ferro por atletas adolescentes praticantes de bad-minton. Rev Bras Nutr Esp 2017;11(63):278-88.
9. Juzwiak CR, Amancio OM, Vitalle MS, Pinheiro MM, Szejnfeld VL. Body com-position and nutritional profile of male adolescent tennis players. J Sports Sci 2008;26(11):1209-17. DOI: 10.1080/02640410801930192
10. Lohman TG, Roche AF, Martorell R. Anthropometric standardization reference manual. Champaign, IL: Human Kinetics Books; 1988.
11. NEPA. Tabela brasileira de composição de alimentos. Campinas (SP): NEPA-Unicamp; 2011. p. 105.
12. Instituto Brasileiro de Geografia e Estatística. Pesquisa de Orçamentos Fami-liares, 2008-2009: tabelas de medidas referidas para os alimentos consu-midos no Brasil. Rio de Janeiro; 2011.
13. US Department of Agriculture ARS. USDA National Nutrient Database for Standard Reference: Release 14. USDA-ARS Washington; 2001.
14. Schofield W. Predicting basal metabolic rate, new standards and review of previous work. Hum Nutr Clin Nutr 1985;39:5-41.
15. Otten JJ, Hellwig JP, Meyers LD. Dietary reference intakes: the essential guide to nutrient requirements. National Academies Press; 2006.
16. Goldberg G, Black A, Jebb S, Cole TJ, Murgatroyd PR, Coward WA, et al. Cri-tical evaluation of energy intake data using fundamental principles of energy physiology: 1. Derivation of cut-off limits to identify under-recording. Eur J Clin Nutr 1991;45(12):569-81.
17. World Health Organization. Interim summary of conclusions and dietary recom-mendations on total fat and fatty acids. From the joint FAO/WHO expert consul-tation on fats and fatty acids in human nutrition. Geneva: WHO; 2008. pp. 10-4.
18. Williams CL, Bollella M, Wynder EL. A new recommendation for dietary fiber in childhood. Pediatrics 1995;96(5):985-8.
19. Heaney S, O’Connor H, Gifford J, Naughton G. Comparison of strategies for assessing nutritional adequacy in elite female athletes’ dietary intake. Int J Sport Nutr Exerc Metabo 2010;20(3):245-56.
20. Philippi ST, Latterza AR, Cruz ATR, Ribeiro LC. Pirâmide alimentar adaptada - Guia para escolha dos alimentos adapted food pyramid: a guide for a right food choice. Rev Nutr 1999;12(1):65-80.
21. Zinn C, Schofield G, Wall C. Evaluation of sports nutrition knowledge of New Zealand premier club rugby coaches. Int J Sport Nutr Exerc Metab 2006;16(2):214-25.
22. Nascimento M, Silva D, Ribeiro S, Nunes M, Almeida M, Mendes-Netto R. Effect of a nutritional intervention in athlete’s body composition, eating beha-viour and nutritional knowledge: a comparison between adults and adoles-cents. Nutrients 2016;8(9):535. DOI: 10.3390/nu8090535

1130 D. Argôlo et al.
[Nutr Hosp 2018;35(5):1124-1130]
23. Leite M, Machado AC, Da Silva DG, Raposo OFF, Netto RSM. Conocimiento sobre alimentación y nutrición después del desarrollo de actividades de educación ali-mentaria entre niños y adolescentes deportistas. Pensar Prát 2016;19(1).
24. Willett WC, Howe GR, Kushi LH. Adjustment for total energy intake in epide-miologic studies. Am J Clin Nutr 1997;65(4):1220S-8S.
25. Woodley A. Computer-based data analysis: using SPSSx in the social and behavioral sciences: David Rowland, Daniel Arkkelin and Larry Crisler. Chi-cago: Nelson-Hall; 1991. p. 213. ISBN 0-8304-1181-X. Pergamon; 1992.
26. Baker LB, Rollo I, Stein KW, Jeukendrup AE. Acute effects of carbohy-drate supplementation on intermittent sports performance. Nutrients 2015;7(7):5733-63. DOI: 10.3390/nu7075249
27. Beis LY, Willkomm L, Ross R, Bekele Z, Wolde B, Fudge B, et al. Food and macronutrient intake of elite Ethiopian distance runners. J Int Soc Sports Nutr 2011;8(1):7. DOI: 10.1186/1550-2783-8-7
28. Ranchordas MK, Rogersion D, Ruddock A, Killer SC, Winter EM. Nutrition for tennis: practical recommendations. J Sports Sci Med 2013;12(2):211.
29. Jeukendrup AE. Nutrition for endurance sports: marathon, triathlon, and road cycling. J Sports Sci 2011;29(Suppl 1):S91-S9. DOI: 10.1080/02640414.2011.610348
30. Klepping J, Fuchs F, Boggio V, Moreau D, Guilland T, Penaranda T, et al. Évaluation des apports vitaminique et minéral chez des sportifs adolescents et adultes. Sci Sports 1988;3(2):157-72.
31. Chiplonkar S, Khadilkar A, Pandit-Agrawal D, Kawade R, Kadam N, Ekbote V, et al. Influence of micronutrient status and socioeconomic gradient on growth indices of 2–18-year-old Indian girls. J Pediatr Endocrinol Metab 2013;26(9-10):825-32. DOI: 10.1515/jpem-2013-0106
32. Kawade R. Zinc status and its association with the health of adolescents: a review of studies in India. Glob Health Action 2012;5(1):7353. DOI: 10.3402/gha.v5i0.7353
33. Spendlove JK, Heaney SE, Gifford JA, Prvan T, Denyer GS, O’Connor HT. Evaluation of general nutrition knowledge in elite Australian athletes. Br J Nutr 2012;107(12):1871-80. DOI: 10.1017/S0007114511005125
34. Wardle J, Parmenter K, Waller J. Nutrition knowledge and food intake. Appe-tite 2000;34(3):269-75.
35. Perron M, Endres J. Knowledge, attitudes, and dietary practices of female athletes. J Am Diet Assoc 1985;85(5):573-6.
36. Rash CL, Malinauskas BM, Duffrin MW, Barber-Heidal K, Overton RF. Nutri-tion-related knowledge, attitude, and dietary intake of college track athletes. Sport J 2008;11(1):48-55.
37. Jenkins S, Horner SD. Barriers that influence eating behaviors in adolescents. J Pediatr Nurs 2005;20(4):258-67.
38. Magkos F, Yannakoulia M. Methodology of dietary assessment in athletes: concepts and pitfalls. Curr Opin Clin Nutr Metab Care 2003;6(5):539-49.

NutriciónHospitalaria
Trabajo Original Valoración nutricional
ISSN (electrónico): 1699-5198 - ISSN (papel): 0212-1611 - CODEN NUHOEQ S.V.R. 318
Correspondence: Belén Barajas-Iglesias. Hospital Clínico Universitario Lozano Blesa. Av. San Juan Bosco, 15. 50009 Zaragoza, Spaine-mail: [email protected]
Barajas-Iglesias B, Jáuregui-Lobera I, Laporta-Herrero I, Sated-Germán MA. The influence of the aesthetic body shape model on adolescents with eating disorders. Nutr Hosp 2018;35(5):1131-1137
DOI: http://dx.doi.org/10.20960/nh.1826
The influence of the aesthetic body shape model on adolescents with eating disordersLa influencia del modelo estético corporal en los trastornos de conducta alimentaria en la adolescencia
Belén Barajas-Iglesias1,2, Ignacio Jáuregui-Lobera3, Isabel Laporta-Herrero2 and Miguel Ángel Santed-Germán2
1Hospital Clínico Universitario Lozano Blesa. Zaragoza, Spain. 2Faculty of Psychology. National Distance Education University (UNED). Madrid, Spain. 3Section of Nutrition and Bromatology. Universidad Pablo de Olavide. Seville, Spain
Palabras clave:
Anorexia nerviosa. Bulimia nerviosa. Adolescencia. Modelo estético corporal. Insatisfacción corporal.
Resumen Introducción: la relevancia de los factores socioculturales en la etiología, el desarrollo y el tratamiento de los trastornos de la conducta alimentaria ha sido apoyada por varios estudios.
Objetivos: los objetivos del presente estudio fueron evaluar las diferencias en la influencia del modelo estético corporal en adolescentes diag-nosticadas de anorexia nerviosa (AN) y bulimia nerviosa (BN), y explorar la relación existente entre la influencia del modelo estético corporal y otras variables clínicamente relevantes, como la insatisfacción corporal, la presencia de conductas purgativas, las actitudes hacia la comida y los rasgos de personalidad.
Método: la muestra se compuso de 104 adolescentes con diagnóstico de AN y BN. Los instrumentos de evaluación utilizados fueron el Cuestion-ario de Influencias sobre el Modelo Estético Corporal (CIMEC-40), el Body Shape Questionnaire (BSQ), el Test de Actitudes Alimentarias (EAT-40) y el Inventario Clínico para Adolescentes de Millon (MACI).
Resultados: los resultados obtenidos indican que la mayoría de la muestra está influenciada por el modelo estético corporal de delgadez. En cambio, las pacientes con BN están significativamente más influenciadas por el modelo estético que las pacientes con AN, provocando en las pacientes con BN una mayor insatisfacción corporal y propiciando la aparición de síntomas bulímicos, sobre todo de tipo purgativo. Por otro lado, parecen existir rasgos de personalidad más susceptibles a la influencia de los factores socioculturales, que pueden mediar entre la influencia del modelo estético, la insatisfacción y la aparición de síntomas.
Conclusiones: a la vista de los resultados, se requiere que las medidas de intervención psicoterapéuticas se adapten a la mayor influencia de los factores socioculturales y de insatisfacción corporal en la BN durante la adolescencia.
Key words:
Anorexia nervosa. Bulimia nervosa. Adolescence. Aesthetic body shape model. Body dissatisfaction.
Abstract Introduction: the relevance of sociocultural factors with respect to etiology, development and treatment of eating disorders has been supported by many studies.
Objectives: the aims of this study were: a) to analyze the different effects of the aesthetic body shape model on adolescents with anorexia nervosa (AN) vs bulimia nervosa (BN); b) to analyze possible differences, regarding that body shape model, between patients with purging behaviors vs non purging types of patients; and c) to explore the relationship between the influence of the aesthetic body shape model and other clinically relevant variables such as body dissatisfaction, eating attitudes and personality traits.
Methods: the sample comprised 104 adolescents suffering from AN and BN. The Questionnaire of Influences on the Aesthetic Body Shape Model (CIMEC-40), the Body Shape Questionnaire (BSQ), the Eating Attitudes Test (EAT-40) and the Millon Adolescent Clinical Inventory (MACI) were applied.
Results: the aesthetic body shape model of thinness influenced 77.9% of this sample, this influence being higher in the case of BN patients. In addition, that influence was stronger in the purging-type patients than in the non-purging type. Moreover, there was a significant and positive correlation among the influence of the aesthetic body shape model, body dissatisfaction and severity of eating symptoms. Finally, there seems to exist some personality traits more vulnerable to be affected by sociocultural factors.
Conclusions: in view of these results, it is necessary that psychotherapeutic approaches take into account the influence of sociocultural factors and body dissatisfaction mainly in the case of adolescents with BN.
Received: 03/02/2018 • Accepted: 21/02/2018
©Copyright 2018 SENPE y ©Arán Ediciones S.L. Este es un artículo Open Access bajo la licencia CC BY-NC-SA (http://creativecommons.org/licenses/by-nc-sa/4.0/).

1132 B. Barajas-Iglesias et al.
[Nutr Hosp 2018;35(5):1131-1137]
INTRODUCTION
The aesthetic body shape model of thinness in our cultural con-text brings a message of thinness as synonymous of beauty and success (1). Sociocultural influences (e.g., media) are an import-ant outlet for the model of thinness. Several studies have reported a relative increase of publications about diets, weight loss, diet products and physical exercise in the last decades (2,3). Other studies show that weight and body measurements of models and celebrities have been decreasing over time (4,5). These findings suggest that currently we are immersed in a culture of thinness, the body shape model being increasingly slim. Despite media are an important transmitter of body models, they are not the unique factor involved. Several studies highlight the relevance of family and peers in the transmission of this body model of thinness (6).
Body dissatisfaction refers to the discomfort caused by the neg-ative self-evaluation of a person with respect to their own weight and body shape (7). Previous studies have reported relevant data about the relationship between the interiorization of thinness ideal and the increase of body dissatisfaction and symptoms of eating disorders (ED), mainly in adolescents (8,9). Adolescence is a period of life in which frequent concerns about physical appearance arise, so dissatisfaction and eating behavior disturbances emerge in order to compensate that dissatisfaction thus reaching a thinness ideal (10). A recent meta-analysis supports the hypothesis that media enact a thinness ideal that causes body dissatisfaction (8).
The direct relationship between interiorization of thinness ideal and disordered eating behaviors has been supported by many studies (11,12). Those studies based on interventions on the aesthetic body shape model have showed prospectively that decreasing of internalization of thinness ideal is associated to reduction of ED symptoms (13).
These findings add data about the relevance of sociocultural factors (e.g., the influence of the aesthetic body shape model) with respect to etiology, development and treatment of ED. In this regard, those factors must be taken into account when designing treatment programs in ED. Nevertheless, studies on this field have several limitations. First of all, most of those studies have been developed in general pop-ulation and the analyses have been focused on risk factors for ED regardless of the severity of symptoms. Thus, it is recommended to evaluate the influence of the aesthetic body shape model not only in risky populations but also in clinical samples. The majority of studies have been focused on how the thinness ideal influences the risk for ED but there is a shortage of research about the differences with respect to the degree of the thinness ideal interiorization comparing subtypes of ED. Bearing in mind the status of art in this field of study, in the current one we have analyzed differences between anorexia nervosa (AN) and bulimia nervosa (BN) and other variables have been included (purging behaviors, eating attitudes and personality traits). Based on clinical observations and previous research, these variables have been reported to be relevant in order to distinguish the different subtypes of ED. Specifically, following the Diagnostic and Statistical Manual of Mental Disorders (4th ed. text rev), the presence of purging behaviors is the variable to distinguish between BN purging-type and BN non-purging-type (American Psychiatric Association [APA], 2000). In the
Diagnostic and Statistical Manual of Mental Disorders (5th ed.) these purging behaviors, along with the presence of episodes of bingeing, remain relevant to establish differences between AN restrictive-type and AN purging-type (APA, 2013). Eating attitudes have been identified as important to improve the knowledge about clinical variability of ED patients (14). With regards to personality, there are several studies reporting significant differences when comparing AN and BN (15-17).
The current study aims: a) to evaluate the different effects of the aesthetic body shape model on adolescents with anorexia nervosa vs bulimia nervosa; b) to analyze possible differences, regarding that body shape model, between patients with purging behaviors vs non purging types of patients; and c) to explore the relationship between the influence of the aesthetic body shape model and other clinically relevant variables such as body dissatisfaction, eating attitudes and personality traits.
METHODS
PARTICIPANTS
A non-probabilistic-intentional sample comprised of 104 patients, aged 13-18 (M = 15.47, SD = 1.43) was studied. There were seven males (6.7%) and 97 females (93.3%). Patients received treatment in the Eating Disorders Unit-Child and Adolescent Psychi-atry (EDU-CAP) of the Hospital Clínico Universitario Lozano Blesa in Zaragoza, Spain (HCU-LB), between January 2008 and June 2012. The inclusion criteria were: a) to have a diagnostic of AN (n = 66) or BN (n = 38) following the DSM-IV-TR criteria (18); and b) to have undergone the evaluation protocol consisting of several question-naires. Regarding the exclusion criteria, they were: a) the existence of neurological disorders; b) the presence of mental retardation; and c) to suffer from ED not otherwise specified.
The sample demographic characteristics are summarized in table I. There were 66 patients with AN and 38 with BN. Within the AN group, 75.75% (n = 50) were of the restrictive-type while
Table I. Sex, age, weight and BMI by groups (n = 104)
Group
AN BN
Sex (n) Males FemalesAge (years) Mean (SD)Weight (kg) Mean (SD)BMI (kg/m²) Mean (SD)
660
15.27 (1.50)
46.34 (6.81)
17.68 (1.88)
137
15.82 (1.24)
54.09 (9.17)
20.76 (2.85)
AN: anorexia nervosa; BN: bulimia nervosa; SD: standard deviation; BMI: body mass index.

1133
[Nutr Hosp 2018;35(5):1131-1137]
THE INFLUENCE OF THE AESTHETIC BODY SHAPE MODEL ON ADOLESCENTS WITH EATING DISORDERS
24.24% (n = 16) were of the purging type. In the case of the BN group, 86.84% (n = 33) were of the purging type and 13.15% (n = 5) were of the non-purging type. Considering the differ-ent diagnostics and the clinical interview, these data show that 47.11% (n = 49) had purging behaviors (e.g., vomits, laxa-tives abuse diuretics or enemas) while 52.88% (n = 55) were non-purging types. In this case, patients showed other pathologi-cal behaviors such as compulsive physical exercise, hyperactivity, skipping meals, etc.
INSTRUMENTS
– Clinical interview to diagnose ED following the DSM-IV-TR criteria (18). It was developed by a psychiatrist and a clinical psychologist, both members of the EDU-CAP.
– Questionnaire of the Influences on the Aesthetic Body Shape Model (CIMEC-40) (19). This instrument explores the inte-riorization degree of influences promoted by social factors with respect to the thinness ideal. The CIMEC-40 comprises 40 items (with three possible responses) which evaluate five areas: discomfort related to body image, influence of adver-tisements, influence of verbal messages, influence of social models and influence of social contexts. This questionnaire was developed and validated in Spanish population and it shows adequate psychometric properties, with an internal consistency (Cronbach’s alpha) of 0.93. The cut-off point is set at 23 and higher scores indicate greater influence of social models. CIMEC-40 is considered as a valid and reliable instrument to evaluate the influence of social factors on the thinness ideal.
– Body Shape Questionnaire (BSQ) (20). This instrument was adapted by Raich et al. (1996) (21) in Spanish population. It aims to evaluate body dissatisfaction related to body self-perception. BSQ comprises 34 items with six possible responses and it explores four factors: body dissatisfaction, fear of gaining weight, feelings of law self-esteem related to appearance and desire to lose weight. BSQ has sown high reliability (Cronbach’s alpha between 0.95 and 0.97).
– Eating Attitudes Test (EAT-40) (22). It was adapted for Span-ish population by Castro, Toro and Guimerá (1991) (23). This instrument is a screening test to detect individuals at risk for ED, assessing fears of gaining weight, drive for thinness and restrictive eating patterns. It comprises 40 questions with six possible responses, which correspond to three subscales: diet and concerns about food, perceived social pressure and eating discomfort, and psychobiological disturbances. Higher scores indicate more ED symptoms. The Spanish version of the EAT-40 shows adequate psychometric properties with a Cronbach’s alpha of 0.93.
– Millon Adolescent Clinical Inventory (MACI) (Millon, 1993) (24). It was adapted for Spanish population by Aguirre (2004) (25). MACI is a self-reported questionnaire, which comprises 160 items (to answer as true/false). It was designed to be applied individually for ages ranging from 13 to 19 years.
After being adapted for Spanish population, specific scales were established by age and sex, in all cases with adequate psychometric properties. It evaluates 12 personality profiles, seven clinical syndromes and eight scales of expressed con-cerns. In the current study MACI was used to evaluate the participants’ personality profiles. In accordance with the aims of this study, we focus on the 12 personality profiles:
1. Introversive. 2A. Inhibited. 2B. Doleful. 3. Submissive. 4. Dramatizing. 5. Egotistic. 6A. Unruly. 6B. Forceful. 7. Conforming. 8A. Oppositional. 8B. Self-demeaning. 9. Borderline tendency.
PROCEDURE
The patients’ evaluation process started by means of individual diagnostic interviews and was completed with a protocol including the following questionnaires: CIMEC-40, BSQ, EAT-40 and MACI. This is an ex post facto study which included patients who sought treatment in the EDU-CAP of Hospital Clínico Universitario Lozano Blesa (Zaragoza, Spain) between January 2008 and June 2012. Patients met the above mentioned inclusion criteria. Access to patients’ clinical data aimed the objective of this research exclu-sively and it was done after obtaining the patients’ and parents’ informed consent. During data collection, any data which could have identified patients were removed, thus ensuring the ano-nymity and confidentiality of those patients who were included in the database.
RESULTS
GENERAL DESCRIPTION OF THE RESULTS OBTAINED REGARDING CIMEC
First of all, a descriptive and exploratory analysis of the scores on CIMEC was performed. Those scores were classified based on the cut-off point (≥ 23) established by the authors of the instrument (19). This cut-off point permits to explore differences between indi-viduals influenced by the aesthetic body shape model and those who are not influenced by that model. The frequencies of patients influenced were analyzed establishing different sample subgroups. In order to make those subgroups, initially patients were classified as AN patients or BN patients based on the diagnostic. Secondly, patients were classified as purging-type patients (including AN and BN purging types) and non-purging type patients (AN restrictive type and BN non-purging type). Overall, 77.9% of participants were

1134 B. Barajas-Iglesias et al.
[Nutr Hosp 2018;35(5):1131-1137]
influenced by the aesthetic body shape model (scores on CIMEC-40 ≥ 23) while 22.1% were not (scores on CIMEC-40 < 23). Figure 1 shows the percentage of patients influenced by the aesthetic model and those not influenced considering the diagnostics of AN and BN. In case of AN, these percentages were 68.18% and 31.82%, respectively. With regard to BN, the percentages were 94.74% and 5.25%, respectively. A significant association was found between the influence of the aesthetic body shape model and the diagnostic of AN or BN (X² [1] = 9.873, p < 0.05).
Figure 2 shows the frequency of patients influenced by the aesthetic model considering the presence of purging behaviors. In case of patients with purging behaviors, 95.91% are influenced by the aesthetic model while in non-purging patients the percent-age was 61.82%. A significant association was found between the influence of the aesthetic model and to have (or not) purging behaviors (X² [1] = 17.494, p < 0.05).
These results show that the thinness aesthetic model influence is more relevant in BN than in AN. In addition, the presence of purging behaviors (regardless of the diagnostic) increases the percentage of patients influenced by the aesthetic model.
COMPARISON BETWEEN AN AND BN PATIENTS WITH REGARDS TO CIMEC-40 SCORES
After ensuring that variables fitted a normal distribution and they were independent, the parametric t-test for independent variables based on the Welch’s equation was applied. Equality of variances was not assumed due to the result of the homosce-dasticity Levene test (W
(1,102) = 7.225, p < 0.05), which showed
that variances of the two diagnostic subgroups were no equal. As a result of the t-test, BN patients seem to be more influ-enced by the aesthetic model than AN patients (t
(1, 95.284) = -4.899,
p < 0.001). The Cohen’s d was 0.9583, which indicates a large effect size (26). The mean scores on the CIMEC-40 were 33.45 and 48.76 for AN and BN, respectively. In addition to the signif-icant difference between the two subgroups, it must be noted that both AN and BN patients scored above the cut-off point of 23. Table II shows the results obtained by means of the t-test. To summarize, there is a significant difference between AN and BN regarding the CIMEC scores, the greatest influence by the aesthetic model showed by BN patients.
Figure 1.
Influence of the aesthetic body shape model (CIMEC-40) on patients with AN and BN (%) (AN: anorexia nervosa; BN: bulimia nervosa).
Figure 2.
Influence of the aesthetic body shape model (CIMEC-40) in purging type patients vs non-purging type patients (%).
Table II. Differences between AN and BN with respect to the aesthetic body shape model (CIMEC-40)
t-test
n Mean SD df t p
CIMEC-40
AN 66 33.45 18.12
95.284 -4.899 0.000BN 38 48.76 13.49
Total 104 39.05 18.09
SD: standard deviation; df: degrees of freedom.

1135
[Nutr Hosp 2018;35(5):1131-1137]
THE INFLUENCE OF THE AESTHETIC BODY SHAPE MODEL ON ADOLESCENTS WITH EATING DISORDERS
COMPARISON BETWEEN PURGING AND NON-PURGING TYPE PATIENTS WITH REGARDS TO CIMEC SCORES
Again, after ensuring that variables fitted a normal distribution and they were independent, the parametric t-test for independent vari-ables based on the Welch’s equation was applied. Equality of varianc-es was not assumed due to the result of the homoscedasticity Levene test (W
(1,102) = 9.822, p < 0.05), which showed that variances of the
two subgroups were no equal. As a result of the t-test, significant dif-ferences between the two subgroups (purging vs non-purging) were found (t
(1, 97.277) = 5.406, p < 0.001) (Table III). In this case, the Cohen’s
d was 1.05, which indicates a large effect size (26). In sum, adoles-cents with ED purging types are more influenced by the aesthetic body shape model than those with ED non-purging types. While the mean score on CIMEC obtained by the purging subgroup was 47.92, it was 31.15 in the case of the non-purging subgroup. In both purging and non-purging subgroups the mean score on CIMEC-40 was higher than the above mentioned cut-off point.
CORRELATIONS AMONG CIMEC-40, BSQ, EAT-40 AND MACI
The Pearson’s correlation coefficient was used in order to eval-uate the relationship among the aesthetic body shape model (as assessed by CIMEC-40), body dissatisfaction (BSQ), eating atti-tudes (EAT-40) and personality profiles (MACI). Table IV sums up the results. With respect to the relationship between the influence of the aesthetic model and body dissatisfaction, a significant and positive correlation was found (r = 0.849; p < 0.001), so a greater influence of the model is related to greater body dissatisfaction.
A significant and positive correlation between the aesthetic model and eating symptoms was also found (r = 0.620; p < 0.001). Those adolescents with more interiorization of the aesthet-ic model tend to show more severe eating symptoms with more pathological eating attitudes. Finally, the possible relationship between the aesthetic model and specific personality profiles was analyzed. As a result, significant and positive correlations were found between the aesthetic model and the following personality
Table III. Differences between purging and non-purging patients with respect to the aesthetic body shape model (CIMEC-40)
t-testn Mean SD df t p
CIMEC-40
Purging 49 47.92 13.04
97.277 5.406 0.000Non purging 55 31.15 18.39
Total 104 39.05 18.09
SD: standard deviation; df: degrees of freedom.
Table IV. Correlation coefficients among CIMEC-40, BSQ, EAT-40 Y MACI
considering the whole sampleCIMEC-40
BSQ 0.849†
EAT-40 0.620†
MACI
Introversive 0.292*
Inhibited 0.303†
Doleful 0.502†
Submissive -0.053
Dramatizing -0.439†
Egotistic -0.568†
Unruly 0.035
Forceful 0.109
Conforming -0.488†
Oppositional 0.442†
Self-demeaning 0.593†
Borderline 0.392†
*p < 0.01; †p < 0.05. CIMEC-40: Questionnaire of Influence of the Aesthetic Body Shape Model; BSQ: Body Shape Questionnaire; EAT-40: Eating Attitudes Test; MACI: Millon Adolescent Clinical Inventory.
profiles: introversive (r = 0.232; p < 0.05), inhibited (r = 0.303; p < 0.01), doleful (r = 0.502; p < 0.01), oppositional (r = 4.442; p < 0.01), self-demeaning (r = 0.593; p < 0.01) and borderline (r = 0.392; p < 0.01). Other significant and negative correlations between the aesthetic model and the following personality pro-files were found: dramatizing (r = -0.439; p < 0.01), egotistic (r = -0.568; p < 0.01) and conforming (r = -0.488; p < 0.01). In case of submissive, unruly and forceful profiles, no significant correlations were found. Summing up, these results show that specific personality profiles are related to a great influence of the aesthetic model (introverted, inhibited, doleful, oppositional, self-demeaning and borderline), while other profiles (dramatizing, egotistic, and conforming) are less related to the interiorization of the aesthetic model.
DICUSSION
The objectives of this study were: a) to evaluate the differ-ent effects of the aesthetic body shape model on adolescents with anorexia nervosa vs bulimia nervosa; b) to analyze possible differences, regarding that body shape model, between patients

1136 B. Barajas-Iglesias et al.
[Nutr Hosp 2018;35(5):1131-1137]
with purging behaviors vs non purging types of patients; and c) to explore the relationship between the influence of the aesthetic body shape model and other clinically relevant variables such as body dissatisfaction, eating attitudes and personality traits. Despite lots of studies have identified a significant influence of sociocultural factors on ED symptoms, there is a shortage of research based on clinical samples aimed to evaluate the different influence of the aesthetic model on different diagnostic categories.
Analyzing the extent of the influence of the aesthetic body shape model in our sample of ED patients, the results indicate that the majority of adolescents (79.9%) are influenced by the current thin-ness ideal. These results are similar to others which have concluded that the interiorization of that aesthetic model is a relevant predictor of ED symptoms (11,12,27). In addition, our results support that the influence of the aesthetic model is a risk factor for ED (28).
With regards to the differences between AN and BN, our results show that BN patients are more influenced by the aesthetic model than AN patients. This finding is in accordance with others which state that the influence of the aesthetic model is a predictor of suffering from BN but not AN (29), and with other studies indi-cating that sociocultural pressures to be thin correlate to bulimic symptoms (30).
Regarding the differences between purging (vomits, laxatives, diuretics, etc.) and non-purging types of ED, those patients with purging behaviors appear to be more influenced by the aesthetic model when comparing with non-purging patients. These results support the idea that the aesthetic model pressure and dissatis-faction predict unhealthy behaviors to control weight such as use of laxatives or vomits (31).
Bearing in mind our objective (to explore the relationship between the influence of the aesthetic body shape model and other clinically relevant variables), we found that body dissatis-faction is related to the aesthetic body shape model positively. The influence of the aesthetic body shape model is associated to higher levels of body dissatisfaction, thus promoting eating behavior disturbances mainly as bulimic symptoms in our sample. These results seem to be in accordance with previous research which has reported that thinness ideal is a relevant predictor of body dissatisfaction and ED (32). In our case, BN patients show the highest risk of thinness ideal interiorization and body dissat-isfaction, thus leading to eating behavior disorders.
Our data support that the severity of ED symptoms (as mea-sured by EAT-40) is linked to a greater influence of the aesthetic model. This finding is similar to the results reported by Martínez, Toro y Salamero (1996), who state that a stronger presence and interiorization of thinness-related cultural influences are associ-ated with more eating symptoms.
Finally, our results support the existence of a positive correlation between the influence of the aesthetic model and the following personality profiles: inhibited, introversive, doleful, self-demean-ing, oppositional and borderline. On the contrary, the correlation is negative with respect to profiles such as dramatizing, egotistic and conforming. These results suggest that specific personality traits might predispose adolescents to be influenced by sociocultural factors, thus increasing the influence of the current aesthetic body
shape model. The Millon’s evolutionary theory considers four basic polarities to describe different personality prototypes. These four polarities are: a) survival strategies-existence (the pleasure-pain polarity); b) adaptation (the active-passive polarity); c) replica-tion (the self-other polarity); and d) processes of abstraction (the thought-feeling polarity). By means of these polarities, Millon built a classification system of personality prototypes. A personality prototype may be strong, weak or neutral with respect to the spe-cific elements of polarities (Millon and Davis, 1998). Our results indicate that those personality traits, which correlated positively with the influence of the aesthetic model (inhibited, introversive, doleful, self-demeaning, oppositional and borderline), share a lack of capacity to experience pleasure (disbalance in the plea-sure-pain polarity). More research is necessary to understand the nature of the relationship between personality and the current aesthetic model influence. Nevertheless, our data are similar to those reported in other studies indicating that some personality traits (e.g., perfectionism) are important and might predispose to ED through a higher susceptibility to sociocultural factors (33-35). There are other studies reporting that ED are not the direct result of a premorbid personality. The thinness ideal and body dissatisfaction would precede other psychological factors such as personality traits (36-38). It is necessary to extend the research on personality traits and their relationship with the aesthetic model influence not only with respect to some profiles (e.g., perfection-ism) but including others such as those mentioned in this study.
The current study has some limitations. First, the use of self-re-ported instruments increases the probability of false responses (positives or negatives). Second, a control group was not included, so it was not possible to compare our results with a non-clinical sample. Third, this is a cross-sectional study. New longitudinal studies would be necessary to explore the temporal relation among sociocultural factors, personality traits, body dissatisfac-tion and ED.
Summarizing, the influence of the aesthetic body shape model is a relevant variable in ED patients as it is shown by the results of this study. All patients are influenced by that model but more clearly in case of BN patients. This influence would cause more body dissatisfaction, thus leading to bulimic symptoms, especially purging behaviors (vomits, laxatives or diuretics). Other aspect to be taken into account refers to the fact that some personality traits seem to be more susceptible to the influence of sociocul-tural factors and the aesthetic model, which might be a media-tor between the aesthetic model influence, body dissatisfaction and ED symptoms. Previous research has reported differences between AN and BN with respect to personality (15,39,40), so further studies would be necessary to explore whether different diagnostics might influence on the degree of the aesthetic model relevance, dissatisfaction and purging symptoms.
A relevant contribution of this study refers to the thinness ideal influence and body dissatisfaction in ED and their implication in AN and BN. To sum up, intervention programs (prevention, treatment) must take into account the influence of sociocultural factors and body dissatisfaction in BN, thus adapting therapeutic programs to different diagnostics of ED in adolescents.

1137
[Nutr Hosp 2018;35(5):1131-1137]
THE INFLUENCE OF THE AESTHETIC BODY SHAPE MODEL ON ADOLESCENTS WITH EATING DISORDERS
ETHICAL APPROVAL
All procedures performed in studies involving human partici-pants were in accordance with the ethical standards of the insti-tutional and/or national research committee and with the 1964 Declaration of Helsinki and its later amendments or comparable ethical standards.
REFERENCES
1. Toro J. Riesgos y causas de la anorexia nerviosa. Barcelona: Ariel; 2004. 2. Toro J, Cervera M, Pérez P. Body shape, publicity and anorexia nervosa. Soc
Psychiatry Psychiatr Epidemiol 1988;23(2):132-6. 3. Andersen AE, Di Domenico L. Diet vs. shape content of popular male and
female magazines: a dose-response relationship to the incidence of eating disorders? Int J Eat Disord 1992;11(3):283-7.
4. Garner DM, Garfinkel PE, Schwartz D, Thompson M. Cultural expectations of thinness in women. Psychol Rep 1980;47(2):483-91.
5. Wiseman CV, Gray JJ, Mosimann JE, Ahrens AH. Cultural expectations of thinness in women: an update. Int J Eat Disord 1992;11(1):85-9.
6. Stice E, Maxfield J, Wells T. Adverse effects of social pressure to be thin on young women: an experimental investigation of the effects of “fat talk”. Int J Eat Disord 2003;34(1):108-17.
7. Glauert R, Rhodes G, Byrne S, Fink B, Grammer K. Body dissatisfaction and the effects of perceptual exposure on body norms and ideals. Int J Eat Disord 2009;42(5):443-52.
8. Groesz LM, Levine MP, Murnen SK. The effect of experimental presentation of thin media images on body satisfaction: a meta-analytic review. Int J Eat Disord 2002;31(1):1-16.
9. Stice E, Ng J, Shaw H. Risk factors and prodromal eating pathology. J Child Psychol Psychiatry 2010;51(4):518-25.
10. Levine M, Smolak L. Body image development in adolescence. In: Cash TF, Pruzinsky T, eds. Body Image: A Hand-book of Theory, Research and Clinical Practice. New York: Guildford Press; 2004. pp. 74-82.
11. Stice E, Agras WS. Predicting onset and cessation bulimic behaviors during adolescence: a longitudinal grouping analysis. Behav Ther 1998;29(2):257-76.
12. Stice E, Presnell K, Spangler D. Risk factors for binge eating onset in adoles-cent girls: a 2-year prospective investigation. Heal Psychol 2002;21(2):131-8.
13. Stice E, Marti CN, Rohde P, Shaw H. Testing mediators hypothesized to account for the effects of a dissonance-based eating disorder pre-vention program over longer term follow-up. J Consult Clin Psychol 2011;79(3):398-405.
14. Alvarenga MS, Koritar P, Pisciolaro F, Mancini M, Cordás TA, Scagliusi FB. Eating attitudes of anorexia nervosa, bulimia nervosa, binge eating disorder and obesity without eating disorder female patients: differences and simila-rities. Physiol Behav 2014;131:99-104.
15. Jáuregui Lobera I, Santiago Fernández MJ, Estébanez Humanes S. Trastornos de la conducta alimentaria y la personalidad. Un estudio con el MCMI-II. Aten Primaria 2009;41(4):201-6.
16. Atiye M, Miettunen J, Raevuori-Helkamaa A. A meta-analysis of temperament in eating disorders. Eur Eat Disord Rev 2015;23(2):89-99.
17. Kaye WH, Bulik CM, Thornton L, Barbarich N, Masters K. Comorbidity of anxiety disorders with anorexia and bulimia nervosa. Am J Psychiatry 2004;161(12):2215-21.
18. American Psychiatric Association (APA). Diagnostic and Statistical Manual of Mental Disorders. 4th ed. Washington: American Psychiatric Associa-tion; 2000.
19. Toro J, Salamero M, Martínez E. Assessment of sociocultural influences on the aesthetic body shape model in anorexia nervosa. Acta Psychiatr Scand 1994;89(3):147-51.
20. Cooper PJ, Taylor MJ, Cooper Z, Fairburn CG. The development and validation of the Body Shape Questionnaire. Int J Eat Disord 1987;6(4):485-94.
21. Raich RM, Mora M, Soler A, Ávila C, Clos I, Zapater L. Adaptación de un instru-mento de evaluación de la insatisfacción corporal. Clin Salud 1996;7(1):51-66.
22. Garner DM, Garfinkel PE. The Eating Attitudes Test: an index of the symptoms of anorexia nervosa. Psychol Med 1979;9(2):273-9.
23. Castro J, Toro J, Salamero M, Guimerá E. The Eating Attitudes Test: validation of the Spanish version. Evaluación Psicológica 1991;7(2):175-89.
24. Millon T. Manual of Millon Adolescent Clinical Inventory. Minneapolis: National Computer System; 1993.
25. Aguirre G. Adaptación española del MACI. Inventario clínico para adolescentes de Millon. Madrid: TEA Ediciones; 2004.
26. Cohen J. Statistical Power of Analysis for the Behavioural Sciences. San Diego: Academic Press; 1969.
27. Field AE, Camargo Jr CA, Taylor CB, Berkey CS, Roberts SB, Colditz GA. Peer, parent, and media influences on the development of weight concerns and frequent dieting among preadolescent and adolescent girls and boys. Pediatrics 2001;107(1):54-60.
28. Stice E. Risk and maintenance factors for eating pathology: a meta-analytic review. Psychol Bull 2002;128(5):825-48.
29. Franco K, De Jesús Díaz F, López-Espinoza A, Escoto MC, Camacho EJ. Variables predictoras de riesgo de trastorno del comportamiento alimentario en mujeres. Ter Psicol 2013;31:219-25.
30. Stice E, Nemeroff C, Shaw HE. Test of the dual pathway model of bulimia nervosa: evidence for dietary restraint and affect regulation mechanisms. J Soc Clin Psychol 1996;15(3):340-63.
31. Chang F-C, Lee C-M, Chen P-H, Chiu C-H, Pan Y-C, Huang T-F. Association of thin-ideal media exposure, body dissatisfaction and disordered eating beha-viors among adolescents in Taiwan. Eat Behav 2013;14(3):382-5.
32. Markham A, Thompson T, Bowling A. Determinants of body-image shame. Pers Individ Dif 2005;38(7):1529-41.
33. Keel PK, Forney KJ. Psychosocial risk factors for eating disorders. Int J Eat Disord 2013;46(5):433-9.
34. Striegel-Moore RH, Bulik CM. Risk factors for eating disorders. Am Psychol 2007;62(3):181-98.
35. Francisco R, Espinoza P, González ML, Penelo E, Mora M, Rosés R, et al. Body dissatisfaction and disordered eating among Portuguese and Spanish adoles-cents: the role of individual characteristics and internalization of sociocultural ideals. J Adolesc 2015;41:7-16.
36. McFarlane T, McCabe RE, Jarry J, Olmsted MP, Polivy J. Weight-related and shape-related self-evaluation in eating-disordered and non-eating-disordered women. Int J Eat Disord 2001;29(3):328-35.
37. Hesse-Biber S, Leavy P, Quinn CE, Zoino J. The mass marketing of disordered eating and eating disorders: the social psychology of women, thinness and culture. Womens Stud Int Forum 2006;29(2):208-24.
38. Polivy J, Herman CP, Younger JC, Erskine B. Effects of a model on eating behavior: the induction of a restrained eating style. J Pers 1979;47(1):100-17.
39. Marcos YQ, Cantero MCT, Acosta GP, Escobar CR. Trastornos de personalidad en pacientes con un trastorno del comportamiento alimentario. An Psiquiatr 2009;25(2):64-9.
40. Pérez IT, Del Río Sánchez C, Mas MB. MCMI-II borderline personality disorder in anorexia and bulimia nervosa. Psicothema 2008;20(1):138-43.

NutriciónHospitalaria
Trabajo Original Valoración nutricional
ISSN (electrónico): 1699-5198 - ISSN (papel): 0212-1611 - CODEN NUHOEQ S.V.R. 318
Correspondence: Valdete Regina Guandalini. Department of Integrated Education Health. Health Sciences Centre. Federal University of Espirito Santo. Av. Marechal Campos, 1468 – Maruipe. 29040-090 Vitoria, Espirito Santo. Brazil e-mail: [email protected]
Lima EMB, Almeida BL, Gomes HB, Bartochevis JAB, Toniato TS, Lazzarini TR, Pereira TSS, Guandalini VR. Agreement between Graz Malnutrition Screening (GMS) with subjective nutritional assessment instruments in hospitalized patients. Nutr Hosp 2018;35(5):1138-1144
DOI: http://dx.doi.org/10.20960/nh.1853
Agreement between Graz Malnutrition Screening (GMS) with subjective nutritional assessment instruments in hospitalized patientsConcordancia entre el Graz Malnutrition Screening (GMS) con instrumentos subjetivos de evaluación nutricional en pacientes hospitalizados
Emanuella Mardegani Batista Lima, Betullya Lucas Almeida, Hanna Barbosa Gomes, Janine Alexandre Borges Bartochevis, Tatiana Salgado Toniato, Thailiny Ricati Lazzarini, Taisa Sabrina Silva Pereira and Valdete Regina Guandalini
Department of Integrated Education Health. Health Sciences Centre. Federal University of Espirito Santo. Vitoria, Espirito Santo. Brazil
Palabras clave:
Evaluación nutricional. Riesgo nutricional. Pacientes hospitalizados. Adultos. Ancianos.
Resumen Introducción: el uso de herramientas de clasificación y evaluación nutricional eficaces, además de prácticas para diagnosticar el estado nutri-cional con el fin de aumentar la supervivencia del paciente, es imprescindible para una intervención nutricional temprana.
Objetivo: evaluar la concordancia del Graz Malnutrition Screening (GMS) con métodos subjetivos de evaluación nutricional en pacientes hos-pitalizados.
Metodología: estudio descriptivo transversal con adultos y ancianos de ambos sexos, evaluados hasta 48 horas después de la admisión hospitalaria. El estado nutricional de los pacientes con cáncer fue identificado mediante la Valoración Global Subjetiva Generada por el Paciente (VGS-GP®) y el de los ancianos, mediante el test Mini Nutritional Assesment (MNA®). El GMS fue aplicado en ambos grupos y se comparó su eficiencia con la VGS-GP® y el MNA-SF®. La concordancia entre los métodos fue evaluada por el test de kappa.
Resultados: de los 87 pacientes evaluados, el 64,4% presentó riesgo nutricional según el GMS, mientras que el 49,4% y el 47,1% indicaron riesgo nutricional y desnutrición de acuerdo con el MNA-SF® y la VGS-GP®, respectivamente. El GMS presentó una concordancia moderada con la VGS-GP® (p < 0,001) y el MNA-SF® (p < 0,001), con alta sensibilidad, especificidad, valor predictivo positivo y valor predictivo negativo. Se observaron correlaciones entre la puntuación del GMS con las puntuaciones de la VGS-GP (p < 0,001) y de la MNA-SF (p < 0,001).
Conclusión: el GMS fue eficaz en la detección del riesgo nutricional en pacientes hospitalizados, en comparación con las herramientas clásicas en la evaluación del estado nutricional de pacientes hospitalizados.
Key words:
Nutritional assessment. Nutritional risk. Hospitalized patients. Adult. Elderly.
Abstract Background: it is essential for an early nutritional intervention that utilizes effective and practical nutritional screening and evaluation tools to diagnose nutritional status, increasing the patient’s survival.
Objective: to evaluate the agreement of the Graz Malnutrition Screening (GMS) with subjective methods of nutritional evaluation in hospitalized patients.
Methods: descriptive cross-sectional study with adults and elderly of both sexes evaluated within 48 hours of hospital admission. Nutritional status in cancer patients was identified by the Patient-Generated Subjective Global Assessment (PG-SGA®) and in the elderly by the Mini Nutritional Assessment Short-Form (MNA-SF®). GMS was applied in both groups and its efficiency was compared with that of PG-SGA® and MNA-SF®. The agreement between the methods was evaluated by the kappa test, followed by assessment of diagnostic performance and correlation test.
Results: of the 87 patients evaluated, 64.4% (56) presented nutritional risk according to GMS, while 49.4% (43) and 47.1% (41) indicat-ed nutritional risk and malnutrition according to MNA-SF® and PG-SGA®, respectively. GMS presented moderate agreement with PG-SGA® (p < 0.001) and MNA-SF® (p < 0.001), with high sensitivity, specificity, positive predictive value, and negative predictive value. Correlations were observed between the GMS score and both the PG-SGA® (p < 0.001) and MNA-SF® scores (p < 0.001).
Conclusion: GMS was effective in detecting nutritional risk in hospitalized patients when compared to classic tools in the evaluation of nutritional status in hospitalized patients.
Received: 21/02/2018 • Accepted: 11/04/2018
©Copyright 2018 SENPE y ©Arán Ediciones S.L. Este es un artículo Open Access bajo la licencia CC BY-NC-SA (http://creativecommons.org/licenses/by-nc-sa/4.0/).

1139
[Nutr Hosp 2018;35(5):1138-1144]
AGREEMENT BETWEEN GRAZ MALNUTRITION SCREENING (GMS) WITH SUBJECTIVE NUTRITIONAL ASSESSMENT INSTRUMENTS IN HOSPITALIZED PATIENTS
INTRODUCTION
Hospital malnutrition is a global public health problem, with a prevalence ranging from 20% to 50%, depending on the evalua-tion method used, the population evaluated, as well as the char-acteristics of the place and country where the evaluation is being performed (1-3). In general, malnutrition affects mainly patients with chronic non-transmissible diseases, due to the severity of the disease and the treatment used (4).
Malnutrition is related to loss of appetite, reduction of food intake, catabolism, and malabsorption of nutrients, with diverse consequences, such as decline in functional capacity and mus-cle function, reduction of bone mass and cognitive function, and dysfunction of the immune system, with consequent worsening of the clinical and nutritional prognosis, increased length of hospital stay, and morbidity and mortality (1,4,5). Therefore, evaluating and classifying nutritional status in patients hospitalized early can lead to a significant improvement in the previously presented conditions (6,7).
The nutritional status of the hospitalized patient can be identified by different subjective methods of nutritional screening and evalu-ation already validated and widely used in the hospital setting, the Patient-Generated Subjective Global Assessment (PG-SGA®) and the Mini Nutritional Assessment Short-Form (MNA-SF®), which will be highlighted here (8,9).
PG-SGA® is a tool used in patients with cancer or other chronic catabolic conditions and presents four sections for evaluation: nutritional screening, nutritional assessment, nutritional interven-tion, and monitoring of the intervention, among which it is possible to diagnose and follow-up nutritional status with accuracy and efficacy (10).
In the reduced version, the MNA-SF® is a nutritional screening tool that is quick, validated and sensitive, with diagnostic precision when compared to complete MNA and widely used in elderly hospitalized patients (8).
Graz Malnutrition Screening (GMS) is a new nutritional screen-ing tool that is fast, easy to apply and encompasses a variety of pathologies. It was developed by researchers from a European university hospital, aiming to facilitate the classification of nutri-tional status, regardless of sex, age, and diagnosis, showing to be innovative when compared to other instruments (11).
This tool has not been validated or tested in Brazil yet, and this pilot study was based on the hypothesis that even in the original version, GMS would be able to identify the nutritional risk in the subpopulation studied. In this way, the objective was to evaluate the agreement of the GMS with subjective methods of nutritional evaluation in hospitalized patients.
MATERIALS AND METHODS
STUDY DESIGN AND SAMPLE
This is a cross-sectional descriptive study carried out at the Medical Clinic and General Surgery and Reparatory Units of a
university hospital located in Vitoria, Espirito Santo, Brazil, from March to October 2017. The participants in the study were adult cancer patients (20-59.9 years) and elderly patients (≥ 60 years) regardless of diagnosis, of both sexes and who underwent nutritional status evaluation during the first 48 hours of hospital admission. Patients who were taking precautions against aerosols or those with associated cognitive or neurological changes were not included.
The independent variables such as clinical diagnosis, sex, and age (years) were consulted in the medical records and later infor-mation on nutritional status was obtained from the application of GMS, PG-SGA®, and MNA-SF®. Anthropometric variables such as weight (kg), height (m), and calf circumference (CC) were also measured. Weight was measured using a Tanita® BC533 scale with an accuracy of 100 g. Stature was obtained by means of the portable stadiometer of the brand AlturExata®, with bilateral scale and 0.35 to 2.13 m of extension. CC was measured with an inelastic tape at the point of greatest perimeter with the individual sitting, with their leg forming a 90° angle and their feet resting on the floor (12).
The PG-SGA® has been applied only to cancer patients, adults, and the elderly. The MNA-SF® was applied only in the elderly regardless of clinical diagnosis. GMS was applied to all study participants. Thus, the PG-SGA® and GMS instruments simul-taneously evaluated 60 patients, while the MNA-SF® and GMS evaluated 63 patients.
The study was approved by the Research Ethics Committee of the Federal University of Espirito Santo under the number CAAE 27954014.0.0000.5060. All patients signed the informed con-sent term.
NUTRITION SCREENING AND EVALUATION
Graz Malnutrition Screening (GMS)
The GMS was developed to facilitate and expedite the evalua-tion of the patient’s nutritional status, regardless of age, gender, or diagnosis. It is a new screening tool whose objective is to identify whether the individual is at nutritional risk (11). This instrument is composed of five items (Fig. 1).
Mini Nutritional Assessment Short-Form (MNA-SF®)
MNA-SF® is limited to the nutritional screening process in the elderly and consists of the first part of the original version (full MNA) and contains six items of evaluation (low food intake, weight loss, psychological stress, mobility, neurological problems and CC) (8,13).
In this study, we chose to use CC measurement so that patients restricted to bed could be included. The total MNA-SF® score ranges from 0 to 14 points divided into three categories: well-nourished, ≥ 12 points; nutritional risk, between 8 and 11 points; and malnutrition, < 7 points.

1140 E. M. B. Lima et al.
[Nutr Hosp 2018;35(5):1138-1144]
Patient-Generated Subjective Global Assessment (PG-SGA®)
PG-SGA® includes aspects of the clinical history, such as weight changes, changes in food intake, presence of gastrointestinal symptoms, changes in functional capacity, physical examination, loss of subcutaneous fat and muscle mass, presence of sacral or ankle edema, and ascites. The results are expressed in three stag-es: well-nourished patients (A), patients with suspected/moderate malnutrition (B), or patients with severe malnutrition (C). All the information was filled in by the researchers, due to the charac-teristics of the study population. In addition to the categorization of nutritional status, the PG-SGA® total score was also used in this study to identify the need for intervention and the nutritional
risk of the patient. Patients were classified as having no nutritional risk (score 0-8 points) or with nutritional risk (score ≥ 9 points) (14). In this study, the Portuguese version of Brazil was translated and validated by Gonzalez et al. (15), with permission to use by PG-SGA/Pt-Global Platform (www.pt-global.org).
STATISTICAL ANALYSIS
A descriptive analysis was performed, expressed as means and standard deviations for the continuous variables and percentage for the categorical variables. The Kolmogorov-Smirnov test was used to verify the normality of the quantitative variables. Only the GMS score did not present normal distribution.
Date of birth:
Weight (kg):
Height (m):
BMI = (kg/m2):
1. Weight loss in the last three months?
Current weight: Weight 3 months ago:
Evaluation weight loss: < 5% 0 points
5-10% 1 points
> 10% 2 points
2. Body mass index (BMI):
For patients up to 65 years old, we considered:
Well-nourished (BMI > 20 kg/m2): 0 points
Nutritional risk (BMI 18-20 kg/m2): 1 points
Malnutrition (BMI < 18 kg/m2): 2 points
For patients over 65 years old, we considered:
Well-nourished (BMI > 22 kg/m2): 0 points
Nutritional risk (BMI 20-22 kg/m2): 1 points
Malnutrition (BMI < 20 kg/m2): 2 points
3. Reduction of food intake during the last months due to:
Loss of appetite: No: 0 Yes: 1 point
Chewing and swallowing problems: No: 0 Yes: 1 point
Nausea, vomiting, and diarrhea: No: 0 Yes: 1 point
4. Severity of disease:
Choose either 4A OR 4B. In 4A the presence of any of these conditions will be awarded 1 point. In 4B the presence of any of these conditions will be awarded 2 points:A. Malignant systemic disease (without chemo-/radiotherapy); preterminal renal failure (serum creatinine > 5 mg/dl); acute gastrointestinal infection; poor digestion; chronic alcohol abuse; liver cirrhosis; polypharmacy; heart failure and pulmonary insufficiency: 1 pointsB. Metastasis; sepsis; wound NPUAP stage lll + lV; malabsorption syndrome; chemotherapy; and radiotherapy (longer than 1 week): 2 points
5. Age ≥ 65 years 1 point
Each item generates a score that results in a final score, and if the final score is ≥ 3 points, it predicts that the patient is at nutritional risk (11).
Figure 1.
The Graz Malnutrition Screening (GMS) adapted from Roller et al. (11).

1141
[Nutr Hosp 2018;35(5):1138-1144]
AGREEMENT BETWEEN GRAZ MALNUTRITION SCREENING (GMS) WITH SUBJECTIVE NUTRITIONAL ASSESSMENT INSTRUMENTS IN HOSPITALIZED PATIENTS
For data analysis, the results of the MNA-SF® and PG-SGA® were grouped into two categories. For MNA-SF®, well-nourished patients had a score between 12 and 14 points and patients at nutritional risk and/or malnutrition had a score ≤ 11 points. Regarding PG-SGA®, the patients were categorized as well-nourished (A) and with suspected moderate and/or severe malnutrition/malnutrition (B + C). The differ-ence between the proportions was verified by the Fisher’s exact test and Chi-square test. The kappa coefficient was calculated to verify the agreement between the nutritional diagnosis obtained by GMS when compared to MNA-SF® and PG-SGA®. The categories proposed by Landis and Koch (16) were considered; according to the degree of agreement found: 0-0.1, without agreement; 0.11-0.40, weak agreement; 0.41-0.60, median; 0.61-0.80, moderate; and 0.81-1, excellent. The presence of correlation between the variables was ana-lyzed by the Spearman correlation. The correlation coefficients may vary from -1 to +1 and be categorized as weak (r < 0.3), moderate (r = 0.3-0.7) or strong (r > 0.7) (17). Taking the definition of MNA-SF® that evaluates elderly patients and the PG-SGA® that evaluates cancer patients, the GMS diagnostic performance measures (sensitivity, spec-ificity, positive predictive value [PPV], and negative predictive value [NPV]). The data were analyzed with the SPSS 21.0 software, and a significance level of 5% was adopted for all tests.
RESULTS
The final sample consisted of 87 patients. The mean age of the studied population was 64.2 ± 12.0 years, 58.6% were males, and 73.6% were elderly. The most frequent clinical diagnoses were cancer and hepatobiliary diseases, which corresponded to 70% and 13.8% of the patients, respectively. The nutritional risk assessed and classified by the three screening tools applied (GMS, MNA-SF® and PG-SGA®) score was present in the majority of patients evaluated. Among the PG-SGA® categories, 47.1% presented suspected malnutrition or some degree of malnutrition (Table I).
Table II shows the distribution of the GMS assessment variables according to their evaluation categories. The variables weight loss in the last three months, BMI and decrease in dietary intake in the last month were associated with the nutritional risk defined by the final score of the instrument (p < 0.001).
The agreement between GMS and PG-SGA® is described in Table III. Moderate and significant agreement was observed between the instruments (p < 0.001). The diagnostic performance measures of GMS compared to PG-SGA® showed sensitivity of 90.0%, specificity of 73.0%, PPV of 88.0%, and NPV of 77.0%.
Table IV shows the agreement between GMS and MNA-SF®. A moderate and significant agreement between both instruments was also found (p < 0.001). In the comparison with MNA-SF®, GMS presented sensitivity of 86.0%, specificity of 75.0%, PPV of 88.0%, and NPV of 71.0%.
The correlations between the GMS score with the MNA-SF® score and the PG-SGA® score were analyzed and are presented in figure 2. The GMS score was inversely correlated with the MNA-SF score (r = -0.674, p < 0.001) and directly correlated with the
PG-SGA score (r = 0.767, p < 0.001), respectively. Moderate and strong correlations were observed between both instruments.
DISCUSSION
Moderate concordances were found between GMS, MNA-SF®, and PG-SGA®, evidencing that GMS is able to predict the nutri-tional status of cancer patients and the elderly.
The high prevalence rates of nutritional risk and malnutrition found in this study, between 47.1% and 64.4%, are common-ly observed in the hospital environment, especially for cancer patients and the elderly. A retrospective study by Kaiser et al. (18) showed that the prevalence of nutritional risk and malnutrition
Table I. Characteristics of the sample studied
Age (mean ± SD) 64.2 ± 12.0
Min-Max 26-87
n (%)
Life stage
Adult 24 (27.6)
Elderly 63 (72.4)
Sex
Female 36 (41.4)
Male 51 (58.6)
Clinical diagnosis
Cancer 60 (70.0)
Hepatobiliary diseases 12 (13.8)
Gastrointestinal tract diseases 8 (9.2)
Cardiorespiratory diseases 5 (5.7)
Others 2 (2.3)
GMS
Well-nourished (< 3 points) 31 (35.6)
Nutritional risk (≥ 3 points) 56 (64.4)
MNA-SF®
Well-nourished (12-14 points) 20 (23.0)
Nutritional risk/malnutrition (≤ 11 points) 43 (49.4)
PG-SGA®
Well-nourished (A) 19 (21.8)
Suspected malnutrition/malnutrition (B + C) 41 (47.1)
Score PG-SGA
Without nutritional risk (< 8 points) 16 (26.7)
With nutritional risk (≥ 9 points) 44 (73.3)
GMS: Graz Malnutrition Screening; MNA-SF®: Mini Nutrition Assessment Short Form; PG-SGAs: Patient-Generated Subjective Global Assessment.

1142 E. M. B. Lima et al.
[Nutr Hosp 2018;35(5):1138-1144]
Table III. Agreement between Graz Malnutrition Screening (GMS) and Patient-Generated Subjective Global Assessment (PG-SGA®)
GMS*< 3 ≥ 3
kappa p valuen (%) n (%)PG-SGA®
Well-nourished (A) 14 (73.7) 5 (26.3)0.648 < 0.001
Suspected malnutrition/malnutrition (B + C) 4 (9.8) 37 (86.4)Kappa coefficient; PG-SGA®: Patient-Generated Subjective Global Assessment. *n = 60 patients with cancer independent of the age.
Table IV. Agreement between Graz Malnutrition Screening (GMS) and Mini Nutrition Assessment Short Form (MNA-SF®)
GMS*< 3 ≥ 3
kappa p valuen (%) n (%)MNA-SF®
Well-nourished 15 (75.0) 5 (25.0)0.602 < 0.001
Nutritional risk/malnutriton 6 (14.0) 37 (86.0)Kappa coefficient; MNA-SF®: Mini Nutrition Assessment Short form. *n = 60 elderly patients independent of the diagnosis.
Table II. Distribution of Graz Malnutrition Screening (GMS) evaluation variables according to their evaluation categories
Variable Without nutritional risk (< 3 points) With nutritional risk (≥ 3 points) p valuen (%) n (%)
Weight loss 3 months* < 0.001
< 5% 29 (59.2) 20 (40.8)
5-10% 2 (10.5) 17 (89.5)
> 10% - 19 (100.0)
BMI† < 0.001
Without nutritional risk 31 (50.8) 30 (49.2)
Nutritional risk - 14 (100.0)
Malnutrition - 12 (100.0)
Decreased food intake last month† < 0.001
No change 28 (77.8) 8 (22.2)
1 nutritional impact symptom 3 (13.0) 20 (87.0)
2 nutritional impact symptom - 23 (100.0)
3 nutritional impact symptom - 5 (100.0)
Severity of disease† 0.415
A 30 (37.0) 51 (63.0)
B 1 (16.7) 5 (83.3)
Age* 1.000
< 65 years 15 (36.6) 26 (63.4)
≥ 65 years 16 (34.8) 30 (65.2)BMI: body mass index. *Chi-square test; †Fisher Exact test.

1143
[Nutr Hosp 2018;35(5):1138-1144]
AGREEMENT BETWEEN GRAZ MALNUTRITION SCREENING (GMS) WITH SUBJECTIVE NUTRITIONAL ASSESSMENT INSTRUMENTS IN HOSPITALIZED PATIENTS
in hospitalized elderly patients was around 47.3% and 38.7%, respectively, according to MNA-SF® (18). Similar results were also observed in a study by Dent et al. (19), in which 39.0% of the elderly evaluated by MNA-SF® presented nutritional risk and 45.0% presented malnutrition.
The prevalence of malnutrition and nutritional risk found in this study corroborates data already available. Using the PG-SGA® and its score, 43.8% of the elderly with some degree of malnutrition (B or C) were classified according to the categories of PG-SGA® and 47.9% with nutritional risk (score ≥ 9 points) (20). Pereira et al. (21) identified 59.5% of the patients with suspected mal-nutrition or moderate and/or severe malnutrition and 97.6% with a score of ≥ 9 points. The diagnosis of suspected malnutrition or nutritional risk when discovered at the beginning of hospital admission is of paramount importance, since it can help patient care in improving the general picture and management of the disease and its symptoms, besides providing individualized early nutritional intervention (14).
The use of new methodologies and instruments that provide an early diagnosis of the nutritional status of hospitalized patients has been developed and used in order to avoid hospital malnu-trition. Thus, GMS, proposed as a new nutritional screening tool, was able to identify more than half of the patients evaluated at nutritional risk (64.4%) when compared to PG-SGA® and MNA-SF®. This result was mainly influenced by weight loss in the last three months, BMI, and decrease in food intake in the last month. These findings demonstrate the instrument’s ability to assess acute changes in nutritional status and food consumption, often characteristic of cancer patients and the elderly.
The precise identification, management, and monitoring of malnutrition are essential steps in the nutritional care process, in which patient outcomes can be improved through the use of
efficiently used resources (22). When compared to instruments translated and validated for the Brazilian population and widely applied in their respective target populations, PG-SGA® in cancer patients and MNA-SF® in the elderly, GMS presented moderate and significant agreement, in addition to high sensitivity, specifici-ty, PPV, and NPV, corroborating the results found in their validation study (11).
The present study showed a correlation between the scores of the evaluated instruments, which indicates that, according to Roller et al. (11), GMS can be applied quickly, simply, and accu-rately by different trained health professionals. There is no single nutritional screening and screening tool recommended for both groups, although some are recognized to be more widely used. When choosing an instrument for nutritional assessment and screening, one should consider some characteristics, such as target population, site, illnesses, and size of the team responsible for this evaluation.
Although GMS has not been translated and validated for the Brazilian population as a limitation, its original version presented high sensitivity and specificity when compared to PG-SGA® and MNA-SF®, proving to be a promising tool in screening for patients with nutritional risk (such as recent weight loss, altered food intake, BMI, disease severity, and age group) and the advantage of being able to be applied in the presence of several pathologies and in adults, adolescents, and the elderly (11).
Despite the small sample size, characteristic of a pilot study, and the difference in classification of the elderly population of GMS (≥ 65 years) and that used in Brazil (≥ 60 years) (23), the instrument was promising in nutritional screening in hospitalized patients. However, due to the methodological design, it is nec-essary to emphasize that the present work does not validate the scale for its application in clinical practice.
Figure 2.
Correlation of the GMS score with MNA-SF® and PG-SGA® scores (GMS: Graz Malnutrition Screening; MNA-SF®: Mini Nutrition Assessment Short form; PG-SGA®: Patient-Ge-nerated Subjective Global Assessment).

1144 E. M. B. Lima et al.
[Nutr Hosp 2018;35(5):1138-1144]
Thus, the inclusion of fast and practical nutritional screening tools, which will be used by the large majority of patients in a gen-eral hospital, should be tested and evaluated in order to accelerate and simplify the identification of nutritional risk in this population, to prevent and/or reduce the high rates of in-hospital malnutrition associated with increased hospital stay, morbidity and mortality, and reduced survival (24,25).
Thus, it is concluded that the results presented by this study show that GMS was sensitive in detecting nutritional risk in hospitalized patients when compared to other subjective nutritional assessment tools, besides being easily applicable in the hospital setting.
ACKNOWLEDGMENTS
Special thanks goes to the University Hospital Cassiano Antonio Moraes for all support and assistance throughout the research and the Health Sciences Centre/Federal University of Espirito Santo.
REFERENCES
1. Correia MITD, Perman MI, Waitzberg DL. Hospital malnutrition in Latin America: a systematic review. Clin Nutr 2016;36:1-10. DOI: 10.1016/j.clnu.2016.06.025
2. Duarte A, Marques AR, Sallet LHB, Colpo E. Nutritional risk in hospitalized patients during hospital stay. Nutr Clín Diet Hosp 2016;36:146-52.
3. Álvarez-Hernández J, Planas VM, León SM, García LMA, Celaya-Pérez S, García-Lorda P, et al. Prevalence and costs of multinutrition in hospitali-zed patients; the PREDYCES study. Nutr Hosp 2012;27(4):1049-59. DOI: 10.3305/nh.2012.27.4.5986
4. Borek P, Chmielewski M, Malgorzewicz S, Desbka Slizien A. Analysis of outco-mes of the NRS 2002 in patients hospitalized in Nephrology wards. Nutrients 2017;9(3):E287. DOI: 10.3390/nu9030287
5. Ahmed T, Haboubi N. Assessment and management of nutrition in older people and its importance to health. Clin Interv Aging 2010;5:207-16.
6. Badora EL, Tahull B, Casas VN, Sangrador EG, Méndez FC, Mesequer IH, et al. Hospital malnutrition screening at admission: malnutrition increases mortality and length of stay. Nutr Hosp 2017;34(4):907-13. DOI: 10.20960/nh.657
7. Waitzberg DL, De Aguilar-Nascimento JE, Dias MCG, Pinho N, Mou-ra R, Correia MITD. Hospital and homecare malnutrition and nutritional therapy in Brazil. Strategies for alleviating it: a position paper. Nutr Hosp 2017;34(4):969-75. DOI: 10.20960/nh.1098.
8. Kaiser MJ, Bauer JM, Ramsch C, Uter W, Guigoz Y, Cederholm T, et al. Valida-tion of the Mini Nutritional Assessment Short-Form (MNA-SF): a practical tool for identification of nutritional status. J Nutr Health Aging 2009;13:782-8.
9. Gomes NS, Maio R. Patient-Generated Subjective Global Assessment and nutritional risk indicators in oncology patients receiving chemotherapy. Rev Bras Cancerol 2015;61(3):235-42.
10. Jager-Wittenaar H, Ottery FD. Assessing nutritional status in can-cer. Curr Opin Clin Nutr Metab Care 2017;20:322-9. DOI: 10.1097/MCO.0000000000000389
11. Roller RE, Eglseer D, Eisenberger A, Wirnsberger GH. The Graz Malnutrition Screening (GMS): a new hospital screening tool for malnutrition. Br J Nutr 2015;115(4):650-7.
12. Lohman TG, Roche AF, Martorell R. Anthropometric standardization reference manual. Champaign: Human Kinetics; 1988.
13. McDougall KE, Cooper PL, Stewart AJ, Huggins CE. Can the mini nutri-tional assessment (MNA) be used as a nutrition evaluation tool for suba-cute in patients over an average length of stay? J Nutr Health Aging 2015;19(10):1032-6. DOI: 10.1007/s12603-015-0525-9
14. Bauer J, Capra S, Ferguson M. Use of the scored Patient-Generated Subjec-tive Global Assessment (PG-SGA) as a nutrition assessment tool in patients with cancer. Eur J Clin Nutr 2002;56:779-85. DOI:10.1038/sj.ejcn.1601412
15. Gonzalez MC, Borges LR, Silveira DH, Assunção MCF, Orlandi SP. Validation of a Portuguese version of patient-generated subjective global assessment. Rev Bras Nutr Clin 2010;25:102-8.
16. Landis JR, Koch GG. The measurement of observer agreement for categorical data. Biometrics 1977;33(1):159-75.
17. Willet W. Nutritional Epidemiology. 2nd ed. New York: Oxford University Press; 1998.
18. Kaiser MJ, Bauer JM, Rämsch C, Uter W, Guigoz Y, Cederholm T, et al. Fre-quency of malnutrition in older adults: a multinational perspective using the Mini Nutritional Assessment. J Am Geriatr Soc 2010;58(9):1734-8. DOI: 10.1111/j.1532-5415.2010.03016.x
19. Dent E, Chapman I, Piantadosi C, Visvanathan R. Nutritional screening tools and anthropometric measures associate with hospital discharge outco-mes in older people. Australas J Ageing 2015;34(1):E1-6. DOI: 10.1111/ajag.12130
20. Santos CA, Rosa COB, Ribeiro AQ, Ribeiro RCL. Patient-Generated Subjecti-ve Global Assessment and classic anthropometry: comparison between the methods in detection of malnutrition among elderly with cancer. Nutr Hosp 2015;31(1):384-92. DOI: 10.3305/nh.2015.31.1.7543
21. Pereira MAC, Santos CA, Brito JA, Fonseca J. Scored Patient-Generated Sub-jective Global Assessment, albumin and transferrin for nutritional assessment of gastrostomy fed head or neck cancer patients. Nutr Hosp 2014;29(2):420-6. DOI: 10.3305/nh.2014.29.2.7066
22. Lacey K, Pritchett E. Nutrition care process and model: ADA adopts road map to quality care and outcomes management. J Am Diet Assoc 2003;103(8):1061-72. DOI: 10.1053/jada.2003.50564
23. World Health Organization. Active ageing: a policy framework. A contribution of the World Health Organization to the second United Nations World Assem-bly on Aging. Madrid, Spain: WHO; 2002.
24. Valero Díaz A, Caracuel García A. Evaluation of factors affecting plate waste of inpatients in different healthcare settings. Nutr Hosp 2013;28(2):419-27. DOI: 10.3305/nh.2013.28.2.6262
25. Gheorghe C, Pascu O, Iacob R, Vadan R, Iacob S, Goldis A, et al. Nutri-tional risk screening and prevalence of malnutrition on admission to gastroenterology departments: a multicentric study. Chirurgia (Bucur) 2013;108(4):535-41.

NutriciónHospitalaria
Trabajo Original Epidemiología y dietética
ISSN (electrónico): 1699-5198 - ISSN (papel): 0212-1611 - CODEN NUHOEQ S.V.R. 318
Correspondence: Zia ud Din. Department of Human Nutrition. University of Agriculture. Peshawar, Pakistane-mail: [email protected]
Zia ud Din, Pervez L, Amir A, Abbas M, Khan I, Iqbal Z, Izbal M. Parasitic infections, malnutrition and anemia among preschool children living in rural areas of Peshawar, Pakistan. Nutr Hosp 2018;35(5):1145-1152
DOI: http://dx.doi.org/10.20960/nh.1685
Parasitic infections, malnutrition and anemia among preschool children living in rural areas of Peshawar, PakistanInfecciones parasitarias, desnutrición y anemia en niños en edad preescolar que viven en áreas rurales de Peshawar, Pakistán
Zia ud Din1, Lubna Pervez1, Arshad Amir2, Muhammad Abbas1, Imran Khan1, Zafar Iqbal3 and Mudassar Iqbal3
Departments of 1Human Nutrition and 3Agricultural Chemistry. University of Agriculture. Peshawar, Pakistan. 2Department of Health. Government of KPK. Pakistan
Palabras clave:
Infección parasitaria intestinal. Desnutrición. Anemia. Niños preescolares.
Resumen Introducción: se ha demostrado previamente que las infecciones parasitarias (IP) tienen efectos nocivos sobre el estado nutricional del huésped, particularmente entre los niños pequeños.
Objetivo: el presente estudio tuvo como objetivo estimar la gravedad del problema de desnutrición y anemia en asociación con IP en niños en edad preescolar e identificar los posibles factores de riesgo que contribuyen a estos problemas de salud.
Métodos: se seleccionaron al azar 437 parejas madre-hijo de zonas rurales de Peshawar, Pakistán. Se identificaron niños con gusanos visibles y no visibles. Se evaluó el estado nutricional de los encuestados. Se usaron cuestionarios estructurados para recopilar datos sobre parámetros relevantes y pruebas estadísticas apropiadas para analizar los datos.
Resultados: la edad promedio de los niños fue de 24 ± 10 meses. Un total de 120 (27,5%) muestras fecales de niños dieron positivo para varios parásitos. Del total, 267 (61%), 205 (47%), 109 (25%) y 140 (32%) niños eran anémicos, presentaban atrofia, desgaste y bajo peso, respectivamente. Los factores independientes relacionados con la anemia infantil incluyen la edad del niño, el tamaño de la familia, el nivel de conciencia de las madres sobre el cuidado de la salud general del niño y los IP. Los IP fueron factores de riesgo independientes para la malnutrición y el desgaste general de los niños. Los factores de riesgo independientes para los IP incluyeron un estado nutricional deficiente de las madres, bajo nivel de conciencia de las madres con respecto a la atención médica general del niño, la educación formal de los padres, el patrón pica en niños, la edad, el sistema de alcantarillado abierto en las casas y el tamaño de la familia.
Conclusión: en general, la malnutrición y la anemia fueron muy prevalentes en los niños en asociación con IP.
Key words:
Intestinal parasitic infection. Malnutrition. Anemia. Preschool children.
Abstract Introduction: it has previously been shown that parasitic infections (PI) have deleterious effects on the nutritional status of the host, particularly among young children.
Objective: the objective of this study was to estimate the severity of the problem of malnutrition and anemia in association with PI in preschool children and to identify the possible risk factors that contribute to these health problems.
Methods: four hundred and thirty-seven mother-child pairs were randomly selected from rural areas of Peshawar, Pakistan. Children with visible and invisible worms were identified. The nutritional status of the respondents was evaluated. Structured questionnaires were used to collect data on relevant parameters. Appropriate statistical tests were used to analyze the data.
Results: the average age of the children was 24 ± 10 months. A total of 120 (27.5%) fecal samples of children tested positive for several para-sites. Of the total, 267 (61%), 205 (47%), 109 (25%) and 140 (32%) children were anemic, stunted, wasted and underweight, respectively. The majority of wasted children (59% wasted versus 41% normal) and anemic (66% anemic versus 34% non-anemic) were infected with parasites (p < 0.05). Independent factors related to child anemia included child age, family size, mothers’ awareness of overall child healthcare, and PIs. PIs were independent risk factors for malnutrition and general child wasting. Sociodemographic, parental and child-related risk factors for PIs included mothers’ poor nutritional status and awareness level regarding overall child healthcare, fathers’ formal education, child’s pica habit, child’s age, open sewage system in the houses and family size.
Conclusion: in general, malnutrition and anemia were highly prevalent in children in association with PI.
Received: 20/11/2017 • Accepted: 02/06/2018
©Copyright 2018 SENPE y ©Arán Ediciones S.L. Este es un artículo Open Access bajo la licencia CC BY-NC-SA (http://creativecommons.org/licenses/by-nc-sa/4.0/).

1146 Zia ud Din et al.
[Nutr Hosp 2018;35(5):1145-1152]
INTRODUCTION
Intestinal parasitic infection (PI) is a major health problem in developing countries. Globally, two billion individuals are infected with intestinal parasites; out of these, the majority of them are children. An increasing trend in intestinal PIs has been recorded in developing countries because of low socioeconomic status, low literacy rate, poor awareness among the parents regarding PI and their mode of transmission, poor quality of drinking water, inappropriate hygiene and sanitation and hot and humid tropical climate (1,2). Parasitic infection has been linked with an increased risk for nutritional anemia, protein-energy malnutrition and growth deficits in children, loss of weight in pregnancy and intrauterine growth retardation followed by low birth weight (1,3).
Globally, worm infestation is the most common health issue among children in developing countries, particularly in those living in the rural and remote areas. However, wide ranges in the prevalence of PI among children have been reported within regions or countries and between the countries. In recent stud-ies, enormously different prevalence rates in intestinal parasites were observed in different developing countries: 60% in Rwanda (age: 5-60 months) (4), 47% in Peru (3-12 years) (5), 51.7% in Nigeria (2-5 years) (6), 26% in Venezuela (< 2 years) (7), 25-70% in Cambodia in different child age groups of children (8-10), 51% in India (< 24 months) (11), and 20-70% reported from various regions of Pakistan in different child age groups (12,13).
Children under five years of age present higher risk of mal-nutrition because of their high nutrient requirements for rapid physical and physiological growth. Multidimensional biologi-cal, environmental and behavioral factors influence childhood malnutrition (14). A number of previous studies demonstrated association between PI and different forms of malnutrition in children (4,15). Similarly, anemia, being characterized by blood hemoglobin concentration below the established cut-off level, is also a common public health problem of the developing world. The global prevalence of anemia in the preschool chil-dren is 43% (16), which contributes substantially to childhood mortality and morbidity. In Pakistan, the reported prevalence of anemia in preschoolers is between 40-70% in different areas and regions. The previous literature has shown signifi-cant association of anemia with impaired brain development and cognitive functions among children. A diverse range of risk factors including PIs likely contribute to its etiology in various age groups (1,17).
Several studies have been conducted in Pakistan to estimate the severity of the problem of PI in different age groups. Most of these studies focused on the prevalence rate of PI in the com-munity. There is no recent information about intestinal PI and its impact on nutritional status of young children in Pakistan. The present study was designed to estimate the severity of the prob-lem of malnutrition and anemia in association with PI among the young children and to identify the potential risk factors contribut-ing to these health issues.
METHODS
STUDY LOCATION AND SETTINGS
This cross-sectional study was conducted in a rural area of Peshawar, the capital city of the Khyber Pakhtunkhwa province of Pakistan. The study was conducted between March 2014 and October 2016 on preschool children (6-59 months). Peshawar has a semi-arid climate, with very hot summers and mild winters. Winter in Peshawar starts in November and ends in late March, although it sometimes extends into mid-April, while the summer months are from mid-May to mid-September or early October. The mean maximum summer temperature surpasses 40 °C (104 °F) during the hottest month, and the mean minimum temperature is 25 °C (77 °F). The mean minimum temperature during the coolest month is 4 °C (39 °F), while the maximum is 18.3 °C (64.9 °F).
SAMPLE SIZE AND PROCEDURE
A sample size of 385 children was estimated considering a prevalence of worm infestation of 50% in rural and semi-urban areas, with a precision of 5% and alpha-error of 0.05. However, the sample size was increased to 450 in order to compensate the expected 15-20% non-response rate. Peshawar has three rural health centers where households and families from the surround-ing rural areas (villages and remote countryside) get registration of their children for routine immunization and other health facilities. Children aged 6-59 months were identified and randomly select-ed from the records of the three rural health centers. Inclusion criteria were: children free from any chronic/inborn disease, and who had no acute diarrhea, constipation or dysentery. Infants > 6 months with exclusively breastfeeding were also excluded. Chil-dren’s families were approached; only one child per household was included after obtaining written informed consent from the parent/caregiver. The study was approved by the university ethical review committee.
DATA COLLECTION
Pretested questionnaires, containing both closed and open end-ed questions, were used to collect data on socioeconomic-demo-graphic status, child medical history including worm infection in the past and health characteristics, and household hygiene and sanitation status. Child’s mothers, fathers or caregivers were thor-oughly interviewed by trained graduates to gather all the required information. Standardized equipment was used to assess mater-nal and child nutritional, and child worm infestation statuses in well-established laboratories of the health centers.
A structured questionnaire was used to collect data on socio-economic-demographic status and health characteristics of the children. The questionnaire included information on household monthly income (in Pakistani rupees), family type (joint or nuclear) and size, home infrastructure (muddy or concrete), and paren-

1147
[Nutr Hosp 2018;35(5):1145-1152]
PARASITIC INFECTIONS, MALNUTRITION AND ANEMIA AMONG PRESCHOOL CHILDREN LIVING IN RURAL AREAS OF PESHAWAR, PAKISTAN
tal characteristics (such as age and formal education). Family size was defined as the total number of individuals, including the child parents, grandparents, parity, and other relatives sharing the same kitchen. Questions on child characteristics included recent medical history (such as any digestive or respiratory problems), current use of medicine, regular medication for worm infestation and pica habit. Questions were asked in the local language and all the information was recorded on the questionnaire.
A pretested questionnaire was used to assess awareness level and perception of mothers about PI, mode of parasites transmis-sion, safety and precautionary measures to control worms, child caring and nutrition, and home hygiene and sanitation. The ques-tionnaire had specific close-ended questions for each section. Mothers’ responses were indicated on a three point scale, ranging from “totally wrong”, “partially true”, and “correct”. A total score for each section was calculated and a grand score value for each respondent was obtained by adding the scores of each section. Mothers above the median of grand score were considered as having “sufficient awareness of overall child health” as compared to those below the median.
Children with both visible and invisible worms were identified by trained graduates using the recommended procedure under the supervision of project investigators. For stool collection, mothers/caretakers were properly guided regarding sample collection in dry, clean leak proof containers labelled with the name and iden-tification number of the child. Physical examination of the stool samples was done by noticing stool color, consistency, presence or absence of mucus and blood and the visibility of worms. Type of worms present in the stool was confirmed and recorded.
Recommended laboratory techniques were used to diagnose invisible worms (18). Invisible worms in fresh stool samples were diagnosed using the “direct wet mount method”, in which micro-scope slides were made from fecal specimen (about 2 mg), 1-2 drops of saline solution and a drop of Lugol’s iodine for examina-tion under low (x10) and high power (x40). The addition of a drop of Lugol’s iodine stains the cysts, making them easier to identify. Saline iodine wet mount identified parasites, protozoan tropho-zoites and cyst, helminth ova and larvae. All stool samples were then processed by formalin-ether sedimentation concentration and examined similarly under 10x and 40x magnifications to iden-tify the protozoan cysts. Pictures and atlases provided by authentic and well-established sources were used to identify parasites.
Nutritional statuses of mothers and their children were assessed. Mothers of the selected children were assessed for nutritional status by taking body weight and height without shoes and in lightweight clothing to the nearest 0.1 kg and 0.1 cm, respectively. Mothers’ body mass indexes (BMI) were calculated using their weight and height measurements. Children nutritional and anemia statuses were evaluated by measuring their body weight, length/height and blood hemoglobin level. Weight was taken to the nearest 0.1 kg by using pediatrics scale for less than two-year-old children and electronic digital scale for young-er children (3-5 years). Length board/recombinant length scale was used for measuring the length of infants and height scale was used for younger children to the nearest 0.1 cm. All of the
anthropometric measurements were taken using recommended procedures of the World Health Organization (WHO) and stan-dardized equipment.
The children anthropometric measurements were compared with the WHO 2006 growth standards to identify malnourished children. Standard deviation or Z-scores for “weight-for-age’ (WAZ), “length/height-for-age” (L/HAZ) and “weight-for- length/height” (WAL/HZ) of the children were generated using the WHO recommended Anthro software. Children with standard deviation score < -2 for WAZ, L/HAZ and WAL/HZ were identified as under-weight, stunted and wasted, respectively. However, children who had all of the WAZ, L/HAZ and WAL/HZ values below -2 were grouped together and collectively declared as undernourished.
HemoCue® was used to measure the hemoglobin concentration of children by taking 2-3 drops of blood in disposable strips used in the HemoCue® micro-cuvette (19). First, the instrument was calibrated for the accuracy of hemoglobin level. A control cuvette was applied to the instrument holder to verify the stability of the HemoCue®. The accuracy of the instrument was checked repeat-edly with the control cuvette after the analysis of 10-12 blood samples. To measure Hb levels, the middle/ring finger of the child was cleaned at the side of the fingertip by alcohol swab, and then punctured with the lancet. First, 2-3 drops were wiped away; the next large drop of blood was transferred to a micro-cuvette and placed in the HemoCue® for the results. The results appeared in approximately 15-60 seconds in g/dl and recorded. Anemia was defined as a hemoglobin < 12 g/dl.
STATISTICAL ANALYSIS
Data were entered and analyzed using the statistical pack-age SPSS version 20 (SPSS, Inc., Chicago, IL, USA). Data was first checked for entry errors and distribution using appropriate descriptive tests such as frequency, mean, mode, and Kolmog-orov-Smirnov. The 95% confidence intervals (95% CI) of per-centages were calculated based on the standard error. Logistic regression tests were used to investigate the association of poten-tial social, demographic, health and nutritional variables with the status of PI among children; independent predictors of PI were identified and their associations with the outcome variable were reported as adjusted odds ratio (OR) with 95% CI. The differences were considered to be statistically significant at p < 0.05.
RESULTS
Required information for the current analysis was available on 437 (97%) mother-child pairs, including data on socioeconom-ic-demographic status, nutritional indicators, worm infestation among children, and hygiene and sanitation status at household levels. General characteristics of the study participants are sum-marized in table I. The mean age of the mothers and children was 27 ± 3.7 year and 24 ± 10 months, respectively; 48% (n = 210) of the study children were female. Average family size of

1148 Zia ud Din et al.
[Nutr Hosp 2018;35(5):1145-1152]
the respondents was 6 ± 1.6, with a mean monthly income (thou-sands) of PKR 18 ± 5.5. The mean monthly income of the families was closed to the 3rd quintile of the national monthly household income of Pakistani rural population (20). Most of the children were living in joint family systems, muddy homes with open sew-age system, and had illiterate or low-educated parents. However, 58% (n = 253) of mothers had some knowledge of overall child health, i.e., awareness on PI, mode of parasites transmission, safety and precautionary measures to control worms, child caring and nutrition, and home hygiene and sanitation.
Table II shows results on the respondents’ health and nutri-tional status. A total of 120 (27.5%) fecal samples were posi-
Table I. General characteristics of the study subjects (n = 437)
Characteristics Mean ± SD - n (%)
Child age (months) 24 ± 10 (6-58 months)
Child age groups 6-36 months 37-59 months
249 (57%)188 (43%)
Child sex Male Female
227 (52%)210 (48%)
Mother age 27 ± 3.7 (17-39 years)
Family income (Rs.)* 18 ± 5.5
Family type Joint Nuclear
275 (63%)162 (37%)
Family size 6 ± 1.6
Father school education (years) Illiterate < 10 years 10-14 years > 14 years
142 (32%)201 (46%)77 (18%)17 (4%)
Mother school education (years) Illiterate 5-8 years 10 years
297 (68%) 109 (25%)31 (07%)
Home construction Muddy Cemented/partially cemented
258 (59%)179 (41%)
Home sewage Open Closed
293 (67%) 144 (33%)
Mothers awareness†
Yes No
253 (58%)184 (42%)
*In thousands (Pakistani rupees [PKR], 1 USD = 105 PKR). †Awareness of PIs, mode of parasites transmission, safety and precautionary measures to control worms, child caring and nutrition, and home hygiene and sanitation
Table II. Health and nutritional status of the children
Indicatorsn (%)/mean ± SD
(range)
Worm infestation status Yes* No
120 (27.5%)317 (72.5%)
Nutritional measurements
Weight (kg)Height/length
(cm)WAZ
WL/HZL/HAZ
12.4 ± 2.5 (5.8-19.2)
93 ± 6.1 (62.5-110.3)
-1.5 ± 1.2 (-4.1-3.1)
-1.4 ± 1.5 (-4.6-2.9)
-1.7 ± 1.4 (-4.4-2.6)
Malnutrition status
StuntedWasted
UnderweightUndernourished†
205 (47%)
109 (25%)
140 (32%)
83 (19%)
Blood hemoglobin level
11.8 ± 3.1 (4.9-15.2)
Anemia status
Anemia (< 12 g/dl)
267 (61%)
Non-anemic 170 (39%)
Mother BMI 21.08 ± 3.7 (14.87-33.19)
*Infections with single or multiple parasites. †Children had WAZ, L/HAZ and WAL/HZ values < -2.
tive for various worms, including both visible (round worm, tape worm, pin worm and thread worms) and invisible worms (giardia, coccidia, whip worm and hook worm). A child being positive for single or multiple worm infestation was declared as “infected” and compared with the rest of children for different characteristics. Average WAZ, WL/HZ and L/HAZ of the children was -1.5 ± 1.2, -1.4 ± 1.5 and -1.7 ± 1.4, respectively. Of the total, 205 (47%), 109 (25%) and 140 (32%) children were stunted, wasted and underweight, respectively. Overall, 83 (19%) of the children had z-scores below -2 for all the three indicators of malnutrition and were grouped as “undernourished”. Based on the recommend-ed cut-off value for blood Hb, 267 (61%) children were found as anemic. The mean BMI of mothers was 21.08 ± 3.7 (range: 14.87-33.19); the minimum and maximum BMI values showed the presence of both underweight and overweight mothers in the study sample.
Prevalence of malnutrition (undernutrition, underweight, wast-ing and stunting) and anemia among children by PIs status was evaluated (Fig. 1). There were no statistical differences among the groups in the prevalence of “underweight” and “stunting” (p > 0.05). Most of the wasted (59% versus 41%) and anemic

1149
[Nutr Hosp 2018;35(5):1145-1152]
PARASITIC INFECTIONS, MALNUTRITION AND ANEMIA AMONG PRESCHOOL CHILDREN LIVING IN RURAL AREAS OF PESHAWAR, PAKISTAN
(66% versus 34%) children were worm infested; these differences in the percentages were statistically different (p < 0.05). Overall, 61% of the undernourished children were infected (p < 0.05).
Figure 2 displays findings on risk factors and their corresponding adjusted OR (95% CI) for PIs in children. Among parental charac-teristics, mothers’ BMI (adjusted OR: 0.56, 95% CI: 0.07-0.98) and awareness (adjusted OR: 3.00, 95% CI: 2.45-3.60) and fathers’ formal education (adjusted OR: 2.43, 95% CI: 1.09-3.10) had inde-pendent association with PIs. Similarly, among child characteristics examined, pica habit (adjusted OR: 2.23, 95% CI: 1.89-3.03) and age (adjusted OR: 2.32, 95% CI: 1.70-3.21) were associated with PIs. Children living in the houses with open sewage system were 1.76 time more at risk for worm infestation as compared to those living with closed sewage system (adjusted OR: 1.76, 95% CI: 1.06-2.61). Among sociodemographic characteristics, only family size had association with PIs (adjusted OR: 2.02, 95% CI: 1.61-2.71).
DISCUSSION
Epidemiological studies on the prevalence of acute and chronic health problems and predisposing risk factors are essential to design appropriate intervention strategies, particularly for the vul-nerable population of young children. The current study was aimed to assess the status of malnutrition and anemia in association with PI among the young children and to identify the potential risk fac-tors for PI in the study area. Parasitic infection has been reported
among the major contributing factors for child malnutrition and anemia in the developing world, leading to growth retardation and other adverse health consequences. Findings of the current study revealed the prevalence of malnutrition and anemia in association with worm infestation in a significant number of the study children. Other risk factors associated with anemia and malnutrition were age, family size, family income, mothers’ BMI and awareness level, fathers’ education and child recent medical history.
Our data found associations of malnutrition (based on anthro-pometric measurements) with PI; infected children were more likely to be wasted in comparison to the rest. There are discrep-ancies in the available literature on the association between the anthropometric indices and PI as some studies had positive results (21,22) whereas others reported no relationship (12,23,24). Our findings demonstrated an association between the prevalence of malnutrition and worm infestation among the study children. The overall prevalence of anemia in the current study was 61%, which is closed to the 2011 national prevalence report for the country for children under five years of age (25). Our study con-firmed the association between worm infestation and the risk of anemia in the subjects as well. Children infected with intestinal parasites were more anemic than those who were not infected, which shows a similar association as the one previously reported in different developing countries (26,27). Parasitic infections are closely related to anemia and malnutrition. Most of the parasites, such as hookworm infections, cause mucosal damage resulting in endogenous losses of iron and other trace micronutrients. Par-
Figure 1.
Malnutrition and anemia in children by parasitic infection status. Note: percent values in bold are statistically different between the groups (p < 0.05). *Children had WAZ, L/HAZ and WAL/H < -2.

1150 Zia ud Din et al.
[Nutr Hosp 2018;35(5):1145-1152]
asitic infections resulting in bleeding (e.g., hookworm infection) are known to be predictors for iron deficiency anemia (28,29). Results of the current study suggest that infected children might have parasites-related comorbidities such as anorexia, nausea and vomiting, reductions in digestion and absorption, increased metabolic requirements, and enhanced nutrient losses that could lead to adverse health consequences (30-32).
Previous studies from different developing countries have identified various socio-demographic and environmental factors associated with PI among children. The findings from multivariate logistic regression analyses in the current study showed a con-siderably higher risk of worm infestation among children having various characteristics, including mothers’ low BMI, open sewage system or poor sanitation at home, pica habit, child age, family size, fathers’ illiteracy and mothers’ poor awareness level. The association between mothers’ nutritional status as manifested by BMI and PI could be explained by the fact that malnourished and unhealthy mothers might not be able to properly maintain the household hygiene status and look after their children. Pre-vious literature supported the relationship between maternal and child health and nutrition statues (33-35). Most mothers in the current study were not educated formally, but showed somehow awareness of PI and related health knowledge. A negative asso-ciation between maternal awareness level and the odds of PI in the children was evident. Mothers’ awareness level played a significant role in lowering the likelihood of PI among children. Awareness, particularly about the mode of parasitic transmis-sion, could enable the mothers or caregivers to modify the child’s
life style and living environment. Paternal formal education was significantly associated with the absence of PI among children. Education levels, particularly regarding decision-making partners such as fathers in the study area, might have a direct impact on children’s health because it increases the ability to acquire and process information. Overall education helps parents to make bet-ter health investments for themselves and their children and may result in better parenting in general (36).
Visible sewage and poor sanitation, child pica, and exposure to soil-transmitted parasites have been frequently reported among the leading causes for PIs among children. Child age had a signif-icant effect, probably because we studied such a wide age range (6-59 months). On average, for a unit increase in child age, the odds of having worm infestation increases by a factor of 2.32 (Fig. 2). As the children get older, exposure to soil-transmitted parasites becomes higher than that of their younger counterparts because of the increase in indoor and outdoor physical activities. The current study was conducted in rural slums where most of the constructions are either muddy or semi-cemented and most houses have open sanitation and sewage systems. This increases the risk of parasite transmission in preschool children. Hands and fingers of children might be easily contaminated with soil that contains cyst and eggs of parasitic organism, leading to intesti-nal PI. Parasitic infection had been shown to be initiated in early childhood in different previous research (32,37,38).
The present study showed that the likelihood of PI in children increased with the increase in family size. Previous studies con-ducted in different developing countries showed a similar trend (39).
Figure 2.
Maternal and child health, and sociodemographic associates of worm infestation. 1Awareness of PIs, mode of parasites transmission, safety and precautionary measures to control worms, child caring and nutrition, and home hygiene and sanitation. *p < 0.05.

1151
[Nutr Hosp 2018;35(5):1145-1152]
PARASITIC INFECTIONS, MALNUTRITION AND ANEMIA AMONG PRESCHOOL CHILDREN LIVING IN RURAL AREAS OF PESHAWAR, PAKISTAN
The possible explanation for this association might be that overcrowding and larger family sizes can easily lead to major problems, such as poor sanitation and personal hygiene, which promote the likelihood of parasitic transmission and increase the susceptibility of family members to PIs.
Our study has certain limitations. This study was of cross-sec-tional study in nature; therefore, our results only reflect one point in time in the study area which has a hot humid summer season between March and October. It was assumed that prevalence of PIs might be higher in this season as children are more exposed to dust, mud and consumption of unwashed fresh foods such as fruits. This exposure is much higher in children living in the rural slums of developing countries where most of the constructions are not cemented. The second limitation is the unavailability of dietary information for current analysis to explore its association with the subjects’ nutritional and hemoglobin status. However, this limitation was offset by adding the variable of family income in the analysis, which predicts the level of household food security. Third, the findings presented here are representative of the selected rural areas of the north western region and cannot be generalized for all of the country.
This study has certain strengths. The sample size was pretty large to represent the study area. Among the participants, gender distribution was fair, with 48 percent of females and 52 percent of males. As per the knowledge of the investiga-tors, this is the first study in the north-west region of Pakistan focusing on preschool children of rural slum areas to inves-tigate the association of anemia and malnutrition with PI. A major strength of the study is the high response rate (97%). Similarly, as planned, the stool sample testing was conducted within 2-3 hours of collection. This was possible as the facil-ities of worm infestation determination were available in the laboratories of local hospitals. Based on previous literature, potential confounders were identified and detailed data were collected to adjust their effects.
CONCLUSIONS
Our results showed that almost one third of the children had infestation of different parasites which were associated with poor health outcomes among children. Overall malnutrition and anemia were highly prevalent in children in association with PI. Parasitic infection was found to be an independent risk factor for malnutrition and anemia among preschoolers. Among the differ-ent possible risk factors evaluated in the current study, mother nutrition status as assessed by BMI, open home sewage, larger family size, child pica habit, child increasing age and mothers’ poor awareness of overall child health were strongly associated with intestinal PI.
Mothers health and awareness level play a significant role in the control of worm infestation among young children. Similarly, household hygiene and sanitation has a direct impact on over-all child health. Therefore, all relevant stakeholders should be involved to design and implement mini developmental projects for
the promotion of maternal nutrition status and awareness level, personal and environmental hygiene, household sanitation, control of PI, and drinking water quality improvement.
ACKNOWLEDGMENTS
We are grateful to all mothers and their children who partici-pated in the study.
REFERENCES
1. Zanin FH, Da Silva CA, Bonomo E, Teixeira RA, Pereira CA, Dos Santos KB, et al. Determinants of iron deficiency anemia in a cohort of children aged 6-71 months living in the Northeast of Minas Gerais, Brazil. PLoS One 2015;10(10):e0139555.
2. Tulu B, Taye S, Amsalu E. Prevalence and its associated risk factors of intesti-nal parasitic infections among Yadot primary school children of South Eastern Ethiopia: a cross-sectional study. BMC Res Notes 2014;7:848.
3. Derso A, Nibret E, Munshea A. Prevalence of intestinal parasitic infections and associated risk factors among pregnant women attending antenatal care center at Felege Hiwot Referral Hospital, northwest Ethiopia. BMC Infect Dis 2016;16(1):530.
4. Ignatius R, Gahutu JB, Klotz C, Steininger C, Shyirambere C, Lyng M, et al. High prevalence of Giardia duodenalis Assemblage B infection and association with underweight in Rwandan children. PLoS Negl Trop Dis 2012;6(6):e1677.
5. Cabada MM, Goodrich MR, Graham B, Villanueva-Meyer PG, Deichsel EL, López M, et al. Prevalence of intestinal helminths, anemia, and malnutrition in Paucartambo, Peru. Rev Panam Salud Publica 2015;37(2):69-75.
6. Tyoalumun K, Abubakar S, Christopher N. Prevalence of intestinal parasitic infections and their association with nutritional status of rural and urban pre-school children in Benue State, Nigeria. Int J MCH AIDS 2016;5(2):146-52.
7. Overeem MM, Verhagen LM, Hermans PW, Del Nogal B, Sánchez AM, Ace-vedo NM, et al. Recurrent wheezing is associated with intestinal protozoan infections in Warao Amerindian children in Venezuela: a cross-sectional sur-vey. BMC Infect Dis 2014;14:293.
8. Liao CW, Chiu KC, Chiang IC, Cheng PC, Chuang TW, Kuo JH, et al. Prevalence and risk factors for intestinal parasitic infection in schoolchildren in Battam-bang, Cambodia. Am J Trop Med Hyg 2017;96(3):583-8.
9. Moore CE, Elwin K, Phot N, Seng C, Mao S, Suy K, et al. Molecular characte-rization of cryptosporidium species and Giardia duodenalis from symptomatic Cambodian children. PLoS Negl Trop Dis 2016;10(7):e0004822.
10. Moore CE, Nget P, Saroeun M, Kuong S, Chanthou S, Kumar V, et al. Intestinal parasite infections in symptomatic children attending hospital in Siem Reap, Cambodia. PLoS One 2015;10(5):e0123719.
11. Rizvi AN, Maity P, Bursey CR. Three new species of Pharygodonidae (Nemato-da: Oxyuridea) in Laudakia tuberculata (Squamata: Agamidae) from Dehradun, Uttarakhand, India. Acta Parasitol 2017;62(2):273-89.
12. Mehraj V, Hatcher J, Akhtar S, Rafique G, Beg MA. Prevalence and factors associated with intestinal parasitic infection among children in an urban slum of Karachi. PLoS One 2008;3(11):e3680.
13. Hussain I, Qureshi NA, Afzal M, Shaheen N, Ali A, Ashraf A. Prevalence and distribution of human Plasmodium infection in Federally Administrative Tribal Areas of Pakistan. Acta Parasitol 2016;61(3):537-43.
14. Dewey KG. Reducing stunting by improving maternal, infant and young child nutrition in regions such as South Asia: evidence, challenges and opportuni-ties. Matern Child Nutr 2016;12(Suppl 1):27-38.
15. Gutiérrez-Jiménez J, Torres-Sánchez MG, Fajardo-Martínez LP, Schlie-Guz-man MA, Luna-Cazares LM, González-Esquinca AR, et al. Malnutrition and the presence of intestinal parasites in children from the poorest municipalities of Mexico. J Infect Dev Ctries 2013;7(10):741-7.
16. World Health Organization (WHO). The global prevalence of anaemia in 2011. Accessed Oct 10th 2017. Available from: http://apps.who.int/iris/bitstream/10665/177094/1/9789241564960_eng.pdf?ua=1
17. Bates I, McKew S, Sarkinfada F. Anaemia: a useful indicator of neglected disease burden and control. PLoS Med 2007;4(8):e231.
18. Garcia LS. Diagnostic medical parasitology: American Society for Microbiology Press; 2006.

1152 Zia ud Din et al.
[Nutr Hosp 2018;35(5):1145-1152]
19. Cohen AR, Seidl-Friedman J. HemoCue system for hemoglobin measu-rement. Evaluation in anemic and nonanemic children. Am J Clin Pathol 1988;90(3):302-5.
20. Government of Pakistan. Household Integrated Economic Survey (HIES). Isla-mabad - Pakistan, Statistics SD-PBo; 2012-2013.
21. Stephenson LS, Latham MC, Ottesen EA. Malnutrition and parasitic helminth infections. Parasitology 2000;121(Suppl):S23-38.
22. Crompton DW, Nesheim MC. Nutritional impact of intestinal helminthiasis during the human life cycle. Annu Rev Nutr 2002;22:35-59.
23. Pegelow K, Gross R, Pietrzik K, Lukito W, Richards AL, Fryauff DJ. Para-sitological and nutritional situation of school children in the Sukaraja district, West Java, Indonesia. Southeast Asian J Trop Med Public Health 1997;28(1):173-90.
24. Muniz PT, Ferreira MU, Ferreira CS, Conde WL, Monteiro CA. Intestinal para-sitic infections in young children in Sao Paulo, Brazil: prevalences, tempo-ral trends and associations with physical growth. Ann Trop Med Parasitol 2002;96(5):503-12.
25. Habib MA, Black K, Soofi SB, Hussain I, Bhatti Z, Bhutta ZA, et al. Prevalence and predictors of iron deficiency anemia in children under five years of age in Pakistan, a secondary analysis of National Nutrition Survey Data 2011-2012. PLoS One 2016;11(5):e0155051.
26. Bechir M, Schelling E, Hamit MA, Tanner M, Zinsstag J. Parasitic infections, anemia and malnutrition among rural settled and mobile pastoralist mothers and their children in Chad. Ecohealth 2012;9(2):122-31.
27. Sousa-Figueiredo JC, Basanez MG, Mgeni AF, Khamis IS, Rollinson D, Sto-thard JR. A parasitological survey, in rural Zanzibar, of pre-school children and their mothers for urinary schistosomiasis, soil-transmitted helminthiases and malaria, with observations on the prevalence of anaemia. Ann Trop Med Parasitol 2008;102(8):679-92.
28. Ramdath DD, Simeon D, Wong M, Grantham-McGregor S. Iron status of schoolchildren with varying intensities of Trichuris trichiura infection. Parasi-tology 1995;110(3):347-51.
29. Robertson LJ, Crompton DW, Sanjur D, Nesheim MC. Haemoglobin con-centrations and concomitant infections of hookworm and Trichuris tri-chiura in Panamanian primary schoolchildren. Trans R Soc Trop Med Hyg 1992;86(6):654-6.
30. Koski KG, Scott ME. Gastrointestinal nematodes, nutrition and immunity: breaking the negative spiral. Annu Rev Nutr 2001;21:297-321.
31. Wordemann M, Polman K, Menocal Heredia LT, Díaz RJ, Madurga AM, Núñez Fernández FA, et al. Prevalence and risk factors of intestinal parasites in Cuban children. Trop Med Int Health 2006;11(12):1813-20.
32. Harhay MO, Horton J, Olliaro PL. Epidemiology and control of human gastroin-testinal parasites in children. Expert Rev Anti Infect Ther 2010;8(2):219-34.
33. Felisbino-Mendes MS, Villamor E, Velasquez-Meléndez G. Association of maternal and child nutritional status in Brazil: a population based cross-sec-tional study. PLoS One 2014;9(1):e87486.
34. Negash C, Whiting SJ, Henry CJ, Belachew T, Hailemariam TG. Association between maternal and child nutritional status in Hula, Rural Southern Ethiopia: a cross sectional study. PLoS One 2015;10(11):e0142301.
35. Rondo PH, Rezende G, Lemos JO, Pereira JA. Maternal stress and distress and child nutritional status. Eur J Clin Nutr 2013;67(4):348-52.
36. Lindeboom M, Llena-Nozal A, Van der Klaauw B. Parental educa-tion and child health: evidence from a schooling reform. J Health Econ 2009;28(1):109-31.
37. Bethony J, Brooker S, Albonico M, Geiger SM, Loukas A, Diemert D, et al. Soil-transmitted helminth infections: ascariasis, trichuriasis, and hookworm. Lancet 2006;367(9521):1521-32.
38. Jardim-Botelho A, Brooker S, Geiger SM, Fleming F, Souza Lopes AC, Diemert DJ, et al. Age patterns in undernutrition and helminth infection in a rural area of Brazil: associations with ascariasis and hookworm. Trop Med Int Health 2008;13(4):458-67.
39. Abera A, Nibret E. Prevalence of gastrointestinal helminthic infections and associated risk factors among schoolchildren in Tilili town, northwest Ethiopia. Asian Pac J Trop Med 2014;7(7):525-30.

NutriciónHospitalaria
Trabajo Original Epidemiología y dietética
ISSN (electrónico): 1699-5198 - ISSN (papel): 0212-1611 - CODEN NUHOEQ S.V.R. 318
Correspondence: Rebecca Peixoto Paes Silva. Federal University of Pernambuco. Av. Prof. Moraes Rego, 1235. Cidade Universitária. 50670-901 Recife, Pernambuco, Brazil e-mail: [email protected]
Paes-Silva RP, Tomiya MTO, Maio R, de Castro CMMB, Arruda IKG, Diniz AS. Prevalence and factors associated with fat-soluble vitamin deficiency in adolescents. Nutr Hosp 2018;35(5):1153-1162
DOI: http://dx.doi.org/10.20960/nh.1785
Authors’ contributions: Paes-Silva RP: designed the research, analyzed the data, performed the statistical analysis and wrote the paper; Tomiya MTO: performed the statistical analysis; Maio R: designed the research; De Castro CMMB: designed the research; Arruda IKG: designed the research, conducted the research and analyzed the data; Diniz AS: designed the research, conducted the research and analyzed the data. All authors read and approved the final manuscript.
Finnancial support: National Research Council (CNPq) (process no. 473387/2010-2) and Ministry of Science and Technology (agreement IMIP/MCT, process no. 01. 0265.00/2005).
Prevalence and factors associated with fat-soluble vitamin deficiency in adolescents Prevalencia y factores asociados a la deficiencia de vitaminas liposolubles en adolescentes
Rebecca Peixoto Paes-Silva1, Marilia Tokiko Oliveira Tomiya2, Regiane Maio3, Célia Maria Machado Barbosa de Castro4, Ilma Kruze Grande de Arruda3 and Alcides da Silva Diniz3
1Nutrition. Federal University of Pernambuco. Recife, Pernambuco. Brazil. 2Children and Adolescent Health. Federal University of Pernambuco. Recife, Pernambuco. Brazil. Departments of 3Nutrition and 4Tropical Medicine. Federal University of Pernambuco. Recife, Pernambuco. Brazil
Palabras clave:
Vitaminas liposolubles. Adolescentes. Estado nutricional. Consumo alimentario. Estilo de vida.
Resumen Introducción: la deficiencia de vitaminas liposolubles puede ser un problema de salud no reconocido en niños y adolescentes.
Objetivo: estimar la prevalencia y los factores asociados a la deficiencia de las vitaminas A, D y E entre adolescentes escolares del nordeste de Brasil.
Métodos: estudio transversal con adolescentes de 12 a 19 años de ambos sexos. Se utilizó un cuestionario para la recolección de datos socioeconómicos, de estilo de vida y de consumo alimentario de los adolescentes. A continuación, se realizó la evaluación antropométrica y la recolección de sangre para el análisis de las concentraciones séricas de retinol, β-caroteno, α-tocoferol y 25-hidroxivitamina D (25[OH]D).
Resultados: la ingesta de vitaminas A (50,3%), E (94,0%) y D (99,8%), así como los niveles séricos del α-tocoferol (88,1%), β-caroteno (74,1%), 25(OH)D (50,9%) y retinol (46,6%) se presentaron en su mayoría deficientes/insuficientes. Se observó un mayor riesgo de deficiencia del α-tocoferol en las niñas (RP = 1,11), y mayor riesgo de insuficiencia de 25(OH)D en los niños (RP = 1,41), así como mayor probabilidad de insuficiencia del β-caroteno (RP = 1,14) y 25(OH)D (RP = 1,38) en el exceso de peso.
Conclusiones: los adolescentes presentaron déficit en el consumo y en los niveles séricos de las vitaminas liposolubles. El mayor riesgo de inadecuación estuvo asociado al sexo y el exceso de peso, sin embargo el comportamiento de las vitaminas liposolubles en los adolescentes necesita una mayor investigación.
Key words:
Fat-soluble vitamins. Adolescents. Nutritional status. Dietary intake. Lifestyle.
Abstract Background: fat-soluble vitamin deficiency may be a health problem not recognized in children and adolescents.
Objective: to estimate the prevalence and factors associated with the deficiency of vitamins A, D and E among adolescent students from Northeastern Brazil.
Methods: transversal study with adolescents aged 12 to 19 of both genders. A questionnaire to collect socioeconomic and lifestyle data and food intake was applied to adolescents. Then, an anthropometric evaluation and a blood sampling were performed to analyze serum concentrations of retinol, β-carotene, α-tocopherol and 25-hydroxy vitamin D (25[OH]D).
Results: the intake of vitamins A (50.3%), E (94.0%) and D (99.8%), as well as α-tocopherol (88.1%), β-carotene (74.1%), 25(OH)D (50.9%) and retinol (46.6%) serum levels were mostly deficient/insufficient. An increased risk of α-tocopherol deficiency was observed in girls (PR = 1.11) and an increased risk of 25(OH)D deficiency was observed in boys (PR = 1.41). An increased likelihood of β-carotene (PR = 1.14) and 25(OH)D (PR = 1.38) insufficiency was observed in overweight individuals.
Conclusions: the adolescents had a deficit in the intake and in serum levels of fat-soluble vitamins. The greatest risk of inadequacy was associated with gender and weight excess. However, the behavior of fat-soluble vitamins in adolescents needs further research.
Received: 17/01/2018 • Accepted: 09/04/2018
©Copyright 2018 SENPE y ©Arán Ediciones S.L. Este es un artículo Open Access bajo la licencia CC BY-NC-SA (http://creativecommons.org/licenses/by-nc-sa/4.0/).

1154 R. P. Paes-Silva et al.
[Nutr Hosp 2018;35(5):1153-1162]
INTRODUCTION
Adolescence is a nutritionally vulnerable period for many rea-sons, especially by increased needs due to growth and develop-ment, and changes in dietary patterns and behaviors related to lifestyle (1). Poor eating habits are considered as a major public health problem because of their relation to the manifestation of chronic diseases. Among children and adolescents, this problem is more serious because many erroneous food preferences are established during this period (2).
The eating habits of Brazilian adolescents have been character-ized as inadequate due to a high consumption of processed foods, rich in saturated fats, added sugar and sodium, combined with a low consumption of fruits, vegetables, beans and dairy products (3). Consequently, there are increasing evidences linking micro-nutrient deficiencies to chronic diseases such as cardiovascular disease, cancer, diabetes and osteoporosis in adulthood (4,5).
The deficiency in fat-soluble vitamins may be a health problem not recognized in children and adolescents because these pop-ulation groups are not routinely investigated (6), making the data on the status of these vitamins in adolescents scarce, especially in northeastern Brazil. Thus, this study aims to estimate the prev-alence and the factors associated with the deficiency of vitamins A, D and E among adolescent students from northeastern Brazil.
METHODOLOGY
STUDY DESIGN AND SAMPLES
Cross-sectional study involving adolescents aged 12 to 19 of both genders, from March to April 2013, in a prospective cohort study conducted in 2007-2013 with teenagers recruited random-ly by a multi-stage sampling process in public schools of Reci-fe, northeastern Brazil. Adolescents who used pharmacological vitamin A, D, E or multivitamins in the last three months were excluded.
The sample size was based on an estimated prevalence (p) of α-tocopherol deficiency of 25%, a sampling error (d) of 5.5%, a confidence level of 95% (z) and an effect of design (c) of 2.1, considering that the sample selection was made by conglomer-ates. Using the formula n = (z2 x p x q x c)/d2, corrected for a finite population, it resulted in a minimum sample of 370 individuals. To correct possible losses, a percentage of 11% (100/[100-11]) was increased, resulting in a sample with 444 adolescents. The final working sample was 411 adolescent students.
METHODS AND EVALUATION TECHNIQUES
Data collection was conducted by applying a questionnaire addressing socioeconomic variables, lifestyle and the food intake of adolescents. The interviews aiming to obtain dietary data were performed by two experts and a Nutrition graduate student at the Federal University of Pernambuco. To ensure the accuracy and
reliability of the data, all members of the research team received training and orientation on the procedures and the routine devel-opment of the study. Then, an anthropometric evaluation and a blood sampling were performed to analyze serum concentrations of retinol, β-carotene, α-tocopherol and 25-hydroxy vitamin D (25[OH]D).
SOCIOECONOMIC STATUS
The variables were obtained through interviews conducted at school and/or domicile, including questions about gender, age and socioeconomic classification. To determine the socioeconomic status (SES), the Brazilian Economic Classification Criteria, estab-lished by the Brazilian Association of Market Research Agencies (ABEP) (7), was employed. This instrument uses a point scale, obtained by adding the possession of household items and the degree of the head of household educational level, which classifies the population in the following economic classes: A1, A2, B1, B2, C1, C2, D, and E, in descending order, respectively initiated by the highest purchasing income. Thus, SES was classified accord-ing to the following scheme: high SES (classes A1, A2), middle SES (classes B1, B2), low SES (classes C1, C2) and lowest SES (classes D, E).
VARIABLES RELATED TO LIFESTYLE
The adolescents were classified according to physical activity level into little active/sedentary or sufficiently active, according to the criteria proposed by Pate et al. (8). Adolescents were classified as smokers by reporting smoking an amount equal to or higher than five cigarettes/day (9). Adolescents who declared drinking an amount of alcohol > 30 g/day for males and > 15 g/day for females were considered as positive to alcohol intake habit (10).
DIETARY VARIABLES
Dietary intake was assessed by a semi-quantitative food fre-quency questionnaire for adolescents (FFQA), developed and validated by Slater et al. (11) and adapted for the usual food consumed in the area. The dietary intake was analyzed with the software DietSys, version 4.01 (National Cancer Institute, Bethes-da, MD, USA), which uses as database the Chemical Composition Table of the United States Department of Agriculture (USDA). The results from the intake of vitamins A, D and E were compared with the values of dietary reference intakes (DRI) proposed by the Institute of Medicine (12).
ANTHROPOMETRIC VARIABLES
The anthropometric evaluation consisted in a double measure-ment of weight and height. The average resulting from the two

1155
[Nutr Hosp 2018;35(5):1153-1162]
PREVALENCE AND FACTORS ASSOCIATED WITH FAT-SOLUBLE VITAMIN DEFICIENCY IN ADOLESCENTS
measurements was used as the final result. For data consistency, the measurements that had differences of more than 100 g for weight and 0.5 cm for height were not considered. Weight and height measurements were performed according to the original technique recommended by Lohman et al. (13). The nutritional diagnosis of adolescents was defined based on body mass index (BMI) curves for age and gender according to the WHO reference data (14).
BIOCHEMICAL VARIABLES
Biochemical analyses were performed after collecting approxi-mately 10 ml of blood by venipuncture at school or domicile after a 10-12-hour fasting. The flasks were packed in Styrofoam box-es containing recyclable ice, sealed and transported for sample processing at the LAPAC laboratory of clinical analysis within a maximum of two hours. The serum was separated from erythro-cytes by centrifugation and stored in two 2 ml tubes. Immediately, one of the serum aliquots was used to analyze the concentration of 25(OH)D. Another serum aliquot (2 ml) was frozen and later sent to the Centre for Micronutrients Research (CIMICRON) of the Federal University of Paraiba (UFPB) to determine serum retinol, β-carotene and α-tocopherol concentrations.
RETINOL, β-CAROTENE AND α-TOCOPHEROL
The quantification of serum retinol, β-carotene and α-tocoph-erol levels followed the technical procedure described by Erhardt et al. (15). The cut-off points recommended by the WHO for retinol levels were used, adopting the classification: poor: < 0.35 µmol/l; low: 0.35-0.69 µmol/l; acceptable: 0.70-1.04 µmol/l; and normal: ≥ 1.05 µmol/l. Vitamin A deficiency was present when retinol levels were below 0.70 µmol/l. For α-tocopherol, the values ≥ 12 µmol/l were used as reference, while the values of β-carotene were considered appropriate in concentrations > 0.9 µmol/l.
25-HYDROXYVITAMIN D
25(OH)D levels were measured by high-performance liquid chromatography (HPLC). There is a vitamin D deficiency when the value of 25(OH)D is less than 52.5 nmol/l and insufficient when values are between 52.5 and 72.4 nmol/l.
DATA ANALYSIS
Data were double entered and verified with VALIDATE, a module of the Epi-Info™ software version 6.0 (WHO/CDC, Atlanta, GE), to verify the consistency of the typing process. The statistical analysis was performed using the Statistical Package for Social Sciences - SPSS, version 13.0 (SPSS Inc., Chicago, IL).
Continuous variables were tested for distribution normality by the Kolmogorov-Smirnov test (to evaluate the symmetry of the distribution curve of variables). Data from normally distributed variables were expressed as means and standard deviation. The variables with a non-Gaussian distribution were presented as medians and the respective interquartile intervals. In the descrip-tion of proportions, the binomial distribution was approximated to the normal distribution with a 95% confidence interval.
In the univariate analysis, the strength of association was assessed by prevalence ratios, the respective confidence intervals and the Pear-son’s Chi-square test. For the comparison among continuous data from independent samples, the t-test or its nonparametric equivalent, Mann-Whitney U test, were used. In all statistical analyses, a 5% significance level was used to reject the null hypothesis.
ETHICAL ASPECTS
The study was approved by the Ethics Committee in Research with Human Beings of the Hospital Universitário Lauro Wanderley at the Federal University of Paraiba, Brazil (registration CEP/HULW no. 723/10), guided by ethical standards for research involving human beings as determined by the resolution no. 196/96 of the National Health Council.
Adolescents and their parents were previously informed of the research objectives and the adopted methods. With their consent, the person responsible signed an informed consent form. The return of the results of evaluations was guaranteed to adolescents and their parents, in addition to the confidentiality of data. The researchers were available for any questions regarding proce-dures, risks, benefits and other questions related to the study.
RESULTS
The study included 411 adolescents. However, there were some losses in the following variables: socioeconomic status (53) and smok-ing (1), due to lack of answers; BMI/age (3), due to inconsistencies between the two measurements; vitamin A (11) and E (11) intake, due to information inconsistencies; and serum retinol (14), β-carotene (87) and α-tocopherol (11) due to biological material insufficiency.
Most adolescents studied were females (61.1%; 95% CI 56.1-65.8). They had a median age of 15 years (IQ: 14-16 years), with a minimal variation of 12 and a maximum of 19 years. According to the socioeconomic status, it was observed that a higher percent-age (41.6%; 95% CI 36.4-46.5) of the adolescents were in the socioeconomic class C. In relation to lifestyle, only 1.9% (95% CI 0.8-3.8) of the adolescents mentioned a smoking habit and 10.2% (95% CI 7.4-13.5) were alcoholic. Regarding nutritional status, it was observed that most adolescents (69.3%; 95% CI 65.1-74.2) were normal (Table I). In assessing food intake, it was observed that the fat-soluble vitamin intake among adolescents was mostly insuf-ficient. With respect to serum levels, a high percentage of retinol (76.8%), β-carotene (74.1%), α-tocopherol (88.1%) and 25(OH)D (50.9%) deficiency/insufficiency was observed.

1156 R. P. Paes-Silva et al.
[Nutr Hosp 2018;35(5):1153-1162]
Table I. Characteristics of adolescent students from Recife, northeastern Brazil, 2013Variables n % 95% CI
Gender Boys 160 38.9 34.1-43.8 Girls 251 61.1 56.1-65.8SES A + B 97 27.5 22.88-32.45 C 147 41.6 36.45-46.48 D + E 109 30.9 26.09-35.98Tabagism Yes 8 1.9 0.8-3.8 No 402 97.8 96.1-99.1Alcoholic Yes 42 10.2 7.4-13.5 No 369 89.8 86.4-92.5Physical activity Yes 259 63 58.1-67.6 No 152 37 32.3-41.8Nutritional status Low weight 9 2.2 1.0-4.1 Eutrophic 285 69.3 65.1-74.2 Overweight 71 17.3 13.8-21.4 Obesity 43 10.5 7.7-13.9Food intake Vitamin A Adequate 199 49.8 44.7-54.7 Inadequate 201 50.3 45.2-55.2Vitamin E Adequate 24 6.0 3.9-8.8 Inadequate 376 94.0 91.2-96.1Vitamin D Adequate 1 0.2 0.0-1.3 Inadequate 410 99.8 98.8-99.9Serum concentrations Retinol Adequate 92 23.2 19.1-27.6 Mild deficiency 176 44.3 39.3-49.3 Moderate deficiency 101 25.4 21.2-30.0 Severe deficiency 28 7.1 4.7-9.8β-carotene Adequate 84 25.9 21.2-31.0 Deficiency 240 74.1 68.9-78.7α-tocopherol Adequate 47 11.9 8.9-15.5 Deficiency 347 88.1 84.4-91.125(OH)D Adequate 202 49.1 44.2-54.1 Insufficient 189 46.0 41.1-50.9 Deficiency 20 4.9 2.9-7.4SES: socioeconomic status; BMI: body mass index; WC: waist circumference; CI: confidence interval; 25(OH)D: 25 hydroxyvitamin D. Criteria of socioeconomic status classification-2013: descending order (being A the household with the highest purchasing power). Adequate retinol > 0.7 µmol/l. Adequate β-caroteno: > 0.9 µmol/l. Adequate α-tocopherol > 12 µmol/l. Adequate 25(OH)D: > 72.4 nmol/l. Adequate food intake: vitamin A > 900 mcg/day; vitamin E > 15 mg/day; vitamin D > 15 mcg/day. Lost: BMI/age by inconsistences between the two measurements, food intake of vitamin A and E for inconsistencies information, serum retinol, β-carotene and α-tocopherol by biological material failure.

1157
[Nutr Hosp 2018;35(5):1153-1162]
PREVALENCE AND FACTORS ASSOCIATED WITH FAT-SOLUBLE VITAMIN DEFICIENCY IN ADOLESCENTS
There was no significant difference between the consumption of vitamins A, D, E and β-carotene and serum levels of the respective fat-soluble vitamins, as shown in table II. However, children who ingested ≥ 10.42 mg/day of vitamin E had a significant decrease in serum concentrations of retinol and an increase in 25(OH)D.
As shown in table III, males had higher concentrations of retinol (p = 0.03), α-tocopherol (p = 0.02) and 25(OH)D (p <0.001). In relation to lifestyle, a significant increase in retinol was observed in adolescents who reported smoking (p = 0.03) and higher concentrations of 25(OH)D (p = 0.02) in individuals who drank alcoholic drinks. With regard to nutritional state, concentrations of retinol and α-tocopherol were significantly higher in overweight adolescents, while the serum levels of β-carotene and 25(OH)D decreased with an increased adiposity.
When factors associated with deficiency of fat-soluble vitamins were evaluated, it was found that the accumulation of body fat represented an increased risk of β-carotene (PR = 1.14) and 25(OH)D (PR = 1.38) insufficiency, while overweight exerted an opposite effect on alpha-tocopherol (Table IV). It was also noted that gender was a risk factor for the change in blood concentra-tions of vitamins, as female adolescents had a higher risk of lower values of α-tocopherol (PR = 1.11), while boys had a higher risk of 25(OH)D (PR = 1.41) inadequacy. No significant association between retinol inadequacy and the variables studied was found.
DISCUSSION
The deficit in the consumption of micronutrients is quite fre-quent among adolescents (16). This has gained prominence after evidence demonstrated an association between the reduction in intake of some micronutrients, such as vitamins A, D and E, and an increased risk of diabetes, cardiovascular disease and cancer (17,18).
In this sense, this study found quite alarming data, since more than 90% of adolescents had a low intake of vitamins D and E, while approximately 50% had an insufficient intake of vitamin A. These data follow the literature, since Peters et al. (19) revealed an inadequate vitamin D intake of around 85% among adolescents, while Veiga et al. (20), in a national study, found that approximately 99% of individuals between ten and 18 years had an inadequate intake of vitamin E. This is similar to the results obtained by Silva et al. (21), who, evaluating the intake of vitamin E of children and adolescents, found that the vitamin intake corresponded to 12% of daily needs. There are reports of deficient intake (22), optimal intake (20) and intake above the recommended for vitamin A (21).
Reduced levels of fat-soluble vitamins in the bloodstream were also prevalent in this study, since adolescents have an inadequacy in more than 70% of the levels of β-carotene and α-tocopherol, approximately 50% of insufficiency in concentrations of 25(OH)D and 32.1% deficiency in retinol levels. Despite few reports with samples involving adolescents, the literature shows that the levels of 25(OH)D are, in fact, highly deficient (23), while retinol levels were insufficient in about 10-28% of adolescents (24,25), and the inadequacy of α-tocopherol is around 25% (26).
Tab
le II
. A
sso
cia
tio
n b
etw
een d
ieta
ry in
take a
nd
seru
m c
oncentr
atio
ns o
f fa
t-so
lub
le v
itam
ins o
f ad
ole
scent
stu
dents
, no
rtheaste
rn B
razil,
2013
Ser
um c
onc
entr
atio
ns
Ret
ino
l (m
mo
l/l)
β-ca
rote
ne (m
mo
l/l)
α-t
oco
phe
rol (m
mo
l/l)
25 h
ydro
xyvi
tam
in D
(nm
ol/
l)Fo
od
inta
ken
Ave
rag
e ±
SD
p*
nM
edia
n (Q
I)p
†n
Med
ian
(QI)
p†
nM
edia
n (Q
I)p
†
Vita
min
A
≤ 4
61.2
8 m
g97
0.85
± 0
.36
0.64
810.
8972
(0.8
968-
0.89
93)
0.31
977.
42 (5
.91-
8.52
)0.
3710
071
.16
(56.
95-8
6.87
)0.
26 ≥
2,2
49.4
4 m
g96
0.83
± 0
.36
790.
8976
(0.8
969-
0.90
01)
946.
71 (5
.05-
8.47
)10
075
.66
(61.
23-9
3.70
)β-
caro
tene
≤
602
.08
mg
960.
86 ±
0.3
60.
7777
0.89
72 (0
.896
7-0.
8993
)0.
2396
7.11
(5.5
6-8.
43)
0.63
100
71.1
6 (5
7.51
-86.
87)
0.24
≤ 2
,399
.02
mg
970.
84 ±
0.3
776
0.89
77 (0
.896
9-0.
9095
)95
6.78
(5.1
1-8.
56)
100
75.2
9 (6
1.28
-93.
70)
Vita
min
E
≤ 5
.71
mg
940.
88 ±
0.3
60.
0482
0.89
77 (0
.896
9-0.
9163
)0.
7193
6.98
(4.9
9-8.
34)
0.43
9771
.84
(56.
68-8
6.63
)0.
02 ≤
10.
42 m
g98
0.77
± 0
.34
780.
8976
(0.8
969-
0.89
94)
966.
38 (4
.68-
7.74
)10
075
.49
(63.
05-9
8.83
)Vi
tam
in D
≤
1.3
1 m
cg97
0.82
± 0
.28
0.45
800.
8976
(0.8
969-
0.90
43)
0.32
966.
78 (4
.88-
8.17
)0.
5899
70,9
5 (6
0,11
-82,
42)
0,52
≤ 3
.86
mcg
99 0
.85
± 0
.38
780.
8971
(0.8
967-
0.89
94)
976.
78 (4
.99-
8.89
)10
371
,84
(58,
34-8
8,63
)SD
: sta
ndar
d de
viatio
n; Q
I: qu
artil
e in
terv
al.*S
tude
nt’s
t-tes
t unp
aire
d. † M
ann-
Whi
tney
U te
st. F
ood
inta
ke: u
sed
com
paris
on b
etwe
en fi
rst a
nd la
st q
uarti
les.

1158 R. P. Paes-Silva et al.
[Nutr Hosp 2018;35(5):1153-1162]
Tab
le II
I. Seru
m c
oncentr
atio
ns o
f re
tino
l, β-
caro
tene, α-t
oco
phero
l and
25-h
ydro
xyv
itam
in D
acco
rdin
g t
o li
festy
le a
nd
nutr
itio
nal s
tatu
s o
f ad
ole
scent
stu
dents
fro
m R
ecife
, no
rtheaste
rn B
razil,
in 2
013
Ret
ino
l (m
mo
l/l)
α-t
oco
phe
rol (m
mo
l/l)
β-ca
rote
ne (m
mo
l/l)
25 h
ydro
xyvi
tam
in D
(nm
ol/
l)
nA
vera
ge
±
SD
p*
nM
edia
n (Q
I)p
†n
Med
ian
(QI)
p†
nM
edia
n (Q
I)p
†
Age
(year
s)
12-
15
271
0.86
± 0
.36
0.14
269
7.06
(5.1
2-8.
63)
0.31
227
0.89
74 (0
.896
8-0.
8998
)0.
6228
572
.49
(60.
21-8
7.52
)0.
29
16-
19
126
0.80
± 0
.28
125
6.71
(5.3
7-7.
90)
970.
8977
(0.8
968-
0.90
53)
126
69.7
2 (5
8.65
-87.
72)
Gend
er
Boy
s15
50.
88 ±
0.3
30.
0315
37.
11 (5
.86-
9.62
)0.
0212
20.
8973
(0.8
967-
0.90
53)
0.18
160
76.9
1 (6
2.76
-98.
13)
< 0
.001
Girl
s24
20.
81 ±
0.3
424
16.
78 (4
.86-
8.23
)20
20.
8977
(0.8
969-
0.90
05)
251
67.6
3 (5
7.67
-82.
21)
SES
A +
B95
0.83
± 0
.34
0.51
§95
6.81
(4.3
2-8.
48)
0.49
‡75
0.89
73 (0
.896
7-0.
8996
)<
0.0
01‡
9771
.37
(59.
67-9
1.83
)0.
12‡
C13
90.
84 ±
0.3
513
77.
03 (4
.99-
8.76
)11
20.
8977
(0.8
968-
0.90
22)
147
71.8
4 (6
0.11
-86.
37)
D+
E10
60.
79 ±
0.3
010
66.
94 (5
.72-
8.26
)89
0.89
74 (0
.896
8-0.
8988
)10
972
.28
(60.
67-8
6.20
)
Smok
ing
Yes
80.
98 ±
0.4
70.
038
7.59
(6.2
4-9.
29)
0.42
50.
9025
(0.8
968-
0.92
76)
0.63
890
.59
(77.
86-1
09.5
3)0.
06
No
389
0.84
± 0
.34
388
6.86
(5.1
4-8.
56)
319
0.89
75 (0
.896
8-0.
9004
)40
371
.84
(60.
11-8
7.07
)
Alco
holic
Yes
420.
83 ±
0.3
50.
8442
6.62
(5.1
1-8.
29)
0.53
350.
8974
(0.8
966-
0.90
25)
0.29
4282
.99
(65.
36-1
04.9
1)0.
02
No
355
0.84
± 0
.34
352
6.91
(5.1
7-8.
59)
289
0.89
75 (0
.896
8-0.
9008
)36
970
.95
(59.
89-8
6.75
)
Phys
ical a
ctivi
ty
Yes
253
0.84
± 0
.33
0.11
251
6.96
(5.2
6-8.
86)
0.12
206
0.89
73 (0
.896
7-0.
8998
)0.
109
259
72.4
9 (6
0.32
-89.
28)
0.31
No
144
0.83
± 0
.35
143
6.78
(4.8
8-7.
99)
118
0.89
77 (0
.896
9-0.
9016
)15
269
.39
(58.
39-8
6.81
)
BMI/A
ge
Wei
ght e
xces
s11
30.
91 ±
0.3
80.
0111
17.
44 (6
.33-
9.45
)<
0.0
0196
0.89
70 (0
.896
7-0.
8979
)0.
001
114
67.1
8 (5
7.46
-81.
39)
0.01
No
wei
ght e
xces
s28
20.
81 ±
0.3
228
16.
62 (4
.84-
8.29
)22
60.
8978
(0.8
969-
0.91
01)
294
73.5
4 (6
1.17
-89.
67)
SD: s
tand
ard
devia
tion;
QI:
quar
tile
inte
rval
; SES
: soc
ioec
onom
ic st
atus
; BM
I: bo
dy m
ass
inde
x. *S
tude
nt’s
t-tes
t unp
aire
d. † M
ann-
Whi
tney
U te
st; ‡ A
NOVA
. § Kru
skal
l-Willi
ams.
Crite
ria o
f soc
ioec
onom
ic st
atus
cla
ssifi
catio
n-20
13:
desc
endi
ng o
rder
(bei
ng A
the
hous
ehol
d wi
th th
e hi
ghes
t pur
chas
ing
powe
r).

1159
[Nutr Hosp 2018;35(5):1153-1162]
PREVALENCE AND FACTORS ASSOCIATED WITH FAT-SOLUBLE VITAMIN DEFICIENCY IN ADOLESCENTS
Tab
le IV
. Facto
rs a
sso
cia
ted
with in
ad
eq
uate
seru
m r
etino
l, α-t
oco
phero
l, β-
caro
tene a
nd
25-h
ydro
xyv
itam
in D
of ad
ole
scent
stu
dents
fro
m R
ecife
, no
rtheaste
rn B
razil,
2013
Ret
ino
l (m
mo
l/l)
α-t
oco
phe
rol (m
mo
l/l)
β-ca
rote
ne (m
mo
l/l)
25 h
ydro
xyvi
tam
in D
(nm
ol/
l)Va
riabl
esIn
suffi
cien
tIn
suffi
cien
tIn
suffi
cien
tIn
suffi
cien
tn
n%
PR (9
5% C
I)p*
nn
%PR
(95%
CI)
p*n
n%
PR (9
5% C
I)p*
nn
%PR
(95%
CI)
p*Ag
e (ye
ars)
12-
15
268
8632
.11.
00
(0.7
-1.4
)0.
9826
923
587
.41.
0022
717
275
.81.
08
(0.9
-1.2
)0.
3528
514
450
.51.
00
16-
19
122
3932
.01.
0012
511
289
.61.
03
(0.9
-1.1
)0.
6397
6870
.11.
0012
668
54.0
1.07
(0
.9-1
.3)
0.59
Gend
er
Boy
s15
344
28.8
1.00
(0
.9-1
.6)
0.31
153
126
82.4
1.00
122
8973
.01.
0025
114
658
.21.
41
(1.1
-1.7
)0.
001
Girl
s23
781
34.2
1.19
237
221
91.7
1.11
(1
.03-
1.2)
0.01
202
151
74.8
1.02
(0
.9-1
.2)
0.82
160
6641
.31.
00
SES
0.67
†0.
20†
0.21
†0.
94†
D +
E10
435
33.7
1.11
(0
.8-1
.6)
0.69
9579
83.2
1.00
7558
77.3
1.0
6 (0
.9-1
.3)
0.39
109
5651
.41.
00
C13
541
30.4
1.00
137
119
86.9
1.04
(0
.9-1
.2)
0.55
112
7970
.51.
0014
776
51.7
1.01
(0
.8-1
.3)
0.94
A +
B95
3435
.81.
18
(0.8
-1.7
)0.
4710
697
91.5
1.10
(0
.9-1
.2)
0.11
8972
80.9
1.15
(0
.9-1
.3)
0.13
9752
53.6
1.04
(0
.8-1
.3)
0.86
Taba
gism
Yes
81
12.5
1.00
87
87.5
1.00
52
40.0
1.00
8
112
.51.
00
No
382
124
32.5
2.60
(0
.4-1
6.3)
0.45
‡38
634
088
.11.
01
(0.8
-1.3
)1.
00‡
319
238
74.6
1.87
(0
.6-5
.5)
0.11
403
211
52.4
4.19
(0
.7-2
6.3)
0.03
‡
Alco
holic
Yes
4113
31.7
1.00
4239
92.9
1.06
(0
.9-1
.2)
0.45
3526
74.3
1.00
(0
.8-1
.2)
0.86
4216
38.1
1.00
No
349
112
32.1
1.01
(0
.6-1
.6)
0.89
352
308
87.5
1.00
289
214
74.0
1.00
369
196
53.1
1.39
(0
.9-2
.1)
0.09
Phys
ical a
ctivi
ty
No
141
4330
.51.
0014
312
889
.51.
03
(0.9
-1.1
)0.
6111
884
71.2
1.00
152
8253
.91.
07
(0.9
-1.3
)0.
52
Yes
249
8232
.91.
08
(0.8
-1.5
)0.
7025
121
987
.31.
0020
615
675
.71.
06(0
.9-1
.2)
0.44
259
130
50.2
1.00
BMI/A
ge
Wei
ght e
xces
s10
931
28.4
1.00
111
8980
.21.
0096
8487
.51.
14
(1.1
-1.4
)<
0.0
0111
468
59.6
1.38
(1
.1-1
.7)
0.00
5
No
wei
ght
exce
ss27
993
33.3
1.17
(0
.8-1
.6)
0.42
281
256
91.1
1.14
(1
.0-1
.3)
0.00
522
615
468
.11.
0029
411
449
.01.
00
SES:
soc
ioec
onom
ic st
atus
; BM
I: bo
dy m
ass
inde
x; P
R: p
reva
lenc
e ra
tio; C
I: co
nfide
nce
inte
rval
; QI:
quar
tile
inte
rval
. *Ch
i-squ
are
test
. † ANO
VA. ‡ F
isher
’s ex
act t
est.
Crite
ria o
f soc
ioec
onom
ic st
atus
cla
ssifi
catio
n-20
13: d
esce
ndin
g or
der (
bein
g A
the
hous
ehol
d wi
th th
e hi
ghes
t pur
chas
ing
powe
r). A
dequ
ate
retin
ol >
0.7
µm
ol/l.
Ade
quat
e β-
caro
teno
: > 0
.9 µ
mol
/l. A
dequ
ate
a-to
coph
erol
> 1
2 µm
ol/l.
Ade
quat
e 25
(OH)
D: >
72.
4 nm
ol/l.

1160 R. P. Paes-Silva et al.
[Nutr Hosp 2018;35(5):1153-1162]
Although the literature demonstrates a relatively high frequency of these nutrients, this study showed higher values, reinforcing the importance of the development of more representative studies on populations in this age group.
It is important to note that adolescents are a group vulnerable to fat-soluble vitamin deficiency, and poor eating habits could exacerbate this deficiency. However, in this study, there was no significant difference between the consumption of vitamins A, D, E and their respective serum concentrations, which leads us to infer that, in addition to absolute values of consumed micronutrients, other factors could interfere with their blood concentrations.
The intake of vitamins below the recommended values for an extended period may be one of the main factors that could inter-fere with serum levels because the concentrations of fat-solu-ble vitamins remain consistent unless the individual consumes chronically inadequate amounts of these vitamins (27). In addition, the bioavailability of vitamins may also influence serum levels since the absorption of fat-soluble vitamins depends on the lipid components involved in the formation of the micelle and in pan-creatic and biliary stimulus. It also depends on diet composition: certain lipids and other nutrients may negatively interfere with the absorption of vitamins (28).
In this study, adolescents who consumed higher amounts of vitamin E had a significant decrease in serum retinol concentra-tions, possibly because a high amount of vitamin E may inhibit the absorption of β-carotene or its conversion into retinol in the intestine (29). It was also noted that a higher intake of vitamin E seems to positively affect the increase of 25(OH)D. However, there are no reports elucidating this finding, which leads us to infer that vitamin E intake could positively affect the bioavailability of vitamin D. However, more studies are needed to evaluate and clarify the probable mechanism of interaction between these two vitamins. In addition, it is suggested that in evaluating the consumption of fat-soluble vitamins, the factors that may interfere in the bioavail-ability of these micronutrients be considered.
In the sample studied, boys had significantly higher values of retinol, α-tocopherol and 25(OH)D. Girls had a higher risk of defi-ciency of α-tocopherol, whereas boys had a higher risk of 25(OH)D inadequacy. This difference may be due to possible differences arising from the pubertal development of the genders. Hormonal factors might be responsible for these differences, since vitamins are highly active compounds associated with the activity of all regulatory chains of the gonadotropic pituitary function and par-ticipate in the synthesis of corticosteroids and sex hormones (30).
The lower concentration of β-carotene observed in adolescents from a higher socioeconomic level shows that purchasing power may interfere with diet choices, because, as the β-carotene is considered as a relevant indicator of fruit and vegetable intake (28), adolescents would possibly show a reduced consumption of these foods. This is because, unlike retinol, in which blood levels are more stable and maintained because of deposits, β-carotene concentrations are more variable, probably because of fluctuations in the carotenoid intake (31).
Regarding the variable lifestyle, adolescents who reported smoking had higher concentrations of retinol, and those who did
not smoke had a higher risk of insufficiency 25(OH)D levels. In addition, this study also found that adolescents who drank alcohol had higher serum concentrations of vitamin D. However, it should be noted that the sample of adolescents who smoke and drink was very small, which shows the need for further research to investigate whether this association is true or if it was just one confounding factor of this study.
Studies demonstrated an inverse association between concen-trations of fat-soluble vitamins and overweight in children and adolescents from both genders (32). Evidence suggests that a decrease in the concentration of fat-soluble vitamins in the plasma may occur in obesity due to a lower intake of these nutrients and/or to a greater deposition in the adipose tissue. By being solu-ble in fats, they are deposited in adipocytes and thus decrease bioavailability in individuals with adiposity excess (35). Thus, a higher adiposity is associated with increased levels of free radi-cals, leading to the reduction of the concentrations of antioxidant liposoluble vitamins in an attempt to reduce the oxidative stress resulting from overweight (34).
However, this study found that overweight adolescents had an increase in the concentrations of retinol and α-tocopherol and a decrease of β-carotene and 25(OH)D concentrations when com-pared to individuals with a normal weight. These findings differ from the literature, since there are reports of a decrease of vita-mins D, E and β-carotene in the bloodstream in overweight indi-viduals (35,36), whereas retinol presents conflicting data, since some authors have reported an increase in this vitamin with an increase in adiposity (35) and others show no association between retinol and obesity (25).
These differences could be attributed to the storage locations of fat-soluble vitamins in the human body, for about 80-90% of the retinol is stored in the liver, while carotenoids and vitamins D and E are ideally stored in the adipose tissue (37). That is, the concentration of retinol would depend primarily on liver reserves and would exert less influence to fluctuations of adipose tissue.
A possible explanation is that, due to the inflammatory pro-cess resulting from overweight, there would initially be a greater recruitment of antioxidant vitamins (A, E and carotenoids) in an attempt to neutralize the free radicals produced, thus increasing their concentration in the bloodstream. β-carotene, as well as having an antioxidant function and the possibility of being diverted for conversion to vitamin A in the liver, would likely decrease its concentrations. Another factor that could influence the decrease in the concentration of these vitamins would be the intensity and the duration of the inflammatory process. However, as this study did not use biochemical markers, it prevented us from confirming the degree of inflammation that adolescents have.
Regarding vitamin D, the reduced values in obese individuals could be due to a higher deposition in adipocytes and a lower recruitment of this vitamin. It has been speculated that a defi-ciency of this vitamin could trigger the accumulation of body fat, because, with the deposit of vitamin D in adipocytes, its lower bioavailability would trigger a cascade of reactions by the hypo-thalamus, which would result in an increased hunger feeling and a reduced expenditure of energy (38). In addition, a decrease in

1161
[Nutr Hosp 2018;35(5):1153-1162]
PREVALENCE AND FACTORS ASSOCIATED WITH FAT-SOLUBLE VITAMIN DEFICIENCY IN ADOLESCENTS
vitamin D levels would increase the parathyroid hormone, which in turn would cause an elevation in intracellular calcium levels in adipocytes, which could act on the increased expression of fatty acid synthase, a key enzyme to the regulation of lipid deposition as well as to the reduction of lipolysis (39).
Upon evaluating the concentration of fat-soluble vitamins in adolescents with weight excess, according to gender, boys showed an increase in the concentrations of retinol and α-tocoph-erol and a reduction of β-carotene and 25(OH)D concentrations as adiposity increased. In girls, only α-tocopherol was high with overweight. These variations may be caused by hormonal influ-ences on the weight development process, but they may also be due to differences existing in different body fat deposition areas. Women deposit more fat in the femoral and gluteal region, and men deposit more fat in the central region, which configures a less inflammatory profile for females (40). Thus, the mobilization of vitamins to the bloodstream would be less intense in girls com-pared to boys with an increase in adiposity.
With regard to the limitations of the study, because it was a cross-sectional study, it was not possible to guarantee causal relations, and confounding variables may have affected the report-ed associations. In addition, biochemical markers monitoring the presence and intensity of oxidative stress were not used, which prevented us from evaluating the changes in concentrations of vitamins related to the inflammatory process in the presence of overweight/obesity.
Evaluated adolescents have a potential risk of inadequacy of fat-soluble vitamins, with a significant deficit both in consumption and serum levels. Although factors such as gender and overweight interfere with serum concentrations, the metabolic behavior of vitamins A, D, E and β-carotene appears to differ according to dif-ferent situations. Thus, it is necessary to understand the biochem-ical pathways that each vitamin takes, particularly with respect to increased adiposity, especially because it is one of the most prevalent nutritional disorders among adolescents, and liposoluble vitamins appear to be negatively related to excess of weight.
These findings point to the fact that the consumption of vitamin E appears to influence the metabolism and bioavailability of vita-min D, but more studies are needed to elucidate this association. This study demonstrates that the behavior of vitamins A, D and E in adolescents needs more research in order to identify the status of these nutrients in this population group, so that specialized and focused strategies to reduce these deficiencies are adequately prepared.
REFERENCES
1. World Health Organization (WHO). Nutrition in adolescence: issues and cha-llenges for the health sector: issues in adolescent health and development. Geneva: WHO; 2005.
2. Araújo MFM, Almeida LS, Freitas RWJF, Marinho NB, Pereira DCP, Damasceno MMC. Hábitos alimentares de adolescentes de escolas particulares: implicações para a prática da enfermagem pediátrica. Rev Enferm 2010;18(3)417-22.
3. Tavares LF, Castro IRR, Levy RB, Cardoso LO, Claro RM. Padrões alimentares de adolescentes brasileiros: resultados da Pesquisa Nacional de Saúde do Escolar (PeNSE). Cad Saúde Pública 2014;30(12):1-13.
4. Pilz S, Dobnig H, Winklhofer-Roob, Riedmüller G, Fischer JE, Seelhorst U, et al. Low serum levels of 25-hydroxyvitamin D predict fatal cancer in patients referred to coronary angiography. Cancer Epidemiol Biomarkers Prev 2008;17(5):1228-33.
5. Cheng S, Massaro JM, Fox CS, Keyes MJ, McCabe EL, Robins SJ, et al. Adiposity, cardiometabolic risk, and vitamin D status: the Framingham Heart Study. Diabetes 2010;59(1):242-8.
6. Prentice A, Branca F, Decsi T, Michaelsen KF, Fletcher RJ, Guesry P, et al. Energy and nutrient dietary reference values for children in Europe: metho-dological approaches and current nutritional recommendations. Br J Nutr 2004;92(2 Suppl):83S-146S.
7. Associação Brasileira de Empresas de Pesquisa (ABEP). Critério Padrão de Classificação Econômica do Brasil. Accessed on Jul 1st 2010. Available from: http://www.abep.org/codigosguias/Criterio_Brasil_2010.pdf
8. Pate RR, Freedson PS, Sallis JF, Taylor WC, Sirard J, Trost SG, et al. Complian-ce with physical activity guidelines: prevalence in a population of children and youth. Ann Epidemiol 2002;12(5):303-8.
9. Piegas LS, Avezum A, Pereira JC, Neto JM, Hoepfner C, Farran JA, et al. Risk factors for myocardial infarction in Brazil. Am Heart J 2003;46(2):331-8.
10. Sociedade Brasileira De Cardiologia. I Diretriz de Prevenção da Aterosclerose na Infância e na Adolescência. Arq Bras Cardiol 2005;85(Suppl VI):4-36.
11. Slater B, Fisberg RM, Philippi ST, Latorre MRO. Validation of a semi-quanti-tative adolescent food frequency questionnaire applies at a public school in São Paulo, Brazil. Eur J Clin Nutr 2003;57:629-35.
12. Institute of Medicine (IOM). National Research Council. Dietary referen-ce intakes for thiamin, riboflavin, niacin, vitamin B6, folate, vitamin B12, pantothenic acid, biotin, and choline. Washington DC: National Academy Press; 2002.
13. Lohman TG, Roche AF, Martorell R. Anthropometric standardization reference manual. Champaign: Human Kinectis Books; 1988.
14. De Onis M, Onyango AW, Borghi E, Nishida C, Siekmann J. Development of a WHO growth reference for school-aged children and adolescents. WHO Bull OMS 2007;85:660-7.
15. Erhardt JG, Mack H, Sobeck U, Biesalski HK. β-carotene and α-tocopherol concentration and antioxidant status in buccal mucosal cells and plasma after oral supplementation. Braz J Nutr 2002;87:471-5.
16. Souza AM, Barufaldi LA, Abreu GA, Gianinni DT, Oliveira CL, Santos MM, et al. ERICA: ingestão de macro e micronutrientes em adolescentes brasileiros. Rev Saúde Pública 2016;50(Suppl 1):5s.
17. Rizvi S, Raza ST, Ahmed F, Ahmad A, Abbas S, Mahdi F. The role of vitamin E in human health and some diseases. SQU Med J 2014;14(2):157-65.
18. Fiedor J, Burda K. Potential role of carotenoids as antioxidants in human health and disease. Nutrients 2014;6(2):466-88.
19. Peters BSE, Roque JP, Fisberg M, Martini LA. Metabólitos séricos da vitamina D não se correlacionam com pressão arterial em adolescentes. Arq Bras Endocrinol Metab 2009;53(4):416-24.
20. Veiga GV, Costa RS, Araújo MC, Souza AM, Bezerra IN, Barbosa FS, et al. Inadequação do consumo de nutrientes entre adolescentes brasileiros. Rev Saúde Pública 2013;47(1 Suppl):212S-21S.
21. Silva JVL, Timóteo AKCD, Santos CD, Fontes G, Rocha EMM. Consumo ali-mentar de crianças e adolescentes residentes em uma área de invasão em Maceió, Alagoas, Brasil. Rev Bras Epidemiol 2010;13(1):83-93.
22. Pinho L, Flávio EF, Santos SHS, Botelho ACC, Caldeira AP. Excesso de peso e consumo alimentar em adolescentes de escolas públicas no norte de Minas Gerais, Brasil. Cien Saúde Colet 2014;19(1):67-74.
23. Hu Y, Chen J, Wang R, Li M, Yun C, Li W, et al. Vitamin D nutritional status and its related factors for Chinese children and adolescents in 2010-2012. Nutrients 2017;9(9).
24. Ribeiro-Silva RC, Nunes IL, Assis AMO. Prevalence and factors asso-ciated with vitamin A deficiency in children and adolescents. J Pediatr 2014;90(5):486-92.
25. Teske M, Melges APB, Souza FIS, Fonseca FL, Sarni RO. Plasma concentra-tions of retinol in obese children and adolescents: relationship to metabolic syndrome components. Rev Paul Pediatr 2014;32(1):50-4.
26. Valtueña J, Breidenassel C, Folle J, González-Gross M. Retinol, β-carotene, α-tocopherol and vitamin D status in European adolescents; regional diffe-rences and variability: a review. Nutr Hosp 2011;26(2):280-8.
27. Ross AC, Zolfaghari R. Regulation of hepatic retinol metabolism: perspectives from studies on vitamin A status. J Nutr 2004;134(1):269S-75S.
28. Mourão DM, Sales NS, Coelho SB, Pinheiro-Santana HM. Biodisponibilidade de vitaminas lipossolúveis. Rev Nutr 2005;18(4):529-39.
29. Traber MG. The ABC of vitamin E and ß-carotene absorption. Am J Clin Nutr 2004;80:3-4.

1162 R. P. Paes-Silva et al.
[Nutr Hosp 2018;35(5):1153-1162]
30. Tret’iakova TV, Kubasov RV, Vlasova OS, Bichkaeva FA, Zhilina LP. Relations-hips between serum content of tocopherol, retinol, and reproductive hormo-nes in children. Klin Lab Diagnost 2009;12:11-4.
31. Lukaski HC. Vitamin and mineral status: effects on physical performance. Nutrition 2004;20(7-8):632-44.
32. De Souza Valente Da Silva L, Valeria Da Veiga G, Ramalho RA. Association of serum concentrations of retinol and carotenoids with overweight in children and adolescents. Nutrition 2007;23:392-7.
33. Wortsman J, Matsuoka LY, Chen TC, Lu Z, Holick MF. Decreased bioavailability of vitamin D in obesity. Am J Clin Nutr 2000;72:690-3.
34. Vicent HK, Innes KE, Vicent KR. Oxidative stress and potential interventions to reduce oxidative stress in overweight and obesity. Diabetes Obes Metab 2007;9(6):813-39.
35. Guananti IR, Marks GC, Al-Mamum, Long KZ. Low serum concentrations of carotenoids and vitamin E are associated with high adiposity in Mexi-can-American children. J Nutr 2014;144:489-95.
36. Vierucci F, Del Pistoia MD, Fanos M, Erba P, Saggese G. Prevalence of hypovi-taminosis D and predictors of vitamin D status in Italian healthy adolescents. Ital J Pediatr 2014;40:54.
37. Biesalki HK, Grimm P. Nutrição: texto e atlas. São Paulo: Editora Artmed; 2007.38. Schuch NJ, Garcia VC, Martini LA. Vitamina D e doenças endocrinometabó-
licas. Arq Bras Endocrinol Metab 2009;53(5):625-33.39. Candido FG, Bressan J. Vitamin D: link between osteoporosis, obesity, and
diabetes? Int J Mol Sci 2014;15:6569-91.40. Bloor ID, Symonds ME. Sexual dimorphism in white and brown adipose tissue
with obesity and inflammation. Horm Behav 2014;66:95-103.

NutriciónHospitalaria
Trabajo Original Valoración nutricional
ISSN (electrónico): 1699-5198 - ISSN (papel): 0212-1611 - CODEN NUHOEQ S.V.R. 318
Desarrollo de una herramienta de tamizaje para consumo elevado de sodio en una población adulta mexicanaDevelopment of a screening tool for a high sodium intake in an adult Mexican population
Paola Vanessa Miranda-Alatriste1, Eloísa Colín Ramírez2,3, Marymar Guillén Hernández1, Susana Rivera Mancía2,3, Raúl Cartas Rosado2,3, Ángeles Espinosa-Cuevas1, Ricardo Correa-Rotter1 y Maite Vallejo2 1Departamento de Nefrología y Metabolismo Mineral. Instituto Nacional de Ciencias Médicas y Nutrición Salvador Zubirán. Ciudad de México, México. 2Departamento de Investigación Sociomédica. Instituto Nacional de Cardiología Ignacio Chávez. Ciudad de México, México. 3Consejo Nacional de Ciencia y Tecnología (CONACYT). Ciudad de México, México
Palabras clave:
Cuestionario de frecuencia de alimentos. Dieta. Sal. Validación.
ResumenIntroducción: la excreción de sodio en orina de 24 horas es el método de referencia para evaluar la ingesta de sodio; sin embargo, se requieren herramientas que puedan aplicarse de manera más práctica tanto en el ámbito clínico como en el poblacional.
Objetivos: desarrollar y evaluar un cuestionario autoadministrable de frecuencia de consumo de alimentos ricos en sodio (CFCA-S) como herramienta de tamizaje para consumo elevado de sodio en una población adulta de la Ciudad de México.
Métodos: se desarrolló un CFCA-S con 28 categorías de alimentos ricos en sodio y su sistema de puntuación respectivo. El percentil 75 del puntaje total del CFCA-S se probó como punto de corte para clasificar a las personas con alto consumo de sodio a dos niveles (≥ 2.000 y ≥ 3.000 mg/día), considerando la excreción urinaria de sodio en 24 horas como método de referencia.
Resultados: se incluyeron 95 participantes (mediana de edad: 39 [percentiles 25-75: 26-46] años; hombres: 39 [41,1%]). Un puntaje total de 51,2 en el CFCA-S mostró una sensibilidad del 31,6% (intervalo de confianza [IC] 95%: 19,1-47,5), una especificidad del 78,9% (IC 95%: 66,7-87,5), valor predictivo positivo del 50% (IC 95%: 31,4-68,6) y valor predictivo negativo del 63,4% (IC 95%: 51,8-73,6), para clasificar a las personas con consumo de sodio ≥ 3.000 mg/día. Un puntaje ≥ 51,2 se asoció significativamente con una ingesta de sodio ≥ 3.000 mg/día, resultando en una razón de momios de 3,12 (IC 95%: 1,03-9,44, p = 0,04), después de ajustar por sexo, edad e índice de masa corporal (IMC).
Conclusiones: el CFCA-S es una herramienta práctica, factible de aplicarse y útil para identificar a personas en riesgo de tener un consumo elevado de sodio.
Key words:
Food frequency questionnaire. Diet. Salt. Validation.
AbstractBackground: twenty-four-hour urinary sodium excretion is the reference method to assess sodium intake; however, tools that can be more easily applied in the clinical and population setting are needed.
Objectives: to develop and evaluate a self-administered high-sodium food frequency questionnaire (abbreviated to CFCA-S in Spanish) as a screening tool for high sodium intake in an adult Mexico City population.
Methods: a CFCA-S including 28 sodium-rich food categories and a scoring system were developed. The 75 percentile for the total score was tested as cut-off point to classify high sodium consumers at two different levels (≥ 2,000 and ≥ 3,000 mg/day) against 24-h urinary sodium excretion as reference method.
Results: ninety-five participants were included (median age: 39 [25th-75th percentiles: 26-46] years; men: 39 [41.1%]). A total score of 51.2 in the CFCA-S showed a sensitivity of 31.6% (95% confidence interval [CI]: 19.1-47.5), specificity of 78.9 (95% CI: 66.7-87.5), positive predictive value of 50% (95% CI: 31.4-68.6) and negative predictive value of 63.4% (95% CI: 51.8-73.6) to classify high-sodium consumers at a level of intake ≥ 3,000 mg/day. A total score ≥ 51.2 was significantly associated with a sodium intake ≥ 3,000 mg/day, observing an odds ratio of 3.12 (CI 95%: 1.03-9.44, p = 0.04), after adjusting by sex, age, and body mass index.
Conclusions: the sodium CFCA-S developed in this study is a practical, feasible and useful tool to identify individuals at greater risk of having a high sodium intake.
Correspondencia: Eloísa Colín Ramírez. Departamento de Sociomedicina. Instituto de Cardiología “Ignacio Chávez”. Juan Badiano No. 1, Col. Sección XVI, Tlalpan, 14080 Ciudad de México. Méxicoe-mail: [email protected]; [email protected]
Miranda-Alatriste PV, Colín Ramírez E, Guillén Hernández M, Rivera Mancía S, Cartas Rosado R, Espinosa-Cuevas A, Correa-Rotter R, Vallejo M. Desarrollo de una herramienta de tamizaje para consumo elevado de sodio en una población adulta mexicana. Nutr Hosp 2018;35(5):1163-1173
DOI: http://dx.doi.org/10.20960/nh.1789
Recibido: 20/01/2018 • Aceptado: 08/05/2018
©Copyright 2018 SENPE y ©Arán Ediciones S.L. Este es un artículo Open Access bajo la licencia CC BY-NC-SA (http://creativecommons.org/licenses/by-nc-sa/4.0/).

1164 P. V. Miranda-Alatriste et al.
[Nutr Hosp 2018;35(5):1163-1173]
INTRODUCCIÓN
La ingesta elevada de sodio se asocia al desarrollo de diver-sas enfermedades, entre las que destacan hipertensión arterial sistémica (HAS), enfermedad cardiovascular (ECV), enfermeda-des cerebrovasculares y enfermedad renal crónica (1). A nivel mundial, en el año 2010 se estimó que el consumo de sodio en adultos fue de 3.950 mg/día (intervalo de confianza [IC] 95%: 3.890-4.010 mg/día) (2). En México, el consumo estimado a través de la excreción de sodio en orina de 24 horas en pobla-ción adulta de la Ciudad de México fue de 3.150 mg/día (IC 95%: 3.054-3.246 mg/día) (3), cifra que excede claramente la recomendación de consumo de la Organización Mundial de la Salud (OMS) de 2.000 mg/día (4,5) y de la Asociación Ameri-cana del Corazón (6) de 2.400 mg/día, para reducir el riesgo cardiovascular.
En el ámbito clínico, la restricción del sodio en la dieta es una de las principales estrategias nutricias para el manejo de la hipertensión arterial y otras condiciones sensibles a este mine-ral, como insuficiencia cardiaca y hepática, así como enferme-dad renal crónica. Por lo tanto, evaluar el consumo de sodio o identificar a las personas en riesgo de tener un consumo alto de este nutrimento es esencial. La medición de sodio en orina de 24 horas se considera el método estándar para estimar la inges-ta de sodio (7); sin embargo, este método requiere tiempo para la recolección de la muestra y pruebas de laboratorio, lo que vuelve su uso poco práctico a nivel poblacional, además de ser tedioso y requerir un elevado nivel de participación del paciente para obtener muestras de orina completas (8). Los métodos dietéticos alternativos incluyen recordatorios de consumo de alimentos de 24 horas, registros de alimentos de múltiples días y cuestionarios de frecuencia de consumo de alimentos (CFCA). Si bien estos suponen menos complicaciones para los pacien-tes en comparación con la recolección de orina de 24 horas, emplean técnicas de análisis que no son fácilmente accesibles en el ámbito poblacional, no proporcionan retroalimentación oportuna o tienen validez limitada para estimar el consumo de sodio (8,9).
Los CFCA diseñados específicamente para sodio dietario cons-tituyen una alternativa útil para clasificar a las personas con un consumo alto o bajo de este nutrimento, facilitando así la iden-tificación de individuos que requieran asesoría nutricional para reducir su ingesta, o bien, a aquellos en quienes deba aplicarse un método cuantitativo para estimar su consumo (10-12). Actual-mente, en México no existe ningún instrumento autoadministrable y con un sistema de puntuación práctico y rápido que permita identificar a las personas con un consumo elevado de sodio que requieran alguna intervención nutricional para reducir su consu-mo. Debido a lo anterior, el objetivo de nuestro estudio fue desa-rrollar un cuestionario de frecuencia de consumo de alimentos ricos en sodio (CFCA-S) y evaluar su utilidad para clasificar a las personas con un consumo elevado de este nutrimento en una población adulta residente de la Ciudad de México, consideran-do la excreción de sodio en orina de 24 horas como método de referencia.
MATERIAL Y MÉTODOS
La metodología de este estudio se divide en dos fases: a) diseño del CFCA-S; y b) evaluación de la utilidad del cuestionario para clasificar a las personas con un consumo elevado de sodio.
FASE 1. DISEÑO DEL CFCA-S
Para el desarrollo del CFCA-S, se consideró la inclusión de los alimentos previamente identificados como las principales fuentes de sodio en la dieta en una cohorte de trabajadores de la Ciudad de México (13). En dicho estudio, se cuantificó el porcentaje de la ingesta total de sodio procedente de diferentes categorías de alimentos, con base en la cantidad promedio con-sumida de los alimentos de cada categoría durante un periodo de tres días, para lo cual se utilizaron diarios de alimentos, tal como se describió en el trabajo original (13). Se identificaron múltiples categorías (incluyendo productos locales, como tacos y tamales) que contribuyeron mayoritariamente al consumo diario de sodio en la población de estudio (per cápita), sin considerar la sal de mesa, dada la dificultad para medir con precisión su uso en la preparación de alimentos, tanto dentro como fuera de casa. Los métodos e instrumentos para determinar el con-tenido de sodio de cada alimento se describen a detalle en la publicación original (13).
En total, el cuestionario incluyó 28 categorías de alimentos, cada una de las cuales se consideró como un reactivo, y se pidió que se indicara con qué frecuencia, dentro de los seis meses pre-vios, se consumieron los alimentos listados, usando las siguientes opciones de respuesta: a) al menos una vez al día; b) 4-6 veces por semana; c) 1-3 veces por semana; y d) rara vez o nunca. A cada opción de respuesta se le asignó una puntuación con-siderando el porcentaje promedio del consumo diario de sodio atribuible a la categoría de alimentos en cuestión entre los con-sumidores, tal como se reportó previamente (13) y se muestra en la tabla I.
Antes de la asignación de los puntajes, los porcentajes lista-dos en la tabla I fueron redondeados al número entero inmedia-to superior o inferior y, posteriormente, este valor redondeado se asignó como puntaje a la respuesta que representa la mayor frecuencia de consumo en cada categoría de alimentos, que es “al menos una vez al día”. Considerando esta frecuencia como un consumo diario (siete de siete días a la semana), las pun-tuaciones del resto de las opciones de frecuencias de consumo se asignaron por prorrateo; por ejemplo, si el porcentaje con que la categoría de “pan salado” contribuyó al consumo total de sodio entre los consumidores de pan salado fue de 9,8%, el puntaje asignado a la frecuencia de consumo de “al menos una vez al día” fue 10 (después de redondear 9,8); a la frecuencia de consumo “4-6 veces por semana” (considerando un valor promedio de cinco días a la semana para esta categoría) le correspondió una puntuación de 5*10/7 = 7,1; y a la frecuen-cia de consumo de “1-3 veces por semana” (valor promedio de dos días a la semana) le correspondió una puntuación de

1165DESARROLLO DE UNA HERRAMIENTA DE TAMIZAJE PARA CONSUMO ELEVADO DE SODIO EN UNA POBLACIÓN ADULTA MEXICANA
[Nutr Hosp 2018;35(5):1163-1173]
2*10/7 = 2,9. A la frecuencia de consumo “rara vez o nunca” se le asignó un valor de cero. La puntuación global máxima posible para el cuestionario fue de 231 y la mínima posible fue de 0, donde a mayor puntuación, mayor frecuencia de consumo de los alimentos listados.
Adicionalmente, se incluyó una sección en la cual se pregunta por el uso discrecional de sal de mesa (sal añadida durante la preparación de alimentos y la agregada en la mesa). Estas pre-guntas no se consideraron en la puntuación del cuestionario; sin embargo, se incluyeron con la finalidad de captar información relevante para orientar la educación nutricional del encuestado en cuanto al uso de sal de mesa.
EVALUACIÓN DE FACTIBILIDAD
Una vez diseñado el cuestionario y el sistema de puntuación, se les pidió a cinco especialistas en nutrición que completaran el cuestionario y que posteriormente evaluaran el tiempo empleado en contestarlo, así como la comprensión de las preguntas, la extensión del instrumento y la factibilidad para aplicarlo en la práctica clínica habitual, usando una escala de Likert; además, se incluyó un espacio en blanco para agregar comentarios.
La evaluación de expertos permitió identificar correcciones necesarias en la redacción de las preguntas y en el formato del cuestionario. Todos los expertos estuvieron de acuerdo o total-
Tabla I. Contribución al consumo total de sodio al día por categorías de alimentos entre los individuos que consumieron los alimentos (consumidores)
Categoría de alimento % de la ingesta total de Na*
Tacos 21,8 (16,9-26,8)
Pizza 20,6 (17,2-24,0)
Tamales 13,5 (10,9-16,1)
Sazonadores (salsas sazonadoras, condimentos salados en polvo y consomé en cubo o polvo) 12,7 (9,6-15,7)
Hamburguesas 12,3 (10,6-13,9)
Sazonadores a base de chile en polvo con sal 11,9 (6,0-17,8)
Carnes procesadas (jamón, tocino, salchichas, chorizo, machaca, chuleta de cerdo ahumada) 11,3 (10,6-12,1)
Pan dulce (empaquetado y de panadería) 11,1 (10,4-11,9)
Pan salado (bolillo, telera, baguette, pan de caja, pan para hot dog y otros) 9,8 (9,4-10,3)
Cereales de desayuno 9,7 (8,5-10,8)
Pescado enlatado (atún, sardinas) 9,6 (7,9-11,3)
Mole 8,5 (6,7-10,3)
Frijoles enlatados 8,4 (6,0-10,8)
Quesos naturales (panela, oaxaca, de cabra, parmesano, brie, camembert, gouda, suizo, queso crema, cheddar, provolone, etc.)
7,0 (6,5-7,6)
Tortilla de harina 6,7 (5,7-7,7)
Quesos procesados (tipo americano, fundido para untar o en rebanadas para fundir) 5,4 (4,7-6,2)
Chiles enlatados (en escabeche y adobados) 5,2 (4,1-6,4)
Salsas picantes y chamoy (salsas botaneras embotelladas) 5,1 (3,6-6,5)
Galletas saladas 4,6 (3,5-5,8)
Frituras (de papa, maíz o trigo) 4,4 (3,8-4,9)
Cacahuates, nueces y otras semillas saladas 4,1 (3,0-5,3)
Palomitas 3,5 (2,5-4,5)
Cátsup y mostaza 3,3 (2,8-3,8)
Galletas y barras de cereal 2,9 (2,5-3,3)
Margarina y mantequilla 1,9 (1,3-2,4)
Mayonesa y aderezos 1,6 (1,5-1,8)
*Los datos representan promedio (intervalo de confianza 95%). Adaptada de Colín-Ramírez et al. (12). Los porcentajes correspondientes a las “sopas y cremas instantáneas” y “nuggets de pollo” son 7,5% (IC 95%: 5,4-9,6) y 4,1% (IC 95%: 2,8-5,4), respectivamente.

1166 P. V. Miranda-Alatriste et al.
[Nutr Hosp 2018;35(5):1163-1173]
mente de acuerdo en el tiempo, la comprensión, la amplitud y la factibilidad de la aplicación del cuestionario durante su práctica clínica. Finalmente, sugirieron que en la opción de respuesta “rara vez o nunca” se especificara que “rara vez” correspondía a una o dos veces por mes. Se incluyó la modificación correspondiente como “rara vez (1-2 veces por mes) o nunca”.
PRUEBA PILOTO
Una vez realizadas las correcciones propuestas por el grupo de expertos, se aplicó el instrumento a cinco voluntarios que se encuentran participando en el protocolo Tlalpan 2020 (14), el cual se describe más adelante. De los cinco voluntarios, tres fueron hombres y dos fueron mujeres, con una edad mínima de 25 y máxima de 49 años. Una nutricionista del Instituto Nacional de Cardiología Ignacio Chávez (INCICh) explicó el objetivo del cuestionario a los participantes y les pidió registrar la hora de inicio y término de llenado del mismo. Al término del llenado del cuestionario, dado que todos los encuestados respondieron entre once y 18 reactivos con la opción de fre-cuencia de consumo “rara vez (1 a 2 veces por mes) o nunca”, se decidió dividir en dos esta opción: “rara vez (1-2 veces al mes)” y “nunca”, a fin de evitar subestimar la puntuación de la frecuencia de consumo de aquellos alimentos que se consumen rara vez. Finalmente, a fin de poder asignar una calificación a la opción de respuesta “rara vez (1-2 veces al mes)”, el sistema de puntuación que originalmente se basó en una semana de siete días, se ajustó a un mes de 28 días. La opción “nunca” conservó el cero como puntuación. La puntua-ción máxima posible para la versión final del cuestionario se mantuvo en 231 y la mínima, en cero. La sección sobre uso de sal de mesa permaneció sin cambios. La mediana (percentiles 25-75) del tiempo de llenado del cuestionario reportado por los encuestados fue de diez (6,5-10) minutos. La versión final del cuestionario se presenta en la figura 1.
FASE 2. EVALUACIÓN DE LA UTILIDAD DEL CUESTIONARIO PARA CLASIFICAR PERSONAS CON UN CONSUMO ELEVADO DE SODIO: VALIDEZ DE CRITERIO CONCURRENTE
Población de estudio
Una vez concluida la fase de diseño del cuestionario, este se incluyó como parte de la evaluación dietética de los participantes reclutados en la cohorte Tlalpan 2020 a fin de medir la frecuencia con que consumen alimentos ricos en sodio. El estudio Tlalpan 2020 es un estudio longitudinal que tiene como objetivo principal evaluar el impacto de factores de riesgo tradicionales y no tra-dicionales sobre la incidencia de hipertensión arterial con segui-miento a diez años en una población clínicamente sana residente de la Ciudad de México. El diseño y la metodología del estudio han sido publicados con anterioridad (14). La cohorte Tlalpan
2020 incluye hombres y mujeres de entre 20 y 50 años que vivan en cualquiera de las 16 delegaciones políticas de la Ciudad de México y que no padezcan hipertensión arterial. Se excluye de la cohorte a las personas con diagnóstico previo de diabetes mellitus, distiroidismo, enfermedad cerebrovascular, cardiopatía isquémica, síndrome coronario agudo, cáncer con efecto en la sobrevida, mujeres embarazadas y personas con algún tratamien-to farmacológico que tenga efecto sobre la presión arterial, o que padezcan alguna alteración cognitiva o mental que impida el adecuado apego al protocolo.
A fin de evaluar la utilidad de cuestionario para clasificar perso-nas con un consumo elevado de sodio, se llevó a cabo un análisis transversal de los datos de los participantes del estudio Tlalpan 2020 que contestaron el cuestionario durante su visita inicial o de seguimiento, entre mayo y septiembre de 2017, utilizando los datos de excreción de sodio en orina de 24 horas como método de referencia para estimar el consumo de sodio. Se excluyeron del análisis los participantes que no proporcionaron una muestra de orina de 24 horas completa, de acuerdo a los criterios descritos más adelante.
El estudio Tlalpan 2020 fue aprobado por los comités de Ética e Investigación del Instituto Nacional de Cardiología Ignacio Chávez (INCICh), con el número de referencia 13-802. Todos los partici-pantes proporcionaron consentimiento informado por escrito para ser reclutados en la cohorte.
Evaluaciones
CFCA-S
Se aplicó el cuestionario diseñado previamente y se calculó la puntuación global para cada participante de acuerdo con el sistema de puntuación desarrollado. Se les pidió a los partici-pantes que registraran la hora de inicio y de término de llenado del cuestionario.
Excreción de sodio en orina de 24 horas
Los pacientes recibieron instrucciones de desechar la primera orina de la mañana y, posteriormente, recolectar todas las mic-ciones subsecuentes durante un periodo de 24 horas, incluida la primera orina de la mañana siguiente (que fue el día de su visita en el INCICh). Para la recolección, se les proporcionó a los participantes un contenedor libre de conservadores y se les pidió mantener el contenedor con orina en un lugar fresco durante el periodo de recolección. El sodio urinario se determinó a través del método de electrodo selectivo de iones y la creati-nina urinaria se determinó por medio del ensayo colorimétrico de Jaffe en un analizador automatizado. Las muestras de orina se consideraron completas cuando los niveles de creatinina urinaria estuvieron dentro de la tasa de excreción de creatinina estándar para hombres (15-25 mg/kg/24 horas) y mujeres (10-20 mg/kg/24 horas) (15).

1167DESARROLLO DE UNA HERRAMIENTA DE TAMIZAJE PARA CONSUMO ELEVADO DE SODIO EN UNA POBLACIÓN ADULTA MEXICANA
[Nutr Hosp 2018;35(5):1163-1173]
CUESTIONARIO DE FRECUENCIA DE CONSUMO DE ALIMENTOS RICOS EN SODIO
Nombre_____________________________________________________________Fecha de llenado del cuestionario: ________________________________________Edad:______________ Sexo: Femenino_____ Masculino______
Instrucciones de llenado
El siguiente cuestionario nos ayudará a conocer mejor su consumo de sodio (sal). Para ello, le pedimos que por favor conteste las siguientes preguntas sobre sus hábitos alimentarios durante los últimos 6 meses. Por favor responda tan honestamente como sea posible, una vez que esté seguro de su respuesta seleccione sólo una casilla por pregunta, la que refleje mejor la frecuencia con que usted consume el alimento correspondiente.
El cuestionario está dividido en dos secciones, en la sección 1 se pregunta sobre la frecuencia de consumo de diferentes ali-mentos ricos en sodio, mientras responde esta sección por favor no piense en la cantidad del consumo del alimento, solo en la frecuencia con que lo consume. En la sección 2 se pregunta sobre el uso de sal para cocinar y la adiciona a sus alimentos en la mesa.
El puntaje total será determinado por el personal de salud.
Sección 1. Frecuencia de consumo de alimentos ricos en sodio
Grupo de alimentos
Ejemplos
Frecuencia de consumoAl menos 1 vez al
día
4-6 veces por
semana
1-3 veces por
semana
Rara vez (1-2 veces
al mes) Nunca
1) Pan salado Pan de caja blanco o integral, bolillo, telera,
baguette, bagel, pan para hot dog 10 7.1 2.9 0.5 0
2) Pan dulce
Empaquetado (donas, roles, gansitos, colchones, conchas, pingüinos, pastelillos rellenos,
bimbuñuelos, chocorroles, mantecadas, panques) y sin empaquetar (de panadería o casero)
11 7.9 3.1 0.6 0
3) Galletas y barras de cereal
Galletas empaquetada (María, de animalitos, de canela, de malvavisco, con chispas de chocolate,
tipo sándwich rellenas de crema, polvores, tartaletas, de mantequilla.) y sin empaquetar, incluyendo
galletas caseras.Barras de cereal o avena
3 2.1 0.9 0.2 0
4) Galletas saladas
Crackets, habaneras, habaneras integrales, saladitas, saladitas integrales
5 3.6 1.4 0.3 0
5) Cereal de cajaCereales de desayuno, incluyendo avena
saborizada empaquetada 10 7.1 2.9 0.5 0
6) Tortillas de harina
7 5 2 0.4 0
7) Quesos (excepto quesos fundidos en rebanadas)
Panela, canasto, oaxaca, manchego, chihuahua, parmesano, gouda, mozzarella,
asadero, provolone, menonita, cotija, cheddar, cottage, queso crema
7 5 2 0.4 0
8) Quesos procesados (fundidos)
Queso en rebanadas tipo americano (queso amarillo), manchego o suizo. Queso crema
fundido en rebanadas 5 3.6 1.4 0.3 0
9) Carnes procesadas
Jamón, salchicha, salami, pepperoni, jamón serrano, chorizo, longaniza, tocino, machaca,
chuleta ahumada 11 7.9 3.1 0.6 0
Figura 1.
Cuestionario de frecuencia de consumo de alimentos ricos en sodio.
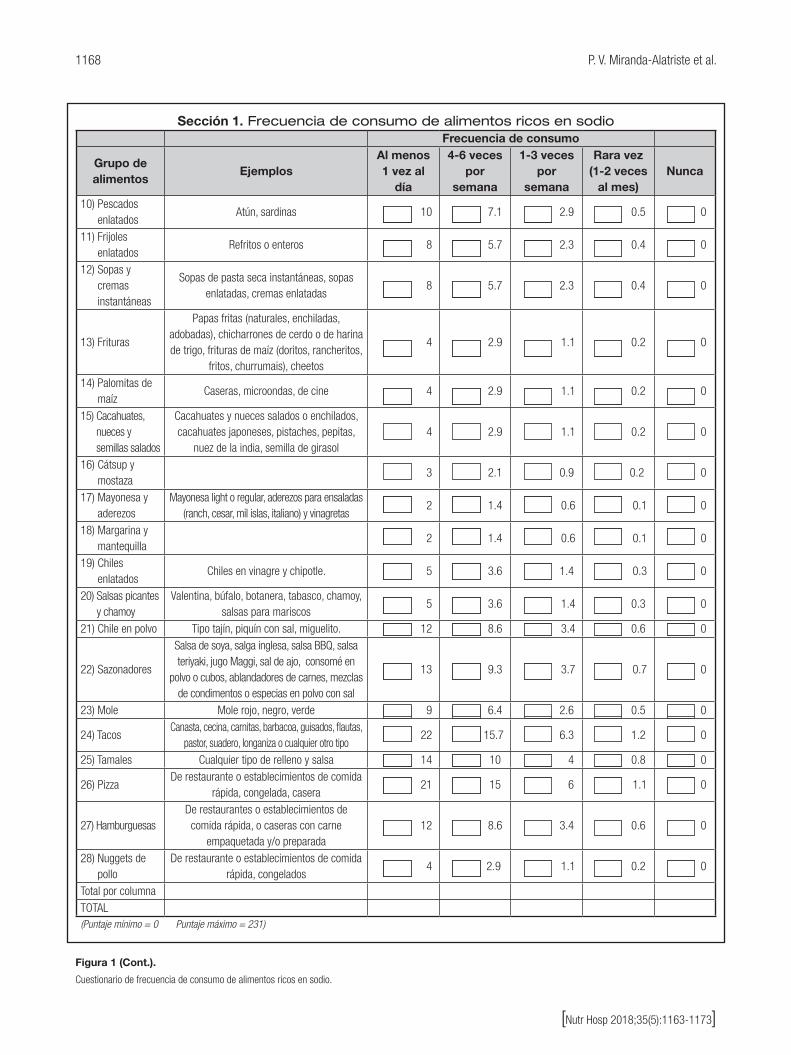
1168 P. V. Miranda-Alatriste et al.
[Nutr Hosp 2018;35(5):1163-1173]
Sección 1. Frecuencia de consumo de alimentos ricos en sodioFrecuencia de consumo
Grupo de alimentos
Ejemplos Al menos 1 vez al
día
4-6 veces por
semana
1-3 veces por
semana
Rara vez (1-2 veces
al mes) Nunca
10) Pescados enlatados
Atún, sardinas 10 7.1 2.9 0.5 0
11) Frijoles enlatados
Refritos o enteros 8 5.7 2.3 0.4 0
12) Sopas y cremas instantáneas
Sopas de pasta seca instantáneas, sopas enlatadas, cremas enlatadas
8 5.7 2.3 0.4 0
13) Frituras
Papas fritas (naturales, enchiladas, adobadas), chicharrones de cerdo o de harina de trigo, frituras de maíz (doritos, rancheritos,
fritos, churrumais), cheetos
4 2.9 1.1 0.2 0
14) Palomitas de maíz
Caseras, microondas, de cine 4 2.9 1.1 0.2 0
15) Cacahuates, nueces y semillas salados
Cacahuates y nueces salados o enchilados, cacahuates japoneses, pistaches, pepitas,
nuez de la india, semilla de girasol 4 2.9 1.1 0.2 0
16) Cátsup y mostaza
3 2.1 0.9 0.2 0
17) Mayonesa y aderezos
Mayonesa light o regular, aderezos para ensaladas (ranch, cesar, mil islas, italiano) y vinagretas
2 1.4 0.6 0.1 0
18) Margarina y mantequilla
2 1.4 0.6 0.1 0
19) Chiles enlatados
Chiles en vinagre y chipotle. 5 3.6 1.4 0.3 0
20) Salsas picantes y chamoy
Valentina, búfalo, botanera, tabasco, chamoy, salsas para mariscos
5 3.6 1.4 0.3 0
21) Chile en polvo Tipo tajín, piquín con sal, miguelito. 12 8.6 3.4 0.6 0
22) Sazonadores
Salsa de soya, salga inglesa, salsa BBQ, salsa teriyaki, jugo Maggi, sal de ajo, consomé en
polvo o cubos, ablandadores de carnes, mezclas de condimentos o especias en polvo con sal
13 9.3 3.7 0.7 0
23) Mole Mole rojo, negro, verde 9 6.4 2.6 0.5 0
24) Tacos Canasta, cecina, carnitas, barbacoa, guisados, flautas,
pastor, suadero, longaniza o cualquier otro tipo 22 15.7 6.3 1.2 0
25) Tamales Cualquier tipo de relleno y salsa 14 10 4 0.8 0
26) Pizza De restaurante o establecimientos de comida
rápida, congelada, casera 21 15 6 1.1 0
27) Hamburguesas De restaurantes o establecimientos de comida rápida, o caseras con carne
empaquetada y/o preparada 12 8.6 3.4 0.6 0
28) Nuggets de pollo
De restaurante o establecimientos de comida rápida, congelados
4 2.9 1.1 0.2 0
Total por columnaTOTAL(Puntaje mínimo = 0 Puntaje máximo = 231)
Figura 1 (Cont.).
Cuestionario de frecuencia de consumo de alimentos ricos en sodio.

1169DESARROLLO DE UNA HERRAMIENTA DE TAMIZAJE PARA CONSUMO ELEVADO DE SODIO EN UNA POBLACIÓN ADULTA MEXICANA
[Nutr Hosp 2018;35(5):1163-1173]
Sección 2. Uso de sal de mesa para cocinar y adicionar a sus alimentos
29. En un día habitual, ¿qué cantidad de sal usa en total para preparar en casa sus alimentos de todo el día? No considere la sal usada en la preparación de los alimentos de toda la familia, solo la incluida en sus alimentos.
¨ 1 cucharadita cafetera ¨ ½ cucharadita cafetera¨ ¼ cucharadita cafetera¨ Otra, especifique: ___________________________________________________________
Puede especificar la cantidad en cucharadas cafeteras (ej. 2 cucharadas cafeteras) o sacudidas de salero (3 sacudidas)
¨ No uso sal para cocinar mis alimentos.
30. En un día habitual, ¿qué cantidad de sal adiciona en la mesa a sus alimentos?¨ 1 cucharadita cafetera ¨ ½ cucharadita cafetera¨ ¼ cucharadita cafetera¨ Otra, especifique:__________________________________________________________
Puede especificar la cantidad en cucharadas cafeteras (ej. 2 cucharadas cafeteras) o sacudidas de salero (3 sacudidas)
¨ No adiciono sal en la mesa a los alimentos.
Antropometría y presión arterial
Se midieron peso, talla y circunferencia de cintura con el paciente en ayuno, sin zapatos y usando una bata de hospital, y de acuerdo con los lineamientos establecidos por la International Society for the Advancement of Kinanthropometry (ISAK) (16) para su medición. Para el peso se utilizó una báscula mecánica de columna Seca®
700 con capacidad de 220 kg y precisión de 0,05 kg. La estatura se midió con un estadiómetro Seca® 220 con precisión de 1 mm y la circunferencia de cintura, con una cinta métrica de fibra de vidrio BodyFlex, con longitud de 150 cm y precisión de 1 mm. La presión arterial sistólica y diastólica se midió en el brazo izquierdo tres veces con un esfigmomanómetro de mercurio y se calculó el promedio de las tres mediciones. Los participantes con un promedio de presión arterial sistólica ≥ 140 mmHg y/o diastólica ≥ 90 mmHg durante la evaluación inicial se excluyeron de la cohorte (17).
Bioquímica
Con el paciente en ayuno de 12 horas, se obtuvieron muestras de sangre venosa para determinar concentraciones séricas de coles-terol total (CT), lipoproteínas de alta densidad (HDL), lipoproteínas de baja densidad (LDL), triglicéridos (TG) y glucosa, en analizadores automatizados dentro del Laboratorio Central del INCICh.
ANÁLISIS ESTADÍSTICO
Las variables continuas se expresaron como media ± des-viación estándar o mediana y percentiles 25-75, dependiendo de su distribución, la cual se evaluó mediante la prueba Kolmo-gorov-Smirnov. Las variables categóricas se presentaron como frecuencias absolutas (número de participantes) y relativas (por-centajes). Se calculó el percentil 75 de la puntuación global del CFCA-S y se estimaron la sensibilidad, la especificidad, el valor predictivo positivo (VPP) y el valor predictivo negativo (VPN) aso-ciados a este punto de corte para clasificar a las personas con una excreción urinaria de sodio ≥ 2.000 mg/día, ≥ 2.400 mg/día y ≥ 3.000 mg/día, considerando estos niveles de excreción como una medida subrogada de un consumo elevado de sodio, dado que la recomendación para el consumo de este nutrimento varía entre 2.000 y 2.400 mg/día para población adulta, de acuerdo con la OMS (4) y la American Heart Association (AHA) (6), respec-tivamente. Si bien la AHA sugiere que un consumo de sodio de 1.500 mg/día puede verse asociado a una mayor reducción de la presión arterial (6), no se consideró este nivel de consumo para clasificar a los sujetos en nuestro estudio, dada la poca factibilidad de alcanzar este nivel de ingesta de sodio en población general.
Posteriormente, se utilizó un modelo de regresión logística para estimar la razón de momios (RM) e intervalo de confianza (IC) al 95%, tanto crudo como ajustando por sexo, edad e IMC, para
Figura 1 (Cont.).
Cuestionario de frecuencia de consumo de alimentos ricos en sodio.

1170 P. V. Miranda-Alatriste et al.
[Nutr Hosp 2018;35(5):1163-1173]
la asociación entre el percentil 75 de la puntuación global del CFCA-S y la excreción urinaria de sodio a los tres niveles antes mencionados: ≥ 2.000 mg/día, ≥ 2.400 mg/día y ≥ 3.000 mg/día. La información se procesó en el software SPSS versión 22.
RESULTADOS
En el periodo de mayo a septiembre de 2017, 148 participantes reclutados en la cohorte Tlalpan 2020 completaron el cuestiona-rio; de estos, 95 (64,2%) proporcionaron una muestra de orina de 24 horas completa y, por tanto, se incluyeron en el análisis. En la tabla II se muestran las características demográficas y clínicas de los participantes. De los 95 incluidos, 39 (41,1%) fueron hombres y la mediana de edad fue de 39 (percentiles 25-75: 26-46) años. El IMC promedio se ubicó en el rango de sobrepeso, en tanto que la tensión arterial sistólica y diastólica se encuentra en rangos normales (18). En la tabla III se presentan los datos bioquímicos y de excreción urinaria de sodio y creatinina.
EVALUACIÓN DE LA UTILIDAD DEL CUESTIONARIO PARA CLASIFICAR A LAS PERSONAS CON UN CONSUMO ELEVADO DE SODIO
El percentil 75 calculado para la puntuación global del cuestionario fue de 51,2 puntos. En la tabla IV se muestran los datos de sensibi-lidad, especificidad, VPP y VPN asociados a este punto de corte para clasificar a los participantes con consumo elevado de sodio conside-
rando los tres niveles de excreción urinaria previamente establecidos; fueron mayores la sensibilidad, especificidad y VPN para el nivel de excreción ≥ 3.000 mg/día que para los de ≥ 2.000 y ≥ 2.400 mg/día.
En la tabla V se muestran los resultados del análisis de regre-sión logística, donde se observa que el punto de corte de 51,2 puntos en el CFCA-S se asoció de manera no significativa con una mayor probabilidad de tener una excreción urinaria de sodio ≥ 2.000 mg/día (RM: 1,20, IC 95%: 0,33-4,34, p = 0,78) y ≥ 2.400 mg/día (RM: 1,89, IC 95%: 0,84-4,22, p = 0,12), en comparación con aquellos con una puntuación global por debajo de este valor, luego de ajustar por sexo, edad e IMC. Cuando esta misma aso-ciación se probó a un nivel de excreción de sodio ≥ 3.000 mg/día, la asociación fue más fuerte y significativa, mostrando una RM ajustada de 3,12 (IC 95%: 1,03-9,44, p = 0,04).
DISCUSIÓN
En este estudio se describe el diseño de un cuestionario de frecuencia de consumo de alimentos ricos en sodio, denomi-nado CFCA-S, en el cual se evalúan 28 categorías de alimentos previamente identificadas como fuentes relevantes de sodio en la dieta en una población de adultos de la Ciudad de México (13). Asimismo, se evaluó su utilidad como una herramienta de tamizaje para consumo elevado de sodio, medido a través de su excreción en orina de 24 horas, mostrando ser un instrumento sencillo y factible de aplicar, para el cual una puntuación global de 51,2 o superior se asoció significativamente con una mayor probabilidad (RM: 3,12, IC 95%: 1,03-9,44, p = 0,04) de tener una excreción de sodio ≥ 3.000 mg/día.
Tabla II. Características demográficas y clínicas de la población de estudio
Población de estudio*
n = 95
Edad (años) 39 (26-46)
Hombres (n [%]) 39 (41,1)
Peso (kg) 71,4 ± 15,4
Talla (m) 1,6 ± 0,9
Circunferencia de cintura (cm) 90,3 ± 12,7
Índice de masa corporal (kg/m2) 27,4 ± 5,3
Tensión arterial sistólica (mmHg) 105,0 ± 14,7
Tensión arterial diastólica (mmHg) 70,7 ± 9,1
Tiempo de aplicación del cuestionario (minutos)
7,0 (6,0-9,0)
*Las variables continuas se presentan como promedio ± desviación estándar o mediana (percentiles 25-75).
Tabla III. Datos bioquímicos y análisis de orina de 24 horas
Población de estudio*
n = 95
Ácido úrico (mg/dl) 5,4 ± 1,4
Creatinina sérica (mg/dl) 0,7 (0,6-0,9)
Triglicéridos (mg/dl) 137,7 (96,3-188)
Colesterol total (mg/dl) 189,7 ± 34,6
Colesterol-HDL (mg/dl) 45,0 (36,8-52,7)
Colesterol-LDL (mg/dl) 117,6 (101,7-140,5)
Glucosa (mg/l) 94,0 (85-99)
Creatinina en orina (mg/24 horas) 1.281 ± 407,1
Sodio en orina (mg/24 horas) 2.714 (2.052-3.541)
Volumen orina (ml/24 horas) 1.500 (900-2.000)
HDL: colesterol de alta densidad; LDL: colesterol de baja densidad. *Los datos se presentan como promedio ± desviación estándar o mediana (percentiles 25-75).

1171DESARROLLO DE UNA HERRAMIENTA DE TAMIZAJE PARA CONSUMO ELEVADO DE SODIO EN UNA POBLACIÓN ADULTA MEXICANA
[Nutr Hosp 2018;35(5):1163-1173]
Estudios previos han diseñado y probado la utilidad de cues-tionarios de frecuencia de consumo específicos para sodio die-tario en poblaciones de pacientes con hipertensión arterial (10), enfermedad renal crónica (11) o población general (12), siendo el nuestro el primero diseñado específicamente para población mexicana (19). Los resultados de este estudio muestran que, aun cuando el percentil 75 de la puntuación global del cuestionario (51,2 puntos) es capaz de detectar a poco más de la tercera parte (31,6%) de los casos con una excreción de sodio ≥ 3.000 mg/día, el 78,9% de los individuos con una excreción de sodio < 3.000 mg/día son clasificados correctamente por el cuestionario. Considerando los tres niveles de excreción de sodio en los que se probó nuestro instrumento (Tabla IV), este mostró una mayor sensibilidad en comparación con la reportada para otro instru-mento en población surafricana (12,4%) (12), pero menor a la observada para un cuestionario validado en población australiana con enfermedad renal (61%) (11). En ambos casos se buscaba identificar personas con un consumo de sodio ≥ 100 mmol/día, equivalente a 2.300 mg/día de sodio aproximadamente. Cabe resaltar que tanto nuestro instrumento como los dos mencionados previamente mostraron mayor especificidad que sensibilidad.
Por otro lado, en nuestro estudio se observó que las personas con un puntaje global ≥ 51,2 en el cuestionario tuvieron significa-tivamente mayor probabilidad de excretar ≥ 3.000 mg de sodio/día (RM: 3,12, IC 95%: 1,03-9,44, p = 0,04), independientemente de la edad, sexo e IMC. Estos resultados permiten sugerir la utili-dad del CFCA-S para identificar personas en riesgo de tener una excreción elevada de sodio en población adulta de la Ciudad de México, quienes puedan beneficiarse de una asesoría nutricional para reducir su consumo con un enfoque preventivo, o bien, a aquellos que ameriten una evaluación formal de la ingesta de sodio a través de métodos cuantitativos, dado que se han identi-ficado como personas en riesgo de consumo alto. Es importante destacar que, dada la baja sensibilidad y alta especificidad del cuestionario, su uso conlleva una menor tasa de falsos positivos, pero mayor de falsos negativos.
A nivel mundial, se estimó que una dieta alta en sodio contri-buyó con el 4,2% del total de muertes en 2016 (20) y recien-temente se reportó que el consumo promedio de sodio en una población mexicana clínicamente sana fue de 3.150 mg/día (IC 95%: 3.054-3.246 mg/día), llegando a ser hasta de 3.735 mg/día en hombres. Estas cifras son superiores a la recomendación de la
Tabla IV. Sensibilidad, especificidad, VPP y VPN del punto de corte establecido para la puntuación del CFCA-S (percentil 75: 51,2 puntos) para identificar a los sujetos con un
consumo de sodio ≥ 2.000 mg/día, ≥ 2.400 mg/día y ≥ 3.000 mg/día, medido a través de la excreción de sodio en orina de 24 horas
≥ 2.000 mg/día ≥ 2.400 mg/día ≥ 3.000 mg/día
Valor del índice
IC 95%Valor del
índiceIC 95%
Valor del índice
IC 95%
Sensibilidad (%) 24,3 16,0-35,2 27,6 17,8-40,2 31,6 19,1-47,5
Especificidad (%) 71,4 50,0-86,2 78,4 62,8-88,6 78,9 66,7-87,5
VPP (%) 75,0 55,0-88,0 66,7 46,7-82 50,0 31,4-68,6
VPN (%) 21,1 13,2-32,0 40,8 30,2-52,5 63,4 51,8-73,6
VPP: valor predictivo positivo; VPN: valor predictivo negativo.
Tabla V. Análisis de regresión logística para la asociación entre el punto de corte establecido para la puntuación del CFCA-S (percentil 75: 51,2 puntos) y un consumo
elevado de sodio, medido a través de la excreción de sodio en orina de 24 horasNivel de consumo
de sodio*RM‡ cruda
IC 95% (valor p)
RM‡ ajustada† IC 95% (valor p)
≥ 2.000 0,800,27-2,38
(0,69)1,20
0,33-4,34 (0,78)
≥ 2.400 1,530,74-3,13
(0,24)1,89
0,84-4,22 (0,12)
≥ 3.000 1,730,68-4,41
(0,25)3,12
1,03-9,44 (0,04)
*Estimado a través de la excreción de sodio en orina de 24 horas. †Ajustado por sexo, edad e IMC. ‡RM: razón de momios.

1172 P. V. Miranda-Alatriste et al.
[Nutr Hosp 2018;35(5):1163-1173]
OMS para consumo de sodio (< 2.000 mg/día sodio) para reducir la presión arterial y el riesgo cardiovascular a nivel poblacional (5), por lo que la necesidad de estrategias para reducir el consumo de sodio en nuestra población sigue latente. Se ha reportado que, a pesar de que los alimentos procesados y las comidas preparadas o consumidas fuera de casa contribuyen de manera significativa a la ingesta de sodio, las personas pueden creer que consumen bajas cantidades de este mineral debido a que no agregan sal a sus alimentos durante su preparación o en la mesa (21). Así, la falta de consciencia o conocimiento por parte de la población sobre la procedencia del sodio en la dieta y su consumo habi-tual puede impedir la motivación personal y/o la implementación efectiva de estrategias para reducir el consumo de este nutriente. Por tanto, contar con un instrumento que nos permita identificar a las personas en riesgo de tener un consumo alto de sodio en el ámbito poblacional es fundamental para poder intervenir opor-tunamente con asesoría nutricional o estrategias para disminuir el consumo de sodio, en congruencia con la iniciativa de la OMS dirigida a reducir el consumo de sodio en un 30% para el año 2025, con el fin de prevenir y controlar las enfermedades no transmisibles en la población (22).
En el ámbito clínico, en padecimientos donde el consumo de sodio debe ser evaluado y controlado rutinariamente, tales como la hipertensión arterial, la insuficiencia renal o la insuficiencia cardiaca, su uso puede ser de gran utilidad para identificar de manera rápida y práctica a los pacientes en riesgo de tener un consumo alto de sodio en quienes se requiera implementar o reforzar intervenciones nutricionales para disminuir su ingesta; sin embargo, aún se requiere evaluar la utilidad de este instrumento en dichos pacientes.
Es importante mencionar las limitaciones de este estudio:1. Aun cuando se incluyeron en el cuestionario dos reacti-
vos sobre el uso de sal de mesa, estas respuestas no se consideraron en la puntuación debido a que en el trabajo original de donde se obtuvieron los datos para el sistema de puntuación no se evaluó su uso; sin embargo, sí se consi-deraron condimentos salados (sal de ajo, consomé en polvo o cubos), cuyo uso en algunas ocasiones sustituye a la sal de mesa en la preparación de alimentos.
2. La población de estudio en la que se validó el cuestionario proviene de una cohorte de adultos clínicamente sanos resi-dentes en la Ciudad de México, participantes de un estudio sobre factores de riesgo para la incidencia de hipertensión arterial, por lo que el instrumento debe usarse con cautela en poblaciones procedentes de otras áreas del país, dado que los hábitos de alimentación y los alimentos locales varían de región a región.
3. Como la mayoría de las encuestas dietarias, este instru-mento es dependiente de la memoria del encuestado y de la percepción que tenga sobre la frecuencia con que con-sume los alimentos estudiados. Sin embargo, debido a que no se preguntan cantidades de consumo específicas para cada alimento, sino que se asume una cantidad promedio de alimento consumido estimada en un estudio previo en población adulta, es posible que la complejidad para com-
prender y contestar la pregunta se vea reducida, tal como lo muestran los datos de la evaluación de factibilidad y la prueba piloto.
4. Finalmente, el cuestionario no incluyó alimentos como anto-jitos mexicanos o ciertos alimentos de restaurantes debido a que en México aún no se cuenta con información sobre su contenido de sodio y, por tanto, no fue posible determinar la proporción con que contribuyen al consumo de sodio habi-tual (13). No obstante, el cuestionario mostró una asociación significativa con una excreción de sodio elevada a un nivel ≥ 3.000 mg/día (RM: 3,12, IC 95%: 1,03-9,44, p = 0,04).
CONCLUSIONES
En conclusión, el CFCA-S diseñado y evaluado en este estudio mostró ser una herramienta práctica, sencilla, de fácil aplicación y útil para identificar a personas en riesgo de tener un consumo elevado de sodio (≥ 3.000 mg/día) en población adulta mexicana. Además, tiene el potencial de ser usado en el ámbito clínico en pacientes con condiciones sensibles al sodio, a fin de identificar fácilmente a aquellos en quienes deban implementarse o reforzar-se las intervenciones para disminuir su ingesta, aunque la utilidad del instrumento en estos pacientes debe ser evaluada.
FINANCIACIÓN
Este trabajo se realizó con financiamiento CONAYT No. SALUD-2016-C02-272561.
BIBLIOGRAFÍA
1. Moon L, Faulks K, Littlewood S, McIntosh N, Ryan C, Waters A-M, et al. Prevention of cardiovascular disease, diabetes and chronic kidney disease: targeting risk factors. Canberra: Australian Institute of Health and Welfare; 2009. p. 131.
2. Powles J, Fahimi S, Micha R, Khatibzadeh S, Shi P, Ezzati M, et al. Global, regional and national sodium intakes in 1990 and 2010: a systematic analysis of 24 h urinary sodium excretion and dietary surveys worldwide. BMJ Open 2013;3(12):e003733.
3. Vallejo M, Colín-Ramírez E, Rivera Mancía S, Cartas Rosado R, Madero M, Infante Vázquez O, et al. Assessment of sodium and potassium intake by 24 h urinary excretion in a healthy Mexican cohort. Arch Med Res 2017;48(2):195-202.
4. World Health Organization (WHO). Guideline. Sodium intake for adults and children. Geneva: WHO; 2012. p. 46.
5. World Health Organization (WHO). Global status report on noncommunicable diseases 2014. Geneva: WHO; 2015.
6. Eckel RH, Jakicic JM, Ard JD, De Jesus JM, Houston Miller N, Hubbard VS, et al. 2013 AHA/ACC Guideline on Lifestyle Management to Reduce Cardio-vascular Risk. J Am Coll Cardiol 2014;63(25):2960-84.
7. Pan American Health Organization, World Health Organization. Strategies to monitor and evaluate population sodium consumption and sources of sodium in the diet: report of a joint technical meeting convened by WHO and the Government of Canada. Canada; 2010.
8. Colin-Ramírez E, Arcand J, Ezekowitz JA. Estimates of dietary sodium con-sumption in patients with chronic heart failure. J Card Fail 2015;21(12):981-8.
9. Goni Mateos L, Aray Miranda M, Martínez H. A, Cuervo Zapatel M. Validación de un cuestionario de frecuencia de consumo de grupos de alimentos basado en un sistema de intercambios. Nutr Hosp 2016;33(6):1391-9.

1173DESARROLLO DE UNA HERRAMIENTA DE TAMIZAJE PARA CONSUMO ELEVADO DE SODIO EN UNA POBLACIÓN ADULTA MEXICANA
[Nutr Hosp 2018;35(5):1163-1173]
10. Ferreira-Sae M-CS, Gallani M-CB, Nadruz W, Rodrigues RC, Franchini KG, Cabral PC, et al. Reliability and validity of a semi-quantitative FFQ for sodium intake in low-income and low-literacy Brazilian hypertensive subjects. Public Health Nutr 2009;12(11):2168-73.
11. Mason B, Ross L, Gill E, Healy H, Juffs P, Kark A. Development and validation of a dietary screening tool for high sodium consumption in Australian renal patients. J Ren Nutr 2014;24(2):123-34.e3.
12. Charlton KE, Steyn K, Levitt NS, Jonathan D, Zulu JV, Nel JH. Development and validation of a short questionnaire to assess sodium intake. Public Health Nutr 2008;11(1):83-94.
13. Colín-Ramírez E, Espinosa-Cuevas Á, Miranda-Alatriste PV, Tovar-Villegas VI, Arcand J, Correa-Rotter R. Food sources of sodium intake in an adult mexican population: a sub-analysis of the SALMEX study. Nutrients 2017;9(8).
14. Colín-Ramírez E, Rivera-Mancía S, Infante-Vázquez O, Cartas-Rosado R, Vargas-Barrón J, Madero M, et al. Protocol for a prospective longitudinal study of risk factors for hypertension incidence in a Mexico City population: the Tlalpan 2020 cohort. BMJ Open 2017;7(7):e016773.
15. Wielgosz A, Robinson C, Mao Y, Jiang Y, Campbell NR, Muthuri S, et al. The impact of using different methods to assess completeness of 24-hour urine collection on estimating dietary sodium. J Clin Hypertens 2016;18:581-4
16. International Standards for Anthropometric Assessment. International Society for the Advance of Kinanthropometry; 2001.
17. Chobanian AV, Bakris GL, Black HR, Cushman WC, Green LA, Izzo JL, et al. Seven-th Report of the Joint National Committee on Prevention, Detection, Evaluation, and Treatment of High Blood Pressure. Hypertension 2003;42(6):1206-52.
18. Whelton PK, Carey RM, Aronow WS, Casey DE, Collins KJ, Dennison Himmelfarb C, et al. 2017 ACC/AHA/AAPA/ABC/ACPM/AGS/APhA/ASH/ASPC/NMA/PCNA Guideline for the Prevention, Detection, Evaluation, and Management of High Blood Pressure in Adults: Executive Summary: A Report of the American College of Cardiology/American Heart Association Task Force on Clinical Practice Guidelines. Hypertens (Dallas, Tex 1979) 2017;HYP.0000000000000066.
19. McLean RM, Farmer VL, Nettleton A, Cameron CM, Cook NR, Campbell NRC. Assessment of dietary sodium intake using a food frequency questionnaire and 24-hour urinary sodium excretion: a systematic literature review. J Clin Hypertens 2017;19(12):1214-30.
20. GBD 2016 Risk Factors Collaborators E, Afshin A, Abajobir AA, Abate KH, Abbafati C, Abbas KM, et al. Global, regional, and national comparative risk assessment of 84 behavioural, environmental and occupational, and metabolic risks or clusters of risks, 1990-2016: a systematic analysis for the Global Burden of Disease Study 2016. Lancet (London, England) 2017;390(10100):1345-422.
21. Arcand J, Mendoza J, Qi Y, Henson S, Lou W, L’Abbe MR. Results of a national survey examining Canadians’ concern, actions, barriers, and support for dietary sodium reduction interventions. Can J Cardiol 2013;29(5):628-31.
22. World Health Organization (WHO). Report of the Formal Meeting of Member States to monitoring framework, including indicators and a set of voluntary global targets for the prevention and control of noncommunicable diseases. Geneve: WHO; 2012.

NutriciónHospitalaria
Trabajo Original Epidemiología y dietética
ISSN (electrónico): 1699-5198 - ISSN (papel): 0212-1611 - CODEN NUHOEQ S.V.R. 318
Correspondence: Javier Marhuenda. Faculty of Health Sciences. Universidad Católica de San Antonio. Av. de los Jerónimos, 135, 30107 Guadalupe, Murcia. Spaine-mail: [email protected]
Barnuevo MD, Marhuenda J, Aldeguer M, Abellán MS, Zafrilla Rentero P, Contreras CJ, Guillén I, Hernández M, López FJ. In vivo randomized trial of three marketed milk preparations enriched with calcium and vitamins (D and K) on bone mass and bone turnover markers from biological fluids in premenopausal Caucasian women. Nutr Hosp 2018;35(5):1174-1185
DOI: http://dx.doi.org/10.20960/nh.1800
In vivo randomized trial of three marketed milk preparations enriched with calcium and vitamins (D and K) on bone mass and bone turnover markers from biological fluids in premenopausal Caucasian women Ensayo clínico aleatorizado del efecto sobre la masa ósea de tres preparados lácteos comercializados enriquecidos con calcio y vitaminas (D y K)María Dolores Barnuevo1, Javier Marhuenda1, Miriam Aldeguer1, María Salud Abellán1, Pilar Zafrilla Rentero1, Carlos J. Contreras1, Isabel Guillén1, Marta Hernández2 and Francisco Javier López1
1Faculty of Health Sciences. Universidad Católica de San Antonio. Murcia, Spain. 2Department of Quality and Nutrition. Corporación Alimentaria Peñasanta. CAPSA. Granda, Asturias. Spain
Palabras clave:
Osteoporosis. Masa ósea. Contenido de la masa ósea. Densidad de la masa ósea.
Resumen Introducción: la osteoporosis es una enfermedad ósea metabólica que conduce a un aumento de la fragilidad ósea y un mayor riesgo de fractura.
Objetivos: el principal objetivo fue determinar la efectividad de la ingesta diaria de tres productos lácteos diferentes enriquecidos con vitaminas y calcio para mejorar el proceso de remodelado óseo.
Métodos: se emplearon tres productos lácteos fortificados con calcio y vitamina D. Se realizó un estudio paralelo, aleatorizado, doble ciego y unicéntrico. Para determinar los cambios en el estado óseo, se determinaron las siguientes mediciones: contenido de la masa ósea (CMO), densidad de la masa ósea (DMO), T-score y Z-score en diferentes lugares anatómicos, además de marcadores bioquímicos. El seguimiento se realizó durante 18 meses en mujeres premenopáusicas, las cuales fueron sometidas a los mismos procedimientos de seguimiento: extracción de sangre, recolección de orina y absorciometría de rayos X (DEXA). El seguimiento se llevó a cabo en tres ocasiones: primero, en el mes 0 (baseline); en segundo lugar, en el mes 9 (en mitad del tratamiento); y finalmente, en el mes 18 (el final del tratamiento).
Resultados: la mayoría de las localizaciones anatómicas mostraron que el contenido y la densidad ósea disminuyeron entre el 0,5% y el 1,5%. El factor T-score y el factor Z-score aumentaron en la columna lumbar después del tratamiento con los productos lácteos. Por otra parte, el cambio más notable en los biomarcadores de la resorción ósea fue observado por la fosfatasa ácida resistente a tartrato, la cual aumentó entre un 20,7% y un 29,5% después de la ingesta de los diferentes productos. Tras el tratamiento, se observaron cambios en la concentración de biomarcadores relacionados con la resorción ósea, sobre todo en niveles de PTH-I, desoxipiridinolina y NTx.
Conclusiones: la ingesta de los tres productos lácteos mejora la masa ósea en la columna lumbar, lo que lleva a cambios importantes en la concentración de biomarcadores de la resorción ósea. La fosfatasa ácida resistente al tartrato parece estar influenciada por la ingesta de los tres productos lácteos. Sin embargo, no se han encontraron diferencias significativas entre los diferentes productos lácteos. Por lo tanto, la ingesta de productos lácteos en sí parece ser más determinante que la suplementación en micronutrientes de los diferentes productos.
Key words:
Osteoporosis. Bone mass. Bone mass content. Bone mass density.
Abstract Introduction: osteoporosis is a metabolic bone disease that leads to increased bone fragility and increased risk of fracture.
Objectives: the aim of the present research was to determine the effectiveness of a diary intake of three different dairy products (250 ml) enriched with vitamins and calcium on decreasing bone mass.
Methods: the present study is a comparative trial of three dairy products fortified with calcium and vitamin D, parallel, randomized, double-blind and single-center. Bone mass content (BMC), bone mass density (BMD), T-score and Z-score were measured in different locations, besides biochemical markers along 18 months in premenopausal women. Two hundred and ten volunteers from all the three groups were submitted to the same monitoring procedures, consisting on blood extraction, urine collection and energy X-ray absorptiometry (DEXA) done in the laboratory. The monitoring was carried on three times, first at month 0 (baseline), the second at month 9 (in the middle of the treatment) and, finally, at month 18 (the end of the treatment).
Results: the majority of anatomical locations showed both BMC and BMD decrease ranging between 0.5% and 1.5%. The T-score and the Z-score increased in lumbar spine after the treatment with the dairy products. Moreover, the most noteworthy change on the biomarkers of bone resorption was showed by plasmatic tartrate-resistant acid phosphatase (TRAP), with and increase between 20.7% and 29.5% after the intake of the different products.
Conclusions: therefore, the intake of the three dairy products improves the bone mass in lumbar spine, leading to important changes in the concentration of biomarkers of bone resorption. Especially, tartrate-resistant acid phosphatase seems to be strongly influenced by the intake of every dairy product. However, no significant differences were found between the different dairy products used in the present study. Therefore, the intake of dairy product seems to be more determinant than micronutrients supplementation.
Received: 24/01/2018 • Accepted: 16/03/2018
©Copyright 2018 SENPE y ©Arán Ediciones S.L. Este es un artículo Open Access bajo la licencia CC BY-NC-SA (http://creativecommons.org/licenses/by-nc-sa/4.0/).

1175
[Nutr Hosp 2018;35(5):1174-1185]
IN VIVO RANDOMIZED TRIAL OF THREE MARKETED MILK PREPARATIONS ENRICHED WITH CALCIUM AND VITAMINS (D AND K) ON BONE MASS AND BONE TURNOVER MARKERS FROM BIOLOGICAL FLUIDS IN PREMENOPAUSAL CAUCASIAN WOMEN
INTRODUCTION
Osteoporosis is a metabolic bone disease characterized by decreased bone mass and impaired microarchitecture of bone tis-sue, leading to increased bone fragility and increased risk of fracture (1,2). Some factors could contribute to reducing bone mass and increasing bone fragility, such as incapacity to reach optimal peak bone mass, bone loss owing to increased resorption, or erroneous replacement of lost bone due to decreased bone formation (3).
For the correct control of osteoporosis, it is important to maxi-mize peak bone mass, preventing rapid bone loss occurring after menopause, for women, and in the elderly (4). A correct nutrition is essential for maximizing peak bone mass. In fact, nutrients as calcium, magnesium, vitamin D or vitamin K, casein peptides or isoflavones are able to determine and promote healthy bone metabolism (5-7). Calcium is a key nutrient for maximizing peak bone mass and the maintenance of bone mass during adult life (8,9). Milk and dairy products provide great amounts of calcium, vitamin D, phosphorus, and proteins (mostly casein), which may enhance calcium absorption and mineral retention (10). Milk and dairy products constitute about 70% of dietary intake of calcium, supporting a balance diet (10).
Regarding dairy consumption and bone turnover, previous studies have reported an improvement of bone turnover both in pre- and post-menopausal women (11-14). Moreover, previous studies also suggest that regular milk consumption is associated with an increase on bone mass density (BMD) and bone mass content (BMC). In premenopausal women undergoing secondary causes of osteoporosis, the treatment of this primary cause should be the management to increase bone health (15). However, despite the importance of prevention of osteo-porosis, there is a lack of scientific literature related to dietary inter-vention on premenopausal women (16).
The aim of the present research was to determine the effective-ness of a diary intake of three different milky products enriched with vitamins and minerals on decreasing bone mass and bone turnover biomarkers.
MATERIAL AND METHODS
DAIRY PRODUCTS
The nutritional composition of the dairy products is displayed in table I. The common ingredients used for the elaboration of each one were: partly skimmed milk, milk proteins, calcium salts and stabilizers (E-450 and E-452). However, they differ in some details. CALACT60 contained vitamin D, while CALDOB54 con-tained five stabilizers (E-450, E-452, E-460, E-466 and E-407). In turn, CALNAT48 contained calcium salts from a different source than CALACT60 and CALDOB54, besides vitamins D and K
2. The
quantity of each dose of product was 250 ml.
VOLUNTEER INCLUSION
A total of 210 healthy female young volunteers were selected for the study. Finally, only 181 patients entered in the study. For inclusion in the study, female volunteers must remain in their premenopausal stage. Exclusion criteria were chronic diseases, chronic consumption of drugs, or inadequate feeding habits. Informed and signed consent of each individual involved in the trial was obtained.
Due to the homogenization of the groups, volunteers were homogenized in the three groups to study. Both the BMI and the age of all the volunteers were determined, with slight statistical variation (p > 0.05). The age of the volunteers was 39.2 ± 4.6 years old (p > 0.05). Volunteers were divided in the groups result-ing in the following age-stratification: 38.9 ± 5.0 years old for the CALNAT48 group, 40.0 ± 4.8 years old for the CALDOB54 group and 38.7 ± 4.9 years old for the CALACT60 group.
Regarding weight and height, IMC of volunteers were 25.78 ± 5.1. After distribution of the groups, volunteers from CALNAT48, CALDOB54 and CALACT60 group showed IMC 25.9 ± 5.1, 27.4 ± 5.3 and 24.2 respectively.
Table I. Nutritional composition of the dairy products
CALACT60 CALNAT48 CALDOB54
Energetic value 44 kcal (184 kJ) 43 kcal (182 kJ) 44 kcal (184 kJ)
Proteins 3.6 g 3.3 g 3.5 g
Hydrates 4.6 g 4.6 g 4.6 g
Sugars 4.6 g 4.6 g 4.6 g
Fats 1.3 g 1.3 g 1.3 g
Saturated fats 0.9 g 0.9 g 0.9 g
Sodium 0.07 g 0.10 g 0.10 g
Calcium 160 mg 160 mg 240 mg
Phosphorus 130 mg 105 mg 105 mg
Vitamin D 1 µg 1 µg -
Vitamin K2 - 18 µg -

1176 M. D. Barnuevo et al.
[Nutr Hosp 2018;35(5):1174-1185]
Figure 1.
Graphical representation of the in vivo study.
STUDY DESIGN
The present study is a comparative trial of three dairy products fortified with calcium and vitamin D, parallel, randomized, dou-ble-blind and single-center. The study was previously approved by the scientific committee of the Catholic University of Murcia and the Ethical Committee of Scientific Investigation (ECSI). Initially, the total 181 volunteers were randomly divided into three study groups: group CALNAT48, composed by 59 subjects; group CALDOB54, composed by 59 subjects; and group CALACT60, composed by 63 subjects. However, due to the length of the treatment some volun-teers left the study. Randomization was accomplished by parallel design, in which volunteers followed the treatment to which they were randomized during the duration of the trial. Therefore, the final composition of the groups was: 40 volunteers in CALNAT48 group, 34 volunteers in CALDOB54 group and 40 volunteers in CALACT60 group. The graphical distribution of the study is displayed in figure 1.
Dairy products were given to the volunteers monthly. In order to ensure compliance on study endorsement, dairy products supplying was accompanied by a food intake questionnaire. Therefore, both dairy supplying and dairy intake monitoring were repeated every month.
Volunteers from all the three groups were submitted to the same monitoring procedures, consisting on blood extraction, urine collection and energy X-ray absorptiometry (DEXA) done in the laboratory. The monitoring was carried on three times: first at month 0 (baseline), the second at month 9 (in the middle of the treatment) and, finally, at month 18 (end of the treatment).
STATISTICAL ANALYSIS
For the descriptive analysis, demographics and other baseline characteristics of the test, subjects have been described using
descriptive statistical indices, for patients overall and for each of the groups studied. Continuous variables were described using measures of central tendency (mean) and dispersion measures (standard deviation). Meanwhile, categorical variables were described by tables of absolute and relative frequencies. The comparison of categorical variables was performed using the Chi-square test and the comparison of continuous variables, using the Student’s t-test.
The changes from baseline in bone mineral density (DEXA val-ues) were compared between groups using a model of analysis of variance for repeated measures: a within-subject factor (time: initial, month 9 and month 18) and a between-factor (product ingested: CALNAT48, CALDOB54 or CALACT60). The statistical distribution was accomplished by Tukey and Bonferroni, accepting a significance level minor than 0.05 (p < 0.05).
The analysis of variance for repeated measures was also used for the establishment of the differences between the different dairy products. In addition, a study of linear correlation test by Pearson linear correlation between radiological variables and the dietary intake of calcium and vitamins D and K was also carried out.
PARAMETERS STUDIED
Urinary and blood analysis
The measurement of blood and urine samples allowed knowing the concentration of different markers of bone remodeling activity and certain biochemical variables related to bone metabolism.
The blood parameters measured were: creatinine (mg/dl) by kinetic measurement; uric acid (mg/dl) by enzymatic measure-ment; calcemia, phosphorus and magnesium (mg/dl) by spectro-photometric measurement; bone alkaline phosphatase (mcg/l) by immunoassays; tartrate-resistant acid phosphatase (TRAP) (UI/l) by kinetic measurement; osteocalcin (ng/ml) and vitamin D (1.25 dihydroxycholecalciferol) (pg/ml) by radioimmunoassay; and intact parathyroid hormone (pg/ml) by chemiluminescence.
Densitometry analysis
Despite being clinical, analytical and radiological markers that can approximate the diagnosis of osteoporosis, the basic diag-nostic tool is bone densitometry. Generally, it is developed at the lumbar (L1-L4 or L2-L4) or femoral regions (neck, trochanter and Ward’s triangle). Densitometry analysis represents good accuracy and reliability (coefficient of variation: 0.5-3%, accuracy error: 3-5%), being a rapid technique that subjects the patient to very low radiation. For the determination of the densitometry values, an X-ray densitometer Norland® XR-46 linear beam DXA (pencil beam) was used. It was equipped by an anode stationary air-cooled tube as emitting source of X-ray, with a constant potential of 100 kV, anode current of 1.3 mA and 0.5 mm section focal point.

1177
[Nutr Hosp 2018;35(5):1174-1185]
IN VIVO RANDOMIZED TRIAL OF THREE MARKETED MILK PREPARATIONS ENRICHED WITH CALCIUM AND VITAMINS (D AND K) ON BONE MASS AND BONE TURNOVER MARKERS FROM BIOLOGICAL FLUIDS IN PREMENOPAUSAL CAUCASIAN WOMEN
The parameters provided by densitometry were: BMC (g) and BMD (g/cm2). These values were expressed as mean values ± SD. The parameters were measured at the lumbar spine (L2-L4), femoral neck, trochanteric region and total hip.
Bone densitometry, in addition to measuring bone mineral den-sity (BMC or BMD) of a particular individual in absolute and relative terms, allows comparison of population-based reference values using the T and Z scales or scores. T-score describes the com-parison between individual BMC and BMD of young (20-35 years old) and healthy same-sex adults. That is, the coefficient T-score reflects the amount of bone mass of an individual regarding the maximum amount of bone mass that presents the population to which they belong. Finally, the Z-score informs about the distribu-tion of the volunteers on the studied population. Z-score describes the comparison between individual BMD and BMD of individuals of the same age and sex. Physiologically, this value should remain constant over time. The individual changes on the bone mineral density of a patient run parallel to changes produced in the cor-responding population (age and sex).
The World Health Organization (WHO), through a group of experts, establishes the densitometric criteria used as a param-eter for the above-mentioned T-score. They standardized the risk of fracture, being largely accepted nowadays. It has been estab-lished that for each standard deviation decreasing the T-score of bone mass, the relative risk of fracture increases approximately 1.5-2 times.
RESULTS
Both BMI and age of all the volunteers were determined, with a very small statistical variation (p > 0.05).
BIOMARKERS OF BONE RESORPTION
In the present study, the concentration of the different biomark-ers varied along the 18 months of the intervention. The differences observed varied depending on the individual biomarkers.
The urinary excretion of deoxypyridinoline increased along the 18 months of the study after the intake of the different beverages compared to baseline (Fig. 2). However, the changes observed were not statistically significant (p > 0.05). Sim-ilarly, the urinary excretion of deoxypyridinoline at month 9 did not showed statistically significant differences compared to baseline or month 18 (p > 0.05). Finally, no differences were observed after the intake of the different types of dairy beverages (p > 0.05).
Other compounds released during the process of bone resorp-tion are the C-telopeptide (ICTP, CTX) and amino-terminal (NTx) collagen. They have shown a significant correlation with BMD in pre- and postmenopausal women. Therefore, CTX and NTx are considered as the most useful markers of bone resorption in clinical practice (17,18).
Figure 2.
Evolution of biomarkers of bone resorption along the 18 months of intervention.
baseline
baseline baseline
deox
ypyr
idin
olin
e
Tartr
ate-
resi
stan
t ac
id p
hosp
hata
se
month 9
month 9 month 9
month 18
month 18 month 18
NTx

1178 M. D. Barnuevo et al.
[Nutr Hosp 2018;35(5):1174-1185]
In turn, the urinary excretion of NTx increased after the intake of CALNAT48 and the intake of CALDO54 while decreased after the intake of CALACT60 during 18 months. Despite noteworthy, those changes in the excretion of NTx were not statistically signif-icant (p > 0.05). Similarly, changes observed after nine months of treatment did not showed to be statistically significant (p > 0.05). As observed for deoxypyridinoline, no differences were found after the intake of the different types of dairy beverages (p > 0.05).
The most noteworthy change on the biomarkers of bone resorption was showed by plasmatic TRAP. At month 9, differ-ences were statistically significant when compared with baseline (p < 0.05). Similarly, those differences remained statistically significant after 18 months of treatment (p < 0.05), reaching increases up to 29.5%, 20.7% and 28% after the intake of CALNAT48, CALDOB54 and CALACT60, respectively. No dif-ferences were observed between the intakes of the three dairy preparations.
BIOMARKERS OF BONE FORMATION
The values of osteocalcin did not varied at month 9 after the intake of any dairy beverage. Similarly, osteocalcin did not show an increase after the whole time of treatment (18 months). In fact, the intake of CALACT60 during 18 months derived on the non-statistically significant decrease of plasmatic osteocalcin (p > 0.05). Finally, the values observed after the intake of every beverage were similar between the different beverages.
Plasmatic level of intact parathyroid hormone (PTH-I) showed a similar trend than previously observed for osteocalcin, with non-significant differences (Fig. 3). After the intake of every dairy beverage, values of intact parathyroid hormone remained unchanged at month 9 (p > 0.05), but increased too slightly at month 18. Analyzing the evolution of alkaline phosphatase in every group of study, a non-significant increment during the first nine months after the intake of CALACT60 and CALDOB54 was found
Figure 3.
Evolution of biomarkers of bone formation throughout the 18 months of intervention.

1179
[Nutr Hosp 2018;35(5):1174-1185]
IN VIVO RANDOMIZED TRIAL OF THREE MARKETED MILK PREPARATIONS ENRICHED WITH CALCIUM AND VITAMINS (D AND K) ON BONE MASS AND BONE TURNOVER MARKERS FROM BIOLOGICAL FLUIDS IN PREMENOPAUSAL CAUCASIAN WOMEN
(Fig. 3). In the second half of the treatment period (from month 9 to month 18) a decrease up to initial values in this variable was observed. Only the intake of CALACT60 derived on the reduction of the concentration of alkaline phosphatase between months 9 and 18 (p < 0.05). No significant differences were observed after the evolution of the three types of dairy products during 18 months.
The variation observed in the plasmatic concentration of vita-mins and minerals was homogenous. The evolution of plasmatic vitamin D, phosphatemia and magnesemia during the 18-month study showed statistically significant increases (p < 0.05) (Fig. 3). In turn, the evolution of calcemia during the 18 months of the study, regardless of the type of dairy beverage consumed, decreased significantly (p < 0.05). Therefore, consuming fortified milk produces an increase in plasmatic values of vitamin D, an increase in values of phosphatemia, the increase of magnesemia, and the decrease of calcemia values. Finally, the evolution of the three different groups after consuming the different types of dairy beverages for 18 months did not varied between groups.
BONE MINERAL CONTENT (BMC) AND BONE MINERAL DENSITY (BMD)
The main objective of this study was the comparative analysis of the in vivo effect of the intake of three types of dairy products, differing in their content on calcium and vitamin D. The compar-ison between the three types of milk in response to the changes
observed in BMC and BMD in various anatomical regions during 18 months did not varied widely. Therefore, the three types of dairy product had the same effectiveness in modifying those den-sitometry variables, preventing or reducing bone loss.
The baseline parameters of the volunteers are showed in table II. The evolution of the BMC along the 18 months of treatment was different depending on the area studied. In this way, the values of BMC obtained in lumbar spine, femoral neck, trochanteric region and total hip did not follow a uniform trend (Fig. 4).
The results obtained after the measurement of BMC in the dif-ferent locations are different depending on the measurement date. At month 9, the evolution of the BMC measured in the lumbar spine, trochanteric region and total hip did not present significant differences in any case (p > 0.05). Therefore, those volunteers belonging to the groups CALNAT48, CALDOB54 and CALACT60 showed similar BMC values when measured in these three areas at month 9. However, despite non-significant, some variations are noteworthy. The BMC measured in the lumbar spine and tro-chanteric region at month 9 showed increased values (p > 0.05) after treatment with CALDOB54 and CALACT60, but decreased (p > 0.05) in the CALNAT48 group. Moreover, the BMC mea-sured in total hip showed very slight modifications (p > 0.05), decreasing after the treatment with CALNAT48 and CALACT60 and increasing after the treatment with CALDOB54. Finally, the evolution of the BMC measured in the femoral neck at month 9 showed a statistically significant decrease (p < 0.031) of 6.7% in the CALACT60 group. Meanwhile, the BMC measured in the femoral neck in the CALNAT48 and CALDOB54 groups increased
Table II. Baseline parameters of the volunteers of the study
BMC BMD T-score Z-score
Lumbar spine
CALNAT48 48.34 ± 7.36 1.075 ± 0.150 0.241 ± 1.444 0.435 ± 1.335
CALDOB54 46.07 ± 7.21 1.078 ± 0.135 0.233 ± 1.238 0.450 ± 1.194
CALACT60 44.08 ± 7.93 1.039 ± 0.149 -0.094 ± 1.427 0.129 ± 1.354
Femoral neck
CALNAT48 4.59 ± 0.79 0.960 ± 0.133 1.107 ± 1.228 1.336 ± 1.198
CALDOB54 4.32 ± 0.78 0.909 ± 0.108 0.599 ± 0.964 0.875 ± 0.999
CALACT60 4.53 ± 1.20 0.889 ± 0.127 0.519 ± 1.198 0.773 ± 1.199
Throcanteric region
CALNAT48 8.60 ± 1.76 0.746 ± 0.111 1.590 ± 1.068 1.590 ± 1.068
CALDOB54 8.16 ± 1.58 0.693 ± 0.113 1.092 ± 0.839 1.111 ± 1.829
CALACT60 8.13 ± 2.26 0.695 ± 0.111 1.148 ± 1.143 1.158 ± 1.139
Total hip
CALNAT48 32.44 ± 4.85 0.995 ± 0.111 - -
CALDOB54 31.05 ± 3.55 0.916 ± 0.113 - -
CALACT60 30.34 ± 5.45 0.932 ± 0.111 - -
BMC: bone mineral content (g ± SD); BMD: bone mineral density (g/cm2 ± SD). T-score (units) and Z-score (units).

1180 M. D. Barnuevo et al.
[Nutr Hosp 2018;35(5):1174-1185]
Figure 4.
Bone mass content (BMC) values of the different regions evaluated for each studied group at different times of intervention. Values are expressed as g.
in a minor extent as compared with the decrease observed in the CALACT60 group. Therefore, the evolution of BMC during the first nine months of treatment did not showed a significant decrease, except in case of the BMC measured in the femoral neck in the patients of the CALACT60 group.
The benchmark of the evolution of the three groups throughout the 18 months of treatment did not reported significant differ-ences on the BMC compared to the values obtained at month 9 (p > 0.05). The BMC measured in the lumbar spine and total hip was quite similar after nine and 18 months of treatment with the three dairy products. Regarding the trochanteric region, the BMC of the CALDOB54 group suffered a drop, while the BMC of the CALNAT48 and CALACT60 groups increase slightly. Finally, the BMC measured in the femur neck decreased (p > 0.05) in the three groups, especially in CALDOB54.
The comparison between BMC values at baseline and those obtained after 18 months of treatment did not show significant results. The sole statistically significant decrease was found in the BMC measured in the femur neck. In turn, the BMC mea-sured in the lumbar spine increased (p > 0.05) after the intake of CALACT60 and CALDOB54 after 18 months of treatment. Finally, the BMC measured in the trochanteric region and in total hip after 18 months of treatment remained at similar values than at baseline.
As previously observed for the study of the BMC, the evolution of the bone mineral density (BMD) did not present a uniform pat-tern. Baseline values are showed in table II.
At month 9, the BMD observed in the lumbar spine did not show any change compared to the baseline values. However, despite being non-statistically significant, some variations were observed in the lumbar spine, femur neck, trochanteric region and total hip due to the intake of CALNAT48, CALDOB54 and CALACT60 (Fig. 5). After the intake of CALNAT48, the BMD presented a decrease of 1.1%, 1.5% and 1% when measured in the femur neck, tro-chanteric region and total hip, respectively. On the contrary, the intake of CALNAT48 lead to 1.2% higher values of BMD measured in the lumbar spine. The oral administration of CALDOB54 leads to a decrease of 1% and 1% when measured in the femur neck and total hip, respectively. In turn, the BMD values obtained in the lumbar spine and trochanteric region were very similar than those obtained at baseline (minor than 1%). Finally, the BMD observed after the intake of CALACT60 was 3% minor when measured in femur neck, while the measurement in the lumbar spine, trochan-teric region and total hip did not show significant differences.
As observed before, the study of the evolution of the three groups throughout the 18 months did not report significant dif-ferences on the BMD measured in the lumbar spine, femur neck, trochanteric region or total hip (p > 0.05). However, a minor

1181
[Nutr Hosp 2018;35(5):1174-1185]
IN VIVO RANDOMIZED TRIAL OF THREE MARKETED MILK PREPARATIONS ENRICHED WITH CALCIUM AND VITAMINS (D AND K) ON BONE MASS AND BONE TURNOVER MARKERS FROM BIOLOGICAL FLUIDS IN PREMENOPAUSAL CAUCASIAN WOMEN
(p > 0.05) BMD was found when measured in the lumbar spine in the CALNAT48 group at month 18. Similarly, the measurement of the BMD in the trochanteric region and total hip also showed minor values (p > 0.05) in the CALNAT48 group and CALACT60, respectively. It is noteworthy that the majority of the BMD values obtained did not differ from month 9 to month 18.
The comparison between the values of BMD obtained at the end of the treatment did not differ widely from the values obtained at baseline. As a whole, the BMD measured in the lumbar spine and femur neck did not vary significantly after the 18 months of treatment, compared to the initial values. Only the CALNAT48 group showed a slight diminution in the BMD values obtained in the trochanteric region after the whole treatment. Similarly, the BMD measured in the total hip showed to be reduced in all the three groups, especially in the CALACT60 group.
T-SCORE AND Z-SCORE
The determination of the T-score was done in the lumbar spine, femur neck and trochanteric region (Table II). The results through-out the 18 months of treatment are showed in figure 6.
At month 9, the T-score determined in the lumbar spine did not decrease in any of the groups. In fact, a slightly increase was observed in the CALNAT48 group, although it was non-signifi-
Figure 5.
Bone mass density (BMD) values of the different regions evaluated for each studied group at different times of intervention. Values are expressed as g/cm2.
cant (p > 0.05). Moreover, unless non-statistically significant (p > 0.05), some changes were observed when measured in the femur neck. The T-score determined in the femur neck showed a diminution of 0.102 units, 0.048 units and 0.107 units after the intake of CALNAT48, CALDOB54 and CALACT60, respectively. Meanwhile, the T-score determined in the trochanteric region did not decrease after nine months of treatment in the CALNAT48 group or the CALACT60 group. In turn, the CALDOB54 showed a little increment in the T-score determined in the trochanteric region.
The trend followed after 18 months of treatment was similar in all the three regions determined, showing no significant differenc-es after the whole treatment (p > 0.05). It is noteworthy that the T-score measured in the lumbar spine was higher after 18 months of treatment than at month 9, in case of volunteers from the CALBOD54 and CALACT60 groups. Meanwhile, the CALNAT48 group showed a decrease in the T-score value compared to that obtained at month 9. The T-score determined in the trochanteric region did not vary from the middle of the treatment (at month 9) to the end of the study (at month 18) in any of the groups. The T-score determined in the femur neck followed a similar trend, without significant changes at the end of the treatment, compared to month 9.
Finally, the final conclusions comparing the values obtained at the end of the treatment with those obtained at baseline were concluding.

1182 M. D. Barnuevo et al.
[Nutr Hosp 2018;35(5):1174-1185]
Figure 6.
T-score and Z-score values of the different regions evaluated for each studied group at different times of intervention. Results are expressed as units.
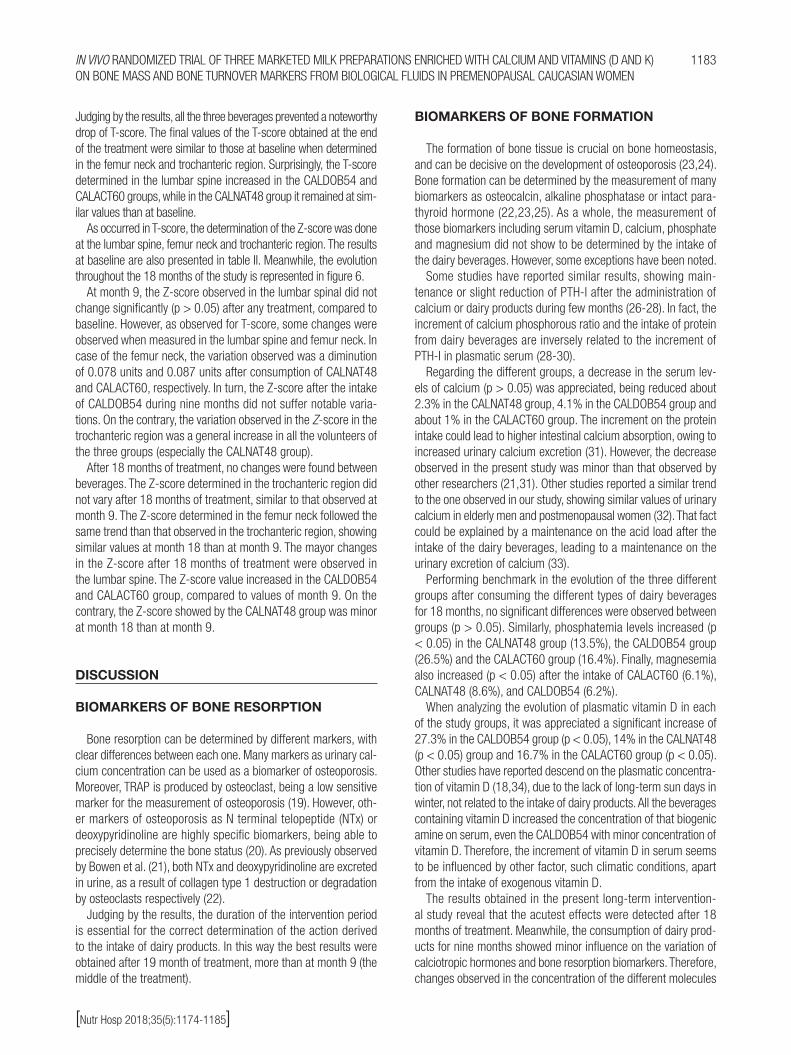
1183
[Nutr Hosp 2018;35(5):1174-1185]
IN VIVO RANDOMIZED TRIAL OF THREE MARKETED MILK PREPARATIONS ENRICHED WITH CALCIUM AND VITAMINS (D AND K) ON BONE MASS AND BONE TURNOVER MARKERS FROM BIOLOGICAL FLUIDS IN PREMENOPAUSAL CAUCASIAN WOMEN
Judging by the results, all the three beverages prevented a noteworthy drop of T-score. The final values of the T-score obtained at the end of the treatment were similar to those at baseline when determined in the femur neck and trochanteric region. Surprisingly, the T-score determined in the lumbar spine increased in the CALDOB54 and CALACT60 groups, while in the CALNAT48 group it remained at sim-ilar values than at baseline.
As occurred in T-score, the determination of the Z-score was done at the lumbar spine, femur neck and trochanteric region. The results at baseline are also presented in table II. Meanwhile, the evolution throughout the 18 months of the study is represented in figure 6.
At month 9, the Z-score observed in the lumbar spinal did not change significantly (p > 0.05) after any treatment, compared to baseline. However, as observed for T-score, some changes were observed when measured in the lumbar spine and femur neck. In case of the femur neck, the variation observed was a diminution of 0.078 units and 0.087 units after consumption of CALNAT48 and CALACT60, respectively. In turn, the Z-score after the intake of CALDOB54 during nine months did not suffer notable varia-tions. On the contrary, the variation observed in the Z-score in the trochanteric region was a general increase in all the volunteers of the three groups (especially the CALNAT48 group).
After 18 months of treatment, no changes were found between beverages. The Z-score determined in the trochanteric region did not vary after 18 months of treatment, similar to that observed at month 9. The Z-score determined in the femur neck followed the same trend than that observed in the trochanteric region, showing similar values at month 18 than at month 9. The mayor changes in the Z-score after 18 months of treatment were observed in the lumbar spine. The Z-score value increased in the CALDOB54 and CALACT60 group, compared to values of month 9. On the contrary, the Z-score showed by the CALNAT48 group was minor at month 18 than at month 9.
DISCUSSION
BIOMARKERS OF BONE RESORPTION
Bone resorption can be determined by different markers, with clear differences between each one. Many markers as urinary cal-cium concentration can be used as a biomarker of osteoporosis. Moreover, TRAP is produced by osteoclast, being a low sensitive marker for the measurement of osteoporosis (19). However, oth-er markers of osteoporosis as N terminal telopeptide (NTx) or deoxypyridinoline are highly specific biomarkers, being able to precisely determine the bone status (20). As previously observed by Bowen et al. (21), both NTx and deoxypyridinoline are excreted in urine, as a result of collagen type 1 destruction or degradation by osteoclasts respectively (22).
Judging by the results, the duration of the intervention period is essential for the correct determination of the action derived to the intake of dairy products. In this way the best results were obtained after 19 month of treatment, more than at month 9 (the middle of the treatment).
BIOMARKERS OF BONE FORMATION
The formation of bone tissue is crucial on bone homeostasis, and can be decisive on the development of osteoporosis (23,24). Bone formation can be determined by the measurement of many biomarkers as osteocalcin, alkaline phosphatase or intact para-thyroid hormone (22,23,25). As a whole, the measurement of those biomarkers including serum vitamin D, calcium, phosphate and magnesium did not show to be determined by the intake of the dairy beverages. However, some exceptions have been noted.
Some studies have reported similar results, showing main-tenance or slight reduction of PTH-I after the administration of calcium or dairy products during few months (26-28). In fact, the increment of calcium phosphorous ratio and the intake of protein from dairy beverages are inversely related to the increment of PTH-I in plasmatic serum (28-30).
Regarding the different groups, a decrease in the serum lev-els of calcium (p > 0.05) was appreciated, being reduced about 2.3% in the CALNAT48 group, 4.1% in the CALDOB54 group and about 1% in the CALACT60 group. The increment on the protein intake could lead to higher intestinal calcium absorption, owing to increased urinary calcium excretion (31). However, the decrease observed in the present study was minor than that observed by other researchers (21,31). Other studies reported a similar trend to the one observed in our study, showing similar values of urinary calcium in elderly men and postmenopausal women (32). That fact could be explained by a maintenance on the acid load after the intake of the dairy beverages, leading to a maintenance on the urinary excretion of calcium (33).
Performing benchmark in the evolution of the three different groups after consuming the different types of dairy beverages for 18 months, no significant differences were observed between groups (p > 0.05). Similarly, phosphatemia levels increased (p < 0.05) in the CALNAT48 group (13.5%), the CALDOB54 group (26.5%) and the CALACT60 group (16.4%). Finally, magnesemia also increased (p < 0.05) after the intake of CALACT60 (6.1%), CALNAT48 (8.6%), and CALDOB54 (6.2%).
When analyzing the evolution of plasmatic vitamin D in each of the study groups, it was appreciated a significant increase of 27.3% in the CALDOB54 group (p < 0.05), 14% in the CALNAT48 (p < 0.05) group and 16.7% in the CALACT60 group (p < 0.05). Other studies have reported descend on the plasmatic concentra-tion of vitamin D (18,34), due to the lack of long-term sun days in winter, not related to the intake of dairy products. All the beverages containing vitamin D increased the concentration of that biogenic amine on serum, even the CALDOB54 with minor concentration of vitamin D. Therefore, the increment of vitamin D in serum seems to be influenced by other factor, such climatic conditions, apart from the intake of exogenous vitamin D.
The results obtained in the present long-term intervention-al study reveal that the acutest effects were detected after 18 months of treatment. Meanwhile, the consumption of dairy prod-ucts for nine months showed minor influence on the variation of calciotropic hormones and bone resorption biomarkers. Therefore, changes observed in the concentration of the different molecules

1184 M. D. Barnuevo et al.
[Nutr Hosp 2018;35(5):1174-1185]
indicate that long-intervention periods might be necessary in order to reach significant differences in the variation of bone remodeling biomarkers.
BONE MINERAL CONTENT (BMC) AND BONE MINERAL DENSITY (BMD)
Most clinical trials concerning the efficacy of different products for the prevention or treatment of osteopenia and osteoporosis use bone mineral content and bone mineral density as primary vari-ables (35). Increased values of BMD about 1.5% can be under-stood as beneficial for the bone maintenance and maximized peak bone mass in young volunteers. For example, Uenishi et al. (36) reported increased values of BMD of 1.57% after consumption of a dairy product compared to placebo (0.3%). As commented before, some nutrients from dairy products can be beneficial for the treatment or prevention of osteoporosis. Calcium, phospho-rus or vitamin D can determine the effectiveness of milk and dairy products in the treatment of oleuropenia and osteoporosis (4,23,35).
The determination of BMD and BMC after nine months of treatment did not show significant changes after the intake of any of the dairy beverages. Therefore, the acute treatment with dairy products could not be enough to exert beneficial effects on BMD or BMC. In fact, the different studies carried out with dairy products on the BMD and BMC content have a length of several months (7,36,37). However, other studies reported healthy bene-fits after few months of treatment with dairy products, as Uenishi et al. (36), who found increased values of BMD after six months of treatment in young female volunteers.
The evolution of BMD and BMC during the 18 months of intake was different depending on the region studied. In case of BMD measured in the lumbar spine, no significant changes were appre-ciated, so BMC did not show a significant increase. In other ana-tomical locations, both BMC and BMD showed a decrease rang-ing between 0.5% and 1.5%. Contrarious to premenopausal and postmenopausal women who suffer an unavoidable loss of bone mass and bone mineral density, the BMD of young population, as adolescents, increases until reaching their maximum bone peak (2,4,9). Previous researchers have shown that increment even in control patients administering placebo product, instead of dairy products (38,39). Toheed (2016), in a study with postmenopausal rural women, recently reported that more than half of the women had either low BMD or osteoporosis, significantly related to low intake of milk and milk products (40). The results obtained in this study are similar to those observed in other studies of sim-ilar characteristics, based on the consumption of mineral- and vitamin-enriched milk, reducing the loss of bone mass (41,42).
T-SCORE AND Z-SCORE
The evolution of the Z-score throughout the whole study showed different tendencies, regarding the location of the measurement.
The Z-score of the trochanteric region remains at similar values than that observed at baseline. Meanwhile, the determination of the Z-score in the femur neck showed a tiny decrease compared to baseline parameters. Finally, the Z-score determined in the lumbar spine showed an increase at the end of the treatment in all the volunteers of the three groups, being statistically significant in the CALDOB54 group (p < 0.05).
Therefore, consumption of fortified dairy products produces a positive effect in the Z-score values. Their consumption prevented the decrease of that parameter and even increased when it was measured in the lumbar spine.
The analysis of the T-score and Z-score provides clarifications to the above conclusions. The T-score and the Z-score deter-mined in the femur neck and the trochanteric region showed no or slight differences compared to baseline, which indicates the capability of reducing bone loss. Noteworthy, the T-score and the Z-score determined in the lumbar spine increased after the treatment with the three types of dairy products. Specially, the intake of CALDOB54 was able to increase both the T-score and the Z-score (Z-score in a statistically significant way). Therefore, for the lumbar region, increases achieved in these scores confirm the results obtained in other studies (42). In the femoral region (neck and trochanter) results are different; intake of different types of milk had no effect improving bone mass in this region, delaying bone loss. These results are comparable to those of other studies, reporting mayor changes for the lumbar spine than in the femoral region (42-44).
Despite carrying out the present investigation in the best pos-sible way, the article presents some limitations. The development of the study is parallel, since the crossing of the groups is not possible for obvious reasons. The menstrual status of the volun-teers was not uniform throughout the study, given the personal variability of each one, and the age difference between them.
Regarding parameters, evaluated densitometry reports bone mineral density, but not bone architecture. In addition, bone den-sity is different in each location, so only a relative correlation between the results of the different measurement points can be evaluated. Therefore, results of densitometry provide information of the location where it was performed and should always be performed in the same location. Finally, given that densitometry results should be assessed for prediction of fracture risk, bone density is a major determinant of fracture risk. However, there are other fracture risk factors not associated with bone fracture.
CONCLUSIONS
In summary, the development of bone loss gets delayed along the different treatments. The intake of the three dairy products enriched with calcium and vitamin D for 18 months improves bone mass in the lumbar spine more than in the lumbar region. However, no differences in efficacy were obtained when compar-ing the three types of dairy products. Changes observed in the concentration of the different biomarkers indicate that long-in-tervention periods seem to be necessary for the disparity of bone

1185
[Nutr Hosp 2018;35(5):1174-1185]
IN VIVO RANDOMIZED TRIAL OF THREE MARKETED MILK PREPARATIONS ENRICHED WITH CALCIUM AND VITAMINS (D AND K) ON BONE MASS AND BONE TURNOVER MARKERS FROM BIOLOGICAL FLUIDS IN PREMENOPAUSAL CAUCASIAN WOMEN
remodeling biomarkers. Especially, tartrate-resistant acid phos-phatase seems to be strongly influenced by the intake of every dairy product. However, the differences observed between the different dairy products were not remarkable, which shows that none of the micronutrients studied is more important than another for the prevention of the disease. Therefore, the intake of dairy products leads to a less enhanced bone resorption in premeno-pausal women (regardless of the product supplementation), which is determinant for the prevention of osteoporosis.
REFERENCES
1. Harris ST, Watts NB, Jackson RD, Genant HK, Wasnich RD, Ross P, et al. Four-year study of intermittent cyclic etidronate treatment of postmenopausal osteoporosis: three years of blinded therapy followed by one year of open therapy. Am J Med 1993;95(6):557-67.
2. Meunier PJ. Prevention of hip fractures. Am J Med 1993;95(5):S75-S8.3. Raisz LG. Pathogenesis of osteoporosis: concepts, conflicts, and prospects.
J Clin Inv 2005;115(12):3318-25.4. Keen R. Osteoporosis: strategies for prevention and management. Best Pract
Res Clin Rheumatol 2007;21(1):109-22.5. Bügel S. Vitamin K and bone health. Proc Nutr Soc 2003;62(04):839-43.6. Ishimi Y, Miyaura C, Ohmura M, Onoe Y, Sato T, Uchiyama Y, et al. Selective
effects of genistein, a soybean isoflavone, on B-lymphopoiesis and bone loss caused by estrogen deficiency 1. Endocrinology 1999;140(4):1893-900.
7. Scholz-Ahrens KE, Schrezenmeir J. Effects of bioactive substances in milk on mineral and trace element metabolism with special reference to casein phosphopeptides. Br J Nutr 2000;84(S1):147-53.
8. Dawson-Hughes B. Calcium insufficiency and fracture risk. Osteoporosis Int 1996;6:37-41.
9. Heaney RP. Bone health. Am J Clin Nut 2007;85(1):300S-3S.10. Guéguen L, Pointillart A. The bioavailability of dietary calcium. J Am Coll Nutr
2000;19(Suppl 2):119S-36S.11. Fogelholm G, Sieva H, Kukkonen-Harjula T, Pasanen M. Bone mineral density
during reduction, maintenance and regain of body weight in premenopausal, obese women. Osteoporosis Int 2001;12(3):199-206.
12. Jensen LB, Kollerup G, Quaade F, Sørensen OH. Bone mineral changes in obese women during a moderate weight loss with and without calcium supplementation. J Bone Miner Res 2001;16(1):141-7.
13. Ricci TA, Chowdhury HA, Heymsfield SB, Stahl T, Pierson RN, Shapses SA. Calcium supplementation suppresses bone turnover during weight reduction in postmenopausal women. J Bone Miner Res 1998;13(6):1045-50.
14. Ricci TA, Heymsfield SB, Pierson RN, Stahl T, Chowdhury HA, Shapses SA. Moderate energy restriction increases bone resorption in obese postmeno-pausal women. Am J Clin Nut 2001;73(2):347-52.
15. Cohen A, Shane E. Treatment of premenopausal women with low bone mine-ral density. Curr Osteoporosis Rep 2008;6(1):39-46.
16. Méndez-Sánchez L, López Casimiro K, Winzenberg TM, Tugwell P, Clark P. Calcium and vitamin D for increasing bone mineral density in premenopausal women. The Cochrane Library 2017.
17. Garnero P. New biochemical markers of bone turnover. IBMS BoneKEy 2008;5(3):84-102.
18. Rapuri PB, Kinyamu HK, Gallagher JC, Haynatzka V. Seasonal changes in calciotropic hormones, bone markers, and bone mineral density in elderly women. J Clin Endocrinol Metab 2002;87(5):2024-32.
19. Bonjour J-P, Benoit V, Rousseau B, Souberbielle J-C. Consumption of vitamin D-and calcium-fortified soft white cheese lowers the biochemical marker of bone resorption TRAP 5b in postmenopausal women at moderate risk of osteoporosis fracture. J Nut 2012;142(4):698-703.
20. Jakob C, Zavrski I, Heider U, Brux B, Eucker J, Langelotz C, et al. Bone resorption parameters (carboxy-terminal telopeptide of type-I collagen [ICTP], amino-terminal collagen type-I telopeptide [NTx], and deoxypyridinoline [Dpd]) in MGUS and multiple myeloma. Eur J Haematol 2002;69(1):37-42.
21. Bowen J, Noakes M, Clifton PM. A high dairy protein, high-calcium diet minimizes bone turnover in overweight adults during weight loss. J Nut 2004;134(3):568-73.
22. Kassen D, Lath D, Lach A, Evans H, Chantry A, Rabin N, et al. Myeloma impairs mature osteoblast function but causes early expansion of osteo-progenitors:
temporal changes in bone physiology and gene expression in the KMS12BM model. Brit J Haematol 2016;172(1):64-79.
23. World Health Organization (WHO). Prevention and management of osteopo-rosis. Series WTR. Contract no.: 921. Geneva: WHO; 2013.
24. Glover SJ, Gall M, Schoenborn-Kellenberger O, Wagener M, Garnero P, Boo-nen S, et al. Establishing a reference interval for bone turnover markers in 637 healthy, young, premenopausal women from the United Kingdom, France, Belgium, and the United States. J Bone Miner Res 2009;24(3):389-97.
25. Yoshida H, Nagaya T, Hayashi T, Takahashi H, Kawai M. Milk consumption decreases activity of human serum alkaline phosphatase: a cross-sectional study. Metabolism 1995;44(9):1190-3.
26. Storm D, Porter REES, Musgrave K, Vereault D, Patton C, Kessenich C, et al. Calcium supplementation prevents seasonal bone loss and chan-ges in biochemical markers of bone turnover in elderly New England women: a randomized placebo-controlled trial 1. J Clin Endocrinol 1998;83(11):3817-25.
27. Chee WSS, Suriah A, Chan SP, Zaitun Y, Chan YM. The effect of milk supple-mentation on bone mineral density in postmenopausal Chinese women in Malaysia. Ost Int 2003;14(10):828-34.
28. Manios Y, Moschonis G, Panagiotakos D, Farajian P, Trovas G, Lyritis G. Chan-ges in biochemical indices of bone metabolism in post-menopausal women following a dietary intervention with fortified dairy products. J Hum Nutr Diet 2009;22(2):156-65.
29. Kerstetter JE, O’Brien KO, Caseria DM, Wall DE, Insogna KL. The impact of dietary protein on calcium absorption and kinetic measures of bone turnover in women. J Clin Endocrinol Metab 2005;90(1):26-31.
30. Kerstetter JE, Svastisalee CM, Caseria DM, Mitnick ME, Insogna KL. A thres-hold for low-protein-diet-induced elevations in parathyroid hormone. Am J Clin Nut 2000;72(1):168-73.
31. Kerstetter JE, O’Brien KO, Insogna KL. Dietary protein affects intestinal cal-cium absorption. Am J Clin Nut 1998;68(4):859-65.
32. Roughead ZKF, Johnson LK, Lykken GI, Hunt JR. Controlled high meat diets do not affect calcium retention or indices of bone status in healthy postme-nopausal women. J Nut 2003;133(4):1020-6.
33. Heaney RP. Excess dietary protein may not adversely affect bone. J Nut 1998;128(6):1054-7.
34. Woitge HW, Scheidt-Nave C, Kissling C, Leidig-Bruckner G, Meyer K, Grauer A, et al. Seasonal variation of biochemical indexes of bone tur-nover: results of a population-based study 1. J Clin Endocrinol Metab 1998;83(1):68-75.
35. Caroli A, Poli A, Ricotta D, Banfi G, Cocchi D. Invited review: dairy intake and bone health: a viewpoint from the state of the art. J Dairy Sci 2011;94(11):5249-62.
36. Uenishi K, Ishida H, Toba Y, Aoe S, Itabashi A, Takada Y. Milk basic protein increases bone mineral density and improves bone metabolism in healthy young women. Osteoporos Int 2007;18(3):385-90.
37. Varenna M, Binelli L, Casari S, Zucchi F, Sinigaglia L. Effects of dietary calcium intake on body weight and prevalence of osteoporosis in early postmenopau-sal women. Am J Clin Nut 2007;86(3):639-44.
38. Aoe S, Toba Y, Yamamura J-I, Kawakami H, Yahiro M, Kumegawa M, et al. Controlled trial of the effects of milk basic protein (MBP) supplementation on bone metabolism in healthy adult women. Biosci Biotechnol Biochem 2001;65(4):913-8.
39. Zhang Z-Q, Ma X-M, Huang Z-W, Yang X-G, Chen Y-M, Su Y-X. Effects of milk salt supplementation on bone mineral gain in pubertal Chinese adolescents: a 2-year randomized, double-blind, controlled, dose-response trial. Bone 2014;65:69-76.
40. Toheed R. Bone mineral density (BMD) status and its determinants in rural women of reproductive age. J Rawalpindi Med Coll 2016;20(2):129-31.
41. Ferrar L, Van Der Hee R, Berry M, Watson C, Miret S, Wilkinson J, et al. Effects of calcium-fortified ice cream on markers of bone health. Osteoporos Int 2011;22(10):2721-31.
42. Chen Y, Xiao Y, Xie B, Zhang Q, Ma X, Li N, et al. Effect of milk powder supplementation with different calcium contents on bone mineral density of postmenopausal women in Northern China: a randomized controlled dou-ble-blind trial. Calcif Tissue Int 2016;98(1):60-6.
43. Ho SC, Chen Y-M, Woo JL, Lam SS. High habitual calcium intake attenuates bone loss in early postmenopausal Chinese women: an 18-month follow-up study. J Clin Endocrinol Metab 2004;89(5):2166-70.
44. Cheng Q, Zhu X, Zhang X, Li H, Du Y, Hong W, et al. A cross-sectional study of loss of muscle mass corresponding to sarcopenia in healthy Chinese men and women: reference values, prevalence, and association with bone mass. J Bone Miner Metab 2014;32(1):78-88.

NutriciónHospitalaria
Trabajo Original Epidemiología y dietética
ISSN (electrónico): 1699-5198 - ISSN (papel): 0212-1611 - CODEN NUHOEQ S.V.R. 318
Correspondence: Dinorah González Castell. Research Center on Nutrition and Health, National Institute of Public Health (INSP). Av. Universidad, 655. Col. Sta. Mª Ahuacatitlán. 62100 Cuernavaca, Morelos. México e-mail: [email protected]
Jiménez Aguilar A, González Castell D, Flores Aldana M, Mundo Rosas V, Hernández Cordero S, García Feregrino R. Dietary intake and adequacy in Mexican preschool children: National Health and Nutrition Survey 2012. Nutr Hosp 2018;35(5):1186-1194
DOI: http://dx.doi.org/10.20960/nh.1843
Source of funding: Mexican Ministry of Health for its financial support.
Dietary intake and adequacy in Mexican preschool children: National Health and Nutrition Survey 2012 Ingesta dietética y adecuación en preescolares mexicanos: Encuesta Nacional de Nutrición y Salud 2012
Alejandra Jiménez Aguilar1, Dinorah González Castell2, Mario Flores Aldana2, Verónica Mundo Rosas1, Sonia Hernández Cordero3 and Raquel García Feregrino2
1Center for Evaluation and Survey Research and 2Nutrition and Health Research Center. National Institute of Public Health. Mexico. 3Department of Health. Universidad Iberoamericana. Ciudad de México. México
Palabras clave:
Dieta. Nutrimentos. Niños preescolares. Encuestas nacionales. Nutrición infantil. México.
Resumen Objetivo: estimar la ingesta de energía, nutrimentos y adecuación de la dieta de preescolares mexicanos de la Encuesta Nacional de Salud y Nutrición 2012.
Material y métodos: se recogieron los datos dietéticos de niños < 5 años (n = 1.212) a través de un cuestionario semicuantitativo de fre-cuencia de consumo de alimentos (CSFCA). El consumo y la adecuación de energía y nutrimentos fueron calculados según las características sociodemográficas.
Resultados: la mediana de ingesta de energía fue de 1.252 kcal (adecuación 104%). Se hallaron adecuaciones mayores al 100% para calcio, zinc, vitamina C, folato, vitamina B12, vitamina A y mediana de grasa saturada. Se observaron adecuaciones bajas para fibra, hierro, grasa poliinsaturada y vitamina D, e ingesta menor para la región sur comparada con otras regiones. Las ingestas y adecuaciones fueron más altas en área urbana en comparación con el área rural, excepto para fibra. Los niños indígenas presentaron ingestas y adecuaciones bajas.
Conclusiones: la dieta de niños preescolares mexicanos presenta riesgo de deficiencias y excesos, con marcadas diferencias entre estratos sociodemográficos.
Key words:
Diet. Nutrients. Preschool children. National surveys. Child nutrition. Mexico.
Abstract Objective: to estimate energy, nutrient intake and diet adequacy in preschool-aged children based on data from the Mexican National Health and Nutrition Survey 2012.
Material and methods: dietary data in children < 5 years (n = 1,212) collected through a Semi-quantitative Food Frequency Questionnaire (SFFQ) were analyzed. Energy and daily nutrient intakes and adequacies were calculated comparing by sociodemographic characteristics.
Results: median daily energy intake was 1,252 kcal (adequacy 104%). Adequacies above 100% were observed for calcium, zinc, vitamin C, folate, vitamin B12, vitamin A and median of saturated fat. Low percent adequacies were observed for fiber, iron, polyunsaturated fat and vitamin D. Intakes were lower in the southern region compared to other regions. Most intakes and adequacies were higher in urban compared to rural areas, but fiber had the opposite trend. Indigenous children had low intakes and percent adequacies.
Conclusions: risks of dietary deficiencies and excess are present in Mexican preschool-aged children, with marked differences across socio-demographic strata.
Received: 14/02/2018 • Accepted: 16/06/2018
©Copyright 2018 SENPE y ©Arán Ediciones S.L. Este es un artículo Open Access bajo la licencia CC BY-NC-SA (http://creativecommons.org/licenses/by-nc-sa/4.0/).

1187
[Nutr Hosp 2018;35(5):1186-1194]
DIETARY INTAKE AND ADEQUACY IN MEXICAN PRESCHOOL CHILDREN: NATIONAL HEALTH AND NUTRITION SURVEY 2012
INTRODUCTION
A series of nationally representative health and nutrition surveys (1988, 1999, 2006, 2012) have shown a “polarized model of nutrition transition” in Mexico (1) characterized by a rapid increase in nutrition-related non-communicable diseases, a reduction of infectious diseases (2), excessive energy intake and reductions in physical activity (3). However, recent studies have shown that micronutrient deficiencies and iron deficiency anemia are still sig-nificant public health problems, affecting the most vulnerable age and gender groups (4). The consequences of nutrition deficiencies during childhood lead to growth retardation, decreased learning capacity and impaired immune response. Additionally, under-nou-rishment is causally related to a higher risk of chronic disease in adulthood (5). The coexistence of excess and deficiency conditions complicates the epidemiologic overview in Mexico.
Nowadays, public health decision-makers have to deal with both sides of malnutrition and this is the greatest challenge the public health system in Mexico has to overcome.
The objective of this paper is to estimate and compare energy and nutrient intake and dietary adequacy according to biological, social and nutritional characteristics in a nationally representative sample of Mexican children aged one to four years of age.
MATERIAL AND METHODS
POPULATION AND SAMPLE SIZE
Data for this analysis were obtained from the Mexican National Health and Nutrition Survey 2012 (ENSANUT-2012 by its Spanish acronym). The ENSANUT-2012 was developed from October 2011 to May 2012. This included a probabilistic sample of 50,000 hou-seholds representative at national, regional and state levels. The sampling framework for selecting the households was provided by the National Institute of Statistics, Geography and Informatics. The study population for the present analysis included preschool aged children, age range 1-4 years.
DIETARY INFORMATION
A random subsample of approximately one-sixth of the 50,000 total households participating in ENSANUT-2012 was selected (6). Dietary information was obtained for 1,338 children from one to four years of age. Standardized personnel administered a semi-quantitative food frequency questionnaire (SFFQ) to women or caregivers. The questionnaire included 140 food items clas-sified in 14 groups (dairy products; fruits; vegetables; fast food; meat, sausages and cold cuts; fish and seafood; legumes; cereals and tubers; corn products; beverages; snacks, candies and des-serts; soups and creams; condiments; corn tortillas). The inter-viewers asked for the days of the week, times of the day, portion sizes and total portions consumed for each food item during a seven-day period before the interview.
ETHICS
Informed consent was obtained from parents or guardians in order to participate in the study. The protocol was previously approved by the Research Ethics Committee and Committee on Biosafety and Research at the National Institute of Public Health, Mexico.
OUTCOME VARIABLES DEFINITIONS
Intake
The estimated quantity of energy, fiber, and macro and micro-nutrients was calculated using food composition tables compiled by the INSP. The methodology and procedures have been des-cribed by Ramírez-Silva I et al. (7).
Energy intake, carbohydrates, proteins, lipids, fiber, vitamins A, C, B12, and D, folates, total iron, heme iron and non-heme iron, zinc, calcium and types of fats were reported.
Intake adequacy percentages
The percentage of energy adequacy was estimated based on the Estimated Energy Requirement. For carbohydrates and fat, 55% and 30%, respectively, of the energy derived from those macronutrients was used as adequacy values (7,8).
The adequacy of protein, zinc, vitamin C, vitamin B12, vitamin D, retinol equivalents and folates was calculated according to age as a percent of the Estimated Average Requirement (8-12).
For calcium and fiber, the adequate intake value was used since the estimated average requirement value has not been calculated due to lack of information (7,13).
OTHER VARIABLES FOR ENSANUT-2012 ANALYSES
Country regions
The country was divided into three regions: North (Baja Cali-fornia, Baja California Sur, Coahuila, Chihuahua, Durango, Nuevo León, Sonora, Tamaulipas); Mexico City/Central (Aguascalientes, Colima, Estado de México, Guanajuato, Jalisco, Michoacán, More-los, Nayarit, Querétaro, San Luis Potosí, Sinaloa, Zacatecas, Mexi-co City); and South (Campeche, Chiapas, Guerrero, Hidalgo, Oaxa-ca, Puebla, Quintana Roo, Tabasco, Tlaxcala, Veracruz, Yucatán).
Area of residency
The area of residency was classified according to the number of inhabitants, considering those with 2,500 or more people as urban, and those with < 2,500 as rural.
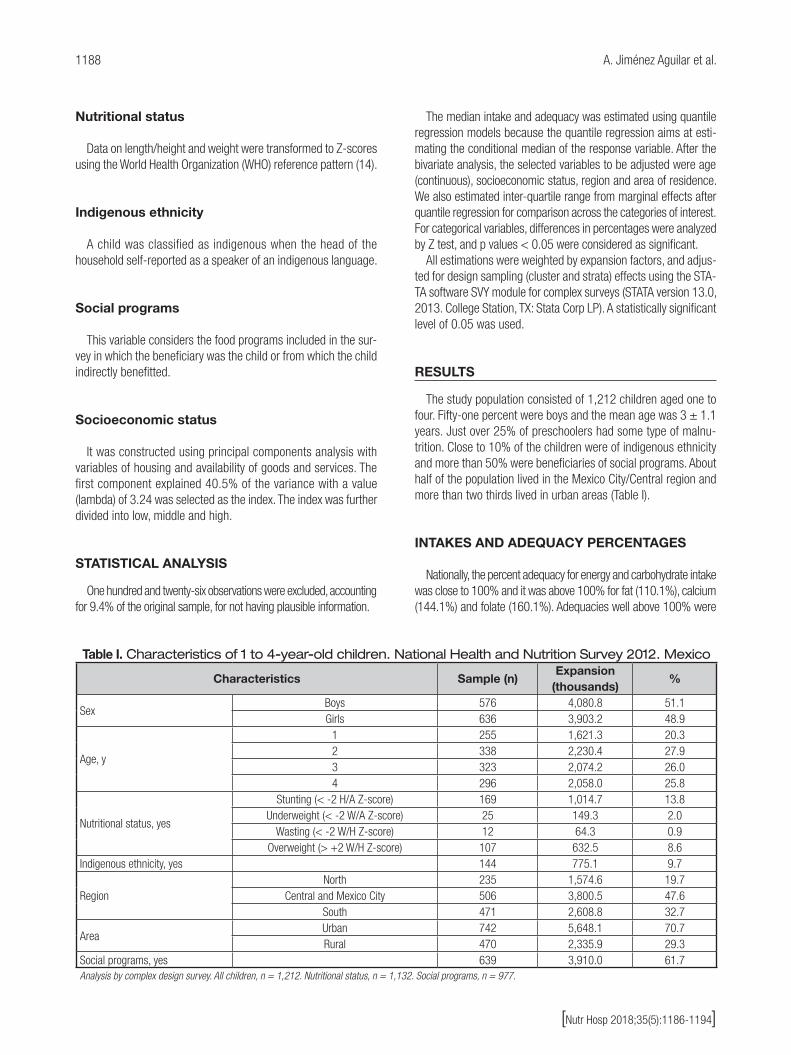
1188 A. Jiménez Aguilar et al.
[Nutr Hosp 2018;35(5):1186-1194]
Nutritional status
Data on length/height and weight were transformed to Z-scores using the World Health Organization (WHO) reference pattern (14).
Indigenous ethnicity
A child was classified as indigenous when the head of the household self-reported as a speaker of an indigenous language.
Social programs
This variable considers the food programs included in the sur-vey in which the beneficiary was the child or from which the child indirectly benefitted.
Socioeconomic status
It was constructed using principal components analysis with variables of housing and availability of goods and services. The first component explained 40.5% of the variance with a value (lambda) of 3.24 was selected as the index. The index was further divided into low, middle and high.
STATISTICAL ANALYSIS
One hundred and twenty-six observations were excluded, accounting for 9.4% of the original sample, for not having plausible information.
The median intake and adequacy was estimated using quantile regression models because the quantile regression aims at esti-mating the conditional median of the response variable. After the bivariate analysis, the selected variables to be adjusted were age (continuous), socioeconomic status, region and area of residence. We also estimated inter-quartile range from marginal effects after quantile regression for comparison across the categories of interest. For categorical variables, differences in percentages were analyzed by Z test, and p values < 0.05 were considered as significant.
All estimations were weighted by expansion factors, and adjus-ted for design sampling (cluster and strata) effects using the STA-TA software SVY module for complex surveys (STATA version 13.0, 2013. College Station, TX: Stata Corp LP). A statistically significant level of 0.05 was used.
RESULTS
The study population consisted of 1,212 children aged one to four. Fifty-one percent were boys and the mean age was 3 ± 1.1 years. Just over 25% of preschoolers had some type of malnu-trition. Close to 10% of the children were of indigenous ethnicity and more than 50% were beneficiaries of social programs. About half of the population lived in the Mexico City/Central region and more than two thirds lived in urban areas (Table I).
INTAKES AND ADEQUACY PERCENTAGES
Nationally, the percent adequacy for energy and carbohydrate intake was close to 100% and it was above 100% for fat (110.1%), calcium (144.1%) and folate (160.1%). Adequacies well above 100% were
Table I. Characteristics of 1 to 4-year-old children. National Health and Nutrition Survey 2012. Mexico
Characteristics Sample (n)Expansion
(thousands)%
SexBoys 576 4,080.8 51.1Girls 636 3,903.2 48.9
Age, y
1 255 1,621.3 20.32 338 2,230.4 27.93 323 2,074.2 26.04 296 2,058.0 25.8
Nutritional status, yes
Stunting (< -2 H/A Z-score) 169 1,014.7 13.8Underweight (< -2 W/A Z-score) 25 149.3 2.0
Wasting (< -2 W/H Z-score) 12 64.3 0.9Overweight (> +2 W/H Z-score) 107 632.5 8.6
Indigenous ethnicity, yes 144 775.1 9.7
RegionNorth 235 1,574.6 19.7
Central and Mexico City 506 3,800.5 47.6South 471 2,608.8 32.7
AreaUrban 742 5,648.1 70.7Rural 470 2,335.9 29.3
Social programs, yes 639 3,910.0 61.7Analysis by complex design survey. All children, n = 1,212. Nutritional status, n = 1,132. Social programs, n = 977.

1189
[Nutr Hosp 2018;35(5):1186-1194]
DIETARY INTAKE AND ADEQUACY IN MEXICAN PRESCHOOL CHILDREN: NATIONAL HEALTH AND NUTRITION SURVEY 2012
observed for protein (342.6%), zinc (250.8%), vitamin C (645.1%), vitamin B12 (333.9%), vitamin A (258.1%) and saturated fat (238.3). Low percent adequacies were observed for fiber (57.5%), iron (71.9%), polyunsaturated fat (74.6%) and vitamin D (11.7%). Adequacies for energy, calcium, zinc and vitamin C were higher in children aged one to two years compared with children three to four years of age, except for fiber, which was higher among the older children (Table II).
Intakes were lower in the South region compared to the other regions except for fiber, which presented the lowest
intake in the North compared to the South region. Also, the lowest adequacies for energy, iron and vitamin D were obser-ved in the South region. Most intakes were higher in urban compared to rural areas, as proteins, folate and saturated fat (Table III).
For most macro and micronutrients, indigenous children had lower intakes and percent adequacies, compared to non-indige-nous children, except for fiber which was slightly higher among indigenous children (Table IV).
Table II. Intake and percent adequacy of intake in 1 to 4-year-old children, national and by age groups. National Health and Nutrition Survey 2012. Mexico
Boys and girlsIntake/d
NationalAge groups
1-2 y 3-4 y Median (P25, P75) Median (P25, P75) Median (P25, P75)
Energy, kcal 1,252.3 (938.8, 1,557.7) 1,096.2‡ (803.9, 1,415.5) 1,355.1 (1,054.1, 1,710.4)Carbohydrates, g 165.8 (124.1, 215.5) 150.6‡ (105.7, 194.8) 185.8 (139.9, 235.1)Dietary fat, g 43.8 (31.5, 56.7) 39.1‡ (26.9, 52.1) 48.5 (35.6, 62.9)Protein, g 40.3 (29.4, 51.3) 35.5‡ (25.8, 48.1) 43.1 (33.3, 54.7)Dietary fiber, g 11.7 (8.0, 16.0) 10.3‡ (6.4, 14.8) 13.0 (9.1, 17.1)Sugars, g 83.5 (55.1, 109) 80.5* (48.3, 105.4) 87.1 (62.1, 112.1)Calcium, mg 811.7 (537.6, 1,103.5) 759.3‡ (473.8, 1,043.3) 859.9 (580.6, 1,192.6)Iron, mg 7.6 (5.3, 11.4) 7.1† (4.7, 11.0) 8.2 (5.9, 11.7)Heme iron, mg 0.223 (0.105, 0.374) 0.174‡ (0.068, 0.309) 0.258 (0.137, 0.432)Non-heme iron, mg 7.3 (5.1, 10.9) 6.8‡ (4.5, 10.7) 7.9 (5.8, 11.2)Zinc, mg 7.0 (5.1, 9.6) 6.7‡ (4.5, 9.2) 7.5 (5.7, 10.0)Vitamin C, mg 96.7 (56.7, 146.9) 97.3 (53.0, 152.7) 97.0 (59.6, 143.0)Folate, mcg 212.2 (146.9, 297.5) 184.6‡ (128.6, 266.7) 236.1 (164.5, 311.3)Vitamin B12, mg 2.6 (1.6, 3.8) 2.3‡ (1.3, 3.3) 2.8 (1.9, 4.1)Vitamin A, mcg ER 583.3 (380.9, 834.9) 570.3 (356.2, 792.6) 593.9 (416.2, 868.6)Vitamin D, IU 46.8 (27.2, 94.9) 46.5 (24.7, 102.0) 47.7 (29.1, 83.0)Saturated fat, g 19.4 (13.7, 25.8) 17.8‡ (12.0, 23.4) 21.4 (15.1, 28.1)Polyunsaturated fat, g 8.0 (5.7, 11.3) 7.0‡ (4.9, 10.0) 9.0 (6.4, 12.5)
Percent adequacy Energy 104.1 (79.5, 134.1) 107.8* (81.4, 138.6) 101.3 (78.6, 128.9)Carbohydrates 101.1 (92.8, 109.2) 101.3 (92.2, 109.7) 100.9 (92.9, 108.5)Fat 110.1 (98.4, 122.1) 108.5 (97.1, 122.4) 111.1 (99.1, 121.8)Protein 342.6 (264.2, 446.4) 354.4 (258.7, 460.9) 335.8 (266.5, 431.1)Dietary fiber 57.5 (38.2, 79.2) 54.1* (33.8, 77.0) 60.6 (41.3, 80.2)Calcium 144.1 (92.5, 201.3) 154.6† (96.1, 210.1) 131.3 (89.2, 187.5)Iron 71.9 (49.9, 108.3) 72.3 (47.3, 108.6) 72.6 (53.8, 107.6)Zinc 250.8 (173.7, 335.0) 264.6‡ (179.6, 366.6) 231.3 (165.4, 319.1)Vitamin C 645.1 (365.6, 1,037.0) 742.8‡ (403.6, 1,163.2) 546.3 (332.6, 897.2)Folate 160.1 (112.7, 226.8) 154.2 (107.7, 224.4) 164.7 (118.5, 229.5)Vitamin B12 333.9 (194.8, 495.6) 335.3 (189.5, 478.8) 334.4 (206.6, 511.7)Vitamin A 258.1 (169.3, 375.5) 267.6 (171.3, 376.7) 252.6 (171.7, 379.2)Vitamin D 11.7 (6.8, 23.7) 11.6 (6.2, 25.5) 11.9 (7.3, 20.7)Saturated fat 238.3 (200.1, 272.9) 237.3 (195.1, 273.9) 238.8 (203.6, 270.4)Polyunsaturated fat 74.6 (59.8, 91.1) 73.9 (57.2, 89.0) 74.9 (61.4, 93.2)Analysis by complex design survey, adjusted by U/R location and region and socioeconomic level. 95% confidence intervals. Statistically significant differences: *p < 0.1; †p < 0.05; ‡p < 0.01. For carbohydrates, fat and saturated fat considered at-risk when intake was above 100% of their requirement.

1190 A. Jiménez Aguilar et al.
[Nutr Hosp 2018;35(5):1186-1194]
Tab
le II
I. In
take a
nd
perc
ent
ad
eq
uacy
of in
take in
1 t
o 4
-year-
old
child
ren, natio
nal a
nd
by
reg
ion a
nd
are
a.
Natio
nal H
ealth
and
Nutr
itio
n S
urv
ey
2012
. M
exic
o
Inta
ke/d
Reg
ion
Are
a
No
rth
Cen
tral
and
Mex
ico
Cit
yS
out
hU
rban
Rur
al
Med
ian
(P25
, P75
)M
edia
n(P
25, P
75)
Med
ian
(P25
, P75
)M
edia
n(P
25, P
75)
Med
ian
(P25
, P75
)
Ener
gy, k
cal
1305
.2a†
(967
.2, 1
,692
.8)
1,30
4.2a‡
(958
.0, 1
,602
.8)
1,14
4.8b
(893
.8, 1
,410
.3)
1,27
5.3
(973
.0, 1
,557
.5)
1,19
6.8
(856
.2, 1
,558
.0)
Carb
ohyd
rate
s, g
163.
9(1
27.8
, 217
.2)
172.
7a†(1
23.7
, 228
.9)
156.
8b(1
22.4
, 195
.1)
166.
4(1
27.0
, 215
.4)
164.
2(1
16.9
, 215
.8)
Diet
ary
fat,
g51
.0a‡
(34.
3, 6
1.1)
44.6
b‡(3
1.7,
58.
3)38
.4c‡
(29.
7, 5
1.9)
45.1
†(3
2.4,
58.
0)40
.8(2
9.5,
53.
6)
Prot
ein,
g41
.1a‡
(31.
2, 5
1.2)
42.7
a‡(3
0.1,
53.
8)36
.2(2
7.3,
47.
7)41
.3†
(30.
2, 5
2.3)
37.8
(27.
6, 4
8.9)
Diet
ary
fiber
, g10
.4a‡
(7.2
, 14.
2)12
.7b
(8.4
, 17.
4)11
.1a†
(7.9
, 15.
1)11
.5(8
.1, 1
5.8)
12.2
(7.7
, 16.
5)
Suga
rs, g
86.3
a†(5
5.3,
114
.5)
88.1
a‡(5
7.0,
114
.2)
75.2
b(5
2.3,
98.
2)86
.7‡
(57.
1, 1
10.2
)76
.0(5
0.4,
106
.2)
Calc
ium
, mg
863.
1a†(5
45.0
, 1,0
88.1
)84
3.7a†
(582
.9, 1
,192
.8)
734.
0b(4
67.1
, 982
.7)
837.
9*(5
64.9
, 1,1
22.4
)74
8.2
(471
.6 ,
1,05
7.9)
Iron,
mg
8.1a‡
(5.3
, 11.
2)7.
8a *(5
.5, 1
2)7.
0b(5
.1, 1
0.6)
7.6
(5.5
, 11.
3)7.
6(4
.9, 1
1.6)
Hem
e iro
n, m
g0.
273a‡
(0.1
49, 0
.436
)0.
226a *
(0.0
97, 0
.377
)0.
189b
(0.0
91, 0
.332
)0.
234*
(0.1
09, 0
.388
)0.
197
(0.0
97, 0
.340
)
Non-
hem
e iro
n, m
g7.
7a†(5
.1, 1
0.7)
7.5a *
(5.3
, 11.
5)6.
7b(4
.9, 1
0.2)
7.3
(5.3
, 10.
8)7.
2(4
.7, 1
1.1)
Zinc
, mg
7.2a‡
(4.9
, 8.9
)7.
5(5
.5, 1
0.3)
6.2b
(4.7
, 8.8
)7.
2(5
.3, 9
.5)
6.7
(4.6
, 9.8
)
Vita
min
C, m
g82
.3a‡
(53.
4, 1
13.9
)11
3.0b
(64.
3, 1
71.3
)81
.6a‡
(47.
8, 1
31.2
)99
.6(5
8.4,
152
.1)
89.5
(52.
7, 1
34.1
)
Fola
te, m
cg22
3.6a *
(162
.1, 3
03.1
)21
9.3a†
(149
.4, 2
99.5
)19
5.1b
(134
.0, 2
91.2
)22
2.1‡
(153
.8, 3
08.6
)18
8.4
(130
.1, 2
70.7
)
Vita
min
B12
, mg
3.1a
(2.1
, 4.1
)2.
5b†(1
.5 ,
3.9)
2.3b‡
(1.4
, 3.6
)2.
7†(1
.6, 3
.9)
2.3
(1.4
, 3.6
)
Vita
min
A, m
cg E
R62
0.4a†
(455
.2, 8
82.1
)60
0.6a *
(364
.4, 8
77.6
)53
5.7b
(359
.9, 7
44.3
)59
2.5
(396
.2, 8
57.4
)56
1.1
(343
.9, 7
80.5
)
Vita
min
D, I
U54
.9a *
(30.
2, 1
07.1
)45
.7(2
8.1,
91.
8)43
.5b
(24.
2, 9
2.1)
49.0
(28.
9, 9
8.6)
41.5
(23.
2, 8
6.2)
Satu
rate
d fa
t, g
21.9
a‡(1
4.6,
27.
7)20
.3a‡
(14.
0, 2
6.9)
16.6
b(1
2.7,
23.
1)20
.0†
(14.
6, 2
6.3)
17.8
(11.
6, 2
4.6)
Polyu
nsat
urat
ed
fat,
g8.
9a(6
.1, 1
2.8)
7.9b†
(5.9
, 10.
9)7.
6b†(5
.2, 1
0.9)
8.0
(5.8
, 11.
2)7.
9(5
.4, 1
1.3)
Per
cent
ad
equa
cy
Ener
gy11
0.2a‡
(79.
6, 1
44.1
)10
7.7a‡
(82.
4, 1
37.8
)95
.0b
(75.
2, 1
22.6
)10
4.7
(81.
9, 1
33.7
)10
2.5
(73.
6, 1
35.0
)
Carb
ohyd
rate
s96
.4a
(89.
3, 1
04.7
)10
2.0b‡
(93.
8, 1
09.5
)10
2.6
b‡(9
3.5,
111
.4)
100.
5(9
2.6,
108
.1)
102.
4(9
3.4,
111
.7)
Fat
117.
6a(1
08.0
, 128
.2)
107.
7 b‡
(98.
2, 1
20.1
)10
9.1b‡
(93.
1, 1
21.2
)11
0.9
(99.
4, 1
23.1
)10
8.2
(96.
0, 1
19.5
)
Prot
ein
356.
4a†(2
78.3
, 444
.2)
355.
1a†(2
73.2
, 478
.3)
316.
1b(2
42.7
, 401
.3)
350.
0*(2
71.7
, 447
.6)
324.
8(2
46.3
, 443
.5)
Diet
ary
fiber
50.6
a‡(3
3.6,
71.
0)62
.2b
(39.
8, 8
6.3)
54.8
(38.
7, 7
3.9)
56.8
(38.
8, 7
8.0)
59.0
(36.
6, 8
2.2)
Calc
ium
148.
2(9
3.8,
204
.4)
150.
9a *(9
8.9,
211
.6)
131.
6b(8
2.4,
184
.4)
148.
2(9
5.9,
205
.8)
134.
0(8
4.2,
190
.4)
Iron
75.1
a(4
8.9,
107
.7)
73.8
(51.
6, 1
13.3
)67
.3b*
(48.
2, 1
01.3
)71
.6(5
1.9,
107
.0)
72.8
(45.
3, 1
11.3
)
Zinc
24
7.8
(171
.9, 3
25.4
)26
7.0a‡
(181
.7, 3
53.9
)22
9.1b
(163
.1, 3
13.2
)25
5.4
(177
.2, 3
32.1
)23
9.7
(165
.3, 3
41.9
)
Vita
min
C55
7.8a‡
(335
.2, 8
59.9
)73
0.5b
(397
.8, 1
,173
.7)
573.
2(3
37.0
, 944
.8)
662.
4(3
84.8
, 1,0
61.6
)60
3.1
(319
.1, 9
77.5
)
(Con
tinue
in th
e ne
xt p
age)

1191
[Nutr Hosp 2018;35(5):1186-1194]
DIETARY INTAKE AND ADEQUACY IN MEXICAN PRESCHOOL CHILDREN: NATIONAL HEALTH AND NUTRITION SURVEY 2012
Tab
le II
I (C
ont
.). Inta
ke a
nd
perc
ent
ad
eq
uacy
of in
take in
1 t
o 4
-year-
old
child
ren, natio
nal a
nd
by
reg
ion a
nd
are
a.
Natio
nal
Health a
nd
Nutr
itio
n S
urv
ey
2012
. M
exic
o
Inta
ke/d
Reg
ion
Are
a
No
rth
Cen
tral
and
Mex
ico
Cit
yS
out
hU
rban
Rur
al
Med
ian
(P25
, P75
)M
edia
n(P
25, P
75)
Med
ian
(P25
, P75
)M
edia
n(P
25, P
75)
Med
ian
(P25
, P75
)
Fola
te17
2.9a
(126
.5, 2
33.4
)16
2.1
(113
.6, 2
22.4
)14
9.5b†
(103
.2, 2
29.2
)16
6.6†
(116
.4, 2
31.2
)14
4.4
(104
.0, 2
16.3
)
Vita
min
B12
397.
1a(2
56.5
, 541
.7)
326.
6b†(1
84.5
, 493
.4)
306.
4b‡(1
72.7
, 470
.9)
338.
8(2
04.0
, 507
.2)
322.
1(1
72.7
, 467
.6)
Vita
min
A27
2.3
(197
.4, 3
99.7
)26
2.6
(165
.5, 3
92.4
)24
3.0
(157
.8, 3
36.2
)26
5.1
(174
.5, 3
85.5
)24
1.3
(156
.7, 3
51.4
)
Vita
min
D13
.7a
(7.6
, 26.
8)11
.4(7
.0, 2
3.0)
10.9
b *(6
.0, 2
3.0)
12.2
(7.2
, 24.
6)10
.4(5
.8, 2
1.5)
Satu
rate
d fa
t24
8.6a‡
(220
.3, 2
80.1
)24
0.4a *
(200
.5, 2
75.1
)22
8.9b
(187
.4, 2
65.5
)24
3.4‡
(207
.3, 2
76.6
)22
6.0
(182
.8, 2
64.0
)
Polyu
nsat
urat
ed fa
t78
.1a†
(63.
3, 9
2.4)
70.7
b(5
7.2,
85.
2)78
.0a‡
(61.
6, 9
8.8)
74.3
(59.
9, 8
9.8)
75.1
(59.
6, 9
4.3)
Anal
isys
by c
ompl
ex d
esig
n su
rvey
adj
uste
d by
U/R
loca
tion,
regi
on a
nd s
ocio
econ
omic
leve
l. 95
% c
onfid
ence
inte
rval
s. Di
ffere
nt le
tters
mea
n st
atist
ically
sig
nific
ant d
iffer
ence
s be
twee
n co
mpa
rison
gro
ups:
* p <
0.1
; † p <
0.0
5;
‡ p <
0.0
1.
DISCUSSION
At a national level, preschool-aged Mexican children have pro-tein, saturated fat, calcium, zinc, vitamins A, C, B-12 and folate intakes exceeding the current recommendations for age. In depth analyses suggest that high intake of these nutrients is explained not only by the consumption of foods in their natural form, but also by the consumption of fortified foods provided by National Nutrition Programs, like Prospera (15), Liconsa (16) and foods fortified by the food industry which are highly available in the market (data not shown). Mexican children consumption of dairy products (i.e. milk, and cheese) contributed significantly to protein, calcium, vitamin B12 and saturated fat intake, as well as zinc and vitamin A to a lesser degree and significantly higher energy intake compared with not-dairy intake consumers (17).
Preschool-aged children showed a high intake of folate mainly from a high consumption of fruits and vegetables, dairy products and ready-to-eat breakfast cereal, pastas, pies, cookies and sweets, all of them fortified by the food industry (18).
Another finding is the high intake of vitamin C among preschool Mexican children, which was eight times greater than the require-ments. This high intake can be explained by the consumption of fruits and vegetables, such as guava and mango, all rich in vitamin C.
It is important to note that highly processed foods are not only the main contributors of vitamin C and folate, but also of total energy, saturated fat, sodium and sugar among children (19,20).
We observed that, at a national level, Mexican preschool chil-dren have a low intake of dietary fiber, iron, vitamin D and polyun-saturated fats. A study of trends in dietary intake in Mexico in the 1980-2008 (21) period showed that there has been a significant increase in national consumption of poultry and eggs, oil and soda, while there has been a decrease in the consumption of those considered as basic foods in the Mexican diet such as tortillas and beans, an important source of fiber.
It is important to note that the diet in the Mexican population tends to be rich in legumes, which mainly contain non-heme iron and phytates, resulting in a lower bioavailability of dietary iron. In our study we used the Mexican reference to determine iron requirement, which already considered the lower bioavailability, thus overestimation of iron absorption has been avoided (9).
This study shows an extremely low intake of vitamin D. These results are consistent with ENSANUT-2006. An analysis in Mexi-can children 2-5 years of age showed that the prevalence of mar-ginal deficiency (< 50 nmol/l of 25-hydroxy-vitamin D) was 25% and insufficient vitamin D levels (< 75 nmol/l 25-hydroxy vitamin D) were observed in 55% of the children (22). This problem of low intake and vitamin D deficiency has been recently documented in Latin America (23).
In our population, the main dietary source of vitamin D is milk, which contributes more than 90% of intake for this vitamin. Currently, in Mexico, fortification/addition of milk with vitamin D is mandatory to 200 IU/l (24). However, based on the level of fortification, an individual would have to consume two liters of milk per day in order to meet the recommended vitamin D intake for preschool children (400 IU/d) (13).

1192 A. Jiménez Aguilar et al.
[Nutr Hosp 2018;35(5):1186-1194]
Table IV. Intake and percent adequacy of intake in children 1-4 years of age by ethnicity. National Health and Nutrition Survey 2012. Mexico
Indigenous ethnicity
Boys and girls Yes No
Intake/d Median (P25, P75) Median (P25, P75)
Energy, kcal 1191.2 (932.3, 1,394.8) 1258.2 (940.4, 1,570.8)
Carbohydrates, g 165.5 (122.1, 211.8) 165.9 (124.6, 215.5)
Dietary fat, g 39.6* (27.0, 49.5) 44.6 (32.0, 58.0)
Protein, g 35.6† (25.9, 45.2) 40.3 (29.9, 51.9)
Dietary fiber, g 13.7‡ (8.5, 17.0) 11.6 (8.0, 16.0)
Sugars, g 67.3‡ (44.5, 94.2) 84.4 (57.0, 109.7)
Calcium, mg 602.9‡ (431.9, 899.8) 832.9 (545.2, 1,117.2)
Iron, mg 7.2 (5.7, 10.4) 7.6 (5.3, 11.4)
Heme iron, mg 0.152‡ (0.064, 0.274) 0.231 (0.114, 0.389)
Non-heme iron, mg 7.0 (3.4, 10.0) 7.3 (5.1, 11.0)
Zinc, mg 6.4 (4.7, 8.7) 7.1 (5.2, 9.6)
Vitamin C, mg 71.7‡ (47.1, 133.4) 97.6 (58.1, 147.7)
Folate, mcg 190.7 (129.2, 250.9) 214.8 (149.3, 298.2)
Vitamin B12, mg 1.8‡ (1.2, 2.5) 2.7 (1.6, 3.9)
Vitamin A, mcg ER 454.3‡ (296.6, 738.2) 600.3 (396.6, 844.2)
Vitamin D, UI 41.1 (23.5, 85.2) 47.9 (27.8, 95.2)
Saturated fat, g 15.7‡ (10.2, 21.6) 19.7 (13.9, 26.2)
Polyunsaturated fat, g 7.3* (5.8, 10.0) 8.1 (5.7, 11.4)
Percent adequacy
Energy 99.1 (78.7, 124.3) 104.8 (79.8, 134.6)
Carbohydrates 106.2† (99.8, 115.3) 100.1 (92.1, 108.3)
Fat 101.5‡ (89.0, 113.9) 110.7 (99.5, 123.0)
Protein 324.4 (252.4, 411.2) 345.9 (266.1, 448.6)
Dietary fiber 65.4† (40.0, 83.1) 56.6 (37.9, 78.2)
Calcium 111.0‡ (71.7, 158.9) 147.6 (95.6, 205.5)
Iron 68.2 (51.0, 95.7) 72.6 (49.7, 108.8)
Zinc 231.4 (164.8, 308.5) 252.6 (175.5, 338.2)
Vitamin C 557.1 (307.4, 925.2) 649.9 (372.3, 1,044.6)
Folate 136.1‡ (95.4, 188.8) 162.3 (114.3, 229.2)
Vitamin B12 240.0‡ (151.4, 330.1) 344.1 (207.5, 504.8)
Vitamin A 209.9‡ (131.5, 340.2) 263.4 (175.6, 380.9)
Vitamin D 10.3 (5.9, 21.3) 12.0 (7.0, 23.8)
Saturated fat 201.5‡ (151.9, 237.4) 242.5 (204.7, 274.8)
Polyunsaturated fat 75.8 (60.8, 95.9) 74.4 (59.5, 90.7)
Analysis by complex design survey, adjusted by age, U/R location, region and socioeconomic level. 95% confidence intervals. Statistically significant differences: *p < 0.1; †p < 0.05; ‡p < 0.01.

1193
[Nutr Hosp 2018;35(5):1186-1194]
DIETARY INTAKE AND ADEQUACY IN MEXICAN PRESCHOOL CHILDREN: NATIONAL HEALTH AND NUTRITION SURVEY 2012
Our results show that a lower intake of important nutrients such as iron and polyunsaturated fats persists among preschool children of economically disadvantaged populations, such as children living in the southern region of the country (the poorest region in Mexico) and rural areas and indigenous children (25). This is mainly due to the quality and diversity of the diet, which are determined by the income, given that, in situations of food insecurity or economic crisis, families in poverty change their diet and certain foods consumption as whole grains, animal products, fruits and vegetables are negatively affected (26).
So, preschool-aged Mexican children have a saturated fat intake above what is recommended, along with a low intake of polyunsatu-rated fat compared to the current recommendations, similar results to high income countries (27,28). This is consistent with the fact that obesity and many nutrition-related chronic illnesses are not just determined by some risk factors in mid-adult life, but begin during fetal development and early infancy and childhood (29).
Similar results of excess intake of folate, vitamin A, zinc, as well as low intake of iron and fiber, have been reported in American preschoolers (30).
Dietary risk, particularly in relation to iron deficiency, was also observed. Studies describing the frequency and severity of anemia and associated nutritional variables indicated that iron deficiency is the main cause of anemia in Mexican children < 5 years (31).
This study presents some limitations. First, it is well known that the SFFQ is subject to various errors in its application and reporting. However, our personnel were trained and standardi-zed to apply it equally to all subjects (7), while the use of food frequency method has shown to be one of the best methods to estimate diet in young children (32) and the caretaker is a valid and useful strategy to obtain the information with respect to the child’s consumption (33).
Second, the intake of water-soluble vitamins like vitamin C and B complex may be overestimated because in the food composition tables used for these analyses, losses by cooking or industrial processes were not considered, nor were losses to vitamin degra-dation which occurs between the date of preparation of fortified food and the date of expiration (34).
The study has important strengths because these data derived from a national Mexican population survey that was representative of areas, regions and states of the country. The SFFQ instrument captures food habits from seven days before the interview, which diminished memory bias.
At a national level, the next steps could be aligned to interna-tional recommendations such as the 4th goal of 2015 Millennium Development Goals (35) for young children to improve comple-mentary feeding, in addition to breastmilk, as an important way to prevent under-nutrition and to reduce child mortality.
REFERENCES
1. Rivera J, Shamah T, Villalpando S, Cuevas L, Mundo V, Morales C. The nutri-tional status of the population in Mexico: changes in magnitude, distribution and tendencies towards poor nutrition from 1988 to 2006. In: Nutrición y pobreza: política pública basada en la evidencia. Chapter 1. Mexico: World
Bank; 2008. pp. 1-22. Available from: http://siteresources.worldbank.org/MEXICOINSPANISHEXT/Resources/NutricionyPobreza.pdf
2. Drewnowski A, Popkin BM. The nutrition transition: new trends in the global diet. Nutr Rev 1997;55:31-43.
3. Rivera J, Barquera S, Campirano F, Campos I, Safdie M, Tovar V. Epidemio-logical and nutritional transition in México: Rapid increase of non-commu-nicable chronic diseases and obesity. Public Health Nutr 2002;14:113-22. DOI: 10.1079/PHN2001282
4. De la Cruz V, Villalpando S, Mundo V, Shamah T. The prevalence of anemia in Mexican children and adolescents: comparison of three national surveys. Salud Publica Mex 2013;55:S180-9.
5. Engle PL, Black MM, Behrman JR, Cabral de Mello M, Gertler PJ, Kapiriri L, et al. The International Child Development Steering Group. Strategies to avoid the loss of developmental potential in more than 200 million children in the developing world. Lancet 2007;369:229-42. DOI: http://dx.doi.org/10.1016/S0140-6736(07)60112-3
6. Romero M, Shamah T, Franco A, Villalpando S, Cuevas L, Gutiérrez JP, et al. National Health and Nutrition Survey 2012: design and coverage. Salud Publica Mex 2013;55:332-40. Cited: Dec 7th, 2017. DOI: http://dx.doi.org/10.21149/spm.v55s2.5132
7. Ramírez-Silva I, Jiménez-Aguilar A, Valenzuela-Bravo D, Martínez B, Rodrí-guez S, Gaona EB, et al. Methodology for estimating dietary data from the semi-quantitative food frequency questionnaire of the Mexican National Heal-th and Nutrition Survey 2012. Salud Publica Mex 2016;58:629-38.
8. Institute of Medicine. Energy. In: Dietary reference intakes for energy, carbo-hydrates, fiber, fat, protein and amino acids (macronutrients). Washington, DC: Institute of Medicine, National Academies Press; 2005. pp. 107-264.
9. Bourges H, Casanueva E, Rosado JL. Nutrient intake recommendations for the Mexican population. Physiological Foundations I. México: Editorial Médica Panamericana; 2005. p. 398.
10. Institute of Medicine. Dietary reference intakes for: vitamin A, vitamin K, arsenic, boron, chromium, copper, iodine, iron, manganese, molybdenum, nickel, silicon, vanadium and zinc. Washington, DC: Institute of Medicine, National Academy Press; 2000. p. 773.
11. Institute of Medicine. Vitamin C. In: Dietary reference intakes for: vitamin C, vitamin E, selenium and carotenoids. Washington, DC: Institute of Medicine, National Academy Press; 2000. pp. 95-185.
12. Institute of Medicine. Folate: In: Dietary reference intakes for: thiamin, ribo-flavin, niacin, vitamin B6, folate, vitamin B12, pantothenic acid, biotin and choline. Washington, DC: Institute of Medicine, National Academy Press; 1998. pp. 196-284. Available from: https://www.ncbi.nlm.nih.gov/books/NBK114310/pdf/Bookshelf_NBK114310.pdf
13. Institute of Medicine. Dietary reference intakes for calcium and vitamin D. Washington, DC: National Academies Press; 2011. p. 1115. Cited: Dec 5th, 2017. Available from: https://www.ncbi.nlm.nih.gov/books/NBK56070/pdf/Bookshelf_NBK56070.pdf
14. Word Health Organization (WHO); Multicentre Growth Reference Study Group. WHO Child Growth Standards: length/height-for-age, weight-for-age, wei-ght-for-length, weight-for-height and body mass index-for-age - Methods and development. Geneva: WHO; 2006. p. 312.
15. Shamah T, Villalpando S, Rivera JA, Mundo V, Cuevas L, Jiménez A. Ferrous gluconate and ferrous sulfate added to a complementary food distributed by the Mexican nutrition program Oportunidades have a comparable efficacy to reduce iron deficiency in toddlers. J Pediat Gastroent Nutr 2008;47:660-6.
16. Shamah T, Villalpando S, Jáuregui A, Rivera JA. Overview of the nutritional status of selected micronutrients in Mexican children in 2006. Salud Publica Mex 2012;54(Suppl 2):146-51.
17. López N, Aburto T, Pedraza L, Sánchez T, Rivera JA. Dairy intake in the Mexi-can population: 2012 National Nutrition and Health Survey Results (ENSANUT 2012). FASEB J 2014;28:1(1018.9).
18. Food and Nutrition Board, Institute of Medicine. Panel on folate, other B vitamins and choline. Dietary reference intakes for thiamin, riboflavin, niacin, vitamin B6, folate, vitamin B12, pantothenic acid, biotin, and choline. Was-hington, DC: National Academy Press; 1998. p. 536.
19. Torres F. Changes in food demands as a factor for obesity in Mexico. In: Obesity in México. Recommendations for a state policy. México: Universidad Nacional Autónoma de México; 2012. pp. 125-44.
20. Stern D, Piernas C, Barquera S, Rivera JA, Popkin B. Caloric beverages were major sources of energy among children and adults in Mexico, 1999-2012. J Nutr 2014;144:949-56.
21. García P. La alimentación de los mexicanos. Cambios sociales y económicos, y su impacto en los hábitos alimenticios. México: Cámara Nacional de la Industria de Transformación; 2012. pp. 81-115. Cited: Dec 5th, 2017. Avai-

1194 A. Jiménez Aguilar et al.
[Nutr Hosp 2018;35(5):1186-1194]
lable from: http://clubnutricion.com.mx/educacion_continua/La%20alimen-tación%20de%20los%20mexicanos%20—%20Estudio%20completo.pdf
22. Flores M, Macías N, Lozada A, Sánchez LM, Díaz E, Barquera S. Serum 25-hydroxyvitamin D levels among Mexican children ages 2 y to 12 y: a national survey. Nutrition 2013;29:802-4.
23. Brito A, Cori H, Olivares M, Fernanda Mujica M, Cediel G, López de Romaña D. Less than adequate vitamin D status and intake in Latin America and the Caribbean: a problem of unknown magnitude. Food Nutr Bull 2013;34:52-64.
24. Secretaría de Salud. Goods and services. Foods and non-alcoholic beverages with modifications to their composition. Nutritional specifications. México: Secretaría de Salud. NOM-086-SSA-1-1994. Cited: Jan 6th, 2018. Available from: http://www.salud.gob.mx/unidades/cdi/nom/086ssa14.html
25. Mundo V, Rodríguez S, Shamah T. Energy and nutrient intake in Mexican children 1 to 4 years old. Results from the Mexican National Health and Nutrition Survey 2006. Salud Publica Mex 2009;51:530-9.
26. Mundo V, De la Cruz V, Jiménez A, Shamah T. Diversidad de la dieta y con-sumo de nutrimentos en niños de 24 a 59 meses de edad y su asociación con inseguridad alimentaria. Salud Publica Mex 2014;56:39-46. DOI: http://dx.doi.org/10.21149/spm.v56s1.5164
27. Troiano RP, Briefel R, Carroll MD, Bialostosky K. Energy and fat intakes of children and adolescents in the United States: data from the National Health and Nutrition Examination Surveys. Am J Clin Nutr 2000;72:1343S-53S.
28. Huybrechts I, De Henauw S. Energy and nutrient intakes by pre-school chil-dren in Flanders-Belgium. Br J Nutr 2007;98:600-10.
29. Dabelea D, Crume T. Maternal environment and the transgenerational cycle of obesity and diabetes. Diabetes 2011;60:1849-55.
30. Butte NF, Fox MK, Briefel RR, Siega-Riz AM, Dwyer JT, Deming DM, et al. Nutrient intakes of US infants, toddlers, and preschoolers meet or exceed dietary reference intakes. J Am Diet Assoc 2010;110(Suppl 12):27-37.
31. De la Cruz V, Villalpando S, Rebollar R, Shamah-Levy T, Méndez-Gómez Humarán I. Nutritional causes of anemia in Mexican children under 5 years. Results from the 2006 National Health and Nutrition Survey. Salud Publica Mex 2012;54:108-15.
32. Olukotun O, Seal N. A systematic review of dietary assessment tools for children age 11 years and younger. Infant Child Adolesc Nutr 2015;7:139-47.
33. Magarey A, Watson J, Golley RK, Burrows T, Sutherland R, McNaughton SA. Assessing dietary intake in children and adolescents: considerations and recommendations for obesity research. Int J Ped Obes 2011;6:2-11.
34. Freixas A, Díaz VP, Durán S, Gaete MC. Does vitamin consumption from fortified foods surpass the allowed limits? A study carried out on a young adult population from the metropolitan region of Chile. Nutr Hosp 2013;28:1201-9.
35. United Nations Development Program (UNDP). Building the Post-2015 Deve-lopment agenda; 2015. p. 42. Cited: Dec 5th, 2017. Available from: http://www.undp.org/content/dam/undp/library/MDG/Post2015-SDG/UNDP_Buil-ding%20the%20Post-2015%20Development%20Agenda_Final_2015.pdf?download.2015

NutriciónHospitalaria
Trabajo Original Otros
ISSN (electrónico): 1699-5198 - ISSN (papel): 0212-1611 - CODEN NUHOEQ S.V.R. 318
Correspondence: Alexandre Sérgio Silva. Universidade Federal da Paraíba. Centro de Ciências da Saúde. Campus I. Cidade Universitária. 58059-900 João Pessoa, PB. Brazile-mail: [email protected]
Lima FF, Silva TF, Neto MM, Toscano LT, Silva CSO, Silva AS. Effect of L-arginine intake on exercise-induced hypotension. Nutr Hosp 2018;35(5):1195-1200
DOI: http://dx.doi.org/10.20960/nh.1708
Effect of L-arginine intake on exercise-induced hypotensionEfecto de la ingestión de L-arginina en la hipotensión inducida por el ejercicio
Fabiano Ferreira de Lima, Taís Feitosa da Silva, Manoel Miranda Neto, Luciana Tavares Toscano, Cássia Surama Oliveira da Silva and Alexandre Sérgio Silva
Laboratory of Physical Training Studies Applied to Performance and Health. Federal University of Paraíba. Universidade Federal da Paraíba - UFPB. João Pessoa, Paraíba. Brazil
Palabras clave:
L-arginina. Hipertensión. Presión sanguínea. Hipotensión post-ejercicio. Ejercicio.
Resumen Objetivo: verificar si una sola dosis de L-arginina mejora la hipotensión post-ejercicio (HPE) en hipertensos.
Métodos: estudio doble ciego, placebo, aleatorizado con 20 hipertensos (51,47 ± 1,24 años). Se realizaron dos sesiones de ejercicio aeróbico para la ingestión de una dosis de 7 g de L-arginina (EX-LARG) o placebo (EX-PLA), más una sesión solo con ingestión de L-arginina (L-ARG). La presión arterial (PA) se midió en reposo y cada diez minutos durante un periodo de recuperación de 60 minutos después del ejercicio. Se tomaron muestras de sangre antes y después del ejercicio para el análisis de la concentración plasmática de nitrito y malondialdehído (MDA). Se usaron pruebas de ANOVA de una vía para comparar las condiciones iniciales y ANOVA de dos vías para evaluar las posibles diferencias en las respuestas de presión entre procedimientos.
Resultados: ambas sesiones, EX-LARG y EX-PLA, mostraron una reducción máxima similar de la presión arterial sistólica media (-6,58 ± 0,95 mmHg y -8,38 ± 1,29 mmHg, respectivamente, p = 0,28). Por otro lado, con respecto al componente diastólico, solo L-ARG fue capaz de promover HPE (-1,85 ± 0,44 mmHg), significativamente mejor que EX-PLA (+2,13 ± 0,62 mmHg, p < 0,01). L-ARG solo no dio como resultado un cambio significativo en la PA. El nitrito y la MDA se comportaron de manera similar entre los procedimientos.
Conclusión: una dosis única de L-arginina antes del ejercicio mejora la HPE diastólica.
Key words:
L-arginine. Hypertension. Blood pressure. Post-exercise hypotension. Exercise.
Abstract Objective: to verify if one single dose of L-arginine improves post-exercise hypotension (PEH) in hypertensive.
Methods: double-blind, placebo, randomized with 20 hypertensive (51.47 ± 1.24 years). Two sessions of aerobic exercise were performed proceeded for the ingestion of one dose of 7 g of L-arginine (EX-LARG) or placebo (EX-PLA), plus one session only with L-arginine ingestion (L-ARG). Blood pressure (BP) was measured at rest, and each ten minutes for a period of 60 minutes recovery after exercise. Blood samples were taken before and after exercise for analysis of plasma concentration of nitrite and malondialdehyde (MDA). One-way ANOVA tests were used to compare the baseline conditions and two-way ANOVA, to evaluate possible differences in pressure responses between procedures.
Results: both sessions EX-LARG and EX-PLA showed similar peak reduction for the mean systolic blood pressure (-6.58 ± 0.95 mmHg and -8.38 ± 1.29 mmHg respectively, p = 0.28). On the other hand, for the diastolic component, only L-ARG was able to promote PEH (-1.85 ± 0.44 mmHg), significantly better than EX-PLA (+2.13 ± 0.62 mmHg; p < 0.01). L-ARG alone did not result in significant changes in BP. Nitrite and MDA behaved similarly between procedures.
Conclusion: a single dose of L-arginine before exercise improves diastolic PEH.
Received: 04/12/2017 • Accepted: 11/01/2018
©Copyright 2018 SENPE y ©Arán Ediciones S.L. Este es un artículo Open Access bajo la licencia CC BY-NC-SA (http://creativecommons.org/licenses/by-nc-sa/4.0/).

1196 F. F. Lima et al.
[Nutr Hosp 2018;35(5):1195-1200]
INTRODUCTION
While hypertensive have lower endothelial function for nitric oxide (NO) synthesis (1), and greater sympathetic activity at rest (2), L-arginine supplementation for four to 24 weeks promotes blood pressure (BP) reduction (3-6). These authors argue the low endothelial capacity for NO production in patients before sup-plementation, which was explained by the low bioavailability of the L-arginine substrate, so that supplementation stimulated an improvement in endothelial activity (6,7) and improved blood flow (8).
A single session of aerobic exercise can promote a significant reduction of BP, a phenomenon called post-exercise hypotension (PEH) (9). Exercise increases blood flow in order to promote a shear stress phenomenon which induces NO production (10,11). But no studies evaluated whether an increased production of NO would also accompany BP reduction with L-arginine supplemen-tation.
Even though exercise is able to increase NO synthesis and, consequently, results in a reduction of post-exercise BP, low endo-thelial capacity may limit this response. Although previous data show that chronic L-arginine supplementation protocols reduce BP and increase NO production at rest, it is not known whether ingestion of a single dose of this aminoacid prior to an exercise session would also increase NO production in response to shear stress exercise-induced. The practical implication of this is that a possible increase in NO production could potentiate PEH.
Therefore, the aim of this study is to verify if a dose of L-arginine improves post-exercise hypotension, increases NO production and reduces oxidative stress o in middle-aged hypertensive patients.
MATERIALS AND METHODS
SUBJECTS OF STUDY AND ETHICAL ISSUES
The study was conducted with 20 diagnosed hypertensive patients (51.47 ± 1.24 years), five men, previously sedentary, who did not use nitrate drugs, betablockers and calcium channel blockers, no history of supplementation with L-arginine, non-dia-betics, and non-menopausal women. Subjects who changed the medication and missed at least one of the experimental protocols were excluded. The project was previously approved by the ethics committee in research with human beings of the University Hos-pital Lauro Wanderley, under protocol 625/10. All subjects were asked to sign the free and informed consent form according to Resolution 466/12 of the National Health Council.
STUDY DESIGN
This was a randomized, double-blind, placebo-controlled clin-ical trial. Three procedures were performed with 48-hour inter-vals: two sessions of aerobic exercise with previous ingestion of L-arginine (EX-LARG) or placebo (EX-PLA) and one with L-arginine
intake without exercise (L-ARG) (www.randomizer.org). BP was recorded at rest and every ten minutes during a recovery period of 60 minutes after exercise or in an equivalent period in the non-exercise procedure. Blood samples were taken at rest and immediately after exercise or at equivalent times in the protocol without exercise for further analysis of the serum concentration of malondialdehyde (MDA) and nitrite.
ADAPTATION OF THE EXERCISE PROTOCOL
Volunteers performed three to five adaptation sessions at inter-vals of at least 24 hours until they were able to walk for 60 min-utes at a minimum intensity of 60% of the maximum heart rate (MHR), which was estimated from the Bruce equation (1974) (12).
EXERCISE PROTOCOL
Twenty-four hours after the last adaptation session the volunteers were invited to start the treadmill exercise lasting 60 minutes. The volunteers were instructed to stay in the target training zone, pre-scribed by the researchers and characterized by intensity between 60% and 85% of the MHR, as proposed by Karvonen (1957) (13). The intensity was controlled by the heart rate (HR) measurement using a Polar RS800CX® cardiometer (Polar ElectroOy, Kempele, Finland) and subjective effort perception through the scale proposed by Borg (1982) (14), with a score of 6 to 20. These measures were performed every ten minutes during the physical exercise. The ses-sions were performed in the afternoon, between 1 pm and 6 pm.
SUPPLEMENTATION PROTOCOL
L-arginine supplementation and the placebo were produced in a handling laboratory and previously passed a certification examination. Seven grams of lemon-flavor L-arginine or equally flavored placebo (Starch), both diluted in 100 ml of water, were administered. This amount of L-arginine was based on the study by Lima et al. (2012) (6). The ingestion took place 30 minutes before the start of the experimental sessions. The volunteers were instructed not to ingest food sources of L-arginine for a period of 24 hours before each session. Accordingly, they received a list of foods rich in L-arginine that should be avoided in this period.
MEASURES OF BLOOD PRESSURE
Blood pressure measures were recorded after ten minutes at rest in the sitting position, immediately at the end of the exercise and every ten minutes during the recovery period of the exercise (60 minutes) or in an equivalent period in the non-exercise pro-cedure. BP measurements were performed by the auscultatory method and always by a single evaluator throughout the whole data collection process, following the VI Brazilian Guidelines for

1197
[Nutr Hosp 2018;35(5):1195-1200]
EFFECT OF L-ARGININE INTAKE ON EXERCISE-INDUCED HYPOTENSION
Hypertension of the Brazilian Society of Cardiology, Brazilian Soci-ety of Nephrology and Brazilian Society of Hypertension (15). The instrument used was a Welch Allyn® aneroid sphygmomanometer (Welch Allyn Inc., New York, USA), previously calibrated against a mercury column.
BIOCHEMICAL ANALYZES
Blood samples were taken at rest (before L-arginine or placebo ingestion) and immediately after exercise or at equivalent times in the non-exercise protocol for further analysis of the serum concentration of MDA and nitrite. Six ml of blood were collected from the antecubital vein in heparinized tubes and centrifuged at 3,000 rpm for 20 minutes. The plasma was separated and refrigerated until analysis.
Plasma concentration of nitrite was measured using the Griess reagent method. The reagent was prepared using equal parts of 5% phosphoric acid, 0.1% N-1-naphthylenediamine (NEED), 1% sulfanylamide in 5% phosphoric acid and distilled water. For the assay, 100 μl of the 10% homogenate supernatant, made with potassium phosphate buffer, in 100 μl of the Griess reagent were added. To the blank, 100 μl of the reagent were added in 100 μl of buffer and to obtain the standard curve serial dilutions (100, 50, 25 12.5, 6.25, 3.12, 1.56 μM) of nitrite were made. The entire assay was done on a 96-well plate and the reading was made in the absorbance range of 560 nm.
The evaluation of the oxidizing activity was quantified by means of the reaction of the thiobarbituric acid or MDA with the products of decomposition of the hydroperoxides. For this, 250 μl of the sample were added to KCl and incubated in a 37 °C water bath for 60 minutes. Thereafter, the mixture was precipitated with 35% AA perchloric acid and centrifuged at 14,000 rpm for ten minutes at 4 °C. The supernatant was transferred to new ependorfs and 400 μl of 0.6% thiobarbituric acid were added and incubated at 95-100 °C for 30 minutes. After cooling, the material was read in a spectrophotometer at a wavelength of 532 nm.
STATISTICAL ANALYSIS
Data were initially tested for normality and homogeneity by the Shapiro-Wilk and Levene tests. One-way ANOVA tests were used to compare the baseline conditions on the four days of procedures and two-way ANOVA was used to evaluate possible differences in pressure responses and autonomic variability between proce-dures, always adopting a 95% confidence level (p < 0.05). Instat 3.0 software (GraphPAd Instat, San Diego, CA, USA) was used. The program GPower 3.1.7 was used to calculate the effect size (16).
RESULTS
Table I presents the conditions of the volunteers. The volunteers were obese (32.64 ± 5.20 kg/m²) and had no diagnosis of dia-
betes or other cardiovascular diseases besides hypertension. All were treated with antihypertensive medication and on the days of the experimental procedures, they presented pressure values compatible with controlled blood pressure levels. The values of BP, HR, nitrite and MDA were statistically similar at these moments prior to the study procedures.
In the exercise sessions, they reported between 9.60 ± 2.47 and 13.11 ± 3.38 points on the effort perception scale, as shown in figure 1. Despite having performed the exercises within the range suitable for perceiving effort, the intensity measured by the HR was only between 28.28% and 50.60% of the MHR with a mean of 41.10%. In any case, the two exercise sessions were performed with intensities quite similar to each other.
The figure 2A presents the difference between the mean of the six post-exercise BP measures and the baseline values for the three procedures performed. In the two procedures in which the volunteers exercised, a statistically significant mean BP reduction of -6.58 ± 0.95 mmHg and -8.38 ± 1.29 mmHg, respectively, occurred for EX-LARG and EX-PLA in relation to the pre-exercise value. Meanwhile, the mean pressure value of the six measures of the moments corresponding to the post-exercise value of the L-ARG procedure (+4.30 ± 1.12 mmHg) was significantly higher in relation to the exercise procedures. These data demonstrate the occurrence of PEH after exercise, with effect size calculated at 3.0 and 2.6 for EX-LARG and EX-PLA, respectively. However, when EX-LARG and EX-PLA are compared, there is no statistical difference between these procedures (p = 0.28). In figure 2A, details of BP values can be visualized by the variation between the values every ten minutes post-exercise and the baseline moments. EX-LARG and EX-PLA were significantly lower in rela-tion to the L-ARG procedure after 40 min post-exercise. However, no differences were noted between the two exercise procedures (EX-LARG and EX-PLA) at any of the post-exercise BP measure-ment moments.
Table I. Conditions of the study variables at the moments preceding the
experimental proceduresEX-LARG EX-PLA L-ARG
RHR (bpm)
83.30 ± 2.95 76.72 ± 3.44 77.20 ± 2.01
RSBP (mmHg)
124.11 ± 5.07 120.22 ± 3.6 113.20 ± 3.58
RDBP (mmHg)
80.32 ± 3.19 78.09 ± 3.64 74.20 ± 1.83
Nitrito (µM)
5.92 ± 3.20 8.75 ± 3.11 10.97 ± 2.07
MDA (µM) 7.20 ± 1.22 6.73 ± 1.12 6.30 ± 1.06
RHR: resting heart rate; RSBP: resting systolic blood pressure; RDBP: resting diastolic blood pressure; MDA: malondialdehyde. Data is average and standard error. There were no statistically significant differences between the rest data (p < 0.05).

1198 F. F. Lima et al.
[Nutr Hosp 2018;35(5):1195-1200]
Regarding the response of the post-exercise diastolic component, we observed that the mean of the six post-exercise blood pressure measurements in relation to baseline EX-LARG, EX-PLA and L-ARG values was -1.85 ± 0.44 mmHg, +2.13 ± 0.62 mmHg and +3.81 ± 0.79 mmHg, respectively (Fig. 2B). Descriptively, it is noted that PEH occurred only in the EX-LARG procedure, which is statistical-ly confirmed in both the EX-LARG comparison for EX-PLA and the EX-LARG for L-ARG with effect size of 0.82 for the hypotensive
effect of EX-LARG. Figure 2B shows the diastolic behavior in detail for the variation between each post-exercise measure with the base-line values. By this analysis, the pressure reduction observed in the EX-LARG procedure was significantly lower than EX-PLA at 20 min-utes post-exercise. However, in the other moments, a statistical trend was observed for the lowest values observed in EX-LARG (p < 0.10). In fact, some effect size was noted in all measures, ranging from 0.14 to 50 minutes up to 0.82 at 20 minutes post-exercise.
Figure 1.
Subjective effort perception and heart rate behavior during the exercise sessions of the experimental procedure. Data is average and standard error. *Statistical difference of the L-ARG procedure for EX-LARG and EX-PLA procedures (p < 0.0001, effect size = 2.45).
Subj
ectiv
e Ef
fort
Perc
eptio
n (S
EP)
Hear
t Rat
e (b
pm)
6
4
2
0
8
6
100
100
0
0
0
0
10 20 30 40 50 6010 20 30 40 50 60Rest
EX-LARG LARGEX-PLA
(Min)(Min)
A B
Figure 2.
Delta values of SBP and DBP between rest and post-exercise recovery period. Data is average and standard error. *Statistical difference of the L-ARG procedure for the EX-LARG and EX-PLA procedures. **Statistical difference of the EX-LARG procedure for EX-PLA and L-ARG procedures.
Syst
olic
blo
od p
ress
ure
Delta
(mm
Hg)
Dias
tolic
blo
od p
ress
ure
Delta
(mm
Hg)
0
5
0
5
0
5
0
5
0
5
0
5
0
5
0
5
0
510 20 30 40 50 6010 20 30 40 50 60
EX-LARG
LARGEX-PLA
(Min)(Min)
A B

1199
[Nutr Hosp 2018;35(5):1195-1200]
EFFECT OF L-ARGININE INTAKE ON EXERCISE-INDUCED HYPOTENSION
Figure 3 shows the serum concentrations of nitrite and MDA in response to the experimental procedures. The EX-LARG and L-ARG procedures were not able to significantly alter nitrite and post-exercise MDA concentrations. However, it should be noted that while the EX-PLA procedure resulted in serum nitrite reduc-tion (at a descriptive level and with effect size of 0.52), the exer-cise of the EX-LARG procedure resulted in an inverse behavior, with a descriptive increase of the nitrite concentration post-exer-cise and effect size of 1.0, which is almost 100% greater.
DISCUSSION
The data from this study show that ingestion of a dose of seven grams of L-arginine prior to an aerobic exercise session does not influence systolic BP and promotes a discrete but significant post-exercise diastolic hypotensive response compared to exer-cise performed without prior ingestion of L-arginine. L-arginine induces increases on post-exercise nitrite, while exercise alone results in decreased nitrite.
Reduction of resting BP after chronic L-arginine supplementa-tion protocols has been pointed out in original studies (3,4) and is ratified in a meta-analysis by Dong et al. (2011) (5), where the authors used only studies that were randomized, double-blind and with control, with a total of 387 subjects who ingested L-arginine from four to 24 weeks and obtained significant reductions of 5.39 mmHg for systolic pressure and 2.66 mmHg for diastolic pressure. While in these studies the ingestion of L-arginine was chronic and BP data refer to the resting state, in the present study the effect of a single dose on post-exercise hypotension was evaluated. The unprecedented nature of this study makes it impossible to com-pare our results with previous data, but it supports the hypothesis that L-arginine could influence post-exercise pressure responses acutely.
Although the mean of the six post-exercise BP values (Fig. 2B) statistically indicated diastolic hypotensive response induced by
previous L-arginine ingestion in comparison with the other pro-cedures, statistical differences were only noticed at 20 minutes. However, effect size of at least 0.14 was found. The implication of this is that a more consistent post-exercise diastolic hypotension induced by prior L-arginine ingestion would be better demon-strated with a sample of 34 people. Another parallel aspect that should be noted in relation to the magnitude of the post-exercise hypotensive response is that the volunteers started the proce-dures with well controlled BP. This may be a result of concomitant drug treatment and has not been discontinued during the study. Therefore, studying hypertensive patients with higher BP values and impaired endothelial function may result in a different effect than that found in this study.
Regarding the possibility of intrinsic vasodilatation, it could be determined by the vasodilatory agents derived from the vessel itself, of which it is known that the endothelial production of NO is the most potent and that L-arginine is the precursor of NO (17). Although the data have not shown statistical significance, an effect size almost 100% higher in the EX-LARG procedure than in the EX-PLA was noted. This indicates that an increase in sample size may statistically confirm this acute but only descriptive improvement of nitrite induced vasodilation resulting from the administration of a single dose of L-arginine prior to an exercise session. Chronically, Lima et al. (2012) showed that nitrite concentrations after exercise with chronic supplementation (four weeks) of L-arginine increased significantly by almost twice, accompanying the reduction of rest BP, and these data corroborate a previous study (3).
The present study has some limitations, such as the fact that vol-unteers were expected to perform exercise with intensity between 60% and 85% of maximum heart rate, but they did so below this range for at least the first half of the session. The causal factor was that they reported subjective perception of effort compatible with the desired intensity and refused to increase the speed of the treadmill until they reached the predicted heart rate. From the perspective of the observation of the effect of L-arginine, this may not represent an intervening factor, but the magnitude of the PEH may have been influenced by this methodological phenomenon. Finally, it should be considered that the study was done with non-menopausal women, so that the menstrual period as well as the use of a contraceptive could influence the results of the study. However, while there is no body of evidence regarding this possibility, previous studies (18,19) indicate that menopausal and non-menopausal women had the same effect of a training program physicist. However, in these, the chronic effect of the training was verified, whereas in the present study, acute responses to an exercise session were evaluated. Thus, although these influencing aspects were not considered in the pres-ent study, they cannot be discarded.
The implications that can be drawn from the data of this study are practical and scientific. The practical implication represents the unprecedented finding that the administration of L-arginine could be useful to improve the hypotensive effect of hypertensive patients who adopt physical exercise as a therapeutic tool. The scientific implication is that the data from this study are unprecedented, but the magnitude of the effect found was discrete, and only for dia-stolic blood pressure. This represents the need for these data to be
Figure 3.
Nitrite and MDA values. They are presented as mean and standard error of the mean. No statistically significant values for p < 0.05.

1200 F. F. Lima et al.
[Nutr Hosp 2018;35(5):1195-1200]
confirmed with other doses of L-arginine, more intense exercise protocols and hypertensive patients with higher resting blood pres-sure levels. Anyway, this study is the first to point out the possibility that a nutritional supplementation with L-arginine may enhance the antihypertensive potential of physical exercise.
CONCLUSION
Taken together, data from this study showed that L-Arginine intake promotes an improvement in the diastolic component of PEH, without altering the systolic component. The data from this study indicate that increased nitrite production may be an explan-atory mechanism for the best diastolic hypotensive response.
ACKNOWLEDGMENTS
We really appreciate the graduation and research rectory from the Federal University of Paraíba, Brazil.
REFERENCES
1. Higashi Y, Oshima T, Ozono R, Matsuura H, Kajiyama G. Aging and severity of hypertension attenuate endothelium-dependent renal vascular relaxation in humans. Hypertension 1997;30(2Pt1):252-8.
2. Truccolo AB, Dipp T, Eibel B, Ribeiro RA, Casali KR, Irigoyen C, et al. Associa-tion between endothelial function and autonomic modulation in patients with chagas disease. Arq Bras Cardiol 2013;100(2):135-40.
3. Rytlewski K, Olszanecki R, Korbut R, Zdebski Z. Effects of prolonged oral supplementation with l-arginine on blood pressure and nitric oxide synthesis in preeclampsia. Eur J Clin Invest 2005;35(1):32-7.
4. Martina V, Masha A, Gigliardi VR, Brocato L, Manzato E, Berchio A, et al. Long-term N-acetylcysteine and L-arginine administration reduces endothe-lial activation and systolic blood pressure in hypertensive patients with type 2. Diabetes Care 2008;31(5):940-4.
5. Dong JY, Qin LQ, Zhang Z, Zhao Y, Wang J, Arigoni F, et al. Effect of oral L-arginine supplementation on blood pressure: a meta-analy-sis of randomized, double-blind, placebo-controlled trials. Am Heart J 2011;162(6):959-65.
6. Lima MJ, Silva AS, Alves NFB, Porpino SKP, Almeida MAE, Lima RT. L-arginina aumenta a produção endotelial de óxido nítrico e reduz a pressão arterial de repouso sem alterar as respostas pressóricas do exercício. Motricidade 2012;8(3):19-29.
7. Cannon RO. Oral L-arginine (and other active ingredients) for ischemic heart disease? J Am Coll Cardiol 2002;39(1):46-8.
8. Lekakis JP, Papathanassiou S, Papaioannou TG, Papamichael CM, Zakopoulos N, Kotsis V, et al. Oral L-arginine improves endothelial dys-function in patients with essential hypertension. Int J Cardiol 2002;86(2-3):317-23.
9. Laterza MC, Rondon MUPB, Negrão CE. The anti-hypertensive effect of exer-cise. Rev Bras Hipertens 2007;14(2):104-11.
10. Boushel R, Langberg H, Gemmer C, Olesen J, Crameri R, Scheede C, et al. Combined inhibition of nitric oxide and prostaglandins reduces human skeletal muscle blood flow during exercise. J Physiol 2002;543(Pt 2):691-8.
11. Mortensen SP, Nyberg M, Thaning P, Saltin B, Hellsten Y. Adenosine con-tributes to blood flow regulation in the exercising human leg by increasing prostaglandin and nitric oxide formation. Hypertension 2009;53(6):993-9.
12. Bruce RA, Fisher LD, Cooper MN, Grey GO. Separation of effects of cardio-vascular disease and age on ventricular function with maximal exercise. Am J Cardiol 1974;34(7):757-63.
13. Karvonen MJ, Kental E, Mustala O. The effects of training on heart rate: a longitudinal study. Ann Med Exp Biol Fenn 1957;35:307-15.
14. Borg G. Psychophysical bases of perceived exertion. Med Sci Sports Exerc 1982;14(5):377-81.
15. Sociedade Brasileira de Cardiologia, Sociedade Brasileira de Nefrologia, Sociedade Brasileira de Hipertensão. VI Diretrizes Brasileiras de Hipertensão. Rev Bras Hipertens 2010;17(1):1-64.
16. Faul F, Erdfelder E, Lang AG, Buchner A. G*Power 3: a flexible statistical power analysis program for the social, behavioral, and biomedical sciences. Behav Res Methods 2007;39(2):175-91.
17. Maeda S, Tanabe T, Otsuki T, Sugawara J, Iemitsu M, Miyauchi T, et al. Mode-rate regular exercise increases basal production of nitric oxide in elderly women. Hypertens Res 2004;27(12):947-53.
18. Lima AHRA, Couto HE, Cardoso GA, Toscano LT, Silva AS, Mota MPG. Treina-mento aeróbio não altera pressão arterial de mulheres menopausadas e com síndrome metabólica. Arq Bras Cardiol 2012;99(5):979-87.
19. Cardoso GB, Silva AS, Souza AA, Santos AP, Silva RSB, Lacerda LM, et al. Influence of resistance training on blood pressure in patients with metabolic syndrome and menopause. J Hum Kinet 2014;43:87-95.

NutriciónHospitalaria
Trabajo Original Otros
ISSN (electrónico): 1699-5198 - ISSN (papel): 0212-1611 - CODEN NUHOEQ S.V.R. 318
Correspondence: Diego Moliner Urdiales. Human Sciences Faculty. Department of Education. Universitat Jaume I. Av. Vicent Sos Baynat. 12071 Castellon, Spaine-mail: [email protected]
Adelantado-Renau M, Beltran-Valls MR, Toledo-Bonifás M, Bou-Sospedra C, Pastor MC, Moliner-Urdiales D. The risk of eating disorders and academic performance in adolescents: DADOS study. Nutr Hosp 2018;35(5):1201-1207
DOI: http://dx.doi.org/10.20960/nh.1778
The risk of eating disorders and academic performance in adolescents: DADOS study Riesgo de padecer trastornos de la conducta alimentaria y rendimiento académico en adolescentes: proyecto DADOS
Mireia Adelantado-Renau1, María Reyes Beltran-Valls1, Miriam Toledo-Bonifás1, Carlos Bou-Sospedra1, M.ª Carmen Pastor2 and Diego Moliner-Urdiales1
1LIFE Research Group. Department of Education. Universitat Jaume I. Castellón de la Plana, Spain. 2MPAGER Research Group. Department of Basic and Clinical Psychology and Psycho-biology. Universitat Jaume I. Castellón de la Plana, Spain
Palabras clave:
Adolescencia. Salud. Composición corporal. Rendimiento escolar.
Resumen Introducción: los trastornos de la conducta alimentaria (TCA) son alteraciones psicológicas severas con graves consecuencias sobre la función cognitiva durante la adolescencia.
Objetivos: el principal objetivo de este estudio fue analizar la asociación entre el riesgo de padecer TCA y el rendimiento académico en adoles-centes, considerando el papel clave de la composición corporal.
Métodos: la muestra estuvo formada por un total de 261 adolescentes (13,9 ± 0,3 años), participantes del proyecto DADOS (Deporte, Adoles-cencia y Salud). La versión española del cuestionario Sick Control on Fast Food (SCOFF) se utilizó para determinar el riesgo de padecer TCA. La composición corporal se evaluó mediante el índice de masa corporal (IMC) (kg/m2). El rendimiento académico fue evaluado mediante las notas finales y mediante la versión española del cuestionario SRA Test of Educational Ability (TEA).
Resultados: el riesgo de padecer TCA estuvo inversamente asociado con las notas y con las habilidades verbales y numéricas medidas mediante el TEA. Los adolescentes que no presentaban riesgo de padecer TCA mostraron calificaciones más altas en las notas (pero no en los componentes del cuestionario TEA). Los adolescentes con sobrepeso u obesidad reportaron un mayor riesgo de padecer TCA.
Conclusiones: el riesgo de padecer TCA está asociado de forma inversa con el rendimiento académico y es más elevado en adolescentes con sobrepeso u obesidad. Las intervenciones cuyo objetivo sea mejorar el rendimiento académico deberían tener en cuenta la composición corporal y el riesgo de padecer TCA.
Key words:
Adolescence. Health. Weight status. Educational achievement.
Abstract Introduction: eating disorders (ED) are complex multifactorial chronic diseases with adverse consequences on cognition in adolescence.
Objectives: the main aim of the present study was to analyze the association between the risk of ED and academic performance in adolescents, considering the key role of weight status.
Methods: a total of 261 adolescents (13.9 ± 0.3 years) from the DADOS (Deporte, Adolescencia y Salud) Study were included in the analysis. The risk of ED was assessed using the Sick Control on Fast Food (SCOFF) questionnaire. Weight status was assessed by body mass index (BMI) (kg/m2). Academic performance was assessed through final grades and through the Spanish version of the SRA Test of Educational Ability (TEA).
Results: the risk of ED was negatively associated with academic grades, and with verbal and numeric abilities measured through TEA. Adolescents with non-eating disorder risk showed higher scores in academic grades (but not in the TEA components). Overweight and obese adolescents reported higher risk of ED.
Conclusions: the risk of ED is negatively associated with academic performance, being higher in overweight and obese adolescents. Interventional programs aimed to improve academic performance should take into account weight status and the risk of ED.
Received: 16/01/2018 • Accepted: 28/02/2018
©Copyright 2018 SENPE y ©Arán Ediciones S.L. Este es un artículo Open Access bajo la licencia CC BY-NC-SA (http://creativecommons.org/licenses/by-nc-sa/4.0/).

1202 M. Adelantado-Renau et al.
[Nutr Hosp 2018;35(5):1201-1207]
INTRODUCTION
Adolescence is a period of life characterized by important phys-ical, behavioral and brain changes (1,2). Nutritional requirements and dietary habits are modified during this age-span, which could lead to different nutrition-related disorders with adverse conse-quences for overall health status (3).
Eating disorders (ED) are complex diseases characterized by dis-ruptive eating behaviors linked to body shape dissatisfaction, disin-terest in food and an intense fear of gaining weight (4). According to scientific literature, anorexia nervosa, bulimia nervosa and binge eating disorder are the most investigated severe clinically defined ED. The origin of ED is multifaceted, being involved a combination of psychological (i.e., positive self-esteem, emotional well-being), biological (i.e., sex) and social factors (i.e., family connectedness) (5). A peak of incidence in the number of ED has been reported in adolescents between 15-19 years old (6), with symptoms starting during pre-adolescence and early adolescence (7).
Since ED are associated to adverse consequences for phys-ical health and psychosocial and cognitive functioning (5), the early detection of people at risk of developing ED is essential to prevent its progression. Evidence from previous studies in ado-lescents suggest that cognitive deficits pre-exist and underlie the etiology of ED (8), while high academic performance could act as a protective factor (9). However, limited and non-conclusive research has been undertaken regarding the link between the risk of developing ED and academic performance in adolescents. To this extent, Veses et al. (10) found higher risk of ED among non-overweight adolescent girls with low academic performance, and among overweight adolescent boys with low school grades in physical education (PE). Conversely, Gil et al. (11) did not find differences in academic performance between adolescents at risk and not at risk of ED.
Although ED is commonly related to normal or low body weight, obesity and ED may coexist (12). Since obesity is a weight-relat-ed disorder with a high prevalence among adolescents, it might affect body satisfaction and perception leading to disruptive eating behaviors. Overweight and obesity have been positively associated with an increased risk of developing ED in adolescents (10,13,14). These disorders share multiple similarities and may occur simulta-neously (15) or as a consequence of each other (16). In addition, recent research has also pointed out the negative association of body fatness with cognition in adolescents (17). Body image dissatisfaction, weight-related teasing, unhealthy behaviors, and health-related problems closely linked to overweight and obese adolescents have been postulated as potential mechanisms by which excess of body fat negatively influences academic out-comes and cognitive functions (17).
Given the high prevalence of obesity and the key role of body weight on the risk of developing ED and cognition in adolescents, the main aim of the present study was to analyze the association between the risk of ED and academic performance in healthy ado-lescents, considering the effect of weight status. We additionally examined: a) the differences in academic performance according to ED categories; and b) the risk of ED according to weight status.
METHODS
PARTICIPANTS
The DADOS (Deporte, Adolescencia y Salud) Study is a 3-year longitudinal research project (from 2015 to 2017) aimed to assess the influence of physical activity on health, cognition and psycho-logical wellness through adolescence. All the participants were recruited from secondary schools and sport clubs of Castellon (Spain), and met the general DADOS inclusion criteria: born in 2001, enrolled in second grade of secondary school and free of any chronic disease. The results presented in this study belong to baseline data obtained between February and May of 2015. From the total DADOS study sample, 261 adolescents (138 boys) with valid data for at least risk of eating disorders, weight status, and academic performance were included in the analyses.
Adolescents and their parents or guardians were informed of the nature and characteristics of the study, and all provided a writ-ten informed consent. The DADOS study protocol was designed in accordance with the ethical guidelines of the Declaration of Helsinki of 1961 (last revision of Fortaleza, Brazil, 2013) and approved by the Research Ethics Committee of the Universitat Jaume I of Castellon.
WEIGHT STATUS
Briefly, body weight was measured to the nearest 0.1 kg using an electronic scale (Seca® 861, Hamburg, Germany) with the participant lightly dressed and without shoes. Height was measured to the near-est 0.1 cm using a wall-mounted stadiometer (Seca® 213, Hamburg, Germany). Measures were assessed in duplicate by trained members of the DADOS research group following standardized procedures (18) and average measures were used for data analysis. Body mass index (BMI) was calculated as weight/height square (kg/m2).
THE RISK OF EATING DISORDERS
The risk of ED was assessed using the Sick Control on Fast Food (SCOFF) questionnaire (19). The questionnaire consists of five questions regarding deliberate vomiting, loss of control over eating, weight loss, body image distortion and impact of food on life. A value of 1 is assigned to each affirmative answer, ranging the SCOFF overall score from 0 to 5. A score ≥ 2 in the SCOFF score indicates a likely case of suffering from ED. The Spanish version of the SCOFF validated for adolescents was used (20), which has shown accurate internal consistency and criteria validity for screening ED in adoles-cents (81.9% sensitivity and 78.7% specificity) (21).
ACADEMIC PERFORMANCE
Academic performance was assessed by two components:1. The final academic grades from the 1st course of secondary
school provided by each school’s secretary office. The fol-

1203
[Nutr Hosp 2018;35(5):1201-1207]
THE RISK OF EATING DISORDERS AND ACADEMIC PERFORMANCE IN ADOLESCENTS: DADOS STUDY
lowing indicators were included in the analyses: individual grades for Math, Language and Physical Education (PE) and grade point average (GPA) score. Language is the grade of Catalan, the official teaching language at school. GPA score was defined as the single average for Geography and His-tory, Natural Science, Math, Spanish, Catalan, English and Physical Education grades. All the subjects are measured on a ten-point scale, where 1 is the worst and 10 is the best.
2. The Spanish version of the validated Science Research Associates Test of Educational Abilities (TEA) (22). This test measures three basic abilities: verbal ability (command of language), numeric ability (speed and precision in perform-ing operations with numbers and quantitative concepts), and reasoning ability (the aptitude to find logical ordination criteria in sets of numbers, figures or letters). Scores for the three abilities were obtained by adding positive answers. Overall academic ability was calculated by adding the three abilities’ scores (verbal + numeric + reasoning). This battery test provides three complexity levels based on the age range of the sample. The present work used the level 3 designed for adolescents aged 14 to 18 years (reliability: verbal α = 0.74, numeric α = 0.87, reasoning α = 0.77 and overall academic ability α = 0.89) (22).
COVARIATES
Pubertal stage was self-reported according to the five stages defined by Tanner and Whitehouse (23). It is based on external primary and secondary sex characteristics, which are described by the participants using standard pictures according to Tanner instructions.
The Family Affluence Scale “FAS” developed by Currie et al. (24) was used as a proxy of socioeconomic status (SES), which is based on material conditions in the family such as car ownership, bedroom occupancy, computer ownership and home internet access.
Parental educational attainment was self-reported by both par-ents as primary school, secondary school, bachelor studies or university degree. Study levels were dichotomized in two groups: no university degree vs university degree for each parent. Maxi-mum parental educational attainment was used in the analyses.
STATISTICAL ANALYSIS
Descriptive characteristics are presented as mean and standard deviation (SD) or percentages. Differences between sexes were examined using the t-test and Chi-square test for continuous and nominal variables, respectively. As preliminary analyses showed no significant interactions between sex and ED risk scores (p > 0.10), all analyses were performed with the total sample.
Partial correlation analyses controlling for sex, pubertal stage, SES and parental educational attainment were performed to examine the associations of the risk of ED with weight status and academic performance.
Linear regression analyses were performed to investigate the associations of the risk of ED (SCOFF score ranging from 0 to 5) with academic performance. We created three regression models: a) unadjusted model; b) model adjusted for sex, pubertal stage, SES and parental educational attainment; and c) model adjusted for confounders in model 2 plus BMI. Analyses of covariance (ANCO-VA) were conducted to examine whether academic performance differed between eating disorders risk categories (eating disorder risk vs non-eating disorder risk). These analyses were adjusted for sex, pubertal stage, SES, parental educational attainment and BMI.
Finally, binary logistic regression analysis controlling for sex, pubertal stage, SES and parental educational attainment was per-formed to estimate the probability of the risk of eating disorders according to weight status (non-overweight vs overweight includ-ing obesity). All the analyses were performed using the IBM SPSS Statistics for Windows version 22.0 (Armonk, NY: IBM Corp), and the level of significance was set to p < 0.05.
RESULTS
Descriptive characteristics of the study sample by sex are dis-played in table I. Weight status was similar for boys and girls, with a 13% of overweight or obese adolescents. The risk of developing ED was of 12%, with no differences among sexes. Girls report-ed higher loss of control over eating and body image distortion than boys (26.0% vs 13.8% and 17.9% vs 8.0%, respectively; all p < 0.05). Academic performance did not show differences among sexes except for numeric ability that was higher in boys (p < 0.001).
Partial correlations among all the study variables controlling for sex, pubertal stage, SES and parental educational attainment are shown in table II. The risk of ED (SCOFF score) was positively asso-ciated with weight status (r = 0.262, p < 0.001) and negatively associated with all the academic grades (r ranging from -0.261 to -0.186; all p < 0.01), and with verbal and numeric abilities (r = -0.146 and -0.125, respectively; all p < 0.05).
Table III presents the associations between the risk of ED and academic performance variables. In model 1 (unadjusted model), the risk of ED was negatively associated with all the academic grades (Math, Language, PE and GPA; β ranging from -0.152 to -0.202), while no significant associations were found with aca-demic abilities. After further controlling for sex, pubertal stage, SES and parental educational attainment (model 2; β ranging from -0.181 to -0.253), and BMI (model 3; β ranging from -0.214 to -0.141), the results for academic grades remained the same. Regarding academic abilities, the risk of ED was negatively asso-ciated with verbal and numeric abilities in model 2, and with verbal ability in model 3 (all p < 0.05).
Figure 1 displays the differences in academic grades between categories of risk of developing ED, adjusting for potential con-founders. Non-risk of ED adolescents (SCOFF score < 2) showed higher academic grades (all p < 0.01) compared with those ado-lescents with risk of ED (SCOFF score ≥ 2). No differences were found for academic abilities between categories of ED risk (data not shown).

1204 M. Adelantado-Renau et al.
[Nutr Hosp 2018;35(5):1201-1207]
Table I. Characteristics of the study sample for the overall sample and by sex
All Boys Girls p
(n = 261) (n = 138) (n = 123)
Age (y) 13.9 ± 0.3 13.9 ± 0.3 13.9 ± 0.3 0.976
Pubertal stage (I-V) (%) 0/8/34/48/10 0/10/33/43/14 0/6/36/53/5 -
Socioeconomic status (0-8) 4.2 ± 1.4 4.0 ± 1.3 4.4 ± 1.4 0.025
Parental university degree attainment (%) 48.3 43.5 53.7 0.100
Anthropometry
Height (cm) 163.1 ± 7.9 164.6 ± 8.6 161.4 ± 6.8 < 0.001
Weight (kg) 54.2 ± 9.3 54.4 ± 9.6 53.9 ± 8.9 0.630
BMI (kg/m2) 20.3 ± 2.7 20.0 ± 2.6 20.7 ± 2.9 0.052
Overweight* (%) 13.0 11.6 14.6 0.466
SCOFF affirmative answers (%)
Q1: Deliberate vomiting 7.3 6.5 8.1 0.618
Q2: Loss of control over eating 19.5 13.8 26.0 0.013
Q3: Weight loss 9.2 11.6 6.5 0.155
Q4: Body image distortion 12.6 8.0 17.9 0.016
Q5: Impact of food on life 8.4 8.0 8.9 0.778
SCOFF score (0-5) 0.6 ± 0.9 0.5 ± 0.8 0.7 ± 1.0 0.079
Eating disorder risk (%) 12.3 10.1 14.6 0.270
Academic grades (0-10)
Math 6.9 ± 1.6 7.0 ± 1.6 6.8 ± 1.6 0.277
Language 6.8 ± 1.5 6.7 ± 1.5 6.9 ± 1.6 0.173
PE 8.1 ± 1.1 8.0 ± 1.1 8.1 ± 1.1 0.468
GPA 7.1 ± 1.3 7.1 ± 1.3 7.2 ± 1.3 0.394
Academic abilities
Verbal (0-50) 18.7 ± 5.4 19.2 ± 5.9 18.2 ± 4.7 0.132
Numeric (0-30) 13.5 ± 4.8 14.8 ± 4.6 11.9 ± 4.6 < 0.001
Reasoning (0-30) 16.5 ± 5.8 16.1 ± 5.7 17.0 ± 6.0 0.198
Overall (0-110) 48.7 ± 12.7 50.1 ± 12.9 47.1 ± 12.3 0.060
Data are presented as mean ± SD or percentages. Differences between sexes were examined by t-test or Chi-square test. Statistically significant values are in italics. *Includes overweight + obese participants. BMI: body mass index; SCOFF: Sick Control on Fast Food; PE: Physical Education; GPA: grade point average. A score ≥ 2 in the SCOFF questionnaire indicates risk of eating disorders. Overall indicates the sum of the three abilities scores.
Table II. Partial correlations between the risk of ED and the study variables controlling for sex, pubertal stage, socioeconomic status, and parental educational attainment (n = 261)
Weight status
Academic grades Academic abilities
BMI Math Language PE GPA Verbal Numeric Reasoning Overall
SCOFF score
0.262‡ -0.186† -0.211‡ -0.211‡ -0.261‡ -0.146* -0.125* 0.019 -0.098
BMI: body mass index; SCOFF: Sick Control on Fast Food; PE: Physical Education; GPA: grade point average. Overall indicates the sum of the three abilities scores. p-value = and *p < 0.05, †p < 0.01, ‡p ≤ 0.001.

1205
[Nutr Hosp 2018;35(5):1201-1207]
THE RISK OF EATING DISORDERS AND ACADEMIC PERFORMANCE IN ADOLESCENTS: DADOS STUDY
Table III. Associations of risk of ED with academic performance in adolescents (n = 261)Model 1 Model 2 Model 3
β p β p β pAcademic grades
Math -0.152 0.014 -0.181 0.003 -0.141 0.022Language -0.159 0.010 -0.207 < 0.001 -0.163 0.009PE -0.181 0.003 -0.213 < 0.001 -0.205 0.002GPA -0.202 0.001 -0.253 < 0.001 -0.214 < 0.001
Academic abilities Verbal ability -0.113 0.067 -0.146 0.019 -0.134 0.038Numeric ability -0.110 0.076 -0.118 0.046 -0.091 0.137
Reasoning ability 0.043 0.491 0.020 0.757 0.052 0.425
Overall -0.070 0.262 -0.097 0.119 -0.067 0.298PE: Physical Education; GPA: grade point average; β: standardized coefficient. Model 1: unadjusted. Model 2: adjusted for sex, pubertal stage, socioeconomic status and parental educational attainment. Model 3: adjusted for model 2 + body mass index. Overall indicates the sum of the three abilities scores. Statistically significant values are highlighted in italics.
Figure 1.
ANCOVA analyses showing differences in academic grades between the categories of the risk of ED in adolescents. Estimated mean (dots) and SD represent values after adjustment for sex, pubertal stage, SES, parental educational attainment and BMI.
Phys
ical
Edu
catio
n
Grad
e po
int a
vera
geLa
ngua
ge
Mat
h
p = 0.007 p = 0.009
non-risk of ED (n = 229)
risk of ED (n = 32)
p = 0.001p = 0.004

1206 M. Adelantado-Renau et al.
[Nutr Hosp 2018;35(5):1201-1207]
Binary logistic regression analysis (Table IV) showed that the risk of ED was three times higher in overweight or obese ado-lescents than in non-overweight participants (OR = 3.016; 95% CI = [1.212; 7.504]; p = 0.018).
DISCUSSION
The main finding of our study suggests an inverse association between the risk of ED and academic performance in adoles-cents. Adolescents without risk of ED had higher scores in all the academic grades. Moreover, overweight or obese adolescents showed higher risk of ED. These findings extend the existing sci-entific knowledge by highlighting the impact of ED on academic performance in adolescents and the importance of considering weight status.
The estimated prevalence of the risk of developing ED in our sample (12.3%) did not show differences between sexes, con-curring with Veses et al. (13). However, previous studies have reported higher prevalence rates of the risk of ED in Spanish (i.e., 17% or 21%) (10,25) and German (22%) (26) adolescents showing differences between boys and girls.
The present study reveals an inverse association between the risk of ED and academic grades, verbal ability and numeric abil-ity in adolescents. Additional analyses according ED categories showed higher scores in all the academic grades (Math, Lan-guage, PE and GPA) among those adolescents without risk of ED. Our results concur with Veses et al. (10), who analyzed a sample of 1,877 Spanish adolescents showing an inverse asso-ciation between the risk of ED and academic grades. However, Gil García et al. (11) did not find differences in academic perfor-mance between Spanish adolescents with different levels of risk of developing ED (at risk vs not at risk). Such inconsistent findings may be due to methodological aspects, such as the different tools used to assess academic performance and ED or the multifactorial character of academic performance.
Previous studies in patients with ED have shown poor aca-demic and cognitive performance (27). For instance, Yanover et al. (28) analyzed a sample of 1,584 college students con-cluding that eating disturbance may have a negative impact on academic outcomes. In 2011, Sarrar et al. (29) analyzed a
sample of 30 patients with anorexia nervosa showing deficits in cognitive flexibility. More recently, Weider et al. (30) found that patients with anorexia nervosa showed lower performance when compared with the control group, on eight out of 13 cognitive measurements. A possible explanation might be that increased levels of metabolic factors (i.e., cortisol serum) in patients with ED alter synaptic function and brain areas closely linked to learn-ing and memory (31), which may impair cognitive functioning (32). In addition, psychological aspects related to ED could affect attitude, interest, motivation and other behaviors linked to academic success which may impair academic performance in adolescents (33,34).
Our analyses indicate that overweight and obese adolescents might present higher risk of ED than non-overweight and obese adolescents in accordance with prior research (13,35,36). This finding highlights the importance of dealing with obesity and ED jointly (12) and could be explained by different mechanisms. Body dissatisfaction and weight-related teasing in overweight and obese adolescents may encourage behaviors associated with weight control, increasing the risk of ED (37,38). In addition, the lack of self-esteem derived from body image dislike might have relevance for the development of ED in overweight and obese adolescents (39).
STRENGTHS AND LIMITATIONS
These results should be interpreted cautiously because of some limitations. First, the cross-sectional design of our study does not allow to infer a causal relationship. A sec-ond significant limitation of this research is the small sam-ple size. Despite these limitations, the main strengths of our study comprise the inclusion of potential confounders closely related with weight status and academic performance (10,40). Another strength was the use of the SCOFF questionnaire as an effective screening instrument (before its clinical mani-festation) with excellent psychometric properties for the early detection of the risk of ED in Spanish adolescents (20,21). In addition, the SCOFF questionnaire has been validated in different languages making possible to establish comparisons between our data and other studies.
CONCLUSIONS
In conclusion, the results of this study suggest a negative association between the risk of ED and academic performance in adolescents, revealing higher risk of ED in overweight and obese adolescents. Early detection of youth at risk of developing ED is highly necessary not only to avoid academic failure, but also to limit its progression, since adolescents showing problematic eating behaviors are predisposed to ED later in life. Therefore, families, educators and policy makers should consider weight and the risk of ED assessments when designing programs aimed to improve academic outcomes.
Table IV. Risk of ED according to weight status, adjusting for sex, pubertal stage,
socioeconomic status and parental educational attainment
OR 95% CI p
Non-overweight 1 Ref.
0.018Overweight or obesity 3.016
1.212; 7.504
OR: odds ratio; CI: confidence interval.
1207
[Nutr Hosp 2018;35(5):1201-1207]
THE RISK OF EATING DISORDERS AND ACADEMIC PERFORMANCE IN ADOLESCENTS: DADOS STUDY
REFERENCES
1. Giedd JN, Denker AH. The adolescent brain: insights from neuroimaging. In: Brain crosstalk in puberty and adolescence. Research and perspectives in endocrine interactions; vol. 13. Switzerland: Springer International Publishing; 2015. pp. 85-96.
2. Patton GC, Viner R. Pubertal transitions in health. Lancet 2007;369:1130-9. 3. Moreno LA, Gottrand F, Huybrechts I, Ruiz JR, González-Gross M, DeHenauw
S. Nutrition and lifestyle in European adolescents: the HELENA (HealthyLif-testyle in Europe by Nutrition in Adolescence) study. Adv Nutr 2014;5(Part 2):615A-23AS.
4. Mairs R, Nicholls D. Assessment and treatment of eating disorders in children and adolescents. Arch Dis Child 2016;101(12):1168-75.
5. Herpertz-Dahlmann B. Adolescent eating disorders. Child Adolesc Psychiatr Clin N Am 2015;24(1):177-96.
6. Favaro A, Caregaro L, Tenconi E, Bosello R, Santonastaso P. Time trends in age at onset of anorexia nervosa and bulimia nervosa. J Clin Psychiatry 2009;70(12):1715-21.
7. Field AE, Javaras KM, Aneja P, Kitos N, Camargo CA, Taylor CB, et al. Fami-ly, peer, and media predictors of becoming eating disordered. Arch Pediatr Adolesc Med 2008;162(6):574-9.
8. Lena SM, Fiocco AJ, Leyenaar J. The role of cognitive deficits in the develop-ment of eating disorders. Neuropsychol Rev 2004;14(2):99-113.
9. Croll J, Neumark-Sztainer D, Story M, Ireland M. Prevalence and risk and protective factors related to disordered eating behaviors among adolescents: Relationship to gender and ethnicity. J Adolesc Heal 2002;31(2):166-75.
10. Veses AM, Gómez-Martínez S, Pérez de Heredia F, Esteban-Cornejo I, Castillo R, Estecha S, et al. Cognition and the risk of eating disorders in Spanish ado-lescents : the AVENA and AFINOS studies. Eur J Pediatr 2015;174:229-36.
11. Gil García E, Ortiz Gómez T, Fernández Soto ML. Social profiles, diet, and prediction of eating disorders in urban Andalusian adolescents. Aten Primaria 2007;39(1):7-11.
12. Haines J, Neumark-Sztainer D. Prevention of obesity and eating disorders: a consideration of shared risk factors. Health Educ Res 2006;21(6):770-82.
13. Veses AM, Martínez-Gómez D, Gómez-Martínez S, Zapatera B, Veiga ÓL, Marcos A. Association between excessive body fat and eating-disorder risk in adolescents: the AFINOS Study. Med Clin 2011;136(14):620-2.
14. Babio N, Canals J, Pietrobelli A, Pérez S, Arija V, Arija V. A two-phase popu-lation study: relationships between overweight, body composition and risk of eating disorders. Nutr Hosp 2009;24(4):485-91.
15. Neumark-Sztainer D. Obesity and eating disorder prevention: an integrated approach? Adolesc Med 2003;14(1):159-73.
16. Reed ZE, Micali N, Bulik CM, Davey Smith G, Wade KH. Assessing the causal role of adiposity on disordered eating in childhood, adolescence, and adulthood: a Mendelian randomization analysis. Am J Clin Nutr 2017;106(3):764-72.
17. Martin A, Booth JN, McGeown S, Niven A, Sproule J, Saunders DH, et al. Lon-gitudinal associations between childhood obesity and academic achievement: Systematic review with focus group data. Curr Obes Rep 2017;6(3):297-313.
18. Beltran-Valls MR, García Artero E, Capdevila-Seder A, Legaz-Arrese A, Adelantado-Renau M, Moliner-Urdiales D. Regular practice of competitive sports does not impair sleep in adolescents: DADOS study. Pediatr Exerc Sci 2017;17:1-8.
19. Morgan JF, Reid F, Lacey JH. The SCOFF questionnaire: assessment of a new screening tool for eating disorders. BMJ 1999;319:1467-8.
20. 20. García-Campayo J, Sanz-Carrillo C, Ibáñez JA, Lou S, Solano V, Alda M. Validation of the Spanish version of the SCOFF questionnaire for the screening of eating disorders in primary care. J Psychosom Res 2005;59(2):51-5.
21. Rueda Jaimes GE, Díaz Martínez LA, Ortiz Barajas DP, Pinzón Plata C, Rodrí-guez Martínez J, Cadena Afanador LP. Validation of the SCOFF questionnaire for screening the eating behaviour disorders of adolescents in school. Aten Primaria 2005;35(2):89-94.
22. Thurstone LL, Thurstone TG. TEA Test de Aptitudes Escolares (Scholar Aptitu-des Test). 11th ed. Vol. 77. Madrid: TEA Ediciones S.A.; 2004.
23. Tanner JM, Whitehouse RH. Clinical longitudinal standards for height, wei-ght, height velocity, weight velocity, and stages of puberty. Arch Dis Child 1976;51(3):170-9.
24. Currie C, Molcho M, Boyce W, Holstein B, Torsheim T, Richter M. Resear-ching health inequalities in adolescents: the development of the Health Behaviour in School-Aged Children (HBSC) Family Affluence Scale. Soc Sci Med 2008;66:1429-36.
25. Jáuregui Lobera I, Romero Candau J, Bolaños Ríos P, Montes Berriatúa C, Díaz Jaramillo R, Montaña González MT, et al. Conducta alimentaria e imagen corporal en una muestra de adolescentes de Sevilla. Nutr Hosp 2009;24(5):568-73.
26. Hölling H, Schlack R. Eating disorders in children and adolescents. First results of the German Health Interview and Examination Survey for Chil-dren and Adolescents (KiGGS). Bundesgesundheitsblatt Gesundheitsforsch Gesundheitsschutz 2007;50(5-6):794-9.
27. Lang K, López C, Stahl D, Tchanturia K, Treasure J. Central coherence in eating disorders: an updated systematic review and meta-analysis. World J Biol Psychiatry 2014;15(8):586-98.
28. Yanover T, Thompson JK. Eating problems, body image disturbances, and academic achievement: preliminary evaluation of the eating and body image disturbances academic interference scale. Int J Eat Disord 2008;41(2):184-7.
29. Sarrar L, Ehrlich S, Merle JV, Pfeiffer E, Lehmkuhl U, Schneider N. Cognitive flexibility and agouti-related protein in adolescent patients with anorexia ner-vosa. Psychoneuroendocrinology 2011;36(9):1396-406.
30. Weider S, Indredavik MS, Lydersen S, Hestad K. Intellectual function in patients with anorexia nervosa and bulimia nervosa. Eur Eat Disord Rev 2014;22(1):15-24.
31. Moult PR, Harvey J. Hormonal regulation of hippocampal dendritic morpho-logy and synaptic plasticity. Cell Adh Migr 2008;2(4):269-75.
32. Blakemore S-J, Choudhury S. Development of the adolescent brain: implica-tions for executive function and social cognition. J Child Psychol Psychiatry 2006;47(3-4):296-312.
33. Petrides KV, Chamorro-Premuzic T, Frederickson N, Furnham A. Explaining individual differences in scholastic behaviour and achievement. Br J Educ Psychol 2005;75(2):239-55.
34. Steinmayr R, Spinath B. The importance of motivation as a predictor of school achievement. Learn Individ Differ 2009;19(1):80-90.
35. Urrila AS, Artiges E, Massicotte J, Miranda R, Vulser H, Bézivin-Frere P, et al. Sleep habits, academic performance, and the adolescent brain structure. Sci Rep 2017;7:41678.
36. Veses AM, Martínez-Gómez D, Gómez-Martínez S, Vicente G, Castillo R, Ortega F, et al. Physical fitness, overweight and the risk of eating disorders in adolescents. The AVENA and AFINOS studies. Pediatr Obes 2014;9(1):1-9.
37. Sepulveda AR, Carrobles JA, Gandarillas AM. Gender, school and acade-mic year differences among Spanish university students at high-risk for developing an eating disorder: an epidemiologic study. BMC Public Health 2008;8(1):102.
38. Neumark-Sztainer D, Falkner N, Story M, Perry C, Hannan PJ, Mulert S. Weight-teasing among adolescents: correlations with weight status and disordered eating behaviors. Int J Obes 2002;26(1):123-31.
39. Haines J, Kleinman KP, Rifas-Shiman SL, Field AE, Bryn Austin S. Examination of shared risk and protective factors for overweight and disordered eating among adolescents. Arch Pediatr Adolesc Med 2010;164(4):336-43.
40. Jiménez Pavón D, Ortega FP, Ruiz JR, España Romero V, García Artero E, Moliner Urdiales D, et al. Socioeconomic status influences physical fitness in European adolescents independently of body fat and physical activity: the HELENA study. Nutr Hosp 2010;25(2):311-6.

NutriciónHospitalaria
Trabajo Original Otros
ISSN (electrónico): 1699-5198 - ISSN (papel): 0212-1611 - CODEN NUHOEQ S.V.R. 318
Correspondence: Seryozha Gontarev. Faculty of Physical Education, Sport, and Health. Ss. Cyril and Methodius University. Dimce Mircev, 3. 1000 Skopje, R. Macedoniae-mail: [email protected]
Gontarev S, Kalack R, Velickovska LA, Stojmanovska DS, Misovski A, Milenkovski J. Health-related physical fitness of normal, stunted and overweight children aged 6-14 years in Macedonia. Nutr Hosp 2018;35(5):1208-1214
DOI: http://dx.doi.org/10.20960/nh.1794
Health-related physical fitness of normal, stunted and overweight children aged 6-14 years in MacedoniaCondición física relacionada con la salud de niños normales, con retraso en el crecimiento y con sobrepeso de 6 a 14 años en Macedonia
Seryozha Gontarev, Ruzdija Kalac, Lence A. Velickovska, Daniela Shukova Stojmanovska, Andrijana Misovski and Josko Milenkovski
Faculty of Physical Education, Sport, and Health. Ss. Cyril and Methodius University. Skopje, Macedonia
Palabras clave:
Niños macedonios. Desnutrición. Raquitismo. Resistencia. Fuerza. Flexibilidad.
Resumen Objetivo: el objetivo de este estudio es comparar el crecimiento y la aptitud física relacionada con la salud de los niños macedonios normales, con sobrepeso/obesos y atrofiados de 6-14 años.
Métodos: este estudio transversal incluyó a 9.241 niños de nacionalidad macedonia, de 19 escuelas primarias de la zona central y de la parte este de la República, de las cuales ocho están en zonas rurales y once, en entornos urbanos. Para llevar a cabo los objetivos de la investigación, se aplicaron cuatro medidas antropométricas, dos medidas antropométricas derivadas, dos mediciones para evaluar la composición corporal y siete pruebas de aptitud física. Normal-no atrofiado, no owt/ob; retraso en el crecimiento-no owt/ob; y owt/ob-no retraso en el crecimiento se compararon con el análisis multivariado de la covarianza que controlaba el estado socioeconómico, el estado de residencia (urbano o rural), el sexo, la edad y la edad al cuadrado.
Resultados: se encontraron diferencias estadísticamente significativas en todas las medidas y mediciones antropométricas para evaluar la composición corporal entre los grupos de sujetos clasificados como normales, atrofiados y con sobrepeso/obesos (p ˂ 0,000). Los niños que pertenecen al grupo de peso normal obtienen mejores resultados en todas las pruebas de condición física (p < 0,001), a excepción de las pruebas de agarre y flexión del brazo doblado. Los niños con sobrepeso u obesidad obtienen mejores resultados en la prueba de aptitud de la empuñadura en comparación con los niños normales y con retraso en el crecimiento. Los niños con retraso en el crecimiento logran mejores resultados en la prueba de aptitud del brazo doblado en comparación con los niños normales y con sobrepeso/obesos. Las diferencias intergrupales se encontraron en la prueba de aptitud de sentarse y alcanzar.
Conclusión: en comparación con los niños con peso normal, tanto los niños malnutridos como los desnutridos tuvieron peores resultados en algunas pruebas de condición física relacionadas con la salud, pero no en todas.
Key words:
Macedonian children. Undernutrition. Stunting. Endurance. Strength. Flexibility.
Abstract Objective: the objective of this study is to compare the growth and health-related physical fitness of normal, overweight/obese and stunted Macedonian children aged 6-14 years.
Methods: this cross-sectional study included 9,241 children of Macedonian nationality, from 19 primary schools from the central and east part of the Republic, out of which eight are in a rural setting and eleven are in urban environment. In order to carry out the objectives of the research, four anthropometric measurements, two derived anthropometric measurements, two measurements for assessing body composition and seven fitness tests were applied. Normal-not stunted, not owt/ob; stunted-not owt/ob; and owt/ob-not stunted were compared with multivariate analysis of covariance controlling for socioeconomic status, residence status (urban or rural), sex, age and age squared.
Results: statistically significant differences were found in all anthropometric measurements, and measurements for assessing body composition among the groups of subjects classified as normal, stunted and overweight/obese (p ˂ 0.000). Children who belong to the normal weight group achieve better results in all fitness tests (p < 0.001), except for the handgrip and bent arm hang tests. Overweight/obese children achieve better results in the handgrip fitness test compared to normal and stunted children. Stunted children achieve better results in the bent arm hang fitness test compared to normal and overweight/obese children. Intergroup differences were found in the sit and reach fitness test.
Conclusion: when compared to normal weight children, both under- and over-nourished children performed poorer on some, but not all, health-related fitness tests.
Received: 21/01/2018 • Accepted: 22/02/2018
©Copyright 2018 SENPE y ©Arán Ediciones S.L. Este es un artículo Open Access bajo la licencia CC BY-NC-SA (http://creativecommons.org/licenses/by-nc-sa/4.0/).

1209
[Nutr Hosp 2018;35(5):1208-1214]
HEALTH-RELATED PHYSICAL FITNESS OF NORMAL, STUNTED AND OVERWEIGHT CHILDREN AGED 6-14 YEARS IN MACEDONIA
INTRODUCTION
Physical fitness is a powerful health condition marker in childhood and adolescence (1,2). Even in children and adolescents physical fitness is inversely related to the physiological risk factors for the emergence of chronic disease, including high blood pressure (3,4), obesity (4), hyperinsulinemia (5), increased abdominal adiposity (6), atherogenic lipid profile, insulin resistance, inflammatory marker (7) and other metabolic risk factors (8,9). However, physical fitness has declined in many countries over the last few decades (10).
Growth stunting is an outcome of linear growth retardation associated with chronic undernutrition during pre-school years. Children who are undernourished in early childhood are shorter, have decreased muscle mass and exhibit lower levels of muscle strength and aerobic endurance compared to their better-nour-ished peers (11,12). Chronic undernutrition is also linked to a reduction in physical activity during school age (13-15). Over-weight and obesity are a consequence of the unbalanced ratio between energy intake and expenditure. Obese children usual-ly have a lack of movement skills (16,17) and a lower level of physical fitness than children with normal body weight (18-23), whereas the evidence on physical activity in overweight/obese youth is equivocal (20). Data on the functional consequences of undernutrition come from children in developing countries, while data on overweight and obese children come mainly from children in developed countries. The functional consequences of undernu-trition are often observed in terms of physical working capacity/oxygen consumption (14,24,25). However, the term functionality has a wider meaning beyond the working abilities of children and can be extended to everyday activities that require movement proficiency, power, strength and endurance.
Nutritional transition, overweight and obesity in childhood have also increased in the Balkan countries, including Macedonia (26). In transitional countries, on the other hand, undernutrition poses a greater problem. This dual burden of under- and over-nutrition may manifest on a societal level, a familial level or an individual level, and presents a complex challenge for the government and the health organizations that are trying to implement a program that is efficiently directed to the opposite ends of the malnutrition spectrum (27).
This study considers the consequences of undernutrition and overweight/obese for the health-related physical fitness of Mace-donian children aged 6-14 years. It specifically compares the growth status and physical fitness of normal (non-stunted, non-owt/ob), stunted (non-overweight/obese) and owt/ob (non-stunt-ed) school children.
METHODS
SAMPLE OF RESPONDENTS
The research was performed on a sample of 9,081 children of Macedonian nationality, from 19 primary schools from the central and east part of the Republic, out of which eight are in a rural
setting and eleven are in urban environment. The sample has been divided into two sub-samples by gender: 4,608 of the respondents are boys and 4,473 respondents are girls. The average age of the respondents of both genders was 10.02 ± 2.4 years.
Anthropometry and fitness tests were assessed by trained nutritionists and Physical Education teachers in March, April and May 2013. Parents or a legal representative signed an informed consent form after being told about the purpose of the study. The study protocol was performed following the ethical guidelines of the Declaration of Helsinki of 1961 (revision of Edinburgh 2013).
ANTHROPOMETRIC MEASURES AND BODY COMPOSITION
Assessment of the anthropometric measurements was per-formed according to the recommendations given by the Interna-tional Biology Program (IBP) (28). For estimation of the morpho-logic characteristics, the following anthropometric measures have been applied: body height in standing position (cm), body weight (kg), circumference of the upper arm and circumference of the calf (cm), as well as body mass index (BMI).
Components of the body composition have been determined by the method of bioelectrical impedance (measuring of the electric conductivity, bioelectrical impedance analysis [BIA]). The mea-suring was carried out with a body composition monitor, model OMRON® - BF511, by means of which body weight, fat tissue percent and muscular mass percent were measured. Prior to commencing the measurement, the parameters of gender, years and body height of the respondent were entered in the body com-position monitor. In order to provide better precision of the results obtained from the estimation of the body composition, prior to each measuring, we ensured that the preconditions recommended by ACSM (29) and Heyward (30) had been fulfilled.
EVALUATION OF PHYSICAL FITNESS
Prior to starting the study, the researchers involved in the proj-ect undertook training sessions in order to guarantee the stan-dardization, validation and reliability of the measurements (31). The fitness test battery a set of valid, reliable, feasible and safe field-based fitness tests for the assessment of health-related physical fitness in children and adolescents, to be used in the public health monitoring system in a comparable way within the European Union (32). The systematic error when fitness assess-ments were performed twice was nearly 0 for all the tests (33).
1. Sit and reach test. With the subject seated on the floor and using a standardized support, the maximum distance reached with the tip of the fingers by forward flexion of the trunk is measured. The test is indicative of amplitude of movement or flexibility.
2. Hand grip test. With the use of a digital Takei® TKK 5101 dynamometer (range, 1-100 kg), the maximum grip strength was measured for both hands.

1210 S. Gontarev et al.
[Nutr Hosp 2018;35(5):1208-1214]
3. Standing broad jump test. The maximum horizontal distance attained, with feet together, was measured. This test evalu-ates lower limb explosive-strength.
4. Bent arm hang test. A standardized test was used to mea-sure the maximum time hanging from a fixed bar. This test estimates the upper limb endurance-strength.
5. Sit-ups 30 sec. Maximum number of sit-ups achieved in 30 seconds. This test measures the endurance of the abdom-inal muscles.
6. Shuttle run: 4 x 10 meters. This test provides an integral evaluation of the speed of movement, agility and coordina-tion. The subject does four shuttle runs as fast as possible between two lines ten meters apart. At each end, the subject places or picks up an object (a sponge) beside the line on the floor
7. Three-minute step test. The aerobic capacity has been esti-mated by means of a three-minute step test. For three min-utes, the respondent had to get up and get down of a bench 30.5 cm high, in four cycles (up, up, down, down), with standardized rhythm of 96 beats in a minute (bmp), which was dictated by the metronome. Before beginning the test, the heart frequency was measured, whereas the children, even in the stand-by state had sub maximal value in terms of the age, were not exposed to burdening. The heart rate was measured by means of the monitor Polar® RS800 for registration of the heart frequency. As a result was taken the heart frequency measured one minute after the test (post-exercise pulse rate). The aerobic fitness test used in this study has been validated for use with adolescents (34).
GROWTH AND WEIGHT STATUS
First, all subjects who lacked BMI data, those who were younger than six and those older than 14 years were excluded from the study. Children were classified as stunted (z-score below -2.00) and non-stunted using the age- and sex-specific reference heights of the WHO 2007 definitions (35), and as normal weight, owt/ob using international criteria for BMI (36). Three groups were formed: a) normal-not stunted and not owt/ob; b) stunted-not owt/ob; and c) owt/ob-not stunted.
The socioeconomic status of the students was evaluated with the help of the international Family Affluence Scale (FAS), which includes four questions. This scale was formulated by the WHO Health Behavior and School Aged Children Study, in 1997 (37).
STATISTICAL METHODS
The data are presented as frequencies (percentage) for cat-egorical variables and mean (standard deviation [SD]) for con-tinuous variables. The adjustment to normal distribution of the different variables was evaluated both by graphs and by the Kolm-ogorov-Smirnov test, and log transformations were made when
possible. Z-scores were calculated for each fitness test according to gender and age group. This controlled for test-specific differ-ences related to age and gender, thereby allowing for standardized comparisons of physical fitness between the children. Multivariate analysis of covariance, controlling for socioeconomic status, resi-dence status (urban or rural), sex, age and age squared, was used to compare anthropometric characteristics and physical fitness of normal, stunted and owt/ob children. Bonferroni adjustments for multiple comparisons were used. An adjusted significance level of p < 0.05 was accepted. All the analyses were performed using the Statistical Package for Social Sciences software (SPSS, v. 22.0 for Windows; SPSS Inc., Chicago, IL, USA).
RESULTS
Of the whole study population of 6-14 year old children (9,081), 2.0% (178) were stunted, according to the WHO 2007 norms. According to the World Obesity Federation (formerly IOTF) norms, 34.3% (3,116) were overweight or obese. In the full sample, 63.7% (5787) of children were of normal weight and used as the comparison group. The data from the application of the Kolmog-orov-Smirnov method pointed out that all applied anthropometric variables and fitness test in all ages and sex were normally dis-tributed, except the test bent arm hang were negative skewed and were thus transformed (natural log). That was possible meth-odologically correct to perform further data procesing (data not shown).
Mean values and standard deviation for anthropometric char-acteristics and body composition measurements in normal, stunt-ed and overweight/obese children are shown in table I. Table II shows the comparison of anthropometric characteristics and body composition of elementary children, classified as normal, stunted and overweight/obese. An overview of table IV shows that there are statistically significant differences in all anthropometric mea-surements and measurements for assessing body composition between the groups of subjects classified as normal, stunted and overweight/obese (p ˂ 0.000). From the values of the estimated means and the level of statistical significance, it can be seen that stunted children of both sexes, in addition to being shorter, have lower body weight, forearm and thigh circumference and mus-cle mass percentage compared to normal and overweight/obese children. Also, stunted children have a lower BMI compared to overweight/obese children and a higher percentage of fat tissues compared to normal children. Overweight/obese children have higher body height, body weight, forearm and thigh circumference and fat tissue percentage and lower muscle mass percentage as compared with normal children. Between normal and stunted children, no statistically significant differences in BMI have been found.
Mean values and standard deviation of physical fitness tests measurements in normal, stunted and overweight/obese chil-dren are shown in table III. Table IV displays the comparison of physical fitness tests of elementary children, classified as normal, stunted and overweight/obese.

1211
[Nutr Hosp 2018;35(5):1208-1214]
HEALTH-RELATED PHYSICAL FITNESS OF NORMAL, STUNTED AND OVERWEIGHT CHILDREN AGED 6-14 YEARS IN MACEDONIA
Table I. Mean values (± SD) for anthropometric characteristics and body composition of elementary children, classified as normal, stunted and overweight/obese
Normal* Owt/ob† Stunted‡
Mean SD Mean SD Mean SDHeight 143.1 15.2 146.3 14.6 128.7 12.2Height, Z-score -0.1 0.9 0.4 0.9 -2.5 0.6Weight, kg 36.7 11.2 51.4 15.6 30.5 11.8Arm circumference, cm 20.2 2.9 25.2 3.4 19.2 3.3Thigh circumference, cm 42.2 6.1 51.5 7.1 39.5 7.4Body fat % 18.3 5.7 30.9 5.4 20.3 8.0Muscular mass % 33.0 4.2 31.1 3.1 28.9 5.0BMI kg/m2 17.4 2.1 23.5 3.4 17.5 3.4BMI: body mass index; SD: standard deviation. *Normal, non-stunted and non-overweight/obese. †Stunted, non-overweight/obese. ‡Overweight/obese, non-stunted.
Table II. Comparison of anthropometric characteristics of elementary children, classified as normal, stunted and overweight/obese, and results of pairwise comparisons (p < 0.05)
after significant MANCOVAs*
Normal† Owt/ob‡ Stunted§
F SigPairwise
comparisons Mean* SE Mean SE Mean SEHeight 142.9 0.1 146.8 0.1 126.5 0.5 953.5 0.000 O > N > SHeight, Z-score -0.1 0.0 0.4 0.0 -2.5 0.1 998.9 0.000 O > N > SWeight, kg 36.5 0.1 51.8 0.1 28.7 0.5 5,086.9 0.000 O > N > SArm circumference, cm 20.2 0.0 25.3 0.0 18.8 0.2 5,790.3 0.000 O > N > SThigh circumference, cm 42.1 0.1 51.7 0.1 38.7 0.3 5,556.9 0.000 O > N > SBody fat % 18.3 0.1 31.0 0.1 20.3 0.4 5,132.5 0.000 O > N > SMuscular mass % 33.0 0.0 31.2 0.0 28.4 0.2 671.8 0.000 N > O > S BMI kg/m2 17.4 0.0 23.6 0.0 17.2 0.2 8,199.7 0.000 N = S > OBMI: body mass index; MANCOVA: multivariate analysis of covariance; N: normal; O: overweight/obese; S: stunted; NS: not significant. SE: standard error. *Adjusted mean (controlling for residence status, socioeconomic status, age and sex). †Normal, non-stunted and non-overweight/obese. ‡Stunted, non-overweight/obese. §Overweight/obese, non-stunted.
Table III. Mean values (± SD) of the physical fitness tests of elementary school children, classified as normal, stunted and overweight/obese
Normal† Owt/ob‡ Stunted§
Mean SD Mean SD Mean SDJump, m 138.1 30.2 123.0 27.2 128.2 29.5Sit-ups, n 30 s 15.2 5.3 13.0 5.8 13.8 6.2Bent arm hang, s 7.6 8.6 1.7 3.9 9.5 11.9Handgrip, kg 22.0 14.3 23.8 15.4 17.3 12.7Grip/weight, kg/kg 0.6 0.3 0.4 0.2 0.5 0.3Sit and reach, cm 15.9 6.6 15.3 6.8 15.5 6.3Shuttle run 4 x 10, s 14.2 2.1 15.0 2.1 14.9 2.2Post-exercise pulse rate 118.3 20.6 125.8 19.7 117.4 22.5Jump Z-score 0.25 0.95 -0.40 0.90 -0.37 0.95Sit-ups Z-score 0.17 0.91 -0.26 1.03 -0.24 1.09Bent arm hang Z-score 0.33 1.07 -0.59 0.48 0.46 1.33Handgrip, Z-score -0.09 0.95 0.24 1.05 -0.80 0.70Sit and reach Z-score 0.01 0.99 -0.05 1.01 -0.04 0.95Shuttle run 4 x 10 Z-score 0.13 0.94 -0.31 1.01 -0.45 1.09Post-exercise pulse rate Z- score -0.16 0.98 0.31 0.99 -0.18 1.03SD: standard deviation. †Normal, non-stunted and non-overweight/obese. ‡Stunted, non-overweight/obese. §Overweight/obese, non-stunted.

1212 S. Gontarev et al.
[Nutr Hosp 2018;35(5):1208-1214]
An overview of table IV shows that there are statistically sig-nificant differences in all tests (except the sit and reach test for assessing flexibility) for assessing fitness between the groups of subjects classified as normal, stunted and overweight/obese (p ˂ 0.000). From the values of the estimated means and the level of statistical significance, it can be seen that children who belong to the normal group achieve better results in the standing long jump, sit-ups, 30 sec, handgrip/weight and shuttle run 4 x 10 m fitness tests compared to stunted and overweight/obese children. Children with normal body weight also perform better in the three-minute step test as compared with overweight/obese children. Overweight/obese children achieve better results in the handgrip fitness test in comparison with normal and stunted children. Overweight/obese children achieve better results in the shuttle run 4 x 10 m fitness test versus stunted children. Stunted children achieve better results in the bent arm hang fitness test in comparison with normal and overweight/obese children. Statistically significant differences between stunted and overweight/obese children have not been found in the sit-ups, 30 sec, and standing long jump fitness tests.
DISCUSSION
The results of our study suggest that Macedonian children and adolescents who have normal body weight achieve better results
in most tests for assessing health-related fitness compared to children and adolescents who are classified as stunted and over-weight/obese. The results are in line with previous studies carried out in children and adolescents that indicate a non-linear relation-ship between BMI and health-related fitness (22,38).
The results of these studies indicate that overweight can affect health-related fitness, with overweight or obese children achieving poorer results in health-related fitness tests, especial-ly when they need to move their bodies through space (39-46). Walking and running while maintaining the same speed require greater absolute energy expenditure in overweight children as compared with children who have normal body weight (47). It is therefore normal to expect that overweight children are at a disadvantage compared to children with normal body weight when the task requires them to move their bodies through space or to overcome the resistance of their own bodies offsetting gravity, as is the case in the standing long jump, shuttle run, bent arm hang, timed sit-up and three-minute step tests. The results of this study are in line with several international studies conducted on children aged five to 17 (39-41,43-46,48). How-ever, schoolchildren that have a moderately increased or high BMI can achieve equally good or better results in those fitness tests where they do not need to move their bodies through space or to overcome the resistance of their own bodies, such as the hand grip test or sit and reach tests.
Table IV. Comparison of the physical fitness of elementary school children, classified as normal, stunted and overweight/obese, results of MANCOVAs and significant pairwise
comparisons (p < 0.05)
Normal† Owt/ob‡ Stunted§
F SigPairwise
comparisons Mean* SE Mean SE Mean SE
Jump, m 137.9 0.3 123.6 0.4 124.8 1.8 235.7 0.000 N > O = S
Sit-ups, n 30 s 15.2 0.1 13.0 0.1 13.3 0.4 86.0 0.000 N > O = S
Bent arm hang, s 7.6 0.1 1.7 0.1 9.1 0.6 381.1 0.000 S > N > O
Handgrip, kg 21.7 0.1 24.6 0.2 15.1 0.8 71.7 0.000 O > N > S
Grip/weight, kg/kg 0.5 0.0 0.4 0.0 0.5 0.0 209.2 0.000 N > S > O
Sit and reach, cm 15.8 0.1 15.5 0.1 15.3 0.5 0.0 0.981 NS
Shuttle run 4 x 10, s 14.2 0.02 14.9 0.03 15.2 0.1 136.6 0.000 N > O > S
Post-exercise pulse rate 117.9 0.4 126.7 0.5 117.1 2.2 91.8 0.000 N = S > O
Jump Z-score 0.26 0.013 -0.41 0.018 -0.35 0.078 252.2 0.000 N > O = S
Sit-ups Z-score 0.18 0.013 -0.27 0.018 -0.22 0.079 83.7 0.000 N > O = S
Bent arm hang Z-score 0.33 0.013 -0.58 0.017 0.46 0.076 423.7 0.000 S > N > O
Handgrip, Z-score -0.10 0.014 0.25 0.018 -0.82 0.081 86.2 0.000 O > N > S
Sit and reach Z-score 0.00 0.014 -0.04 0.019 -0.07 0.083 0.0 0.959 NS
Shuttle run 4 x 10 Z-score 0.12 0.013 -0.28 0.018 -0.50 0.078 143.7 0.000 N > O > S
Post-exercise pulse rate Z-score
-0.16 0.02 0.31 0.03 -0.17 0.12 91.1 0.000 N = S > O
MANCOVA: multivariate analysis of covariance; N: normal; O: overweight/obese; S: stunted; NS: not significant. SE: standard error. *Adjusted mean (controlling for residence status, socioeconomic status, age and sex). †Normal, non-stunted and non-overweight/obese. ‡Stunted, non-overweight/obese. §Overweight/obese, non-stunted.

1213
[Nutr Hosp 2018;35(5):1208-1214]
HEALTH-RELATED PHYSICAL FITNESS OF NORMAL, STUNTED AND OVERWEIGHT CHILDREN AGED 6-14 YEARS IN MACEDONIA
The relationship between undernutrition and health-related fit-ness has been researched less. The research results indicate that children who were classified as stunted achieve worse results in most fitness tests compared to children with normal body weight. Prista et al. (41) showed that undernourished children were dis-advantaged in tests of strength. The reason may lie in the lower muscle mass percentage that these children have, which this research confirms. Monyeki et al. (49) found that activities that require rapid release of energy in the shortest possible time, such as the standing long jump, sit-ups, 30 sec, or shuttle run 4 x 10 tests, were negatively affected by muscle wasting in a group of undernourished South African children. Undernourishment and nutritional deprivation during growth in children can cause struc-tural, metabolic and functional changes to the skeletal muscles that manifest as a reduction in the number and size of fast-twitch muscle fibres, yet slow-twitch fibres are spared (50-53). The dif-ferent types of muscle fibres affect physical performance, and these changes result in a decreased ability to successfully perform the exercise tasks in a relatively short time, as indicated in the stunted subject group in our study. Results from previous studies are mixed, with some (41,54), but not others (44,55), showing poorer performance in the standing long jump for undernour-ished children as compared with children with normal weight. Two studies have shown no difference in sit-up performance between undernourished children and children with normal weight, while one (41) showed a poorer performance among undernourished children.
No differences in flexibility were found between undernourished children, children with normal body weight and overweight/obese children. The results are in line with a number of international studies that have found flexibility is not affected by body weight (40,43,45,48,54,56).
Undernourished children and children with normal body weight do not differ in cardiorespiratory fitness assessed by the three-minute step test (post-exercise pulse rate). This is contrary to the results obtained from Colombian children, where under-nourished children were characterized by a lower level of aerobic fitness compared to children with normal body weight (24,57). The differences in the results from these two studies can be explained by the different protocols implemented to assess aerobic fitness. On the other hand, undernourished children and children with normal weight achieve better results in the three-minute step test versus overweight/obese children, which is in line with a number of previous studies (21,22).
The advantage of this research lies in the large sample size and diversity of children that were drawn from different socioeconomic groups and several regions in Macedonia. The research did not collect information on diet and nutrition, which could have brought additional information and interpretations of the results.
Our results confirmed the original hypothesis that both under-nutrition and over-nutrition have a primarily negative influence on the health fitness of Macedonian children and adolescents. Although discussions about the functional consequences of nutri-tional status often focus on the implications of working abilities and economic productivity, it is important to realize that school-
age children are not miniature adults. They are children with their own needs, so that the notion of functional efficiency or conse-quence must be extended to measurements that are more related to their everyday activities (school, play and other culturally-spe-cific demands). Motor performance such as jumping, running, muscle strength and endurance is of essential importance for children’s physical activity, be they in school, at play or sport, or doing household chores.
REFERENCES
1. Myers J, Prakash M, Froelicher V, Do D, Partington S, Atwood JE. Exercise capacity and mortality among men referred for exercise testing. N Engl J Med 2002;346(11):793-801.
2. Andersen LB, Harro M, Sardinha LB, Froberg K, Ekelund U, Brage S, et al. Phy-sical activity and clustered cardiovascular risk in children: a cross-sectional study (The European Youth Heart Study). Lancet 2006;368(9532):299-304.
3. Sallis JF, Patterson Tl, Buono MJ, Nader PR. Relation of cardiovascular fitness and physical activity to cardiovascular disease risk factors in children and adults. Am J Epidemiol 1988;127(5):933-41.
4. Ruiz JR, Ortega FB, Meusel D, Harro M, Oja P, Sjöström M. Cardiorespiratory fitness is associated with features of metabolic risk factors in children. Should cardiorespiratory fitness be assessed in a European health monitoring sys-tem? The European Youth Heart Study. J Public Health 2006;14(2):94-102.
5. Gutin B, Yin Z, Humphries MC, Hoffman WH, Gower B, Barbeau P. Relations of fatness and fitness to fasting insulin in black and white adolescents. J Pediatr 2004;145(6):737-43.
6. Brunet M, Chaput JP, Tremblay A. The association between low physical fit-ness and high body mass index or waist circumference is increasing with age in children: the Quebec en Forme Project. Int J Obesity 2007;31(4):637-43.
7. Gulati M, Pandey DK, Arnsdorf MF, Lauderdale DS, Thisted RA, Wicklund RH, et al. Exercise capacity and the risk of death in women. Circulation 2003;108(13):1554-9.
8. Brage S, Wedderkopp N, Ekelund U, Franks PW, Wareham NJ, Andersen LB, et al. Features of the metabolic syndrome are associated with objectively measured physical activity and fitness in Danish children. Diabetes Care 2004;27(9):2141-8.
9. Ruiz JR, Ortega FB, Rizzo NS, Villa I, Hurtig-Wennlöf A, Oja L, et al. High cardiovascular fitness is associated with low metabolic risk score in children: the European Youth Heart Study. Ped Research 2007;61(3):350-5.
10. Tomkinson GR, Léger LA, Olds TS, Cazorla G. Secular trends in the performance of children and adolescents (1980-2000). J Sport Med 2003;33(4):285-300.
11. Malina RM, Little BB, Buschang PH. Estimated body composition and stren-gth of chronically mild-to-moderately undernourished rural boys in Southern Mexico. In: Human growth, physical fitness and nutrition. Vol. 31. Basel: Kar-ger Publishers; 1991. pp. 119-32.
12. Benefice E. Growth and motor performances of rural Senegalese children. In: Physical Fitness and Nutrition during Growth. Vol. 43. Basel: Karger Publi-shers; 1998. pp. 117-31.
13. Reina JC, Spurr GB. Daily activity level of marginally malnourished school-aged girls: a preliminary report. Energy intake and physical activity. New York: Alan R Liss; 1984. pp. 263-83.
14. Spurr GB. Physical activity and energy expenditure in undernutrition. Prog Food Nutr Sci 1990;14(2-3):139-92.
15. Dufour DL. Nutrition, activity, and health in children. Annu Rev Anthropol 1997;26(1):541-65.
16. Graf C, Koch B, Kretschmann-Kandel E, Falkowski G, Christ H, Coburger S, et al. Correlation between BMI, leisure habits and motor abilities in childhood (CHILT-project). Int J Obes 2004;28(1):22-6.
17. Okely AD, Booth ML, Chey T. Relationships between body composition and fundamental movement skills among children and adolescents. Res Q Exerc Spor 2004;75(3):238-47.
18. Beunen G, Malina RM, Ostyn M, Renson R, Simons J, Van Gerven D. Fatness, growth and motor fitness of Belgian boys 12 through 20 years of age. Ann Hum Biol 1983;599-613.
19. Malina RM. Anthropometry. Psychol Assess Human Fitness 1995;205-19.20. Malina RM, Bouchard C, Bar-Or O. Growth, maturation and physical activity.
2nd ed. Champaign, IL: Human Kinetics; 2004.

1214 S. Gontarev et al.
[Nutr Hosp 2018;35(5):1208-1214]
21. Bovet P, Auguste R, Burdette H. Strong inverse association between physical fitness and overweight in adolescents: a large school-based survey. Int J Behav Nutr Phys Act 2007;4(1):24.
22. Huang YC, Malina RM. BMI and health-related physical fitness in Taiwanese youth 9-18 years. Med Sci Sports Exerc 2007;39(4):701-8.
23. Huang YC, Malina RM. Body mass index and individual physical fitness tests in Taiwanese youth aged 9-18 years. Int J Pediatr Obes 2010;5(5):404-11.
24. Spurr GB. Nutritional status and physical work capacity. Am J Phys Anthropol 1983;26(S1):1-35.
25. Bar-Or O, Rowland TW. Pediatric exercise medicine: from physiologic princi-ples to health care application. Champaign, IL: Human Kinetics; 2004.
26. Gontarev S, Kalac R. Association between obesity and socioeconomic factors in Macedonian children and adolescents. Adva L Sci Health 2014;1(1):55-63.
27. Tzioumis E, Adair LS. Childhood dual burden of under-and overnutri-tion in low-and middle-income countries: a critical review. Food Nutr Bull 2014;35(2):230-43.
28. Lohman TG, Roche AF. Martorell R. Anthropometric standardization reference manual. Chicago: Human Kinetics Books; 1988.
29. American College of Sports Medicine (ACSM). Health-Related Physical Fitness Assessment Manual. Baltimore: Lippincott Williams and Wilkins; 2005.
30. Heyward VH, Gibson A. Advanced fitness assessment and exercise prescrip-tion. 7th ed. Champaign, IL: Human Kinetics; 2014.
31. Moreno LA, Joyanes M, Mesana MI, González-Gross M, Gil CM, Sarría A, et al. Harmonization of anthropometric measurements for a multicenter nutrition survey in Spanish adolescents. Nutrition 2003;19(6):481-6.
32. Ortega FB, Artero EG, Ruiz JR, Vicente-Rodríguez G, Bergman P, Hagströmer M, et al. Reliability of health-related physical fitness tests in European ado-lescents. The HELENA Study. Int J Obes 2008;32(S5):S49.
33. Sazdovski C, Gontarev S, Pop-Petrovski V, Novacevska S, Stamenov R, Dimi-trioska KJ, et al. Structure and development of anthropometric, motoric, func-tional dimensions and condition of postural status among pupils from both genders aged 6 to 14 years old in primary schools in municipality of “Kisela Voda”. Union on Sports Pedagogues - Kisela Voda; 2012.
34. Topp RV, Jacks DE, Moore JB. Prediction of VO2 peak using sub-maximum bench step test in children. Clini Kine 2011;65(4):68-75.
35. World Health Organization (WHO). WHO Reference 2007. Growth reference data for 5-19 years. 2013. Geneva: WHO; 2015.
36. Cole TJ, Bellizzi MC, Flegal KM, Dietz WH. Establishing a standard defini-tion for child overweight and obesity worldwide: international survey. BMJ 2000;320(7244):1240.
37. Currie CE, Elton RA, Todd J, Platt S. Indicators of socioeconomic status for adolescents: the WHO Health Behaviour in School-aged Children Survey. Health Educ Res 1997;12(3):385-97.
38. Mak KK, Ho SY, Lo WS, Thomas GN, McManus AM, Day JR, et al. Health-re-lated physical fitness and weight status in Hong Kong adolescents. BMC Public Health 2010;10(1):88.
39. Brunet M, Chaput JP, Tremblay A. The association between low physical fit-ness and high body mass index or waist circumference is increasing with age in children: the Quebec en Forme Project. Int J Obes 2007;31(4):637-43.
40. Ceschia A, Giacomini S, Santarossa S, Rugo M, Salvadego D, Da Ponte A, et al. Deleterious effects of obesity on physical fitness in pre-pubertal children. Eur J Sport Sci 2016;16(2):271-8.
41. Prista A, Maia JA, Damasceno A, Beunen G. Anthropometric indicators of nutritional status: implications for fitness, activity, and health in school-age children and adolescents from Maputo, Mozambique. Am J Clin Nutr 2003;77(4):952-9.
42. Raudsepp L, Jürimäe T. Relationships between somatic variables, physical activity, fitness and fundamental motor skills in prepubertal boys. Biol Sport 1996;13:279-90.
43. Sacchetti R, Ceciliani A, Garulli A, Masotti A, Poletti G, Beltrami P, et al. Phy-sical fitness of primary school children in relation to overweight prevalence and physical activity habits. J Sports Sci 2012;30(7):633-40.
44. Shang X, Liu A, Li Y, Hu X, Du L, Ma J, et al. The association of wei-ght status with physical fitness among Chinese children. Int J Pediatr 2010;2010:515414.
45. Tokmakidis SP, Kasambalis A, Christodoulos AD. Fitness levels of Greek pri-mary schoolchildren in relationship to overweight and obesity. Eur J Pediatr 2006;165(12):867-74.
46. Truter L, Pienaar AE, Du Toit D. Relationships between overweight, obesity and physical fitness of nine-to twelve-year-old South African children. S Afr Fam Pract 2010;52(3).
47. Maffels C, Schutz Y, Schena F, Zaffanello M, Pinelli L. Energy expenditure during walking and running in obese and nonobese prepubertal children. J Pediatr 1993;123(2):193-9.
48. Dumith SC, Ramires VV, Souza MA, Moraes DS, Petry FG, Oliveira ES, et al. Overweight/obesity and physical fitness among children and adolescents. J Phys Act Health 2010;(5):641-8.
49. Monyeki MA, Koppes LL, Monyeki KD, Kemper HC, Twisk JW. Longitudinal relationships between nutritional status, body composition, and physical fit-ness in rural children of South Africa: the Ellisras longitudinal study. Am J Hum Biol 2007;19(4):551-8.
50. De Jonge R, Bedu M, Fellmann N, Blonc S, Spielvogel H, Coudert J. Effect of anthropometric characteristics and socio-economic status on physical per-formances of pre-pubertal children living in Bolivia at low altitude. Eur J Appl Physiol Occup Physiol 1996;74(4):367-74.
51. Essen B, Fohlin L, Thorén G, Saltin B. Skeletal muscle fibre types and sizes in anorexia nervosa patients. Clin Physiol Funct Imaging 1981;1(4):395-403.
52. Jeejeebhoy KN. Muscle function and nutrition. Gut 1986;27(Suppl 1):25-39.53. Russell DM, Walker PM, Leiter LA, Sima AA, Tanner WK, Mickle DA, et al.
Metabolic and structural changes in skeletal muscle during hypocaloric die-ting. Am J Clin Nutr 1984;39(4):503-13.
54. Malina RM, Reyes MP, Tan SK, Little BB. Physical fitness of normal, stun-ted and overweight children 6-13 years in Oaxaca, Mexico. Eur J Clin Nutr 2011;65(7):826-34.
55. Monyeki MA, Koppes LL, Kemper HC, Monyeki KD, Toriola AL, Pienaar AE, et al. Body composition and physical fitness of undernourished South African rural primary school children. Eur J Clin Nutr 2005;59(7):877-83.
56. Pongprapai S, Mo-suwan L, Leelasamran W. Physical fitness in obese school children in Hat Yai, Southern Thailand. Asian J Trop Med Public Heal-th 1994;25:354.
57. Spurr GB, Barac-Nieto M, Reina D. Growth, maturation, body composition and maximal aerobic power of nutritionally normal and marginally malnourished school-aged Colombian children. In: Human Growth, Physical Fitness and Nutrition. Vol. 31. Basel: Karger Publishers; 1991. pp. 41-60.

NutriciónHospitalaria
Trabajo Original Otros
ISSN (electrónico): 1699-5198 - ISSN (papel): 0212-1611 - CODEN NUHOEQ S.V.R. 318
Correspondence: Suelem Cruz. Universidade Estácio de Sá (UNESA). Rio de Janeiro, Brazil e-mail: [email protected]
Matos A, Gonçales VMS, Souza G, Cruz SP, Cruz S, Ramalho A. Vitamin A nutritional status in patients with coronary artery disease and its correlation with the severity of the disease. Nutr Hosp 2018;35(5):1215-1220
DOI: http://dx.doi.org/10.20960/nh.1804
Source of funding: Fundação de Amparo à Pesquisa do Estado do Rio de Janeiro - FAPERJ (Scientist of our state).Author´s contribution: The authors participated in all stages of the study.
Vitamin A nutritional status in patients with coronary artery disease and its correlation with the severity of the diseaseEstado nutricional de la vitamina A en pacientes con enfermedad coronaria y su correlación con la gravedad de la enfermedad
Andrea Matos1, Vanessa Moreira da Silveira Gonçalves1, Gisele Souza1, Suelem Pereira da Cruz2, Sabrina Cruz1 and Andréa Ramalho3
1School of Medicine. Federal University of Rio de Janeiro. Center for Research on Micronutrients (NPqM). Institute of Nutrition Josué de Castro - Federal University of Rio de Janeiro. 2School of Medicine. Universidade Estácio de Sá (UNESA). 3ENSP/FIOCRUZ. Department of Social and Applied Nutrition. Institute of Nutrition at UFRJ. Brazil
Palabras clave:
Vitamina A. Estado nutricional. Enfermedad coronaria grave.
Resumen Introducción: el objetivo de este estudio fue evaluar el estado nutricional de la vitamina A (VA) de pacientes con enfermedad coronaria (EAC) y su correlación con la gravedad de la enfermedad, teniendo en cuenta la concentración de zinc y el estrés oxidativo.
Métodos: los pacientes fueron pacientes internados preoperatorios en espera de cirugía de revascularización miocárdica. Las concentraciones séricas de retinol, β-caroteno, zinc, malondialdehído (MDA) y proteína C-reactiva (CRP) fueron cuantificados. La gravedad del CAD fue evaluada por cineangiografía, observando los parámetros de severidad, extensión y oclusión. Se realizó un ecocardiograma para evaluar la fracción de eyección.
Resultados: se estudiaron noventa individuos (64,5 ± 9,6 años). El zinc no se correlaciona con retinol (r = -0,009 / p = 0.40), β-caroteno (r = -0,06 / p = 0,73) o MDA (r = 0,03 / p = 0,70), pero la deficiencia de zinc fue más frecuente entre los pacientes con MDA alta (cuartiles 50 y 75). CRP era encontrado asociado con retinol (x2 = 3,95 / p = 0,04). Los individuos con deficiencia de retinol tuvieron CAD más severa y disminuyeron el β-caroteno a medida que aumentaba el puntaje de la extensión, aunque esto no era estadísticamente significativo (p = 0,12). El grado de severidad se asoció a la extensión (x2 = 67,9) / (p < 0,001), oclusión (x2 = 34,5 / p < 0,001) y CRP (x2 = 5,9 / p = 0,05), mientras que la extensión se asoció con MDA (x2 = 42,1) / (p < 0,001). Ahí fue una correlación positiva entre la fracción de eyección y el β-caroteno (r = 0,42 / p = 0,02).
Conclusión: los hallazgos de este estudio indican que la inflamación crónica resultante de la aterosclerosis está relacionada con la gravedad de la enfermedad y el consiguiente influencia sobre el estado nutricional de VA.
Key words:
Vitamin A. Nutrition status. Severity coronary artery disease.
Abstract Indroduction: the purpose of this study was to assess the vitamin A (VA) nutritional status of patients with coronary artery disease (CAD) and its correlation with the severity of the disease, taking into consideration zinc concentration and oxidative stress.
Methods: the patients were preoperative inpatients awaiting myocardial revascularization surgery. The serum concentrations of retinol, β-caro-tene, zinc, malondialdehyde (MDA) and C-reactive protein (CRP) were quantified. CAD severity was assessed by cineangiography, observing the parameters of severity, extent and occlusion. An echocardiogram was performed to assess the ejection fraction.
Results: ninety individuals were studied (64.5 ± 9.6 years). Zinc did not correlate with retinol (r = -0.009/p = 0.40), β-carotene (r = -0.06/p = 0.73) or MDA (r = 0.03/p = 0.70), but zinc deficiency was more frequent amongst the patients with high MDA (quartiles 50 and 75). CRP was found to be associated with retinol (x2 = 3.95/p = 0.04). The individuals with retinol deficiency had more severe CAD, and β-carotene diminished as the extent score rose, although this was not statistically significant (p = 0.12). The degree of severity was associated to extent (x2 = 67.9)/(p < 0.001), occlusion (x2 = 34.5/p < 0.001) and CRP (x2 = 5.9/p = 0.05), while extent was associated with MDA (x2 = 42.1)/(p < 0.001). There was a positive correlation between the ejection fraction and β-carotene (r = 0.42/p = 0.02).
Conclusion: findings from this study indicate that chronic inflammation resulting from atherosclerosis is related to disease severity and conse-quent influence on nutritional status of VA.
Received: 25/01/2018 • Accepted: 07/05/2018
©Copyright 2018 SENPE y ©Arán Ediciones S.L. Este es un artículo Open Access bajo la licencia CC BY-NC-SA (http://creativecommons.org/licenses/by-nc-sa/4.0/).
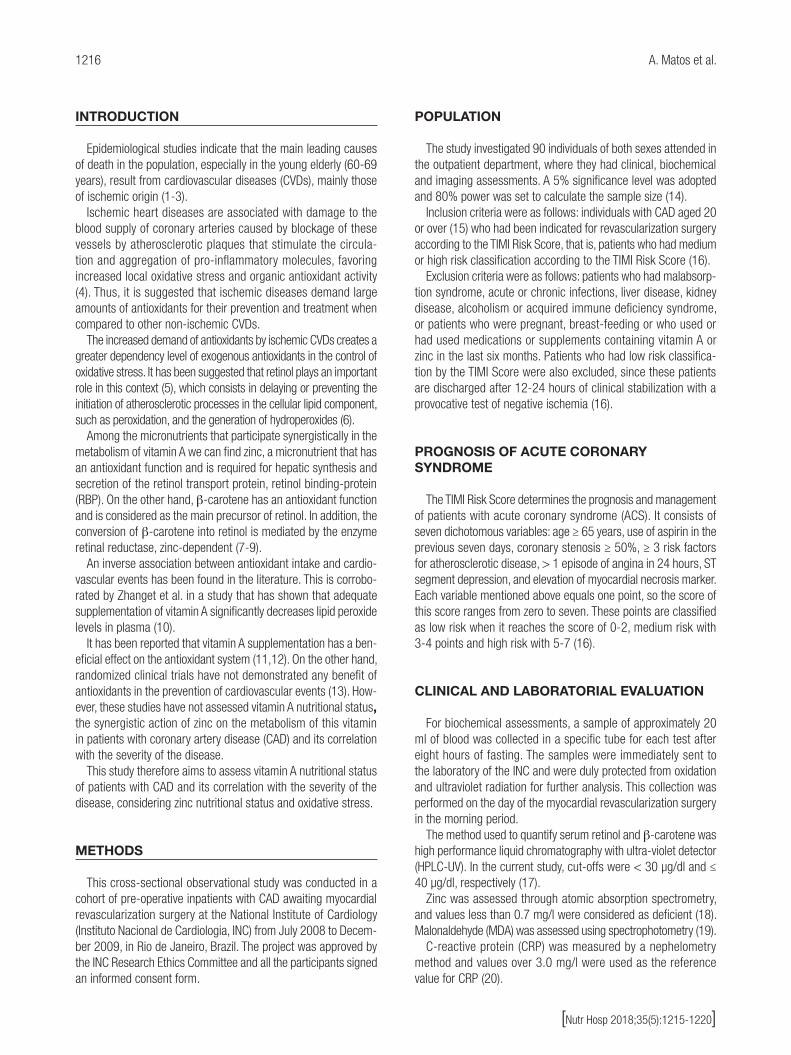
1216 A. Matos et al.
[Nutr Hosp 2018;35(5):1215-1220]
INTRODUCTION
Epidemiological studies indicate that the main leading causes of death in the population, especially in the young elderly (60-69 years), result from cardiovascular diseases (CVDs), mainly those of ischemic origin (1-3).
Ischemic heart diseases are associated with damage to the blood supply of coronary arteries caused by blockage of these vessels by atherosclerotic plaques that stimulate the circula-tion and aggregation of pro-inflammatory molecules, favoring increased local oxidative stress and organic antioxidant activity (4). Thus, it is suggested that ischemic diseases demand large amounts of antioxidants for their prevention and treatment when compared to other non-ischemic CVDs.
The increased demand of antioxidants by ischemic CVDs creates a greater dependency level of exogenous antioxidants in the control of oxidative stress. It has been suggested that retinol plays an important role in this context (5), which consists in delaying or preventing the initiation of atherosclerotic processes in the cellular lipid component, such as peroxidation, and the generation of hydroperoxides (6).
Among the micronutrients that participate synergistically in the metabolism of vitamin A we can find zinc, a micronutrient that has an antioxidant function and is required for hepatic synthesis and secretion of the retinol transport protein, retinol binding-protein (RBP). On the other hand, β-carotene has an antioxidant function and is considered as the main precursor of retinol. In addition, the conversion of β-carotene into retinol is mediated by the enzyme retinal reductase, zinc-dependent (7-9).
An inverse association between antioxidant intake and cardio-vascular events has been found in the literature. This is corrobo-rated by Zhanget et al. in a study that has shown that adequate supplementation of vitamin A significantly decreases lipid peroxide levels in plasma (10).
It has been reported that vitamin A supplementation has a ben-eficial effect on the antioxidant system (11,12). On the other hand, randomized clinical trials have not demonstrated any benefit of antioxidants in the prevention of cardiovascular events (13). How-ever, these studies have not assessed vitamin A nutritional status, the synergistic action of zinc on the metabolism of this vitamin in patients with coronary artery disease (CAD) and its correlation with the severity of the disease.
This study therefore aims to assess vitamin A nutritional status of patients with CAD and its correlation with the severity of the disease, considering zinc nutritional status and oxidative stress.
METHODS
This cross-sectional observational study was conducted in a cohort of pre-operative inpatients with CAD awaiting myocardial revascularization surgery at the National Institute of Cardiology (Instituto Nacional de Cardiologia, INC) from July 2008 to Decem-ber 2009, in Rio de Janeiro, Brazil. The project was approved by the INC Research Ethics Committee and all the participants signed an informed consent form.
POPULATION
The study investigated 90 individuals of both sexes attended in the outpatient department, where they had clinical, biochemical and imaging assessments. A 5% significance level was adopted and 80% power was set to calculate the sample size (14).
Inclusion criteria were as follows: individuals with CAD aged 20 or over (15) who had been indicated for revascularization surgery according to the TIMI Risk Score, that is, patients who had medium or high risk classification according to the TIMI Risk Score (16).
Exclusion criteria were as follows: patients who had malabsorp-tion syndrome, acute or chronic infections, liver disease, kidney disease, alcoholism or acquired immune deficiency syndrome, or patients who were pregnant, breast-feeding or who used or had used medications or supplements containing vitamin A or zinc in the last six months. Patients who had low risk classifica-tion by the TIMI Score were also excluded, since these patients are discharged after 12-24 hours of clinical stabilization with a provocative test of negative ischemia (16).
PROGNOSIS OF ACUTE CORONARY SYNDROME
The TIMI Risk Score determines the prognosis and management of patients with acute coronary syndrome (ACS). It consists of seven dichotomous variables: age ≥ 65 years, use of aspirin in the previous seven days, coronary stenosis ≥ 50%, ≥ 3 risk factors for atherosclerotic disease, > 1 episode of angina in 24 hours, ST segment depression, and elevation of myocardial necrosis marker. Each variable mentioned above equals one point, so the score of this score ranges from zero to seven. These points are classified as low risk when it reaches the score of 0-2, medium risk with 3-4 points and high risk with 5-7 (16).
CLINICAL AND LABORATORIAL EVALUATION
For biochemical assessments, a sample of approximately 20 ml of blood was collected in a specific tube for each test after eight hours of fasting. The samples were immediately sent to the laboratory of the INC and were duly protected from oxidation and ultraviolet radiation for further analysis. This collection was performed on the day of the myocardial revascularization surgery in the morning period.
The method used to quantify serum retinol and β-carotene was high performance liquid chromatography with ultra-violet detector (HPLC-UV). In the current study, cut-offs were < 30 µg/dl and ≤ 40 µg/dl, respectively (17).
Zinc was assessed through atomic absorption spectrometry, and values less than 0.7 mg/l were considered as deficient (18). Malonaldehyde (MDA) was assessed using spectrophotometry (19).
C-reactive protein (CRP) was measured by a nephelometry method and values over 3.0 mg/l were used as the reference value for CRP (20).

1217
[Nutr Hosp 2018;35(5):1215-1220]
VITAMIN A NUTRITIONAL STATUS IN PATIENTS WITH CORONARY ARTERY DISEASE AND ITS CORRELATION WITH THE SEVERITY OF THE DISEASE
CAD severity was determined by coronary cineangiography using a classification criteria adapted from the method proposed by Bogaty et al. (21). An echocardiogram was performed (22) and systolic dysfunction was considered to occur when the ejection fraction < 50% (23).
Data collection instruments consisted of a form filled out by only one interviewer with information gathered from a structured questionnaire and medical records. The diagnosis of hyperten-sion, dyslipidemia and/or diabetes mellitus was obtained from the patient’s medical records.
The general characteristics of the sample related to smok-ing were defined according to the World Health Organization (WHO, 1998) as follows: regular smoker, a consumer of at least 1 cigarette/day that consumed at least 100 cigarettes in his/her lifetime; ex-smoker, a smoker who consumed at least 100 cigarettes in his/her lifetime and stopped smoking; occasional smoker, a consumer of less than one cigarette/day or who consumes sporadically; and non-smokers, individuals who do not fit into any of these categories (24). Recent studies have suggested that a 30-minute exposure to environmen-tal tobacco smoke is sufficient to affect the endothelial cells of the coronary arteries of non-smokers. Therefore, passive smoking is defined as smoking exposure by non-smokers, at home, at work or in other enclosed places, excluding outdoor occupations (25).
STATISTICAL EVALUATION
In data assessment, central tendency and dispersion were calculated using the Chi-square test to assess the association between categorical variables, while the Student’s t-test and the ANOVA test (normal distributions), Mann-Whitney and Krus-kal-Wallis tests (non-normal distributions) and Spearman’s cor-relation coefficient were used to compare continuous variations. A 5% significance level was set (p ≤ 0.05). Statistical analysis was undertaken using the Statistical Package for the Social Sciences (SPSS) for Windows, version 17.
RESULTS
A total of 90 individuals were studied, aged 39-88 (mean age: 64.5 ± 9.6 years), of whom 27.8% were female and 72.2% were male. Data were adjusted for gender and age. The general characteristics of the sample are shown in table I.
The percentage of patients with deficiency of serum concentra-tions of retinol, β-carotene and zinc was 7.8%, 86% and 17.8%, respectively (Table II).
No correlation was found between zinc concentrations and retinol (r = -0.009/p = 0.40), β-carotene (r = -0.06/p = 0.73) or MDA (r = 0.03/p = 0.70). However, it was found that zinc deficiency was more frequent in patients with higher serum MDA levels (quartiles 50 and 75), although this trend was not statisti-cally significant (p = 0.44).
Mean CRP was 5.9 ± 14.6 mg/dl, with 36.7% of the individu-als falling above the cut-off established, which showed that this was associated with deficiency of serum retinol concentrations (x2 = 3.95/p = 0.04). Furthermore, a trend concerning β-carotene was noted: amongst the patients with deficient serum levels, 48% had high CRP (p = 0.07).
In the assessment of CAD severity, a correlation was found between severity and extent (x2 = 67.9/p < 0.001), occlusion (x2 = 34.5/p < 0.001) and CRP (x2 = 5.9/p = 0.05) (Table III).
All the individuals with retinol deficiency had a higher degree of severity, i.e., over 90% arterial stenosis, although this was not statistically significant. β-carotene, zinc and MDA did not correlate with severity. It was found that serum β-carotene levels dimin-ished as the extension score rose, but not significantly (p = 0.12). Extension was the only factor found to be associated with MDA (x2 = 42.1/p < 0.001). Occlusion did not correlate with any variable.
When assessing the ejection faction, a positive correlation was found with serum β-carotene concentrations (r = 0.42/p = 0.02).
Table I. General characteristics of the patients studied
Characteristics Mean
Age (years) 64.5 ± 9.6
Gender (%)
Male 72.2
Female 27.8
BMI (kg/m²) 27.67 ± 3.2
SH (%) 100
DLP (%) 94.9
DM (%) 32.5
Smoking (%)
Regular smoker 2.4
Prior smoker 73.3
Occasional smoker 0
Non-smoker 24.1
Passive smoker 8.3
SH: systemic hypertension; DLP: dyslipidemia; DM: diabetes mellitus.
Table II. Percentage of patients with deficiency of serum retinol, β-carotene
and zinc levels
Retinol β-carotene Zinc
Inadequate 7.8% 86% 17.8%
Adequate 92.2% 14% 82.2%

1218 A. Matos et al.
[Nutr Hosp 2018;35(5):1215-1220]
When investigating the relation between oxidative stress and vitamin A serum concentrations in the total sample, a negative and significant correlation was found between retinol, β-carotene and thiobarbituric acid reactive substances (TBARS) serum con-centrations (Table IV). It is important to mention that the patients with zinc inadequacy (69%) concomitantly presented retinol and β-carotene deficiency, which was more frequent in patients with higher circulating concentrations of TBARS.
DISCUSSION
In this study, β-carotene and retinol deficiency was found in 86% and 7.8% of the patients, respectively. Such results could be related to the greater mobilization of β-carotene for conversion into retinol, since β-carotene is recognized as the most powerful retinol precursor (26,27). This finding deserves attention, since reduced serum β-carotene concentrations are associated with increased oxidative stress, showing that this antioxidant could be diverted to other important functions, such as combating oxidative stress, in order to maintain an adequate retinol nutritional status. As such, adequate retinol levels are important for preserving the antioxidant function of β-carotene.
There was no correlation between serum vitamin A and zinc concentrations. No studies have been found in the literature that concomitantly assessed these nutrients in the target pub-lic studied. This result could be masked because, due to strict homeostatic control, serum zinc levels could fluctuate to limits above the real values, even in individuals with low levels of this mineral.
A significant association was found between CRP and serum retinol levels. This finding is corroborated by Nogueira et al. (28), who have found that individuals with high CRP had lower retinol levels in their blood. This could be related to the fact that when the liver is inflamed, it prioritizes the production of acute-phase proteins needed for the defense of the host, resulting in reduced production of RBP, the carrier protein for retinol. This leads to a reduction in the nutrients involved in combating oxidative stress, possibly due to the increased demand for nutrients with antioxi-dant function in such individuals.
According to epidemiological research (29,30), a high con-sumption of carotenoid-rich fruits and vegetables is associated with reduced CRP. Although this study did not assess the individ-uals’ diets, it was found that 48% of the patients with hypocar-otenemia had high CRP. Suárez et al. (31) found that the lower β-carotene was associated with higher CRP, therefore, this micro-nutrient is involved in reducing lipid peroxidation inactivation of reactive oxygen species, as well as in the greater mobilization of β-carotene for conversion into retinol.
There was a significant association between CRP levels and the severity of stenosis. This shows that CRP concentrations are related to the severity of the disease, suggesting that inflammation is not just a mechanism related to plaque rupture, but is also is correlated with the participation of chronic atherosclerosis. Similar results have been found by Shen et al. (32) and Pan et al. (33), who have identified a positive correlation between CRP and the severity of CAD using angiography.
Some studies have demonstrated the participation of CRP in since it exerts a pro-inflammatory effect (34). In addition, increased levels of CRP are considered as an independent risk factor for CVD, even for borderline dyslipidemic individuals as they have great risk of suffering acute myocardial infarction (AMI) (35).
When it comes to the severity of CAD, the overall patients with retinol deficiency presented a higher degree of severity, i.e., over 90% stenosis, although this was not statistically significant. This can be explained since CRP has been recognized as a marker of inflammation related to CAD severity and deficiency of serum retinol levels. Recent studies have shown that vitamin A concen-tration is increased in the ischemic heart, as this micronutrient is related to proliferative processes of cardiac progenitor cells such as cicatrization and cellular repair. Therefore, depletion of hepat-ic vitamin A stores affects the molecular structure of the heart (36,37). Furthermore, the studies that have assessed the severity of CAD have not checked vitamin A nutritional status, which pre-vents making comparisons with the results obtained here.
Atherosclerosis risk factors induce endothelial dysfunction and thereby, oxidative stress (38). In the present study, an association was observed between MDA and CAD extent, determined by the number of diseased vessels. This finding has been corroborated by Basarici et al. (39), who have found a correlation between several risk factors, the extent and severity of CAD with high uri-nary concentrations of 8-isoprostane, considered as a marker of oxidative stress.
It was found that serum β-carotene concentrations diminished as the extent score rose, which suggests a possible increase in
Table III. Association between severity of coronary arterial stenosis and extent,
occlusion and C-reactive protein
Severity
n x2 p-value
Extent 90 67.9 < 0.001*
Occlusion 90 34.5 < 0.001*
CRP (mg/l) 90 5.9 < 0.05*
Table IV. Correlation between serum retinol and β-carotene and thiobarbituric
acid reactive substances
TBARS
R p-value
Serum retinol -0.3 0.003
Serum β-carotene -0.31 0.02

1219
[Nutr Hosp 2018;35(5):1215-1220]
VITAMIN A NUTRITIONAL STATUS IN PATIENTS WITH CORONARY ARTERY DISEASE AND ITS CORRELATION WITH THE SEVERITY OF THE DISEASE
β-carotene demand to combat the oxidative stress implicated in CAD. However, Riccioni et al. (40) have noted that this antioxidant is directly associated with arterial intima-media thickness.
Ejection fraction is an indicator used to determine the volume of blood pumped by the heart and is important for quantifying sys-tolic function, besides supplying information for determining the prognosis of CAD (41). In this study, ejection fraction was found to correlate positively with the serum concentration of β-carotene.
Singh et al. (42) and Bockeria et al. (43) have observed that decreased ejection fraction in individuals after a myocardial infarc-tion significantly reduced their quality of life measured by their phys-ical and social function and physiological wellbeing. An ejection fraction of < 50% was also considered as a risk factor for predicting mortality after myocardial revascularization surgery (44).
Literature is scarce on the relationship between ejection fraction and nutrients with antioxidant function since only three studies corroborate the result found, as follows. Polidori et al. (45) have observed a correlation between vitamin A, lutein, lycopene, vitamin E and ejection fraction in patients with congestive heart failure. Witte et al. (46) have reported that they supplemented men over 60 with a mix of micronutrients and vitamins, including vitamin A, which resulted in a significant increase in ejection fraction and quality of life when compared to the control group. Finally, Zhu et al. have found that all-trans retinoic acid (ATRA) has anti-apoptotic activity and protective role on myocardial in vivo, because this micronutrient reduced the size of the infarcted area and rescued cardiac function loss (47).
In the current study, 73.3% of the patients were ex-smokers according to the WHO criteria (1998). Therefore, individuals who have recently quit smoking and those who have not smoked for years were in the same group, since the time in which an indi-vidual stopped smoking could interfere in the results found in the literature (48,49). This fact can be considered as a limiting factor in the study.
CONCLUSION
In view of the results presented, it may be concluded that the chronic inflammation caused by atherosclerosis and its relation-ship with the severity of the disease influence vitamin A nutritional status due to the negative repercussions that deficiency of this nutrient can have on the disease in question.
REFERENCES
1. Ministério da Saúde, Brazil. DATASUS: Informações em Saúde. Ministério da Saúde, Sistema de Informações sobre Mortalidade (SIM); 2010. Accessed on July 13, 2014. Available from: http://tabnet.datasus.gov.br/cgi/deftohtm.exe?sim/cnv/obt09uf.def
2. Instituto Brasileiro de Geografia e Estatística. Pesquisa Nacional de Saúde 2013. Percepção de estado de saúde, estilo de vida e doenças crônicas. Rio de Janeiro: IBGE; 2014.
3. GBD 2013 Mortality and Causes of Death Collaborators. Global, regional, and national age-sex specific all-cause and cause-specific mortality for 240 causes of death, 1990-2013: a systematic analysis for the Global Burden of Disease Study 2013. Lancet 2015;385(9963):117-71.
4. Ivanova EA. LDL electronegativity index: a potential novel index for predicting cardiovascular disease. Vasc Health Risk Manag 2015;11:525-32.
5. Poss J, Ukena C, Kindermann I, et al. Angiopoietin-2 and outcome in patients with acute decompensated heart failure. Clin Res Cardiol 2015;104:380-7.
6. Asson-Batres MA, Ryzhov S, Tikhomirov O, et al. Effects of vitamin A deficien-cy in the postnatal mouse heart: role of hepatic retinoid stores. Am J Physiol Heart Circ Physiol 2016;310(11):H1773-89.
7. Harari A, Abecassis R, Relevi N, et al. Prevention of atherosclerosis progres-sion by 9-cis-β-carotene rich alga dunaliella in apoE-deficient nice. BioMed Res Int 2013.
8. Zhang PY, Xu X, Li XC, et al. Cardiovascular diseases: oxidative damage and antioxidant protection. Eur Rev Med Pharmacol Sci 2014;18:3091-6.
9. Chagas C, Saunders C, Pereira S, et al. Vitamin A status and its relationship with serum zinc concentrations among pregnant women who have previously undergone Roux-en-Y gastric bypass. Int J Gynaecol Obstet 2016;133:94-7.
10. Zhang PY, et al. Cardiovascular diseases: oxidative damage and antioxidant protection. Eur Rev Med Pharmacol Sci 2014;18(20):3091-6.
11. Csepanyi E, Czompa A, Haines D, et al. Cardiovascular effects of low versus high-dose beta-carotene in a rat model. Pharmacol Res 2015;100:148-56.
12. Matos AC, Souza GG, Moreira V, et al. Effect of vitamin A supplementation on clinical evolution in patients undergoing coronary artery bypass graf-ting, according to serum levels of zinc. Nutr Hosp 2012;27(6):1981-6. DOI: 10.3305/nh.2012.27.6.5891
13. Bjelakovic G, Nikolova D, Gluud LL, et al. Mortality in randomized trials of antioxidant supplements for primary and secondary prevention: systematic review and meta-analysis. JAMA 2007;297(8):842-57.
14. Fleiss JL. Design and Analysis of Clinical Experiments. 2011.15. World Health Organization (WHO). WHO Discussion Papers on Adolescence -
Issues in Adolescent Health and Development. Geneva: WHO; 2004. 16. Morrow DA, Antman EM, Charlesworth A, et al. TIMI risk score for ST-ele-
vation myocardial infarction: a convenient, bedside, clinical score for risk assessment at presentation - An intravenous nPA for treatment of infarcting myocardium early II trial substudy. Circulation 2000;102(17):2031-7.
17. Sauberlich H, Hodges RE, Wallace DL, et al. Vitamin A metabolism and requirements in human studied with the use of labeled retinol. Vitam Horm 1974;32:251-75.
18. Hotz C, Peerson JM, Brown KH, et al. Suggested lower cutoffs of serum zinc concentrations for assessing zinc status: reanalysis of the second National Health and Nutrition Examination Survey data (1976-1980). Am J Clin Nutr 2003;78:756-64.
19. Ohkawa H, Ohishi N, Yagi K, et al. Assay for lipid peroxides in animal tissues by thiobarbituric acid reaction. Anal Biochem 1979;95:351-8.
20. Pearson TA, Mensah GA, Alexander RW, et al. Markers of inflammation and cardiovascular disease. Circulation 2003;107:499-511.
21. Bogaty P, Brecker SJ, White SE, et al. Comparison of coronary angiographic findings in acute and chronic first presentation of ischemic heart disease. Circulation 2018;87:1938-46.
22. Lang RM, Bierig M, Devereux RB, et al. Recommendations for chamber quantifi-cation: a report from the American Society of Echocardiography’s Guidelines and Standards Committee and the Chamber Quantification Writing Group, developed in conjunction with the European Association of Echocardiography, a branch of the European Society of Cardiology. J Am Soc Echocardiogr 2005;18:1440-63.
23. Bocchi EA, Marcondes-Braga FG, Ayub-Ferreira SM, et al. Sociedade Bra-sileira de Cardiologia. III Diretriz brasileira de insuficiência cardíaca crônica. Arq Bras Cardiol 2009;93:01-71.
24. World Health Organization (WHO). Guidelines for controlling and monitoring the tobacco epidemic. Geneva: WHO; 1998.
25. Lotufo JP. Tabagismo, uma doença pediátrica. São Paulo: Savier; 2007. pp. 17-9.26. Teske M, Melges AP, Suano F, et al. Plasma concentration of retinol in obese
children and adolescents: relationship to metabolic syndrome components. Rev Paul Pediatr 2014;32:396-401.
27. Albuquerque MNL, Diniz AS, Arruda IKG, et al. Elevated serum retinol and low beta-carotene but not alpha-tocopherol concentration are associated with dyslipidemia in Brazilian adolescents. J Nutr Sci Vitaminol 2016;62:73-80.
28. Nogueira C, Borges F, Lameu E, et al. Retinol, β-carotene and oxidative stress in systemic inflammatory response syndrome. Rev Assoc Med Bras 2015;61(2):116-20.
29. Fredrikson GN, Hedblad B, Nilsson JA, et al. Association between diet, lifes-tyle, metabolic cardiovascular risk factors, and plasma C-reactive protein levels. Metab Clin Exp 2004;53:1436-42.
30. Watzl B, Kulling SE, Möseneder J, et al. A 4-wk intervention with high intake of carotenoid-rich vegetables and fruit reduces plasma C-reactive protein in healthy, nonsmoking men. Am J Clin Nutr 2005;82:1052-8.

1220 A. Matos et al.
[Nutr Hosp 2018;35(5):1215-1220]
31. Suárez EC, Schramm-Sapyta NL. Race differences in the relation of vitamins A, C, E, and β-carotene to metabolic and inflammatory biomarkers. Nutr Res 2014;1:1-10.
32. Shen Y, Ding FH, Zhang RY, et al. Serum cystatin C reflects angiographic coro-nary collateralization in stable coronary artery disease patients with chronic total occlusion. PLoS One 2015;10(9):e0137253.
33. Pan HC, Shey WH, Lee WJ et al. Coronary severity score and C-reactive pro-tein predict major adverse cardiovascular events in patients with stable coronary artery disease (from the Taichung CAD study). Clin Chim Acta 2015;445:93-100.
34. Svensson E, Mor A, Rungby J, et al. Lifestyle and clinical factors associated with elevated C-reactive protein among newly diagnosed type 2 diabetes mellitus patients: a cross-sectional study from the nationwide DD2 cohort. BMC Endocr Disord 2014;14-74.
35. Kawada T, Andou T, Fukumitsu M. Metabolic syndrome showed significant relationship with carotid atherosclerosis. Heart Vessels 2016;31(5):664-70.
36. Poss J, Ukena C, Kindermann I, et al. Angiopoietin-2 and outcome in patients with acute decompensated heart failure. Clin Res Cardiol 2015;104:380-7.
37. Asson-Batres MA, Ryzhov S, Tikhomirov O, et al. Effects of vitamin A deficien-cy in the postnatal mouse heart: role of hepatic retinoid stores. Am J Physiol Heart Circ Physiol 2016;310(11):H1773-89.
38. Habib SS, Al Masri AA. Relationship of high sensitivity C-reactive protein with pre-sence and severity of coronary artery disease. Pak J Med Sci 2013;29(6):1425-9.
39. Basarici I, Altekin RE, Demir I, et al. Urinary 8-isoprostane levels can indicate the presence, severity and extent of angiographic coronary artery disease. Acta Cardiol 2008;63:415-22.
40. Riccioni G, D’Orazio N, Palumbo N, et al. Relationship between plasma antioxi-dant concentrations and carotid intima-media thickness: the Asymptomatic Carotid Atherosclerotic Disease in Manfredonia Study. Eur J Cardiovasc Prev Rehabil 2009;16(3):351-7.
41. Bonow RO, Castelvecchio S, Panza JA, et al. Severity of remodeling, myocar-dial viability, and survival in ischemic LV dysfunction after surgical revascula-rization. JACC Cardiovasc Imaging 2015;8(10):1121-9.
42. Singh P, Sethi N, Kaur N, et al. Revascularization in severe left ventricular dysfunction: does myocardial viability even matter? Clin Med Insights Cardiol 2015;9(Suppl 1):105-9.
43. Bockeria LA, Sokolskaya NO, Kopylova NS, et al. Echocardiographic predictors of the severity of the early postoperative period in patients after surgical myo-cardial revascularization. Anesteziol Reanimatol 2015;5:8-11.
44. Wang R, Gao CQ, Xiao CS, et al. Long-term outcome of surgical revasculari-zation in patients with ischemic heart disease and left ventricular dysfunction. Zhonghua Yi Xue Za Zhi 2016;15:1178-82.
45. Polidori MC, Savino K, Alunni G, et al. Plasma lipophilic antioxidants and malondialdehyde in congestive heart failure patients: relationship to disease severity. Free Radical Biol Med 2002;32:148-52.
46. Witte K, Nikitin NP, Parker AC, et al. The effect of micronutrient supplemen-tation on quality-of-life and left ventricular function in elderly patients with chronic heart failure. Eur Heart J 2005;26:2238-44.
47. Zhu Z, Zhu J, Zhao X, et al. All-trans retinoic acid ameliorates myocardial ischemia/reperfusion injury by reducing cardiomyocyte apoptosis. PloS One 2015;10(7):e0133414.
48. Steele L, Lloyd A, Fotheringham J, et al. A retrospective cross-sectional study on the association between tobacco smoking and incidence of ST-segment elevation myocardial infarction and cardiovascular risk factors. Postgrad Med J 2015;91(1079):492-6.
49. Yi M, Chun EJ, Lee MS, et al. Coronary CT angiography findings based on smoking status: Do ex-smokers and never-smokers share a low pro-bability of developing coronary atherosclerosis? Int J Cardiov. Imaging 2015;2:169-76.

NutriciónHospitalaria
Revisión
ISSN (electrónico): 1699-5198 - ISSN (papel): 0212-1611 - CODEN NUHOEQ S.V.R. 318
Correspondencia: Anghy Daniela Aponte Borda. Departamento de Nutrición y Dietética. Universidad Nacional de Colombia. Carrera 30 no. 45-03, edif. 471, of. 545. Bogotá, Colombiae-mail: [email protected]
Aponte Borda AD, Pinzón Espitia OL, Aguilera Otalvaro PA. Tamizaje nutricional en paciente pediátrico hospitalizado: revisión sistemática. Nutr Hosp 2018;35(5):1221-1228
DOI: http://dx.doi.org/10.20960/nh.1658
Autoría: Todas las autoras declaramos que hemos contribuido intelectualmente en la elaboración del artículo.
Tamizaje nutricional en paciente pediátrico hospitalizado: revisión sistemáticaNutritional screening in hospitalized pediatric patients: systematic review
Anghy Daniela Aponte Borda1,2, Olga Lucia Pinzón Espitia1,2 y Paula Andrea Aguilera Otalvaro2 1Departamento de Nutrición y Dietética. Universidad Nacional de Colombia. Colombia. 2Hospital Universitario Mayor-Méderi. Colombia
Palabras clave:
Desnutrición. Cribado nutricional. Pediatría. Hospitalización.
ResumenIntroducción: la malnutrición en la población pediátrica está asociada a problemas fisiológicos y complicaciones, que conllevan mayor estancia hospitalaria y aumento de la morbimortalidad y de costos de atención.
Objetivo: el propósito de esta revisión sistemática es recopilar la evidencia disponible sobre herramientas de tamizaje nutricional en pediatría que permitan prevenir e intervenir la malnutrición hospitalaria y entregar directrices en cuanto al momento oportuno de aplicación.
Material y métodos: se realizó una revisión sistemática de literatura de acuerdo con la Declaración Preferred Reporting Items in Systematic Reviews and Meta-Analyses (PRISMA) en las principales bases de datos, búsqueda en ClinicalTrials y literatura gris en Open grey y TRIP Database. Luego se seleccionaron y clasificaron los artículos dependiendo del tipo de estudio. La evaluación de calidad se hizo acorde con las listas de verificación Scottish Intercollegiate Guidelines Network (SIGN).
Resultados: se identificaron 110 artículos, siguiendo los parámetros de la declaración PRISMA. Veintiún artículos fueron analizados y evaluados mediante la metodología SIGN; 19 cumplieron con los criterios de alta calidad y fueron incluidos en la presente revisión. Se identificaron seis herramientas de tamizaje nutricional en pediatría, siendo STRONGkids la herramienta referida por el 63% de los estudios para la detección del riesgo de desnutrición.
Conclusiones: la presente revisión sistemática permitió concluir que la mejor herramienta de tamizaje en niños hospitalizados es STRONGkids puesto que es práctica, rápida, de fácil uso y predice con fiabilidad el riesgo de desnutrición. No obstante, se requieren mayores estudios para validar el uso de esta en el contexto colombiano.
Key words:
Malnutrition. Nutritional screening. Pediatrics. Hospitalization.
AbstractIntroduction: malnutrition in the pediatric population has been associated with a great number of physiological problems and complications, which lead to a longer period of hospitalization, a higher risk of infections, a rise in mortality rate, and hence, a rise in assistance expenses.
Objective: to collect available evidence on tools of nutritional screening frequently used in pediatrics that allow identifying, preventing and intervening hospital malnutrition, as well as providing guidelines regarding the appropriate application instant.
Materials and methods: a systematic review of literature was carried out in accordance with the PRISMA Declaration (Preferred Reporting Items in Systematic Reviews and Meta-Analyses) and in the main databases, search in ClinicalTrials and gray literature in Open Gray and TRIP Database. Then, the articles were selected and classified depending on the type of study. The quality assessment was done in accordance with the Scottish Intercollegiate Guidelines Network (SIGN) checklists.
Results: one hundred and ten articles were identified, following the parameters of the PRISMA declaration. Twenty-one articles were analyzed and evaluated through the SIGN methodology; 19 met the high quality criteria and were included in the present review. Six nutritional screening tools in pediatrics were identified, STRONGkids being the tool referred by 63% of the studies for the detection of malnutrition risk.
Conclusions: the present systematic review allowed us to conclude that STRONGkids is the best screening tool for hospitalized children since it is practical, quick, easy to use and it reliably predicts the risk of malnutrition. However, further studies are required to validate the use of this in the Colombian context.
Recibido: 28/10/2017 • Aceptado: 26/11/2017
©Copyright 2018 SENPE y ©Arán Ediciones S.L. Este es un artículo Open Access bajo la licencia CC BY-NC-SA (http://creativecommons.org/licenses/by-nc-sa/4.0/).

1222 A. D. Aponte Borda et al.
[Nutr Hosp 2018;35(5):1221-1228]
INTRODUCCIÓN
En los pacientes pediátricos hospitalizados la malnutrición está asociada a un gran número de problemas fisiológicos y complicacio-nes, lo cual conlleva un aumento de la morbimortalidad y, por ende, la disminución de los resultados clínicos favorables de los tratamientos. A su vez, la presencia de desnutrición en los pacientes hospitalizados se relaciona con una pobre evolución clínica, especialmente con una mayor estancia hospitalaria, mayor riesgo de infecciones, necesidad de asistencia respiratoria más prolongada y peor cicatrización (1).
Por consiguiente, la desnutrición en el paciente hospitalizado es el resultado de la compleja interacción entre enfermedad y estado nutricional, lo que genera importantes consecuencias clínicas y eco-nómicas. Clínicamente, puede contribuir a incrementar el número y las complicaciones de la patología, a disminuir la capacidad de respuesta al tratamiento y el grado de respuesta inmune y a incrementar la morbimortalidad. Desde el punto de vista económico, está demostra-do que aumenta el costo asociado a la prolongación de la estancia hospitalaria así como el costo asociado al tratamiento adicional de las complicaciones (2). Lo anterior evidencia la necesidad de identificar de manera oportuna el riesgo nutricional del paciente, que hace referencia a factores que afectan directamente el estado nutricional, tales como pérdida de peso, disminución de grasa subcutánea y/o masa muscular, baja ingesta, condición patológica y estrés por enfermedad, lo cual se debe identificar tan pronto como sea posible por medio del tamizaje nutricional, para la prevención de desnutrición o para el tratamiento de esta, en aquellos pacientes que ingresan a hospitalización con deterio-ro en el estado nutricional, por medio de herramientas que indagan el estado nutricional actual del paciente. Asimismo, las herramientas de tamizaje nutricional se deben caracterizar por ser de fácil comprensión tanto para el personal asistencial como para el paciente, sencillas, rápidas de aplicar y reproducibles, con el objetivo de identificar el riesgo nutricional de manera oportuna. Dentro de las herramientas de tamizaje encontramos Nutrition Risk Score (NRS), Pediatric Nutritional Risk Score (PYMS), Screening Tool for the Assessment of Malnutrition in Paediatrics (STAMP), Paediatric Yorkhill Malnutrition Score (PNRS), Screening Tool for Risk of Impaired Nutritional Status and Growth (STRONG kids) y Subjetive Global Nutritional Assessment (SGNA), entre otras, utilizadas a nivel hospitalario (3-7).
Teniendo en cuenta lo anterior, y evidenciando la necesidad de un consenso acerca de la herramienta de tamizaje nutricional más apropiada para aplicar en población infantil en ambiente hospita-lario, es fundamental realizar una comparación exhaustiva de las diversas herramientas de tamizaje nutricional. Por esta razón, el objetivo de esta revisión sistemática es recopilar la evidencia dis-ponible sobre herramientas de tamizaje nutricional en pediatría que permitan prevenir e intervenir la malnutrición hospitalaria, así como entregar directrices en cuanto al momento oportuno de aplicación.
MATERIAL Y MÉTODOS
Esta revisión sistemática de la literatura fue diseñada y desa-rrollada de acuerdo con la declaración Preferred Reporting Items in Systematic Reviews and Meta-Analyses (PRISMA) (8).
La selección de artículos se llevó a cabo considerando los si-guientes criterios de inclusión: estudios en pacientes pediátricos hospitalizados, publicados desde el año 2000 hasta 2017, sin límite de idioma, incluidos revisiones sistemáticas y metaanálisis, estudios de cohortes, estudios de casos y controles y estudios de prueba diagnóstica. Se excluyeron los artículos sin relación con las palabras clave y capítulos de libros.
En cuanto a la estrategia de búsqueda bibliográfica, se realizó la búsqueda en las principales bases de datos Scopus, Embase, PubMed, LILACS y ScienceDirect, y se utilizaron términos como “nutritional screening tools, hospitalized and child”. Además, en cuanto a las palabras clave, se utilizó el operador booleano “AND” para la combinación de términos en la búsqueda en las bases de datos. Adicionalmente, se hizo la búsqueda en ClinicalTrials y en OpenGrey y TRIP Database para la literatura gris con el objetivo de identificar nuevos artículos no encontrados en las principales bases de datos.
El proceso de selección y clasificación de los artículos se llevó a cabo en tres etapas: primera, identificación de los artículos de la búsqueda en las bases de datos; segunda, organización y selec-ción de los artículos según nombre, autor, año y revista y exclusión de artículos duplicados en cada una de las bases de datos; y tercera, elegibilidad: teniendo en cuenta el título y el resumen, se excluyeron aquellos que no tenían relación con las palabras clave definidas para la búsqueda y aquellos que cumplían los criterios de exclusión definidos anteriormente.
Adicionalmente, se realizó la clasificación de los artículos según el tipo de estudio (revisiones sistemáticas y metaanálisis, estudios de cohortes, estudios de casos y controles y estudios diagnósticos).
La evaluación de la calidad de los artículos se hizo acorde con las listas de verificación de la Scottish Intercollegiate Guidelines Network (SIGN) (9) y se consideraron cuatro formatos de verifica-ción de la calidad para cada uno de los anteriores tipos de estudio. Debido a que dichas listas están realizadas para ser aplicadas de manera subjetiva, se realizó una categorización para evaluar la calidad. Por lo cual, se definieron los estudios seleccionados como: inaceptables, < 19%; de baja calidad, 20-39%; acepta-bles, 40-59%; y de alta calidad, 60-100%.
Al realizar la identificación del tipo y diseño de los estudios, se identificó una gran heterogeneidad de los datos, por lo que se decidió no realizar metaanálisis.
Para la extracción de datos de cada publicación se tomó la in-formación que respondiera a la pregunta de investigación, tenien-do en cuenta información de riesgo, asociaciones, rendimiento de prueba diagnóstica, etc. Este proceso fue realizado por tres evaluadores independientes, dos principales y otro en caso de ha-ber discrepancias o de desacuerdo en la evaluación, y verificado posteriormente para comprobar la uniformidad en los mismos.
Finalmente, se realizó la elección de los artículos para la revi-sión sistemática. No obstante, para prevenir el riesgo de sesgo, en primer lugar se evaluó el sesgo de publicación, para lo cual se realizó una búsqueda en las principales bases de datos y se hizo una búsqueda adicional en literatura gris; no se realizó análisis con funnel plot. Asimismo, en las revisiones sistemáticas existe el riesgo de comunicación selectiva. Puede que los resultados estén

1223TAMIZAJE NUTRICIONAL EN PACIENTE PEDIÁTRICO HOSPITALIZADO: REVISIÓN SISTEMÁTICA
[Nutr Hosp 2018;35(5):1221-1228]
influenciados por publicaciones previas; sin embargo, no hubo control de este sesgo, lo que implica una limitación del estudio.
Adicionalmente, se hizo enmascaramiento de los autores, centros de estudio y títulos de los artículos primarios en la evaluación de la calidad de los artículos para evitar sesgos de selección y análisis.
RESULTADOS
Se identificaron 110 artículos de la búsqueda en las bases de datos: 47 artículos de Scopus, 23 artículos de Embase, 17 artículos de PubMed, 15 artículos de LILACS y ocho artículos ScienceDirect. Posteriormente, se eliminaron 38 artículos por du-plicación y se seleccionaron 72 artículos para revisión exhaustiva. Asimismo, al realizar la selección de acuerdo con los criterios de inclusión y exclusión se descartaron 51 artículos. Se seleccio-naron 21 artículos para realizar la evaluación según las listas de verificación SIGN, por lo que se logró elegir 19 artículos de alta calidad para la revisión sistemática (7,10-29) (Fig. 1).
Con respecto a la clasificación de los artículos por el tipo de es-tudio evaluados de acuerdo con el modelo SIGN, se encontró que el 19% cuenta con un nivel de evidencia 1; el 24%, con un nivel de evidencia 2; y el 57%, con un nivel de evidencia 3 (Tabla I).
Por otro lado, al evaluar los niveles de calidad de la evidencia científica por medio de SIGN, se constató que el 90% de los artículos seleccionados son de alta calidad (Tabla II).
Adicionalmente, se realizó la caracterización de dichos artícu-los y se determinó que el 53% de los artículos se realizaron en Europa; el 21%, en Suramérica; el 16%, en Oceanía; y un 10%, en el continente asiático. Además de los 19 artículos selecciona-dos, cuatro fueron publicados en 2013, reincidiendo este mismo número en los años 2014 y 2015. Por otra parte, el 74% de los artículos se realizaron con población pediátrica de entre un mes y 18 años de edad, el 21% con artículos de revisión y un 5% con hospitales pediátricos, para un total de 4.070 niños. Se muestra una descripción completa en la tabla III.
Figura 1.
Diagrama de flujo de la selección de artículos para la revisión sistemática.
Tabla I. Clasificación de los artículos por tipo de estudio y niveles de evidencia evaluados con la herramienta SIGN
Tipo de estudio Nivel de
evidencia n %
Metaanálisis, revisiones sistemáticas de ensayos clínicos aleatorizados o ensayos clínicos aleatorizados
1 4 19
Revisiones sistemáticas de alta calidad de estudios de cohortes o de casos y controles o estudios de cohortes o de casos y controles de alta calidad
2 5 24
Estudios no analíticos (observaciones clínicas y series de casos)
3 12 57
Opiniones de expertos* 4 0 0
SIGN: Scottish Intercollegiate Guidelines Network. *En la evaluación de la calidad SIGN incluyen este tipo de artículos, pero por criterios de exclusión no fueron incluidos.
Tabla II. Niveles de calidad de la evidencia científica según los parámetros del Scottish Intercollegiate Guidelines
Network (SIGN)0 n %
Alta calidad 19 90
Aceptable 2 10
Baja calidad 0 0
Inaceptable 0 0

1224 A. D. Aponte Borda et al.
[Nutr Hosp 2018;35(5):1221-1228]
Tabla III. Caracterización de los artículos de alta calidad que cumplen con los criterios de evaluación del Scottish Intercollegiate Guidelines Network (SIGN)
Artículo Autor Año Herramienta LugarPoblación
(niños)Resultado
Nutritional risk and associated factors in hospitalized paediatric patients (12)
Moura y cols.
2016 STRONGkids Brasil 122
La herramienta de detección nutricional STRONGkids en relación con la edad,
el diagnóstico antropométrico y la condición socioeconómica fueron
factores de alto riesgo, por lo cual se deben tener presentes
Nutritional screening in hospitalized pediatric patients: a systematic review (13)
Teixeira y cols.
2016
STAMP, STRONGkids, PYMS, PNST,
SGNA
Brasil 1593
En esta revisión sistemática se resalta el uso de las herramientas STRONGkids
y STAMP, ya que mostraron un buen rendimiento clínico al momento de
realizar la evaluación de riesgo en niños pediátricos
Nutritional screening tool versus anthropometric assessment in hospitalized children: which method is better associated to clinical outcomes (14)
Márquez y cols.
2015 STRONGkids Brasil 181
La herramienta de tamizaje STRONGkids fue un método más sensible en comparación con la
valoración nutricional antropométrica para predecir el riesgo nutricional
Nutritional risk assessment in hospitalized children: a comparison (15)
Campos y cols.
2015SGNA,
STRONGkidsBrasil 317
STRONGkids mostró una mayor asociación pero se requieren mayores
estudios
Accuracy of nutritional screening tools in assessing the risk of undernutrition in hospitalized children (16)
Huysentruyt y cols.
2015STAMP,
PYMS, PNRS, STRONGkids
Bruselas 1.629
En esta revisión sistemática se hace hincapié en que no se puede elegir una herramienta de evaluación nutricional
en función de la exactitud, por lo que se recomienda realizar más investigación
en el tema
More training and awareness are needed to improve the recognition (17)
Huysentruyt y cols.
2015 NST Bélgica 71
Al ser un estudio nacional, en este artículo se evidencia que la mitad de los departamentos pediátricos en hospitales
de nivel secundario no realizan el uso de herramientas nutricionales, debido
en muchos casos a las diferencias culturales o educativas
Simple nutrition screening tool for pediatric inpatients (18)
White y cols. 2014
SGNA vs PNST (Pediatric Nutrition
Screening Tool)
Australia 295
Las herramientas PNST y SGNA pediátricas carecen en la identificación
de desnutrición crónica aguda.Sin embargo, el PNST puede ser una herramienta válida pala la detección
nutricional, aunque se podría modificar para mejorar la detección de niños con
exceso de peso
Validity of nutritional screening tools for hospitalized children (19)
Wonoputri y cols.
2014PYMS, STAMP, STRONGkids,
SGNAIndonesia 116
Es este estudio se recomienda la herramienta PYMS como herramienta de detección nutricional más confiable en un hospital de Bandung, de acuerdo
a su especificidad y sensibilidad
(Continua en la página siguiente)

1225TAMIZAJE NUTRICIONAL EN PACIENTE PEDIÁTRICO HOSPITALIZADO: REVISIÓN SISTEMÁTICA
[Nutr Hosp 2018;35(5):1221-1228]
Tabla III (Cont.). Caracterización de los artículos de alta calidad que cumplen con los criterios de evaluación del Scottish Intercollegiate Guidelines Network (SIGN)
Artículo Autor Año Herramienta LugarPoblación
(niños)Resultado
The prevalence of malnutrition and effectiveness of STRONGkids tool in the identification of malnutrition risks among pediatric surgical patients (20)
Durakbaşa y cols.
2014 STRONGkids. Turquía 495
Se apoya el uso de la herramienta STRONGkids entre los pacientes
quirúrgicos pediátricos para identificar pacientes con riesgo de desnutrición y
para aumentar el conocimiento del médico sobre la evaluación nutricional de los
pacientes hospitalizados en la admisión
The STRONGkids nutritional risk screening tool can be used by paediatric nurses to identify hospitalized children at risk (21)
Moeeni y cols.
2014 STRONGkidsNueva
Zelanda162
Este estudio mostró que STRONGkids es una herramienta válida para la
detección de riesgo nutricional en los niños hospitalizados,
pero es importante que los niños que están en riesgo de desnutrición se identifiquen temprano durante su
ingreso al hospital
Nutritional screening tools for hospitalized children: methodological considerations (22)
Joosten y cols.
2014
NRS, STAMP, STRONGkids, PYMS, PNST,
SGNA
Países Bajos
1.277
Se realiza el análisis de las seis herramientas de tamizaje y se
concluye que STRONGkids parece ser la herramienta más práctica y
reproducible, aunque PYMS es mucho más práctica para la determinación del
riesgo nutricional
Nutritional status and nutrition risk screening in hospitalized children in New Zealand (23)
Moeeni y cols.
2013STAMP, PYMS y
STRONGkidsNueva
Zelanda162
En este estudio, al aplicar las tres herramientas de tamizaje nutricional,
se concluye que la herramienta más confiable en este entorno es
STRONGkids.Sin embargo, se requieren otros estudios en diferentes centros hospitalarios para
confirmar dicha herramienta
Nutrition status on pediatric admissions in Spanish hospitals; DHOSPE study (24)
Moreno y cols.
2013 STAMP España 991Se hace necesario evaluar la eficacia de herramientas de cribado, como el método STAMP, en nuevos estudios
The STRONGkids nutritional screening tool in hospitalized children: a validation study (25)
Huysentruyt y cols.
2013 STRONGkids Holanda 368
Este estudio mostró que STRONGkids era una herramienta válida para la
detección de riesgo nutricional en los niños hospitalizados
Application of a score system to evaluate the risk of malnutrition in a multiple hospital setting (26)
Spagnuolo y cols.
2013 STRONGkids Italia 144
STRONGkids es fácil de administrar y altamente sensible pero no específica.Puede utilizarse como una herramienta
de detección muy preliminar para integrarse con otros datos clínicos con
el fin de predecir con fiabilidad el riesgo de malnutrición.
Además, su estructura es simple, lo que la hace fácil de usar en cualquier
entorno hospitalario
(Continua en la página siguiente)

1226 A. D. Aponte Borda et al.
[Nutr Hosp 2018;35(5):1221-1228]
Tabla III (Cont). Caracterización de los artículos de alta calidad que cumplen con los criterios de evaluación del Scottish Intercollegiate Guidelines Network (SIGN)
Artículo Autor Año Herramienta LugarPoblación
(niños)Resultado
Validation of a nutritional screening tool for hospitalized pediatric patients (27)
Lama y cols. 2012 STAMP España 250
Al utilizar STAMP se sobreestima el número de pacientes en riesgo
de desnutrición, por lo que se hace necesaria una segunda herramienta
más específica
Malnutrition screening tools for hospitalized children (28)
Hartman y cols.
2012
STAMP, STRONGkids, PYMS, PNST,
SGNA
Israel 1.231
Se realiza la revisión de cinco herramientas para la detección de
desnutrición en niños hospitalizados y se dice que, aunque estas herramientas han sido probadas en un grado limitado, no han sido validadas en otros estudios,
por lo que se sugiere que estas herramientas deben ser reproducibles, con buena sensibilidad y especificidad
con respecto a sus resultados
Dutch national survey to test the STRONGkids nutritional risk screening tool in hospitalized children (7)
Hulst y cols. 2011 STRONGkids Holanda 424
Usando la herramienta STRONGkids se encontró una relación significativa entre tener un riesgo alto y una puntuación SD negativa en peso por talla y una estancia prolongada en el hospital.
Por ello, STRONGkids ayudará a aumentar la conciencia del clínico sobre la importancia del estado nutricional en
los niños
Nutritional risk in hospitalized children: an assessment of two instruments (29)
Ling y cols. 2011STRONGkids y
STAMPReino Unido
43
Se sugiere que STRONGkids puede ser una herramienta de detección
nutricional pediátrica más útil, pero se requieren estudios comparativos
adicionales
De igual manera, la presente revisión encontró que las herramien-tas de riesgo nutricional utilizadas en pacientes pediátricos hospita-lizados son: NRS, STAMP, STRONGkids, PYMS, PNST y SGNA. Sin embargo, el 63% de los estudios recomiendan STRONGkids como la mejor herramienta de tamizaje en pacientes pediátricos hospi-talizados. Además, se aconseja la aplicación de esta herramienta en aquellos niños que sean hospitalizados en un periodo de tiempo inferior a 24 horas, mayores de un mes y menores de 18 años, lo que contribuirá a prevenir e intervenir la malnutrición hospitalaria y, por consiguiente, reducir la estancia hospitalaria, el riesgo de infecciones y los costos de atención en los centros de salud.
DISCUSIÓN
Los datos de esta revisión sistemática, que incluye no solo los artículos en bases de datos indexadas sino la revisión exhaustiva
en literatura gris, indican que la mejor herramienta para realizar el tamizaje nutricional en el paciente pediátrico hospitalizado es la herramienta STRONGkids, aunque las publicaciones también plantean el uso de la herramienta SGNA, que es más específica, por lo que se sugiere utilizarla para realizar evaluación nutricional completa y no para tamizaje.
En el análisis de los artículos se mostró que las herramientas de riesgo nutricional en pacientes pediátricos hospitalizados utilizadas para los estudios fueron en varias ocasiones NRS, STAMP, STRONG-kids, PYMS, PNST y SGNA. No obstante, Hartman y cols. (28) refieren que estas herramientas han sido probadas en un grado limitado y no han sido validadas en otros estudios, por lo que se debe tener en cuenta que estas herramientas deben ser reproducibles, con buena sensibilidad y especificidad con respecto a sus resultados. Además, la disponibilidad de una buena herramienta de tamizaje facilita la labor asistencial, ya que evita la necesidad de valorar a todos los pacientes para identificar a los que presentan desnutrición (27).

1227TAMIZAJE NUTRICIONAL EN PACIENTE PEDIÁTRICO HOSPITALIZADO: REVISIÓN SISTEMÁTICA
[Nutr Hosp 2018;35(5):1221-1228]
El uso de la herramienta PYMS dentro de los artículos selec-cionados el 5% la recomiendan como herramienta de detección nutricional, de acuerdo a su especificidad y sensibilidad. Cabe resaltar que este estudio se evaluó en comparación con STRON-Gkids, STAMP y PYMS, además de que se llevó a cabo en el continente asiático, más específicamente en Indonesia (19). Adi-cionalmente, Joosten y Hulst (22) resaltan esta herramienta más práctica para la determinación del riesgo nutricional.
La herramienta STAMP fue seleccionada por un 10%. Sin em-bargo, este estudio fue realizado en España y se concluyó que esta herramienta sobreestima la proporción de pacientes que serían remitidos al especialista, por lo que se sugiere el uso de una segunda herramienta más específica (24,27).
Por otro lado, White y cols. proponen una nueva herramienta denominada Pediatric Nutrition Screening Tool (PNST), que cons-ta de cuatro preguntas. La recomiendan como una alternativa sensible, valida y más sencilla frente al uso de la herramienta STAMP (18).
La presente revisión sugiere STRONGkids como la mejor he-rramienta de tamizaje en pacientes pediátricos hospitalizados, teniendo en cuenta que el 63% de los estudios refieren que dicha herramienta es práctica, de fácil uso, altamente sensible pero no especifica y que permite la detección preliminar para integrarse con otros datos clínicos con el fin de predecir con fiabilidad el riesgo de desnutrición (7,12-15,20,21,23,25,26,29).
Además, la herramienta STRONGkids valora cuatro ítems como son la evaluación global subjetiva, la enfermedad de alto riesgo,
la ingesta y pérdidas nutricionales y la pérdida de peso o bajo aumento de peso para determinar el riesgo nutricional, como se puede apreciar en la tabla IV.
Cabe resaltar que el uso de esta herramienta en las institu-ciones hospitalarias permite identificar a los niños que están en riesgo de desnutrición de manera temprana y oportuna durante su ingreso al hospital, por lo que es indispensable implementar esta herramienta de tamizaje nutricional en los centros hospitalarios.
Sin embargo, se requieren más estudios para validar el uso de la herramienta de tamizaje STRONGkids en el contexto co-lombiano.
Por otro lado, es relevante destacar que, según el consenso “Evaluación nutricional de paciente hospitalizado”, del cual son partícipes Argentina, Brasil, Chile, Colombia, El Salvador, México, Paraguay y Venezuela, la herramienta de tamizaje nutricional pe-diátrico que se recomienda es SGNA. Esta herramienta clasifica a los niños en tres grupos: bien nutridos, moderadamente mal-nutridos y severamente malnutridos, partiendo de un cuestionario que analiza varios datos como la adecuación de la altura actual para la edad, la adecuación de peso actual para la altura, las alteraciones de peso involuntario, la ingesta de alimentos, los sín-tomas gastrointestinales, el estrés metabólico de la enfermedad y el examen físico (30).
Es necesario mencionar algunas limitaciones de este estudio. En primer lugar, al ser una revisión sistemática se dificulta la posi-bilidad de establecer una relación directa debido a la diversidad de tipos de estudio. Esto conllevó a no poder realizar un metaanálisis
Tabla IV. Herramienta de tamizaje nutricional STRONGkidsVariable Pregunta Puntaje
Evaluación clínica subjetiva¿Está el paciente en un estado nutricional deficiente juzgado por evaluación subjetiva clínica (grasa subcutánea y/o masa muscular disminuida y/o cara hueca)?
1 punto
Riesgo de enfermedad ¿Hay una enfermedad subyacente con un riesgo de desnutrición o cirugía mayor? 2 puntos
Ingesta nutricional y pérdidas
¿Algunos de los siguientes aspectos están presentes?Diarrea excesiva (5/día) y/o vómito (> 3 veces/día) en los últimos días?Reducción de la ingesta de alimentos durante los últimos días antes de la admisión (sin incluir el ayuno para un procedimiento electivo o cirugía).¿Incapacidad para consumir la ingesta de alimentos adecuada debido al dolor?
1 punto
Pérdida de peso o aumento de peso
¿Hay pérdida de peso o no presenta aumento de peso (niños < 1 año) durante las últimas semanas/meses?
1 punto
Tipo de riesgo Recomendaciones de intervención Puntaje
Riesgo altoConsulte a su médico y/o nutricionista para diagnóstico completo, asesoramiento nutricional individual y seguimiento.Comience prescripción alimentaria hasta nuevo diagnóstico
4-5
Riesgo medio Consulte a su médico para diagnóstico completo; considerar una intervención nutricional con el nutricionista
1-3
Riesgo bajoCompruebe peso regularmente según las políticas o normas del hospitalEvaluar el riesgo nutricional después de una semana
0
Adaptada de: Hulst JM, Zwart H, Hop WC, Joosten KFM, Stevens MC, Booth IW, et al. Dutch national survey to test the STRONGkids nutritional risk screening tool in hospitalized children. Clin Nutr 2010;29(1):106-11.

1228 A. D. Aponte Borda et al.
[Nutr Hosp 2018;35(5):1221-1228]
que arrojara datos concluyentes con significancia estadística, lo cual permite generar resultados más amplios. Por otro lado, las personas que aplican el tamizaje nutricional en los estudios varia-ron constantemente (médico, nutricionista, enfermera o auxiliar), por lo que los resultados podrían verse afectados, además de que existe el sesgo de la comunicación selectiva, difícil de controlar.
CONCLUSIONES
La presente revisión sistemática permitió concluir que la herra-mienta STRONGkids es la mejor para aplicar en niños que sean hospitalizados puesto que es práctica, de fácil uso y predice con fiabilidad el riesgo de desnutrición. No obstante, se requieren mayores estudios para validar el uso de esta en el contexto co-lombiano.
Sin embargo, la implementación de esta herramienta de tami-zaje nutricional se debe hacer en las instituciones hospitalarias en las primeras 24 horas de ingreso a pacientes entre un mes y menores de 18 años, no solo con el fin de identificar a los niños que están en riesgo de desnutrición de manera temprana y opor-tuna sino también para prevenir e intervenir la malnutrición hos-pitalaria, lo que generará menor estancia hospitalaria, reducción del riesgo de infecciones y, por ende, disminución de los costos de atención en los centros de salud.
BIBLIOGRAFÍA
1. Joosten K, Zwart H, Hop W, Hulst J. National malnutrition screening days in hospitalised children in The Netherlands. Arch Dis Child 2010;95(2):141-5.
2. Montejo J, Culebras J, García de Lorenzo A. Recomendaciones para la valo-ración nutricional del paciente crítico. Rev Med Chil 2006;134(8):1049-56.
3. Reilly H, Martineau J, Moran K. Nutritional screening evaluation and imple-mentation of a simple nutrition risk score. Clin Nutr 1995;14(5):269-73.
4. Sermet I, Poisson A, Colomb V, Brusset M, Mosser F, Berrier F, et al. Simple pediatric nutritional risk score to identify children at risk of malnutrition. Am J Clin Nutr 2000;72(1):64-70.
5. Central Manchester University Hospitals. STAMP, the Screening Tool for the Assessment of Malnutrition in Paediatrics, provides a simple way of deter-mining whether a child is at risk of malnutrition; 2010. Disponible en: http://www.stampscreeningtool.org/data/pdfs/stamp_instructions.pdf
6. Gerasimidis K, Keane O, Macleod I, Flynn D, Wright C. A four stage evaluation of the Paediatric Yorkhill Malnutrition Score in a tertiary paediatric hospital and a district general hospital. Clin Nutr 2010;104:751-6. Disponible en: https://www.cambridge.org/core/services/aop-cambridge-core/content/view/2F57A5711A1D5EB7E33548FE677402E2/S0007114510001121a.pdf/fourstage_evaluation_of_the_paediatric_yorkhill_malnutrition_score_in_a_tertiary_paediatric_hospital_and_a_district_general_hos
7. Hulst J, Zwart H, Hop W, Joosten K, Stevens M, Booth I, et al. Dutch national survey to test the STRONGkids nutritional risk screening tool in hospitalized children. Clin Nutr 2010;29(1):106-11.
8. Urrútia G, Bonfill X. Declaración PRISMA: una propuesta para mejorar la publicación de revisiones sistemáticas y metaanálisis. Med Clin (Barc) 2010;135(11):507-11.
9. Scottish Intercollegiate Guidelines Network (SIGN). Citado 22 de mayo de 2017. Disponible en: http://www.sign.ac.uk/
10. McCarthy H, Dixon M, Crabtree I. The development and evaluation of the Screening Tool for the Assessment of Malnutrition in Paediatrics (STAMP©) for use by healthcare staff. J Hum Nutr Diet 2012;25(1):311-8.
11. Karagiozoglou T, Daskalou E, Lampoudis D, Apostolou A, Agakidis C. Com-puter-based malnutrition risk calculation may enhance the ability to identify pediatric patients at malnutrition-related risk for unfavorable outcome. J Parenter Enter Nutr 2015;39(4):418-25.
12. Moura M, Assis C, Barbosa dos Santos D, Ribas de Farias P. Nutritional risk and associated factors in hospitalized paediatric patients through the STRONGKids. Nutr Clín Diet Hosp 2016;36(362).
13. Teixeira A, Viana K. Nutritional screening in hospitalized pediatric patients: a systematic review. J Pediatr (Rio J) 2016;92(4):343-52.
14. Márquez M, Alberici C. Nutritional screening tool versus anthropometric assessment in hospitalized children: which method is better associated to clinical outcomes. Arch Latinoam Nutr 2015;65(1):12-20.
15. Campos L, Neumann L, Iraci E. Nutritional risk assessment in hospitalized children: a comparison of pediatric subjective global assessment and STRON-Gkids screening tool with anthropometric indicators. Sci Med (Porto Alegre) 2015;25(3):2.
16. Huysentruyt K, Devreker T, Dejonckheere J, De Schepper J, Vandenplas Y, Cools F. Accuracy of nutritional screening tools in assessing the risk of undernutrition in hospitalized children. J Pediatr Gastroenterol Nutr 2015;61(2):159-66.
17. Huysentruyt K, Goyens P, Alliet P, Bontems P, Van Hautem H, Philippet P, et al. More training and awareness are needed to improve the recognition of undernutrition in hospitalised children. Acta Paediatr 2015;104(8):801-7.
18. White M, Lawson K, Ramsey R, Dennis N, Hutchinson Z, Soh XY, et al. Sim-ple nutrition screening tool for pediatric inpatients. J Parenter Enter Nutr 2014;40(3):392-8.
19. Wonoputri N, Djais J, Rosalina I. Validity of nutritional screening tools for hospitalized children. J Nutr Metab 2014;2014:143649.
20. Durakbaşa Ç, Fettahoğlu S, Bayar A, Mutus M, Okur H. The prevalence of malnutrition and effectiveness of STRONGkids tool in the identifica-tion of malnutrition risks among pediatric surgical patients. Balkan Med J 2014;31(4):313-21.
21. Moeeni V, Walls T, Day AS. The STRONGkids nutritional risk screening tool can be used by paediatric nurses to identify hospitalised children at risk. Acta Paediatr 2014;103(12):e528-31.
22. Joosten KFM, Hulst JM. Nutritional screening tools for hospitalized children: methodological considerations. Clin Nutr 2014;33(1):1-5.
23. Moeeni V, Walls T, Day A. Nutritional status and nutrition risk screening in hospitalized children in New Zealand. Acta Paediatr 2013;102(9):e419-23. Disponible en: http://doi.wiley.com/10.1111/apa.12299
24. Moreno J, Varea V, Bousoño C, Lama R, Redecillas S, Peña L. Nutrition sta-tus on pediatric admissions in Spanish hospitals; DHOSPE study. Nutr Hosp 2013;28(3):709-18.
25. Huysentruyt K, Alliet P, Muyshont L, Rossignol R, Devreker T, Bontems P, et al. The STRONGkids nutritional screening tool in hospitalized children: a validation study. Nutrition 2013;29(11):1356-61.
26. Spagnuolo M, Liguoro I, Chiatto F, Mambretti D, Guarino A. Application of a score system to evaluate the risk of malnutrition in a multiple hospital setting. Ital J Pediatr 2013;39:81.
27. Lama R, Moráis A, Herrero M, Caraballo S, Galera R, López E, et al. Validation of a nutritional screening tool for hospitalized pediatric patients. Nutr Hosp 2012;27(5):1429-36.
28. Hartman C, Shamir R, Hecht C, Koletzko B. Malnutrition screening tools for hospitalized children. Curr Opin Clin Nutr Metab Care 2012;15(3):303-9.
29. Ling R, Hedges V, Sullivan P. Nutritional risk in hospitalised children: an assess-ment of two instruments. E Spen Eur E J Clin Nutr Metab 2011;6(3):e153-7.
30. FENALPE. Evaluación nutricional de paciente hospitalizado; 2009. Citado 10 de mayo de 2017. pp. 1-57. Disponible en: http://www.aanep.com/docs/Consenso-Final-Evaluacion-Nutricional.pdf

NutriciónHospitalaria
Artículo Especial
ISSN (electrónico): 1699-5198 - ISSN (papel): 0212-1611 - CODEN NUHOEQ S.V.R. 318
Correspondencia: Marcela González-Gross. Departamento de Salud y Rendimiento Humano. Facultad de Ciencias de la Actividad Física y del Deporte-INEF. C/ Martín Fierro, 7. 28040 Madride-mail: [email protected]
Gesteiro E, Galera-Gordo J, González-Gross M. Aceite de palma y salud cardiovascular: consideraciones para valorar la literatura. Nutr Hosp 2018;35(5):1229-1242
DOI: http://dx.doi.org/10.20960/nh.1970
Aceite de palma y salud cardiovascular: consideraciones para valorar la literaturaPalm oil and cardiovascular health: considerations to evaluate the literature critically
Eva Gesteiro1, Jesús Galera-Gordo1 y Marcela González-Gross1,2
1Grupo de investigación ImFINE. Departamento de Salud y Rendimiento Humano. Universidad Politécnica de Madrid. Madrid. 2CIBER de Fisiopatología de la Nutrición y la Obesidad (CIBEROBN)
Palabras clave:
Aceite de palma. Salud cardiovascular. Ácido palmítico. Ácido oleico.
ResumenEl aceite de palma se obtiene de los frutos de Elaeis guineensis, E. oleifera y el cruce de ambas, OxG (híbrida). En crudo contiene gran proporción de carotenoides (responsables del color rojo), tocoferoles y tocotrienoles, pero se pierden durante su refinado. En su composición destacan los ácidos grasos palmítico y oleico, casi al 50%, aunque su proporción varía según la fracción en la que se utilizan. La absorción de los ácidos grasos y, por tanto, su efecto sobre el perfil lipídico plasmático dependen de su posición en el triglicérido, especialmente en sn-2. Según el aceite de palma o la fracción, variará dicha posición de los ácidos grasos monoinsaturados o saturados. Se revisan críticamente las dos principales revisiones publicadas en relación al aceite de palma, que incluyen un total de 67 artículos, además de otros estudios más recientes. La mayoría se realizan en países no europeos donde el aceite de palma es el principal aceite culinario. Su efecto sobre el perfil cardiovascular varía según con qué se compare, mejorándolo frente a las grasas trans y saturadas y empeorándolo frente a las grasas mono y poliinsaturadas. Hemos detectado errores metodológicos importantes, como no diferenciar entre palma, palmiste o fracciones, comparar ácidos grasos con aceites o no considerar la actividad física y otros factores que influyen sobre el perfil lipídico. No hemos encontrado estudios realizados con aceite de palma como ingrediente de alimentos en un contexto de dieta mediterránea, donde el principal aceite culinario es el de oliva, que serían los extrapolables a nuestro entorno.
Key words:
Palm oil. Cardiovascular health. Palmitic acid. Oleic acid.
AbstractPalm oil is obtained from Elaeis guineensis, E. oleifera or the hybrid OxG palm fruits. When crude, it contains high carotenoid concentrations (responsible for the red color), tocopherols and tocotrienols, but most of them are eliminated during its refining. Palm oil main components are palmitic and oleic acids, both near 50%, but their proportion changes depending on the fraction used. Fatty acids absorption and the effect on blood lipid profile depend on the position in the triacylglycerol, especially in the sn-2 position. The location of the monounsaturated or saturated fatty acids varies depending on the type of palm oil or fraction used. We critically review the two main reviews published about palm oil, which analyze 67 publications, and several studies that are more recent. Most of the studies were performed in non-European countries where palm oil is the main culinary oil. The effect on cardiovascular risk factors depends on the fat used as counterpart. Palm oil improves lipid profile after a diet rich in trans and saturated fats, while it impairs lipid profile after a diet rich in monounsaturated and polyunsaturated fats. Relevant meth-odological errors have been identified, such as not differentiating between palm oil, palm kernel oil and their fractions, comparing single fatty acids with whole oils or fats, or not considering physical activity or other factors that can affect blood lipids. No studies considering palm oil as an ingredient in a Mediterranean diet context, where olive oil is the main culinary oil, were found, so extrapolation of data is currently very difficult.
Recibido: 06/04/2018 • Aceptado: 04/06/2018
©Copyright 2018 SENPE y ©Arán Ediciones S.L. Este es un artículo Open Access bajo la licencia CC BY-NC-SA (http://creativecommons.org/licenses/by-nc-sa/4.0/).

1230 E. Gesteiro et al.
[Nutr Hosp 2018;35(5):1229-1242]
INTRODUCCIÓN
El aceite de palma es apto para el consumo humano y es a nivel mundial el que mayor producción, importación, exportación y con-sumo doméstico presenta (1). Características como la resistencia a la oxidación, su elevado punto de fusión y su bajo coste han contribuido a la expansión de su uso en la industria alimentaria. En países de Asia, África y Sudamérica es aceite de consumo (crudo o para cocinar); en cambio, en la cultura occidental lo utilizamos principalmente como ingrediente en alimentos procesados, seña-lados por las sociedades científicas como de consumo ocasional. Comparado con otros aceites vegetales, el aceite de palma contiene mayor proporción de ácidos grasos saturados (AGS) de cadena larga (12-18 carbonos) (2), por lo que se le han atribuido efectos negativos para la salud. Desde hace años, los organismos interna-cionales recomiendan un aporte energético procedente de ácidos grasos saturados (AGS) inferior al 10% en el marco de una dieta equilibrada (3,4), aunque, como muestra la tabla I, no hay consenso entre ellos. En la misma línea, la Fundación Italiana de la Nutrición se ha posicionado incluyendo las grasas saturadas del aceite de palma en el cómputo de la ingesta de AGS, que en total no debe exceder el 10% de las kcal de la dieta (4). La composición del aceite de palma dependerá de la especie de palma de la que se obtiene (5,6), del grado de maduración del fruto (7) y de la parte del fruto de la que se extrae (8), sin olvidar que el procesado del aceite determinará su composición final. En este sentido, el aceite crudo es rojo por su elevado contenido en carotenoides, además de tocoferoles y tocotrienoles, que se pierden en gran parte durante el proceso de refinado, blanqueamiento y desodorización (9).
Dada la controversia existente, nuestro objetivo es profundizar en el conocimiento sobre la composición del aceite de palma y sus efectos sobre la salud cardiovascular. Para ello, hemos vuelto a revisar los 67 artículos incluidos en las dos principales revisiones sobre el aceite de palma, y alguno más reciente, evaluando su calidad metodológica en base a los criterios que se recogen en la tabla II y cuya evaluación se puede consultar con más detalle en la tabla del Anexo 1.
COMPOSICIÓN DEL ACEITE DE PALMA
El aceite de palma está compuesto por AGS y AG insaturados (AGI) casi en la misma proporción. Sin embargo, algunos facto-res pueden favorecer un perfil menos saturado. Las diferentes especies de planta (Elaeis guineensis, E. oleifera y el cruce de ambas, OxG [híbrida]), los tipos de fruto (dura, tenera y pisífera), la parte del fruto que se use en la obtención del aceite (mesocarpio o almendra), así como el procesado al que se someta el aceite, determinarán su composición en AG y su acción fisiológica. La tabla III resume el contenido en diferentes AG del aceite de palma y palmiste, así como sus fracciones.
PALMISTE
El aceite de palmiste se obtiene de la almendra del fruto de la palma. Su contenido de AGS es muy superior al de AGI (82/18%) (15). Asimismo, se ha encontrado una proporción de 85/15%
Tabla I. Recomendaciones de ingesta de grasas en adultos sanos según diferentes criteriosFAO/OMS (2010) (10) FESNAD (2015) (11) Carbajal (2013) (12) AHA (2000) (13)
Grasa total 20-35% 20-40%< 30% o < 35% si se consumen AGM en alta
proporción30%
AGS < 10%
- No se establece un umbral preciso de ingesta recomendada
- Se recomienda reducir el consumo de alimentos ricos en
AGS
< 7-8% < 10%
AGM Por diferencia 20-25% (45-55 g/día) 20% (por diferencia) Por diferencia
AGP 6-11% – 5% < 10%
AGP ω3Alfa linolénico
DHA + EPA–
0,1-1% (0,25-2,25 g/día)0,5-1%
0,5-1% (2 g/día)0,5-1% (2 g/día)
–
AGP ω6 0,5-2% 5-10% (10-20 g/día) 2,5-9% (10 g/día) –
AG trans < 1% – < 1% (< 3 g/día)2-3% Reducirlos lo
máximo posible
Colesterol – – – < 300 mg/díaElaboración propia a partir de diversas fuentes. AGS: ácidos grasos saturados; AGM: ácidos grasos monoinsaturados; AGP: ácidos grasos poliinsaturados; EPA: ácido eicosapentaenoico; DHA: ácido docosahexaenoico; AHA: American Heart Association; FESNAD: Federación Española de Sociedades de Nutrición, Alimentación y Dietética; FAO: Food and Agriculture Organization; OMS: Organización Mundial de la Salud.

1231ACEITE DE PALMA Y SALUD CARDIOVASCULAR: CONSIDERACIONES PARA VALORAR LA LITERATURA
[Nutr Hosp 2018;35(5):1229-1242]
(AGS/AGI) en el aceite obtenido de E. guineensis, con mayor pre-sencia de AGS que en el de la variedad híbrida OxG (77/23%) y en el de E. oleifera (76/24%) (8). Esto se debe principalmente al elevado contenido en ácidos láurico y mirístico del aceite de palmiste (8,15).
Las necesidades de la industria requieren la utilización de diferentes fracciones del aceite de palmiste, entre ellas la estearina, que por su característica solidez y su bajo coste es empleada a menudo en repostería en sustitución de la manteca de cacao.
PALMA
El aceite de palma se obtiene del mesocarpio del fruto de la palma. Es el más estudiado, principalmente por su composición de AG. A diferencia del aceite de palmiste, presenta una proporción AGS/AGI más equilibrada, con rangos de 49,4/50,5% (15,16) o 46/56% (5).
Tabla III. Composición de los ácidos grasos del aceite de palmiste y palma y sus fracciones
Ácidos grasosAceite de
palmaAceite de palmiste
Oleína de palma
Oleína de palmiste
Estearina de
palmiste
Estearina de palma
Superoleína de palma
Caproico C6:0 0,00 0,76 0,00 0,68 0,19 0,00 0,00Caprílico C8:0 0,00 4,09 0,00 4,50 2,08 0,00 0,00Cáprico C10:0 0,00 3,61 0,00 3,52 2,76 0,00 0,00Láurico C12:0 0,45 47,53 0,28 42,42 54,07 0,30 0,30Mirístico C14:0 1,12 15,21 0,94 13,21 21,78 1,49 1,00Palmítico C16:0 38,84 7,84 38,41 8,22 8,08 60,46 34,62Esteárico C18:0 4,25 1,90 4,01 2,30 1,94 4,91 3,66Araquídico C20:0 0,04 0,10 0,28 0,24 0,24 0,25 0,20Total AGS % 44,70 81,04 43,92 75,10 91,14 67,39 39,79Palmitoleico C16:1 4,25 1,90 4,01 2,30 1,94 0,10 0,25Oleico C18:1 35,79 14,73 40,43 19,08 5,86 25,52 46,41Eicosanoico C20:1 0,18 0,10 0,19 0,10 0,05 0,20 0,10Erúcico C22:1 0,00 0,00 0,00 0,00 0,00 0,00 0,00Total AGM % 40,22 16,73 44,63 21,48 7,84 25,82 46,76Linoleico C18:2 14,77 2,14 11,07 3,28 0,97 6,44 12,79α-linolénico C18:3 0,22 0,10 0,28 0,15 0,05 0,25 0,60Estearidónico C18:4 0 0,00 0,00 0,00 0,00 0,00 0,00Araquidónico C20:4 0 0,00 0,00 0,00 0,00 0,00 0,00Eicosapentaenoico C20:5 ω-3 (EPA)
0 0,00 0,00 0,00 0,00 0,00 0,00
Docosapentaenoico C22:5 ω-3 (DPA)
0 0,00 0,00 0,00 0,00 0,00 0,00
Docosahexaenoico C22:6 ω-3 (DHA)
0 0,00 0,00 0,00 0,00 0,00 0,00
Total AGP % 14,99 2,23 11,36 3,42 1,02 6,69 13,40Total AGI % 55,21 18,96 55,98 24,90 8,86 32,51 60,16AGS: ácidos grasos saturados; AGM: ácidos grasos monoinsaturados; AGP: ácidos grasos poliinsaturados, AGI: ácidos grasos insaturados. Elaboración propia a partir de los datos de Codex Alimentarius (14).
Tabla II. Criterios adoptados para realizar la revisión de los artículos
A. Tipo de aceite usado:– Diferencia entre palma, palmiste y fracciones (sí/no)– Especifica perfil de ácidos grasos de cada aceite usado (sí/no)B. Diferencia entre aceites y ácidos grasos aislados (sí/no)C. Indica energía de la dieta procedente de las grasas (sí/no)– Expresa dato en % (+) - Expresa en g/día (-)D. Indica energía procedente del aceite de palma (sí/no)– Expresa dato en % (+) - Expresa en g/día (-)E. Emplea aceite de palma como ingrediente o de forma aislada Aceite líquido (aderezo)/aceite de fritura/ingrediente en producto
procesadoF. Indica perfil lipídico de los participantes (sí/no)G. Considera factores de confusión de los participantes: – Actividad física (sí/no)– Contexto de dieta habitual (sí/no)H. Macronutrientes de la dieta ajustados a las recomendaciones (sí/no)

1232 E. Gesteiro et al.
[Nutr Hosp 2018;35(5):1229-1242]
Podría considerarse que el aceite de palma presenta un perfil de AG más saludable que el de palmiste por su mayor concentración de ácidos oleico y linoleico (8), pero la elevada concentración de ácido palmítico, que representa casi la totalidad de AGS, se ha sugerido como un aspecto negativo, que justificaría la asociación del aceite de palma con enfermedad cardiovascular (ECV) (17,18). Sin embargo, la concentración de ácido palmítico se reduce en las fracciones de oleína y superoleina de palma (14). Además, como se explicará más adelante, la posición que ocupan los AG en los triglicéridos (TG) del aceite de palma tiene un papel fundamental en su absorción y biodisponibilidad.
El aceite de palma crudo, o aceite de palma rojo (RPO), debe su característico color a la elevada concentración de pigmentos naturales como los carotenoides y, en menor medida, a otros com-puestos antioxidantes como licopeno y xantofilas. El alto contenido en β-carotenos y tocoferoles ha contribuido a que se considere una alternativa plausible para mitigar la deficiencia de vitamina A y E en poblaciones de Asia y África (19,20). La concentración de carotenos ronda los 500-700 mg/kg. El β-caroteno es el mayor precursor de origen vegetal de la síntesis de vitamina A en el orga-nismo humano, con una concentración de 375 mg/kg (15). La alta concentración de tocoferoles y tocotrienoles en el aceite de palma ha recibido especial atención por ser precursores de vitamina E. Su concentración en el RPO se ha situado entre 600 y 1.000 mg/kg dependiendo de los autores (15,21). Tanto los tocoferoles como los tocotrienoles están compuestos por cuatro isoformas análogas (α, β, γ, δ), saturadas en los primeros e insaturadas en los segundos. De la vitamina E total del aceite de palma, los tocotrienoles repre-sentan el 70-80% y los tocoferoles, el resto (15,22). La elevada concentración de tocotrienoles ha llevado a sugerir una potencial actividad antioxidante, antiinflamatoria, antitrombótica e incluso anticancerígena (23-26). Investigaciones recientes con suplemen-tos de tocotrienoles y carotenos procedentes de la palma en función vascular y enfermedad cardiovascular en personas de riesgo no mostraron efectos positivos ni negativos sobre esta patología (27).
La industria alimentaria usa aceite de palma previamente someti-do a procesos de refinado, blanqueamiento y desodorización (RBD), durante los que se destruyen la gran mayoría de carotenoides, licopeno, xantofilas, tocoferoles y tocotrienoles, disminuyendo drás-ticamente los potenciales beneficios del RPO (9,14).
METABOLISMO DE LOS TRIGLICÉRIDOS (LA HIPÓTESIS sn-2)
Como es bien sabido, un TG consta de una molécula de glicerol y tres AG, no necesariamente iguales entre sí. En función de los AG que se unan al glicerol y la posición que ocupen en el TG, así serán las propiedades de la grasa, su metabolismo y los efectos que esta tendrá sobre el organismo (9,28,29). En las grasas de origen vegetal, el ácido palmítico representa casi la totalidad de AGS, ocupando mayoritariamente las posiciones sn-1 y sn-3, y se considera neutro en cuanto a sus efectos sobre el colesterol plasmático. En cambio, en las grasas de origen animal ocupa más frecuentemente la posición sn-2 (28). Está bastante extendida la teoría de que durante el metabolismo, dos lipasas liberan los AG
situados en sn-1 y sn-3, de modo que los AG absorbidos en los monoglicéridos ocupan la posición sn-2 y los AG libres se emplean en la síntesis de nuevos TG o se eliminan saponificados (29) (Fig. 1). En el caso del aceite de palma, se ha enfatizado en la posición de los AG monoinsaturados (AGM), sobre todo el ácido oleico en sn-2, y la mayor concentración de AGS (ácido palmítico) en las posiciones sn-1 y sn-3, ya que la singularidad de la localización de los AGM en sn-2 puede favorecer una mayor absorción de estas grasas (4,30).
En productos como margarinas, confitería, bollería, etc., la industria alimentaria requiere aceites con mayor temperatura de fusión, recu-rriendo al uso de aceite de palma interesterificado (API). Este aceite es sólido a temperatura ambiente y tiene una mayor proporción de ácido palmítico en posición sn-2 (hasta un 40%) que la oleína de palma (10%) (31). El API origina una lipemia posprandial menor que el aceite de palma per se en las tres primeras horas, aunque esta se mantiene elevada durante más tiempo (6-8 h) (31). Esta variación de la lipemia posprandial en el tiempo puede deberse a la diferente tasa de absorción según la posición del ácido palmítico en el TG. A pesar de que la lipemia posprandial con el API es menor que con la oleína de palma en las primeras ocho horas, para obtener conclusiones sobre su impacto en el metabolismo lipoproteico debe considerarse el desconocimiento existente en periodos más largos. Para determinar un posible efecto negativo del API sobre el metabolismo lipoproteico a medio-largo plazo, aumentando el colesterol transportado por lipo-proteínas de baja densidad (LDLc) y los TG circulantes, habría que estudiar la absorción del ácido palmítico situado en sn-2 en periodos de tiempo superiores a ocho horas. Algunos autores argumentan que la lipemia posprandial a corto plazo puede no ser representativa del metabolismo lipoproteico (32), lo que cuestiona la transferibilidad de los datos de Sanders y cols. (2011) (31).
La asociación entre la sustitución del ácido palmítico de la dieta y un menor riesgo cardiovascular (RCV) ha sido establecida en varios estudios (33-35). Sin embargo, estos investigadores no han determinado las diferentes posiciones del ácido palmítico
Figura 1.
Esquema del metabolismo de los TG de la grasa. Modificada de Mancini y cols. (29).

1233ACEITE DE PALMA Y SALUD CARDIOVASCULAR: CONSIDERACIONES PARA VALORAR LA LITERATURA
[Nutr Hosp 2018;35(5):1229-1242]
en los TG del aceite de palma o en la grasa animal, añadiendo mayor complejidad la modificación de la estructura de los TG en el API. Los estudios futuros deberían determinar la posición del ácido palmítico en el TG y usar modelos con una duración superior a ocho horas para determinar su acción sobre el perfil lipídico.
ACEITE DE PALMA Y SALUD CARDIOVASCULAR
Las ECV suponen la mayoría de las muertes prematuras en el mundo, estimadas por la Organización Mundial de la Salud (OMS) en 17,7 millones/año (36). La dieta y en concreto las grasas ricas en AGS han recibido especial atención por su relación con las ECV (37,38). Además, los AGS se han asociado con alteraciones en biomarcadores del metabolismo lipoproteico. El aceite de palma, y especialmente el de palmiste por su elevado contenido en AGS, es el aceite vegetal más cuestionado a la hora de inducir altera-ciones en el metabolismo lipoproteico. Las revisiones realizadas por Sun y cols. (2015) (39) y Fattore y cols. (2014) (40) recogen los estudios más relevantes realizados hasta 2012 en este campo.
Sun y cols. (2015) analizan el efecto del aceite de palma sobre el LDLc comparado con otros aceites vegetales bajos en AGS. Se revi-san 38 artículos (siete europeos), con una población total de 764 suje-tos. En 27 estudios se compara el aceite de palma con aceites bajos en AGS; en nueve, con aceites parcialmente hidrogenados (trans); y en dos, con grasa animal. Muy pocos de estos artículos hacen referencia al estilo de vida de los participantes en las investigaciones (39). Los hallazgos de Sun y cols. (2015) se resumen en la tabla IV.
Al comparar el aceite de palma con grasas vegetales con poco contenido en AGS, los estudios de mayor calidad metodológica (aleatorizados y doble ciego) muestran un mayor incremento en los niveles de LDLc. Sun y cols. (2015) sugieren que este efecto supondría un aumento del 6% en mortalidad y eventos coronarios totales (39). Los autores realizan un metaanálisis de los valores esperados menos los observados y, según la fórmula de Katan (41), el efecto del aceite de palma es 0,25 mmol/l menor de lo esperado y se concluye que es mayor en las mujeres.
Fattore y cols. (2014) realizaron una revisión sistemática anali-zando 53 estudios (40), de los cuales 24 también fueron analizados por Sun y cols. (2015) (39). La muestra total incluye 1.526 sujetos de entre 16 y 70 años en su mayoría normocolesterolémicos. La grasa de las dietas aportaba entre el 28 y el 53% del total de calo-rías. Se analiza el efecto de sustituir dietas ricas en determinadas
grasas por dietas ricas en aceite de palma (RPO, oleína de palma o ácido palmítico no sn-2). Se evaluaron marcadores de ECV y enfermedad coronaria: lipoproteínas de muy baja densidad (VLDL), apolipoproteína (Apo) A-1, ApoB, CT, LDLc, colesterol transportado por lipoproteínas de alta densidad (HDLc) y los cocientes CT/HDLc y LDLc/HDLc (40). Los cambios significativos se resumen en la tabla V. Se encontró un mayor efecto sobre las concentraciones de colesterol total (CT) y LDLc al aumentar la edad y la cantidad de energía procedente de la grasa (> 30%) en las intervenciones.
Una revisión posterior a las de Fattore (40) y Sun (39) concluye que hasta ahora no hay asociación del consumo de aceite de palma con ECV y que serán necesarias nuevas investigaciones a largo plazo para establecer el impacto del consumo de aceite de palma sobre “un corazón saludable”, como los que ya se han realizado con otros aceites como el de oliva (42).
Recientemente, Ismail y cols. (2018) han publicado una revisión sistemática centrada en el consumo de aceite de palma y el RCV. Se analizan cuatro estudios para la revisión final de enfermedad corona-ria y aceite de palma, y uno para analizar la asociación de accidente cerebrovascular y aceite de palma. Se excluyeron los trabajos que empleaban aceites vegetales distintos al de palma y las interven-ciones no relacionadas con el objetivo de estudio (ECV y mortalidad asociada) y se incluyeron los que diferenciaban la composición de los ácidos grasos. Todos los estudios utilizados para determinar la asociación de RCV y aceite de palma se han realizado en Costa Rica y pertenecen a la misma investigación a lo largo del tiempo. Por lo que, tal como indican los autores, las conclusiones tienen que ser consideradas con cautela. Se concluye que no existe evidencia de asociación entre el consumo de aceite de palma y el riesgo de muerte por ECV. Los autores indican las necesidades detectadas en relación a la investigación futura en aceite de palma, como evaluar el consumo de aceite de palma cuantitativamente, analizar el consumo de aceite de palma independientemente de otros alimentos, ajustar por los factores de RCV conocidos cuando se realiza el análisis estadístico o incluir en los estudios los países con alto consumo de aceite de palma, ente otros (43).
Desde 2012 se ha seguido investigando sobre el aceite de palma. Un estudio reciente realizado en Tanzania asocia el uso culinario del aceite de palma con un incremento del CT de 15 mg/dl y de LDLc de 17 mg/dl en sujetos normocolesterolémicos (44). Está muy limitado por la escasez de marcadores lipídicos analizados, el pequeño tamaño de la muestra y el perfil lipídico de los participantes y no es extrapolable a España.
Tabla IV. Resumen de los hallazgos de Sun y cols. (2015) al revisar estudios que comparan el aceite de palma con otras grasas
Aceite de palma vs. n artículos Colesterol total LDLc HDLc TG
Aceite vegetal bajo en AGS 27 + 0,25 mmol/l + 0,24 mmol/l + 0,02 mmol/l =
Grasas trans 9 = = + 0,09 mmol/l =
Grasa animal 2 = = = =
LDLc: colesterol transportado por lipoproteínas de baja densidad; HDLc: colesterol transportado por partículas de alta densidad; TG: triglicéridos. Elaboración propia a partir de Sun y cols. (2015) (37).

1234 E. Gesteiro et al.
[Nutr Hosp 2018;35(5):1229-1242]
La mayoría de las publicaciones científicas se centran en el efecto del aceite de palma o del ácido palmítico de forma aislada sobre el per-fil cardiovascular. Entre los pocos que contemplan el aceite de palma como ingrediente en el contexto de una dieta, se pueden mencionar dos estudios de intervención en humanos. En el primero de ellos se incluyen en la dieta habitual de los participantes magdalenas (muffins) elaboradas con aceite de girasol o con aceite de palma, ambos refina-dos, durante siete semanas, ajustando la cantidad para una ganancia ponderal del 3% (45). Los autores observaron que, ganando el mismo peso (1,6 kg), el grupo que consumía más AGS acumuló más grasa hepática, visceral y total y tenía menos masa magra que el grupo que consumía más ácidos grasos poliinsaturados (AGP). Concluyen que el tipo de grasa consumida en la dieta determina la distribución de la grasa corporal, el acúmulo de grasa hepática y la composición cor-poral en las ganancias moderadas de peso. Mencionan también que esto no se debe al aceite de palma per se, sino a los AGS en general (45). El segundo estudio es una intervención consistente en ingerir una mayonesa con base aceite de soja o con base oleína de palma dentro de un sándwich (46). Eran dietas muy controladas, elaboradas y servidas en un comedor colectivo. El objeto del estudio era el aceite de soja y el de palma se empleaba como control, ya que en Malasia es la principal grasa culinaria. Las cantidades consumidas eran suficientes para variar la composición lipídica de la dieta entre ambos grupos. La dieta con aceite de soja disminuyó más los valores de CT, HDLc (ambos p < 0,001) y LDLc (p = 0,016), atribuyéndose parte de estos resultados al alto contenido en ácido linoleico del aceite de soja. Tras el periodo de aceite de palma, también se observó un ligero descenso de los niveles de CT y LDLc, atribuible al alto contenido en ácido oleico de la oleína de palma empleada en la mayonesa (45%). Con el aceite de soja disminuyó el número total de partículas LDL, así como de las grandes e intermedias, sin variación en las LDL pequeñas (las más aterogénicas) (46).
Algunas fracciones del aceite de palma (oleína, superoleína), permiten obtener perfiles más insaturados. Aunque aún no se han publicado estudios en humanos con estas fracciones, los realizados en animales presentan el aceite de palma como una buena alter-
nativa. Hay un estudio de intervención con diferentes suplementos de aceite de palma (superoleína, oleína y RPO) en ratas viejas e hipertensas y en un grupo control durante 15 semanas (47). El 15% del aporte calórico procedía de las grasas y se evaluaron presión arterial sistólica, frecuencia cardiaca y biomarcadores (TG, CT, HDLc, LDLc y CT/HDLc). Solo LDLc y CT/HDLc descendieron significativamente en los grupos de superoleína y RPO, mientras que con oleína no hubo cambios significativos. La reducción de la presión arterial sistólica fue significativamente mayor con supero-leína y oleína de palma que con RPO. La frecuencia cardiaca dismi-nuyó significativamente solo en los grupos de superoleína y oleína.
Generalmente, los antioxidantes son muy sensibles al calor. El calentamiento repetido reduce las propiedades antioxidantes del aceite y aumenta la peroxidación lipídica, lo que incrementa la for-mación de radicales libres, que tienden a unirse a lípidos, proteínas, carbohidratos y ADN en el organismo, aumentando el estrés oxida-tivo. Este se asocia con el desarrollo de aterosclerosis por daños en la pared arterial y aumento de la captación de lípidos, y con hiper-tensión por una menor biodisponibilidad de óxido nítrico (48,49).
En general, recalentar los aceites, además, favorece la forma-ción de compuestos nocivos y tóxicos, como grasas trans (50), acrilamida (51) o compuestos polares (52), entre otros.
DISCUSIÓN
La ingesta de AGS centra el foco de las recomendaciones nutri-cionales en la prevención de ECV y enfermedades metabólicas. Tradicionalmente se ha asociado el aceite de palma con un elevado contenido en AGS. Sin embargo, su perfil lipídico pone de manifies-to una gran variabilidad en su composición según sus diferentes fracciones (14). Esta revisión presenta las diferencias en la com-posición de AG en el aceite de palma, palmiste y sus fracciones (14). La proporción AGS/AGI presenta un perfil más favorable de AGI en el aceite, oleína y superoleína de palma, mientras que las concentraciones más elevadas de AGS se encontraron en el aceite
Tabla V. Resumen de los hallazgos de la revisión de Fattore y cols. (2014) analizando el efecto que tiene sobre el perfil lipídico en sangre la sustitución de diferentes grasas por
aceite de palmaPerfil lipídico
Cuando el aceite de palma sustituye a
CT LDLc HDLc TG Apo A1 Apo B CT/HDLc LDLc/HDLc
Ácidos mirístico + láurico ↓ ↓ ↓
Ácido esteárico ↑ ↑ ↑ ↑ ↑ ↑
AGM ↑ ↑ ↑ ↑
AGP ↑ ↑ ↑ ↑
Grasas trans ↑ ↓ ↑ ↓ ↓
AGM: ácidos grasos monoinsaturados; AGP: ácidos grasos poliinsaturados; LDLc: colesterol transportado por lipoproteínas de baja densidad; HDLc: colesterol transportado por partículas de alta densidad; TG: triglicéridos; Apo: apolopoproteína; CT; colesterol total. ↓ disminuye la concentración o ratio; ↑ aumenta la concentración o ratio. Elaboración propia a partir de Fattore y cols. (2014) (40).
1235ACEITE DE PALMA Y SALUD CARDIOVASCULAR: CONSIDERACIONES PARA VALORAR LA LITERATURA
[Nutr Hosp 2018;35(5):1229-1242]
de palmiste y sus fracciones (14). En la misma línea, otros estudios indican el elevado perfil de AGS en el aceite de palmiste, solamente superado por el aceite de coco (9,15). En el caso del aceite de pal-ma y sus fracciones, la concentración de AGS es menor y aumenta la de AGI (8,14). Por tanto, en las investigaciones, es necesario distinguir los diferentes efectos sobre los biomarcadores lipídicos según el tipo de aceite consumido. Mientras el aceite de palmiste, rico en ácido láurico, ha demostrado incrementar LDLc y CT séricos (2,35,53), es menos conocido el efecto de fracciones del aceite de palma como oleína y superoleína sobre el perfil lipídico en humanos. La alta concentración de ácido oleico en esta última sugiere una repuesta fisiológica similar al aceite de oliva respecto a la lipemia posprandial (54). Sun y cols. (2015), por su parte, concluyen que el aceite de palma incrementa la concentración de LDLc comparado con aceites vegetales bajos en AGS (39). Hay que puntualizar que en esta revisión no se diferencia entre aceite y oleína, a pesar de ser contemplados ambos en los criterios de búsqueda, e incluso en algunos artículos se usan como sinónimos. La principal diferen-cia entre ambas recae en el mayor porcentaje de ácido oleico en detrimento del ácido linoleico. Además, se excluyen los estudios con RPO, aceite de palmiste y estearina de palma. Se ha demostrado que, a diferencia del aceite de oliva, la oleína de palma no disminuye significativamente los niveles de LDLc (55). En cambio, el aceite de palma OxG comparado con grasa trans vegetal y estearina de palma no incrementó LDLc, TG, CT, ApoB o CT/HDLc (56).
En el modelo animal, el consumo de superoleína y oleína de palma redujo significativamente LDLc y CT/HDLc (47).
Tanto en la revisión de Fattore y cols. (2014) (40) como en la de Sun y cols. (2015) (39) deben realizarse algunas puntualizacio-nes. Gran parte de los estudios analizados utilizan el aceite para fritura o en consumo líquido, incluyéndolo dentro del menú. Dos de ellos emplearon únicamente fórmulas líquidas como dietas y suplementos vitamínicos (53,57). Los estudios en que el aceite o la oleína de palma se usan como ingrediente incluyen solamente los realizados con patatas fritas, galletas, magdalenas y mar-garinas. En estos casos se plantean dificultades metodológicas añadidas debido a la composición de los productos. Sun y cols. (2015) (39) analizan un estudio que emplea margarinas en la dieta clasificadas como “palm margarine”, cuya composición era 80% aceite de palma, 11% aceite de soja y 9% aceite de colza (58). Otro estudio, que incide en las características funcionales de los AG en los alimentos, consiste en una intervención con grasa rica en ácido palmítico libre de trans vs. grasa rica en ácido oleico con una pequeña cantidad de trans. Ambas grasas fueron integradas en productos en diferente proporción (80% en margarinas, 17% en galletas, 24% en magdalenas, 35% en pasta de chocolate y 23% en patatas fritas) (59).
Fattore y cols. (2014) incluyen estudios de intervención que utilizan aceites mezclados, basándose exclusivamente en la concentración de ácido palmítico (40). En estas publicaciones se clasifican las intervenciones según el contenido de ácido palmítico, lo que no es equiparable al aceite de palma, ya que las concentraciones de ácido palmítico varían incluso entre las diferentes fracciones del aceite de palma (14). Analizando la com-posición de los AG del aceite de palma en los estudios de esta
revisión encontramos inexactitudes, como considerar la oleína como aceite de palma. Esto puede deberse a que en el momento de la publicación no se conocieran bien las fracciones, pero es necesario realizar esta distinción para poder hacer comparaciones con otros tipos de aceites, ya que, por ejemplo, presentando la oleína de palma una concentración de ácido palmítico muy similar al aceite de palma per se, la concentración de ácido oleico es considerablemente mayor (14).
El objetivo de la revisión de Sun y cols. (2015) es comparar el aceite de palma con aceites bajos en AGS, por lo que el aceite de coco, con un perfil más saturado, queda excluido. La diferencia de edad en la población de estudio muestra mayor efecto de acei-tes bajos en AGS sobre el perfil lipídico. Además, la mayoría de la población de estudio mayor de 50 años presenta una moderada hipercolesterolemia, mostrando un efecto positivo en los niveles de CT y LDLc con el aceite vegetal bajo en AGS, y negativo con aceite de palma (39). Este metaanálisis concluye que el aceite de palma produce efectos diferentes según con qué grasa se compare. Se sugiere que los ácidos láurico y mirístico afectan a todas las fraccio-nes del colesterol más que el palmítico, y este las aumenta más que el esteárico. Los autores comparan el efecto del aceite de palma con el de AG específicos, metodología que puede ser cuestionada, ya que lo correcto sería comparar AG entre sí o aceites entre sí (39).
Según lo revisado, las investigaciones deberían considerar intervenciones en humanos con dietas elaboradas con fraccio-nes de aceite de palma diferenciadas, como las comentadas del modelo animal. Algunas fracciones del aceite de palma presentan perfiles lipídicos con diferente proporción de AG y con tendencia a una composición más “favorable” para la salud cardiovascular por su mayor contenido en ácido oleico.
Al no haber encontrado estudios realizados con aceite de palma como ingrediente de alimentos en un contexto de dieta mediterránea, donde el principal aceite culinario es el de oliva, consideramos necesario realizar estas investigaciones que serían las extrapolables a nuestro entorno.
FINANCIACIÓN
Este trabajo ha sido financiado parcialmente con fondos de la Fundación Española del Aceite de Palma Sostenible mediante acuerdo con la Universidad Politécnica de Madrid. Ningún miem-bro de la Fundación ha tomado parte en el diseño, la búsqueda de datos, su interpretación, la redacción del manuscrito o la publi-cación del mismo.
CONTRIBUCIÓN DE AUTORÍA
MGG es la autora para la correspondencia y garante del manus-crito, se ha encargado del diseño y ha contribuido a la discusión y redacción del mismo. JGG ha contribuido a la obtención de los datos, discusión y redacción. EG ha participado en el diseño del estudio y ha contribuido a la obtención de los datos, su discusión y la redacción del manuscrito.

1236 E. Gesteiro et al.
[Nutr Hosp 2018;35(5):1229-1242]
Ane
xo I.
Est
udio
sTi
po d
e ac
eite
usa
do
Dife
renc
ia
entr
e ac
eite
s y
AG
ai
slad
os
Indi
ca %
E
de la
die
ta
proc
eden
te d
e gr
asas
Indi
ca %
E
proc
eden
te
del a
ceite
es
tudi
ado
Ace
ite d
e pa
lma
com
o in
gred
ient
e o
de fo
rma
aisl
ada
Indi
ca p
erfil
lip
ídic
o de
los
part
icip
ante
sFa
ctor
es d
e co
nfus
ión
Mac
ronu
trie
ntes
de
la d
ieta
se
ajus
tan
a la
s re
com
enda
cion
es
Dife
renc
ia
entr
e pa
lma,
pa
lmis
te y
fr
acci
ones
Espe
cific
a pe
rfil
de A
G
de c
ada
acei
te
usad
o
En %
En
g/dí
aEn
%En
g/
día
- Ace
ite lí
quid
o - A
ceite
de
fritu
ra- I
ngre
dien
te d
e pr
oduc
to
Act
ivid
ad
físic
a
Con
text
o de
la d
ieta
ha
bitu
al
Cate
r y c
ols.
(2
001)
SíSí
SíSí
-Sí 43%
-Ac
eite
líqu
ido
Sí
Hipe
rNo
Sí
No
35%
CHO
12%
Pro
teín
a53
% G
rasa
Cate
r y c
ols.
(1
997)
SíSí
SíSí
-Sí
43%
-Ac
eite
líqu
ido
Sí
Hipe
rNo
Sí
No
35%
CHO
12%
Pro
teín
a53
% G
rasa
Chou
dhur
y y
cols
. (1
995)
SíSí
SíSí
-Sí 50%
-Ac
eite
util
izado
par
a un
tar,
coci
nar y
ho
rnea
r
Sí
Hipe
r (le
ve)
Man
tiene
n pa
trone
s de
eje
rcic
io
habi
tual
es
Sí
Sí
51%
CHO
17%
Pro
teín
a31
% G
rasa
Chou
dhur
y y
cols.
(199
7)Sí
SíSí
Sí-
Sí 50%
-Pa
tata
s fri
tas
en
acei
te
Sí
Hipe
r (le
ve)
NoNo
No e
spec
ifica
30%
Gra
sa
Denk
e y
cols
. (19
92)
SíSí
SíSí
-Sí 40%
-Fó
rmul
a líq
uida
Sí
Hipe
r
Sí d
uran
te e
l es
tudi
oNo
Sí
40%
CHO
20%
Pro
teín
a40
% G
rasa
Ghaf
ooru
-ni
ssa
y co
ls.
(199
5)Sí
NoSí
Sí-
Sí
Estu
dio
117
,5%
Estu
dio
220
%
-Ac
eite
de
coci
nado
No d
ifere
ncia
No m
uest
ran
valo
res
basa
les
del c
oles
tero
lNo
Sí
Sí
Estu
dio
161
% C
HO12
% P
rote
ína
27%
Gra
sa
Estu
dio
256
% C
HO12
% P
rote
ína
32%
Gra
sa
(Con
tinúa
en
la p
ágin
a sig
uien
te)
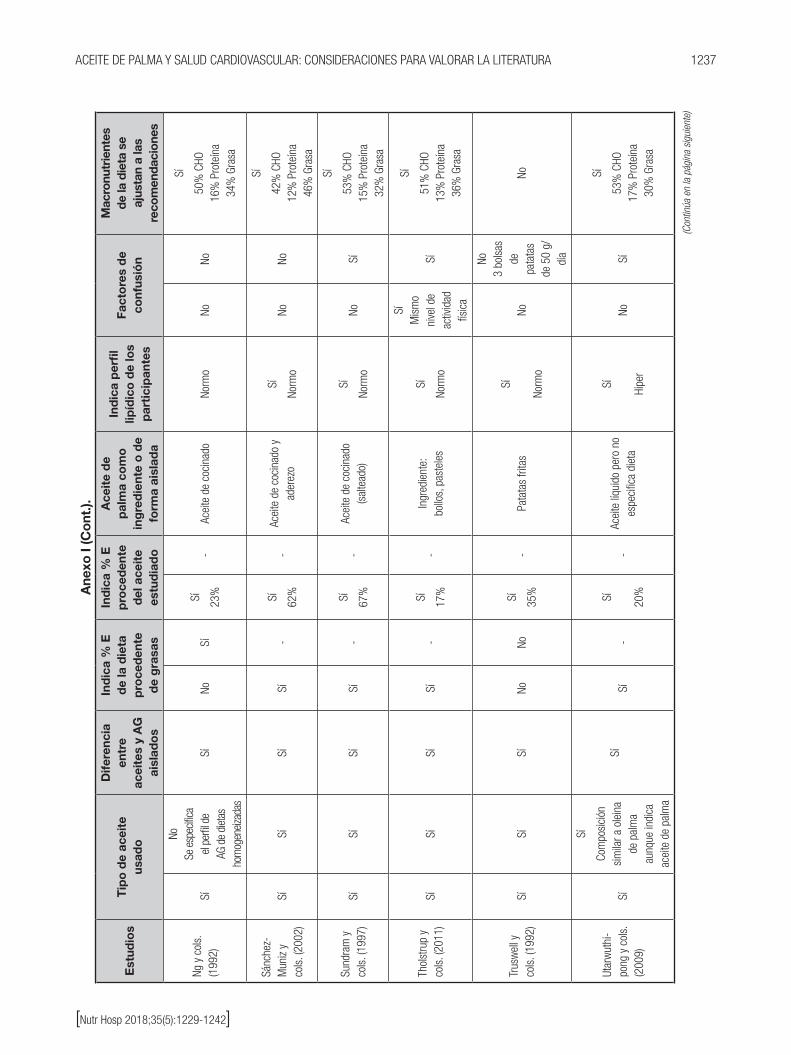
1237ACEITE DE PALMA Y SALUD CARDIOVASCULAR: CONSIDERACIONES PARA VALORAR LA LITERATURA
[Nutr Hosp 2018;35(5):1229-1242]
Ane
xo I
(Co
nt.).
Est
udio
sT
ipo
de
acei
te
usad
o
Dife
renc
ia
entr
e ac
eite
s y
AG
ai
slad
os
Ind
ica
% E
d
e la
die
ta
pro
ced
ente
d
e g
rasa
s
Ind
ica
% E
p
roce
den
te
del
ace
ite
estu
dia
do
Ace
ite
de
pal
ma
com
o
ing
red
ient
e o
de
form
a ai
slad
a
Ind
ica
per
fil
lipíd
ico
de
los
par
tici
pan
tes
Fact
ore
s d
e co
nfus
ión
Mac
ronu
trie
ntes
de
la d
ieta
se
ajus
tan
a la
s re
com
enda
cion
es
Ng y
col
s.
(199
2)Sí
NoSe
esp
ecific
a el
perfi
l de
AG d
e di
etas
ho
mog
eneiz
adas
SíNo
Sí
Sí 23%
-Ac
eite
de
coci
nado
Norm
oNo
No
Sí
50%
CHO
16%
Pro
teín
a34
% G
rasa
Sánc
hez-
Mun
iz y
cols
. (20
02)
SíSí
SíSí
-Sí 62%
-Ac
eite
de
coci
nado
y
ader
ezo
Sí
Norm
oNo
No
Sí
42%
CHO
12%
Pro
teín
a46
% G
rasa
Sund
ram
y
cols
. (19
97)
SíSí
SíSí
-Sí 67%
-Ac
eite
de
coci
nado
(s
alte
ado)
Sí
Norm
oNo
Sí
Sí
53%
CHO
15%
Pro
teín
a32
% G
rasa
Thol
stru
p y
cols
. (20
11)
SíSí
SíSí
-Sí
17%
-In
gred
ient
e:bo
llos,
pas
tele
s
Sí
Norm
o
SíM
ism
o ni
vel d
e ac
tivid
ad
físic
a
Sí
Sí
51%
CHO
13%
Pro
teín
a36
% G
rasa
Trus
wel
l y
cols
. (19
92)
SíSí
SíNo
NoSí 35%
-Pa
tata
s fri
tas
Sí
Norm
oNo
No3
bols
as
de
pata
tas
de 5
0 g/
día
No
Utar
wut
hi-
pong
y c
ols.
(2
009)
Sí
Sí
Com
posi
ción
si
mila
r a o
lein
a de
pal
ma
aunq
ue in
dica
ac
eite
de
palm
a
SíSí
-Sí 20%
-Ac
eite
líqu
ido
pero
no
espe
cific
a di
eta
Sí
Hipe
rNo
Sí
Sí
53%
CHO
17%
Pro
teín
a30
% G
rasa
(Con
tinúa
en
la p
ágin
a sig
uien
te)

1238 E. Gesteiro et al.
[Nutr Hosp 2018;35(5):1229-1242]
Ane
xo I
(Co
nt.).
Est
udio
sT
ipo
de
acei
te u
sad
o
Dife
renc
ia
entr
e ac
eite
s y
AG
ais
lad
os
Ind
ica
% E
d
e la
die
ta
pro
ced
ente
d
e g
rasa
s
Ind
ica
% E
p
roce
den
te
del
ace
ite
estu
dia
do
Ace
ite
de
pal
ma
com
o
ing
red
ient
e o
de
form
a ai
slad
a
Ind
ica
per
fil
lipíd
ico
de
los
par
tici
pan
tes
Fact
ore
s d
e co
nfus
ión
Mac
ronu
trie
ntes
de
la d
ieta
se
ajus
tan
a la
s re
com
enda
cion
es
Vega
-Lóp
ez
y co
ls.
(200
6)Sí
NoSí
Sí-
Sí 20%
-Ac
eite
líqu
ido
pero
no
esp
ecifi
ca d
ieta
Sí
Hipe
r (le
ve)
No
Sí
Sí
53%
CHO
17%
Pro
teín
a30
% G
rasa
Voon
y
cols
. (2
011)
SíNo
SíSí
-Sí
-Ac
eite
líqu
ido
pero
no
esp
ecifi
ca d
ieta
Sí
Norm
oNo
Sí
Sí
55%
CHO
15%
Pro
teín
a30
% G
rasa
Zhan
g y
cols
. (1
997)
Sí
NoSe
esp
ecifi
ca
el p
erfil
de
AG d
e di
etas
ho
mog
enei
zada
s
SíNo
Sí
Sí
60-
65%
-Ac
eite
líqu
ido
pero
no
esp
ecifi
ca s
u us
o
Sí
Norm
oNo
No
SÍ
57%
CHO
13%
Pro
teín
a30
% G
rasa
Mar
zuki
y
cols
. (1
991)
SíSí
SíSí
-No
-Ac
eite
de
coci
nado
Sí
Norm
oNo
Sí
Sí52
% C
HO12
% P
rote
ína
36%
Gra
sa
Mat
tson
y
cols
. (1
985)
SíSí
SíSí
-No
-Fó
rmul
a líq
uida
Sí
Hipe
rNo
No
Sí
40%
CHO
20%
Pro
teín
a40
% G
rasa
Woo
d y
cols
. (1
993)
SíSí
NoSí
-Sí 60%
-Un
tabl
es, g
alle
tas,
he
lado
SíNo
rmo
No s
e lim
itó
ejer
cici
o y
activ
idad
fís
ica
Sí
Sí
48%
CHO
15%
Pro
teín
a37
% G
rasa
(Con
tinúa
en
la p
ágin
a sig
uien
te)

1239ACEITE DE PALMA Y SALUD CARDIOVASCULAR: CONSIDERACIONES PARA VALORAR LA LITERATURA
[Nutr Hosp 2018;35(5):1229-1242]
Ane
xo I
(Co
nt.).
Est
udio
sT
ipo
de
acei
te
usad
o
Dife
renc
ia
entr
e ac
eite
s y
AG
ai
slad
os
Ind
ica
% E
d
e la
die
ta
pro
ced
ente
d
e g
rasa
s
Ind
ica
% E
p
roce
den
te
del
ace
ite
estu
dia
do
Ace
ite
de
pal
ma
com
o
ing
red
ient
e o
de
form
a ai
slad
a
Ind
ica
per
fil
lipíd
ico
de
los
par
tici
pan
tes
Fact
ore
s d
e co
nfus
ión
Mac
ronu
trie
ntes
de
la d
ieta
se
ajus
tan
a la
s re
com
enda
cion
es
Ng y
col
s.
(199
1)Sí
NoSe
esp
ecifi
ca
el p
erfil
de
AG d
e di
etas
ho
mog
enei
zada
s
SíNo
Sí
Sí50
% d
e la
ole
ina
de p
alm
a (h
abitu
al
en la
co
cina
M
alas
ia)
-Ac
eite
de
coci
nado
Sí
Norm
oNo
No
Sí
Perio
do 1
:56
% C
HO15
% P
rote
ína
29%
Gra
sa
Perio
do 2
:55
% C
HO15
% P
rote
ína
30%
Gra
sa
Perio
do 3
:54
% C
HO15
% P
rote
ína
31%
Gra
sa
Scho
ltz y
co
ls. (
2004
) Sí
SíSí
Sí-
Sí 12%
-
Acei
te c
omo
ingr
edie
nte:
mag
dale
nas
y bi
zcoc
ho
Sí
Hipe
r
Man
tiene
n la
ac
tivid
ad fí
sica
si
n ca
mbi
os
No
No
Falta
n da
tos
de C
HO y
pr
oteí
nas
33-3
7% G
rasa
Bona
nom
e &
Grun
dy,
1988
Sí
SíSí
Sí-
Sí 40%
-Fó
rmul
a líq
uida
Sí
Hipe
r
Se li
mita
el
eje
rcic
io
exte
nuan
te
(se
perm
ite
cam
inar
en
el
hosp
ital)
No
Sí
40%
CHO
20%
Pro
teín
a40
% G
rasa
Sund
ram
y
cols
. (19
94)
SíSí
SíSí
-Sí 20%
-Ac
eite
de
coci
nado
(s
alte
ado)
Sí
Norm
o
Entre
nam
ient
o en
aca
dem
ia
milit
arSí
Sí
53%
CHO
16%
Pro
teín
a 31
% G
rasa
Cues
ta y
co
ls. (
1998
) Sí
SíSí
Sí-
Sí 62%
-Ac
eite
de
coci
nado
y
ader
ezo
Sí
Hipe
rNo
No
No
42%
CHO
12%
Pro
teín
a46
% G
rasa
(Con
tinúa
en
la p
ágin
a sig
uien
te)

1240 E. Gesteiro et al.
[Nutr Hosp 2018;35(5):1229-1242]
Ane
xo I
(Co
nt.).
Est
udio
sT
ipo
de
acei
te
usad
o
Dife
renc
ia
entr
e ac
eite
s y
AG
ais
lad
os
Ind
ica
% E
d
e la
die
ta
pro
ced
ente
d
e g
rasa
s
Ind
ica
% E
p
roce
den
te
del
ace
ite
estu
dia
do
Ace
ite
de
pal
ma
com
o
ing
red
ient
e o
de
form
a ai
slad
a
Ind
ica
per
fil
lipíd
ico
de
los
par
tici
pan
tes
Fact
ore
s d
e co
nfus
ión
Mac
ronu
trie
ntes
de
la d
ieta
se
ajus
tan
a la
s re
com
enda
cion
es
Sund
ram
y
cols
. (20
03)
No
No
Rem
ite a
Su
ndra
m y
col
s.,
(199
4)
NoSí
-Sí
10,6
%-
Acei
te d
e co
cina
doSí
Norm
oNo
Sí
Sí
56%
CHO
14%
Pro
teín
a 30
% G
rasa
Men
sik
(200
8)
SíSí
SíSí
-No
-
Ingr
edie
nte:
- M
arga
rinas
(80%
)-
Galle
tas
(17%
)-
Mag
dale
nas
(24%
)-
Past
a de
cho
cola
te
(35%
)-
Pata
tas
frita
s (2
3%)
Sí
Norm
oNo
Sí
Sí
45%
CHO
15%
Pro
teín
a 40
% G
rasa
Mül
ler y
co
ls. (
1998
)Sí
SíSí
Sí-
Sí 28%
-M
arga
rinas
usa
das
para
unt
ar, h
orne
ar y
co
cina
r
Sí
Norm
o
Man
tiene
n el
m
ism
o ni
vel
de a
ctivi
dad
físic
a du
rant
e la
inte
rven
ción
Sí
Sí
52%
CHO
17%
Pro
teín
a 40
% G
rasa
Sund
ram
y
cols
. (20
07)
SíSí
SíSí
-Sí 70%
-Ac
eite
de
coci
nado
Sí
Hipe
r (le
ve)
NoSí
Sí
54%
CHO
15%
Pro
teín
a 31
% G
rasa
Mut
alib
y
cols
. (19
99)
SíSí
SíSí
-Sí 65%
-
Acei
te in
tegr
ado
en
la d
ieta
dur
ante
el
proc
eso
de c
ocin
ado
No s
e de
fine
Sí
Norm
o
Activ
idad
fís
ica
regi
stra
da
en u
n di
ario
se
man
al
Sí
Sí
45%
CHO
15%
Pro
teín
a 40
% G
rasa
AG: á
cidos
gra
sos;
Hip
er: h
iper
cole
ster
olém
icos;
Nor
mo:
nor
moc
oles
tero
lém
icos;
CHO
: hid
rato
s de
car
bono
.

1241ACEITE DE PALMA Y SALUD CARDIOVASCULAR: CONSIDERACIONES PARA VALORAR LA LITERATURA
[Nutr Hosp 2018;35(5):1229-1242]
BIBLIOGRAFÍA
1. USDA. Oilseeds: World Markets and Trade 2017 World Production, Markets, and Trade Reports. 2017.
2. Zock P, De Vries JHM, Katan MB. Impact of myristic acid versus palmitic acid on serum lipid and lipoprotein levels y healthy women and men. Arterioscler Thromb 1994;14:567-75.
3. EFSA Panel on Dietetic Products, Nutrition, and Allergies (NDA). Scienti-fic opinion on dietary reference values for fats, including saturated fatty acids, polyunsaturated fatty acids, monounsaturated fatty acids, trans fatty acids, and cholesterol. EFSA Journal 2010;8:1461. DOI: 10.2903/j.efsa.2010.1461
4. Marangoni F, Galli C, Ghiselli A, Lercker G, La Vecchia C, Maffeis C, et al. Palm oil and human health. Meeting report of NFI: Nutrition Founda-tion of Italy symposium. Int J Food Sci Nutr 2017;68(6):643-55. DOI: 10.1080/09637486.2016.1278431
5. Montoya C, Cochard B, Flori A, Cros D, Lopes R, Cuellar T, et al. Genetic architecture of palm oil fatty acid composition in cultivated oil palm (Elaeis guineensis Jacq.) compared to its wild relative E. oleifera (H.B.K) Cortés. PLoS One 2014;9:e95412. DOI: 10.1371/journal.pone.0095412
6. Ting NC, Yaakub Z, Kamaruddin K, Mayes S, Massawe F, Sambanthamur-thi R, et al. Fine-mapping and cross-validation of QTLs linked to fatty acid composition in multiple independent interspecific crosses of oil palm. BMC Genomics 2016;17:289. DOI: 10.1186/s12864-016-2607-4
7. Sambanthamurthi R, Sundram K, Tan Y. Chemistry and biochemistry of palm oil. Prog Lipid Res 2000;39:507-58.
8. Lieb VM, Kerfers MR, Kronmüller A, Esquivel P, Alvarado A, Jiménez VM, et al. Characterization of mesocarp and kernel lipids from Elaeis guineensis Jacq., Elaeis oleifera [Kunth] Cortés, and their interspecific hybrids. J Agric Food Chem 2017;65:3617-26. DOI: 10.1021/acs.jafc.7b00604
9. Sundram K, Sambanthamurthi R, Tan YA. Palm fruit chemistry and nutrition. Asia Pac J Clin Nutr 2003;12:355-62.
10. FAO/OMS. Estudio FAO alimentación y nutrición nº 91. Grasas y ácidos grasos en nutrición humana. Consulta de expertos. 2010. FAO y FINUT, 2012 (edición española). FAO ISBN: 978-92-5-306733-6
11. FESNAD. Consenso sobre las grasas y aceites en la alimentación de la pobla-ción española adulta. 2015. Disponible en: http://www.fesnad.org/resources/files/Publicaciones/Consenso_sobre_las_grasas_y_aceites_2015.pdf
12. Carbajal A. Ingestas recomendadas de energía y nutrientes. En: Nutrición y dietética. Tema 2. pp: 27-44. MT García-Arias, MC García-Fernández (eds.). Secretariado de Publicaciones y Medios Audiovisuales. Universidad de León; 2003 (ISBN: 84-9773-023-2). Actualizado 2013.
13. Krauss RM, Eckel RH, Howard B, Appel LJ, Daniels SR, Deckelbaum RJ, et al. AHA Dietary Guidelines Revision 2000: a statement for healthcare pro-fessionals from the Nutrition Committee of the American Heart Association. Stroke 2000;31:2751-66.
14. Codex Alimentarius CODEX STAN 210-1999. Codex standard for named vegetable oils. Adopted 1999. Revisions 2001, 2003, 2009. Amendment 2005, 2011 and 2015.
15. Edem DO. Palm oil: biochemical, physiological, nutritional, hematological, and toxicologic aspects - A review. Plant Foods Hum Nutr 2002;57:319-41.
16. Siew WL. Analysis of palm and palm kernel oils. En: Basiron Y, Jalani BS, Chan KW, eds. Advances in oil palm research. Kuala Lumpur: Malaysian Palm Oil Board; 2000. pp 968-1035.
17. Fattore E, Fanelli R. Palm oil and palmitic acid: a review on cardiovascular effects and carcinogenicity. Int J Food Sci Nutr 2013;64:648-59.
18. Clifton PM. Palm oil and LDL cholesterol. Am J Clin Nutr 2011;94:1392-3.19. Oguntibeju OO, Esterhuyse AJ, Truter EJ. Red palm oil: nutritional, physiolo-
gical and therapeutic roles in improving human wellbeing and quality of life. Br J Biomed Sci 2009;66(4):216-22.
20. Souganidis E, Laillou A, Leyvraz M, Moench-Pfanner R. A comparison of retinyl palmitate and red palm oil β-carotene as strategies to address vitamin A deficiency. Nutrients 2013;5:3257-71.
21. Han NM, May CY. Chromatographic analyses of tocopherols and tocotrienols in palm oil. J Chromatogr Sci 2012;50(3):283-6.
22. Schroeder MT, Becker EM, Skibsted LH. Molecular mechanism of antioxidant synergism of tocotrienols and carotenoids in palm oil. J Agric Food Chem 2006;54(9):3445-53.
23. Kulkarni S, Ghosh SP, Satyamitra M, Mog S, Hieber K, Romanyukha L, et al. Gamma-tocotrienol protects hematopoietic stem and progenitor cells in mice after total-body irradiation. Radiat Res 2010;173(6):738-47. DOI: 10.1667/RR1824.1
24. Li XH, Fu D, Latif NH, Mullaney CP, Ney PH, Mog SR, et al. Delta-tocotrienol protects mouse and human hematopoietic progenitors from gamma-irra-diation through extracellular signal-regulated kinase/mammalian target of rapamycin signaling. Haematologica 2010;95(12):1996-2004. DOI: 10.3324/haematol.2010.026492. E-pub 7 sept 2010.
25. Ling MT, Luk SU, Al-Ejeh F, Khanna KK. Tocotrienol as a potential anticancer agent. Carcinogenesis 2012;33:233-9.
26. Luk SU, Yap WN, Chiu YT, Lee DT, Ma S, Lee TK, et al. Gamma-tocotrienol as an effective agent in targeting prostate cancer stem cell-like population. Int J Cancer 2011;128(9):2182-91. DOI: 10.1002/ijc.25546
27. Stonehouse W, Brinkworth GD, Thompson CH, Abeywardena MY. Short term effects of palm-tocotrienol and palm-carotenes on vascular function and cardiovascular disease risk: a randomised controlled trial. Atherosclerosis 2016;254:205e214.
28. May CY, Nesaretnam K. Research advancements in palm oil nutrition. Eur J Lipid Sci Technol 2014;116:1301-15.
29. Mancini A, Imperlini E, Nigro E, Montagnese C, Daniele A, Orrù S, et al. Biological and nutritional properties of palm oil and palmitic acid: effects on health. Molecules 2015;20:17339-61.
30. Hayes KC. Synthetic and modified glycerides: effects on plasma lipids. Curr Opin Lipidol 2001;12:55-60.
31. Sanders TA, Filippou A, Berry SE, Baumgartner S, Mensink RP. Palmitic acid in the sn-2 position of triacylglycerols acutely influences postprandial lipid metabolism. Am J Clin Nutr 2011;94:1433-41.
32. Khosla P, Hayes KC. Saturated fat and lipemia: importance of study design and triglyceride structure. Am J Clin Nutr 2012;96:216-8;author reply 218-9. DOI: 10.3945/ajcn.112.037234
33. Zong G, Li Y, Wanders AJ, Alssema M, Zock PL, Willett WC, et al. Intake of indi-vidual saturated fatty acids and risk of coronary heart disease in US men and women: two prospective longitudinal cohort studies. BMJ 2016;355:i5796. DOI: 10.1136/bmj.i5796
34. Praagman J, De Jonge EA, Kiefte-de Jong JC, Beulens JW, Sluijs I, Schoufour JD, et al. Dietary saturated fatty acids and coronary heart disease risk in a Dutch middle-aged and elderly population. Arterioscler Thromb Vasc Biol 2016;36:2011-8. DOI: 10.1161/ATVBAHA.116.307578
35. Mensink RP, Sanders TA, Baer DJ, Hayes KC, Howles PN, Marangoni A. The increasing use of interesterified lipids in the food supply and their effects on health parameters. Adv Nutr 2016;7:719-29. DOI: 10.3945/an.115.009662
36. World Health Organization (WHO). Cardiovascular diseases (CVDs). 2017. Disponible en: http://www.who.int/mediacentre/factsheets/fs317/en/
37. Dalen JE, Devries S. Diets to prevent coronary heart disease 1957-2013: what have we learned? Am J Med 2014;127:364-9.
38. Li Y, Hruby A, Bernstein AM, Ley SH, Wang DD, Chiuve SE, et al. Saturated fats compared with unsaturated fats and sources of carbohydrates in relation to risk of coronary heart disease: a prospective cohort study. J Am Coll Cardiol 2015;66:1538-48. DOI: 10.1016/j.jacc.2015.07.055
39. Sun Y, Neelakantan N, Wu Y, Lote-Oke R, Pan A, Van Dam RM. Palm oil consumption increases LDL cholesterol compared with vegetable oils low in saturated fat in a meta-analysis of clinical trials. J Nutr 2015;145:1549-58.
40. Fattore E, Bosetti B, Brighenti F, Agostoni C, Fattore G. Palm oil and blood lipid-related markers of cardiovascular disease: a systematic review and meta-analysis of dietary intervention trials. Am J Clin Nutr 2014;99:1331-50.
41. Mensink RP, Katan MB. Effect of dietary fatty acids on serum lipids and lipo-proteins. A meta-analysis of 27 trials. Arterioscler Thromb 1992;12:911-9.
42. Odia OJ, Ofori S, Maduka O. Palm oil and the heart: a review. World J Cardiol 2015;7(3):144-9. DOI: 10.4330/wjc.v7.i3.144. PubMed PMID: 25810814; PubMed Central PMCID: PMC4365303.
43. Ismail SR, Maarof SK, Siedar Ali S, Ali A. Systematic review of palm oil consumption and the risk of cardiovascular disease. PLoS ONE 2018;13(2):e0193533.
44. Kakarmath SS, Zack RM, Leyna GH, Fahimi S, Liu E, Fawzi WW, et al. Dietary determinants of serum total cholesterol among middle-aged and older adults: a population-based cross-sectional study in Dar es Salaam, Tanzania. BMJ Open 2017;7:e015028. DOI: 10.1136/bmjopen-2016-015028
45. Rosqvist F, Iggman D, Kullberg J, Cedernaes J, Johansson HE, Larsson A, et al. Overfeeding polyunsaturates and saturated fat causes distinct effects on liver and visceral fat accumulation in humans. Diabetes 2014;63:2356-68.
46. Karupaiah T, Chuah KA, Chinna K, Matsuoka R, Masuda Y, Sundram K, et al. Comparing effects of soybean oil- and palm olein-based mayonnaise consumption on the plasma lipid and lipoprotein profiles in human subjects: a double-blind randomized controlled trial with cross-over design. Lipids Health Dis 2016;15:131-42.

1242 E. Gesteiro et al.
[Nutr Hosp 2018;35(5):1229-1242]
47. Boon CM, Ng MH, Choo YM, Mok SL. Super, red palm and palm oleins improve the blood pressure, heart size, aortic media thickness and lipid profile in spontaneously hypertensive rats. PLoS One 2013;8:e55908. DOI: 10.1371/journal.pone.0055908
48. Xian TK, Omar NA, Ying LW, Hamzah A, Raj S, Jaarin K, et al. Reheated palm oil consumption and risk of atherosclerosis: evidence at ultrastruc-tural level. Evid Based Complement Alternat Med 2012:828170. DOI: 10.1155/2012/828170. E-pub 2012.
49. Perumalla Venkata R, Subramanyam R. Evaluation of the deleterious heal-th effects of consumption of repeatedly heated vegetable oil. Toxicol Rep 2016;3:636-43.
50. Gotoh N, Kagiono S, Yoshinaga K, Mizobe H, Nagai T, Yoshida A, et al. Study of trans fatty acid formation in oil by heating using model compounds. J Oleo Sci 2018;67(3):273-81.
51. Daniali G, Jinap S, Sanny M, Tan CP. Effect of amino acids and frequency of reuse frying oils at different temperature on acrylamide formation in palm olein and soybean oils via modeling system. Food Chem 2018;245:1-6.
52. Endo Y. Analytical methods to evaluate the quality of edible fats and oils: the JOCS standard methods for analysis of fats, oils and related materials (2013) and advanced methods. J Oleo Sci 2018;67(1):1-10. DOi: 10.5650/jos.ess17130
53. Denke MA, Grundy SM. Comparison of effects of lauric acid and palmitic acid on plasma lipids and lipoproteins. Am J Clin Nutr 1992;56:895-8.
54. Teng KT, Nagapan G, Cheng HM, Nesaretnam K. Palm olein and olive oil cause a higher increase in postprandial lipemia compared with lard but had no effect on plasma glucose, insulin and adipocytokines. Lipids 2011;46:381-8. DOI: 10.1007/s11745-010-3516-y
55. Tholstrup T, Hjerpsted J, Raff M. Palm olein increases plasma cholesterol moderately compared with olive oil in healthy individuals. Am J Clin Nutr 2011;94:1426-32. DOI: 10.3945/ajcn.111.018846
56. Teng KT, Voon PT, Cheng HM, Nesaretnam K. Effects of partially hydrogenated, semi-saturated, and high oleate vegetable oils on inflammatory markers and lipids. Lipids 2010;45:385-92. DOI: 10.1007/s11745-010-3416-1
57. Bonanome A, Grundy SM. Effect of dietary stearic acid on plasma cholesterol and lipoprotein levels. N Engl J Med 1988;318:1244-8.
58. Müller H, Jordal O, Kierulf P, Kirkhus B, Pedersen JI. Replacement of partially hydrogenated soybean oil by palm oil in margarine without unfavorable effects on serum lipoproteins. Lipids 1998;33:879-87.
59. Mensink RP. Effects of products made from a high palmitic acid, trans-free semiliquid fat or a high oleic acid, low-trans semiliquid fat on the serum lipoprotein profile and on C-reactive protein concentration in humans. Eur J Clin Nutr 2008;62:617-24.

NutriciónHospitalaria
ISSN (electrónico): 1699-5198 - ISSN (papel): 0212-1611 - CODEN NUHOEQ S.V.R. 318
Grupo de Trabajo SENPE
Manejo nutricional de la esclerosis lateral amiotrófica: resumen de recomendacionesNutritional management of amyotrophic lateral sclerosis: summary of recommendations
Mª Dolores del Olmo García1, Nuria Virgili Casas2, Ana Cantón Blanco3, Francisca Margarita Lozano Fuster4, Carmina Wanden-Berghe5, Victoria Avilés6, Rosana Ashbaugh Enguídanos7, Isabel Ferrero López8, Juan Bautista Molina Soria9, Juan Carlos Montejo González10, Irene Bretón Lesmes11, Julia Álvarez Hernández7 y José Manuel Moreno Villares12, miembros del Grupo de Trabajo de Ética de la Sociedad Española de Nutrición Clínica y Metabolismo (SENPE)1Hospital Universitario Severo Ochoa de Leganés. Madrid. 2Hospital Universitario Bellvitge. L’Hospitalet de Llobregat. Barcelona. 3Hospital Clínico Universitario Santiago de Compostela. Santiago. 4Hospital Universitario Son Dureta (Hospital General). Palma de Mallorca. 5Hospital General Universitario de Alicante. Alicante. 6Hospital Universitario Vall d’Hebrón. Barcelona. 7Hospital Universitario Príncipe de Asturias. Alcalá de Henares. Madrid. 8Hospital Pare Jofré. Valencia. 9Hospital Universitario “San Agustín”. Linares, Jaén. 10Hospital Universitario 12 de Octubre. Madrid. 11Hospital Universitario Gregorio Marañón. Madrid. 12Clínica Universidad de Navarra. Madrid
INTRODUCCIÓN
La esclerosis lateral amiotrófica (ELA) es una enfermedad neuro-degenerativa que se caracteriza por debilidad muscular y discapaci-dad progresivas que acaban produciendo fallo respiratorio y disfagia que conducen a la muerte. El término surge de la combinación de los hallazgos clínicos, caracterizados por la atrofia muscular (amio-trofia), y los hallazgos anatomopatológicos con gliosis y esclerosis del área dorsolateral de la médula espinal, entre otros (1).
La ELA es la enfermedad más común de las enfermedades de la motoneurona. Su incidencia global es de 1,5 a 2,7 nuevos casos/100.000 habitantes/año, con una prevalencia media de 2,7 a 7,4 casos/100.000 habitantes (2). En España, según la Sociedad Española de Neurología, se diagnostican tres nuevos casos cada día, lo que supone una incidencia anual de 1/100.000 habitantes y una prevalencia de 3,5/100.000 (3).
Más del 90% de los casos de ELA son esporádicos e idiopáticos y entre el 5 y el 10% son familiares. La ELA esporádica afecta más a los hombres (ratio: 1,3-1,5:1), con una incidencia que va aumentando a partir de los 40 años y un pico entre los 70 y 75 años. La incidencia entre sexos se va igualando a medida que aumenta la edad de diagnóstico (4-6).
No existe marcador biológico de ELA. El diagnóstico es funda-mentalmente clínico, demorándose en la mayoría de los casos varios meses. Los criterios de El Escorial y de Awaji permiten confirmar la sospecha diagnóstica (4,6).
Clínicamente se presenta como una combinación de síntomas y signos derivados de la destrucción progresiva de las neuro-nas motoras superiores (corteza cerebral) e inferiores (tronco del encéfalo y médula espinal). En un principio se creía que era una enfermedad pura de la motoneurona, pero actualmente se reco-noce que existe degeneración neuronal en otras regiones de la corteza cerebral, lo cual puede complicar el espectro clínico (1,4).
Los síntomas y signos típicos son debilidad, hiperreflexia y espasticidad en relación a la degeneración de las neuronas motoras superiores, y amiotrofia y fasciculaciones reflejo de la afectación de las neuronas motoras inferiores y la subsecuente denervación muscular (Tabla I). Cualquier grupo muscular puede verse afectado y la enfermedad va extendiéndose progresivamen-te de unas regiones a otras siguiendo un patrón relativamente predecible. En función de la localización, la extensión y la veloci-dad de destrucción de las neuronas se distinguen distintas formas de presentación. La más frecuente, en el 80% de los casos, es la debilidad asimétrica de los miembros, que afecta fundamental-mente a manos (dificultando la manipulación de objetos cotidianos como botones, monedas, etc.) y pies (inicialmente la dorsiflexión y, progresivamente, dificultad para levantarse, subir escaleras, etc.). En el 20% restante, los pacientes presentan inicialmente síntomas de afectación bulbar, principalmente disartria y disfagia. La disfagia aislada, sin disartria, es excepcional (1).
Aunque la mayoría de los pacientes con ELA no presentan demencia (predominantemente frontotemporal en caso de existir),
©Copyright 2018 SENPE y ©Arán Ediciones S.L. Este es un artículo Open Access bajo la licencia CC BY-NC-SA (http://creativecommons.org/licenses/by-nc-sa/4.0/).
Del Olmo García MD, Virgili Casas N, Cantón Blanco A, Lozano Fuster FM, Wanden-Berghe C, Avilés V, Ashbaugh Enguídanos R, Ferrero López I, Molina Soria JB, Montejo González JC, Bretón Lesmes I, Álvarez Hernández J, Moreno Villares JM y SENPE. Manejo nutricional de la esclerosis lateral amiotrófica: resumen de recomendaciones. Nutr Hosp 2018;35(5):1243-1251
DOI: http://dx.doi.org/10.20960/nh.2162
Correspondencia: Ana Cantón Blanco. Hospital Clínico Universitario Santiago de Compostela. Rúa da Choupana, s/n. 15706 Santiago de Compostela, A Coruñae-mail: [email protected]
Recibido: 22/06/2018 • Aceptado: 23/06/2018

1244 M. D. del Olmo García et al.
[Nutr Hosp 2018;35(5):1243-1251]
en casi la mitad de los pacientes puede detectarse cierto deterioro cognitivo. La labilidad emocional es muy frecuente en la forma bulbar.
A medida que la enfermedad progresa pueden aparecer tam-bién signos de afectación del sistema nervioso autónomo: retraso del vaciamiento gástrico, problemas de micción, estreñimiento, hiperhidrosis, etc. (1).
La forma y velocidad de progresión son variables entre indivi-duos, empeorando progresivamente hasta la muerte, sin “brotes” ni remisiones. La insuficiencia respiratoria constituye la causa más frecuente de muerte. Rara vez se presenta como primer síntoma de la enfermedad (solamente un 5% de los pacientes), pero aparece durante la evolución de cualquier forma de ELA. La capacidad vital forzada (FVC) es uno de los factores pronósticos al diagnóstico y se utiliza para evaluar la progresión de la enfer-medad. La desnutrición grave y la deshidratación también son causas de muerte. La supervivencia media es de tres a cinco años tras el diagnóstico, aunque casi un 10% de los pacientes pueden sobrevivir durante más de diez años (5,7).
ASPECTOS NUTRICIONALES
La ELA, como enfermedad neurológica degenerativa, tiene un importante impacto sobre el estado nutricional. En función de la definición de malnutrición utilizada, su prevalencia varía entre el 16 y el 55% (8). Por otro lado, la malnutrición en sí misma afecta negativamente a la fuerza muscular y la inmunidad, deteriorando el curso evolutivo de la enfermedad. La malnutrición es uno de los factores predictores independientes de la calidad de vida y de la supervivencia de los pacientes afectados por ELA (9).
Son muchos los factores implicados en la patogenia de la malnutrición (Tabla II) tanto en relación con la disminución de la ingesta (disfagia, hiporexia, sialorrea, depresión, etc.) o como consecuencia del incremento del gasto energético. Según algunos estudios la ingesta calórica es inferior a la necesaria en más del 70% de los pacientes (8)
La disfagia orofaringea es el principal determinante de la apa-rición de malnutrición en la ELA. Afecta a más del 80% de los
pacientes y puede aparecer en cualquier momento evolutivo, independientemente de la forma de inicio, aunque en la forma bulbar aparece como síntoma inicial (4,10). La ELA produce tanto afectación de la seguridad como de la eficacia de la deglución. En algunos casos el primer signo de disfagia es la pérdida progresiva de peso, pero lo más frecuente es que el paciente refiera episo-dios de atragantamiento y cambios en la voz después de comer. La seguridad de la deglución se ve agravada por la dificultad para toser y/o aclarar los restos de alimento que pueden quedar en la garganta (10).
La patogenia de la disfagia es multifactorial. La lesión de las neuronas del bulbo produce una descoordinación de la muscu-latura deglutoria. La afectación de la lengua también aparece precozmente y se manifiesta por dificultad para impulsar el bolo y manejar los líquidos. Asimismo, puede existir afectación de los maseteros ocasionando problemas para abrir la boca y trismus. La disfagia puede aparecer también como consecuencia del daño de las motoneuronas inferiores por debilidad de los músculos faríngeos, de la lengua, de la boca (sello labial) y de la muscula-tura masticatoria.
En la mayoría de los trabajos publicados, el gasto energético de los pacientes con ELA es superior al esperado. Alrededor del 50% presentan un aumento del gasto energético basal al diagnóstico, y de forma constante a lo largo de la enfermedad. La disfunción mitocondrial y el estado proinflamatorio podrían explicar, al menos en parte, el hipermetabolismo. A este incremento del gasto basal hay que añadirle un mayor consumo energético derivado del tra-bajo respiratorio, las fasciculaciones, infecciones de repetición, ventilación mecánica, etc. (8,11).
La sialorrea también constituye un problema importante en el proceso de alimentación y favorece las aspiraciones. Se produce por debilidad de la musculatura facial y faríngea que afecta a la deglución normal de la saliva (pseudohipersalivación).
Tabla I. Signos y síntomas en función de las motoneuronas afectadas
Neuronas motoras superiores (cortical)
Neuronas motoras inferiores (bulbar o
espinal)
Torpeza y lentitud Debilidad muscular
Espasticidad Atrofia muscular
Hiperreflexia Fasciculaciones
Reflejos patológicos Calambres
Labilidad emocionalHipotonía muscular e hiporreflexia
Tabla II. Factores causantes de malnutrición
Disfagia
Aumento del gasto energético consecuencia de: mayor trabajo respiratorio, fasciculaciones, infecciones de repetición, estado inflamatorio, etc.
Sialorrea
Disnea y episodios de desaturación al comer
Problemas en la manipulación de las herramientas y utensilios necesarios para la alimentación (preparación/administración)
Hiporexia/anorexia
Problemas en el mantenimiento de una postura correcta para comer
Problemas de vaciamiento gástrico
Estreñimiento
Depresión y ansiedad
Deterioro cognitivo y/o dificultad para expresar las necesidades

1245MANEJO NUTRICIONAL DE LA ESCLEROSIS LATERAL AMIOTRÓFICA: RESUMEN DE RECOMENDACIONES
[Nutr Hosp 2018;35(5):1243-1251]
La afectación de la musculatura de las manos y los brazos añade dificultad al proceso de alimentación (preparación de las comidas, manejo de los cubiertos, etc.). La debilidad del tronco y del cuello puede ocasionar problemas en la sujeción de la cabeza y el mantenimiento de la posición erecta.
El estreñimiento es frecuente. Además de causas dietéticas (reducción en la ingesta de fibra y agua) se ha demostrado que puede existir una dismotilidad cólica secundaria a la afectación del sistema nervioso autónomo. A medida que la enfermedad avanza, el retraso del vaciamiento gástrico puede provocar sacie-dad precoz, reflujo y problemas de tolerancia a la nutrición enteral.
VALORACIÓN NUTRICIONAL
Todas las sociedades científicas y documentos de consenso coinciden en que la valoración nutricional de los pacientes con ELA debe ser precoz y periódica, y no solo por la elevada pre-valencia de malnutrición de este tipo de pacientes, sino por el hecho de que la desnutrición es un factor predictor de mortalidad (3,4,10,12,13). Una pérdida de peso mayor del 5-10%, tanto en el momento del diagnóstico como a lo largo de la enfermedad, supone un incremento de un 30-50% en el riesgo de muerte. Por cada 5% de pérdida de peso se ha estimado un aumento del 14 al 30% en la probabilidad de morir (14). Asimismo, un índice de masa corporal (IMC) inferior a 18,5 kg/m2 incrementa el riesgo relativo de muerte y por cada punto de descenso de IMC el riesgo de morir aumenta entre un 9 y un 20% (9,12,14).
Por consenso, la valoración nutricional debe hacerse al inicio y cada tres meses e incluir datos básicos de peso, cálculo de sus variaciones, IMC y antropometría básica (3,12).
También debe incluirse un despistaje de disfagia que debe realizarse desde el diagnóstico de ELA, ya que en ocasiones ni el paciente ni la familia relatan espontáneamente sus síntomas. Se puede hacer despistaje con cuestionarios validados (EAT-10, por ejemplo) o bien utilizar cualquier método validado para el diag-nóstico de disfagia (test volumen-viscosidad, pruebas de imagen, videofluoroscopia, fibroscopia, etc.) (12).
Se deben recoger datos sobre la ingesta dietética, apeti-to, capacidad funcional y autonomía. Es esencial investigar las razones por las que el paciente ingiere menos de lo esperado, incluyendo datos sobre sus sentimientos al comer. El miedo a los atragantamientos y la angustia sustituyen frecuentemente al pla-cer de comer y deben ser tenidos en cuenta a la hora de prescribir el tratamiento nutricional (15).
Los parámetros bioquímicos de desnutrición (proteínas séri-cas, colesterol, ácido úrico, etc.) complementan el diagnóstico del estado nutricional y para algunos autores pueden ser utilizados como marcadores pronósticos (16,17).
La interpretación de los resultados de la antropometría básica y de los test de fuerza de prensión de la mano puede presentar ciertas limitaciones debido principalmente a dos factores: la afectación muscular de la ELA es heterogénea y compromete distintos grupos musculares que pueden, o no, verse involucra-dos en las mediciones. Por otro lado, la atrofia muscular puede
seguirse de un reemplazo de tejido graso. La bioimpedancia (BIA) es una técnica útil en la valoración de la composición corporal de los pacientes con ELA validada por Desport y cols. en 2003 (18). La realización de una BIA, tanto al diagnóstico como de forma periódica (cada 3-6 meses) (12), resulta útil además de para valorar la composición corporal, para estable-cer el pronóstico vital: la pérdida de masa libre de grasa y/o la reducción del ángulo de fase, aun en ausencia de pérdida de peso, se asocian con una menor supervivencia (19). Al igual que en otras enfermedades neurológicas degenerativas, la determi-nación periódica de la masa libre de grasa permite monitorizar la masa muscular y su relación con el gasto metabólico, la denervación y la actividad física. La calorimetría indirecta y la densitometría ósea (DEXA) también se han demostrado válidas, aunque su utilización es limitada.
REQUERIMIENTOS ENERGÉTICOS
Como se ha visto anteriormente, los pacientes con ELA sue-len presentar un aumento del gasto energético. La calorimetría indirecta, en caso de estar disponible, es el método más seguro para la medición del gasto energético basal (11,12). Cuando no se dispone de calorimetría, debe estimarse el gasto calórico cal-culando 30-34 kcal/kg para los pacientes en ventilación espon-tánea y 25-30 kcal/kg para pacientes con ventilación mecánica no invasiva. Existe controversia sobre la seguridad de utilizar las ecuaciones predictivas para el cálculo del gasto energético. Las ecuaciones de Harris Benedict y Mifflin-St Jeor son, para algunos autores, las más seguras (10), mientras que otros no las conside-ran fiables debido a la disparidad de resultados en comparación con los obtenidos mediante calorimetría, con variaciones que pueden oscilar ± 600 kcal (12).
No existen recomendaciones específicas sobre la cantidad de proteínas, aunque en función del estado nutricional pueden cal-cularse aportes de entre 0,8 y 1,5 g/kg/día (10,20,21).
En todo caso, tanto el aporte calórico como el proteico deben adaptarse a la evolución.
MANEJO NUTRICIONAL
La instauración de un tratamiento nutricional adecuado tiene como principal objetivo evitar la aparición de desnutrición y el incremento del riesgo de muerte que la acompaña. Sin embar-go, si bien resulta evidente que el estado nutricional empeora el pronóstico vital y la calidad de vida de los pacientes con ELA, por el momento no se puede afirmar que la instauración del tra-tamiento nutricional conlleve una mejoría de estos parámetros (3,10,13,22,23), habiendo incluso publicaciones que recogen una menor supervivencia en los pacientes tratados con nutrición enteral (24), si bien hay que destacar que en muchas ocasiones la nutrición enteral se había iniciado de forma tardía. Lo que parece ser un factor determinante es la pérdida de peso previa a la colocación de la gastrostomía (25).

1246 M. D. del Olmo García et al.
[Nutr Hosp 2018;35(5):1243-1251]
En cualquier caso, el soporte nutricional persigue mantener un correcto estado de hidratación y nutrición minimizando los riesgos de broncoaspiraciones, de modo que aunque no esté demostrado un aumento de la supervivencia, el tratamiento nutricional forma parte de todas las recomendaciones de las sociedades científicas y expertos en ELA (3,10,13,22,23). Las medidas dependerán del estado nutricional, del estado evolutivo de la enfermedad y de los factores predisponentes presentes en cada momento.
En el momento del diagnóstico, aun sin problemas nutricio-nales evidentes, es conveniente que el paciente reciba los con-sejos dietéticos necesarios para asegurar un aporte adecuado de nutrientes y empezar la concienciación sobre la importancia del mantenimiento de un correcto estado nutricional (26). Sin embargo, cuando existe disfagia, el consejo dietético resulta insu-ficiente y deben adoptarse las medidas adecuadas para facilitar la deglución y prevenir las aspiraciones. En las fases iniciales de la disfagia, además de modificarse la textura de los alimentos y los líquidos, es necesario recurrir a maniobras posturales y faci-litadoras de la deglución (10). El uso de herramientas adaptadas (cubiertos, vajilla, etc.) puede conseguir que el paciente mantenga su autonomía a la hora de comer (13).
El tratamiento sintomático de otros factores que interfieren con la alimentación, como la sialorrea, la depresión y las anomalías posturales, entre otros, también ayuda a mantener un correcto estado nutricional (10,27).
Cuando la disfagia progresa o no puede mantenerse el estado nutricional con la alimentación oral, es necesario recurrir a la nutrición enteral (NE).
Los suplementos orales nutricionales (SON) están indicados cuando el paciente es incapaz de cubrir sus requerimientos con la alimentación natural pero mantiene su capacidad deglutoria. Pue-den resultar útiles los suplementos con textura modificada en forma de líquido espeso o pudding, pero no existen recomendaciones sobre cuál debe ser su composición (13). Se han utilizado suple-mentos hiperproteicos, hipercalóricos con diferentes proporciones de carbohidratos y grasa, omega-3, etc. Los resultados de los tra-bajos que valoran la eficacia de la suplementación oral son escasos y heterogéneos, si bien la mayoría identifican un beneficio para el estado nutricional (mantenimiento de peso, menor pérdida de peso, etc.) y algunos, sobre la calidad de vida percibida (12,28,29).
Siempre que exista la suficiente seguridad, es importante man-tener un mínimo de alimentación oral. Pero a medida que progre-sa la enfermedad, se hace evidente la necesidad de aumentar el aporte de NE, llegando a sustituir a la alimentación natural. La decisión sobre la instauración de la NE y su vía de acceso debe tomarse de forma consensuada con el paciente y sus familiares, en un proceso continuo y abierto que comienza desde el diag-nóstico de la ELA y debe tener en cuenta varios factores (Tabla III). Los equipos multidisciplinares liderados por un especialista en Neurología y compuestos por neumólogos, dietistas, logo-pedas, psicólogos, psiquiatras, rehabilitadores y, por supuesto, especialistas en Endocrinología y Nutrición son fundamentales. Es nuestro deber participar en un debate sincero y realista sobre la evolución natural de la enfermedad y los deseos y expectativas del paciente (13). La gastrostomía percutánea de alimentación,
sus indicaciones, procedimiento y momento de colocación deben formar parte de este debate de forma precoz. El paciente debe estar informado sobre los riesgos del procedimiento en función de su situación de base, sabiendo que la morbimortalidad de la técnica se ve profundamente influida por el estado nutricional y la función respiratoria.
La recomendación generalizada es que la colocación de la gas-trostomía endoscópica percutánea (GEP) se realice antes de que la FVC caiga por debajo del 50%, incluso aunque en ese momento no existan problemas nutricionales ni datos de disfagia. La gas-trostomía radiológica percutánea (GRP) puede hacerse con FVC menores del 50% ya que requiere un menor grado de sedación (10,12,22). Sin embargo, recientemente se ha comprobado que la colocación de una GEP es factible y segura en manos expertas, aun con FVC inferiores a 50% (29-32).
Existen en la literatura defensores y detractores de cada una de las vías, endoscópica y radiológica. Debemos dejar atrás el concepto de que las GEP son más seguras y eficaces, y plantear la realización de una técnica u otra en función de la situación y los deseos del paciente, así como de las características de nuestro centro de trabajo (33,34).
Al igual que ocurre con la composición de los SON, no existen recomendaciones sobre el tipo de fórmula de NE más adecuada. En la gran mayoría de los trabajos se utilizan fórmulas hipercalóricas normo o hiperproteicas. Solamente existe un estudio prospectivo aleatorizado en 20 pacientes comparando una fórmula estándar con dos fórmulas hipercalóricas normoproteicas: rica en hidratos de carbono vs. rica en grasa (35). La tolerancia a la fórmula rica en hidratos de carbono resultó mejor que para las fórmulas isocalóri-ca y rica en grasa, pero no pueden identificarse otras diferencias clínicamente relevantes. Tampoco se ha estudiado suficientemente la necesidad de administrar fórmulas con fibra.
El uso de nutrición parenteral (NP) en los pacientes con ELA que-da reservado para aquellos en los que la NE esté contraindicada o sea imposible (10,12). La decisión sobre el inicio de NP domiciliaria como forma de soporte nutricional, al igual que en otras situaciones clínicas, debe tomarse teniendo en cuenta las causas por las que no se puede iniciar NE, los deseos del paciente, los riesgos y otros aspectos éticos que incluyen la relación coste/beneficio (12). Los estudios publicados son escasos y observacionales. Los pacientes que reciben NP lo hacen, en la mayoría de los casos, por impo-sibilidad de instaurar NE por gastrostomía debido a su situación
Tabla III. Indicaciones de gastrostomía y NE
Disfagia
Pérdida del 5-10% sobre el peso habitual
IMC < 20 kg/m2
Incapacidad para mantener un correcto estado nutricional o de hidratación con alimentación y suplementos orales
Imposibilidad de cumplimiento del tratamiento oral
Angustia y miedo a comer

1247MANEJO NUTRICIONAL DE LA ESCLEROSIS LATERAL AMIOTRÓFICA: RESUMEN DE RECOMENDACIONES
[Nutr Hosp 2018;35(5):1243-1251]
respiratoria de base. El beneficio, la tasa de complicaciones y la mortalidad en este tipo de pacientes con enfermedad avanzada parecen similares con NE por GEP o NP (36). Por otro lado, la limitación en la colocación de una GEP en función de la capacidad respiratoria podría reducirse mediante la colocación radiológica, la especialización del equipo y/o el uso de ventilación mecánica no invasiva durante el procedimiento (31,32), por lo que la NP quedará relegada a situaciones excepcionales.
Abdelnour-Mallet y cols. (37) han publicado los datos de NP domiciliaria en pacientes de centros franceses especializados en ELA. Entre 2005 y 2009 recibieron NP 73 pacientes, presentando complicaciones, infecciosas y metabólicas, en proporción similar a la descrita en la literatura para la NP domiciliaria en otro tipo de pacientes (37). Recientemente se ha comprobado la seguridad de la utilización de catéteres centrales de inserción periférica (PPIC) para la NP domiciliaria de pacientes con ELA avanzada en los que la NE estaba contraindicada (38). En la tabla IV se presenta un resumen de las recomendaciones nutricionales en pacientes con ELA.
CONSIDERACIONES ÉTICAS
La complejidad clínica de la ELA hace imprescindible su mane-jo multidiscipli nar, con la implicación de distintas espe cialidades médicas (principalmente neurólogos, neumólogos, nutricionistas, digestólogos y rehabilitadores), además de profesionales de enfer-mería, farmacéuticos, fisiote rapeutas, psicólogos y trabajadores sociales. La participación de las asociaciones de pacientes facilita y acompaña al paciente y su entorno en el duro proceso de acep-tación de la enfermedad.
La enfermedad no solo es compleja desde el punto de vista clínico, sino también desde un enfoque ético. Las decisiones a las que el paciente debe enfrentarse desde el mismo momento del diagnóstico obligan a que el médico maneje conceptos básicos de ética clínica y esté familiarizado con el proceso de provisión de la información (3,39,40). La forma y manera en la que se realiza este proceso de comunicación es de extrema importancia, ya que en gran medida de ello depende la dirección de las decisiones que el paciente toma. No debemos delegar la responsabilidad exclusiva de la decisión en el paciente o sus familiares, recitando las opciones de tratamiento sin involucrarnos en el proceso. La probabilidad de que las decisiones que se adopten sean las más adecuadas para el paciente en cada momento aumenta cuando favorecemos una relación dinámica médico-paciente en la que nuestra opinión cualificada interaccione con los deseos y expec-tativas del paciente, respetando la autonomía de ambos.
La información veraz, sencilla, clara y sincera sobre el curso de la enfermedad y su pronóstico es la base para que el paciente tome sus decisiones con autonomía. Cada nuevo síntoma enfrenta al binomio médico-paciente a una nueva coyuntura ética, en la que es necesario mantener en escena la inevitable pérdida de autonomía, el dolor y el sufrimiento que acompaña a la ELA y que afecta a la toma de decisiones (41). Ya que la ELA no tiene cura, la mayoría de los expertos recomienda adoptar una postu-ra más propia de la medicina paliativa en la que la interacción
médico-paciente se dirija a la consecución de la mayor calidad de vida posible.
El destinatario principal y primero de la información es el propio paciente. La participación de los familiares y cuidadores debe ser algo expresamente pactado con él y, por tanto, siempre algo simultáneo o posterior al proceso de información al paciente. No es éticamente aceptable informar a la familia antes que al pacien-te, excepto que exista una circunstancia justificada de forma rigu-rosa, explícita y clara. La libertad del paciente alcanza también a la propia decisión de tomar o no parte en el proceso de decisión, incluso a la voluntad de recibir o no información (39).
Respecto a los problemas éticos concretos del soporte nutri-cional, es necesario recordar que la decisión sobre el inicio de la NE o la colocación de una gastrostomía o de una sonda debe tomarse en un proceso sosegado y continuo, sin prisa ni angus-tia. Es todavía relativamente frecuente que las decisiones sobre el inicio de la ventilación artificial se hagan en una situación de emergencia que pone en peligro la vida del paciente. En nuestro caso, por el contrario, desde el momento del diagnóstico debe abrirse un espacio de comunicación en el que puedan discutirse las posibles opciones según el contexto evolutivo de la enferme-dad, basándonos en la evidencia clínica, y las recomendaciones científicas y en los deseos y preferencias del paciente. Un aspecto importante para esta relación de confianza y respeto es la nece-sidad que tiene el paciente de asegurarse de que puede aceptar o rechazar cualquiera de las medidas que se le propongan en un momento determinado, manteniendo su derecho legal y ético de cambiar su decisión en el futuro (41).
Es importante que quede registro en la historia clínica del paciente del proceso de información, de sus deseos, preferencias, así como de las decisiones que va adoptando. Aunque el proceso de consentimiento informado es básicamente verbal, pueden ser de utilidad los formularios escritos, siempre y cuando el paciente comprenda y acepte su utilidad y significado. Asimismo, debe considerarse la posibilidad de redactar un documento de instruc-ciones previas o de voluntades anticipadas en el que se detallen los programas de cuidados que el paciente desea durante la evo-lución de la enfermedad, manteniendo la posibilidad de cambiar de opinión y modificar su decisión sobre el inicio/suspensión del soporte vital, incluida la alimentación artificial. El representante nombrado por el paciente garantizará el cumplimiento de sus deseos.
En la tabla V se resumen algunas de las recomendaciones en las que debe basarse el proceso de información al diagnóstico de ELA pero que resultan útiles durante cualquier momento evo-lutivo (4).
CONCLUSIONES
La ELA es la más común de las enfermedades de la motoneu-rona. Con una incidencia en España cercana a un nuevo caso por 100.000 habitantes/año, no es muy habitual encontrarnos este tipo de pacientes en las consultas de Nutrición, por lo que contar con una guía de manejo resulta especialmente útil.

1248 M. D. del Olmo García et al.
[Nutr Hosp 2018;35(5):1243-1251]
Tabla IV. Preguntas clave en el manejo nutricional de los pacientes con ELA: resumen de recomendaciones nutricionales
Recomendaciones (grado de recomendación)Sociedad científica
¿Está indicado el soporte nutricional?
La pérdida de peso empeora la supervivencia, sin embargo, no está demostrado que el aumento de peso mejore el pronóstico vital de los pacientes con ELA (GPP - 95% de acuerdo)
ESPEN 2017
El objetivo del soporte nutricional depende de la situación de base:– En pacientes con IMC < 25 kg/m2 debe buscarse un aumento de peso– Para pacientes con IMC entre 25-35 kg/m2 el objetivo es el mantenimiento de peso– Los pacientes con IMC > 35 kg/m2 deben reducir peso para mejorar su movilización activa y pasiva (GPP - 95% de acuerdo)
ESPEN 2017
No existen estudios clínicos aleatorizados respecto al beneficio/daño de la NE en el soporte nutricional de los pacientes con ELA
Cochrane 2017
¿Cuándo y cómo debe realizarse una valoración nutricional?
Se recomienda la evaluación nutricional, incluido el cribado de disfagia, cada tres meses (GCPP) EFNS 2012
Se recomienda valoración nutricional (IMC y pérdida de peso) al diagnóstico y cada tres meses durante el seguimiento (B) ESPEN 2017
El estado nutricional y la existencia de disfagia deben valorarse en cada revisión AAN 2009/2014
Con el fin de mantener el estado nutricional en la mejor situación posible, debe hacerse una valoración periódica aun en ausencia aparente de síntomas sugestivos
Ministerio Sanidad 2016
En el momento del diagnóstico se recomienda una valoración nutricional que incluya IMC, cambios ponderales y perfil lipídico (B)
ESPEN 2017
Si está disponible, debe analizarse la composición corporal mediante DEXA y/o BIA validada, tanto al diagnóstico como durante el seguimiento (B)
ESPEN 2017
¿Cuáles son los requerimientos energéticos?
Si no se puede realizar una calorimetría, pueden estimarse los requerimientos calóricos utilizando 30 kcal/kg/día, adaptando el aporte según actividad física, evolución ponderal y cambios en la composición corporal (GPP - 100% de acuerdo)
ESPEN 2017
Los requerimientos calóricos para pacientes con ventilación mecánica, en ausencia de calorimetría, deben estimarse con 25-30 kcal/kg/día o mediante la ecuación de Harris-Benedict, adaptando el aporte a la evolución clínica y ponderal (GPP 0 - 95% de acuerdo)
ESPEN 2017
Para los pacientes con dificultad en su alimentación, representada por fatiga al comer o prolongación del tiempo de las comidas, se debe recomendar dieta fraccionada de alta densidad calórica. Si el paciente pierde peso deben indicarse suplementos orales (GPP - 95% de acuerdo)
ESPEN 2017
¿Debe realizarse despistaje de disfagia?
Debido a su alta prevalencia y a su repercusión sobre el estado nutricional y riesgo de broncoaspiraciones, el screening de disfagia debe implementarse en todos los pacientes (B)
ESPEN 2017
En el despistaje y diagnóstico de disfagia puede utilizarse cualquier método validado: cuestionarios, test de volumen viscosidad, técnicas de imagen y endoscopia (radiología, videofluoroscopia, videofluoromanometría) (B)
ESPEN 2017
Se debe tratar la disfagia de manera precoz asegurando un aporte calórico, y cuando se detectan signos de des nutrición puede proponerse de forma precoz la realización de una gastrostomía endoscópica percutánea, sin que ello suponga el abandono total de la ingesta por vía oral
Ministerio Sanidad 2016
Los pacientes con disfagia moderada deben recibir consejos sobre dieta adaptada y maniobras posturales encaminadas a proteger la vía aérea de las aspiraciones (GPP - 100% de acuerdo)
ESPEN 2017
¿Cuáles son las indicaciones de los suplementos orales nutricionales y la nutrición enteral?
Se deben indicar suplementos orales a los pacientes que no puedan cubrir sus requerimientos con una dieta enriquecida, a pesar de que no exista evidencia suficiente de que esta medida mejore la supervivencia (GPP - 100% de acuerdo)
ESPEN 2017
Se debe plantear la NE a todos los pacientes con ELA que no puedan cubrir sus requerimientos por vía oral, a pesar de que no está demostrado que la NE mejore la supervivencia ni la calidad de vida (B)
ESPEN 2017
La NE por gastrostomía prolonga la supervivencia (B) pero no ha podido demostrarse que influya en la calidad de vida AAN 2009/2014
(Continúa en la página siguiente)

1249MANEJO NUTRICIONAL DE LA ESCLEROSIS LATERAL AMIOTRÓFICA: RESUMEN DE RECOMENDACIONES
[Nutr Hosp 2018;35(5):1243-1251]
Tabla IV (Cont.). Preguntas clave en el manejo nutricional de los pacientes con ELA: resumen de recomendaciones nutricionales
Recomendaciones (grado de recomendación) Sociedad científica
¿Cuáles son las indicaciones y el momento para realizar una gastrostomía?
La gastrostomía de alimentación está indicada para pacientes con ELA que presenten problemas en la ingesta oral (B) AAN 2009/2014
La decisión sobre la colocación de una gastrostomía está justificada en base a estudios no aleatorizados Cochrane 2017
La decisión sobre la indicación y el momento de colocar una gastrostomía debe tomarse con el paciente mediante un proceso continuo, en el que se tengan en cuenta sus expectativas y deseos y se informe sobre los beneficios y riesgos de la técnica (GPP - 100% de acuerdo)
ESPEN 2017
El momento en el que se debe colocar una gastrostomía depende del paciente, su estado nutricional (pérdida del 10% de su peso), afectación bulbar y función respiratoria (GCPP)
EFNS 2012
Se recomienda la colocación precoz de la PEG (GCPP) EFNS 2012
No existe un momento preciso en el que se deba recomendar la colocación de la gastrostomía (B) AAN 2009/2014
No existe suficiente evidencia para determinar el mejor momento para colocar una gastrostomía Cochrane 2017
La gastrostomía de alimentación debe hacerse antes de que exista una pérdida de peso y/o un compromiso respiratorio severo (GPP - 100% de acuerdo)
ESPEN 2017
La PEG y la GR son igual de efectivas y tienen una tasa similar de complicaciones Cochrane 2017
Se recomienda preferentemente la vía endoscópica para la realización de la gastrostomía (0-97% de acuerdo) ESPEN 2017
La SNG puede utilizarse como vía de acceso a corto plazo cuando otra vía de NE no sea posible (GCPP) EFNS 2012
¿Está indicada la nutrición parenteral?
La NP puede utilizarse en ELA avanzada sin acceso para NE (GCPP) EFNS 2012
Si la NE está contraindicada o no es factible, puede indicarse la NPEn caso de que el paciente rechace la NE o de que esta no sea posible, debe considerarse la NP domiciliaria, teniendo en cuenta la relación riesgo/beneficio/coste y otros aspectos éticos (GPP - 100% de acuerdo)
ESPEN 2017
IMC: índice de masa corporal; NE: nutrición enteral; NP: nutrición parenteral; DEXA: densitometría ósea; BIA: bioimpedancia. EFNS Task Force 2012: GCPP (Good Clinical Practice), no existe evidencia pero sí un consenso claro entre los expertos de la EFNS. ESPEN 2017: grados de recomendación SIGN (A, B, 0). GPP: Good Practice Point, no existe evidencia pero sí un consenso entre los expertos de la ESPEN. Cochrane 2017: grados de evidencia y recomendación GRADE.
Tabla V. Recomendaciones en el proceso de comunicación del diagnóstico de ELA (modificado de Andersen 2012) (4)
Lugar Silencioso, confortable y privado
Estructura – En persona, cara a cara– Situación del médico cercana al paciente, manteniendo el contacto ocular– Dedicar un tiempo suficiente– Sin interrupciones externas
Destinatarios El paciente y las personas de confianza que él decida
Preparación – Debemos conocer con antelación la historia clínica del paciente, sus antecedentes familiares y su estructura de apoyo emocional
– Advertir de que se trata de malas noticias
Qué debemos decir
– Averiguar cuánto sabe el paciente sobre la ELA y qué quiere saber– Aportar la información de forma gradual, percibiendo las necesidades del paciente– Informar de forma real y honesta de que la enfermedad es incurable y progresiva, pero que el pronóstico es muy variable, con
supervivencias de entre cinco y diez años– Observar la reacción del paciente y de los demás participantes y permitirles que expresen sus emociones– Facilitar cualquier pregunta
(Continúa en la página siguiente)

1250 M. D. del Olmo García et al.
[Nutr Hosp 2018;35(5):1243-1251]
Tabla V (Cont.). Recomendaciones en el proceso de comunicación del diagnóstico de ELA (modificado de Andersen 2012) (4)
Lugar Silencioso, confortable y privado
Tranquilizar – Acompañar el sentimiento de lo devastador del diagnóstico, pero incluir frases esperanzadoras sinceras sobre la investigación de la enfermedad y la búsqueda de nuevos tratamientos
– Explicar que las complicaciones tienen tratamiento– Subrayar que se aplicarán las medidas necesarias para mantener la funcionalidad y la calidad de vida del paciente– Asegurar que tendrá el control sobre las decisiones del tratamiento, o sea, que podrá rechazar o aceptar los tratamientos que se
le propongan– Asegurar que se le facilitarán todos los cuidados hasta el final y que no se encontrará solo– Facilitar el contacto con asociaciones de pacientes– Discutir la posibilidad de participar en ensayos clínicos– Proponer una segunda opinión médica si el paciente lo sugiere
Cómo decirlo – Con cariño, respeto y empatía– Procurado evitar los sentimentalismos y paternalismos– Dar las noticias al ritmo que requiera el paciente: dejar que se exprese
Lenguaje Elegir palabras sencillas y directas, evitar eufemismos y términos médicos
Registro Resumir en la historia clínica la entrevista y la información aportada. Deben recogerse también la información que no ha podido aportarse y los motivos
La ELA afecta gravemente al proceso de alimentación y al esta-do nutricional. Está demostrado que la desnutrición, junto con la disminución de la FVC, es uno de los factores pronósticos de supervivencia más relevantes. Una pérdida de más del 5-10% de peso duplica el riesgo de muerte. De entre todos los factores que predisponen a malnutrición, la disfagia es el más importan-te. El cribado de malnutrición y el tratamiento apropiado deben implementarse de forma precoz, desde el mismo momento del diagnóstico, adelantándose a la aparición de la disfagia, la des-nutrición y la discapacidad.
Una de las cuestiones éticas fundamentales en el manejo de la ELA recae sobre la indicación de la realización de una gastrosto-mía de alimentación. En principio, al igual que respecto al soporte ventilatorio, es necesario plantear precozmente, prácticamente desde el diagnóstico, la necesidad de un tratamiento nutricional específico y la colocación de una vía de acceso segura para el mantenimiento de la alimentación. La decisión sobre la indicación y el momento de realizar una gastrostomía debe basarse en los deseos y expectativas del paciente tras haber sido expuestas las evidencias disponibles en cada momento. Actualmente, el riesgo de complicaciones de la gastrostomía en manos expertas es míni-mo, similar al de otras indicaciones, y depende fundamentalmente del estado nutricional y la función respiratoria del paciente.
Si bien es cierto que por el momento no se ha podido demostrar que el soporte nutricional mejore el pronóstico vital de los pacien-tes con ELA, su objetivo primordial debe ser el mantenimiento de un correcto estado de nutrición e hidratación. En este sentido, la NP domiciliaria debe plantearse de forma excepcional para los pacientes con ELA en los que no se pueda o deba indicar la NE, siguiendo los mismos protocolos éticos que en otras situaciones clínicas.
BIBLIOGRAFÍA
1. Elman LB, McCluskey L. Clinical features of amyotrophic lateral sclerosis and other forms of motor neuron disease. En: Uptodate. Eichler AF (ed.) 2018. Acceso enero 2018. Disponible en: http://www.uptodate.com/
2. Maragakis NJ, Gálvez-Jiménez N. Epidemiology and pathogenesis of amyo-trophic lateral sclerosis. En: Uptodate. Eichler AF (ed.). 2018. Acceso enero 2018. Disponible en: http://www.uptodate.com/
3. Ministerio de Sanidad, Servicios Sociales e Igualdad. Matías-Guiu Guía J, Gómez Pastor I, Martín Acero T (coord.). Estrategia en enfermedades neuro-lógicas del Sistema Nacional de Salud. Abril 2016.
4. Andersen PM, Abrahams S, Borasio GD, De Carvalho M, Chio A, Van Damme P, et al. EFNS Task Force on Diagnosis and Management of Amyotrophic Lateral Sclerosis: EFNS guidelines on the clinical management of amyotrophic lateral sclerosis. Eur J Neurol 2012;19(3):360-75.
5. Wang MD, Little J, Gomes J, Cashman NR, Krewski D. Identification of risk factors associated with onset and progression of amyotrophic late-ral sclerosis using systematic review and meta-analysis. Neurotoxicology 2017;61:101-30.
6. Elman LB, McCluskey L. Diagnosis of amyotrophic lateral sclerosis and other forms of motor neuron disease. En: Uptodate. Eichler AF (ed.). 2018. Acceso enero 2018. Disponible en: http://www.uptodate.com/
7. Chiò A, Logroscino G, Hardiman O, Swingler R, Mitchell D, Beghi E, et al; Eurals Consortium. Prognostic factors in ALS: a critical review. Amyotroph Lateral Scler 2009;10(5-6):310-23.
8. Genton L, Viatte V, Janssens JP, Héritier AC, Pichard C. Nutritional state, energy intakes, and energy expenditure of amyotrophic lateral sclerosis (ALS) patients. Clin Nutr 2011;30:553-9.
9. Marin B, Arcuti S, Jesus P, Logroscino G, Copetti M, Fontana A, et al.; French Register of ALS in Limousin (FRALim). Population-based evidence that sur-vival in amyotrophic lateral sclerosis is related to weight loss at diagnosis. Neurodegener Dis 2016;16(3-4):225-34.
10. Greenwood DI. Nutrition management of amyotrophic lateral sclerosis. Nutr Clin Pract 2013;28(3):392-9.
11. Kasarskis EJ, Mendiondo MS, Matthews DE, Mitsumoto H, Tandan R, Sim-mons Z, et al.; ALS Nutrition/NIPPV Study Group. Estimating daily energy expenditure in individuals with amyotrophic lateral sclerosis. Am J Clin Nutr 2014;99(4):792-803.
12. Burgos R, Bretón I, Cereda E, Desport JC, Dziewas R, Genton L, et al. ESPEN guideline clinical nutrition in neurology. Clin Nutr 2018;37:354-96. DOI: 10.1016/j.clnu.2017.09.003

1251MANEJO NUTRICIONAL DE LA ESCLEROSIS LATERAL AMIOTRÓFICA: RESUMEN DE RECOMENDACIONES
[Nutr Hosp 2018;35(5):1243-1251]
13. National Institute for Health and Care Excellence: Clinical Guidelines. Motor neurone disease: assessment and management. National Clinical Guideline Centre (UK). London: National Institute for Health and Care Excellence (UK); 2016.
14. Héritier AC, Janssens JP, Adler D, Ferfoglia RI, Genton L. Should patients with ALS gain weight during their follow-up? Nutrition 2015;1368-71.
15. Johnson J, Leigh PN, Shaw CE, Ellis C, Burman R, Al-Chalabi A. Eating-de-rived pleasure in amyotrophic lateral sclerosis as a predictor of non-oral feeding. Amyotroph Lateral Scler 2012;13(6):555-9.
16. Dorst J, Kühnlein P, Hendrich C, Kassubek J, Sperfeld AD, Ludolph AC. Patients with elevated triglyceride and cholesterol serum levels have a prolonged survival in amyotrophic lateral sclerosis. J Neurol 2011;258(4):613-7.
17. Zhang F, Zhang Q, Ke Y, Hao J, Lu L, Lu N, et al. Serum uric acid levels in patients with amyotrophic lateral sclerosis: a meta-analysis. Sci Rep 2018;8(1):1100.
18. Desport JC, Preux PM, Bouteloup-Demange C, Clavelou P, Beaufrère B, Bon-net C, et al. Validation of bioelectrical impedance analysis in patients with amyotrophic lateral sclerosis. Am J Clin Nutr 2003;77:1179-85.
19. Roubeau V, Blasco H, Maillot F, Corcia P, Praline J. Nutritional assessment of amyotrophic lateral sclerosis in routine practice: value of weighing and biolectrical impedance analysis. Muscle Nerve 2015;51:479-84.
20. Muscaritoli M, Kushta I, Molfino A, Inghilleri M, Sabatelli M, Rossi Fanelli F. Nutritional and metabolic support in patients with amyotrophic lateral scle-rosis. Nutrition 2012;28(10):959-66.
21. Piquet MA. Nutritional approach for patients with amyotrophic lateral sclero-sis. Rev Neurol (Paris) 2006;162 Spec No 2:4S177-4S187.
22. American Academy of Neurology. Update: the care of the patient with Amyo-trophic Lateral Sclerosis: drugs, nutritional and respiratory therapies. October 2009. Reaffirmed on April 30, 2014. Disponible en: www.aan.com
23. Kellogg J, Bottman L, Arra EJ, Selkirk SM, Kozlowski F. Nutrition management methods effective in increasing weight, survival time and functional status in ALS patients: a systematic review. Amyotroph Lateral Scler Frontotemporal Degener 2017;11:1-5.
24. McDonnell E, Schoenfeld D, Paganoni S, Atassi N. Causal inference methods to study gastric tube use in amyotrophic lateral sclerosis. Neurology 2017;89(14):1483-9.
25. Fasano A, Fini N, Ferraro D, Ferri L, Vinceti M, Mandrioli J. Percutaneus endoscopic gastrostomy, body weight loss and survival in amyotrophic lateral sclerosis: a population-based registry study. Amyotroph Lateral Scler Fronto-temporal Degener 2017;18(3-4):233-42.
26. Morassutti I, Giometto M, Baruffi C, Marcon ML, Michieletto S, Giometto B, et al. Nutritional intervention for amyotrophic lateral sclerosis. Minerva Gastroenterol Dietol 2012;58(3):253-60.
27. Ng L, Khan F, Young CA, Galea M. Symptomatic treatments for amyotro-phic lateral sclerosis/motor neuron disease. Cochrane Database Syst Rev 2017;1:CD011776. DOI: 10.1002/14651858.CD011776.pub2
28. Körner S, Hendricks M, Kollewe K, Zapf A, Dengler R, Silani V, et al. Weight loss, dysphagia and supplement intake in patients with amyotrophic lateral sclerosis (ALS): impact on quality of life and therapeutic options. BMC Neu-rology 2013;13:84-93.
29. Dorst J, Dupuis L, Petri S, Kollewe K, Abdulla S, Wolf J, et al. Percutaneous endoscopic gastrostomy in amyotrophic lateral sclerosis: a prospective obser-vational study. J Neurol 2015;262(4):849-58.
30. Czell D, Bauer M, Binek J, Schoch OD, Weber M. Outcomes of percuta-neous endoscopic gastrostomy tube insertion in respiratory impaired amyo-trophic lateral sclerosis patients under noninvasive ventilation. Respir Care 2013;58(5):838-44.
31. Banfi P, Volpato E, Valota C, D’Ascenzo S, Alunno CB, Lax A, et al. Use of noninvasive ventilation during feeding tube placement. Respir Care 2017;62(11):1474-84.
32. Kak M, Issa NP, Roos RP, Sweitzer BJ, Gottlieb O, Guralnick A, et al. Gas-trostomy tube placement is safe in advanced amyotrophic lateral sclerosis. Neurol Res 2017;39(1):16-22.
33. Katzberg HD, Benatar M. Enteral tube feeding for amyotrophic lateral sclero-sis/motor neuron disease. Cochrane Database Syst Rev 2011;(1):CD004030. DOI: 10.1002/14651858.CD004030.pub3
34. McDermott CJ, Shaw PJ, Stavroulakis T, Walters SJ, Al-Chalabi A, Chan-dran S, et al. Gastrostomy in patients with amyotrophic lateral sclerosis (ProGas): a prospective cohort study. ProGas Study Group. Lancet Neurol 2015;14(7):702-9.
35. Wills AM, Hubbard J, Macklin EA, Glass J, Tandan R, Simpson EP, et al. Hypercaloric enteral nutrition in patients with amyotrophic lateral sclero-sis: a randomised, double-blind, placebo-controlled phase 2 trial. Lancet 2014;383(9934):2065-72.
36. Verschueren A, Monnier A, Attarian S, Lardillier D, Pouget J. Enteral and parenteral nutrition in the later stages of ALS: an observational study. Amyo-troph Lateral Scler 2009;10(1):42-6.
37. Abdelnour-Mallet M, Verschueren A, Guy N, Soriani MH, Chalbi M, Gordon P, et al. Safety of home parenteral nutrition in patients with amyotrophic lateral scle-rosis: a French national survey. Amyotroph Lateral Scler 2011;12(3):178-84.
38. Juntas-Morales R, Pageot N, Alphandéry S, Camu W. The use of peripherally inserted central catheter in amyotrophic lateral sclerosis patients at a later stage. Eur Neurol 2017;77(1-2):87-90.
39. González-Meneses López A, Benavides Vílchez J, Fernández de la Mota E, Fernández López R, García García A, García Roldan P, et al. Plan de atención a personas con enfermedades raras. Junta de Andalucía. Consejería de Salud; 2015. Disponible en: http://www.juntadeandalucia.es/salud/sites/csalud/con-tenidos/Informacion_General/c_1_c_6_planes_estrategias/plan_de_aten-cion_a_personas_afectadas_por_enfermedades_raras
40. Connolly S, Galvin M, Hardiman O. End-of-life management in patients with amyotrophic lateral sclerosis. Lancet Neurol 2015;14(4):435-42.
41. Johnston WS, Hoskins K, McCluskey L. Amyotrophic lateral sclerosis: ethical challenges. Neurology 2011;76(7 Suppl 2):S1-S5

NutriciónHospitalaria
ISSN (electrónico): 1699-5198 - ISSN (papel): 0212-1611 - CODEN NUHOEQ S.V.R. 318
In Memoriam
Pilar Marco Garde (1944-2018)Jesús M. Culebras1 y Abelardo García de Lorenzo2
1De la Real Academia de Medicina y Cirugía de Valladolid. Presidente de Honor de la SENPE. Director Honorario de Nutrición Hospitalaria. Director de Journal of Negative and No Positive Results. acProfesor Titular de Cirugía. 2acCatedrático de Medicina Crítica y Metabolismo-UAM. Jefe de Servicio de Medicina Intensiva. Hospital Universitario La Paz-Carlos III/IdiPAZ. Presidente de la Fundación SENPE. Académico de Honor de la Academia Española de Nutrición y Dietética
Ha fallecido el 1 de agosto de 2018 Pilar Marco Garde, la primera Jefa de Servicio de Medicina Intensiva de España. Pilar nació en Caparroso (Navarra). Contaba con gracia, tipificando el carácter de sus paisanos que, siendo como eran muy devotos del patrón del pueblo, cuando el agua de lluvia se retrasaba más de la cuenta, amenazaban con tirarlo al río. Estudió Bachillerato en San Sebastián y la licenciatura en Medicina en Zaragoza. Se especializó en Medicina Intensiva junto al Prof. Aguado Matorras en el Servicio de Medicina Intensiva del Hospital Universitario La Paz de Madrid.
Obtuvo el grado de Doctor por la Universidad Autónoma de Madrid. Cuando Pilar leyó la tesis doctoral, algunos amigos nos acercamos para ver su exposición y defensa. Nuestra sorpresa fue que cuando llegó el presidente del tribunal, Juan Martínez López de Letona, abrió la sesión diciendo de forma autoritaria: “¡Lea usted las conclusiones!”. El acto académico concluyó en pocos minutos. Afortunadamente, obtuvo la máxima calificación.
En el año 1979 accedió a la plaza de Jefa de Servicio por oposición en el actual Hospital Universitario Donostia. Su gestión brillante le permitió hacer un servicio de medicina intensiva dis-tribuido en tres áreas que fue de lo más elegante y aparente del país, con vistas espectaculares.
En los años difíciles de la lucha contra ETA, Pilar supo gestionar muy bien la atención a los no pocos presos, alguno de ellos con alto cargo, que de la organización terrorista desfilaron por su servicio. Hablaba con ellos largamente, siempre con cien ojos y oídos porque era consciente de que podía haber personal de su propio servicio simpatizante o adscrito a ETA. En alguna ocasión quiso intuir que sus razonamientos hacían mella en la filosofía y en las convicciones de alguno de ellos. Pilar dirigió el servicio hasta su jubilación en 2015.
Siendo como era una experta en Metabolismo y Nutrición, tuvo mucha vinculación con SENPE, y era respetada y querida por los intensivistas de nuestra sociedad aunque nunca accediera a cargos directivos. De hecho participó en una de las tres mesas redondas de la Primera Reunión Nacional de la SENPE celebrada
en Bilbao en el lejano mes de mayo de 1979 (1), siendo ya flamante Jefa de Servicio de Medicina Intensiva. La mesa redonda “Nutrición parenteral en el enfermo crítico” fue moderada por Javier Zaldumbide (Miembro de Honor de SENPE, fallecido hace dos años) de Bilbao, que era también secretario de aquella reunión. Los demás ponentes de la mesa redon-da eran, Abelardo García de Lorenzo de Bilbao, Juan Gómez Rubí de Mur-cia, Antonio Garijo de Málaga, Vicente Bixquert de Murcia y Félix Lenguas de Madrid.
Participó activamente en el Manual de Medicina Intensiva edi-tado por Montejo y García de Lorenzo, que ya va por su séptima edición. De hecho ha sido coeditora del mismo en alguna de las ediciones anteriores.
Pilar fue miembro de diversas asociaciones científicas de ámbito estatal, europeo y americano, en las que participó muy activamente. Fue miembro de comisiones técnicas asesoras del Servicio Vasco de Salud; participó en el consejo asesor de Euskadi de enfermedades cardiovasculares y en el Comité de Trasplantes del País Vasco. Fue codirectora del Máster de Urgencias y Emer-gencias de la Universidad del País Vasco e investigadora principal en diferentes trabajos relacionados con las enfermedades cardia-cas, con numerosas publicaciones en revistas científicas de su especialidad. Presidió diversos congresos nacionales y despidió su vida laboral en 2015 presidiendo el Congreso de Medicina Intensiva celebrado en el Palacio Kursaal de San Sebastián.
En uno de los cursos recientes de postgrado organizados en la Cristalera, edificio sito en Miraflores de la Sierra propiedad de la Universidad Autónoma de Madrid, dijo: “El diagnóstico y el trata-miento del paciente crítico en los servicios de medicina intensiva pasa por conocer su composición corporal y los procesos meta-bólicos y nutritivos en las fases de estrés. No es casualidad que
©Copyright 2018 SENPE y ©Arán Ediciones S.L. Este es un artículo Open Access bajo la licencia CC BY-NC-SA (http://creativecommons.org/licenses/by-nc-sa/4.0/).
Culebras JM, García de Lorenzo A. Pilar Marco Garde (1944-2018). Nutr Hosp 2018;35(5):1252-1253

1253IN MEMORIAM
[Nutr Hosp 2018;35(5):1252-1253]
muchos de los jefes de servicio de Medicina Intensiva de nuestro país hayan desempeñado labores destacadas en la SENPE. Pongo por ejemplo a Tomas Caparrós de la Fundación Jiménez Díaz, Ser-gio Ruiz Santana del Hospital Insular de Las Palmas, Juan Carlos Montejo del Hospital 12 de Octubre de Madrid, Abelardo García de Lorenzo del Hospital Universitario La Paz y muchos otros.”
Tras su jubilación, Pilar Marco ha dedicado sus esfuerzos hacia el voluntariado, formando parte de los gestores de la Fundación Aubixa, para dar impulso a la concienciación social sobre el enve-jecimiento y, dentro de él, sobre la enfermedad de Alzheimer y otras demencias. Como Presidenta de esta Fundación lideró el objetivo de hacer frente al reto del envejecimiento y las demencias.
Pilar Marco era una mujer inteligente, tenaz y justa, lo que le valió el cariño y el respeto de sus amigos, de sus colaboradores y de sus subalternos. Transmitimos nuestras condolencias a su marido, Eduardo Aguado, a su hija María y a sus nietos Carmen, Javier y Lucía.
Descanse en paz.
BIBLIOGRAFÍA
1. Primera Reunión Nacional de la Sociedad Española de Nutrición Paren-teral y Enteral. Bilbao 25 y 26 de mayo de 1979. Boletín de SENPE 1979;1(1):21-4.