Department Application Silver Award Department of Applied ...
142
Department Application Silver Award Department of Applied Sciences, UWE Bristol April 2020
-
Upload
khangminh22 -
Category
Documents
-
view
1 -
download
0
Transcript of Department Application Silver Award Department of Applied ...

Department Application Silver Award
Department of Applied Sciences, UWE Bristol April 2020

2
Contents Page
1. Letter of endorsement 4
2. Description of the department 7
3. Self-assessment process 11
4. Picture of the department 21
5. Supporting and advancing women’s careers 54
6. Case studies 101
7. Further information 105
Abbreviations
Associate Head of Department AHOD
Academic Personal Tutor APT
Academic Workload Model AWM
Biological, Environmental Sciences, and Science Communication
BESSC
Black and Minority Ethnicity BAME
Centre for Research in Biosciences CRIB
Department of Applied Sciences DAS
Department Leadership Team DLT
Employee Self Service/Manager Self Service ESS/MSS
Equality, Diversity and Inclusion EDI
Forensic, Analytical and Chemical Sciences FACS
Full Time/Person Equivalent FTE/FPE
Head of Department HOD
Higher Education Innovation Funding HEIF
Human and Biomedical Sciences HUBS
Joint Academic Coding System JACS
Learning Development Centre LDC
Personal Development Review PDR
Research, Business and Innovation RBI
Research Excellence Framework REF
Science Communication Unit SCU
Terms of Reference TOR
Unit of Assessment UOA
Workload Bundle WLB
Women Researchers Mentoring Scheme WRMS

3
Name of institution UWE Bristol
Department Applied Sciences
Focus of department STEMM
Date of application April 2020
Award Level Silver
Institution Athena SWAN award
Date: April 2017 Level: Bronze
Contact for application Must be based in the department
Dr Clare Wilkinson, Associate Professor
Email [email protected]
Telephone 0117 32 82146
Departmental website http://www1.uwe.ac.uk/hls/bbas
Data Sources
Data in this submission includes material from the latest datasets provided to the Self-Assessment Team (SAT) at the time of application.
Student Data
Student data is presented as Full Person Equivalent (FPE) and by academic year.
The SAT have benchmarked all student data against the 2017/18 Alliance Universities HEIDI data for JACS subject area v3 and the 2017/18 data for all Universities HEIDI data for JACS subject area v3, where available.
Staff Data
Staff data is presented as headcount or incidences and this is indicated when relevant.
The majority of staff data is presented by academic year, but for some data it is taken from a census point which reflects calendar year, this is indicated in Tables and Figures.
Benchmarking data is ECU benchmarking data 2017-18 based on all science subjects.
We would like to thank Kimberly Scott, Frances Bathurst, Fiona Hamilton, and Evanthia Triantafyllidou in assisting to provide data for this application. We would also like to thank members of the self-assessment team, past and present, our internal and external reviewers, and staff and students in the Department for their contributions to this application.
1. LETTER OF ENDORSEMENT FROM THE HEAD OF DEPARTMENT
Silver: 462 words
An accompanying letter of endorsement from the head of department should be
included. If the head of department is soon to be succeeded, or has recently taken up the
post, applicants should include an additional (200 words) short statement from the
incoming head.

4
Department of Applied Sciences UWE Bristol
Coldharbour Lane Bristol
BS16 1QY United Kingdom
Equality Challenge Unit First Floor, Westminster Tower 3 Albert Embankment London SE1 7SP 29th April 2020
Dear Equality Charters Manager,
Since becoming Head of Department in 2016 and simultaneously joining our self-assessment team, I have made a personal and public commitment to advancing gender equality using the Athena SWAN Framework. I am delighted to support our Silver Application.
Over the last 4 years, we have continued to keep Athena SWAN engagement high on our priorities and see positive engagement through;
Gender equality discussions at Department annual away days and during Department meetings
Increased participation in surveys to 74% and awareness of our gender equality initiatives to 85%, promoting Athena SWAN at student Open Days and when welcoming new students
92% of staff have engaged with equality and diversity training
99% of staff report flexibility in their working patterns.
I am proud of the impacts we have achieved in the last four years;
1. Through our work analysing and assessing our staff journey from recruitment to promotion, we have increased female applicants to 43% and females are now more likely to be shortlisted (25% females, 19% males) and offered (10% females, 8% males) an academic post.
2. We have invested in leadership training and since 2016, I have supported 6 female staff to complete mentoring schemes, including the UWE REACH programme and LFHE Aurora Leadership course.
3. I have restructured the Department’s core leadership team and now six of the eight Associate Heads of Departments/Deputy Head/Research Centre Directors are female.
4. Reaching gender equality (52% females, 48% males) for Postgraduate Research students.
We recognise there is more to do and our priorities in our next action plan include;
Working with our female staff to plan and support their career progression to improve our gender ratios at Associate Professor and Professor grades via our mentoring schemes and through productive appraisals

5
Growing female appointments at Grades G (Lecturer/Research Fellow) and H (Senior Lecturer/Senior Research Fellow)
Maintaining good levels of female student recruitment on programmes, and addressing gaps in male recruitment and degree performance where underrepresentation is identified
Harnessing ideas and feedback from our student body and increasing their engagement with Athena SWAN.
To maintain momentum, I have structured the core of the Departments future strategy ‘Science 2030’ to focus on ‘Our People’ and within this included our gender equality priorities. In doing so, as well as continuing our work with academic staff and students, we will increase our engagement with professional and technical staff and have a continued focus on the intersectionality of gender with ethnicity. Working with the whole Department, the self-assessment team and through our action plan, I am confident that we will continue to progress gender equality.
I confirm that the information in this application (including qualitative and quantitative data) is an honest, accurate and true representation of the Department.
Yours sincerely
Dr Lyn Newton
Head of Department

6
< Information removed for confidentiality reasons >

7
2. DESCRIPTION OF THE DEPARTMENT
Silver: 453 words
Please provide a brief description of the department including any relevant
contextual information. Present data on the total number of academic staff,
professional and support staff and students by gender.
The Department of Applied Sciences (DAS) is one of four Departments within the
Faculty of Health and Applied Sciences at UWE Bristol, based at UWE’s Frenchay
Campus. The underlying ethos of DAS is to use and apply science to improve quality of
life and help society, and this permeates throughout all our programmes and research
activities. The Department has an excellent reputation for the quality of its teaching and
accreditation from external bodies such as the Chartered Society of Forensic Sciences,
Institute of Biomedical Sciences and Institution of Environmental Sciences.
Research, knowledge exchange and impact are fundamental to the Department and
DAS hosts the Centre for Research in Biosciences (CRIB). It also co-hosts the Institute of
Bio-sensing Technology (IBST) and the Science Communication Unit (SCU), which are
cross-Faculty. Since 2016, the Department has generated over £5 million in external
research funding.
Figure 2.1: Department of Applied Sciences Overview
Institute of Bio-sensing Technology
(shared with Faculty of Environment and
Technology FET)
Prof. Richard Luxton (M)
Prof. Janice Kiely (F) (FET)
Department of Applied Sciences
Head of Department
Deputy Head of Department
Dr Lyn Newton (F)
Quality and Field Leader AHoD
Dr Sarah Bateman
(F)
Human and Biomedical and Sciences AHoD
Dr Karina Stewart (F)
Forensic, Analytical and
Chemical Sciences AHoD
Dr Antony Hill (M)
Biological, Environmental Sciences and
Science Communication
AHoD
Dr Katy Ling (F)
Research and Knowledge
Exchange AHoD
Prof. John Hancock (M)
Centre for Research in Biosciences
Prof. Aniko Varadi (F)
Prof. Dawn Arnold (F)
Science Communication Unit
(shared with Faculty of Environment and Technology FET)
Dr Clare Wilkinson (F)
Dr Emma Weitkamp (F)
Technical Staff/University Professional Staff
Michelle Hickman (F)/ David Corry (M)
Dr Helen
Green (F)

8
DAS works over three subject areas, Human and Biomedical and Sciences (HUBS),
Forensic, Analytical and Chemical Sciences (FACS) and Biological, Environmental
Sciences and Science Communication (BESCC). As a snapshot, in 2018/19, 114 (48%
female, 52% male) staff were employed within the Department. 6% (57% female, 43%
male) of staff were BAME, increasing from 3% (75% female, 25% male) in 2014 and we
aim to increase the diversity of our staff in future years.
Table 2.1: Percentage and Number of Staff (Headcount) 2018/19
2018/19
Fem
ale
n
Fem
ale
%
Mal
e n
Mal
e %
Teaching and Research Staff 28 38% 45 62%
Research Only Staff 8 80% 2 20%
Teaching Only (Associated Lecturers) 6 50% 6 50%
Technical Staff 6 50% 6 50%
Professional Services 6 100%
Senior Management 1 100%
TOTAL 55 48% 59 52%
DAS works with experienced technical staff, who are employed and managed at Faculty
level, as well as a range of experienced professional staff who operate as a centralised
University service. For the purpose of Athena SWAN, the SAT identify key technical
team and professional services members with a designated relationship to the
Department (Table 2.1).
Where possible we have incorporated data from the technical and professional services
staff within this application, and locally all such associated staff have been invited to
self-select to participate in Athena SWAN activities, for example via staff surveys (an
additional 21 technical staff, and 17 professional staff) and as members of the SAT.
However, DAS does not line manage technical and professional staff. We work with
managers of these teams to ensure these staff benefit from our gender equality
actions.
In 2018/19, the Department delivered a portfolio of science programmes (1 foundation,
13 undergraduate (UG), 4 postgraduate taught (PGT) and 2 postgraduate research
(PGR)) which allow for multidisciplinary working and encourage a problem-solving
mindset (Figure 2.2)
In 2018/19 the total number of students within the Department was 1,925 (FPE),
comprising 59% (n=1,129) female students and 41% male (n=796) (Table 2.2), a 9%
increase in females from our 2016 application. Recruitment of female students at
foundation, undergraduate, postgraduate taught and postgraduate research level is

9
exceeding or on par with national averages, as well as those amongst the University
Alliance, of which UWE is a member.
Figure 2.2 DAS Programmes 2018/19
Table 2.2: Percentage and Number of Students (FPE) 2018/19
2018/19
Fem
ale
n
Fem
ale
%
Mal
e n
Mal
e %
Foundation Courses 88 55% 72 45%
Undergraduate 872 58% 619 42%
Postgraduate Taught 138 66% 70 44%
Postgraduate Research 31 47% 35 53%
TOTAL 1,129 59% 796 41%

10
Figure 2.3: Frenchay Campus, Library and Laboratories

11
3. THE SELF-ASSESSMENT PROCESS
Silver: 1279 words
(i) a description of the self-assessment team
Table 3.1 Self-Assessment Team Action Progress and Impacts
Since our Athena SWAN Bronze 2013 and 2016 we have:
Increased student representation, including input from undergraduate, postgraduate taught and postgraduate research students.
Annually reviewed SAT membership, diversifying its intersectionality, caring responsibilities, and improving the gender balance.
As a result, reporting to the SAT has increased and we have a waiting list for membership, demonstrating pro-active departmental support.
Our Athena SWAN self-assessment team (SAT) (Table 3.2) comprises 17 members,
reflecting the size and complexity of the Department (Figure 3.1) and has expanded to
provide greater departmental reach, improve the gender balance and diversity in terms
of intersectionality. Representatives have a defined role and designated responsibilities
in our action plan.
Our expanded membership includes undergraduate student representation and more
staff from technical/professional services. In 2017/18 we connected our postgraduate
research representative to postgraduate taught student reps, ensuring PGT issues are
reported.
Membership of the SAT is reviewed annually, and staff join voluntarily via an expression
of interest. Since 2017, we have had a membership waiting list, with 35% (n=6) of our
current membership participating in our 2016 application.
Since 2015/16 the Department has provided 3 workload bundles (WLB), equivalent to
one day annually, for SAT staff members. The University subsequently introduced
guidance for Departments on WLB allocation, and an annual budget. In 2018/19 DAS
added additional WLB and budget, beyond this recommendation, evidencing its
commitment to gender equality.

12
Table 3.2 Self-Assessment Team
Name and Gender Departmental/Faculty Role/Career
Path/Circumstances
Role on SAT
Jackie
Barnett (F)
Research Fellow in Virology and Biosensors.
Fixed-Term, Research. Caring responsibilities.
Research Fellow Representative
*New member 17/18
Farhan
Cheema
EDI Strategy Manager. Permanent,
Professional Services. Caring responsibilities.
EDI representative
*New member 17/18
Sarah
Dean (F)
Senior Lecturer in Biomedical Science.
Permanent, Teaching and Research. Caring
responsibilities.
Senior Lecturer Representative
*New member 17/18
Alison
Halliday
(F)
Technician and Radiation Protection
Supervisor. Permanent, Technical Staff. BSc
from UWE. 0.8 FTE. Caring responsibilities.
Technical Team Representative
John
Hancock
(M)
Professor and Associate Head of Department.
Promoted in 2016. Permanent, Teaching and
Research. Caring responsibilities.
AHoD/Research Representative
Antony Hill
(M)
Deputy Head of Department. Promoted in
2017. Permanent, Teaching and Research.
Deputy Head of Department
Working Group Participant
*New member 17/18
Debbie
Lewis (F)
Molecular Biology and Immunology Technician.
Permanent, Technical Staff. Caring
responsibilities.
Technical Team Representative
Working Group Participant
*New member 17/18
Hannah
Little (F)
Senior Lecturer in Science Communication and
DAS Public Engagement lead. Promoted in
2019. Permanent, Teaching and Research.
Early Career Academic Representative
*New member 18/19
Lyn
Newton (F)
Head of Department of Applied Sciences.
Promoted from AHoD in 2016. Permanent,
Senior Management. Caring responsibilities.
Head of Department
*New member 16/17
Jen May
(F)
Senior Lecturer in Biomedical Science. 0.6FTE.
Promoted in 2014. Permanent, Teaching and
Research. Caring responsibilities.
Part-Time academic staff representative
Working Group Participant
*New member 18/19
Postgraduate Research Student and Student
Representative. < Information removed for
confidentiality reasons >
PG/PhD student Representative
*New member 18/19

13
Martina
Piano (F)
Research Fellow Institute of Bio-sensing
Technology, previously PhD student at UWE.
Permanent, Research.
International Representative
*New member 18/19
Jan
Richardson
(F)
Faculty Business Manager and Equality and
Diversity Representative. PGCert in
Management at UWE. Permanent, Professional
Services. Caring responsibilities.
Professional Services Representative
Gareth
Robinson
(M)
Senior Lecturer/Programme Leader for
Biological Sciences. MSc/PhD at UWE.
Promoted in 2013. Permanent, Teaching and
Research. Caring responsibilities.
Open Days and Marketing
Representative
Undergraduate student and student
representative. < Information removed for
confidentiality reasons >
Undergraduate Student Representative
*New member 18/19
Clare
Wilkinson
(F)
Associate Professor and Co-Director of the
Science Communication Unit. Promoted in
2014. Permanent, Teaching and Research.
SAT Lead
Working Group Participant
Jane
Wooster
(F)
Professional Services Administrator. 0.64 FTE.
Permanent, Professional Services. Caring
Responsibilities.
Professional Services Representative
and SAT support
*New member 18/19
Figure 3.1 SAT Representation
59%, n=10, Academic staff
12%, n=2 Students
17%, n=3, ProfessionalServices staff
12%, n=2, Technical staff

14
(ii) an account of the self-assessment process
Table 3.3 Self-Assessment Process Action Progress and Impacts
Since our Athena SWAN Bronze 2013 and 2016 we have:
Increased meetings to bi-monthly, and monthly in the six months prior to application.
Launched our 2019 staff survey at a Departmental Away Day, sharing a weekly results summary to encourage completion.
Continued to communicate about our work internally and externally (locally, nationally and internationally).
Used our reporting channels to influence/lobby Faculty and University gender equality actions.
As a result, response rates to the staff survey increased to 74% from 50% in 2016, and awareness of gender equality initiatives in the Department increased to 85% (from 81% in 2016).
Since our 2016 application, we have increased SAT meetings to develop actions on the
basis of the action plan and ascertain feedback from SAT representatives, allowing for
prompt actions for local issues.
Our SAT meeting format, encourages a collaborative environment, including a bi-annual
review of action plan progress and available data. The meeting style is informal, so
members at all career and study stages can contribute.
Figure 3.2 SAT Team meetings

15
In 2017/18 we created SAT working groups. These focussed on actions associated to
staff recruitment and progression (2017/18) and student recruitment and progression
(2018/19). Information on outcomes is provided in Section 4.1 and 5.1(i) as well as our
action plans.
Beyond the SAT we have increased communication regarding Athena SWAN. News is
shared in Sci Bytes (a Department newsletter), and at Department Forums (an open
forum for all staff) and the annual Department Away Day. We continue to develop our
website featuring case studies, infographics and external links, and use social media
(Figure 3.4). In 2017/18 we developed a banner for events and open days, as well as
postcards which are used at Department events internally and externally, and these
have been replicated by other Departments (Figure 3.5).
Figure 3.3 SAT Communication channels
Department
•Sci Bytes (Department Newsletter, 3 per year) STAFF ONLY
•Science Matters (Department Magazine, print and online) STAFF AND STUDENTS
•Department Forum and Annual Away Day STAFF AND PGR STUDENTS
•Website, posters, banners, and postcards STAFF, STUDENTS AND FUTURE STUDENTS
University
•Weekly News (University weekly email) STAFF ONLY
•University Conferences and Events STAFF AND STUDENTS
•Website STAFF AND STUDENTS
External
•Conferences, Events (e.g. open days) and Publications STAFF, STUDENTS (INC. FUTURE) AND EXTERNAL
•Website STAFF, STUDENTS (INC. FUTURE) AND EXTERNAL
•Social Media STAFF, STUDENTS (INC. FUTURE) AND EXTERNAL

16
Figure 3.4 Athena SWAN Social Media examples
Figure 3.5. Athena SWAN Banner, Posters and Postcards
Since 2013 Athena SWAN has been a standing item at DAS student and staff
committees and groups, embedding actions in Department, Faculty and University
processes. Application outcomes are presented to the Faculty Executive (January 2018
and forthcoming) and we collaborate with the Faculty Equality, Diversity and Inclusivity
<Image removed>
<Image removed>

17
(EDI) Task Force, with DAS’s plans to achieve a Silver Award included as an integral part
of the Faculty’s Equality, Diversity and Inclusion Action Plan.
Figure 3.6 SAT Reporting channels
Our staff and student consultation process has expanded. In 2019 we repeated our staff
survey (including academic staff, associate lecturers, technical and professional staff),
PGR and UG Level 2 surveys.
Response rates to our staff survey increased to 74% (n=111, 56% female, 42% male)
from 50% in 2016, and results were shared at a Department Forum, allowing all staff to
contribute to the 2020 action plan. An externally facilitated staff focus group and
Associate Lecturer’s focus group garnered further qualitative insights on which to base
the application and action plan. Infographics on the survey findings were shared with
the Department, via social media and the website.
Figure 3.7 Recommendations from staff for the 2020 action plan
•SAT Meetings
• Extended Executive (Standing Item)
•Department Leadership Team (Standing Item)
Department
• Faculty Executive
• Faculty Board
• Faculty Equality, Diversity and Inclusivity Task Force
Faculty • Athena SWAN Collaborative Group (Standing Item)
• University Athena SWAN Steering Group
University

18
Figure 3.8 Survey Result Infographics
Response rates to a PhD/professional doctorate survey increased modestly to 22% (20%
in 2016) and there was some uptake of an UG level 2 survey. However, our student
focus group failed to recruit participants, and we are reviewing student engagement.
Additional feedback mechanisms include a staff feedback box introduced in 2017,
where issues that relate to gender equality are actioned at the SAT. The facilitator of
Faculty initiated BAME Student Voice Cafés, also shares issues pertinent to gender
equality with the SAT.
Members of the SAT participate in the UWE Athena SWAN Collaborative group, sharing
best practice to all Departments engaged in Athena SWAN, and the University Athena
SWAN Steering Group. This directly feed issues beyond the scope of the Department,
and best practice originating from it, to the University.
Table 3.4 Sharing Good Practice Example
In 2018/19 we made the decision to pay student representatives for their time, aligning
with Student Ambassador roles.
Working with the University Athena SWAN Steering Group and Students Union we
identified a process to do this, which is now replicated by other Departments at UWE.
Externally, members of the SAT attend a variety of regional and national events and
conferences, such as Athena SWAN Regional meetings. We have provided workshops
on gender equality to UWE, including at an International Women’s Day event (March
2018), and the Faculty of Business and Law’s annual Away Day (September 2018).

19
Table 3.5 Sharing Good Practice Example
We share ongoing work within DAS externally and internally, including at national
conferences (e.g. Science in Public July 2017), and a commentary published in a special issue
of the Journal of Science Communication.
The SAT lead was invited to be an advisor for the UK hub of the Hypathia project, an EU
Horizon 2020 funded project that aims to develop a theoretical framework on gender
inclusive STEM education, and in May 2019 DAS signed a Memorandum of Understanding to
be a member of the ACT LifeSciCoP - Gender Equality in Life Sciences. This EU Horizon 2020
community of practice is looking to change institutional culture towards Gender Equality.
Members of the SAT have participated in two associated international meetings, and
provided a skype presentation on our survey work to members based in Spain, Portugal,
Germany and Romania.
The final draft application was sent to all staff and PGR students for comment and
suggestions prior to submission, with a response from over 20 staff members. It was
shared with the Faculty Executive and Dean of the Faculty ensuring ongoing strategic
support.
(iii) plans for the future of the self-assessment team
As our ambitions for Athena SWAN expand, we will continue to build on impactful
actions. We will diversify membership of the SAT, considering intersectionality of other
protected characteristics and annually reviewing our TOR to expand membership.

20
We will improve input from our students by shadowing existing events to reach UG,
PGT and PGR students, including employability activities, Conversation Cafes, a new
PGR seminar series and programme level meetings, rather than standalone focus
groups. We will ask students about the best ways to reach them, considering options
other than surveys to gather their experiences. We plan to continue to coordinate our
activities with other Department EDI strategies, such as BAME and widening
participation events, whilst focusing on gender.
We will continue to communicate our activities, increasing involvement from members
of the SAT as gender equality ambassadors, attending regional, national and
international events, and communicating the work internally and externally. We will
improve awareness of Athena SWAN actions, so that Department staff are more aware
of its impact.
We will continue to work with the University to improve staff and student data reporting
practices so that key information is available for us to review on an annual basis.
Action: Increase awareness of Athena SWAN and the role of the SAT in embedding change across the Department (Action 7.1).
Action: Annually review all student and staff Athena SWAN datasets (Action 1.5).
Action: Increase the number of male and BAME staff representatives in the Self-Assessment Team (Action 1.1).
Action: Identify emerging gender equality issues from a greater number of students (Action 1.2).
Action: Coordinate with other equality and diversity events and activities at Departmental level to promote intersectional considerations of gender equality (Action 1.3).

21
4. A PICTURE OF THE DEPARTMENT
Silver: 2909 words (An additional 500 words was agreed for this section, please see
email on p.6).
4.1. Student data
(i) Numbers of men and women on access or foundation courses
Table 4.1.1 Foundation Students Action Progress and Impacts
Since our Athena SWAN Bronze 2013 and 2016 we have:
Introduced a foundation coordinator and technician supporting student continuation.
Involved UG programme staff/PhD students at foundation level, introducing students to a wider variety of role models.
Embedded skills for UG programmes in module learning objectives to encourage continuation.
As a result, our recruitment of female students at foundation level has maintained a gender balance since 2014/15 and the pass rate has improved to an average of 85% in the last five years.
The Department offers a foundation year prior to continuation with an undergraduate
programme. We have increased and maintained over 50% female recruitment in the
last five years, exceeding national averages for science foundation programmes, as well
as those amongst Alliance Universities.
Figure 4.1.1: Percentage and Number (FPE) of Students recruited to foundation
programmes
2014/15 2015/16 2016/17 2017/18 2018/19Alliance
Universities17/18
AllUniversities
17/18
Male % 48% 48% 43% 44% 45% 50% 47%
Female % 52% 52% 57% 56% 55% 50% 53%
65 64 64 85 88
58 58 49 66 72
0%
10%
20%
30%
40%
50%
60%
70%
80%
90%
100%

22
(ii) Numbers of undergraduate students by gender
Full- and part-time by programme. Provide data on course applications, offers,
and acceptance rates, and degree attainment by gender.
Table 4.1.2 Undergraduate Students Action Progress and Impacts
Since our Athena SWAN Bronze 2013 and 2016 we have:
Reviewed UCAS student choice data by gender and decisions to study in DAS.
Set up a student recruitment and progression working group, including reviewing UG prospectus and marketing materials, examining student support offered by the Academic Personal Tutor (APT) programme, the Peer Assisted Learning (PAL) scheme and examining graduate destination data by gender.
Altered UCAS Tariff arrangements requiring students to have one science A-level at C or above, compared to two previously and increasing the attractiveness of programmes for a greater diversity of students.
Introduced annual review of module attainment gaps during Department Leadership meetings, addressing variations in module performance on the basis of gender and intersectionality.
Provided compulsory unconscious bias and inclusive curriculum design training to Department staff (including technical and professional services staff).
As a result, the percentage of female students across our undergraduate provision has increased to 58% in 2018/19, and part-time student numbers have improved. We have reduced by over 50% the number of programmes who are recruiting 5% from benchmarks. The percentage of females applying, being offered a place and enrolling has increased. Over the last five years 75% of UG female students have achieved a ‘good’ degree award, and the gap in male student performance has improved but requires continued efforts.
The Department offers 13 undergraduate programmes over a range of subject areas
including biological sciences, biomedical sciences, forensic sciences and environmental
sciences. Despite closing six programmes, undergraduate enrolments have increased by
21% in the last five years. The percentage of female students has increased across our
undergraduate provision from 50% in 2014/15 to 58% in 2018/19, above or equal to our
benchmarks (Figure 4.1.2) and care is needed that our increased female recruitment
does not impact on male student recruitment.

23
Figure 4.1.2: Percentage and Number of Students (FPE) over all UG programmes
Over the last five years, 4% (n=262) of students enrolled part-time, 54% (n=141) were
female. Undergraduate programmes are not offered on a part-time basis, but students
can confine credits to a limited number of days, allowing flexibility for students to take
90 credits or under per academic year. Our 2016 application showed fewer female part-
time students than males. This trend has now reversed, with more female students
studying part-time than males, in line with national and Alliance University benchmarks
(Figure 4.1.3).
2014/15 2015/16 2016/17 2017/18 2018/19Alliance
Universities 17/18
AllUniversitie
s 17/18
Male % 50% 49% 46% 44% 42% 50% 49%
Female % 50% 51% 54% 56% 58% 50% 51%
583 655 731 796 872
592 628 619 617 619
0%
10%
20%
30%
40%
50%
60%
70%
80%
90%
100%
< Information removed for confidentiality reasons >
24
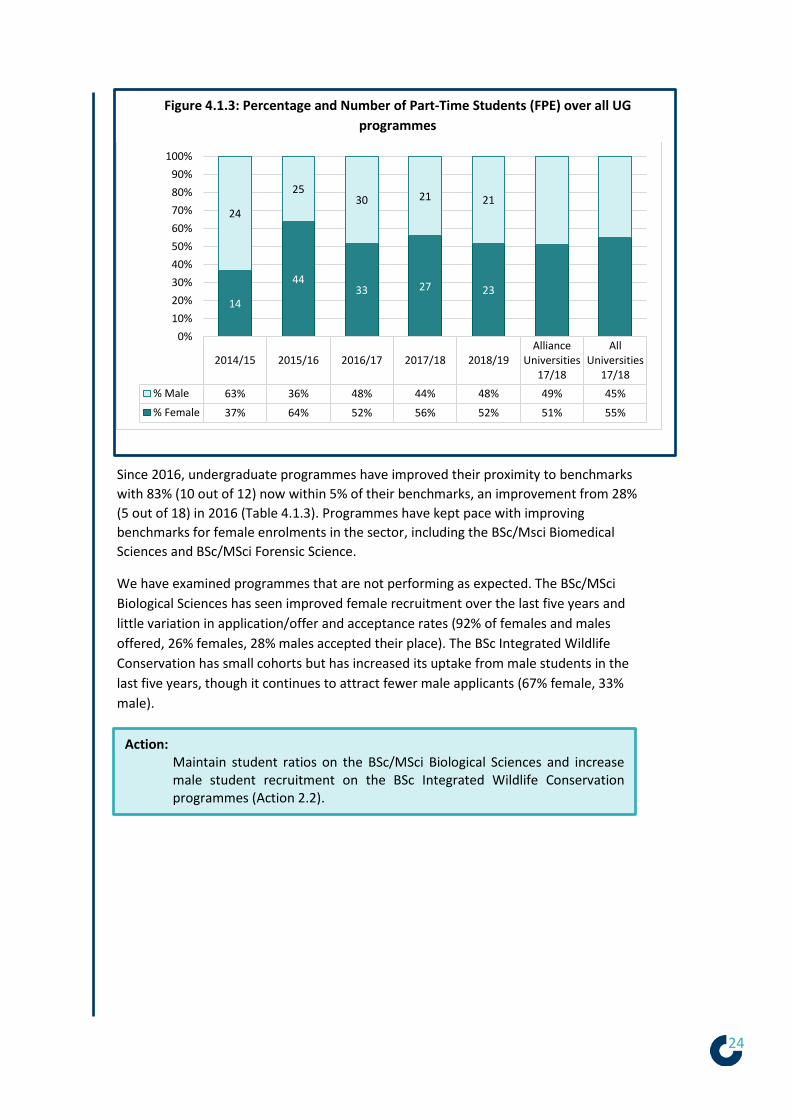
Figure 4.1.3: Percentage and Number of Part-Time Students (FPE) over all UG
programmes
Since 2016, undergraduate programmes have improved their proximity to benchmarks
with 83% (10 out of 12) now within 5% of their benchmarks, an improvement from 28%
(5 out of 18) in 2016 (Table 4.1.3). Programmes have kept pace with improving
benchmarks for female enrolments in the sector, including the BSc/Msci Biomedical
Sciences and BSc/MSci Forensic Science.
We have examined programmes that are not performing as expected. The BSc/MSci
Biological Sciences has seen improved female recruitment over the last five years and
little variation in application/offer and acceptance rates (92% of females and males
offered, 26% females, 28% males accepted their place). The BSc Integrated Wildlife
Conservation has small cohorts but has increased its uptake from male students in the
last five years, though it continues to attract fewer male applicants (67% female, 33%
male).
2014/15 2015/16 2016/17 2017/18 2018/19Alliance
Universities17/18
AllUniversities
17/18
% Male 63% 36% 48% 44% 48% 49% 45%
% Female 37% 64% 52% 56% 52% 51% 55%
14
4433 27 23
24
2530 21 21
0%
10%
20%
30%
40%
50%
60%
70%
80%
90%
100%
Action: Maintain student ratios on the BSc/MSci Biological Sciences and increase male student recruitment on the BSc Integrated Wildlife Conservation programmes (Action 2.2).

25
Table 4.1.3: Percentage and Number of Students (FPE) by UG programme
2014/15-2018/19 Su
bje
ct G
rou
p
Programme 2014/15 2015/16 2016/17 2017/18 2018/19 Female Average % (FPE)
Fem
ale
n /
%
Mal
e n
/%
Fem
ale
n /
%
Mal
e n
/%
Fem
ale
n /
%
Mal
e n
/%
Fem
ale
n /
%
Mal
e n
/%
Fem
ale
n /
%
Mal
e n
/%
All
Un
iver
siti
es
Alli
ance
Un
iver
siti
es
HU
BS
BSC/MSCI (HONS) BIOMEDICAL SCIENCES (C9)
198 52%
186 48%
220 55%
178 45%
285 58%
207 41%
309 60%
202 40%
335 62%
206 38%
63%
62%
BSC (HONS) HEALTHCARE SCIENCES *INCLUDES LIFE SCIENCES, PHYSIOLOGICAL SCIENCES, CLINICAL ENGINEERING & MEDICAL PHYSICS TECHNOLOGY ROUTES (C9)
44 69%
20 31%
50 64%
28 36%
46 61%
29 39%
72 63%
43 37%
71 58%
52 42%
63%
62%
FDSC HEALTHCARE SCIENCE (C9)
7 47%
8 53%
11 58%
8 42%
19 50%
19 50%
11 42%
15 58%
8 61%
5 39%
58%
53%
FAC
S
BSC/MSCI (HONS) FORENSIC SCIENCE (F4)
77 59%
53 41%
93 58%
66 42%
107 62%
65 38%
126 63%
75 37%
140 68%
67 32%
66%
64%
BES
SC
BSC/MSCI (HONS) BIOLOGICAL SCIENCES (C1)
77 39%
122 61%
80 37%
134 63%
99 42%
135 58%
99 47%
114 53%
111 51%
108 49%
61%
60%
BSC/MSCI (HONS) WILDLIFE ECOLOGY AND CONSERVATION SCIENCE (C1)
32 50%
32 50%
47 47%
53 53%
89 54%
77 46%
99 52%
90 48%
127 56%
99 44%
61%
60%
BSC (HONS) INTEGRATED WILDLIFE CONSERVATION (F7)
7 78%
2 22%
10 59%
7 41%
9 64%
5 36%
15 79%
4 21%
10 67%
5 33%
50%
51%
FDSC INTEGRATED WILDLIFE CONSERVATION (F7)
24 67%
12 33%
30 70%
13 30%
30 70%
13 30%
26 67%
13 33%
24 63%
14 37%
56%
67%
BSC (HONS) ENVIRONMENTAL SCIENCE (F9)
25 29%
62 71%
27 31%
61 69%
36 39%
57 61%
37 38%
61 62%
46 42%
63 58%
40%
46%
Benchmarking data is drawn from HEIDI 2017/18, on the basis of programme JACS codes. Shaded rows
indicate programmes regularly performing within 5% of benchmarks. The table excludes programmes which
have closed in the last five years and includes four programmes which also now have an MSci route.
Our gender inclusive recruitment process for degree apprenticeships, introduced in
2017/18 shows near gender equity. Female enrolment (51%, n=45) aligns to male
enrolment (49%, n=44) and we will continue to maintain this as these programmes
grow.

26
Table 4.1.4: Percentage and Number of Students (FPE) by Apprenticeship
programme 2017/18-2018/19 Su
bje
ct G
rou
p
Programme 2017/18 2018/19 Female Average % (FPE)
Fem
ale
n /
%
Mal
e n
/%
Fem
ale
n /
%
Mal
e n
/%
All
Un
iver
siti
es
Alli
ance
Un
iver
siti
es
HU
BS
BSC (HONS) HEALTHCARE SCIENCE APPRENTICESHIP *INCLUDES PHYSIOLOGICAL SCIENCES, CLINICAL ENGINEERING & MEDICAL PHYSICS TECHNOLOGY ROUTES (C9)
15 50%
15 50%
30 51%
29 49%
-
-
Benchmarking data is not yet available for apprenticeship provision.
Our female applicants to programmes have increased (Table 4.1.5) to 58% of
applications to undergraduate programmes. There has been a rise in the number of
offers made to females to 57% compared to 48% in 2013. Over the last five years the
percentage of females applying, being offered a place and enrolling has increased and
we are monitoring to ensure this does not further reduce male student applications.
In our 2016 application we noted a 9% difference in female students accepting an offer
on an undergraduate programme compared to male students. We have examined our
marketing materials, made gender equality more visible and considered staffing at open
days and events, and this gap has closed to a 3% difference over the last 5 years, with
36% of female students now accepting a place, compared to 39% of male students
(Figure 4.1.4).
Table 4.1.5 Percentage and Number of Student Applications, Offers and Acceptance
(FPE) over all UG programmes
UGT Application Offer Acceptance
N % N % N %
2014/15 Female 857 52% 720 52% 271 48%
Male 780 48% 663 48% 295 52%
2015/16 Female 906 57% 756 56% 306 52%
Male 684 43% 581 44% 279 48%
2016/17 Female 936 58% 797 58% 302 56%
Male 675 42% 576 42% 237 44%
2017/18 Female 1087 60% 928 59% 308 60%
Male 736 40% 647 41% 204 40%
2018/19 Female 1141 61% 991 60% 306 58%
Male 740 39% 666 40% 218 42%
TOTAL Female 4927 58% 4192 57% 1493 55%
Male 3615 42% 3133 43% 1233 45%

27
Figure 4.1.4: Percentage and Number of Student Offers and Acceptance over all UG
programmes (FPE)
75% of undergraduate female students achieved a ‘good’ degree (Figure 4.1.5),
compared to 66% of male students, and they are performing particularly well in
achieving first class degrees. 26% of female students achieved a first class degree,
compared to 15% of male students.
In our 2016 application we committed to monitor male undergraduate performance.
We have subsequently explored male uptake of student placements, APT programme,
and PAL scheme, and increased the emphasis on student employability (Section 5.3iv).
Although there remains a gap, the percentage of male students awarded good degrees
has risen, from 64% (n=269) in 2013-2016 to 66% (n=411), and we will maintain this
action.
Acceptance
Females (n=271) 38%
Males (n=295) 44%
OffersFemales
(n=720) 84%Males (n=663)
85%
2014/15 ApplicationsFemales (n=857)
Males (n=780)
Acceptance
Females (n=306) 40%
Males (n=279) 48%
OffersFemales
(n=756) 83%Males (n=581)
85%
2015/16 ApplicationsFemales (n=906)
Males (n=684)
Acceptance
Females (n=302) 39%
Males (n=237) 41%
OffersFemales
(n=797) 85%Males (n=576)
85%
2016/17 ApplicationsFemales (n=936)
Males (n=675)
Acceptance
Females (n=308) 33%
Males (n=204) 31%
OffersFemales
(n=928) 85%Males (n=647)
88%
2017/18ApplicationsFemales (n=1087)
Males (n=736)
Acceptance
Females (n=306) 31%
Males (n=218) 33%
OffersFemales
(n=991) 87%Males (n=666)
90%
2018/19 ApplicationsFemales (n=1141)
Males (n=740)
Acceptance
Females (n=1493) 36%
Males (n=1233) 39%
OffersFemales
(n=4192) 85%Males
(n=3133) 87%
TOTAL ApplicationsFemales (n=4927)
Males (n=3615)
Action: Address male degree performance working with programmes, Faculty Equality and Diversity Task Force and the DAS employability team (Action 2.4).

28
Figure 4.1.5: Percentage of Students (FPE) achieving ‘good’ degree classifications over
all UG programmes
‘Good’ degrees are considered to be first class or upper second.
Table 4.1.6: Percentage and Number of Students (FPE) by degree classification over all
UG programmes
Female full-time students completed their degrees in 2.9 years, compared to 3.1 years
for males (Figure 4.1.6). Female students studying part-time completed on average in
4.5 years compared to 4.2 years for males (Figure 4.1.7). We have seen improving
completion rates, and there is a very small difference between female (71%) and male
students (69%) (Figure 4.1.8).
2014/15 2015/16 2016/17 2017/18 2018/19Alliance
Universities 17/18
AllUniversitie
s 17/18
Female % 'Good' Degree 86% 71% 73% 79% 68% 75% 78%
Male % 'Good' Degree 61% 64% 67% 62% 73% 62% 73%
103
95 115129
11366 87 90
81
104
0%
10%
20%
30%
40%
50%
60%
70%
80%
90%
100%
UGT First Class Upper Second
Lower Second
Third Pass
N % N % N % N % N %
2014/15 Female 36 35% 53 51% 13 12% 2 2% 0 0%
Male 10 11% 43 49% 32 37% 2 2% 0 0%
2015/16 Female 27 21% 67 51% 36 27% 1 1% 0 0%
Male 18 14% 65 50% 40 31% 7 5% 0 0%
2016/17 Female 43 27% 72 45% 41 26% 2 1% 0 0%
Male 23 17% 67 50% 34 25% 10 7% 0 0%
2017/18 Female 42 26% 87 53% 32 19% 3 2% 0 0%
Male 12 9% 69 53% 43 33% 5 4% 1 1%
2018/19 Female 45 23% 86 45% 55 29% 5 3% 0 0%
Male 31 22% 73 51% 28 20% 10 7% 0 0%
TOTAL Female 193 26% 365 49% 177 23% 13 2% 0 0%
Male 94 15% 317 51% 177 28% 34 5% 1 1%

29
Figure 4.1.6: Full-Time Students (FPE) average years of attendance over all UG
programmes
Figure 4.1.7: Part-Time Students (FPE) average years of attendance over all UG
programmes
2.5
2.6
2.7
2.8
2.9
3.0
3.1
3.2
3.3
14/15 15/16 16/17 17/18 18/19
NU
MB
ER O
F YE
AR
S
FEMALE MALE
0.0
1.0
2.0
3.0
4.0
5.0
6.0
14/15 15/16 16/17 17/18 18/19
NU
MB
ER O
F YE
AR
S
FEMALE MALE

30
Figure 4.1.8: Students (FPE) degree completion over all UG programmes
(iii) Numbers of men and women on postgraduate taught degrees
Full- and part-time. Provide data on course application, offers and acceptance
rates and degree completion rates by gender.
Table 4.1.7 Postgraduate Taught Students Action Progress and Impacts
Since our Athena SWAN Bronze 2013 and 2016 we have:
Improved the routine monitoring of data at postgraduate taught level.
Introduced postgraduate taught student representation to the SAT.
As a result, we are better able to identify issues for PGT actions and engage with the PGT community. All PGT programmes are now recruiting over 50% female students, female students being offered a place to study has increased, as has female student performance.
In the last five years our recruitment of female students across all programmes offered
at postgraduate taught level has continued to rise (Figure 4.1.9). The percentage of
female PGT students has increased from 56% in 2014/15 to 66% in 2018/19, exceeding
comparable benchmarks but with a knock-on effect on our male recruitment for whom
enrolments have also increased but at a lower rate.
The number of students studying PGT part-time has increased to 30% (n=218) of which
80% (n=174) of students were female (Figure 4.1.10). Our PGT programmes are very
flexibly designed for part-time study, and attractive alongside other responsibilities,
meaning our part-time female student recruitment is outperforming benchmarks.
2014/15 2015/16 2016/17 2017/18 2018/19
Female % 61% 60% 81% 79% 74%
Male % 54% 65% 74% 78% 76%
104 131
158 164 191
87130
134 130 142
0%
10%
20%
30%
40%
50%
60%
70%
80%
90%

31
Figure 4.1.9: Percentage and Number of Students (FPE) over all PGT
programmes
Figure 4.1.10: Percentage and Number of Part-Time Students (FPE) over all PGT
programmes
2014/15 2015/16 2016/17 2017/18 2018/19Alliance
Universities17/18
AllUniversities
17/18
% Male 44% 41% 37% 32% 34% 42% 42%
% Female 56% 59% 63% 68% 66% 58% 58%
28 48 103 130 138
27 40 61 62 70
0%
10%
20%
30%
40%
50%
60%
70%
80%
90%
100%
2014/15 2015/16 2016/17 2017/18 2018/19Alliance
Universities17/18
AllUniversities
17/18
% Male 19% 21% 26% 12% 23% 37% 37%
% Female 81% 79% 74% 88% 77% 63% 63%
28 48 4045
45
27 40 146
13
0%
10%
20%
30%
40%
50%
60%
70%
80%
90%
100%

32
Table 4.1.8: Percentage and Number of Students (FPE)
recruited over all PGT programmes Su
bje
ct G
rou
p
Programme 2014/15 2015/16 2016/17 2017/18 2018/19 Female Average % (FPE)
Fem
ale
n /
%
Mal
e n
/%
Fem
ale
n /
%
Mal
e n
/%
Fem
ale
n /
%
Mal
e n
/%
Fem
ale
n /
%
Mal
e n
/%
Fem
ale
n /
%
Mal
e n
/%
All
Un
iver
siti
es
Alli
ance
Un
iver
siti
es
ALL
MRES APPLIED SCIENCES (C9)
- - - - - - 1 25%
3 75%
11 58%
8 42%
60%
58%
HU
BS MSC BIOMEDICAL
SCIENCE (C9)
9 35%
17 65%
26 53%
23 47%
35 54%
30 46%
27 55%
22 45%
18 50%
18 50%
60%
58%
BES
SC
MSC SCIENCE COMMUNICATION (P9)
19 65%
10 35%
19 68%
9 32%
25 68%
12 32%
37 71%
15 29%
45 70%
19 30%
75%
73%
MSC ADVANCED WILDLIFE CONSERVATION IN PRACTICE (C1)
- - 12 60%
8 40%
33 70%
14 30%
51 72%
20 28%
49 68%
23 32%
61%
61%
Benchmarking data is drawn from HEIDI 2017/18, on the basis of programme JACS codes. Shaded rows
indicate programmes regularly performing within 5% of benchmarks. The table excludes programmes which
have closed in the last five years and includes two new programmes.
All PGT programmes are now recruiting over 50% female students, compared to 57% of
programmes in 2015/16 (Table 4.1.8). The MSc Biomedical Science has seen
improvement in female recruitment over the last five years, however it has slightly
fewer female applicants (48% female, 52% male), and acceptances (70% female, 75%
male). The MSc Advanced Wildlife Conservation in Practice, including modules based at
Bristol Zoo, has fewer male applicants, offers and acceptances, and we are working with
the programme team to address this.
Since our 2016 application, the numbers of female students being offered a place has
increased from 73% of female applicants to 76%, alongside a small increase in
acceptance rates from 73% to 74% (Figure 4.1.11). More male students take up their
place, but fewer apply and are offered places.
Action: Increase male student recruitment on the MSc Advanced Wildlife Conservation in Practice by 5% (Action 2.3).

33
Table 4.1.14: Percentage and Number of Student Applications, Offers and Acceptance
(FPE) over all PGT programmes
Figure 4.1.11: Percentage and Number of Students Offers and Acceptance
over all PGT programmes (FPE)
Acceptance
Females (n=70) 92%
Males (n=68) 75%
OffersFemales
(n=97) 76%Males (n=91)
76%
2014/15 ApplicationsFemales (n=127)
Males (n=120)
Acceptance
Females (n=79) 74%
Males (n=82) 79%
OffersFemales
(n=106) 75%Males (n=104)
76%
2015/16 ApplicationsFemales (n=142)
Males (n=137)
Acceptance
Females (n=111) 76%
Males (n=109) 77%
OffersFemales
(n=145) 75%Males (n=141)
65%
2016/17 ApplicationsFemales (n=193)
Males (n=216)
Acceptance
Females (n=96) 71%
Males (n=80) 75%
OffersFemales
(n=135) 76%Males (n=107)
68%
2017/18 ApplicationsFemales (n=178)
Males (n=158)
Acceptance
Females (n=104) 78%
Males (n=67) 83%
OffersFemales
(n=134) 79%Males (n=81)
63%
2018/19 ApplicationsFemales (n=169)
Males (n=128)
Acceptance
Females (n=460) 74%
Males (n=406) 77%
OffersFemales
(n=617) 76%Males (n=524)
69%
TOTAL ApplicationsFemales (n=809)
Males (n=759)
PGT Application Offer Acceptance
N % N % N %
2014/15 Female 127 515 97 51% 70 51%
Male 120 49% 91 49% 68 49%
2015/16 Female 142 51% 106 50% 79 49%
Male 137 49% 104 50% 82 51%
2016/17 Female 193 47% 145 51% 111 50%
Male 216 53% 141 49% 109 50%
2017/18 Female 178 53% 135 56% 96 54%
Male 158 47% 107 44% 80 46%
2018/19 Female 169 57% 134 62% 104 61%
Male 128 43% 81 38% 67 39%
TOTAL Female 809 51% 617 54% 460 53%
Male 759 49% 524 46% 406 47%

34
Female student performance at PGT level has improved year on year, with 77% (n=118)
now achieving a distinction or merit, compared to 72% in our previous application
(Figure 4.1.12). 68% (n=72) of male students achieved a distinction or merit decreasing
slightly since our last application.
Figure 4.1.12: Percentage of Students (FPE) achieving Distinction or Merit
degree classifications over all PGT programmes
Table 4.1.15: Percentage and Number of Students (FPE) by degree classification over
all PGT programmes
2014/15 2015/16 2016/17 2017/18 2018/19
% Female 50% 54% 59% 65% 66%
% Male 50% 46% 41% 35% 34%
812
17
38 43
810
12
20 22
0%
10%
20%
30%
40%
50%
60%
70%
PGT Distinction Merit Pass
N % N % N %
2014/15 Female n 5 62% 3 38% 3 33%
Male n 3 38% 5 62% 6 67%
2015/16 Female n 2 40% 10 59% 1 33%
Male n 3 60% 7 41% 2 67%
2016/17 Female n 6 67% 11 55% 8 40%
Male n 3 33% 9 45% 12 60%
2017/18 Female n 11 73% 27 63% 15 65%
Male n 4 27% 16 37% 8 35%
2018/19 Female n 14 74% 29 63% 9 64%
Male n 5 26% 17 37% 5 36%
TOTAL Female n 38 68% 80 60% 36 52%
Male n 18 32% 54 40% 33 48%

35
Female and male full-time students have on average completed their PGT degrees in
1.3 years (Figure 4.1.13), and 2.2 years when studying part-time (Figure 4.1.14), with no
variation in completion times by gender. There is a very small difference between
female (89%) and male students (92%) in terms of completion rates (Figure 4.1.15).
Figure 4.1.13: Full-Time Students (FPE) average years of attendance over all PGT
programmes
Figure 4.1.14: Part-Time Students (FPE) average years of attendance over all PGT
programmes
0
0.2
0.4
0.6
0.8
1
1.2
1.4
1.6
14/15 15/16 16/17 17/18 18/19
NU
MB
ER O
F YE
AR
S
FEMALE MALE
0
0.5
1
1.5
2
2.5
3
3.5
4
14/15 15/16 16/17 17/18 18/19
NU
MB
ER O
F YE
AR
S
FEMALE MALE

36
Figure 4.1.15: Students (FPE) degree completion over all PGT programmes
(iv) Numbers of men and women on postgraduate research degrees
Full- and part-time. Provide data on course application, offers, acceptance and
degree completion rates by gender.
Table 4.1.16 Postgraduate Research Students Action Progress and Impacts
Since our Athena SWAN Bronze 2013 and 2016 we have:
Improved the routine monitoring of data at postgraduate research level.
Improved the response rate to our PGR student survey from 20% in 2016 to 22% in 2019.
Collaborated with the UWE Graduate School to improve gender equality training and pre-enrolment information for supporting students with caring responsibilities.
Updated our PGR student case study to reflect a greater diversity in life experiences.
As a result, our PGR programmes are recruiting over 50% female students, both female and male applicants are equally likely to accept a place and there is no difference between female and male students’ completion rates (86%).
The Department has two main routes for postgraduate research, studying for a PhD or a
Professional Doctorate in Biomedical Sciences. Over the last five years we have
improved our gender ratios to within 5% of benchmarks across these programmes
(Figure 4.1.16), with female students making up 52% (n=187) of PGR cohorts between
2014/15 and 2018/19.
2014/15 2015/16 2016/17 2017/18 2018/19
Female % 100% 72% 96% 88% 93%
Male % 100% 86% 96% 93% 84%
11
13
2553 52
1412
24 2827
0%
10%
20%
30%
40%
50%
60%
70%
80%
90%
100%

37
Figure 4.1.16: Percentage and Number of Students (FPE) over all PGR
programmes
The percentage of females studying for a PhD exceeds national averages for science
PGR programmes. The Professional Doctorate (part-time only) (Table 4.1.17), requires
students to be working in an aligned area and has slightly lower female numbers, and
this programme influences the gender balance in those studying part-time as PGR
students. Although 55 (FPE) female students studied part-time over the last five years
(Figure 4.1.17), this is lower than might be expected, with 39% (n=55) of female
students studying part-time compared to 61% (n=87) of males.
Table 4.1.17: Percentage and Number of Students (FPE)
recruited over all PGR programmes
Sub
ject
Gro
up
Programme 2014/15 2015/16 2016/17 2017/18 2018/19 Female Average % (FPE)
Fem
ale
n /
%
Mal
e n
/%
Fem
ale
n /
%
Mal
e n
/%
Fem
ale
n /
%
Mal
e n
/%
Fem
ale
n /
%
Mal
e n
/%
Fem
ale
n /
%
Mal
e n
/%
All
Un
iver
siti
es
Alli
ance
Un
iver
siti
es
ALL
PhD SCIENCE (inc. C1, C9, F4, P9)
29 54%
25 46%
29 47%
32 53%
33 54%
28 46%
26 55%
21 45%
28 57%
21 43%
45%
45%
HU
BS
PROFESSIONAL DOCTORATE IN BIOMEDICAL SCIENCES (B9)
11 52%
10 48%
8 47%
9 53%
7 50%
7 50%
9 53%
8 47%
7 41%
10 59%
62%
63%
Benchmarking data is drawn from HEIDI Student Record 2017/18, on the basis of all science PGR
programmes.
2014/15 2015/16 2016/17 2017/18 2018/19Alliance
Universities17/18
AllUniversities
17/18
% Male 47% 53% 47% 45% 47% 55% 55%
% Female 53% 47% 53% 55% 53% 45% 45%
36 31 22 29 31
23 22 20 35 35
0%10%20%30%40%50%60%70%80%90%
100%

38
Figure 4.1.17: Percentage and Number of Part-Time Students (FPE) over all PGR
programmes
There have been slightly fewer female (46%, n=26) applicants to PGR programmes than
males (53%, n=30) (Table 4.1.18), and a small increase in male students offered a place
(67%, n=20) compared to female students (65%, n=17) (Figure 4.1.18), though both
female and male applicants are equally likely to accept.
Table 4.1.18: Percentage and Number of Students Applications, Offers and
Acceptance (FPE) over all PGR programmes
2014/15 2015/16 2016/17 2017/18 2018/19Alliance
Universities17/18
AllUniversities
17/18
% Male 58% 66% 62% 62% 60% 53% 50%
% Female 42% 34% 38% 38% 40% 47% 50%
1411 10 10 10
1921 16 16 15
0%
10%
20%
30%
40%
50%
60%
70%
80%
90%
100%
PGR Application Offer Acceptance
N % N % N %
2014/15 Female 7 54% 6 54% 6 54%
Male 6 46% 5 46% 5 46%
2015/16 Female 2 17% 1 17% 1 17%
Male 10 83% 5 83% 5 83%
2016/17 Female 5 62% 1 33% 1 33%
Male 3 38% 2 67% 2 67%
2017/18 Female 7 64% 5 62% 5 62%
Male 4 36% 3 38% 3 38%
2018/19 Female 5 42% 4 44% 4 44%
Male 7 58% 5 56% 5 56%
TOTAL Female 26 46% 17 46% 17 46%
Male 30 54% 20 54% 20 54%

39
Figure 4.1.18: Percentage and Number of Students Offers and Acceptance over all PGR
programmes (FPE)
Female full-time students on average completed their PGR degrees in 5.5 years,
compared to 4.3 years for male students (Figure 4.1.19). Female students studying part-
time completed on average in 6.7 years compared to 8 years for male students (Figure
4.1.20). There is no difference in completion rates (86%) by gender (Figure 4.1.21).
Acceptance
Females (n=6) 100%
Males (n=5) 100%
OffersFemales (n=6)
86%Males (n=5)
83%
2014/15 Applications
Females (n=7) Males (n=6)
Acceptance
Females (n=1) 100%
Males (n=5) 100%
OffersFemales (n=1)
50%Males (n=5)
50%
2015/16 Applications
Females (n=2) Males (n=10)
Acceptance
Females (n=1)100%
Males (n=2) 100%
OffersFemales (n=1)
20%Males (n=2)
67%
2016/17 Applications
Females (n=5) Males (n=3)
Acceptance
Females (n=5) 100%
Males (n=3) 100%
OffersFemales (n=5)
71%Males (n=3)
75%
2017/18 Applications
Females (n=7) Males (n=4)
Acceptance
Females (n=4) 100%
Males (n=5) 100%
OffersFemales (n=4)
80%Males (n=5)
71%
2018/19 Applications
Females (n=5) Males (n=7)
Acceptance
Females (n=17) 100%
Males (n=5) 100%
OffersFemales
(n=17) 65%Males (n=20)
67%
TOTAL ApplicationsFemales (n=26)
Males (n=30)

40
Figure 4.1.19: Full-Time Students (FPE) average years of attendance over all PGR
programmes
Figure 4.1.20: Part-Time Students (FPE) average years of attendance over all PGR
programmes
No PT completions were recorded in 2018/19 at the time data was gathered.
0
1
2
3
4
5
6
7
8
14/15 15/16 16/17 17/18 18/19
NU
MB
ER O
F YE
AR
S
FEMALE MALE
0
1
2
3
4
5
6
7
8
9
10
2014/15 2015/16 2016/17 2017/18 2018/19
NU
MB
ER O
F YE
AR
S
FEMALE MALE

41
Figure 4.1.21: Students (FPE) degree completion over all PGR programmes
(v) Progression pipeline between undergraduate and postgraduate student levels
Identify and comment on any issues in the pipeline between undergraduate and
postgraduate degrees.
Our previous pipeline (Figure 4.1.22) showed gender equity across all study levels but a
number of programmes were significantly under recruiting female students compared
to benchmarks. As programmes have further aligned with benchmarks, our current
pipeline (Figure 4.1.23) demonstrates increased female students at all levels, including
PGR, feeding into academic staff recruitment. Our focus now is to maintain male
recruitment on programmes where it is lower than expected and we are mindful of
male recruitment, particularly at PGT.
2014/15 2015/16 2016/17 2017/18 2018/19
Female % 90% 50% 90% 100% 100%
Male % 100% 78% 70% 80% 100%
9
1
97 32
77
4
1
0%
10%
20%
30%
40%
50%
60%
70%
80%
90%
100%

42
Figure 4.1.22 Student Pipeline (FPE) 2014/15
Figure 4.1.23: Student Pipeline (FPE) 2018/19
Since 2014/15 (Figure 4.1.24) 122 students have immediately progressed to PG study at
UWE of which 59% (n=72) were female, and 41% (n=50) were male. Female (12%)
students were slightly more likely to progress to PG studies than male students (10%),
particularly due to two newly introduced programmes (MRes Applied Sciences and MSc
Advanced Wildlife Conservation in Practice).
FoundationCourses
UndergraduatePostgraduate
TaughtPostgraduate
Research
Female % 52% 50% 56% 53%
Male % 48% 50% 45% 47%
0%
10%
20%
30%
40%
50%
60%
70%
80%
90%
100%
FoundationCourses
UndergraduatePostgraduate
TaughtPostgraduate
Research
Female % 55% 58% 66% 53%
Male % 45% 42% 34% 47%
0%
10%
20%
30%
40%
50%
60%
70%
80%
90%
100%

43
Figure 4.1.24: Percentage and Number of Students continuing
to PG from UWE UG programmes (FPE)
Excludes progression to UG from foundation, and MSci programmes. 2018/19 data not yet
available.
We also support our students to progress at other institutions and examined DLHE data
(now Graduate Outcomes Survey) by gender. The proportion of female and male UG
students progressing to further study is identical (25%), though female students are
slightly less likely to progress to further study after a PGT programme (10% female, 14%
male). This can be effected by fluctuations in survey response rates and we will
continue to monitor.
Figure 4.1.25: Percentage and Number of UG Students continuing to PGT and
PGR based on DHLE data
2014/15 2015/16 2016/17 2017/18
Male % 35% 52% 49% 29%
Female % 65% 48% 51% 71%
1114 18
29
615 17
12
0%
10%
20%
30%
40%
50%
60%
70%
80%
90%
100%
2012/13 2013/14 2014/15 2015/16 2016/17
Male % 55% 43% 41% 48% 48%
Female % 45% 57% 59% 52% 52%
1932 26 36 45
2324 18 33 42
0%
10%
20%
30%
40%
50%
60%
70%
80%
90%
100%

44
Figure 4.1.26: Percentage and Number of PGT Students continuing to PGR based
on DHLE data
2012/13 2013/14 2014/15 2015/16 2016/17
Male % 40% 50% 75% 100% 29%
Female % 60% 50% 25% 0% 71%
32
1
0
5
22
3
1
2
0%
10%
20%
30%
40%
50%
60%
70%
80%
90%
100%

45
4.2. Academic and research staff data
(i) Academic staff by grade, contract function and gender: research-only, teaching
and research or teaching-only
Look at the career pipeline and comment on and explain any differences between
men and women. Identify any gender issues in the pipeline at particular
grades/job type/academic contract type.
In 2018, 84 academic staff (44% female, 56% male) were employed within the
Department, of which 10 were research-only staff, with the remainder in roles which
contribute to both research and teaching. 12 staff (50% female, 50% male) were
employed on ‘teaching-only’ contracts as associate lecturers. Since 2014, our
percentage of female staff has averaged at 47% of staff in DAS, exceeding national
averages (Table 4.2.1).
Figure 4.2.1: Academic and Research Staff Departmental career path structure
Head of Department (Senior
Management S1/S2 Grade)
Director/Research Centre
Director (J Grade)
Associate Professor (I Grade) Associate Head of
Department (I Grade)
Senior Research Fellow (H
Grade)
Senior Lecturer (H Grade)
Lecturer (G Grade) Research Fellow (G Grade)
Associate Lecturer (F Grade) Research Associate (F Grade)
Professor (J Grade)

46
Table 4.2.1: Percentage and Number of Staff by Contract Function (Headcount)
2014 2015 2016 2017 2018
Fem
ale
ECU
Ave
rage
17
/18
All
scie
nce
su
bje
cts
Mal
e E
CU
Ave
rage
17
/18
All
scie
nce
su
bje
cts
Fem
ale
n /
%
Mal
e n
/%
Fem
ale
n /
%
Mal
e n
/%
Fem
ale
n /
%
Mal
e n
/%
Fem
ale
n /
%
Mal
e n
/%
Fem
ale
n /
%
Mal
e n
/%
Associate Lecturers (Teaching -only)*
9 53%
8 47%
9 64%
5 36%
8 57%
6 43%
10 71%
4 29%
6 50%
6 50%
49%
51%
Teaching and Research
28 44%
35 56%
29 45%
36 55%
30 43%
39 57%
29 41%
42 59%
28 38%
45 62%
36%
64%
Research-Only 11 61%
7 39%
8 57%
6 43%
9 56%
7 44%
8 57%
6 43%
8 80%
2 20%
46%
54%
Senior Management
1 50%
1 50%
1 50%
1 50%
1 50%
1 50%
1 50%
1 50%
1 100%
0 0%
42%
58%
TOTAL 49 49%
51 51%
47 50%
48 50%
48 47%
53 53%
48 47%
53 53%
43 45%
53 55%
42%
58%
HR data is reported on a calendar year basis.
* Includes those with over 30hrs teaching per year, who are provided with a fixed-term contract
annually. For Associate Lecturers who exceed 0.4FTE, and are employed for over two years, there
is automatic progression to a Lecturer contract.
Figure 4.2.2: Percentage of Academic Staff (Headcount) by Gender and Grade
averaged 2014 to 2018
ResearchAssistant
ResearchFellow/Lecturer
Senior ResearchFellow/Senior
Lecturer
AssociateProfessor/Assoc
iate Head ofDepartment
Professor/Academic
Director/Headof Department
Female % 52% 57% 43% 56% 36%
Male % 48% 43% 57% 44% 64%
0%
10%
20%
30%
40%
50%
60%
70%
80%
90%
100%

47
Percentages of female and male staff are relatively aligned at many grades (Table 4.2.2)
and across teaching-only, research-only and teaching and research contracts (Figure
4.2.2).
Table 4.2.2: Percentage and Number of Staff (Headcount) by Grade
2014 2015 2016 2017 2018
Fem
ale
n /
%
Mal
e n
/%
Fem
ale
n /
%
Mal
e n
/%
Fem
ale
n /
%
Mal
e n
/%
Fem
ale
n /
%
Mal
e n
/%
Fem
ale
n /
%
Mal
e n
/%
Research Assistant (Grade F) Research-Only
5 56%
4 44%
4 67%
2 33%
2 50%
2 50%
0 0%
2 100%
2 50%
2 50%
Research Fellow (Grade G) Research-Only
5 83%
1 17%
3 60%
2 40%
6 67%
3 33%
7 78%
2 22%
5 100%
0 0%
Associate Lecturer (Grade G) Teaching-Only
9 53%
8 47%
9 64%
5 36%
8 57%
6 43%
10 71%
4 29%
6 50%
6 50%
Lecturer (Grade G) 0 0%
2 100%
0 0%
1 100%
1 20%
4 80%
1 17%
5 83%
2 40%
3 60%
Senior Research Fellow (Grade H) Research-Only
1 33%
2 67%
1 33%
2 67%
1 33%
2 67%
1 33%
2 67%
1 100%
0 0%
Senior Lecturer (Grade H) 18 45%
22 55%
20 47%
23 53%
21 47%
24 53%
20 43%
26 57%
17 38%
28 62%
Associate Professor/Associate Head of Department (Grade I)
5 56%
4 44%
4 44%
5 56%
4 57%
3 43%
5 71%
2 29%
6 55%
5 45%
Professor/Academic Director/Head of Department (Grade J/S1/S2)
6 43%
8 57%
6 43%
8 57%
5 36%
9 64%
4 28%
10 72%
4 31%
9 69%
TOTAL 49 49%
51 51%
47 49%
48 51%
48 47%
53 53%
48 47%
53 53%
43 45%
53 55%
We are focussing actions on two areas:
At Grade H a number of male appointments since 2016, alongside the promotion of
female staff to Grade I, means 38% of Senior Lecturers in DAS are female compared to
47% in 2016. We have actions to address this (Section 5.1(i)) and are seeing results (in
2019 three out of seven Senior Lecturer appointments were female). We expect to see
continued impacts from these actions in future years.
At Grade J, female staff has decreased to 31% from 42% in our 2016 application. A
female Professor was promoted to a Faculty role and one retired. Three of the Grade J
male staff are also part-time. Although the percentage of female staff at this level
remains considerably higher than national average for the sciences, we do not want this
to decrease further. The percentage of female staff at Grade I, Associate
Professor/Associate Head of Department, has increased to 55% female from 44% in our
2016 application. This will continue the pipeline of female staff progressing, alongside
actions outlined in Section 5.1(iii).

48
Figure 4.2.4: Percentage of staff by Teaching-Research, Research-only, and
teaching-only contract by Gender 2014 to 2018
2014 2015 2016 2017 2018
Male % 56% 55% 57% 59% 62%
Female % 44% 45% 43% 41% 38%
28 29 30 29 28
35 36 39 42 45
0%
10%
20%
30%
40%
50%
60%
70%
80%
90%
100%
Teaching-Research
2014 2015 2016 2017 2018
Male % 39% 43% 44% 43% 20%
Female % 61% 57% 56% 57% 80%
11 8 9 8
8
7 6 7 6
2
0%
10%
20%
30%
40%
50%
60%
70%
80%
90%
100%
Research Only
2014 2015 2016 2017 2018
Male % 47% 36% 43% 29% 50%
Female % 53% 64% 57% 71% 50%
99 8
10
6
85 6
4
6
0%
10%
20%
30%
40%
50%
60%
70%
80%
90%
100%
Teaching Only

49
Excluding Associate Lecturers who are all part-time, 16% of staff worked part-time
(Figure 4.2.5). Of these staff 10% (n=35) were female and 7% were male (n=25), lower
than national averages for both genders (female 14%, male 12%) although part-time
working and job share is well supported by DAS.
Figure 4.2.5: Percentage of staff by Full-Time, Part-Time contract by Gender 2014 to
2018
SILVER APPLICATIONS ONLY
Where relevant, comment on the transition of technical staff to academic
roles.
No technical staff have transitioned to academic roles in the last three years, however
technical staff have a number of routes for career progression through to higher grades
(Section 5.4).
2014 2015 2016 2017 2018
PT Female % 18% 21% 11% 16% 22%
FT Female % 82% 79% 89% 84% 78%
33 3034 32 29
7 86 6 8
0%
10%
20%
30%
40%
50%
60%
70%
80%
90%
100%
2014 2015 2016 2017 2018
PT Male % 14% 12% 6% 10% 13%
FT Male % 86% 88% 94% 90% 87%
37 38 44 44 41
6 5 3 5 6
0%
10%
20%
30%
40%
50%
60%
70%
80%
90%
100%

50
Table 4.2.3 Impact Good Practice Example
In 2018 DAS signed the Technicians Commitment. In July 2019 the first UWE Technician
Conference was held to focus on the future of the profession, innovation and creativity. 29
technicians who work with DAS attended the event. Coordinating with name removed, who
is leading on this work for the Faculty, we are aligning actions associated to technical staff
career development with the UWE Technician Commitment Action Plan.
(ii) Academic and research staff by grade on fixed-term, open-ended/permanent
and zero-hour contracts by gender
Comment on the proportions of men and women on these contracts. Comment on
what is being done to ensure continuity of employment and to address any other
issues, including redeployment schemes.
17% of research-only, teaching-only and teaching and research staff were on fixed-term
contracts since 2014, a small increase of 2% from our 2016 application, and with the
remaining staff on permanent contracts.
Figure 4.2.6: Percentage of Staff (Headcount) on a Fixed-Term contract by
Gender 2014 to 2018
2014 2015 2016 2017 2018
Fixed Term Female % 18% 17% 19% 25% 23%
Permanent Female % 82% 83% 81% 75% 77%
40 39 39 37 33
9 8 9 11 10
0%10%20%30%40%50%60%70%80%90%
100%

51
Since our first application in 2013, when 75% of fixed-term contracts were female staff,
58% of fixed-term contracts were for female staff between 2014 and 2018. Over the last
5 years, between 17-25% of female staff were on a fixed-term contract, compared to 10-
20% of male staff. This compares well to benchmarking (40% female, 37% males for STEM
subjects) but requires continued monitoring.
Table 4.2.4: Percentage and Number of Staff (Headcount) by type of contract
2014 2015 2016 2017 2018
Fem
ale
n /
%
Mal
e n
/%
Fem
ale
n /
%
Mal
e n
/%
Fem
ale
n /
%
Mal
e n
/%
Fem
ale
n /
%
Mal
e n
/%
Fem
ale
n /
%
Mal
e n
/%
Teaching - Research
Permanent 28 96%
33 92%
29 97%
36 97%
30 97%
37 92%
29 97%
41 95%
28 96%
44 98%
Fixed-Term 1 4%
3 8%
1 3%
1 3%
1 3%
3 8%
1 3%
2 5%
1 4%
1 2%
Research-only Permanent 5 45%
4 57%
4 50%
3 50%
5 56%
3 43%
4 50%
3 50%
3 38%
0 0%
Fixed-Term 6 55%
3 43%
4 50%
3 50%
4 44%
4 57%
4 50%
3 50%
5 63%
2 100%
Teaching-only Permanent 7 78%
4 50%
6 67%
4 80%
4 50%
4 67%
4 40%
4 100%
2 33%
4 67%
Fixed-Term 2 22%
4 50%
3 33%
1 20%
4 50%
2 33%
6 60%
0 0%
4 67%
2 33%
Fixed-term contracts are more common amongst research-only staff; 53% of research-
only staff were on a contract of this type, compared to 4% of teaching and research staff.
However, there is little variation by gender (52% female/53% male research only staff are
on fixed-term contracts).
To ensure continuity of employment for fixed-term staff, people managers and the
HoD, are informed when a contract is coming to an end. When contracts are unlikely to
be renewed (for example due to funding), a meeting is held on re-deployment
2014 2015 2016 2017 2018
Fixed Term Male % 20% 11% 17% 10% 10%
Permanent Male % 80% 89% 83% 90% 90%
4143 44
48 48
105 9
5 5
0%
10%
20%
30%
40%
50%
60%
70%
80%
90%
100%

52
opportunities at UWE. If a job opportunity arises for which they meet essential criteria
they must be offered the post.
Our staff focus group highlighted fixed-term research staff would like more integration
in DAS, mentoring, support, and reassurance around contractual processes.
‘Even as a post-doc, I think you kind of defer to the academics… But actually, sometimes
the post-docs are specialist in what they do, more so than the academics, because they're
on it and also with the research…maybe [there could be] more networking for post docs.
Just to be more visible really, that you’re there. Staff focus group, 2019
(iii) Academic leavers by grade and gender and full/part-time status
Comment on the reasons academic staff leave the department, any differences by
gender and the mechanisms for collecting this data.
Since 2014, 45 people left DAS, 48% were female (n=22), a 4% decrease since our last
application (Table 4.2.5).
< Information removed for confidentiality reasons >.
In 2017, ‘Department’ was added to the exit questionnaires all leavers are asked to
complete. Questionnaire outcomes are returned to DAS and key findings shared at the
Department Leadership Team (DLT) meetings. People managers encourage leavers to
complete the exit questionnaire at their final meeting. However, we still have limited
information from leavers, as very few staff indicate their Department.
Action: Improve post-doctoral researchers/fixed-term contract staff integration within the Department, mentoring, training and development opportunities (Action 5.10).
Action: Increase exit questionnaire responses, which can be the basis for information and actions amongst the Department Leadership Team (Action 5.11).

53
Table 4.2.5: Percentage and Number of Staff (Headcount) Leaving by Grade
< Information removed for confidentiality reasons >
Table 4.2.6 Sharing Good Practice Example
In March 2019 it was reported to the SAT that letters sent by HR to fixed-term staff three
months prior to a contract ending cause additional worry. We requested letter drafts,
reviewed them, and made recommendations that the tone and gratitude in the letters was
revised, and a reminder of the exit questionnaire included. HR made these changes, to be
applied across UWE in June 2019.

54
5. SUPPORTING AND ADVANCING WOMEN’S CAREERS
Silver: 6372 words
5.1. Key career transition points: academic staff
(i) Recruitment
Break down data by gender and grade for applications to academic posts
including shortlisted candidates, offer and acceptance rates. Comment on how
the department’s recruitment processes ensure that women (and men where
there is an underrepresentation in numbers) are encouraged to apply.
Table 5.1.1 Recruitment Action Progress and Impacts
Since our Athena SWAN Bronze 2013 and 2016 we have:
Improved and monitored gender balance throughout the recruitment process (including female contact people, gender balance in shortlisting and interview panels).
Analysed job descriptions for gender-neutral language, and female-friendly terms e.g. highlighting peer to peer support, references to flexible working.
Updated the Department information in recruitment information.
Circulated all job opportunities to staff with encouragement to share amongst personal/professional networks.
Trialled the use of WISE.
Ensured all managers, shortlisters and interview panel chairs, receive Recruitment and Selection training, including a 3-year refresher.
Standardised marking and feedback sheets at recruitment presentations.
Increased intersectionality at recruitment events by extending involvement in campus tours, and hosting, to more junior staff members.
As a result, numbers of female applicants have increased since our 2016 application and females are now more likely to be shortlisted and offered a post after interview.
Since 2013/14, 954 individuals applied for academic posts within DAS, 42% (n=397)
females and 58% (n=557) males (Figure 5.1.1). 84 people were offered posts (46% n=39
female/54% n=45 male).
Posts are advertised via the University website, specialist mailing lists, learned societies
and organisations. The University ‘Working Here’ website includes information on
family-friendly policies, equality and diversity, and features a strong female presence.
Job descriptions include information on equality and diversity, flexible working, job
share and Athena SWAN.

55
Figure 5.1.1: Percentage and Number of Applications
to Academic Posts (Headcount)
Table 5.1.2. Impact Good Practice Example
In 2017/18 we piloted post advertisements via the WISE network, including
a Senior Lectureship in Forensic Science where 60% (n=9) of applicants and
100% (n=4) of those shortlisted were female.
Although the female application rate was higher than average at that grade
(35%) no applicants identified the post via WISE. WISE will be used again for selected,
strategic appointments.
Though fewer female applicants apply they are more likely to be shortlisted. 25% (n=98)
of female applicants were shortlisted, compared to 19% of male applicants (n=106)
(Figure 5.1.2). Shortlisting is undertaken by at least two staff, and reasons for rejecting
candidates are recorded via Manager Self-Service (MSS). Internal applicants who are
not shortlisted are contacted with feedback. We detect no bias in the selection of
female applicants for shortlisting.
2013/14 2014/15 2015/16 2016/17 2017/18
Male % 52% 65% 61% 61% 57%
Female % 48% 35% 39% 39% 43%
12355 85 55 79
133103 131 84 106
0%
10%
20%
30%
40%
50%
60%
70%
80%
90%
100%
Action: Continue to improve the appeal of the Department as a place to work and study, increasing female applicants for Department job opportunities to 50%. (Action 3.1).
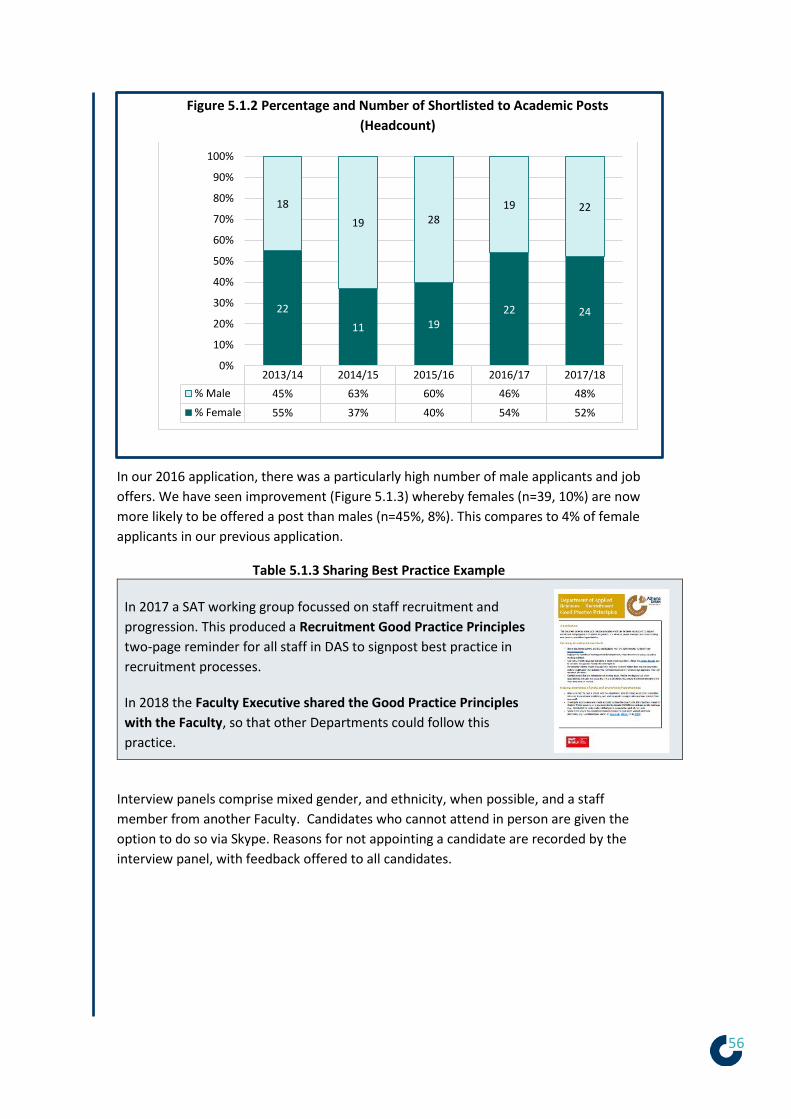
56
Figure 5.1.2 Percentage and Number of Shortlisted to Academic Posts
(Headcount)
In our 2016 application, there was a particularly high number of male applicants and job
offers. We have seen improvement (Figure 5.1.3) whereby females (n=39, 10%) are now
more likely to be offered a post than males (n=45%, 8%). This compares to 4% of female
applicants in our previous application.
Table 5.1.3 Sharing Best Practice Example
In 2017 a SAT working group focussed on staff recruitment and
progression. This produced a Recruitment Good Practice Principles
two-page reminder for all staff in DAS to signpost best practice in
recruitment processes.
In 2018 the Faculty Executive shared the Good Practice Principles
with the Faculty, so that other Departments could follow this
practice.
Interview panels comprise mixed gender, and ethnicity, when possible, and a staff
member from another Faculty. Candidates who cannot attend in person are given the
option to do so via Skype. Reasons for not appointing a candidate are recorded by the
interview panel, with feedback offered to all candidates.
2013/14 2014/15 2015/16 2016/17 2017/18
% Male 45% 63% 60% 46% 48%
% Female 55% 37% 40% 54% 52%
22
11 1922 24
18
19 2819 22
0%
10%
20%
30%
40%
50%
60%
70%
80%
90%
100%

57
Figure 5.1.3: Percentage and Number Offered Academic Posts (Headcount)
There is little variation amongst female and male applicants accepting their offer of
employment (92%, n=36 female and 93%, n=42 male) (Figure 5.1.4).
Figure 5.1.4: Percentage and Number Accepted Academic Posts (Headcount)
More men applied than women for all grades, apart from one KTP appointment. This
includes Research Associate (37% female, 63% male), Lecturer/Research Fellow (46%
female, 54% male) and Senior Lecturer/Senior Research Fellow (35% female, 65% male)
posts.
2013/14 2014/15 2015/16 2016/17 2017/18
% Male 39% 75% 67% 53% 41%
% Female 61% 25% 33% 47% 59%
8
36
913
5
912
109
0%
10%
20%
30%
40%
50%
60%
70%
80%
90%
100%
2013/14 2014/15 2015/16 2016/17 2017/18
% Male 33% 73% 71% 53% 39%
% Female 67% 27% 29% 47% 61%
8
3 5
911
5
8 12
107
0%
10%
20%
30%
40%
50%
60%
70%
80%
90%
100%

58
Table 5.1.4: Percentage and Number of Applications, Shortlisted, Offered and
Accepted by Grade (Headcount)
< Information removed for confidentiality reasons >

59
Despite higher numbers of applications from males, at all grades women were more
likely to be shortlisted than men, particularly at Grades I (62% females/24% males) and
J (85% females/38% males).
Similarly, at all grades women were more likely to be appointed, apart from at Grades G
and H. At Grade G, 39% (n=16) of shortlisted females and 42% (n=15) of males were
offered an appointment. At Grade H, 31% (n=8) of females and 36% (n=17) of males
shortlisted were offered an appointment.
(ii) Induction
Describe the induction and support provided to all new academic staff at all
levels. Comment on the uptake of this and how its effectiveness is reviewed.
Table 5.1.5 Induction Action Progress and Impacts
Since our Athena SWAN Bronze 2013 and 2016 we have:
Required new staff to engage with University induction processes.
Introduced new staff to the Department via email, subject group meetings and Department Forums.
Offered, when possible, the option between a female or male mentor/buddy.
Developed a Department Induction Handbook.
As a result, 100% of DAS staff have undertaken induction and we have seen increased uptake of our staff survey and awareness of gender equality amongst new staff.
All new staff are supervised through the induction and probation process, which
includes mandatory equality and diversity training and activities that are pertinent to
gender equality:
Induction checklist – staff are assigned a mentor or a buddy (a peer or
colleague for immediate advice) and information on training
opportunities and career progression.
Online induction – Overview of working at the University including
information on equality and diversity.
Welcome Fair – includes health and wellbeing support.
Benefits of working for the University – information on the childcare
voucher scheme, flexible working, job share, mental wealth etc.
Action: Increase the diversity of applicants, offers and acceptances for posts at Grades G (Lecturer/Research Fellow) and H (Senior Lecturer/Senior Research Fellow) (Action 3.2).

60
Figure 5.1.5: Working at the University – New starter information
Academic staff complete a funded Postgraduate Certificate in Academic Practice
(PgCAP) alongside a 20% reduction in their workload and new staff set professional
objectives, personal development and learning needs as part of the probationary
process. Staff survey results demonstrate increasing responses from new staff but we
do not currently ask questions specific to induction processes.
Figure 5.1.6: 2016 to 2019 new staff survey results
Temporary staff and Associate Lecturers are offered a bespoke induction process but we
aspire to improve their induction experiences.
42% (n=41, 42% females, 44% males) of our staff survey respondents in 2019 had worked for UWE for under 5 years compared to 27% (n=16) in 2016.
All staff (23 females, 18 males), who had joined the department since 2014, were aware of equality and diversity training.
80% (n=32) of staff, who had joined the department since 2014, agreed or strongly agreed that they are encouraged to undertake activities that contribute to their career.

61
(iii) Promotion
Provide data on staff applying for promotion and comment on applications and
success rates by gender, grade and full- and part-time status. Comment on how
staff are encouraged and supported through the process.
Table 5.1.6 Promotion Action Progress and Impacts
Since our Athena SWAN Bronze 2013 and 2016 we have:
Moved promotion information to the electronic recruitment system, providing records for all staff promotions.
Improved awareness of promotional processes and criteria, and the perception that there is no variation on treatment of staff on the basis of gender from 60% in 2016 to 82% in 2019.
Lobbied for the introduction of a University-led annual promotion scheme.
As a result, there has been an increase in staff reporting promotion, some improvements of awareness of the processes and increased female staff are promoted due to internal and external promotion opportunities.
Figure 5.1.7 Career Progression Structure
Action: Introduce a series of questions to the Athena SWAN staff survey, which are focussed on staff induction experiences (Action 5.1).
Action:
Introduce an annual Department level induction event for new staff, including Associate Lecturers (0.2 FTE contracts) (Action 5.1).

62
Staff can apply for an internal promotion opportunity, an externally and internally
advertised post at a higher grade or be re-graded if performing beyond their role
(Figure 5.1.7). For promotion above Senior Lecturer/Research Fellow, UWE currently
has an atypical approach. Staff can only apply for a higher grade when it is identified by
Departments/Faculties, following a Business Case and internal/external advertising. 37
members of staff have been promoted since 2014, comprising 46% (n=17) female and
54% (n=20) male staff (Figure 5.1.8).
Figure 5.1.7: Percentage and Number of Staff (Headcount) promoted over all
grades
More staff in our 2019 staff survey reported being promoted and there was evidence of
increased use of temporary uplifts/promotions to support readiness for promotion to a
post at a higher grade (14% of staff who had been promoted in 2019).
Figure 5.1.9: 2016 to 2019 staff survey results in relation to promotion
2014 2015 2016 2017 2018
% Male 36% 100% 43% 50% 67%
% Female 64% 0% 57% 50% 33%
74
3
3
4
4
33
6
0%
10%
20%
30%
40%
50%
60%
70%
80%
90%
100%
38% (n=27, 28% females, 29% males) had been promoted to a higher grade in the last three years compared to 19% (n=11) in 2016.
82% (n=61, 79% females, 86% males) percieved there was no difference in the Department's treatment of staff in relation to promotion on the basis of gender compared to 60% (n=36) in 2016.
48% (n=45, 48% females, 50% males) had good or some knowledge of UWE's promotion process compared to 58% (n=35) in 2016.

63
Since our 2013 staff survey, we have seen considerable improvement in staff awareness
of promotion processes, but our 2019 staff survey alerted us to newer staff and those
at lower grades, being less familiar.
70% (n=26) of staff were promoted due to an internal promotion opportunity or an
externally and internally advertised post at a higher grade, and 30% (n=11) of staff
through re-grading. In our 2016 application female staff were much more likely to be
promoted via re-grading (50%). We now see increased female progression via internal
promotion opportunities or an externally and internally advertised post at a higher
grade (65% females).
Figure 5.1.10: Percentage and Number of Staff (Headcount) promotion route
2014-2018
At most grades there is little variation in success rates by gender (Figure 5.1.11). The
main grade demonstrating any variation is H, whereby 71% of those promoted to Senior
Lecturer/Senior Research Fellow roles were male. More male staff are being appointed
at Grade G, who are then progressing to H when they reach the bar for that grade
and/or take on module or programme leadership roles.
Internalpromotion/internal/external post
Re-grading
Male % 58% 46%
Female % 42% 54%
116
155
0%
10%
20%
30%
40%
50%
60%
70%
80%
90%
100%
Action: Ensure that all members of staff are familiar with the criteria and procedures for promotion (Action 6.1).
Action: Address lower numbers of female staff being promoted (Action 6.2).

64
Figure 5.1.11: Percentage and Number of Staff (Headcount) promotion by grade
2014-2018
Table 5.1.7: Percentage and Number of Staff (Headcount) promoted by grade
Promotion to Grade 2014 2015 2016 2017 2018
Fem
ale
n /
%
Mal
e n
/%
Fem
ale
n /
%
Mal
e n
/%
Fem
ale
n /
%
Mal
e n
/%
Fem
ale
n /
%
Mal
e n
/%
Fem
ale
n /
%
Mal
e n
/%
Grade F (Research Assistant)
Grade G (Lecturer/Research Fellow)
2 100%
1 100%
3 75%
1 25%
Grade H (Senior Lecturer/Senior Research Fellow)
2 33%
4 67%
2 100%
1 50%
1 50%
1 25%
3 75%
Grade I (Associate Professor/Associate Head of Department)
2 100%
1 100%
2 67%
1 33%
2 40%
3 60%
Grade J (Professor/Academic Director/Head of Department)
1 100%
1 33%
2 67%
1 100%
TOTAL BY YEAR 7
64% 4
36% 0
0% 4
100% 4
57% 3
43% 3
50% 3
50% 3
33% 6
67%
Since 2016, all promotions use our electronic recruitment system, but we have not
been able to distinguish appointments by full and part-time status or fully detail the
journey from application/shortlisting/offer for internal candidates only and this needs
resolving in order that we can clearly identify more detailed trends in our data.
Grade F Grade G Grade H Grade I Grade J
Male % 0% 29% 71% 46% 60%
Female % 0% 71% 29% 54% 40%
5
4
62
2
10
53
0%
10%
20%
30%
40%
50%
60%
70%
80%
90%
100%
Action: Improve record keeping for staff applying for promotional opportunities that are advertised both externally and internally, including whether the posts are full or part-time (Action 6.5).

65
Individual feedback is offered to all staff applying for promotion, and career progression
is important in DAS, as reflected in 2019 staff survey where it was rated second in priority
for future actions. Much of the frustration expressed around promotion relates to the
promotional system at UWE.
‘Opportunities within senior management across UWE are very limited and tend to be
very polarized as either teaching or research based.’ (Staff survey 2019, Female,
academic)
The problem at UWE is a lack of career opportunities for EVERYONE, regardless of
[gender] (Staff survey 2019, Male, academic)
Since our 2016 application, UWE has clarified the structure to progress to Associate
Professor through teaching and learning. We continue to lobby the University for a
University-led annual promotion scheme to alleviate staff concerns regarding the equity
of the business case model. Consultation and negotiation took place between the
University and the joint trade unions in early 2019, but no agreement was reached. The
joint trade unions have recently agreed to undertake talks at the conciliation service
ACAS, in order to set out the terms of any future talks.
(iv) Department submissions to the Research Excellence Framework (REF)
Provide data on the staff, by gender, submitted to REF versus those that were
eligible. Compare this to the data for the Research Assessment Exercise 2008.
Comment on any gender imbalances identified.
34 staff were submitted to REF 2014 to four Units of Assessment, an increase in number
from 2008. Two UoA’s (3 and 6) were led by staff (2 female, 1 male) in DAS. 38% (n=13)
of staff submitted were female, increasing from 2008 and beyond the national average
(32%). Seven early career researchers and two staff who had taken a career break
(including maternity leave) were entered in 2014, compared to no staff in these
circumstances in 2008.
Table 5.1.8: Percentage and Number of Department Staff Entered in REF 2008
and 2014
Staff RAE 2008 REF 2014 National Average
(HEFCE, 2015)
Fem
ale
n
Fem
ale
%
Mal
e n
Mal
e %
Fem
ale
n
Fem
ale
%
Mal
e n
Mal
e %
Fem
ale
%
Mal
e %
Female/Male 5 24% 16 76% 13 36% 23 64% 32% 68%
Early Career Researcher
0 0% 0 0% 4 57% 3 43% 38% 62%
Career Break 1 50% 1 50% - -
Part-Time 1 33% 2 67% 40% 60%

66
Figure 5.1.12: Percentage and Number of Department Staff Eligible and Entered
in REF 2014
In 2014, eligible female staff in DAS, were less likely to be entered than eligible male
staff (Figure 5.1.7). HEFCE ascertained that nationally there were differences in
selection for REF 2014 (67% males, 51% females) and due to a range of factors
(including career breaks, subject area etc.).
In planning for REF 2021, two female staff members were appointed to lead UoA3 and
6. Both have had unconscious bias training. An up-to-date REF CV has helped to inform
selection of outputs. A new Code of Practice has been designed, with staff encouraged
to report equality-related circumstances affecting productivity during the assessment
period, via a confidential and supportive structure. Combined with actions in Section
5.3, we anticipate increased numbers of female staff outputs will be included in
REF2021, but data is not yet available.
Table 5.1.9 Sharing Good Practice Example
In spring 2019, the REF Code of Practice was an agenda item at a SAT meeting. We fed back
via the University Athena SWAN Steering Group, including the recommendation that there
be clarification around census dates for inclusion for staff on periods of extended leave (e.g.
maternity).
Female Eligible % Male Eligible %
REF 2014 34% 42%
13
21
0%
5%
10%
15%
20%
25%
30%
35%
40%
45%
50%
Action: Monitor the gender, part-time/full-time status, and career breaks of researchers entered to REF2021, as well as any implications of the use of the REF Code of Practice (Action 6.4).

67
SILVER APPLICATIONS ONLY
5.2. Key career transition points: professional and support staff
(i) Induction
Describe the induction and support provided to all new professional
and support staff, at all levels. Comment on the uptake of this and how
its effectiveness is reviewed.
(ii) Promotion
Provide data on staff applying for promotion, and comment on
applications and success rates by gender, grade and full- and part-time
status. Comment on how staff are encouraged and supported through
the process.
Professional and support staff have identical induction opportunities as academic staff
(Section 5.1ii), completed by all new appointees but with alternative training and
development to the PgCAP. As technical staff are managed at Faculty level and
professional staff operate as a centralised University service, we cannot provide
Department level promotion data for these staff. However, our 2019 survey results
indicated that 17% (n=5, 4 female) had received a permanent promotion in the last
three years, and 7% (n=3, 2 female) had experienced a temporary promotion.
5.3. Career development: academic staff
(i) Training
Describe the training available to staff at all levels in the department. Provide
details of uptake by gender and how existing staff are kept up to date with
training. How is its effectiveness monitored and developed in response to levels of
uptake and evaluation?
Table 5.3.1 Academic Staff Training Action Progress and Impacts
Since our Athena SWAN Bronze 2013 and 2016 we have:
Encouraged uptake of training via Personal Development Reviews (PDR).
Booked Learning Development Centre (LDC) courses via Employee Self Service (ESS) with people managers notified when staff book.
Invested in equality and diversity training for all Department staff at annual Away Days.
As a result, over 90% of staff have engaged in equality and diversity training, more female staff continue to undertake training and 86% of staff report that they are kept up-to-date with Department training and development.
Staff engage in a variety of training, including online training, and the ability to request
internal and external training via their PDR, which includes planned development
objectives for the year (Figure 5.3.1). Training prepares staff for future promotion

68
opportunities and staff can be funded by DAS or the staff sponsorship scheme to take
UWE modules/programmes and may be given study leave.
Figure 5.3.1 Training Opportunities
UWE provides mandatory training, including on equality and diversity, strengthening
awareness of gender equality amongst staff. There is good uptake of this training, at all
grades, but the local recording mechanism notes the most recent engagement, as
opposed to all training undertaken.
We are currently unable to reliably examine data on mandatory training annually (Table
5.3.2) or by grade. However, 48% (n=150) of mandatory training has been taken up by
female staff, with 90% of female staff and 95% of male staff undertaking mandatory
equality and diversity training since 2014.
• Ad hoc department training (e.g. Working with Biological Agents)
•Training identified in PDR
•Annual Away Day Training
•DLT training (e.g. managing performance)
Department
• Ad Hoc Faculty training (e.g. GDPR, accessibility)
•Annual Staff Development programme (e.g. module and programme leadership)
Faculty •UWE Induction Programme
•PgCAP
•Learning Development Centre training
•Registering for modules and programmes
•Staff sponsorship scheme
University
Action: Increase staff awareness that staff training records are available on Employee Self-Service, increase personal recording and include a more extensive range of training on Employee Self-Service records (Action 5.6).

69
Table 5.3.2: Percentage and Number of Staff (Incidences) participating in
mandatory UWE training
2014 - 2018
Fem
ale
n /
%
Mal
e n
/%
Fire Safety 52 49%
54 51%
Equality and Diversity 52 47%
58 53%
Information Security and Data Protection 46 49%
48 51%
TOTAL 150 48%
160 52%
Department record includes female (n=58) and male staff (n=61) employed within DAS over this
time.
Table 5.3.3 Impact Good Practice Example
Following unconscious bias training at our 2016 Department Away Day, in 2019 we commissioned an external trainer to deliver an unconscious bias update and a session on Inclusive Teaching. 63 Department staff participated.
97% (n=92) of staff in our 2019 survey said they were aware of or had participated in Equality and Diversity Training compared to 88% (n=52) in 2016.
‘The equality & diversity / inclusivity training has been good. We are starting the journey and everyone may now have realised we are on one… I think this will take some time to address but will only change with persistent and consistent messaging and training.’
Female academic, staff survey, 2019.
Training is also provided by UWE’s Learning and Development Centre (LDC). This
includes a range of face-to-face and online courses (Figure 5.3.2) and accredited
courses (e.g. Institute in Leadership and Management).

70
Figure 5.3.2: UWE Learning and Development Course Extract
There is good uptake of this training (Table 5.3.4) and 63% (n=292) of all training
opportunities are taken by female staff, compared to 37% (n=174) of male staff. The
LDC also manages the staff sponsorship scheme, however few DAS staff use this and it
requires further promotion.
Table 5.3.4: Percentage and Number of Staff (Incidences) participating in
training offered by the Learning and Development Centre
2014/15 2015/16 2016/17 2017/18 2018/19
Fem
ale
n /
%
Mal
e n
/%
Fem
ale
n /
%
Mal
e n
/%
Fem
ale
n /
%
Mal
e n
/%
Fem
ale
n /
%
Mal
e n
/%
Fem
ale
n /
%
Mal
e n
/%
Equality and Diversity*
1 100%
1 100%
4 40%
6 60%
17 71%
7 29%
3 75%
1 25%
Health and Safety 2 50%
2 50%
44 57%
33 43%
15 47%
17 53%
1 20%
4 80%
IT 7 54%
6 46%
13 87%
2 13%
14 61%
9 39%
1 100%
4 25%
12 75%
Learning and Teaching
2 100%
Management and Leadership
1 50%
1 50%
9 60%
6 40%
22 65%
12 35%
14 93%
1 7%
26 76%
8 24%
Personal Development
3 60%
2 40%
13 72%
5 28%
7 39%
11 61%
34 71%
14 29%
22 76%
7 24%
Wellbeing 2 40%
3 60%
3 100%
4 80%
1 20%
1 33%
2 67%
1 100%
Staff Sponsorship Scheme
1 50%
1 50%
1 100%
TOTAL 16 53%
14 47%
39 75%
13 25%
96 57%
73 43%
84 67%
42 33%
57 64%
32 36%
*Equality and Diversity training is a distinct programme and is not the UWE mandatory training
Since 2016 there has been increased awareness of Department training and
development in our staff survey results (Figure 5.3.3). Satisfaction with training
opportunities remains high, however we have noted that staff are becoming less aware

71
of University training provision, particularly when new to UWE. Post-course evaluation
improves the training offered in future.
Figure 5.3.3: Training and Development Staff Survey Results
(ii) Appraisal/development review
Describe current appraisal/development review schemes for staff at all levels,
including postdoctoral researchers and provide data on uptake by gender. Provide
details of any appraisal/review training offered and the uptake of this, as well as
staff feedback about the process.
Table 5.3.6 Appraisal Action Progress and Impacts
Since our Athena SWAN Bronze 2013 and 2016 we have:
Altered the way Personal Development Reviews are monitored, identifying non-completions annually.
Scheduled PDR’s earlier to feed into workload planning.
PDR reviewers attend mandatory PDR training.
Provided an annual briefing for PDR reviewers.
Given AHoD’s access to PDR’s to identify issues specific to their subject groups and common themes.
As a result, over 94% of staff have engaged in the PDR process and there is very little variation in the uptake or satisfaction with PDR processes, on the basis of gender.
All staff (including postdoctoral researchers/associate lecturers), have an annual PDR,
apart from those on probation. In 2018, the PDR process was revised, as part of People
and Performance 2020, to place greater emphasis on planning professional and
personal development around roles, values and behaviours. The PDR occurs in the
context of an individual’s circumstances, including working hours, periods of parental
leave etc. and now incorporates the opportunity for a mid-cycle review.
86% (n=79, 88% females, 87% males) are kept up-to-date with Department development and training opportunities compared to 84% (n=49) in 2016.
72% (n=64, 76% females, 69% males) are kept up-to-date with University development and training opportunities compared to 78% (n=45) in 2016.
81% (n=76, 83% females, 79% males) say they have been supported to undertake further academic or professional training compared to 78% (n=46) in 2016.
Action: Increase uptake of internal and external staff development courses and activities by staff of all genders to increase readiness for promotion opportunities in future (Action 5.5).

72
Since our 2016 application, on average 94% of female and 95% of male staff have
completed a PDR annually (Figure 5.3.4).
Figure 5.3.4: Completion Rates of Eligible Staff (Headcount) participating in a
PDR
*2014 data is not included due to a change in the recording that year, 29 female staff and 30
male staff had PDR’s in 2014 but this was not recorded by % eligible.
In our 2019 staff survey, 91% (n=78, 89% females, 87% males) reported being appraised
regularly in the last three years compared to 88% in 2016 and 68% in 2013. Whilst there
had been improving satisfaction with the PDR process only 47% (n=38, 63% females,
32% males) of staff in 2019 saw the PDR process as useful and professionally valuable.
We plan further investigation as to whether dissatisfaction is due to gender alone,
variation amongst PDR reviewers, staff expectations or the new PDR documentation.
Maggie - It's [PDR] a good way of letting the manager know what you do though
All - Yeah yeah
Tara- Well I don't like the questions in the new forms. I can't remember the phrasing of
them now, but…I find it difficult to place myself. I think it's something to do with… ‘How
have you benefited the university?’. Well, I've done my job! I really struggle with those
new questions. (2019 Focus Group)
2014 2015 2016 2017 2018
Female % 0% 97% 100% 91% 90%
Male % 0% 100% 98% 87% 95%
39 3631 35
39 4135
39
0%
10%
20%
30%
40%
50%
60%
70%
80%
90%
100%
Action: Ensure that all staff are appraised annually via their PDR and increase percentage of staff who see it as useful and professional valuable to 75%. (Action 5.3).

73
(iii) Support given to academic staff for career progression
Comment and reflect on support given to academic staff, especially postdoctoral
researchers, to assist in their career progression.
Staff, including postdoctoral researchers, are supported to develop their career
progression via a range of mechanisms (Figure 5.3.2), alongside PDR’s and
conversations with managers.
DAS signposts staff to Human Resources who, as part of People and Performance 2020,
have enhanced progression information. This includes how to apply for roles, the
knowledge, skills and experience needed, and developing to meet those expectations.
Since our 2016 application, there has been an increased focus on progression of careers
in learning and teaching, particularly relevant to staff in DAS. The Department now
monitors staff who have FHEA Fellowships, and actively encourages staff to apply for
SFHEA Senior Fellowships.
Staff are encouraged to use resources, including telephone career guidance, careers
coaching, secondments, shadowing and voluntary opportunities to build experience.
DAS particularly encourages a number of staff development schemes with good uptake
from female staff (91%, n=11, Table 5.3.7) since 2014,
including:
REACH UWE’s talent management programme seeks
to develop and retain staff pursuing posts at a higher
level.
UWE Women Researchers Mentoring Scheme (WRMS)
is open to all females in academic or research roles,
including postdoctoral researchers.
Aurora a women-only leadership development
programme run by Leadership Foundation. In 2019,
the UWE Women’s Forum created an Aurora Alumni
Network.
Stepping Up a training and mentoring scheme
dedicated for UWE’s BAME staff.
UWE also holds a mentoring database, where staff members
may approach mentors beyond these schemes. WLB are
available for mentors and mentees on all schemes. Since
2016, for all schemes where DAS nominates participants, we
have moved to Expressions of Interest, to ensure opportunities are provided fairly and
transparently.
<Image removed>
Figure 5.3.5 Aurora Tweet

74
Table 5.3 7: Percentage and Number of Staff (Incidences) participating in
mentoring schemes
2014 2015 2016 2017 2018
Fem
ale
n /
%
Mal
e n
/%
Fem
ale
n /
%
Mal
e n
/%
Fem
ale
n /
%
Mal
e n
/%
Fem
ale
n /
%
Mal
e n
/%
Fem
ale
n /
%
Mal
e n
/%
REACH*
1 100%
2 100%
WRMS (inc. mentors and mentees)
2 100%
1 50%
1 50%
1 100%
1 100%
Aurora 2 100%
1 100%
TOTAL 2 100%
3 75%
1 25%
1 100%
1 100%
4 100%
* Some programmes do not run on an annual basis and data is unavailable for Stepping Up.
Table 5.3.8 Sharing Best Practice Example
In 2018 at a Faculty Forum co-organised by our HoD staff shared their experiences of
mentoring schemes, including REACH and Aurora to increase awareness and uptake amongst
all staff.
(iv) Support given to students (at any level) for academic career progression
Comment and reflect on support given to students at any level to enable them
to make informed decisions about their career (including the transition to a
sustainable academic career).
Employability is a key UWE agenda and DAS encourages student uptake of programmes
including the UWE Bristol Futures Award, designed for female and male students to
heighten their graduate prospects. UWE’s careers service is available for three years
after graduation.
Since 2016, DAS has invested heavily in additional employability support, including:
The Department organised Science Futures Fair, now one the largest applied
sciences employability events in the UK, and the largest careers event by any
Department at UWE. Speakers are representative in terms of gender,
intersectionality and are often UWE alumni.
Action: Increase staff participation in mentoring schemes, including (when appropriate) the Women Researchers Mentoring Scheme (WRMS) (Action 5.4).

75
The Department Employability Blog and Employability Programme provides
monthly workshops, trips to the national Biosciences Career Day, alumni
networking events, and support to join professional societies.
Social media comprises a dedicated LinkedIn group (Department of Applied
Sciences UWE), twitter accounts (@UWE_SciFutures) and handles
(#ScienceFutures2020).
This work aims to address the BAME student attainment gap, a key focus in DAS, as well
as supporting female and male student progression. Our most recent BAME student
attainment gap data demonstrates a decrease from 17% in 2016/17 to 10% in 2018/19
and though more work is needed, DAS now has the second lowest attainment gap of all
Departments at UWE.
Figure 5.3.6: Department Science Employability Events
<Image removed>
DAS utilises the Academic Personal Tutor system offering one-to-one advice on
academic progression to students for the duration of their programme. We are
currently refreshing APT so that it can embed gender equality and unconscious bias
training for students, promoting best practice as they advance in their chosen careers.
Action: Increase awareness of Athena SWAN amongst current undergraduate and postgraduate students, including via the Academic Personal Tutoring Programme (APT) (Action 2.1).

76
PGT and PGR students primarily work with supervisors but are also supported by
extensive resources. The UWE Graduate School provides guidance for students and
supervisors, aligning to VITAE best practice and is well suited for students continuing
their careers at UWE or elsewhere.
Table 5.3.9 Impact Good Practice Example
It was reported to the SAT (March 2018) that PhD students had negative feedback on a
Graduate School session on Women and Careers and were experiencing variation in how
understanding supervisors were of caring responsibilities. Working with the UWE Graduate
School manager we were able to influence changes to the training and the information
provided to supervisors, applied across UWE, from June 2018.
(v) Support offered to those applying for research grant applications
Comment and reflect on support given to staff who apply for funding and what
support is offered to those who are unsuccessful.
Staff applying for external research funding are supported by UWE’s Research, Business
and Innovation (RBI) team who offer support ranging from bid writing, to overseeing
internal processes and procedures via PASS, UWE’s project approval system. For
researchers applying for UKRI funding there is a compulsory peer review process,
involving two experienced researchers.
The Researchers Forum, provide peer and informal mentoring, whilst UWE continues to
hold a European Commission HR Excellence in Research Award. Internal bidding
opportunities, including the Vice-Chancellor’s Early Career Researchers Award provide
post-doctoral researchers opportunities to achieve funding, develop bids, and/or
internal feedback.
In DAS, male staff more frequently lead external research funding applications, with
male PI’s making 61% (n=188) of applications since 2013/14, compared to 39% (n=121)
led by female staff (Figure 5.3.7). However, the success rate of applications is
comparable (40% n=49 female, 41% n=78 male applications) (Figure 5.3.8) and female
< Information removed for confidentiality reasons >

77
staff are equally likely to be successful. Unsuccessful applicants are supported via PDRs,
and Centre Directors, to consider further opportunities for funding, research mentoring,
internal funding opportunities or to apply again. We believe the way our PASS system
records applications, may be under-reporting female staff involvement.
Figure 5.3.7: Staff (PI) Percentage and Number applying for external funding
Figure 5.3.8: Staff (PI) success rate in external funding
2013/14 2014/15 2015/16 2016/17 2017/18
Male % 56% 59% 60% 58% 68%
Female % 44% 41% 40% 42% 32%
28 26 21 2224
36 38 32 3151
0%
10%
20%
30%
40%
50%
60%
70%
80%
90%
100%
2013/14 2014/15 2015/16 2016/17 2017/18
Female % 36% 61% 33% 41% 29%
Male % 67% 21% 59% 39% 29%
10
16
7
9
7
24
8
19
12
15
0%
10%
20%
30%
40%
50%
60%
70%
80%
Action:
Lobby the University for changes to the PASS system which records by principal investigator only and may distort the contributions of staff to applications, including fixed-term and postdoctoral researchers, contributions to bidding (Action 6.7).

78
Since our 2016 application, we have monitored internal Faculty funding schemes which
contribute to readiness to bid externally. These are internally funded workload bundles,
supporting staff time for grant application and publishing, and the Faculty QR scheme,
supporting small-scale research projects, aiming for external funding. There is little
variation by gender in terms of allocation from these schemes, but there is less uptake
of internally funded WLB by women (Table 5.3.10) which warrants further promotion.
Table 5.3.10: Percentage and Number of Staff (Headcount) receiving internal
Faculty funding
Application Year 2014/15 2015/16 2016/17 2017/18 2018/19
Fem
ale
n /
%
Mal
e n
/%
Fem
ale
n /
%
Mal
e n
/%
Fem
ale
n /
%
Mal
e n
/%
Fem
ale
n /
%
Mal
e n
/%
Fem
ale
n /
%
Mal
e n
/%
Faculty QR Funding 1 10%
9 90%
5 50%
5 50%
4 100%
5 62%
3 38%
1 100%
Faculty Individual WLB Funding
5 36%
9 64%
4 36%
7 64%
3 25%
9 75%
TOTAL 9 50%
9 50%
9 47%
10 53%
4 31%
9 69%
Data is unavailable on the individual WLB scheme before 2016/17
All academic staff are allocated 75 WLB (equates to five weeks) per year for scholarly
activity, however staff frequently report that they do not use this time and DAS is
addressing this in 2020.
Action: Increase staff uptake of scholarly activity by introducing a two-week scholarly activity period when no departmental activities are scheduled, and including scholarly activity on the workload model as a reminder to staff to utilise this time (Action 6.6).

79
SILVER APPLICATIONS ONLY
5.4. Career development: professional and support staff
(i) Training
Describe the training available to staff at all levels in the department.
Provide details of uptake by gender and how existing staff are kept up
to date with training. How is its effectiveness monitored and developed
in response to levels of uptake and evaluation?
(vi) Appraisal/development review
Describe current appraisal/development review schemes for
professional and support staff at all levels and provide data on uptake
by gender. Provide details of any appraisal/review training offered and
the uptake of this, as well as staff feedback about the process.
(ii) Support given to professional and support staff for career progression
Comment and reflect on support given to professional and support staff
to assist in their career progression.
Professional and support staff (see Section 5.3 i-iii), follow the same process as
academic staff for training, appraisal, and career progression, with bespoke training for
their roles (Figure 5.4.1). As technical staff are managed at Faculty level and
professional staff operate as a centralised University service, we cannot provide data
for these staff. 2019 staff survey results demonstrate improvements in training and
appraisal however, and we continue to work on increased awareness of progression.
Figure 5.4.1: 2016 to 2019 staff survey results training, appraisal and promotion
professional and technical staff
86% (n=24, 86% females, 87% males) had been supported to undertake further training compared to 71% in 2016.
92% (n=25, 89% females, 100% males) had been appraised (via PDR) regularly in the past three years compared to 87% in 2016.
79% (n=23, 90% females, 67% males) had good, some or a little knowledge of UWE promotion processes, and 70% (n=21, 89% females, 55% males) of UWE promotion criteria in 2019.

80
5.5. Flexible working and managing career breaks
Note: Present professional and support staff and academic staff data separately
Table 5.5.1 Flexible working and managing career breaks Action Progress and Impacts
Since our Athena SWAN Bronze 2013 and 2016 we have:
Signposted information on maternity, paternity and carers leave, and UWE staff networks, at DAS away days, to reach all staff.
Included the first Department staff member to use shared parental leave in the Athena SWAN website case studies.
Continued to encourage uptake and awareness of flexible working, amongst people managers and staff.
As a result, our staff survey results on maternity, adoption and carers leave have improved, with increased uptake of keeping in touch days and a decrease in staff reporting it is difficult to return from leave. 99% (n=87) of staff now report flexibility in hours/days worked/work pattern compared to 91% (n=53) in 2016.
(i) Cover and support for maternity and adoption leave: before leave
Explain what support the department offers to staff before they go on maternity and
adoption leave.
Staff taking maternity/adoption leave meet with HR and their people manager,
supported by a maternity checklist, and guide for managers. DAS has been working
towards redistributing work or having staff appointed earlier in advance of the person
departing, to mitigate impacts and better support staff.
Our 2016 application identified people were having a mixed experience of
maternity/adoption leave, depending on their people managers. Our 2019 survey
results demonstrate improvements across all questions associated to maternity,
paternity and adoption leave (Figure 5.5.1).
Action: Ensure that all members of staff are familiar with the criteria and procedures for promotion (Action 6.1).
Action:
Improve the process to collate data, identify and action change for technical and professional service staff (Action 1.6).

81
Figure 5.5.1: 2016 to 2019 staff survey results ‘when you last went on
maternity/paternity/shared adoption leave what was provided beforehand’
Figure 5.5.2: Parental Information
Table 5.5.2 Sharing Good Practice Example
In 2018 the SAT examined UWE website maternity advice for students and identified
problems with content and accessibility. Working with the Head of Student Administration
and Advice we were able to make materials more user friendly and inclusive in tone (e.g.
including information on paternity, shared and adoption leave), easier to find and with the
materials re-launched across UWE Bristol in March 2019.
74% (n=6, 80% females, 67% males) had provision or access to useful advice compared to 60% (n=6) in 2016.
0% (n=0) said assistance with cover arrangements was not available but they would have liked it compared to 22% (n=2) in 2016.
49% (n=4, 40% females, 67% males) said a meeting with the HoD was available to them compared to 40% (n=4) in 2016. Only one respondent said it was not available and they would have liked it.
82
(ii) Cover and support for maternity and adoption leave: during leave
Explain what support the department offers to staff during maternity and adoption
leave.
Staff have continued IT/UWE facilities access and DAS invites staff to (optionally)
participate in away days, key meetings and social events. Staff can plan with their
people manager to use their ‘keeping in touch’ as they choose and can bring their child
to non lab-based events. 74% (n=6, 60% females, 67% males) of 2019 survey
respondents indicated they had kept in touch whilst away, compared to 67% in 2016.
(iii) Cover and support for maternity and adoption leave: returning to work
Explain what support the department offers to staff on return from maternity
or adoption leave. Comment on any funding provided to support returning staff.
Returning staff are reminded about flexible working, working from home, feeding
facilities, accrued leave and the University’s childcare voucher scheme. In our 2019 staff
survey, 50% (n=4, 40% females, 67% males) of respondents had used flexible working
on their return to work, and no staff said flexible working was unavailable to them and
needed.
(iv) Maternity return rate
Provide data and comment on the maternity return rate in the department. Data of staff
whose contracts are not renewed while on maternity leave should be included in the
section along with commentary.
10 staff have taken maternity/shared parental leave, including our first shared parental
leave instances, which we have featured in a case study, to inform others of this option.
Table 5.5.3.: Number of Female Department Staff (Headcount) taking maternity
leave
< Information removed for confidentiality reasons >
* Shared parental leave
Action: Continue to ensure that all people managers are familiar with the UWE guidance and advice for maternity, adoption, paternity and carers leave to improve provision or access to useful advice to 100% of respondents (Action 4.4).
Action: Continue to emphasise role of the Parents group for peer support and advice, and create a list of Department maternity/paternity/adoption and shared parental leave mentors (Action 4.5).

83
< Information removed for confidentiality reasons >
All staff returned from leave and have remained in post six, 12 and 18 months after
return. In our 2019 staff survey, respondents reporting it was difficult or very difficult to
return from maternity/paternity/shared/adoption leave decreased from 22% (n=2) in
2016 to 0%.
(v) Paternity, shared parental, adoption, and parental leave uptake
Provide data and comment on the uptake of these types of leave by gender and
grade. Comment on what the department does to promote and encourage take-
up of paternity leave and shared parental leave.
Uptake of paternity leave and shared parental leave remains low (Table 5.5.4) despite
encouragement. Staff are taking leave, but this is frequently being recorded as annual
leave rather than paternity leave. There have been no recorded instances of adoption
leave. Parental leave is recorded as ‘carer’s leave’ as it is also applicable to staff who are
caring for people other than children. There were five recorded instances of carer’s
leave being taken (Table 5.5.5).
Table 5.5.4: Percentage and Number of Department Staff (Headcount) taking
paternity leave
< Information removed for confidentiality reasons >
SILVER APPLICATIONS ONLY
Provide data and comment on the proportion of staff remaining
in post six, 12 and 18 months after return from maternity leave.

84
Table 5.5.5.: Percentage and Number of Female Department Staff (Incidences)
taking carers leave
< Information removed for confidentiality reasons >
(vi) Flexible working
Provide information on the flexible working arrangements available.
DAS has a positive attitude to flexible working and most arrangements are made
informally. In our most recent staff survey responses (Figure 5.5.3), all questions around
flexible working demonstrated improvements.
Figure 5.5.3: 2016 to 2019 staff survey results flexible working
99% (n=87, 100% females, 97% males) had flexibility in hours/days worked/work pattern compared to 91% (n=53) in 2016.
82% (n=74, 80% females, 87% males) had home/remote working available to them compared to 76% (n=45) in 2016.
95% (n=71, 98% females, 93% males) were able to take time off at short notice without the need to give reasons compared to 81% (n=48) in 2016.
Action: Increase awareness of reporting of paternity and carers leave via Managers Self-Service (Action 4.6).
Action: Maintain staff awareness of the option to request flexible working (Action 4.3).

85
(vii) Transition from part-time back to full-time work after career breaks
Outline what policy and practice exists to support and enable staff who work part-time
after a career break to transition back to full-time roles.
Part-time staff can discuss an increase in hours during their PDR and/or on the basis of
their workload model. Part-time staff are encouraged to consider promotional
opportunities, and internally/externally advertised posts, resulting in a return to a full-
time role.
5.6. Organisation and culture
Table 5.6.1 Organisation and Culture Action Progress and Impacts
Since our Athena SWAN Bronze 2013 and 2016 we have:
Embedded Athena SWAN principles in the Department’s 2030 strategy.
Increased awareness of HR policies and support mechanisms via DLT mandatory training, DLT away days and working with our HR Business Partner.
Maintained over 50% female representation on committees and encouraged increased use of PDRs to record external activities.
Moved workload planning earlier, informing the PDR process and improving monitoring of ‘over-bundled’ staff.
Scheduled Department seminar series over lunch, increasing female presenters.
Improved the diversity of (intersectional) images used in Department marketing materials.
Embedded gender equality in Department branding and environment.
As a result, staff awareness of gender equality has increased to 85% (80% females, 90% males), and staff survey results suggest female staff feel well supported, have opportunities to participate in important committees, feel that their external professional activities are valued, are less likely to be ‘over-bundled’, and view communication as good.
(i) Culture
Demonstrate how the department actively considers gender equality and inclusivity.
Provide details of how the Athena SWAN Charter principles have been, and will continue
to be, embedded into the culture and workings of the department.
Section 3ii explains how we have pro-actively embedded Athena SWAN principles
within DAS, increased communications, feedback and engagement, as well as the
financial and time commitment to gender equality. Our 2019 staff survey demonstrates
increasing awareness of Athena SWAN, and we will continue to increase staff
awareness of the impact of our activities.

86
Figure 5.6.1: 2016 to 2019 Athena SWAN awareness staff survey results
88% (n=83, 94% female, 90% male) of staff agree or strongly agree that the working
environment in the Department is friendly, compared to 86% (n=51) in 2016. Staff are
also perceived to be collegiate, 90% (n=85, 94% female, 95% male) of staff agree or
strongly agree that their colleagues were cooperative, compared to 85% (n=50) in 2016.
Table 5.6.2 Impact Good Practice Example
In 2017, DAS introduced an anonymous feedback box. This simple approach encourages
staff to feedback on any Department/Faculty/University issues. You can also name
individuals for a Penny Coffee Voucher. Staff receive a thank you postcard, a hot drink
voucher, and are thanked in a Department communication.
The DLT have also increased nominations to University and external awards and schemes. In
2019, 28 staff from the Department were nominated for UWE Staff Excellence Awards, with
winners in two categories.
85% (n=77, 80% females, 90% males) of staff were aware of gender equality/Athena SWAN initiatives in the department compared to 81% in 2016 and 39% in 2013.
25% (n=22, 34% females, 15% males) said they were personally benefitting from gender equality/Athena SWAN initiatives in the department compared to 19% (n=11) in 2016.
Action: Increase awareness of Athena SWAN and the role of the SAT in embedding change across the Department (Action 7.1).

87
< Information removed for confidentiality reasons >
Our staff and student consultation process including academic staff, associate lecturers,
technical and professional staff, as well as PhD/professional doctorate students,
informed the development of an action plan which is embedded in other key DAS
actions and strategies.
Athena SWAN has influenced our Department Science 2030 strategy, most specifically:
‘Diversity allows communities such as our Department to evolve, respond to
changing demands and flourish in the future. Our aim is to increase the diversity
of the Department community which affords broader international ideas and
proposals, and to better support our student body.’
The following sections demonstrate how this committment is implemented.
Table 5.6.3 Sharing Good Practice Example
In recent investment to Department spaces, including a £3.2 million refurbishment of our
lab facilities, the opportunity to highlight female scientists has been embedded in
Department corridors and branding.
<Image removed>

88
(ii) HR policies
Describe how the department monitors the consistency in application of HR policies for
equality, dignity at work, bullying, harassment, grievance and disciplinary processes.
Describe actions taken to address any identified differences between policy and practice.
Comment on how the department ensures staff with management responsibilities are
kept informed and updated on HR polices.
DAS supports all University policies, providing reminders to staff on equality, dignity at
work and the Employee Assistance Programme. These are communicated to staff via
the website, workshops, committees, UWE weekly news and dedicated Department
communications.
In 2018, UWE introduced UWE Manager training for staff with management
responsibilities. 33% (n=7) of DAS managers have now completed this programme, with
67% in progress. The DLT works with our HR Business Partner on any policy/practice
matters, and monitors for wider equality issues, which need addressing beyond
individual staff members. In May 2018, HR provided additional DLT training on
managing staff performance, and working with teams.
Table 5.6.4: Percentage and Number of Staff (Headcount) completing UWE
Manager Training
< Information removed for confidentiality reasons >
In 2016, a Leadership Behaviours programme was also rolled out for all managers
(Grades F and above) including 360 feedback, coaching and development programmes.
In 2019, UWE Manager training was extended to new managers, and aspiring leaders.
However, we are aware there is a low awareness that managers are undertaking this
training, which is important as it can assist in resolving equality associated complaints
and issues. UWE is also currently developing its Report and Support Tool, for bullying,
harassment or discrimination incidents, so that it can be extended to staff reporting.
Staff survey results demonstrate that the majority of staff feel well supported and are
able to access senior Department colleagues.
Action: Increase awareness that managers receive leadership training and that processes are used to handle performance and grievances (Action 5.7).

89
Figure 5.6.2: 2016 to 2019 staff survey results management
(iii) Representation of men and women on committees
Provide data for all department committees broken down by gender and staff type.
Identify the most influential committees. Explain how potential committee members are
identified and comment on any consideration given to gender equality in the selection of
representatives and what the department is doing to address any gender imbalances.
Comment on how the issue of ‘committee overload’ is addressed where there are small
numbers of women or men.
Figure 5.6.3: Key Department, Faculty and University Committee and
Management Groups
75% (n=71, 79% females, 85% males) agreed/strongly agreed that senior department colleagues are accessible compared to 61% (n=36) in 2016.
68% (n=64, 69% females, 75% males) agreed/strongly agreed that senior department colleagues are supportive compared to 68% (n=40) in 2016.
81% (n=72, 83% female, 80% male) agreed/strongly agreed that they had a supportive people manager compared to 81% (n=48) in 2016.
University Commitees and Academic Board
Departmental Leadership Team
Subject Group meetings
Programme Management
Committee
Student Representative Staff Forum
CRIB Management
Group
SCU Management
Group
Athena SWAN SAT
Faculty Board
Faculty Academic
Standards and Quality
Committee
Faculty Executive
Faculty Academic
Business Group
Professional Placement
Strategy Group
Faculty Student Retention Group
Faculty Teaching and Learning
(LTAC)
Faculty Collaborative
Provision Commitee
University and Faculty
‘owned’
Department ‘owned’

90
In our 2016 application, we reported that DAS links to in excess of 75 UWE committees
and groups. In 2019/20 there was a rationalisation of committees, nevertheless
committee ‘fatigue’ remains a significant concern.
Department Committees
In DAS, 56% (n=38) of committee representatives are female (Table 5.6.5) and the
Athena SWAN SAT has continued to seek to increase male representation.
Representation is on the basis of a designated role, for instance all programme leaders
participate in the Programme Management Committee. Student representatives are
elected via a Students Union monitored process. Where a committee involves a
considerable workload, workload bundles are allocated.
Table 5.6.5: Number and Percentage of Representation on Department
Committees and Management Groups
2011/12 2015/16 2019/20
Fem
ale
n /
%
Mal
e n
/%
Fem
ale
n /
%
Mal
e n
/%
Fem
ale
n /
%
Mal
e n
/%
DEPARTMENT LEADERSHIP TEAM* 2 33%
4 67%
19 63%
11 37%
8 73%
3 27%
DEPARTMENT PROGRAMME MANAGEMENT COMMITTEE
10 53%
9 47%
15 58%
11 42%
15 50%
15 50%
CRIB MANAGEMENT GROUP 4 44%
5 56%
5 50%
5 50%
3 30%
7 70%
SCU MANAGEMENT GROUP** 2 50%
2 50%
2 40%
3 60%
ATHENA SWAN SAT 13 81%
3 19%
11 69%
5 31%
12 70%
5 30%
TOTAL*** 31 57%
23 43%
52 60%
35 40%
38 56%
30 44%
* The Department Leadership Team was operated as an Extended Executive in 2015/16, which is
why numbers were higher in that year, it has now reverted to a smaller team.
** The SCU management group is currently under review and therefore membership is
unconfirmed.
***We have excluded data on Subject Group meetings here, and Programme Management
Committees/Student Representative Staff Forums, as all staff are required to participate.
Department Representation on Faculty Committees
Staff are invited or required to represent DAS at Faculty level committees (Table 5.6.6).
A number of these committees were created in 2014, and we can only compare to our
2016 application. At Faculty level, 63% (n=17) of DAS representatives are female.
Faculty Board (instigated in 2013) is the only committee that requires formal
Action: Improve accurate local record keeping for Department and Faculty level roles, such as committee memberships (Action 1.4).

91
nomination/election, and women are well represented (75% of our elected members in
2015/16, and 100% in 2019/20).
Whilst this presents good female representation, there remains potential that female
staff are overburdened by committee engagement. 47% (n=43) of staff agreed or
strongly agreed they have the opportunity to serve on important Department
committees in our 2019 staff survey, with no statistical variation in this response on the
basis of gender. Nevertheless, they tended to be working at higher grades, and/or to
have been at the University for over 2-3 years, and we aim to increase committee
involvement from a broader range of staff.
Table 5.6.6: Number and Percentage of Department Representatives on Faculty
Committees and Management Groups
2015/16 2019/20
Fem
ale
n /
%
Mal
e n
/%
Fem
ale
n /
%
Mal
e n
/%
ACADEMIC BOARD 1 50%
1 50%
2 100%
FACULTY BOARD 3 75%
1 25%
3 100%
FACULTY ACADEMIC STANDARDS AND QUALITY COMMITTEE
4 67%
2 33%
3 75%
1 25%
FACULTY EXECUTIVE 1 100%
1 100%
FACULTY ACADEMIC BUSINESS GROUP 1 50%
1 50%
1 100%
FACULTY PLACEMENT STRATEGY GROUP 1 50%
1 50%
2 67%
1 33%
FACULTY STUDENT RETENTION GROUP 1 50%
1 50%
2 100%
FACULTY TEACHING AND LEARNING GROUP (LTAC)
2 50%
2 50%
3 50%
3 50%
FACULTY COLLABORATIVE PROVISION COMMITTEE 3 60%
2 40%
2 40%
3 60%
TOTAL 17 61%
11 39%
17 63%
10 37%
The percentage are based on the number of departmental representatives present on the
committee or group, not percentage of all members.
Action: Increase staff ‘turnover’ in Departmental, Faculty and University roles, e.g. committee membership, including by sharing opportunities with newer and more junior staff (Action 5.8).

92
(iv) Participation on influential external committees
How are staff encouraged to participate in other influential external committees
and what procedures are in place to encourage women (or men if they are
underrepresented) to participate in these committees?
Staff have workload bundles to engage in scholarly activity, including committee
engagement, peer reviewing and grant panel membership. Staff can also apply for
individual workload bundles to support such activities (Section 5.3v).
The PDR prompt guide captures external activities but this is not centrally recorded. Our
2019 staff survey suggested 40% of staff now strongly agree or agree that the
Department values their external professional activities, a decrease from 2016 (50%).
This is due to increased respondents who are at earlier career stages or are new to
UWE, who could be less aware of external opportunities.
In our 2016 survey, male staff (71%) were more likely to agree that their external
professional activities were valued than female staff (43%). In our 2019 data female
staff (44%, n=15) are now slightly more likely to feel supported than men (39%, n=12).
(v) Workload model
Describe any workload allocation model in place and what it includes. Comment on
ways in which the model is monitored for gender bias and whether it is taken into
account at appraisal/development review and in promotion criteria. Comment on the
rotation of responsibilities and if staff consider the model to be transparent and fair.
DAS utilises the Workload Allocation Management System (WAMS) to support fair,
open and consistent planning, management and allocation of workload for academic
staff. Workload is pro-rated for part-time staff and new staff have a reduced workload.
WAMS recognises teaching, research, administrative, and pastoral responsibilities, and
DAS can flexibility apply workload bundles against key tasks. Three WAMS updates are
made over the academic year, allowing for short-term changes.
Since 2016, we have moved workload planning to the spring, so that it is agreed with
subject group leaders before the summer, informing the PDR process. New
appointments are now planned pro-actively rather than re-actively.
We can also better monitor the number of staff who are ‘over-bundled’ by gender and
have seen a small decrease in the percentage of staff who are over-bundled since 2016,
and a reduction in the percentage of female staff who are over-bundled.
Action: Encourage and value external roles taken on by female and male staff members by using objectives on PDR’s to increase encouragement of external activities (Action 5.9).

93
Figure 5.6.4 Percentage and Number of Staff (Headcount) who are Over-bundled
% is from overbundled staff, not % of staff by gender.
Staff workload remains problematic in a growing Department, but we are seeing small
improvements in our survey results regarding how fairly and openly workload is
allocated.
Figure 5.6.5: 2016 to 2019 staff survey workload results
The DLT, people managers and PDR reviewers encourage staff to plan in annual leave
and there is modest improvement in uptake, with female staff more likely to report
taking their full leave allocation. There is also a decrease in staff reporting they have
over a third of their leave unused (17% in 2019, compared to 23% in 2016) and we
continue to work with staff to improve the accurate capturing of workload and leave.
2014/15 2015/16 2016/17 2017/18 2018/19
Female Overbundled % 60% 55% 44% 51% 43%
Male Overbundled % 40% 45% 56% 49% 57%
Total Overbundled % 33% 38% 43% 43% 40%
1817
17
20
1712
14
22
19
23
0%
10%
20%
30%
40%
50%
60%
70%
54% (n=50, 58% females, 60% males) agree or strongly agree that workload is allocated openly compared to 41% (n=24) in 2016.
44% (n=42, 51% females, 46% males) agree or strongly agree that workload is allocated fairly compared to 41% (n=24) in 2016
50% (n=48, 60% females, 46% males) said they took their full allocation of annual leave in the previous academic year compared to 47% (n=28) in 2016.
Action: Continue to develop the equity and transparency of the Academic Workload Model and monitor WLB allocation between male and female staff to identify any variations in ‘over-bundling’ (Action 4.1).

94
(vi) Timing of departmental meetings and social gatherings
Describe the consideration given to those with caring responsibilities and part-
time staff around the timing of departmental meetings and social gatherings.
Meeting dates are provided well in advance and staff are encouraged to use electronic
calendars, so that availability/days of work, are taken into account when scheduling.
Important meetings avoid dates staff may take annual leave, such as half-term. The
Department holds an annual staff ‘away day’ each June, with all staff are invited. Since
our 2016 application, we have investigated the use of core hours, introducing these in
2020/21.
Figure 5.6.6: Applied Sciences Graduation
Informally, staff make good use of the staff room, and there is a daily coffee/lunch club.
Each December a Department party is held, and in June a summer BBQ and rounders
game. Family members are welcome at events, as well as PhD students.
Programme teams and research groups hold celebrations around activities such as
graduation, including programme parties in the final year, when a cohort photo is taken
for students.
Action: The Department will introduce core hours 10-4pm for Department meetings and events (Action 7.2).

95
Figure 5.6.7: Summer BBQ
There have been improvements in staff agreeing that meetings and social events are
scheduled at appropriate times. 57% (n=54) of staff agree or strongly agreed in 2019,
compared to 50% (n=29) in 2016 and we anticipate that the introduction of core hours
will improve this further.
(vii) Visibility of role models
Describe how the institution builds gender equality into organisation of events.
Comment on the gender balance of speakers and chairpersons in seminars,
workshops and other relevant activities. Comment on publicity materials,
including the department’s website and images used.
Two seminar series are organised by DAS; the CRIB seminar series and the Science
Communication seminar series (Thursday/Friday lunchtimes). 46% of speakers have
been female and because of our 2016 action plan this has increased annually.
Table 5.6.10: Speakers at Department Seminars
2014/15 2015/16 2016/17 2017/18 2018/19 TOTAL BY SERIES
Fem
ale
n
/%
Mal
e n
/%
Fem
ale
n
/%
Mal
e n
/%
Fem
ale
n
/%
Mal
e n
/%
Fem
ale
n
/%
Mal
e n
/%
Fem
ale
n
/%
Mal
e n
/%
Fem
ale
n
/%
Mal
e n
/%
CRIB Seminar Series 6 30%
14 70%
4 33%
8 67%
6 50%
6 50%
5 42%
7 58%
10 71%
4 29%
31 44%
39 56%
Science Communication Seminar Series
1 25%
3 75%
1 50%
1 50%
5 71%
2 29%
2 67%
1 33%
1 33%
2 67%
10 53%
9 47%
TOTAL BY YEAR 7 29%
17 71%
5 36%
9 64%
11 58%
8 42%
7 47%
8 53%
11 65%
6 35%
41 46%
48 54%
Action: Ensure Departmental and social gatherings are organised over a range of days of the week to enable staff on differing work patterns to engage (Action 7.4).
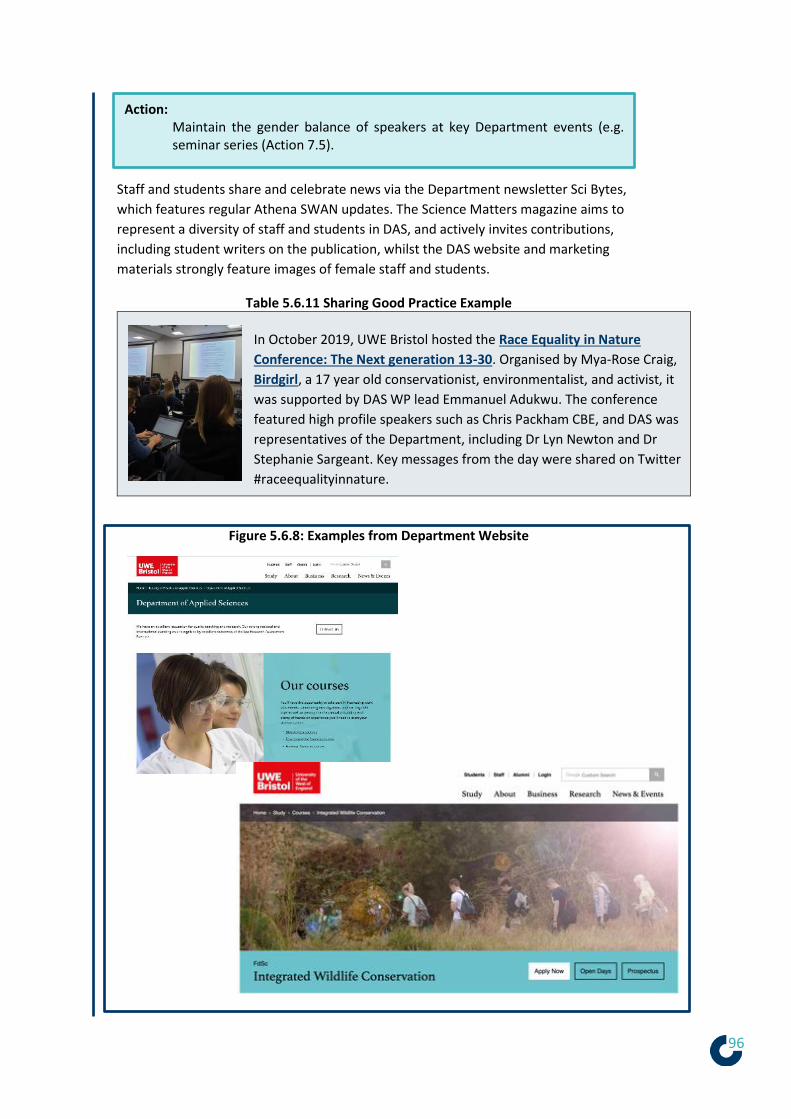
96
Staff and students share and celebrate news via the Department newsletter Sci Bytes,
which features regular Athena SWAN updates. The Science Matters magazine aims to
represent a diversity of staff and students in DAS, and actively invites contributions,
including student writers on the publication, whilst the DAS website and marketing
materials strongly feature images of female staff and students.
Table 5.6.11 Sharing Good Practice Example
In October 2019, UWE Bristol hosted the Race Equality in Nature
Conference: The Next generation 13-30. Organised by Mya-Rose Craig,
Birdgirl, a 17 year old conservationist, environmentalist, and activist, it
was supported by DAS WP lead Emmanuel Adukwu. The conference
featured high profile speakers such as Chris Packham CBE, and DAS was
representatives of the Department, including Dr Lyn Newton and Dr
Stephanie Sargeant. Key messages from the day were shared on Twitter
#raceequalityinnature.
Figure 5.6.8: Examples from Department Website
Action: Maintain the gender balance of speakers at key Department events (e.g. seminar series (Action 7.5).

97
Figure 5.6.9 Examples from Department Marketing Materials

98
Figure 5.6.10 Examples from Sci Bytes, Science Matters and external newsletters
Action: Publicise and celebrate the successes of staff and students (publications, Award of Grants, Nominations for awards, prizes) (Action 7.3).

99
(viii) Outreach activities
Provide data on the staff and students from the department involved in outreach
and engagement activities by gender and grade. How is staff and student
contribution to outreach and engagement activities formally recognised?
Comment on the participant uptake of these activities by gender.
DAS has longstanding involvement in outreach including ‘flagship’ events, including the
Bristol Festival of Nature, UWE BoxED and the STEM Ambassadors scheme.
Activities focus on multiple audiences including school students, the public, applicants
and their families. Staff involvement varies but female staff, PhD students and student
ambassadors 69% (n=401) are well represented.
Figure 5.6.11: Outreach involvement by staff and student (incidences) gender
* ‘Other’ includes HE-BCI entries which can include additional staff who are not specified by
name or gender, and under reports some outreach activities.
Department staff also contribute to Faculty widening participation activities. Growing
significantly since our 2016 application these now include a monthly newsletter,
programme taster days, and a series of public events.
Staff are involved in outreach from a variety of career stages, with invitations sent to all
staff by a Department Outreach Coordinator. Staff can engage in public engagement
workshops organised by RBI, and outreach training is provided to PhD students. Staff
can apply for HEIF funding to support research impact activities, including public and
community engagement. Finally, community and public engagement is recognised
within UWE’s promotional processes and within PDR’s. UWE Bristol is a signatory of the
Concordat for Engaging the Public with Research, and jointly houses the National
Coordinating Centre for Public Engagement.
Festival of Nature UWE BoxED StaffUWE BoxED Student
AmbassadorsOther outreach
activities*
Male % 43% 27% 32% 27%
Female % 57% 73% 68% 73%
16
164 205 16
12
60 94 6
0%
10%
20%
30%
40%
50%
60%
70%
80%
90%
100%

100
Figure 5.6.12: Department Outreach Events
<Images removed>
Figure 5.6.13: Widening Participation Monthly Newsletter
<Image removed>
As staff frequently conduct outreach over evenings and weekends, and to reflect a
diversity of role models, continuing action is needed to ensure a wide range of staff are
involved. Since our 2016 application, UWE no longer has a centrally supported Public

101
and Community Engagement Coordinator, making it challenging to monitor and
evaluate the impact of our outreach activities.
SILVER APPLICATIONS ONLY
6. CASE STUDIES: IMPACT ON INDIVIDUALS
Recommended word count: Silver 1000 words
Two individuals working in the department should describe how the
department’s activities have benefitted them.
The subject of one of these case studies should be a member of the self-
assessment team.
The second case study should be related to someone else in the department.
More information on case studies is available in the awards handbook.
Silver: 1,000 words
< Information removed for confidentiality reasons >
Action: Encourage a diverse range of staff to participate in outreach and ensure it is clearly communicated to staff that time spent on University outreach and open day events (outside of working hours) should be taken as leave at another time (Action 4.2).
Action: Contribute to UWE’s new Community and Business 2030 strategy, working with RBI and DAS outreach coordinators to improve reporting on outreach activities and develop evaluation mechanisms, which are fit for purpose (Action 7.6).

102

103
7. FURTHER INFORMATION
Silver: 483 words
Please comment here on any other elements that are relevant to the application.
The final weeks of this application process were impacted by COVID-19. The SAT would
like to additionally thank staff and students who continued to assist with the
application, despite significant concerns in their professional and personal lives.
The challenges presented by COVID-19 and rapid changes to the Department’s working
environment, have brought out the best in colleagues and demonstrated how truly
flexible and supportive the Department can be. In summary:
All academic, professional and technical staff were provided with IT equipment to
work from home from Tuesday 17th March 2020. In addition, staff were
encouraged to take home physical resources and equipment which would make
their working lives easier (e.g. monitors, office chairs and equipment).
The Department instigated a daily online ‘collaborate’ meeting (1-2pm) for staff
to drop in with questions, and to continue to socialise.
Research Centres (CRIB and SCU) set up regular online meetings, tutorials and
seminars.
Particular attention was paid to staff members/students who were self-isolating
alone and an additional online group was set up for staff members who were
shielding due to health or caring responsibilities.
A range of social events were instigated, including an online film, book club and
quizzes.
Staff were encouraged to work on the basis of outputs, rather than hours
worked, with an expectation that many were taking on additional childcare and
caring responsibilities.
Staff were encouraged to take leave for two-weeks over Easter, as well as regular
breaks and time at weekends to rest and recuperate.
People managers were supported with additional resources on leading remote
teams, including one-to-one coaching sessions with the Learning Development
Centre and additional mentoring support.
Staff were asked to complete a Covid Care Survey to assess the impact on staff
and how the University can further help.
The Department’s approach has been highly praised amongst staff and appreciated by
students:
‘The daily DAS Collaborate has helped as well professionally and socially.’
‘I have felt very supported by the Department over the last few weeks, during a time
when it would have been very easy to feel isolated and overwhelmed. The leadership
team have been very accessible and approachable, and I think the Collaborate sessions
have been really useful. The relaxed format also means that I don’t have to worry about

104
one of my children making an unscheduled appearance...Reinforcing that working as
flexibly as you need to is absolutely fine.’
‘Excellent sharing of good practice. Provision of ad-hoc training.’
‘Thanks for all of the guidance and support from the DLT – having the ability to drop in
to the Collaborate room is especially reassuring and a good way to be able to ask
questions/keep in touch’
‘Just to say thank you so much for everything you and the team are doing. The
Nightingale hospital is yet another reason I am so proud. I wouldn’t expect anything but
the best from UWE but that makes it no less special when it comes.’

105
8. ACTION PLAN Department of Applied Sciences, UWE, Bristol: 2020 Athena SWAN ACTION PLAN The action plan contains both ‘continuing’ actions, actions first established in our action plans in 2013 and 2016 which require continued efforts and ‘new’ actions, those identified in the course of our data gathering and reflections since 2016. In order to be more targeted, strategic and less process driven in our actions moving forwards we have now removed some previous actions which are indicated as complete/green in our 2016 action plan. These positive impacts will continue to be maintained and embedded in the work of the Department, rather than as a focus of the action plan. We have identified and clustered actions under seven key themes, which have evolved through a process of consultation amongst the SAT as well as wider Department staff. Each action includes reference to the section of the application form which justifies and explains its inclusion. Each SAT member has been designated actions for which they are responsible, though this may involve working with other persons at the University who may hold wider accountability for an action being achieved (when appropriate). We have indicated with each action whether it is High, Medium, or Low priority.
Theme 1: Self-Assessment Process and Evidence Gathering
Action number and priority
Planned action/objectives Rationale Responsibility (SAT member)
Timescale
Success Measure
1.1 NEW (Medium)
Increase the number of male and BAME staff representatives in the Self-Assessment Team. - Examine intersectionality of the SAT in relation to other protected characteristics and annually review our TOR. - Communicate the wish to recruit more diversity in staff and student representatives. - Assess the waiting list for membership identifying male and BAME candidates. - Increase awareness of outcomes of SAT membership (e.g. profile SAT role in SciBytes) and encourage recognition in PDRs and promotional processes. - Raise awareness of gender equality/Athena SWAN with new staff.
Despite turnover in membership, 12 out of 17 Self-Assessment Team members are female and the group could be more representative of intersectional characteristics.
SAT Lead Equality and Diversity Awards Officer
Annually from September 2020
25% of members replaced every two years. 40% male representation by 2024. Increased intersectionality of SAT members. Four representatives who are BAME by 2024.

106
Action number and priority
Planned action/objectives Rationale Responsibility (SAT member)
Timescale
Success Measure
1.2 NEW (High)
Identify emerging gender equality issues from a greater number of students. - Shadow existing events to reach UG, PGT and PGR students, including employability activities, Conversation Cafes, a new PGR seminar series and programme level meetings. - Consult with students on how best to reach them and consider other options to gather quantitative data on their experiences.
Uptake of Athena SWAN surveys established for PhD/Prof Doc and UG students in 2016 has been lower than expected (for example, 22% responded to the 2019 PGR survey). Very few gender equality issues are reported via our UG representatives.
SAT Lead DAS Employability Lead Faculty BAME Project Officer
June 2020 to July 2022
Increase in UG/PGT/PGR related issues minuted at SAT meetings. Increase in student consultation informing 2024 action plan. Increased impacts for students in 2024 application.
1.3 NEW (Medium)
Coordinate with other equality and diversity events and activities at Departmental level to promote intersectional considerations of gender equality. - Continue to coordinate our activities with other Department level agendas, such as BAME and widening participation events. - Increase intersectional analysis of future staff and student surveys. - Continue to contribute to the Faculty EDI Taskforce.
Athena SWAN and gender equality now has a ‘presence’ at a variety of Department events, but there are opportunities to further embed Athena SWAN in Faculty/Department equality, diversity and inclusion agendas. Analysis of Athena SWAN survey data is primarily analysed by gender, missing opportunities to identify relationships with other protected characteristics.
SAT Lead DAS Employability Lead Faculty BAME Project Officer
June 2020 to July 2022
Increase in UG/PGT/PGR related issues minuted at SAT meetings. Increase in student consultation informing 2024 action plan. Increased actions in 2024 application which relate to intersectional issues.
1.4 Continuing (Low)
Improve accurate local record keeping for Department and Faculty level roles, such as committee memberships. - Introduction of DAS Sharepoint to centralise annual record keeping.
Information on Department roles is often overwritten on an annual basis, which may present an unclear picture of the gendered nature of roles such as programme leadership and committee membership.
Professional Services Representative Deputy Head of Department
Annually from June 2020
Annual local records on Department and Faculty roles in future applications.

107
Action number and priority
Planned action/objectives Rationale Responsibility (SAT member)
Timescale
Success Measure
1.5 Continuing (High)
Annually review all student and staff Athena SWAN datasets. - Working with Equality, Diversity and Inclusivity, and Business Intelligence, provide annual reports to SAT meetings at least once per year. - Programme and module teams provided with access to performance data on the basis of gender, BAME etc. via Power BI. - Use of Power BI data, including any gender differences, in annual module reports. - Introduction of DAS Sharepoint to centralise record keeping.
Data reporting to the SAT has improved, both in terms of availability of data in advance of the application, and the number of years available. However, the data available annually remains inconsistent and it has only recently been available to module and programme teams. This makes it challenging to track action progress and impact.
Equality and Diversity Awards Officer Deputy Head of Department
Annually from September 2020
Data feeds into action plan on an ongoing basis. Review of all student and staff data during SAT meetings at least once a year.
1.6 Continuing (High)
Improve the process to collate data, identify and action change for technical and professional service staff. - Supporting actions in the UWE Technician Commitment action plan, including increasing the internal and external profile of technical staff, increased featuring in strategic communication, celebrating their achievement, supporting their staff resourcing and promotion strategy - Work with the Professional Services Representative to ascertain additional ways to action change for professional service staff.
We remain connected to our technical and professional staff colleagues via Athena SWAN surveys and SAT representation. However, it is easy to miss colleagues who are not ‘officially’ connected to the Department. This may mean some technical and professional staff as well as their people managers are less aware of best practice promoted via Athena SWAN activities. Some data provided does not distinguish technical and professional staff.
SAT Lead Professional Services Representative Technical Team Representatives
Annually from September 2020
Improved completeness of data in future applications, in relation to technical/professional colleagues. Increased impacts for technical and professional staff measured via survey questions.
Theme 2: Student Engagement
Action number and priority
Planned action/objectives Rationale Responsibility (SAT member)
Timescale
Success Measure
2.1 Continuing
Increase awareness of Athena SWAN amongst current undergraduate and postgraduate students, including via the
Uptake of Athena SWAN surveys established for PhD/Prof Doc and UG students in 2016 has been
Programme Leader Representative
September 2021 to April 2024
Increase in responses to student survey question ‘I am aware of Athena SWAN

108
(Medium)
Academic Personal Tutoring Programme (APT). - Increase equality and diversity information at open days, applicant days and on student facing webpages (including the Athena SWAN logo). - Build materials on unconscious bias and equality and diversity which can be delivered as part of APT. - Feedback to students on the impacts of Athena SWAN activities. - Consider inclusion of gender equality in DAS Degree Shows (under development). - Encourage PGR’s to nominate and be nominated through the Penny Coffee Voucher scheme.
lower than expected (for example, 22% responded to the 2019 PGR survey). Very few gender equality issues are reported via our UG representatives. Although Athena SWAN is included at open days and during induction programmes, there is a low level of awareness amongst students and we are missing opportunities to provide equality and diversity training during APT.
Senior Lecturer Representative UG Student Representative PG/PhD Student Representative
initiatives in my Department’. Increase in UG related issues minuted and actioned at SAT meetings. Increase in PGT and PGR related issues minuted and actioned at SAT meetings. 50% students engaging in mandatory equality and diversity training during their programmes via APT by 2024.
2.2 NEW (High)
Maintain student ratios on the BSc/MSci Biological Sciences and increase male student recruitment on the BSc Integrated Wildlife Conservation programmes. - Share outcomes of the student recruitment working group with specified programme teams. - Programme and module teams provided with access to application and performance data on the basis of gender, BAME etc. via Power BI. - Review marketing materials for the programmes to identify any gender biases. - Analyse open day student survey data in relation to the programmes. - Meet with relevant programme leaders and first year students to gain insights on their choices. - Work with the Bristol Zoo Partnership Lead to share gender actions for zoo based modules (BSc Integrated Wildlife Conservation).
The BSc/MSci Biological Sciences and the BSc Integrated Wildlife Conservation programmes are now the only two UG programmes in the Department which are performing beyond 5% of the expected benchmarks for gender equality. Female student recruitment to the BSc/MSci Biological Sciences has increased from 39% to 51% and we seek to maintain a gender balance rather than increase the representation of females further. Male student recruitment to the BSc Integrated Wildlife Conservation has increased from 22% to 33% and requires continued actions.
Programme Leader Representative Senior Lecturer Representative
Sept 2021 to August 2022
Maintain student
recruitment on BSc/MSci Biological Sciences within 5% of gender parity (currently 51%/49%). Increase male student recruitment to the BSc Integrated Wildlife Conservation, from 33% to 50%.

109
Action number and priority
Planned action/objectives Rationale Responsibility (SAT member)
Timescale
Success Measure
2.3 NEW (High)
Increase male student recruitment on the MSc Advanced Wildlife Conservation in Practice by 5%. - Share outcomes of the student recruitment working group with the programme team. - Programme and module teams provided with access to application and performance data on the basis of gender, BAME etc. via Power BI. - Review marketing materials for the programme to identify any gender biases. - Meet with the programme leader and students to gain insights on their choices. - Work with the Bristol Zoo Partnership Lead to share gender actions for zoo based modules (MSc Advanced Wildlife Conservation).
The MSc Advanced Wildlife Conservation in Practice programme has recruited, on average, 32% male students since 2015/16 and actions are needed to improve male recruitment.
Programme Leader Representative Senior Lecturer Representative
Sept 2021 to August 2022
Increased male student recruitment on the MSc Advanced Wildlife Conservation in Practice to 35%, within 5% of expected benchmarks (39%).
2.4 NEW (High)
Address male degree performance working with programmes, Faculty Equality and Diversity Task Force and the DAS employability team. - Coordinate with the DAS BAME Attainment Gap Plan. - Investigate if attendance monitoring for ADP identifies variations in female/male attendance. - Work with the Peer Assisted Learning scheme to increase male students who are PAL leaders/participants. - Further investigate variations in female/male uptake of placement schemes. - Continue to monitor any implications for male student outcomes via the DAS Graduate Outcomes Survey Action Plan.
Over the last five years 75% of UG female students have achieved a ‘good’ degree compared to 66% of male students. Following actions in our last application, the percentage of male students awarded good degrees has risen, from 64% but continued effort is needed to improve male degree performance.
SAT Lead Programme Leader Representative DAS Employability Lead Faculty BAME Project Officer
Sept 2020 to April 2024
70% of UG male students have achieved a ‘good’ degree in 2024 application.

110
Theme 3: Recruitment
Action number and priority
Planned action/objectives Rationale Responsibility (SAT member)
Timescale
Success Measure
3.1 Continuing (High)
Continue to improve the appeal of the Department as a place to work and study, increasing female applicants for Department job opportunities to 50%. - Encourage all Department staff to keep their online profiles up-to-date. - Developing exemplar job descriptions beyond existing recruitment templates. - Breaks for maternity/paternity leave etc. are proactively taken into account in recruitment processes if these are acknowledged by applicants. - Use WISE for selected, strategic appointments or subject groups with low representation. -Introduce independent observers on recruitment panel for senior/strategic appointments.
Fewer female applicants (42% female, 58% male) apply for academic posts in the Department, though they are more likely to be shortlisted and offered a post.
Head of Department
April 2020 to April 2024.
Increase female applicants for Department job opportunities to 50% by 2024. Increased intersectionality of applicants for Department job opportunities.
3.2 NEW (High)
Increase the diversity of applicants, offers and acceptances for posts at Grades G (Lecturer/Research Fellow) and H (Senior Lecturer/Senior Research Fellow). - Develop exemplar job descriptions. - Breaks for maternity/paternity leave etc. are proactively taken into account if acknowledged by applicants. - Use WISE for selected, strategic appointments or subject groups with low representation. - Add question to staff survey ‘would you recommend the Department as a place to work’ with an option for additional comments.
Grades G and H are the only grades were male staff are more likely to be appointed than female staff and there has been a decrease of female Senior Lecturers in the Department from 45% to 38%.
Head of Department
April 2020 to April 2024
40% of female applicants are appointed at Grades G and H.

111
Theme 4: Workload Management, Flexible Working and Career Breaks
Action number and priority
Planned action/objectives Rationale Responsibility (SAT member)
Timescale
Success Measure
4.1 Continuing (High)
Continue to develop the equity and
transparency of the Academic Workload
Model and monitor WLB allocation between
male and female staff to identify any
variations in ‘over-bundling’.
- Improve staff planning of annual leave and increase % of staff who feel able to take their full annual leave. - Work towards programme level flexibility in allocation workloads in relation to teaching.
- Coordinate with the Faculty operational
plan and Faculty Workload governance group
to achieve a fair and equitable workload for
staff.
Our staff survey results demonstrate ongoing improvement in staff agreement that workload is allocated openly (38% in 2013 to 54% in 2019), and fairly (38% in 2013 to 44% in 2019) but there remains considerable room for improvement. Though also increasing, only 50% of staff in 2019, reported that they were able to take their full allocation of annual leave.
Deputy Head of Department
April 2020 to Sept 2022
Increase staff agreement that workload is allocated fairly to 60% and openly to 70% in the next staff survey. Increase staff agreement that they took their full allocation of annual leave to 60% in the next staff survey.
4.2 Continuing (Low)
Encourage a diverse range of staff to participate in outreach and ensure it is clearly communicated to staff that time spent on University outreach and open day events (outside of working hours) should be taken as leave at another time. - Increased encouragement and uptake of staff recording outreach activities via PDR and communications to the Department. - Introduction of DAS Sharepoint to centralise record keeping.
UWE no longer has a centrally supported Public and Community Engagement Coordinator and this makes it more challenging for us to monitor and evaluate who is participating in outreach activities and the impact they have. The data we do have suggests female staff are more likely to participate, and therefore could be more ‘burdened’ in terms of time on outreach activities.
Open Days and Marketing Representative Deputy Head of Department
September 2021 to April 2024
Increase to 60% (from 54% in 2019) in the next staff survey, staff agreement that knowledge exchange (inc. public engagement activities) are valued in the Department. Increase male staff engaged in outreach activities to 50% from 31% in 2024 application data.

112
Action number and priority
Planned action/objectives Rationale Responsibility (SAT member)
Timescale
Success Measure
4.3 Continuing (Low)
Maintain staff awareness of the option to request flexible working. - Continue to work with people managers to maintain staff awareness of flexible working options. - Increase the numbers of staff who have the ability to work from home, and equipment to do so.
Our staff survey work shows increases in staff agreeing there is flexibility in their working hours/days/pattern (79% to 99%) since 2013 and we are keen to continue to maintain this high level of availability for flexible working due to its wider positive impacts.
Head of Department SAT Lead
April 2020 to April 2024
Maintain over 90% agreement that staff have flexibility in their working hours/days/pattern. Maintain over 90% agreement that staff can ask for time off at short notice.
4.4 Continuing (Medium)
Continue to ensure that all people managers are familiar with the UWE guidance and advice for maternity, adoption, paternity and carers leave to improve provision or access to useful advice to 100% of respondents. - DLT and all other managers have all completed mandatory UWE Manager training. - Collate maternity, adoption, paternity and carers leave ‘buddy’ information to provide individuals to contact for advice.
Our staff survey results on maternity, adoption and carers leave have improved, but we are keen to continue to maintain awareness as these can be topics which managers, and staff, deal with infrequently. We know that staff are taking carers and paternity leave in the Department, but this is frequently being recorded as annual leave rather than paternity leave.
Head of Department SAT Lead
April 2020 to April 2024
Continue to reduce discrepancies in experience/ awareness amongst staff taking leave, as recorded on staff survey*. Increased carers and paternity leave recorded in 2024 application* 95% of managers have all completed mandatory UWE Manager training. *Due to small numbers of staff for whom this is relevant we are not setting a % improvement.

113
Action number and priority
Planned action/objectives Rationale Responsibility (SAT member)
Timescale
Success Measure
4.5 Continuing (Low)
Continue to emphasise role of the Parents group for peer support and advice and create a list of Department maternity/paternity/adoption and shared parental leave mentors. - Create a list of Department maternity/paternity/adoption and shared parental leave mentors.
- Staff would like improved access to leave ‘role models’ for advice and it can be difficult to maintain awareness of staff groups and forums.
SAT Lead Annually from September 2020
Increase awareness amongst staff of role models, as recorded on staff survey questions*. Increased carers and paternity leave recorded in 2024 application*. *Due to small numbers of staff for whom this is relevant we are not setting a % improvement.
4.6 NEW (Low)
Increase awareness of reporting of paternity and carers leave via Managers Self-Service. - Encourage staff, via people managers to record carers leave and paternity leave via Manager Self-Service unless there is a personal reason that they prefer to use flexible working or annual leave. - Work with staff to understand why paternity/carers leave might be under reported. - Encourage staff to include paternity/carers leave on out of office notifications (when appropriate) so that it becomes more visible in Department culture.
Uptake of paternity leave, shared parental leave and carers leave remains low. We know that staff are taking paternity and carers leave, but this is frequently being recorded as annual leave rather than personal leave of this type.
SAT Lead Annually from September 2020
Increased carers and paternity leave recorded in 2024 application*. *Due to small numbers of staff for whom this is relevant we are not setting a % improvement.
Theme 5: Career Development

114
Action number and priority
Action/objectives Rationale Responsibility (SAT member)
Timescale
Success Measure
5.1 NEW (Medium)
Introduce a series of questions to the Athena SWAN staff survey, which are focused on staff induction experiences. - Collect data from new staff, specific to their induction experiences within the Department, with a particular focus on how they are supported around training, career development and future progression. - Creation of a new SAT working group on supporting new staff in the Department.
All new teaching and research staff engage with University induction processes, but a number of general questions on the staff survey suggests new staff may leave induction with gaps in knowledge around training, ongoing mentoring and progression.
SAT Lead Deputy Head of Department Working Group of SAT members
Sept 2022 to Sept 2023.
Increased understanding of the experiences of new staff, as recorded by a series of new questions on induction in the staff survey.
5.2 NEW (Medium)
Introduce an annual Department level induction event for new staff, including Associate Lecturers (0.2 FTE contracts). - Annual Department level event including introduction to key Department staff, processes, Induction Handbook, researchers’ links, and future career development opportunities (inc. promotion, training and development). - Ensure that staff who are coming to the end of their induction/probation periods are supported and aware of continued training opportunities. - Creation of a new SAT working group on supporting new staff in the Department.
We aspire to improve the induction experience of temporary staff and Associate Lecturers who may presently have mixed induction experiences.
Head of Department Deputy Head of Department Working Group of SAT members
Sept 2021 to Sept 2023.
New staff, and Associate Lecturers, are more informed about questions associated to training and development, career progression and UWE policies in next staff survey results.
5.3 Continuing (High)
Ensure that all staff are appraised annually via their PDR and increase percentage of staff who see it as useful and professional valuable to 75%. - Creation of a SAT working group on PDR’s to identify and make recommendations as to how the Department can improve staff satisfaction in the UWE PDR process.
We are seeing increases in staff (94% female, 95% male) annual appraisal but improving satisfaction with the PDR process is slow. We need to better understand whether dissatisfaction is due to variation amongst PDR reviewers, staff expectations or the new PDR documentation introduced by the University and adjust accordingly. Females also report increased
Head of Department SAT Lead Working Group of SAT members
Sept 2021 to Sept 2023
100% staff appraised via PDR or probationary processes by 2024. Staff satisfaction in PDR being useful and professionally valuable to increase to 75%.
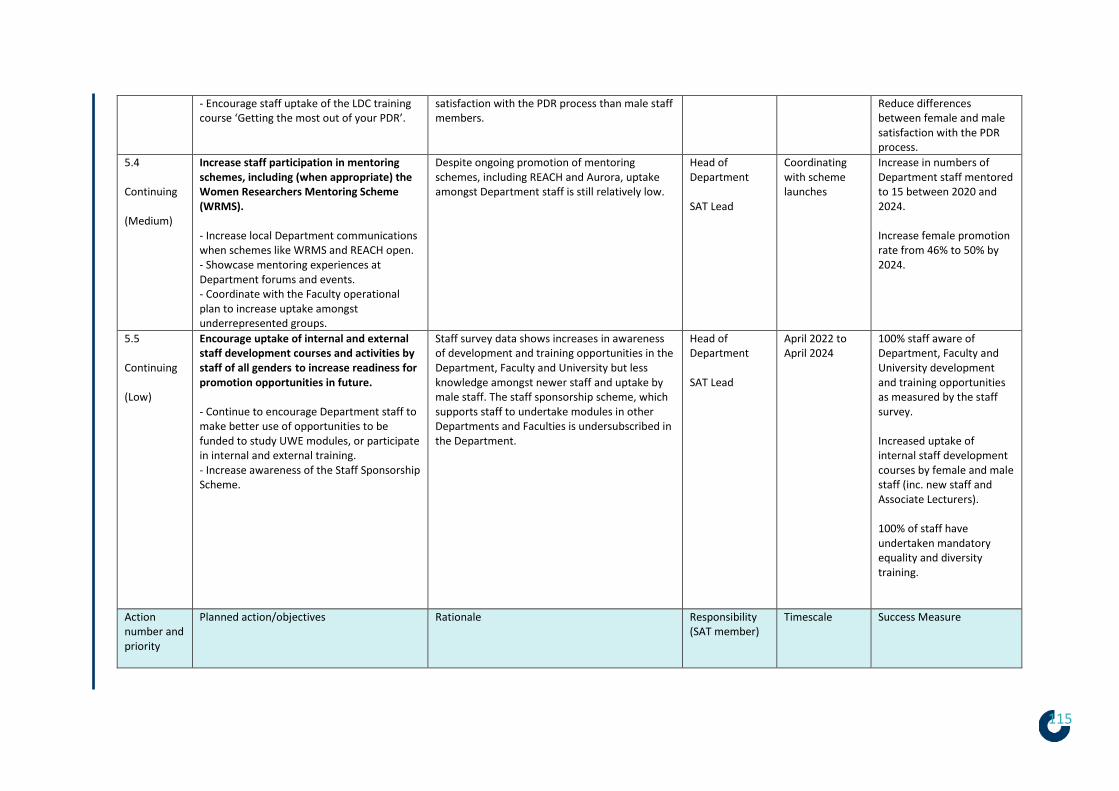
115
- Encourage staff uptake of the LDC training course ‘Getting the most out of your PDR’.
satisfaction with the PDR process than male staff members.
Reduce differences between female and male satisfaction with the PDR process.
5.4 Continuing (Medium)
Increase staff participation in mentoring schemes, including (when appropriate) the Women Researchers Mentoring Scheme (WRMS). - Increase local Department communications when schemes like WRMS and REACH open. - Showcase mentoring experiences at Department forums and events. - Coordinate with the Faculty operational plan to increase uptake amongst underrepresented groups.
Despite ongoing promotion of mentoring schemes, including REACH and Aurora, uptake amongst Department staff is still relatively low.
Head of Department SAT Lead
Coordinating with scheme launches
Increase in numbers of Department staff mentored to 15 between 2020 and 2024. Increase female promotion rate from 46% to 50% by 2024.
5.5 Continuing (Low)
Encourage uptake of internal and external staff development courses and activities by staff of all genders to increase readiness for promotion opportunities in future. - Continue to encourage Department staff to make better use of opportunities to be funded to study UWE modules, or participate in internal and external training. - Increase awareness of the Staff Sponsorship Scheme.
Staff survey data shows increases in awareness of development and training opportunities in the Department, Faculty and University but less knowledge amongst newer staff and uptake by male staff. The staff sponsorship scheme, which supports staff to undertake modules in other Departments and Faculties is undersubscribed in the Department.
Head of Department SAT Lead
April 2022 to April 2024
100% staff aware of Department, Faculty and University development and training opportunities as measured by the staff survey. Increased uptake of internal staff development courses by female and male staff (inc. new staff and Associate Lecturers). 100% of staff have undertaken mandatory equality and diversity training.
Action number and priority
Planned action/objectives Rationale Responsibility (SAT member)
Timescale
Success Measure

116
5.6 NEW (Low)
Increase staff awareness that staff training records are available on Employee Self-Service, increase personal recording and include a more extensive range of training on Employee Self-Service records. - Work with HR/Employee Self-Service and LDC to understand how training can be captured on an annual basis and more reliably.
Mandatory training is provided by UWE, including on equality and diversity. There is good uptake of this training, at all grades, but the local recording mechanism has inaccuracies and may be under reporting. We are therefore unable to reliably examine data on an annual basis or by grade.
Head of Department Faculty Business Manager
April 2020 to April 2022
Improved monitoring and dedicated actions around training uptake on the basis of type of contract, grade and gender.
5.7 NEW (Medium)
Increase awareness that managers receive leadership training and that processes are used to handle performance and grievances. - Department forum item on leadership and management training to share good practice. - Faculty and Department leadership staff offer open door policy or drops in at set times. - Increase awareness of Employee Assistance Programme and Dignity at Work advisers to supplement support from people managers.
In 2018, UWE introduced UWE Manager training for staff with management responsibilities. However, we are aware there is a low awareness amongst wider teams that managers are undertaking this training, and this may lead to a lack of awareness of management processes and roles, which can assist in the reporting of gender –related issues, as well as progression and development.
Head of Department Deputy Head of Department
April 2020 to September 2022
Develop more nuanced staff survey questions around leadership and management (including awareness of resources and procedures). 90% of DAS managers to have completed the UWE Manager Programme by 2024.
5.8 Continuing (Medium)
Increase staff ‘turnover’ in Departmental, Faculty and University roles, e.g. committee membership, including by sharing opportunities with newer and more junior staff. - Introduction of DAS Sharepoint to centralise record keeping, including on committee membership. - Increase awareness of opportunities to participate via PDRs and Department events (e.g. Away Days). - Consider committee ‘shadowing’ roles.
There is high female representation on committees with the potential that female staff are overburdened by committee engagement. Staff who agree they have the opportunity to serve on important Department committees tend to be working at the higher grades, and/or to have been at the University for over 2-3 years, and we aim to increase committee involvement from a broader range of staff, where possible.
SAT Lead Professional Services Representative
Annually from September 2020
Annual review of committee membership data during SAT meetings.
Action number and priority
Planned action/objectives Rationale Responsibility (SAT member)
Timescale
Success Measure

117
5.9 NEW (Medium)
Encourage and value external roles taken on by female and male staff members by using objectives on PDR’s to increase encouragement of external activities. - Two week scholarly activity period scheduled each summer from 2020. - Increased featuring of external staff roles, including case studies, in Department communications and captured during PDR’s.
Staff are provided with workload bundles to engage in scholarly activity, including external activities but our staff survey results suggest there could be improvements as to how this is perceived to be valued, and that those who are at earlier career stages or are new to UWE, are less aware of these opportunities. There is also limited sharing of external activities following PDRs.
Head of Department Deputy Head of Department
Annually from September 2020
Increase from 40% to 55% staff agreement that external professional activities are valued in the Department, as measured in the staff survey.
5.10 NEW (High)
Improve post-doctoral researchers/fixed-term contract staff integration within the Department, mentoring, training and development opportunities. - Improve awareness of the Researchers Forum as a source of professional and social support for staff. - Carry out further analysis of staff survey results on the basis of contract type. - Work with PDR managers to improve support for post-doctoral and fixed-term contract staff. - Coordinate with the Faculty operational plan to clearly identify retention plans for fixed-term staff.
Our 2019 staff focus group highlighted that fixed-term research staff would like more integration in DAS, mentoring and support, offering additional reassurance around the more formal contractual processes.
AHoD/Research Representative Research Fellow Representative
April 2020 to April 2024
Staff survey results, as well as data, demonstrate improvements in communication, training and development uptake, PDR satisfaction and management, for post-doctoral researchers/fixed-term contract staff.
5.11 NEW (Medium)
Increase exit questionnaire responses, which can be the basis for information and actions amongst the Department Leadership Team. - People managers continue to encourage leavers to complete the exit questionnaire at their final meeting with staff and indicate the role of confirming the Department. - Work with HR to more effectively communicate the results of exit questionnaires to the HoD.
Department is included in exit questionnaires but very few respondents complete it. This means any questionnaire outcomes returned to DAS are relatively generic to the Faculty as a whole. Key findings for action are shared at the Department Leadership Team meetings. However, we still have limited information from leavers, as very few staff indicate their Department.
Head of Department
September 2021 to September 2022
Increased feedback from exit questionnaires to inform Department Leadership Team, actions and culture.
Theme 6: Promotion

118
Action number and priority
Action/objectives Rationale Responsibility (SAT member)
Timescale
Success Measure
6.1 Continuing (High)
Ensure that all members of staff are familiar with the criteria and procedures for promotion. - Create a promotion ‘mythbusting’ document for the Department. - Continue to lobby for the introduction of a University-led annual promotion scheme. - Continue to support staff to engage with the Technicians Commitment and Conference.
Since our 2013 staff survey, we have seen considerable improvement in staff awareness of UWE promotion processes, but our 2019 staff survey alerted us to newer staff and those at lower grades being less familiar with the processes
Head of Department AhoD/Research Representative SAT Lead
April 2020 to April 2024
Increase female promotion rate from 46% to 50% by 2024. Increase from 48% to 75% staff agreement that they have knowledge of UWE promotion criteria and processes.
6.2 Continuing (High)
Address lower numbers of female staff being promoted. - Ongoing actioning of working group recommendations. - Create a promotion ‘mythbusting’ document for the Department. - Investigate extending coaching opportunities (e..g 360 review) to staff who are being considered/prepared for promotion.
There has been an increase in staff reporting promotion, some improvements of awareness of the processes and increased female staff are promoted due to internal and external promotion opportunities. However proportionally more men (54%) have been promoted than women (46%), particularly from Lecturer to Senior Lecturer.
Head of Department AhoD/Research Representative SAT Lead
April 2020 to April 2024
Improved understanding of why female promotion rates might be varying. Increase from 48% to 75% staff agreement that they have knowledge of UWE promotion criteria and processes. Increase female promotion rate from 46% to 50% by 2024.
6.4 Continuing (Medium)
Monitor the gender, part-time/full-time status, and career breaks of researchers entered to REF2021, as well as any implications of the use of the REF Code of Practice. - Analyse submission data for REF 2021. - Continue to monitor staff views on REF as expressed in staff survey. - Monitor planning for REF beyond 2021.
In planning for REF 2021, female staff members
were appointed to lead UoAs, and they have had
unconscious bias training. Along with a new Code
of Practice, staff have been encouraged to report
equality-related circumstances. We anticipate
increased numbers of outputs from female staff
will be included in REF2021, but data is not yet
available.
SAT Lead AHoD/Research Representative
September 2021
Increase in female researcher outputs entered from the Department in REF 2020/21. 50% of eligible female staff outputs entered in REF 2020/21.

119
6.5 Continuing (Low)
Improve record keeping for staff applying for promotional opportunities that are advertised both externally and internally, including whether the posts are full or part-time. - Improve electronic recruitment records to better distinguish full and part-time posts, as increased breakdown of application, shortlisting and appointment details by gender, for internal candidates.
Since our 2016 application, all promotions use
our electronic recruitment system, but we have
not been able to distinguish appointments by full
and part-time status and HR have been able to
provide less detail than in our 2016 application.
Equality and Diversity Awards Officer
January 2021 to January 2022
More detail on application, shortlisting and appointment to be presented in 2024 application.
6.6 NEW (Medium)
Increase staff uptake of scholarly activity by introducing a two-week scholarly activity period when no departmental activities are scheduled, and including scholarly activity on the workload model as a reminder to staff to utilise this time. - Trial a two-week scholarly activity period in 2020 when no Department activities are scheduled for staff to use as a mini-sabbatical. - Add scholarly activity time to WAMS and encourage staff to plan how they will use it via PDRs. - Continue to reduce ‘over-bundling’ in the Department.
All academic staff are allocated 75 WLB (equates
to five weeks) per year for ‘scholarly activity’,
however staff frequently report that they do not
use this time as it is not included on the
workload model, or time they feel able to
protect from other teaching, research and
administrative activities.
Deputy Head of Department
April 2020 to April 2024
Introduce question on the staff survey on use of scholarly activity time. Increased female staff receiving internal Faculty funding for research.
6.7 NEW (Low)
Lobby the University for changes to the PASS system which records by principal investigator only and may distort the contributions of staff to applications, including fixed-term and postdoctoral researchers, contributions to bidding. - Work with RBI and Research Centre Directors to ascertain if the new PIMS system (due to replace PASS) can more accurately
Male staff more frequently lead external
research funding applications, 61% compared to
39% led by female staff but the current PASS
system which records research funding
applications and outcomes records information
only on the basis of PI. This may neglect to fully
capture co-applicants and/or bidding which takes
place more collaboratively.
SAT Lead AHoD/Research Representative
September 2021 to September 2022
Increased female staff recorded as receiving external funding for research.

120
and fairly record contributions to external funding applications and success rates.
Theme 7: Communication and Culture
Action number and priority
Action/objectives Rationale Responsibility (SAT member)
Timescale
Success Measure
7.1 Continuing (Medium)
Increase awareness of Athena SWAN and the role of the SAT in embedding change across the Department. - Develop audio capture of Athena SWAN case studies for the website and sharing with staff, including the benefits attained. - Establish SAT representatives as gender equality ambassadors and create a focussed Department campaign, which evidences progress and impact on gender equality. - Highlight to staff the ways in which gender equality has been embedded in the Department.
Our staff survey shows increases in the number of staff aware of Athena SWAN in the Department (39% to 85%) since 2013 but still few staff identify with Athena SWAN offering personal benefits to them (25% in 2019). By embedding many of our actions it is possible some staff are less aware of the impact of the activities.
All SAT members
Annually from September 2020
95% staff aware of Athena SWAN in the Department. Increase in ‘agree’ responses to survey question ‘I am personally benefitting from Athena SWAN’ from 25% to 40%.
7.2 Continuing (Medium)
The Department will introduce core hours
(10-4pm) for Department meetings and
events. - All Department organised meetings to be held in core hours. - Communication sent to all Department staff. - Monitor adherence in scheduling to core hours in the next staff survey.
Since our 2016 application, we have investigated and consulted on the use of core hours and now plan to formally introduce these.
Head of Department
Annually from September 2020
All Department meetings scheduled between 10-4pm.
7.3 Continuing (Medium)
Publicise and celebrate the successes of staff and students (publications, Award of Grants, Nominations for awards, prizes). - Increase profiling of professional service and technical staff successes.
- Continue to promote the dedicated LinkedIn group (Department of Applied
SciBytes and Science Matters profiles staff and student successes and the DLT encourages staff and students to apply for external and internal awards. We plan to continue to expand on this, increasing the numbers and roles of staff and students who are included.
Head of Department All SAT members
Annually Greater variety of news shared in SciBytes, Science Matters and through internal and external staff awards. 95% of staff agree that successes are publicly

121
Sciences UWE), twitter accounts (@UWE_SciFutures) and handles (#ScienceFutures2020).
acknowledged within the Department.
7.4 Continuing (Medium)
Ensure departmental and social gatherings
are organised over a range of days of the
week to enable staff on differing work
patterns to engage.
- Ensure continuity of events over the summer when some university facilities are closed, including online events. - Continue to develop seminars, talks, events with varied opportunities to socialise after and at differing times of day. - Continue to encourage use of staff room.
Our staff survey shows an increase in number of staff agreeing that the working environment is friendly (82% to 88%) since 2013 and a range of Department events are offered. However, there could be improvement in the variety of times when these are offered and extending invitations to a wider range of colleagues (e.g. professional and technical staff, PhD students).
All SAT members
Annually from September 2020.
Increase in variety of social gatherings and timings held.
7.5 Continuing (Low)
Maintain the gender balance of speakers at
key Department events (e.g. seminar
series).
- Continue to provide reminders to seminar organisers regarding intersectionality.
- Continue to monitor gender of speakers
annually.
56% of speakers at Department seminars have been female since our 2016 action plan, however there could still be additional diversity in terms of intersectional characteristics.
AHoD/Research Representative
Annually from September 2020.
50% of speakers at Department seminars are female.
7.6 NEW (Low)
Contribute to UWE’s new Community and Business 2030 strategy, working with RBI and DAS outreach coordinators to improve reporting on outreach activities and develop evaluation mechanisms, which are fit for purpose. - Work with staff developing UWE’s new Community and Business 2030 strategy to ensure intersectional principles are embedded. - Increase staff inclusion of outreach activities in PDR’s. - Improved information available on participants experiences in departmental outreach.
UWE no longer has a centrally supported Public and Community Engagement Coordinator and this makes it more challenging for us to monitor and evaluate who is participating in outreach activities and the impact they have.
SAT Lead DAS Outreach Coordinators
Annually Increase to 60% (from 54% in 2019) in the next staff survey, staff agreement that knowledge exchange (inc. public engagement activities) are valued in the Department. Increase male staff engaged in outreach activities to 50% from 31% in 2024 application data.

122
9. 2016 RAG ACTION PLAN
Department of Applied Sciences, UWE, Bristol: 2016 Athena SWAN ACTION PLAN (LAST UPDATED DECEMBER 2019) The action plan contains both ‘continuing’ actions, actions first established in our original action plan in 2013 which require continued implementation and ‘new’ actions, those identified in the course of our data gathering and reflections over the last three years. Our previous action plan can be found at the Departments Athena SWAN website.

123
We have identified and clustered actions under seven key themes, which have evolved through a process of consultation amongst the SAT as well as wider Department staff. Each action includes reference to the section of the application form which justifies and explains its inclusion. Each SAT member has been designated actions for which they are responsible, and we have also identified the individual or persons at the University who may hold wider accountability for an action being achieved (when appropriate). We have indicated with each action whether it is High (H), Medium (M) or Low (L) priority.
Theme 1: Self-Assessment Process and Evidence Gathering
NEW or continuing action and RAG RATING
Issue identified for action
Actions and impacts achieved since 2013
Actions and impacts achieved since 2016
Responsibility (SAT member)
Accountability
Timescale Success Measure
Start Review/ end date
1.1 (3.2iii)
Continuing (Medium) GREEN
Annually review membership of SAT team to ensure inclusivity, gender balance and intersectionality.
- SAT membership reviewed annually since 2013. - Membership includes technical and professional staff representation. - Male representation has increased to 31% in 2016. - SAT Terms of Reference established annual review of membership.
- Circulate open email calls for SAT membership annually. Encourage uptake with better profiling of role. - Waiting list for membership introduced. - Greater diversity of caring roles and intersectional characteristics amongst SAT.
SAT Lead Equality and Diversity Awards Officer
SAT Lead n/a Annually
25% of members replaced every two years – 35% replaced since 2016 40% male representation by 2017. – 29% in 2019 Increased intersectionality - increased
1.2 (3.2iii)
NEW (Medium) GREEN
Increase student SAT representation.
- PhD student representative since 2013. - Introduced undergraduate representation in 2016.
- PRG rep now coordinates with PGT representatives. - Student reps are now paid. - Feedback from BAME Student Voice Cafes.
PG/PhD representative
SAT Lead Sept 2016
Sept 2017
Increase in UG/PGT/PGR related issues minuted at SAT meetings - increased
1.3 (3.2iii)
NEW (High) GREEN
Increase shared accountability amongst SAT.
- SAT Terms of Reference align SAT to a greater shared accountability for actions. - Workload bundles for staff under the Academic Workload Model.
- Creation of two working groups on key issues and actions. - DAS invest additional WLB and budget for gender equality activities.
All SAT members
All SAT members
Sept 2017
Nov 2020
Future applications align SAT actions to dedicated working groups around key themes – 2020 action plan

124
1.4 (3.2iii)
Continuing (High) GREEN
Gather quantitative and qualitative feedback from staff on issues of relevance to Athena SWAN.
- Athena SWAN surveys extended to include data collection on a wider range of equality issues and circumstances (e.g. planning for end of career), as well as professional staff and associate lecturers in March 2016. - Increased response rate to survey. - Focus group for staff in October 2016.
- Staff survey completed in 2019, response rate increased from 50% to 74%. - Two focus groups held in 2019, one with all staff, one with associate lecturers. - DAS feedback box introduced in 2017. - Gender Equality included as an agenda item in key DAS committees and events.
SAT Lead SAT Lead March 2017
March 2019
Staff survey completed in March 2018 – completed Further increase response rate to survey by 10% - increased by 24% Staff focus groups completed in March 2019 – completed
1.5 (3.2iii)
NEW (High) GREEN
Gather quantitative and qualitative feedback from PhD/Prof Doc students on issues of relevance to Athena SWAN.
- Additional Athena SWAN surveys established for PhD/Prof Doc students in March 2016.
- PGR survey completed in 2019, response rate increased from 20% to 22%. - PGT now represented. - Actions with the UWE Graduate School.
SAT Lead SAT Lead March 2017
March 2019
PhD/Prof Doc survey completed in March 2018 – completed
1.6 (5.6iii)
NEW (Low) AMBER
Ensure accurate local record keeping for Department and Faculty level roles (e.g. committee memberships).
- Information gathered in 15/16, flagging issue with local overwriting of information year on year.
- Annual local records for reporting now available for some actions.
Professional Services Representative
n/a Sept 2016
Annually
More complete local records on Department and Faculty roles in future applications - ongoing
1.7 (3.2iii)
Continuing (High) AMBER
Collect and analyse institutional data, relevant to Athena SWAN, on an annual basis.
- Key contacts identified for data collection. - Data collection approaches have advanced to include more detailed data (e.g. time taken to complete studies). - Data has been examined and analysed by SAT.
- Continuing to work with UWE Business Intelligence and EDI to improve annual data that is provided - Data for 2019 application available 9 months in advance. - 5 years of data presented in 2020 application.
Equality and Diversity Awards Officer
UWE Business Intelligence UWE HR
Sept 2017
Annually
Data feeds into action plan on an ongoing basis - increased Regular review of data during SAT meetings - increased Improved accuracy of data in future applications - ongoing

125
1.8 (3.2iii)
Continuing (Medium) GREEN
Network with regional initiatives to share departmental good practice.
- Departmental SAT members have regularly attended regional network meetings (April 2014, September 2014, March 2016) and co-hosted a regional network meeting in July 2013. - Departmental SAT lead is a member of WISE Bristol Hub (from November 2015). - Relevant local events are promoted to the SAT and/or Department (e.g. Bristol Girls Make It launch March 2016).
- Provide workshops at UWE Bristol. - Attended conferences and contributed publications on Athena SWAN. - Participation in an international project on gender equality. - Features at key DAS events (Forums, Futures Fair etc.)
All SAT members
n/a Sept 2016
Nov 2020
50% of SAT members expected to attend one relevant event over three years. - complete Flagship regional meeting or conference held – participation in a number of internal and external events
1.9 (3.2iii)
Continuing (Medium) GREEN
Network with national conferences and events to share departmental good practice.
- Departmental SAT lead has attended national events to share good practice (September 2015, November 2015, December 2015).
- UWE and DAS budget to support staff attending Athena SWAN events. - Participation in an international project on gender equality.
All SAT members
HoD Sept 2016
Nov 2020
25% SAT members expected to attend one relevant national event over three years - complete
1.10 (3.2 iii)
NEW (Medium) GREEN
Increase the frequency of SAT meetings to every two months.
- SAT meetings scheduled well in advance, within working hours of 10-4pm and avoiding key holidays (e.g. half-term).
- SAT meetings held every two months, and monthly for the six months before application. - Meetings held on rotating schedule to increased part-time staff participation.
Equality and Diversity Awards Officer
SAT Lead Sept 2016
Nov 2020
SAT meetings held every two months - complete

126
1.11 (2)
NEW (High) AMBER
Improve the process to collate data, identify and action change for technical and professional service staff with a clear relationship to the Department.
- SAT membership includes technical and professional staff representation. - Athena SWAN surveys extended to include technical and professional staff. - List of technical and professional staff associated to the Department identified and data collected for 2015/16.
- Increased technical/professional staff representation on SAT. - Technical/professional staff included in communications and events (e.g. DAS Away Day training). - Collaboration with the Technicians Commitment team.
SAT Lead Athena SWAN Officer Professional Services Representative Technical Team Representatives
SAT Lead Faculty Technical/ Professional Team Managers
Sept 2016
Annually
Improved accuracy of data in future applications - ongoing Increased impacts for technical and professional staff measured via survey questions – 30 staff completed survey in 2019, compared to 24 in 2016.
Theme 2: Undergraduate Student Engagement
New or continuing action
Issue identified for action
Actions and impacts achieved since 2013
Actions and impacts achieved since 2016
Responsibility (SAT member)
Accountability
Timescale Success Measure
Start Review/end date
2.1 (3iii)
NEW (High) AMBER
Increase awareness of Athena SWAN amongst current undergraduate and postgraduate students.
- Introduced undergraduate SAT representation in 2016. - PhD student representative on SAT since 2013. - ‘Athena SWAN plenary’ included in annual Department careers event the ‘Futures Fair’. - Additional Athena SWAN surveys established for PhD/Prof Doc students in March 2016. - PGR tutor has attended relevant SAT meetings to hear and report back on PGR related issues.
- Athena SWAN banners and postcards available at key student locations and events. - Athena SWAN slide included in open day and induction presentations. - PGT/PGR programme leaders, supervisors and Graduate School aware of Athena SWAN. - Athena SWAN included in SciBytes and Science Matters. - Athena SWAN speakers at Futures Fair.
Open Days and Marketing Representative Programme Leader Representative Senior Lecturer Representative UG Student Representative AHoD/Research Representative
SAT Lead Sept 2016
Annually
Increase in responses to survey question ‘I am aware of Athena SWAN initiatives in my Department’ - ongoing Student engagement with SAT, e.g. uptake of membership opportunities - complete Increase in UG related issues minuted at SAT meetings – no change Increase in PGT and PGR related issues minuted at SAT meetings - increased

127
– Second year undergraduate survey piloted in March 2016.
PG/PhD Student Representative
2.2 (3.2iii)
NEW (Medium) RED
Expand pilot undergraduate survey to all second years in 2017.
– Second year undergraduate survey piloted in March 2016.
- Recorded programme area in survey. - Extra questions on the UG survey around their choice to accept a place at UWE. - Survey sent to all UG Level 2 students in Spring 2019. - Student focus group scheduled in Dec 2019 but no uptake.
SAT Lead Programme Leader Representative
SAT Lead June 2017
Dec 2017
UG survey completed in September 2017 – completed in 2019 but low student uptake
2.3 (4.1ii)
NEW (High) GREEN
Develop a strategy around improved female recruitment on UG programmes which are failing to recruit expected numbers of female or male students.
- All Department staff requested to update their online profile pictures in February 2016. - Departmental video produced in January 2014 featuring 53% (n=9) female and 47% (n=8) male students, and 57% male (n=4) and 43% (n=3) female staff in individual shots. - CRIB Impact brochure produced in October 2015 names 64% (n=21) male researchers and 36% (n=12) female researchers. - Departmental Athena SWAN case studies feature 6 women and 2 men in a range of career and personal contexts.
- ‘Recruitment’ working group set up in 2018/19 to examine why female/male recruitment is varying from benchmarks. - Updates to the online prospectus to demonstrate commitment to ensure visible female and male staff and students.
Open Days and Marketing Representative Programme Leader Representative Senior Lecturer Representative UG Student Representative
SAT Lead UWE Marketing
Sept 2017
Sept 2018
3-5 actions recommended from working group - complete Athena SWAN agenda more visible in UG prospectus materials - ongoing Improvement of female/male recruitment to UG programmes so that they are within 5% of national and Alliance benchmarks - 61% of UG within 5% of their benchmarks, compared to 28% (5 out of 18) in 2016

128
2.4 (4.2ii)
NEW (High) AMBER
Investigate why there is a variation in the number of offers made to female students at UG level, as well as acceptance of those offers by female students.
- All Department staff have online E&D training, and participated in Decision Making and Unconcious Bias training in June 2016. - Application, including information on programmes missing benchmarks shared with all Department staff, including programme leaders.
- ‘Recruitment’ working group set up in 2018/19 to examine why female recruitment is varying from benchmarks. - Extra questions on the UG survey around their choice to accept a place at UWE. - Investigated Athena SWAN aligned activities within UG APT. - Investigated the introduction of an Athena SWAN prize for a female student at graduation. - Examined UCAS data at SAT meetings. - DAS staff completed mandatory equality and diversity training. - Unconcious Bias and Inclusive Curriculum Design training at DAS 2019 away day.
Open Days and Marketing Representative Programme Leader Representative Senior Lecturer Representative UG Student Representative
SAT Lead Sept 2017
Sept 2018
3-5 actions recommended from working group - complete Improved understanding of why female students accept a place at UWE - ongoing Increase in responses to survey question ‘if I required information on a University policy (e.g. maternity/ paternity) I would be aware of who to contact for information’ – Increased to 44% in 2019, compared to 33% in 2016 Increase in responses to survey question ‘I am personally benefitting from Athena SWAN initiatives in my Department’ – no change
2.5 (4.2ii)
NEW (High) AMBER
Monitor male degree results and consult programme leaders on actions in relation to male UG degree performance.
- Degree results have been monitored and examined by the SAT.
- Introduce questions within the UG student survey regarding how male students feel supported. - Module Attainment Gap now reviewed by DAS DLT annually and including an intersectional approach. - Collaboration with DAS widening participation team.
SAT Lead Programme Leader Representative Senior Lecturer Representative
SAT Lead Sept 2017
Nov 2020
Increase in understanding of degree result disparities by gender - ongoing

129
Theme 3: Recruitment
New or continuing action
Issue identified for action
Actions and impacts achieved since 2013
Actions and impacts achieved since 2016
Responsibility (SAT member)
Accountability
Timescale Success Measure
Start Review/end date
3.1 (5.1i)
Continuing (High) AMBER
Make the Department more attractive to female applicants by increasing visibility of women among existing staff and students.
- Use of positive action statements on job adverts. - Athena SWAN mentioned in Department information for appointments. - All Department staff requested to update their online profile pictures in February 2016. - Departmental video produced in January 2014 featuring 53% (n=9) female and 47% (n=8) male students, and 57% male (n=4) and 43% (n=3) female staff in individual shots. - CRIB Impact brochure produced in October 2015 names 64% (n=21) male researchers and 36% (n=12) female researchers. - Departmental Athena SWAN case studies feature women and men in a range of career and personal contexts.
- Staff Recruitment and Progression working group set up in 2018/19 to examine why female recruitment is varying from benchmarks. - Strengthened information on Department culture, flexible working and career breaks within information for appointments. - Created a Recruitment Reminders document. - Trialled the use of WISE for academic appointments. - Encouraged all DAS marketing materials to improve representation of gender equality.
Head of Department SAT Lead Professional Services Representative
Head of Department
Sept 2016
Annually
Increase female applicants for Department job opportunities to 50% by 2019 – 42% of applicants are female but females are now more likely to be shortlisted and offered a post after interview
3.2 (5.1i)
NEW (Medium)
Better utilise Department staff networks in sharing
- Appropriate Department staff are notified when an
- All Department staff are now notified when a job
Head of Department
Head of Department
Sept 2016
Annually
Increase female applicants for Department job opportunities to

130
GREEN
and promoting Department job opportunities.
(external) job role is advertised online. - All staff within the Department are invited to presentations for posts.
opportunity is advertised within the Department.
Professional Services Representative
50% by 2019 – ongoing, 42% of applicants are female
3.3 (5.1i)
NEW (Medium) GREEN
Ensure that there is a gender and diversity mix (e.g. BME, LBGT) throughout Department recruitment events (interviews, Department tour, presentation).
- Staff recruitment is carried out in accordance with the statutory duties of the University to promote equality and eliminate discrimination. - Interview panels include female representation and wider range of staff grades. - Staff on interview panels have undertaken recruitment and selection training. - All staff within the Department are invited to presentations for posts.
- Encouraged uptake of recruitment and selection training throughout the recruitment process. - Improved intersectionality in recruitment events by extending involvement in campus tours, and hosting, to more junior staff members.
Head of Department Professional Services Representative
Head of Department HR
Sept 2016
Annually
Increase diversity of staff engaged in recruitment events by 2019 - complete
Theme 4: Workload Management, Flexible Working and Career Breaks
New or continuing action
Issue identified for action
Actions and impacts achieved since 2013
Actions and impacts achieved since 2016
Responsibility (SAT member)
Accountability
Timescale Success Measure
Start Review/end date
4.1 (5.6v)
NEW (High) AMBER
Academic Workload
Model is not
transparent:
Investigate equity
of WLB allocation
between male and
female staff to
identify any
- Staff survey shows small increase in staff agreeing workload is allocated fairly (38% to 41%) and openly (38% to 41%) since 2013. - Staff survey shows increases in how staff see their teaching/pedagogy
- Continued to gather feedback from Department staff on the inconsistencies of the WLM. - Moved workload planning earlier, allowing it to inform the PDR process and improve
Head of Department Senior Lecturer Representative Senior Research
Subject Group AHoDs/ Head of Department
Sept 2017
Sept 2018
Increase by 15% staff agreement that workload is allocated fairly and openly in next staff survey – ongoing, 13% improvement in staff agreement that workload is allocated openly (41% in 2016 to 54% in 2019), and 3% improvement that workload is allocated fairly (41% in 2016 to

131
variations in ‘over-
bundling’.
(76% to 81%), administrative work (28% to 44%) and external activities (21% to 34%) valued. - Department has increased advanced use of AWM to identify potential for over-bundling in advance and recruit accordingly. Over bundling has decreased by 25% since 2013/14.
monitoring of staff who are ‘over bundled’.
Fellow Representative Technical Team Representatives Professional Services Representative
44% in 2019). There was no statistical variation in the responses on the basis of gender
4.2 (5.6viii)
NEW (Low) AMBER
Ensure it is clearly communicated to staff that time spent on University outreach and open day events (outside of working hours) should be taken as leave at another time.
- Staff survey asked for the first time if knowledge exchange (inc. public engagement activities) are valued in the Department, 46% agreed/strongly agreed. - Engagement in outreach is included as a discussion prompt in departmental PDRs. - Staff are informally able to take time in lieu on other dates.
- Communicate this message in requests to participate in relevant events. - Avoid scheduling Department meeting or events in close proximity (i.e. on the Monday following a Saturday open day).
Head of Department Open Days and Marketing Representative
n/a Sept 2016
Annually
Increase by 15% staff agreement that knowledge exchange (inc. public engagement activities) are valued in the Department – decrease to 54% in 2019 survey, from 63% in 2016 Diversify staff engaged in these activities – increase in female staff participation to 69%
4.3 (5.5vi)
Continuing (Medium) GREEN
Ensure that all staff are aware of the option to request flexible working.
- Staff survey shows increase in staff agreeing there is flexibility in their working hours/days/pattern (79% to 91%) since 2013. - Staff survey shows increase in availability and use of asking for time off at short notice, within leave, and without the
- Continue to include questions in staff surveys and focus groups, rather than instigate a formal request system. - Published a greater diversity of case studies. - ESS encourages greater diversity of recording for leave, and paid leave for cancer screening and
Head of Department SAT Lead
Subject Group AHoDs/ Head of Department
n/a March 2019
Maintain over 90% agreement that staff have flexibility in their working hours/days/ Pattern – increased to 99% agreement in 2019 Maintain over 80% agreement that staff can ask for time off at short notice – increased to 95% agreement in 2019

132
need to give reasons (56% to 81%) since 2013.
life-long illness appointments.
4.4 (5.5i)
NEW (High) GREEN
Ensure that all line managers are familiar with the UWE guidance and advice for maternity, adoption, paternity and carers leave
- HR resources on maternity, adoption, paternity and carers leave have been updated. - Some staff are utilising all support available before, during and after leave.
- Increased staff awareness of the support available, before, during or after leave. - Provided departmental pointers to UWE HR resources for line mangers at 2018 DAS Away Day.
Head of Department SAT Lead
Head of Department UWE HR
Sept 2016
Nov 2020
Reduce discrepancies in experience/ awareness amongst staff taking leave, as recorded on staff survey – improvements in all survey questions associated to these types of leave
4.5 (5.5i)
NEW (Low) GREEN
Emphasise role of the New Parents group for peer support and advice, alongside maternity/paternity/adoption mentor coffee meetings (Action 5.5).
- Staff would like improved access to leave ‘role models’ for advice.
- Mentor database now available on the UWE intranet. - Staff groups and forums highlighted in DAS communications.
All SAT members
n/a Sept 2017
March 2018
Increase awareness amongst staff of role models, as recorded on staff survey – increase in staff reporting it was easy to return to work from 55% in 2016 to 62% in 2019.
Theme 5: Career Development
New or continuing action
Issue identified for action
Actions and impacts achieved since 2013
Actions and impacts achieved since 2016
Responsibility (SAT member)
Accountability
Timescale Success Measure
Start Review/end date
5.1 (5.3ii)
Continuing (High) AMBER
Ensure that all staff are appraised annually via their PDR and that this process is valuable for workload planning and career development.
- Increased staff having an annual PDR and improved record keeping of this. - PDR’s now aligned with early summer to assist in workload planning. - Staff survey shows increase in staff appraised regularly by
- Changed the way PDRs are monitored, permitting non-completions to be identified on an annual basis. - Scheduled PDR’s earlier in the academic year to feed into workload planning.
Head of Department SAT Lead
Head of Department
n/a Nov 2020
95% staff appraised via PDR or probationary processes by 2020 – 94% of female staff, and 95% of male staff completing annually Staff satisfaction in PDR being useful and professionally valuable to increase to 75% - ongoing, 47% of staff in 2019 saw the PDR process as useful and professionally valuable

133
PDR (68% to 88%) since 2013. - Staff survey shows increase in staff who see the PDR as useful and professionally valuable (35% to 49%) since 2013. - Guidance notes (including advice on job descriptions, objective setting, recognition, health and wellbeing etc.) for PDR providers circulated by HoD in advance of PDR’s being carried out.
- PDR reviewers attend mandatory PDR training as part of UWE Manager training. - Provided an annual briefing for PDR reviewers and collated common issues at the end of each PDR cycle.
5.2 (5.3iii)
Continuing (Medium) GREEN
Encourage staff to participate in mentoring schemes, including (when appropriate) the Women Researchers Mentoring Scheme (WRMS).
- 4 female staff have applied to be mentored since 2013 - % of female staff at grades I and J has increased since 2013.
- Communicated various mentoring and careers development opportunities (including external) to staff.
Head of Department SAT Lead
Head of Department RBI Individual staff members
Nov 2016
Nov 2019
- Increase numbers of female staff mentored to nine or more by 2019 - complete
5.3 (5.3i)
Continuing (Low) AMBER
Encourage uptake of internal and external staff development courses and activities by female and male staff.
- Staff survey shows increase in awareness of development and training opportunities in the Department, Faculty and University (over 77%) and 78% have been supported to undertake further academic or professional training. - Staff survey shows increase in awareness amongst staff of training on management, mentoring and
- Continued to offer training and development on unconscious bias at the local level (e.g. via Department Away Day) of benefit for all staff. - Encourage Department staff to make better use of opportunities to be funded to study UWE modules, or participate in internal and external training.
Head of Department SAT Lead
Subject AHoDs/ Head of Department/ HR
n/a Nov 2020
100% staff aware of Department, Faculty and University development and training opportunities as measured by the staff survey – ongoing, 92% of staff have engaged in equality and diversity training and 86% of staff report that they are kept up-to-date with department training and development

134
supervision (53% to 85%) and equality and diversity (46% to 88%) since 2013. - Female staff have higher uptake of Department and Faculty level training opportunities. - Technical staff are encouraged to join the Science Council.
- DLT, and those with management responsibilities, have attended mandatory UWE Manager training, - Signed up to the Technician Commitment in 2017.
5.4 (5.3i)
NEW (Medium) AMBER
Seek to increase uptake of training and development opportunities amongst associate lecturers, whilst recognising that the nature of their contract may make this challenging.
- Staff survey shows low awareness of training and development opportunities amongst Associate Lecturer staff.
- Associate Lecturers added to department mailing lists in 2017. - Continued to offer training and development on unconscious bias at the local level (e.g. via Department Away Day) of benefit for all staff. - Associate Lecturer focus group held in 2019.
Head of Department SAT Lead Professional Services Representative
Head of Department HR
June 2017
March 2019
Increased awareness and uptake of Department, Faculty and University development and training opportunities amongst associate lecturers - ongoing
5.5 (5.3i)
NEW (Low) AMBER
Investigate Department staff uptake of University level training and development, and/or external courses, and consider how this data can be recorded.
n/a - Staff encouraged to report uptake of external training and development in their PDRs, and to plan in future training and development as objectives. - ESS records University level training.
Equality and Diversity Awards Officer SAT Lead Head of Department
HR March 2017
Nov 2020
Provision of data on external training and development by gender and grade in next application – ongoing, increased data included
5.6 (5.6iii)
Continuing (Medium) GREEN
Encourage staff ‘turnover’ in Departmental, Faculty and University roles, e.g. committee membership.
-73% of Department roles (e.g. PGR tutor, vacation bursaries coordinator, programme leaders) are now occupied by female staff.
- Turnover in department roles has been encouraged, monitored and more frequently assigned on the basis of transparent expressions of interest.
SAT Lead Professional Services Representative
Head of Department Faculty Deans
Sept 2016
Nov 2020
Monitor current levels of female staff in such roles – complete, more parity with 54% of Department roles now female

135
5.7 (5.6iii)
NEW (High) GREEN
Investigate if female staff are ‘overburdened’ by Departmental, Faculty and University roles.
- Staff survey shows increase in numbers of staff who high identify high administrative load as being detrimental to their career to date (39% to 45%) since 2013.
- Staff focus group carried out in 2019. - Turnover in department roles has encouraged greater parity in committee roles.
SAT Lead Equality and Diversity Awards Officer
n/a March 2017
March 2019
50%/50% female/male staff engaged in Departmental, Faculty and University roles – complete, 56% (n=38) of department level committee representatives are female
5.8 (5.6iii)
NEW (Medium) AMBER
Report on the excess of committees at the University which may be overburdening staff in certain job roles and grades.
- Data collection identified over 75 University and Faculty committees and groups.
- Engaged with the University SAT and collaborative group regarding committee proliferation. - UWE undertook a rationalisation of committees in 2019.
SAT Lead Professional Services Representative
University Executive
Nov 2016
Nov 2020
15% reduction in the number of University and Faculty committees and groups - ongoing
5.9 (5.6iv)
NEW (Medium) RED
Encourage and value external roles taken on by female staff members.
- SciBytes profiles all staff and student achievements on a monthly basis. All staff are sent a request for news. - Science Matters profiles staff and student successes. - Department away day profiles successes from the year.
- Staff encouraged to report uptake of external roles in their PDRs, and to plan in future training and development as objectives. - Moved workload planning earlier to encourage staff to plan use of their research and scholarship time for such activities. - Increased nominations to University and external awards and schemes.
Head of Department SAT Lead
Head of Department Faculty Deans
Sept 2016
Annually
Increase by 15% staff agreement that external professional activities are valued in the Department - ongoing,10% decrease in external professional activities being valued (for both men and women)
5.10 (4.2ii)
NEW (High) GREEN
Continue to monitor the percentage of female staff on fixed term contracts and develop opportunities for
- Percentage of female staff employed on fixed term contracts has decreased to 51% in 2015/16 compared to 75% at the time of our last application.
- Continue to explore opportunities/business cases for permenant contracts.
Head of Department
Head of Department Principle/co-investigators.
Nov 2016
Nov 2020
% of female staff on fixed term contracts aligns to Alliance Universities average (43%) – complete, 17-25% female staff on fixed term contracts

136
permanent contracts.
Theme 6: Promotion
New or continuing action
Issue identified for action
Actions and impacts achieved since 2013
Actions and impacts achieved since 2016
Responsibility (SAT member)
Accountability
Timescale Success Measure
Start Review/end date
6.1 (5.1iii) (5.4)
Continuing (Medium) GREEN
Ensure that all members of staff are familiar with the criteria and procedures for promotion.
- SAT have regularly engaged and sought to inform/lobby University policy/procedures regarding promotion (e.g. via Faculty Board February 2014, SAT meetings July 2014, March 2015). - HR created new promotional criteria and guidance June 2014 onwards, including clearer routes to promotion for staff at different levels. - Faculty promotion workshop held in 2014 with Department staff encouraged to attend. - Staff survey shows increase in staff knowledge of UWE’s promotion criteria (29% to 52%) since 2013. - Staff survey shows increase in staff knowledge of UWE’s promotion processes (31% to 58%) since 2013.
- Improved awareness of promotional processes and criteria, and the perception that there is no variation on treatment of staff on the basis of gender from 60% in 2016 to 82% in 2019. - Continued to lobby for the introduction of a University-led annual promotion scheme. - UWE has clarified the structure to progress to Associate Professor through teaching and learning. - Staff Recruitment and Progression working group set up in 2018/19 to examine how progression can be better supported and actions created. - Carried out staff focus group. - DLT circulated
information on Progressing to Associate
Head of Department Faculty Executive Representative AhoD/Research Representative SAT Lead
HR Sept 2018
Nov 2019
3-5 actions recommended from working group. - complete One focus group held - complete Increase female promotion rate to 50% by 2019 – ongoing, 46% by 2019 Increase to 75% staff agreement that they have knowledge of UWE promotion criteria and processes – ongoing, 48% UWE's promotion process and 47% UWE’s promotion criteria

137
Professor/Professor workshops.
6.2 (5.1iii)
NEW (High) GREEN
Examine why lower numbers of female staff are being promoted.
- Female Department staff encouraged to take up Women Researchers Mentoring Scheme. - Staff survey shows majority of female staff have knowledge of UWE’s promotion criteria (60%). - Staff survey shows increase in staff knowledge of UWE’s promotion processes (31% to 58%) since 2013.
- Staff Recruitment and Progression working group set up in 2018/19 to examine how progression can be better supported and actions created. - Carried out staff focus group.
Head of Department Faculty Executive Representative AhoD/Research Representative SAT Lead
HR Sept 2018
Nov 2019
3-5 actions recommended from working group - complete One focus group held - complete Improved understanding of why female promotion rates might be varying - ongoing Increase female promotion rate to 50% by 2019 - ongoing, 46% by 2019
6.3 (5.1iii)
Continuing (High) AMBER
Ensure female staff are aware of and consider externally, as well as internally, advertised promotion opportunities, alongside opportunities for re-grading.
- Annual promotion round for research associates/fellows/senior fellows communicated well in advance to Department staff. - One-to-ones on promotion held by Executive Dean for Research and Innovation (SAT team member) since 2013. - From 2015 agreed that all internal and external departmental appointments will be listed in the Faculty Business plan and all staff will be informed on opportunities well in advance.
- All Department staff are notified when a job opportunity is advertised within the Department. - All Department staff are notified when a job opportunity, permitting progression, is advertised within other departments (e.g. AHoD roles). - Progression resources signposted in Athena SWAN updates (e.g. SciBytes and Away Days). - DLT circulated
information on Progressing to Associate Professor/Professor workshops.
Head of Department Faculty Executive Representative AhoD/Research Representative SAT Lead
HR n/a Nov 2019
Increase female promotion rate to 50% by 2019 - ongoing, 46% by 2019 Increase to 75% staff agreement that they have knowledge of UWE promotion criteria and processes - ongoing, 48% UWE's promotion process and 47% UWE’s promotion criteria ongoing, 48% UWE's promotion process and 47% UWE’s promotion criteria

138
6.4 (5.3iii)
NEW (High) GREEN
Feed into UWE processes regarding the additional need for teaching led progression routes.
- Staff survey data gathered information on barriers to progression at UWE. - Staff survey identified career progression and promotion as the second most important priority area that Athena SWAN could address for department staff.
- Engaged with the University SAT and collaborative group regarding promotion opportunities for teaching orientated staff beyond Senior Lecturer level. - UWE has clarified the structure to progress to Associate Professor through teaching and learning. - DLT circulated
information on Progressing your career in learning and teaching organised by the Academic Practice Directorate.
Head of Department Faculty Executive Representative AhoD/Research Representative SAT Lead Equality and Diversity Awards Officer
HR/University Executive
Sept 2016
Nov 2019
UWE instigates a teaching led progression route – complete, UWE has clarified the structure to progress to Associate Professor through teaching and learning
6.5 (5.1iv)
NEW (Medium) GREEN
Continue to monitor female researchers entered to REF, compared to those eligible, and recommend UoA leads have compulsory unconscious bias training.
- Increase in the numbers
of female staff, as well as
early career researchers
and those who had a
career break entered in
REF 2014.
- Female staff members were appointed to lead UoA3 and 6, and UoA leads have had unconscious bias training. - REF CV has helped to inform selection of outputs. - SAT fed into consultation on a new Code of Practice.
Faculty Executive Representative Senior Research Fellow Representative Research Fellow/Associate Representative
UoA Leads
Sept 2016
Nov 2020
Increase in female researchers entered from the Department in REF 2020/21 – ongoing, outcome will be known in 2020 50% of eligible female staff entered in REF 2020/21 - ongoing, outcome will be known in 2020
6.6 (5.1iii)
NEW (High) GREEN
Improve record keeping for staff applying for promotional opportunities that are advertised both externally and
- Records on promotion
by gender are now being
kept by HR.
- All promotion information is now captured by the electronic recruitment process.
Head of Department
Head of Department HR
Sept 2016
Nov 2019
Complete records on application, shortlisting and appointment to be presented in 2019 application - complete

139
internally, or do not follow the electronic recruitment process.
Theme 7: Communication and Culture
New/ continuing action
Issue identified for action
Actions and impacts achieved since 2013
Actions and impacts achieved since 2016
Responsibility (SAT member)
Accountability
Timescale Success Measure
Start Review/ end date
7.1 (3iii)
Continuing (High) AMBER
Increase awareness of Athena SWAN and the role of the SAT in embedding change across the Department.
- Application and action plan shared with all Department staff. - Department Athena SWAN website established. - Athena SWAN included in HoD monthly news (SciBytes) and Department ‘magazine’ (Science Matters). - Staff survey shows increase in number of staff aware of Athena SWAN in the Department (39% to 81%) since 2013.
- Bronze Award outcome shared via DAS Forums and UWE Staff News - Athena SWAN logo shared for use in staff email signatures. - Athena SWAN included on agenda at 2017,18 and 19 DAS Away Day. - Standing item on department committees. - Waiting list for SAT membership. -Increased use of ‘Gender Equality’ rather than Athena SWAN.
All SAT members
SAT Lead Sept 2016
Annually
95% staff aware of Athena SWAN in the Department –ongoing, increased to 85% agreement in 2019 Increase in ‘agree’ responses to survey question ‘I am personally benefitting from Athena SWAN’ - ongoing, increased to 25% agreement in 2019
7.2 (3.2iii)
NEW (Medium) GREEN
When appropriate, coordinate with other equality and diversity events and activities at Department level.
- ‘Athena SWAN plenary’ included in annual Department careers event the ‘Futures Fair’. - Conversations held with BME and widening participation team about possible collaborative opportunities.
- Three SAT members participate in Faculty Equality, Diversity and Inclusivity Task Force. - Continuing collaborations with employability, widening participation teams and other DAS events.
SAT Lead Professional Services Representative
Equality and Diversity Unit
Jan 2018
Dec 2018
Increased engagement with other Department events (2-4 per year) - complete

140
7.3 (3.iii)
Continuing (High) GREEN
Share good practice with the Faculty and institution.
- Athena SWAN news and updates from the Department communicated in University weekly e-news and the Voice magazine. - Member of the UWE Athena SWAN collaborative group (established January 2015). - Application, including impacts and future action plan shared with collaborative group.
- Results of Athena SWAN activities are regularly shared with the Faculty Executive. - DAS materials are used as templates for other departments (e.g. postcard). - Continued ‘local’ Department equality and diversity training.
SAT Lead Equality and Diversity Awards Officer
Equality and Diversity Unit/ University SAT
Sept 2016
Nov 2019
3-5 actions recommended from student intern project – incomplete, UWE student intern process changed meaning this activity could not go ahead Provision of advice to 1-4 new Departments applying to Athena SWAN for the first time - complete
7.4 (3.2iii)
NEW (High) GREEN
Investigate a way to better report/coordinate issues to the University SAT.
- Member of the UWE Athena SWAN collaborative group (established January 2015).
- SAT lead is a member of the UWE Athena SWAN steering groups. - Issues regularly fed to University via collaborative group.
SAT Lead
Equality and Diversity Unit/ University SAT
March 2017
Annually
Reporting mechanism from Department to University SAT established - complete
7.5 (5.6vi)
NEW (Medium)
Investigate the
introduction of core
hours (10-4pm) for
Department
meetings.
- SAT meetings scheduled well in advance, within working hours of 10-4pm and avoiding key holidays (e.g. half-term).
- SAT meetings held on a rotating schedule to accommodate part-time staff. - Consultation on core hours and introduction in next action plan.
Head of Department Professional Services Representative
Head of Department
Sept 2017
Annually
75% of Department meetings scheduled between 10-4pm - complete
7.6 (5.6vii)
Continuing (High) AMBER
Publicise and celebrate the successes of staff and students (publications, Award of Grants, Nominations for awards, prizes).
- Award celebration held (November 2013) to mark Bronze Award. - SciBytes profiles all staff and student achievements on a monthly basis. All staff are sent a request for news.
- Increased nominations to University and external awards and schemes. - Introduced Penny Coffee scheme as recognition for good work. - Increased encouragement to apply
Head of Department All SAT members
Head of Department
n/a Annually
Greater variety of news shared in SciBytes, Science Matters and through internal and external staff awards - complete 95% of staff agree that successes are publically acknowledged within the Department. – ongoing, 71% agreement in 2019

141
- Science Matters profiles staff and student successes. - Department away day profiles successes from the year. - Head of Department encourages staff and students to apply for external and internal awards. - Staff survey shows increase in number of staff agreeing that staff successes are publically acknowledged within the Department (34% to 75%) since 2013.
for the Exceptional Contribution Honorarium scheme.
7.7 (5.6vi)
Continuing (Medium) GREEN
Improve social aspects of the Department, and introduce more social gatherings that also involve students.
- Annual departmental Barbeque held in coordination with departmental Away Day. Staff and PhD students are invited to bring their families. - Annual departmental Christmas party. Staff and PhD students are invited to bring their families. - Christmas and NSS parties held at programme level to celebrate achievements with UG students. - Monthly ‘Cake Friday’ encourages staff to socialise and meet over coffee. - Staff survey shows increase in number of
- Continued to hold social events to which students of all levels are also invited. - Staff survey shows increase in number of staff agreeing that the working environment is friendly (86% to 88%) since 2016.
All SAT members
n/a Sept 2016
Annually
5-6 social events held per year - complete Increase in number of social events held to which students are invited - complete

142
staff agreeing that the working environment is friendly (82% to 86%) since 2013.
7.8 (5.6vi)
NEW (Medium) AMBER
Ensure
departmental and
social gatherings
are organised over
a range of days of
the week to enable
staff on differing
work patterns to
engage.
n/a - Varied dates and timings of social events to accommodate different working patterns.
All SAT members
n/a Sept 2016
Annually
Increase in social gatherings held on Tuesday – Thursday - ongoing
7.9 (5.6vii)
NEW (High) GREEN
Improve the gender
balance of speakers
at key Department
events (e.g. seminar
series)
- 35% of speakers at Department seminars have been female.
- Requested in that seminar organisers keep gender balance in mind when identifying speakers from 2017/18.
AHoD/Research Representative
Research Centres
Sept 2016
Annually
50% of speakers at Department seminars are female – complete, 56% seminar speakers female since 2016
7.10 (5.6viii)
NEW (Low) AMBER
Make ‘gender count’ liaise with PE coordinator to encourage outreach reporting and evaluation to include demographics on gender as standard.
- Improved data on staff participation in outreach since 2013. - Staff survey asked for the first time if knowledge exchange (inc. public engagement activities) are valued in the Department, 46% agreed/strongly agreed.
- Outreach evaluation does not routinely collect data on participants, including their gender. - PDR form acknowledges outreach and public engagement
SAT Lead UWE Public Engagement Coordinator
Sept 2016
Annually
Improved information available on the gender of participants in departmental outreach - ongoing