Demographic and sociological indicators of privatisation of marriage in the 19th century in Flanders
38
European Journal of Population 19: 375–412, 2003. © 2003 Kluwer Academic Publishers. Printed in the Netherlands. 375 Demographic and Sociological Indicators of Privatisation of Marriage in the 19 th Century in Flanders KOEN MATTHIJS Katholieke Universiteit Leuven, Department of Sociology, Centre for Population and Family Research, Van Evenstraat 2B, 3000 Leuven, Belgium (E-mail: [email protected]) Received 2 October 2002; accepted in final form 24 February 2003 Matthijs, K., 2003. Demographic and Sociological Indicators of Privatisation of Marriage in the 19 th Century in Flanders, European Journal of Population, 19: 375–412. Abstract. Relying on the assumption that privatisation of family life intensified in the 19 th century and that women were the pioneers in this process, we formulate nine hypotheses concerning indicators on family and marriage. The hypotheses are tested using data for three municipalities in Flanders (roughly the northern part of Belgium) covering the period 1800–1913, taken from about 17,000 marriage certificates. Special emphasis is on gender and social status distinctions. Most of the hypotheses, particularly those relating to first marriage, are confirmed. The various developments point to an underlying process which we refer to here as the privatisation of marriage, which can be explained by the changed social position and gender identity of women. The hypothesis put forward is that 19th-century economic and political marginalisation encouraged women to develop their dyadic power in primary relationships. Marrying young and creating an identity around expressive family and motherhood tasks was, for many women, a reaction to and a remedy for their public exclusion and economic subordination. Key words: illegitimacy, marriage patterns, privatisation, remarriage, 19 th century Matthijs, K., 2003. Indicateurs socio-démographiques de la privatisation du mariage en Flandre au 19 e siècle, Revue Européenne de Démographie, 19: 375–412. Résumé. Reprenant l’idée selon laquelle la privatisation de la vie familiale s’est intensifiée au 19 e siècle et que les femmes ont été des pionnières dans ce processus, nous émettons 9 hypothèses sur les indicateurs du mariage et de la famille. Ces hypothèses sont confrontées aux données de 17000 certificats de mariage provenant de 3 communes des Flandres (partie nord de la Belgique) sur la période 1800–1913. Une attention particulière est portée aux facteurs de genre et aux facteurs sociaux. La plupart des hypothèses, et notamment celles relatives au premier mariage, sont confirmées. Les différentes évolutions peuvent être rapportées à un même processus sous-jacent, dénommée ici privatisation du mariage, qui peut s’expliquer par le changement de la situation sociale des femmes et par la montée d’une identité féminine. Ainsi la marginalisation économique et politique des femmes au 19 e siècle les a encouragées à développer un double pouvoir dans les relations familiales. Un mariage précoce et la construction d’une identité à travers la
Transcript of Demographic and sociological indicators of privatisation of marriage in the 19th century in Flanders

European Journal of Population 19: 375–412, 2003.© 2003 Kluwer Academic Publishers. Printed in the Netherlands.
375
Demographic and Sociological Indicators ofPrivatisation of Marriage in the 19th Centuryin Flanders
KOEN MATTHIJSKatholieke Universiteit Leuven, Department of Sociology, Centre for Population and FamilyResearch, Van Evenstraat 2B, 3000 Leuven, Belgium (E-mail: [email protected])
Received 2 October 2002; accepted in final form 24 February 2003
Matthijs, K., 2003. Demographic and Sociological Indicators of Privatisation of Marriage in the 19th
Century in Flanders, European Journal of Population, 19: 375–412.
Abstract. Relying on the assumption that privatisation of family life intensified in the 19th
century and that women were the pioneers in this process, we formulate nine hypotheses concerningindicators on family and marriage. The hypotheses are tested using data for three municipalities inFlanders (roughly the northern part of Belgium) covering the period 1800–1913, taken from about17,000 marriage certificates. Special emphasis is on gender and social status distinctions. Most ofthe hypotheses, particularly those relating to first marriage, are confirmed. The various developmentspoint to an underlying process which we refer to here as the privatisation of marriage, which can beexplained by the changed social position and gender identity of women. The hypothesis put forwardis that 19th-century economic and political marginalisation encouraged women to develop theirdyadic power in primary relationships. Marrying young and creating an identity around expressivefamily and motherhood tasks was, for many women, a reaction to and a remedy for their publicexclusion and economic subordination.
Key words: illegitimacy, marriage patterns, privatisation, remarriage, 19th century
Matthijs, K., 2003. Indicateurs socio-démographiques de la privatisation du mariage en Flandre au19e siècle, Revue Européenne de Démographie, 19: 375–412.
Résumé. Reprenant l’idée selon laquelle la privatisation de la vie familiale s’est intensifiéeau 19e siècle et que les femmes ont été des pionnières dans ce processus, nous émettons 9hypothèses sur les indicateurs du mariage et de la famille. Ces hypothèses sont confrontées auxdonnées de 17000 certificats de mariage provenant de 3 communes des Flandres (partie nordde la Belgique) sur la période 1800–1913. Une attention particulière est portée aux facteurs degenre et aux facteurs sociaux. La plupart des hypothèses, et notamment celles relatives au premiermariage, sont confirmées. Les différentes évolutions peuvent être rapportées à un même processussous-jacent, dénommée ici privatisation du mariage, qui peut s’expliquer par le changement de lasituation sociale des femmes et par la montée d’une identité féminine. Ainsi la marginalisationéconomique et politique des femmes au 19e siècle les a encouragées à développer un double pouvoirdans les relations familiales. Un mariage précoce et la construction d’une identité à travers la

376 KOEN MATTHIJS
reconnaissance des tâches familiales et maternelles ont permis à beaucoup de femmes de réagir etde compenser leur exclusion de la sphère publique et leur dépendance économique.
Mots clés: illégitimité, privatisation, remariage, types de mariage, 19e siècle
1. Introduction
It is generally acknowledged that 19th-century private life in Western Europe wascharacterised by emotionalisation, domesticisation and privatisation. These devel-opments had been underway for some time, but they broadened and deepenedin all directions over the course of the 19th century (Ariès, 1962; Demos, 1970;Shorter, 1977; Stone, 1977; Hareven, 1978; Mitterauer and Sieder, 1983; Gillis,1996). Within the family, this involved the partner system as well as the parent andsibling system. A great body of historical sociological and historical demographicresearch is available on the characteristics and background of this. These studiesare mainly based on qualitative materials, such as diaries, sermons or advice books.The present study is an extension of these studies, and deals with the evolutionof demographic and sociological characteristics of people entering into marriageduring the ‘long’ 19th century (1800–1913) in Flanders.1 Specifically, we examinethe evolution of the following indicators: (1) first marriage intensity, (2) age atfirst marriage, (3) remarriage intensity, (4) the interval between being widowedand remarriage, (5) the number and proportion of witnessing family members, (6)the number and proportion of witnessing family members in the male or femaleline, (7) the proportion of first-married women working outside the home, (8) theproportion of illegitimate births and, (9) the proportion of children legitimised bymarriage.2
The development of each of these indicators is determined by various socialand cultural factors. However, rather than looking any further into this aspect, ourintention is to present an overall picture of the indicators together: if all differenttypes of demographic and sociological features of marriage and the marriage cere-mony point in the same direction, this can indicate an underlying social process.In our opinion, this process might be characterised as the privatisation of marriage.For some indicators, e.g., the proportion of witnessing family members, this char-acterisation is rather ‘evident’, for other indicators, e.g., the marriage intensity, itis not. But together and combined, the indicators might give an accurate picture ofan overall, macro-social development. Our starting point is that during the 19th
century, marriage and family life underwent a more or less progressing privat-isation. More and more formerly public activities became ‘domesticized’ and ininterpersonal relations between partners, parents and children, emotions becamecrucial (Perrot, 1990). Apparently more and more people wanted to be activelyinvolved in this process. An additional assumption is that romanticisation wasfurthered primarily by women (Dentith, 1998: 128–155; Caine and Sluga, 2000:32–54; Davidoff and Hall, 1987: 319). As will become clearer below, our basic

PRIVATISATION OF MARRIAGE IN 19TH CENTURY FLANDERS 377
hypothesis is partly confirmed, but it must also be qualified: there are some tentativeindicators that the privatisation trend seems to be restricted to first marriages (forremarriages there are some unexpected, although interesting conclusions), it seemsto accelerate in the second half of the 19th century, and the decade around 1850appears to be a crucial turning point.
2. Hypotheses
According to Gillis (1996) the decades around 1850 were a symbolic turning point.It was the time when highly-valued quality time became increasingly equated withintimate family time. In order to fulfil the new expectations, an entire range ofmarriage and family symbols were created, expanded and imitated en masse fromthe mid-19th century onwards. Bastard children, abandoned children, step-families,cohabitation and barbarian ways were thrown on the dung heap of society. Bycontrast, their middle-class counterparts were actively working their way to theforeground: anyone wanting to celebrate religious rites, buy children’s clothes,organise birthday parties or spend Christmas in a family group, simply had tomarry. Families were or became museums of family portraits and family albums,timeless places where the past was constantly commemorated. The family wasno longer a place where people shared instrumental tasks and anonymous rooms;it was no longer a household, but an environment in which the shared past andjoint future were realised. Physical proximity was not the only crucial aspect,but intense instinctive involvement was also important. The family became theultimate supplier of quality time. All kinds of rituals were intended to stimulatefamily stability, a sense of belonging, affection and continuity. This was chieflythe woman’s role and one reserved for Sundays. Sunday was not a day of restfor women, but a day for “labours of love” (Gillis, 1996: 13–14). Increasinglystrict requirements were imposed on this invisible labour and, by 1900, houseworkhad become a full-time job. It was a job involving increasingly more daily taskstaking longer to perform, precisely at a time when the public discussion was oneof reducing the hours worked outside the home (by men)!
Based on this general trend, nine hypotheses on long-term developments areformulated: (1) first marriage intensity will increase, (2) age at first marriage willfall, (3) remarriage intensity will increase, (4) the interval between widowing andremarriage will increase, (5) the number and proportion of family members actingas witnesses to marriage will increase, (6) the number and proportion of witnessingfamily members from the bride’s side will increase relatively more than from thebridegroom’s side, (7) the proportion of women in first marriages working outsidethe home will fall, (8) the proportion of illegitimate births will fall and, (9) theproportion of marriages with at least one legitimised child will increase.
People married and remarried during the (second half of the) 19th century moreand earlier and this behaviour was played out within a legally guaranteed andsocially highly esteemed family context. The ‘new’ domesticity was translated not

378 KOEN MATTHIJS
only into the husband/wife system, but also into the mother/daughter relationship.According to Roberts (1973), in the second half of the 19th century a ‘mum’ culturedeveloped, not only in middle-class enclaves, but also in working-class districts.This culture refers to the close contacts between and the mutual involvement ofmothers and their married daughters. The latter often settled in the immediatevicinity of the parental home. This house became the centre and the network ofmutual neighbourly help, of intimate social intercourse and a little secret language– in brief, of a congenial family culture. This had consequences for (the perceptionof) marriage and the marriage ceremony.
The more or less ‘autonomous’ process of privatisation, and related develop-ments such as emotionalisation and domesticisation, are a central guide for ourstudy, but not the only one. These processes can also be the result of civil and reli-gious disciplinary activities. This was incidentally prominent in the 19th century,particularly the second half (Art, 1992). This had consequences for the frequencyof marriage during Lent and Advent, two periods during which marriage wasforbidden by the Church, subject to dispensation (Lesthaeghe, 1989; Matthijs andVan de Putte, 2001). Nonetheless, romance and emotion were not immediately thefirst areas to receive attention from the Church: passion and affection were not themost important ingredients of a good marriage. Rather, the ‘ideal family’ was basedmore on domesticity then on emotional ties, more on marital love than on romanticlove (Cloet and Storme, 1991: 19–21).
Another characteristic of the 19th century was economic modernisation. Acarefully qualified transition took place at this time from a small-scale, tradi-tional agricultural society to a centralised, mechanised and large-scale industrialeconomy, flanked and supported by an expansive service sector. This was allpushed and pulled by the mutual reinforcement of scientific knowledge and tech-nical skill. Some see this movement as the driving force behind all kinds ofsocio-demographic and cultural changes, including at the level of the structure,the organisation and the functions of the family, as well as of marriage and themarriage ceremony.3 At first sight, this seems obvious but, upon closer inspection,additional explanation is needed. After all, central features of industrialisation,such as rationalisation and instrumentalisation cannot simply be logically linked toprivatisation: on the contrary, these processes can be better designated as the privatereaction to economic modernisation. ‘Cultural’ and ‘economic’ processes influenceeach other reciprocally. For this reason, the degree and direction of privatisationwill differ depending on socio-economic status: to an unskilled factory worker, thesong of emotion and romance sounds different than to small-scale farmers or a largeindustrialist. This is also translated into highly specific events: the interval betweenwidowing and remarriage is different for low-status groups than for high-statusgroups. This interval not only measures emotionalisation but also, for example,economic needs. Since all the elements of the nine hypotheses are status-sensitive,this social-status dimension is incorporated into our study where necessary and inso far as is possible.
PRIVATISATION OF MARRIAGE IN 19TH CENTURY FLANDERS 379
3. The Study
3.1. SOURCES
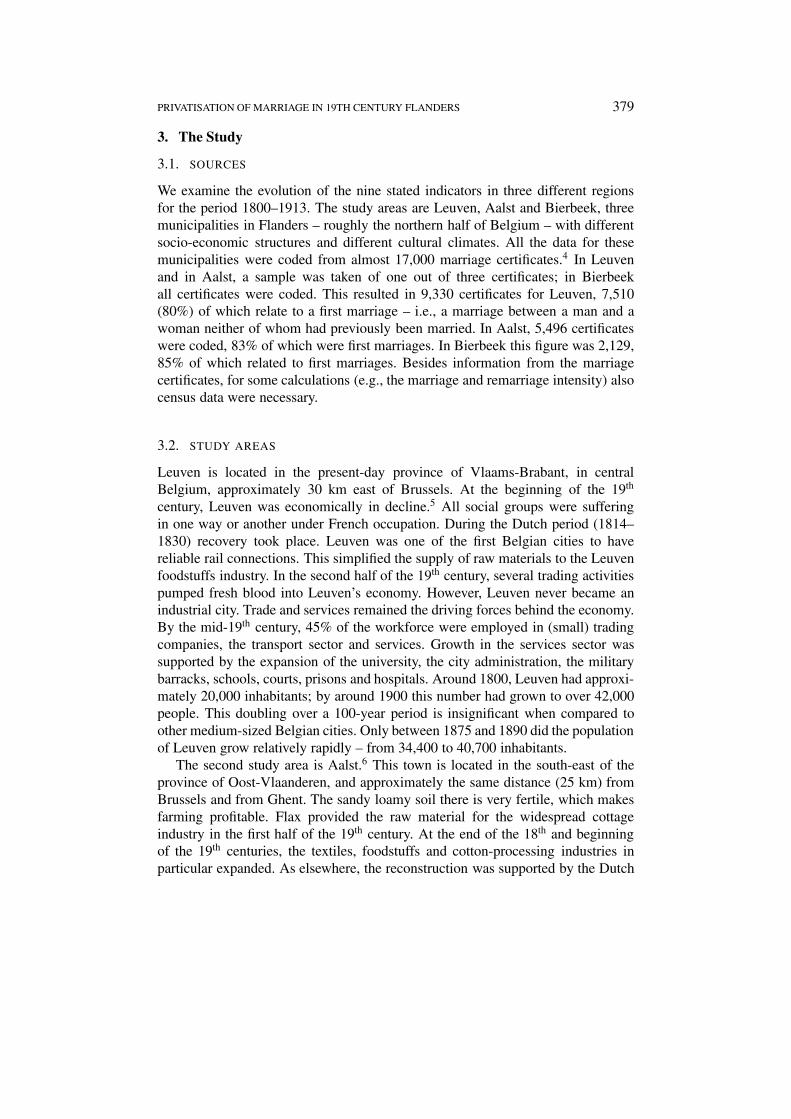
We examine the evolution of the nine stated indicators in three different regionsfor the period 1800–1913. The study areas are Leuven, Aalst and Bierbeek, threemunicipalities in Flanders – roughly the northern half of Belgium – with differentsocio-economic structures and different cultural climates. All the data for thesemunicipalities were coded from almost 17,000 marriage certificates.4 In Leuvenand in Aalst, a sample was taken of one out of three certificates; in Bierbeekall certificates were coded. This resulted in 9,330 certificates for Leuven, 7,510(80%) of which relate to a first marriage – i.e., a marriage between a man and awoman neither of whom had previously been married. In Aalst, 5,496 certificateswere coded, 83% of which were first marriages. In Bierbeek this figure was 2,129,85% of which related to first marriages. Besides information from the marriagecertificates, for some calculations (e.g., the marriage and remarriage intensity) alsocensus data were necessary.
3.2. STUDY AREAS
Leuven is located in the present-day province of Vlaams-Brabant, in centralBelgium, approximately 30 km east of Brussels. At the beginning of the 19th
century, Leuven was economically in decline.5 All social groups were sufferingin one way or another under French occupation. During the Dutch period (1814–1830) recovery took place. Leuven was one of the first Belgian cities to havereliable rail connections. This simplified the supply of raw materials to the Leuvenfoodstuffs industry. In the second half of the 19th century, several trading activitiespumped fresh blood into Leuven’s economy. However, Leuven never became anindustrial city. Trade and services remained the driving forces behind the economy.By the mid-19th century, 45% of the workforce were employed in (small) tradingcompanies, the transport sector and services. Growth in the services sector wassupported by the expansion of the university, the city administration, the militarybarracks, schools, courts, prisons and hospitals. Around 1800, Leuven had approxi-mately 20,000 inhabitants; by around 1900 this number had grown to over 42,000people. This doubling over a 100-year period is insignificant when compared toother medium-sized Belgian cities. Only between 1875 and 1890 did the populationof Leuven grow relatively rapidly – from 34,400 to 40,700 inhabitants.
The second study area is Aalst.6 This town is located in the south-east of theprovince of Oost-Vlaanderen, and approximately the same distance (25 km) fromBrussels and from Ghent. The sandy loamy soil there is very fertile, which makesfarming profitable. Flax provided the raw material for the widespread cottageindustry in the first half of the 19th century. At the end of the 18th and beginningof the 19th centuries, the textiles, foodstuffs and cotton-processing industries inparticular expanded. As elsewhere, the reconstruction was supported by the Dutch

380 KOEN MATTHIJS
regime. In 19th-century Aalst, textiles played a major role. The population of AalstGrew more quickly during the 19th century than that of Leuven. Around 1800 Aalsthad almost 11,000 inhabitants, rising to a little over 35,000 by 1910. This growthwas under pinned by the attraction of the textile industry. Its employees wereoften underskilled women. However, not only did Aalst have more immigrantsthan Leuven, but its natural growth was also higher, particularly after 1880.
The third study community, Bierbeek, was a small country community.7 Thecommunity lies just less than 10 km south-east of Leuven. Around 1750, Bierbeekhad fewer than 1,000 inhabitants, 2,700 around 1850 and 3,700 by around 1910.Geographically, Bierbeek is on the border between the loamy ground of Brabant,the Hageland and western Haspengouw. This border roughly coincides with thesoil science border between sand/loam and loam. The agricultural land is generallysuited to arable farming. In the 19th century, the vast majority of the population wasemployed in farming.
3.3. DIVISION OF OCCUPATIONS BY REGION
In order to gain an idea of the socio-economic profile of those marrying and, there-fore, to a certain extent of the study regions, the occupations of those marryingwere coded and classified.8 Following consultation and based on contact withthe sources and on theoretical considerations, we developed our own occupationclassification model (Matthijs, 2001: 68–73). A rough distinction is made betweenoccupations based chiefly on education and training (mainly occupations in theservices sector), and occupations based chiefly on capital and economic activities(chiefly occupations in trade and industry). Within these, a hierarchy can be createdfrom low, through middle, to high. Farmers and the ‘no occupation’ group are notincluded in this model.
Tables 1 and 2 divide up the occupations of first-marriage bridegrooms andbrides along the dual dividing line of capital/education and high/middle/low.9 Thetotals show us that in Leuven a relatively high proportion – approximately 10% –of bridegrooms had a high class position, either based on training and education oron capital. In Aalst and Bierbeek, these figures were much lower. Bierbeek had agreat many farmers. In Bierbeek, on average over the entire century among first-marrying men, 43% were farmers; in Leuven and Aalst these figures were 2% and10%. Relatively speaking, the low and middle economic occupations were over-represented in Aalst. This is in line with expectations (see study areas). It mustbe stressed that – with the exception of the last decades of the 19th century – thedifferences between Leuven and Aalst were fairly small. Among brides, the differ-ences were somewhat larger, which is related to the fact that much of the industrialemployment in Aalst revolved around textile processing, which was primarily afemale occupation. During the last decades of the 19th century, the proportion ofthe low capital occupations rose slightly in Aalst.

PRIVATISATION OF MARRIAGE IN 19TH CENTURY FLANDERS 381
Tabl
e1.
Soc
ials
tatu
sof
brid
egro
oms
(Leu
ven,
Aal
stan
dB
ierb
eek,
1800
–191
3,fi
rstm
arri
ages
)
1800
–180
918
10–1
819
1820
–182
918
30–1
839
1840
–184
918
50–1
859
1860
–186
918
70–1
879
1880
–188
918
90–1
899
1900
–191
3To
tal
Leu
ven
Hig
hcu
ltura
l(∗
)6.
94.
63.
55.
43.
95.
44.
96.
26.
57.
25.
85.
6H
igh
econ
omic
(∗∗)
4.5
4.8
3.1
5.7
3.5
3.6
3.5
3.6
4.5
3.5
6.3
4.4
Mid
dle
cultu
ral
4.3
5.0
4.1
6.1
4.4
8.0
6.0
7.2
8.6
8.4
10.9
7.4
Mid
dle
econ
omic
22.9
22.3
16.1
13.5
14.7
13.0
14.3
16.5
11.0
19.7
18.8
16.6
Low
econ
omic
59.4
60.3
70.7
65.3
70.1
64.8
66.0
60.9
64.9
59.3
55.9
62.4
Farm
ers
1.9
3.1
1.0
2.4
3.0
3.5
1.3
1.4
1.2
0.2
0.9
1.6
No
occu
patio
n0.
00.
01.
41.
70.
51.
84.
24.
23.
21.
81.
42.
0N
=10
0%41
941
848
554
157
155
163
872
175
289
51,
488
7,47
9
Aal
st Hig
hcu
ltura
l2.
62.
61.
41.
01.
50.
30.
82.
71.
71.
81.
81.
7H
igh
econ
omic
5.3
5.7
1.1
1.7
1.5
2.9
2.2
3.0
3.2
2.9
3.4
3.0
Mid
dle
cultu
ral
4.0
1.8
2.1
3.1
1.1
3.7
5.0
4.1
4.2
5.0
6.9
4.4
Mid
dle
econ
omic
24.2
18.8
16.0
25.3
18.6
15.0
14.4
17.3
20.8
17.3
16.3
18.0
Low
econ
omic
33.5
53.7
63.1
55.5
68.3
66.1
62.2
62.3
63.1
67.1
62.3
Farm
ers
30.4
17.5
15.0
11.6
10.2
8.7
10.3
8.2
7.0
7.9
3.6
9.5
No
occu
patio
n0.
00.
01.
41.
70.
81.
11.
12.
50.
81.
90.
91.
2N
=10
0%22
722
928
729
226
437
936
036
547
561
81,
043
4,53
9
Bie
rbee
kH
igh
cultu
ral
1.1
0.0
0.0
0.0
0.0
0.0
0.6
0.6
0.0
0.0
0.0
0.2
Hig
hec
onom
ic0.
00.
00.
90.
00.
80.
01.
20.
60.
61.
00.
90.
6M
iddl
ecu
ltura
l0.
00.
00.
00.
01.
71.
20.
01.
82.
51.
02.
31.
2M
iddl
eec
onom
ic3.
38.
510
.45.
06.
67.
04.
17.
16.
88.
18.
07.
0L
owec
onom
ic74
.463
.255
.758
.351
.252
.343
.541
.139
.340
.637
.547
.4Fa
rmer
s21
.128
.333
.036
.039
.739
.550
.647
.049
.748
.251
.043
.1N
ooc
cupa
tion
0.0
0.0
0.0
0.7
0.0
0.0
0.0
1.8
1.2
1.0
0.3
0.5
N=
100%
9010
611
513
912
117
217
016
816
319
734
91,
790
∗ Cul
tura
l:cl
ass
divi
sion
base
don
scho
olin
g,ed
ucat
ion
and
trai
ning
.∗∗
Eco
nom
ic:c
lass
divi
sion
base
don
capi
tal.
Sour
ce:m
arri
age
cert
ifica
tes
for
Leu
ven,
Aal
stan
dB
ierb
eek;
own
calc
ulat
ions
.

382 KOEN MATTHIJS
Tabl
e2.
Soc
ials
tatu
sof
brid
es(L
euve
n,A
alst
and
Bie
rbee
k,18
00–1
913,
firs
tmar
riag
es)
1800
–180
918
10–1
819
1820
–182
918
30–1
839
1840
–184
918
50–1
859
1860
–186
918
70–1
879
1880
–188
918
90–1
899
1900
–191
3To
tal
Leu
ven
Hig
hcu
ltura
l(∗
)0.
00.
00.
00.
00.
00.
00.
00.
30.
00.
00.
10.
0H
igh
econ
omic
(∗∗)
0.0
0.5
0.9
1.8
2.9
3.1
0.7
1.5
1.1
0.8
0.7
1.3
Mid
dle
cultu
ral
0.0
0.3
0.0
0.2
0.2
0.2
0.0
0.4
0.9
0.5
0.6
0.4
Mid
dle
econ
omic
24.5
17.9
8.1
21.9
22.6
17.6
13.2
13.6
9.4
10.4
12.1
14.2
Low
econ
omic
74.2
77.4
77.0
65.1
66.0
64.2
63.6
51.7
59.4
57.2
43.0
59.0
Farm
ers’
wiv
es1.
32.
10.
20.
41.
10.
90.
70.
70.
40.
00.
10.
5N
ooc
cupa
tion
0.0
1.3
13.6
10.7
7.0
14.0
20.8
29.3
28.2
30.3
43.3
24.0
Hou
sew
ife
0.0
0.0.
20.
00.
40.
01.
12.
50.
50.
80.
20.
6N
=10
0%15
538
545
754
455
855
061
672
075
289
11,
493
7,12
1
Aal
st Hig
hcu
ltura
l—
0.0
0.0
0.0
0.0
0.0
0.0
0.0
0.0
0.0
0.0
0.0
Hig
hec
onom
ic—
5.0
0.7
0.7
0.4
0.5
0.0
0.3
0.0
0.2
0.2
0.4
Mid
dle
cultu
ral
—0.
00.
40.
30.
00.
00.
30.
00.
40.
70.
20.
3M
iddl
eec
onom
ic—
10.9
14.6
17.2
22.1
14.0
10.3
14.9
12.0
8.9
7.9
12.0
Low
econ
omic
—69
.867
.368
.663
.370
.366
.858
.862
.665
.366
.965
.8Fa
rmer
s’w
ives
—13
.512
.210
.08.
27.
68.
06.
26.
34.
51.
96.
2N
ooc
cupa
tion
—0.
84.
93.
15.
26.
814
.719
.518
.320
.522
.815
.2H
ouse
wif
e—
0.0
0.0
0.0
0.8
0.8
0.0
0.3
0.4
0.0
0.1
0.2
N=
100%
—11
928
729
026
738
036
136
947
661
91,
039
4,20
7
Bie
rbee
kH
igh
cultu
ral
0.0
0.0
0.0
0.0
0.0
0.0
0.0
0.0
0.0
0.0
0.0
0.0
Hig
hec
onom
ic0.
00.
00.
00.
00.
00.
00.
00.
01.
20.
00.
00.
1M
iddl
ecu
ltura
l0.
00.
00.
00.
00.
00.
60.
00.
00.
00.
00.
00.
0M
iddl
eec
onom
ic0.
02.
40.
90.
729
.20.
01.
20.
60.
00.
50.
32.
6L
owec
onom
ic88
.970
.745
.750
.445
.031
.531
.824
.433
.725
.914
.632
.0Fa
rmer
s’w
ives
11.1
24.4
47.4
45.3
21.7
20.0
53.5
41.1
56.4
20.8
0.6
9.4
No
occu
patio
n0.
00.
06.
02.
23.
347
.913
.532
.78.
652
.384
.535
.4H
ouse
wif
e0.
02.
40.
01.
40.
80.
00.
01.
20.
00.
50.
00.
4N
=10
0%18
4111
613
912
016
517
016
816
319
734
91,
646
∗ Cul
tura
l:cl
ass
divi
sion
base
don
scho
olin
g,ed
ucat
ion
and
trai
ning
.∗∗
Eco
nom
ic:c
lass
divi
sion
base
don
capi
tal.
Sour
ce:m
arri
age
cert
ifica
tes
for
Leu
ven,
Aal
stan
dB
ierb
eek;
own
calc
ulat
ions
.

PRIVATISATION OF MARRIAGE IN 19TH CENTURY FLANDERS 383
Table 3. Coale’s marriage index Im (Leuven, Aalst and Bierbeek, 19th century censusyears and 1910)
1846 1856 1866 1880 1890 1900 1910
Leuven 0.3508 0.3510 0.3568 0.4006 0.3913 0.4119 0.4479
Aalst 0.3661 0.3940 0.4188 0.4281 0.4403 0.4739 0.5005
Bierbeek 0.3763 0.3682 0.3962 0.4543 0.4398 0.4654 0.4966
Source: census figures for the years stated and statistics from registers of births,marriages and deaths, own calculations.
4. Results
4.1. FIRST MARRIAGE INTENSITY
Table 3 shows the Coale nuptiality index Im for the three study areas.10 Roughly,Im figures around 0.800 point to ‘many’ and ‘early’, figures around 0.300 pointto ‘few’ and ‘late’ marriages. Until the mid-19th century, nuptiality scores werelow, which points to a restrictive ‘Malthusian’ marriage pattern.11 This patternhad two basic characteristics: first marriage age was high (27–29 for men, 24–26for women) and a large proportion remained unmarried (10–15% of marriageablepeople). According to Hajnal, this pattern – which he saw as emerging somewherearound the period 1400–1650 – had its roots in the traditional farming economy ofthe time: marriage aspirations had to be postponed until a person could take respon-sibility for a household. Particularly for the children of farmers and craftsmen – i.e.,for most of the population – this meant waiting to marry until the father gave up hisprofession or died.12 This pattern persisted in Flanders through the first half of the19th century, the period when the first wave of industrialisation was nonethelessengulfing some areas (Lebrun et al., 1979). This is an indication that economicdevelopment was not the only and perhaps not even the most important drivingforce behind the long-term evolution in first marriage intensity. This has to be putinto perspective because rapid industrial growth was not taking place in any of thethree study areas. From the mid-19th century onwards – the time when the economypicked up again following the crisis years of 1840–50 – the situation changed: theIm indices rose systematically in every region, although regional differences wereevident. The Leuven indices were smaller than those for Aalst or Bierbeek. Overall,however, the proportion of married (between 15 and 50) increased. Thus, thismeasure of the ‘stock’ of married women confirms our first hypothesis, althoughin itself this is not a direct indication of domesticisation and emotionalisation, butan indirect indication of the rapid diffusion of marriage as a highly valued socialinstitution.
Table 4 shows the same, but from another angle, viz. the first marriage rates(the number of those marrying per 1,000 previously unmarried people by age andsex) for Leuven and Aalst. In Bierbeek, the number of observation units is too

384 KOEN MATTHIJS
Table 4. First marriage rates (per 1,000 unmarried) of men and women (Leuven and Aalst, 19th
century census years and 1910)
Leuven Aalst
1846 1856 1866 1880 1890 1900 1910 1846 1856 1866 1880 1890 1900 1910
Men20–29 41 37 74 81 82 100 93 21 40 70 99 107 151 12630–39 82 93 143 90 74 72 74 57 64 97 67 85 114 9540–49 70 67 75 67 35 29 26 41 59 66 40 41 36 3350–59 45 37 37 18 21 30 17 19 26 8 8 13 29 1460–69 13 26 37 41 30 15 6 16 0 9 0 17 0 0Total 50 50 83 76 72 83 77 30 44 68 76 86 118 101
Women20–29 52 51 78 81 89 107 95 56 72 88 103 96 139 12230–39 63 63 72 60 47 46 52 42 78 78 36 61 63 6540–49 23 17 30 32 13 8 15 26 31 12 22 9 20 1250–59 12 9 0 5 5 7 4 0 6 0 0 5 5 560–69 0 4 0 0 6 3 0 0 0 0 0 0 0 0Total 44 43 59 57 57 67 60 42 58 61 65 68 91 83
Source: marriage certificates for Leuven and Aalst, and statistics from population registers.
limited for this calculation. This information fits in more closely with our researchintention than Im because we are dealing here only with first marriages, while Im
also includes remarriages (roughly one fifth of the total). In the mid-19th centurythe first marriage rates of men and women aged 30–39 were actually higher thanthose of people aged 20–29! Initially, even the first marriage rates of 40–49-year-old men were higher than those of 20–29-year-olds. This changed dramaticallyover the course of the second half of the 19th century. The first marriage rate inthe youngest age group (20–29 years old) increased considerably in the secondhalf of the 19th century.13 This is an indication of the erosion of the Malthusianmarriage pattern. This confirms our first hypothesis. One explanation of this mightbe that during the third quarter of the 19th century the economy expanded rapidly.Material obstacles to marriage declined in importance, although not everybodyprofited equally from this phenomenon. Unskilled industrial workers, for example,found life very difficult, as they had during the previous decades – their standardof living barely improved, if at all (Scholliers, 1996). It is not possible to tell fromthe available data whether this prevented an increase in their first marriage rates.This will, however, be possible for the evolution in first marriage age by socialstatus (see below). Nonetheless, some indications exist that first marriage intensityincreased in all social groups. After all and globally speaking, the increase in firstmarriage rates was fairly significant and this was perhaps only possible becausemarriage behaviour was evolving in the same direction in all social groups. In otherwords, the general increase would not have been possible if only the marriage ratesof the economically successful groups increased. Another element to support thisargument is that the first marriage rate for young people in Aalst increased more

PRIVATISATION OF MARRIAGE IN 19TH CENTURY FLANDERS 385
Figure 1. First marriage age of bridegrooms (Leuven, Aalst and Bierbeek, 1800–1913).
Figure 2. First marriage age of brides (Leuven, Aalst and Bierbeek, 1800–1913).
than it did in Leuven, although this was precisely the region where factory workerswere present in large quantities.
4.2. FIRST MARRIAGE AGE
Figures 1 and 2 show the evolution of average age at first marriage in Leuven, Aalstand Bierbeek for the period 1800–1913.14 As well as the annual observations, the

386 KOEN MATTHIJS
sixth degree polynomials are also shown: these provide a visual synthesis of thelong-term trend.15 In the further description and in the sociological interpretation,the emphasis is on these trends and less on short-term fluctuations, which areincidentally not insignificant.16
At the beginning of the 19th century, the average age at first marriage formen was 30 to 32, for women 28 to 30. This confirms, from an age perspective,that the marriage pattern at the time was restrictive. These results are along thesame line as those of different studies in Flanders (Vandenbroeke, 1976). Over thecourse of the first two decades of the 19th century, age at first marriage fell byapproximately two years, both for bridegrooms and for brides, and in each region.This decline was more intense and lasted longer for men than for women which,certainly at the beginning of the century, was linked to attempts by young men toescape French (war) demands by marrying. It is striking that Belgian independence(1830) – undoubtedly a politically turbulent period – had no visible effect on theevolution in first marriage intensity or age. This has also been established for otherdemographic indicators (Hofstee, 1981). In the second quarter of the 19th century –a period of economic decline in Flanders – age at first marriage rose in each region,although without reaching the level of the beginning of the century. This increasewas relatively weak and short-lived and was quickly followed by a ‘definitive’decline in age at first marriage. By ‘definitive’ we mean a consistent, long-termdecline without reverting to the previous high levels. The beginning of this declinecan be placed somewhere between 1840 and 1860, therefore around the same timeas the beginning of the increase in the marriage index Im (Table 3) and 20–25 yearsbefore the start of the decline in fertility. The second hypothesis is therefore alsoconfirmed and, again, the mid-19th century seems to be a turning point.
The first marriage age of bridegrooms in Bierbeek is higher for almost the entireperiod than for those in Leuven and Aalst. One obvious explanation is the largenumber of farmers in Bierbeek, a group which usually has a higher first marriageage than other occupational groups (see e.g., Van Poppel, 1992). The level andevolution of first marriage age of bridegrooms in Leuven and Aalst do run parallel,in spite of the substantial economic differences between the two towns. A differentpicture emerges for brides. The fluctuations in first marriage age among bridesare generally smaller than among bridegrooms. The evolution in first marriage ageof brides follows approximately the same pattern throughout the 19th century inLeuven and Bierbeek, but in Aalst the first marriage age is lower, which couldbe related to the large number of female textile workers. The late decline in firstmarriage age in Aalst is striking. This is unexpected, given the large proportionof poorly skilled and unskilled (female) workers. It could mean that industrial-isation in Aalst did not have a decisive effect on the evolution of first marriageage. If industrialisation and proletarianisation facilitated the decline in age at firstmarriage, this decline should have taken place first in Aalst and last in Bierbeek –but it did not!

PRIVATISATION OF MARRIAGE IN 19TH CENTURY FLANDERS 387
As well as the differences – which are related to local circumstances – strikingsimilarities certainly exist between the three regions. This is sociologically anddemographically interesting, since the regions studied differ significantly from oneanother in terms of the timing and intensity (of the reception) of modernisation,proto-industrialisation, proletarianisation and development of the services sector.This can indicate that an underlying process was at work here which encounteredonly little resistance from territorial and economic factors.
In general the decline in first marriage age started earlier for brides than forgrooms. Apparently women played a pioneering role in the 19th century declinein marriage age. In a sense, this produces additional evidence for the existenceof an underlying process of domesticisation and emotionalisation. Apparently, thechanged social position and gender identity of women, together with the fact thatthey were pushed back into the private sector, played a key role in the decline infirst marriage age. This hypothesis is more or less at odds with hypotheses whichassociate the 19th-century evolution of first marriage age with the consequences ofthe 19th-century (economic) developments on the social position of men. Although,in his semi-economic model, Hajnal concentrates on the evolution of the firstmarriage age of women, in his explanation little is said about the contribution ofthe woman. When Hajnal speaks of economic needs, he is referring to male needs.Our Flemish data raise critical questions about this, and even suggest that womenin particular played a crucial role in bringing about (a process of change which ledto) the decline in first marriage age.
In discussing first marriage rates (see previous point) and the evolution offirst marriage age, the importance of insight into differences in socio-economicstatus has emerged. For this reason, the evolution in the first marriage age ofbridegrooms and brides has been reconstructed by socio-economic status.17 Themacro-image which emerged earlier, i.e., a decline in first marriage age during thefirst two decades of the 19th century, followed by a slight increase for two to threedecades, then a ‘definitive’ decline until the end of the study period, is roughlyspeaking also apparent for the various status groups. The fluctuations are moreintense among bridegrooms than brides. Overall, the highest status groups havethe highest average first marriage age, the middle groups marry somewhat youngerand the lowest socio-economic groups even younger still. This does not indicatethe existence of a young proletarian marriage pattern: until 1865, the average age atfirst marriage of low-status bridegrooms was almost never under 28. For almost theentire study period, farmers had the highest first marriage age. This could explainwhy the first marriage age in Bierbeek (see Figure 1) was higher than in Leuvenor Aalst. A similar pattern emerges for brides, at least from approximately 1870onwards. This explains why the first marriage age of brides in Aalst was lower thanthose in Leuven and Bierbeek (see Figure 2). Brides in Aalst included a relativelylarge number of unskilled or poorly educated textile workers, who married fairlyyoung.

388 KOEN MATTHIJS
Figure 3. Remarriage intensity of widowed people (Leuven, Aalst and Bierbeek, 1800–1913).
4.3. REMARRIAGE INTENSITY
In the light of increased domesticisation and of the greater zest for marriage, we canexpect remarriage intensity to increase over the course of the second half of the 19th
century. However, this is not self-evident because marriage and remarriage differsignificantly from one another in terms of characteristics, functions, expectationsand intentions. What is true for the first marriage market is not necessarily true forthe remarriage market, and vice versa. It is possible that in some respects the two‘markets’ operate independently. It is even possible that as marriage became morehighly regarded over the course of the 19th century (see previous point), remarriagewas regarded less highly.
The remarriage intensity is the ratio of the number of widowers (widows)remarrying in year x compared to the average number of new widowers (widows)in year x and in the six preceding years.18 The number of men (women) widowedin year x equals the number of married women (men) deceased in that year. Thisinformation is given in the (civil) death certificates and these have been kept inBelgium since the middle of 1796.19 Our calculation does not include migration,which could cause an error unless inflow and outflow balance each other out.Formally, the remarriage intensity of widowers Rim(x) (or Rif (x) for widows) in yearx is calculated as follows:
Rim(x) = Nwidowers who remarry (x)/((Ndeaths of married women (x) + . . . +Ndeaths of married women (x−6))/7)
Figure 3 shows the evolution of the remarriage intensity for bridegrooms andbrides in the three regions together.20 At the beginning of the 19th century, one

PRIVATISATION OF MARRIAGE IN 19TH CENTURY FLANDERS 389
in three widowers and one in four widows remarried. From 1840 onwards, theremarriage intensity of widowers declined. Initially, the decline was gradual but,towards the end of the century, it accelerated. These findings contradict our hypoth-esis: over the course of (the second half of) the 19th century, the remarriageintensity did not increase but declined, particularly among widowers. Since thefirst marriage intensity increased in the same period (see above), the proportion ofthose remarrying fell sharply, specifically from one in five around 1800 to one inten by around 1900.
Broadly speaking, the three study areas demonstrate a parallel pattern fromapproximately 1830 onwards, in terms of the evolution in remarriage intensity.21
The cultural and socio-demographic differences between Leuven, Aalst and Bier-beek, which were fairly wide, appear to play only a subordinate role in this case.This was also observed for the evolution in first marriage rate and first marriageage. Nonetheless, regional differences can be seen.
Among widows, the decline of the remarriage intensity began a few decadeslater: it only became noticeable by the end of the 19th century and did not accelerateuntil the beginning of the 20th century. The difference in remarriage intensity ofwidowers and widows therefore gradually shrank. Until around 1890, the remar-riage intensity of widowers in Leuven was always higher than in Aalst or Bierbeek.These latter two communities show a comparable pattern between 1815 and 1885.Among widows, the figures for Leuven and Aalst run parallel, and those for Bier-beek are usually the lowest. The remarriage intensity was therefore lower in thecountryside (Bierbeek) than in the towns, which could mean that farmers (andservants and day labourers) remarried less often than other occupational groups.This raises critical questions about the hypothesis which associates the 19th-centurydecline in remarriage intensity with the changed socio-economic structures, partic-ularly the erosion of the traditional farming society, the reduction in the farmingpopulation and the growth of industrialisation and the services sector (Cabourdin,1981: 282; Bellettini, 1981). Various authors are fairly quick to assume that thepressure to remarry was so high in farming societies because farmers’ householdshad to continue functioning even after a death, which meant that vacant familypositions had to be filled quickly. This would mean that the remarriage intensityshould be highest in Bierbeek and lowest in Leuven and the decline in this intensitywould start the latest in Bierbeek. This was definitely not the case. Our study resultssuggest, on the contrary, that the remarriage market in urbanised areas was moreopen. Apparently, widowed people found it easier to find a new marriage partnerin such areas. Perhaps less restrictive marriage control was exercised in the urbanculture.22
Various factors explain the decline in remarriage intensity: falling mortality,the demographically less favourable remarriage market and remarriage-unfriendlyeconomic and cultural changes.23 An argument in favour of our privatisationhypothesis might be found in the long-term evolution of age-specific remar-riage rates. These rates are indeed age-sensitive: the older a person is, the lower

390 KOEN MATTHIJS
the remarriage rate.24 The remarriage rates of widows remained fairly stablethroughout the 19th century for all age groups. In Leuven, for example, the age-specific remarriage rate for the 20–29 old widows was 200 in 1846, 222 in1880 and again 200 in 1900. The corresponding rate for the age group 50–59was respectively 4, 8 and 11. Among widowers, remarriage rates declined inperiod 1846–1900 in the three youngest age groups, among older widowers theyremained fairly stable. In Leuven, the age-specific remarriage rate for the 20–29-old widowers was 333 in 1846, 83 in 1880 and 0 in 1900. The decline in remarriageintensity for widowers was therefore confined to the younger age groups. In a sense,this is an indication that emotional considerations became more important in theconcrete planning of life. Maybe that from the middle of the 19th century onwards,the deceased partner was more romanticised and idealised, which caused a kind ofremarriage blockage. The new family discourse, the idealisation of close relation-ships and the enthusiastic emotionalisation of all internal family subsystems wereso central to social contacts and they became so highly valued in public opinion thata watered-down version, in the form of a remarriage and a reconstituted family, washeld in low esteem and sometimes even disdained.
4.4. INTERVAL BETWEEN WIDOWING AND REMARRIAGE
Another way of measuring the emotional bond between the former partners isthe interval between being widowed and remarrying. In the Early Modern Period,people remarried ‘quickly’ – in specific terms, this means within one year of beingwidowed – which would point to a significant affective distance between the part-ners (Ariès, 1981; Segalen, 1981; Shorter, 1977; Van Poppel, 1992).25 The death ofa partner was apparently quickly processed and he/she was quickly replaced. Seenagainst the emotionalisation process, we can expect the interval between widowingand remarrying to increase over the course of the 19th century. The deceased partnerremained emotionally and symbolically ‘present’ in the family for a longer period,which resulted in a kind of emotional blockade, leading to the postponement oreven abandonment of a new marriage (see previous point).
Figure 4 shows the waiting time (in months) between the time of widowing andof remarriage in the period 1800–1913 for the three study areas together.26 Amongwidowers, the average interval was 2.5 to 3 years, among widows one year longer(for comparisons, see Ihinger-Tallman and Pasley, 1987: 28; Cabourdin, 1978: 316;Charbonneau, 1970: 82; Bideau, 1980: 38; Van Poppel, 1992: 375; Segalen, 1981:68; Lundh, 2002: 424–425). This male-female difference has to do with the fact thatthe social regulations regarding marriage, mourning and the mourning period wereless far-reaching for widowers than for widows (Van Poppel, 1992: 307; Lundh,2002: 433). There is also a legal aspect: in order to prevent confusio sanguinis(offspring confusion), the widow had to wait three hundred days before she couldremarry.27

PRIVATISATION OF MARRIAGE IN 19TH CENTURY FLANDERS 391
Figure 4. Interval (in months) between the time of widowing and remarriage (Leuven, Aalstand Bierbeek, 1800–1913).
What is more important to our hypothesis is that the interval between widowingand remarriage changed only slightly over the course of the 19th century. If the firstand last decades of the period under observation are removed from the analysis– which is defensible – a slight increase in that interval is observed, more forwidowers than for widows (a lower-degree polynomial makes this much moreclear). Note that this observation runs parallel to the one in the previous sectionon remarriage intensity. We also examined whether (the evolution of) that intervaldiffered per type of remarriage, but this was not the case.28 The results there-fore only partly confirm the expectation that the interval between widowing andremarriage would increase over the course of the 19th century.
4.5. NUMBER AND PROPORTION OF WITNESSING FAMILY MEMBERS
As is the case today, the marriage ceremony in the 19th century involved witnesses.These witnesses were there to control and verify the proceedings. Those marryingwere free to choose the witnesses, but some formal rules did apply. Except duringthe French Period, when both men and women could act as witnesses, during the19th century only men could be witnesses. The entire study group contained onlythirteen female witnesses; they were rejected from the analysis. The 19th-centuryrules also stipulated that there must be four witnesses, two from 1908 onwards. Therelationship of each of them to the bride or bridegroom, as well as other details, isregistered on the marriage certificate. This is now further examined as an elementof privatisation or, more accurately, of ‘familiarisation’ of the marriage ceremony.29

392 KOEN MATTHIJS
Figure 5. Average number of family members among witnesses (Leuven, Aalst and Bierbeek,1800–1913) (maximum = 4).
The starting point is the hypothesis that mobilising family members as witnessesis an indication of privatisation of family life: the higher that proportion (relativeto all witnesses), the stronger the privatisation. This is clearly confirmed by ourstudy; the proportion of witnessing family members increased in each study areaover the course of the 19th century (Figure 5). By the mid-19th century, one or twoof the witnesses were relatives of the bride or groom; by the end of the 19th century,this was three out of four. From approximately 1900 onwards, the witnesses werealmost always family members. This is a strong indication of the increasing impor-tance of family ties. The marriage ceremony increasingly became a matter for thepartners and their families and less for the anonymous environment. In a mannerof speaking, the marriage ceremony became ‘familial’ and this can be interpretedas an aspect of privatisation. Important to note is that, here too, the period around1850 is a turning point.
Figure 6 examines whether the four (two after 1908) witnesses were relativesof the marriage partners, for each witness separately. This analysis is confined toLeuven because of the restricted number of observations for Aalst and Bierbeek.A clear pattern emerges: the proportion of witnesses who are family of one ofthe marriage partners is higher for the first witness than for the second, higherfor the second than for the third and higher for the third than for the fourth. Theorder in which the witnesses were officially registered was not random. Non-familymembers were not involved until the group of potential family member signatorieshad been exhausted and this was carried right through to the order of the signatureson the marriage certificate. This observation also strongly points in the direction ofprivatisation of marriage in the second part of the 19th century.

PRIVATISATION OF MARRIAGE IN 19TH CENTURY FLANDERS 393
Figure 6. Percentage of witnesses with family tie, per witness (Leuven, 1865–1913).
4.6. MALE OR FEMALE RELATIONSHIP OF THE WITNESSES
In detailing our hypotheses, we take as our basis the additional hypothesis that thehistory of privatisation took place principally, but not exclusively, via women andwas, in this sense, gendered. Following on from this, the previous point (proportionof witnessing family members) can be specified, i.e., that in choosing witnesses,stronger and increasing preference was given to the bride’s family (the ‘female’line) than to the groom’s family (the ‘male’ line). Specifically, we expect theproportion of witnessing family members from the bride’s side to increase overthe course of the 19th century. This is not obvious because of the possible reactionfrom the groom’s ‘female’ side, i.e., his mother. Bridegrooms – certainly youngerbridegrooms – usually have a living mother who interferes with the marriageaspirations of her offspring. However, it seems plausible that the negotiating posi-tion and the micro-social power to control the marriage ceremony of the groom’smother is usually less than that of the bride’s mother because, in the latter case, no‘disruptive’ male link is present.
The results are presented in Figure 7.30 Around 1840–1850, the division wasapproximately equal: one in three witnesses was related to the bride, one in threeto the bridegroom and the remaining third was not related. In the course of the19th century, the proportion of the ‘no relation’ group gradually diminishes. This iscompletely in line with our basic hypothesis. Abstracting from this last group, theproportion of witnesses related to the bride and the groom remains approximatelyequal throughout the entire 19th century, i.e., 50%. The loss of the proportionof the ‘unrelated’ group is equally compensated by an increase in the group ofrelated witnesses on both the bride’s and the bridegroom’s side. This contradicts

394 KOEN MATTHIJS
Figure 7. Family ties of witnesses on the ‘female’ or ‘male’ side (Leuven, all witnesses1865–1913).
our hypothesis. Apart from the aforementioned restraint – the bridegroom’s motheralso interferes in the marriage ceremony – another, purely pragmatic explanationis also possible: achieving a fair balance in terms of number of related witnessesin the ‘male’ and ‘female’ line prevents conflicts within and primarily betweenfamilies. The new marriage cannot be encumbered with disputes between familiesfrom the outset. As to witnesses, this presupposes a fair exchange.
4.7. EMPLOYMENT OUTSIDE THE HOME OF WOMEN IN FIRST MARRIAGES
Data concerning the evolution in the level of activity in the 19th century usuallycome from the censuses (see e.g., Pott-Buter, 1993), but this evolution can alsobe checked fairly reliably from marriage certificates, although it relates, of course,only to people getting married. This is now empirically checked, but a method-ological problem arises: some women stopped working when they married whileothers did not wish to see their work status registered on the marriage certificate(Van Poppel, 1992; Matthijs, 2001). That some stopped working when they marriedsays a great deal about domesticisation. The material advantage (in the form ofan additional income) of continuing to work did apparently not counterbalancethe (expected) disadvantages. These disadvantages were mainly cultural, which iswhere the tension emerges between income and status. In our study period, themeritocratic society was in full swing, but that path was clearly male. The wife’sincome did generate increased financial clout, but apparently not additional status.Perhaps this was even interpreted in precisely the opposite way: the fact that amarried woman had to go to work indicated that the husband had a low income and

PRIVATISATION OF MARRIAGE IN 19TH CENTURY FLANDERS 395
Figure 8. Proportion of first marrying women employed outside the home (total group,1815–1913).
‘therefore’ a low family status. By not going out to work, the wife was indicatingthat she did not have to work – whether or not this was true. In this way, the wifecould make enough time to take part in the ‘new’ 19th-century bourgeois (female)culture of the middle classes and to shaping the cult of motherhood.
The analysis is confined to period after 1815 because, before that date, majorfluctuations were seen in the stated numbers of women working outside the home.This was related to registration errors and administrative oversights, perhaps evento the deliberate withholding of information. Here, employment outside the home ismeasured by whether or not an occupation is explicitly stated on the marriage certi-ficate. Figure 8 shows that the proportion of (marrying) women working outsidethe home fell systematically over the course of the 19th century, especially inthe second half. Between 1815 and 1860, over 80% of marrying women had anoccupation; subsequently this figure fell to 60%. As already indicated, this wasnot only a real reduction, it was also related to the fact that increasing numbersof women did not wish to register the fact that they worked outside the home. Itmust be stressed that the stated percentages significantly overestimate the generalemployment of women outside the home. Our research group consists mainly ofyoung, unmarried and childless women. Their employment outside the home is, ofcourse, substantially higher than that of the older, married women with dependentchildren.
The reduction in employment outside the home supports the domesticisationhypothesis. Whether this was a genuine development or a shift in registration is in asense of little relevance: both processes point to the fact that work outside the homewas increasingly regarded as male and instrumental, domestic labour as female

396 KOEN MATTHIJS
and expressive (Perrot, 1990). The contrast between male, public work outside thehome and female, private domestic labour became clearer. The man/husband/fatherwas responsible for income and status, while the woman/wife/mother took care ofthe household and the children.
4.8. PROPORTION OF ILLEGITIMATE BIRTHS
In various Western European countries, including Belgium, the proportion of ille-gitimate children rose considerably between 1750 and 1850. According to Shorter(1977), this was a result of female emancipation and primarily the female strugglefor (sexual) liberation from oppressive male power structures. Increased industrialemployment provided the necessary leverage. The ‘new woman’ was more indi-vidualist and more independent, she rebelled against parental authority, opposedtraditions and sought sexual gratification. Her ‘old’ rural values were eroded andreplaced by a libertarian and proletarian sub-culture full of romanticism and erot-icism. The result was an increase in the number and proportion of illegitimatechildren. Much opposition was voiced against this attitude (Tilly et al., 1976:463–469; Anderson, 1980: 56; Damsma, 1993: 178–184). To begin with, it is noteasy to check whether the shift in the perception of sexuality and sexual beha-viour took place earlier among women employed in industry than among otherwomen. The data required to check this do not exist. This is also the case for themotives of young girls going to work in factories: the emancipatory effect of thisis hard to see. On the contrary: this work was hard, monotonous and underpaid.Moreover, only a small minority of women worked there, while the vast majorityremained employed within the home, on the farm and in the classic cottage industrycircuit. Those who did still work in factories did not do so out of rebellion, butto increase the family’s income. Their reasons were utilitarian, not emancipatory;family interest took pride of place, not their own benefit. Many women were atthat time in a structural poverty trap: they had no property of their own, no money,no permanent job, no family network, no circle of friends. In order to escape fromloneliness and mind-numbing factory labour, they looked for a partner. Pregnancyhelped put this partner under pressure to marry. This devious intent was sometimessuccessful, but not always: many men simply left their pregnant partners high anddry because they, too, had no money and suffered appalling (working) conditions.In a nutshell, the fact that many women at the time had illegitimate children wasthe result of a calculated risk which often did not pay off. This was the result oftwo conflicting breeding grounds: despair resulting from economic problems andhope that marriage would offer a way out.
Over the course of the second half of the 19th century, the proportion of ille-gitimate births declined. Living conditions improved considerably for many: menearned more and women were not pushed so much into working outside the home.The number of servants and poor migrants fell – two groups which had been highlyvulnerable to unwanted pregnancy (Tilly et al., 1976: 475). Young couples now

PRIVATISATION OF MARRIAGE IN 19TH CENTURY FLANDERS 397
Figure 9. Proportion of illegitimate births (Leuven, Aalst and Bierbeek, 1840–1913).
found it economically easier to marry ‘in time’. In this sense, economic growthput the brakes on illegitimacy. Nonetheless, the effect of this economic factorshould not be overestimated: for various groups, purchasing power and consump-tion pattern around 1900 did not differ greatly from those of 1800 (Scholliers,1981, 1985, 1992). The decline in the proportion of illegitimate children can alsobe explained culturally. Over the course of the 19th century, a very child-friendlyenvironment developed (Cunningham, 1997). Moral newspeak stipulated on allfronts that children should be born within marriage and should grow up in a‘normal family’. An unmarried woman with children had to marry (quickly) sothat the children would immediately be legitimised. As a consequence of thesenew values and of the associated social control, it was now no longer possible toseparate motherhood from marriage (Tilly and Scott, 1978; Gillis, 1985). This isan additional indication that all kinds of aspects of domesticisation were spreadingin all directions. In the above paragraphs, the partner system took pride of place,now it is the parental system.
Figure 9 shows the evolution (from 1840 onwards) in the proportion of illegit-imate children (relative to all births) in Leuven, Aalst and Bierbeek. In Leuven,the proportion of illegitimate births decreased substantially. Fairly large regionaldifferences prevail. This also emerges in the measurement of extramarital fertilityusing the Coale-index Ih (Table 5). On this scale, Leuven scores up to four timeshigher than Aalst or Bierbeek. In the mid-19th century, one in four to one in fivebirths in Leuven were illegitimate, but this figure fell from 1850 onwards.31 Thisproportion was lower and more stable in Aalst and Bierbeek, fluctuating around5% throughout the period of observation, leaving little room for a decline. Thehigh illegitimacy score for Leuven is related, among other things, to the presence

398 KOEN MATTHIJS
Table 5. Coale’s extra-marital fertility Ih index (Leuven, Aalst and Bierbeek, 19th
century census years and 1910)
1846 1856 1866 1880 1890 1900 1910
Leuven 0.0947 0.1091 0.0889 0.0859 0.0823 0.0620 0.0455
Aalst 0.0247 0.0236 0.0221 0.0204 0.0419 0.0415 0.0378
Bierbeek 0.0128 0.0060 0.0446 0.0222 0.0472 0.0260 0.0254
Source: census figures for the years stated and statistics from registers of births,marriages and deaths, own calculations.
of army barracks and the large number of university students. However, these werealso present in the second half of the 19th century and the illegitimacy ratio stilldeclined considerably in that period. This indicates that, in the second half of the19th century, people succeeded in culturally incorporating groups which had previ-ously operated more or less outside the regular marriage pattern and to imposeupon them new standards relating to sexuality, homeliness, marriage and familyformation. However, in addition to this intensive and extensive social control (e.g.,by the state and church authorities), it is just as plausible that these groups werethemselves now sufficiently sensitive and receptive to the new values and standardsand that they followed the prescribed route without external pressure. Conformingto the expectations of the dominant, highly esteemed marriage system and familypattern was, at the end of the day, the driving force behind social promotion.
4.9. CHILDREN LEGITIMISED BY MARRIAGE
The evolution in illegitimacy and the link with domesticisation can be empiricallydemonstrated from a different angle of approach, i.e. through the evolution in theproportion of marriages in which at least one child is legitimised (Figure 10).32 Onaverage in Leuven during the period 1810–1913, at least one child was legitimisedin one out of five marriages, in Aalst and Bierbeek this figure was one in ten. Atthe beginning of the 19th century, this proportion was lower in every region than bythe end of the century. This confirms and reinforces the basic hypothesis that moreparents wanted to see their children growing up in the conventional family circuit.Apparently, the ‘false start’ to a relationship – in the form of an illegitimate child– could and should quickly be corrected by marrying. The fact that this proportiondeclined again at the end of the 19th and beginning of the 20th centuries can beexplained in part by the sharp decline in illegitimacy at that time (see Table 5 andFigure 9). Illegitimacy had indeed now become fairly rare – in Belgium as a whole,the proportion of illegitimate births was only 6% by around 1910.
Taken together, Figures 9 and 10 suggest that the proportion of children legitim-ised by a marriage, per year of birth, increased over the course of the 19th century.In order to check this, a legitimacy index was developed, which is the ratio of thenumber of children legitimised by marriage in a given year to all the children born

PRIVATISATION OF MARRIAGE IN 19TH CENTURY FLANDERS 399
Figure 10. Proportion of marriages with at least one legitimised child (Leuven, Aalst andBierbeek, 1810–1913).
Figure 11. Legitimacy index (Leuven, Aalst and Bierbeek, 1840–1913).
illegitimately in that year.33 Figure 11 confirms that, by the end of the 19th century,most illegitimately born children were legitimised by marriage; in the first halfof the 19th century this figure was only half. This confirms the stated hypothesis.Apart from the cultural pressure to allow children to grow up in a ‘normal’ family,a demographic factor was also at work here, i.e., the decline in infant mortality.Initially, the likelihood of illegitimate children dying was fairly high, particularly

400 KOEN MATTHIJS
Table 6. Proportion of marriages with at least one legitimised child by socio-economicstatus of the bride and bridegroom (total group, 1810–1913)
Brides Bridegrooms
% Number of % Number ofmarriages marriages
Upper classesLarge land owners 1.0 296 3.1 196Occupations with high cultural capital 0.0 12 3.9 1,526Senior occupations in trade and industry 9.5 222 7.7 1,437
Middle and lower classesShop owners, small entrepreneurs 15.9 4,089 15.7 7,006Occupations with average cultural capital 2.1 145 10.8 2.559Small land owners 6.5 1,747 5.4 496
Farmers 6.1 1,714 9.2 2,724
Poorly educated, not employed in a factoryNon-factory workers 24.4 9,516 22.3 12,648Domestic staff 14.2 8,601 16.2 2.967Economic craftsmen 30.8 1,014 16.8 2,027
Poorly educated factory workers 21.5 3,217 20.5 6,095
Unskilled 33.9 3,074 29.6 3,281
OthersNo occupation 12.7 8,872 11.1 738Housewives 29.3 382 — —
Source: marriage certificates for Leuven, Aalst and Bierbeek; own calculations.
when very young. This situation improved by the end of the 19th century: morechildren were living longer and, as a result, their probability of being legitimisedincreased.
There are indications that illegitimate fertility among lower social groups washigher than among the medium and higher groups (Van Bavel, 1998). With theusual reservations, the evolution in the proportion of marriages with at least onelegitimised child by socio-economic status can be regarded as an approximatemeasure of the evolution in the difference in illegitimacy between these groups.We expect that the proportion of marriages with at least one legitimised child willbe higher in the lower social groups. Over the entire 19th century on average and thethree study areas together, at least one child was legitimised by 34% of unskilledworkers getting married; this figure was lower for the middle and certainly thehigher social groups (Table 6).

PRIVATISATION OF MARRIAGE IN 19TH CENTURY FLANDERS 401
5. Conclusion and Discussion
At the beginning of this study, we formulated nine hypotheses concerning the 19th-century (mainly the second part) development of certain indicators in family andmarriage. The basis for these hypotheses was the assumption that domesticisationand privatisation were intensifying at the time, that women were the pioneers inthis process and that this was then translated into renewal (or reinforcement) ofall kinds of aspects of the content and form of marriage, the marriage ceremonyand the family. The main results can be summarised roughly as follows: (1) firstmarriage intensity increased; (2) age at first marriage fell; (3) remarriage intensitydeclined; (4) the interval between widowing and remarriage increased slightly;(5) the number and proportion of witnessing family members increased; (6) thenumber and proportion of family members did not increase more on the female sidethan on the male side; (7) the proportion of women working outside the home fell;(8) the proportion of illegitimate births declined; (9) the proportion of marriagesinvolving at least one legitimised child increased.
Most of these hypotheses, particularly those relating to the first marriage,witnesses, working outside the home and illegitimacy, are confirmed. It must bestressed, however, that each of these developments is the result of the complexinterplay between various social and cultural factors. It was not the intention ofthis study to disentangle these patterns. The intention was to demonstrate empir-ically that various macro-sociological and demographic indicators point in thesame direction. This suggests an underlying process which we refer to here asdomesticisation and privatisation of marriage.
There are some indications that, from the mid-19th century onwards in Flanders– as elsewhere in Western Europe – (first) marriages were the object of muchsocial enthusiasm. The probability of first marriage increased and first marriage agedeclined. Within less than one generation – roughly the generations from 1800–25 and 1825–50 – the Malthusian marriage pattern of ‘few’ and ‘late’ marriagesimploded. The decline in first marriage age began earlier among women thanamong men, which is an intriguing social puzzle. After all, men benefited firstand most from the new economic possibilities and we can therefore expect themto marry earlier – they were the ones with fewer material obstacles to marriage.Apparently, these new opportunities were not enough to take men over the marriagethreshold more quickly. On the other hand, at first sight women had no reason at allto marry earlier and with greater intensity. In the 19th century, their legal compet-ence was, after all, limited. With very few exceptions, a married woman couldnot act legally, unless she had her husband’s consent. He controlled her maritalproperty, he could ‘punish’ her and was ‘responsible’ for her, in the same way asfor their under-age children. An unmarried (or widowed) woman could, however,act legally in her own name and do business. Which led to the key question: whydid women desire precisely that which pushed them into a legally subordinateposition?

402 KOEN MATTHIJS
Another striking and consistent pattern emerges, which is that the decline in ageat first marriage occurred among all social groups, i.e., both among ‘new’ groupssuch as the middle classes and the poorly-qualified industrial workers and among‘old’ groups such as farmers. Here too, however, socially significant differences interms of start and pace are evident: first marriage age fell first and fairly slowlyamong the lower social groups; the middle and higher groups followed later but,once started, the decline was rapid. Age at first marriage was higher on averageamong the highest-status groups than among the middle groups and higher amongthe middle groups than among the lower social classes. This is also a challengingparadox, since the higher groups were apparently not using their material opportu-nities and status to marry early. In other respects, the low-status groups certainly didnot marry early; in no way can we speak of an early, ‘proletarian’ marriage pattern.The low-status groups probably saw marriage as a means of social emancipation; aform of imitation of highly esteemed (private) behaviour which was typical of themiddle and high-status groups, i.e., groups which pulled and pushed the domest-ication project. Marrying early was a means of anticipatory socialisation with theintention of gaining access to the world and the private role behaviour of the higher-status groups. Once again, however, it appears that the groups which postponedthe decline for the longest made a rapid start on catching up. The result of thismovement was that by the end of the 19th century, the ages at first marriage ofboth men and women and of all socio-economic groups were moving increasinglycloser to one another. One possible sociological consequence was that, from thenon, marriage maybe became a less relevant social distinction mechanism.
The proportion of remarriages declined from 20–25% in the first half of the19th century to 10–15% by the end of the century. This proportion remained thehighest throughout the study period in urbanised Leuven, it was slightly lowerin Aalst – where a substantial agricultural minority still lived at the beginning ofthe 19th century – and was the lowest in Bierbeek, a markedly rural region. Theinterval between the time of widowing and of remarriage changed little over thecourse of the 19th century. Among widowers, this was an average of 2.5 to 3 years,one year longer for widows, and this differed little among the three study regions.Contrary to expectations, the remarriage intensity – the proportion of widowedpeople remarrying – declined over the course of the second half of the 19th century.Around 1830–’40, almost half of widowers remarried and one in five to one in fourof widows. By the beginning of the 20th century, one quarter of widowers remarriedand one in seven of widows. This is entirely contrary to the expectations, since itwas assumed that the social enthusiasm for marriage would also spill over intoremarriage rates.
Other indicators also point in a direction which can be interpreted as expressionsof domesticisation in the course of the second half of the 19th century. The numberand proportion of family members acting as witnesses increased, the numbers ofmarrying women working outside the home declined and the proportion of ille-gitimate children fell. Furthermore, it appeared that, towards the end of the 19th

PRIVATISATION OF MARRIAGE IN 19TH CENTURY FLANDERS 403
century, the majority of children born illegitimately were being legitimised bymarriage, while this proportion was only half in the first half of the 19th century.
In brief, various demographic and social indicators show that domesticisationsubtly shaped 19th century private life. This took place by people marrying moreand earlier, by the development of a ‘female’ marriage discourse, by the promotionof marriage and family rituals, by not going out to work and by doing everythingpossible to ensure that children were born into a conventional marriage and broughtup within a family. All these aspects were institutionally rooted in marriage andthe family – two legally safeguarded and socially highly esteemed institutions.If ‘the marriage’ was not always and everywhere of the quantitatively dominanttype, it was a qualitatively highly esteemed model. For this reason it was ‘imitated’on a large scale and, for this reason also, we can talk, somewhat exaggeratedly,of a mimetic appetite for marriage. This explains why the age at first marriagedeclined first among the lower social groups: more than for the other social groups,marriage was for them a vehicle for social promotion. In other respects, this wasonly possible because the prevailing economic and social developments permittedit: more people were now becoming economically independent (from their parents)at an earlier age and could therefore marry younger. However, this explanation isnot enough. This can be seen from the fact that the timing of the 19th-centuryeconomic cycles and of indicators such as the evolution in first marriage intensityand first marriage age did not run parallel. The differences between the three socio-economically very diverse regions and between the status groups are also not in linewith expectations.
Of course, to interpret 19th-century socio-demographic and family sociologydevelopments, the social and economic processes of the time must be taken intothe equation. Specifically, this includes the expansion of liberalism, the process ofstate-creation, the development of the ‘nation state’, the growth of democratisation,industrialisation and the service sector, and the spreading of professionalisation.These were all macro-developments with major micro-social consequences. All ofthis turned the conventional mechanisms of status struggle and competition upsidedown. From then on, education, profession and income played a major role. Thisnew status struggle was to a large extent ‘public’ and ‘economic’ and, in thissense, ‘male’. Despite the Enlightenment, the French Revolution, liberalisation,economic expansion – in other words, despite ‘favourable’ social and cultural limitconditions (or precisely because of them?) – women were increasingly kept outor pushed out of public life, where ‘new’ status could be acquired. In a mannerof speaking, women were banished to the private living environment. The socialposition and gender identity of women changed substantially: over the course ofthe 19th century they were increasingly pushed out of public life and banishedto the private living environment. In response to this exclusion and subordination,women developed a separate, ‘female’ status scale within their private world, whichrevolved around a ‘good’ marriage, a ‘clean’ home, a ‘closed’ family, ‘expressive’contacts and a permanently available mother. From then on, women had to look

404 KOEN MATTHIJS
for social appreciation and individual recognition within these environments. Thedivision of tasks became even more gender-specific than it already was (Duby andPerrot, 1993). The notion of ‘outside the home’ became symbolically associatedwith husband, work, money, prestige, public – and future. The notion of inside thehome was associated with wife, leisure time, private, children, emotion, warmth– and past. In the male mind, this produced an unusual paradox: more so thanwomen, they lived in two worlds – one within the house and one outside the house.Their families and their homes were associated with home-coming and cosiness.The new citizen was therefore confronted with a sharp contradiction: on the onehand, he had all kinds of public roles and responsibilities; on the other hand he felthimself strongly attracted to the new homeliness. This schizophrenic phenomenon,for men, has received and is still receiving little attention, historically speaking.
The ‘new’ marital and family life could only develop in the dynamic 19th-century economic setting. The emotionalisation of interpersonal intercourse, thedomesticisation and development of affective partner relationships were onlypossible because the economy permitted them. The hypothesis put forward hereis that 19th-century structural, economic and political marginalisation encouragedwomen to develop their dyadic power in primary relationships. Marrying youngand creating an identity around expressive family and motherhood tasks was,for (many?) women, a reaction to and a remedy for their public exclusion andeconomic subordination. This process distanced men and women from one another,but it also produced – paradoxically enough – social and individual pacificationbetween the sexes. Marrying and being able to create a family independentlydefused the gender problem which industrialisation reinforced. This problem wastranslated in specific terms as deprivation, perhaps even as discrimination, but itwas precisely this which gave women the ammunition to write a new social history.
Acknowledgement
This research has been supported by the Fund for Scientific Research – Flanders.
Notes1 This study forms part of a wider historical study of the demographic and sociological character-istics of three Flemish communities – Leuven, Aalst and Bierbeek. For a description, see Matthijs(2001).2 The list of nine indicators is, of course, not exhaustive. E.g., another important indicator is the agehomogamy of people marrying for the first time (Van de Putte and Matthijs, 2001).3 People develop permanent economic adjustment strategies; to this end, they exchange and dealin material and symbolic goods and services. For a thorough summary of these strategies, see Kok(1994: 108–116) and Seccombe (1992: 166–199). Seccombe contends that the economic changes ingeneral and the labour market shifts in particular played (and play) a central role in the permanentadjustment of family and population characteristics. Birdsall (1983) also sees a direct link betweenthe economy and demographic parameters. For example, proto-industrialisation led to a highermarriage intensity and marriage fertility and to a lower first marriage age. The conclusion reached by

PRIVATISATION OF MARRIAGE IN 19TH CENTURY FLANDERS 405
Schofield (1983: 279) that the evolution in the number of marriages in the past and the developmentof the wage level points to the same thing.4 The marriage certificate establishes the marriage in law. As well as information about the dateand place of the marriage ceremony, it contains all kinds of information about the marriage partnersthemselves, their parents and the witnesses. The registration of births, marriages and deaths began inBelgium on 17 June 1796. For many different reasons, some of the observations from the beginningof our study period may be unreliable. During the Dutch Period (1815–1830) the registration systemwas perfected. The Civil Code (Article 109) of the independent Belgium, which was grafted on tothe Napoleonic Code (1804), continued the existing registration practices. With the exception of afew adjustments, little changed in the content of the marriage certificates during the 19th century.Comparability was, however, made more difficult at the beginning of the 19th century because theRepublican calendar was in use during the period 1792–1805. This has been taken into account inthe study.5 Historical aspects of 19th-century Leuven are discussed in Torfs (1899); Jonckheere (1960);Camerlinckx (1960); Magits (1974); Stadsbestuur Leuven (1975); Brepoels et al. (1985); Van Croon-enborch (1988); Peeters (1992); Van Ermen (1997) and Matthijs et al. (1997).6 Historical aspects of 19th-century Aalst are discussed in Courteaux and Van Lul (1956); VanRossem (1965); Van Melkebeke (1977); Willems (1984); Praet (1986); Poddevijn et al. (1991); DeHauwere (undated).7 For more information on Bierbeek, see Bovin et al. (1985); Vliebergh and Ulens (1914).8 The marriage certificates almost always state the occupation of the bridegroom, that of the bridemuch less frequently (Matthijs, 2001). Some officials evidently did not think the work of certainwomen was important enough to ask about it, let alone state it. Furthermore, for all kinds of reasons,some marrying women withheld their occupations from the attention of the officials and thus fromthe eyes of society. Others stopped working when they married. The description ‘housewife’ occursonly rarely; apparently this was not seen as an occupation in the strict sense of the word. One otherproblem is the description ‘no occupation’. This can refer to a high social level (people who wereso rich that they neither had to nor wanted to work and also wanted to be registered as such), aswell as to unemployed people looking for work, non-job-seeking housewives or homeworkers whodid not state their job as an occupation (lace workers, for example). The status of people marrying,particularly of brides, is not only determined by their own education, occupation and income, but alsoby that of their parents, particularly the father. His occupation is, however, (usually) only registeredon the certificates if he was still alive at the time of the marriage ceremony. In our study, this wastrue in one out of two cases. Nonetheless, the social weight of the father does not expire when hedies. The extent to which prospective brides attached importance to their own occupation (or status)or to that of their fathers depends on the value attached to those occupations. The higher their ownoccupation and the lower that of the father, the more the woman will make of her own occupation onthe marriage market. However, if the father has a highly-regarded occupation, she will make more ofher background on the marriage market. Additional measurement problems are posed by the fact thata person’s social status at the time of the marriage ceremony is determined by both his own and hisparents’ position. For the ways in which these problems were resolved, see Matthijs (2001: 68–80).9 These tables contain some anomalies which almost certainly have to do with administrative proce-dures and official registration practices.10 For more information about the backgrounds to, calculation method and interpretation of theCoale indices, see Coale and Watkins (1986, appendix B).11 See Hajnal (1965) for a description of the characteristics, causes and consequences of the Malthu-sian marriage pattern. Hajnal’s basic proposition has never been thoroughly negated. Both aspects –marriage intensity and first marriage age – are often empirically linked: marriages are either early andmany or late and few but, in fact, all combinations are possible. See Watkins (1984), Stone (1977),Dixon (1978), Lehning (1983, 1988).

406 KOEN MATTHIJS
12 That restricting marriage was a response to a shortage of land and to limited economic possibil-ities seems obvious but must nonetheless be qualified: examples exist of early and almost universalmarriage in regions where and at times when, in view of the economic problems, more reticencewould be expected (Alter, 1991). Examples also exist of few, late marriages at times, in places or ingroups where virtually no economic restrictions existed: the rich bourgeoisie, for example, did notuse their wealth to marry off their children quickly.13 At the beginning of the 20th century, another reversal seems to be noticeable. However, we donot examine this further.14 The average first marriage ages can, for various reasons, present a misleading picture of actualevolution. The number of marriages by age is, after all, not only dependent on the age-specificmarriage rate, but also on the available numbers of marriageable people by generation and by age.Differences between groups regarding first marriage age thus can point to genuine differences, aswell as to differences in the age structure of the population. In the same way, differences in averagemarriage ages by social level can be a result of actual differences, as well as of the unequal agestructure of the marriageable people per occupational group.15 In addition to the polynomial, the R2 values are also shown. These values illustrate the extent towhich the actual curve deviates from the trend line, i.e., from the polynomial. The R2 values varybetween 0 and 100%, where 100% refers to a perfect match. Particularly at the extremes, the directionand intensity of the polynomial can be misleading and, for this reason, these have to be interpretedwith caution.16 For a thorough analysis of the evolution of the age at first marriage in the three study areas, seeMatthijs (2002).17 These figures are not reproduced here; see Matthijs (2001: 190–196).18 The choice of a seven-year period is pragmatic: remarriage usually takes place within this period.The calculation method described does have disadvantages, but nonetheless provides a close approx-imation of remarriage behaviour. One difficulty is that no account is taken of the timing of remarriage;a decline in remarriage intensity can be linked either to deferment or to abandonment and, if widefluctuations occur, the measure used could become inaccurate. For other calculation methods, see forexample Van Poppel (1992); Bideau (1980); Beex (1982).19 The coding of the death certificates for complete years is possible from 1797 onwards; for thisreason, the remarriage intensity can be calculated from 1803 onwards. For the three previous years,extrapolation was required. In addition to this methodological problem a substantive problem alsoexists: many people from the surrounding countryside died in the hospitals of Leuven and Aalst.They did not therefore die where they legally lived. This was a rare occurrence in Bierbeek. In orderto correct for this, these deaths were counted and deducted from the original number. Specifically,the legal place of residence of the deceased was checked for every tenth year. The figures for theintermediate years were estimated by interpolation. A second problem is that widowed people aregeographically mobile – even at an advanced age. The measurements are distorted because somepeople return to their village of birth after being widowed – women more so than men – while othersmove to the town to start a new social life, which can also mean looking for a new partner (VanPoppel, 1995: 431).20 For a thorough analysis of the methods of calculation of the remarriage intensity, see Matthijs(2003).21 For more information and comparisons, see Matthijs (2001: 207–210).22 The fact that agricultural regions were more closed in terms of nuptiality was perhaps related tothe fact that farmers were under significant pressure to marry within their own class and perhaps thispressure was stronger in second marriages than in first marriages. It is also possible that agriculturalregions differed from non-agricultural regions in terms of household composition in the sense thatcohabitation and living with parents was more common in the countryside. After all, cohabitantscan fully or partially take over the family functions of deceased family members, which reduces theemotional and economic pressure to remarry. Inheritance questions can also play a role: Bierbeek

PRIVATISATION OF MARRIAGE IN 19TH CENTURY FLANDERS 407
had a great many larger and smaller owner-farmers and their inheritance could in some cases haveplayed a part in curbing remarriage aspirations.23 What is known as crisis mortality – i.e., mortality as a consequence of ‘economic stress’,epidemics and wars – fell over the course of the 19th century as a result of better medical knowledgeand prevention, better nutrition and the development of social provisions such as the supply of cleanwater and the efficient disposal of contaminated water (Burnett, 1991: 59; Schofield and Reher, 1991:1). Since life expectancy was rising, marriages were dissolved later and since remarriage rates declineas age increases (see below), this resulted in a lower remarriage intensity (Charbonneau, 1970: 81;Ihinger-Tallman and Pasley, 1987: 28; Van Poppel, 1995: 280; Dyrvik, 1981: 305; Knodel and Lynch,1985: 39). Generally speaking, this proposition has to be put into perspective because the decline inmortality was not linear, but differed with age (see e.g., Vallin, 1991: 54). It is difficult to say whetheranother demographic factor, the late 19th-century decline in fertility, also played a role in the declinein remarriage intensity. According to most research, the remarriage rate is smaller if (several) childrenare involved, but children can sometimes also be an incentive to remarry. This depends partly ontheir age and gender (Van Poppel, 1992: 326–327). Older children can help with the household andprovide an additional income, which lessens the pressure to remarry (Knodel and Lynch, 1985: 53).If only young children are involved, things are more difficult: from the point of view of the parent,this ‘burden’ can be a worthwhile reason for remarrying, while this is precisely the reverse for anynew partner and, for this reason, he/she is not inclined to remarry (Grigg, 1977: 194). Changes onthe (local) marriage market also play a part in the evolution of remarriage intensity (Knodel andLynch, 1985: 58). Over the course of the second half of the 19th century, the first marriage intensityincreased (see above) and, as a result, the supply of marriageable people declined, which squeezed theprobability of remarriage. The emigration of young adults for economic reasons played a comparablerole; one example is the exodus of young farmers from Bierbeek to the urban industries and services.This disrupted the already precarious balance on the local marriage market. The remarriage intensityalso declined as a result of the 19th century changes in the (economic) production system (VanPoppel, 1992: 405). Together with the development of the industrial capitalist production method, thequantitative and qualitative importance of family production and of proto-industry declined, whileemployment in industry and in the services sector rose (Karush, 1977). This had consequences forinternal family functioning: the family evolved from a production unit into a consumer unit, whichled to a shift in (the importance of some) family functions (Parsons, 1954). A consumer unit is lesssensitive to vacant positions and can more easily continue functioning ‘incomplete’ than a productionunit.24 These figures are not given here. See Matthijs (2003).25 The following quotation by Burguière (1981: 41) illustrates this very nicely: “Lorsqu’un mariperd sa femme (. . .) ou une femme son mari, le survivant donne de même un repas. Pendant que lecorps est là gisant, les convives rient, boivent, et chantent et font des arrangements pour marier, denouveau, l’hôte qui les traite. Le veuf ou la veuve donne des raisons d’acceptation ou de refus dupersonnage qu’on lui propose: mais les amis ne se séparent guère que le marché soit conclu.” (Whena husband loses his wife (. . .) or a wife her husband, the surviving partner organises a meal. Whilethe body is lying there, the guests laugh, drink and sing and make arrangements for the remarriageof the host who is feeding them. The widower or widow gives reasons for accepting or refusing theperson suggested; but the friends barely part until the deal is done.)26 The waiting time differed little between the three study regions. Specifically, remarriage tookplace a little more quickly in Bierbeek than in Leuven or Aalst. It is difficult to say whether this isrelated to the pressure on farmers to remarry quickly, but this is unlikely. The figures by region arenot reproduced here; they are available upon request from the author. See Matthijs (2001).27 Bideau (1980: 40) observed that these regulations about waiting to remarry were by no meansrespected at all times.

408 KOEN MATTHIJS
28 Leaving separated people aside, three remarriage types exist: a widow with an unmarried man,a widower with an unmarried woman and a widower with a widow. For concrete information andfigures, see Matthijs (2003).29 Information about the relationship of the witnesses to the marriage partners is availablethroughout the study period for Bierbeek, from 1830 onwards for Leuven and from 1865 onwardsfor Aalst.30 The results are shown from 1835 onwards because they are not reliable until this date.31 By way of comparison: in the mid-19th century, the proportion of illegitimate births in Belgiumwas 8–10%, in the Province of Brabant 15–20%, in Brussels 30–35%.32 The civil status of the parents – or more accurately of the mother – determines whether achild is legitimate or not. In the 19th century, this status had major social and legal consequences.Children born of a married mother were, of course, legitimate. If the mother was not married, threepossibilities existed. Firstly, the child could remain illegitimate for the rest of its life, a person withno legal father. Secondly, the father could acknowledge the child, without marrying the mother. Inthat case, the child was acknowledged, but not legitimised. In acknowledging the child, the naturalfather was making it known that he was the father of the child – no more, no less. Thirdly, it waspossible to acknowledge and immediately legitimise the child by marrying. Legitimisation wentfurther than acknowledgement both in fact and in law. A legitimised child had the same rights as alegitimate child. Acknowledged illegitimate children, by contrast, were excluded from certain rights,for example concerning inheritance and public assistance.33 The number of illegitimate births is known from birth certificates, the number of childrenlegitimised by marriage from marriage certificates. Some distortion caused by migration is possible.
References
Alter, G., 1991. ‘New perspectives on European marriage in the nineteenth century’. Journal ofFamily History 16(1): 1–5.
Anderson, M., 1980. Approaches to the History of the Western Family, 1500–1914. Cambridge:Cambridge University Press.
Ariès, P., 1962. Centuries of Childhood: A Social History of Family Life (translated by R. Baldick).New York: Knopf.
Ariès, P., 1981. ‘Introduction to Part I’, in J. Dupâquier, E. Hélin, P. Laslett, M. Livi-Bacci andS. Sogner (eds.), Marriage and Remarriage in Populations of the Past, pp. 27–40. London:Academic Press.
Art, J., 1992. ‘De pastorale methodes van de Vlaamse parochiegeestelijkheid: verandering ofcontinuïteit’ (The pastoral methods of Flemish parochial clergy: change or continuity), in E.Lamberts (ed.), Een kantelend tijdperk. De wending van de kerk naar het volk in Noord-West-Europa (1890–1910), pp. 227–243. Leuven; Universitaire Pers.
Beex, B., 1982. ‘Hertrouw in Nederland in de jaren zestig en zeventig: een sociaal-demografischperspectief’ (Remarriage in the Netherlands in the sixties and seventies: a socio-demographicperspective). Bevolking en Gezin 2: 185–204.
Bellettini, A., 1981. ‘Les remariages dans la ville et dans la campagne de Bologne au dix-neuvièmesiècle’ (Remarriage in towns and in the Boulogne countryside in the nineteenth century), in J.Dupâquier, E. Hélin, P. Laslett, M. Livi-Bacci and S. Sogner (eds.), Marriage and Remarriage inPopulations of the Past, pp. 259–272. London: Academic Press.
Bideau, A., 1980. ‘A demographic and social analysis of widowhood and remarriage: the example ofthe castellany of Thoissey-en-Dombes, 1670–1840’. Journal of Family History 5(1): 28–43.
Birdsall, N., 1983. ‘Fertility and economic change in eighteenth and nineteenth century Europe: Acomment’. Population and Development Review 9: 111–123.

PRIVATISATION OF MARRIAGE IN 19TH CENTURY FLANDERS 409
Bovin, K., Goedseels V. and Van Mellaert, P., 1985. Boerderijen in Bierbeek (Farms in Bierbeek).Leuven: Centrum Agrarische Bouwkunde.
Brepoels, J. et al., 1985. Stadsboek Leuven. Leuven: Kritak.Burguière, A., 1981. ‘Réticences théoriques et intégration pratique du remariage dans la France
d’Ancien Régime’ (Theoretical reticence and practical integration of remarriage in France duringthe Ancien Régime), in J. Dupâquier, E. Hélin, P. Laslett, M. Livi-Bacci and S. Sogner (eds.),Marriage and Remarriage in Populations of the Past, pp. 41–48. London: Academic Press.
Burnett, J., 1991. ‘Housing and the decline of mortality’, in R. Schofield, D. Reher and A. Bideau(eds.), The Decline of Mortality in Europe, pp. 158–176. Oxford: Clarendon Press.
Caine, B. and G. Sluga, 2000. Gendering European History. London: Leicester University Press.Cabourdin, G., 1978. ‘Le remariage’ (Remarriage). Annales de Démographie Historique: 307–336.Cabourdin, G., 1981. ‘Le remariage en France sous l’Ancien Régime (seizième – dix-huitième
siècles)’ (Remarriage in France during the Ancien Régime (sixteenth – eighteenth centuries)), inJ. Dupâquier, E. Hélin, P. Laslett, M. Livi-Bacci and S. Sogner (eds.), Marriage and Remarriagein Populations of the Past, pp. 273–285. London: Academic Press.
Camerlinckx, H., 1960. Bijdrage tot een studie van de demografische en sociaal-economische struc-tuur van Leuven tijdens het Hollands Bewind (Contribution to a Study of the Demographicand Socio-economic Structure of Leuven during the Dutch Regime). Leuven: K.U. Leuven,Department of History lecture.
Charbonneau, H., 1970. Tourouve-au-Perche aux XVIIième et XVIIIième siècles (Tourouve-au-Perchein the 17th and 18th Centuries). Paris: P.U.F.
Cloet, M. and Storme, H., 1991. ‘Relatie en huwelijk in de Nieuwe Tijd’ (Relationship andmarriage in the New Age), in R. Burggraeve et al. (eds.), Levenssrituelen. Het huwelijk. Leuven:Universitaire Pers.
Coale, A. J. and Watkins, S. C., 1986. The Decline of Fertility in Europe. Princeton: PrincetonUniversity Press.
Courteaux, F. and Van Lul, A., 1956. ‘Aalst in de 19de eeuw’ (Aalst in the 19th century). Gazet vanAalst en omstreken 13(13): 170–207.
Cunningham, H., 1997. Het kind in het westen. Vijf eeuwen geschiedenis (The Child in the West. FiveCenturies of History). Amsterdam: Van Gennep.
Damsma, D., 1993. ‘De dubbele revolutie en het gezin’ (The double revolution and the family), in T.Zwaan (ed.), Familie, huwelijk en gezin in West-Europa, pp. 165–192. Amsterdam: Boom/OpenUniversity.
Davidoff, L, and Hall, C., 1987. Family Fortunes: Men and Women of the English Middle Class1780–1850. London: Hutchinson.
De Hauwere, H. (undated). Vergelijking tussen twee Vlaamse steden die een zeer verschillende demo-grafische ontwikkeling kenden in de hedendaagse tijden (1784–1940): Aalst en Dendermonde(Comparison between two Flemish Cities and Their very Different Demographic Developmentin Modern Times (1784–1940): Aalst and Dendermonde). Leuven: K.U. Leuven, Department ofHistory lecture.
Demos, J., 1970. A Little Commonwealth: Family Life in Plymouth Colony. New York: OxfordUniversity Press.
Dentith, S., 1998. Society and Cultural Forms in Nineteenth-Century England. London: MacmillanPress.
Dixon, R.B., 1978. ‘Late marriage and non-marriage as demographic responses: Are they similar?’Population Studies 32(3): 449–466.
Duby, G. and Perrot, M., 1993. Geschiedenis van de vrouw. Deel 3. De negentiende eeuw (History ofthe Woman. Part 3. The Nineteenth Century) (eds. G. Fraisse and M. Perrot). Amsterdam: Agon.
Dyrvik, S., 1981. ‘Gagne-pain ou sentiments? Trait du remariage en Norvège au dix-neuvième siècle’(Source of Income or Feelings. Views of Remarriage in Norway in the Nineteenth Century), in

410 KOEN MATTHIJS
J. Dupâquier, E. Hélin, P. Laslett, M. Livi-Bacci and S. Sogner (eds.), Marriage and Remarriagein Populations of the Past, pp. 297–306. London: Academic Press.
Gillis, J., 1985. For Better, for Worse: British Marriages, 1600 to the Present. New York: OxfordUniversity Press.
Gillis, J., 1996. ‘Making the family: The invention of family times(s) and the reinvention of familyhistory’. Journal of Family History 21(1): 4–21.
Grigg, S., 1977. ‘Toward a theory of remarriage: A case study of Newburyport at the beginning ofthe nineteenth century’. Journal of Interdisciplinary History 8(2): 183–220.
Hajnal, J., 1965. ‘European marriage patterns in perspective’, in D.V. Glass and D.E. Eversley (eds.),Population in History, pp. 101–143. London: Edward Arnold.
Hareven, T.K., 1978. The Family and the Life Course in Historical Perspective. New York: AcademicPress.
Hofstee, E.W., 1981. Korte demografische geschiedenis van Nederland van 1800 tot heden (BriefDemographic History of the Netherlands from 1800 to the Present). Haarlem: Fibula-VanDishoeck.
Ihinger-Tallman, M. and Pasley, K., 1987. Remarriage. California Newbury Park: Sage.Jonckheere, W.G., 1960. Bevolking en mortaliteit. Aspecten van de demografische evolutie te Leuven
onder het Frans Bewind (1794–1814) (Population and Mortality. Aspects of the DemographicEvolution in Leuven under the French Regime (1794–1814)). Leuven: K.U. Leuven, Departmentof History lecture.
Karush, G. E., 1977. ‘Industrialisation et changements de la population active en Belgique de1846 à 1910’ (Industrialisation and Changes in the Workforce in Belgium from 1846 to 1910).Population et Famille 40(1): 37–76.
Knodel, J. and Lynch, K., 1985. ‘The decline of remarriage: Evidence from German villagepopulations in the eighteenth and nineteenth centuries’. Journal of Family History 10(1): 34–59.
Kok, J., 1994. ‘Collectieve strategie en individuele levensloop’ (Collective strategy and individuallifecycle), in M. Baud and T. Engelen (eds.), Samen wonen, samen werken? Vijf essays over degeschiedenis van arbeid en gezin, pp. 97–121. Hilversum: Verloren.
Lebrun, P., Bruwier, M., Dhondt, J. and Hansette, G. (eds.), 1979. Histoire quantitative et dévelop-pement de la Belgique au XIXième siècle. Essai sur la révolution industrielle en Belgique.Bruxelles: Academie Royale de Belgique.
Lehning, J. R., 1983. ‘Nuptiality and rural industry: Families and labor in the French countryside’.Journal of Family History 8(4): 333–345.
Lehning, J. R., 1988. ‘The timing and prevalence of women’s marriage in the French department ofthe Loire, 1851–1891’. Journal of Family History 13(3): 307–327.
Lesthaeghe, R., 1989. Motivation and Legitimation: Living Conditions, Social Control and theReproductive Regimes in Belgium and France from the 16th Through the 19th Century. Brussel:VUB-Centrum voor Sociologie.
Lundh, C., 2002. ‘Remarriages in Sweden in the 18th and 19th centuries’. The History of the Family7(3): 423–449.
Magits, M., 1974. Demografische en sociale structuren te Leuven (1846–1860). Bijdrage tot destadsgeschiedenis in de 19de eeuw (Demographic and Social Structures in Leuven (1846–1860). Contribution to the City’s History in the 19th Century). Brussels: VUB, Centre for socialstructures and the economy.
Matthijs, K., 2001. De mateloze negentiende eeuw. Bevolking, huwelijk, gezin en sociale veran-dering (The Extravagant Nineteenth Century. Population, Marriage, Family and Social Change).Leuven: Universitaire Pers.
Matthijs, K., 2002. ‘Mimetic appetite for marriage in nineteenth-century Flanders: Gender disad-vantage as an incentive for social change’. Journal of Family History 27(2): 101–127.
Matthijs, K., 2003. ‘Frequency, timing and intensity of remarriage in 19th century Flanders’. TheHistory of the Family. An International Journal 8(1): 135–162.

PRIVATISATION OF MARRIAGE IN 19TH CENTURY FLANDERS 411
Matthijs, K., Van Bavel, J. and Van de Velde, I., 1997. Leuven in de negentiende eeuw. De bevolking:een spiegel van het dagelijkse leven (Leuven in the Nineteenth Century. The Population: AReflection of Everyday Life). Leuven: Acco.
Matthijs, K. and Van de Putte, B., 2001. ‘Huwen tijdens de advent en de vasten in de 19de eeuw inVlaanderen’. Belgisch Tijdschrift voor Nieuwste Geschiedenis 31(1–2): 75–112.
Mitterauer, M. and Sieder, R., 1983. The European Family. Patriarchy to Partnership from the MiddleAges to the Present. Oxford: Basil Blackwell.
Parsons, T., 1954. Essays in Sociological Theory. New York: The Free Press.Peeters, M. G., 1992. Leven in het oude Leuven (Living in Old Leuven). Ghent: Stichting Mens en
Kultuur.Perrot, M. (ed.), 1990. A History of Private Life. Volume 4. From the Fires of Revolution to the Great
War (translated by A. Goldhammer). Cambridge: Belknap Press of Harvard University Press.Poddevijn, D., Van Gyseghem, G. and Baert, K., 1991. Van paternalisme naar emancipatie. Een
bijdrage tot de sociaal-economische geschiedenis van het arrondissement Aalst uitgegeven naaraanleiding van 150 jaar Kamer van Koophandel en Nijverheid van Aalst en Gewest (1841–1991)(From Paternalism to Emancipation. A Contribution to the Socio-economic History of the Districtof Aalst, Published to Mark 150 Years of the Chamber of Commerce and Industry for the AalstRegion (1841–1991)). Aalst: Chamber of Commerce and Industry.
Pott-Buter, H. A., 1993. Facts and Fairy Tales about Female Labor, Family and Fertility. A Seven-country Comparison, 1850–1990. Amsterdam: Amsterdam University Press.
Praet, P., 1986. Bijdrage tot de studie over de armoede in Aalst tijdens de 19de eeuw (Contributionto the Study of Poverty in Aalst during the 19th Century). Leuven: K.U. Leuven, Department ofHistory.
Roberts, R., 1973. The Classic Slum: Salford Life in the First Quarter of the Century. Harmond-sworth: Penguin Books.
Schofield, R., 1983. ‘The impact of scarcity and plenty on population change in England’. Journalof Interdisciplinary History 14: 265–291.
Schofield, R. and Reher, D., 1991. ‘The decline of mortality in Europe’, in R. Schofield, D. Reherand A. Bideau (eds.), The Decline of Mortality in Europe, pp. 1–17. Oxford: Clarendon.
Scholliers, P., 1981. ‘Arbeidersconsumptie in transitie (Workers’ consumption in transition) 1890–1930’, in J. Hannes (ed.), Consumptiepatronen en prijsindexen, pp. 30–36. Brussels: VUB Press.
Scholliers, P., 1985. De Gentse metaalarbeiders in de 19de eeuw (Metalworkers in Ghent in the 19th
Century). Brussels: VUB, Centre for contemporary social history.Scholliers, P., 1992. ‘Historical food study in Belgium: Development, problems and results in the 19th
and 20th centuries’, in H. J. Teuteberg (ed.), European Food History. A Study Review, pp. 71–89.Leicester: Leicester University Press.
Scholliers, P., 1996. Wages, Manufacturers and Workers in the 19th Century Factory: the VoortmanCotton Mill in Ghent. Oxford: Berg.
Seccombe, W., 1992. A Millennium of Family Change. Feudalism to Capitalism in NorthwesternEurope. London: Verso.
Segalen, M., 1981. ‘Mentalité populaire et remariage en Europe occidentale’ (Popular mentality andremarriage in Western Europe), in J. Dupâquier, E. Hélin, P. Laslett, M. Livi-Bacci and S. Sogner(eds.), Marriage and Remarriage in Populations of the Past, pp. 67–80. London: Academic Press.
Shorter, E., 1977. The Making of the Modern Family. New York: Basic Books.Stadsbestuur Leuven, 1975. Leuven, een stad die groeit (Leuven, a Growing City). Leuven:
Stadsbestuur.Stone, L., 1977. The Family, Sex and Marriage in England, 1500–1800. London: Weidenfeld.Tilly, L. and Scott, J. W., 1978. Women, Work, and Family. New York: Routledge.Tilly, L., Scott, J. W. and Cohen, M., 1976. Women’s work and European fertility patterns. Journal
of Interdisciplinary History 6(3): 447–476.

412 KOEN MATTHIJS
Torfs, J. A., 1899. Geschiedenis van Leuven. Van den vroegsten tijd tot op heden (History of Leuven.From the Earliest Times to the Present). Leuven: Drukkerij Emiel Charpentier.
Vallin, J., 1991. ‘Mortality in Europe from 1720 to 1914: Long-term trends and changes in patternsby age and sex’, in R. Schofield, D. Reher and A. Bideau (eds.), The Decline of Mortality inEurope, pp. 38–67. Oxford: Clarendon.
Van Bavel, J., 1998. Economic crisis, illegitimacy and first marriage before the fertility transition: Acohort case study in Leuven, Belgium, 1846–1866. Paper presented at the 1998 Social Scienceand History Conference. Amsterdam, the Netherlands.
Van Croonenborch, J., 1988. De Leuvense Vaart (The Vaart in Leuven) 1830–1913. Leuven: K.U.Leuven, Department of History lecture.
Van Ermen, E. (ed.), 1997. Van Petermannen en koeienschieters. Kroniek van Leuven. Leuven:Uitgeverij P.
Van de Putte, B. and Matthijs, K., 2002. Romantic love and marriage. A study of age homogamyin 19th century Leuven. Belgisch Tijdschrijft voor Nieuwste Geschiedenis xxxi, 2001, 3–4: 579–619.
Vandenbroeke, C., 1976. ‘Karakteristieken van het huwelijks- en voortplantingspatroon. Vlaanderenen Brabant, 17de–19de eeuw’ (Characteristics of the Marriage and Reproduction Pattern.Flanders and Brabant, 17th–19th Centuries). Tijdschrift voor Sociale Geschiedenis 2(2): 107–145.
Van Melkebeke, D., 1977. Seizoensarbeid in het arrondissement Aalst (Seasonal labour in the Districtof Aalst) (1880–1914). Leuven: K.U. Leuven, Department of History.
Van Poppel, F., 1992. Trouwen in Nederland. Een historisch-demografische studie van de 19de- envroeg-20ste eeuw (Marriage in the Netherlands. A Historical Demographic Study of the 19th andEarly 20th Centuries). The Hague: Netherlands Interdisciplinary Demographic Institute.
Van Poppel, F., 1995. ‘Widows, widowers and remarriage in nineteenth-century Netherlands’.Population Studies 49: 421–441.
Van Rossem, B., 1965. Bijdrage tot de studie van het analfabetisme en de geschiedenis van het lageronderwijs te Aalst (Contribution to the study of illiteracy and the history of primary education inAalst) (1790–1860). Leuven: K.U. Leuven, Department of History.
Vliebergh, E. and Ulens, R., 1914. Het Hageland. Zijne plattelandsche bevolking in de xixde eeuw(The Hageland. Its Rural Population in the 19th Century). Brussels: Hayez.
Watkins, S. C., 1984. ‘Spinsters’. Journal of Family History 9(4): 310–325.Willems, C., 1984. De Dender en zijn Vlaamse steden. Geraardsbergen, Ninove, Aalst en Dender-
monde (The Dender and its Flemish towns. Geraardsbergen, Ninove, Aalst and Dendermonde).Brussels: Artis-Historia.