Del Monte Pacific Fresh ideas, global ambition, healthy growth
25
Asia Singapore Consumer Food & Beverage 4 June 2008 Del Monte Pacific Reuters: DMPL.SI Bloomberg: DELM SP Exchange: SES Ticker: DMPL Fresh ideas, global ambition, healthy growth; Buy initiated James Tan Research Analyst (65) 6423 5139 [email protected] Leading Asian food and beverage company Del Monte Pacific Ltd produces, markets and distributes premium-branded fruit and vegetable-based products worldwide. The company has a strong presence in the Philippines, where it owns the Del Monte brand. It also has brand rights in the Indian subcontinent. We forecast a 26.7% increase in recurring earnings, underpinned by revenue growth CAGR of 26.2% in FY07-10E. Our TP of S$0.90 is 29% above the current price. Initiate with a Buy. Forecasts and ratios Year End Dec 31 2006A 2007A 2008E 2009E 2010E Sales (USDm) 243.4 289.4 386.8 484.5 582.0 EBITDA (USDm) 35.9 47.9 60.5 73.0 83.7 Reported NPAT (USDm) 21.0 28.3 37.0 47.0 57.5 Reported EPS FD(USD) 0.02 0.03 0.03 0.04 0.05 DB EPS FD (USD) 0.02 0.03 0.03 0.04 0.05 DB EPS growth (%) – 34.7 30.7 26.8 22.5 PER (x) 14.8 14.7 15.0 11.8 9.7 EV/EBITDA (x) 8.5 8.7 9.1 7.5 6.4 DPS (net) (USD) 0.01 0.03 0.03 0.03 0.04 Yield (net) (%) 5.1 6.9 5.0 6.3 7.8 Source: Deutsche Bank estimates, company data 1 DB EPS is fully diluted and excludes non-recurring items 2 Multiples and yields calculations use average historical prices for past years and spot prices for current and future years, except P/B which uses the year end close Deutsche Bank AG/Hong Kong All prices are those current at the end of the previous trading session unless otherwise indicated. Prices are sourced from local exchanges via Reuters, Bloomberg and other vendors. Data is sourced from Deutsche Bank and subject companies. Deutsche Bank does and seeks to do business with companies covered in its research reports. Thus, investors should be aware that the firm may have a conflict of interest that could affect the objectivity of this report. Investors should consider this report as only a single factor in making their investment decision. Independent, third-party research (IR) on certain companies covered by DBSI's research is available to customers of DBSI in the United States at no cost. Customers can access this IR at http://gm.db.com, or call 1-877-208-6300 to request that a copy of the IR be sent to them. DISCLOSURES AND ANALYST CERTIFICATIONS ARE LOCATED IN APPENDIX 1 Initiation of Coverage Buy Price at 4 Jun 2008 (SGD) 0.70 Price target - 12mth (SGD) 0.90 52-week range (SGD) 0.80 - 0.48 Straits Times Index 3,154 Price/price relative 0.0 0.13 0.25 0.38 0.5 0.63 0.75 0.88 1.0 6/06 9/06 12/06 3/07 6/07 9/07 12/07 3/08 Del Monte Pacific Straits Times Index (Rebased) Performance (%) 1m 3m 12m Absolute 0.0 12.0 7.7 Straits Times Index -2.5 -4.7 -11.9 Stock data Market cap (SGDm) 757 Market cap (USDm) 555 Shares outstanding (m) 1,081.8 Major shareholders NutriAsia (79%) Free float (%) 21 Avg daily value traded (USDm) 0.3 Key indicators (FY1) ROE (%) 16.5 Net debt/equity (%) 8.1 Book value/share (USD) 0.21 Price/book (x) 2.4 Net interest cover (x) 29.0 Operating profit margin (%) 13.1 Company Global Markets Research Transformation into a global branded consumer company The company plans to expand its branded and private label business in Asia and the Indian subcontinent with the recent acquisition of the S&W brand and FieldFresh Foods in India. We believe this could help to transform Del Monte Pacific into a branded consumer products company with a global reach. Multiple growth engines to drive earnings Del Monte Pacific aims to (1) grow organically in the Philippine market with its new beverage product Fit ’n Right and double its nationwide store coverage within three years; (2) increase its fresh fruit business worldwide; and (3) expand its export business through the extension of the S&W brand globally. DCF valuation; competition, input costs and FX key risks Our DCF-derived TP of S$0.90 is based on an 9.1% WACC and a terminal growth rate of 1.0%, implying a PE of 15.2x FY09E. Downside risks include competition (branded and private label), a rise in input costs (raw materials and packaging), foreign exchange fluctuations, ongoing litigation suit and execution of its new ventures.
-
Upload
khangminh22 -
Category
Documents
-
view
4 -
download
0
Transcript of Del Monte Pacific Fresh ideas, global ambition, healthy growth

Asia Singapore Consumer Food & Beverage
4 June 2008
Del Monte Pacific Reuters: DMPL.SI Bloomberg: DELM SP Exchange: SES Ticker: DMPL
Fresh ideas, global ambition, healthy growth; Buy initiatedJames Tan Research Analyst (65) 6423 5139 [email protected]
Leading Asian food and beverage company Del Monte Pacific Ltd produces, markets and distributes premium-branded fruit and vegetable-based products worldwide. The company has a strong presence in the Philippines, where it owns the Del Monte brand. It also has brand rights in the Indian subcontinent. We forecast a 26.7% increase in recurring earnings, underpinned by revenue growth CAGR of 26.2% in FY07-10E. Our TP of S$0.90 is 29% above the current price. Initiate with a Buy.
Forecasts and ratios
Year End Dec 31 2006A 2007A 2008E 2009E 2010E
Sales (USDm) 243.4 289.4 386.8 484.5 582.0
EBITDA (USDm) 35.9 47.9 60.5 73.0 83.7
Reported NPAT (USDm) 21.0 28.3 37.0 47.0 57.5
Reported EPS FD(USD) 0.02 0.03 0.03 0.04 0.05
DB EPS FD (USD) 0.02 0.03 0.03 0.04 0.05
DB EPS growth (%) – 34.7 30.7 26.8 22.5
PER (x) 14.8 14.7 15.0 11.8 9.7
EV/EBITDA (x) 8.5 8.7 9.1 7.5 6.4
DPS (net) (USD) 0.01 0.03 0.03 0.03 0.04
Yield (net) (%) 5.1 6.9 5.0 6.3 7.8Source: Deutsche Bank estimates, company data
1 DB EPS is fully diluted and excludes non-recurring items 2 Multiples and yields calculations use average historical prices for past years and spot prices for current and future years, except P/B which uses the year end close
Deutsche Bank AG/Hong Kong
All prices are those current at the end of the previous trading session unless otherwise indicated. Prices are sourced from local exchanges via Reuters, Bloomberg and other vendors. Data is sourced from Deutsche Bank and subject companies.
Deutsche Bank does and seeks to do business with companies covered in its research reports. Thus, investors should be aware that the firm may have a conflict of interest that could affect the objectivity of this report.
Investors should consider this report as only a single factor in making their investment decision.
Independent, third-party research (IR) on certain companies covered by DBSI's research is available to customers of DBSI in the United States at no cost. Customers can access this IR at http://gm.db.com, or call 1-877-208-6300 to request that a copy of the IR be sent to them.
DISCLOSURES AND ANALYST CERTIFICATIONS ARE LOCATED IN APPENDIX 1
Initiation of Coverage
Buy Price at 4 Jun 2008 (SGD) 0.70Price target - 12mth (SGD) 0.9052-week range (SGD) 0.80 - 0.48Straits Times Index 3,154
Price/price relative
0.00.130.250.380.5
0.630.750.881.0
6/06
9/06
12/06 3/0
76/0
79/0
712
/07 3/08
Del Monte Pacific
Straits Times Index (Rebased)
Performance (%) 1m 3m 12mAbsolute 0.0 12.0 7.7Straits Times Index -2.5 -4.7 -11.9
Stock data
Market cap (SGDm) 757Market cap (USDm) 555Shares outstanding (m) 1,081.8Major shareholders NutriAsia (79%)Free float (%) 21Avg daily value traded (USDm) 0.3
Key indicators (FY1)
ROE (%) 16.5Net debt/equity (%) 8.1Book value/share (USD) 0.21Price/book (x) 2.4Net interest cover (x) 29.0Operating profit margin (%) 13.1
Co
mp
any
Glo
bal
Mar
kets
Res
earc
h
Transformation into a global branded consumer company The company plans to expand its branded and private label business in Asia and the Indian subcontinent with the recent acquisition of the S&W brand and FieldFresh Foods in India. We believe this could help to transform Del Monte Pacific into a branded consumer products company with a global reach.
Multiple growth engines to drive earnings Del Monte Pacific aims to (1) grow organically in the Philippine market with its new beverage product Fit ’n Right and double its nationwide store coverage within three years; (2) increase its fresh fruit business worldwide; and (3) expand its export business through the extension of the S&W brand globally.
DCF valuation; competition, input costs and FX key risks Our DCF-derived TP of S$0.90 is based on an 9.1% WACC and a terminal growth rate of 1.0%, implying a PE of 15.2x FY09E. Downside risks include competition (branded and private label), a rise in input costs (raw materials and packaging), foreign exchange fluctuations, ongoing litigation suit and execution of its new ventures.

4 June 2008 Food & Beverage Del Monte Pacific
Page 2 Deutsche Bank AG/Hong Kong
Fiscal year end 31-Dec 2006 2007 2008E 2009E 2010E
Financial Summary DB EPS (USD) 0.02 0.03 0.03 0.04 0.05Reported EPS (USD) 0.02 0.03 0.03 0.04 0.05DPS (USD) 0.01 0.03 0.03 0.03 0.04BVPS (USD) 0.2 0.2 0.2 0.2 0.3
Weighted average shares (m) 1,082 1,082 1,082 1,082 1,082Average market cap (USDm) 311 417 555 555 555Enterprise value (USDm) 305 416 554 546 533
Valuation Metrics P/E (DB) (x) 14.8 14.7 15.0 11.8 9.7P/E (Reported) (x) 14.8 14.7 15.0 11.8 9.7P/BV (x) 1.70 1.59 2.42 2.24 2.05
FCF Yield (%) 3.3 6.0 5.6 6.7 8.6Dividend Yield (%) 5.1 6.9 5.0 6.3 7.8
EV/Sales (x) 1.3 1.4 1.4 1.1 0.9EV/EBITDA (x) 8.5 8.7 9.1 7.5 6.4EV/EBIT (x) 11.0 10.8 10.9 8.7 7.3
Income Statement (USDm) Sales revenue 243 289 387 485 582Gross profit 71 85 109 134 156EBITDA 36 48 61 73 84Depreciation 8 9 9 10 10Amortisation 0 0 0 0 0EBIT 28 39 51 63 73Net interest income(expense) 0 -1 -2 -2 -1Associates/affiliates 0 -1 -2 -2 1Exceptionals/extraordinaries 0 -10 0 0 0Other pre-tax income/(expense) 0 0 0 0 0Profit before tax 28 37 47 60 73Income tax expense 7 -1 10 13 16Minorities 0 0 0 0 0Other post-tax income/(expense) 0 0 0 0 0Net profit 21 28 37 47 58
DB adjustments (including dilution) 0 0 0 0 0DB Net profit 21 28 37 47 58
Cash Flow (USDm) Cash flow from operations 16 31 39 43 53Net Capex -5 -6 -8 -6 -5Free cash flow 10 25 31 37 48Equity raised/(bought back) 0 0 0 0 0Dividends paid -16 -18 -29 -28 -35Net inc/(dec) in borrowings 1 -11 0 0 0Other investing/financing cash flows -2 -33 0 0 0Net cash flow -7 -37 2 9 13Change in working capital 102 122 139 157 174
Balance Sheet (USDm) Cash and other liquid assets 52 15 17 26 39Tangible fixed assets 79 102 100 96 90Goodwill/intangible assets 0 0 0 0 0Associates/investments 0 22 20 18 19Other assets 136 183 221 262 304Total assets 266 322 358 403 452Interest bearing debt 46 36 36 36 36Other liabilities 46 65 93 119 146Total liabilities 92 101 129 155 182Shareholders' equity 174 221 229 248 271Minorities 0 0 0 0 0Total shareholders' equity 174 221 229 248 271Net debt -5 21 18 9 -3
Key Company Metrics Sales growth (%) nm 18.9 33.6 25.3 20.1DB EPS growth (%) na 34.7 30.7 26.8 22.5EBITDA Margin (%) 14.7 16.6 15.7 15.1 14.4EBIT Margin (%) 11.4 13.3 13.1 13.0 12.5Payout ratio (%) 75.1 102.3 75.0 75.0 75.0ROE (%) 12.1 14.3 16.5 19.7 22.2Capex/sales (%) 2.2 2.2 2.1 1.2 0.9Capex/depreciation (x) 0.7 0.7 0.8 0.6 0.5Net debt/equity (%) -3.1 9.3 8.1 3.7 -1.2Net interest cover (x) 127.7 44.8 29.0 39.3 77.8
Source: Company data, Deutsche Bank estimates
Model updated:04 June 2008
Running the numbers Asia Singapore Food & Beverage
Del Monte Pacific Reuters: DMPL.SI Bloomberg: DELM SP
Buy Price (4 Jun 08) SGD 0.70
Target price SGD 0.90
52-week Range SGD 0.48 - 0.80 Market Cap (m) SGDm 757 USDm 555
Company Profile Del Monte Pacific Limited owns the Del Monte trademark inthe Philippines and Indian subcontinent. The company'soperations are there and also in China.
Price Performance
000111
Jun 06 Nov 06 M ay 07 Nov 07 M ay 08
Del Mont e Pacif ic St rait s Times Index (Rebased)
Margin Trends
0
5
10
15
20
06 07 08E 09E 10E
EBITDA Margin EBIT Margin
Growth & Profitability
0
10
20
30
40
06 07 08E 09E 10E0510152025
Sales growt h (LHS) ROE (RHS)
Solvency
-5
0
5
10
06 07 08E 09E 10E0
50
100
150
Net debt / equit y (LHS) Net int erest cover (RHS)
James Tan +65 6423 5139 [email protected]

4 June 2008 Food & Beverage Del Monte Pacific
Deutsche Bank AG/Hong Kong Page 3
Investment thesis Outlook
Del Monte Pacific owns the Del Monte brand in the Philippines and the Indian subcontinent. It enjoys leading market shares in fruit beverages and processed/mixed fruit such as pineapple juice and canned pineapple, and condiments such as tomato sauce, spaghetti sauce and ketchup. With its own 20,000 hectare plantation and pineapple cooperatives in the Philippines, the company owns a significant part of the world’s processed pineapple production and is a global low-cost producer of pineapples.
NutriGroup Asia acquired Del Monte Pacific in 2006, and the new management team has started to turn the company around through cost-cutting initiatives. The next phase of growth is to roll out a new fresh fruit business and seize overseas market opportunities in premium quality processed fruit and vegetables through its newly acquired brand, S&W.
The S&W brand acquisition allows Del Monte Pacific scope for product line expansion and global market penetration. The company aims to expand its branded and private label business in Asia and the Indian subcontinent with the recent acquisition of the S&W brand and FieldFresh Foods in India. The company is transforming itself into a branded consumer products company with a global reach through these acquisitions and initiatives.
The company aims to: (1) grow organically in the Philippine market with its new beverage product Fit ’n Right and double its nationwide store coverage within three years; (2) increase its fresh fruit business worldwide; and (3) expand its export business by extending the S&W brand globally.
Valuation
We value Del Monte Pacific using a discounted cash flow (DCF) methodology, arriving at a 12-month TP of S$0.90. This is based on an 9.1% WACC, assuming 10.9% risk-free rate, equity risk premium of 4.6%, and 0.3 beta based on DB’s cost of capital in the Philippines to derive our cost of equity of 9.1%. Our terminal growth rate of 1.0% is based on long-term economic growth.
Our TP implies 15.2x FY09E PE and the stock is currently trading at 11.8x FY09E PE. Its peer group is trading at an average of 13.3x FY09E PE. The stock has traded at a high of 30x PE, and on an average PE of 13.4x. We believe that the stock warrants a higher PE multiple due to its stronger earnings CAGR compared with peers. The multiple implies a PEG of around 0.5.
Risks
Risks to our view include competition (branded and private label), a rise in input costs (raw materials and packaging), fluctuations between the Philippines peso and the US dollar, outcome of ongoing litigation with Fresh Del Monte Produce Inc and the execution of its new ventures – S&W and FieldFresh.
Turnaround story in
progress, with new
management initiatives
driving the transformation
into a global branded
consumer company
Acquisition of S&W and
FieldFresh driving growth in
the Asia Pacific
Outlook and strategy
DCF-based TP of S$0.90
Competition, forex, litigation
and execution are key risks

4 June 2008 Food & Beverage Del Monte Pacific
Page 4 Deutsche Bank AG/Hong Kong
Table of Contents
Processed food industry ................................................................... 5 Philippines – domestic operations ............................................................................................5 Philippines – market share of sauces........................................................................................6 Philippines – market share of canned food ...............................................................................6
Beverage industry.............................................................................. 7 Philippines -market share of juices............................................................................................ 7 China – Great Lakes ..................................................................................................................8 India – expanding its Del Monte brand and JV business...........................................................8
Non-processed food industry........................................................... 9 Del Monte's non-processed food business ..............................................................................9
New management driving new initiatives .................................... 10 NutriAsia has extensive experience in the Philippines ............................................................ 10 Doubling its store coverage in the Philippines ........................................................................ 11 Amended its long-term supply contracts ................................................................................ 11
Competitive strengths .................................................................... 12 Del Monte Pacific's integrated operations.............................................................................. 12
Financial forecasts........................................................................... 13 Key assumptions..................................................................................................................... 13 Financial Statements............................................................................................................... 14
Valuation .......................................................................................... 16 DCF valuation at S$0.90.......................................................................................................... 16 Peer valuation comparison...................................................................................................... 17
Risks.................................................................................................. 18
Company background ..................................................................... 19 Business overview.................................................................................................................. 19 Del Monte Brand History ........................................................................................................ 19 S&W brand history.................................................................................................................. 20 Management profile................................................................................................................ 20
Appendix A....................................................................................... 21 Extension of its brand portfolio ............................................................................................... 21

4 June 2008 Food & Beverage Del Monte Pacific
Deutsche Bank AG/Hong Kong Page 5
Processed food industry Philippines – domestic operations
Figure 1: Del Monte Pacific’s processed
segment from FY07-10E
Figure 2: Geographical revenue
contribution by region/country in FY08E
0.0
50.0
100.0
150.0
200.0
250.0
300.0
350.0
400.0
450.0
2007 2008E 2009E 2010E
0.0%
5.0%
10.0%
15.0%
20.0%
25.0%
30.0%
35.0%
40.0%Revenue EBIT Grow th(US$m) (% YoY) Europe
7%North
America16%
Asia Pacific14%
Philippines63%
Source: Company data, Deutsche Bank Source: Deutsche Bank
In 2007, the company’s revenue of processed products increased by 17.1% YoY to US$194.1m driven by higher sales of tomato-based products and processed pineapples. The company’s processed product segment makes up the lion’s share of revenue, accounting for 67% of turnover and 74% of EBIT for FY07. As shown in Figure 1, we forecast CAGR growth of 26.2% for revenue and 22.7% for earnings in the company’s processed segment from FY07-10E. Figure 2 shows the geographical revenue contribution by region/country in FY08E. The Philippines is the largest market for the company deriving 63% of the company’s revenue, followed by North America at 16%, the Asia Pacific at 14%, and Europe at 7%. On the domestic front, we believe that the growth of the company’s processed segment will come from the company’s shift from two national distributors to 18 regional distributors; this will enable broader distribution of both new and existing products.
Figure 3: Del Monte Pacific’s market share of processed products in the Philippines
66.0%
68.0%
70.0%
72.0%
74.0%
76.0%
78.0%
80.0%
82.0%
84.0%
86.0%
88.0%
Canned Fruits Canned Juices Tomato & Spaghetti Sauce
(%)
Source: Deutsche Bank, Company (2007)
Datamonitor forecasts Philippines canned food sales CAGR of only 2.4%, from US$337.6m in 2007 to US$362.8m in 2010. We believe that the company will be able to grow faster than the segment due to its new product pipeline and increased store coverage from 68,000 to 140,000 from FY07-10E, a CAGR of 27.2%.
We forecast CAGR of 26.2%
in revenue and 22.7% in
earnings in the processed
segment for FY07-10E
Del Monte Pacific holds a
dominant market share of
several processed products
in the Philippines: 73.6% for
tomato & spaghetti sauce,
86.2% for canned juices and
79.0% for canned fruit in
2007

4 June 2008 Food & Beverage Del Monte Pacific
Page 6 Deutsche Bank AG/Hong Kong
Philippines – market share of sauces
Figure 4: Del Monte % share of total
sauces
Figure 5: Del Monte % share of total
culinary
0.0%10.0%20.0%30.0%40.0%
50.0%60.0%70.0%80.0%90.0%
2003 2004 2005 2006 2007
Del Monte Others(%)
0.0%
20.0%
40.0%
60.0%
80.0%
100.0%
2003 2004 2005 2006 2007
Del Monte Others(%)
Source: Deutsche Bank, Company Source: Deutsche Bank, Company
The company currently dominates categories such as total sauces, ready-to-drink canned juice and total canned fruit. In 2007, the market size of total sauces in the Philippines was estimated to be US$65.1m, of which Del Monte Pacific had a 73.6% market share. The entire culinary segment is estimated to be worth US$511.6 in 2007 and Del Monte Pacific has steadily increased its market share from, 12.8% in 2006 to 13.0% in 2007.
Philippines – market share of canned food
Figure 6: Del Monte share of total canned
fruit
Figure 7: Del Monte share of total snacks
0.0%10.0%20.0%30.0%40.0%50.0%60.0%70.0%80.0%90.0%
2003 2004 2005 2006 2007
Del Monte Others(%)
0.0%
20.0%
40.0%
60.0%
80.0%
100.0%
2003 2004 2005 2006 2007
Del Monte Others(%)
Source: Deutsche Bank, Company Source: Deutsche Bank, Company
The total canned fruit segment in the Philippines was estimated to be US$46.5m, with Del Monte Pacific making up 79.0% of the canned fruit segment. The company plans to target the total snacks market, which is estimated to be worth US$558.1m, by expanding its product range to increase its market share. Del Monte Pacific currently has a steady 6.0% share of the total snacks market in the Philippines.
Del Monte Pacific is looking
to capture bigger markets
such as culinary and total
snacks for more growth
potential.

4 June 2008 Food & Beverage Del Monte Pacific
Deutsche Bank AG/Hong Kong Page 7
Beverage industry Philippines -market share of juices
Figure 8: Revenue and EBIT forecast from
FY07-10E
Figure 9: Del Monte % share of total
ready-to-drink canned juices
0.0
20.0
40.0
60.0
80.0
100.0
120.0
140.0
160.0
2007 2008E 2009E 2010E
0.0%
5.0%
10.0%
15.0%
20.0%
25.0%
30.0%
35.0%Revenue EBIT Growth(US$m) (% YoY)
01020
30405060
708090
2003 2004 2005 2006
Del Monte Others(%)
Source: Deutsche Bank, Company Source: Deutsche Bank, Company
Our earnings model forecasts Del Monte Pacific’s beverage revenue to grow 24.9% and EBIT to rise at a 23.6% CAGR from FY07-10E. Even though the soft drink market is showing signs of reaching maturity, Del Monte Pacific has shifted its focus to healthier drinks to increase its market share. Historically, beverages made up 32% and 24% of the company’s revenue and EBIT, respectively.
The company’s beverage lineup consists of juice drinks, purees and juice concentrates. Del Monte Pacific’s new Fit ’n Right beverage is marketed as a fruit juice with weight loss ingredients. When the company re-launched Fit’n Right last year, product sales in 2007 had exceeded management’s target. Management plans to double the production capacity of its Fit’n Right beverage this year. We believe that Fit’n Right, along with non-carbonated juice beverages in Del Monte Pacific’s product line, will continue to drive beverage market penetration.
Figure 10: Soft drink market growth
globally and in the Philippines
Figure 11: Soft drinks vs. carbonated
drinks growth globally
0.0%
1.0%
2.0%
3.0%
4.0%
5.0%
6.0%
7.0%
8.0%
9.0%
10.0%
2006 2007E 2008E 2009E 2010E
Global The Philippines(% growth YoY)
0.0%
0.5%
1.0%
1.5%
2.0%
2.5%
3.0%
3.5%
4.0%
2006 2007 2008E 2009E 2010E 2011E
Carbonated Drink Overall Soft Drinks(% growth YoY)
Source: Deutsche Bank, National Statistics Office, Philippine Department of Trade and Industry, BMI Source: Deutsche Bank, Datamonitor
Soft drink sales in the Philippines grew faster than global soft drink sales and should continue to do so. Soft drink sales in the Philippines reached US$698.4m in 2007. BMI estimates that sales will grow to US$819.7m in 2010, with a CAGR of 5.5%. In 2007, beverage turnover for the company increased 26.8% YoY to US$92.0m. The main growth driver for the company’s beverage segment will come from its new product, Fit’n Right.
The company’s latest
product, Fit’ n Right
beverage, was launched in
4Q06. The response has
been strong; sales hit
US$10m in FY07
Fit ‘n Right was first
marketed in single-serve
cans and expanded to the
PET format in Oct 2007
Global carbonated drinks
grew at only 0.5% for 2007,
while the global soft drink
value grew at 2.6%

4 June 2008 Food & Beverage Del Monte Pacific
Page 8 Deutsche Bank AG/Hong Kong
China – Great Lakes
Improving economic conditions in India and China continue to drive the rapid development of the food processing industry. First, the growing middle class in each country increasingly prefers processed food due to the ease, speed and convenience with which meals can be prepared. Second, an increasing number of women who would have traditionally prepared food at home are entering the workforce to earn additional wages for the family. Third, migration from rural to urban areas is resulting in lifestyle and dietary changes. Finally, rising disposable income means that people are spending more on higher-value food such as meat, fruits and vegetables.
Figure 12: Total soft drink sales by
category in China in 2005
Figure 13: Total soft drink sales by
category in China in 2010E
Ready-to-drink tea, 19.5%
Ready-to-drink coffee, 0.1%
Concentrates,9.5%
Functional drinks, 7.1%
Bottled water, 15.1%
Fruit and vegetable
juices, 25.4%
Carbonates, 17.8%
Other Asian Speciality
drinks, 5.5%
Ready-to-drink
tea, 17.2%
Ready-to-drink coffee, 0.1%
Concentrates, 8.7%
Functional drinks, 6.7%
Bottled w ater, 17.7%
Fruit and vegetable
juices, 29.8%
Carbonates, 14.5%
Other Asian Speciality
drinks, 5.3%
Source: Deutsche Bank, Euromonitor Source: Deutsche Bank, Euromonitor
In Figure 12 and 13 show total off-trade soft drink sales by category in China in 2005 and 2010E. Fruit and vegetable juices increased their share of overall soft drinks sales, from 19.5% in 2000 to 25.4% in 2005, and according to Euromonitor’s forecast, should increase to 29.8% in 2010.
Del Monte Pacific has a 100% stake in one of the leading Chinese juice brand, Great Lakes, which produces, markets and distributes juice under the Great Lakes, Ming Lang, Rougemont and Welch’s brands. Great Lakes’ turnover in 2007 grew a healthy 22% due to strong domestic sales. Its leading juice brand, Great Lakes, together with licensed brands Rougemont, and Welch’s performed well compared with 2006. However, Great Lakes is still making losses as prices of imported orange juice concentrate and apples continue to remain high.
India – expanding its Del Monte brand and JV business
In 2007, Del Monte Foods India expanded its sales of fruit purees – mango, guava and papaya worldwide, exporting to diverse markets such as North America, Europe, Africa, the Middle East and the Asia Pacific. The company has turned around the business and achieved breakeven at the operating income level by streamlining operations and increasing production capacity during the 2007 mango season.
In 2007, Del Monte Pacific acquired 40.1% of FieldFresh Foods in India, a fresh produce grower and marketer that is part of the Bharti group, for US$22.5m. Del Monte Pacific’s stake in the joint venture will help develop the Del Monte Brand and expand distribution channels for exports. The Bharti group’s local expertise and leadership position and Del Monte Pacific’s product line should make a healthy combination.
Emerging markets present
opportunities for earnings
growth
Euromonitor expects that
the fruit and vegetable
juices market in China will
continue to grow at a 14.5%
CAGR to 19.1bn liters in
2012
Partnering with local leading
leader: FieldFresh

4 June 2008 Food & Beverage Del Monte Pacific
Deutsche Bank AG/Hong Kong Page 9
Non-processed food industry Del Monte's non-processed food business
Figure 14: Revenue and EBIT forecast from FY07-10E
0.0
2.0
4.0
6.0
8.0
10.0
12.0
14.0
2007 2008E 2009E 2010E
-60.0%
-40.0%
-20.0%
0.0%
20.0%
40.0%
60.0%
80.0%
100.0%
120.0%
Revenue EBIT Grow th(US$m)(% YoY)
Source: Company data, Deutsche Bank
In 2007, Del Monte Pacific’s non-processed products (consisting of fresh pineapple and non-core cattle business) accounted for US$3.4m in revenue and US$0.8m in EBIT, or 2.1% of FY07 EBIT. The outlook for fresh pineapple is good, with strong pricing for pineapples expected to double and volumes to increase due to higher production from Del Monte’s own and contract pineapple plantations. Del Monte Pacific owns about 20,000 hectares of pineapple plantations and has an additional 1,200 hectares with contract farmers. The company plans to increase the land with contract farmers from 1,200 to 4,500 hectares in the next three years.
Figure 15: Top producers of fresh pineapple in 2006
Thailand, 11%
Philippines, 11%
Brazil , 11%China, 10%
India, 9%
Nigeria, 6%
Costa Rica, 5%
Mexico, 5%Indonesia, 4% Kenya, 3%
Source: Deutsche Bank, FAO
In 2006, the total world production of pineapples was around 15.0m tons. The Philippines was the second-largest producer of fresh pineapples with annual production of 1.7 m tons and has an 11% market share. The Philippines’ export of harvested fresh pineapple totaled US$262m in 2006, growing by a healthy 25.8% from US$210.8m in 2005.
Del Monte’s non-processed
food consists of fresh
pineapple and the non-core
cattle business

4 June 2008 Food & Beverage Del Monte Pacific
Page 10 Deutsche Bank AG/Hong Kong
New management driving new initiatives NutriAsia has extensive experience in the Philippines
Since the new management team took over in early 2006, the company has undergone extensive restructuring to drive sales and reduce costs. New management, under the leadership of J.D. Campos, Jr., has a deep understanding of the Del Monte business, whose holding company NutriAsia owns SAFI, the largest sauces and condiments company in the Philippines. The new management has a hands-on style and is committed to finding new growth avenues and driving cost saving initiatives and efficiencies. The company will continue to benefit from the cost initiatives put in place last year, i.e. the full year impact of using PET juice packaging instead of tinplate, and the impact of price hikes for some of its products in November 2007.
Del Monte Pacific has renewed its contracts with distributors to carry inventory of their finished products, allowing it to reduce its number of warehouses from 12 to three. The contract renewals also reduce working capital, allowing for further cost savings. The company used to rely on only one supplier for its tinplate sourcing but has recently added a supplier. In addition, the company has also looked into joint procurement with NutriAsia for its raw materials and the outsourcing of more of its lower margin business such as pineapple harvesting.
In 2007, Del Monte Pacific secured contracts to supply fresh pineapple juice to two fast food chains in the Philippines: McDonald’s, the world leader and Jollibee, a leading national chain. McDonald’s currently operates 180 company-owned branches in the Philippines and Jollibee operates over 620 stores. We believe that the contract will provide Del Monte Pacific with additional future revenue stream. In addition, the company has started to supply fresh pineapple to the food service sector and has partnered with a strong distributor who supplies fruit and vegetables to a number of airlines. Currently, about 18 airlines serve the company’s fruit to passengers daily.
In November 2007, the company acquired the S&W brand from Del Monte Foods (DLM US; non rated) for all markets with the exception of North and South America, Australia and New Zealand, for US$10m. With this acquisition, Del Monte Pacific is transforming itself into a global market-oriented company. The acquisition of S&W allows Del Monte Pacific to expand its food product line globally whereas before it was limited to operations in the Philippines and the Indian subcontinent. Processed and non-processed food accounted for US$197.5m in turnover in 2007, mainly from the Philippines. In 2007, if S&W sales were to be annualized, sales for the company would have been US$8m. The company believes that cost synergies can be attained by manufacturing the S&W brand in-house wherever possible and tapping the marketing expertise of Del Monte Pacific to grow the label in the region.
Cost savings in reduction of
warehouses and working
capital and greater cost
efficiencies by expanding
the supplier base
Del Monte secured deals
with McDonald’s and
Jollibee in the Philippines in
2007 with contribution to
begin from 2007
The S&W brand originated
in the USA in 1896 as a
producer and marketer of
premium quality processed
fruit and vegetables

4 June 2008 Food & Beverage Del Monte Pacific
Deutsche Bank AG/Hong Kong Page 11
Doubling its store coverage in the Philippines
Figure 16: Expansion of distribution channels in FY07-10E
0
20000
40000
60000
80000
100000
120000
140000
160000
FY07 FY08E FY09E FY10E
0
0.1
0.2
0.3
0.4
0.5
0.6
Store Grow th YoY(Stores) (Growth YoY %)
Source: Company data, Deutsche Bank
The company could double its nationwide store coverage within three years. In 2007, management decided to switch from two national distributors to 18 regional distributors in the Philippines to increase its nationwide store coverage. In May 2007, the company had nationwide store coverage of 28,000 stores in the Philippines (4.7% market coverage, based on an estimated 600,000 stores nationwide); by the end of the year, this number had increased to 64,000 stores (10.7% market coverage). We believe that the company should be able to increase its stores from 68,000 to 140,000 from FY07-10E and more than double its market coverage to 23.3%. We believe the increase in store coverage and penetration should help drive sales growth for the company.
Amended its long-term supply contracts
Figure 17: Changes to its supply contracts Supply contract with: Markets Status
Del Monte Foods USA Amended in Oct 2006
Fresh Del Monte Europe, Middle East and Africa Served notice of termination in May 2007
Fresh Del Monte Globally for fresh products Amended in Feb 2007
Del Monte Asia Asia New contract in Jan 2007 Source: Deutsche Bank, Company
Supply contracts with Del Monte brand owners. Del Monte Pacific has long-term supply contracts with Del Monte brand owners (Del Monte Foods, Fresh Del Monte and Del Monte Asia). Contracts may be terminated with three years’ notice due to the three-year growing cycle of pineapples. The contract with Del Monte Foods was amended in Oct 2006, retroactive to Jan 2006, which clarified and enforced cost floor provision. Del Monte Pacific served notice of termination in May 2007 for processed food and amended its fresh produce contract in Feb 2007 to raise pineapple prices and shift in variety. The contract with Del Monte Asia was renewed in Jan 2007 with reduced prices, in exchange for direct access to private label in Asia ex Japan.
Del Monte amended its
supply contracts to allow for
higher volume of outside
supply contracts of fruit in
cups

4 June 2008 Food & Beverage Del Monte Pacific
Page 12 Deutsche Bank AG/Hong Kong
Competitive strengths Del Monte Pacific's integrated operations
Figure 18: Value chain
Plantation owner Cannery 18 regional distributors
End marketsRaw materials
Del Monte Pacific integrated operations
Processing Distribution networks in Philippines, Asia and Intl markets
Key International customers
End customers
Plantation owner Cannery 18 regional distributors
End marketsRaw materials
Del Monte Pacific integrated operations
Processing Distribution networks in Philippines, Asia and Intl markets
Key International customers
End customers
Source: Deutsche Bank, company
We believe the management’s business strategy will have a positive impact on the company’s outlook. By leveraging the S&W brand, Del Monte Pacific is well-positioned to enter new global markets. The transformation into a branded consumer products company will establish Del Monte Pacific as a globally market-oriented company and help expand products and processes into new markets. Finally, management’s business strategy will diversify its business segments; increase its geographical markets, branded consumer products, and fruit and vegetable production distribution capacity.
Del Monte Pacific operates one of the world’s largest, fully integrated pineapple operations in the Philippines and is a global low-cost producer of pineapples. It operates a plantation of approximately 20,000 hectares at northern Mindanao, Philippines and runs a cannery that processes some 700,000 tpa of pineapples.
S&W, an internationally recognised fruit and vegetable products brand, was founded in the USA in 1896. Before acquiring the S&W brand, Del Monte Pacific was restricted to markets in the Philippines and Indian subcontinent and only sold products under the Del Monte brand. We believe the acquisition of the S&W brand will release Del Monte Pacific from these restrictions and increase its opportunity to enter new markets and introduce product lines.
The Bharti group is one of India’s well-respected and leading companies with business operations spanning from telecom to retail. In 2007, Del Monte Pacific formed a joint venture with the Bharti group to capitalise on India’s rapid growing fruit and vegetable industry. Del Monte Pacific’s 40.1% stake in the joint venture will help develop the Del Monte Brand and expand distribution channels for export. The Bharti group’s local expertise and leadership position along with Del Monte Pacific’ product line will make a healthy combination for growth.
The current senior management team has food industry experience ranging from 20-25 years at multinational corporations. In 2007, many senior positions in key areas were filled by talented individuals from multinational corporations to support long-term aggressive growth plans. Management also created initiatives to improve productivity and efficiency, implement a Sales Information System, and also targets to bring working capital down to zero in 3 years time. We see the hiring of food industry veterans into Del Monte Pacific and the initiatives they have introduced as leading the organisation in the right direction.
Global market-oriented
Vertically integrated
pineapple operations
Globally recognised brand
Partnering leading local
businesses
Current management of Del
Monte Pacific driving key
areas of growth
4 June 2008 Food & Beverage Del Monte Pacific
Deutsche Bank AG/Hong Kong Page 13
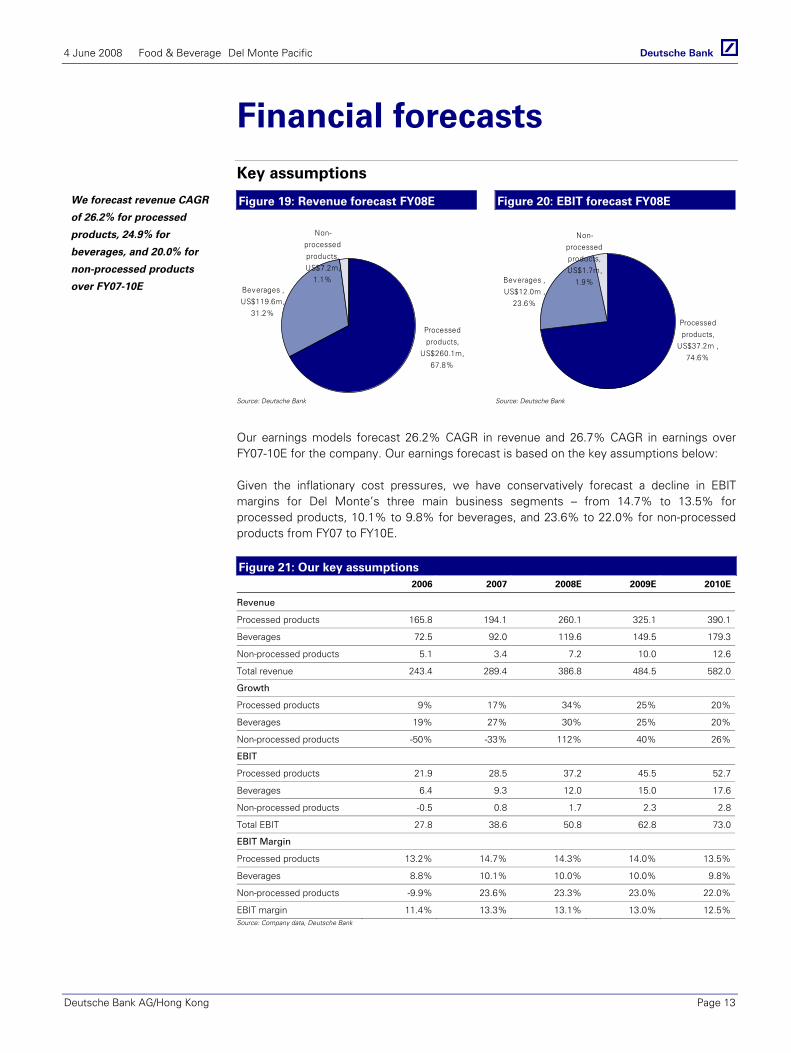
Financial forecasts Key assumptions
Figure 19: Revenue forecast FY08E Figure 20: EBIT forecast FY08E
Processed products,
US$260.1m, 67.8%
Beverages , US$119.6m,
31.2%
Non-processed products, US$7.2m,
1.1%
Processed products,
US$37.2m , 74.6%
Beverages , US$12.0m ,
23.6%
Non-processed products, US$1.7m,
1.9%
Source: Deutsche Bank Source: Deutsche Bank
Our earnings models forecast 26.2% CAGR in revenue and 26.7% CAGR in earnings over FY07-10E for the company. Our earnings forecast is based on the key assumptions below:
Given the inflationary cost pressures, we have conservatively forecast a decline in EBIT margins for Del Monte’s three main business segments – from 14.7% to 13.5% for processed products, 10.1% to 9.8% for beverages, and 23.6% to 22.0% for non-processed products from FY07 to FY10E.
Figure 21: Our key assumptions 2006 2007 2008E 2009E 2010E
Revenue
Processed products 165.8 194.1 260.1 325.1 390.1
Beverages 72.5 92.0 119.6 149.5 179.3
Non-processed products 5.1 3.4 7.2 10.0 12.6
Total revenue 243.4 289.4 386.8 484.5 582.0
Growth
Processed products 9% 17% 34% 25% 20%
Beverages 19% 27% 30% 25% 20%
Non-processed products -50% -33% 112% 40% 26%
EBIT
Processed products 21.9 28.5 37.2 45.5 52.7
Beverages 6.4 9.3 12.0 15.0 17.6
Non-processed products -0.5 0.8 1.7 2.3 2.8
Total EBIT 27.8 38.6 50.8 62.8 73.0
EBIT Margin
Processed products 13.2% 14.7% 14.3% 14.0% 13.5%
Beverages 8.8% 10.1% 10.0% 10.0% 9.8%
Non-processed products -9.9% 23.6% 23.3% 23.0% 22.0%
EBIT margin 11.4% 13.3% 13.1% 13.0% 12.5%Source: Company data, Deutsche Bank
We forecast revenue CAGR
of 26.2% for processed
products, 24.9% for
beverages, and 20.0% for
non-processed products
over FY07-10E

4 June 2008 Food & Beverage Del Monte Pacific
Page 14 Deutsche Bank AG/Hong Kong
Financial Statements
Figure 22: Income statement (USDm) 2006 2007 2008E 2009E 2010E
Revenues 243.4 289.4 386.8 484.5 582.0
% change Y/Y 9.5% 18.9% 33.6% 25.3% 20.1%
Gross margin (%) 25.8% 26.1% 25.6% 25.5% 25.0%
EBITDA 35.9 37.6 60.5 73.0 83.7
% change Y/Y 5.0% 4.9% 61.0% 20.5% 14.7%
EBITDA margin (%) 14.7% 13.0% 15.7% 15.1% 14.4%
EBIT 27.8 28.3 50.8 62.8 73.0
% change Y/Y 16.4% 1.8% 79.4% 23.5% 16.3%
EBIT margin (%) 11.4% 9.8% 13.1% 13.0% 12.5%
Net interest -0.2 -0.9 -1.7 -1.6 -0.9
Share of Associates 0.0 -0.6 -2.0 -1.5 1.0
Exceptional Gains/(Losses) 0.0 10.3 0.0 0.0 0.0
Earnings before tax 27.6 37.2 47.1 59.7 73.1
% change Y/Y 23.7% 34.6% 26.7% 26.8% 22.5%
Tax -6.6 1.5 -10.0 -12.7 -15.6
as % of EBT -23.8% 4.0% -21.3% -21.3% -21.3%
Minority Interests – – – – –
Net income 21.0 38.6 37.0 47.0 57.5
Recurring net profit 21.0 28.3 37.0 47.0 57.5
% change Y/Y 16.6% 83.6% -4.1% 26.8% 22.5%Source: Company data, Deutsche Bank
Figure 23: Balance sheet (USDm) 2006 2007 2008E 2009E 2010E
Cash and Cash Equivalents 51.5 15.0 17.1 26.3 38.9
Accounts receivable 46.1 64.4 81.4 102.0 122.5
Inventories 45.2 61.5 82.2 103.0 123.7
Others 44.5 57.4 57.4 57.4 57.4
Current assets 187.4 198.2 238.1 288.7 342.5
LT investments 0.0 0.0 0.0 0.0 0.0
Net fixed assets 78.9 101.7 100.0 95.8 90.1
Intangible assets 0.0 0.0 0.0 0.0 0.0
Other LT assets 0.0 22.0 20.0 18.5 19.5
Total Assets 266.3 321.9 358.1 403.0 452.2
ST bank loans 44.6 34.8 34.8 34.8 34.8
Payables 33.7 60.8 82.3 105.3 129.3
Others 4.1 3.4 10.0 12.7 15.6
Total current liabilities 82.4 99.0 127.1 152.8 179.7
Long term debt 1.5 0.8 0.8 0.8 0.8
Other liabilities 8.5 1.1 1.1 1.1 1.1
Total liabilities 92.4 100.9 129.0 154.7 181.6
Shareholder's equity 173.9 221.1 229.1 248.3 270.6
Total liabilities and equity 266.3 321.9 358.1 403.0 452.2Source: Company data, Deutsche Bank

4 June 2008 Food & Beverage Del Monte Pacific
Deutsche Bank AG/Hong Kong Page 15
Figure 24: Cash flow statements (USDm) 2006 2007 2008E 2009E 2010E
Pre-Tax Profit 27.6 37.2 47.1 59.7 73.1
Tax Paid -8.9 -4.1 -3.4 -10.0 -12.7
Depreciation & amortisation 8.0 9.3 9.7 10.2 10.7
Other non-cash items -1.3 -7.3 -1.4 -8.5 -13.7
Change in working capital -18.7 -7.8 -16.3 -18.3 -17.2
Cash flow from operations 15.7 31.4 39.1 43.0 52.8
CAPEX -5.5 -6.3 -8.0 -6.0 -5.0
Disposal/ (purchase) 0.0 -32.5 0.0 0.0 0.0
Other 1.7 2.4 0.0 0.0 0.0
Cash flow from investing -3.7 -36.5 -8.0 -6.0 -5.0
Equity raised/(repaid) 0.0 0.0 0.0 0.0 0.0
Debt raised/(repaid) 1.0 -10.6 0.0 0.0 0.0
Other -4.0 -3.1 0.0 0.0 0.0
Dividends -15.9 -18.4 -29.0 -27.8 -35.2
Cash flow from financing -18.9 -32.0 -29.0 -27.8 -35.2
Net changes in cash -6.9 -37.1 2.1 9.2 12.6
Currency Adjustments -1.6 0.5 0.0 0.0 0.0
Beginning cash 60.1 51.5 15.0 17.1 26.3
Ending cash 51.5 15.0 17.1 26.3 38.9
DPS (S cts) 2.0 3.6 3.5 4.4 5.4
Free cash flows 10.2 25.1 31.1 37.0 47.8Source: Company data, Deutsche Bank
The major cost components of the company’s cost of goods sold are raw materials making up 40%, followed by tin plate at 20%, other packaging at 20%, labor at 8%, overheads at 7% and energy at 5%. Raw materials are not a concern for the company as it sources the bulk of its pineapples at its own plantations. However, tin plate and packaging costs have been rising. The company typically locks in its tin plate prices for 6 months and is moving more towards plastic bottles instead of tin plate packaging to reduce costs. With packing and tin plate accounting for 40% of the cost of goods, every 1% increase in packaging and tin plate costs could reduce net profit by 2% if the company is unable to pass on the costs.
Figure 25: Breakdown of cost of goods sold in 2007
Raw materials, 40%
Tin plate, 20%
Other packaging, 20%
Labor, 8%
Overheads, 7%Energy, 5%
Source: Deutsche Bank,Company

4 June 2008 Food & Beverage Del Monte Pacific
Page 16 Deutsche Bank AG/Hong Kong
Valuation DCF valuation at S$0.90
Our primary valuation method is using our DCF valuation methodology which is consistent with the valuation framework of DB's F&B/consumer research team as the DCF valuation methodology takes into account the business cycle and long-term profitability of F&B companies Based on our DCF methodology and valuing the company’s cash flows, we arrive at a 12-month TP of S$0.90. This is based on a 9.1% WACC, assuming DB’s estimates for cost of capital in the Philippines, we take a risk-free rate of 10.9%m, equity risk premium of 4.6% and 0.3 beta to derive our cost of equity of 9.1%. Our terminal growth rate is 1%, based on long-term economic growth.
Figure 26: DCF assumptions and TP sensitivity Assumptions Terminal growth rate
Risk free rate 10.9% DB COE methodology WACC -1% 0% 1% 2% 3%
Cost of debt 4.6% DB COE methodology 10.0% 0.69 0.73 0.79 0.86 0.96
Tax rate % 21.0% Forecast tax rate 9.0% 0.77 0.83 0.91 1.01 1.14
Expected market return 4.6% DB COE methodology 9.1% 0.76 0.83 0.90 1.00 1.13
Current beta 0.3 Historical average 8.0% 0.80 0.88 0.98 1.11 1.30
Target debt/equity ratio 0.0% Net cash in FY10E 7.0% 1.00 1.11 1.26 1.47 1.77
Cost of equity 9.1% Based on CAPM model
WACC 9.1%
Terminal growth 1% Assumed Source: Deutsche Bank
Our TP implies 15.2x FY09E PE and the stock is currently trading at 11.8x FY09E PE. Its peer group is trading at an average of 13.3x FY09E PE. We believe that the multiple is justified given the company’s strong recurring earnings CAGR growth of 26.7%. The multiple implies a PEG of around 0.5.
Figure 27: DCF valuation 2006 2007 2008E 2009E 2010E 2011E 2012E 2013E Terminal
Operating profit 27.8 28.3 50.8 62.8 73.0 85.1 96.1 108.4
Operating profit growth% 2% 79% 24% 16% 17% 13% 13%
Tax rate % 24% -4% 21% 21% 21% 21% 21% 21%
NOPLAT 21.2 29.4 40.0 49.4 57.5 67.0 75.6 85.3
+Depreciation & amortization 8.0 9.3 9.7 10.2 10.7 11.2 11.7 12.3
+(Increase)/decrease in working capital
(18.7) (7.8) (16.3) (18.3) (17.2) 15.0 (13.7) (15.6)
-Capex (5.5) (6.3) (8.0) (6.0) (5.0) (5.0) (5.0) (5.0)
FCFF 5.1 24.6 25.5 35.3 45.9 88.2 68.7 77.1 964.1
Discounted FCFF 23.3 29.6 35.4 62.3 44.5 45.8 524.9
Sum of Discounted FCFF to FY08E 765.8
Net Cash as at FY08E (18.5)
Fair Value of Equity (at end FY08E) 747
Total outstanding shares (m) 1,082
Forex Conversion 1.30
Fair Equity Value/Share (S$) 0.90 Source: Deutsche Bank
We use WACC of 9.1%

4 June 2008 Food & Beverage Del Monte Pacific
Deutsche Bank AG/Hong Kong Page 17
Peer valuation comparison
Figure 28: Peer valuation comparable Regional F&B companies
Company Name Ticker Price Mkt Cap Yield P/B P/S P/E ROE Liquidity Price Movement
($) (US$MM) (%) (x) (x) FY07 FY08E FY09E (%) (US$MM) 5D 3M 12M
Cerebos Pacific CER 3.83 920 6.5 3.6 1.5 14.3 13.7 12.4 23.3 0.0 1.3 -3.0 8.9
China Huiyuan Juice Group 1886 5.85 1131 2.1 na 2.7 11.1 19.6 15.3 14.3 0.2 -3.2 -6.1 -34.5
Dutch Lady Milk DLM 12.70 270 4.4 6.1 1.3 21.1 17.2 14.8 38.1 0.0 0.8 0.8 12.5
Jollibee Foods Corp JFC 42.00 1020 2.0 3.3 na 18.2 16.1 13.9 22.2 0.0 -2.3 -9.9 -23.0
Lam Soon PCL LST 4.78 257 2.1 2.2 0.5 14.1 12.6 14.7 11.0 2.2 -5.6 68.7 149.7
Nestle Bhd NESZ 29.50 2296 6.6 9.5 1.7 21.9 21.5 20.0 48.8 0.0 -0.8 19.8 30.2
Petra Foods PETRA 1.02 414 2.9 2.1 0.4 17.9 13.8 10.7 14.6 0.3 -15.5 -22.1 -43.5
Singapore Food Industries SFI 0.79 311 6.3 2.5 0.6 11.8 11.0 10.1 20.7 0.1 1.3 7.4 -9.0
Universal Robina Corp URC 13.25 686 5.1 0.9 0.8 5.3 9.3 8.0 17.2 0.0 0.0 -0.6 -13.0
Peer average 812 4.2 3.8 1.2 15.1 15.0 13.3 23.3 0.3 -2.7 6.1 8.7
Global F&B companies
Del Monte Foods Co DLM 8.63 1702 1.9 1.2 0.5 12.9 12.2 11.4 8.1 1.1 0.8 -6.3 -27.3
Fresh Del Monte FDP 29.27 244 0.0 1.3 0.5 8.5 9.0 8.9 -13.4 0.1 3.5 -13.6 17.9
Kikkoman Corp 2801 1290.0 2544 1.2 1.5 0.6 21.8 56.6 na 6.7 0.0 -1.5 9.2 -28.4
Kraft Foods Inc KFT 32.05 48589 3.3 2.0 1.3 17.6 16.7 15.6 9.3 8.1 -0.7 3.6 -3.9
Peer average 13270 1.6 1.5 0.7 15.2 12.6 12.0 2.7 2.3 0.5 -1.8 -10.4
Del Monte Pacific Limited DELM 0.70 578 5.0 2.4 1.4 14.7 15.0 11.8 16.5 0.2 3.0 16.6 9.0Source: Deutsche Bank, Company data, Bloomberg priced as at 4 June 2008.
Regional F&B peers are trading at 15.0x and 13.3x FY08-09E PE whereas global F&B companies, which include brand owners of the Del Monte brand, are trading at 12.6x and 12.0x FY08-09E PE. The stock has traded at a high of 30x PE and at an average of 13.4x PE. We believe that the stock warrants a higher PE multiple due to stronger CAGR in earnings compared with peers.
Figure 29: P/E chart Figure 30: P/B chart
0.00
0.10
0.20
0.30
0.40
0.50
0.60
0.70
0.80
0.90
1.00
1.10
1.20
1.30
1.40
1.50
Date Mar-06 Aug-06 Jan-07 May-07 Oct-07 Feb-08
Share price 5.0x 10.0x 15.0x 20.0x 25.0x(S$)
0.000.100.200.300.400.500.600.700.800.901.001.101.201.301.401.50
Date Mar-06 Aug-06 Jan-07 May-07 Oct-07 Feb-08
Share price 1.0x 2.0x 3.0x 4.0x 5.0x(S$)
Source: Deutsche Bank, Bloomberg priced as at 4 June 2008. Source: Deutsche Bank, Bloomberg priced as at 4 June 2008.
Our TP implies a PE of 15.2x
for FY09E

4 June 2008 Food & Beverage Del Monte Pacific
Page 18 Deutsche Bank AG/Hong Kong
Risks Del Monte has exposure to a number of commodity markets including fruit, vegetables, energy, tinplate and plastic (PET resin). If Del Monte is not be able to pass through sufficient price increases to cover increased costs without a negative effect on volume, sales and profits’ profitability could be affected. With tin plate and other packaging accounting for 40% of the cost of goods, every 1% increase in packaging and tin plate costs could reduce net profit by 2% if the company is unable to pass on the costs.
The company’s output of pineapples at its plantations could be subject to weather conditions. As its plantations sit on a plateau, it’s less susceptible to flooding or La Nina weather conditions but would be more susceptible to drought or El Nino. The last major occurrence of El Nino was in 1999 where the company’s plantations experienced a lower crop tonnage. A severe drought could affect the company’s pineapple yield and have a negative impact on the company’s profitability.
As 40-50% of the company’s total revenue is derived from the Philippines market and the company’s cost structure denominated in local currency, an appreciation of the Philippines peso against the US dollar could lead to higher costs and a squeeze in gross margins.
In May 2008, Fresh Del Monte Produce Inc filed a complaint against Del Monte Pacific in the US District Court, Southern District of New York, over an alleged breach of contract and claimed damages of US$100m. FDM is the licensee of the Del Monte brand for processed products in Europe, the Middle East and Africa, and for fresh produce worldwide. FDM alleged that Del Monte Pacific had sold Del Monte processed products in FDM’s territory. The complaint relates to two contested shipments. In the past, there were two lawsuits of a similar nature with Fresh Del Monte produce which were settled amicably. Del Monte Pacific believes that the claims are without merit and will contest them vigorously without prejudice to actions it may take against FDM. However, an unfavourable outcome from the litigation with FDM could have a negative impact on the company.
The company may fail to successfully implement its growth strategy (acquisition of S&W and joint venture with FieldFresh), possibly resulting in lower sales projections and decreased earnings.
Exposure to fluctuations in
prices of raw materials
Foreign exchange risk
between the peso and the
US dollar
The company has ongoing
litigation with Fresh Del
Monte Produce (FDM)
Execution risk associated
with new ventures – S&W
and FieldFresh

4 June 2008 Food & Beverage Del Monte Pacific
Deutsche Bank AG/Hong Kong Page 19
Company background Business overview
Del Monte Pacific Limited is a leading group of companies that provides branded fruit and vegetable products to consumers around the world. The company has operations in the Philippines, the Indian subcontinent, and China. In the Philippines, through its Del Monte brand and second tier brand, Today’s, the group holds a leading market share in canned food products. Del Monte Pacific’s brand portfolio includes Del Monte, S&W, FieldFresh, Today’s, Great Lakes, Ming Lang and Little Lakes.
Del Monte Pacific Limited is committed to strengthening its reputation among consumers as a premium quality, healthy fruit and vegetable company. The group owns the S&W trademark globally (except for Americas, Australia and New Zealand), which is well-known for its premium canned fruit and vegetable products. NutriAsia Pacific Ltd (NPL), under the parent company NutriAsia Group of Companies, owns 78.5% of Del Monte Pacific Limited.
Del Monte Brand History
Figure 31: Del Monte brand and Del Monte Pacific Timeline Del Monte Pacific Limited history and the Del Monte Brand
1892 Del Monte brand originated in the USA
1926 Del Monte Foods (USA) set up operations in the Philippines to move away from disease-affected Hawaiian pineapple plantation
1990 In the biggest LBO at that time, KKR took over RJR Nabisco (then owner of Del Monte Foods). The Del Monte brand was disaggregated and sold to different companies to extract more value.
1991 Del Monte Foods sold its 50% stake in the Philippines unit, Del Monte Philippines, to Del Monte Intl (Europe) and Kikkoman (Japan)
1996 Del Monte Foods and Kikkoman divested to MCI (Philippines) and Del Monte Intl (later became Cirio)
1999 DMPL was incorporated and became the holding company of Del Monte Philippines and was listed on SGX
Dec 2005 MCI and Cirio divested to NutriAsia Pacific Ltd (NPL)
Jan 2006 NPL stake reached 85% after the General Offer
Jul 2007 and Mar 2008 NPL reduced its stake to 79% to increase trading liquidity Source: Deutsche Bank, Company
Del Monte Pacific Limited owns the Del Monte trademark in the Philippines and the brand rights for the Indian subcontinent territories. The company has long-term supply contracts with Del Monte Asia/Kikkoman, Del Monte Foods, Kraft Canada and Del Monte Fresh Produce, all of whom have exclusive rights to the Del Monte trademark in their respective territories or product category.
Figure 32: Del Monte trademark rights around the world Company Markets Product Category
Del Monte Pacific Philippines and Indian subcontinent Processed Food and Beverage
Del Monte Asia/Kikkoman Asia Pacific (ex-Philippines and Indian subcontinent) Processed Food and Beverage
Del Monte Foods USA and South America Processed Food and Beverage
Kraft and CanGro Canada Processed Food and Beverage
Africa, Europe and the Middle East Processed Food and Beverage Del Monte Fresh Produce
Worldwide Fresh Produce Source: Deutsche Bank, Company
4 June 2008 Food & Beverage Del Monte Pacific
Page 20 Deutsche Bank AG/Hong Kong
S&W brand history
The S&W brand was founded in 1896 by three grocery wholesalers from San Francisco -- Samuel Sussman, Gustav Wormser and Samuel Wormser. S&W has grown from a local city brand to one recognised worldwide due to the quality and taste of its products. S&W is recognised as a premium canned-food, dressings and sauces by consumers all over the world.
Management profile
Mr. Joselito D. Campos, Jr. – Managing Director and CEO
Mr. Campos is the current chairman and CEO of the NutriAsia Group of Companies, chairman of Fort Bonifacio Development Corp, vice chairman of Avala-Greenfield Development Corp, and director of FieldFresh Foods Private Ltd. He received his MBA from Cornell University.
Mr. Luis F. Alejandro – COO
With over 20 years’ consumer product operations and management experience, Mr. Alejandro has worked with Procter & Gamble, Kraft Foods Philippines, Southeast Asia Food Inc, NutriAsia Group Inc. and Heinz UFC Philippines. He has a Bachelor’s degree in Economics from the Ateneo de Manila University and an MBA from the Asian Institute of Management.
Mr. Richard W. Blossom – Head of International Markets
With over 25 years’ experience in general management, marketing, sales, distribution and logistics of fast-moving consumer goods, Mr. Blossom has served as president of Pepsi Cola Asia Pacific, PepsiCo Foods Asia Pacific, Revlon Asia Pacific, and CEO of Dohler Asia and EAC Consumer Products. He completed his MBA in Marketing from the Stern School of Business at New York University.
Mr. Ignacio C O Sison – CFO
Mr. Sison has BA in Economics, magna cum laude, from the University of the Philippines, an MA in Economics from the International University of Japan, and an MS in Agricultural Economics from Oxford University. Mr. Ignacio has more than 20 years’ experience in treasury, corporate planning and controllership.
NutriAsia is the holding company of the Campos family and is the market leader in liquid condiments, specialty sauces and cooking oil in the Philippines. Its flagship brand, UFC, has an 85% market share in the local ketchup and hot chilli sauce categories. In 2006, NutriAsia’s stake reached 85% after the general offer and subsequently reduced its stake to 79% to increase trading liquidity in the company. The free float for Del Monte Pacific stands at 21%.
S&W brand is named after
its founders – Samuel
Sussman, Gustav Wormser
and Samuel Wormser
NutriAsia Group of
Companies owns 79% of Del
Monte Pacific

4 June 2008 Food & Beverage Del Monte Pacific
Deutsche Bank AG/Hong Kong Page 21
Appendix A Extension of its brand portfolio
Figure 33: Del Monte Pacific portfolio of brands
Source: Company
4 June 2008 Food & Beverage Del Monte Pacific
Page 22 Deutsche Bank AG/Hong Kong
Appendix 1 Important Disclosures
Additional information available upon request
Disclosure checklist Company Ticker Recent price* Disclosure Del Monte Pacific DMPL.SI 0.70 (SGD) 4 Jun 08 NA *Prices are sourced from local exchanges via Reuters, Bloomberg and other vendors. Data is sourced from Deutsche Bank and subject companies.
For disclosures pertaining to recommendations or estimates made on securities other than the primary subject of this research, please see the most recently published company report or visit our global disclosure look-up page on our website at http://gm.db.com.
Analyst Certification
The views expressed in this report accurately reflect the personal views of the undersigned lead analyst(s) about the subject issuer and the securities of the issuer. In addition, the undersigned lead analyst(s) has not and will not receive any compensation for providing a specific recommendation or view in this report. James Tan
Equity rating key Equity rating dispersion and banking relationships
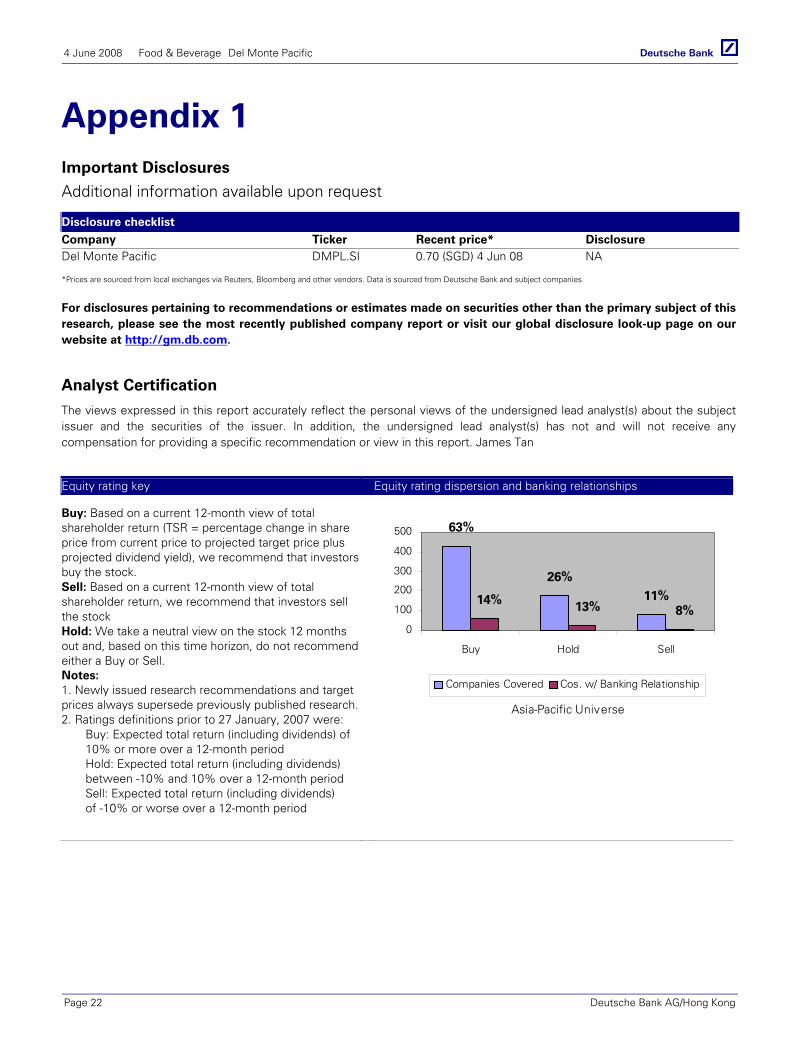
Buy: Based on a current 12-month view of total shareholder return (TSR = percentage change in share price from current price to projected target price plus projected dividend yield), we recommend that investors buy the stock. Sell: Based on a current 12-month view of total shareholder return, we recommend that investors sell the stock Hold: We take a neutral view on the stock 12 months out and, based on this time horizon, do not recommend either a Buy or Sell. Notes: 1. Newly issued research recommendations and target prices always supersede previously published research.2. Ratings definitions prior to 27 January, 2007 were:
Buy: Expected total return (including dividends) of 10% or more over a 12-month period Hold: Expected total return (including dividends) between -10% and 10% over a 12-month period Sell: Expected total return (including dividends) of -10% or worse over a 12-month period
11%26%
63%
8%13%14%
0
100
200
300
400
500
Buy Hold Sell
Asia-Pacific Universe
Companies Covered Cos. w/ Banking Relationship

4 June 2008 Food & Beverage Del Monte Pacific
Deutsche Bank AG/Hong Kong Page 23
Regulatory Disclosures
SOLAR Disclosure
For select companies, Deutsche Bank equity research analysts may identify shorter-term trade opportunities that are consistent or inconsistent with Deutsche Bank's existing longer term ratings. This information is made available only to Deutsche Bank clients, who may access it through the SOLAR stock list, which can be found at http://gm.db.com
Disclosures required by United States laws and regulations
See company-specific disclosures above for any of the following disclosures required for covered companies referred to in this report: acting as a financial advisor, manager or co-manager in a pending transaction; 1% or other ownership; compensation for certain services; types of client relationships; managed/co-managed public offerings in prior periods; directorships; market making and/or specialist role.
The following are additional required disclosures:
Ownership and Material Conflicts of Interest: DBSI prohibits its analysts, persons reporting to analysts and members of their households from owning securities of any company in the analyst's area of coverage. Analyst compensation: Analysts are paid in part based on the profitability of DBSI, which includes investment banking revenues. Analyst as Officer or Director: DBSI policy prohibits its analysts, persons reporting to analysts or members of their households from serving as an officer, director, advisory board member or employee of any company in the analyst's area of coverage. Distribution of ratings: See the distribution of ratings disclosure above. Price Chart: See the price chart, with changes of ratings and price targets in prior periods, above, or, if electronic format or if with respect to multiple companies which are the subject of this report, on the DBSI website at http://gm.db.com.
Additional disclosures required under the laws and regulations of jurisdictions other than the United States
The following disclosures are those required by the jurisdiction indicated, in addition to those already made pursuant to United States laws and regulations. Analyst compensation: Analysts are paid in part based on the profitability of Deutsche Bank AG and its affiliates, which includes investment banking revenues Australia: This research, and any access to it, is intended only for "wholesale clients" within the meaning of the Australian Corporations Act. EU: A general description of how Deutsche Bank AG identifies and manages conflicts of interest in Europe is contained in our public facing policy for managing conflicts of interest in connection with investment research. Disclosures relating to the firm's obligations under MiFiD can be found at http://globalmarkets.db.com/riskdisclosures. Germany: See company-specific disclosures above for holdings of five percent or more of the share capital. In order to prevent or deal with conflicts of interests Deutsche Bank AG has implemented the necessary organisational procedures to comply with legal requirements and regulatory decrees. Adherence to these procedures is monitored by the Compliance-Department. Hong Kong: See http://gm.db.com for company-specific disclosures required under Hong Kong regulations in connection with this research report. Disclosure #5 includes an associate of the research analyst. Disclosure #6, satisfies the disclosure of financial interests for the purposes of paragraph 16.5(a) of the SFC's Code of Conduct (the "Code"). The 1% or more interests is calculated as of the previous month end. Disclosures #7 and #8 combined satisfy the SFC requirement under paragraph 16.5(d) of the Code to disclose an investment banking relationship. Japan: See company-specific disclosures as to any applicable disclosures required by Japanese stock exchanges, the Japanese Securities Dealers Association or the Japanese Securities Finance Company. Disclosures under the Financial Instruments and Exchange Law Company name: Deutsche Securities Inc. Registration number: Registered as a financial instruments dealer by the Head of the Kanto Local Finance Bureau (Kinsho) No. 117 Member of associations: Japan Securities Dealers Association (JSDA), The Financial Futures Association of Japan Commissions and risks involved in stock transactions: For stock transactions, we charge stock commissions and consumption tax by multiplying the transaction amount by the commission rate agreed with each customer. Stock transactions can lead to

4 June 2008 Food & Beverage Del Monte Pacific
Page 24 Deutsche Bank AG/Hong Kong
losses as a result of share price fluctuations and other factors. Transactions in foreign stocks can lead to additional losses stemming from foreign exchange fluctuations. New Zealand: This research is not intended for, and should not be given to, "members of the public" within the meaning of the New Zealand Securities Markets Act 1988. Russia: The information, interpretation and opinions submitted herein are not in the context of, and do not constitute, any appraisal or evaluation activity requiring a licence in the Russian Federation. South Africa: Publisher: Deutsche Securities (Pty) Ltd, 3 Exchange Square, 87 Maude Street, Sandton, 2196, South Africa. Author: As referred to on the front cover. All rights reserved. When quoting, please cite Deutsche Securities Research as the source. Turkey: The information, interpretation and advice submitted herein are not in the context of an investment consultancy service. Investment consultancy services are provided by brokerage firms, portfolio management companies and banks that are not authorized to accept deposits through an investment consultancy agreement to be entered into such corporations and their clients. The interpretation and advices herein are submitted on the basis of personal opinion of the relevant interpreters and consultants. Such opinion may not fit your financial situation and your profit/risk preferences. Accordingly, investment decisions solely based on the information herein may not result in expected outcomes. United Kingdom: Persons who would be categorized as private customers in the United Kingdom, as such term is defined in the rules of the Financial Services Authority, should read this research in conjunction with prior Deutsche Bank AG research on the companies which are the subject of this research. Disclosures relating to the firm's obligations under MiFiD can be found at http://globalmarkets.db.com/riskdisclosures.

GRCM2008PROD013474
Deutsche Bank AG/Hong Kong
Asia-Pacific locations
Deutsche Bank AG Deutsche Bank Place Level 16 Corner of Hunter & Phillip Streets Sydney, NSW 2000 Australia Tel: (61) 2 8258 1234
Deutsche Bank AG Level 55 Cheung Kong Center 2 Queen’s Road Central Hong Kong Tel: (852) 2203 8888
Deutsche Equities India Pte Ltd DB House, Ground Floor Hazarimal Somani Marg Fort, Mumbai 400 001 India Tel: (91) 22 5658 4600
Deutsche Securities Inc. 2-11-1 Nagatacho Sanno Park Tower Chiyoda-ku, Tokyo 100-6171 Japan Tel: (81) 3 5156 6701
Deutsche Bank (Malaysia) Berhad Level 18-20 Menara IMC 8 Jalan Sultan Ismail Kuala Lumpur 50250 Malaysia Tel: (60) 3 2053 6760
In association with Deutsche Regis Partners, Inc. Level 23, Tower One Ayala Triangle, Ayala Avenue Makati City, Philippines Tel: (63) 2 894 6600
Deutsche Securities Korea Co. 17th Floor, YoungPoong Bldg., 33 SeoRin-Dong, Chongro-Ku, Seoul (110-752) Republic of Korea Tel: (82) 2 316 8888
Deutsche Bank AG Singapore One Raffles Quay South Tower Singapore 048583 Tel: (65) 6423 8001
Deutsche Securities Asia Ltd Taiwan Branch Level 6 296 Jen-Ai Road, Sec 4 Taipei 106 Taiwan Tel: (886) 2 2192 2888
In association with TISCO Securities Co., Ltd TISCO Tower 48/8 North Sathorn Road Bangkok 10500 Thailand Tel: (66) 2 633 6470
In association with PT Deutsche Verdhana Indonesia Deutsche Bank Building, 6th Floor, Jl. Imam Bonjol No.80, Central Jakarta, Indonesia Tel: (62 21) 318 9541
International locations
Deutsche Bank Securities Inc. 60 Wall Street New York, NY 10005 United States of America Tel: (1) 212 250 2500
Deutsche Bank AG London 1 Great Winchester Street London EC2N 2EQ United Kingdom Tel: (44) 20 7545 8000
Deutsche Bank AG Große Gallusstraße 10-14 60272 Frankfurt am Main Germany Tel: (49) 69 910 0
Deutsche Bank AG Deutsche Bank Place Level 16 Corner of Hunter & Phillip Streets Sydney, NSW 2000 Australia Tel: (61) 2 8258 1234
Deutsche Bank AG Level 55 Cheung Kong Center 2 Queen’s Road Central Hong Kong Tel: (852) 2203 8888
Deutsche Securities Inc. 2-11-1 Nagatacho Sanno Park Tower Chiyoda-ku, Tokyo 100-6171 Japan Tel: (81) 3 5156 6701
Global Disclaimer The information and opinions in this report were prepared by Deutsche Bank AG or one of its affiliates (collectively “Deutsche Bank”) for its clients. The information herein is believed by Deutsche Bank to be reliable and has been obtained from public sources believed to be reliable. With the exception of information about Deutsche Bank, Deutsche Bank makes no representation as to the accuracy or completeness of such information.
This published research report may be considered by Deutsche Bank when Deutsche Bank is deciding to buy or sell proprietary positions in the securities mentioned in this report.
For select companies, Deutsche Bank equity research analysts may identify shorter-term opportunities that are consistent or inconsistent with Deutsche Bank's existing, longer-term Buy or Sell recommendations. This information is made available on the SOLAR stock list, which can be found at http://gm.db.com.
Deutsche Bank may trade for its own account as a result of the short term trading suggestions of analysts and may also engage in securities transactions in a manner inconsistent with this research report and with respect to securities covered by this report, will sell to or buy from customers on a principal basis. Disclosures of conflicts of interest, if any, are discussed at the end of the text of this report or on the Deutsche Bank website at http://gm.db.com.
Opinions, estimates and projections in this report constitute the current judgement of the author as of the date of this report. They do not necessarily reflect the opinions of Deutsche Bank and are subject to change without notice. Deutsche Bank has no obligation to update, modify or amend this report or to otherwise notify a reader thereof in the event that any matter stated herein, or any opinion, projection, forecast or estimate set forth herein, changes or subsequently becomes inaccurate, except if research on the subject company is withdrawn. Prices and availability of financial instruments also are subject to change without notice. This report is provided for informational purposes only. It is not to be construed as an offer to buy or sell or a solicitation of an offer to buy or sell any financial instruments or to participate in any particular trading strategy in any jurisdiction or as an advertisement of any financial instruments.
Derivative transactions involve numerous risks including, among others, market, counterparty default and illiquidity risk. The appropriateness or otherwise of these products for use by investors is dependent on the investors' own circumstances including their tax position, their regulatory environment and the nature of their other assets and liabilities and as such investors should take expert legal and financial advice before entering into any transaction similar to or inspired by the contents of this publication. Trading in options involves risk and is not suitable for all investors. Prior to buying or selling an option investors must review the "Characteristics and Risks of Standardized Options," at http://www.optionsclearing.com/publications/risks/riskchap1.jsp. If you are unable to access the website please contact Deutsche Bank AG at +1 (212) 250-7994, for a copy of this important document. Furthermore, past performance is not necessarily indicative of future results. Please note that multi-leg options strategies will incur multiple commissions.
The financial instruments discussed in this report may not be suitable for all investors and investors must make their own investment decisions using their own independent advisors as they believe necessary and based upon their specific financial situations and investment objectives. If a financial instrument is denominated in a currency other than an investor’s currency, a change in exchange rates may adversely affect the price or value of, or the income derived from, the financial instrument, and such investor effectively assumes currency risk. In addition, income from an investment may fluctuate and the price or value of financial instruments described in this report, either directly or indirectly, may rise or fall. Furthermore, past performance is not necessarily indicative of future results.
Unless governing law provides otherwise, all transactions should be executed through the Deutsche Bank entity in the investor’s home jurisdiction . In the U.S. this report is approved and/or distributed by Deutsche Bank Securities Inc., a member of the NYSE, the NASD, NFA and SIPC. In Germany this report is approved and/or communicated by Deutsche Bank AG Frankfurt authorised by Bundesanstalt für Finanzdienstleistungsaufsicht. In the United Kingdom this report is approved and/or communicated by Deutsche Bank AG London, a member of the London Stock Exchange and regulated by the Financial Services Authority for the conduct of investment business in the UK and authorised by Bundesanstalt für Finanzdienstleistungsaufsicht (BaFin). This report is distributed in Hong Kong by Deutsche Bank AG, Hong Kong Branch, in Korea by Deutsche Securities Korea Co. and in Singapore by Deutsche Bank AG, Singapore Branch. In Japan this report is approved and/or distributed by Deutsche Securities Inc. The information contained in this report does not constitute the provision of investment advice. In Australia, retail clients should obtain a copy of a Product Disclosure Statement (PDS) relating to any financial product referred to in this report and consider the PDS before making any decision about whether to acquire the product. Deutsche Bank AG Johannesburg is incorporated in the Federal Republic of Germany (Branch Register Number in South Africa: 1998/003298/10) Additional information relative to securities, other financial products or issuers discussed in this report is available upon request. This report may not be reproduced, distributed or published by any person for any purpose without Deutsche Bank's prior written consent. Please cite source when quoting.
Copyright © 2008 Deutsche Bank AG


![[FRESH (FOR ADMISSION) - CIVIL CASES]](https://static.fdokumen.com/doc/165x107/6327cffe5c2c3bbfa8045c6c/fresh-for-admission-civil-cases.jpg)