Deformation monitoring at Nevado del Ruiz, Colombia - October 1985 - March 1988
27
Journal of Volcanology and Geothermal Research, 41 (1990) 269-295 Elsevier Science Publishers B.V., Amsterdam--Printed in The Netherlands 269 Deformation monitoring at Nevado del Ruiz, Colombia - October 1985 - March 1988 NORMAN G. BANKS a, CESAR CARVAJAL b, HECTOR MORA b and EYSTEINN TRYGGVASON c a U.S. Geological Survey, Cascades Volcano Observatory, 5400 MacArthur Blvd., Vancouver, WA 98661, U.S.A. b Observatorio Vulcanol6gicos de Colombia, INGEOMINAS, Manizales, Colombia c Nordic Volcanologieal Institute, Reykjavik, Iceland (Received for publication December 1, 1989) Abstract Banks, N.G., Carvajal, C., Mora, H. and Tryggvason, E., 1990. Deformation monitoring at Nevado del Ruiz, Colombia - October 1985-March 1988. In. S.N. Williams (Editor), Nevado del Ruiz Volcano, Col- ombia, I. J. Volcanol. Geotherm. Res., 41: 269-295. Deformation studies began at Nevado del Ruiz 23 days before the devastating 13 November 1985 erup- tion, at least 12 months after precursory seismicity and fumarolic activity began. The late start in geodetic monitoring, limited number of stations in the pre-eruption network, and inconsistent patterns in the observed deformation limit conclusions about intrusive activity in the months and weeks prior to the erup- tion. However, the data require that the magma source of the devastating eruption was either deeper than 7 km or, if shallow, recovered the same volume and position within one week of the eruption. Geodetic monitoring resumed 1 week after the eruption and, by April 1986, included 11 tilt-leveling sta- tions, 38 EDM lines, and 7 short leveling lines - a network capable of detecting emplacement or move- ment of magma volumes as small as 3 MCM (3 x 10⁶ m 3) to a depth of 2-3 km (using a point-source model), 10 MCM to 7 km, 50 MCM to 10 km, and 200 MCM to 15 km beneath Ruiz. In addition, 4 telemetered tiltmeters provided the capability of detecting, in real time, the fairly rapid ascent of much smaller magma bodies. Stations established to detect instability of the summit ice cap after the eruption were discontinued in early 1986. The data collected from the geodetic networks have higher than normal variance but demonstrate that little or no cumulative deformation of Ruiz occurred from October 1985 through March 1988. Thus, little, if any, magma intruded above 5 km beneath the summit during or after the 13 November 1985 eruption. This lack of significant intrusive activity agrees with the surprisingly low seismic energy release under Ruiz and makes direct degassing of a large batholith an improbable explanation of the large sulfur flux to date at Ruiz. Part of the variance in the geodetic data results from real but noncumulative deformation that may in part be pressure-buffered by a fairly large geothermal water-gas mixture for which abundant physical evidence exists. Part of the noncumulative deformation, some of the fairly dispersed and low-level seismicity under Ruiz, and some phreatic events appear to correlate with seasonal precipitation patterns. Hence rain/snow-loading and groundwater interaction may cause deformation events and possibly help trigger some phreatic explosions and seismic events at Ruiz and, as search of the literature reveals, at other volcanoes in metastable states.
-
Upload
independent -
Category
Documents
-
view
0 -
download
0
Transcript of Deformation monitoring at Nevado del Ruiz, Colombia - October 1985 - March 1988
Journal of Volcanology and Geothermal Research, 41 (1990) 269-295 Elsevier Science Publishers B.V., Amsterdam--Printed in The Netherlands
269
Deformat ion monitor ing at N e v a d o del Ruiz, C o l o m b i a - October 1985 - March 1988
N O R M A N G. B A N K S a, CESAR CARVAJAL b, HECTOR MORA b and EYSTEINN TRYGGVASON c
a U.S. Geological Survey, Cascades Volcano Observatory, 5400 MacArthur Blvd., Vancouver, WA 98661, U.S.A.
b Observatorio Vulcanol6gicos de Colombia, INGEOMINAS, Manizales, Colombia c Nordic Volcanologieal Institute, Reykjavik, Iceland
(Received for publication December 1, 1989)
Abstrac t
Banks, N.G., Carvajal, C., Mora, H. and Tryggvason, E., 1990. Deformation monitoring at Nevado del Ruiz, Colombia - October 1985-March 1988. In. S.N. Williams (Editor), Nevado del Ruiz Volcano, Col- ombia, I. J. Volcanol. Geotherm. Res., 41: 269-295.
Deformation studies began at Nevado del Ruiz 23 days before the devastating 13 November 1985 erup- tion, at least 12 months after precursory seismicity and fumarolic activity began. The late start in geodetic monitoring, limited number of stations in the pre-eruption network, and inconsistent patterns in the observed deformation limit conclusions about intrusive activity in the months and weeks prior to the erup- tion. However, the data require that the magma source of the devastating eruption was either deeper than 7 km or, if shallow, recovered the same volume and position within one week of the eruption.
Geodetic monitoring resumed 1 week after the eruption and, by April 1986, included 11 tilt-leveling sta- tions, 38 EDM lines, and 7 short leveling lines - a network capable of detecting emplacement or move- ment of magma volumes as small as 3 MCM (3 x 10⁶ m 3) to a depth of 2 - 3 km (using a point-source model), 10 MCM to 7 km, 50 MCM to 10 km, and 200 MCM to 15 km beneath Ruiz. In addition, 4 telemetered tiltmeters provided the capability of detecting, in real time, the fairly rapid ascent of much smaller magma bodies. Stations established to detect instability of the summit ice cap after the eruption were discontinued in early 1986.
The data collected from the geodetic networks have higher than normal variance but demonstrate that little or no cumulative deformation of Ruiz occurred from October 1985 through March 1988. Thus, little, if any, magma intruded above 5 km beneath the summit during or after the 13 November 1985 eruption. This lack of significant intrusive activity agrees with the surprisingly low seismic energy release under Ruiz and makes direct degassing of a large batholith an improbable explanation of the large sulfur flux to date at Ruiz.
Part of the variance in the geodetic data results from real but noncumulative deformation that may in part be pressure-buffered by a fairly large geothermal water-gas mixture for which abundant physical evidence exists. Part of the noncumulative deformation, some of the fairly dispersed and low-level seismicity under Ruiz, and some phreatic events appear to correlate with seasonal precipitation patterns. Hence rain/snow-loading and groundwater interaction may cause deformation events and possibly help trigger some phreatic explosions and seismic events at Ruiz and, as search of the literature reveals, at other volcanoes in metastable states.
270 N.¢~ BANKS ET AL
1. I n t r o d u c t i o n
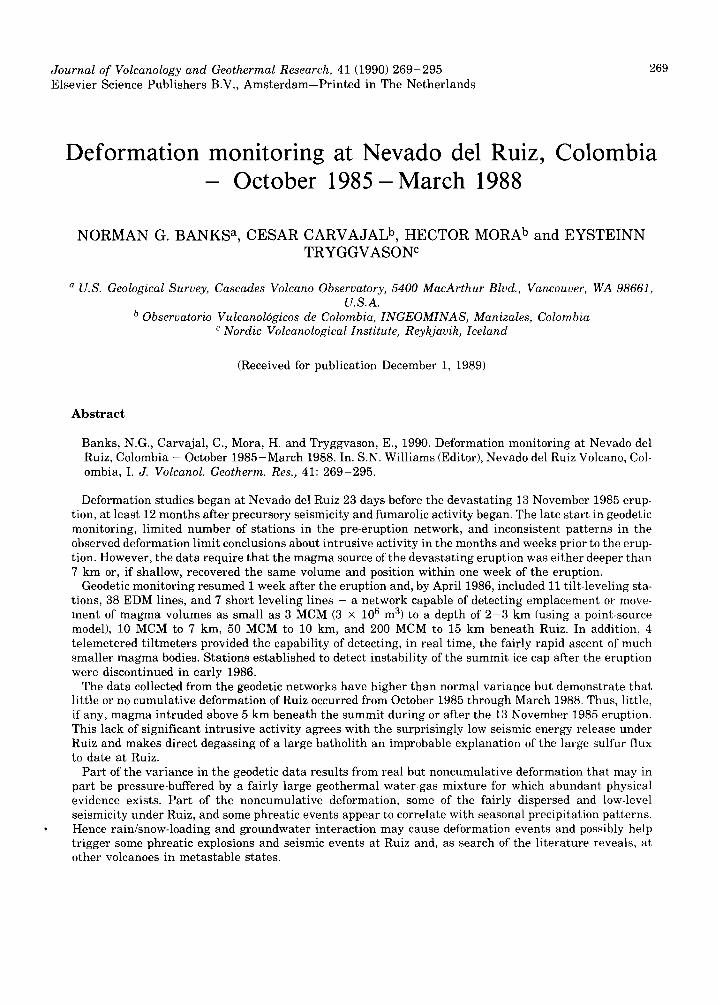
Deformation studies began at Nevado del Ruiz on 21 October 1985 (Van der Laat, 1985), just 23 days before the devastat ing 13 November 1985 eruption and at least 12 months after onset of precursory seismicity and fumarolic activity at the volcano (Fig. 1). The late s tar t in geodetic monitoring and the small number of stations (4 tilt-leveling stations and 2 electronic ti l tmeters, both of which were removed in early November 1985, Fig. 2) in the initial network severely limit knowledge of deformation that might have occurred prior to and during the eruption and essentially preclude determination of whether, and how much, new magma was emplaced under the volcano prior to October 1985.
Immediately following the eruption, a more extensive geodetic monitoring program was developed on Ruiz; it included reobservation of the original 4 tilt-leveling stations, 4 new
telemetered til tmeters, 18 EDM lines shot from 4 instrument stations (Figs. 2, 3), and several now-abandoned nail stations measured by hand-held tape to monitor movement of the ice on the summit. The main objective of the post- eruption monitoring program was to provide adequately sensitive data to assist forecasting of eruptions. Establ ishment of a deformation network required to rigorously model Ruiz was precluded by difficult access, the presence of the ice cap in the summit area, limited resources for field work, and consideration for safety of field crews.
The first deformation monitors were operative 1 week after the eruption, and by December, the networks could detect emplace- ment or movement of magma volumes as small as 3 MCM (3 × 10⁶ m 3) to depths of 2 - 3 km (using a point-source model; Mogi, 1958), 1 0 - 5 0 MCM to depths of 9 km, and 200-500 MCM to depths of 13 km beneath Ruiz, In addi- tion, the 4 telemetered t i l tmeters provided the
MONITORING RUIZ
Felt Seismic i ty Phreatic Erupt ions
Magmat ic Erupt ions Hazard Assessment
Monitoring Activity Seismic Studies
Dry Tilt Level ing Line
Electr ic Tilt EDM
Crack Sta t ions COSPEC SO2
Fumarole Thermal Spr ings
VOLCANO 1 9 8 4 - 1 9 8 8
I ~1 I [
R m
1 1984 1985 t 1986 1987 1988
13 NOVEMBER 1985 ERUPTION
Fig. 1. Time-series diagram of seismic and eruptive activity versus onset of various monitoring activities at Nevado del Ruiz Volcano, Colombia. Arrow indicates the 13 November 1985 eruption. Thickness of time bar in- dicates relative intensity of effort.
DEFORMATION MONITORING AT NEVADO DEL RUIZ COLOMBIA 271
capability of detecting the ascent, in real time,
of even smaller magma bodies.
By mid 1986, the program had been expanded
to include 7 short leveling lines, 7 more (to total
11) tilt-leveling stations, and 20 additional EDM lines, 17 of which were measured from 4
additional instrument stations (to total of 35
after 3 original lines were abandoned). The
measurements on these monitors from late
1985 through early 1988 were extensive and provide data that both assist and confine inter-
pretations of the magmatic/geothermal system
under Nevado de1 Ruiz.
5’
4’
2. Methods
2.1 Tilt-leveling (dry-tilt) measurements
The first measurements of ground tilt at Ruiz
were made at 4 stations (Fig. 2) by the tilt-
leveling procedures described in Kinoshita et
al. (1974) and Yamashita (1981). The stations
consisted of 3 bench marks established in an ar-
ray approximating an equilateral triangle with
40-m-long sides and a total elevation difference
across the station of less than 3 m. The bench marks were installed in moderate-
i “.
., .:,’ : .j’ “... ;..:, . . . ,” .., I
:’
:, ,, ..
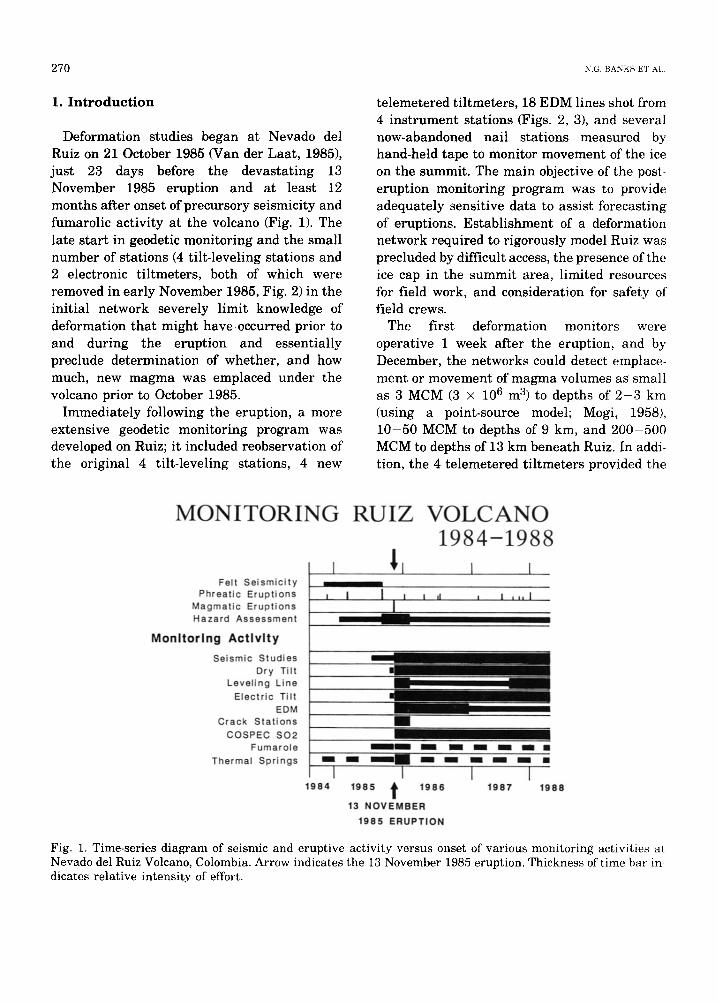
Fig. 2. Location of tilt-leveling stations (triangles), electronic-tilt stations monitors (inverted triangles), short leveling lines (short heavy lines), and meteorologic stations (circles) on Nevado de1 Ruiz Volcano. Open symbols denote the 4 dry-tilt and 2 electronic-tilt stations established and briefly read prior to the 13 November 1985 eruption.
272 N(; BANKS ~:'r' U~
ly consolidated volcanic deposits in piers (0.3-0.5 m in diameter) formed of concrete poured in a hole about 1 m deep and into which protruded several steel rods (at least 2 m in length and 1.5 cm in diameter) that had been driven at various angles to refusal in the substrate below the encasing cement. Such bench mark installations commonly give data comparable in quality to those of bedrock in- stallations and frequently are chosen because of the necessity in the 3-point array for relative- ly flat sites. In the post-eruption stations, the bench marks were cemented, wherever possi- ble, to bedrock. The pre-eruption bench marks were the rounded tops of steel bars; post- eruption marks were cast brass and stainless steel.
The three bench marks at each station form a plane tha t moves in response to ground defor- mation, and the tilt is detected by measuring changes in the relative elevation of the three bench marks using a precision level, micrometer plate, and invar rods set vertically on each bench mark. The same rod was used on the same bench mark for each remeasurement to avoid introduction of rod errors. The initial procedure used the foresight-backsight pro-
cedure of Yamashita (1981) in which 4 paired readings of 5 measurements to each rod were made around the array. This method permitted error checking between each bench mark pair as well as verified closure of the three-bench- mark array; however, the method was unac- countably modified in late 1986 to a method that disabled measured array closure.
The change in procedure was discovered dur- ing preparation of this paper when explana- tions were sought for why the standard devia- tion (5.4 microradians (MR), assuming linear regression) in the tilt data was about twice that generally observed for such measurements (2-3 MR, Kinoshita et al., 1974). In March 1988, the original technique of verified closure was reestablished to ensure in-the-field error checking. In addition, a program was begun to add at least one more mark to each triangle and to established leveling loops (100-1000 m in diameter) to improve the precision of the tilt- leveling measurements.
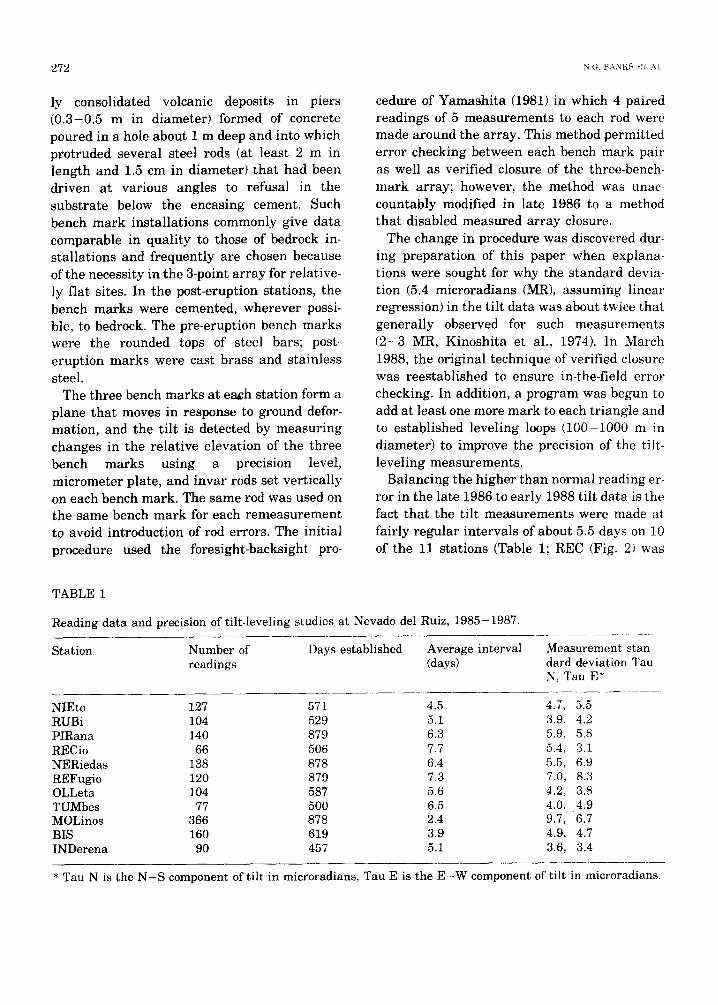
Balancing the higher than normal reading er- ror in the late 1986 to early 1988 tilt data is the fact that the tilt measurements were made at fairly regular intervals of about 5.5 days on 10 of the 11 stations (Table 1; REC (Fig. 2) was
TABLE 1
Reading data and precision of tilt-leveling studies at Nevado del Ruiz, 1985-1987.
Station Number of Days established Average interval readings (days)
Measurement stan- dard deviation Tau N, Tau E*
NIEto 127 571 4.5 4.7, 5.5 RUBi 104 529 5.1 3.9, 4.2 PIRana 140 879 6.3 5.9, 5.8 RECio 66 506 7.7 5.4, 3.1 NERiedas 138 878 6.4 5.5, 6.9 REFugio 120 879 7.3 7.0, 8.3 OLLeta 104 587 5.6 4.2, 3.8 TUMbes 77 500 6.5 4.0, 4.9 MOLinos 366 878 2.4 9.7, 6.7 BIS 160 619 3.9 4.9, 4.7 INDerena 90 457 5.1 3.6, 3.4
* Tau N is the N-S component of tilt in microradians, Tau E is the E-W component of tilt in microradians.
DEFORMATION MONITORING AT NEVADO DEL RUIZ COLOMBIA 273
measured less frequently owing to loss of helicopter support). Thus, over periods of 1 - 2 months, measurement redundancy yielded data comparable to or better than that gathered every 2 - 3 months at higher individual reading precisions. In addition, as discussed in Section 3.6, the frequent measurements revealed that part of the dispersion in the data may represent real (but nonvolcanic), noncumulative tilt associated with seasonal precipitation.
2.2 Short leveling lines
Leveling of short lines (200-400 m) was done at Ruiz by precision level, micrometer plate,
and invar rods at 7 locations as close as 3 km and as far as 7 km from the summit (Fig. 2). The ends of the lines were marked with permanent bench marks and some lines had more than two permanent marks. The leveling was done by conventional techniques but at times did not in- clude circuit closure for error detection and distribution. Standard deviation on these lines, which in practice at other volcanoes is 1 - 3 MR using redundant circuit closure (Yamashita and Doukas, 1987), has been about 5 - 1 0 MR at Ruiz, although as noted above, part of this ab- normally high dispersion may be related to real but noncumulative tilt.
5 ' 0 0 '
4 ' 5 5 '
4" 50
7s '2~ . . 7s' 20. 7s. ~s, I ..... "- . , . . . . . . ~ , . , ' ^ A ; ' ~ \ r - , . . , ...... ,..: , .:..--- . ...... . .............
i
~ " ~ . , - : ":": ......... " .... ~ ' " ~ " : : " '~ :l " : : . ~ ........ . " . N rv .9 ' I ' . . . . • . : ; ~ .. . . . . . . . . .... ..... : ~ j . . . ...... .. . . . . , . , , ~.: .
: : ........ : . ' . , . . . . . . . . . . ~ : : ~ : " - . : . . . . . . . . . ..... .... .......... . . . . . , , z Ro~ I: : A R B . .
/
. . . . . . . . : : i . : ' " : " ' . , ! ; . . . . . . . . . . . ~ ' ~ - - : ' T E T ' ( ~ ' ~ X " " : ' " " ..... i . . . . . . . ' ' : . . . . . '#~-"~ C o n t o u r ( M e t e r s ) l "
...... " :. : : . . . .............. " ............ T ~ . . . : " . ~ | :: I l l & ' : : " ' : " o , 2 ~ , l~. ' .-: : ." ' : ' ' - .- .": " ' . ....... ~ ~- :: ] I m~\ ::.: ~ F L A " . . . . . . I I I I I I ".
' . , " : . ..... " ,:: ~ "~ :: I I ' - I I ~ \ i " r " " .-" - ." KLOMETER$ I . , : • . ....... '... . . " . . . . . . . . . . . . :: ..... ~t :. -:. , : ...... .: ..: :~ ... " -.. . . . . . . " _ - - .~
:.::, . . . . . . . . . . . . . . . . . . . . . " B R I E : [ i - - f I ' ~ R O C ~ i ~ - - - / / J ' : ' ; • " ' , " - " ,, : . . : " . . . . . . ; - : : . , - , . , . i " ,.,,,~ .::::,:, ~ ....
• .-" . . . . : '. I ~ I I ' k ~ " V ' " , / ' / ~ ..... • " , - . " " . " : : - - :::" ~: -~ . o A ,I '; I I ...... s . o ~ , ~ , F : 2 " / f " ~ " ' : , > , .... : : : ..........
• :.: ..: . . . . . . . : :~ " 1,t:i G~:R " o X . , ~ ~ f ' g , ~ . s ~ ........ ::: : ' 2 : , " : : ' ~ : ~ : : "::" " "'. ."" ." ~ ~: [ ~ "~ " : j ~ l f g l l ~ " 1 1 , %. " " ~ , , ~ ~'~ '" " : : ". • F A R ~ • N .... " " -. / "~..
• • .... : : " ....... , ' . ~ - • s,_ - " . , ~ : . . . . . . . . . . . " ~ : - ' : ' '~ - - , :
• .,.:~ ;.: . ',-.. . 1 - { : ' : : . ^ ^ , ~ . : . - ~ c ~ - : . . . . ,.: ~ , ~ " - - , - - - . . ~
...... • : ...... ' : .......... ..:. .................. ' - 1 / ~ L ~ V " " ' , , " ='" . . . . '~':" " .. ' " . : ; : '~ ............ " - - " : ' . . . . . . . . ::~ . . . . . . . . . . . . . . . . . . . . . I _ ; , , ~ / : e u , . . . . . . " .: ..~ ....... : ...,~] . . . . . . . . . . - :. ~ : ' ; ' ~ " J ~ H E ~ ...... ~ 9~M~ .. .... ~:- . .... ..: . . . . . . ~
....... : : : : ......... , BLO , : ::::
.. . . . . . . . . . . . : . : - . . . . . . . : . . . - ........ ,.:.,.. "~. P O T . . . . . . ~ / ...... " ............. ~' : ......... . - I " ' 1 R E C :': ::1 .... " : ...":. ........ ':.. " -.-..":.. '
": ".~ " : - . , : ! -..- / - - ~ . t . . . . . - . . . :. - . ::.:-. . . _
. ~ . - - :.... ...,....:: t/ ' : . : . . . . . " . . ....... ---..:. . . . . . . . . - . . . . . . . . : ....... ...
i"~:: ,:.J : : " : , , / ; : . : . . ~ i . : i : " : = ':::~. ~ . s ~ E : . . ~ .: ':~ i . : . , : : : : " : : : ~ .... : :
"lr.~ " i: I ~ ...... : , .... I :-: :-
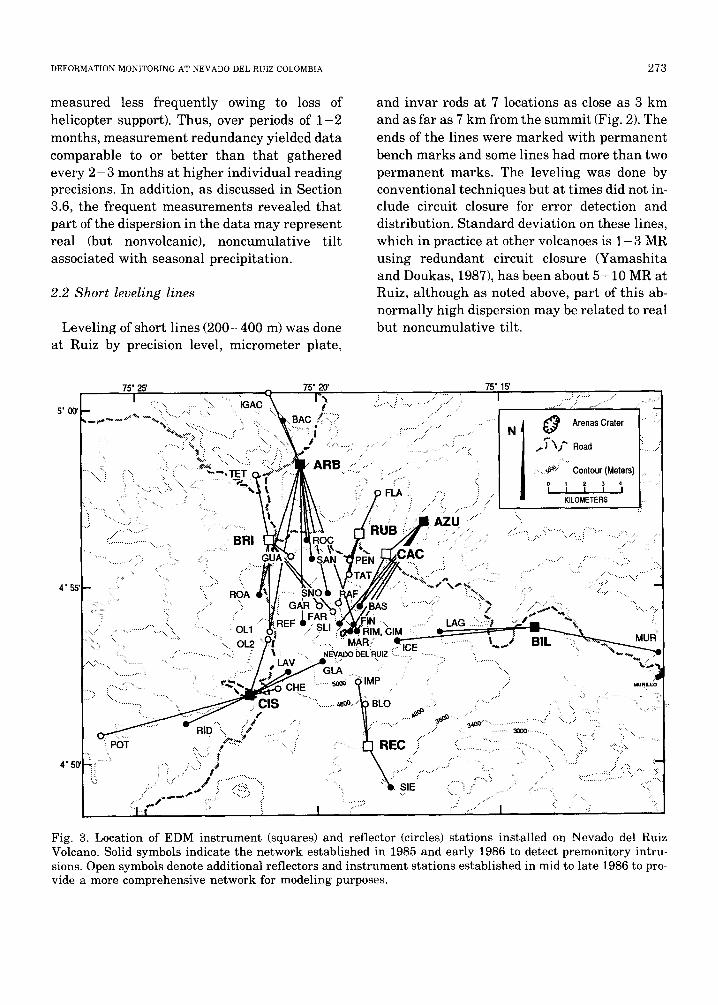
Fig. 3. Location of EDM instrument (squares) and reflector (circles) stations installed on Nevado del Ruiz Volcano. Solid symbols indicate the network established in 1985 and early 1986 to detect premonitory intru- sions. Open symbols denote additional reflectors and instrument stations established in mid to late 1986 to pro- vide a more comprehensive network for modeling purposes.
274 :,,-.(;. BANKS ET AI ,
2,3 Electronic tilt
Four platform electronic t i l tmeters were emplaced on Ruiz in December 1985 to t ransmit data to the Observatorio at Manizales. Telemetered t i l tmeters provide continuous recording of tilt in real time and more precise measurements than those provided by standard surveying techniques. In addition, when tilt data are telemetered, operational expense is less and safety for the instrument crews is greater owing to fewer required visits to the field. The limitation of such ti l tmeters is tha t they commonly produce electronic drift, data offsets, and temperature-related diurnal cycles. Moreover, their small size (normally 15-20 cm base) makes them sensitive to local or installation-related nonvolcanic tilt. Thus tilt-
leveling stations or leveling lines were located near t i l tmeters to provide periodic checks on electronic drift and site-related tilt.
Two electronic ti l tmeters at Ruiz (EIND and EREF, Fig. 2) are 2-axis Westphal meters (Westphal et al., 1983) with detection limits of 0.1 MR and relatively low electronic drift. The two Sperry t i l tmeters (EREC and EPIR) have less sensitive resolution of 10 MR and much higher long-term and diurnal drift. Both types of t i l tmeters operate by electronically tracking the movement of a bubble sealed with an elec- trolyte in a curved glass tube.
The data were t ransmit ted every 10 minutes to a dedicated microcomputer and printer at the Observatorio in Manizales via digital elec- tronics developed at the USGS Cascades Volcano Observatory (Murray, 1988). Hourly
TABLE 2
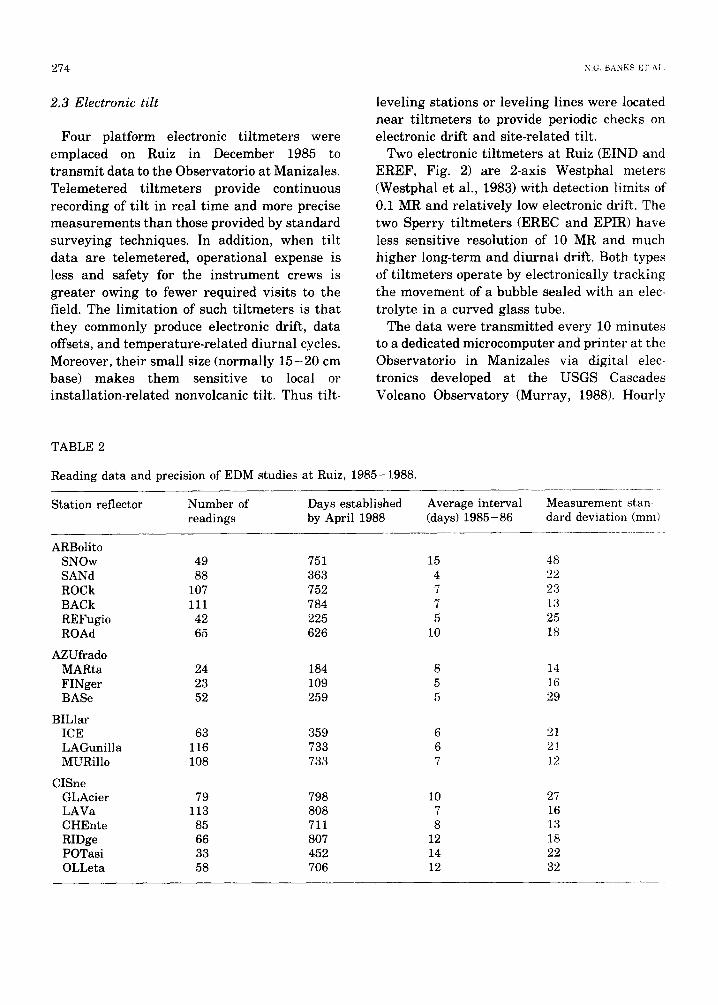
Reading data and precision of EDM studies at Ruiz, 1985-1988.
Station reflector Number of Days established Average interval Measurement stan- readings by April 1988 (days) 1985-86 dard deviation (mm)
ARBolito SNOw 49 751 15 48 SANd 88 363 4 22 ROCk 107 752 7 23 BACk 111 784 7 13 REFugio 42 225 5 25 ROAd 65 626 10 18
AZUfrado MARta 24 184 8 14 FINger 23 109 5 16 BASe 52 259 5 29
BILlar ICE 63 359 6 21 LAGunilla 116 733 6 21 MURillo 108 733 7 12
CISne GLAcier 79 798 10 27 LAVa 113 808 7 16 CHEnte 85 711 8 13 RIDge 66 807 12 18 POTasi 33 452 14 22 OLLeta 58 706 12 32

DEFORMATION MONITORING AT NEVADO DEL RUIZ COLOMBIA 2 7 5
averages of these data were automatically calculated, recorded, and printed out for either manual or electronic transfer to plotting and analysis programs on the Observatorio's main computers. Regular checking of real-time tilt was ensured by hourly hand-plotting of the data, and in addition, audible alarms were generated by the microcomputer when tilt values or rates exceed a predetermined threshold.
2.4 Electronic distance measurements (EDM)
EDM instruments measure distance by emit- t ing a modulated visible or infrared light beam and analyzing the phase shift of the signal returned by a passive reflector. Because of the difficult access at Ruiz, the reflectors were per- manent ly bolted to rock faces or less commonly to steel bars driven to refusal into volcanic deposits. Differences in instrument set-up height were removed by calculation, and correc- tions were made for refraction (Bomford, 1980) related to meteorologic changes using air temperature and pressure data collected at the instrument station. Temperature was measured on calibrated thermistors mounted on the top of 6-m-long-poles to reduce the effects of ground radiation.
Assuming straight-line regression curves, standard deviations for the EDM data at Ruiz averaged 14.5 mm for short lines ( 1 - 3 km), or 5 - 1 0 ppm, and 22.5 mm for the longer lines ( 3 - 8 km), or 3 - 7 ppm (Table 2). These devia- tions are higher than those normally observed in EDM data collected by similar methods at other volcanoes ( 2 - 4 ppm, Iwatsubo et al., 1988; Chadwick et al., 1985). As discussed in Section 3.6, part of the dispersion of the EDM data at Ruiz may result from real but non- cumulative deformation of the edifice; however, some also results from imprecisely known refractive index changes along the line of sight (Bomford, 1980). For example, Figure 4 shows greater scatter in the EDM data corrected for atmospheric change than is observed in the raw
data, indicating that atmospheric changes detected at the instrument sites, which were at lower elevations, were greater than the average change in conditions along the line of sight to the reflectors, which generally were located at elevations above the instrument site. However, except for smaller dispersion, no dif- ference in slope or pat tern is apparent between plots of corrected and uncorrected data (Fig. 4).
The EDM data gathered at Ruiz will probably never approach theoretical precisions of 1 - 2 ppm (Bomford, 1980) because of the expense and difficulty inherent in collecting along-the- line refraction data at Ruiz. However, precision could be improved by increasing the number of measurements made at each reading and by measuring at night to minimize along-the-line temperature gradients.
EDM lines were measured from the 4 original instrument stations at fairly regular intervals (about every 8 days, Table 2) until January 1987 when the lack of significant cumulative changes and loss of helicopter support reduced the active EDM program to stations ARB and CIS. Line measurements at these two stations
soo_ 7)
z
< B) o o -
r_7.3 ::> [-, .<
L..)
- 5 0 0 - ' ' ,I 85
NOV
i , ~ i i i , , i , i , i ~ f i , , i i i i ~ i , i
CORRECTED DATA ~ B I L - C E (2.7 xm)
BIL-uAG ( 4 7 kin)
~ * ' B I L - M U R (15.7 k in)
UNCORRECTED DATA
~ BIL- ICE (2.7 km)
~ BIL-LAG (4.7 krn)
, ~ ~ , B I L - M U R (15.7 kin)
I I I I I I I I I k I I i I I I I I , I
8 6 8 7 5
YEAR
I I
8 8
Fig. 4. Time-series plot of Billar EDM data with (A) and without (B) atmospheric corrections. Units on or- dinate are changes in line length in millimeters; the initial values are adjusted for plotting.
276 N.C;. BANKS ET At,
in 1987-1988 averaged once every 91 days in 1987.
2.5 Crack stations
Immediately after the November 1985 erup- tion, rapid formation and widening of cracks in the summit glaciers raised concerns about ice and rock avalanches into the Azufrado Valley. Therefore, several crack-measurement stations were established to determine and monitor the rate of crack widening. At each station, nails were driven into large rocks embedded in ice on opposite sides of the crack to detect dilation, and several stations were quadrilaterals to in- clude detection of lateral motion. The distances between nails were measured by hand-held tape, and some of the cracks were marked with paint to facilitate checking from the air. Measurement of the distances parallel to the cracks indicated precisions of about 1 - 2 mm. Crack measurements were terminated in late February 1986 when loss of helicopter support made regular access impractical. EDM reflec- tors set on and immediately under the ice on the summit continued to monitor ice movement and the stability of the uppermost slopes of the volcano for several months.
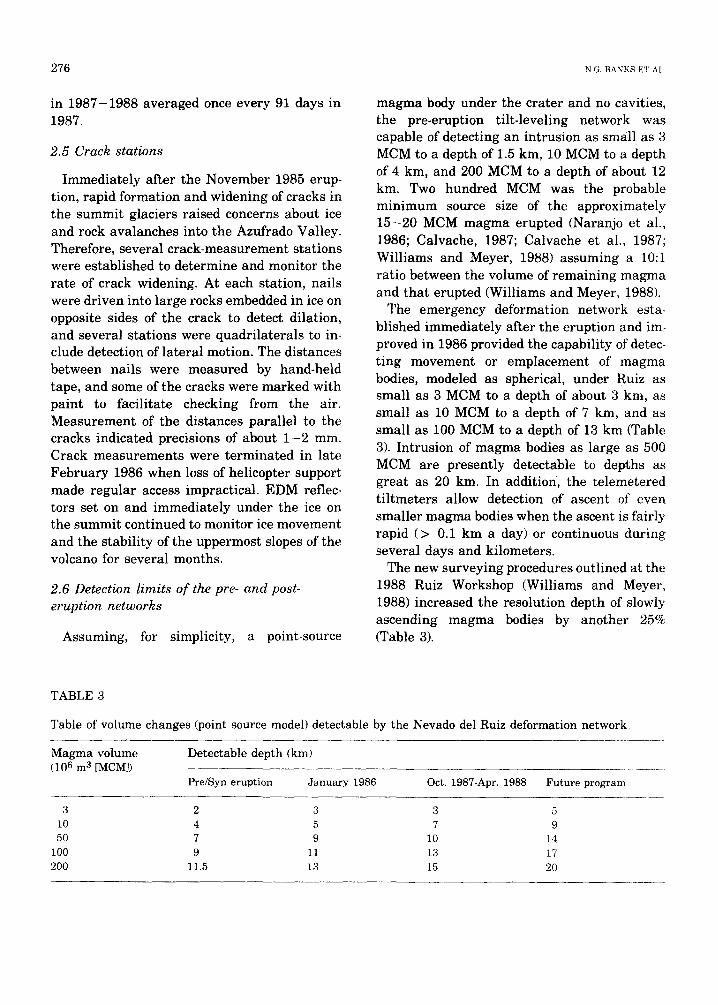
2.6 Detection limits of the pre- and post- eruption networks
Assuming, for simplicity, a point-source
magma body under the crater and no cavities, the pre-eruption tilt-leveling network was capable of detecting an intrusion as small as 3 MCM to a depth of 1.5 km, 10 MCM to a depth of 4 km, and 200 MCM to a depth of about 12 km. Two hundred MCM was the probable minimum source size of the approximately 15-20 MCM magma erupted (Naranjo et al., 1986; Calvache, 1987; Calvache et al., 1987; Williams and Meyer, 1988) assuming a 10:1 ratio between the volume of remaining magma and that erupted (Williams and Meyer, 1988).
The emergency deformation network esta- blished immediately after the eruption and im- proved in 1986 provided the capability of detec- t ing movement or emplacement of magma bodies, modeled as spherical, under Ruiz as small as 3 MCM to a depth of about 3 km, as small as 10 MCM to a depth of 7 km, and as small as 100 MCM to a depth of 13 km (Table 3). Intrusion of magma bodies as large as 500 MCM are presently detectable to depths as great as 20 km. In addition, the telemetered t i l tmeters allow detection of ascent of even smaller magma bodies when the ascent is fairly rapid (> 0.1 km a day) or continuous during several days and kilometers.
The new surveying procedures outlined at the 1988 Ruiz Workshop (Williams and Meyer, 1988) increased the resolution depth of slowly ascending magma bodies by another 25% (Table 3).
TABLE 3
Table of volume changes (point source model) detectable by the Nevado del Ruiz deformation network.
Magma volume (106 m 3 [MCM])
Detectable depth (km)
Pre/Syn eruption January 1986 Oct. 1987-Apr. 1988 Future program
3 2 3 3 5 10 4 5 7 9 50 7 9 10 ]4
100 9 11 13 17 200 11.5 13 15 20
DEFORMATION MONITORING AT NEVADO DEL RUIZ COLOMBIA 277
3. Deformat ion
3.1 Pre-eruption period
Precursory seismicity and fumarolic activity at Ruiz began 11 months before geodetic measurements commenced in October 1985 (Herd and Comitd de Estudios VulcanolSgicos, 1986; Voight, 1988; Williams and Meyer, 1988). Thus definition of deformation tha t might have occurred during most of the premonitory period of the 13 November eruption was lost. Further- more, the data gathered from 21 October to 3 November 1985 came from few stations, ceased 10 days before the eruption, and yielded erratic trends not easily reconciled with even a small intrusion under Arenas crater.
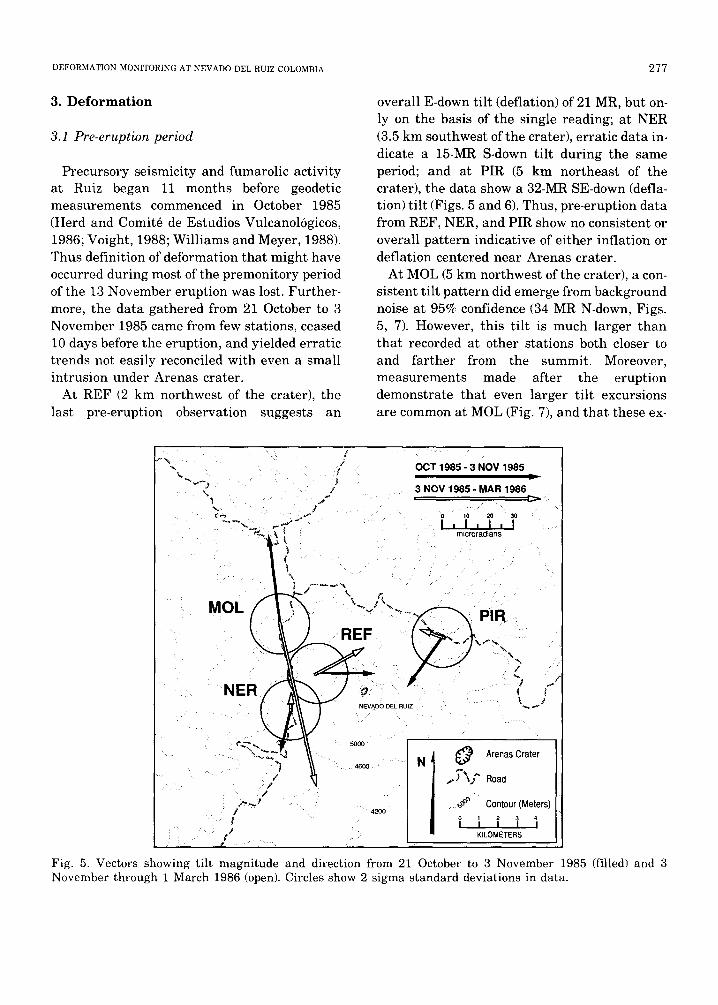
At REF (2 km northwest of the crater), the last pre-eruption observation suggests an
overall E-down tilt (deflation) of 21 MR, but on- ly on the basis of the single reading; at NER (3.5 km southwest of the crater), erratic data in- dicate a 15-MR S-down tilt during the same period; and at PIR (5 km northeast of the crater), the data show a 32-MR SE-down (defla- tion) tilt (Figs. 5 and 6). Thus, pre-eruption data from REF, NER, and PIR show no consistent or overall pattern indicative of either inflation or deflation centered near Arenas crater.
At MOL (5 km northwest of the crater), a con- sistent tilt pat tern did emerge from background noise at 95% confidence (34 MR N-down, Figs. 5, 7). However, this tilt is much larger than that recorded at other stations both closer to and farther from the summit. Moreover, measurements made after the eruption demonstrate tha t even larger tilt excursions are common at MOL (Fig. 7), and tha t these ex-
f
g
OCT 1985 - 3 N O V 1985
3 NOV 1985- MAR 1986 I:::>
i°, i° microradians
• . k ~ ] ~
• ~ f = ] " ~ %% • i
N E R ~ 1 t S . . . .
¢'~..~" ~,~ 5000 : . . . . ~ . ~ \ \ ~00 ~ Arenas Crater
J " '~ ..,.) \ f " Road /
z--~t ~ Contour (Meters) I 4200
J t KILOMETERS
t "
Fig. 5, Vectors showing t i l t magnitude and direction from 21 October to 3 November 1985 (fi l led) and 3 November through 1 March 1986 (open). Circles show 2 sigma standard deviat ions in data.
278 N.(~ B A N K S IffI AL
g o z u2
2 0 0 - , , ,
160- cr~l _ cq
1" I 2 0 - ~-1~
- A |
- 1 2 0 - ~
- 1 6 0 -
LD 80
~-~ 40
;> o
"-? ~ - 4 0
~.D - 8 0
Summlt) TAL; N
7 AU E
• , ' T J ~ ER (3 5 km WSW f om Summit) ~u ~'
PIR (5 km ENE from Summit) TAb N
[AU E J
_ 2 0 0 L - - L ~ . . . . . . . . . . . i . . . . . . . . . . . . . . .
~5 t , 86 t $7 , 88 NOV 13
YEAR
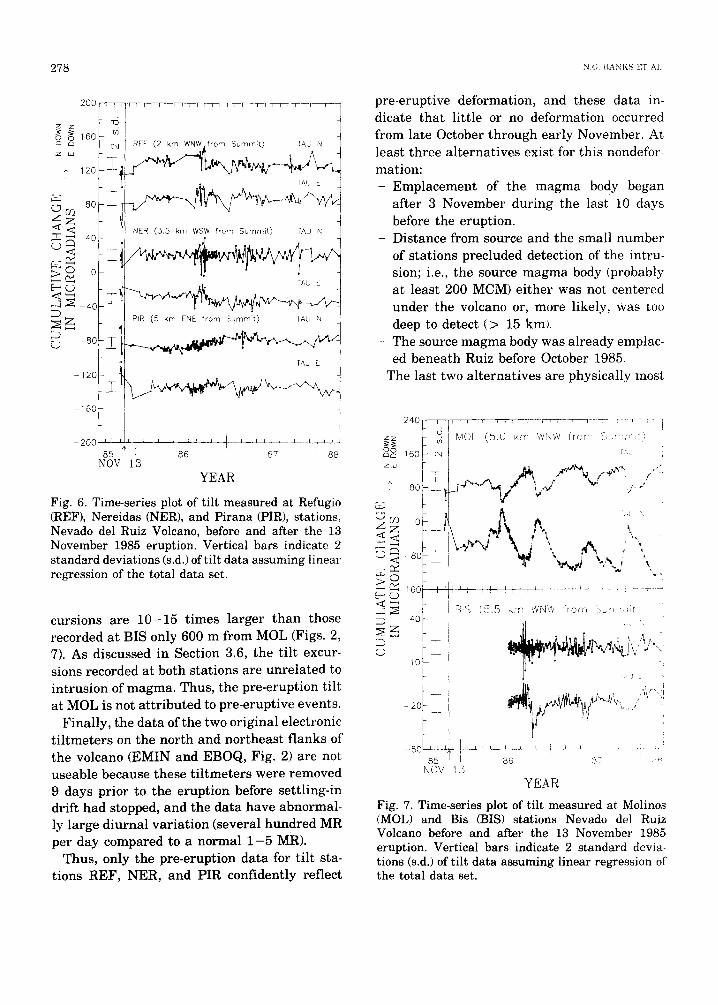
Fig. 6. Time-series plot of tilt measured at Refugio (REF), Nereidas (NER), and Pirana (PIR), stations, Nevado del Ruiz Volcano, before and after the 13 November 1985 eruption. Vertical bars indicate 2 standard deviations (s.d.) of tilt data assuming linear regression of the total data set.
cursions are 1 0 - 1 5 times larger than those recorded at BIS only 600 m from MOL (Figs. 2, 7). As discussed in Section 3.6, the tilt excur- sions recorded at both stations are unrelated to intrusion of magma. Thus, the pre-eruption tilt at MOL is not attributed to pre-eruptive events.
Finally, the data of the two original electronic tiltmeters on the north and northeast flanks of the volcano (EMIN and EBOQ, Fig. 2) are not useable because these tiltmeters were removed 9 days prior to the eruption before settling-in drift had stopped, and the data have abnormal- ly large diurnal variation (several hundred MR per day compared to a normal 1 - 5 MR).
Thus, only the pre-eruption data for tilt sta- tions REF, NER, and PIR confidently reflect
pre-eruptive deformation, and these data in- dicate tha t little or no deformation occurred from late October through early November. At least three al ternat ives exist for this nondefor- mation: - E m p l a c e m e n t of the magma body began
after 3 November during the last 10 days before the eruption.
- Distance from source and the small number of stations precluded detection of the intru- sion; i.e., the source magma body (probably at least 200 MCM) ei ther was not centered under the volcano or, more likely, was too deep to detect (> 15 km).
- The source magma body was already emplac- ed beneath Ruiz before October 1985.
The last two al ternat ives are physically most
2 4 0 ~ r T ] . . . . . . . . . - r - r ~ - - - - - - , - r ~ - - - ~-~ r - "
z z o M O L ( 5 . 0 '
o o ~d~ 160 '~ ..... i
7 - '~,
_:~: : SIS (5.5 krra WNVV rorn 40
10 ,, 4
5 0 . . . . . . . .
o,2 ' o u , , : ~ N O V 1 5
YEAR
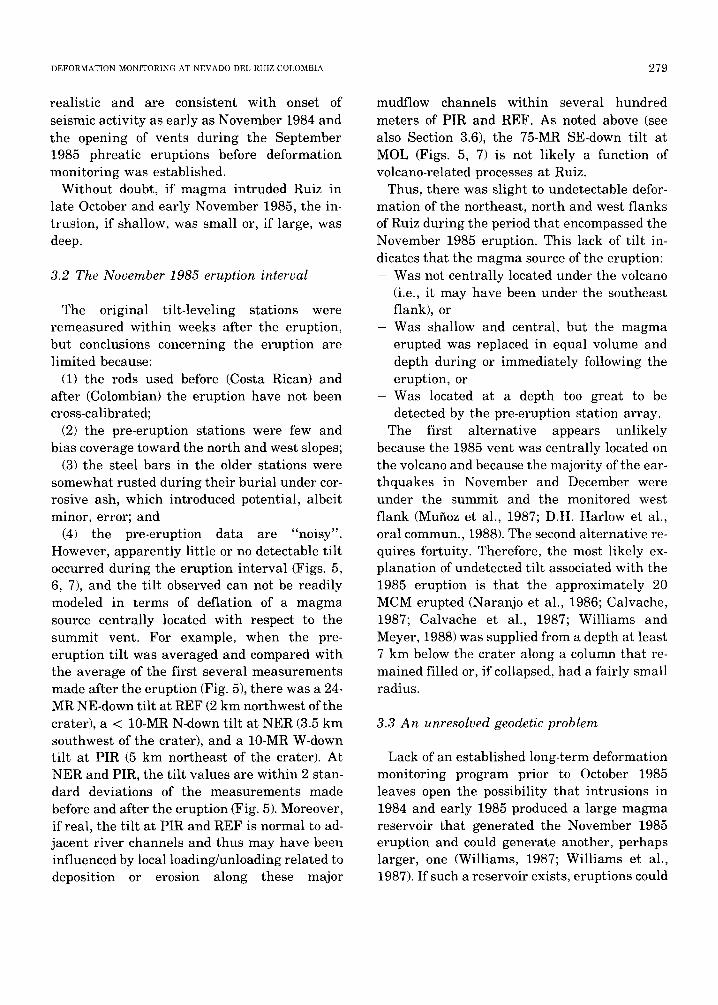
Fig. 7. Time-series plot of tilt measured at Motinos (MOL) and Bis (BIS) stations Nevado del Ruiz Volcano before and after the 13 November 1985 eruption. Vertical bars indicate 2 standard devia- tions (s.d.) of tilt data assuming linear regression of the total data set.
DEFORMATION MONITORING AT NEVADO DEL RUIZ COLOMBIA 279
realistic and are consistent with onset of seismic activity as early as November 1984 and the opening of vents during the September 1985 phreatic eruptions before deformation monitoring was established.
Without doubt, if magma intruded Ruiz in late October and early November 1985, the in- trusion, if shallow, was small or, if large, was deep.
3.2 The November 1985 eruption interval
The original tilt-leveling stations were remeasured within weeks after the eruption, but conclusions concerning the eruption are limited because:
(1) the rods used before (Costa Rican) and after (Colombian) the eruption have not been cross-calibrated;
(2) the pre-eruption stations were few and bias coverage toward the north and west slopes;
(3) the steel bars in the older stations were somewhat rusted during their burial under cor- rosive ash, which introduced potential, albeit minor, error; and
(4) the pre-eruption data are "noisy". However, apparently little or no detectable t i l t occurred during the eruption interval (Figs. 5, 6, 7), and the tilt observed can not be readily modeled in terms of deflation of a magma source centrally located with respect to the summit vent. For example, when the pre- eruption tilt was averaged and compared with the average of the first several measurements made after the eruption (Fig. 5), there was a 24- MR NE-down til t at REF (2 km northwest of the crater), a < 10-MR N-down tilt at NER (3.5 km southwest of the crater), and a 10-MR W-down tilt at PIR (5 km northeast of the crater). At NER and PIR, the ti l t values are within 2 stan- dard deviations of the measurements made before and after the eruption (Fig. 5). Moreover, if real, the tilt at PIR and REF is normal to ad- jacent river channels and thus may have been influenced by local loading/unloading related to deposition or erosion along these major
mudflow channels within several hundred meters of PIR and REF. As noted above (see also Section 3.6), the 75-MR SE-down tilt at MOL (Figs. 5, 7) is not likely a function of volcano-related processes at Ruiz.
Thus, there was slight to undetectable defor- mation of the northeast, north and west flanks of Ruiz during the period tha t encompassed the November 1985 eruption. This lack of tilt in- dicates tha t the magma source of the eruption: - Was not centrally located under the volcano
(i.e., it may have been under the southeast flank), or
- Was shallow and central, but the magma erupted was replaced in equal volume and depth during or immediately following the eruption, or
- W a s located at a depth too great to be detected by the pre-eruption station array.
The first alternative appears unlikely because the 1985 vent was centrally located on the volcano and because the majority of the ear- thquakes in November and December were under the summit and the monitored west flank (Mufioz et al., 1987; D.H. Harlow et al., oral commun., 1988). The second alternative re- quires fortuity. Therefore, the most likely ex- planation of undetected tilt associated with the 1985 eruption is that the approximately 20 MCM erupted (Naranjo et al., 1986; Calvache, 1987; Calvache et al., 1987; Williams and Meyer, 1988) was supplied from a depth at least 7 km below the crater along a column that re- mained filled or, if collapsed, had a fairly small radius.
3.3 An unresolved geodetic problem
Lack of an established long-term deformation monitoring program prior to October 1985 leaves open the possibility tha t intrusions in 1984 and early 1985 produced a large magma reservoir that generated the November 1985 eruption and could generate another, perhaps larger, one (Williams, 1987; Williams et al., 1987). If such a reservoir exists, eruptions could

280 N.G. BANffS gT AI,
occur wi thou t de tec tab le de format ion and wi th l i t t le or no warn ing . This possibi l i ty is un l ike ly to be resolved unt i l the cu r r en t cycle of act ivi ty , which his tor ical records indicate could last
z
E4 L~ Z <
¢0
L3 Z
.a
z
>
E-~ <
C)
2.0
A, S u m m i t C r a c k M o n i t o r 1.6
. ~ , _ . ~ . J 1 1.2 ~ 200
7 16a ~,
0.8 43 E
0.4i Z 165 ,5
0.oi ?
0 -0.4 ~ 500
- 0 . 8 I I I I I J I ; I
B. Rodial EDM Line
~, ~s to RIM (0.4 kin)
-~ ARB to CIM (0.7 kin)
l I I I I ] I I t I
C. Rad ia l EDM L ine 1
- 4
i
1985 1' NOV 13
L
\ AZU to RIM (0.4 kin)
1886
YEAR
Fig. 8. (A) Time-series plot of dilation of cracks in the summit ice sheet northeast of Arenas Crater. Measurements were reproducible to 1 -2 mm. (B and C) Time-series plots of cumulative change in length of EDM lines to reflectors on the summit ice cap from ARB and AZU stations. Numbers in parentheses in- dicate the distance of the reflector from the summit.
500
Z
Z <
t ) 0
:>
<
L9
-500
m
- Z
T
8 5 N O V
i i i i i i i i J i ~ - r : i i i " ~ - - r ~ - T - : l I i I ]
E D M f r o m A Z U J 7.3 km NE from S,,~mmit !
i
~ ' " MAR (radici, 0,~ . . . . . ,) !
J
i
, ~ :iN (radial, oa ,m, ]
a.~,S (rcciei, 1 :: , - r ;
i i
-!
I 7- - I i ; i J I I i i , i i _ i , i ~ A _ ~ ~ _ _ J
8 6 87 i ' ,~ 3
YEAR
Fig. 9. Time-series plot of cumulative change in line length (mm) between Azufrado (AZU) station and reflectors in the Azufrado valley and scarp. Lines are radial and ordered top to bottom according to the distance (indicated in parentheses) of the reflector from the summit. Vertical bars indicate 2 standard deviations (s.d.) of the data assuming linear regres- sion of the total data set. Units on ordinate are changes in line length in millimeters; the initial values are adjusted for plotting.
severa l tens of yea r s (Voight, 1988) has conclud- ed.
3.4 Glacial movement and summit stability
The s ta t ions es tabl ished on the summi t glaciers to moni tor crack deve lopment and glacial surging, which might be precursors to ava lanches of ice and rock into the Azufrado Valley, did not detect any increases in creep r a t e of the s u m m i t ice cap (Fig. 8A). Similar ly , EDM ref lectors moun ted on the ice and observ- ed f rom the lower f lanks of the volcano recorded essent ia l ly cons tan t ice m o v em en t of about 20 cm per day over the 8 mon ths of observat ion (Figs. 8B, 8C). In addit ion, the EDM moni tors es tab l i shed in bedrock on the upper f lanks no r theas t of Arenas Cra t e r (Fig. 3) detec ted no ou tward bulging of the c ra te r ' s t h in rock sep-
DEFORMATION MONITORING AT NEVADO DEL RUIZ COLOMBIA 281
20Q
160
Z ~A
1' 8o
4 0
or3
<
- 8 o
<
0 -120 ~ 4
(.9
: ~ - 1 6 o
Z
0
160
L )
1 2 0 >
~ ao
~ 4o
-41
-81
-12£
OLL (3.5 km W from Summit) TALl N
F ,'rUM (4.3 km WNW from Summit) TAU N
n TAU E
[NO (5.5 km NW from Summit) TAU N r-
TAU E
r
I I I I I I I I ; ; I I I I : : I I I I : I I I I I I I I I I
NIE (6.5 km NW From Summit) TAU N
"rAW E
RUE] (5.2 km NE from Summit) TAU N
REC (5.5 km S from Summit) TAU N
e4. TAU E
-160
- 2 0 0 ' ' , I , , , , , , , , , , , I , , , , , , , , , , , i , ,
8 5 8 6 8 7 8 8 NOV 13
YEAR
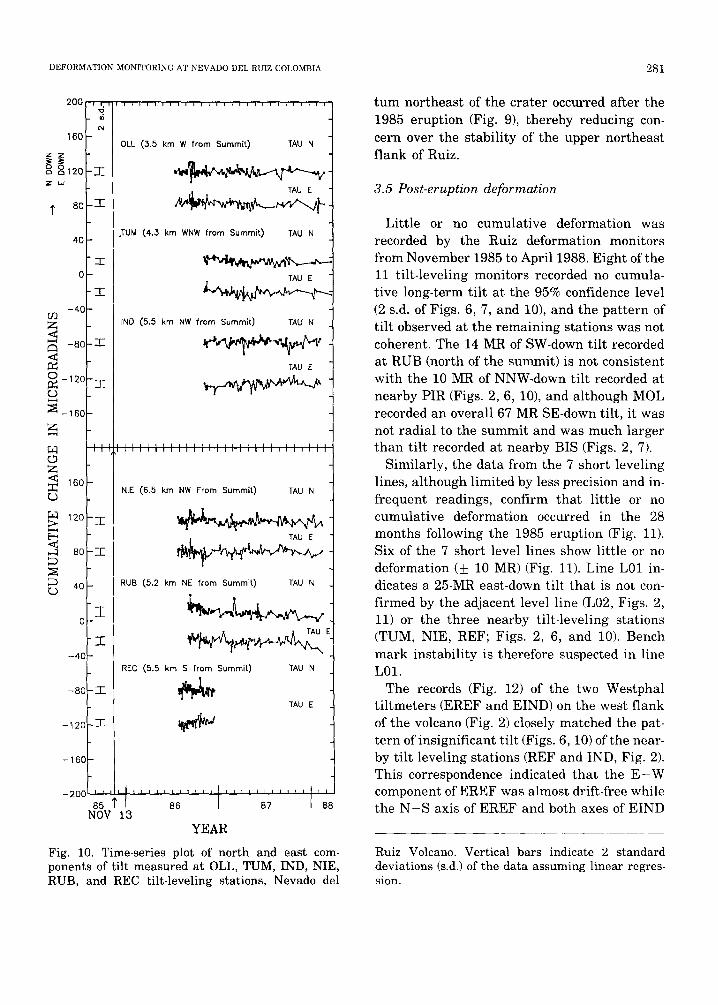
Fig. 10. Time-series plot of north and east com- ponents of tilt measured at OLL, TUM, IND, NIE, RUB, and REC tilt-leveling stations, Nevado del
tum northeast of the crater occurred after the 1985 eruption (Fig. 9), thereby reducing con- cern over the stability of the upper northeast f lank of Ruiz.
3.5 Post-eruption deformation
Little or no cumulative deformation was recorded by the Ruiz deformation monitors from November 1985 to April 1988. Eight of the 11 tilt-leveling monitors recorded no cumula- tive long-term tilt at the 95% confidence level (2 s.d. of Figs. 6, 7, and 10), and the pattern of tilt observed at the remaining stations was not coherent. The 14 MR of SW-down tilt recorded at RUB (north of the summit) is not consistent with the 10 MR of NNW-down tilt recorded at nearby PIR (Figs. 2, 6, 10), and although MOL recorded an overall 67 MR SE-down tilt, it was not radial to the summit and was much larger than tilt recorded at nearby BIS (Figs. 2, 7).
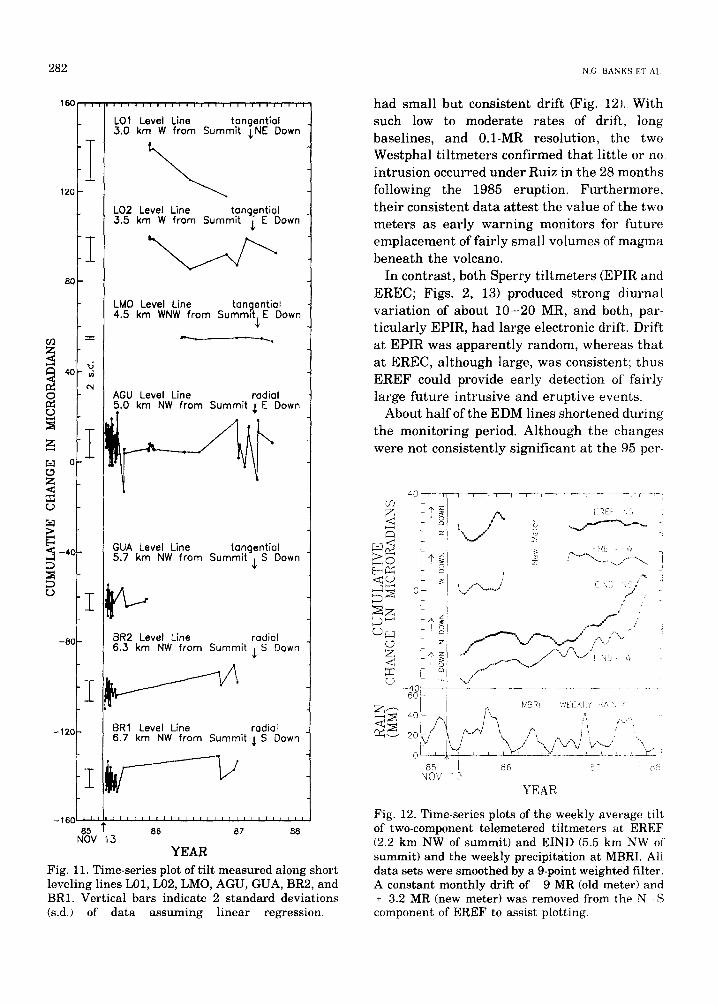
Similarly, the data from the 7 short leveling lines, although limited by less precision and in- frequent readings, confirm that little or no cumulative deformation occurred in the 28 months following the 1985 eruption (Fig. 11). Six of the 7 short level lines show little or no deformation (+_ 10 MR) (Fig. 11). Line L01 in- dicates a 25-MR east-down tilt that is not con- firmed by the adjacent level line (L02, Figs. 2, 11) or the three nearby tilt-leveling stations (TUM, NIE, REF; Figs. 2, 6, and 10). Bench mark instability is therefore suspected in line L01.
The records (Fig. 12) of the two Westphal t i l tmeters (EREF and EIND) on the west flank of the volcano (Fig. 2) closely matched the pat- tern of insignificant tilt (Figs. 6, 10) of the near- by tilt leveling stations (REF and IND, Fig. 2). This correspondence indicated tha t the E - W component of EREF was almost drift-free while the N - S axis of EREF and both axes of EIND
Ruiz Volcano. Vertical bars indicate 2 standard deviations (s.d.) of the data assuming linear regres- sion.
2 8 2 N.G. BANKS ET AL
160
120
0
£
z
r~
>
80
LOt Level Line tangential 3.0 km W from Summit sNE Down
L02 Level Line tancjentiol .3.5 km W from Summit ~ E Down
LMO Level Line tan(~ential 4.5 km WNW from SummltsE Down
AGU Level Line radial 5.0 km NW from Summit ,L E Down
GUA Level Line tangential 5.7 km NW from S u m m i t . S Down ¢
BR2 Level Line radial 6.3 km NW from S u m m i t . S Down ¢
-12(3 BR1 Level Line radial 6.7 km NW from Summit $ S Down
- 1 6 C i ~ 85 T 86 87 88
NOV 13 YEAR
Fig. 11. Time-series plot of tilt measured along short leveling lines L01, L02, LMO, AGU, GUA, BR2, and BRI. Vertical bars indicate 2 standard deviations (s.d.) of data assuming linear regression.
had small but consistent drift (Fig. 12). With such low to moderate rates of drift, long baselines, and 0.1-MR resolution, the two Westphal t i l tmeters confirmed that little or no intrusion occurred under Ruiz in the 28 months following the 1985 eruption. Furthermore, their consistent data attest the value of the two meters as early warning monitors for future emplacement of fairly small volumes of magma beneath the volcano.
In contrast, both Sperry ti l tmeters (EPIR and EREC; Figs. 2, 13)produced strong diurnal variation of about 10-20 MR, and both, par- t icularly EPIR, had large electronic drift. Drift at EPIR was apparently random, whereas that at EREC, although large, was consistent; thus EREF could provide early detection of fairly large future intrusive and eruptive events.
About half of the EDM lines shortened during the monitoring period. Although the changes were not consistently significant at the 95 per-
U? z
~ z ~,..- (.D :E.~,
r..D
L)
+I o
t
t
¸--40
[:REP
l
,,' [
f "~" y
i . . . . . . . . . . . . . . . . . . . . 1
60 + ,~ ~,.. F MBRi MECK[ ': : !
~' E / X / '\ :'%/X/ Y'-~' ",~ o ~ ~ ~ - - ~ - ~ ............. ~ . . . . . ~-~!
85 I 86 {-~7 ' ::5, NOV i:¢
YEAR
Fig. 12. Time-series plots of the weekly average tilt of two-component telemetered tiltmeters at EREF (2.2 km NW of summit) and EIND (5.5 km NW of summit) and the weekly precipitation at MBRI. All data sets were smoothed by a 9-point weighted filter. A constant monthly drift of -9 MR (old meter) and + 3.2 MR (new meter) was removed from the N-S component of EREF to assist plotting.
DEFORMATION MONITORING AT NEVADO DEL RUIZ COLOMBIA 283
cent confidence level (Figs. 4, 9, 14, 15), con- t inuat ion of the t rends would lead to statistical- ly detectable, a l though minor, deformation. Because the lines slope upward toward the summit, shortening is consistent with ei ther a shallow intrusion beneath the volcano (not detected by the til t leveling nor the t i l tmeters) or general depression (deflation) of the central edifice with respect to the outer flanks upon which the ins t rument stations are located.
In summary, deformation monitoring during the 28-month period after the November 1985 eruption demonstrated geodetic stability at Ruiz tha t limits interpretat ions of volcanic ac- t ivity by indicating that from October 1985 to March 1988: - Less than 3 MCM of magma moved above a
depth of about 3 km. - Less than 10 MCM of magma moved above a
depth of about 7 km. - Less than 200 MCM magma was emplaced
above a depth of about 15 km.
2 5 0
Ef~ z <
~ 0 E'-'~
~ Z
c..)M
z .<
r_)
- 2 5 0
NOV 15
' ' ' ' / t ~ ' ' 'z'~ ' EP~R' ' ' 'RADIAL' i , , , , , , i , , , f ' / ' ~ , , i
5 .5 km NE f r o m S u m m i t J ~ I v
' /:4 - y
~ E R E C - RADIAL 3.5 km SSE f r o m S u m m i t
i i i i I~L ~ ~ I I I i I I I I I I I I I I I I L I I h I
85 ' 1 86 I I 88 YEAR
Fig. 13. Time-series plots of average daily tilt measured by telemetered one-component tiltmeters at EPIR (5.5 km from the summit) and EREC (3.3 km SE from the summit), Nevado del Ruiz Volcano.
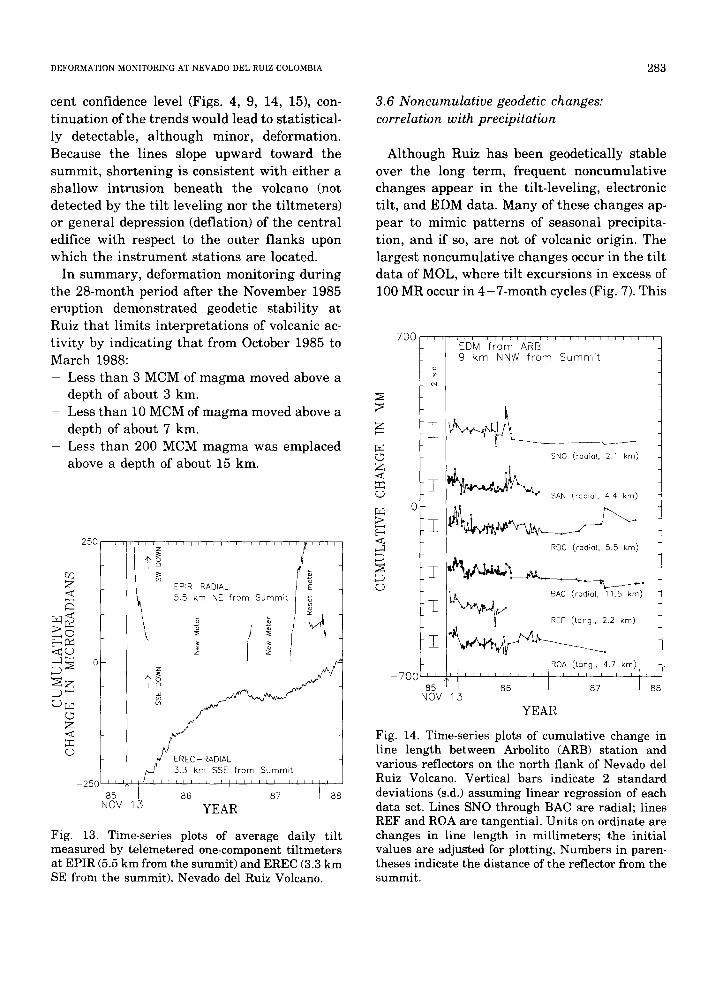
3.6 Noncumulative geodetic changes: correlation with precipitation
Although Ruiz has been geodetically stable over the long term, frequent noncumulat ive changes appear in the tilt-leveling, electronic tilt, and EDM data. Many of these changes ap- pear to mimic pat terns of seasonal precipita- tion, and if so, are not of volcanic origin. The largest noncumulative changes occur in the til t data of MOL, where tilt excursions in excess of 100 MR occur in 4 - 7 - m o n t h cycles (Fig. 7). This
2s
o 2s <
;>
<
70O i i
~5 - d
_ c - i
}Z O-
:Z
- 7 0 0 ~ 85
NOV
i ) i , ~ i i i ~ L i i i i i ~ i i L I ~ I I I 1 1 E I
EDM from ARB 9 km NNW from Summit
~ SNO (tad a , ~ )
~f l ./. BAC (radlal, 11.5 kin) -
~ 2 kin)
ROA (tan%, 4.7 kin) i l l I I L I i i i L I I I I i i i I I i I J i I I ~ L
1" 86 87 88 15
YEAR
Fig. 14. Time-series plots of cumulative change in line length between Arbolito (ARB) station and various reflectors on the north flank of Nevado del Ruiz Volcano. Vertical bars indicate 2 standard deviations (s.d.) assuming linear regression of each data set. Lines SNO through BAC are radial; lines REF and ROA are tangential. Units on ordinate are changes in line length in millimeters; the initial values are adjusted for plotting. Numbers in paren- theses indicate the distance of the reflector from the summit.
284 N.(; BANKS ET AL
tilt is well outside reading error, occurs in regular patterns, and thus reflects tilting of the station. An intrusion-related origin of the tilt is ruled out because it is noncumulative and no other station recorded tilt of this magnitude, in- cluding BIS, only 600 m distant from MOL (see Fig. 2 for locations; compare MOL and BIS data, Fig. 7).
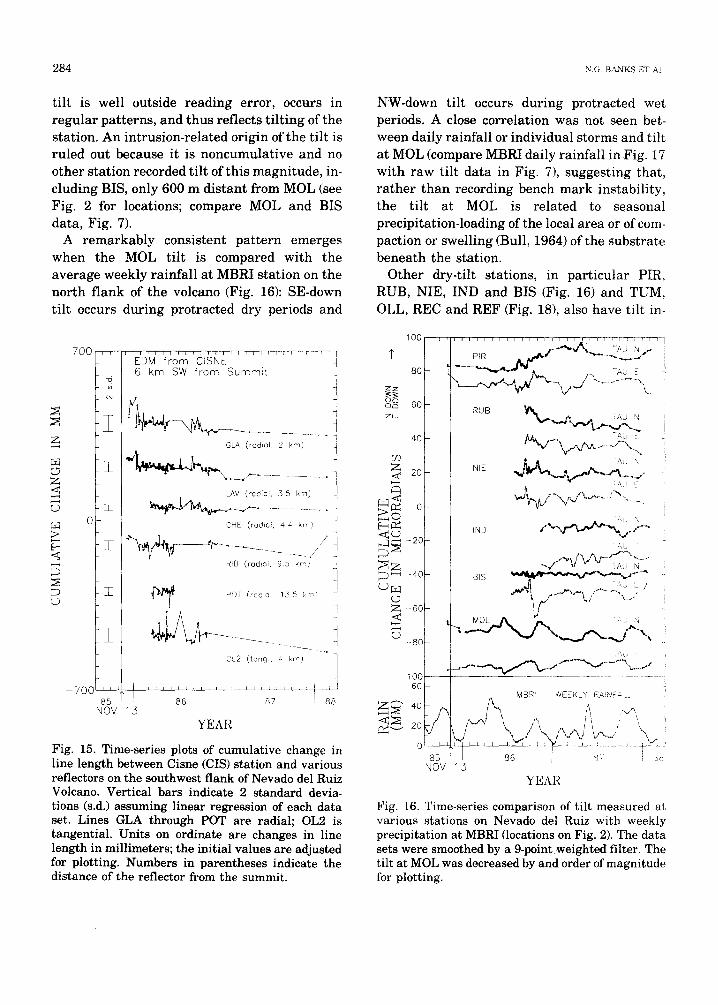
A remarkably consistent pattern emerges when the MOL tilt is compared with the a~erage weekly rainfall at MBRI station on the north flank of the volcano (Fig. 16): SE-down tilt occurs during protracted dry periods and
Z
2: <
c)
~a >
<
(D
7 0 0 i I ~ F i r ~ i i i i r ~ i ~ , r i ~ ~ i 1 i ~ ~ i ~ i ~ i
EDM from CISNE 6 km SW from Summit
(w
-Z
-2I_
700
GLA (radial, 2 kin)
I~V (radial, .3 5 kin)
CHE (radio!, 4 4 kin)
RID (radio!, 9.5 k r r )
- ~ ~ POT (radia, 135 kn"i
OL2 (tang., 4 kin)
I I I 1, I I I I I I I I I ~ ~ !
85 ' 86 NOV 15
! 1 ! 1
4
1 i 4
! 8 7 ' 88
Y E A R
Fig. 15. Time-series plots of cumulative change in line length between Cisne (CIS) station and various reflectors on the southwest flank of Nevado del Ruiz Volcano. Vertical bars indicate 2 standard devia- tions (s.d.) assuming linear regression of each data set. Lines GLA through POT are radial; OL2 is tangential. Units on ordinate are changes in line length in millimeters; the initial values are adjusted for plotting. Numbers in parentheses indicate the distance of the reflector from the summit.
NW-down tilt occurs during protracted wet periods. A close correlation was not seen bet- ween daily rainfall or individual storms and tilt at MOL (compare MBRI daily rainfall in Fig. 17 with raw tilt data in Fig. 7), suggesting that, rather than recording bench mark instability, the tilt at MOL is related to seasonal precipitation-loading of the local area or of com- paction or swelling (Bull, 1964) of the substrate beneath the station.
Other dry-tilt stations, in particular PIR, RUB, NIE, IND and BIS (Fig. 16) and TUM, OLL, REC and REF (Fig. 18), also have tilt in-
100
t 8O
ZZ 0(3 C~C~ 60 ZtJ
40
59 Z 2O
N z ; D ~ -40 cO M
Z -6o < m {D
--8o
85 NOV
t i i I i i i I 1 , ~ i i i ~ i t " - i ~ - - r - l ' - r T ' ~ T ' , - - - - - - 1
, ~ .)"m__ i, ~AJ ~ 4 X ~ W~/~, ' - ........ \,,< i
TAU F
! i^< i
~ " M ' - * x V ' 7 ~ " : " * . . . . i A L X il
q iND
BIS
A U
"~ <i.i :
i MBR WEEKLY RAiFiF;, , !
' / 86 J R : ! 6f ~
Y E A R
Fig. 16. Time-series comparison of tilt m e a s u r e d a t
various stations on Nevado del Ruiz with weekly precipitation at MBRI (locations on Fig. 2). The data sets were smoothed by a 9-point weighted filter. The tilt at MOL was decreased by and order of magnitude for plotting.
D E F O R M A T I O N M O N I T O R I N G A T N E V A D O D E L R U I Z C O L O M B I A 285
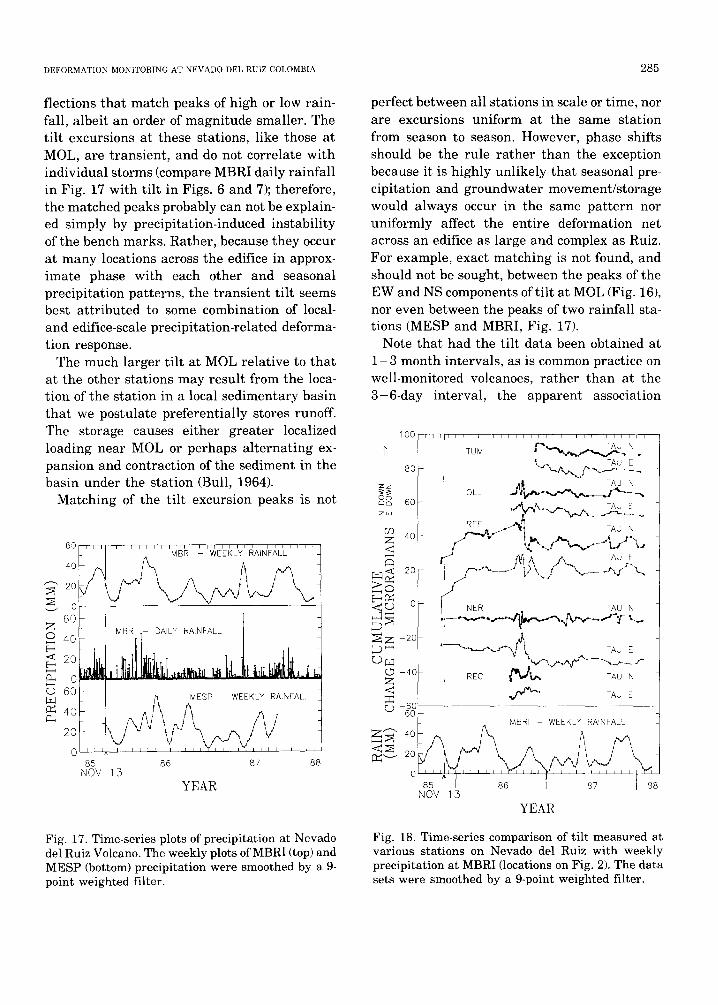
flections tha t match peaks of high or low rain- fall, albeit an order of magni tude smaller. The tilt excursions at these stations, like those at MOL, are t ransient , and do not correlate with individual storms (compare MBRI daily rainfall in Fig. 17 with til t in Figs. 6 and 7); therefore, the matched peaks probably can not be explain- ed simply by precipitation-induced instabili ty of the bench marks. Rather, because they occur at many locations across the edifice in approx- imate phase with each other and seasonal precipitation patterns, the t rans ient tilt seems best a t t r ibuted to some combination of local- and edifice-scale precipitation-related deforma- tion response.
The much larger ti l t at MOL relative to tha t at the other stations may result from the loca- tion of the station in a local sedimentary basin tha t we postulate preferent ial ly stores runoff. The storage causes ei ther greater localized loading near MOL or perhaps a l ternat ing ex- pansion and contraction of the sediment in the basin under the station (Bull, 1964).
Matching of the til t excursion peaks is not
6O
4O
2o
o z 60 ~ 40-
2o
ol
m 4o
2o
' ' V~E'EKL'Y . . . . . . . . I i i i i i ~ ~ i i i i i i i i
MBRI - RAINFALL
85 NOV 15
MBRi . - DAILY RAINFALL
86 87 88
YEAR
Fig. 17. Time-series plots of precipitation at Nevado del Ruiz Volcano. The weekly plots of MBRI (top) and MESP (bottom) precipitation were smoothed by a 9- point weighted filter.
perfect between all stations in scale or time, nor are excursions uniform at the same station from season to season. However, phase shifts should be the rule ra ther than the exception because it is highly unlikely that seasonal pre- cipitation and groundwater movement/storage would always occur in the same pat tern nor uniformly affect the entire deformation net across an edifice as large and complex as Ruiz. For example, exact matching is not found, and should not be sought, between the peaks of the EW and NS components of tilt at MOL (Fig. 16), nor even between the peaks of two rainfall sta- tions (MESP and MBRI, Fig. 17).
Note that had the tilt data been obtained at 1 - 3 month intervals, as is common practice on well-monitored volcanoes, ra ther than at the 3 -6 -day interval, the apparent association
1 0 0 , ,
8 0
z z D o ~ 60 ZLI
Z 4o <
o
~ Z -20
r..p~ 0 -40 Z .<
LO 6O 6 0
Z f - ~..~ 40
1:~ " - " 2 0
0
i I i i i i i ~ i , i , i i i i ! i i i ~ i i i i
TUM ~ ~ TAU E
~AU N QLL . ~ -~.,~
NER TAU N
REC ~ TAU N
TAU E
MBRI - WEEKLY RAINFALL
85 86 87 88 NOV 15
YEAR
Fig. 18. Time-series comparison of tilt measured at various stations on Nevado del Ruiz with weekly precipitation at MBRI (locations on Fig. 2). The data sets were smoothed by a 9-point weighted filter.
2 8 6 N.G. BANKS ET AL
with precipitation would not have been detec- table in the data. Instead, the tilt changes would have been described in terms of volcano- related tilt, unstable bench marks, or "noise". Note also that there is a tendency (9 out of 11 stations) for the E - W component of tilt to be more reactive than the N - S component of tilt (Figs. 16, 18). This produces a general E - W pattern in the tilt excursions that would not be expected if the tilt was related to random error or bench mark instability. However, the pat- tern makes sense in terms of general E - W flex- ing of the edifice in relation to regional and
500
ARS-SNO
z
r~ 0 Z <
LP
;:>
-< ,--]
-50C 60
,---~ ~ 40
ARB-ROC
ARB-REF
' ~ . ¢ ~ % v - ~ 2 J " ARB-ROA
BIL-ICE
B/L-LAG
BIL--MUR
CfS-GLA
CIS-LAV
CIS--- CHE
CIS-R~D
AZ O - BAS
MBRI - WEEKLY RAINFALL
85 r I 86 I 87 i 88 NOV 13
YEAR
Fig. 19. Time-series comparison of cumulative change in line length measured at ARB, BIL, CIS and AZU EDM stations with precipitation at MBRI (locations on Figs. 2, 3). The data sets were smoothed by a 9-point weighted filter.
local precipitation shadows associated with the general E - W wind direction at Ruiz.
Fluctuations similar in wavelength, ampli- tude, and timing occur in the electronic tilt data (Fig. 12) in which there is a fairly consis- tent pattern of SE down tilt at EREF and EIND during seasonal dry periods, with reversals of tilt at EIND being larger and lagging behind the reversals of precipitation by 30 to 45 days. The electronic tilt excursions are similar in magnitude to those detected by the tilt-leveling stations and likewise do not seem closely related to individual storms.
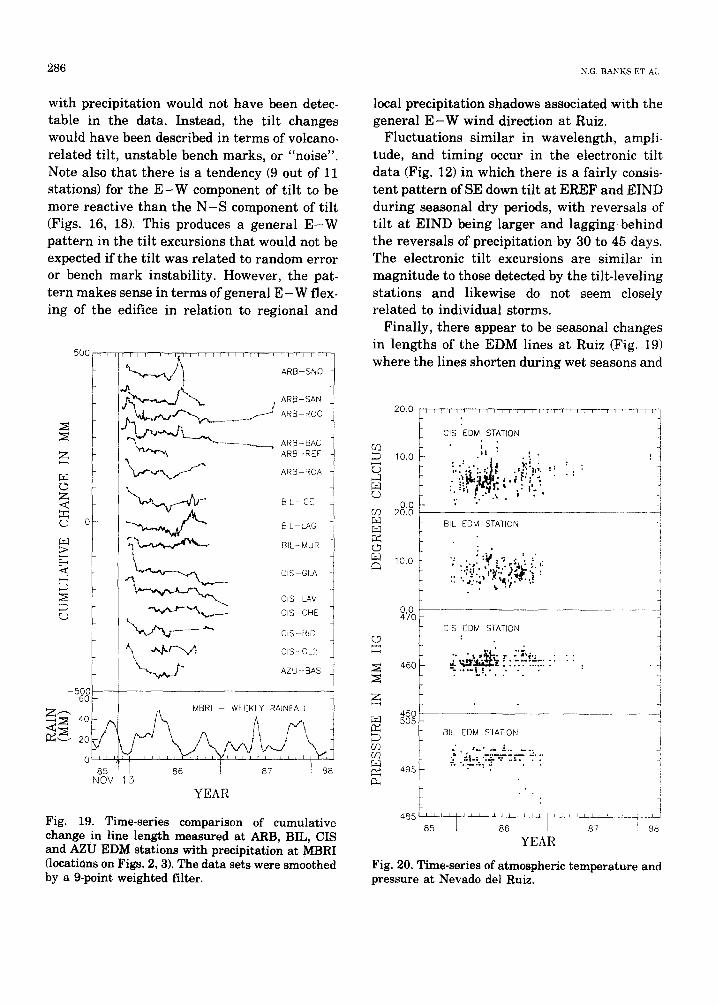
Finally, there appear to be seasonal changes in lengths of the EDM lines at Ruiz (Fig. 19) where the lines shorten during wet seasons and
u ]
r.D
.[=] r.)
g~
r.o u:::
20.0
10.0
0.0 20.0
10.0
0.0 47Q
,~ 460
z 450 505
CIS EDM STATION
I :I " f •
, : .;..:.,:h, " ' , ~:. " 1 , ; .
i Pi !i, ,,.': BiL EDM STATION
• : I
i
"" . : ' , " ,. ~ : O ~ " £,:
• . *,,. . ! ."
C[S EDM STATION
- %~'~*t ~ ...... "~-" ..-. . . . . ,%,; . . ,
[z.] !
BIL EDM STATION i
O'Q J ~'-" . . " . . . . . . i r n " i~',-:. '.:'z.. "• ' . '-: ' : ' : '- i "
4 9 5 ' " - " " : ".' '
I::L
I
J
85 86 87 88
YEAR
Fig. 20. Time-series of atmospheric temperature and pressure at Nevado del Ruiz.
D E F O R M A T I O N M O N I T O R I N G A T N E V A D O D E L R U I Z C O L O M B I A 2 8 7
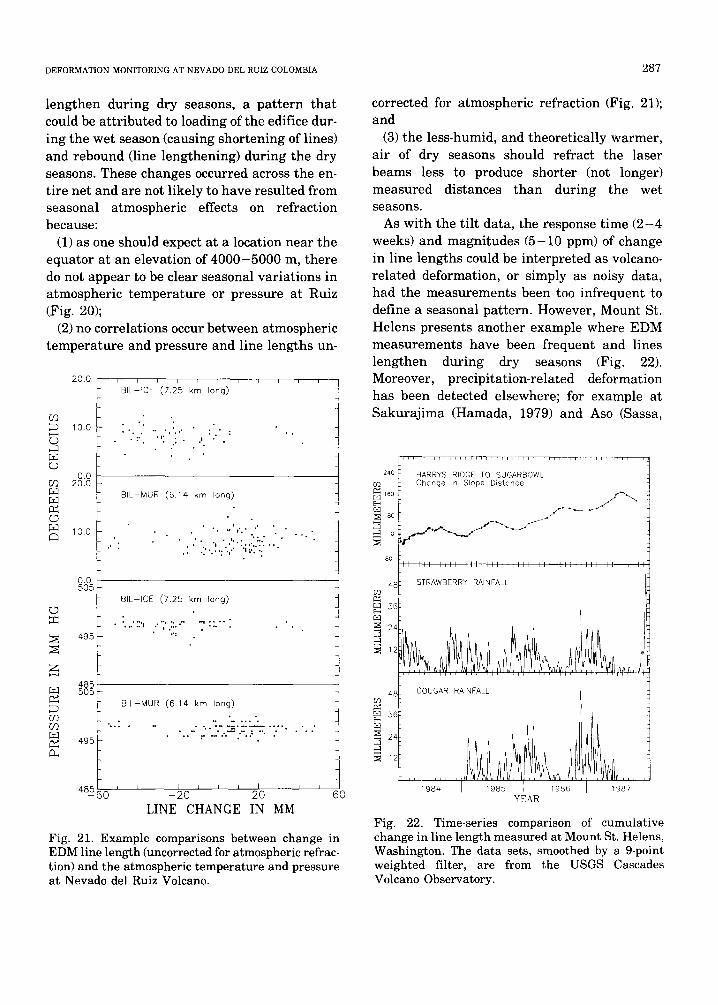
lengthen during dry seasons, a pat tern tha t could be at tr ibuted to loading of the edifice dur- ing the wet season (causing shortening of lines) and rebound (line lengthening) during the dry seasons. These changes occurred across the en- tire net and are not likely to have resulted from seasonal atmospheric effects on refraction because:
(1) as one should expect at a location near the equator at an elevation of 4000-5000 m, there do not appear to be clear seasonal variations in atmospheric temperature or pressure at Ruiz (Fig. 2O);
(2) no correlations occur between atmospheric temperature and pressure and line lengths un-
O'3
U
ro
50
o
z
27-3
O0 50 [.ra
~L
20.0
10.0
0.0 20.0
10.0
0.0 505
4-95
485 505
495
4856(
i i i i i i
BE-ICE (7.25 km long)
• . .• , , •
,':.°. I. '"" I : .''
BiL-MUR (6.14 krn long)
i • , • , £ , , '
• • , i • • ° : , " " • • • • , ' , • , , ' , • " • . : . . . . . : ".,.' "a : . . . :
B/L-ICE (7.25 km long)
• - . . . . ::., . . . : . . : : . . . . . . . : : . "
BIL-MUR (6.14 km long)
.• • . . . . . " ,
• • • • •o : • • , • ' ,%* - ° o•,•, .~ ••% • • • •
I I I I I I I ] I I I
- 2 0 20 60
LINE CHANGE IN MM
Fig. 21. Example comparisons between change in EDM line length (uncorrected for atmospheric refrac- tion) and the atmospheric temperature and pressure at Nevado del Ruiz Volcano•
corrected for atmospheric refraction (Fig. 21); and
(3) the less-humid, and theoretically warmer, air of dry seasons should refract the laser beams less to produce shorter (not longer) measured distances than during the wet seasons•
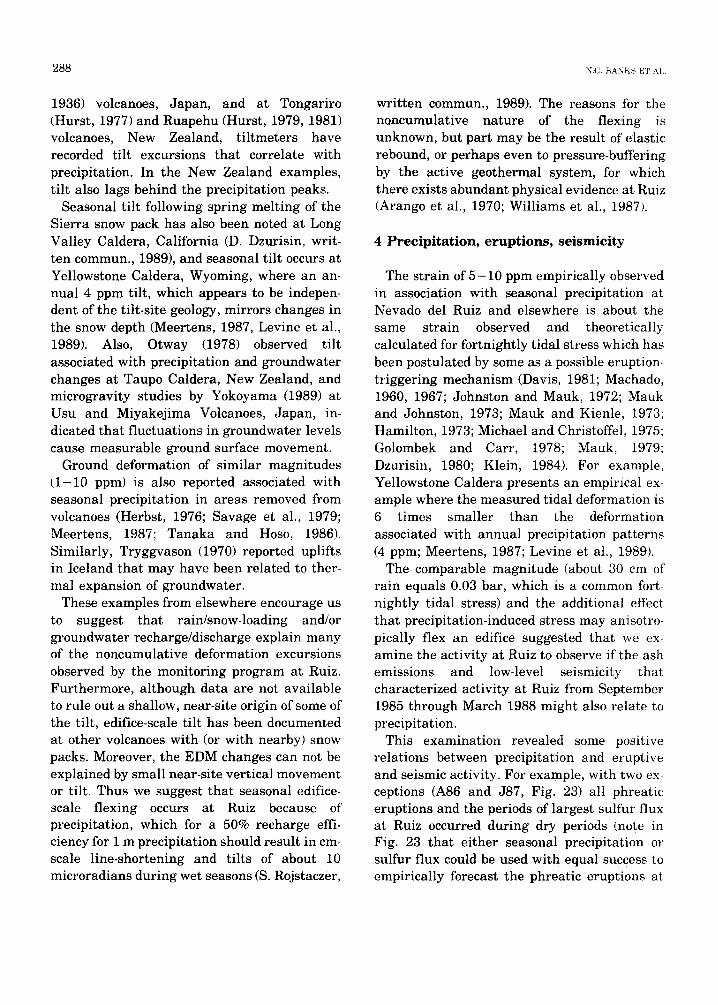
As with the tilt data, the response time (2-4 weeks) and magnitudes (5-10 ppm) of change in line lengths could be interpreted as volcano- related deformation, or simply as noisy data, had the measurements been too infrequent to define a seasonal pattern. However, Mount St. Helens presents another example where EDM measurements have been frequent and lines lengthen during dry seasons (Fig. 22). Moreover, precipitation-related deformation has been detected elsewhere; for example at Sakuraj ima (Hamada, 1979) and Aso (Sassa,
240
G9
4~ 09
2~
4~ u ?
~ 2~
12
, , , , , , , , , , , , i , , , , , , ~ , , , , , , , , , , . . . . , F , , , : , ~ , , , ,
HARRYS R IDGE TQ SUGARBOWL Chcnge in Slope Distonce
I I l l l I l l ; l l i l l l l l l l ; l l l l l l l l l l ~ l i l l l l l l l l l l l l l
I STRAWBERRY RA INFALL
E, /
COUGAR RA INFALL
. . . . . . . . . . . . .
~98~ I 198s 1 1986 Y E A R
1987
Fig. 22. Time-series comparison of cumulative change in line length measured at Mount St. Helens, Washington. The data sets, smoothed by a 9-point weighted filter, are from the USGS Cascades Volcano Observatory.
288 N.(.~. BANKS ET AI,
1936) volcanoes, Japan, and at Tongariro (Hurst, 1977) and Ruapehu (Hurst, 1979, 1981) volcanoes, New Zealand, tiltmeters have recorded tilt excursions that correlate with precipitation. In the New Zealand examples, tilt also lags behind the precipitation peaks.
Seasonal tilt following spring melting of the Sierra snow pack has also been noted at Long Valley Caldera, California (D. Dzurisin, writ- ten commun., 1989), and seasonal tilt occurs at Yellowstone Caldera, Wyoming, where an an- nual 4 ppm tilt, which appears to be indepen- dent of the tilt-site geology, mirrors changes in the snow depth (Meertens, 1987, Levine et al., 1989). Also, Otway (1978) observed tilt associated with precipitation and groundwater changes at Taupo Caldera, New Zealand, and microgravity studies by Yokoyama (1989) at Usu and Miyakejima Volcanoes, Japan, in- dicated that fluctuations in groundwater levels cause measurable ground surface movement.
Ground deformation of similar magnitudes (1-10 ppm) is also reported associated with seasonal precipitation in areas removed from volcanoes (Herbst, 1976; Savage et at., 1979; Meertens, 1987; Tanaka and Hoso, 1986). Similarly, Tryggvason (1970) reported uplifts in Iceland that may have been related to ther- mal expansion of groundwater.
These examples from elsewhere encourage us to suggest that rain/snow-loading and/or groundwater recharge/discharge explain many of the noncumulative deformation excursions observed by the monitoring program at Ruiz. Furthermore, although data are not available to rule out a shallow, near-site origin of some of the tilt, edifice-scale tilt has been documented at other volcanoes with (or with nearby) snow packs. Moreover, the EDM changes can not be explained by small near-site vertical movement or tilt. Thus we suggest that seasonal edifice- scale flexing occurs at Ruiz because of precipitation, which for a 50% recharge effi- ciency for 1 m precipitation should result in cm- scale line-shortening and tilts of about 10 microradians during wet seasons (S. Rojstaczer,
written commun., 1989). The reasons for the noncumulative nature of the flexing is unknown, but part may be the result of' elastic rebound, or perhaps even to pressure-buffering by the active geothermal system, for which there exists abundant physical evidence at Ruiz (Arango et al., 1970; Williams et al., 1987).
4 Precipitation, eruptions, seismicity
The strain of 5-10 ppm empirically observed in association with seasonal precipitation at Nevado del Ruiz and elsewhere is about the same strain observed and theoretically calculated for fortnightly tidal stress which has been postulated by some as a possible eruption- triggering mechanism (Davis, 1981; Machado, 1960, 1967; Johnston and Mauk, 1972; Mauk and Johnston, 1973; Mauk and Kienle, 1973; Hamilton, 1973; Michael and Christoffel, 1975; Golombek and Carr, 1978; Mauk, 1979; Dzurisin, 1980; Klein, 1984). For example, Yellowstone Caldera presents an empirical ex- ample where the measured tidal deformation is 6 times smaller than the deformation associated with annual precipitation patterns (4 ppm; Meertens, 1987; Levine et al., 1989).
The comparable magnitude (about 30 cm of rain equals 0.03 bar, which is a common fort- nightly tidal stress) and the additional effect that precipitation-induced stress may anisotro- pically flex an edifice suggested that we ex- amine the activity at Ruiz to observe if the ash emissions and low-level seismicity that characterized activity at Ruiz from September 1985 through March 1988 might also relate to precipitation.
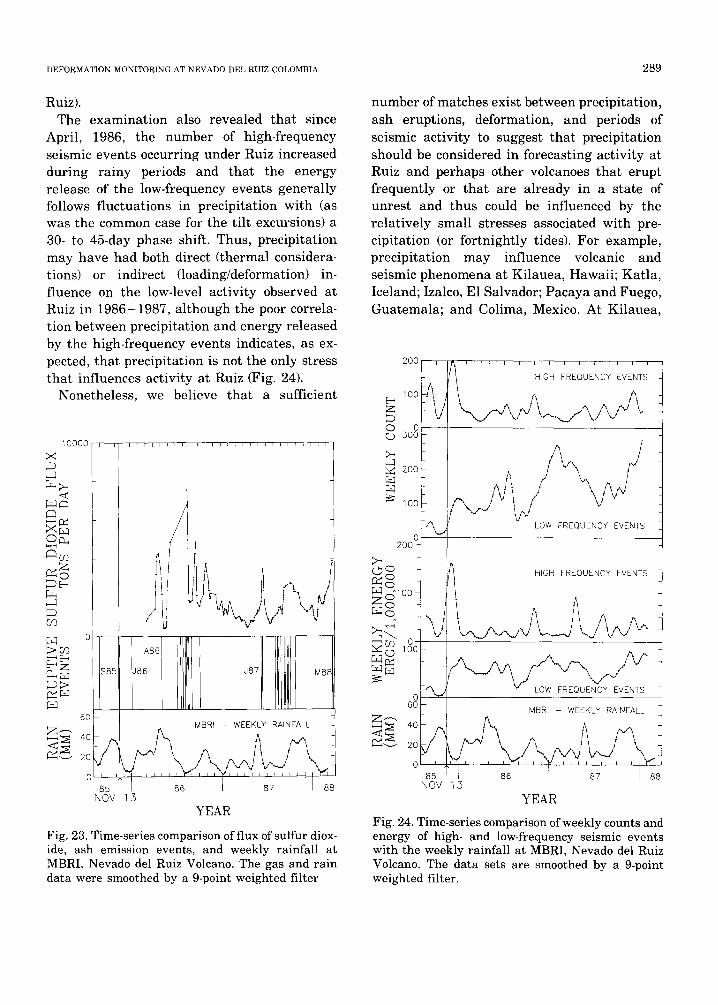
This examination revealed some positive relations between precipitation and eruptive and seismic activity. For example, with two ex- ceptions (A86 and J87, Fig. 23) all phreatic eruptions and the periods of largest sulfur flux at Ruiz occurred during dry periods (note in Fig. 23 that either seasonal precipitation or sulfur flux could be used with equal success to empirically forecast the phreatic eruptions at
DEFORMATION MONITORING AT NEVADO DEL RUIZ COLOMBIA 289
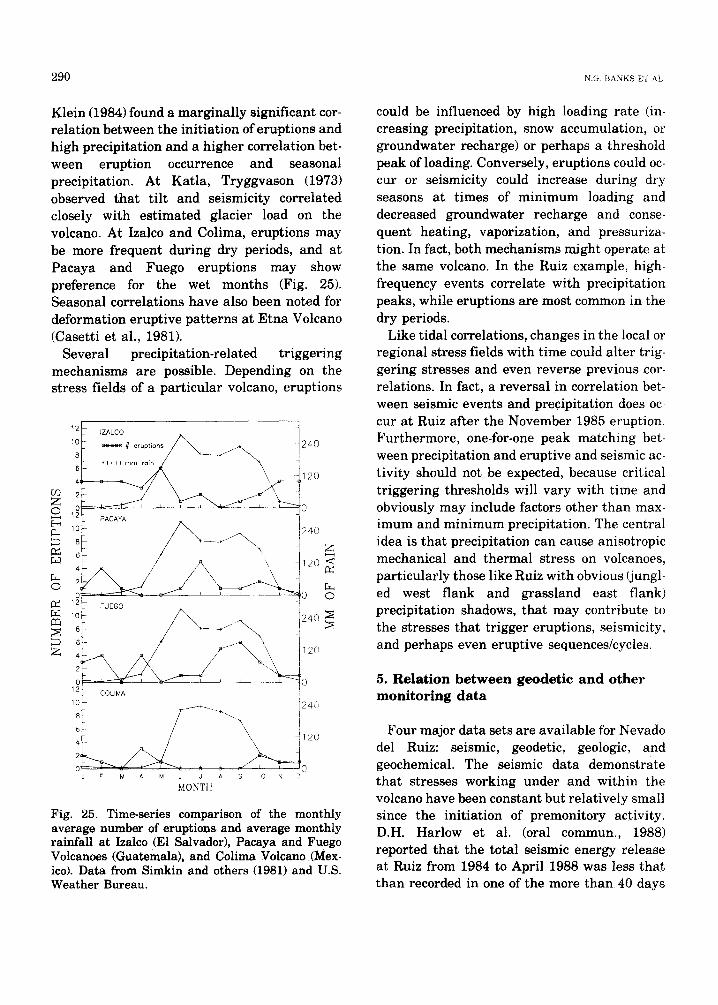
Ruiz). The examination also revealed tha t since
April, 1986, the number of high-frequency seismic events occurring under Ruiz increased during rainy periods and that the energy release of the low-frequency events generally follows fluctuations in precipitation with (as was the common case for the tilt excursions) a 30- to 45-day phase shift. Thus, precipitation may have had both direct (thermal considera- tions) or indirect (loading/deformation) in- fluence on the low-level activity observed at Ruiz in 1986-1987, although the poor correla- tion between precipitation and energy released by the high-frequency events indicates, as ex- pected, that precipitation is not the only stress tha t influences activity at Ruiz (Fig. 24).
Nonetheless, we believe that a sufficient
10000
x
[-T.3 ~
Xr..4
C3m
,--7
Oq
[_7_7 c
~ Z
~ -r..4
6O
~85 J86 J87 M88
i MBRI - WEEKLY RAINFALL
85 86 87 88 NOV 15
YEAR
Fig. 23. Time-series comparison of flux of sulfur diox- ide, ash emission events, and weekly rainfall at MBRI, Nevado del Ruiz Volcano. The gas and rain data were smoothed by a 9-point weighted filter
number of matches exist between precipitation, ash eruptions, deformation, and periods of seismic activity to suggest that precipitation should be considered in forecasting activity at Ruiz and perhaps other volcanoes that erupt frequently or tha t are already in a state of unrest and thus could be influenced by the relatively small stresses associated with pre- cipitation (or fortnightly tides). For example, precipitation may influence volcanic and seismic phenomena at Kilauea, Hawaii; Katla, Iceland; Izalco, E1 Salvador; Pacaya and Fuego, Guatemala; and Colima, Mexico. At Kilauea,
200 1 ' '
ZE-~ 1 0 0 1 %
0 30 o
~ 20O
lOOL :%
f ~ ~ s ' '
LOW FREQUENCY EVENTS
O o
["t-] C# 10 0 - Z o
~" U? V
MBRI WEEKLY RAINFALL
85 86 87 88 NOV 1,5
YEAR
Fig. 24. Time-series comparison of weekly counts and energy of high- and low-frequency seismic events with the weekly rainfall at MBRI, Nevado del Ruiz Volcano. The data sets are smoothed by a 9-point weighted filter.
290 NX; BANKS ET AL
Klein (1984) found a marginally significant cor- relation between the initiation of eruptions and high precipitation and a higher correlation bet- ween eruption occurrence and seasonal precipitation. At Katla, Tryggvason (1973) observed that tilt and seismicity correlated closely with est imated glacier load on the volcano. At Izalco and Colima, eruptions may be more frequent during dry periods, and at Pacaya and Fuego eruptions may show preference for the wet months (Fig. 25). Seasonal correlations have also been noted for deformation eruptive pat terns at Etna Volcano (Casetti et al., 1981).
Several precipitation-related triggering mechanisms are possible. Depending on the stress fields of a part icular volcano, eruptions
5Q z ©
O
z
12 ~ }ZALCO
6~- . . . . . . . . . ~ .4 \ 4-b = _ A \ " , \ 120
0 , ~ 0
o~_ ruEoo - - _T O o
:E / --"3,"x
12 COLiMA J l o ~ --,,-. 2 4 0
8' ( ~ ~-"',\ 4
F M A M J J A S @ N D
MONTH
Fig. 25. Time-series comparison of the monthly average number of eruptions and average monthly rainfall at Izalco (El Salvador), Pacaya and Fuego Volcanoes (Guatemala), and Colima Volcano (Mex- ico). Data from Simkin and others (1981) and U.S. Weather Bureau.
could be influenced by high loading rate (in- creasing precipitation, snow accumulation, or groundwater recharge) or perhaps a threshold peak of loading. Conversely, eruptions could oc- cur or seismicity could increase during dry seasons at t imes of minimum loading and decreased groundwater recharge and conse- quent heating, vaporization, and pressuriza- tion. In fact, both mechanisms might operate at the same volcano. In the Ruiz example, high- frequency events correlate with precipitation peaks, while eruptions are most common in the dry periods.
Like tidal correlations, changes in the local or regional stress fields with time could alter trig- gering stresses and even reverse previous cor- relations. In fact, a reversal in correlation bet- ween seismic events and precipitation does oc- cur at Ruiz after the November 1985 eruption. Furthermore, one-for-one peak matching bet- ween precipitation and eruptive and seismic ac- t ivity should not be expected, because critical triggering thresholds will vary with time and obviously may include factors other than max- imum and minimum precipitation. The central idea is that precipitation can cause anisotropic mechanical and thermal stress on volcanoes, particularly those like Ruiz with obvious (jungl- ed west flank and grassland east flank) precipitation shadows, that may contribute to the stresses that trigger eruptions, seismicity, and perhaps even eruptive sequences/cycles.
5. Relation between geodetic and other monitoring data
Four major data sets are available for Nevado del Ruiz: seismic, geodetic, geologic, and geochemical. The seismic data demonstrate that stresses working under and within the volcano have been constant but relatively small since the initiation of premonitory activity. D.H. Harlow et al. (oral commun., 1988) reported that the total seismic energy release at Ruiz from 1984 to April 1988 was less that than recorded in one of the more than 40 days
DEFORMATION MONITORING AT NEVADO DEL RUIZ COLOMBIA 291
of seismicity that preceded the Mount St. Helens eruption in 1980. The geodetic monitors indicate that there has been no cumulat ive pressurization or intrusion of Ruiz since Oc- tober 1985. The geologic data indicate a modest volume (Calvache, 1987; Calvache et al., 1987) for the highly crystalline and largely degassed magma that was erupted (Melson et al., 1986) and that the ash events from 1986 to 1988 were of small volume and phreatic in nature. However, the flux of sulfur has been higher at Ruiz than at most other volcanoes in states of unrest or even those in actual magmatic erup- tion (Williams, 1987; Williams et al., 1987; Williams and Meyer, 1988). Williams and Meyer (1988) reported that more than 2.5 x 10⁶ metric tons of sulfur was produced at Ruiz between September 1985 and April 1988, and Williams et al. (1987) determined the isotopic composition of the sulfur to be ÷ 2.0 per mil, ap- proximately centered on fields of both magmatic sulfides and sulfides of disseminated porphyry deposits (Ohmoto and Rye, 1978).
The sulfur content of glass inclusions in phenocrysts of the magma erupted on 13 November 1985 is 675 ppm (Williams et al., 1987), a fact which led Williams and Meyer (1988) to conclude that at least 4 - 8 km 3 of this magma would be required to furnish the observed sulfur flux. However, a magmatic source could be 2 - 4 t imes larger (8 -32 km 3) to account for the low glass content of magma, about 56% (Melson et al., 1986), and the possibility that the melt inclusion analyzed had been enriched in sulfur over the free melt ow- ing to rejection of sulfur into the inclusion dur- ing growth of its ansulfurous host phenocryst. Finally, observed and experimental pressure dependance of sulfur solubility (Moore, 1965; Haughton and Roeder, 1971; Haughton and Skinner, 1972; Haughton et al., 1974; Banks, 1982; Lipman et al., 1985; Lipman and Banks, 1987; Greenland, 1987a,b) requires a shallow source ( < 5 km) for sulfur emitted directly from a magma without significant cooling or crystallization.
Several models have been advanced to ex- plain these data sets. At least three end- member models were presented at the Workshop - A Model for Nevado del Ruiz - convened by Williams and Meyer (1988) in March-Apr i l 1988 that fit within the geologic, seismic, deformational, and gas geochemical constraints observed from 1985 into 1988. No model uniquely fits all the data sets.
This is an important point, because each end- member model presents profoundly different implications for the risks faced by and actions required in current civil defense and public planning for events at Ruiz. Thus, all modeling, particularly that with hazards implications, should be carefully examined for al ternatives that also fit within all available data sets.
For example, are there alternatives to the ominous suggestion of Williams et al. (1987) that " the gas flux and (sulfur) isotopic data ... require that a significant volume of new magma is available for degassing at shallow depth beneath Ruiz," to Williams' (1987) postulate that we "consider the possibility that the activity to date is actually premonitory to the true 'paroxysmal' eruption," and to Williams' and Meyers' (1988) hypothesis that " the sulfur flux might have a less hazardous in- terpretat ion because it might have "exsolved over a long period of time and collected in pore spaces beneath an impermeable hydrothermal cap"?
The deformation and geologic data suggest to us at least one more al ternative in which magma bodies of various (but not necessarily batholithic) sizes have periodically intruded the volcano to produce a sustained geothermal system, perhaps more complex in form and history than the one described by Williams and Meyer (1988). With such a scenario, sulfides deposited by the hydrothermal systems associated with previous intrusions are the cur- rent source of the higher sulfur flux at Ruiz. Such a sulfur source would be isotopically in- distinguishable from "magmatic" sulfur, and hydrothermal sulfides are in fact observed in
2 9 2 N.c~. BANKS ET AL
the lithic blocks ejected during the 1985 erup- tion (M.L. Calvache, oral commun., 1988). Mobilization of these previously deposited sulfides could take several forms but would be most easily accomplished by stoping of sulfide- bearing roof rock during intrusion (or remobilization) of sulfide-saturated magma at any depth. Moreover, the volume of the magma required could be reasonably small, need not have explosive characteristics, and could lie essentially dormant or at a depth too great to be detected by the deformation monitoring.
Under such a scenario, eruption at Ruiz dur- ing this cycle of activity would not deviate significantly in size and style from the 9 known eruptions of the past 2100 years. These erup- tions produced small to modest deposits of andesitic tephra and pyroclastic flows, general- ly during single modest plinian events (Herd, 1982; Young et al., 1987).
The 1985 eruption and the 1986-1988 phreatic events and continuing seismic events might then relate simply to disturbance of the hydrothermal system by intrusion or remobilization of a small volume of magma. The small eruptions thus far are consistent with a small energy impulse on the system. The low energy of the seismic events in 1986 and 1987 are consistent with an origin that might be as simple as (1) thermal expansion/contrac- tion of the geothermal fluid and host rocks and (2) crack propagation initiated by volume changes accompanying conversion of primary minerals to hydrothermal ones on fractures newly made available to fluids during the 1984-1985 vent-opening process. In such a low- energy environment, anisotropic precipitation- loading might easily contribute to triggering of seismic and phreatic events.
6. Summary
Deformation studies at Nevado del Ruiz in- dicate that little or no cumulative ground defor- mation occurred in the period from October
1985 to April 1988. Assuming that no cavities exist within or below the edifice, these data in- dicate that (1) very little (< 3 MCM) or no magma was emplaced within the volcano since October 1985 and (2) that less than 200 MCM of magma (and perhaps none) was emplaced above a depth of 15 km beneath the summit during the same time period.
The tilt-leveling and EDM data have higher standard deviations than seen in data gathered at some other volcanoes. Part of the dispersion in the data results from the formidable logistics involved in monitoring deformation on Ruiz; however, precision can and should be improved if the deformation monitoring is to confidently detect precursory intrusion of small ( < 3 MCM) magma bodies.
Part of the dispersion in the deformation data will not be removed by higher-precision measurements because it appears to result from seasonal noncumulative flexing of the edifice by precipitation loading and/or ground- water recharge. This flexing also correlates in time with the occurrence of phreatic ash events and, to some extent, with the magnitude of seismicity under Ruiz. Review of the literature revealed the possibility that precipitation loading and subsequent adjustments to physical and thermal stress may also explain some of the deformation, seismicity, and erup- tive activity at other volcanoes with metastable magma/geothermal systems.
The continuing activity at Ruiz demonstrates the need for particular caution in presenting and interpreting the monitoring data. The cau- tion is merited by the proven high risk, a large populace unsure of the future, a large multidisciplinary data set, and many volcanologists concerned with interpretation of the data.
None of the current data sets indicate, re- quire, nor refute the potential for a large, catastrophic eruption of Ruiz during this erup- tive cycle. Neither do they suggest that this eruptive cycle might differ from those of the
DEFORMATION MONITORING AT NEVADO DEL RUIZ COLOMBIA 293
past 2100 years, which have been characterized by generally single, small to modest plinian events.
Future work at Ruiz should focus on studies tha t produce data more definitive than current- ly available to forecast and model the volcano's behavior. This effort may require substantial funds and take years to complete, although careful planning and cooperative internationa] involvement would ease the cost of improvin~ our models and forecasts of future eruptive behavior of Nevado del Ruiz.
7. Acknowledgements
Many people have contributed significantly to the deformation monitoring program at Ruiz. Among those to whom we owe particular grati tude are: Marta Calvache, Hector Cepeda, Alberto Salazar, and Kepler Salgado of the Observatorio Vulcanologico de Colombia; Ger- man Urrea and Hernando Garrido of Insti tuto Geografico Agustin Codazzi, Colombia; Monica Duyoner, Victoria Mejia, Mauricio Mejia, and Jorge Mejia of the Universidad del Caldas; Robert W. Decker, Roger Denlinger, Daniel Johnson, Richard G. LaHusen, Jeffery N. Mar- so, Thomas Murray, Arnold Okamura, and Donald Swanson of the USGS; Hans Peter Boler of the Swiss Federal Seismological Ser- vice; and Barry Voight of Pennsylvania State University. Data concerning seismicity was kindly supplied by Fernando Gil and Fernando Munoz of OVC; data on the flux of sulfur diox- ide was supplied by Ricardo Mendez of OVC. Bern Pedit, and Michael Doukas and Cynthia Stine of the USGS assisted production of the figures. Support for the deformation studies came from INGEOMINAS, the USGS, the Of- fice of Foreign Disaster Assistance of USAID, and the Nordic Volcanologic Institute. Defor- mation and precipitation data for Mount St. Helens came from the data files of the USGS Cascades Volcano Observatory. Helpful reviews were provided by Jane Buchanan- Banks, Daniel Dzurisin, Richard Fiske, David
Harlow, Cynthia Stine, Donald Swanson, George Wadge, and Edward Wolfe.
8. References
Arango, E., Buitrago A., J., Cataldi, R., Ferrara, G.C., Panichi, C. and Villegas V.J., 1970. Preliminary study on the Ruiz geothermal project (Colombia). United Nations Symposium on the Development and Use of Geothermal Resources, 2(1): 43-56.
Banks, N.G., 1982. Sulfur and copper in magma and rocks, Ray porphyry copper deposit, Pinal Coun- ty, Arizona. In: S.R. Titley (Editor), Advances in Geology of the Porphyry Copper Deposits, Southwestern Arizona. Univ. Arizona Press, Tuc- son, AZ, pp. 227-257.
Bomford, G., 1980. Geodesy, 4th Edition. Clarendon Press, London, 855 pp.
Bull, W.B., 1964. A consolidation test for undisturb- ed sands. Am. Soc. Test. Mater., Mater. Res. Stand., 4(7): 347-351.
Calvache, M.L., 1987. Deposits piroclasticos asociados a la erupcion del 13 de Noviembre, 1985 en el Nevado del Ruiz, Colombia. Revista CIAF, 11(2): 94-114.
Calvache, M.L., Williams, S.N. and Young, R.H., 1987. Distribution and volumes of deposits and dynamics of eruptions of Nevado del Ruiz and Cerro Bravo Volcanoes, Colombia. EOS, 68(16): 455 [abs].
Casetti, G., Frazzeta, G. and Romano, R., 1981. A statistical analysis in time of the eruptive events at Etna. Bull. Volcanol., 44: 283-294.
Chadwick Jr., W.W., Iwatubo, E.Y., Swanson, D.A. and Ewert, J.W., 1985. Measurements of slope distances and vertical angles at Mt. Baker and Mt. Rainier, Washington, Mt. Hood and Crater Lake, Oregon, and Mt. Shasta and Lassen Peak, California 1980-1984. U.S. Geol. Surv., Open File Rep. 85-205, 96 pp.
Davis, P.M., 1981. Gravity and earth tides measured on an active volcano, Mt. Etna, Sicily. J. Volcanol. Geotherm. Res., 11: 213-223.
Dzurisin, D., 1980. Influence of fortnightly earth tides at Kilauea Volcano, Hawaii. Geophys. Res. Lett., 7: 925-928.
Golombek, M.P. and Carr, M.J., 1978. Tidal trigger- ing of seismic and volcanic phenomena during the 1879-1880 eruption of Islas Quemadas Volcano in E1 Salvador, Central America. J. Volcanol. Geotherm. Res., 3: 299-307.
Greenland, P.G., 1987a. Hawaiian eruptive gases. U.S. Geol. Surv., Prof. Pap., 1350: 759-770.
294 N.G. BANKS ET AI.~
Greenland, P.G., 1987b. Composition of Gases from the 1984 eruption of Mauna Loa Volcano. U.S. Geol. Surv., Prof. Pap., 1350: 781-790. 1
Hamada, N., 1979. Tilt measurements at Arimura of Volcano Sakurajima. J. Volcanol. Soc. Japan, 24: 9-17.
Hamilton, W.L., 1973. Tidal cycles of volcanic erup- tions; fortnightly to 19 yearly periods. J. Geophys. Res., 78: 3363-3375.
Haughton, D.R. and Roeder, P.L., 1971. Iron and sulfur in basaltic liquids. Geol. Assoc. Can.- Mineral. Assoc. Can. Joint Mtg., May 13-15, Abstr. of Papers, pp. 31-32.
Haughton, D.R. and Skinner, B.J., 1972. Chemistry of sulfur in melts. Int. Geol. Congr., 24th, Mon- treal, Canada, Resumes, abstr., p. 520.
Haughton, D.R., Roeder, P.L. and Skinner, B.J., 1974. Solubility of sulfur in mafic magmas. Econ. Geol., 69: 491-467.
Herd, D.G., 1982. Glacial and volcanic geology of the Ruiz-Tolima volcanic complex Cordillera Central, Colombia. INGEOMINAS Publ. Geol. Esp., No. 8, 48 pp.
Herd, D.G. and Comit6 de Estudios Vulcanologicos, 1986. The 1985 Ruiz volcano disaster. EOS, 67: 457 -460.
Herbst, K., 1 9 7 6 . Interpretation of tilt measurements in the period range above that of the tides. Ph.D. Diss., Technische Universitat Clausthal (Transl: AFGL-TR-79-0093, Air Force Geophysics Laboratory, Hanscom AFB, MA, 88 pp.
Hurst, A.W., 1977. Ruapehu borehole tiltmeter. New Zealand Volcanic Record, # 7, p. 40.
Hurst, A.W., 1979. Ruapehu borehole tiltmeter. New Zealand Volcanic Record, # 9, p. 39.
Hurst, A.W., 1981. Ruapehu borehole tittmeter. New Zealand Volcanic Record, # 10, p. 34.
Iwatsubo, E.Y., Topinka, L. and Swanson, D.A., 1988. Measurements of slope distances and zenith angles at Newberry and South Sister Volcanoes, Oregon. U.S. Geol. Surv., Open File Rep. 88-377, 51 pp.
Johnston, M.J.S. and Mauk, F.J., 1972. Earth tides and the triggering of eruptions from Mount Stromboli, Italy: Nature, 239: 266-267.
Kinoshita, W.T., Swanson, D.A. and Jackson, D.B., 1974. The measurement of crustal deformation related to volcanic activity at Kilauea Volcano, Hawaii. In: L. Civetta et al. (Editors), Physical Volcanology. Elsevier, Amsterdam, pp. 87-115.
Klein, F.W., 1984. Eruption forecasting at Kilauea Volcano, Hawaii. J. Geophys. Res., 89 (B5): 3059- 3073.
Levine, J., Meertens, C.M. and Busby, R., 1989. Tilt
observations using borehole tiltmeters; 1. Analyses of tidal and secular tilt. J. Geophys. Res., 94: 574-586.
Lipman, P.W. and Banks, N.G., 1987. Aa flow dynamics, Mauna Loa 1984. U.S. Geol. Surv., Prof. Pap., 1350:1525-1567.
Lipman, P.W., Banks, N.G. and Rhodes, J.M., 1985. Degassing-induced crystallization of basaltic magma and the effects on lava rheology. Nature, 317(17): 604-607.
Machado, F., 1960. Secular variations of' seismo- volcanic phenomena in the Azores. Bull. Volcanol., 23: 101-108.
Machado, F., 1967. Activity of the Atlantic volcanoes, 1947-1965. Bull. Volcanol., 30: 29-34.
Mauk, F.J., 1979. The triggering of activity at Soufriere de St. Vincent, April 1979, by solid earth tides labs]. EOS, 60: 833.
Mauk, F.J. and Johnston, M.J.S., 1973. On the trig- gering of volcanic eruptions by earth tides. J. Geophys. Res., 78: 3356-3362.
Mauk, F.J. and Kienle, J., 1973. Microearthquakes at St. Augustine Volcano, Alaska, triggering by earth tides. Science, 182: 386-389.
Melson, W.G., Jerez, D. and Williams, S., 1986. Largely degassed magma of the 13 November 1985 Plinian phase of Ruiz Volcano: Amer. Geophys. Union. EOS, 67(16): 406.
Meertens, C.M., 1987. Tilt tides and tectonics at Yellowstone National Park. Ph D Thesis, Univ. Colorado, Fort Collins, CO, 236 pp.
Michael, M.O. and Christoffel, D.A., 1975. Trigger- ing of eruptions of Mt. Ngauruhoe by fortnightly earth tide maxima, January 1972-June 1974. N.Z.J. Geol. Geophys., 18: 273-277.
Mogi, 1958. Relations between the eruptions of" various volcanoes and the deformations of the ground surfaces around them. Bull. Earthquake Res. Inst., 36: 99-134.
Moore, J.G., 1965. Petrology of deep-sea basalt near Hawaii. Am. J. Sci., 263: 40-52.
Mufioz, F.C., Nieto, A. and Mejia, I., 1987. Localiza- cion y estadistica de los eventos sismicos de atta y baja frecuencia ocurrida en el Nevado del Ruiz de julio 20 de 1985 a noviembre 14 de 1986. Rev. CIAF, 11(2): 364-392.
Murray, T.L., 1988. A system for telemetering low- frequency data from active volcanoes: U.S. Geol. Surv., Open File Rep. 88-201, 27 pp.
Naranjo, J.L., Sigurdsson, H., Carey, S.N. and Fritz, W., 1986. Eruption of the Nevado del Ruiz Volcano, Colombia on 13 November 1987; tephra fall and lahars. Science, 233: 961-963.
Ohmoto, H. and Rye, R.O., 1978. Isotopes of sulfur
DEFORMATION MONITORING AT NEVADO DEL RUIZ COLOMBIA 295
and carbon. In: H.C. Barnes (Editor), Geochemistry of hydrothermal ore deposits. 2nd Edition. Wiley Interscience, New York, NY, pp. 509-567.
Otway, P., 1978. Tilt-level monitoring in the Taupo Volcanic Zone. N.Z. Volc. Rec., # 8, p. 27.
Sassa, K., 1936. Microseismometric study on erup- tions of the volcano Aso. Mem. Coll. Sci., Kyoto Imperial Univ., Ser. A., 19: 11-56.
Savage, J.C., Prescott, W.H., Chamberlain, J.F., Lisowski, M. and Martensen, C.E., 1979. Measurements along the San Andreas Fault in Central California. Bull. Seismol. Soc. Am., 67: 1965-1981.
Simkin, T., Siebert, L., McClelland, L., Bridge, D., Newhall, C. and Latter, J.H., 1981. Volcanoes of the World. Hutchinson Ross. Stroudsburg, PA, 232 pp.
Tanaka, T. and Hoso, Y., 1986. Effect of rainfall on a continuous observation of ground tilts. R. Soc. N.Z. Bull., 24: 19-28.
Tryggvason, E., 1970. Surface deformation and fault displacement associated with an earthquake swarm in Iceland. J. Geophys. Res., 75(23): 4407 -4422.
Tryggvason, E., 1973a. Surface deformation and crustal structure in the Myrdalsjokull area of South Iceland. J. Geophys. Res., 78(14): 2488-2497.
Tryggvason, E., 1973b. Seismicity, earthquake swarms, and plate boundaries in the Iceland region. Bull. Seismol. Soc. Am., 63(4): 1327-1348.
Van der Laat, R., 1985. Informe de la mision tecnica para la implementacion de estudios de deforma- cion del Volcan Nevado del Ruiz, Colombia. In-
forme del Observatorio Vulcanologico y Sismologico de Costa Rica, Univ. Nac., Heredia Costa Rica, 23 pp. and 15 pp. Anexo. (unpubl.).
Voight, B. 1988. Countdown to Catastrophe. Earth Miner. Sci. (Penn. State Univ.), 57(2): 17-36.
Westphal, J.A., Carr, M.A., Miller, W.R. and Dzurisin, D., 1983. Expendable bubble tiltmeter for geophysical monitoring. Rev. Sci. In- struments, 54(4): 415-418.
Williams, S.N., 1987. Nevado del Ruiz Volcano, Col- ombia; the November 1985 eruption and related events. J. Volcanol. Geotherm. Res., 33: 355-360.
Williams, S.N. and Meyer, H.-J., 1988. A model of Nevado del Ruiz Volcano, Colombia. EOS, 69(45): 1554-1566.
Williams, S.N., Calvache V., M.L., Sturchio, N.C., Londofio C., A., Mendez, R., Garcia, N., Cepeda, B., Rodriguez, J.L. and Rojas, N., 1987. The degassing of sulfur dioxide from Nevado del Ruiz Volcano, Colombia; total sulfur flux and isotopic constraints. EOS, 68(16): 455.
Yamashita, K.M., 1981. Dry tilt: A ground deforma- tion monitor as applied to the active volcanoes of Hawaii. U.S. Geol. Surv. Open File Rep., 81-523.
Yamashita, K.M. and Doukas, M.P., 1987. Precise level lines at Crater Lake, Newberry Crater, and South Sister Volcanoes, Oregon. U.S. Geol. Surv., Open File Rep. 87-293, 18 pp.
Yokoyama, I., 1989. Microgravity and height changes caused by volcanic activity: four Japanese examples. Bull. Volcanol., 51: 333-345.
Young, R.H., Williams, S.N. and Calvache V., M.L., 1987. Similar temporal variations in petrology and eruption dynamics of most-recent eruptions of Nevado del Ruiz Volcano, Colombia. Geol. Soc. Am., Abstr. Programs, 19(6): 903 (abstr.).