December 1995 - Indian Accounting Association
115
-
Upload
khangminh22 -
Category
Documents
-
view
0 -
download
0
Transcript of December 1995 - Indian Accounting Association

CHIEF EDITOR
B. BANERJEE
University of Calcutta
ASSOCIATE EDITORS
A. K. BASU
University of Calcutta
RAMAKANTH
lAS ( Retd.), Jaipur
P. G. GOPALAKRISHNAN
R. J. College, Bombay
EDITORIAL BOARD
S. K. R. BhandariFormerly of Banaras Hindu University
c. M. MuniramappaUniversity of Mysore
Pranes DasUniversity of Burdwan
L. S. PorwalFormerly of University of Delhi
P. K. GhoshFormerly of University of Delhi
G. D. RoyFormerly of University of Calcutta
M. Gangadhara RaoAndhra University
Stephen A. ZeffRice University
Yuji IjiriCarnegie-Mel/on University
Bikki JaggiRutgers University
Charles T. HorngrenSt3nford University
Joseph A. SilvosoUniversity of Missouri
Barry E. HicksLaurentian University
Belverd E. Needles, Jr.DePaul University
Members of the Editorial Board and the Indian Accounting Associationare not responsible for any of the views expressed by the contributors inthe Indian Journal of Accounting.
INDIAN JOURNAL OF ACCOUNTING
CONTENTS
Vol. XXVI
\/\ ". /
Disclosure of Management Earnings Forecasts inFinancial Statements: Challenges for DevelopingCountries
-Bikki Jaggi
Forecasting Annual Cash Flows: The Effectiveness ofSelected Multivariate Models
-Philip H. Siegel-David Franz-Khursheed Omer-John R. Leavins
Corporate Characteristics and Extended CorporateReporting-5ome Indian Evidence
-v. K. Vasal
~ccounting Education in Developing Countries:. Perceptions of Interested Parties and Cultural Influences
-A Case Study of Papua New Guinea-Fabian Pok-Patrick Hutchinson
Graphic Techniques for Presentation ofFinancial Results
-Dr. M. Ranganatham-Dr. R. Madhumathi
--r<~ics in Accounting: A Plea for a New Conceptualization-Arup Choudhuri
't·0axation and the Capital Structure of Companies inoj New Zealand Manufacturing Industry
-Dr. Kazi Firoz Alam
Some Thoughts on Management of Liquidity-Dr. Tanmoy Datta
International Conference News
IAA Branch News
December 1995
1
14
24
35
53
63
76
88
96
102

INDIAN ACCOUNTING ASSOCIATION
President
Vice-Presidents
General Secretary
Treasurer
Dr. U. L. Gupta, Former DeanFaculty of Commerce and ManagementStudies, University of Jodhpur
Prof. K. R. Sharma, Dean of Commerce andManagement StudiesM. L. Sukhadia University, Udaipur
Prof. Bhagwati PrasadDirector, Kousali Institute of ManagementStudies, Karnataka University
Prof. D. Prabhakara RaoAndhra University, Visakhapatnam
Dr. Sugan Chand JainRajasthan University
Members (Elected)
Prof. N. M. KhandelwalSaurashtra University
Ms. T. KalyaniNagpur
Dr. Bhairav H. DesaiGujarat University
Dr. VinayakamSalem
Shri Sukumar BhattacharyaCalcutta
Dr. N. M. SinghviAjmer
Dr. B. R. SinghiUniversity of Jodhpur
Dr. R. L. TamboliUniversity of Udaipur
Dr. A. M. AgarwalBhusawal
Prof. D. C. SharmaJiwaji University
Members (Co-opted)
Prof. Nageshwara Rao
Vikram University
Dr. J. B. Sarker
Burdwan University
Sri A. K. Basu
Calcutta University

EDITORIAL
Financial reports are seen today as much more than mere legaldocuments. They are instruments for giving credible financial informationto capital market participants and to the public at large. So, due emphasishas been given to this vital aspect of accounting in publishing the currentissue-four articles relate to different aspects of financial reporting. BikkiJaggi examines why forecast information is considered important forinvestment decisions. Philip Siegel and Khurseed Omer discuss the abilityof forecast alternative cash measures using multivariate models. WhileV. K. Vasal identifies the determinants of extended corporate reportingin India, M. Ranganathan and R. Madhumathi explain the graphictechniques for presentation of financial results.
The remaining four articles deal with accounting education,management accounting, ethics in accounting and taxation respectively.Fabian Pok and Patrick Hutchinson analyze in their article the perceptionsof accountants in practice, accounting academics and accounting studentsregarding accounting education and influence of cultural factors on it indeveloping countries with particular reference to Papua New Guinea.While conceptualization of ethics in accounting is the focus of ArupChoudhuri's article, Tanmoy Datta argues for the need for managementof liquidity. K.F. Alam examines the influence of taxation on the capitalstructure of companies in the manufacturing industry in New Zealand.
As usual, the international conference news section contains a numberof information for the interested readers.
lastly. I express my thankfulness to the associate editors, membersof the editorial board, office-bearers of the Indian Accounting Associationand secretaries of the local branches for their co-operation and support.
December 4, 1995B. BanerjeeChief Editor
INDIAN ACCOUNTING ASSOCIATION
Past Presidents
Mr. Raghu Nath Rai-Chartered Accountant, U. P.
Dr. S. N. Sen (Late)-Past Vice-Chancellor, Calcutta University
Dr. S. K. Raj Bhandari-Former Professor, Banaras Hindu University
Mr. G. D. Roy-Former Professor, Calcutta University
Mr. M. C. Bhandari-Chartered Accountant, Calcutta
Dr. K. S. Mathur-Former Professor, University of Rajasthan
Dr. R. Rajagopalan-Additional Secretary, Government of India, New Delhi
Dr. L. S. Porwal-Former Professor, University of Delhi
Dr. H. C. Mehrotra-Former Dean, Agra University
Mr. S. M. Dugar-Member, Company Law Board, Government of India
Dr. S. P. Gupta-Rohilkhand University
Mr. Sukumar Bhattacharya-Chartered Accountant, Calcutta
Dr. 0001 Singh-Former Professor, Kurukshetra University
Dr. M. C. Khandelwal-Former Professor, Rajasthan University
Dr. Bhabatosh Banerjee-Professor of Commerce, University of Calcutta
Dr. Chhote Lal-Banaras Hindu University
Prof. N. M. Khandelwal-Saurashtra University

INDIAN JOURNAL OF ACCOUNTINGVOL. XXVI, DECEMBER 1995
DISCLOSURE OF MANAGEMENT EARNINGS FORECASTSIN FINANCIAL STATEMENTS: CHALLENGES FORDEVELOPING COUNTRIES
The author examines why forecast information is considered inportantfor investment decisions. After evaluating the historical developmentsrelated to public disclosures of forecast information in the U.S. andneed for disclosure of forecast information for policy implications fordeveloping countries. he concludes that investors should be providedwith information on the firm's future performance for evaluating theirinvestment strategies and that the regulatory bodies in India shouldmake the public disclosure of management forecast informationmandatory.
I. Introduction
Forecasts or predictions have become an integral part of our modernday life. Similarly, in business life, forecasts also play an important role.Management of companies routinely develop forecasts for sales, revenues,costs, income, etc., for their internal use, but, due to several reasons,they do not disclose forecast information to investors and other outsideconstituents on a regular basis. Investors, on the other hand, who needforecast information for their investment decisions, either develop theirown forecasts on the basis of historical data published in financialstatements and information available from other sources, or they buyforecast information from security analysts. Irrespective of the source offorecast information, this information is considered critical for investmentdecisions.
This paper examines why forecast information is considered importantfor investment decisions, evaluates the historical developments relatedto public disclosure of forecast information in the United States, andexamines whether firms in the developing countries (with special referenceto India) should be required to disclose forecast information in financialstatements.
The remaining paper is organized into four parts. In the second partwe discuss the usefulness of financial information contained in financialstatements for investment decisions. This is followed by a review of the
* Alumni Professor of Accounting, Department of Accounting, School of Business, RutgersUniversity, New Brunswick, NJ, USA, and visiting Professor, City University of HongKing, Hong Kong.

2 INDIAN JOURNAL OF ACCOUNTING
historical developments for public disclosure of management forecastinformation by the companies in the United States. In this section, wealso examine regulatory agencies' and professional bodies' position onthe disclosure of forecast information in financial statements. Part fourexamines the rationale for public disclosure of forecast information. Thelast part discusses whether it would be desirable to include managementearnings forecasts in the financial statements of firms in the developingcountries and whether this disclosure would serve any useful purpose.
II. Association between Financial Information contained in FinancialStatements and Investment Decisions
During 1960s, the accounting profession in the United States waschallenged by investors and security analysts to provide more relevantfinancial information for investment decisions. This challenge was part ofthe rising tide of "consumerism", which, in fact, assaulted the quantityand quality of virtually every good and service produced in the country.In the absence of reliable forecast information, investors were finding itdifficult to make optimal investment decisions, and demanded disclosureof information on management earnings forecasts. In this section, we firstexamine how the nature of historical information contained in financialstatements changed to meet the needs of financial statement users. Then,we examine why disclosure of forecast information in financial statementswas considered important.
(1) Historical Information contained in Financial Statements and InvestmentDecisions
The nature of financial information contained in financial statements,which originally focused on the financial position of the firm, wasconsidered inappropriate for investment decisions. As a result of widespread ownership of firms, demand for information shifted from financialposition of the firm to profitability of the firm. and thus the focus ofreporting shifted from balance sheet to income statement.
Investment decisions required that economic value of common stocksbe determined in a way that investors were able to compare the valueof common stocks of different companies in order to arrive at an optimalinvestment strategy. The multiples of earnings or the present worth offuture earnings was considered to be appropriate technique to determinethe economic value of the firm. Consequently, the demand for earningsinformation assumed greater importance. Furthermore, it was demandedthat earnings information be presented in a way that investors and securityanalysts were able to forecast future earnings so that the economic valueof the firms could be determined.

DISCLOSURE OF MANAGEMENT EARNINGS FORECASTS 3
Historical data as it was disclosed in financial statements at that timewas considered to be inadequate for making predictions about the firm'sfuture earnings. Researchers started highlighting the deficiencies inhistorical data disclosed in financial statements and suggested certainimprovements so that it became useful for investment decisions. Threeimprovements were especially suggested in this respect and all of themhave since been incorporated in the financial statements of US companies.
First, financial statements were required to differentiate betweenrecurring and non-recurring elements of Income. Second, income fromcontinuing operations and non-continuing operations needed to be clearlydifferentiated in income statements. Recognizing the importance of incomenumbers for prediction purposes, the modified Generally AcceptedAccounting Principles required US corporations to clearly identifyextraordinary items and show separately continuing and discontinuedoperations.
Third, in the case of large corporations with a variety of products andservices, separate reporting for each segment of business was consideredessential. Accordingly, the Securities and Exchange Commission (SEC)required all SEC registered companies to provide segmental informationon their operations.
In addition to the above three developments, all US firms were requiredto provide information on the impact of changes in accounting methodsand policies. This was done to make the reported information more usefulfor prediction purposes.
Though these modifications improved the predictive ability of historicaldata, but historical data by itself is not sufficient enough to enable investorsto make predictions about future earnings of the firm. Thus, disclosureof forecast information was considered to be more useful for investmentdecisions.
(2) Forecast Information in Financial Statements and Investment Decisions
It has been argued that investors with close ties to the firm'smanagement or investors who have the benefit of inside information willcomparatively be in an advantageous position compared to those whodo not have access to this information. This difference in the knowledgeof information about the firm results in asymmetry of information betweenthe two groups, which is likely to lead to suboptimal investment decisions.As a result of suboptimal decisions, there is likelihood of resources beingmisallocated to different sectors of the economy, which will have negativeeffect on capital markets and ultimately on the country's economy. Inorder to improve the quality of investment decisions and the capital

4 WD~NJOURNALOFACCOUNnNG
market's efficiency, reduction in asymmetry of information is consideredto be important.
It has been argued that disclosure of earnings forecasts in financialstatements will make the forecast information available to all interestedinvestors on an equitable basis, and will reduce the asymmetry ofinformation. On the other hand, nonavailability of forecast information infinancial statements would result in a gap between the need for andavailability of this information. With the objective to reduce this gap,researchers and professionals reevaluated the information generationprocess and presentation of forecast information. After a lengthy debateon the disclosure of forecast information, a general consensus emergedthat inclusion of forecast information in financial statements would servea useful function for investment decisions. This realization has been theresult of an evolutionary process over an extended period of time. A briefreview of important aspects of the debate on the process will highlightthe position of management, regulatory agency, and professional body.
III. Historical Developments on Inclusion of Forecast Information InFinancial Statements
Inclusion of forecast information in financial statements has generallybeen opposed by management of corporations. The management positionwas originally supported by the professional body (AICPA) as well as theregulatory agency (SEC). As a result of open debate on this issue, theAICPA as well as SEC changed their position and encouragedmanagement to disclose forecast information. Important aspects of theposition taken by each group are briefly evaluated.
(1) Management Position
Though management has long been involved in preparing varioustypes of earnings forecasts, preparing budgets or profit plans for internalplanning and control purposes and for making different types of decisions,but they have been opposed to disclosure of forecast information tooutsiders in a systematic way. Their opposition has been based on thefear that they might divulge confidential information to competitors, itwould involve additional expense to prepare forecast information, andthere could be a possibility of legal proceedings by disgruntled investorsif forecasts were not met. Despite these concerns, some companies havebeen making forecast information available to outsiders on a selectivebasis through press releases or through packages for promotion on newstock issues.
Apart from disclosing forecast information on a selective basis,managements have not been convinced to disclose information on theirearnings forecasts in financial statements on a regular basis.

DISCLOSURE OF MANAGEMENT EARNINGS FORECASTS 5
(2) Securities and Exchange Commission's Position
Prior to 1970, the SEC did not recognize the need for future-orientedinformation to be included in financial statements. But slowly pressurestarted building up from different sources. In early seventies, the SECbegan revising its policy on prohibiting the inclusion of forecast informationin financial statements.
The most important reason for the change in the SEC's positionprobably related to the release of management forecast information tosecurity analysts on a selective basis, as discussed in the precedingsection. In private meetings with security analysts, the top managementswould disclose estimates relating to the firm's next year earnings. Securityanalysts would also obtain forecast information from other senior officersof the firm through informal discussions.
In 1975, the SEC developed a proposal for inclusion of forecastinformation in financial statements and invited comments on the rule andform of changes to implement the "Statement by the Commission on theDisclosure of Projections of Future Economic Performance". Thisstatement required that companies release forecast information byincluding it in 1OK reports. Any significant change in the forecastinformation required filing of 8K no later than 10 days after that eventoccurred.
The SEC's proposal was developed on the premise thatmanagements' assessment of the company's future performance will resultin information which will be useful for investors, and that such informationshould be made available to all investors on an equitable basis. Theproposal required that reports filed with the SEC include forecastinformation and all financial details pertaining to this forecast information.The information filed should at the very least include information on salesor revenues, net income, and fully diluted earnings per share. Furthermore,it required disclosure of the underlying assumptions, and a proVision ofcaution that the achievement of the forecasts depended on the occurrenceof the specified assumptions. It also defined the circumstances underwhich the statement could be deemed misleading or fraudulent.
Public hearings were held on the proposal, and it became clear fromcomments that preparers of financial statements were not in favor of theproposal and management strongly opposed it. On August 23, 1976, theSEC withdrew its proposal with the statement:
"Due to the important legal, disclosure policy and technicalissues raised by the commentators with respect to the projectionproposals and the lack of public input on the change of controlproposals, the Commission has determined that all of theseproposals should be withdrawn". (SEC 1976, p. 473).

6 INDIAN JOURNAL OF ACCOUNTING
In 1978, the SEC, however, issued guidelines for voluntary disclosureof projections, and in June 1979 it adopted a rule providing for a "safeharbor" from liability provisions of the Federal Securities Laws forprojections and management's plans and objectives plus disclosedassumptions [SEC, 1979]. According to this rule, management'sstatements with regard to forecasts would not be deemed false ormisleading unless the forecasts were prepared without a reasonable basisor they were disclosed in other than good faith.
In summary, prior to 1970, the SEC did not allow inclusion of forecastinformation in financial statements. At present, forecast information maybe included on a voluntary basis. If forecasts are developed on areasonable basis and are disclosed in good faith, the preparers wouldbe protected by the safe harbor from liability provision of the FederalSecurities Laws.
The major objective of the new SEC's regulations has been toeliminate the management's fears for disclosing forecast information byproviding "safe harbor" from liability if forecasts are prepared in goodfaith. These regulations were also intended to remove the management'sfears of costly litigation, diminished credibility, and a general loss ofinvestor confidence resulting from material variations between forecastedearnings and actual results.
(3) AICPA's Position on the Management Earnings Forecasts
In response to the SEC's position, the AICPA started debates to dealwith the issue. It, however, expressed its opposition to mandatorydisclosure of forecast information. At the same time, it began developingguidelines for auditors to examine forecast information. In March 1975,it issued guidelines which provided general criteria for a forecastingsystem, and in 1980 it provided guidelines for review of financialstatements. In 1985, it issued a statement which established proceduresand reporting standards for compilation services on the prospectivefinancial statements.
The earlier position taken by AICPA was that CPAs do not possesstechnical qualification to attest to the accuracy of financial statements,and, therefore, there should be no attestation of forecasts. Later on, acompromise solution was found which related to the attestation ofunderlying assumptions and bases used in the development of forecasts.
IV. Disclosure of Management Earnings Forecasts in FinancialStatements(1) Need for Disclosure Forecast Information
The need for disclosure of forecast information is basically derivedfrom optimal investment decisions and also to achieve certainmanagement objectives.

DISCLOSURE OF MANAGEMENT EARNINGS FORECASTS 7
Modigliani and Miller (1958) presented theoretically strong and validarguments in favor of the need for a stream of "profits" over time forvaluing a firm. Their argument has been reflected in the "TheoreticalFramework for Accounting" developed by the Financial AccountingStandard Board (FASB) in the United States. Upon the assumption thatfuture earnings influence the value of the firm, it can be said that theseearnings will have a strong impact on the investors' motivation to investin a particular firm. If future earnings are not attractive, motivation toinvest will not be strong.
It has been observed in actual practice that investors constantly seekinformation on the future performance of firms. In addition to developingtheir own predictions, they seek this information from outside sources,such as security analysts, brokers, news media, etc. Thus, the strongdemand for forecast information suggests that this information is beingused for investment decisions.
Forecast information from outside sources generally involves costs(subscription to Value Line Service, payments to brokers and securityanalysts, purchase of investment newsletter, etc.). In such cases, valueof information is being weighed against costs. Because it is difficult toassess the value of information relating to future, information whichinvolves heavy costs may not be used in investment decisions.Consequently, investment decisions which ignore such information maynot be optimal. To achieve the objective of optimal investment decisions,disclosure of forecast information in financial statement would be desirable.Furthermore, as pointed out earlier, disclosure of forecast information infinancial statements would also enable us to reduce asymmetry ofinformation available to different groups of investors.
From the management perspective, the need for disclosure ofmanagement earnings forecasts is derived from their motivation to achievecertain objectives. Sometimes, management may be motivated to discloseforecast information to provide positive signals to the investors. Despitethe fact that it would be cheaper and less risky for management to signalforecast information to the market by cooperating with analysts in thedevelopment of security analyst forecasts (for example, see Ajinkya andGift, 1984), management would choose to disclose earnings forecasts ona voluntary basis. The objectives of such disclosures is either to conveyinformation to the market that otherwise would not be available or tocorrect or augment or sometimes to confirm the available information.
(2) Comparative Accuracy of Management Earnings Forecasts
Disclosure of management forecasts has also been supported on thepremise that managements are in a better position to predict their futureperformance more accurately than any other forecasting agent.

8 WD~NJOURNALOFACCOUNnNG
Management have a data base which is not available to others, andmanagement can also include exogenous factors which other forecastingagents do. Furthermore, management have control over their ownoperations, and they can adjust the plans according to the changedenvironment. Thus, these arguments strongly suggest that managementshould be capable of generating more accurate forecasts.
The expected better accuracy of management earnings forecasts hasbeen tested by several studies. The findings of these studies show thatmanagement forecasts have been comparatively more accurate thanforecasts developed by other forecasting agents, such as analyst forecastspublished by the Value Line Service or Standard and Poor's EarningsForecasts. The first important study was conducted by McDonald (1973).The results of this study indicated management overpredicted earningsby an average of 13.6 per cent. Later, Imhoff's (1978) study confirmedMcDonald's findings. Additionally, Imhoff's study indicated that forecastingcompanies had significantly less variability in earnings than did a randomsample of non-forecasting firms. He also found that the average systematicrisk was significantly greater for forecasting firms compared to the averagefor the S&P 500 index. but no significant difference was detected for thesystematic risk between forecasting and non-forecasting firms.
Basi. Carey and Twark (1976) compared management's and analysts'earnings forecasts, and found that management forecasts had an averageerror of 6 per cent compared to 8.8 per cent error for analyst forecasts.In 1980. Jaggi re-examined analyst and management forecasts, and hisfindings indicated a mean prediction error of 26.7 per cent for managementforecasts compared to 28.3 per cent for analyst forecasts. The differencein the errors of the two groups was statistically significant. However, therewas no statistically significant difference in the forecast errors of the twogroups when analyst forecasts were developed after managementforecasts were released.
v. Usefulness of Forecast Information for Developing Countries
Before we examine the usefulness of forecast information for firmsin the developing countries, and especially for India. we first evaluate theusefulness of such information in the industrialized countries, especiallyUSA. The usefulness of forecast information can be examined byevaluating investors' reaction to pUblication of such forecasts. If investorsdo not find the forecast information useful for their decisions, then thereis no reason for managements to publish this information.
One way of examining the usefulness of information will be to examinethe market reaction to publication of management earnings forecasts. Ifearnings forecasts provide additional information, then investors' reactionto this information will be evident in adjustments to the security prices.

DISCLOSURE OF MANAGEMENT EARNINGS FORECASTS 9
The first study on the impact of management's earnings forecastswas on stock prices conducted by Foster (1973), who explored the effectof the release of preliminary earnings after the firm's fiscal year end butbefore the release of audited financial statements. Though this study wasnot strictly based on the management earnings forecasts made over along period of time, but the preliminary announcement of earnings hada forecast flavor. Foster's findings indicated that investors reacted todisclosure of preliminary earnings which suggested that investorsperceived preliminary announcements of annual earnings to containadditional information.
The important study on the impact of management earnings forecastwas conducted by PateU (1976). PateU used weekly price data andconducted the statistical test upon the assumption of normal distributionof weekly returns. Patell's findings indicated that there was statisticallysignificant upward price adjustments during the week the forecasts weredisclosed. He also found that upto two weeks before the release of anearnings forecast, the stock prices tended to move in the direction ofthe change of the forecast. The results, however, did not clearly indicatewhether the upward movement in stock prices was due to informationcontent of earnings forecasts or it was just the act of voluntary disclosurewhich triggered the movement in prices.
Because Patell's results depended upon the sensitivity to violation ofthe normality assumption, these results needed further stUdy. Moreover,the reaction to earnings forecasts is expected to be on the dayssurrounding the disclosure date; dilution of this reaction might occur whenmonthly or weekly returns are employed. To overcome the weaknessesof Patell's study, Jaggi (1978) replicated PateU's study by using dailyreturns. Though daily returns may have greater inherent risk of inclUdingnoise than weekly or monthly returns, their use was considered moreappropriate for measuring the timeliness of the market's response. It wasargued that forecasts were likely to elicit investors' reaction during theimmediate period surrounding the release date, and this could be bettercaptured through daily stock price movements. Jaggi's findings indicatedthat significant price adjustments were evident, suggesting that thedisclosure of management earnings forecast might have caused investorsto revise their expectations.
Jaggi's study also examined the impact of management earningsforecasts on investors' decision on an average basis by considering thenegative and positive signals from the earnings forecasts. Whenmanagement earnings forecasts exceeded an estimate of the investors'expectations, the signals were termed as positive; when managementforecasts were below an estimate of the investors' expectations, signalswere considered negative. The results of this test indicated that there
10 INDIAN JOURNAL OFACCOUNTING
were some price adjustments around the announcement date of earningsforecasts. These results confirmed the expectation that voluntarydisclosure of earnings forecasts may provide some additional informationto investors which they would find useful for their investment decisions.
Nichols, Tsay and Larkin (1979) looked at the changes in the tradingactivity in the week of the earnings forecasts announcement. Theyassumed trading volume would indicate investors' perceptions of theinformation content of management earnings forecasts. Their resultsindicated that there was a change in the trading volume associated withthe release of earnings forecasts. These results provided additionalevidence that there was information content in the forecastannouncements. The results also indicated that there was no significantrelationship between the length of the forecast period and trading volume,which suggested that investors perceived longterm forecasts as beingequal to the short term forecasts in information content.
Some researchers have argued that an intraindustry informationtransfer has also an impact on the stock prices of firms that do notdisclose earnings forecasts. It has been suggested that managementforecast disclosures of one firm may generate unexpected price reactionfor firms which do not disclose forecasts but the nature of their activitiesis similar to those of forecast firms. This argument supports the expectationthat price reaction to management forecasts is triggered by informationon the firm's future earnings rather than the mere act of disclosure. Astudy by Baginski (1987) provided support to this expectation. The resultsof this study indicated that forecasts of disclosing firms provide importantinformation for determining the price reaction of the similar type ofnondisclosing firms. These results thus indicate that the effects of voluntarymanagement forecast disclosures extend beyond the disclosing firm.
VI. Polley implications for Developing Countries
The stock market reaction to disclosure of earnings forecastinformation demonstrates that investors consider information on the futureperformance of the firm to be important for firm valuation and for theirinvestment decisions. The investment decisions, in turn, will have animpact on the development of capital markets and also on the optimalallocation of resources among different sectors of the economy. Theresults of several studies, some of them have been cited in this paper,on the other hand, provide strong support to the expectation thatmanagements are in a better position to generate more accurateinformation on the future performance of the firms than any otherforecasting agent. As a result of evidence presented by several studies,the Securities and Exchange Commission (SEC) as well as the AmericanInstitute of Certified Public Accountants (AICPA) strongly encouraged

DISCLOSURE OF MANAGEMENT EARNINGS FORECASTS 11
managements of US corporation to disclose information on their earningsforecasts. Though disclosure of forecast is not required in the USA, butstill quite a large number of firms disclose this information on a voluntarybasis. In view of the nature of cultural, economic and political environmentsin the United States, and because of the well developed financial marketsin the country, and higher dependence on voluntary development ofGenerally Accepted Accounting Principles and their implementation,mandatory disclosure requirements have not been considered necessary.
The environments in newly developed countries and developingcountries, however, differ compared to the environments in the UnitedStates. The capital markets in the developing countries are not yet fUllydeveloped and investors need a strong encouragement to invest in stocksand shares. In order to enable investors to properly evaluate their riskand return, they should be provided with reliable and timely informationto evaluate their investment strategies. Availability of information on thefirms' future performance will encourage them to make investments inthe stocks of these firms.
Furthermore, advances made in the information and computertechnology have increasingly globalized the financial markets. The stockmarkets are attracting investors across national boundaries and capitalis moving freely from country to country. In order to attract capital to thedeveloping countries, it is critical that foreign investors are provided withrelevant and timely information to develop their investment strategies,and are encouraged to invest in the stocks of companies from thedeveloping countries. An important piece of timely and relevant informationwill be the predictions on the future performance of the firms. Thus,availability of information on earnings forecasts will facilitate the flow offunds between different countries and attract foreign capital to thedeveloping countries.
In case of India, state enterprises are being privatized on a peacemealbasis. At this time, only certain percentage of ownership is beingtransferred to private owners through sale of shares in the stock market.Investors should be encouraged to buy shares of the state enterprisesso that the process of further privatization of these enterprises can beaccelerated. To encourage investors to buy shares in these companies,they should be provided with information on the firms' future performanceso that they can evaluate their investment strategies.
Disclosure of forecast information on a voluntary basis, as is beingdone by the US companies, may not be a right solution for developingcountries, especially India. In the developed countries, especially theUSA, forecast information is regularly developed by several securityanalysts for each firm and it is readily available to investors. A well

12 WDMNJOURNALOFACCOUNnNG
developed system to generate forecast information outside the firm, ismeeting the information needs of investors, and voluntary disclosure offorecast information by management supplements the forecast informationavailable in the market. In the developing countries, a system for providingforecast information by sources other than managements of the firmseither does not exist or it has not reached the level of sophistication thatit can provide reliable information. Therefore, it is essential that forecastinformation developed by corporate management in the developingcountries is made available to investors.
In order to achieve the objective of providing forecast information toinvestors, we suggest that the firms in the developing countries shouldbe required to disclose forecast information on their future earnings eitherin their financial statements or through press releases. Disclosure of thisinformation would be of great help in developing the capital markets inthese countries and it will also provide a great impetus to the economicgrowth in the country. The regulatory bodies should, therefore, carefUllyexamine this issue and they should make the disclosure of managementforecast information mandatory.
Reterence
Ajinkya, B. and Michael Gift, "Corporate Managers' Earnings Forecasts andSymmetrical Adjustments of Market Expectations," Journal of AccountingResearch (Autum 1984), pp. 425-44.
Baginski, Stephen P., "Intraindustry Information Transfers Associated withManagement Foreci'lsts of Earnings", Journal of Accounting Research,Vol 25, NO.2 (Autumn 1987), pP. 196· 216.
Basi, Bart A., Kenneth J. Carey, and Richard O. Twark, "A Comparison of theAccuracy of Coj'p()j'~te and Security Analysts" Forecasts of Earnings,The Accounting, Vol 51, No. 2 (April, 1976), pp. 244·54.
Foster, G., "Stock Market Reaction to Estimates of Earnings per Share by CompanyOfficials," Journal of Accounting Research (Spring 1973), pp. 25·37.
Imhoff, Eugene, "The Representativeness of Management Earnings Forecasts,"The Accounting Review, (October, 1978), PP. 429-39.
Jaggi, Bikki, "A Note on the Information Content of Corporate Annual EarningsForecasts," The Accounting Review (October, 1978), pp. 961-67.
--, "Further Evidence on the Accuracy of Management's Forecasts Vis·a·visAnalysts' Forecasts," The Accounting Review (January 1980), pp. 96·101.
McDonald, Charles, L. "An Empirical Examination of the Reliability of PublishedPredictions of Future Earrnngs," The Accounting Review (July 1973), pp.502-10.

DISCLOSURE OF MANAGEMENT EARNINGS FORECASTS 13
Modigliani, F., and M. H. Miller, "The Cost of Capital, Corporate Finance and theTheory of Investment," American Economic Review (June 1958), pp.325-42.
Nichols, Donald R., Jeffrey J. Tsay, and Paula D. Larkin, "Investor TradingResponses to Differing Characteristics of Voluntary Disclosed EarningsForecasts," The Accounting Review (April 1979), pp. 376-82.
PateU, James M., "Corporate Forecasts of Earnings per Share and Stock PriceBehavior: Empirical Tests," Journal of Accounting Research (Autumn1976), pp. 70-73.
Securities and Exchange Commission, "Disclosure of Projections of FutureEconomic Performance," Release No. 33-5362 (Feb. 2, 1973).
--, "Disclosure of Projections of Future Economic Performance," ReleaseNo. 33-5581 (April 28, 1975).
, Safe Harbor Rule for Projections, Securities and Exchange Act of 1933(Release No. 6084); Securities and Exchange Act of 192 1. (Release No.15944), June 25, 1979.
Indian Accounting Association ResearchFoundation Invites Research Proposals
To encourage re~~:arch in Accounk1ncy the Indian AccountingA<;sociation Research f'41ndation (IAARF) invites research schemesfrom academics and/or professionals.
The Foundation proposes to provide financial assistance to afew selected research schemes up to a maximum of Rs. 30,000each. Details of the schemes along with a short resume of theproposer and a statement of financial assistance needed should reachDr. J. B. Sarkar, Secreulry (Adg.) IAARF, 1, Graham's Land Extn.,Calcutta 700 040, on or before 29th February, 1996.

INDIAN JOURNAL OF ACCOUNTINGVOL XXVI, DECEMBER 1995
FORECASTING ANNUAL CASH FLOWS : THEEFFECTIVENESS OF SELECTED MULTIVARIATE MODELS
Pliilip !Jl. Seig'e[*
'Davia ~ranzt
Xjiurslieea Omer*
Jolin 'R.: Leavins*
This study provides evidence on the aoility to forecast alternative cashflow measures using multivariate models. A sample of 250 firms wasrandomly drawn and data was gathered for the years 1973-1992. Theresults indicate that multivariate models had better predictability forfuture cash flows than random walk models.
Introduction
In recent years, cash flow accounting has developed a wideningconstituency. While management accounting has long recognized thevalue of maximizing the net present value of future cash flows from aproject, financial accounting until recently has been reluctant to acceptcash flow accounting. However, when the Financial Accounting StandardsBoar'cL (FASB) recently required that firms replace the Statement ofChanges in Financial Position with the Statement of Cash Flows, financialaccountants formally recognized the importance of cash flows to externalusers (FASB, 1987). With the FASB identifying cash flows as importantinformation, there should be increasing concern among corporatemanagers and other decision makers to forecast annual cash flows.
In addition to the FASB in U.S.A., other national and internationalrule making bodies have issued standards of disclosure on cash flows(e.g. the ASB in the UK, the DECCA in France, the AASB in Australia,and AISC worldwide). These standards on cash flow disclosure havegenerated added interest in research on the properties and usefulnessof cash flow information [Bowen, Burgstahler, and Daley (1986); Bernard
* University of Houston Downtown.
t San Francisco State University
14

FORECASTING ANNUAL CASH FLOWS 15
and Stober (1989); Board and Day (1989); EI-Gazer and Zaumeyer (1990);Percy and Stokes (1992); Kinnunen and Niskanen (1993); and Franz,Siegel, and Figsby (1993)].
So far, inconsistent answers have emerged in this research. Forexample, Bernard and Stober (1989) failed to reject the null hypothesisof insignificant information content in cash flows, while Bowen et al. (1987)rejected this hypothesis. Percy and Stokes (1992) generally supportedthe findings of Bowen et al. (1987) but raised new questions about thepropriety of the more refined measures in the task of predicting futurecash flows. Franz et al. (1993) showed that cash flow information tendedto be more closely associated with long term earnings than short termearnings. They argued that short term cash flow prediction errors maybe attributable to the fact that such information may already beincorporated in the market price.
Lorek, Schaefer, and Willinger (1993) show that the time-seriesbehaviour of cash flow series is in marked contrast to the models typicallyemployed for accounting net income. They demonstrated that univariatetime-series models of cash flow generate more accurate forecasts thanthe multivariate cross-sectional regression models used in prior studies.In this study, we provide further information on the relationship betweencash flows and earnings.
The traditional cash bUdget has a short term orientation. The cashbudgeting techniques which include an annual forecast of cash flow andearnings have been found to be highly correlated to annual cash flows.However, some firms find the cash budgeting process to be tedious and/ortime-consuming. Therefore, if a firm desires to forecast annual cash flowswithout preparing a complel~ set of budgeted financial statements, thecash flow forecast is generated by using previous earnings data (Gombolaand Ketz, 1983).
This study examines the ability to forecast annual cash flows usingdata from prior years. The approach of this paper finds support in thestudy conducted by Percy and Stoke (1992). Percy and Stokes studiedAustralian firms and found that:
(1) there was low correlation between traditional cash flowmeasures (such as net income plus depreciation and workingcapital from operations) and a more refined measure of cashflow as utilized in Bowen et al. (1986);
(2) the traditional cash flow measures are highly correlated withearnings; and
(3) one and two period ahead forecasting models using traditionalcash flow measures provide a better prediction of future cashflows than more refined cash flow measure.

16 INDIAN JOURNAL OFACCOUNTING
Bowen et al. (1986) used univariate models to predict future cashflows because they maintained that there was no theory that specified amultivariate prediction model. Furthermore, they indicated that theavailable data was inadequate to empirically estimate a multivariate model.However, it has been pointed out that multivariate models are bettersuited to capturing time- series properties of cash flow information thanare univariate models (Lev, 1989; Arnold, Clubb, Monson, and Wearing,1991; Moses, 1991; and Kinnuen and Niskanen, 1993). Therefore, thisstudy examines the ability of multivariate models to forecast future cashflows.
Data and Methodology
The Financial Accounting Standards Board (FASB) has repeatedlymaintained that past earnings are a better predictor of future cash flowsthan are past cash flows. Numerous studies have indicated that decisionmakers are concerned about the importance of forecasting annual cashflows (Bowen et aI., 1986; Greenberg, Johnson and Ramesh, 1986; Ketzand Largay, 1987; Bernard and Stober, 1989; Kinnuen and Niskanen,1993).
The empirical portion of this study used a random sample of 250firms drawn without replacement from the Standard and Poor's CompustatAnnual Industrial tapes for the years 1973-1992. The sample includes165 industries based on the four digit SIC codes and forty nine industriesin the two digit SIC codes. The sample contains both manufacturing andretailing firms.
A number of cash flow measures have been proposed in the literature(Drtina and Largay, 1985; Bernard and Ruland. 1989; Board and Day,1989; Arnold et aI., 1991; Kinnunen and Niskanen, 1993). The cash flowmeasures differ because of different users and uses of cash flowinformation. In addition, there is no empirical support for anyone of thesemeasures. Four alternative measures of cash flow: net income fromoperations plus depreciation and amortization (NIPD); working capitalfrom operations (WCFO); cash flow from operations (CFFO); and cashflow from operations after changes in plant, property, and equipment(CFAP). All the cash flow measures can be calculated through adjustmentsto annual net income from operations (see the appendix for specificdefinitions of these measures).
Cross sectional Spearman's correlations for 1973-1992 werecomputed as an overall correlation of cash flow measures for all finn.s inthe sample (as shown in Table 1).

FORECASTING ANNUAL CASH FLOWS
Table 1. Cross-sectional Spearman's Correlations(Significance Levels) of Cash Flow Measures Normalized
by Total Assets
17
OPNI NIPD WCFO CFFO CFAP
Operating Net Income 1.0(OPNI)
Operating Net Income .9359 1.0Plus Depreciation (NIPD) (.001)
Working Capital from .8652 .9088 1.0Operations (WCFO) (.001) (.001)
Cash Flow from .5890 .6460 .6979 1.0Operations (CFFO) (.001) (.001) (.001)
Cash Flow after Change .5202 .5006 .5353 .8826 1.0in Plant, Property, and (.001) (.001) (.001) (.001)Equipment (CFAP)
Each cash flow measure was divided by total assets in order toovercome correlations due to firm size. An examination of this table showshigh correlations between operating net income (OPNI) and net incomeplus depreciation and amortization (NIPD), and working capital fromoperations (WCFO). The correlations between OPNI and cash flow fromoperations (CFFO) and cash flow after change in plant property andequipment (CFPAP) are, however, moderate. These results are consistentwith the results shown in Bowen et al. (1986) and Percy and Stokes(1992).
Spearman's correlations of the various cash flow measures forindividual firms were determined for the years 1973-1992. Table 2summarizes the results.
The correlations between OPNI and different cash flow measures aresimilar to the correlations shown in Table 1. When NIPD, the traditionalcash flow measure, is correlated with other measures of cash flow, it canbe seen that the refined cash flow measures are weak proxies for thetraditional cash flow measures. Similar results were reported by Percyand Stokes (1992).

18 WD~NJOURNALOFACCOUNnNG
Table 2. Time Series Analysis of Spearman's Correlationsby Individual Firms
Independent Variable(s) Quantiles of Correlations for 250 firms
Number of Mean 10% 25% 50% 75% 90%Firms Insig.
OPNI and NIPD 10 .903 .781 .900 .976 1.0 1.0
OPNI and WCFO 44 .752 .371 .679 .891 .975 1.0
OPNI and CFFO 154 .318 -.30 .048 .400 .701 .900
OPNI and CFAP 166 .232 -.40 -.07 .271 .569 .943
NIPD and WCFO 38 .787 .428 .750 .924 .988 1.0..•.NIPD and CFFO 144 .368 -.27 .152 .402 .694 .915
NIPD and CFAP 168 .273 -.40 .029 .309 .556 .943
WCFO and CFFO 130 .418 -.22 .200 .486 .771 .943
WCFO and CFAP 170 .298 -.30 .061 .348 .633 1.0
CFFO and CFAP 38 .795 .321 .738 .914 1.0 1.0
Model Development
Numerous studies have indicated that the relationship betweeneconomic variables is stable such that measures from a previous timeperiod can provide predictions of like measures in future time periods(Schaefer and Kennelley, 1986; Bernard and Stober, 1989; Lorek, Schafer,and Willinger, 1993; Franz et aI., 1993). This study takes into considerationdistinct accounting identities, such as NIPD=Operating Income +Depreciation and Amortization, in the development of cash flowexpectations model.
Four groups of cash flow expectation models were analyzed. Theadjusted R2 was used to evaluate the expectation models. For each cashflow measure and each expectation model. a time-series relationship wascalculated separately for the firms in the sample and the adjusted R2swere compared. The forecast accuracy for individual firms is dependentupon the accuracy of the lagged annual earnings and cash flows. In orderto minimize confounding errors, we used the actual earnings and cashflows for time "t" rather than a forecast. The results are impacted to theextent that forecasted earnings and sales differ from actual earnings andsales.
FORECASTING ANNUAL CASH FLOWS 19
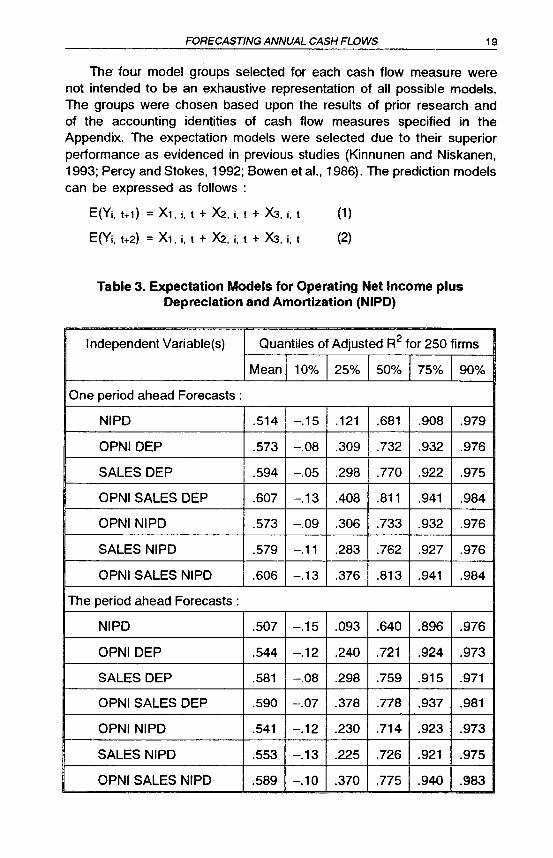
The' four model groups selected for each cash flow measure werenot intended to be an exhaustive representation of all possible models.The groups were chosen based upon the results of prior research andof the accounting identities of cash flow measures specified in theAppendix. The expectation models were selected due to their superiorperformance as evidenced in previous studies (Kinnunen and Niskanen,1993; Percy and Stokes, 1992; Bowen et aI., 1986). The prediction modelscan be expressed as follows :
E(Yi. t+l) = Xl, i, t + X2. i, t + X3, i, t (1)
E(Yi, t+2) = Xl, i, t + X2, i, t + X3, i, t (2)
Table 3. Expectation Models for Operating Net Income plusDepreciation and Amortization (NIPD)
Independent Variable(s) Quantiles of Adjusted R2 for 250 firms
Mean 10% 25% 50% 75% 90%
One period ahead Forecasts:
NIPD .514 -.15 .121 .681 .908 .979
OPNIDEP .573 -.08 .309 .732 .932 .976
SALES DEP .594 -.05 .298 .770 .922 .975
OPNI SALES DEP .607 -.13 .408 .811 .941 .984
OPNI NIPD .573 -.09 .306 .733 .932 .976
SALES NIPD .579 -.11 .283 .762 .927 .976
OPNI SALES NIPD .606 -.13 .376 .813 .941 .984
The period ahead Forecasts:
NIPD .507 -.15 .093 .640 .896 .976
OPNIDEP .544 -.12 .240 .721 .924 .973
SALES DEP .581 -.08 .298 .759 .915 .971
OPNI SALES DEP .590 -.07 .378 .778 .937 .981
OPNI NIPD .541 -.12 .230 .714 .923 .973
SALES NIPD .553 -.13 .225 .726 .921 .975
OPNI SALES NIPD .589 -.10 .370 .775 .940 .g83

20 mD~NJOURNALOFACCOUNnNG
Four groups of expectation models were developed which use differentaccounting identities to measure cash flows. Since some cash flowmeasures are highly correlated with earnings, it was anticipated thatcurrent year's earnings could be a significant factor in predicting futurecash flows.
The first group of expectation models uses opera~ing net income plusdepreciation (NIPD) as the predicted variable which is forecasted for oneand two period ahead respectively.
Table 4. Expectation Models for Cash Flow after change In Plant,Property, and Equipment (CFAP)
Independent Variable(s) Quantiles of Adjusted R2 for 250 firms
Mean 10% 25% 50% 75% 90%
One period ahead Forecasts:
CFAP .134 -.21 -.07 .041 .340 .909
OPNINETPLANT .133 -.04 -.11 .149 .429 .762
SALES NETPLANT .164 -.26 -.10 .145 .445 .927
OPNI SALES NETPLANT .151 -.39 -.10 .178 .452 .748
OPNICFAP .133 -.44 -.11 .149 .429 .762
SALES CFAP .146 -.29 -.12 .133 .419 .796
OPNI SALES CFAP .151 -.39 -.10 .178 .452 .748
Two period ahead Forecasts:
CFAP .140 -.21 -.07 .043 .388 .650
OPr-J1 NETPLANT .176 -.31 -.09 .169 .489 .791
SALES NETPLANT .203 -.24 -.06 .146 .487 .757
OPNI SALES NETPLANT .180 -.27 -.07 .223 .491 .745
OPNICFAP .176 -.31 -.09 .169 .489 .791
SALES CFAP .178 -.27 -.09 .150 .460 .779
OPNI SALES CFAP .180 -.27 -.07 .223 .491 .745
Table 3 indicates that for cash flow defined as NIPD, all identitieshad high adjusted R2s but the multivariate models had the highest adjustedR2s. For the one period ahead forecast, the multivariate version of themodel had mean adjusted R2s ranging from .573 to .607 (median .732

FORECASTING ANNUAL CASH FLOWS 21
to .913). Similar results were found for the two period ahead forecastswhere the mean adjusted R2s for multivariate models had values from.544 to .590 (median: .714 to .778).
The second group of models utilized working capital from operations(WCFO) as the dependent variable. The results were similar to thoseobserved in the first models.
For both the one and two period ahead forecasts, the mean adjustedR2s of multivariate models were higher than the adjusted R2s for therandom walk model.
Cash flow from operations (CFFO) was the dependent variable.
Even though the mean adjusted R2s were much lower than the modelsshown in Table 3, the multivariate models exhibited higher mean adjustedR2s than the random walk model.
In the final model group, the multivariate models for the most parthad higher mean adjusted R2s. For the two period ahead forecast, themultivariate models had in all cases mean adjusted R2s.
The statistical significance of the median adjusted R2s for each cashflow variable is presented in Table 5 using Friedman's test of equality.
Table 5. Friedman Tests of the Null Hypothesis that, for each CashFlow Variable, the Median Adjusted R2 are equal
Cash Flow Variable One Period Ahead Two periods Ahead
Chi-sq. Signif. Chi-sq. Signif.
NIPD 1.84 .0889 1.41 .2081
WCFO 1.72 .1134 1.30 .2519
CFFO 3.07 .0054 2.13 .0479
CFAP 3.08 .0054 2.13 .0479
In the case of NIPD and WCFO, the Friendman test did not indicatethat there were any significant differences among the median adjustedR2s. For the variables, CFFO and CFAP, the null hypothesis of equalitywas rejected for both one period and two period ahead forecast at .01level and .05 level respectively. These results indicate that the multivariatemodels performed better in predicting future cash flows than the randomwalk models. This is particularly evident for CFFO and CFAP.

22 mD~NJOURNALOFACCOUNnNG
Conclusion
The extant literature indicated that there is no established theory tospecify the exact nature of a multivariate model to forecast cash flows.This study examined the value of multivariate models based on commonlydeveloped cash flow forecasts.
The results of this study provide evidence that support the desirabilityof using multivariate models for forecasting cash flows. Using data froma random sample of 250 American companies for the time period1973-1992, the study found that :
1. There are higher correlations between different cash flowmeasures Le. NIPD, WCFO, CFFO, and CFAP.
2. Multivariate cash flow models had higher adjusted R2s inforecasting than the benchmark random walk.
3. The multivariate model performed better for the CFO and CFAPmeasures of cash flow.
These results have important implications about the merits of usingmultivariate models for annual cash flows. It also raises some questionsabout the position taken by FASB regarding the superiority of past earningsin the task of predicting future cash flows.
ReferetlCe
Arnold, A., Clubb, C., Manson, S., and Wearing, R., "The Relationship betweenEarnings, Funds Flows, and Cash Flows : Evidence for the U.K.,"Accounting and Business Research, Winter 1991, 13-19.
Bernard, V. and Ruland, R., "The Incremental Information Content of HistoricalCost and Current Cost Income Numbers: Time Series Analyses for1962 to 1980," The Accounting Review, October 1987, 707-722.
Bernard, V. and Stober, T., "The Nature and Amount of Information in CashFlows and Accruals," The Accounting Review, October 1ge9, 624-652.
Board, J. and Day, J., "The Information Content of Cash Flow Figures," Accountingand Business Research, Winter 1989, 3-11.
Bowen, R., Burgstahler, D, and Daley, L., "Evidence on ths Relationships betweenEarnings in Various Measures of Cash Flow," The Accounting Review,OCtober 1986, 713-725.
--, "The Incremental Information Content of Accrual Versus Cash Flows,"The Accounting Review, October 1987, 723-747.
Drtina, R. and Largay, J., "Pitfalls in Calculating Cash Flow from Operations,"The Accounting RevieW, April 1995, 314- 326.
El-Gaz.er, S. and Zaumeyer, D., "Cash flow Disclosure, Solvency, and BondRating Changes," paper presented at the International Cash FlowConference, Nice, 1990.

FORECASTING ANNUAL CASH FLOWS 23
Financial Accounting Standards Board, "Statement of Cash Flows," Statement ofFinancial Accounting Standards No. 95, Stanford, CT. :FASB, November1987.
Franz, D., Siegel, P., and Rigsby, J., "The Information Content of Various CashFlow Measures after Controlling for Earnings." Indian Journal ofAccounting, December 1993, 1-14.
Gombola, M. and Ketz, J., "A Caveat on Measuring Cash Flow and Solvency,"Financial Analysts' Journal, September-October 1983, 66-72.
Greenberg, R., Johnson, G., and Ramesh, K., "Earnings Versus Cash Flow asA Predictor of Future Cash Flow Measures," Journal of Accounting,Auditing, and Finance, Fall 1986, 266-277.
Ketz" J. and Largay, J., "Reporting Income and Cash Flows from Operations,"Accounting Horizons, June 1987, 9-18.
Kinnuen, J. and Niskanen, J., "The Information Content of Cash Flows and theRandom Walk: Evidence from the Helsinki Stock Exchange," Accountingand Business Research, Summer 1993, 263-272.
Lorek, K., Schaefer, T., and Willinger, G., "TIme-Series Properties and PredictiveAbility of Funds Flow Variables," The Accounting Review, January 1993,151-163.
Moses, 0., "Cash Flow Signals and Analysts' Forecast Revisions," Journal ofBusiness, Finance, and Accounting, November 1991, 807-832.
Percy, M. and Stokes, D., "Further Evidence on Empirical Relationships betweenEarnings and Cash Flows," Accounting and Finance, May 1992, 27-49.
Schaefer, T. and Kennelley, M., "Alternative Cash Flow Measures andRisk-Adjusted Returns," Journal of Accounting. Auditing & Finance,October 1986, 278-87.
Appendix
Definitions of cash flow variables :
a. NIPD =Operating net income pius depreciation and amortization
b. WCFO =Working capital from operations
c. CFFO = Cash flow from operations
d. CFAP = Cash flow after change in plant property and equipment
e. SALES = Sales revenue
f. DEP = Depreciation plus amortization
g. OPNI = Operating net income
h. WCA = Working Capital Accounts WCA = WCFO - OPNI
i. CFA =Cash flow accounts CFA = CFFO - OPNI
j. NETPLANT =Net change in plant investmentNETPLANT = CFAP - OPNI.

INDIAN JOURNAL OF ACCOUNTINGVOL. XXVI, DECEMBER 1995
CORPORATE CHARACTERISTICS AND EXTENDEDCORPORATE REPORTING· SOME INDIAN EVIDENCE
0/. 1(. o/asa{*
This article is a sequel to Vasal (1994) and Vasal (1995) identifyingdeterminants of, respectively, social and financial reporting in India. Inthe present research paper an attempt has been made at identifyingdeterminants of extended corporate reporting (ECA) in India. The authorconcludes that the level of significance as well as the relative importanceof the determinants of extended corporate reporting are quite differentfrom those of extended social and extended financial reporting in Indiahaving its implications for using the precise definitions of the conceptsof social, financial, and corporate reporting in the empirical studiesconducted hereafter.
Introduction
Broadly speaking, business objectives can be classified into two majorcategories, namely financial and social. While the financial objectivesrelate to commercial and financial performance, the social objectives areconcerned with the social performance of a business entity. In thisbackground, Vasal (1994, 1995) has proposed that concepts of financialand social reporting should, respectively, correspond to financial andcommercial objectives, and social objectives of the businesses.Accordingly, the above cited studies have marshalled some empiricalevidence on the likely determinants of intercorporate variations in financialand social reporting. Notably, both the studies have examined the impactof same set of explanatory variables with values of each explanatoryvariable determined using the common database. With same values ofthe likely determinants, whereas Vasal (1994) has identified size and ageof a company as the most important determinants of social reporting inthe stated order of variables, the most significant determinant of financialreporting in Vasal (1995) is identified as the Review of Accounts by theComptroller and Auditor General (C&AG) of India1
.
It is argued here that since financial and social objectives are sub-setsof the overall business objectives, the financial and social reporting, inturn, are sub-sets of the overall business reporting. In this backdrop,
* Faculty, Department of Financial Studies, University of Delhi, South Campus.
1 At 1 per cent level of significance.
24

EXTENDED CORPORATE REPORTING 25
therefore, it is quite likely that factors identified as significant determinants,as also the order of their importance, in explaining the financial and socialreporting sub-sets may be different from those likely for the business(corporate) reporting as a whole. In fact, an empirical testing of thisproposition forms the basis of the present study. More specifically,objectives of the present research paper are two-fold. First, the studyhas made an attempt to identify some significant corporate characteristicsthat explain the observed inter-corporate variations in corporate reportingthrough the medium of corporate annual reports (CAR). Second, the setof identified determinants of corporate reporting has been compared withthose found for social and financial reporting in Vasal (1994) and Vasal(1995), respectively.
Methodology
Approach to the Problem
The problem of measuring and analyzing inter-corporate differencesin corporate reporting can be approached in two different ways. Underthe first approach corporate reporting is defined in terms of all suchdisclosures in an annual report which pertain to the issues covered withinthe ambit of corporate reporting. However, a serious shortcoming of thisapproach is that it does not make a distinction between statutorily requiredand non-statutorily required disclosures. As an alternative, corporatereporting can be defined in terms of non-statutorily required disclosuresonly, termed Extended Corporate Reporting (ECR) in this stUdy. Therationale for adopting this alternative approach is that corporate entities,by and large, tend to conform to the governing corporate laws. Moreover,requirement of statutory audit [and a supplementary audit of public sectorcompanies by the Comptroller and Auditor General (C&AG) in India)further ensures that all applicable provisions of the corporate laws areobserved diligently by the companies. Thus, inter-corporate variations inreporting, if any, would generally relate only to disclosures not mandatedunder the laws. In view of this, in the present paper, this alternativeapproach has been followed in isolating the determinants of corporatereporting in India.1 Moreover, ECR is a better indicator of enlightenedself-regulation by a company.
Regression Model
In order to identify company characteristics explaining inter- corporatevariations in ECR, a multiple regression model has been designed. The
1 In terms of 'disclosure index' method absolute differences between companies undereither approach would be the same. However, values of intercorporate variations incorporate reporting are stated in a narrower range when they are expressed as ratiosunder the former method.

26 INDIAN JOURNAL OFACCOUNTING
designed model expresses ECR as a function of variables representingvarying financial characteristics and diverse socio-cultural milieu of samplecompanies. The form of equation used for estimating the functionalrelationship is :
y =a + b1 X1 + b2 X2 + b3 X3 + b4 X4 + bs Xs + bj Xj + e
where,
Y = VOLINDEX = extended corporate reporting score,
a = intercept,
bj = b6 to b23 = regression coefficients for industry dummies,
b1 to b23 = regression coefficients,
X1 =SIZE =Size of a company,
X2 =GOVTAGE =Age of a company,
X3 =ROTA = Profitability,
X4 =NOC~EV =Review of accounts by C&AG (Dummy variable),
Xs =ICAI =Best presented accounts competition (Dummy Variable}.
Xj = X6 to X23 = DPE1 to DPE18 (Industry Dummy variables), and
e = regression residual.
In the foregoing model, like Vasal (1994, 1995); 23 explanatoryvariables are used to explain the behaviour of dependent variable.Amongst the explanatory variables, variables X1 to X3 are quantitativewhile the others, X4 to X23, are qualitative (dummy) variables. Sincesample companies have been divided into nineteen iocllJstry-groups, theindustry variable has resulted into eighteen dummy variables DPE1 toDPE18 [see Vasal (1994) for details].
Sample and Data
The present study is based on a sample of com~nies selected fromthe Indian Public Sector. A choicl? for central public sector companies(CPSC) has been made for the reQ~ons given in Vasal (1994). In thestudy, based on the availability of annual reports for four cross-sectionalyears 1988 to 1991 1, a sample of 129 CPSC is taken. The industrywisegrouping of companies, using industry classification adopted by theDepartment of Public Enterprises (OPE) in 1990-91, is given in Vasal(1994).
1 The croas-sectiol'lal year 1988 to 1991 oorrespond to the fi5Cal')lIMTs 1!987-88 to 1990-~.
A fiscal year begins on April 1 and ends on Mareh 31. At the time of collection of data1990-91 was the latest year for which annual reports weN allllitable.

£><TENDED CORPORATE REPORTING 27
Data Probltuns
In the study, a serious problem was noticed at the time of measuring~ome of the selected financial variables for the sample year 1989. Theproblem related to a change in the accounting period resorted to by sixsamp1e companies. O.",ing to this, operating data for these six companiesespecially on flow variables like turnover, net profits etc. have lackedcomparabiJity both on an inter-period and on an inter-corporate basts. Inorder to remedy this problem data on flow variables for the above saidsix companies were annualised by using appropriate adjustment factors.
Variables
Dependent Variable - Corporate Reporting Score (VOUNDEX)
Like Vasal (1994, 1'995), quantum of information disclosure in annualreports has been measured by using the 'disclosure index' method.Significantly, this method has been used widely in the similar kind ofresearch studies conducted all across the world. To operationalize theselected method the following steps are taken. First, a list of sixty-fiveitems that relate to various aspects of corporate reporting has beenprepared1
. Second, using 'modified dichotomous approach', corporatereporting score for a company is defined and measured as a ratio of thenumber of items ql$closed to what was expected to be disclosed by thecompany concerned.
Independent Variables
As stated above, the present study employs 23 explanatory variablesin the designed regression model. These variables are same as thoseexamined in Vasal (1994) and VCI$al (1995). For the sake of brevity,details on definitions and measurements of these variables have beenomitted2
. Notably, the hypothesized relationship of each oHhese variableswith the corporate reporting scores are same as those discussed in Vasal(1994).
In the present study all disclosures related to aspects covered under the ambit offinancial and social reporting have been included in the construction of the disclosureindex. Also, those items which could not be classified in either of ttle two sub-sets ofreporting due to lack ()f clarity or possible overlapping. and the items in the nature ofgeneral reporting have been considered in defining and measuring the corporate reportingas a whole. The list of items included in the disclosure index is available with theauthor.
2 Those interested in the detailed definiti<>ns and measurements of independent variablesmay reter to Vasal (1994).
28 WD~NJOURNALOFACCOUNnNG
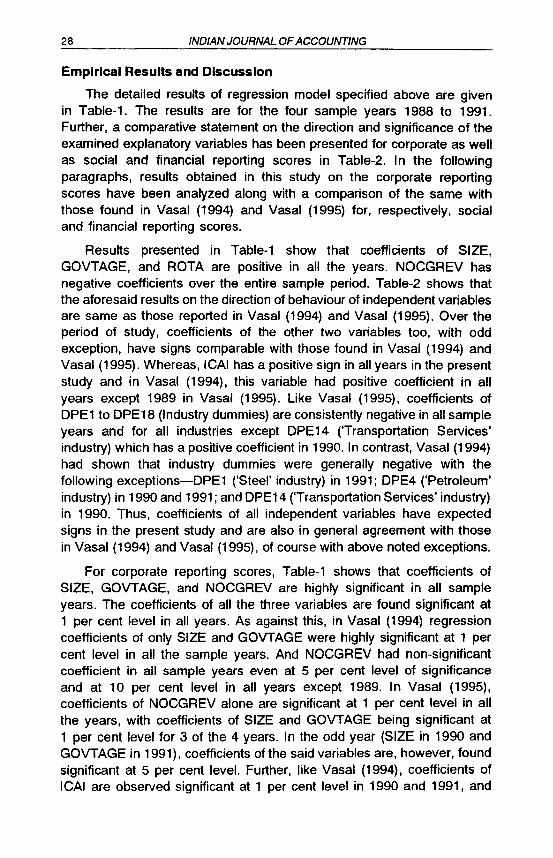
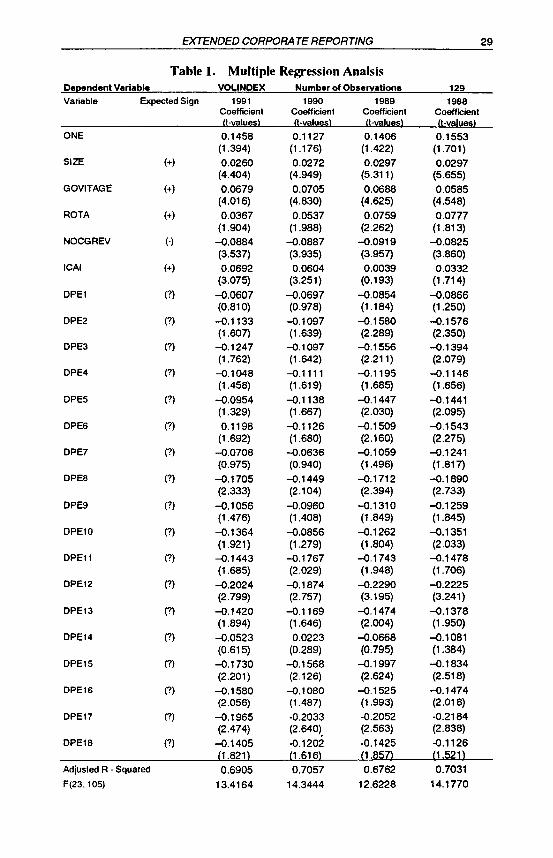
Empirical Results and Discussion
The detailed results of regression model specified above are givenin Table-1. The results are for the four sample years 1988 to 1991.Further, a comparative statement on the direction and significance of theexamined explanatory variables has been presented for corporate as wellas social and financial reporting scores in Table-2. In the followingparagraphs, results obtained in this study on the corporate reportingscores have been analyzed along with a comparison of the same withthose found in Vasal (1994) and Vasal (1995) for, respectively, socialand financial reporting scores.
Results presented in Table-1 show that coefficients of SIZE,GOVTAGE, and ROTA are positive in all the years. NOCGREV hasnegative coefficients over the entire sample period. Table-2 shows thatthe aforesaid results on the direction of behaviour of independent variablesare same as those reported in Vasal (1994) and Vasal (1995). Over theperiod of study, coefficients of the other two variables too, with oddexception, have signs comparable with those found in Vasal (1994) andVasal (1995). Whereas, ICAI has a positive sign in all years in the presentstudy and in Vasal (1994), this variable had positive coefficient in allyears except 1989 in Vasal (1995). Like Vasal (1995), coefficients ofOPE1 to OPE18 (Industry dummies) are consistently negative in all sampleyears and for all industries except OPE14 ('Transportation Services'industry) which has a positive coefficient in 1990. In contrast, Vasal (1994)had shown that industry dummies were generally negative with thefollowing exceptions-OPE1 ('Steel' industry) in 1991; DPE4 ('Petroleum'industry) in 1990 and 1991; and OPE14 ('Transportation Services' industry)in 1990. Thus, coefficients of all independent variables have expectedsigns in the present study and are also in general agreement with thosein Vasal (1994) and Vasal (1995), of course with above noted exceptions.
For corporate reporting scores, Table-1 shows that coefficients ofSIZE, GOVTAGE, and NOCGREV are highly significant in all sampleyears. The coefficients of all the three variables are found significant at1 per cent level in all years. As against this, in Vasal (1994) regressioncoefficients of only SIZE and GOVTAGE were highly significant at 1 percent level in all the sample years. And NOCGREV had non-significantcoefficient in all sample years even at 5 per cent level of significanceand at 10 per cent level in all years except 1989. In Vasal (1995),coefficients of NOCGREV alone are significant at 1 per cent level in allthe years, with coefficients of SIZE and GOVTAGE being significant at1 per cent level for 3 of the 4 years. In the odd year (SIZE in 1990 andGOVTAGE in 1991), coefficients of the said variables are, however, foundsignificant at 5 per cent level. Further, like Vasal (1994), coefficients ofICAl are observed significant at 1 per cent level in 1990 and 199', and
EXTENDED CORPORATE REPORTING 29
Table 1. Multiple Regression AnalsisDependent Variable VOLINDEX Number of Observations 129Variable Expected Sign 1991 1990 1989 1988
Coefficient Coefficient Coefficient CoefficientIt-values) (I-values) (I-values) (I-values)
ONE 0.1458 0.1127 0.1406 0.1553(1.394) (1.176) (1.422) (1.701)
SIZE (+) 0.0260 0.0272 0.0297 0.0297(4.404) (4.949) (5.311) (5.655)
GOVITAGE (+) 0.0679 0.0705 0.0688 0.0585(4.016) (4.830) (4.625) (4.548)
ROTA (+) 0.0367 0.0537 0.0759 0.0777(1.904) (1.988) (2.262) (1.813)
NOCGREV (-) -0.0884 -0.0887 -0.0919 -0.0825(3.537) (3.935) (3.957) (3.860)
ICAI (+) 0.0692 0.0604 0.0039 0.0332(3.075) (3.251) (0.193) (1.714)
OPEl (?) -0.0607 -0.0697 -0.0854 -0.0866(0.810) (0.978) (1.184) (1.250)
OPE2 (7) -0.1133 -0.1097 -0.1580 -0.1576(1.607) (1.639) (2.289) (2.350)
OPE3 (7) -0.1247 -0.1097 -0.1556 -0.1394(1.762) (1.642) (2.211) (2.079)
OPE4 (7) -0.1048 -0.1111 -0.1195 -0.1146(1.458) (1.619) (1.685) (1.656)
OPES (7) -0.0954 -0.1138 -0.1447 -0.1441(1.329) (1667) (2.030) (2.095)
OPE6 (7) 0.1198 -0.1126 -0.1509 -0.1543(1.692) (1.680) (2.160) (2.275)
OPE7 (?) -0.0708 -0.0636 -0.1059 -0.1241(0.975) (0.940) (1.496) (1.817)
OPE8 (7) -0.1705 -0.1449 -0.1712 -0.1890(2.333) (2.104) (2.394) (2.733)
OPE9 (?) -0.1056 -0.0960 -0.1310 -0.1259(1.476) (1.408) (1.849) (1.845)
OPE10 (?) -0.1364 -0.0856 -0.1262 -0.1351(1.921) (1.279) (1.804) (2.033)
OPEll (7) -0.1443 -0.1767 -0.1743 -0.1478(1.685) (2.029) (1.948) (1.706)
OPE12 (7) -0.2024 -0.1874 -0.2290 -0.2225(2.799) (2.757) (3.195) (3.241)
OPE13 (?) -0.1420 -0.1169 -0.1474 -0.1378(1.894) (1.646) (2.004) (1.950)
OPE14 (?) -0.0523 0.0223 -0.0668 -0.1081(0.615) (0.289) (0.795) (1.384)
OPE1S (?) -0.1730 -0.1568 -0.1997 -0.1834(2.201) (2.126) (2.624) (2.518)
DPE16 (7) -0.1580 -0.1080 -0.1525 -0.1474(2.056) (1.487) (1.993) (2.018)
DPE17 (7) -0.1965 -0.2033 -0.2052 -0.2184(2.474) (2.640), (2.563) (2.838)
OPE18 (?) -0.1405 -0.1202 -0.1425 -0.1126(1.821) (1.616) (1.857) (1.521>
Adjusted R - Squared 0.6905 0.7057 0.6762 0.7031F(23.10S) 13.4164 14.3444 12.6228 14.1770

30 INDIAN JOURNAL OF ACCOUNTING
Table 2. Comparative Statement on the Significance ofExplanatory Variables
Number of Observations 129
Dependent Variable
Variable SOCINDEX FININDEX VOUNDEX
Sign Coell. Sign Coell. Coelt. Coell. Coeff. Coelf.Significance Sign Significance Sign Significance
SIZE (+) 1098 - 1098 .+** 1098 -GOVTAGE (+) 1098 - 1098 +- 1098 -ROTA (+) 1098 ??+? 1098 @??? 1098 @++@
NOCGREV (-) 1098 ??@? 1098 - 1098 -ICAI (+) 1098 ""?@ 10#8 +@?? 1098 **?@
OPEl H #098 ???? 1098 ???? 1098 ????
OPE2 H 1098 ??@@ 1098 @@@? 1098 ??++
OPE3 (-) 1098 ???? 1098 *+++ 1098 @@++
OPE4 H ##98 ???? 1098 +.+@ 1098 ??@@
OPE5 H 1098 ???+ 1098 ???? 1098 ?@++
OPE6 H 1098 ???? 1098 +++@ 1098 @@++
OPE? (-) 1098 ??@+ 1098 ???? 1098 ???@
OPE8 H 1098 ??@+ 1098 +++@ 1098 +++*
OPE9 (-) 1098 ??@+ 1098 ???? 1098 ??@@
OPE10 H 1098 ???@ 1098 +?71 1098 @?@+
OPE11 (-) 1098 ??!@ 1098 @@@? 1098 @+@@
OPE12 (-) 1098 ++.. 1098 +@+@ 1098 -OPE13 H 1098 ??@@ 1098 ???? 1098 @@+@
DPE14 (-) 1#98 ???? 1@98 ???? 1#98 ????
DPE15 H 1098 @@** 1098 @@@? 1098 ++*+
OPE16 (-) 1098 ??@@ 1098 ++71 1098 +1++
OPEl? (-) 1098 @@++ 1098 +++? 1098 +*+*
OPE18 H 1098 ??+@ 1098 ++@? 1098 @?@?
Legend: Sign 01 Coefficients
1 - expecled sign in 1991
o- expected sign in 1990
9 - expected sign in 1989
8 - expected sign in 1988
# - non-expected sign in 1. O. 9 or 8
Dependent Variables :
Significance of Coefficients
• - significant at 0.01 level
+ - significant at 0.05 level
@ - significant at 0.1 0 level
? - non-significant at 0.10 level
SOCINOEX - Social Reporting Score (Vasal. 1994)
FININDEX - Financial Reporting Score (Vasal. 1995).
VALINOEX - Corporate Reporting Score (present Study).

EXTENDED CORPORATE REPORTING 31
at 10 per cent level even for the year 1988. However, in Vasal (1995),coefficients of ICAI were found significant only in 1990 and 1991 at 10per cent and at 5 per cent levels, respectively. For ROTA, regressioncoefficients in the present study are significant at 5 per cent level for theyears 1989 and 1990. For the other two years also the coefficients aresignificant though at 10 per cent level. In contrast, Vasal (1994) hasfound coefficient of ROTA significant only in 1989 at 5 per cent level ofsignificance. In Vasal (1995) also coefficients of ROTA were non-significantat 5 per cent level in all the sample years. It has only in 1991 that thecoefficient of ROTA was significant at 10 per cent level. In a nutshell,analysis of empirical results has revealed a dissimilar set of statisticallysignificant determinants of extended corporate reporting vis-a-vis socialand financial reporting. To sum up, the salient features of the abovediscussion are as follows. First, Corporate size, Age of a company, andReview of Accounts by C&AG are the three most important determinantsof the inter-corporate variations in extended corporate reporting. Second,profitability explains the corporate reporting scores significantly on aconsistent basis. Third, participation of companies in Best PresentedAccounts Competition in general does appear to be an importantdeterminant of the extent of corporate reporting. Fourth, in comparisonwith the results on determinants of extended social reporting and extendedfinancial reporting discussed in Vasal (1994) and Vasal (1995) profitabilityis a significant determinant of inter-corporate variations in corporatereporting scores.
On the significance of 18 industry dummy variables, the followingresults are obtained on a consistent basis. First, unlike Vasal (1994) andVasal (1995), one industry - 'Textiles' - has its regression coefficientssignificant at 1 per cent level of significance in all sample years. Second,three industries - 'Medium and Light Engineering', 'Contract andConstruction Services' and 'Tourist Services' - have their regressioncoefficients significant at 5 per cent level in all the sample years. Incomparison, only 'Textiles' industry had statistically significant coefficientsat 5 per cent level in all the sample years for social reporting scores inVasal (1994). In Vasal (1995) also only one industry - 'Coal and Lignite'- has highly significant regression coefficients at 5 per cent level in allsample years. Third, at 10 per cent level of significance, regressioncoefficients for four industries - 'Coal and Lignite', I Chemicals andPharmaceuticals', 'Agro-based Industries', and 'Trading and MarketingServices' - are significant in all the sample years. In Vasal (1994), twoindustries with similar results were 'Contract and Construction Services',and 'Tourist Services'. In Vasal (1995) four industries - 'Petroleum','Chemicals and Pharmaceuticals', 'Medium and Light Engineering', and'Textiles' - were found having their regression coefficients significant at
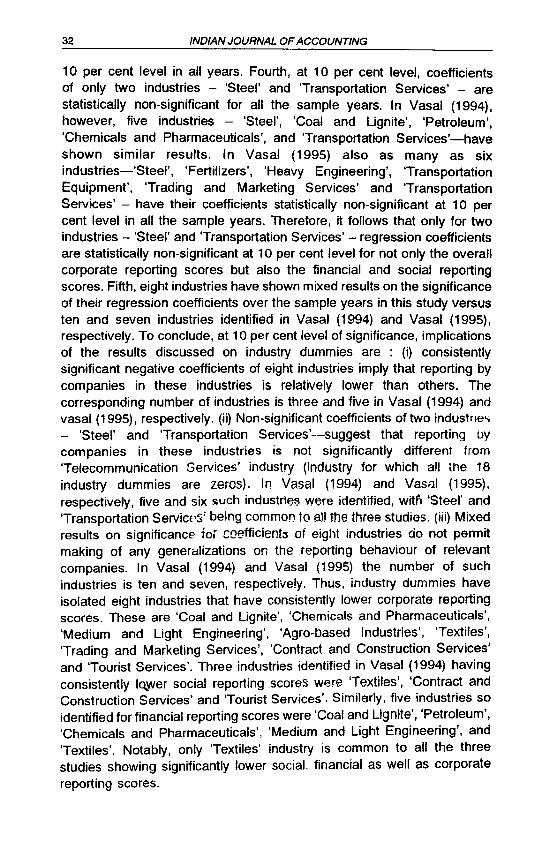
32 INDIAN JOURNAL OFACCOUNTING
10 per cent level in all years. Fourth, at 10 per cent level, coefficientsof only two industries - 'Steel' and 'Transportation Services' - arestatistically non-significant for all the sample years. In Vasal (1994),however, five industries - 'Steel', 'Coal and Lignite', 'Petroleum','Chemicals and Pharmaceuticals', and 'Transportation Services'-haveshown similar results. In Vasal (1995) also as many as sixindustries-'Steel', 'Fertilizers', 'Heavy Engineering', 'TransportationEquipment', 'Trading and Marketing Services' and 'TransportationServices' - have their coefficients statistically non-significant at 10 percent level in all the sample years. Therefore, it follows that only for twoindustries - 'Steel' and 'Transportation Services' - regression coefficientsare statistically non-significant at 10 per cent level for not only the overallcorporate reporting scores but also the financial and social reportingscores. Fifth, eight industries have shown mixed results on the significanceof their regression coefficients over the sample years in this study versusten and seven industries identified in Vasal (1994) and Vasal (1995),respectively. To conclude, at 10 per cent level of significance, implicationsof the results discussed on industry dummies are : (i) consistentlysignificant negative coefficients of eight industries imply that reporting bycompanies in these industries is relatively lower than others. Thecorresponding number of industries is three and five in Vasal (1994) andvasal (1995), respectively. (ii) Non-significant coefficients of two industfle"i- 'Steel' and 'Transportation Services'-suggest that reporting bycompanies in these industries is not significantly different tram'Telecommunication Services' industry (industry for which all the 18industry dummies are zams). In Vasal (1994) and Vasal (1995),respectively, five and six such industrlE}$ were identified, witli 'Steel' and'Transportation ServicpS' being common to all the three studies. (iii) Mixedresults on significance for coefficient;, of eight industries do not permitmaking of any generalizations on the reporting behaviour of relevantcompanies. In Vasal (1994) and Vasal (1995) the number of suchindustries is ten and seven, respectively. Thus, industry dummies haveisolated eight industries that have consistently lower corporate reportingscores. These are 'Coal and Lignite', 'Chemicals and Pharmaceuticals','Medium and Light Engineering', 'Agro-based Industries', 'Textiles'.'Trading and Marketing Services', 'Contract and Construction Services'and 'Tourist Services'. Three industries identified in Vasal (1994) havingconsistently lQ..Wer social reporting scoreS w€re 'Textiles', 'Contract andConstruction Services' and 'Tourist Services'. Similarly. five industries soidentified for financial reporting scores were 'Coal and Lignite', 'Petroleum','Chemicals and Pharmaceuticals', 'Medium and Light Engineering', and'Textiles'. Notably, only 'Textiles' industry is common to all the threestudies showing significantly lower social, financial as well as corporatereporting scores.
EXTENDED CO/3PORATE REPORTING 33
The overall significance of relationship between corporate reportingscores and six explanatory variables has been assessed in terms ofadjusted A-square and F-test values. The observed values of adjustedA-squared indicate that 68 to 71 per cent variation in corporate reportingis explained by the independent variables. F-values, showing significanceof the overall regression model, have also been found significant at 1per cent level for all sample years, thus implying a statisfically significantrelationship between disclosures on corporate reporting items and theselected explanatory variables.
Conclusions
The present research study is a pioneering effort in identifying somefundamental factors which affect extended corporate reporting in India.Using a multivariate analysis framework, the main empirical conclusionof the study is that Corporate size, Age of a company, Aeview of Accountsby C&AG and Nature of Industry are the most important determinants ofextended corporate reporting in India. Unlike Vasal (1994) and Vasal(1995), however, profitability also appears to be an important determinantof the corporate reporting. Also, the results have shown that levels ofsignificance as well as the relative importance of the identifieddeterminants of extended corporate reporting are quite different fromthose of the extended social and extended financial reporting. Theaforesaid conclusions have their implications for the semantic theories ofaccounting in that while defining such accounting terms as social, financial,and corporate reporting a strict view of the said terms needs to be taken.
Reference
Ahmed, K. and Nicholls, D., 'The impact of Non-financial Company Characteristicson Mandatory Disclosure Compliance in Developing Countries : TheCase of Bangladesh', International Journal of Accounting, Vol. 29, No.1,1994, 62-77.
Buzby, Stephen L. 'Company Size, Listed versus Unlisted Stocks, and the extentof Financial Disclosure', Journal of Accounting Research, April 1975,16-17.
Cert, Alan R. Corporate Reporting and Investment Decisions, The University ofCalifornia Press, California, 1961.
Chow, Chee W. and Boren, Adrian Wong.. 'V<9luntary Financial Disclosure byMexican Corporations', The Accounting Review, July 1987, 533-541.
Cooke T.E. 'Disclosure in the Corporate Annual Reports of Swedish Companies',Accounting and Business Research, Spring 1989, 113-124.

34 INDMNJOURNALOFACCOUNnNG
--, T. E. 'The Impact of Size, Stock market Listing and Industry Type onDisclosure in the Annual Reports of Japanese Listed Corporations'.Accounting and Business Research, Summer 1992, 229-237.
Firth, Michael 'The Impact of Size, Stock Market Listing and Auditors on VoluntaryDisclosure in Corporate Annual Report', Accounting and BusinessResearch, Autumn 1979, 273-280.
Hossain, M., Tan, L.M. and Adams, M., 'Voluntary Disclosure in an EmergingCapital Market : Some Empirical Evidence from Companies Listed onthe Kuala Lumpur Stock Exchange', International Journal of Accounting,Vol.29, No.4, 1994, 334-351.
International Federation of Accountants, 'International Public Sector Guideline 1-Financial Reporting by Government Business Enterprises', New York,IFAC, 1989. Reprinted in Accountancy, July 1989, 163.
International Federation of Accountants, 'Exposure Draft - Performance Reportingby Government Business Enterprises' New York, IFAC, 1994. Reprintedin The Chartered Accountant, August 1994, 183-210.
Marston, Claire L, and Shrives, Philip J. 'The Use of Disclosure Indices inAccounting Research: A Review', British Accounting Review, No.3,1991, 195-210.
McNally, G. M., Eng, Hock and Hasseldine, C. Roy, 'Corporate Financial Reportingin New Zealand : An analysis of user preference, CorporateCharacteristics and disclosure practices for Discretionary Information',Accounting and Business Research, Winter 1982, 11-20.
Singhvi, S. and Desai, Harsha B. 'An Empirical Analysis of the Quality of CorporateFinancial Disclosure', The Accounting Review, Jan. 1971, 129-138.
Vasal, V. K. 'Corporate Characteristics and Extended Social Reporting - SomeIndian Evidence', Indian Journal of Accounting, December 1994, 63-78.
--, 'Corporate Characteristics and Extended Financial Reporting - SomeIndian Evidence', Indian Journal of Accounting, June 1995, pp. 41-50.
Wallace, R.S.O. 'Corporate Financial Reporting in Nigeria', Accounting andBusiness Research, Autumn 1988, 352-362.

INDIAN JOURNAL OF ACCOUNTINGVOL. XXVI, DECEMBER 1995
ACCOUNTING EDUCATION IN DEVELOPING COUNTRIESPERCEPTIONS OF INTERESTED PARTIES AND CULTURALINFLUENCES-A CASE STUDY OF PAPUA NEW GUINEA
:Fabian Pol(;Patrid(:J{utcliinson t
This study analyses the perceptions of three interested parties in theaccounting profession: accountants in practice; accounting academics;and accounting students; with regard to issues concerning aims andobjectives and inputs for accounting education in Papua New Guinea.The impact of various cultural factors on the perceptions of the interestedparties are also analysed. The results of the empirical survey suggestthat there are differences between the three interested parties and thatthese are related to cultural factors. Finally, the implications of theresults for a policy for accounting education in developing countriesgenerally, and particularly in Papua New Guinea, are discussed.
Introduction
The literature on accounting systems and related accounting educationissues in developing countries such as Papua New Guinea (PNG) isprimarily descriptive. Discussion is found of the factors that influence thesystems in these countries including colonial, international, local andothers (for example, regional influences). Even though many developingcountries are independent nations, the accounting systems imposed bythe colonial powers are reinforced by international factors (e.g.,transnational corporations, international accounting firms, aid conditionsand education). Local influences tend to be weak (Hove, 1986; Tipgos,1987; Yunus, 1990a : Banerjee 1992A). As Tipgos (1987; 383-384)noted:
As vestiges of the colonial past begin to disappear in many developingcountries, one area of endeavour which appears to have difficulties insevering the bond is accounting. Today, as in the past, the accountingprofession is dominated by foreign philosophy, which may have little orno relation to the social, economic and political realities of those nations.
• Senior Lecturer, Department of Accounting, University of Papua New Guinea.
t Professor, Department of Accounting and Financial Management. University of NewEngland, Armidale, NSW 2351, Australia.
35

36 mD~NJOURNALOFACCOUNnNG
The accounting system within a country influences the accountingeducation system. The accovnting education system enforces theprinciples and practices through the education of accountants. In turn,the accounting graduates reinforce that accounting system through trainingand continuing education with the organisations in which they areemployed, professional organisations of which they are members andfollow the norms and practices of the society of which they are a part(Yunus, 1990b).
A policy on accounting education for PNG requires consideration ofperceptions of various interested parties. Since accounting education formembership of the profession in PNG takes place at university level, theperceptions of university academics and students are considered as wellas those of accountants in practice.
Policies must consider selected aims and objectives and input issuesof accounting education in Papua New Guinea in order to maximiseoutput. The perceptions of the three interested parties on selected aimsand input issues form the basis of the study which is the first attempt toprovide empirical evidence about accounting education issues in PNG toenable improvement of accounting education in the country. In this study,the main output is seen as being accounting graduates, going intoemployment in different accounting fields, joining accounting professionalbodies and contributing to the welfare of the society. The quantity andquality of graduates produced will affect the status of the local accountingprofession and staffing problems faced in developing countries includingPNG. If the aims and objectives are identified and inputs into theaccounting education system and the processing unit are improved, thesystem may be more efficient in the production of graduates needed inPNG.
The perceptions are tested, first of all, for between group differences(the three interested parties) and secondly for between subgroupdifferences where the perceptions of those involved are used to testselected cultural issues as found in Hofstede's (1980, 1983) work onnational culture and work related values. He noted three cultural issuesthat can influence the perceptions of individuals on work related values.They are national culture; organisational culture and occupational culture.Secondly, therefore, this study investigates which of several, selectedcultural issues affect the perceptions of accountants in practice, accountingacademics and accounting students regarding accounting educationissues in PNG.
The following section of this article deals with perceptions regardingaims and objectives and inputs into national accounting educationprograms. The discussion in this section leads to the formulation ofhypotheses for the empirical study, the nature of which is then describedin the section on method. The final sections present the results of thestudy and the conclusions which flow from them.

ACCOUNTING EDUCATION IN DEVELOPING COUNTRIES 37
Perceptions Regarding Aims and Objectives and Inputs into NationalAccounting Education Program
Studies relating to examining perceptions of different groups regardingaccounting and financial issues have increased in recent years. Most ofthese studies examine these issues from cross-cultural perspective orwithin a country. The cross-cultural perspective involves groups in twoor more different countries. Within country studies involve the perceptionsof different groups within that country. A within country study could involvecross-cultural studies involving people from different countries or regionsin that country (Hofstede, 1983).
Few studies have examined perceptions regarding aims and objectivesand inputs into national accounting education systems. Most of theaccounting education studies are descriptive, examining specific problemsrelated to accounting profession and education in both developed anddeveloping countries (including PNG). Abdoelkadir (1982) studied theperception of accountants in practicE', accounting academics andaccounting students regarding general issues of accounting educationand profession in Indonesia. In this study, perceptions of specific issuesrelated to aims and inputs into university level accounting education areexamined.
In the following sub-section, various studies of perceptions areexamined. This will provide support for the measurement scale andstatistical techniques used in this study. This will also justify the selectionof cultural issues (background and characteristics) to test the perceptionsof the three interested parties.
Within Country Studies
Holland and Arrington (1987) examined issues that influenceaccounting faculty in the US to relocate. Cohen et al (1991) looked atthe attitudinal factors affecting the coverage of international accountingcourses in the undergraduate accounting curricula in the US. An analysiswas conducted from department chairpersons and members of theinternational section of the American Accounting Association using anattitude model adopted from the psychology literature. Reed andKratchman (1989) examined the differences in the perceptions of USaccounting students and graduates concerning the importance of variousjob attributes. A similar study was conducted by Carcello et al (1991).Pabst and Talbott (1991) analysed the perceptions of CertifiedManagement Accountants (CMA) in the US regarding the present standardof CMA examinations, Ferguson and Orpen (1991) looked at theperceptions of universities and college students to working with computersin Australia. Poe and Viator (1990) examined US university administratorsperceptions of the relative importance attached to research. teaching and

38 WD~NJOURNALOFACCOUNnNG
other services in evaluating accounting faculties. Peel et al (1991) analysedthe perceptions of two groups of accounting students in a British universityregarding the understanding of accounting concepts. McLanen (1990)examined practicing accountants and accounting academics in NewZealand regarding communication skills needed by accountants and Tanand Choo (1990) examined the impact of deep-elaborative versusshallow-reiterative information processing on students academicperformances in Australian universities.
Cross-cultural Studies
Belkaoui and Picur (1991) examined the perceptions of a group ofCanadian, American and British members of an international accountingfirm regarding a set of accounting concepts. Barnir and Elitzur (1989)analysed the perceptions of Certified Practicing Accountants (CPAs) inIsrael and the USA regarding Generally Accepted Accounting Principles(GAAP) for closely held corporations and small businesses. Welton andDavis (1990) looked at the perceptions of American and New Zealandaccounting students regarding professional ethics. Karnes et al (1990)analysed the perceptions of accountants in Taiwan and the USA regardingunethical business practices. Harrison (1992) examined the relationshipbetween participation, budget emphasis and job related attitudes of middlelevel managers in Australia and Singapore and Hofstede (1980, 1983)analysed the perceptions of employees of a multinational corporation infifty countries and three regions regarding work related values.
Hofstede (1980 : 25) defined culture as :
Collective programming ofthe mind which distinguishes the members of one human group from another.
In an attempt to develop acceptable, well defined and empiricallybased terminology to describe culture, Hofstede (1987) identified fourdistinct dimensions which were considered to reflect the cultural orientationof a country. They were: (1) power distance, (2) Uncertainty avoidance;(3) individualism; and (4) maSCUlinity. Of the four, power distance anduncertainty avoidance were most relevant for the function of anorganisation with a country (Hofstede 1987).
Hofstede (1980 and 1983), in his research on national culture andwork related value, surveyed the employees' perceptions towards workrelated values of a multinational corporation in 50 countries and threeregions. He found three different cultures that can influence an individual'sperception about work related values. The three different cultures are:(1) national culture; (2) organisational culture; and (3) occupational culture.
ACCOUNTING EDUCATlON IN DEVELOPING COUNTRIES 39
Hofstede (1987: 9) noted:
One ofthe usefulside effects ofstudying nationalcultural differences is that it opens our eyes to the differences that exists inorganisational and occupational cultures.
Subsequent empirical and descriptive research on the accountingprofession and education has shown that cultural issues such as :
(a) nationality (Harrison and McKinnon, 1986; McKinnon, 1986),
(b) where the accountants were educated (Abdeen and Yavas, 1987;Banerjee, 1992b),
(c) different industry sUbgroups (Birkett, 1989),
(d) different academic institutions (Sishta, 1989), and
(e) students sponsorship by different industry subgroups (Abdoelkadir,1982)
can affect the perceptions of individuals including accountants in practice(accountants in industry/commerce, governmenVstatutory bodies andpublic practice), accounting academics and accounting students regardingaccounting profession and education. In this study, the perceptions ofthe three interested parties will be examined in relation to accountingeducation issues in PNG, taking into consideration some of the culturalissues discussed above.
Method
There were two research questions developed for the empirical study.They are
01. Are there any differences in the perceptions of accounting students. accounting academics and accountants in practice regarding
(1) aims and objectives and
(2) selected inputs, specifically:
(2a) student development and teaching methods.
(2b) accounting academics: recruitment, promotion, and tenure.
(2c) course program development.
(2d) adequacy of teaching and research facilities, and
(2e) administration of university level accounting education inPNG?
02. Do the respondents identified in 01 differ in their perceptionsregarding aims and objectives and input issues due to selectedcultural factors (described below)?

40 WD~NJOURNALOFACCOUNnNG
A survey questionnaire (details available from the authors) wasdeveloped from a literature review of accounting professional andeducation issues in developed countries, developing countries in generaland PNG in particular.
Part A of the questionnaire, which varied depending on whichgroup respondents belonged to, sought background and characteristics information.
Part B comprising thirty-nine questions sought the perceptions ofthe three key parties relating to accounting education issues inPNG. The questions were arranged on a five point Likert scale,ranging from strongly agre~ to strongly disagree.
Questionnaires were completed and returned from 246 accountantsin practice (72% response rate), 16 accounting academics (100% responserate) and 277 accounting students (99% response rate). The sample ofaccountants in practice was chosen from Port Moresby and Lae whichare the two most commercialised cities in PNG and most accountantswork in these two cities. The accounting academics and students werethe total population from the two universities in PNG.
Two approaches were applied to measure the perceptions of thethree parties. The groups were divided to test for
(1) Between Group Differences; and
(2) Between Subgroup Differences.
To analyse between group differences in perceptions, the respondentswere grouped into:
(a) accountants in practice;
(b) accounting academics; and
(c) accounting students.
Between subgroup differences tested which cultural issues affect theperceptions of the three parties. The accountants in practice andaccounting academics were tested for
(i) nationality
(ii) place where latest accounting educational qualification was obtained:
(iii) industry subgroups (i.e. academia, industry/commerce, government/statutory bodies and pUblic practices): and
(iv) institutions (the two universities in PNG (UPNG and UNITECH).
For accounting students, their perceptions were analysed regarding:
(i) as to which of the two universities they attended. and
(ii) sponsorship by the different industry subgroups indicated above.

ACCOUNTING EDUCATION IN DEVELOPING COUNTRIES 41
Since 99 per cent of the students were from PNG, this group wasnot taken into consideration in analysing the nationality or educationaleffects as this could bias the results.
Table I : ~actors Obtained by Applying Factor Analysis
Factors Questions % Var AlphaCoef
1. AIMS
F1 National Aims 7, 13 66.9 0.49F2 Personal AirT'C' 1,25 66.8 0.58
2. INPUTS
2a Student Development and Teaching Methods
F3 Student entry and Development 33, 38 65.6 0.47F4 Mature Student Entry 15,21 59.2 0.31F5 Teaching Methods 6,9,27 42.5 0.32
2b Accounting Academics
F6 Recruitment 4, 10, 34 52.8 0.55F7 Promotion 16,22.35 46.3 0.42F8 Tenure 38
2c Course program Development
F9 Course Program/Content 18,20,24,32,37 37.7 0.58F10 Course Emphasis 2,8 65.7 0.48
2d Teaching and Research Facilities
F11 Teaching and Research Resources 5, 11 53.0 0.55
2e Administration
F12 Program Management and Control 12, 14, 26, 28, 37.8 0.6730,36
Total Questions 33/39
Notes:
(1) % of Variance = Percentage of Variance explained
(2) Alpha Coet. =Cronbach's Alpha
Three statistical approaches were used to examine the perceptionsof the three key parties. First, descriptive statistics were applied tosummarise the data and examine broadly how these three key parties

42 INDIAN JOURNAL OF ACCOUNTING
Table II : Mean, Standard Deviation, 95% Confidence Interval andRanking of the Factors
Factors Mean Dif. Std Conf Rankingfrom 3 Dev. Interval
High Low 1 2
1. AIMS
F1 National Aims 1.76 1.24 0.62 2.38 1.13 2 2
F2 Personal Aims 3.87 0.87 0.83 4.07 3.04 12 8
2. INPUTS
2a Student Development and Teaching Methods
F3 Student Entry and 1.88 1.12 0.73 2.61 1.15 5 5Development
F4 Mature Student Entry 2.37 0.63 0.82 3.19 1.55 9 10
F5 Teaching Methods 1.77 1.23 0.67 2.44 1.10 3 3
2b Accounting Academics
F6 Recruitment 2.00 1.00 0.67 2.67 1.33 7 7
F7 Promotion 2.23 0.77 0.66 2.89 1.57 8 9
F8 Tenure 2.75 0.25 1.12 3.87 1.63 11 12
2c Course Program Development
F9 Course program/Content 1.91 1.09 0.50 2.41 1.41 6 6
F10 Course Emphasis 2.57 0.43 0.82 3.39 1.76 10 11
2d Teaching and Research Facilities
F11 Teaching andResearch Resources· 1.43 1.57 0.54 1.97 0.89 1 1
2e Administration
F12 Program Managementand Control 1.85 1.15 0.49 2.34 1.35 4 4
Note:
(a) STD = Standard Deviations; CONF Interval = 95% ConfidenceInterval
(b) Diff from 3 = Absolute differences between the means and 3. 3denotes neutral responses.
(c) Ranking 1 = Ranking of the factors according to the means
(d) Ranking 2 = Ranking of the factors according to the absolutedifferences between the means and 3.

ACCOUNTING EDUCATION IN DEVELOPING COUNTRIES 43
answered the 39 survey questions. Second, factor analysis/principalcomponent analysis was applied to see if the technique confirmed theaims and objectives and input issues identified by the researchers. Thereliability of the questions in measuring the same factor was also analysed.In the process a total of six questions which could not be related to anyfactor or which reduced the reliability of the factors were removed. Thefactor analysis technique was not applied to the 39 questions at oncebut to each subset of questions regarding aims and objectives and inputissues identified by the researchers.
Table I shows the 12 factors obtained by applying FA/PCA technique,the questions included in each factor and the corresponding percentagesof variance explained and Cronbach's alpha coefficients indicating thereliability of the factors.
Finally, analysis of variance (ANOVA) was applied to test thehypotheses relating to between group differences and between sUbgroupdifferences. The results of this analysis are reported in the next section.
Table II shows the means, standard deviations, and confidence intervalof the 12 factors and the ranking of the factors according to the meansand absolute mean difference from the middle score (3). The two methodsof ranking of the factors give similar results except for F2-Personal aims.
The ranking of the factors indicates a situation typical in developingcountries. Relating to aims of accounting education, the three groupsnote that accountants should be produced for national aims (ranked 2)such as to fulfil the staffing needs more than producing elites for thesociety (personal aims-ranked 12/8). In developing countries like PNG,where qualified personnel is scarce, they rely on foreign accountants.The results show that more accountants must be produced within PNGto fulfil the accounting manpower needs. For example, to fill the manpowerneeds and be part of the development process indicates there is a needto produce more local accountants.
Relating to input factors. the results reflect the fact that resourcesare scarce in developing countries. Consequently, the adequacy ofresources is ranked 1 according to the mean. Once the resources areimproved, then teaching medhods (ranked 3) may improve because ofthe availability of computers, classroom space and library holdings ofaccounting textbooks and materials. This will allow for innovative teachingmethods using computers and other facilities. The administration (programmanagement-ranked 4) will be able to implement policies to enablemore student entry into the program and development from entry tograduation and the recruitment and retention of qualified accountingacademics. This will enable course development and implementation to

44 INDIAN JOURNAL OF ACCOUNTING
Table III: Perceptions of Accounting Academics, Accountants InPractice and Accounting Students
Factors Mean of Reponses Test of Significance F Ratio F Prob
(1) (2) (3) (1.2) (1.3) (2.3)
1. AIMS
Fl National Aims 1.47 1.90 1.64 0.43 0.17 0.26 13.748 0.000·(0.38) (0.38) (0.13)·
F2 Personal Aims 4.063 4.13 3.64 0.064 0.43 0.49 25.021 0.000·(0.504) (0.50) (0.17)·
2. INPUTS
2a Student Development and Teaching Methods
F3 Student Entry and Development 2.13 2.081 1.68 0.044 0.441 0.40 21.864 0.000·(0.445) (0.443) (0.15)·
F4 Mature Student Entry 2.063 2.26 2.49 0.20 0.43 0.23 6.589 0.002·(0.51) (0.51) (0.17)·
F5 Teaching Methods 1.72 1.90 1.66 0.18 0.064 0.24 8.703 0.002·(0.42) (0.42) (0.14)·
2b Accounting Academics
F6 Recruitment 2.083 2.058 1.95 0.025 0.14 0.11 1.996 0.137(0.425) (0.42) (0.14)
F7 Promotion 2.104 2.34 2.14 0.25 0.037 0.24 6.413 0.002·(0.41) (0.411) (0.14)·
F8 Tenure 2.56 2.48 3.00 0.083 0.44 0.52 15.028 0.000·(0.691) (0.69) (0.23)·
2c Course Program Development
F9 Course ContentlProgram 1.98 1.95 1.88 0.027 0.096 0.069 1.37 0.26(0.317) (0.316) (0.108)
FlO Course Emphasis 2.81 2.75 2.41 0.067 0.41 0.34 12.442 0.000·(0.507) (0.51) (0.17)·
2d Teaching and Research Facilities
Fll Teaching and Research 1.53 1.58 1.30 0.046 0.24 0.28 19.020 0.000·Resources (0.332) (0.33) (0.11)·
28 Administration
F12 Program Management & 2.072 1.85 1.83 0.23 0.24 0.011 1.78 0.17Control (0.31) (0.31) (0.106)
Note
(a) * significant at 0.05 level
(b) The numbers under 'mean of responses' are the means of thethree groups.
(c) The numbers under 'test of significance' without parentheses aredifferences between the means and the numbers in parenthesesare critical values.
(d) (1) = Accounting Academics, (2) = Accountants in Practice,(3) = Accounting students.
(e) nof(1)=16; n of (2) = 246; n of (3) = 277; sample size = 539.

ACCOUNTING EDUCATlON IN DEVELOPING COUNTRIES 45
meet the needs of the society. However, in relation to tenure for expatriateaccounting academics (ranked 11/12), perceptions indicate nationalisticfeeling for training more indigenous accounting academics. Perhapsexpatriate academics should be put on short-term contracts and moreindigenous accounting academics produced. This is also in line with theviews relating to national aims of accounting education to produce moreindigenous accountants to meet the staffing needs.
From Table III it can be concluded that there are differences in aimsand input issues into university level accounting education betweenaccountants inn practice and accounting students but the accountingacademics do not differ from either groups. The latter could result fromthe fact that the sample of accounting acaQemics is small, 16 out of atotal of 539 usable responses.
The accountants in practice and accounting students (groups 2 and3) differ in most aspects regarding aims and inputs into accountingeducation in PNG, except for F6-recruitment, F9-course content/program,and F12-program management and control where they do not differ.
The agreement between the three groups on Factors 6, 9 and 12suggest that they agree with the methods outlined in the surveyquestionnaire to enable recruitment of ~cademics. The methods, ifimplemented, may enable recruitment of qualified accounting academicsfor the two universities in PNG. The agreement with the coursecontent/program suggests the courses designed for PNG universitiesshould meet the needs of both international and local needs and havecomponents of both private and public sector accounting. The agreementrelating to prograltl management and control indicates that the threeparties believe all sectors of the economy must be involved to improveaccounting education and accounting manpower needs in PNG which islacking at present. This has resulted in criticisms regarding courseprograms and quality of graduates from both the government and privatesectors.
As far as the other factors are concerned, disagreements betweenaccounting students and accountants in practice may suggest differencesin developing and developed country perceptions because 99 per centof the students are from PNG while most accountants in practice arefrom developed countries. The cultural effect of country of origin isconsidered next.

46 INDIAN JOURNAL OF ACCOUNTING
Table IVPerceptions of Accountants from PNG, Other Developing and
Developed CountriesFactors Mean of Reponses Test of Significance F Ratio F Prob
(1) (2) (3) (1.2) (1.3) (2.3)
1. AIMS
Fl National Aims 1.69 1.79 2.26 0.11 0.58 0.47 21.063 0.000*(0.30) (0.22)* (0.37)*
F2 Personal Aims 3.96 4.27 4.36 0.30 0.39 0.091 8.272 0.000*(0.34) (0.25)* (0.368)
2. INPUTS
2a Student Development and Teaching Methods
F3 Student Entry and 1.97 2.37 2.t8 0.39 0.21 0.19 4.941 0.008*Development (0.34)* (0.25) (0.37)
F4 Mature Students Entry 2.27 2.15 2.25 0.12 0.020 0.103 0.352 0.703(0.40) (0.264) (0.389)
F5 Teaching Methods 1.76 1.93 2.09 0.16 0.33 0.17 7.506 0.001*(0.29) (0.21)* (0.13)*
2b Accounting Academics
F6 Recruitment 1.99 1.89 2.28 0.11 0.289 0.40 7.394 0.001*(0.29) (0.2t2)* (0.31)*
F7 Promotion 2.12 2.31 2.71 0.19 0.59 0.39 25.325 0.000*(0.28) (0.20)* (0.30)*
F8 Tenure 2.67 2.35 2.20 0.32 0.47 0.15 7.078 0.000*(0.43) (0.32)* (0.47)
2c Course Program Development
F9 Course ContentlProgram 1.89 1.94 2.060 0.042 0.17 0.12 3.516 0.031*(0.213) (0.16)* (0.23)
FlO Course Emphasis 2.64 2.79 2.93 0.15 0.289 0.14 3.157 0.044*(0.39) (0.286)* (0.39)*
2d Teaching and Research Facilities
Fll Teaching and Research 1.45 1.46 1.85 0.003 0.39 0.39 15.504 0.000*Resources (0.285) (0.18)* (0.27)*
2e Administration
F12 Program Management & 1.77 1.94 1.99 0.17 0.23 0.053 7.525 0.001*Control (0.21) (0.15)* (0.223)
Note:
(a) *significant of 0.05 level
(b) The numbers under 'mean of responses' are the means of thethree groups
(c) The numbers under 'test of significance' without parentheses aredifferences between means and the members in parentheses arecritical values.
(d) (1) = PNG; (2) = Other Developing Countries, (3) = DevelopedCountries
(e) nof(1) =148; n of (2) = 34; n of (3) = 80; Samplesize = 262
(1) The sample size includes 246 accountants in practice and 16accounting academics.

ACCOUNTING EDUCATION IN DEVELOPING COUNTRIES 47
Table V : Perceptions of Accountant who Received LatestAccounting Education Qualifications In PNG,
Other Developing or Developed CountriesFaclors Mean of Reponses Test of Significance FRatio FProb
(1) (2) (3) (1.2) (1.3) (2.3)
1. AIMS
Fl National Aims 1.66 1.82 2.19 0.16 0.53 0.37 17.932 0.000*(0.38) (0.22)' (0.40)
F2 Personal Aims 3.97 4.13 4.39 0.17 0.42 0.26 8.8331 0.0002*(0.44) (0.25)' (0.45)
2. INPUTS
2a Student Development and Teaching Methods
F3 Student Entry and 1.97 2.39 2.24 0.27 0.43 0.15 5.137 0.007'Development (0.45) (0.26)' (0.53)
F4 Mature Student Entry 2.26 2.18 2.24 0.78 0.022 0.057 0.089 0.915(0.532) (0.269) (0.493)
F5 Teaching Methods 1.76 2.026 2.049 0.27 0.029 0.023 6.202 0.002'(0.38) (0.21)' (0.392)
2b Accounting Academics
F6 Recruitment 1.97 2.00 2.24 0.03 0.27 0.24 4.891 0.008*(0.38) (0.22)· (0.40)
F7 Promotion 2.14 2.33 2.63 0.198 0.50 0.30 17.193 0.000·(0.229) (0.21)' (0.38)
F8Tenure 2.68 2.37 2.27 0.31 0.41 0.097 5.113 0.007*(0.56) (0.32)' (0.589)
2c Course Program Development
F9 Course Program/Content 1.88 2.01 2.02 0.13 0.14 0.Q1 2.679 0.071(0.27) (0.16) (0.29)
FlO Course Emphasis 2.62 2.87 2.96 0.25 0.33 0.088 4.310 0.015'(0.50) (0.29)· (0.526)
2d Teaching and Research Facilities
Fll Teaching and Research 1.44 1.58 1.81 0.14 0.37 0.24.
12.763 0.000·Resources (0.32) (0.18)* (0.33)
2e Administration
F12 Program Management & 1.76 1.96 1.99 0.19 0.22 0.036 6.912 0.001·Control (0.27) (0.15)· (0.028)
Note(a) *significant at 0.05 level
(b) The numbers under 'mean of responses' are the means of thethree groups.
(c) The numbers under 'test of significance' without parentheses aredifferences between means and the numbers in purchases arecritical values.
(d) (1) = Accountant with PNG Qualifications; (2) = Other DevelopingCountries; (3) =Developed Countries.
(e) n of (1) =143; n of (2) =19; n of (3) =81; Sample Size =243
(f) Those accountants with no accounting education qualificationsbut only professional qualifications were excluded from thisanalysis; 16 accountants were excluded.

48 INDIAN JOURNAL OF ACCOUNTING
From Table IV it can be concluded that there are differences betweenthe three subgroups for country of origin. However, there are.no statisticallysignificant differences between PNG and 0ther developing countries(sub-groups 1 and 2) except for F3 - stud 'nt entry and development.This may result from different admission cri :eria in different developingcountries and different methods of dealing with students from entry tograduation because of different colonial influences and admission criteriaput in place and some may have changed after independence.
There are, however, many statistically significant differences betweenaccountants from PNG and developed countries (sub-groups 1 and 3).They differ in most factors except for F3-student entry and developmentand F4-mature student entry.
There are statistically significant differences between other developingand developed countries (sub-groups 2 and 3) relating to certain factorsbut not others. They differ with regard to F1-national aims, F5-teachingmethods, F6-recruitment, F7-promotion and F11-resources.
The results do indicate significant differences in perceptions betweenthose people from developing and developed countries. Accountants fromPNG and Qther developing countries do not differ in their perceptionswhilst they do differ from accountants from developed countries.
From the analysis presented in Table V it can be seen that there isa difference in the perceptions of accountants who received their latestaccounting education qualification in PNG and those who did so indeveloped countries (sub-groups 1 and 3). They differ with respect tomost factors except for input F4 - mature student entry and F9 - courseprogram/content.
The accountants from other developing countries do not differ fromaccountants educated in either PNG or developed countries. Again, thiscould be a function of the small sample size.
Similar analyses to those presented in Tables IV and V were donefor the other selected sub-groups representing the remaining culturalvariables namely industry, institution, and sponsorship but no significantdifferences were found between these groups indicating that thesevariables do not affect perceptions of accounting education.
Conclusions
Ranking of Factors
The national aim of accounting education (F1) is clearly the mostimportant factor to be considered when planning output of accountinggraduates. There is also general agreement relating to input factors which

ACCOUNTING EDUCATION IN DEVELOPING COUNTRIES 49
needs modification to upgrade both the quantity and quality of PNGaccounting graduates.
The results indicate that priority must be given to improving resources(teaching and research facilities) including library holdings of accountingjournals and books and computer facilities. Then there is a need to recruitcompetent academics. This will in turn enhance student development,teaching methods and course development. The courses must meet localrequirements as well as those of international business to enable themto produce qualified graduates. This also means that for programmanagement, there is a need for cooperation from private and governmentsectors, accounting professional bodies and the universities to review thecurrent programs to give them both local and international contents tosatisfy all sectors of the profession. The exchange of staff between theuniversity and the private and government sectors may enable the coursesto be better oriented towards both the international and PNG environments.
Perceptions of interested parties and cultural influences
The analysis of the perceptions of the three interested parties,accounting academics, accountants in practice and accounting studentsrevealed major differences between practitioners and students. Sincevirtually all of the students were from PNG whereas many practitionerswere from other countries, this suggested cultural influences were atwork. The results of the perceptions relating to selected cultural issuesindicate that nationality and where the accountants were educated havegreat effects on the perceptions of accountants regarding aims andobjectives ·and input issues of accounting education in PNG.
This has implications for recruitment of accounting academics whichwill in turn affect student development, teaching methods used andteaching and research facilities including textbooks used. So, based onthe findings of this study. it is suggested that the following are policyoptions for the developing countries in general and PNG in particular.
Policy Options
Depending on what type of accounting education model a developingcountry wants to adopt, there are three options;
(1) adopt a model from a developed country;
(2) adopt a model from a developing country with similarenvironment;or
(3) develop a model more related to its unique environment.
For Option 1-, the accounting academics. in the first instance, mustcome from the developed country concerned or have been educated in

50 INDIAN JOURNAL OFACCOUNTING
that country. The first group of indigenous accounting academics shouldbe educated in that country. For example, if PNG wants to adopt theAustralian accounting education model then it should, in the first instance,recruit Australian accounting academics and send the first group of PNGaccounting academics to be trained in Australia.
For Option 2, the developing country concerned will, in the firstinstance, have to recruit accounting academics fr~m another developingcountry with a similar environment or who have been educated in thatcountry.
For Option 3, to develop accounting education programs applicableto the developing country's unique environment, there may be a need todevelop an accounting research centre. The research centre should enableresearch to be conducted and develop teaching materials and textbooksand design course programs appropriate for its own environment. Thecentre should be allowed to conduct postgraduate studies by researchto produce local accounting academics. The locally produced accountingacademics may be in a better position to dispense accounting knowledgeand produce accounting graduates required by the different sectorsoperating within the unique PNG environment.
References
Abdeen, A. and Yavas, U (1987), Current Status of Accounting Education in. Saudi Arabia, The International Journal of Accounting, Spring, pp.
155-173.
Abdoelkadir, K. K. (1982), The Perception ofAccountants andAccounting Studentson the Accounting Profession in Indonesia, Unpublished Ph.D.Dissertation, Texas A & M University.
Bane~ee, B. (1992a), Accounting Education in the Perspective of EconomicDevelopment in India : In Retrospect and Prospect, Paper presenSed atthe 7th Intemational Conference on Accounting Education, WashingtonDC, October.
Banerjee, B. (1992b), The Current Status of Accounting Education and Researchin India, Paper presented at the Department of Accounting and FinancialManagement, University of New England, November.
Bamir, R. and Elitzur, R. (1987), Attitudes of CPA's in Israel Towards GAAP for, Closely Held Corporations and Small Business, The International Journal
of Accounting, pp. 343-364.
Belkaoui, R. A. and Picur, D. R. (1991), Cultural Determinism and the Perceptionof Accounting Concepts, The International Journal of Accounting, pp.118-130.
Birkett, P. W. (1989), The Demand for and Supply of Education for ProfessionalAccountants, University of New South Wales Printing Unit.

ACCOUNTING EDUCATION IN DEVELOPING COUNTRIES 51
Careello, V. J. et at (1991), A Public Accounting Career: The Gap betweenStudents' Expectations and Accounting Staff Experiences, AccountingHorizons, September, pp. 1-11.
Cohen, J. R. et al (1991), An Empirical Investigation of Attitudinal Factors AffectingEducational Course Coverage of International Topics, The International
. Journal of Accounting, pp. 286-301.
Ferguson, C. and Orpen, C. (1991), The Attitude of Accounting Students toWorking with Computers: A Preliminary Study; Accounting and Finance,November, pp. 113-119.
Harrison, G. (1992), The Cross-Cultural Generalisability of the RelationshipBetween BUdget Participation and Job Related Value, Accounting,Organisation and Society, pp. 1·15.
Harrison, G. and McKinnon, J. (1986), Culture and Accounting Change, a NewPerspective on Corporate Reporting Regulations and Accounting PolicyFormulation, Accounting, Organisation and Society, pp. 232-252.
Hofstede, G (1980), Cultural Consequences : International Differences inWork-Related Values, Saga Publications, California.
Hofstede, G. (1983), Dimensions of National Culture in Fifty Countries and ThreeRegions, in Deregowski, J. B. et al (ed), Expectations in Cross-CulturalPsychology, Swets and Zietlinger PUblications, Netherlands, pp. 335-355.
Hofstede, G. (1987), The Cultural Context of Accounting, in Cushing, B.E. (ed).Accounting and CUlture, American Accounting Association, pp. 1·11.
Holland, G. R. and Arrington C. E. (1987). Issues Influencing the Decision ofAccounting Faculty to Relocate, Issues in Accounting Education, Spring,pp. 57-71.
Hove, M. R. (1986), Accounting Practices in Developing Countries: Colonialism'sLegacy of Inappropriate Technologies, The International Journal ofAccounting, Fall, pp. 88-100.
Karnes, A. et al (1990), A Bi-Cultural Comparison of Accountant's Perceptionsof Unethical Business Practices, Accounting, Auditing and AccountabilityJournal, pp. 45-64.
McKinnon, J. (1986), The Historical Development and Operational Form ofCorporate Reporting in Japan, Garland, New York.
McLanen, C. M. (1990), The Place of Communication Skills in the Training ofAccountants in New Zealand, Accounting and Finance, May, pp. 82-94.
Pabst, F. D. and Talbott C. J. (1991), The CMA : Past, Present and Future,Accounting Horisons, September, pp. 31-37.
Peel, J. M. et al (1991), The Determinant of Students Financial Awareness·Some British Evidence, British Accounting Review, March, pp. 23-48.
Poe, C. D. and Viator, E. R. (1990), MCSB Accounting Accreditation andAdministrators' Attitudes Towards Criteria for the Evaluation of Faculty,Issues in Accountfng Education, Spring, pp, 59-77.

52 INDIAN JOURNAL OF ACCOUNTING
Reed, A. S. and Kratchman, H. S. (1989), A Longitudinal and Cross-SectionalStudy ofStudents Perceptions of the Importance of Job Attributes, Journalof Accounting Education, pp. 171-193.
Sishta, S. V. (1989), Economic Planning and Accounting Education in theUniversities, Indian Journal of Accounting, June, pp. 1-12.
Tan, K. and Choo, F. (1990), A note on the Academic Performance ofDeep-Elaborative Versus Shallow-Reiterative Information ProcessingStudents, Accounting and Finance, May, pp. 67-81.
Tipgos, M. A. (1987), A Comprehensive Model for Improving Accounting Educationin Developing Countries, Advances in International Accounting, pp.383-404.
Welton, E. R. and Davis, R. J. (1990), Accounting Implications of the Perceptionof Professional Ethics : A Comparative Analysis of American and NewZealand Students, The International Journal of Accounting, pp. 268-283.
Yunus, H. (1990a), History of Accounting in Developing Nations: The Case ofIndonesia, Indonesian Institute of Accountants.
Yunus, H. (1990b), Provision of Continuing Professional Education in Accountingwith the Case in Indonesia, Indonesian Institute of Accountants.

53
INDIAN JOURNAL OF ACCOUNTINGVOL. XXVI, DECEMBER 1995
GRAPHIC TECHNIQUES FOR PRESENTATION OFFINANCIAL RESULTS
'1Jr. M. !R.flnganatliam*'1Jr. ~ Matfliumatlii*
Graphical presentation of financial results can help in highlighting certainessential features and make communication smoother. It is also likely"to catch the attention of the pUblic and increase the company imageconsiderably. In this article, the authors explain application of a fewgraphic techniques for presenting financial performance of companies.
For many investors, financial results of companies are the basis onwhich investment decisions are made. Besides, it is also mandatory onthe part of public companies to disclose the financial results to theshareholders. These financial results are in an accounting format. Thefinancial performance of companies can also be expressed through graphictechniques and already many companies use bar diagrams or pie chartsto highlight their performance.
Graphical presentation of financial results can help in highlightingessential facts, can be attractive and make communication easier.Graphical presentation is not just drawing a line, a bar or pictorial graphof net profits, production to EPS. It can also be the translation of profitand loss account and other financial statements from accountingperspective to pictorial status. Graphics can also present many facets offinancial performance just as accounting statements. In this article, theapplication of a few graphic techniques for presenting the financial resultsof companies are explained.
Components of Financial Results
Items such as Net sales (export turnover, if any), Other income, Totalexpenditure, Interest paid, Gross profit. Depreciation, Provision for taxationand Net profit are the main components of the financial results. Besides,the balance sheet items such as the paid up equity capital and thereserves excluding the revaluation reserves are also disclosed. Theseare available in the accounting format and the investor, if desired, can
* The authors are Reader and Research Associate respectively in the Department ofCommerce, University of Madras, Madras 600 005. The authors thank Dr. D. Amarchand,Professor & Head, Department of Commerce, for his comments and suggestions toimprove the article.

54 mD~NJOURNALOFACCOUNnNG
analyse the financial performance through the techniques known to him(mostly by using simple percentages or ratio analysis).
Investors also perform internal comparison of financial results over atwo year period since the companies usually provide the results for (a)current accounting year, and (b) corresponding previous year. Similarly,when companies report their half-yearly results they also discloseperformance for (a) the current six months, and (b) immediately precedingsix months. From these statements, comparative increase or decreaseover the previous period are to be worked out by the investors. Suchdata by themselves are inadequate to assess the performance at a glance.Again, inter-company comparisons are possible only when the investormaintains his own analysed version of the financial results. When thecompanies take so much effort to project their financial results, care canalso be taken to make it easier for the investor to interpret the results.
Network Between The Components of Financial Results
The components of the financial results are not separate entities. Theprofit and loss account items are all linked to the sales income. Amongthe expenditure items, apart from depreciation all other componentsinvolve cash flows. The network diagram indicating the interlinks betweenthe components can be illustrated as under :
Expenditure Interest Tax Depreciation
.- - -- - -R- -- - ---R- - - - - -R - - --- -0
To..II=me :""Pro" • PBDT Cash:~gNet"O"'Other income
Equity Capital
For comparative purposes, rather than stating the components offinancial performance, the resulting events such as gross profit, profitbefore depreciation and tax (PBD1) , cash flow and net profit can bestated as a ratio to total income. Besides, cash flow and net profit canbe stated as a ratio to equity capital also. This relative form can be:"interpreted more easily than the absolute amounts.

PRESENTATION OF FINANCIAL RESULTS 55
Graphical presentation of all these information in a combined way ispossible either through a star symbol plot, sun ray plot, casement plotor chernoff faces and along with a legend, these graphs can be easilyinterpreted by an investor.
Application
Ten companies whose financial results (1993-94) appeared in thenewspapers have been taken for illustration. The companies that wereselected are Gupta Carpets Udyog Ltd (Gupta), Vijay Shanthi BuildersLtd (Vijay), Carrier Aircon Ltd (Carrier), Hotline Teletube & ComponentsLtd (HTC), Anjani Fabrics Ltd (Anjani), SKS Ltd (SKS), Onida Savak Ltd(Onida), Vardhman Spinning & General Mills Ltd (Varspin), MahavirSpinning Mills Ltd (Mahavir) and Vardhman Polytex Ltd (Varpol). The lastthree companies belong to the Vardhman Group. The financial resultsdeclared in the accounting format were converted into ratios such asGross profit to sales (GP), Profit before depreciation and tax to sales(PBDT) , Net profit to sales (NP), Sales turnover (ST), Cash flow pershare (CPS), and Earnings per share (EPS).
The performance details of the selected companies for the year1993-94 are provided in Table 1. Table 2 provides performance detailsfor 1992-93.
Table 1Performance Details for 1993-94
Company Gross Profit Cash Net Profit Earnings SalesProfit to before Earnings to sales per Share Turnoversales dep. & tax per Share
'.
(%) (%) (Rs.) (%) (Rs.) (times),
Vijay 23.61069 22.15346 3.235673 20.01934 3.029766 1.479878
Gupta 22.39513 16.58906 6.208726 16.40444 6.139629 3.593066
Carrier Sl.5282 5.606039 1.876569 4014752 1.388343 3.105663
HTC 18.66179 11.23064 7.414441 7.934558 5.238378 6.428981
Onida 13.5581 10.27348 4.818617 8.927796 4.223135 4.652977
SKS 16.81055 8.332978 7.063038 4.728928 4.008106 8.092881
Anjani 9.433117 5.583819 3.443398 3.895371 2.628859 6.708956
Varspin 19.10422 13.61535 60.0432 6.436701 35.78834 54.2635
Mahavir 24.28571 19.7028 34.44258 10.07768 25.01257 24.58424
Varpol 23.06506 17.22171 12.80899 9.682393 8.820225 8.79073
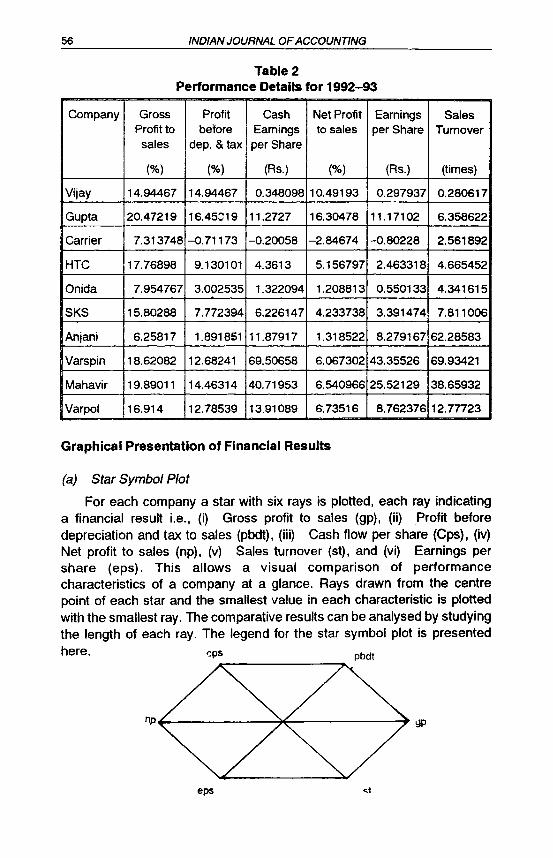
56 fND~NJOURNALOFACCOUNnNG
Table 2Performance Details for 1992-93
t;pS
Company Gross Profit Cash Net Profit Earnings SalesProfit to betore Earnings to sales per Share Turnover
sales dep. & tax per Share
(%) (%) (Rs.) (%) (Rs.) (times)
Vijay 14.94467 14.94467 0.348098 10.49193 0.297937 0.280617
Gupta 20.47219 16.45~19 11.2727 16.30478 11.17102 6.358622
Carrier 7.313748 -0.71173 -0.20058 -2.84674 -0.80228 2.561892
HTC 17.76898 9.130101 4.3613 5.156797 2.463318 4.665452
Onida 7.954767 3.002535 1.322094 1.208813 0.550133 4.341615
SKS 15.80288 7.772394 6.226147 4.233738 3.391474 7.811006
Anjani 6.25817 1.891851 11.87917 1.318522 8.279167 62.28583
Varspin 18.62082 12.68241 69.50658 6.067302 43.35526 69.93421
Mahavir 19.89011 14.46314 40.71953 6.540966 25.52129 38.65932
Varpol 16.914 12.78539 13.91089 S.73516 8.762376 12.77723
Graphical Presentation of Financial Results
(a) Star Symbol Plot
For each company a star with six rays is plotted, each ray indicatinga financial result i.e., (i) Gross profit to sales (gp), (ii) Profit beforedepreciation and tax to sales (pbdt), (iii) Cash flow per share (Cps), (iv)Net profit to sales (np), (v) Sales turnover (st) , and (vi) Earnings pershare (eps). This allows a visual comparison of performancecharacteristics of a compa.ny at a glance. Rays drawn from the centrepoint of each star and the smallest value in each characteristic is plottedwith the smallest ray. The comparative results can be analysed by studyingthe length of each ray. The legend for the star symbol plot is presentedhere.
np~- 4~ ~ IJP
eps

PRESENTATION OFFINANCIAL RESULTS 57
Star plot has been used to present the results of all the companiesin 1993-94. The relative profitability performance of the companies canbe analysed through this graph (Figure 1). "Mahavir" has a better profitposition than other companies since the star is bigger and all the raysof the star are stretched out. Take the case of Varspin, though big, oneof the rays is too short indicating the low net profit margin. Carrier andAnjani have the lowest performance..The shape of the star also identifiesthe overall performance of the companies. Take the case of vijay. Thenet profit and gross profit figures are high while the earnings per shareand cash flow per share are less leading to a rugged star.
Figure 1Star Plot of Selected Companies (1993-94)
Mahavir Varpol
<2f> E> ® ®Onida SKS AnianiVarspin
~ <Z> <Z> <K>Vijay Gupta Carrier HTC
This star plot can also be used by individual companies to comparetheir performances ever a time period. While presenting their half-yearlyor year-end results apart from giving the accounting statements, thecompanies can present their results through these stars. Two examplesmay be given here (Figure 2). Onida has good overall performance andits profit improvement can be seen from the size of the stars. Take thecase of Gupta. In the year 1992- 93, EPS, cash flow and sales turnoverare higher. In the year 1993-94 the opposite is the case; the net profit,

58 mD~NJOURNALOFACCOUNnNG
gross profit and profit before depreciation and tax are higher. This showsthat though profitability as revealed by profit and loss account is good,the return on assets employed has actually fallen. Thus, the shape ofthe star identifies the performance of the company to a large extent.
Figure 2Star Plot for Comparison over Two Year Time Period
(1993-94) (1992-93)
Onida Onid..
Gupta
steps
np ------E~--~~--~----gp
(b) Sun Ray Plot
The sun ray plot is a polygon wherein, each side of the plot representsthe value of one financial characteristic. Each ray is scaled so that a sidewill intersect it in the middle if a variable is equal to the sample mean.The extreme points in each ray represent the standard deviations. Sunray plots can be used by companies with many subsidiaries. Here, theplots are easily comparable among the subsidiaries. Further, the relativeprofitability of each company compared to the overall group's profits canbe visualised. The legend for the sun ray plot is presented here.
• ,s pbdt

PRESENTA TlON OF FINANGJAL RESULTS 59
The sun ray plot is drawn for the Vardhman group companies.Vardhman spinning, Mahavir and Vardhman polytex (Figure 3). Theshapes of the figures are not. entirely different from that of the star plots.The net profit ratios for the two companies, Mahavir and Vardhmanpolytex, are greater than the group mean while for the Vardhman spinningit is lesser. This can be identified by locating the point at which each rayis intersected by the sides. Varspin and Mahavir have better EPS andcash flow than the Varpol company. Of the three companies, Mahavir isthe best performer.
Figure 3Sun Ray Plot for Vardhman Group Companies (1993-94)
Varpol
MahavirVarspin
(c) Casement Plot
Casement plot produces a two-characteristic scatter plot forcompanies. The current year and previous year results of a ratio can becompared through this plot. Additionally, the plot can subdivide the graphbased on a separate characteristic such as earnings per share. Thisadditional sub-classification will group the companies based on a threedimensional performance.

60 IND~NJOURNALOFACCOUNnNG
Casement plot was used to group the companies on the basis oftheir net profits (1993-94 & 1992-93) and earnings per share (1993-94).Three groups have been formed based on earnings per share (Figure4). Group I has EPS of less than 5. The second group has EPS between5 and 20 and the last group has EPS between 25 and 40. Within eachgroup the performance in terms of net profits is plotted. The highestperformers are Vardhman and Mahavir. The lowest performers are Carrier,Anjani, SKS, Onida and Vijay. The moderate performers are Gupta, HTCand Vandhman Polytex.
Figure 4Casement Plot of Selected Companies (1992-94)
EPS (93-94)(25,40)
EPS (93-94)(520)
EPS (93-94)(0 5), ,
•GUPTA
•VIJAY.VARPOL VANSPIN
SKS • •• • MAHAVIRHTCANJANI
• • ONIDA
CARRIER
•
9
13
17
n
P
(92-93) 5
-3o 4 8 12 16 20 24 0 4 8 12 16 20 24 0 4 8 12 16 20 24
np (93-94) np (93-94) np (93-94)
(d) Chernoff Faces
A technique for displaying data on a dimensional form is called asglyphs. Originally, this was intended as a concise way of displayingassociation between many variables. Since its introduction, manyvariations have been proposed and the Chernoff faces is a novel way topresent multiple variables. Eighteen facial features have been identifiedand each vaflable would be associated with one of the 18 facial features.The facial features considered for associating the financial variables are(1) head, (2) mouth, (3) nose, (4) eyes, (5) eyebrows, and (6) ears.

PRESENTATION OF FINANCIAL RESULTS 61
For illustrative purposes, the chernoff face drawn here has thefollowing legend.
Feature
Head size
Left Eye
Right Eye
Nose length
Left Ear
Right Ear
Financial Variable
Sales Turnover
Gross Profit
Net Profit
Profit before Depreciation & Tax
Earnings per share
Cash Flow per share
Figure 5Chernoff Faces of Selected Companies
Vijay
SKS
Gupta
Anjani
Carrier
Varspin
HTC Onida

62 mD~NJOURNALOFACCOUNnNG
Looking at the chernoff faces (figure 5) drawn for the year 1993-94,we can easily identify the superior performance of Vardhman group toother companies. Vardhman Spinning has the largest sales turnover andearnings and cash flow per share (face size and ears). But its profitperformance in terms of net profit, gross profit and PBDT are rather toosmall (eyes and nose). An overall good performance is reported byMahavir. Its growth in respect of sales as well as in terms of investmentsare good (none of the features are too small). Take the case of Carrier.The eyes, ears and nose are so small indicating a poor performance bythe company. A similar performance company is Anjani. SKS and Onida,Vijay, Gupta and HTC have bigger eye balls and moderate ears indicatinga comparatively better financial result.
This type of chernoff faces can also be drawn for comparing thepresent and past financial results of the companies. The legend for sucha chernoff face could be as follows :
Facial feature Financial Variable Previous Year Current year
Head Sales Turnover Inner circle Outer circle
Eyes Net profit Left Right
Eyebrows Gross profit Left Right
Nose PBDT Left hole Right hole
Mouth Cash flow/share Top lip Bottom lip
Ears Earnings/share Left Right
. This would provide in one. diagram, the comparison between theprevious and current year results as well as the overall financialperformance at a glance. Each company can design its own feature andhighlight its performance through these graphical techniques.
Conclusion
With the secondary and primary markets gaining popularity in India,the companies are obliged to educate and inform the general public oftheir performance. The financial data could be confusing to an ordinaryinvestor. A good performance record made impressive throughpictures/diagrams are likely to catch the attention of the public and increasethe Company image. Not only for individual companies, even to mediasuch as financial newspapers and financial journals, presentation ofcompany performance through such graphic techniques will get theapproval of the investors.

INDIAN JOURNAL OF ACCOUNTINGVOL. XXVI December 1995 .
ETHICS IN ACCOUNTING : A PLEA FOR A NEWCONCEPTUALIZATION
.f1l.rup cfioutffiuri *-
Highlighting different aspects of ethics in accounting the author in thisthoughtful article, opines that codes of ethics are violated to serveindividual familial and group interests. If ethics is redefined in a positiveway to favour the cause of the enlightened accountant instead ofthreatening to penalise him, the accounting profession and the domainof ethical conduct get united.
IEthics, rationality, morality and such other concepts remain even
today problematics in the domain of philosophy. There are as manyschools of thought comprehending these concepts as there arephilosophers. These concepts convey different meanings to differentpersons, cutting across ideological lines. Kantians, Hegelians, Romantics,Socialists, non-Socialists, Existentialists. Realists, Surrealists, Hippies andmany other schools of thought beat the same donkey to move it todifferent directions. The conceptual donkey has been beaten severely; ithad moved much distance, this way and that way, and thereafter haslost a sense of direction. To move it to a particular direction one has tohave with him a compass.
The compass is not yet available. One has to undergo definitionalhazards in search olit. If one undertakes such a journey one would comeacross a multiplicity of definitions for such concepts as ethics, moralityor rationality. Even a Hegelian dialectician cannot but be dumbfoundedby the polar opposite actions defensible in the name of such concepts.
Is it rational to eat human flesh? When a cannibal was asked thisquestion by an American Sociologist he was reported to have shot backwith the proposition that it was at least more rational than killing thousandsof people with an atom bomb and not eating their flesh. 'When we arehungry we kill to eat, but you kill needlessly'. That seems to be the ideaconveyed by the cannibal.
* UGC Research Fellow, Department of Commerce, University of Calcutta.
63

64 INDIAN JOURNAL OF ACCOUNTING
Similar is the case with the concept of ethics. When one of my friendsfirst purchased one hundred equity shares of a renowned enterprise fromthe stock market he was rebuked by the Hindu Brahmin patriarch of hisfamily on the charge that it was unethical for him to indulge in activitiesthat come naturally to the Vaishyas. But it was not, however, unethicalfor him to accept dowry while he married.
The world of ethics, morality, rationality is indeed a queer world inwhich our dear,.innocent, professional accountant cannot but feel like anAlice in Wonderland. He may feel like the hero in one of Mollier's playswho was surprised to know from his fiancee that all throughout his lifehe had been talking French prose. Similarly our accountant may be takenaback to know that all throughout his life he has been following oneethical yardstick-his enlightened self-interest.
II
The stUdy of ethics, it is said, is the study of good and bad anddifference between them; of right and wrong (and also of what is merelyall right) and their differences; of duties and rights and their relationship;and the virtues and vices and related traits of character (Windt et ai,1989, p.9).
Kohler's Dictionary of Accounting describes 'ethics' as "a system ofmoral principles and their application to particular problems of conduct;specifically, the rules of conduct of a profession sometimes formallyexpressed and imposed by a profession or by a professional body,governing the behaviour of its members" (Cooper and Ijiri, 1983, p.199).
Oliviera. A. Johnson opines that "ethics is the theoretical examinationof morality and it is the science of conduct" (1978, p.3).
De Georage's definition also stresses the 'morality' point of view ashas been the case with the aforementioned one. According to him, ethicsis a "theory of morality which attempts to systematize moral judgementsand establish and defend basic moral principles" (1982, p.37).
W.T. Jones provides a very simple but suggestive definition: 'ethics'(or an 'ethic') is a pattern or norm or code of conduct actually adoptedby a group of people (although, of course, not necessarily obeyed) (1979,p.l).
Some aspects of ethics are universal in nature. But much of it canonly be described with reference to the values establ!shed by a particularsociety. Ethics also changes with the passage of time. In 1900s, it wasconsidered unethical for a person to purchase some merchandise oncredit, while now in the 1990s credit purchase is an integral part of living.

ETHICS IN ACCOUNTING 65
The definitions of ethics can be multiplied almost ad infinitum. Butone escape route to get out of this awesome definition jungle is to evolvea typology of the available definitions. Philosophers have classified suchdefinitions as belonging to three schools of thought :
1. The Consequentialist School,
2. The Dentological School, and
3. The School of Virtue Ethics (Donaldson and Werhane, 1989,p.528).
As its name implies, a consequentialist theory of ethical reasoningconcentrates on the consequences of human actions, and all actions areevaluated in terms of the extent to which they achieve desirable results.
A dentological theory stipulates that all complete justifications mustbe based on fundamental principles of right or wrong action, or on appealsto individual rights.
The proponents of the virtue ethics school believe that justificationsmust always end in appeals to virtue or vice.
Obviously, accounting ethics have their reference points to all theseschools of ethics. Professional ethics guiding the accountants is a lambthat has its grazing ground in the pastures of different schools.
IIIThe International Federation of Accountants, in its guidelines on
Professional Ethics for the Accountancy Profession, has stated :
"Persons who pursue a vocation in which they offer theirknowledge and the skills in the service of the affairs of others haveresponsibilities and obligations to those who rely on their work. Anessential prerequisite for any group of such persons is the acceptance and observance of professional ethical standards regUlatingtheir relationship with clients, employers, fellow members of thegroup and the public generally".
"The ethical requirements of any accountancy body should bebased upon the following fundamental principles by which anaccountant should be governed in the conduct of his professionalrelations with others:
(a) Integrity: An accountant should be straightforward, honest andsincere in his approach to his professional work.
(b) Objectivity : An accountant must be fair and must not allowprejudice or bias to override his objectivity; when reporting onfinancial statements which come under his review he shouldmaintain an impartial attitude.

66 INDIAN JOURNAL OF ACCOUNTING
(c) Independence: When in public practice, an accountant shouldboth be, and appear to be. free of any interest which might beregarded. whatever be its actual effect. as being incompatible withintegrity and objectivity.
(d) Confidentiality: An accountant should respect the confidenti~lity
of information acquired in the course of his work and should notdisclose any such information to a third party without specificauthority or unless there is a legal or professional duty to disclose.
(e) Technical Standards: An accountant should carry out his professional work in accordance with the technical and professionalstandards relevant to that work.
(1) Professional Competence: An accountant has a duty to maintain his level of competence throughout his professional career.He should only undertake work which he or his firm can expect tocomplete with professional competence.
(g) Ethical Behaviour: An accountant should conduct himself in amanner consistent with the good reputation of the profession andrefrain from any conduct which might bring discredit to the profession (ICAI. 1978. p.1).
The philosophical foundation upon which the rules of conduct adoptedby the American Institute of Certified Public Accountants are based isexpressed in the form of five ethical principles. Whereas the rules ofconduct set forth minimum levels of acceptable conduct and are mandatoryand enforceable. the principles suggest behaviour which the accountantshould strive for. They represent a commitment to ethical conduct beyondany explicit prohibitions. The following affirmative principle is set forth inthe area of independence, integrity and objectivity :
"A certified public accountant should maintain his integrity andobjectivity, and when engaged in the practice of public accounting. beindependent of those he serves" (AICPA, 1974. p.2).
The nineteen statements which follow are intended by the Instituteto provide an elaboration of this principle and rationale for its support.
1. The public expects a number of character traits in a certified publicaccountant but primarily integrity and objectivity and, in the practice of pUblic accounting, independence.
2. Independence has traditionally been defined by the profession asthe ability to act with integrity and objectivity.
3. Integrity is an element of character which is fundamental toreliance on the CPA. This quality may be difficult to jUdge. however. since a particular fault of omission or commission may bethe result either of honest error or of a lack of integrity.
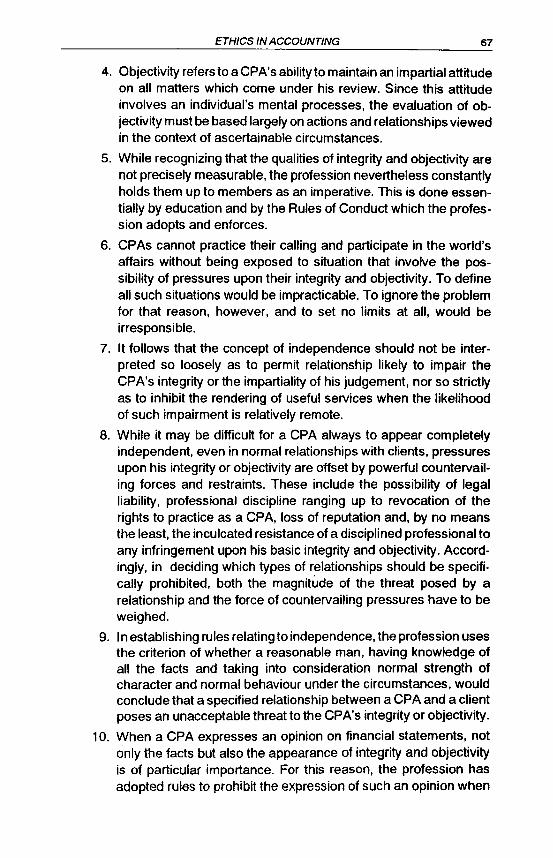
ETHICS IN ACCOUNTING 67
4. Objectivity refers to a CPA's ability to maintain an impartial attitudeon all matters which come under his review. Since this attitudeinvolves an individual's mental processes, the evaluation of objectivity must be based largely on actions and relationships viewedin the context of ascertainable circumstances.
5. While recognizing that the qualities of integrity and objectivity arenot precisely measurable, the profession nevertheless constantlyholds them up to members as an imperative. This is done essentially by education and by the Rules of Conduct which the profession adopts and enforces.
6. CPAs cannot practice their calling and participate in the world'saffairs without being exposed to situation that involve the possibility of pressures upon their integrity and objectivity. To defineall such situations would be impracticable. To ignore the problemfor that reason, however, and to set no limits at all, would beirresponsible.
7. It follows that the concept of independence should not be interpreted so loosely as to permit relationship likely to impair theCPA's integrity or the impartiality of his judgement, nor so strictlyas to inhibit the rendering of useful services when the likelihoodof such impairment is relatively remote.
8. While it may be difficult for a CPA always to appear completelyindependent, even in normal relationships with clients, pressuresupon his integrity or objectivity are offset by powerful countervailing forces and restraints. These include the possibility of legalliability, professional discipline ranging up to revocation of therights to practice as a CPA, loss of reputation and, by no meansthe least, the inculcated resistance of a disciplined professional toany infringement upon his basic integrity and objectivity. Accordingly, in deciding which types of relationships should be specifically prohibited, both the magnitude of the threat posed by arelationship and the force of countervailing pressures have to beweighed.
9. In establishing rules relating to independence, the profession usesthe criterion of whether a reasonable man, haVing knowledge ofall the facts and taking into consideration normal strength ofcharacter and normal behaviour under the circumstances, wouldconclude that a specified relationship between a CPA and a clientposes an unacceptable threat to the CPA's integrity or objectiVity.
10. When a CPA expresses an opinion on financial statements, notonly the facts but also the appearance of integrity and objectiVityis of particular importance. For this reason, the profession hasadopted rules to prohibit the expression of such an opinion when
68 INDIAN JOURNAL OFACCOUNTING
relationships exist which might pose such a threat to integrity andobjectivity as to exceed the strength of countervailing forces andrestraints. These relationships fall into two general categories:(i) certain financial relationships with clients, and (ii) relationshipsin which a CPA is virtually part of management or an employeeunder management's control.
11. Although the appearance of independence is not required in thecase of management advisory services and tax practice, a CPAis encouraged to avoid the proscribed relationships with clientsregardless of the type of services being rendered. In any event,the CPA, in all types of engagements, should refuse to subordinate his professional judgement to others and should expresshis conclusions honestly and objectively.
12. The financial relationships proscribed when an opinion is expressed on financial statements that make no reference to feespaid to a CPA by a client. Remuneration of providers of servicesis necessary forthe continued provision ofthose services. Indeed,a principal reason for the development and persistence in theprofessions of the client-practitioner relationship and of remuneration by fee (as contrasted with an employer-employee relationship and remuneration by salary) is that these arrangementsare seen as a safeguard of independence.
13. The above reference to an employer-employee relationship ispertinent to a question sometimes raised as to whether a CPA'sobjectivity in expressing an opinion on financial statements will beimpaired by his being involved with his client in the decisionmaking process.
14. CPAs continually provide advice to their clients, and they expectthat this advice ",,!i11 usually be followed. Decisions based on suchadvice may have a significant effect on a client's financial condition or operating results. This is the case not only in tax engagements and management advisory services but in the audit functionas well.
15. If a CPA disagrees with a client on a significant matter during thecourse of an audit, the client has three choices; he can modify thefinancial statements (which is usually the case), he can accept aqualified report or he can discharge the CPA. While the ultimatedecision and the resulting financial statements clearly are thoseof the client, the CPA has obviously been a significant factor in thedecision-making process. Indeed, no responsible user offinancialstatements would want it otherwise.
16. It must be noted that when a CPA expresses an opinion on thefinancial statements, the jUdgements involved pertain to whether
ETHICS IN ACCOUNTING 69
the result of operating decisions of the client are fairly presentedin the statements and not on the underlying wisdom of suchdecisions. It is highly unlikely, therefore, that being a factor in theclient's decision-making process would impair the CPA's bbjectivity in judging the fairness of presentation.
17. The more important question is whether a CPA would deliberatelycompromise his integrity by expressing an unqualified opinion onfinancial statements which are prepared in such a way as to coverup a poor business decision by the client and on which the CPAhas rendered advice. The basic character traits ofthe CPA as wellas the risks arising from such a compromise of integrity, includingliability to third parties, disciplinary actions and loss of right topractice, should preclude such action.
18. Providing advice or recommendations which mayor may notinvolve skills logically related to a client's information and controlsystem, and which may affect the client's decision- making, doesnot in itself indicate lack of independence. However, the CPA mustbe alert to the possibility that undue identification with the management of the client or involvement with a client's affairs to such adegree as to place him virtually in the position of being anemployee, may impair the appearance of independence.
19. To sum up, CPAs cannot avoid external pressures on their integrity and objectivity in the course of their professional work, butthey are expected to resist the pressures. They must, in fact, retaintheir integrity and objectivity in all phases of their practice and,when expressing opinions on financial statements, avoid involvement in situations that would impair the credibility of their independence in the minds of reasonable men familiar with the facts(Windal and Corley, 1980, p.41).
In the backdrop of the aforementioned International Code and itsAmerican counterpart, a perusal of the Indian Chartered Accountants Actof 1949, read with the different editions of the code of conduct pUblishedby the Council of the Institute of Chartered Accountants of India and therevised Chartered Accountants' Regulations of 1988, suggests that theoverriding motto has been pride of service in preference to personal gain(ICAl, 1988, p.2). It reminds all concerned that it has a great practicalvalue in so far as it proclaims to the public that the accountants woulddischarge their duties and responsibilities, having regard to pUblic interest.Any breach of this Code, it reminds all concerned, may disentitle anerring accountant to remain a member of the professional body.
In the Introduction to the Code of Conduct published by the ICAI itis admittecrthat "human nature being' what it is, a man often places hispersonal gain above service" (ICAI, 1988, p.2).

70 WD~NJOURNALOFACCOUNn~G
This article devotes itself to the task of demonstrating the rationaleof the proposition that personal gain and public interest can be harnessedin a new conceptualization of ethics that is more in tune with free marketeconomy. The dichotomy between personal gain and public interest is afalse one; the two may be redefined to serve realisable ethical standards.If the two remain dichotomous, as they are at present, both play hypocriticalgames with one another.
The empirical researches and probes into the activities of accountantslead to the inescapable conclusion that, however much important theprofessional rules and regulations are, the overriding importance ofself-interest of the accountant in the enforcement of ethical standardscan hardly be denied. By self-interest, I do not mean selfish interests;what I mean by such interests is those interests which I want to realizeand willingly let others realize in their professional career. Abraham Lincolnjustified his stand against slavery on the ground that he wanted no oneto be a slave as he himself did not want to be a slave. This kind ofLincolnian logic is precisely the force behind my argument that theaccountant must not resemble the proverbial donkey which is constantlywhipped to bear a heavy load. He should be provided with carrots tobear the burden of ethics on his poor, tiny shoulders. The incentives forshouldering the burden are hardly provided by the enactment of rules,regulations, or norms. Nor are they taken care of by the provision ofmore and more perks for the accountants.
Like all other human beings the accountants are also Homoeconomicus-economic beings. One cannot expect them to be moreparticular than other members of the society in the enforcement of ethicalnorms in their accounting jobs if their economic interests are not served.When they do a good job, pay them well, pamper them, if you like, withcars, perks, airconditioned bungalows, executive class air travel and thelike. They are a rare breed in matrimonial columns; let them be. Theyshould get the riches as well as the princess. If they do a fine job, theyshould get the coveted prize. No one should grudge.
The economic incentives or the carrots, as I say in a lighter vein,are not enough to guarantee the enforcement of ethical standards inaccounting jobs. Ethical standards of any society evolve from thesocio-economic formation and the superstructural elements supported bythat formation (Bottomore, 1983, pp.42-45). The production relations, orproperty relations being the base of any society, determines to a largeextent the institutional and ideological superstructure of any particularsociety.
Family, associations and state as institutions and law, morality,religion, ethics, art, culture, etc. as ideas go on fashioning and refashioning
ETHICS IN ACCOUNTING 71
in tune with changes taking place in production relations. Ethical standardsof a given society may enjoy a degree of relative autonomy from thebase, but not much. They may affect the base, but not sUbstantially.Accountants all over the world have no power to determine the contentand configurations of such ethical standards. They are themselves underthe spell of such standards. The accountine] rules, regulations and normshave to conform to such standards.
The accountants must be made to realize that they stand to gain byenforcing the societal ethical standards as expressed through accountingrules and regulations. Economic incentives are needed; but they are notenough. Accountants need the assurance that they stand to gain bysteadfastly adhering to the rules and regulations than by camouflaging,hoodwinking or feigning compliance to them. It is the accountant whoshould be the custodian of ethics in the financial housekeeping of anenterprise. Rules and regulations are his guides; but he is the personwho decides how to utilize the services of the gUides. If he feels surethat he stands to gain by allowing the guides full and free play, he willbe second to none in permitting such a play. If he anticipates that bytwisting, torturing or disregarding such guides his own interests are served,he would not hesitate to do so like any other normal human being.
This article is built on the hypothesis that under Indian conditions theaccountants stand to gain by conforming to the covert and overt dictatesof their employers. They have to pay lip service and feign loyalty to theethical standards embodied in the existing rules and regulations. It is byso doing they may reasonably expect to keep their jobs secure, assurehikes in their pay and perks in the next financial year and maintain aclean and quiet record of service that is a sine qua non for betteremployment prospects.
The Indian accountants cannot be expected to be crusaders for theenforcement of ethical standards; they are likely to be conformists, byand large paying much more heed to the wishes of their employers thanto the dictates of individual, organizational, societal or international codesof ethics. Some of them may be extraordinary deviants, fliving up jobsin the private sector and switching over to the public sedor for muchless remuneration or going back to academic pursuits. Such exceptionsonly prove the rule that under existing circumstances the accountants inIndia have no earthly reason to be, without fear or favour, the realcustodian of ethical standards.
It is common knowledge that every economy, be it capitalist orsocialist, witnesses another economy running' parallel to it. This is sobecause the normal economy has failed to take into full cognizance ofthe need for utilizing the creative energies of the people that are hinderedby the prevalent system. A· doctor in a government hospital, after

72 WD~NJOURNALOFACCOUNnNG
performing his duties to the satisfaction of the patients and his employer,may have sufficient time, energy and motivation to work for more fameand money. The whole energy of a college teacher may not be exhaustedafter attending a few classes in a week. He may feel the urge to earnmore by writing books and articles in jburnals or by delivering lecturesto an audience outside the classroom. A company executive, a technician,a clerk, a tailor, in fact any employee, may feel that he is capable ofbolstering his income by working extra hours. In Hong Kong it is possibleto have a suit tailor-made within a few hours because of the cooperationof the management of the tailoring establishment and the willingness ofthe employees to do extra work for extra money. Such extra work andextra money do no harm to anybody. Money has no colour; it is blackonly when the ethical code of conduct approved by the society is violated.It is for the state authority to decide when and how it is violated and topunish the violators. But, in no case, should it stifle private self-seekingthat does not in any way damage the collective interests of the society.If it does so it will be nothing short of killing the goose that lays downgolden eggs.
It is my contention that no system can have a vigorous existencewithout providing for the vindication of self-interests of its participants.Allow me to refer to Hegel who said that unlike the family or the statewhere the individuals are required to sacrifice selfish interests, the civilsociety represents a domain in which all its members pursue egoisticinterests (Taylor, 1975, p.433). Right, but not exactly. If everyone isallowed to play his own selfish game there would be no free and fairplay. Rules of the game have to be framed. Such rules of the game mustnot stifle the freedom of the players to play their own game, they shouldmake the game possible and enjoyable. I would rather like to call therules of the game, the politics of the game.
The politics of the right kind is important. The executive of governmentcompanies cannot but shun decision-making, because even if he makesan extraordinarily momentous decision that proves right there is noprovision for reward, but for a major error there is a provision for censure,demotion and even dismissal. Buck-passing is his answer to this type ofpolitics prevailing in government administration. Outstanding teachers anddoctors know that for extraordinary services rendered in their respectiveinstitutions there is no reward. One common scale of pay binds theextraordinary. average and below average colleagues into one mediocrefraternity.
JUdges get fixed salaries; if there are businessmen to prOVide airfare for all the family members of an exceptionally gifted judge of theHigh Court and Lake Palace Hotel Bills for all of them, how long can hebe expected to be the vanguard of legal conscience? Once appointed,judges have no other means of getting rewards for excellent job
ETHICS IN ACCOUNTING 73
performance. Excellence is the first casualty in this wrong kind of politics.The accountants in India, similarly, cannot be expected to do a fine jobin enforcing codified ethical standards if the right kind of politics is notintroduced in their service career.
How should it be done? First, call a spade a spade. The accountantscannot be coerced to act as guardians of ethical standards. Penalmeasures hardly deter men from wrong doing.
Second, economic incentives by themselves are not enough for askingthe accountants to deliver the goods wanted of them. Arrangementsshould be made in such a way that they like to be the volunteer adventureswho are prepared to undertake risks for achieving higher goal aspiration.Non-monetary incentives in the form of social esteem, recognition,self-fulfilment etc should be within the reach of the accountants courageousenough to point out the unethical conduct discernible in the accountingpractices of their respective employers.
Third, the accountants should enjoy a high degree of independence.The more independent they are, the more probable is the non-vulnerabilityof their custodian role.
In the USA the two journalists who were instrumental in exposingthe Watergate scandal. leading to the resignation of President Nixon arenow enjoying 'Ia dolce vita'-better placement, higher emoluments andsuperior social recognition. In India journalists of this description perhapswould either be beaten or killed; what is certain is that they would beunemployable for life. There is no accountant in India who can boastthat, after exposing the unethical conduct of accounting practice of thefirm where he earns his living, he has been inundated by lucrativeemployment offers from more reputable firms. The policies surroundingthe working environment of the Indian accountant is such that it breedsmediocrity and conformism. I suggest a change in this politics.
Privatization and deregulation are increasingly being resorted to inthe erstwhile socialist states of eastern Europe. The Peoples' Republicof China has found it convenient to fuse free market system with commandeconomy model. India is slowly but steadily follOWing the footsteps offree market economy. In such an economy competition and efficiency gohand in hand. The new politics that I speak of thrives best under a systemwhere accountants compete with one another on the strength of theirintegrity, independent frame of mind and reputation for upholding ethicalstandards.
Codes, rules, regulations etc are not the law that regulates the humanconduct. Following Lord Moulton it can be said that there are at leastthree domains that affect an accountant's sense of ethical judgement :(1) the area of free choice, (2) the area of obedience to theunenforceable, and (3) the area of law. An accountant has hardly any
74 INDIAN JOURNAL OFACCOUNTING
free choice left to him except in a limited number of instances. Theremaining two areas, the domains of obedience to the unenforceable andlaw, are interrelated. "They intertwine and complement each other.Obedience to law in a free society is of the essence, but law observancewould come to naught unless the members of that society were not alsodeeply devoted to the precept of obedience to that which they cannot beforced to obey (Windal and Corley, 1980, p.4). Lord Multon designatesthe domain of obedience to the unenforceable as the world of truth,ethics, morals, aesthetics and the like.
The unenforceable is enforced only when the accountants are madeto understand that their enlightened self-interest lies in exposing allunethical practices in the field of accounting. It is only when the societyis prepared to reward them for their services that they would come outof their shell of subservience and say "We are free !"
It is common experience that because of the system of punishmentand reward operating in a given society, or even in the domain of economicoperations, the accountants are willynilly forced to behave in a predictableway. In governmental organizations they are expected of many thingsexcept anything creative or exemplary. The accountants there know forcertain that if their innovative endeavours go wrong they are not likelyto go punished. They also know that for doing work in an unimaginativeor routine way there waits no punishment whatsoever. In the world ofprivate business, trade and commerce, the reverse holds true. Workingin a routine or unimaginative sort of way is the surest way to get fired.Innovative or truant way of accounting is likely to be visited by profuserewards. Here again, rewards are tuned to the advantages secured forthe company where the accountant earns his daily bread. Innovation andcompliance with the law or accepted standards are not by themselvesenough to fetch rewards.
My feeling is that under the present system only the pedestrian andthe successful hoodwinkers thrive best. All others are marginalized. Itseems that the system needs overhauling in such a way as toaccommodate the legitimate aspirations of the accountants in terms ofmoney, status and fame within a scheme tailor-made to reward thelaw-abiding and creative accountants. Whatever be the worth of theaccountants in the eyes of their employees they should be protected bylaw to do their job unhindered. Similarly, the meak job-doers with socapacity for innovation need reprimand.
Codes of ethics are not inviolable. They are violated to serve individual,familial and group interests. If ethics is redefined in a positive way tofavollr the cause of the enlightened, aspiring, public spirited accountantinsteaJ of threatening to pehalise him, the accounting profession and thedomain of ethical conduct get united in a non-hypocritical bond of love.

ETHICS IN ACCOUNTING
Long live enlightened self interest !
End Notes
75
1. Oliviera, A. Johnson further mentioned "...... Let us characterize,ethics as a systematic inquiry into man's conduct with the purposeof discovering both rules that ought to govern human action" (p.4)
2. According to Jones et ai, "...... the term ethics applies not merelyto the various approved codes but also to the activity of appraisingand perhaps revising these codes" (p.2)
3. The base - superstructure controversy has not yet been solvedin Marxist theory. Gramsci and later the Euro- communistsgranted much more autonomy to the superstructure than theearlier brand of Marxists. In recent history the base- superstructure controversy has acquired a new significance in the writing ofFrench Marxists. For example, Poulantzas, grants much moreautonomy to the political superstructure than Lojkine, who thinksthat the base 'overdetermines the superstructure'.
References
AICPA (1974) : Concepts of Professional Ethics: AICPA Professional standards;New York; Vol. 2.
Bottomore, Tom (ed) 1983) : A Dictionary of Marxist Thought, Basil Blackwell;London,
Cooper, W. W. and Yuji Ijiri (eds) (1983) : Kohler's Dictionary of Accounting;Prentice-Hall of India Ltd.; New Delhi; 3rd edition.
De George, R. T. (1982) : Business Ethics; McMillan India; Calcutta,
Donaldson, Thomas and Patricia Werhane (1989) : "Introduction to EthicalReasoning" in Peter Y. Windt et al. (eds,) Ethical Issues in Professions;Prentice-Hall Inc.; Englewood-Cliffs, New Jersey.
ICAI (Institute of Chartered Accountants of India) (1988) : Codes of ConduQt,ICAI, New Delhi; 8th edition. '
Johnson, Oliviera A. (1978) : Ethics-Selection from Classical :ana ContemporaryWriters; Holt-Rinehart and Winston, New York.
, .Jones, W. T.; F. Sontag; M. O. Buckner; R. ,J. Forelin (1979) : Appraaches to
Ethics; McGraw-Hili Bo.ok Co; New York.
Taylor, Charles (1975) : Hegel; Cambridge University Press, London.
Windal, Floyed W. and Rob,ert N. 90rley (1980) ; The..Acc0l.Jnting Professional-Ethics: Responsibility and Liability, Pr~tice-Hall Inc.; EnglewoodCliffs, New Jersey,'
Windt. Peter Y,; Peter C. Appleby; Margaret P. Battin; Bruce M. Landman andLeslie P. Frat:lcis (1989) : Ethical Issues in ProfesSions; Prentice-HaJlInc., Englewooa~Cliffs, New Jersey.

INDIAN JOURNAL OF ACCOUNTINGVOL. XXVI, DECEMBER 1995
TAXATION AND THE CAPITAL STRUCTURE OFCOMPANIES IN NEW ZEALAND MANUFACTURINGIN'DUSTRV
'Dr 1(azi :firoz !J{lam*The author examines the influence of taxation on the Capital Structureof companies in New Zealand manufacturing industry. According to thesurvey, taxation has some influence on the financial behaviour ofcompanies and that this influence is not negligible.
Introduction
The main objective of this paper is to examine the influence of taxationon the capital structure of companies. An important decision facingcompanies requiring new finance is whether to raise equity or debt. Inraising finance, the question of taxation arises because interest on debtis tax deductible. Where the tax consideration is of prime importance,companies might be expected to issue more debt capital, other thingsremaining the same. But empirical studies on debt ratio determinants(see for example, Titman & Wessels, 1988, Long & Malitz, 1985) werenot consistent. In fact, there is relatively little empirical evidence on howcompanies select between financing instruments at a given point in time(Marsh, 1982).
This study throws some light on a number of interesting issues suchas whether companies' management think that they have target debtratios, whether companies adopt extremely levered capital structure,factors that are considered to be important in selecting financinginstruments and how important taXation is as compared with other factorsin choosing a particular ·form .of finance.
Theoretical Background
Prior to Modigliani and Miller's (1958) study, tile "traditional view"'assumed that there was an optimal point of gearing for any given firm(Solomon, 1959; Donaldson, 1961; Schwartz, 1962; Gordon, 1963) andthat the financing decisions of the firms were not irrelevant. Several otherstudies offered evidence that companies in aggregate appeared to att~mpt
to keep a target debt ratio (Bosworth, 1971; Taggart, 1977). Ang (1976)
* Senior Lecturer, Department of Accountancy, Massey University, Palmerston North,New Zealand. .
76

TAXATION AND THE CAPITAL STRUCTURE 77
and Marsh's (1982) findings confirmed this at the individual firm level andconsistent, and less· direct evidence was also provided by Lev andPekelman (1975) and Brealey, Hodges and Capron (1976).
M & M (1958) assert that in a perfect capital market, the overall costof capital is independent of the proportion of debt and preference sharesin the capital structure of the firm. A number of studies demonstrate thatthe M & M capital structure irrelevance theory holds under a fairly generalset of assumptions (Fama & Miller, 1972; Stiglitz, 1969, 1974; Miller,1977).
De Angelo and Masulis (1980) demonstrate that under a more realisticmodel of the tax regime that includes non-debt tax shields such asdepreciation and investment tax credit, an optimum degree of leveragemay exist for each firm regardless of whether leverage-related costs aresignificant or not. Moreover, they show that the existence of significantleverage related costs in the absence of non-debt tax shield also suggestsan optimum degree of leverage at the level of the individual firm.
Both Miller (1977) and De Angelo and Masulis's (1980) models havebeen challenged because of their assumption that all payments to debtholders are tax deductible. There are studies which distinguish betweeninterest payments and repayment of principal under alternativeassumptions about the behaviour of companies regarding payment indefault (see, for example, Park and Williams, 1985; Zechner and Swoboda,1986). These studies suggest that pure tax arguments are not sufficientto support the firm's optimal capital structure as suggested in De Angeloand Masulis (1980). There are other considerations which need to beincorporated into the model to offer a sensible solution to the firm's optimalcapital structure. Such considerations may include existence of agencycosts (Jensen and Meckling, 1976; Scott, 1977), corporate taxes andbankruptcy costs (Kraus and Litzenberger, 1973), asymmetric information(Ross, 1977) and regulatory costs (Marcus, 1983).
Myers (1984) and Myers and Majluf (1984) argue for a pecking ordertheory based on asymmetric information. Under this theory firms will relyinitially on available internal finance to finance new projects. If this sourceproves inadequate then the firm may decrease its dividend payment togenerate more internal funds. Finally, if more funds are needed the firmmay resort to external finance beginning with debt, then hybrid securitiesand finally equities. These studies clearly indicate that the type of fundsto be used in financing a project will very much depend on the costs ofissue.

78 WD~NJOURNALOFACCOUNnNG
Previous Empirical Studies
The influence of taxation on the capital structure of companies is amatter for empirical testing.
There are studies which indicate that executives regard tax as a veryimportant debt ratio determinant (Stonehill et ai, 1973). On the otherhand, other studies failed to find any significant independent effect ondebt ratios (Williamson, 1982; Long & Maliz, 1983; and Taub, 1975). Onesurvey study also indicated that the tax system had not influencedcorporate management's attitude towards either equity financing or debtfinance (Alam, 1985).
Bosworth (1971), White (1974) and Taggart (1977) provided evidencethat both the level and structure of interest rates were importantdeterminants of the level of long term debt issues.
Several studies indicate that leverage increases with fixed assets,non-debt tax shields, growth opportunities and firm size and decreaseswith volatility, research and development expenditures, bankruptcyprobability, profitability and uniqueness of the product (Bradley, et ai,1984; Castanias, 1983; Kester, 1986; Titman & Wessel, 1988).
Marsh (1982) pointed out that his findings indicated that firms behaveas if they had target gearing ratio in mind when raising outside finance.His study also suggested that larger and more capital intensive companieswere likely to employ relatively more debt. Other studies also indicatethat asset structure and size have an effect on leverage (Bennett andDonnelly, 1993; Myers, 1977; Scott, 1977). Bray (1967) and Gupta (1969)indicated that total debt ratios were positively related to growth, typicallymeasured as sales growth.
Overall, the corporate financing behaviour is still the subject ofconsiderable controversy. It is not clearly known how firms choose thedebt, equity or hybrid services they issue (Myers, 1984) and how importanttax is in the process.
Methodology
The objective of this research was to evaluate the relative importanceof tax compared with other factors as far as the raising of outside financeis concerned. It is not likely that an answer to this issue can be foundby building complex macro-economic models and more fruitful methodadopted in this research was to carry out a sample survey concerningthe management's perception of the role of tax in the financial behaviourof companies in the New Zealand manufacturing industry.
The data used in the research was obtained from a self-administeredquestionnaire sent to the 'Chief Executive' of 115 companies. These

TAXATION AND THE CAPITAL STRUCTURE 79
included all public manufacturing, mining and exploration companies listedon the 'Oatex Investment Service'.
The questionnaire was pretested using a small sample. The final setof mailings consisted of the questionnaire itsel1, a cover letter and astamped, self-addressed reply envelope. An identical follow-up mailingpack was also sent to the non-respondents approximately three weeksafter the original questionnaire was mailed.
Respondents were guaranteed that complete confidentiality would bemaintained and it was also suggested that responses which they felt tobe too confidential could be omitted.
To remed~ the problem of divergence between actual and reportedbehaviour, X (Chi-square) tests were carried out to check forinconsistencies between respondents' declared policies and their reportsof actual practices.
The questionnaire design. sample characteristics and response rateare discussed followed by the results of the X2 tests.
Questionnaire Design
The construction of a reliable questionnaire is of vital importance. Inthis case a number of techniques were adopted to increase the likelihoodof obtaining valid responses. These included a number of questions withalternative answers to induce the respondents to select the answers whichcorresponded most nearly to this desired response, logically interrelatedquestions randomly ordered so that inconsistencies may be detectedeasily and some open ended questions also in order to encouragerespondents to express their own viewpoints.
Sample Characteristics
The survey was conducted in a way that the companies represent awide cross-section of major industrial categories.
The distribution of companies surveyed by industrial groups is shownin Table 1.
The survey was so designed that large, medium and small companieswould be represented. The classification of firms by size is indicated inTable 2.

80 INDIAN JOURNAL OFACCOUNTING
Table 1 : Distribution of Companies by Industrial Groups
No. of Percentage No. of PercentageCompanies of Total Responses of Total
1. Apparels &Textiles 14 12.2 6 10.3
2. Automotive 7 6.1 3 5.2
3. Building &Construction 18 15.7 6 10.4
4. Electronics &Appliances 4 3.5 2 3.4
5. Engineering 14 12.2 7 12.1
6. Fertiliser &Chemicals 6 5.2 4 6.9
7. Food 7 6.1 5 8.6
8. Forestry 3 2.6 1.7
9. Frozen Meat &By-products 9 7.8 7 12.1
10. Fuel &energy 5 4.3 2 3.5
11. Liquor &Tobacco 7 6.1 1.7
12. Mining &Exploration 10 8.7 4 6.9
13. Printing &Packaging 6 5.2 5 8.6
14. Rubber & Plastics 5 4.3 5 8.6
115 100.0 58 100.0
Table 2 : Classification of Firms by Size
No. of Companies %ofin Sample Total
Large firms (sales over $50 m) 44 38.3
Medium sized firms(sales from $10 m to $50 m) 48 41.7
Small firms (less than $10 m of sales) 23 20.0
115 100.0

TAXA TION AND THE CAPITAL STRUCTURE 81
Response Rate
Altogether 58 replies were received but three of them were not usable.So 55 unable replies were received giving an effective overall responserate of 49.1% (55/112).
The response rate by company size is shown in Table 3.
Table 3 : Response Rate by Company Size
No. of Responses Response Rate %
Large firms 21 47.7
Medium sized firms 26 56.5
Small firms 8 36.4
55 49.1--The wide industry coverage and the response rates achieved, which
are quite high for this type of surgery, have ensured that the result isrepresentative of New Zealand industry.
Survey Results and Discussions
A summary of the main replies to the questionnaire is given in tabularform as an appendix to this paper. The replies give an indication not onlyof the importance of taxation in decisions made regarding the raising ofcompany finance but also key factors which affect decisions in this areaand whether the decision makers believe that there is an optimal debtequity ratio. The main pattern of responses is outlined below.
Deduction of Interest Payments and Reliance on Debt
Interest on borrowed capital is a deductible expense for tax purposesbut dividend on equity capital is not. In view of this fact it is importantto know whether the tax system encouraged the decision makers to relymore heavily on debt rather than equity capital. When respondents wereasked whether their decisions on raising outside finance were influencedby the taxation system in favour of raising more loan capital than theywould if dividends and interest payments were treated in the same wayfor tax purposes, a majority of them replied it did (58%). This percentagewas even higher in the case of large firms (61.9%). This reply indicatesthat tax may play an important role in shaping the pattern of finance.
Factors Influencing the Pattern ofFinance
An understanding of the likely effects of taxation on the raising offinance requires the fullest possible information on the factors which

82 WD~NJOURNALOFACCOUNnNG
influence companies in making these decisions. From the replies it appearsthat interest rates and debt equity ratio are the most important factors inraising finance. Very few firms indicated the tax deductibility of interestwas an important factor in raising outside finance. The reason may bethat in raising finance the companies initially consider debt equity ratioand interest rates. Once they are happy with these, the tax factor hasbecome an important issue in selecting financing instruments.
Firms' Borrowing and Taxation
It is interesting to know whether firms would borrow more, less orthe same. if interest on borrowing were not allowed as a deductibleexpense for tax purposes. The replies suggested that a great majority ofrespondents (75%) were of the opinion that they would borrow less ifinterest on borrowing were not allowed as deductible expense for taxpurposes. This response suggests that the decision makers opt for cheaperfinance where possible and gives support to Myers and Majluf's (1984)pecking order theory.
Extremely Levered (Geared) Capital Structure and Taxation
There are suggestions that although the tax system favours the useof debt capital, firms in practice do not adopt extremely levered (geared)capital structures. The replies indicate that the majority of respondents(82%) in practice do not adopt extremely levered (geared) capitalstructures despite the tax benefits attached to the use of debt.
The reasons given for not adopting an extremely geared capitalstructure include risks, higher gearing clouds long term thinking and lowergearing helps borrowing at favourable terms.
Optimum Debt Equity Ratio
There are studies which assume that there does exist an optimalpoint of gearing for any given firm (Solomon. 1963; Schwartz, 1959;Schwartz & Aronson, 1967). On the other hand, there are other studieswhich oppose the above view (see, for example. Modigliani & Miller,1958). To get an idea 'about this. a question was asked whetherrespondents believed there was an optimal debt equity ratio for theircompanies.
The majority of respondents (78%) indicated that there was an optimaldebt equity ratio for their companies. This was more so in the case oflarge firms (85.7%). From their comments it appeared that there was arange of acceptable debt equity ratios depending on the nature of thebusiness with a rule of thumb figure being 40% debt to 60% equity.

TAXATION AND THE CAPITAL STRUCTURE 83
It is interesting to note that there was a significant difference betweenthe percentage responses of large firms and those of small firms inindicating that there was an optimal debt equity ratio for their companies.Probably large firms raise more debt finance and they consider that debtequity ratio is important in the process of raising finance. Marsh's (1982)results also support the hypothesis that companies have target debt levelsand that these targets are influenced by firm size, risk and assetcomposition.
Importance of Tax in Raising Finance
To have a better understanding of the taxation effects one questionasked was how important taxation is in relation to other factors in makingdecisions on the raising of finance. A majority of firms (62%) replied thattaxation was "extremely" and "very" important in their decision on raisingoutside finance with 29% replying that taxation was "moderately" important.This response was strongest in the case of large firms (81 %) but wasless so in the case of medium (46.2%) and small (62.5%) firms. Onecan get the impression from the above reply that the taxation is importantand it cannot be totally ignored in the financial decision making process.
It may appear conflicting that many companies did not consider taxas a determining factor in selecting a particular form of financialinstruments but the majority of them think that tax is extremely and veryimportant as compared with other factors when they make their decisionon raising outside finance. The real issue is that once the decision makersare comfortable with the debt eqUity ratio and interest rates, then theyconsider the tax factor in issuing either debt or equity. It is reasonablefor them not to resort to more debt finance only because of deductibilityof interest expense for tax purposes. On the other hand, they will issuemore debts if the debt equity ratio and interest rates permit them to doso. In short, the decision makers generally opt for cheaper finance wherepossible.
There was a significant difference between the percentage of largecompanies and the percentage of small and medium sized companiesregarding the' importance of tax in raising outside finance. A greaterproportion of large firms consider tax as extremely and very important incomparison. with other factors in raising outside finance. There was nosignificant difference between small and medium sized firms.
Relationship between Responses
Additional light is likely to be thrown on respondents reaction totaxation and selection of financial instruments if relationships betweenresponses are analysed. This has been done by setting up

84 WD~NJOURNALOFACCOUNnNG
cross-tabulations and calculating the X2 measure for each selectedrelationship.
Chief executives' attitudes as expressed in their responses to thequestionnaire, would be consistent if those stating that they believed thatthe company tax system encouraged them to rely rflore heavily on debtalso felt that they would borrow less if interest on borrowing were notallowed as deductible expense.
The contingency table for those responses is shown in Table 4 below.
Table 4: Taxation & Debt Finance
Tax System encourages debt No tax deductibility of interest
Borrow Less Same N/A Don't Know
Yes 26 4 1 1
No 12 7 0 0
No opinion 3 0 0 0
No reply 0 0 0 1
Total Responses 41 11 1 2
Chi-square =33.00
significance = 0.0001
From this table it can be seen that statistically significant support (atthe 0.0001 level) has been provided for the view that those companieswhich consider that the tax system encourages debt finance also believethat they would borrow less if interest on debts were not allowed asdeductible expense.
Some General Comments
About three fifths of all respondents submitted comments of a generalnature and the contents of these varied widely.
Quite a substantial number of respondents mentioned that tax ratesshould be reduced. Some of the respondents were of the view that thecompany tax and fringe benefits tax should be deductible in the company'shands and that the tax system should not inhibit growth and shouldencourage capital formation.
Conclusion
From the analysis of replies a number of interesting findings didemerge. Firstly, the tax system encouraged companies to borrow morethan otherwise would be the case. Secondly, the tax system by itself

TAXATION AND THE CAPITAL STRUCTURE 85
cannot be a determining factor in raising outside finance, the majority ofrespondents indicate that interest rates and debt equity ratio are the mostimportant factors in influencing financial behaviour of companies.
Although the cost of debenture or debt finance may be cheaper inview of tax deductibility of interest paid than equivalent equity finance,the majority of respondents do not favour a highly geared position.
It is interesting to note that a great majority of respondents furtherindicate that there is an optimal debt equity ratio for their companies.These targets are affected by risk and company size.
The majority of respondents also consider taxat!on to be extremelyand very important as compared with other factors in raising outsidefinance.
There were significant differences in the reported attitudes ofcompanies of various sizes. More large firms reported that they consideredtax to be extremely and very important and far fewer small and mediumsized firms considered tax the same way.
The overall conclusions which emerge from the survey responsesare that taxation has some influence on the financial behaviour ofcompanies and that this influence may not be negligible, since it is largecompanies which are more sensitive to taxation related benefits.
References
Alam, K. F. (1985), "Company Taxation and the Raising of Finance", MasseyUniversity, Department of Accountancy, Discussion Paper Series No.34, 1-11.
Ang, J. S. (1976), "The Intertemporal Behaviour of Corporate Debt Policy", Journalof Financial and Quantitative Analysis, 11. 555-566.
Bennett, M. & Donnelly, R. (1993), "The Determinants of Capital Structure: SomeUK Evidence, British Accounting Review, 25, 43-59.
Bosworth, B. (1971), "Patterns of Corporate External Financing", Brookings Paperson Economic Activity, 2, 253-279.
Bradley, M.; Jarrell, G. & Hamlin, E. (1984). "On the Existence of an OptimalCapital Structure: Theory and Evidence, Journal ofFinance. 39, 857-878.
Bray, J. N. (1967), The Risk and Use of Debt Financing, Unpublished Ph.DDissertation, UCLA, 1967.
Brealey, R. A., Hodges, S. D. & Capron, D. (1976), "The Return on AlternativeServices of Finance", Review of Economics and Statistics, 58, 469-477.
Castanias, R. (1983), "Bankruptcy Risk and Optimal Capital Structure", Journalof Finance, 38, 1617-1635.

86 IND~NJOURNALOFACCOUNnNG
Davenport, M. (1971), "Leverage and the Cost of Capital: Some Tests UsingBritish Data". Economics, Vol. XXXVIII.
De Angelo, H. & Masulis, R. (19BO), "Optimal Capital Structure Under Corporateand Personal Taxation", Journal of Financial Economics, 8,3-29.
Donaldson, G. (1961). Corporate Debt Capacity: A Study of Corporate DebtPolicy and the Determination of Corporate Debt Capacity, HarvardBusiness School, Division of Research.
Fama, E. & Miller, M.H. (1972), The Theory of Finance, New York: Holt. Rinehartand Winston.
Gordon, M. J. (1962), The Investment, Financing and Valuation of the Corporation,Homewood, Illinois : Irwin.
Gordon, M. J. (196?), "Some Estimates of the Cost of Capital to the ElectiveUtility Industry 1954-57 : Comment". American Economic Review.
Gupta, M. C. (1969), "The Effect of Size, Growth and Industry on the FinancialStructure of Manufacturing Companies, Journal of Finance, 24, 517-529.
Jensen, M. C. and Meekling, W. H. (1976), "Theory of the Firm: ManagerialBehaviour, Agency Costs and Ownership Structure", Journal of FinancialEconomics, 3, 305-360.
Kester, C. W. (1986), "Capital and Ownership Structure; A Comparison of UnitedStates and Japanese Manufacturing Corporations", FinancialManagement, 5-16.
Kraus, A. and Litzenberger, R. (1973), "A State Preference Model of OptimalFinancial Leverage", Journal of Finance, 28, 911-922.
Lev. B. & Pekelman, D. (1975), "A Multi-period Adjustment Model for the Firm'sCapital Structure", Journal of Finance, 30, 75-92.
Long, M. S. & Malitz, E. B. (19B3), "Investment Patterns and Financial Leverage",Working Paper, National Bureau of Economic Research.
Long, M. S. & Malitz, I. B. (1985), "Investment Patterns and Financial Leverage"in (B. M. Friedman, ed.), Corporate Capital Structures in the UnitedStates, 325-348. Chicago : University of Chicago.
Marcus, A. J. (1983), "The Bank Capital Decision: A Time Series-Cross SectionAnalysis", Journal of Finance, 38, 1217- 1232.
Marsh, D. R. (1982), "The Choice Between Equity and Debt: An Empirical Study",Journal of Finance, 37, 121-144.
Miller, M. H. (1977). "Debt and Taxes", Journal of Finance, 32, 261-275.
Modigliani, F. & Miller, M. H. (1958), "The Cost of Capital, Corporation Financeand the Theory of Investment", American Economic Review, 53,261-297.
Myers, S. (1977). "Determinants of Corporate Borrowing", Journal of FinancialEconomics, 9, November, 147-176.
Myers, S. (1984), "The Search for Optimal Capital Structure". Midland CorporateFinancial Joomal, 1, 6-1 6.

TAXATION AND THE CAPITAL STRUCTURE 87
Myers, S. & Majluf, N. (1984), "Corporate Financing and Investment DecisionsWhen Firms Have Information Investors Do Not Have", Journal ofFinancial Economics, 12, June, 187-221.
Park, S. Y. and Williams, H. (1985), "Taxes, Capital Structure and BondholderClienteles", Journal of Business, 58,203- 224.
Robicheck, A. A., MacDonald, J. & Higgins, R. (1967), "Some Estimates of theCost of Capital to the Elective Utility Industry, 1954-57 : Comment",American Economic Review, 57, 1278-88.
Ross, S. A. (1977), "The Determination of Financial Structure: The IncentiveSignalling Approach ", Bell Journal of Economics, 8, 23-40.
Sarma, L.V.L.N., & Rao, K.S.H. (1969), "Leverage and the Value of the Firm",Journal of Finance, 24.
Schwartz, E. (1959), "The Theory of the Capital Structure of the Firm". Journalof Finance, 14.
Schwartz, E., & Aronson, J. R. (1967), "Some Surrogate Evidence in Support ofthe Concept of Optimal Financial Structure", Journal of Finance, 22,10-18.
Scott, D. (1977). "Bankruptcy, Secured Debt and Optimal Capital Structure",Journal of Finance, March, 1-19.
Soiomon, E. (1963), The Theory of Financial Management, Colombia UniversityPrep., 1963.
Stiglitz, J. (1969), "A Re-Examination of the Modigliani-Miller Theoron", TheAmerican Economic Review, 59.
Stiglitz, J. (1974), "On the Irrelevance of Corporate Financial Policy", TheAmericanEconomic Review, 64.
Stonehill, A., Beekhuisen, T., Wright, R., Remmers, L. Toy, N., Parses, A., Shapiro,A., Egan, D., & Bates, T. (1973), "Determinants of Corporate FinancialStructure: A Survey of Practice in Rve Countries". Unpublished paper.
Taggart, R. A. (1977), "A Model 01 Corporate Financing Decisions", Journal ofFinance, 32, 1467-1484.
Taub, A. (1975), "The Determinants of the Firm's Capital Structure, Review ofEconomics & Statistics, 57, 410-416.
Titman, S. & Wessels, R. (1988), "The determinants of Capital Structure Choice",Journal of Finance, March, 1-19.
White, W. L. (1974), "Debt Management and thE' Form of Business Financing",Journal of Finance, 29, 565-$77.
Wiillamson, S. (1981), "The Moral Hazard Theory of Corporate FinancialStructure: An Empirical Test", Unpublished Ph.D Dissertation.
Zechner, J. and Swoboda, P. (1986), "The Critical Implicit Tax Rate and CapitalStructure", Journal of Banking & Finance, 10, 327-341.
INDIAN JOURNAL OF ACCOUNTINGVOL. XXVI, DECEMBER 1995
SOME THOUGHTS ON MANAGEMENT OF LIQUIDITY
'1Jr. 'Tanmoy '1Jatta*
The major objective indicators of the problem of liquidity always remainin the background, obtainable only through enquiry from various internaland external sources. The author suggests that managing of liquidityis a labyrinthine process and deserves a contingency approach.
The term "liquidity" possibly has its origin in physical sciences.'liqUidity' means the property of liquid. Matters in liqUid state can beeasily converted to any physical form. In case of a solid it is difficult todo so.
Later, in 1918, according to· the Shorter Oxford English Dictionary,the term 'liquidity' first came into its commercial use, conveying themeaning how promptly an asset is convertible to cash. Because, cashis, by definition, the most liquid asset. Other assets have varying degreesof liquidity.
Without going further through many introductory details, it can bereminded that although each and every discipline has developed and isdeveloping its own vocabularies, many technical terms have occupiedplace in more than one discipline, however conveying divergent meanings.And even in a particular discipline, the same technical term is in use forvarious contextual meanings.
Likewise, Financial Management literature also contains variouscontextual meanings of the term 'liquidity'. Of them, two contextualmeanings are qUite distinct-(i) liquidity of a firm, and (ii) liqUidity ofindividual assets held by the firm.' Generally, the former refers to thefirm's ability to meet its current cash obligations-or in a differentexpression, the firm's ability to raise cash when needed-while the latterrefers to the speed with which the assets are convertible into cash.
Again, liquidity of an asset may be viewed from two different angles :(i) the speed with which the assets am maturing into cash in the ordinarycourse of business, and (ii) the ease with which cash can be arrangedagainst hypothecation or pledge of the assets.
Ordinarily, a firm's ability to raise cash depends on its ability to raisecash against its assets, either through their maturation in the usual courseof business, or through their hypothecation or pledge. But, a firm may
• Reader in Commerce, Tripura University, Agartala.
88
SOME THOUGHTS ON MANAGEMENT OF LIQUIDITY 89
have the ability to raise cash against the physical properties and personalstanding of its owners too. Moreover, in case of need, a firm may arrangecash from its owners, depending on the owners' ability and willingnessto finance the firm, even for non-commercial considerations. In essence,besides the quality of individual assets the firm holds some other factorsalso may assume a vital rolEl in manoeuvring the liquidity position of afirm. Thus, 'liquidity' functionally refers more to the liquidity of a firm thanthe liquidity of individual assets. Precisely, "liquidity" functionally refers tothe firm's ability to raise cash when needed. Here, the ability implies onlythe potential ability, immaterial whether exercised or not.
Again, in the expression 'ability to raise cash when needed', thephrase 'when needed' refers to the timing of cash needs which in its turndepends on the volume and timing of operating activities of the firm.However, cash needs also depend on the firm's schedule of other finan'cialcommitments like debt servicing, dividend payment, etc.
Thus, the overall liquidity of a firm depends on a combination of both'the ability to raise cash' and 'the timing of cash needs'.
This timing of cash needs may well be regulated by manipulating thetiming of operating activities, either deliberately or under compulsion, witha view to avoiding immediate cash obligations and thus avoiding a problemof liquidity, In case of a private firm this may be a righteous approach,in the sense that after all it is basically guided by profitability criteria.Loss minimisation is as good an objective as profit maximisation. But, incase of a public enterprise the major objectives are expected to beattained through physical performances or the performances tangiblybeneficial to the society.
In one approach, therefore, if an enterprise either fails to implementits operating programmes in time or cannot implement it at ail, due toshortage of funds or for not being able to procure funds in time, theenterprise may be said to be suffering from low liquidity.
Liquidity in general encompasses both planned liquidity and protectiveliquidity. While the former refers to the ability to raise cash as per forecastneed, the latter refers to the ability to meet any unforeseen paymentobligation.2
Protective liquidity factor is quite important in case of both privatefirm and public enterprise. It is important even for the public enterpriseswhich are essentially financially dependent on various grants, subsidies,and budgetary support. Because, the quantum of funds originallysanctioned and the funds actually released by a government for itsenterprises vary widely from time to time, The timing of fund release alsonot always correspond with the timing of cash need. Therefore, to cope

90 WD~NJOURNALOFACCOUNnNG
with such contingencies, such enterprises also should maintain a certaindegree of protective liquidity, or 'liquidity buffer' in Van Horne's terms.
One important dimension in this context is the liquidity-profitabilityinterface. In one sense, they are positively related. Healthy liquidity helpsprofitability, while profitability, i.e., capacity to generate funds from within,is no substitute for anything that can ensure a better liquidity. Again, theyare inversely related in the sense that while in many growing businesssituations, profitability curve goes up, liquidity curve goes down?
In terms of prioritisation, however, liquidity assumes greaterimportance than profitability. One established theory is that whileprofitability is the condition for the ultimate survival, liquidity is the conditionfor the immediate survival of a firm. Specifically speaking, a highlyprofitable firm may die due to lack of liquidity, while a firm can peculiarlysurvive without making profit or even by incurring losses for long.4 Thisis particularly relevant to the public enterprises where different grants,subsidies, and budgetary support often tend to replenish the fundsdepleted by operations, either under sociopolitical compulsion or as amatter of government policy.
While 'liquidity' technically refers to an enterprise's ability to raisecash when needed, liquidity management essentially implies the processthrough which an enterprise can maintain a reasonable degree of liqUidityon a continuing basis and thus can effectively synchronise its inflow andoutflow of funds.
However, while managing liquidity the basic approach of a privatefirm is understandably different from that of a public enterprise, in aprivate firm the concern for both liquidity and profitability may reasonablygo hand in hand, where a trade off between the two is said to be theideal. Hence, in a private firm, while giving prima facie emphasis onprofitability, liqUidity also gets due importance automatically. But the sameapproach cannot possibly hold good in case of a public enterprise. Asalready mentioned, pUblic enterprises are entitled to various grants,subsidies and budgetary support as a matter of government policy. Again,the public enterprises wholly owned by the government have nocommercial obligation to declare dividend, immaterial whether there isany implicit expectation or explicit guidelines for that. Moreover, it is notunusual to see that the funds provided by the government by way ofloan is subsequently declared interest-free. Besides, most of the pUblicenterprises work in a non-competitive environment. Understandably,therefore, it is difficult to conceive that such enterprises can be operatedpurely on commercial lines. Furthermore, in some public enterprisescommercial and non-commercial objectives are so inextricably mixed upthat they cannot be envisaged as commercial undertakings. Above all, agood number of State level public enterprises are established purely on

SOME THOUGHTS ON MANAGEMENT OF LIQUIDITY 91
non-commercial grounds, for the upliftment of certain backward orunderprivileged communities of the society.5
Hence, in case of a public enterprise, the primary emphasis reasonablygoes to the physical performance towards attaining the objectives forwhich it is established and a major prerequisite for achieving these physicalperformances is the maintenance of a reasonable degree of liquidity.Thus, liquidity assumes key importance here, profitability being relegatedto the secondary position. Or otherwise, it can be contended that hereprofitability gets importance primarily in the context of liquidity, recognisingthe fact that profit is the major source of fund generated from within.*
From the foregoing conceptual base and factual jUdgement, it is nowpossible to identify the major determinants of liquidity of a firm. Onlythree out of them, under suitable headings, are now in order, albeit notfollowing any linear logic. After all, managing liquidity is a labyrinthineprocess.
1. Inherent Structural Phenomena
(a) Internal Vs. External Capital, or Capital Mix, or FinancialLeverage:
Although it may be attractive to the Management from the viewpointsof profitability and growth, or to the owners desirous of 'trading on equity',a highly geared capital structure automatically assumes a great burdenof loan instalments. It certainly tends to shake the liquidity position of afirm, even if it is conceded that the burden of interest and that of dividendare mutually exclusive, the former being a statutory obligation while thelatter a commercial one.
(b) Block Capital vs. Working Capital:
From liquidity point of view, the functioning of a block capital-intensivefirm is more challenging in nature than that of a working-capital-intensivefirm. Through the process of utilising the installed capacities, gradualconversion of block capital to working capital takes place. Any departurefrom this usual course disturbs this conversion process and thus tendsto create a problem of liquidity. Hence, to ensure a smooth conversionof block capital to working capital, both proper utilisation of serviceablefixed assets and immediate diasposal of unserviceable ones areimperative.
As a sidelight, it may be mentioned that the trend of ratios of blockcapital and working capital can provide an objective indicator of the
* This secondary importance of profitability is quite exposed in the organisation cultureof the public enterprises, particularly of those in the special category status of theNorth-East India.

92 INDIAN JOURNAL OF ACCOUNTING
improving or deteriorating trend of liquidity position of a firm. It isunderstandable that the interrelationship of block capital and workingcapital is sometimes negative, sometimes positive. In some cases, aninvestment in block capital reduces the burden of working capital, e.g.,owned office bUilding vs. rented office building. Again, in some cases,an investment in block capital demands corresponding investment inworking capital, e.g., installation of one machine requires at least oneoperator. Now, in case of a firm normatively characterised by a positiveinterrelationship of its block capital and working capital, if it is observedthat the trend of block capital is upward and the working capital downward,it certainly indicates that the firm is approaching towards illiquidity. Andthis trend can well be calculated from the published accounts which aresomewhat accessible to the external analysts, at least at the office ofthe Registrar of Companies.
(c) Workfing Capital Structure, or, Composition of Working CapitalComponents:
Some working capital components are more prone to illiquidity, someare less. Performance may be made of two critical components :inventories and receivables. Ordinarily, inventories are less liquid becauseit converts into cash through receivables. Importantly, inventories aremore prone to illiquidity because of the fact that many Slow-moving andnon-moving items tend to pile up in the process of bUilding up of stores.Maybe, the procedure followed for maintaining stores is not appropriate.Maybe, some ulterior motives of the store dealing personnel creep intothe process.
Similar is the case with receivables. Ordinarily following the samecredit policy, with the increase in volume of sales the volume of receivablesalso increases and thus more and more commitment of fund to receivablesbecomes imperative. Understandably, extension of credit is the supplierfirm's choice for the benefit of the own, but any move for the withdrawalof this facility would certainly be disapproved by the customer firms.Moreover, any lax in the collection policy obviously drags the supplierfirm to a receivables trap,6 supply the second lot and get the paymentfor the first, needing thereby more and more commitment of fund toreceivables, and thus the whole process tends to make receivables lessand less liquid.
2. Operating Efficiency or Capacity to Generate Funds from Within
Capacity of a firm to generate fund from within may be analogouswith the capacity of a human body to generate blood from within. Anydebility in this area adversely affects the financial health of the firmcausing sickness of different kinds and degrees.

SOME THOUGHTS ON MANAGEMENT OF LIQUIDITY 93
A firm suffering from depletion of funds by operations for long is justlike a leukemia patient. So long as fresh blood can be injected and thebody is in a position to accept it, the patient can survive, however notbeing able to lead a normal life. Similarly, a firm incurring losses for longcan somehow survive so long as replenishment is done by injecting freshcapital. This is quite evident from the public enterprises of the specialcategory States, where routine bUdgetary support replenishes the fundsdepleted by operations.
3. Potential for Arranging Funds on Contingency Basis
"Cash Credit" arrangement with a bank is possibly the most convenientsource of finance for a firm to cope with its contingent requirements. Inthis context, therefore, the real world situation as for bank financingdeserves special mentioning.
Understandably, because of their faceless ownership, the nationalisedbanks have to depend heavily on their employees for financing the clientfirms jUdiciously. But the fact is that not all the bank personnel entrustedwith this job are well conversant with the nature of business of theapplicant firms. Consequently, while processing the application for a cashcredit limit, observance of prescribed formalities tends to become moreimportant than the assessment of actual requirement of the firm. And thisis qUite spontaneous. The very organisational set-up of the nationalisedbanks, bureaucratic or nearer to that, tends to make their employeesmore concerned about 'accountability' than 'responsibility'.*
Under the circumstances, it is not possibly illogical to think thatestablishing rapport with the bank personnel at personal level andsubmitting documents as per their requirements are more paying thanpreparing and submitting projected balance sheets and profit and lossaccounts in a realistic manner.
Now, coming to the question of identification of the problem of liquidityof a firm, it can be categorically said, may be at the risk of redundancy,that any mechanical interpretation with the help of conventional liquidityratios based on published accounts may lead to erroneous conclusion.Besides the fact that they are ordinarily susceptible to manipulation, theyear-end figures fail to represent the seasonal factors of the business ofa firm. That apart, stock clearance sale, special drive for collection ofreceivables, and the like initiatives tend to mar the year-end figures tothe representative of the actual state of affairs of a firm.
* Responsibility here refers to 'felt obligation', something internal to an individual. If onefeels responsible. he or she is responsible, otherwise not.?
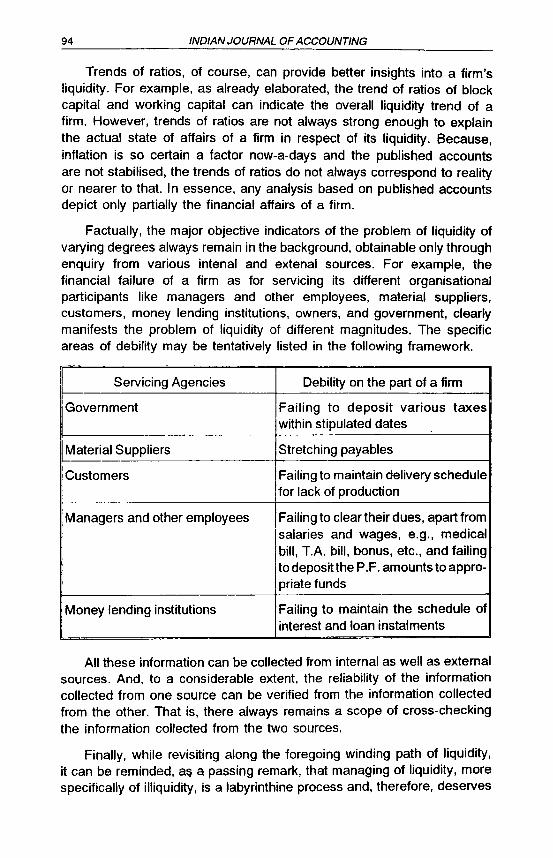
94 INDIAN JOURNAL OF ACCOUNTING
Trends of ratios, of course, can provide better insights into a firm'sliquidity. For example, as already elaborated, the trend of ratios of blockcapital and working capital can indicate the overall liqUidity trend of afirm. However, trends of ratios are not always strong enough to explainthe actual state of affairs of a firm in respect of its liqUidity. Because,inflation is so certain a factor now-a-days and the published accountsare not stabilised, the trends of ratios do not always correspond to realityor nearer to that. In essence, any analysis based on published accountsdepict only partially the financial affairs of a firm.
Factually, the major objective indicators of the problem of liquidity ofvarying degrees always remain in the background, obtainable only throughenquiry from various intenal and extenal sources. For example, thefinancial failure of a firm as for servicing its different organisationalparticipants like managers and other employees, material suppliers,customers, money lending institutions, owners, and government, clearlymanifests the problem of liquidity of different magnitUdes. The specificareas of debility may be tentatively listed in the following framework.
Servicing Agencies Debility on the part of a firm
Government Failing to deposit various taxeswithin stipUlated dates
Material Suppliers Stretching payables
Customers Failing to maintain delivery schedulefor lack of production
Managers and other employees Failing to clear their dues, apart fromsalaries and wages, e.g., medicalbill, T.A. bill, bonus, etc., and failingto deposit the P.F. amounts to appro-priate funds
Money lending institutions Failing to maintain the schedule ofinterest and loan instalments
All these information can be collected from internal as well as externalsources. And, to a considerable extent, the reliability of the informationcollected from one source can be verified from the information collectedfrom the other. That is, there always remains a scope of cross-checkingthe information collected from the two sources.
Finally, while revisiting along the foregoing winding path of liquidity,it can be reminded, a~ a passing remark, that managing of liquidity, morespecifically of illiquidity, is a labyrinthine process and, therefore, deserves

SOME THOUGHTS ON MANAGEMENT OF LIQUIDITY 95
a contingency approach. The underlying idea is that there cannot be onebest way to do anything. Everything is contingent upon the situationalfactors, internal (controllable) and external (non-controllable).
Note of References
1. Tanmoy Datta, Receivables Management-A Positive Approach (a study basedon small pharmaceutical firms of West Bengal), Nalanda PublicationsPvt. Ltd., Calcutta, 1989, p.37.
2. Laurence D. Schall and Charles W. Haley, Introduction to FinancialManagement, fata McGraw-Hili Publishing Co. Ltd., New Delhi, 1989,pp.572-73.
3. Harry B. Ernst, "New balance sheet for managing liquidity and growth",Harvard Business Review, March-April, 1984.
4. John A. Welsh and Jerry F. White," A Small business is not a little bigbusiness", Harvard Business Review, July-August, 1981.
5. T. L. Sankar, "Stray Thoughts on Public Enterprises", Course Material onFinance and Accounting, Institute of Public Enterprises, Hyderabad, p.3.
6. Tanmoy Datta, op. cit., p.149.
7. Harbert G. Hicks and C. Ray GUllett, Organisations: Theory and Behavior,McGraw-Hili International Edition, 1976, p.73.
OBITUARY
Mrs Rama Kashinath, Director (1'0&1') of The Institute of Cost and WorksAccountants of India, died on 8th November, 1995. She was a life member ofthe Indian Accounting A<;sociation.
Mrs Kashinath jpined the Institute in early 1980s and rose to the position ofDirector of Professional Development and Programme in 1994. Among her variousactivities, Mrs Kashinath successfully represented rhe Institute in manymanagement development programmes organised by the ICWAI or those organisedhy the ICWAl joinlly with other bodies like NPC, ICAI, etc. She was alsointerested in international accounting and presented papers at many internationalaccounting conferences in India and abroad. Among them the II th CAPAConference held in New Udhi in November 1982, the Sixth InternationalConference of the International A<;sociation for Accounting Education and Research(IAAER) held in Octoher 19R7 is Kyoto, .Japan, the 7th Conference of the IAAERheld in Arlington, USA, in October 1992 ilnd the World Congress of Accountantsheld in Washington, USA, in Ocloher IQQ2 arc worth mentioning. Mrs Kashinathwas also an active member of thc IAA and allended many of its national andregional conferences.
The memhers of the fAA condole the sad and sudden demise of Mrs RamaKashinath and do not find appropriate words for expressing their sympathy to themembers of the hreaved family.
Let the departed soul he rest in peace in heavenly ahove.
INTERNATIONAL CONFERENCE NEWS
Third International Accounting ConferenceJanuary 4-5, 1997
Grand Hotel, Calcutta
Invitation
The Third International Accounting Conference of the IndianAccounting Association Research Foundation will be held in Calcutta,India, in January 4-5, 1997. The main theme of the conference is"Accounting In Changing Perspectives". The conference will providean opportunity for accounting academics and practitioners to discuss andassess the developments which are taking place in various spheres ofaccounting throughout the world. To an accounting academic orpractitioner, this conference will provide an excellent opportunity to presentresearch findings or exchange views and meet academic and professionalchallenges.
Call For Papers
Major Topics of interest are:
1. Accounting in a Global Perspective
2. Government Accounting
3. Accounting for Mergers, Acquisitions and Joint Ventures
4. Emerging Trends in Accounting Research
5. Tax-Effect Accounting
6. Development of Capital Markets with special reference to India.
Presentation of papers and discussion will be held in concurrentsessions. There will be a number of plenary sessions to be chaired bydistinguished academics and practitioners. Paper presentations and paneldiscussions in any area of the above-mentioned topics are invited.
Instructions for Contributors
1. Each contributor should submit three typed, double spaced, copies ofthe full paper along with an abstract, not exceeding 200 words, inEnglish.
2. Each submission should include a separate title page on each copy,listing author(s), affiliation(s), address(es), telephone number(s), andFAX number(s). The main body of the paper, or abstract, should havea title but no author identification.
96

INTERNATIONAL CONFERENCE NEWS 97
3. All submitted papers will be subject to blind review. The submissionof a paper for review means the author certifies that the manuscript isnot copyrighted, and has not been published elsewhere. Acceptedpapers will be pUblished in the Conference Proceedings only if the.irauthors register and attend the conference.
4. All submissions must be received by August 31, 1996. Notificationabout the decision will be made by September 30, 1996.
Mail your registration of interest, paper etc. to :
Dr. J. B. SarkerDepartment of Commerce
Calcutta UniversityCalcutta-700 073
or
Dr. Bhabatosh BanerjeeVisiting Professor
Department of AccountingRutgers University, New Brunswick
New Jersey 08903, U.S.A.Fax: (908) 445-3201.
INTERNATIONAL ASSOCIATION FORACCOUNTING EDUCATION AND RESEARCH (IAAER)
Eighth International Conference on Accounting EducationThe Changing World ofAccounting: Global and Regional Issues
First AnnouncementOctober 23-25,1997, Paris (France)
The objective of the Association is to represent accounting educatorsand researchers to encourage and promote interest in all aspects ofaccounting education and research internationally, including the assistancein organizing and planning periodic international conferences onaccounting education.
The Association is both an organization of individual members fromsome thirty-five countries and a federation of academic organizationsfrom all continents.
The 8th conference on accounting education will be held jointly bythe International Association for Accounting Education and Research andthee Association Francaise de-Comptabilite. The convention will takeplace immediately before the 10th World Congress of the InternationalFederation of Accountants, October 26-29, in PARIS.

98 IND~NJOURNALOFACCOUNnNG
Previous conventions met in the United States (1962), the UnitedKingdom (1967), Australia (1972), West Germany (1977), Mexico (1982),Japan (1987), Washington DC (1992). Paris is most attractive in Octoberand still offers some of the best entertainment in the world.
* Impact of International AccountingDifferences
* Stock Markets and AccountingDiversity
* Comparative AUditing Systems
* International Financial ReportingIssues
* Accounting and the Environment
* Accounting Education inDeveloping Countries
* Accounting Education in ChangingEconomies
* Implementing AdvancedTechnologies in AccountingEducation.
* New Curricula in AccountingEducation
* Teaching Innovation in AccountingEducation
* Information Technologies inAccounting Education
Sidney Gray, PresidentUniversity of Warwick, U.K.
Belverd Needles, Secretary-TreasurerDePaul University, Chicago, IL, USA
Vice-Presidents :Bhabatosh Bane~ee
University of Calcutta, India
Alain BurlaudConservatoire National d' Arts et Metiers,France
Past Presidents
Murray WellsUniversity of Sydney, NSW, Australia
Paul GarnerUniversity of Alabama, Emeritus, USA
Adolph CoenenbergUniversity of Augsburg, Germany
Yuklo FujitaWaseda University, Japan
Roger HopkinsVictoria University of Wellington,New Zealand
Salvador Rulz-de-ChavezNational University of Mexico
The theme of the conference is "The Changing World of Accounting: Globaland Regional Issues" and deals with the following subjects:
IAAER EXECUTIVE COMMITIEE * Comparative Accounting Systems1992-97 * Managerial Accounting in
Multinational Corporations
* Cultural Influences on Accounting
* International AccountingHarmonization
CALL FOR PAPERSRULES FOR MANUSCRIPT SUBMISSION
1. Papers must be written in English.
2. Authors must list the major topic(s) under which their paper falls in theregistration of interest form.
3. Papers must not have been pubiished or accepted for publicationelsewhere.

INTERNATIONAL CONFERENCE NEWS 99
4. Each paper must contain a title with all coauthors listed and an abstract.To facilitate blind reviews do not identify authors after the cover page.
5. The abstract should be presented uniformly 81/2 x 11 for (or A4) typed,single-spaced 10 point maximum of 400 words, headed by title,author(s) and affiliation(s).
6. Paper must be typed, double spaced, Helvetica, New York, Palatinoor Times, 12-point, and between fifteen and twenty pages long.Footnotes should be stated on a separate page and be included inthe total page length indicated.
7. Margins are to be 1-1/2 inches (or 2.5-3 em.) left margin, 3/4 of an inch(or 2 em.) right margin and 1 inch (or 2.5 em) for the top and bottom.
8. Papers must be received for review by December 31, 1996. Earliersubmission is encouraged. Received papers will be acknowledged.Abstracts of paper, without the full paper, will also be considered butpriority will be given to complete papers.
9. Three copies of the papers (or abstracts) must be sUbmitted. Nosumnission by fax will be accepted.
10. Authors will be notified decision by February 28, 1997. A final versionof the accepted papers must be submitted in the specified format byMarch 31, 1997. Further instructions will be given to authors ofaccepted papers. All abstracts will be published in the proceedings.
11. At least one author of accepted papers must register for the confe~ence in order for the paper to appear in the proceedings.
Use the registration of interest form for paper submissions. Forcoauthored papers, fill in the name and address of the contact person.
All submission should be made to :
Professor Jean-Claudel ScheidINTEC-CNAM
292 rue Saint-Martin75141 PARIS CEDEX, 03, FRANCE
Fax: (33-1) 4271 6701Internet (E. mail) : burlaud@cnam. fro
REGISTRATION OF INTERESTI would like to participate in the Eighth International Conference on
Accounting Education and Research and :
Submit a paper------
Review papers------
Chair a session
Discussant in a session
Attend only

100 INDIAN JOURNAL OFACCOUNTING
It you submit a paper indicate the topic in which it will fall (see pp. 97-98for details) _
Name----------------------Address ---------------------
City-----------------------State / Province-------------------Country _
Postal Code ---------------------Telephone (with Area Code) _
Fax -------------------------E-mail-------------
Mail your Registration of Interest to:IAAER-APC Congress 1997
Professor Jean-Claude SCHEIDINTEC
292, rue Saint-Martin75141 PARIS, CEDEX 03
Fax: (33-1) 42716701Internet (E-mail):[email protected]
INTERNATIONAL ACCOUNTING RESEARCH:MULTINATIONAL ENTERPRISES AND GLOBAL CHANGE
24th·25th May 1996
Warwick Business School,University of Warwick, England
Conference Theme
International Disclosure Issues : Cultural Perspectives, VoluntaryDisclosures by Multinationals, Segment Reporting, EnvironmentalDisclosures and Social Reporting.
Managerial Accounting by MUltinationals : Cultural Perspectives,Strategic Accounting, Design of Planning and Control Systems,Performance Measurement Issues.
International Financial Statement Analysis : Problems ofAccounting Diversity. Impact of Accounting Differences on ReportedResults, Stock Market Responses in a Multi-reporting Context, ForeignStock Exchange Listing Behaviour.

INTERNATIONAL CONFERENCE NEWS 101
Multinational Reporting Problems : Foreign Currency Translation,Consolidation, Goodwill, Intangibles, Financial Instruments.
International Accounting Harmonisation & Regulation Issues :Harmonisation Measurement Issues, Impact of IASC on Multinationals,Global Stock Exchange Co-ordination & IOSCO.
Issues relating to Multi-national Enterprises in a rapidly changingglobal business and Financial environment.
Submission date: Deadline for submission of completed papers is31 st December 1995. Notification of the papers selected for theConference will be given at the end of February 1996. The authors ofaccepted papers will have their registration fee and accommodation costsmet by the Conference Sponsors. Papers selected for the Conferencewill also have the opportunity to be considered for Fast-track publicationin the Journal of International Financial Management and Accounting(JIFMA). papers - 3 copies - (and also early indications of interest,including offers to participate as a discussant or session chair), should besent to :
Professor Sidney GrayIAAER Research Conference Organiser
Warwick Business SchoolUniversity of Warwick
Coventry CV4 7ALEngland
Telephone: 44-(0)1203-524580Fax: 44-(0)1203-524628
This special International Accounting Research Conference is cosponsored by the following Member Associations of IAAER : AmericanAccounting Association, Australian Society of Certified PractisingAccountants, Certified General Accountants Association of Canada,Institute of Chartered Accountants in England & Wales, JapanAccounting Association.
EIGHTH ASIAN-PACIFIC CONFERENCEON INTERNATIONAL ACCOUNTING ISSUES
October 13-16, 1996Vancouver, Canada
The Eighth Asian Pacific Conference on International AccountingIssues will be held on October 13-16, 1996, in Vancouver, Canada. Themain theme of the conference is "Capital Market Developments and theRole of Accounting." The conference will provide an important forum forthe interaction of differ,ent ideas and information between academicians
102 IND~NJOURNALOFACCOUNnNG
and practitioners, in order to enhance the understanding of internationalaccounting issues in various Asian-pacific countries.
Conference Registration Fee : Registration fees of US $250 perdelegate covers a reception, 2 breakfasts, 2 luncheons, 1 dinner (Banquetand Entertainment), a copy of the proceedings and a one-day tour.
Best Paper Award : The best four papers will each be awarded US$500, to be selected by a panel of distinguished reviewers.
Conference Hotel: The conference will be held at the Westin BayshoreHotel, a five-star hotel in Vancouver. Rate for Single/Double occupancyis C$125 per night.
Deadline for paper submission : All submissions must be receivedby May 15, 1996. Notification about the decision will be made by June30, 1996.
Mail all papers. panel discussion, and workshop proposals to :
Professor Ali Peyvandi or Professor Benjamin TaiAsian-Pacific Conference on International Accounting Issues
The Sig Craig School of BusinessCalifornia State University-Fresno
5245 North Backer AvenueFresno, California 93740-0007. USA
Fax: (209) 278-7336E-mail: ali peyvandi @csu fresno.edu or
benjamin tai @csu fresno.edu
IAA BRANCH NEWS
VARANASIBRANCH
The Varanasi Branch of the Indian Accounting Association has beenrevived. Following members have been unanimously elected to theExecutive Committee of the Branch for 1995-96.
(1) Prof. S. N. Mehrotra. .. .. PresidentEx-Head & Dean,Faculty of Commerce. B.H.U.
(2) Dr. Rajendra Kumar Sah. Vice-PresidentNational Winders. Varanasi.
(3) Prof. M. N. Mishra, Vice-PresidentEx-Head & Dean, Faculty of Commerce, B.H.U.
fAA BRANCH NEWS
(4) Dr. M. B. Shukla,Mahatma Gandhi Kashi Vidyapath,Varanasi
(5) Dr. B. D. Gujrati
(6) Prof. H. S. Kulshrestha
(7) Dr. Vinay Kumar
(8) Shri Mukul Sah
(9) Dr. A. R. Tripathi
(10) Dr. S.K. Varma
103
Secretary-cumTreasurer
Member
Member
Member
Member
Member
Member
The Local Branch has been quite active after the revival. It organiseda Seminar on Social Audit on 18th May, 1995 in the Faculty of Commerce&Management Studies, Mahatma Gandhi Kashi Vidyapith, Varanasi. Prof.S. N. Mehrotra was the Chief Speaker. Prof. H. S. Kulshrestha, Dr. B.D. Gujrati, Dr. S. K. Varma, and many other delegates have participatedin the discussion. Prof. R. C. Sharma, Head & Dean of the faculty,presided.
A lecture on "Tax Reforms in Indirect Taxes" by Sri B. P. SrivastavaCommissioner, Custom and Central Excise, New Delhi, Government ofIndia, was jointly organised by I.A.A., Varanasi Branch and VaranasiBranch of C.I.R.C. of Institute of Chartered Accountants of India, atParadkar Bhawan, Varanasi on 7th October, 1995. Prof. S. N. Mehrotrapresided and Sri B. D. Gujarati introduced the Speaker and the ChiefGuest Sri T. R. Tamta, Commissioner of Income Tax (Appeals). Prof. H.S. Kulshrestha, Dr. S. K. Varma, Prof. R. C. Sharma, Dr. K. M. Pandeyand many other members participated.
The above functions were conducted by Dr. M. B. Shukla, Secretaryof I.A.A., Varanasi Branch.
GOA BRANCH
The members of IAA in and around Goa have formed IAA Goa Branchwhich will be operated at the Department of Commerce, Goa University,Goa-403 203. The following members have been elected to the BranchExecutive:
President
Vice-President
Dr. M. Modassir,Managing Director of GODIDC;
Shri !.M.D' Souza,Pra.ctising Company Secretary;

104 WD~NJOURNALOFACCOUNnNG
Secretary & Treasurer
Member
Member
Member
Member
Dr. B. Ramesh, Goa University
Dr. B. Ramkotaiah
Mr. Savari Muthu
Dr. C. N. Sontakki
Dr. J. P. Pathak
Member Mrs. Purva Hedge Desai
Prof. D. Prabhakara Rao, the General Secretary of IAA presentedthe profile of IAA at the formal inauguration of Goa Branch on 28thOctober 1995 by Shri Louzinho Faleiro, the Minister of Industry, Labourand Employment, Dept. of Goa. In this context, a One-Day Seminar onFinancial Services Industry in India was organised by Goa University.Thoughtful papers on Financial Services were presented by Mr. R.Hariharan of CRB Capitals Ltd.; Prof. D. Prabhakara Rao of AndhraUniversity: Prof. G. C. Maheswari of M. S. University of Baroda; Mr. R.D. Kamat of ACGL, and Mr. Suresh Rao of Goa. Lively discussion tookplace after the presentations.
OTHER BRANCHES
Prof. A.R.M.REHMAN, Head, Dept of Commerce, Dibrugarh University(Assam) and other members in around Dibrugarh University, have formedIAA Dibrugarh Branch to be operated from the Department of Commerce,Dibrugarh University, Dibrugarh (Assam).
Prof. Sujit Sikidar and other members in around Gauhati Universityhave formed IAA Gauhati Branch to be operated from the Dept. ofCommerce, Gauhati University, Gauhati (Assam).
Prof. Vinayaham, Head, Madras University's P.G. Extn. Dept ofCommerce at Salem and other members in around Madras University,have formed IAA branch to be operated from Salem (Tamil Nadu).
INDIAN ACCOUNTING ASSOCIATIONCALCUTTA BRANCH NEWS
Indian Accounting Association, Calcutta Branch, held its AnnualGeneral Meeting on 4 November 1995 at the Management House, Instituteof Social Welfare and Business Management. College Square, West.
The meeting was preceded by a seminar in which Mr. A. Bose,Vice-President, Finance and Accounts, Haldia Petro-Chemical Ltd.,

fAA BRANCH NEWS 105
Calcutta. presented a paper on 'Globalisation of the Indian Capital Market: the Accountant'.
Dr. J.B. Sarker, Secretary, IAA. welcomed the members, invitees andthe participants. Prof. S. Bhattacharya, Chairman of the Calcutta Branch,IAA presided over the seminar.
Mr. A. Bose in his paper dealt at length with the impact of globalisation-both short-term and long-term-on the Indian Capital Market. He alsopointed out the orientation that will have to be given in the accountingpractices to accommodate those changes. He concluded the paper bypointing out the present gaps in the reporting practices of the corporatesector in India vis-a-vis the same in the developing countries.
After the presentation of the paper, a lively dicusson ensued. Prof.P. Chattopadhyay, Dr. BK Chatterjee, Dr. T.S. Roy, Shri ManipadmaDutta, Dr. J.B. Sarker & Prof. S. Dhar sought clarification on some issuesraised by Mr. Bose in his paper.
The seminar ended with a vote of thanks by Prof. I.K. Chatterjee,Vice-Chairman of the Branch.
Needless to say, the seminar was lively and it was largely attendedby the members and the invitees.

OverACenfury
ofExcellence
n&. Garden Reach Shipbuilders~ &Engineers UtI.
43/46. Garden Reach Road. Ca!cur.: 700 024
• SHIPBUllOfNG • SHIPREPAIR • SHIPOECK MACHINERY• PORTABLE STEEl BRIDGE. TURBINE PUMP. DIESEL &CAS ENGINES
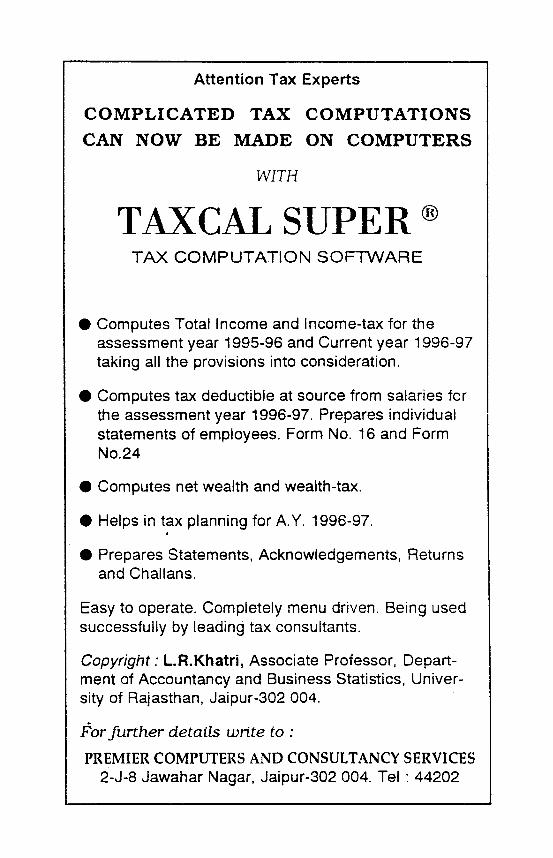
Attention Tax Experts
COMPLICATED TAX COMPUTATIONS
CAN NOW BE MADE ON COMPUTERS
WITH
TAXCAL SUPER ®
TAX COMPUTATION SOFTWARE
• Computes Total Income and Income-tax for theassessment year 1995-96 and Current year 1996'-97taking all the provisions into consideration.
• Computes tax deductible at source from salaries forthe assessment year 1996-97. Prepares individualstatements of employees. Form No. 16 and FormNO.24
• Computes net wealth and wealth-tax.
• Helps in tax planning for A. Y. 1996-97.
• Prepares Statements, Acknowledgements, Returnsand Challans.
Easy to operate. Completely menu driven. Being usedsuccessfully by leading tax consultants.
Copyright: L.R.Khatri, Associate Professor, Department of Accountancy and Business Statistics, University of Rajasthan, Jaipur-302 004.
For further details write to :
PREMIER COMPUTERS AND CONSULTANCY SERVICES2-J-8 Jawahar Nagar, Jaipur-302 004. Tel: 44202
THE INDIAN ACCOUNTING ASSOCIATION
The Indian Accounting Association is an organisation of persons willingto assist in the advancement of accounting education and research. Theregistered office of the Association ilS at the College of Commerce andManagement Studies, M. L. Sukhadia University, Udaipur-313001, India.Membership of the Association is open to academics and professionalswho are willing to assist in achieving the objectives of the Association.
The membership fees for individuals are as under:
India
Life Rs. 750Annual Rs. 100
Abroad
US $ 100$ 25
Members are emit led to participate in the activities of the Associationand receive a free co;;y of the Indian Journal of Accounting and selectedresearch publications.
INDIAN JOURNAL OF ACCOUNTING
Indian Journal of Accounting is an official publication of the IndianAccounting Association. It is published twice a year, in June andDecember respectively.
The subscription rates are :
Individual India Abroad
AnnualLife
Institutional
AnnualPermanent
(Rs.)100750
5001,500
(US $)
25100
100250
Other particulars of the Journal are:
TECHNICAL
Periodicity : Bi-annual Overall size : 24i cmx 16 cm.
Language : English Printed area: 20 cm. x 11! em.Manuscripts (in duplicate and neatly typed in double space) for
publication in the Indian Journal of Accounting should be sent to theProf. Bhabatosh Banerjee, Chief Editor, Indian Journal of Accounting.164/78, lake Gardens, Flat-CO, Cal-700 045. Each submission shallinclude 8 separate title page listing full particular(s) of the contributor(s).Thereshall not be any author(s) identification in the paper in order tofacilitate blind review. Referpnce books and research publications forreview (two copies of each title) should also be sent to the Chief Editor.

STATEMENT OF OWNERSHIP AND OTHERPARTICULARS OF JOURNAL
Printer's NameNationalityAddress
Place of PublicationPeriodicity of PublicationPublisher's NameNationalityAddress
Chief Editor's NemeNatioAalityAddress
Dr. D. Prabhakara RaoIndianDept. of Commerce &Management StudiesAndhra UniversityVisakhapatnam-530 003
CalcuttaHalf.yearlyDr. D. Prabhakara RaoIndianDept. of Commerce &Management StudiesAndhra UniversityVisakhapatnam-530 003
r Dr. Bhabatosh BanerjeeIndianCollege of Business StudiesUniversity of CalcuttaCalcutta-700 073
Indian Accounting AssociationAndhra UniversityVisakhapatnam-530 003
Name end address of individualswho own the newspaper andpartners or shareholder. holdingmore than one per cent of thetotal capital.
I, Dr. D. Prabhakara Rao, hereby declare that the particulars givenebove are true to the best of my knowledge and belief.
(Sd1-) Dr. D. Prabhakara RaoSignature of Publisher
Printed in India by Dr. D. Prabhakara Rao at Ajanta Printers, 7B, SitaramGhosh Street, Calcutta-700 009 (Ph. 241-4249/241-3969) and published
by him on behalf of the Indian Accounting Association,Visakhapatnam-530 003, India.