De-Hubbing cases and recovery patterns
28
UNIVERSITA’ DEGLI STUDI DI BERGAMO DIPARTIMENTO DI INGEGNERIA GESTIONALE QUADERNI DEL DIPARTIMENTO † Department of Economics and Technology Management Working Paper n. 08 – 2010 De-hubbing cases and recovery patterns by Renato Redondi, Paolo Malighetti, Stefano Paleari † Il Dipartimento ottempera agli obblighi previsti dall’art. 1 del D.L.L. 31.8.1945, n. 660 e successive modificazioni.
Transcript of De-Hubbing cases and recovery patterns

UNIVERSITA’ DEGLI STUDI DI BERGAMO DIPARTIMENTO DI INGEGNERIA GESTIONALE
QUADERNI DEL DIPARTIMENTO†
Department of Economics and Technology Management
Working Paper
n. 08 – 2010
De-hubbing cases and recovery patterns
by
Renato Redondi, Paolo Malighetti, Stefano Paleari
† Il Dipartimento ottempera agli obblighi previsti dall’art. 1 del D.L.L. 31.8.1945, n. 660 e successive modificazioni.

COMITATO DI REDAZIONE§ Lucio Cassia, Gianmaria Martini, Stefano Paleari, Andrea Salanti
§ L’accesso alla Collana dei Quaderni del Dipartimento di Ingegneria Gestionale è approvato dal Comitato di Redazione. I Working Papers della Collana costituiscono un servizio atto a fornire la tempestiva divulgazione dei risultati dell’attività di ricerca, siano essi in forma provvisoria o definitiva.

De-Hubbing cases and recovery patterns
Renato Redondia, Paolo Malighettib, Stefano Palearic
a Associate Professor, University of Brescia, Dept of Mechanical Engineering, Viale Branze 38, 25123 Brescia, Italy Phone (+39) 030 3715645 Fax (+39) 02 700529452 E-mail: [email protected] b Researcher, University of Bergamo, Dept of Economics and Technology Management, Viale G. Marconi 5, 24044 Dalmine (BG), Italy Phone (+39) 035 2052023 Fax (+39) 035 562779 E-mail: [email protected] c Professor, University of Bergamo, Dept of Economics and Technology Management, Scientific Director of ICCSAI. Viale G. Marconi 5, 24044 Dalmine (BG), Italy Phone (+39) 035 2052340 Fax (+39) 035 562779 E-mail: [email protected]
ABSTRACT
The objective of this work is to analyze the cases of de-hubbing during period 1997-2009 in the world-wide air transport network. To the best of our knowledge, this is the first attempt to study de-hubbing in a systematic way. In order to identify those cases, this paper firstly addresses the issue of which quantitative conditions must be met for airports to be identified as de-hubbing cases. These conditions include the declining presence of the hub carrier, or hub alliance, within the airport, that results in a decrease in the number and quality of connections offered. The second phase is to study what happens after de-hubbing by clustering the cases into homogenous scenarios. Our results show that, on average, airports that suffered de-hubbing did not recover their original traffic in 5 years. Results suggest that de-hubbing is not likely to be reversible. When hub carriers are replaced at least partially by low-cost carriers, the airports on average show faster recovery trends. The most frequent case is when, after de-hubbing, the airports traffic declines. The impact of de-hubbing on the number of destinations is less severe than its effect on offered seats.
KEYWORDS: de-hubbing, recovery scenarios, airport network.

2
1. Introduction
On March 31, 2008 Alitalia abandons the Malpensa airport, by cutting 180 flights a day and
moving 14 intercontinental routes to the Rome Fiumicino airport. That is an example of the
numerous recent cases in which the dominating carrier dismantles its hub-activities in one of
its main bases.
A hub is an airport where traffic is concentrated in order to foster connections typically to
intercontinental long-haul destinations. To do this requires the presence of the feeding
network, a series of medium-and short-haul connections that are concentrated in specific
times and temporally coordinated with intercontinental flights. A hub is not simply a big
airport, but an airport that can generate a high number of transit passengers. Due to the
presence of transit passengers, in addition to origin passengers, the hub airline has a sufficient
traffic volume to offer more routes and frequencies to long-haul destinations, compared to
those that would have been provided based only on the origination traffic.
The partial or complete abandonment of a hub by the dominant carrier is known in literature
under the term "de-hubbing" (Bhadra, 2009, Shaw and Ivy, 1994). It refers to the process of
dismantling the structure of connections offered by the hub airline that could result in its
complete withdrawal from the airport.
What are the development scenarios for an airport which suffered de-hubbing? Is it likely to
be “re-hubbed” by the same carrier or other carriers? What strategies are necessary to prevent
decline? The study of international cases can provide some guidance to answer these
questions.
To the best of our knowledge this is the first attempt to study de-hubbing in a systematic and
quantitative way.
The literature section introduces several well-known examples of de-hubbing highlighting
their causes and direct effects. The methodology and data section analyzes the quantitative
conditions to be met for a de-hubbing to take place. We apply those conditions to all airports
with scheduled services operating world-wide in the period 1997-2009. The empirical results
section examines the possible developments from de-hubbing paying particular attention to

3
the implications for airports and passengers. The concluding section summarizes the main
findings of the paper and discusses the directions for future research.
2. Literature Review
Hubbing activities have seen a big increase from the liberalization of the U.S. market in 1978,
when large U.S. companies began to restructure their networks by adopting hub & spoke
configurations (Morrison and Winston 1986). The advantages associated with such a
configuration result from the presence of economies of density (Tretheway and Oum 1992)
and in some cases economies of scale, although on the latter literature has produced only
minor evidences (Antoniou, 1991). Hub & Spoke configurations allow hub carriers to offer a
not-easily replicable service giving rise to positions of dominance (Borenstein, 1989).
The most natural cause of de-hubbing is the failure of the hub carrier. An example is the
airport of Raleigh-Durham after the failure of Midway or the Brussels airport following the
bankruptcy of Sabena. Zurich also suffered from the failure of Swissair and the subsequent
formation of a new carrier, Swiss, although in this case there was only a partial dismantling of
the hub & spoke system, supported by Swissair’s partners.
In other cases, de-hubbing follows the strategic choice of hub carriers to reducing their
presence, and often completely abandoning the airport. Among their motivations there are the
performances and strategic objectives of the airport operators. When several airports could be
employed as available alternatives, as in the case of US or EU, the type of services offered by
the airport together with the related charges may influence the choice of carriers to locate their
hub activities.
In this respect we classify the case of Denver, where in 1994 following the closure of the old
airport and contextual opening of the new International airport, the incumbent carrier
Continental decided to abandon its hub activities. In this case there was an evident mismatch
between the interests and the strategic visions of the airport and the hub carrier. Szyliowlcz
and Goetz (1995) showed that in a project of this magnitude airport and carrier are deeply
involved and other factors, not least political motivations, play a determinant role.

4
Low cost carriers also play a prominent role to induce hub carriers to rationalize their multi-
hubs networks, especially in contexts of recession. Berry and Jia (2008) identify in the
entrance of low-cost carriers, the main element to induce changes in the US network,
including the abandonment or partial withdrawal of the incumbent carrier in some hubs. This
is the case of the airport in Baltimore, which was subjected to the so-called "Southwest effect"
described by Vowles (2001).
The rationalization of the network in multi-hubs systems typically occurs as a result of
mergers and acquisitions activities or as an effect of economic recession. Both these
phenomena, often together, affect the balance between carriers by promoting the development
of alliances and opening up new strategic options. In the case of Nashville (Johansson, 2007)
following the bankruptcy of Eastern Airlines in 1995, American Airlines decided to enter the
market to Latin America moving to Miami and thereby reducing hub activities at Nashville
and Raleigh-Durham. In the case of San Jose, hubbing activities started by American Airlines
after the acquisition of Air California, were then partially sold to Reno Air.
The liberalization process in Europe has also changed airline competition and network
structure. Thompson (2002) and Dennis (2005) pointed out that the role of the secondary hub
of Clermont-Ferrand failed within the new Air France network, because of its overlapping
with Lyon.
Similarly, in the case of Barcelona (Burghouwt, 2008), the limited success of the hub
structure is due to the failure to define a specific role for this airport within the Iberia network,
and avoid duplications with Madrid.
Secondary hubs are more vulnerable than primarily hubs in times of recession. Financial
problems may trigger a process of consolidation and contraction of existing networks. The de-
hubbing of Cincinnati to favour Atlanta, following the merger between Delta and Northwest
is an emblematic example. British Airways formerly decided to develop Gatwick to overcome
the growth limitations imposed by congestion at Heathrow. However, this choice did not
prove profitable, so that in 2000 the airline reduced its network in Gatwick and refocused on
Heathrow (Halstead, 2001). Basel also suffered the dismantling of hub activities following the
bankruptcy of Swissair (Dennis 2005). In this case the newly-born Swiss airline did not
replace them.

5
<Table 1 about here>
Network restructuring has accelerated due to the aggregation process in the three major global
alliances (Oneworld, Star, Skyteam). Dennis (2005) linked the main reasons for de-hubbing in
Europe to the carriers’ new role within alliances. However, studies in the literature do not
clarify whether the ongoing consolidation will lead to a greater concentration of traffic on a
few major hubs (Dudden, 2006) or whether the current network configurations are to remain.
The recent case of the Malpensa de-hubbing highlights the joint presence of several
motivations discussed above. There is no doubt that the “Malpensa 2000” project was mainly
driven by political motivations. Little thought was given at the time to the economic
rationales for establishing a dual-hub system in Italy, or to the new role of the other Milan-
based airport of Linate.
The prolonged financial difficulties of Alitalia and the gradual contraction of its network is
the second factor that led in time to the unsustainability of a dual-hub system. Finally, in the
light of the Alitalia’ role within SkyTeam, the Malpensa proximity to the main hubs of Paris
and Amsterdam further diminished the functionality of a hub located in northern Italy.
Table 1 summarizes the cases of de-hubbing considered by literature and their main
references. This paper does not limit the analysis to those famous cases but, by considering
quantitative criteria, takes into account also less known instances of de-hubbing and their
effects on airport traffic.
3. Methodology and data
The main issue of this work is how to measure hub activities in airports. Since a hub is an
airport that generates a high proportion of transit passengers, the volume of transit passengers
itself could be employed to measure the extent of hub activities. However, there are certain
drawbacks to this natural measure. The most relevant is about data availability. The volume of
transit passengers is generally known only for major hubs. Then, even for those airports it is
rarely possible to recover that information before the year 2000 and almost impossible to have
monthly statistics. So, basing the analysis on the volume of transit passengers would have
resulted in seriously limiting the study to major airports and for the recent years.

6
We decided to consider instead a supply-based measure of hubbing activities taken from
literature on connectivity of air transport networks. See Burghouwt and Redondi (2010) for a
review of the different measures in this field. They also show that traditional size-based
measures as the number of passengers, number of flights or number of destinations, tend to
overestimate the importance of airports as connecting hubs. Based on scheduled information,
our measure is simply the number of “viable” connections between incoming and outgoing
flights happening in a given airport. We considered three conditions for a connection to be
considered as “viable”:
• the connection must be between flights of the same carriers (online transfers) or
between flights operated by different carriers belonging to the same alliance (interline-
transfers).
• the time between the incoming and the outgoing flights must be between one hour
(minimum connecting time) and three hours (maximum connecting time);
• the routing factor of the one-stop itinerary starting from the origin of the incoming
flight, passing by the considered airport and arriving to the destination of the outgoing
flight, must be less than or equal to 1.2. So, the detour necessary to complete the trip
must be at maximum 20% of the direct distance between origin and destination.
The last two conditions discriminate the quality of connections, by considering only those that
have a high probability to be employed by transit passengers. Since Burghouwt and Redondi
(2010) show that the different connectivity measures yield similar results at an aggregate level
and for longitudinal studies aimed to show how connectivity of a single airport changes over
time, we deem further complications in the connectivity index unnecessary.
For each airport with scheduled flights and for each month in the period January 1997-
September 2009, we compute this connectivity index. Since it requires actual connections in a
specific day, we analyze every third Wednesday in each month of the period. Our sample
covers all 2.141 airports worldwide with at least a viable connection during the period. We
employ OAG scheduled flights data.
<Figure 1 about here>

7
Figure 1 shows the overall number of viable connections in the analyzed period. There are a
few features worth of evidence. Starting from 1997 the number of connections, a proxy for
hub activities, steadily increased till September 2001 when it dropped significantly. After that,
it recovered in 2002-2004 and has ranged between 400,000 and little above 500,000 since.
The average number of connections decreased in late 2008 and 2009 due to economic
recession. One would also observe a marked seasonal effect, since May, June and July are by
far the most relevant months in terms of number of offered connections.
<Table 2 about here>
Table 2 shows the first twenty airports in the world in terms of the number of viable
connections, as defined above, computed for the last period of the analysis, on Wednesday
16th September, 2009. The first five in the ranking are US airports, confirming the importance
of hub activities especially for the US domestic market. The Atlanta airport has the highest
number of viable of connections by far. By this measure, the main European airports are
Frankfurt, Paris Charles De Gaulle, Munich and London Heathrow with more than 8,000
viable connections per day.
After having defined the measure of hub activities, we now address the issue of de-hubbing
identification. As the monthly number of connections is subjected to yearly seasonal trends as
well as longer-term variations, we proceeded to de-season it in two steps.
Firstly, we de-season the monthly number of connections on an airport-base. So, for each
airport, we smooth intra-year effects that could result in sharp decreases in monthly hub
activities not induced by a de-hubbing process.
Secondly, we de-trend the number of connections from the overall longer-term variation. As
the number of connections decreased sharply in September 2001, that could result in
identifying a great number of (false) de-hubbing cases. After de-trending on the overall
sample, de-hubbing is potentially identified for airports whose number of connections
decreases significantly more than the average. The number of connections resulting from
these modifications is referred to as the adjusted number of connections.
The conditions to be met for de-hubbing identification are as follows:

8
• we look for two successive months t1 and t2, t1<t2, where the adjusted number of
connections decreases by at least 75%. We do not further constraint the de-hubbing
period, t2-t1. By doing so we take into account both the cases of sudden de-hubbing, when
the hub-carrier sharply decreases its hub activities, and gradual de-hubbing, when the hub
carrier slowly but steadily reduced its hub activities from the airport.
• We also consider a dimensional constraint. We include de-hubbing when the initial
adjusted number of connections, measured in t1, is higher than 150 connections per day.
This is to exclude smaller airports that are not to be considered as hubs in the first place.
With no dimensional constraint, an airport with 4 daily flights in t1, 2 incoming and 2
outgoing, and only 2 flights in t2 could reduce its number of connections by 75% from 4 to
1 and so be included in the de-hubbing case. The limit of 150 connections, meaning that
the airport offers connections between on average 12-13 incoming and outgoing flights
per day, is set to a relatively low level, also accounting for de-hubbing in secondary
airports. We find 123 airports in the initial month, January 1997, which satisfy this
constraint. This number increases to 154 in the final month of our analysis, September
2009. There are also 90 airports with an adjusted number of connections higher than 150
for all the months in the period.
• The airport continues some of its scheduled services after de-hubbing. This condition is to
exclude from de-hubbing cases in which old airports were closed and replaced by new
ones.
4. The de-hubbing cases
By applying those conditions reported in the methodology section, we obtain 37 different
cases of de-hubbing. Table 3 shows a geographical distribution of de-hubbing among the
main areas. As expected, Europe and North America have the greatest number of cases,
closely followed by Central-South America and Asia-Pacific region.
<Table 3 about here>
<Figure 2 about here>

9
Figure 2 reports the temporal distribution of de-hubbing cases. As seen above, each de-
hubbing is identified within a period from t1 to t2. In this figure we classify a de-hubbing to
the month t3, included in the interval [t1, t2], where the decrease in the adjusted number of
connections is higher.
From Figure 2 one would observe that the greater number of de-hubbing cases happened in
the immediate aftermath of September 11th, 2001. The second wave of de-hubbing happened
in the second half of 2003, after the spreading of SARS. So, crises in the air transport industry
could trigger de-hubbing processes either directly by the bankruptcy of the hub carriers or
indirectly by their decision to restructure their network.
<Table 4 about here>
Table 4 reports the major ten de-hubbing cases in terms of the adjusted number of
connections just before de-hubbing. The most relevant and much studied de-hubbing cases
happened in the US airports of Cincinnati, Pittsburgh and Lambert-St. Luis. There are then
the three European cases of Milan Malpensa, Brussels and London Gatwick of which we
already referred in the literature section. The Ronald Reagan National airport suffered
temporal de-hubbing after September 11th, 2001, due to security restrictions imposed on air
traffic in the Washington area. The Luis Munoz Marin airport suffered de-hubbing by
American Airlines in September 2008, when the carrier truncated flights by over 50 percent.
In the case of the Orlando International airport, Delta Air Lines pulled gradually much of its
large aircraft operations from Orlando and ended all services in September 30, 2008. The
tenth case is that of the Kimpo International airport that was the main airport for Seoul and
South Korea before its international activities were moved to the Incheon International
Airport in 2001. A similar case is that of the second Milan-based airport of Linate, also
identified as a de-hubbing case in our analysis. In the end of 1998 the bulk of its international
activities by Alitalia were moved to the newly restructured airport of Malpensa. Both the
cases could be considered as de-hubbing following network restructuring in which political
motivations played a relevant role. However, both airports continued their services, even if
mainly at a national level, and no other carrier has so far replaced hub activities. So, we

10
decided not to exclude these cases from our analysis. A complete list of the 37 de-hubbing
cases is reported in Appendix1.
5. De-hubbing effects and recovery patterns
We study the effects of de-hubbing on the airports offered seats. We compare seats offered
the year before de-hubbing to those offered from 1 to 5 years after de-hubbing. Figure 3
shows average traffic variations for all 37 airports which suffered by-hubbing. On average,
offered seats decrease by 19.1% one year after de-hubbing compared with the pre-de-hubbing
year. Offered seats continue to decline also in the second year by 23.6%, compared to the year
before de-hubbing. A slow-recovery trend starts from the third year after de-hubbing.
However, after 5 years, offered seats are still below the pre-de-hubbing mark by 17.5%. One
would observe that offered seats decline much less than the adjusted number of connections.
In fact, to be considered as de-hubbing, the airport must see a reduction of at least 75% in
terms of the adjusted number of connections. On the one hand, it confirms that hubbing
activities cannot be approximated to size-related measures since the former has a square effect
with respect to offered flights that the latter lacks. On the other hand, it validates the use of
the adjusted number of offered connections as a supply-based proxy for hub activities.
Figure 3 also reports changes in offered seats for airports comparable to those which suffered
de-hubbing. To be comparable, an airport has to have a size, in terms of offered seats, within
10% of the de-hubbed airport and has to operate in the same geographical region.
<Figure 3 about here>
Interestingly, the year after de-hubbing, offered seats in comparable airports remain almost
unchanged (+0.1%), confirming that de-hubbing happens on average in periods of slow-
growth or decline of the air transport industry. However, in five years comparable airports see
offered seats increasing by 16.2%, against a decline by 17.5% in airports which suffered de-
hubbing.
1 Further information on the specific de‐hubbing cases indentified in this study is available from the authors on request.

11
In order to identify the specific recovery patters after de-hubbing, we classify each of the 37
cases by the following two criteria:
1 if the adjusted number of connections after de-hubbing recovered its initial value in time, the case is classified as “re-hubbing”;
2 we consider offered seats after 5 years from de-hubbing. If de-hubbing took place less than 5 years before September 2009, we consider offered seats in September 2009.
o If more than 50% of seats is then offered by an Alliance, we classify the case as “Alliance-dominated”;
o If more than 50% of seats is then offered by low cost carriers, we classify the case as “Low cost-dominated”;
o If more than 50% of seats is then offered by unallied carriers, we classify the case as “Unallied-dominated”;
o or else, we classify the case as “Battleground”.
The “Battleground” category includes airports whose offered seats are strongly divided into
the first three groups with no clear dominant positions.
Table 5 reports the changes in offered seats after de-hubbing dividing the cases into the
categories above defined.
<Table 5 about here>
A number of interesting observations can be drawn. First of all, we indentified only 3 cases in
which the adjusted number of connections recovered in time its value before de-hubbing (re-
hubbing scenario). Those airports almost recovered their initial seats capacity. In the fifth year
after de-hubbing they offer a number of seats below the level before de-hubbing by 3.9%,
against -17.5% for all 37 cases and -20.4% for the other 34 where de-hubbing was not
reversed.
There are no re-hubbing cases where the airport is dominated by low cost carrier (Low cost-
dominated) or contended by different groups of carriers (battleground scenario). So, some
forms of dominance by traditional carriers seem necessary for re-hubbing to take place.
Looking at the 34 cases in which de-hubbing did not reverse, one would observe very
different recovery patterns. In the Low cost-dominated scenario, the initial offered seats
volume is recovered in five years with offered seats above their initial mark by 12.8%.
12
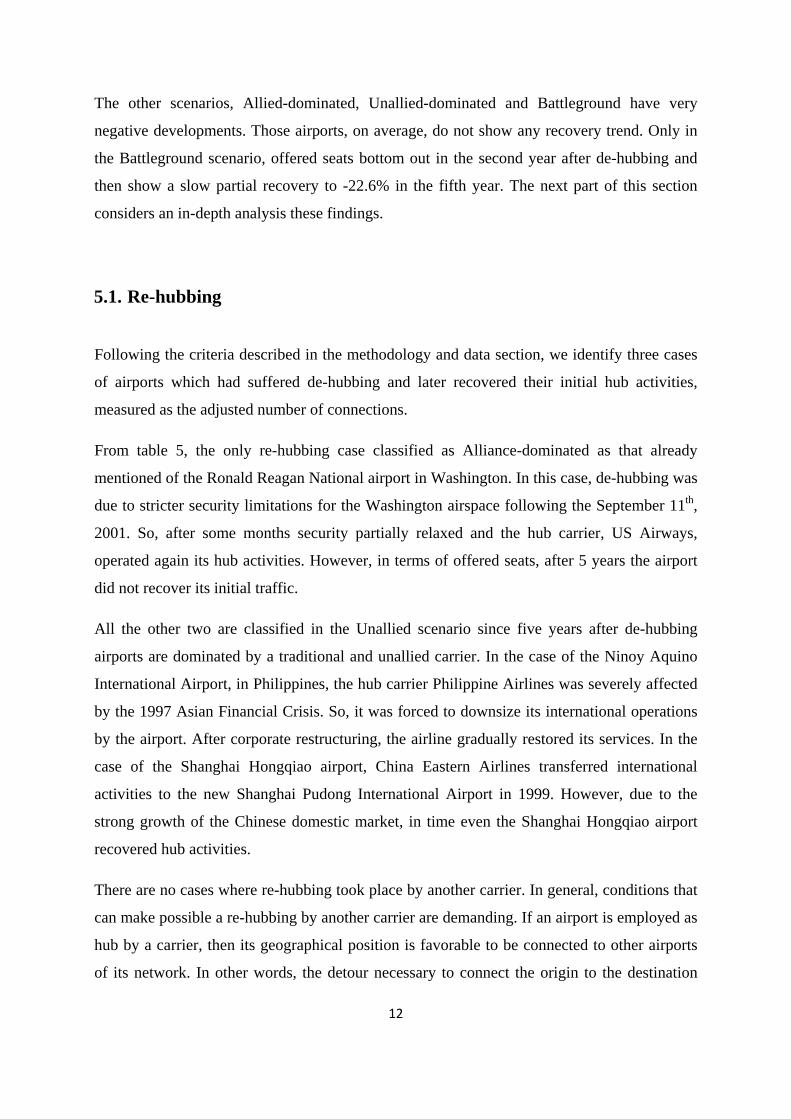
The other scenarios, Allied-dominated, Unallied-dominated and Battleground have very
negative developments. Those airports, on average, do not show any recovery trend. Only in
the Battleground scenario, offered seats bottom out in the second year after de-hubbing and
then show a slow partial recovery to -22.6% in the fifth year. The next part of this section
considers an in-depth analysis these findings.
5.1. Re-hubbing
Following the criteria described in the methodology and data section, we identify three cases
of airports which had suffered de-hubbing and later recovered their initial hub activities,
measured as the adjusted number of connections.
From table 5, the only re-hubbing case classified as Alliance-dominated as that already
mentioned of the Ronald Reagan National airport in Washington. In this case, de-hubbing was
due to stricter security limitations for the Washington airspace following the September 11th,
2001. So, after some months security partially relaxed and the hub carrier, US Airways,
operated again its hub activities. However, in terms of offered seats, after 5 years the airport
did not recover its initial traffic.
All the other two are classified in the Unallied scenario since five years after de-hubbing
airports are dominated by a traditional and unallied carrier. In the case of the Ninoy Aquino
International Airport, in Philippines, the hub carrier Philippine Airlines was severely affected
by the 1997 Asian Financial Crisis. So, it was forced to downsize its international operations
by the airport. After corporate restructuring, the airline gradually restored its services. In the
case of the Shanghai Hongqiao airport, China Eastern Airlines transferred international
activities to the new Shanghai Pudong International Airport in 1999. However, due to the
strong growth of the Chinese domestic market, in time even the Shanghai Hongqiao airport
recovered hub activities.
There are no cases where re-hubbing took place by another carrier. In general, conditions that
can make possible a re-hubbing by another carrier are demanding. If an airport is employed as
hub by a carrier, then its geographical position is favorable to be connected to other airports
of its network. In other words, the detour necessary to connect the origin to the destination

13
airports via the hub, compared with a direct connection, is low. For this reason, it is very
difficult to find another airline for which the same airport is ideal for hub location. This
condition is more likely to be met when the new carrier operates, or has an interest in
expanding, in the origin and destination markets served by the former hub carrier.
5.2. The low-cost alternative
When the airline abandons its hubbing activity, re-hubbing is not likely to take place,
especially by other carriers. So, what should an airport do to avoid decline?
The four European airports of Birmingham, Basel-Mulhouse, East Midlands Nottingham and
Glasgow have fostered the development of low-cost carriers which became dominant five
years after de-hubbing, respectively FlyBE, Easyjet Switzerland, bmibaby and easyJet. They
show the best recovery development in five years with offered seats above the pre-de-hubbing
mark of 12.8%, from table 5. However, out of 37 de-hubbing cases, only 4 followed this
development patter.
It is also of interest to look at airports where the major airline is a low-cost carrier, even if it
offers less of 50% of seats. We find that in the Battleground scenario, out of the 12 cases
shown in table 5, in four the main carrier is low-cost. Table 6 reports traffic developments for
those cases.
<Table 6 about here>
When the first carrier is low-cost, seats capacity decreases much less year by year. Five years
after de-hubbing offered seats are above the initial value by 9% against a decrease of 27.1% in
the other cases. So, even if the airport is not clearly dominated by carriers or alliances, a
recovery path is still possible if low-cost carriers take the lead. These cases are that of the
American airports of Albany, Orlando and New Orleans Louis Armstrong with a relative
dominance of Southwest, and the recent case of Milan Malpensa by easyJet. However, as in
the case of Low cost-dominated scenario, complete traffic recovery does not come before 4-5
years from de-hubbing.
<Figure 4 about here>

14
Figure 4 shows the relationship between the percentage of offered seats by low cost carriers
and the increase in seats capacity 5 years from de-hubbing, including all airports considered
in this study. It confirms a robust positive relation with a statistically significant coefficient of
about 0.5, meaning that, on average, each percentage point of seats by low cost carriers brings
an extra-growth of 0.5%.
The airport’s strategy to favour low-cost carriers has profound implications. It implies an
effort to reduce costs and airport charges. Infrastructures dedicated to the support of long-haul
flights may no longer be adequately remunerated. Furthermore, this strategy is likely to be
irreversible. The probability of traditional carriers offering new hub services is very low since
they would face aggressive competition for their short-haul feeding flights.
5.3. The decline
Table 7 reports statistics on de-hubbing effects for airports with no majority presence of low-
cost carriers. Looking at averages and medians value one would see very declining trends.
However, there are relevant variations within these 26 cases. The most positive exception is
the Adelaide airport, classified in the Alliance-dominated scenario which suffered de-hubbing
at the end of 2001 by the bankruptcy of Ansett Australia but later recovered seats capacity by
Qantas Airways. The only other case of de-hubbing which later recovered capacity in five
years with no predominant presence of low-cost carriers is that London Gatwick, classified in
the Battleground scenario. Five years after de-hubbing by British Airways in 2000, the first
carrier was still British Airways just offering 31.6% of seats, almost half of its the pre-de-
hubbing share. However, a significant part of the growth was due to the rapid development of
easyJet, that later became the most important carrier in that airport. A part from these two
cases that recovered in five years their initial traffic, even if they grew much less than their
comparables, all other 24 cases saw significant reductions in capacity.
<Table 7 about here>
The three main de-hubbing cases considered in this study as reported in table 4, the US
airports of Cincinnati, Pittsburgh and Lambert-St. Luis suffered similar fate. The former hub
carriers, Delta Air Lines, US Airways and American Airlines remained the first carriers in the

15
airports. At the end of our monitoring periods, their traffic declined to respectively 43%, 57%
and 42% of their initial levels. A similar case is that of the French Clermont-Ferrand airport, a
secondary hub for Air France. After de-hubbing, the former hub carrier remained the main
operator in the airport. As a result, in five years it lost 50% of seats capacity.
Analogously, the Nice airport suffered de-hubbing by Air France in 2001 that decided to
concentrate intercontinental services to its main hub of Paris Charles de Gaulle. In this case,
however, the favorable position of the airport to serve the south coast of France, attracted in
time other carriers, among which the low-cost easyJet and carriers from other alliances. For
this reason, the Nice airport, classified in the Battleground scenario, contained its reduction in
seats capacity to 5% in 5 years with respect to its initial value.
This case exemplifies several characteristics of the airports in the Battleground scenario. After
the abandonment by the hub carrier, the traffic potentiality of their catchment areas attracts
other carries. Alliances are very keen to enter the airport to offer passengers connections to
intercontinental destinations by their main hubs. In this respect, other examples are those
already mentioned of Milan Malpensa, London Gatwick and Brussels in Europe, and the US
airports of Albany International, Louis Armstrong International, Lambert-St. Louis
International, Colorado Springs and Raleigh/Durham.
A further primary objective of alliances to offer at least a minimum service is to preempt
competition and make re-hubbing by rival alliances or unallied carriers much less likely. For
that reason, as showed in table 6, airports classified in this scenario have better prospective if
a low-cost carrier takes to lead.
5.4. Impact on territories
In this section we assess the impact of de-hubbing on region accessibility by looking at the
number of destinations available for departing passengers. Figure 5 compares the impact of
de-hubbing on offered seats and on the number of destinations and intercontinental
destinations.
In each year, the number of destinations offered after de-hubbing decreases less than offered
seats. So, the decline in offered seats is driven mainly by a decrease in frequencies or in

16
aircraft seats capacity rather than by cutting the number of destinations. The negative effect
on accessibility suffered by territories is less severe than the direct impact of de-hubbing on
airports.
We also look at variations in the number of intercontinental destinations. As one would
expect, the decrease in the number of long-haul destinations exceeds, even if only marginally,
the reduction in the number of destinations.
<Figure 5 about here>
Table 8 shows variations in the number of destinations and intercontinental destinations for
each of the scenarios introduced in the previous section. In the low-cost dominated scenario
and in the Battleground scenario with a low-cost main carrier, the number of destinations
recovers speedily. In these cases, 5 years from de-hubbing the number of destinations grew by
28.3% and 26% respectively, mainly driven by short-haul connections. Those airports gained
more in the number of destinations than in offered seats. That is consistent with the strategy
of low-cost carriers to offer a wide range of short-haul destinations served less intensely than
traditional carriers. In the other cases, the number of destinations decreased severely,
especially for the Alliance-dominated scenario, with -22.5% of destinations and -32.6% of
intercontinental destinations after 5 years.
<Table 8 about here>
Interestingly, in the three cases where re-hubbing took place, the number of destinations
recovered much more speedily than the number of intercontinental destinations, meaning that
even if those airports recovered hub activities, their offers changed towards short and
medium-haul destinations.
6. Conclusion
The objective of this work is to analyze the cases of de-hubbing during period 1997-2009 in
the world-wide air transport network by looking at scheduled flights. To the best of our
knowledge, this is the first paper to study de-hubbing in a systematic way. Other works which
dealt with de-hubbing adopted case study approaches.

17
After introducing quantitative criteria we find 37 different instances of airports which suffered
de-hubbing in the world. We did not find any case in which those airports recovered their hub
activities by other carriers.
Our results show that, on average, airports that suffered de-hubbing did not recover their
original traffic in 5 years. When low-cost carriers enter the airport, traffic, measured in terms
of seats capacity, shows much faster recovery trends. If low-cost carriers are not significantly
involved, the most frequent case is that in which the airports decline.
From a passenger’s and region’s perspective, the number of destinations and intercontinental
destinations decline less than offered seats. So, the negative effect of de-hubbing on air-side
accessibility is less severe than its impact on airports traffics.
Other future developments could study the characteristics of the cases indentified in this
study, in order to estimate the probability of future de-hubbing to take place.
Acknowledgements
We wish to thank all the participants at the Airneth workshop “The economic crisis and the
impact on the network quality of hub airports” (The Hague, Netherland, 22nd September,
2009) and at the 2010 ATRS conference in Porto for their useful comments and suggestions.
Any errors are our own.

18
References
Antoniou A. 1991. “Economies of scale in the airline industry: the evidence revisited”. The
Logistics and Transportation Review, 27: 159-184.
Berry S., Jia P. 2008. “Tracing the woes: an empirical analysis of the airline industry”. NBER
Working Paper, 14503.
Bhadra D. 2009. “Race to the bottom or swimming upstream: performance analysis of US
airlines”. Journal of Air Transport Management, 15 (5): 227-235.
Borenstein S. 1989. “Hubs and high fares: dominance and market power in the US airline
industry”. RAND Journal of Economics, 20: 344-365.
Burghouwt G. 2007. Airline Network Developments in Europe and its Implications for
Airport Planning, England. Ashgate.
Burghouwt G. 2008. Uncertainties for Hub Airports in Multi-Hub Networks. Airneth WIP.
Burghouwt G. , Redondi R. 2010. Connectivity in the Air Transport Industry: Measures,
Models and Applications. ICCSAI WIP.
Dennis N. 2005. “Industry consolidation and future airline network structures in Europe”.
Journal of Air Transport Management, 11: 175-183.
Dudden J-C. 2006. “Multi-hub network configurations - A temporary or permanent outcome
of airline consolidation?”. Review of Network Economics, 5 (4): 421-434.
Halstead, J. 2001. “Has downsizing worked?”. Aviation Strategy, 6-9.
IRER. 2008. L’evoluzione del ruolo di Malpensa: effetti delle strategie di Alitalia,
l’accessibilità intercontinentale del nord Italia, il rapporto con il territorio.
Johansson O. 2007. “Inter-urban competition and air transport in the deregulated era: the
Nashville case”. Journal of Transport Geography, 15: 368-379.
Knorr A., Arndt A. 2004. “Alliance strategy and the fall of Swissair: a comment”. Journal of
Air Transport Management, 10: 119-123.
Morrison S., Winston C. 1986. The Economic Effect of Airline Deregulation. Brookings
Institution: Washington DC.
Shaw S-L., Ivy R. 1994. “Airline mergers and their effect on network structure”. Journal of
Transport Geography, 2 (4): 234-246.
Sorkin A., Bailey J. 2008. “Northwest and Delta talk merger”. The New York Times,
February 7, 2008.

19
Szyliowlcz J.S., Goetz A.R. 1995. “Getting realistic about megaproject planning: the case of
the new Denver international airport”. Policy Sciences, 28: 347-367.
Thompson I.B. 2002. “Air transport liberalisation and the development of third level airports
in France”. Journal of Transport Geography, 10: 273-285.
Tretheway M.W., Oum T.H. 1992. “Airline economic foundations for strategy and policy”.
Center for Transportation Studies, University of British Columbia, Vancouver.
Vowles T.M. 2001. “The ‘Southwest effect’ in multi-airport regions”. Journal of Air
Transport Management, 7: 251-258.
Wojahn O.W. 2001. “Airline network structure and the gravity model”. Transportation
Research Part E: Logistics and Transportation Review, 37 (4): 267-279.

20
Appendix
Rank Airport Country Adjusted
connectionsdecrease
Period Hub carrier
1 Cincinnati/Northern Kentucky United States 86% November‐05 Delta Air Lines
2 Pittsburgh International United States 98% September‐01 US Airways
3 Lambert‐St. Louis International United States 95% October‐03 American Airlines
4 Milano Malpensa Italy 94% March‐08 Alitalia
5 Brussels National Belgium 83% November‐01 Sabena
6 London Gatwick United Kingdom 79% October‐01 British Airways
7 Ronald Reagan National United States 85% September‐01 US Airways
8 Luis Munoz Marin International Puerto Rico 82% December‐01 American Airlines
9 Orlando International United States 77% May‐01 Delta Air Lines
10 Metropolitan Area Republic of Korea 100% March‐01 Korean Air Lines
11 Nice Cote D'Azur France 98% November‐01 Air France
12 Milano Linate Italy 97% October‐98 Alitalia
13 Raleigh/Durham United States 84% August‐01 Midway
14 Jorge Newbery Argentina 84% April‐00 Aerolineas Argentinas
15 Birmingham United Kingdom 86% April‐03 British Airways
16 Simon Bolivar Venezuela 78% January‐03 Aeropostal
17 Anchorage International United States 83% October‐01 Alaska Airlines
18 Basel‐Mulhouse Switzerland 98% March‐03 Swissair
19 Ninoy Aquino International Philippines 84% June‐98 Philippine Airlines
20 King Khaled International Saudi Arabia 81% April‐08 Saudia
21 Hongqiao China 90% October‐99 China Eastern Airlines
22 Philip S.W. Goldson International Belize 99% September‐03 Maya Island Air
23 Ketchikan International United States 99% August‐98 Alaska Airlines
24 Belize City Municipal Belize 100% September‐03 Maya Island Air
25 Sangster International Jamaica 97% August‐03 Air Jamaica
26 Louis Armstrong International United States 92% September‐05 Southwest Airlines
27 East Midlands Nottingham United Kingdom 94% March‐98 bmi
28 Nadi International Fiji 92% June‐00 Air Pacific
29 Glasgow United Kingdom 75% September‐06 British Airways
30 Adelaide Australia 75% October‐01 Ansett Australia
31 Albany International United States 96% November‐04 US Airways
32 Caye Caulker Belize 100% March‐04 Tropic Air
33 Kaliningrad Russian Federation 96% September‐08 KD Avia
34 Clermont‐Ferrand Aulnat France 91% April‐03 Air France
35 Colorado Springs United States 98% February‐98 United Airlines
36 Gen Pesqueira Garcia Mexico 79% June‐02 Aeromexico
37 Taichung Chinese Taipei 100% February‐99 Islas Airways
21
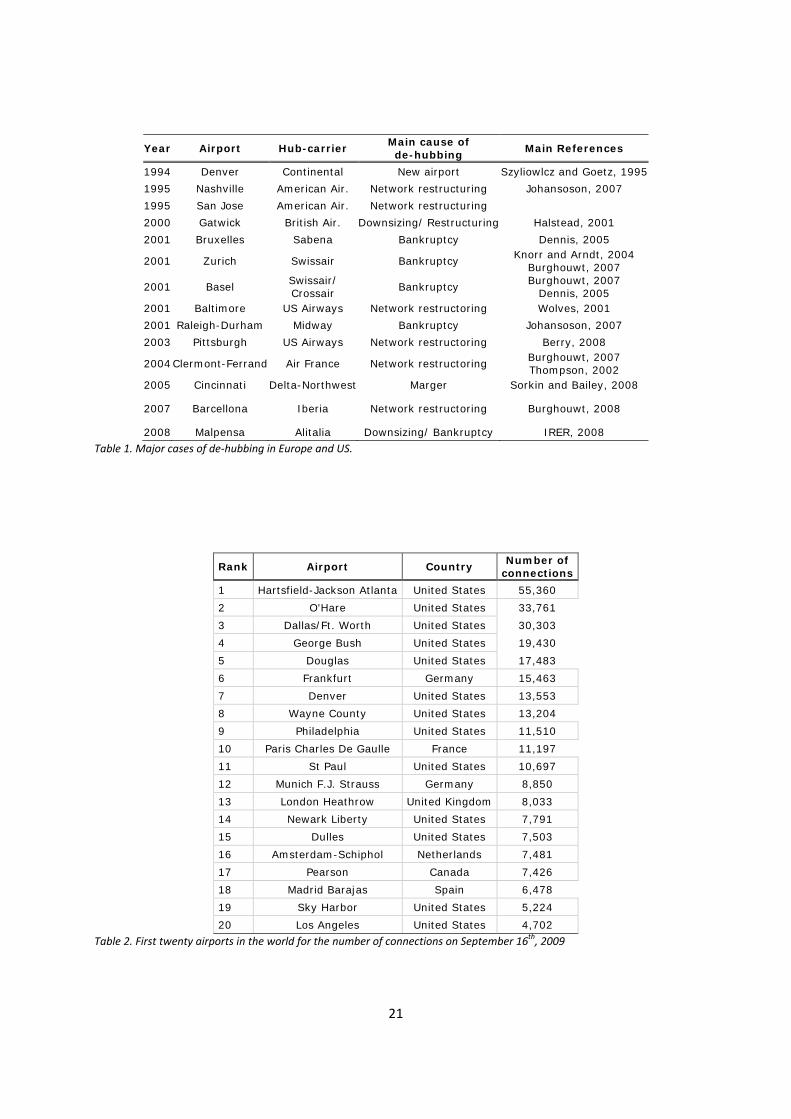
Year Airport Hub-carrier Main cause of de-hubbing
Main References
1994 Denver Continental New airport Szyliowlcz and Goetz, 1995
1995 Nashville American Air. Network restructuring Johansoson, 2007
1995 San Jose American Air. Network restructuring
2000 Gatwick British Air. Downsizing/ Restructuring Halstead, 2001
2001 Bruxelles Sabena Bankruptcy Dennis, 2005
2001 Zurich Swissair Bankruptcy Knorr and Arndt, 2004
Burghouwt, 2007
2001 Basel Swissair/ Crossair
Bankruptcy Burghouwt, 2007
Dennis, 2005 2001 Baltimore US Airways Network restructoring Wolves, 2001
2001 Raleigh-Durham Midway Bankruptcy Johansoson, 2007
2003 Pittsburgh US Airways Network restructoring Berry, 2008
2004 Clermont-Ferrand Air France Network restructoring Burghouwt, 2007 Thompson, 2002
2005 Cincinnati Delta-Northwest Marger Sorkin and Bailey, 2008
2007 Barcellona Iberia Network restructoring Burghouwt, 2008
2008 Malpensa Alitalia Downsizing/ Bankruptcy IRER, 2008
Table 1. Major cases of de‐hubbing in Europe and US.
Rank Airport Country Number of
connections
1 Hartsfield-Jackson Atlanta United States 55,360
2 O'Hare United States 33,761
3 Dallas/Ft. Worth United States 30,303
4 George Bush United States 19,430
5 Douglas United States 17,483
6 Frankfurt Germany 15,463
7 Denver United States 13,553
8 Wayne County United States 13,204
9 Philadelphia United States 11,510
10 Paris Charles De Gaulle France 11,197
11 St Paul United States 10,697
12 Munich F.J. Strauss Germany 8,850
13 London Heathrow United Kingdom 8,033
14 Newark Liberty United States 7,791
15 Dulles United States 7,503
16 Amsterdam-Schiphol Netherlands 7,481
17 Pearson Canada 7,426
18 Madrid Barajas Spain 6,478
19 Sky Harbor United States 5,224
20 Los Angeles United States 4,702
Table 2. First twenty airports in the world for the number of connections on September 16th, 2009

22
Area Number of cases
Europe 11
North America 11
Central-South America 8
Asia-Pacific 7
Total 37
Table 3. Geographical distribution of the de‐hubbing cases.
Rank Airport Country
Adjusted number
of connections
Decrease De-hubbing
month Hub Carrier
1 Cincinnati/Northern Kentucky United States 22,105 86% November-05 Delta Air Lines
2 Pittsburgh International United States 16,790 98% September-01 US Airways
3 Lambert-St. Louis International United States 15,165 95% October-03 American Airlines
4 Milan Malpensa Italy 4,434 94% March-08 Alitalia
5 Brussels National Belgium 3,576 83% November-01 Sabena
6 London Gatwick United Kingdom 2,744 79% October-01 British Airways
7 Ronald Reagan National United States 2,136 85% September-01 US Airways
8 Luis Munoz Marin International Puerto Rico 1,790 82% September-08 American Airlines
9 Orlando International United States 1,575 77% May-01 Delta Air Lines
10 Kimpo International South Korea 1,411 100% March-01 Korean Air Lines
Table 4. Main ten de‐hubbing in terms of the adjusted number of connections.
Offered seats Number Year+1 Year+2 Year+3 Year+4 Year+5
All de-hubbing cases 37 -19.8% -23.6% -22.3% -21.1% -17.5%
No Re-hubbing 34 -20.3% -25.2% -23.8% -22.1% -20.4%
Low Cost-dominated 4 -13.2% -18.0% -14.6% -8.9% 12.8%
Alliance-dominated 6 -28.5% -24.0% -21.4% -18.3% -19.3%
Unallied-dominated 12 -15.3% -24.7% -24.2% -23.1% -26.8%
Battleground 12 -23.8% -28.8% -27.2% -25.0% -22.6%
Re-hubbing 3 -20.1% -13.2% -6.0% -10.7% -3.9%
Low Cost-dominated - - - - - -
Alliance-dominated 1 -29.9% -18.6% -12.7% -2.8% -2.5%
Unallied-dominated 2 -15.2% -10.5% -2.6% -14.6% -4.6%
Battleground - - - - - -
Table 5. De‐hubbing effects on offered seats. We distinguish between the re‐hubbing and the no re‐hubbing case and
between the four categories based on the offered seats structure five years after de‐hubbing.

23
Offered seats Number Year+1 Year+2 Year+3 Year+4 Year+5
Battleground 12 -23.8% -28.8% -27.2% -25.0% -22.6%
the first carrier is low-cost 4 -20.8% -22.3% -17.9% -16.3% 9.0%
the first carrier is not low-cost 8 -25.3% -31.6% -31.3% -28.8% -27.1%
Table 6. De‐hubbing effects on offered seats. We distinguish between the re‐hubbing and the no re‐hubbing case and
between the four categories based on the offered seats structure five years after de‐hubbing.
Scenario
Number Year 1 Year 2 Year 3 Year 4 Year 5
Decline
Average
26
-21.4% -26.9% -26.1% -24.7% -26.3%
25% percentile -33.9% -39.3% -41.7% -41.7% -49.3%
Median -16.7% -29.0% -29.3% -22.1% -27.2%
75% percentile -6.2% -11.6% -11.6% -7.5% -6.8%
Alliance-dominated
Average
6
-28.3% -25.1% -23.2% -22.2% -23.5%
25% percentile -29.8% -37.0% -42.6% -47.4% -51.9%
Median -17.2% -27.8% -34.9% -22.5% -25.9%
75% percentile -8.6% -11.8% -0.1% 2.8% 2.5%
Unallied dominated
Average
12
-15.3% -24.7% -24.2% -23.1% -26.8%
25% percentile -30.0% -36.0% -35.6% -33.8% -48.9%
Median -7.5% -27.6% -21.5% -21.4% -21.5%
75% percentile -4.7% -12.1% -14.4% -13.8% -10.3%
Battleground- Non low-cost first carrier
Average
8
-25.3% -31.6% -31.3% -28.8% -27.1%
25% percentile -42.0% -41.0% -46.5% -45.9% -43.3%
Median -22.5% -29.3% -29.3% -30.0% -30.1%
75% percentile -12.9% -20.1% -18.4% -13.2% -16.3%
Table 7. De‐hubbing effects for airports with no relatively dominant presence of low‐cost carriers.
Number of destinations Number Year+1 Year+2 Year+3 Year+4 Year+5
All de-hubbing cases 37 -15.0%
(-18.9%) -15.9%
(-20.3%) -14.9%
(-17.1%) -15.7%
(-17.7%) -11.6%
(-14.8%)
No Re-hubbing 34
-14.7% (-18.6%)
-15.9% (-20.1%)
-15.6% (-17.8%)
-16.3% (-16.9%)
-12.4% (-14.0%)
Low Cost-dominated 4 -0.9%
(-17.0%) -6.4%
(-7.6%) -1.3%
(-11.5%) 2.8%
(-12.5%) 28.3% (16.3)
Alliance-dominated 6 -22.6%
(-18.9%) -13.6% (-8.7%)
-15.3% (-13.7%)
-20.8% (-24.1%)
-22.5% (-32.6%)
Unallied-dominated 12 -9.8%
(-14.4%) -14.6%
(-15.8%) -17.7% (-6.5%)
-17.7% (-7.7%)
-20.1% (-8.2%)
Battleground 12 -20.2%
(-27.7%) -22.2%
(-31.2%) -19.0%
(-32.7%) -18.6%
(-24.6%) -12.0%
(-13.6%)
the first carrier is low-cost 4 -17.7%
(-32.0%) -17.3%
(-27.7%) -9.0%
(-21.6%) -11.2%
(-12.7%) 26.0%
(+6.6%)
the first carrier is not low-cost 8 -21.4%
(-24.8%) -24.4%
(-33.2%) -23.3%
(-39.4%) -21.8%
(-31.8%) -17.4%
(-29.6%)
Re-hubbing 3
-18.7% (-20.7%)
-15.7% (-21.4%)
-8.2% (-13%)
-9.8% (-21.4%)
-4.3% (-18.8%)
Table 8. De‐hubbing effects on the number of destinations. We distinguish between the re‐hubbing and no re‐hubbing case.
For the latter we consider the four clusters defined in the previous section. Changes in the number of intercontinental
destinations are in brackets.

24
0
100,000
200,000
300,000
400,000
500,000
600,000
Jan‐97
Sep‐97
May‐98
Jan‐99
Sep‐99
May‐00
Jan‐01
Sep‐01
May‐02
Jan‐03
Sep‐03
May‐04
Jan‐05
Sep‐05
May‐06
Jan‐07
Sep‐07
May‐08
Jan‐09
Sep‐09
Figure 1. Worldwide number of daily connections for each day considered in the period January 1997 – September 2009.
0
1
2
3
4
Jan‐97
Sep‐97
May‐98
Jan‐99
Sep‐99
May‐00
Jan‐01
Sep‐01
May‐02
Jan‐03
Sep‐03
May‐04
Jan‐05
Sep‐05
May‐06
Jan‐07
Sep‐07
May‐08
Jan‐09
Sep‐09
Figure 2. Temporal distribution of the number of de‐hubbing cases.

25
‐30.0%
‐25.0%
‐20.0%
‐15.0%
‐10.0%
‐5.0%
0.0%
5.0%
10.0%
15.0%
20.0%
Year0 De‐Hubbing
Year+1 Year+2 Year+3 Year+4 Year+5
Chan
ges to Year0
De‐Hubbed airports Comparables
Figure 3. De‐hubbing effects on offered seats compared with seats offered by similar‐size airports (±10% in terms of seats)
on the same region (Europe, North America, Central‐South America, Asia‐Pacific).
y = 0.5087x ‐ 0.2424R² = 0.3067
‐70%
‐60%‐50%‐40%
‐30%‐20%‐10%
0%10%20%
30%40%
0.0% 20.0% 40.0% 60.0% 80.0% 100.0%Increase in seats capacity after 5 years
Percentage of offered seats by low‐cost carriers
Figure 4. Relationship between the percentage of offered seats by low‐cost carriers and the increase in seats capacity five
years from de‐hubbing.

26
‐30.0%
‐25.0%
‐20.0%
‐15.0%
‐10.0%
‐5.0%
0.0%
Year0 De‐Hubbing
Year+1 Year+2 Year+3 Year+4 Year+5
Chan
ges to Year0
Destinations Long‐haul destinations Offered Seats
Figure 5. Comparison of de‐hubbing effects on offered seats, the number of destinations and the number of intercontinental
destinations.


![CIVIL CASES] [FRESH (FOR ADMISSION) - CRIMINAL CASES]](https://static.fdokumen.com/doc/165x107/633739bdd63e7c790105b19d/civil-cases-fresh-for-admission-criminal-cases-1682892728.jpg)