DAFTAR PUSTAKA - Repository Universitas Hasanuddin
29
42 DAFTAR PUSTAKA Abbott, R. T. and Morris, P. A. (2001) A field guide to shells: Atlantic and Gulf Coasts and the West Indies. Houghton Mifflin Harcourt. Abdullah, A., Hidayat, T. and Chairunisah, R. (2017) ‗Karakteristik Kimiawi dari Daging Kerang Tahu, Kerang Salju dan Keong Macan‘, Journal of Food Technology & Industry/Jurnal Teknologi & Industri Pangan, 28(1), pp. 79–84. Ajith, N. and Arumugam, S. (2020) ‗Global distribution of microplastics and its impact on marine environment — a review‘, Environmental Science and Pollution. Environmental Science and Pollution Research. Akhmadi, M. F. and Trijoko, T. (2016) ‗Variasi Morfologi Lima Populasi Meretrix spp.(Bivalvia: Veneridae) di Indonesia‘, Jurnal Harpodon Borneo, 9(2), pp. 171– 182. Alimba, C. G. and Faggio, C. (2019) ‗Microplastics in the marine environment: Current trends in environmental pollution and mechanisms of toxicological profile‘, Environmental Toxicology and Pharmacology, 68(March), pp. 61–74. doi: 10.1016/j.etap.2019.03.001. Andrady, A. L. (2011) ‗Microplastics in the marine environment‘, Marine pollution bulletin. Elsevier, 62(8), pp. 1596–1605. Asikin (1982) Kerang Hijau. Jakarta: Penebar Swadaya. Assidqi, K. (2015) The Physiological Impact Of Microplastic On Holothuria leucospilota . Institut Pertanian Bogor. Avio, C. G., Gorbi, S. and Regoli, F. (2015) ‗Experimental development of a new protocol for extraction and characterization of microplastics in fish tissues: first observations in commercial species from Adriatic Sea‘, Marine environmental research. Elsevier, 111, pp. 1–10. Barnes, D. K. A., Richard, C. Thompson and Morton, B. (2009) ‗Accumulation and fragmentation of plastic debris in global environments‘, Philosophical Transactions of the Royal Society B: Biological Sciences . The Royal Society Publishing, 364(1526), pp. 1985–1998. Barrows, A. P. W., Cathey, S. E. and Petersen, C. W. (2018) ‗Marine environment microfiber contamination: Global patterns and the diversity of microparticle origins‘, Environmental Pollution. Elsevier Ltd, 237, pp. 275–284. doi: 10.1016/j.envpol.2018.02.062. Beyer, J. Beyer, J., Green, N.W., Brooks, S., Allan, I.J., Ruus, A., Gomes, Tâ., Bråte, I.L.N., Schøyen, M., (2017) ‗Blue mussels (Mytilus edulis spp.) as sentinel organisms in coastal pollution monitoring: A review‘, Marine Environmental Research, 130, pp. 338–365. Bogusz, A. and Oleszczuk, P. (2017) ‗Microplastics in the environment: characteristic, identification and potential risk‘, Annales Universitatis Mariae Curie- Sklodowska, sectio AA–Chemia, 71(2), p. 97. Borkar, S. Sondavid, N., Young-I, K., Don, K., Hyun, K, S and Hak, J, K. (2020) ‗Investigation of Microplastics from Three Marine Organisms‘, 53(2), p244–245.
-
Upload
khangminh22 -
Category
Documents
-
view
2 -
download
0
Transcript of DAFTAR PUSTAKA - Repository Universitas Hasanuddin

42
DAFTAR PUSTAKA
Abbott, R. T. and Morris, P. A. (2001) A field guide to shells: Atlantic and Gulf Coasts and the West Indies. Houghton Mifflin Harcourt.
Abdullah, A., Hidayat, T. and Chairunisah, R. (2017) ‗Karakteristik Kimiawi dari Daging Kerang Tahu, Kerang Salju dan Keong Macan‘, Journal of Food Technology & Industry/Jurnal Teknologi & Industri Pangan, 28(1), pp. 79–84.
Ajith, N. and Arumugam, S. (2020) ‗Global distribution of microplastics and its impact on marine environment — a review‘, Environmental Science and Pollution. Environmental Science and Pollution Research.
Akhmadi, M. F. and Trijoko, T. (2016) ‗Variasi Morfologi Lima Populasi Meretrix spp.(Bivalvia: Veneridae) di Indonesia‘, Jurnal Harpodon Borneo, 9(2), pp. 171–182.
Alimba, C. G. and Faggio, C. (2019) ‗Microplastics in the marine environment: Current trends in environmental pollution and mechanisms of toxicological profile‘, Environmental Toxicology and Pharmacology, 68(March), pp. 61–74. doi: 10.1016/j.etap.2019.03.001.
Andrady, A. L. (2011) ‗Microplastics in the marine environment‘, Marine pollution bulletin. Elsevier, 62(8), pp. 1596–1605.
Asikin (1982) Kerang Hijau. Jakarta: Penebar Swadaya.
Assidqi, K. (2015) The Physiological Impact Of Microplastic On Holothuria leucospilota. Institut Pertanian Bogor.
Avio, C. G., Gorbi, S. and Regoli, F. (2015) ‗Experimental development of a new protocol for extraction and characterization of microplastics in fish tissues: first observations in commercial species from Adriatic Sea‘, Marine environmental research. Elsevier, 111, pp. 1–10.
Barnes, D. K. A., Richard, C. Thompson and Morton, B. (2009) ‗Accumulation and fragmentation of plastic debris in global environments‘, Philosophical Transactions of the Royal Society B: Biological Sciences. The Royal Society Publishing, 364(1526), pp. 1985–1998.
Barrows, A. P. W., Cathey, S. E. and Petersen, C. W. (2018) ‗Marine environment microfiber contamination: Global patterns and the diversity of microparticle origins‘, Environmental Pollution. Elsevier Ltd, 237, pp. 275–284. doi: 10.1016/j.envpol.2018.02.062.
Beyer, J. Beyer, J., Green, N.W., Brooks, S., Allan, I.J., Ruus, A., Gomes, Tâ., Bråte, I.L.N., Schøyen, M., (2017) ‗Blue mussels (Mytilus edulis spp.) as sentinel organisms in coastal pollution monitoring: A review‘, Marine Environmental Research, 130, pp. 338–365.
Bogusz, A. and Oleszczuk, P. (2017) ‗Microplastics in the environment: characteristic, identification and potential risk‘, Annales Universitatis Mariae Curie-Sklodowska, sectio AA–Chemia, 71(2), p. 97.
Borkar, S. Sondavid, N., Young-I, K., Don, K., Hyun, K, S and Hak, J, K. (2020) ‗Investigation of Microplastics from Three Marine Organisms‘, 53(2), p244–245.
43
Boucher, J. and F. D. (2017) Primary Microplastics in the Oceans : Edited by C. G. L.
and J. M. de Sousa and Francis. Switzerland: IUCN, Gland, Switzerland. doi: dx.doi.org/10.2305/IUCN.CH.2017.01.en Authors:
Bour, A., Haarr., Ane, K., Steffen, H., Ketil. (2018) ‗Environmentally relevant microplastic exposure affects sediment-dwelling bivalves‘, Environmental Pollution. Elsevier Ltd, 236, pp. 652–660. doi: 10.1016/j.envpol.2018.02.006.
Bråte, I. L. N. Hurley, R., Iversen, K., Beyer, J., Thomas, K.V., Steindal, C.C., Green, N.W., Olsen, M., Lusher, A. (2018) ‗Mytilus spp. as sentinels for monitoring microplastic pollution in Norwegian coastal waters: A qualitative and quantitative study‘, Environmental Pollution. Elsevier Ltd, 243, pp. 383–393. doi: 10.1016/j.envpol.2018.08.077.
Browne, M. A., Crump, P., Niven, Stewart J., Andrew, T., T, Galloway. and Richard C. T. (2011) ‗Accumulation of microplastic on shorelines woldwide: Sources and sinks‘, Environmental Science and Technology, 45(21), pp. 9175–9179. doi: 10.1021/es201811s.
Carpenter, K. E. and Niem, V. H. (1998) The living marine resources of the western Central Pacific: 1. Seaweeds, corals, bivalves and gastropods. P. Oliver. Edited
by R. N. DeAngelis and M. Kautenberger-Longo (FAO. USA: M. Kautenberger-Longo and N. DeAngelis (FAO, Rome).
Cauwenberghe, L. and Janssen, C. R. (2014) ‗Microplastics in bivalves cultured for human consumption‘, Environmental pollution. Elsevier, 193, pp. 65–70.
Cauwenberghe, L. Van, Devriese, L., Galgani, F., Robbens, J., & Janssen, C. R. 2015. Microplastics in sediments: A review of techniques, occurrence and effects. Marine Environmental Research. 199:10-17.
Chairunisah, R. (2011) Karakteristik Asam Amino Daging Kerang Tahu (Meretrix Meretrix), Kerang Salju (Pholas Dactylus) Dan Keong Macan (Babylonia Spirata).[Skripsi], Fakultas Perikanan Dan Ilmu Kelautan Institut Pertanian Bogor. Bogor.
Claessens, M., Meester, S. De, Landuyt, L. Van, Clerck, K. De, & Janssen, C. R. 2011. Occurrence and distribution of microplastics in marine sediments along the Belgian coast. Marine Pollution Bulletin, vol. 62, no. 10: 2199–2204.
Cole, M., P. Lindeque, C. Halsband and T. S., Galloway. 2011. Microplastics as Contaminants in the Marine Environment: A review. Marine Pollution Bulletin. 62:2588–2597.
Cole, M. P. Lindeque, C. Halsband and T. S., Galloway. (2013) ‗Microplastic ingestion by zooplankton‘, Environmental Science and Technology, 47(12), pp. 6646–6655. doi: 10.1021/es400663f.
Davidson, K. and Dudas, S. E. (2016) ‗Microplastic ingestion by wild and cultured Manila clams (Venerupis philippinarum) from Baynes Sound, British Columbia‘, Archives of Environmental Contamination and Toxicology. Springer, 71(2), pp. 147–156
Devendport, J. and Xiogan C, 1987. A comparasion methods for the assesment of condition in the mussel (Mytilus edulis L.). Jur Moll. Stud. 53, 293-297.
Ding, J. F., Li, J. X., Sun, C. J., He, C. F., Jiang, F. H., Gao, F. L., & Zheng, L. 2018. Separation and Identification of Microplastics in Digestive System of Bivalves.
44
Chinese Journal of Analytical Chemistry. 46 (5): 690–697. doi: 10.1016/S1872-2040(18)61086-2.
Fachruddin, L., Yaqin, K., & Reski, I, 2020. Perbandingan dua metode analisis konsentrasi mikroplastik pada kerang hijau, Perna viridis dan penerapannya dalam kajian ekotoksikologi. Jurnal Pengelolaan Perairan. 3 (1):1-13. 2620-
6552
Fang, C. Zheng, R., Chen, H, Hong., F, Lin., Longshan, Lin, H., Guo., H, Bailey., C, S, Helmut., Mu, J, Bo, and Jun. (2019) ‗Comparison of microplastic contamination in fish and bivalves from two major cities in Fujian province, China and the implications for human health‘, Aquaculture. Elsevier, 512(April), p. 734322. doi: 10.1016/j.aquaculture.2019.734322.
Farrell, P. and Nelson, K. (2013) ‗Trophic level transfer of microplastic: Mytilus edulis (L.) to Carcinus maenas (L.)‘, Environmental pollution. Elsevier, 177, pp. 1–3.
doi: 10.1016/j.envpol.2013.01.046.
Pedrotti ML, Bruzaud S, Dumontet B, Elineau A, Petit S, Grohens Y, Voisin P, Crebassa JC, Gorsky G. 2014. Plastic fragments on the surface of Mediterranean waters. CIESM Workshop Monographs n°46. Marine litter in the Mediterranean and black seas-Tirana, Albania, 18-21 June 2014.
Fendall, L. S. and Sewell, M. A. (2009) ‗Contributing to marine pollution by washing your face: microplastics in facial cleansers‘, Marine pollution bulletin. Elsevier, 58(8), pp. 1225–1228.
Figueroa-Pico, J., D.M.D. Valle, R. Castillo-Ruperti & Macías-Mayorga, D., 2016. Marine Debris-Implications for Conservation of Rocky Reefs in Manabi, Ecuador (Se Pacific Coast). Marine pollution bulletin. 109 : 7-13.
Fisner M, Taniguchi S, Moreira F, Bícego M.,C, Turra A. 2013. Polycyclic aromatic hydrocarbons (PAHs) in plastic pellets: variability in the concentration and composition at different sediment depths in a sandy beach. Marine Pollution Bullulletin 70: 219–226..
Fossi, M. C. Coppola, D., Baini, M., Giannetti, M., Guerranti, C., Marsili, L.,Clò, S. (2016) ‗Fin whales and microplastics: The Mediterranean Sea and the Sea of Cortez scenarios‘, Environmental Pollution, 209, pp. 68–78. doi: 10.1016/j.envpol.2015.11.022.
Fowler, J., Cohen, L. & Jarvis, P. 2013. Practical statistic for field biology. John Wiley dan Sons. Toronto.
Frias, J. and Nash, R. (2019) ‗Microplastics: finding a consensus on the definition‘, Marine pollution bulletin. Elsevier, 138, pp. 145–147.
Galloway, T. and Lewis, C. (2017) ‗Quick Guide Marine microplastics‘, Current Biology,
June, pp. R445–R446. doi: 10.1016/j.cub.2017.01.043.
Gigault, J., Baudrimont, M., Halle, A. ter, & Pascal, P. (2018). Current opinion : What is a nanoplastic ?. Environmental Pollution, 1-5.
Grace, U. (2016) ‗Microplastics: Trouble in the Food Chain‘, United Nations Environment Programme, pp. 32–43.
Hamli, H. (2016) ‗Inner shell as variation key of local hard clam Meretrix spp.‘ Journal of Environmental Biology, 14, pp. 118–200.

45
Hara, J., Frias, J. and Nash, R. (2020) ‗Quanti fi cation of microplastic ingestion by the decapod crustacean Nephrops norvegicus from Irish waters‘, Marine Pollution Bulletin. Elsevier, 152(October 2019), p. 110905. doi: 10.1016/j.marpolbul.2020.110905.
Hartmann, N. B. H, T, Thompson., C, Richard., Hassell v., M, Verschoor., A, Daugaard., A, E, Rist, S, K, Therese., Brennholt and Nicole. (2019). Are we speaking the same language? Recommendations for a definition and categorization framework for plastic debris. Environmental Science & Technology. 1039−1047.
Hidalgo-Ruz, V., Gutow, L., Thompson, R.C., Thiel, M., (2012). Microplastics in the marine environment: a review of the methods used for identification and quantification. Environmental. Science. Technology. 46:3060–3075.
Hiwari, H. P, Noir, P Ihsan., N, Yudi., Yuliadi., P, S, Lintang., Mulyani, Putri, G. (2019) ‗Kondisi sampah mikroplastik di permukaan air laut sekitar Kupang dan Rote , Provinsi Nusa Tenggara Timur‘, in Masyarakat Biodiversitas Indonesia, pp. 165–171. doi: 10.13057/psnmbi/m050204.
Ivar Do Sul, J. A., Costa, M. F. and Fillmann, G. (2014) ‗Microplastics in the pelagic environment around oceanic islands of the western Tropical Atlantic Ocean‘, Water, Air, and Soil Pollution, 225(7). doi: 10.1007/s11270-014-2004-z.
Jambeck, J. R., Gayer, R., Wilcox, C., Siegler, R. T., Perryman, M., Andrady, A., Law, L. K. 2015. Plastic waste inputs from land into the ocean. Science. 347:768–771.
Joesidawati, M. I. (2018) ‗Pencemaran Mikroplastik di Sepanjang Pantai Kabupaten Tuban‘, Prosiding SNasPPM, 3(1), pp. 8–15.
Ke, A. Y., Chen, J., Zhu, J., Wang, Y. H., Hu, Y., Fan, Z. L., Li, H. X. 2019. Impacts of leachates from single-use polyethylene plastic bags on the early development of clam Meretrix meretrix (Bivalvia: Veneridae). Marine Pollution Bulletin, 142:54–57.
Khoironi, A., Anggoro, S. and Sudarno, S. (2018) ‗The existence of microplastic in Asian green mussels‘, IOP Conference Series: Earth and Environmental Science, 131(1), pp. 1–6. doi: 10.1088/1755-1315/131/1/012050.
Kor, K. and Mehdinia, A. (2020) ‗Neustonic microplastic pollution in the Persian Gulf‘, Marine pollution bulletin. Elsevier, 150, p. 110665.
Kovač Viršek M, Palatinus A, Koren Š, Peterlin M, Horvat P, Kržan A.. 2016. Protocol for Microplastics Sampling on the Sea Surface and Sample Analysis. J Visual Exp 118: 1-9.
Krebs, C. J. (2014) Ecological Methodology. Addison-Wesley Educational Publishers,
Inc.
Law, K. L., Mor t-Ferguson, S.E., Goodwin, D.S., Zettler, E.R., DeForce, E., Kukulka, T. & Proskurowski, G. 2014. Distribution of surface plastic debris in the eastern Pacific Ocean from an 11-year data set. Environ. Sci. Technol., 48(9):
4732-4738.
Lebreton, L. C. M., van der Zwet, J., Damsteeg, J.W., Slat, B., Andrady, A., & Reisser, J. 2017. River plastic emissions to the world‘s oceans. Nature Communications, 8, 15611.
46
Li, J., Yang, D. Li, L. Jabeen, K. Shi, H. 2015. Microplastics in commercial bivalves from China. Environmental Pollution 207:190–195
Li, J., X. Qu, L. Su, W. Zhang, D. Yang, P. Kolandhasamy, D. Li, and H. Shi. 2016. Microplastics in mussels along the coastal waters of China. Environmental Pollution 214: 177–184.
Luan, L., Wang, X., Zheng, H., Liu, L., Luo, X., & Li, F. 2019. Differential toxicity of functionalized polystyrene microplastics to clams (Meretrix meretrix) at three key development stages of life history. Marine Pollution Bulletin, vol. 139, 346–354.
Lucas, A. and Putiher, P. G. (1985) ‗The use of physiological condition indices in marine bivalve aquaculture‘, Aquaculture, 44(3), pp. 187–200. doi: 10.1016/0044-8486(85)90243-1.
Lusher, A. L., Mchugh, M. and Thompson, R. C. (2013) ‗Occurrence of microplastics in the gastrointestinal tract of pelagic and demersal fish from the English Channel‘, Marine pollution bulletin. Elsevier, 67(1–2), pp. 94–99.
Lusher, A., Hollman, P. and Mendoza-Hill, J. (2017) ‗Microplastics in fisheries and aquaculture: status of knowledge on their occurrence and implications for aquatic organisms and food safety‘, FAO Fisheries and Aquaculture Technical Paper. Food and Agriculture Organization of the United Nations, (615). doi: 10.1016/j.marpolbul.2011.09.025.
Mathalon, A. and Hill, P. (2014) ‗Microplastic fibers in the intertidal ecosystem surrounding Halifax Harbor, Nova Scotia‘, Marine pollution bulletin. Elsevier, 81(1), pp. 69–79.
micheal M. Helm (2004) ‗Hatchery culture of bivalves‘, in FAO of the United Nations. Canada, p. 400.
Naji, A., Nuri, M. and Vethaak, A. D. (2018) ‗Microplastics contamination in molluscs from the northern part of the Persian Gulf‘, Environmental pollution. Elsevier, 235, pp. 113–120. doi: 10.1016/j.envpol.2017.12.046.
Narasimham, K. A. Muthiah P. Sundararajan D. & Vaithinathan N. 1988. Biology of great clam, Meretrix meretrix in The Korampallam Creek, Tuticorin. Indian J. Tuticorin research Centre of Central Marine Fisherie Research Institut, Fish. 35 (4) : 288-293.
Peng, L., Fua, D., Qi, H., Christopher, Q. L., Yu, H., & Ge, C. 2019. Micro- and nano-plastics in marine environment: Source, distribution and threats — A review. Science of the Total Environment. 698 :134254.
Phu, T. Q. (2000) ‗Clam farming in the Mekong Detal, Vietnam.‘, world fish, 19(4), pp. 60–62.
Phuong, N. N. et al. (2018) ‗Factors influencing the microplastic contamination of bivalves from the French Atlantic coast: Location, season and/or mode of life?‘, Marine Pollution Bulletin. Elsevier, 129(2), pp. 664–674. doi: 10.1016/j.marpolbul.2017.10.054.
Plastics Europe, 2016. Plastics the facts, 2016 an analysis of European plastics production, demand and waste data. Diakses pada 1 tanggal Februari 2020: http://www.plasticseurope.org
47
Prokić, M. D., Radovanović, T. B., Gavrić, J. P., and Faggio, C. 2019. Ecotoxicological effects of microplastics: Examination of biomarkers, current state and future perspectives. TrAC - Trends in Analytical Chemistry, 111, 37–46.
Richards, Z. T. and Beger, M. (2011) ‗A quantification of the standing stock of macro-debris in Majuro lagoon and its effect on hard coral communities‘, Marine pollution bulletin. Elsevier, 62(8), pp. 1693–1701.
Rochman, C. M., Hoh, E., Kurobe, T., & Teh, S. J., 2013. Ingested plastic transfers hazardous chemicals to fish and induces hepatic stress. Scientific reports. 3 (3263)
Rochman, C. M., Tahir, A., S. L. Williams, D. V. Baxa, R. Lam, J.T. Miller, F. C. Teh, S. Werorilangi & Teh., S.J., 2015. Anthropogenic debris in seafood: Plastic debris.
Rochman, C. M., Brookson, C., Bikker, J., Djuric, N., Earn, A., Bucci, K., & Hung, C. 2019. Rethinking microplastics as a diverse contaminant suite. Environmental Toxicology and Chemistry. 38(4): 703–711.
Ryan, P. G. et al. (2019) GESAMP 2019 Guidelines for the monitoring & assessment of plastic litter in the ocean Reports & Studies 99. United Nations Environment Programme (UNEP).
Sakila, N., D, A, Ramadhani., Ani, S., 2018. Pertumbuhan dan Struktur Umur Kerang Kepah (Meretrix meretrix) di Kampung Nipah Desa Sei Nagalawan Kecamatan Perbaungan Kabupaten Serdang Bedagai. Journal of Marine and Aquatic Sciences 4(2), 316-323.
Santana, M.F.M., Ascer, L.G., Custódio, M.R., Moreira, F.T. & Turra, A. 2016. Microplastic contamination in natural mussel beds from a Brazilian urbanized coastal region: Rapid evaluation through bioassessment. Mar. Pollut. Bull., 106(1): 183-189.
Sari, K. (2018) Keberadaan Mikroplastik pada Hewan Filter Feeder di Padang Lamun Kepulauan Spermonde Kota Makassar, Skripsi. universitas Hasanuddin.
Setyobudiandi Isdradjat , Eddy Soekendarsih, Yon Vitner, R. S. (2004) ‗Jurnal ilmu-ilmu perairan dan perikanan Indonesia.‘, Jurnal Ilmu-Ilmu Perairan dan Perikanan Indonesia, 16(2), pp. 167–175. Available at: http://journal.ipb.ac.id/index.php/jippi/article/view/12079/9305.
Shim, W. J. and Thomposon, R. C. (2015) ‗Microplastics in the Ocean‘, Archives of environmental contamination and toxicology, 69(3), pp. 265–268. doi:
10.1007/s00244-015-0216-x.
Smith, M., Love, D. C., Rochman, C. M., & Neff, R. A. (2018). Microplastics in Seafood and the Implications for Human Health. Current Environmental Health. 5(3), pp. 375–386. doi: 10.1007/s40572-018-0206-z.
Soemodihardjo, S., Roberts, D. and Kastoro, W. (1986) Shallow water marine molluscs of north-west Java, Lembaga Ilmu Pengetahuan Indonesia. Jakarta. 83p. Jakarta: Lembaga Ilmu Pengetahuan Indonesia.
Sugiyono (2007) Statistik Untuk Penelitian. Bandung: Penerbit Alfabeta. doi:
10.1016/S0969-4765(04)00066-9.
Sun, J., Dai, X., Wang, Q., van Loosdrecht, M. C. M., & Ni, B. J. 2019. Microplastics in wastewater treatment plants: Detection, occurrence and removal. Water
48
Research, vol. 152, 21–37.
Sutton, R. et al. (2016) ‗Microplastic contamination in the San Francisco Bay , California , USA‘, MPB. Elsevier Ltd, 109(1), pp. 230–235. doi: 10.1016/j.marpolbul.2016.05.077.
Tanaka, K. and Takada, H. (2016) ‗Microplastic fragments and microbeads in digestive tracts of planktivorous fish from urban coastal waters‘, Scientific reports. Nature Publishing Group, 6, p. 34351.
Tantanasarit, C., Babel, S., Englande, A.J., & Meksumpun, S. 2013. Influence of size and density on filtration rate modeling and nutrient uptake by green mussel (Perna viridis). Marine pollution bulletin, 68(1), 38-45.
Thiet, C. C. and Kumar, M. S. (2008) ‗Clam (Meretrix lyrata) Hatchery Manual‘, Aquaculture Research Sub-Institute for North Centre (ARSINC) South Australian Research and Development Institute (SARDI), pp. 4–5.
Thompson, R.C, Olsen Y, Mitchell., R, P, Davis, A, Rowland., S. J, John., A, W, G, M, Gonigle., D, Russel., A, E. 2004. Lost at sea: where is all the plastic? Science, 304 (5627): 838.
Thompson, R. C, Swan S. H, Moore C, J, & Vom Saal F, S. 2009. Our plastic age. Philosophical Transactions of the Royal Society B. Biological Science. 364 (1526): 2153-2166.
Thompson, R. C. 2015. Microplastics in the Marine Environment: Sources, Consequences and Solutions. Chapter 7. 185–200.
Versteegh, L. 2012. Assessment of Shell Thickness in Mytilus edulis as a Biomarker for Establishment of Its Health and Thiamine Status. Institute of Applied Environmental Sciences Stockholms Universitet.
Veerasingam, S., Suneel, V., Saha, M., and Vethamony, P. 2017. Microplastic pollution : A serious threat to the marine ecosystem. Frontiers in MicrobiologyVeerasingam, S. et al. (2017) ‗Microplastic pollution : A serious threat to the marine ecosystem‘, Frontiers in Microbiology, 18(Januari). doi: 10.3389/fmicb.2014.00603.
Wahdani, A., Yaqin, K., Rukminasari, N., Inaku, D. F., & Fachruddin, L. (2020). Konsentrasi mikroplastik pada kerang manila Venerupis philippinarum di perairan Maccini Baji, Kecamatan Labakkang, Kabupaten Pangkajene Kepulauan, Sulawesi Selatan. Maspari Journal: Marine Science Research, 12(2), 1-14.
Walkinshaw, C. Lindeque, P, K, Thompson., Richard.,T, T, Cole and Matthew. (2020) ‗Microplastics and seafood: lower trophic organisms at highest risk of contamination‘, Ecotoxicology and Environmental Safety. Elsevier, 190, p.
110066. doi: 10.1016/j.ecoenv.2019.110066.
Wang, T., Zou, X., Li, B., Yao, Y., Zang, Z., Li, Y., Yu, W., Wang, W., 2019. Preliminary study of the source apportionment and diversity of microplastics: taking floating microplastics in the South China Sea as an example. Environ. Pollut. 245: 965–974.
Widiniarko, B. and Hantoro, I. (2018) Mikroplastik dalam Seafood dari Pantai Utara Jawa. Semarang: Universitas Katolik Soegijapranata.

49
WoRMS (2012) WoRMS - World Register of Marine Species - Meretrix meretrix (Linnaeus, 1758). Accessed through: World Register of Marine Species at: http://www.marinespecies.org/aphia.php?p=taxdetails&id=224891 on 2020-09-12.
Wright, S. L. and Kelly, F. J. (2017) ‗Plastic and human health: a micro issue?‘, Environmental science & technology. ACS Publications, 51(12), pp. 6634–6647.
Wright, S. L., Thompson, R. C. and Galloway, T. S. (2013) ‗The physical impacts of microplastics on marine organisms: a review‘, Environmental pollution. Elsevier, 178, pp. 483–492.
Yap, C, K & Al-Barwani S, M. 2012. A Comparative Study of Condition Indices and Heavy Metals in Perna viridis Populations at Sebatu and Muar, Peninsular Malaysia. Sains Malaysiana, 41(9), 1063-1069.
Yaqin, K., L. Fachruddin, & N.F. Rahim. 2015. Studi Kandungan Logam Timbal (PB) Kerang Hijau , Perna viridis Terhadap Indeks Kondisinya. Jurnal Lingkungan Indonesia, III(6), 309–317.
Yaqin, K. & A. Kabangnga, 2015. Penggunaan Indeks Kondisi Kerang Hijau (Perna Viridis) sebagai Biomarker untuk Mendeteksi Pengaruh Pengasaman Laut Terhadap Toksisitas Logam PB. Torani (Jurnal Ilmu Kelautan dan Perikanan). 25(1): 32-38.
Yaqin, K., Nursyamsiah, M.T. Umar, L. Fachruddin,& B. Bachtiar. 2014. Apakah Variasi Ukuran Panjang Cangkang Memengaruhi Konsentrasi Logam Timbal di dalam Daging Kerang Hijau, Perna viridis? Prosiding Simposium Nasional I Kelatan Dan Perikan. Fakultas Ilmu Kelautandan Perikanan, Universitas Hasanuddin. Makasssar, 1–13.
Yaqin, 2019. Petunjuk Aplikasi Biomaker Sederhana. Makassar: Unhas Press.
Yamane, T. (1967) Statistics : An Introductory Analysis. 2nd edn. New York: Harper and Row.
Yang, C. Z. et al. (2011) ‗Most plastic products release estrogenic chemicals: a potential health problem that can be solved‘, Environmental health perspectives.
National Institute of Environmental Health Sciences, 119(7), pp. 989–996. doi: 10.1289/ehp.1003220.
Yuan, W. et al. (2019) ‗Microplastic abundance, distribution and composition in water, sediments, and wild fish from Poyang Lake, China‘, Ecotoxicology and environmental safety. Elsevier, 170, pp. 180–187.
Zettler, E. R., Mincer, T. J. and Amaral-Zettler, L. A. (2013) ‗Life in the ―plastisphere‖: Microbial communities on plastic marine debris‘, Environmental Science and Technology, 47(13), pp. 7137–7146. doi: 10.1021/es401288x.
50
LAMPIRAN
51
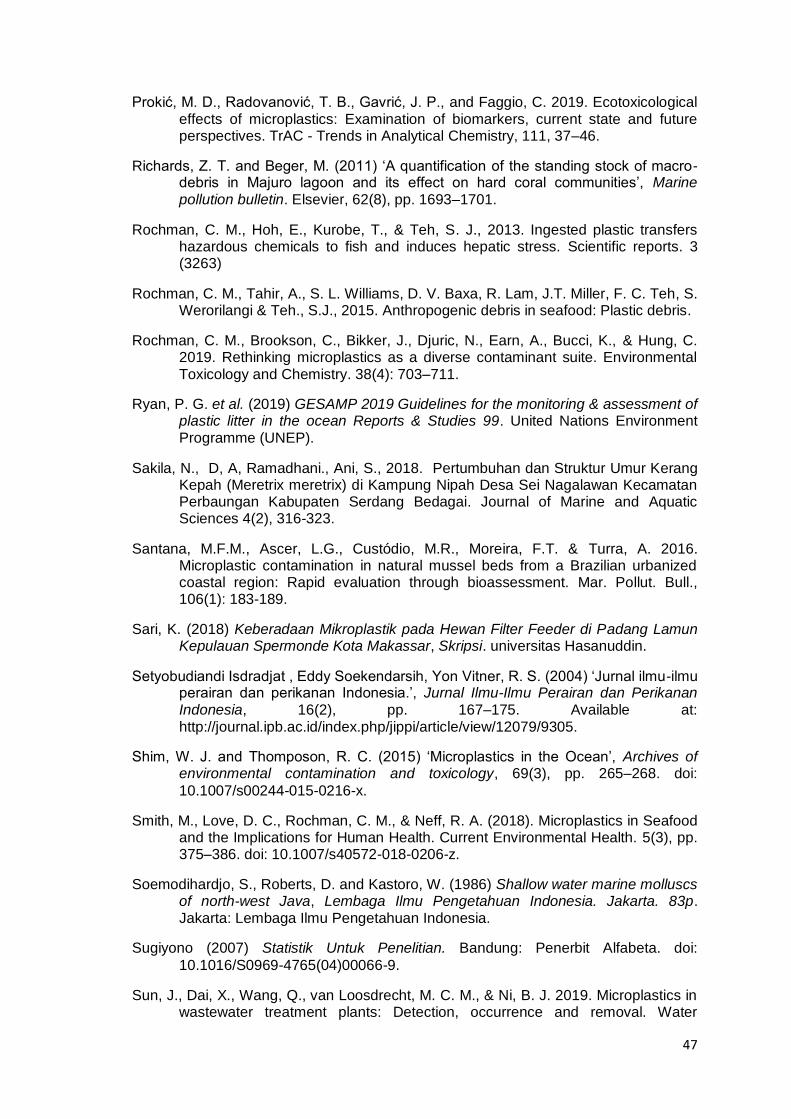
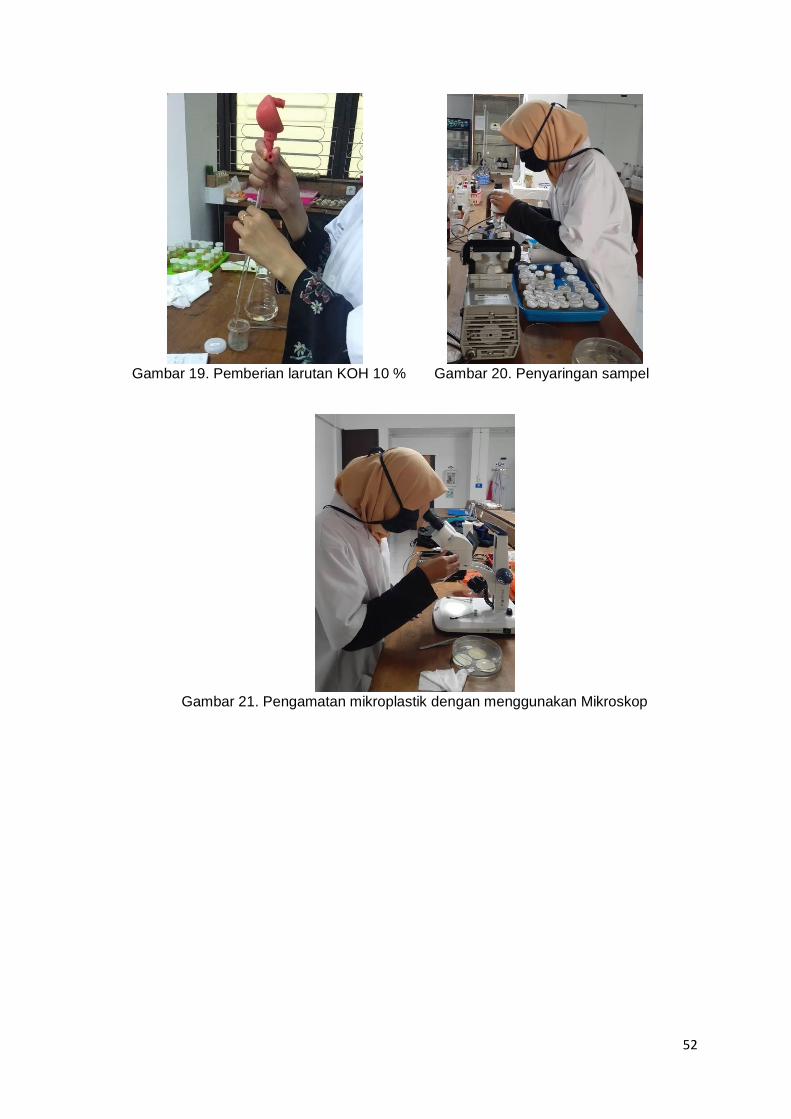
Lampiran 1. Dokumentasi Penelitian
Gambar 16. Keadaan sekitar Pantai Lemo
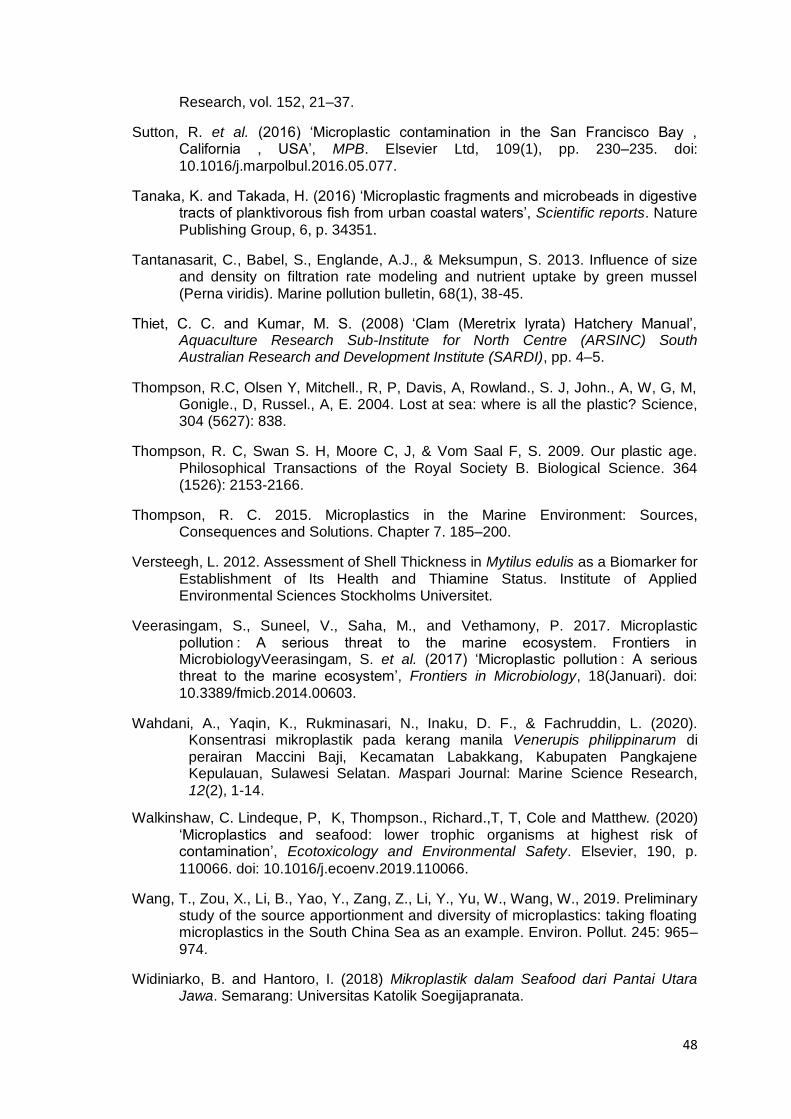
Gambar 17. Pengambilan sampel kerang tahu (Meretrix meretrix)
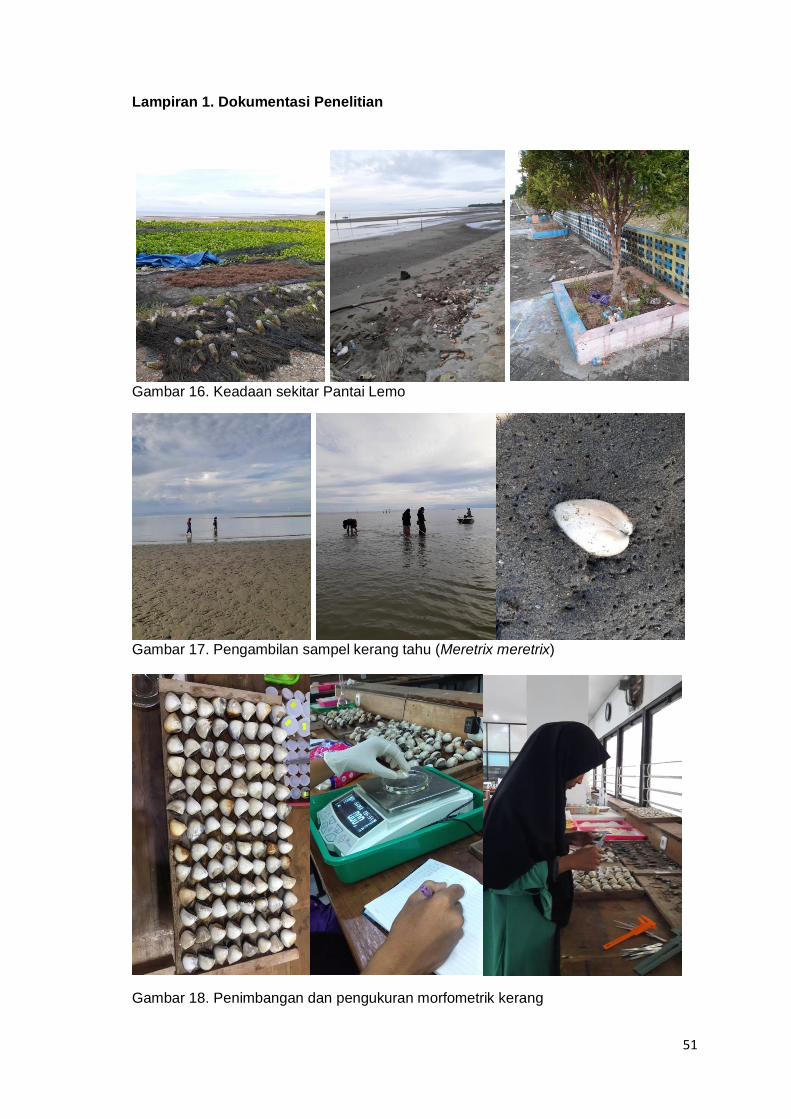
Gambar 18. Penimbangan dan pengukuran morfometrik kerang
52
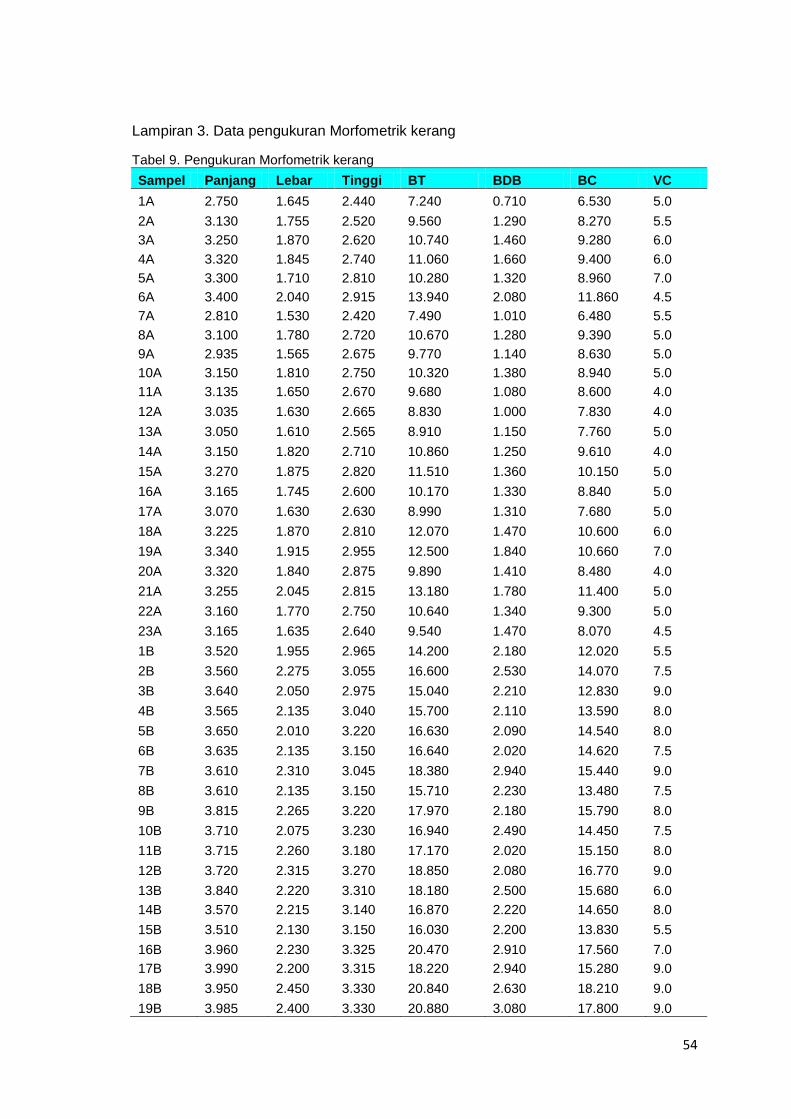
Gambar 19. Pemberian larutan KOH 10 % Gambar 20. Penyaringan sampel
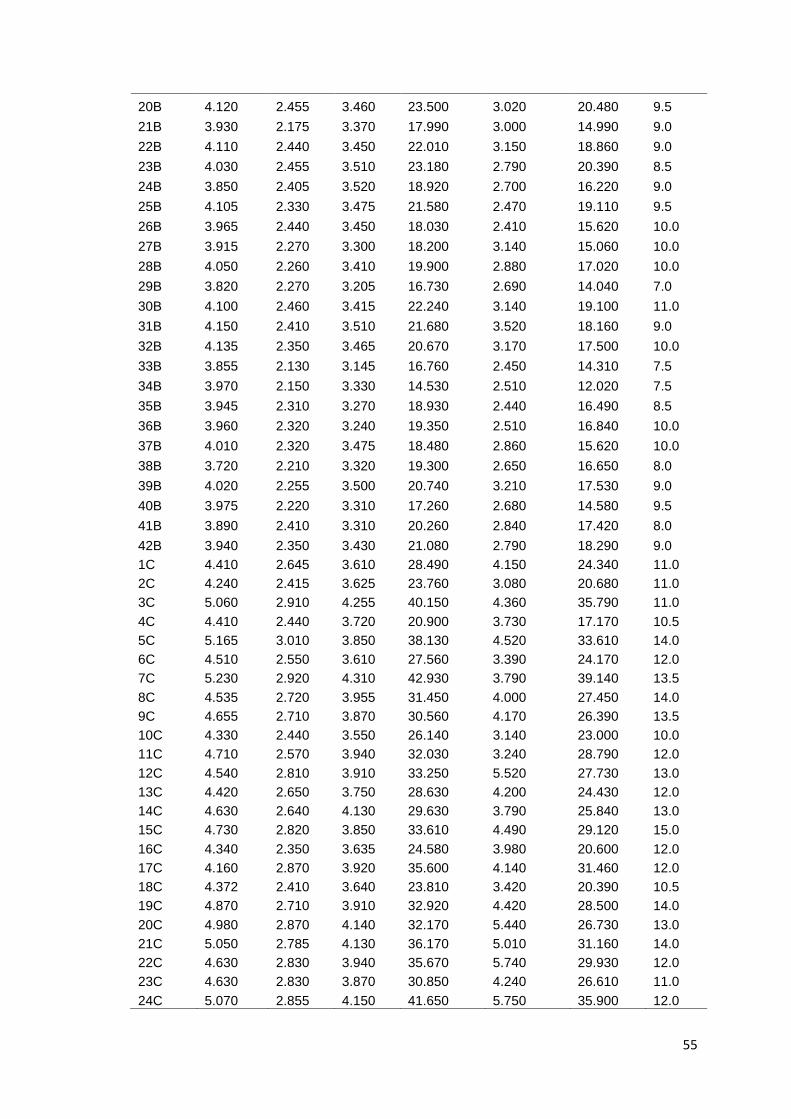
Gambar 21. Pengamatan mikroplastik dengan menggunakan Mikroskop

53
Lampiran 2. Perhitungan kelompok ukuran panjang cangkang kerang
Panjang terkecil : 2,75 cm
Panjang terbesar : 5,24 cm
Logaritma harga terbesar = log 5,24 = 0,7193
Logaritma harga terkecil = log 2,75= 0,4393
Beda logaritma = 0,7193 – 0,4395 = 0,2800
Banyaknya kelas yang dikehendaki = 3
Beda logaritma tengah-tengah kelas = 0,2800 = 0,0933 3
Logaritma tengah-tengah kelas pertama = 0,4393 + 0,0933 = 0,4859 2 Harga-harga yang terdapat di dalam kelas panjang yaitu:
Kelas Logaritma Antilog
Harga terendah Tengah kelas Harga terendah Tengah kelas
I 0,4393 0,4859 2,75 3,06
Il 0,5326 0,5792 3,41 3,79
Ill 0,6259 0,6725 4,22 4,70
Kelas-kelas panjang yang terbetuk dan jumlah sampel tiap kelas:
Kelas l : 2,75 - 3,40 = 33 individu
Kelas ll : 3,41 - 4,21 = 60 individu
Kelas lll : 4,22 – 5,24 = 74 invididu
167 individu
Jumlah sampel yang dibutuhkan :
=N
1 + N ( 2)
=1
1 + 1 (0 0 2)
=1
1 + 0 1
= 11 1 0 ~ 118 ekor
Jumlah sampel tiap kelas :
=Ni
N
=
1 11
= 23 ekor
= 0
1 11
= 42 ekor
=
1 11
= 53 ekor
Total Sampel = 23+42+53 = 118 ekor
54
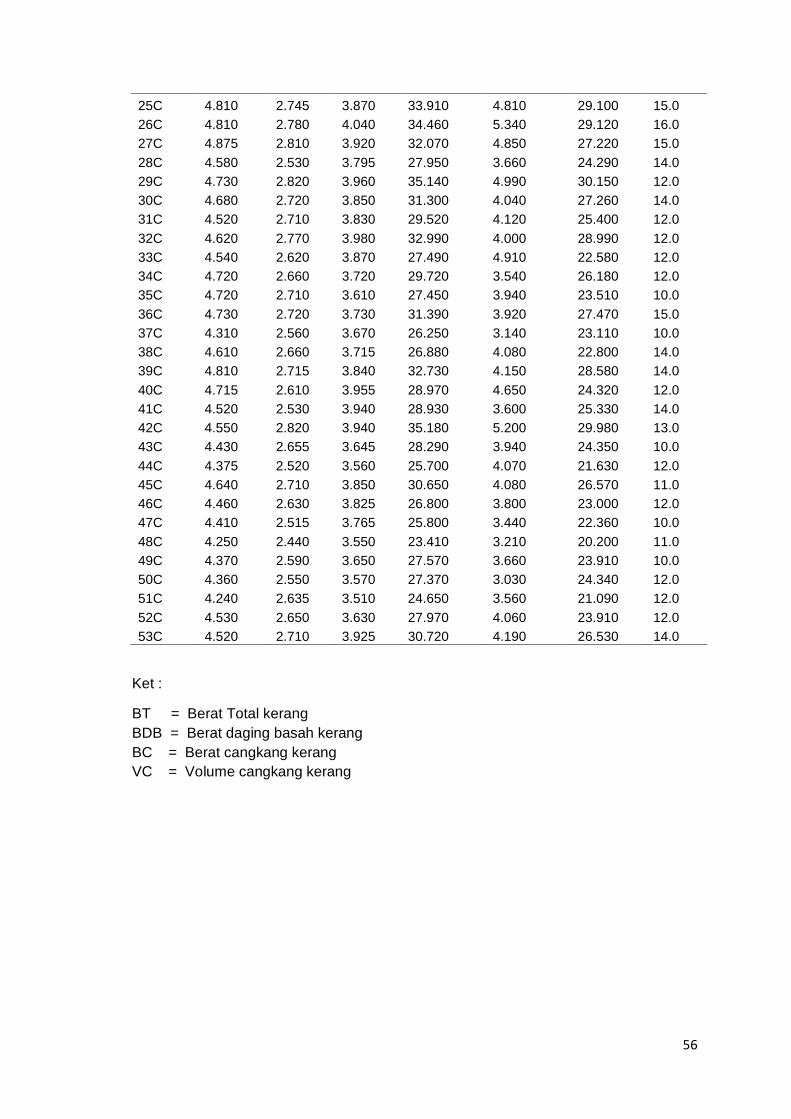
Lampiran 3. Data pengukuran Morfometrik kerang
Tabel 9. Pengukuran Morfometrik kerang
Sampel Panjang Lebar Tinggi BT BDB BC VC
1A 2.750 1.645 2.440 7.240 0.710 6.530 5.0
2A 3.130 1.755 2.520 9.560 1.290 8.270 5.5
3A 3.250 1.870 2.620 10.740 1.460 9.280 6.0
4A 3.320 1.845 2.740 11.060 1.660 9.400 6.0
5A 3.300 1.710 2.810 10.280 1.320 8.960 7.0
6A 3.400 2.040 2.915 13.940 2.080 11.860 4.5
7A 2.810 1.530 2.420 7.490 1.010 6.480 5.5
8A 3.100 1.780 2.720 10.670 1.280 9.390 5.0
9A 2.935 1.565 2.675 9.770 1.140 8.630 5.0
10A 3.150 1.810 2.750 10.320 1.380 8.940 5.0
11A 3.135 1.650 2.670 9.680 1.080 8.600 4.0
12A 3.035 1.630 2.665 8.830 1.000 7.830 4.0
13A 3.050 1.610 2.565 8.910 1.150 7.760 5.0
14A 3.150 1.820 2.710 10.860 1.250 9.610 4.0
15A 3.270 1.875 2.820 11.510 1.360 10.150 5.0
16A 3.165 1.745 2.600 10.170 1.330 8.840 5.0
17A 3.070 1.630 2.630 8.990 1.310 7.680 5.0
18A 3.225 1.870 2.810 12.070 1.470 10.600 6.0
19A 3.340 1.915 2.955 12.500 1.840 10.660 7.0
20A 3.320 1.840 2.875 9.890 1.410 8.480 4.0
21A 3.255 2.045 2.815 13.180 1.780 11.400 5.0
22A 3.160 1.770 2.750 10.640 1.340 9.300 5.0
23A 3.165 1.635 2.640 9.540 1.470 8.070 4.5
1B 3.520 1.955 2.965 14.200 2.180 12.020 5.5
2B 3.560 2.275 3.055 16.600 2.530 14.070 7.5
3B 3.640 2.050 2.975 15.040 2.210 12.830 9.0
4B 3.565 2.135 3.040 15.700 2.110 13.590 8.0
5B 3.650 2.010 3.220 16.630 2.090 14.540 8.0
6B 3.635 2.135 3.150 16.640 2.020 14.620 7.5
7B 3.610 2.310 3.045 18.380 2.940 15.440 9.0
8B 3.610 2.135 3.150 15.710 2.230 13.480 7.5
9B 3.815 2.265 3.220 17.970 2.180 15.790 8.0
10B 3.710 2.075 3.230 16.940 2.490 14.450 7.5
11B 3.715 2.260 3.180 17.170 2.020 15.150 8.0
12B 3.720 2.315 3.270 18.850 2.080 16.770 9.0
13B 3.840 2.220 3.310 18.180 2.500 15.680 6.0
14B 3.570 2.215 3.140 16.870 2.220 14.650 8.0
15B 3.510 2.130 3.150 16.030 2.200 13.830 5.5
16B 3.960 2.230 3.325 20.470 2.910 17.560 7.0
17B 3.990 2.200 3.315 18.220 2.940 15.280 9.0
18B 3.950 2.450 3.330 20.840 2.630 18.210 9.0
19B 3.985 2.400 3.330 20.880 3.080 17.800 9.0
55
20B 4.120 2.455 3.460 23.500 3.020 20.480 9.5
21B 3.930 2.175 3.370 17.990 3.000 14.990 9.0
22B 4.110 2.440 3.450 22.010 3.150 18.860 9.0
23B 4.030 2.455 3.510 23.180 2.790 20.390 8.5
24B 3.850 2.405 3.520 18.920 2.700 16.220 9.0
25B 4.105 2.330 3.475 21.580 2.470 19.110 9.5
26B 3.965 2.440 3.450 18.030 2.410 15.620 10.0
27B 3.915 2.270 3.300 18.200 3.140 15.060 10.0
28B 4.050 2.260 3.410 19.900 2.880 17.020 10.0
29B 3.820 2.270 3.205 16.730 2.690 14.040 7.0
30B 4.100 2.460 3.415 22.240 3.140 19.100 11.0
31B 4.150 2.410 3.510 21.680 3.520 18.160 9.0
32B 4.135 2.350 3.465 20.670 3.170 17.500 10.0
33B 3.855 2.130 3.145 16.760 2.450 14.310 7.5
34B 3.970 2.150 3.330 14.530 2.510 12.020 7.5
35B 3.945 2.310 3.270 18.930 2.440 16.490 8.5
36B 3.960 2.320 3.240 19.350 2.510 16.840 10.0
37B 4.010 2.320 3.475 18.480 2.860 15.620 10.0
38B 3.720 2.210 3.320 19.300 2.650 16.650 8.0
39B 4.020 2.255 3.500 20.740 3.210 17.530 9.0
40B 3.975 2.220 3.310 17.260 2.680 14.580 9.5
41B 3.890 2.410 3.310 20.260 2.840 17.420 8.0
42B 3.940 2.350 3.430 21.080 2.790 18.290 9.0
1C 4.410 2.645 3.610 28.490 4.150 24.340 11.0
2C 4.240 2.415 3.625 23.760 3.080 20.680 11.0
3C 5.060 2.910 4.255 40.150 4.360 35.790 11.0
4C 4.410 2.440 3.720 20.900 3.730 17.170 10.5
5C 5.165 3.010 3.850 38.130 4.520 33.610 14.0
6C 4.510 2.550 3.610 27.560 3.390 24.170 12.0
7C 5.230 2.920 4.310 42.930 3.790 39.140 13.5
8C 4.535 2.720 3.955 31.450 4.000 27.450 14.0
9C 4.655 2.710 3.870 30.560 4.170 26.390 13.5
10C 4.330 2.440 3.550 26.140 3.140 23.000 10.0
11C 4.710 2.570 3.940 32.030 3.240 28.790 12.0
12C 4.540 2.810 3.910 33.250 5.520 27.730 13.0
13C 4.420 2.650 3.750 28.630 4.200 24.430 12.0
14C 4.630 2.640 4.130 29.630 3.790 25.840 13.0
15C 4.730 2.820 3.850 33.610 4.490 29.120 15.0
16C 4.340 2.350 3.635 24.580 3.980 20.600 12.0
17C 4.160 2.870 3.920 35.600 4.140 31.460 12.0
18C 4.372 2.410 3.640 23.810 3.420 20.390 10.5
19C 4.870 2.710 3.910 32.920 4.420 28.500 14.0
20C 4.980 2.870 4.140 32.170 5.440 26.730 13.0
21C 5.050 2.785 4.130 36.170 5.010 31.160 14.0
22C 4.630 2.830 3.940 35.670 5.740 29.930 12.0
23C 4.630 2.830 3.870 30.850 4.240 26.610 11.0
24C 5.070 2.855 4.150 41.650 5.750 35.900 12.0
56
25C 4.810 2.745 3.870 33.910 4.810 29.100 15.0
26C 4.810 2.780 4.040 34.460 5.340 29.120 16.0
27C 4.875 2.810 3.920 32.070 4.850 27.220 15.0
28C 4.580 2.530 3.795 27.950 3.660 24.290 14.0
29C 4.730 2.820 3.960 35.140 4.990 30.150 12.0
30C 4.680 2.720 3.850 31.300 4.040 27.260 14.0
31C 4.520 2.710 3.830 29.520 4.120 25.400 12.0
32C 4.620 2.770 3.980 32.990 4.000 28.990 12.0
33C 4.540 2.620 3.870 27.490 4.910 22.580 12.0
34C 4.720 2.660 3.720 29.720 3.540 26.180 12.0
35C 4.720 2.710 3.610 27.450 3.940 23.510 10.0
36C 4.730 2.720 3.730 31.390 3.920 27.470 15.0
37C 4.310 2.560 3.670 26.250 3.140 23.110 10.0
38C 4.610 2.660 3.715 26.880 4.080 22.800 14.0
39C 4.810 2.715 3.840 32.730 4.150 28.580 14.0
40C 4.715 2.610 3.955 28.970 4.650 24.320 12.0
41C 4.520 2.530 3.940 28.930 3.600 25.330 14.0
42C 4.550 2.820 3.940 35.180 5.200 29.980 13.0
43C 4.430 2.655 3.645 28.290 3.940 24.350 10.0
44C 4.375 2.520 3.560 25.700 4.070 21.630 12.0
45C 4.640 2.710 3.850 30.650 4.080 26.570 11.0
46C 4.460 2.630 3.825 26.800 3.800 23.000 12.0
47C 4.410 2.515 3.765 25.800 3.440 22.360 10.0
48C 4.250 2.440 3.550 23.410 3.210 20.200 11.0
49C 4.370 2.590 3.650 27.570 3.660 23.910 10.0
50C 4.360 2.550 3.570 27.370 3.030 24.340 12.0
51C 4.240 2.635 3.510 24.650 3.560 21.090 12.0
52C 4.530 2.650 3.630 27.970 4.060 23.910 12.0
53C 4.520 2.710 3.925 30.720 4.190 26.530 14.0
Ket :
BT = Berat Total kerang
BDB = Berat daging basah kerang
BC = Berat cangkang kerang
VC = Volume cangkang kerang
57
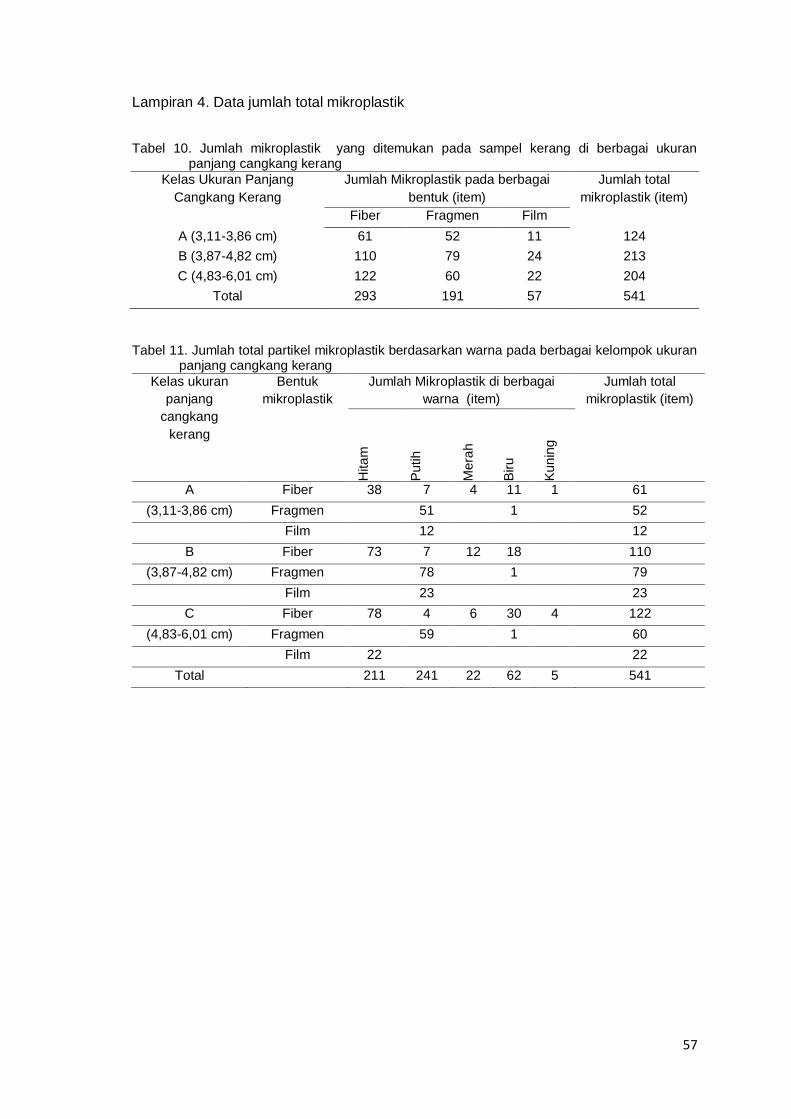
Lampiran 4. Data jumlah total mikroplastik
Tabel 10. Jumlah mikroplastik yang ditemukan pada sampel kerang di berbagai ukuran
panjang cangkang kerang Kelas Ukuran Panjang
Cangkang Kerang
Jumlah Mikroplastik pada berbagai
bentuk (item)
Jumlah total
mikroplastik (item)
Fiber Fragmen Film
A (3,11-3,86 cm) 61 52 11 124
B (3,87-4,82 cm) 110 79 24 213
C (4,83-6,01 cm) 122 60 22 204
Total 293 191 57 541
Tabel 11. Jumlah total partikel mikroplastik berdasarkan warna pada berbagai kelompok ukuran
panjang cangkang kerang Kelas ukuran
panjang
cangkang
kerang
Bentuk
mikroplastik
Jumlah Mikroplastik di berbagai
warna (item)
Jumlah total
mikroplastik (item)
Hita
m
Pu
tih
Me
rah
Bir
u
Ku
nin
g
A Fiber 38 7 4 11 1 61
(3,11-3,86 cm) Fragmen 51 1 52
Film 12 12
B Fiber 73 7 12 18 110
(3,87-4,82 cm) Fragmen 78 1 79
Film 23 23
C Fiber 78 4 6 30 4 122
(4,83-6,01 cm) Fragmen 59 1 60
Film 22 22
Total 211 241 22 62 5 541
58
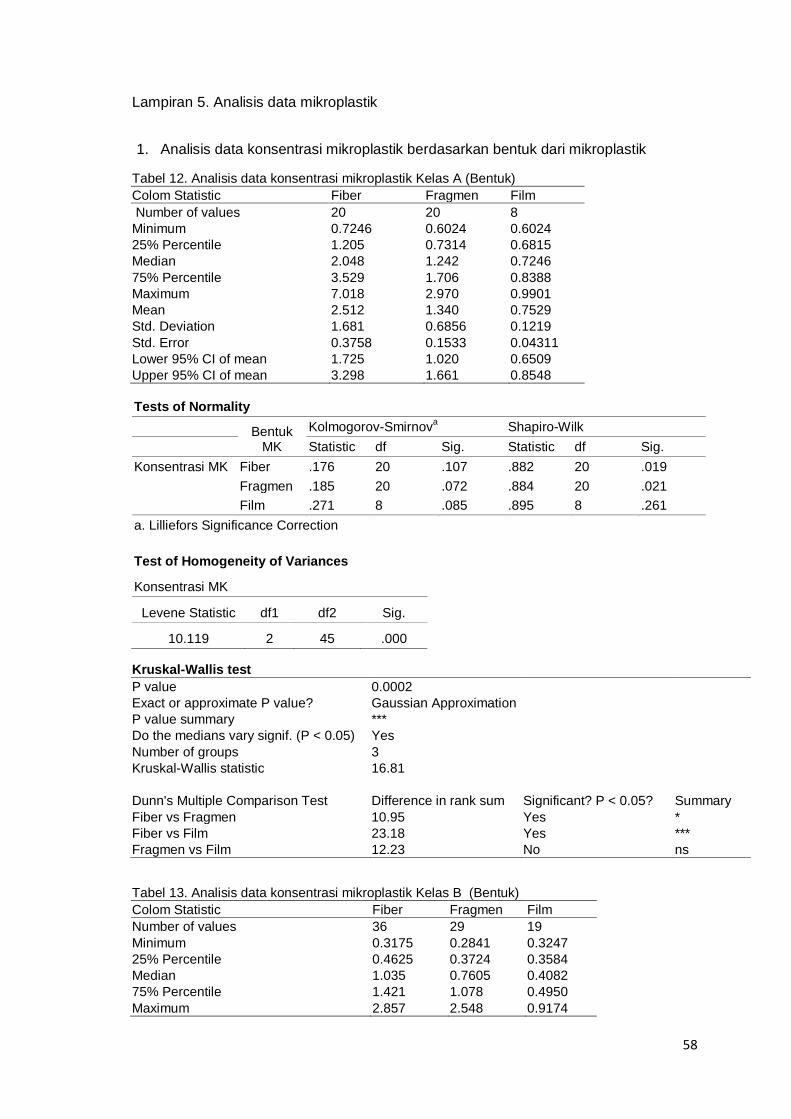
Lampiran 5. Analisis data mikroplastik
1. Analisis data konsentrasi mikroplastik berdasarkan bentuk dari mikroplastik
Tabel 12. Analisis data konsentrasi mikroplastik Kelas A (Bentuk)
Colom Statistic Fiber Fragmen Film
Number of values 20 20 8
Minimum 0.7246 0.6024 0.6024
25% Percentile 1.205 0.7314 0.6815
Median 2.048 1.242 0.7246
75% Percentile 3.529 1.706 0.8388
Maximum 7.018 2.970 0.9901
Mean 2.512 1.340 0.7529
Std. Deviation 1.681 0.6856 0.1219
Std. Error 0.3758 0.1533 0.04311
Lower 95% CI of mean 1.725 1.020 0.6509
Upper 95% CI of mean 3.298 1.661 0.8548
Tests of Normality
Bentuk MK
Kolmogorov-Smirnova Shapiro-Wilk
Statistic df Sig. Statistic df Sig.
Konsentrasi MK Fiber .176 20 .107 .882 20 .019
Fragmen .185 20 .072 .884 20 .021
Film .271 8 .085 .895 8 .261
a. Lilliefors Significance Correction
Test of Homogeneity of Variances
Konsentrasi MK
Levene Statistic df1 df2 Sig.
10.119 2 45 .000
Kruskal-Wallis test
P value 0.0002
Exact or approximate P value? Gaussian Approximation
P value summary ***
Do the medians vary signif. (P < 0.05) Yes
Number of groups 3
Kruskal-Wallis statistic 16.81
Dunn's Multiple Comparison Test Difference in rank sum Significant? P < 0.05? Summary
Fiber vs Fragmen 10.95 Yes *
Fiber vs Film 23.18 Yes ***
Fragmen vs Film 12.23 No ns
Tabel 13. Analisis data konsentrasi mikroplastik Kelas B (Bentuk)
Colom Statistic Fiber Fragmen Film
Number of values 36 29 19
Minimum 0.3175 0.2841 0.3247
25% Percentile 0.4625 0.3724 0.3584
Median 1.035 0.7605 0.4082
75% Percentile 1.421 1.078 0.4950
Maximum 2.857 2.548 0.9174
59
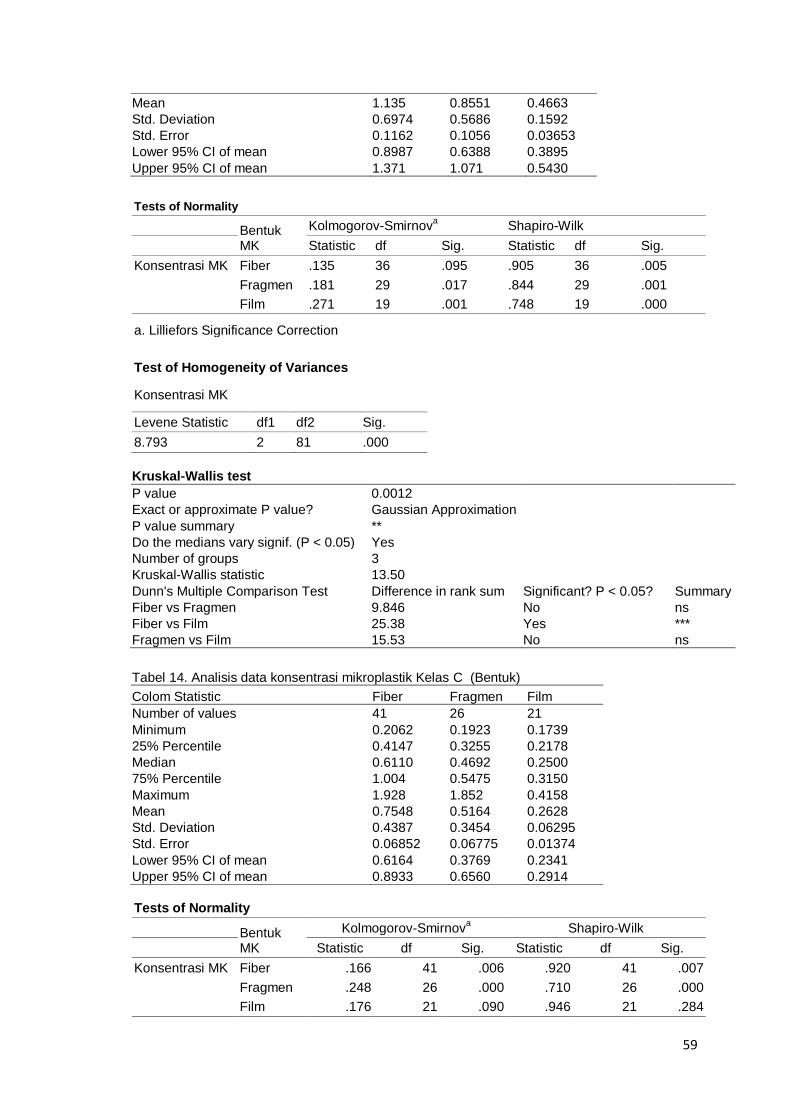
Mean 1.135 0.8551 0.4663
Std. Deviation 0.6974 0.5686 0.1592
Std. Error 0.1162 0.1056 0.03653
Lower 95% CI of mean 0.8987 0.6388 0.3895
Upper 95% CI of mean 1.371 1.071 0.5430
Tests of Normality
Bentuk MK
Kolmogorov-Smirnova Shapiro-Wilk
Statistic df Sig. Statistic df Sig.
Konsentrasi MK Fiber .135 36 .095 .905 36 .005
Fragmen .181 29 .017 .844 29 .001
Film .271 19 .001 .748 19 .000
a. Lilliefors Significance Correction
Test of Homogeneity of Variances
Konsentrasi MK
Levene Statistic df1 df2 Sig.
8.793 2 81 .000
Kruskal-Wallis test
P value 0.0012
Exact or approximate P value? Gaussian Approximation
P value summary **
Do the medians vary signif. (P < 0.05) Yes
Number of groups 3
Kruskal-Wallis statistic 13.50
Dunn's Multiple Comparison Test Difference in rank sum Significant? P < 0.05? Summary
Fiber vs Fragmen 9.846 No ns
Fiber vs Film 25.38 Yes ***
Fragmen vs Film 15.53 No ns
Tabel 14. Analisis data konsentrasi mikroplastik Kelas C (Bentuk)
Colom Statistic Fiber Fragmen Film
Number of values 41 26 21
Minimum 0.2062 0.1923 0.1739
25% Percentile 0.4147 0.3255 0.2178
Median 0.6110 0.4692 0.2500
75% Percentile 1.004 0.5475 0.3150
Maximum 1.928 1.852 0.4158
Mean 0.7548 0.5164 0.2628
Std. Deviation 0.4387 0.3454 0.06295
Std. Error 0.06852 0.06775 0.01374
Lower 95% CI of mean 0.6164 0.3769 0.2341
Upper 95% CI of mean 0.8933 0.6560 0.2914
Tests of Normality
Bentuk MK
Kolmogorov-Smirnova Shapiro-Wilk
Statistic df Sig. Statistic df Sig.
Konsentrasi MK Fiber .166 41 .006 .920 41 .007
Fragmen .248 26 .000 .710 26 .000
Film .176 21 .090 .946 21 .284
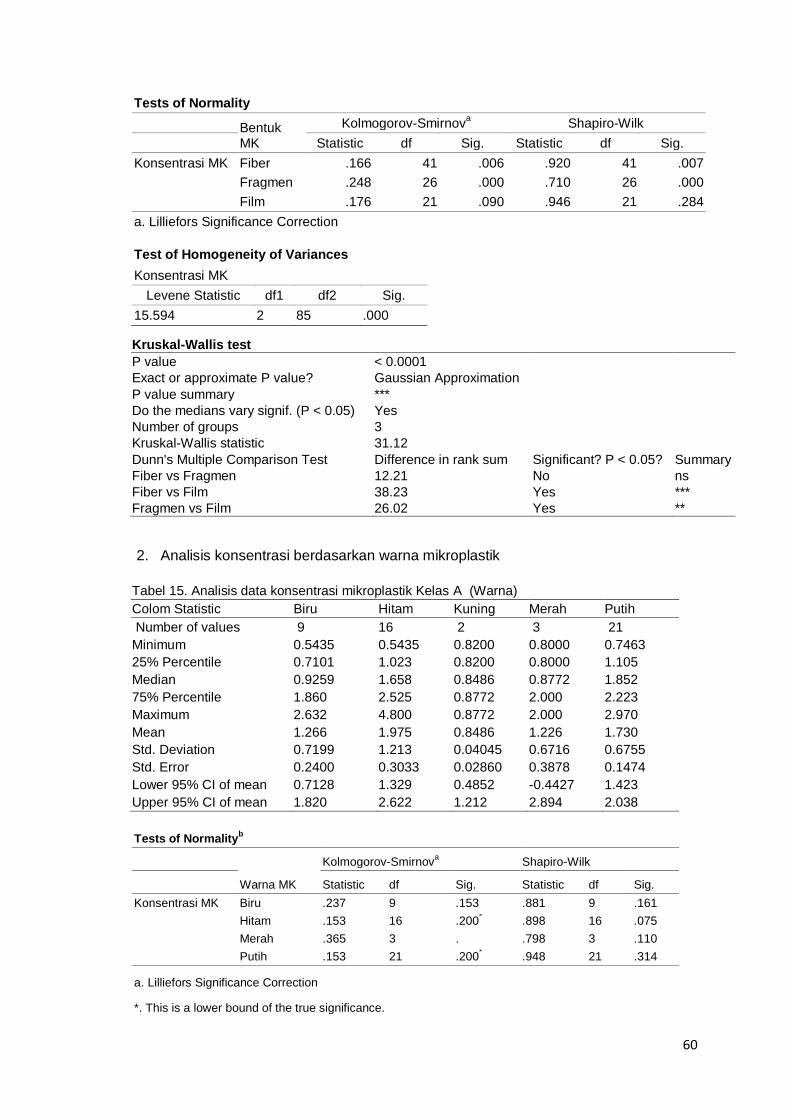
60
Tests of Normality
Bentuk MK
Kolmogorov-Smirnova Shapiro-Wilk
Statistic df Sig. Statistic df Sig.
Konsentrasi MK Fiber .166 41 .006 .920 41 .007
Fragmen .248 26 .000 .710 26 .000
Film .176 21 .090 .946 21 .284
a. Lilliefors Significance Correction
Test of Homogeneity of Variances
Konsentrasi MK
Levene Statistic df1 df2 Sig.
15.594 2 85 .000
Kruskal-Wallis test
P value < 0.0001
Exact or approximate P value? Gaussian Approximation
P value summary ***
Do the medians vary signif. (P < 0.05) Yes
Number of groups 3
Kruskal-Wallis statistic 31.12
Dunn's Multiple Comparison Test Difference in rank sum Significant? P < 0.05? Summary
Fiber vs Fragmen 12.21 No ns
Fiber vs Film 38.23 Yes ***
Fragmen vs Film 26.02 Yes **
2. Analisis konsentrasi berdasarkan warna mikroplastik
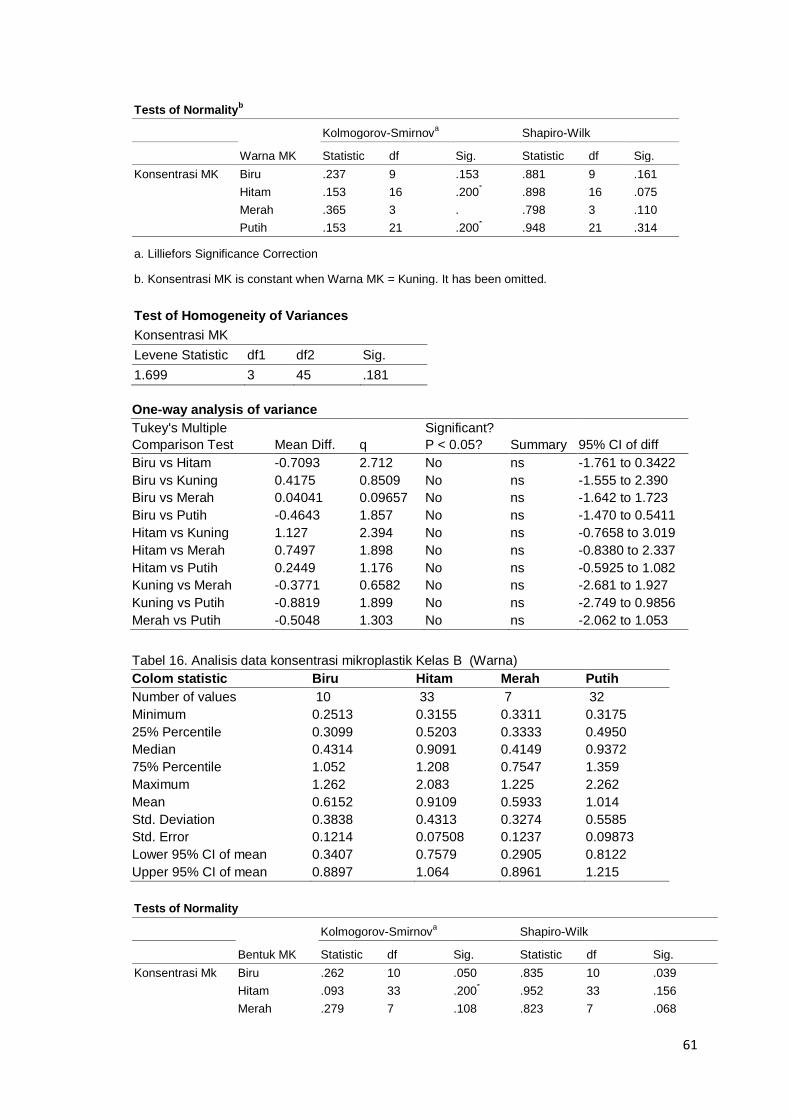
Tabel 15. Analisis data konsentrasi mikroplastik Kelas A (Warna)
Colom Statistic Biru Hitam Kuning Merah Putih
Number of values 9 16 2 3 21
Minimum 0.5435 0.5435 0.8200 0.8000 0.7463
25% Percentile 0.7101 1.023 0.8200 0.8000 1.105
Median 0.9259 1.658 0.8486 0.8772 1.852
75% Percentile 1.860 2.525 0.8772 2.000 2.223
Maximum 2.632 4.800 0.8772 2.000 2.970
Mean 1.266 1.975 0.8486 1.226 1.730
Std. Deviation 0.7199 1.213 0.04045 0.6716 0.6755
Std. Error 0.2400 0.3033 0.02860 0.3878 0.1474
Lower 95% CI of mean 0.7128 1.329 0.4852 -0.4427 1.423
Upper 95% CI of mean 1.820 2.622 1.212 2.894 2.038
Tests of Normalityb
Warna MK
Kolmogorov-Smirnova Shapiro-Wilk
Statistic df Sig. Statistic df Sig.
Konsentrasi MK Biru .237 9 .153 .881 9 .161
Hitam .153 16 .200* .898 16 .075
Merah .365 3 . .798 3 .110
Putih .153 21 .200* .948 21 .314
a. Lilliefors Significance Correction
*. This is a lower bound of the true significance.
61
Tests of Normalityb
Warna MK
Kolmogorov-Smirnova Shapiro-Wilk
Statistic df Sig. Statistic df Sig.
Konsentrasi MK Biru .237 9 .153 .881 9 .161
Hitam .153 16 .200* .898 16 .075
Merah .365 3 . .798 3 .110
Putih .153 21 .200* .948 21 .314
a. Lilliefors Significance Correction
b. Konsentrasi MK is constant when Warna MK = Kuning. It has been omitted.
Test of Homogeneity of Variances
Konsentrasi MK
Levene Statistic df1 df2 Sig.
1.699 3 45 .181
One-way analysis of variance
Tukey's Multiple
Comparison Test Mean Diff. q
Significant?
P < 0.05? Summary 95% CI of diff
Biru vs Hitam -0.7093 2.712 No ns -1.761 to 0.3422
Biru vs Kuning 0.4175 0.8509 No ns -1.555 to 2.390
Biru vs Merah 0.04041 0.09657 No ns -1.642 to 1.723
Biru vs Putih -0.4643 1.857 No ns -1.470 to 0.5411
Hitam vs Kuning 1.127 2.394 No ns -0.7658 to 3.019
Hitam vs Merah 0.7497 1.898 No ns -0.8380 to 2.337
Hitam vs Putih 0.2449 1.176 No ns -0.5925 to 1.082
Kuning vs Merah -0.3771 0.6582 No ns -2.681 to 1.927
Kuning vs Putih -0.8819 1.899 No ns -2.749 to 0.9856
Merah vs Putih -0.5048 1.303 No ns -2.062 to 1.053
Tabel 16. Analisis data konsentrasi mikroplastik Kelas B (Warna)
Colom statistic Biru Hitam Merah Putih
Number of values 10 33 7 32
Minimum 0.2513 0.3155 0.3311 0.3175
25% Percentile 0.3099 0.5203 0.3333 0.4950
Median 0.4314 0.9091 0.4149 0.9372
75% Percentile 1.052 1.208 0.7547 1.359
Maximum 1.262 2.083 1.225 2.262
Mean 0.6152 0.9109 0.5933 1.014
Std. Deviation 0.3838 0.4313 0.3274 0.5585
Std. Error 0.1214 0.07508 0.1237 0.09873
Lower 95% CI of mean 0.3407 0.7579 0.2905 0.8122
Upper 95% CI of mean 0.8897 1.064 0.8961 1.215
Tests of Normality
Bentuk MK
Kolmogorov-Smirnova Shapiro-Wilk
Statistic df Sig. Statistic df Sig.
Konsentrasi Mk Biru .262 10 .050 .835 10 .039
Hitam .093 33 .200* .952 33 .156
Merah .279 7 .108 .823 7 .068
62
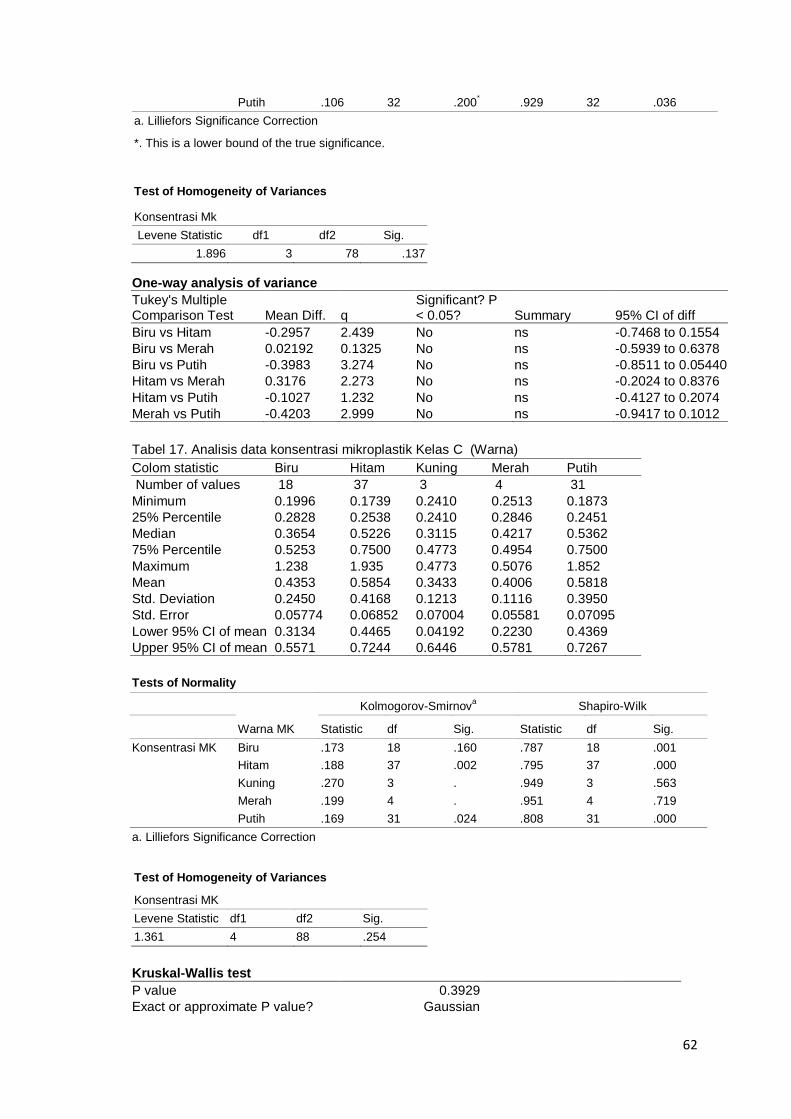
Putih .106 32 .200* .929 32 .036
a. Lilliefors Significance Correction
*. This is a lower bound of the true significance.
Test of Homogeneity of Variances
Konsentrasi Mk
Levene Statistic df1 df2 Sig.
1.896 3 78 .137
One-way analysis of variance
Tukey's Multiple Comparison Test Mean Diff. q
Significant? P < 0.05? Summary 95% CI of diff
Biru vs Hitam -0.2957 2.439 No ns -0.7468 to 0.1554
Biru vs Merah 0.02192 0.1325 No ns -0.5939 to 0.6378
Biru vs Putih -0.3983 3.274 No ns -0.8511 to 0.05440
Hitam vs Merah 0.3176 2.273 No ns -0.2024 to 0.8376
Hitam vs Putih -0.1027 1.232 No ns -0.4127 to 0.2074
Merah vs Putih -0.4203 2.999 No ns -0.9417 to 0.1012
Tabel 17. Analisis data konsentrasi mikroplastik Kelas C (Warna)
Colom statistic Biru Hitam Kuning Merah Putih
Number of values 18 37 3 4 31
Minimum 0.1996 0.1739 0.2410 0.2513 0.1873
25% Percentile 0.2828 0.2538 0.2410 0.2846 0.2451
Median 0.3654 0.5226 0.3115 0.4217 0.5362
75% Percentile 0.5253 0.7500 0.4773 0.4954 0.7500
Maximum 1.238 1.935 0.4773 0.5076 1.852
Mean 0.4353 0.5854 0.3433 0.4006 0.5818
Std. Deviation 0.2450 0.4168 0.1213 0.1116 0.3950
Std. Error 0.05774 0.06852 0.07004 0.05581 0.07095
Lower 95% CI of mean 0.3134 0.4465 0.04192 0.2230 0.4369
Upper 95% CI of mean 0.5571 0.7244 0.6446 0.5781 0.7267
Tests of Normality
Warna MK
Kolmogorov-Smirnova Shapiro-Wilk
Statistic df Sig. Statistic df Sig.
Konsentrasi MK Biru .173 18 .160 .787 18 .001
Hitam .188 37 .002 .795 37 .000
Kuning .270 3 . .949 3 .563
Merah .199 4 . .951 4 .719
Putih .169 31 .024 .808 31 .000
a. Lilliefors Significance Correction
Test of Homogeneity of Variances
Konsentrasi MK
Levene Statistic df1 df2 Sig.
1.361 4 88 .254
Kruskal-Wallis test
P value 0.3929
Exact or approximate P value? Gaussian
63
Approximation
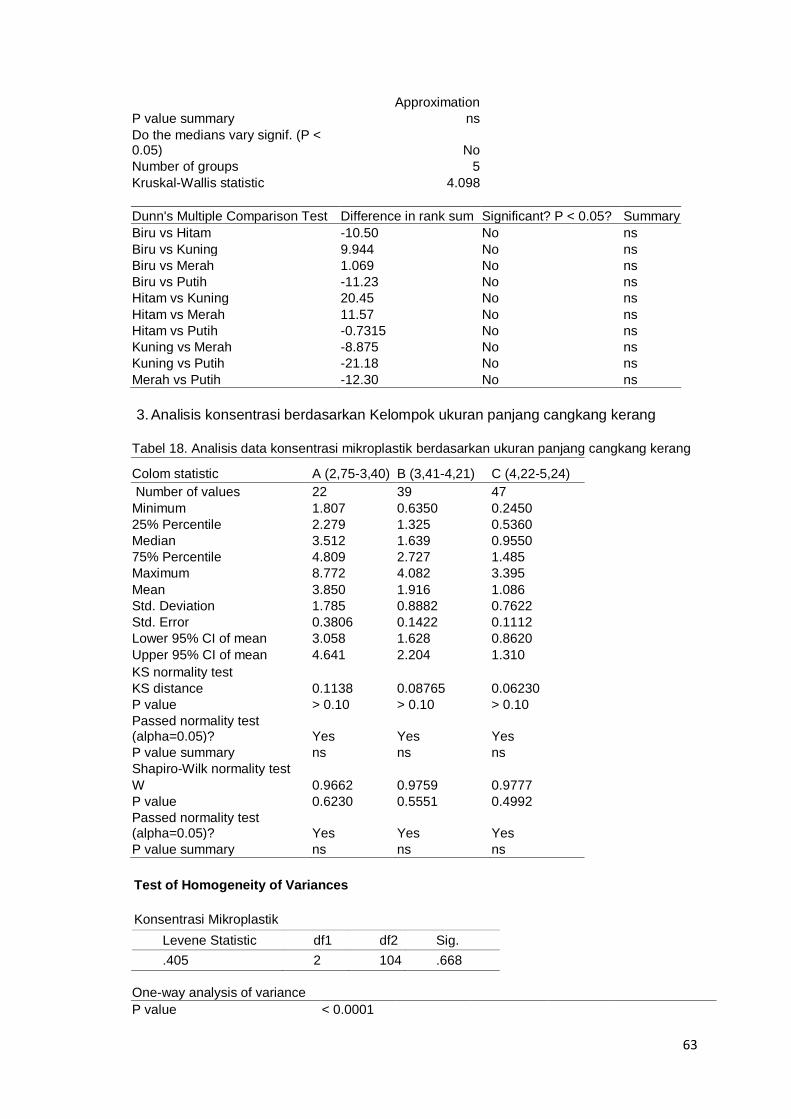
P value summary ns
Do the medians vary signif. (P < 0.05) No
Number of groups 5
Kruskal-Wallis statistic 4.098
Dunn's Multiple Comparison Test Difference in rank sum Significant? P < 0.05? Summary
Biru vs Hitam -10.50 No ns
Biru vs Kuning 9.944 No ns
Biru vs Merah 1.069 No ns
Biru vs Putih -11.23 No ns
Hitam vs Kuning 20.45 No ns
Hitam vs Merah 11.57 No ns
Hitam vs Putih -0.7315 No ns
Kuning vs Merah -8.875 No ns
Kuning vs Putih -21.18 No ns
Merah vs Putih -12.30 No ns
3. Analisis konsentrasi berdasarkan Kelompok ukuran panjang cangkang kerang
Tabel 18. Analisis data konsentrasi mikroplastik berdasarkan ukuran panjang cangkang kerang
Colom statistic A (2,75-3,40) B (3,41-4,21) C (4,22-5,24)
Number of values 22 39 47
Minimum 1.807 0.6350 0.2450
25% Percentile 2.279 1.325 0.5360
Median 3.512 1.639 0.9550
75% Percentile 4.809 2.727 1.485
Maximum 8.772 4.082 3.395
Mean 3.850 1.916 1.086
Std. Deviation 1.785 0.8882 0.7622
Std. Error 0.3806 0.1422 0.1112
Lower 95% CI of mean 3.058 1.628 0.8620
Upper 95% CI of mean 4.641 2.204 1.310
KS normality test
KS distance 0.1138 0.08765 0.06230
P value > 0.10 > 0.10 > 0.10
Passed normality test (alpha=0.05)? Yes Yes Yes
P value summary ns ns ns
Shapiro-Wilk normality test
W 0.9662 0.9759 0.9777
P value 0.6230 0.5551 0.4992
Passed normality test (alpha=0.05)? Yes Yes Yes
P value summary ns ns ns
Test of Homogeneity of Variances
Konsentrasi Mikroplastik
Levene Statistic df1 df2 Sig.
.405 2 104 .668
One-way analysis of variance
P value < 0.0001
64
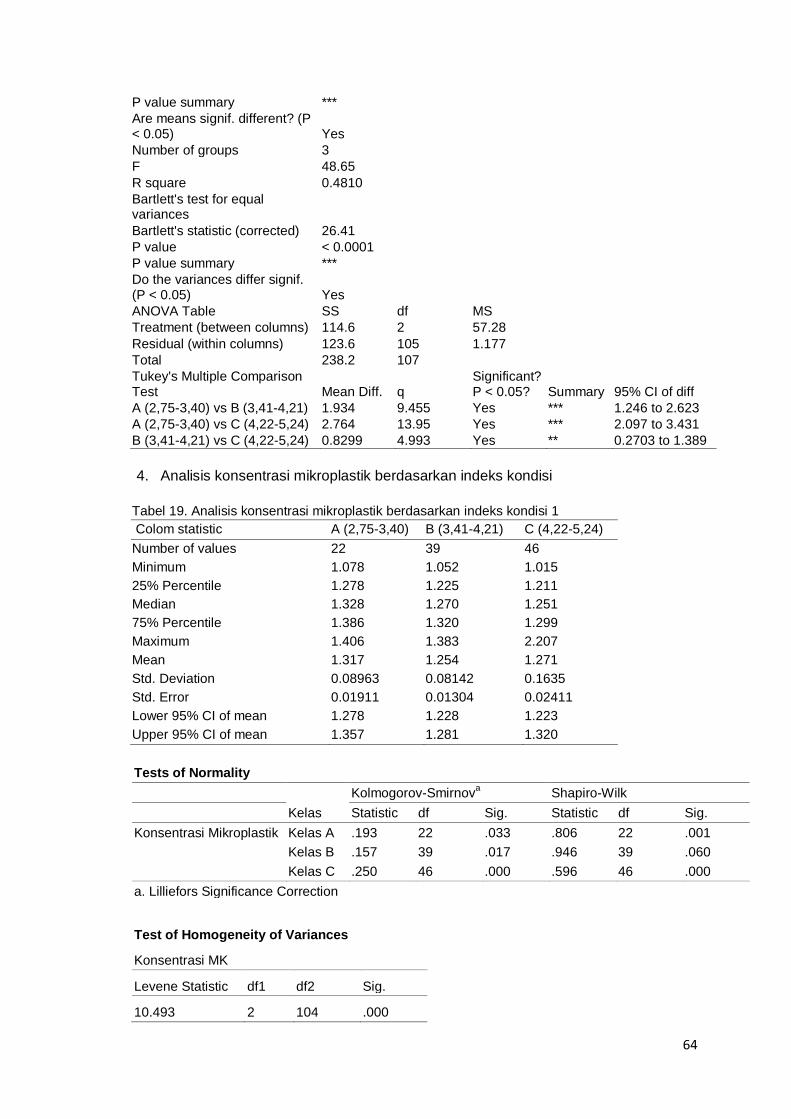
P value summary ***
Are means signif. different? (P < 0.05) Yes
Number of groups 3
F 48.65
R square 0.4810
Bartlett's test for equal variances
Bartlett's statistic (corrected) 26.41
P value < 0.0001
P value summary ***
Do the variances differ signif. (P < 0.05) Yes
ANOVA Table SS df MS
Treatment (between columns) 114.6 2 57.28
Residual (within columns) 123.6 105 1.177
Total 238.2 107
Tukey's Multiple Comparison Test Mean Diff. q
Significant? P < 0.05? Summary 95% CI of diff
A (2,75-3,40) vs B (3,41-4,21) 1.934 9.455 Yes *** 1.246 to 2.623
A (2,75-3,40) vs C (4,22-5,24) 2.764 13.95 Yes *** 2.097 to 3.431
B (3,41-4,21) vs C (4,22-5,24) 0.8299 4.993 Yes ** 0.2703 to 1.389
4. Analisis konsentrasi mikroplastik berdasarkan indeks kondisi
Tabel 19. Analisis konsentrasi mikroplastik berdasarkan indeks kondisi 1
Colom statistic A (2,75-3,40) B (3,41-4,21) C (4,22-5,24)
Number of values 22 39 46
Minimum 1.078 1.052 1.015
25% Percentile 1.278 1.225 1.211
Median 1.328 1.270 1.251
75% Percentile 1.386 1.320 1.299
Maximum 1.406 1.383 2.207
Mean 1.317 1.254 1.271
Std. Deviation 0.08963 0.08142 0.1635
Std. Error 0.01911 0.01304 0.02411
Lower 95% CI of mean 1.278 1.228 1.223
Upper 95% CI of mean 1.357 1.281 1.320
Tests of Normality
Kelas
Kolmogorov-Smirnova Shapiro-Wilk
Statistic df Sig. Statistic df Sig.
Konsentrasi Mikroplastik Kelas A .193 22 .033 .806 22 .001
Kelas B .157 39 .017 .946 39 .060
Kelas C .250 46 .000 .596 46 .000
a. Lilliefors Significance Correction
Test of Homogeneity of Variances
Konsentrasi MK
Levene Statistic df1 df2 Sig.
10.493 2 104 .000
65
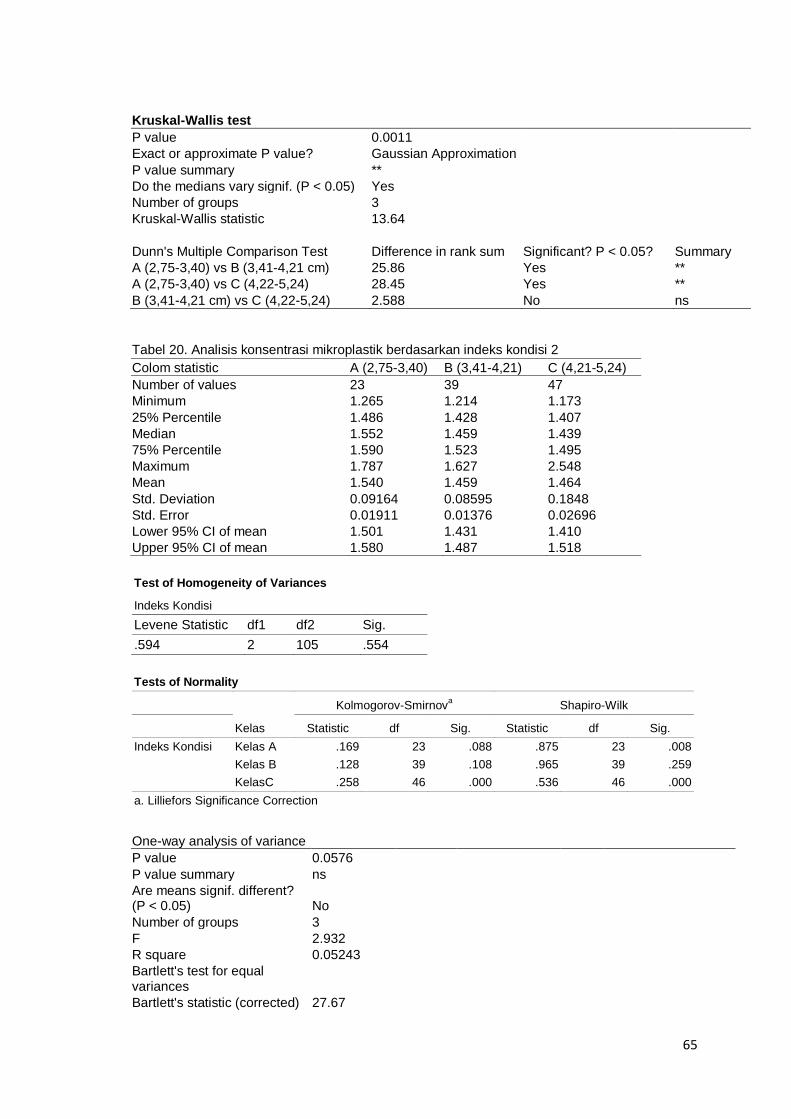
Kruskal-Wallis test
P value 0.0011
Exact or approximate P value? Gaussian Approximation
P value summary **
Do the medians vary signif. (P < 0.05) Yes
Number of groups 3
Kruskal-Wallis statistic 13.64
Dunn's Multiple Comparison Test Difference in rank sum Significant? P < 0.05? Summary
A (2,75-3,40) vs B (3,41-4,21 cm) 25.86 Yes **
A (2,75-3,40) vs C (4,22-5,24) 28.45 Yes **
B (3,41-4,21 cm) vs C (4,22-5,24) 2.588 No ns
Tabel 20. Analisis konsentrasi mikroplastik berdasarkan indeks kondisi 2
Colom statistic A (2,75-3,40) B (3,41-4,21) C (4,21-5,24)
Number of values 23 39 47
Minimum 1.265 1.214 1.173
25% Percentile 1.486 1.428 1.407
Median 1.552 1.459 1.439
75% Percentile 1.590 1.523 1.495
Maximum 1.787 1.627 2.548
Mean 1.540 1.459 1.464
Std. Deviation 0.09164 0.08595 0.1848
Std. Error 0.01911 0.01376 0.02696
Lower 95% CI of mean 1.501 1.431 1.410
Upper 95% CI of mean 1.580 1.487 1.518
Test of Homogeneity of Variances
Indeks Kondisi
Levene Statistic df1 df2 Sig.
.594 2 105 .554
Tests of Normality
Kelas
Kolmogorov-Smirnova Shapiro-Wilk
Statistic df Sig. Statistic df Sig.
Indeks Kondisi Kelas A .169 23 .088 .875 23 .008
Kelas B .128 39 .108 .965 39 .259
KelasC .258 46 .000 .536 46 .000
a. Lilliefors Significance Correction
One-way analysis of variance
P value 0.0576
P value summary ns
Are means signif. different? (P < 0.05) No
Number of groups 3
F 2.932
R square 0.05243
Bartlett's test for equal variances
Bartlett's statistic (corrected) 27.67

66
P value < 0.0001
P value summary ***
Do the variances differ signif. (P < 0.05) Yes
ANOVA Table SS df MS
Treatment (between columns) 0.1127 2 0.05634
Residual (within columns) 2.036 106 0.01921
Total 2.149 108
Tukey's Multiple Comparison Test Mean Diff. q
Significant? P < 0.05? Summary 95% CI of diff
A (2,75-3,40) vs B (3,41-4,21) 0.08126 3.154 No ns -0.005471 to 0.1680
A (2,75-3,40) vs C (4,21-5,24) 0.07643 3.065 No ns -0.007515 to 0.1604
B (3,41-4,21) vs C (4,21-5,24) -0.004827 0.2274 No ns -0.07628 to 0.06663
Tabel 21. Analisis konsentrasi mikroplastik berdasarkan indeks kondisi 3
Colom statistic A (2,75-3,40) B (3,41-4,21) C (4,21-5,24)
Number of values 21 39 48
Minimum 0.1066 0.1240 0.1125
25% Percentile 0.1331 0.1490 0.1453
Median 0.1482 0.1657 0.1591
75% Percentile 0.1618 0.1814 0.1730
Maximum 0.1822 0.2085 0.2968
Mean 0.1482 0.1654 0.1632
Std. Deviation 0.01906 0.02060 0.03049
Std. Error 0.004160 0.003299 0.004400
Lower 95% CI of mean 0.1395 0.1587 0.1544
Upper 95% CI of mean 0.1569 0.1720 0.1721
KS normality test
KS distance 0.09228 0.06610 0.1403
P value > 0.10 > 0.10 0.0190
Passed normality test (alpha=0.05)? Yes Yes No
P value summary ns ns *
Test of Homogeneity of Variances
Indeks Kondisi
Levene Statistic df1 df2 Sig.
1.286 2 105 .281
One-way analysis of variance
P value 0.0349
P value summary *
Are means signif. different? (P < 0.05) Yes
Number of groups 3
F 3.463
R square 0.06189
Bartlett's test for equal variances
Bartlett's statistic 9.070
P value 0.0107
P value summary *
Do the variances differ signif. (P < 0.05) Yes
ANOVA Table SS df MS
Treatment (between columns) 0.004425 2 0.002213

67
Residual (within columns) 0.06708 105 0.0006388
Total 0.07150 107
Tukey's Multiple Comparison Test Mean Diff. q
Significant? P < 0.05? Summary 95% CI of diff
A vs B -0.01716 3.548 Yes * -0.03345 to -0.0008769
A vs C -0.01505 3.218 No ns -0.03079 to 0.0006939
B vs C 0.002114 0.5487 No ns -0.01086 to 0.01509
5. Analisis korelasi konsentrasi mikroplastik dengan indeks kondisi kerang
Tabel 22. Analisis korelasi konsentrasi mikroplastik dengan indeks kondisi kerang (A)
Parameter Indeks Kondisi 1 Indeks Kondisi 2 Indeks Kondisi 3
Number of XY Pairs 20 20 20
Pearson r 0.2296 0.04408 -0.4214
95% confidence interval -0.2371 to 0.6102 -0.4065 to 0.4774 -0.7282 to 0.02607
P value (two-tailed) 0.3301 0.8536 0.0642
P value summary ns ns ns
Is the correlation significant? (alpha=0.05) No No No
R square 0.05272 0.001943 0.1776
Tabel 23. Analisis korelasi konsentrasi mikroplastik dengan indeks kondisi kerang (B)
Parameter Indeks Kondisi 1 Indeks Kondisi 2 Indeks Kondisi 3
Number of XY Pairs 39 39 39
Pearson r 0.1191 0.1127 -0.07326
95% confidence interval -0.2041 to 0.4190 -0.2104 to 0.4135 -0.3801 to 0.2481
P value (two-tailed) 0.4701 0.4947 0.6576
P value summary ns ns ns
Is the correlation significant? (alpha=0.05) No No No
R square 0.01419 0.01269 0.005368
Tabel 24. Analisis korelasi konsentrasi mikroplastik dengan indeks kondisi kerang (C)
Parameter Indeks Kondisi 1 Indeks Kondisi 2 Indeks Kondisi 3
Number of XY Pairs 42 42 42
Pearson r 0.3716 0.2983 -0.3214
95% confidence interval 0.07624 to 0.6070 -0.006301 to 0.5522 -0.5697 to -0.01926
P value (two-tailed) 0.154 0.0550 0.380
P value summary ns ns ns
Is the correlation significant? (alpha=0.05) No No No
R square 0.0381 0.08897 0.033
6. Analisis korelasi konsentrasi mikroplastik dengan indeks kondisi kerang
Tabel 25. Analisis korelasi konsentrasi mikroplastik dengan indeks kondisi kerang (A)
Parameter Panjang Lebar Tinggi
Number of XY Pairs 22 22 22
Pearson r -0.5177 -0.3580 -0.3101
95% confidence interval -0.7711 to -0.1229 -0.6775 to 0.07498 -0.6472 to 0.1284
P value (two-tailed) 0.0136 0.1018 0.1602
P value summary * ns ns
Is the correlation significant? (alpha=0.05) No No No
R square 0.2681 0.1282 0.09616

68
Tabel 26. Analisis korelasi konsentrasi mikroplastik mofometrik kerang (B)
Parameter Panjang Lebar Tinggi
Number of XY Pairs 39 39 39
Pearson r -0.02206 -0.1508 -0.1657
95% confidence interval -0.3353 to 0.2956
-0.4452 to 0.1730
-0.4574 to 0.1581
P value (two-tailed) 0.8940 0.3594 0.3133
P value summary ns ns ns
Is the correlation significant? (alpha=0.05) No No No
R square 0.0004866 0.02275 0.02747
Tabel 27. Analisis korelasi konsentrasi mikroplastik dengan indeks kondisi kerang (C)
Parameter Panjang Lebar Tinggi
Number of XY Pairs 46 46 46
Pearson r -0.2583 -0.09374 -0.05591
95% confidence interval -0.5104 to 0.03468
-0.3739 to 0.2021
-0.3407 to 0.2383
P value (two-tailed) 0.0831 0.5355 0.7121
P value summary ns ns ns
Is the correlation significant? (alpha=0.05) No No No
R square 0.06671 0.008788 0.003126

69
Lampiran 5. Makroplastik yang ditemukan pada kerang tahu
Fiber Fiber
Fragmen
Fragmen
Fiber Fragmen
70
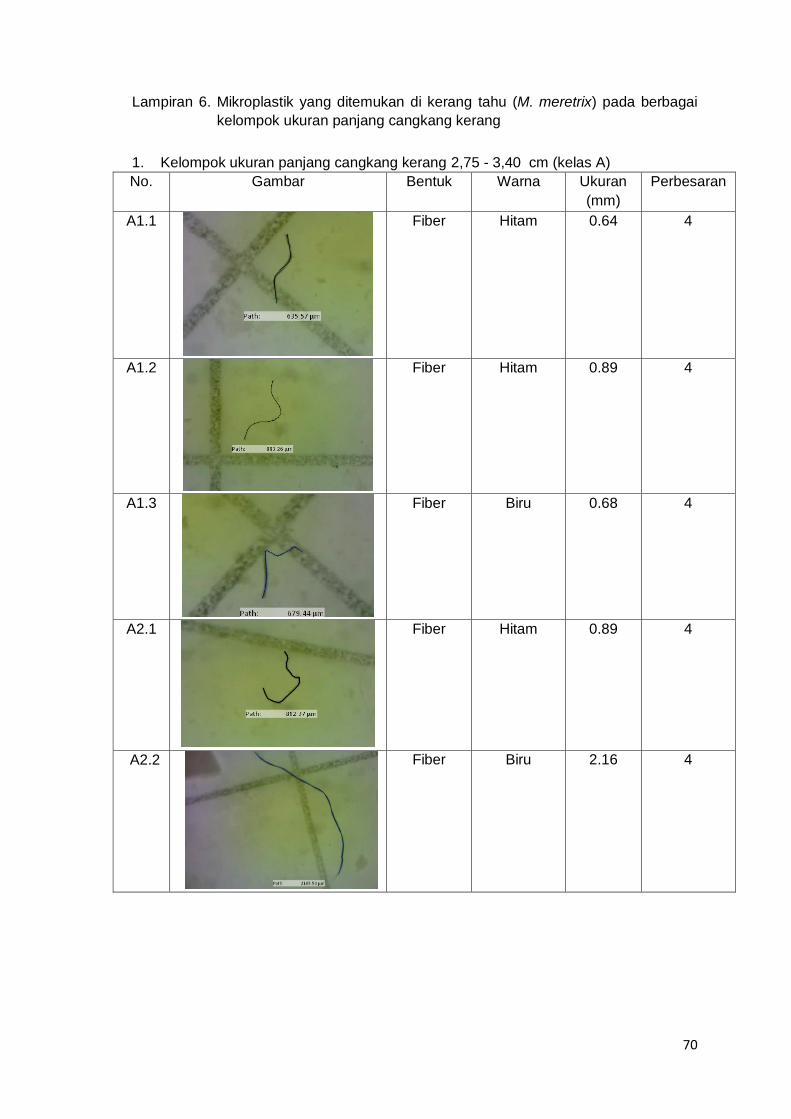
Lampiran 6. Mikroplastik yang ditemukan di kerang tahu (M. meretrix) pada berbagai
kelompok ukuran panjang cangkang kerang
1. Kelompok ukuran panjang cangkang kerang 2,75 - 3,40 cm (kelas A)
No. Gambar Bentuk Warna Ukuran
(mm)
Perbesaran
A1.1
Fiber Hitam 0.64 4
A1.2
Fiber Hitam 0.89 4
A1.3
Fiber Biru 0.68 4
A2.1
Fiber Hitam 0.89 4
A2.2
Fiber Biru 2.16 4