Wireless Rechargeable Sensor Networks - Current Status and ...
Upload
khangminh22Category
view
1download
0
�����������������
Citation: Remigio-Carmona, P.;
González-de-la-Rosa, J.-J.;
Florencias-Oliveros, O.; Sierra-
Fernández, J.-M.; Fernández-Morales,
J.; Espinosa-Gavira, M.-J.; Agüera-
Pérez, A.; Palomares-Salas, J.-C.
Current Status and Future Trends of
Power Quality Analysis. Energies
2022, 15, 2328. https://doi.org/
10.3390/en15072328
Academic Editor: Saeed Golestan
Received: 25 February 2022
Accepted: 21 March 2022
Published: 23 March 2022
Publisher’s Note: MDPI stays neutral
with regard to jurisdictional claims in
published maps and institutional affil-
iations.
Copyright: © 2022 by the authors.
Licensee MDPI, Basel, Switzerland.
This article is an open access article
distributed under the terms and
conditions of the Creative Commons
Attribution (CC BY) license (https://
creativecommons.org/licenses/by/
4.0/).
energies
Review
Current Status and Future Trends of Power Quality AnalysisPaula Remigio-Carmona , Juan-José González-de-la-Rosa * , Olivia Florencias-Oliveros ,José-María Sierra-Fernández , Javier Fernández-Morales, Manuel-Jesús Espinosa-Gavira ,Agustín Agüera-Pérez and José-Carlos Palomares-Salas
Research Group PAIDI-TIC-168, Department of Automation Engineering, Electronics, Architecture andComputers Networks, University of Cádiz, E-11202 Algeciras, Spain; [email protected] (P.R.-C.);[email protected] (O.F.-O.); [email protected] (J.-M.S.-F.); [email protected] (J.F.-M.);[email protected] (M.-J.E.-G.); [email protected] (A.A.-P.); [email protected] (J.-C.P.-S.)* Correspondence: [email protected]
Abstract: In this article, a systematic literature review of 153 articles on power quality analysis inPV systems published in the last 20 years is presented. This provides readers with an overviewon PQ trends in several fields related to instrumental techniques that are being used in the smartgrid to visualize the quality of the energy, establishing a solid literature base from which to startfuture research. A preliminary appreciation allows us to intuit that higher-order statistics are notimplemented in measurement equipment and that traditional instrumentation is still used for theperformance of measurement campaigns, not yielding the expected results since the informationprocessed does not come from an electrical network from 20 years ago. Instead, current networkscontain numerous coupled load effects; thus, new disturbances are not simple; they are usuallycomplex events, the sum of several types of disturbances. Likewise, depending on the type ofinstallation, the objective of the PQ analysis changes, either by detecting certain events or simplyfocusing on seeing the state of the network.
Keywords: observational data analysis; power quality; quality indices; big data
1. Introduction
Power quality (PQ) can be defined as a group of characteristics that electronic systemsmust follow in their power distribution, supply, and delivery networks, ensuring theadequate supply to end customers (voltage and current), as well as guaranteed optimalperformance and as little as possible disturbance to the system in general when used bycustomers. The concept of PQ requires constant review since a faithful reflection of thebehavior of the network has become necessary for each PQ indicator to verify the correctoperation of the grid or, on the contrary, the appearance of disturbances. As a reference,some standards have been developed; in fact, the UNE-EN 50,160 standard [1] (entitled“Voltage characteristics of electricity supplied by public electricity networks”) describesand specifies the limits or values of voltage characteristics expected at any supply terminal.Among the authors who stand out for their contributions to the elaboration of the regulatedbases for the power quality at the end of the 20th century, Math H. J. Bollen [2], Ewald F.Fuchs [3], and Jos Arrillaga [4] are worthy of mention.
Furthermore, with the advent of the new electrical network made up of differentdistributed energy resources, most of them come from renewable sources, and the PQbecomes more important than ever since the “green power” entails an intermittent energygeneration and loads related to renewable energies, affected by the electrical network’sstability. Therefore, the reinterpretation of the PQ concept has become necessary. Powerquality should no longer consist of complex mathematical calculations which requirespecific equipment for the monitoring; PQ must be understood from the point of view ofconsumers–producers, with a simpler, more affordable interpretation.
Energies 2022, 15, 2328. https://doi.org/10.3390/en15072328 https://www.mdpi.com/journal/energies
Energies 2022, 15, 2328 2 of 18
Several techniques and procedures have been developed to make the PQ concept moreunderstandable and transferable to instrumentation. In addition to traditional methods,researchers have been working with new strategies generated in recent years based onsecond-order statistics, higher-order statistics, or artificial intelligence. Even so, fullysatisfactory results have not been achieved, which allow for implementing these proceduresin the instrumentation field by a simple, visual way for the user.
The objective of the paper consists of an exhaustive review of the different techniqueswhich have been recently incorporated during the last decade. For this purpose, the mostnoticeable ones have been selected, and future lines of research have been defined; thus,the implementation of these processes could be possible, not only in the instrumentationfield, but also as a regulated methodology which enables the deployment of appropriatemonitoring campaigns.
The paper is organized as follows: Section 2 explains the information search method-ology based on the contextualization of the factors or parameters considered of interest.Section 3 provides an overview, and selected papers in the PQ-monitoring field are de-scribed. Then, Section 4 includes graphical and statistical results of the analyzed papers.Lastly, conclusions are drawn in Section 5.
2. Methodology
This review provides a comprehensive description and structured presentation ofthe content of recent and emerging international literature on instrumental techniquesfor power quality monitoring. Therefore, a systematic and replicable analysis of a highnumber of articles was conducted regarding methods for detection and classification ofPQ disturbances, including complex or hybrids events that result from the sum of severaltypes of simple events. The concise literature classification serves as a decision base forfellow researchers to appropriate data models for their projects. Direct and easy access toarticles corresponding to a particular set of criteria is provided though structured tablesfor selected papers in the next section and graphic schemes for an easier understandingof the collected papers. Challenges and future research directions are suggested, and thecompiled materials provide a basis for future hypothesis-based quantitative testing.
To provide a time perspective, the search focused on articles published in the last20 years, but special attention was paid to those published between 2018 and 2022. Thismethod aims for the analysis of the methodology employed in current and future research.The literature base for this review is the result of several queries to IEEE (Institute of Electri-cal and Electronics Engineers) Xplore, among other databases, such as ScienceDirect, Worldof Science, or Google Scholar, from April 2021 to February 2022. Some of the keywords usedfor the literature research combined with “power quality” were “monitoring”, “indices”,“photovoltaic”, and some specific terms relative to different methods for PQ disturbancedetection and classification, such as “artificial intelligence”, “higher-order statistics”, or“wavelet transform”. Several papers related to reliability of supply were rejected with theobjective of focusing the research on continuous monitoring of power quality. Articlesare classified according to the properties listed in Table 1. In Table 1, each item representsa property characterizing the techniques applied in the respective articles, and a shortdescription and possible values are given.
Energies 2022, 15, 2328 3 of 18
Table 1. Assessment criteria: An overview of analysis criteria define the collected data. Each itemrepresents a property characterizing the techniques applied in the respective articles, and a shortdescription and possible values are given.
Analysis Criteria Description Possible Values
Method Selected method(s) for detection andclassification of PQ disturbances
Discrete Fourier Transform (DFT)/Fast FourierTransform (FFT), Wavelet Transform (WT),
S-Transform (ST), Short Time Fourier Transform(STFT), Kalman Filter (KF), Hilbert-Huang Transform
(HHT), Singular Spectrum Analysis (SSA),Higher-Order Statistics (HOS), Artificial Intelligence(AI), Total Harmonic Distortion (THD), Root Mean
Square (RMS)
Complexity of eventsDifferentiation between events with only
one type of disturbance or events withmore than one type
Complex events, single events
Network environment Type of network environment to whichthe study is focused
Generation, industrial environment,urban/domestic environment
Renewable energy source In case of focus on renewable energies,source of energy Photovoltaic system (PV), wind system
PQ disturbances Type(s) of disturbances detected
Sag, swell, flicker, harmonic, interruption, transient,notch, sag + harmonic, sag + transient, sag + flicker,sag + notch, sag + spike, sag + interruption, swell +harmonic, swell + transient, swell + flicker, swell +notch, swell + spike, swell + interruption, flicker +harmonic, spike + interruption, spike + harmonic,
spike + transient, notch + interruption, notch +harmonic, notch + transient, harmonic + interruption,
harmonic + transient, more than 2 events
Analysis domain Selected domain for the analysis ofPQ disturbances Time domain, frequency domain
HOS cumulant Cumulants studied for HOS papers Skewness, kurtosis, 5th order, 6th order
Signal source Type of signal used for the detection ofPQ disturbances Real signal, synthetic signal
Instrumentation Employed instrumentation forreal signals
Commercial instrumentation, instrumentationdesigned by researchers
Theorical paper The paper is a review or a theorical paper. Yes, no
3. Overview of the Analyzed Papers
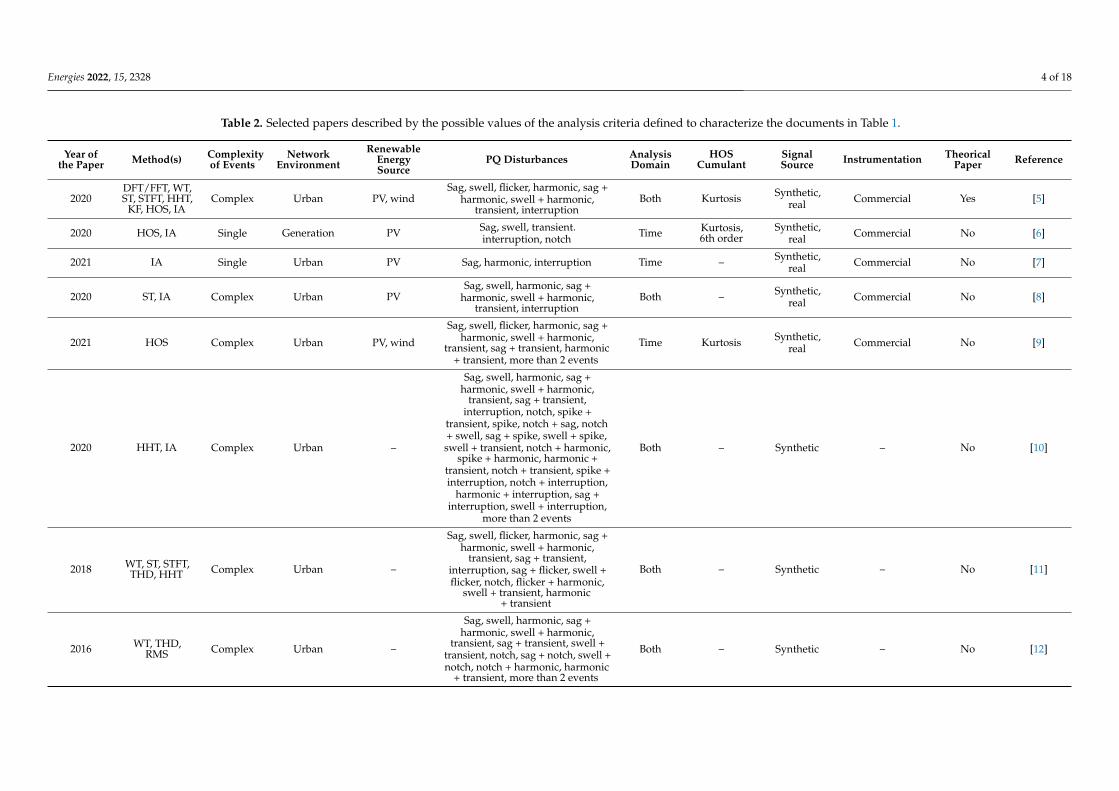
Among all the analyzed papers, a few have been selected for further insight andcollected to this end in Table 2. The criteria for choosing these has been those with themost relevant contributions to the field of PQ disturbance monitoring and most completeinformation about the parameters determined in Table 1.
Energies 2022, 15, 2328 4 of 18
Table 2. Selected papers described by the possible values of the analysis criteria defined to characterize the documents in Table 1.
Year ofthe Paper Method(s) Complexity
of EventsNetwork
EnvironmentRenewable
EnergySource
PQ Disturbances AnalysisDomain
HOSCumulant
SignalSource Instrumentation Theorical
Paper Reference
2020DFT/FFT, WT,ST, STFT, HHT,
KF, HOS, IAComplex Urban PV, wind
Sag, swell, flicker, harmonic, sag +harmonic, swell + harmonic,
transient, interruptionBoth Kurtosis Synthetic,
real Commercial Yes [5]
2020 HOS, IA Single Generation PV Sag, swell, transient.interruption, notch Time Kurtosis,
6th orderSynthetic,
real Commercial No [6]
2021 IA Single Urban PV Sag, harmonic, interruption Time – Synthetic,real Commercial No [7]
2020 ST, IA Complex Urban PVSag, swell, harmonic, sag +
harmonic, swell + harmonic,transient, interruption
Both – Synthetic,real Commercial No [8]
2021 HOS Complex Urban PV, wind
Sag, swell, flicker, harmonic, sag +harmonic, swell + harmonic,
transient, sag + transient, harmonic+ transient, more than 2 events
Time Kurtosis Synthetic,real Commercial No [9]
2020 HHT, IA Complex Urban –
Sag, swell, harmonic, sag +harmonic, swell + harmonic,
transient, sag + transient,interruption, notch, spike +
transient, spike, notch + sag, notch+ swell, sag + spike, swell + spike,swell + transient, notch + harmonic,
spike + harmonic, harmonic +transient, notch + transient, spike +interruption, notch + interruption,
harmonic + interruption, sag +interruption, swell + interruption,
more than 2 events
Both – Synthetic – No [10]
2018 WT, ST, STFT,THD, HHT Complex Urban –
Sag, swell, flicker, harmonic, sag +harmonic, swell + harmonic,
transient, sag + transient,interruption, sag + flicker, swell +flicker, notch, flicker + harmonic,
swell + transient, harmonic+ transient
Both – Synthetic – No [11]
2016 WT, THD,RMS Complex Urban –
Sag, swell, harmonic, sag +harmonic, swell + harmonic,
transient, sag + transient, swell +transient, notch, sag + notch, swell +notch, notch + harmonic, harmonic
+ transient, more than 2 events
Both – Synthetic – No [12]
Energies 2022, 15, 2328 5 of 18
4. Results
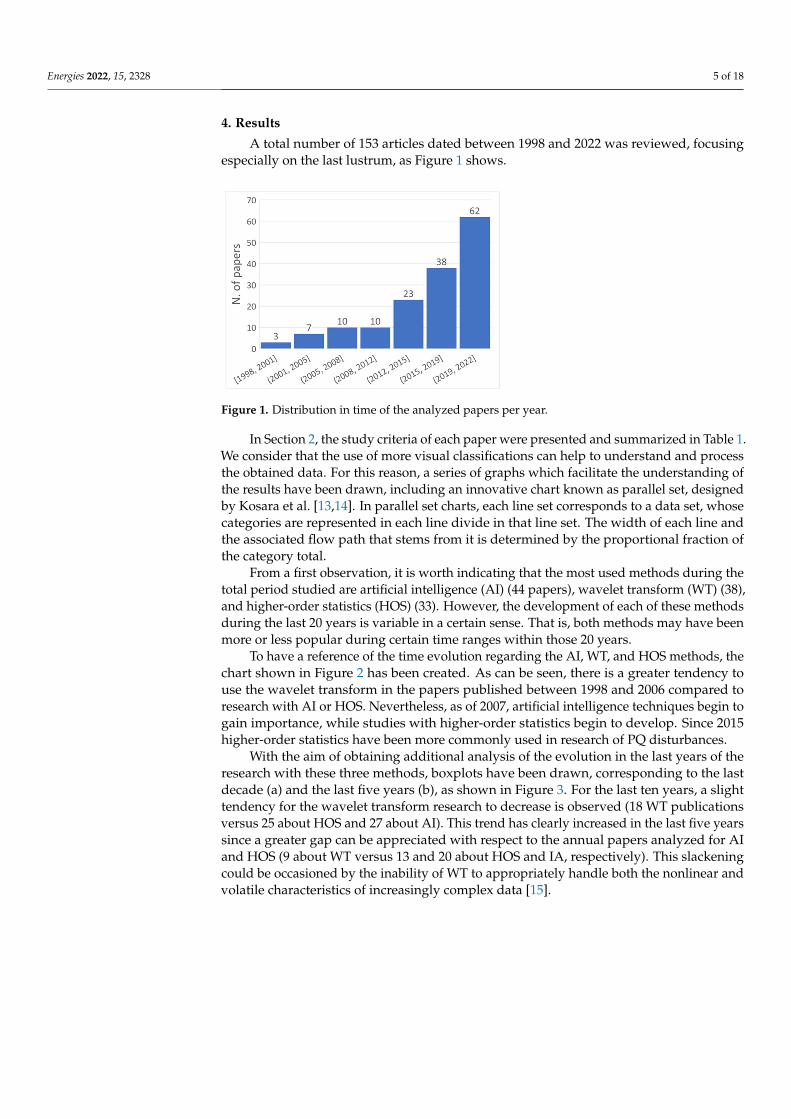
A total number of 153 articles dated between 1998 and 2022 was reviewed, focusingespecially on the last lustrum, as Figure 1 shows.
Energies 2022, 15, x FOR PEER REVIEW 4 of 17
HHT, KF, HOS, IA
2020 HOS, IA Single Genera-
tion PV
Sag, swell, transient. interruption, notch
Time Kurtosis, 6th order
Syn-thetic,
real
Commer-cial
No [6]
2021 IA Single Urban PV Sag, harmonic, interruption Time -- Syn-
thetic, real
Commer-cial
No [7]
2020 ST, IA Complex Urban PV Sag, swell, harmonic, sag + har-
monic, swell + harmonic, transient, interruption
Both -- Syn-
thetic, real
Commer-cial
No [8]
2021 HOS Complex Urban PV, wind
Sag, swell, flicker, harmonic, sag + harmonic, swell + harmonic, tran-sient, sag + transient, harmonic +
transient, more than 2 events
Time Kurtosis Syn-
thetic, real
Commer-cial
No [9]
2020 HHT, IA Complex Urban --
Sag, swell, harmonic, sag + har-monic, swell + harmonic, transient, sag + transient, interruption, notch,
spike + transient, spike, notch + sag, notch + swell, sag + spike, swell + spike, swell + transient, notch + harmonic, spike + har-
monic, harmonic + transient, notch + transient, spike + interruption, notch + interruption, harmonic + interruption, sag + interruption, swell + interruption, more than 2
events
Both -- Syn-thetic
-- No [10]
2018
WT, ST, STFT, THD, HHT
Complex Urban --
Sag, swell, flicker, harmonic, sag + harmonic, swell + harmonic, tran-sient, sag + transient, interruption, sag + flicker, swell + flicker, notch, flicker + harmonic, swell + transi-
ent, harmonic + transient
Both -- Syn-thetic
-- No [11]
2016 WT, THD,
RMS Complex Urban --
Sag, swell, harmonic, sag + har-monic, swell + harmonic, transient,
sag + transient, swell + transient, notch, sag + notch, swell + notch,
notch + harmonic, harmonic + transient, more than 2 events
Both -- Syn-thetic
-- No [12]
4. Results A total number of 153 articles dated between 1998 and 2022 was reviewed, focusing
especially on the last lustrum, as Figure 1 shows.
Figure 1. Distribution in time of the analyzed papers per year. Figure 1. Distribution in time of the analyzed papers per year.
In Section 2, the study criteria of each paper were presented and summarized in Table 1.We consider that the use of more visual classifications can help to understand and processthe obtained data. For this reason, a series of graphs which facilitate the understanding ofthe results have been drawn, including an innovative chart known as parallel set, designedby Kosara et al. [13,14]. In parallel set charts, each line set corresponds to a data set, whosecategories are represented in each line divide in that line set. The width of each line andthe associated flow path that stems from it is determined by the proportional fraction ofthe category total.
From a first observation, it is worth indicating that the most used methods during thetotal period studied are artificial intelligence (AI) (44 papers), wavelet transform (WT) (38),and higher-order statistics (HOS) (33). However, the development of each of these methodsduring the last 20 years is variable in a certain sense. That is, both methods may have beenmore or less popular during certain time ranges within those 20 years.
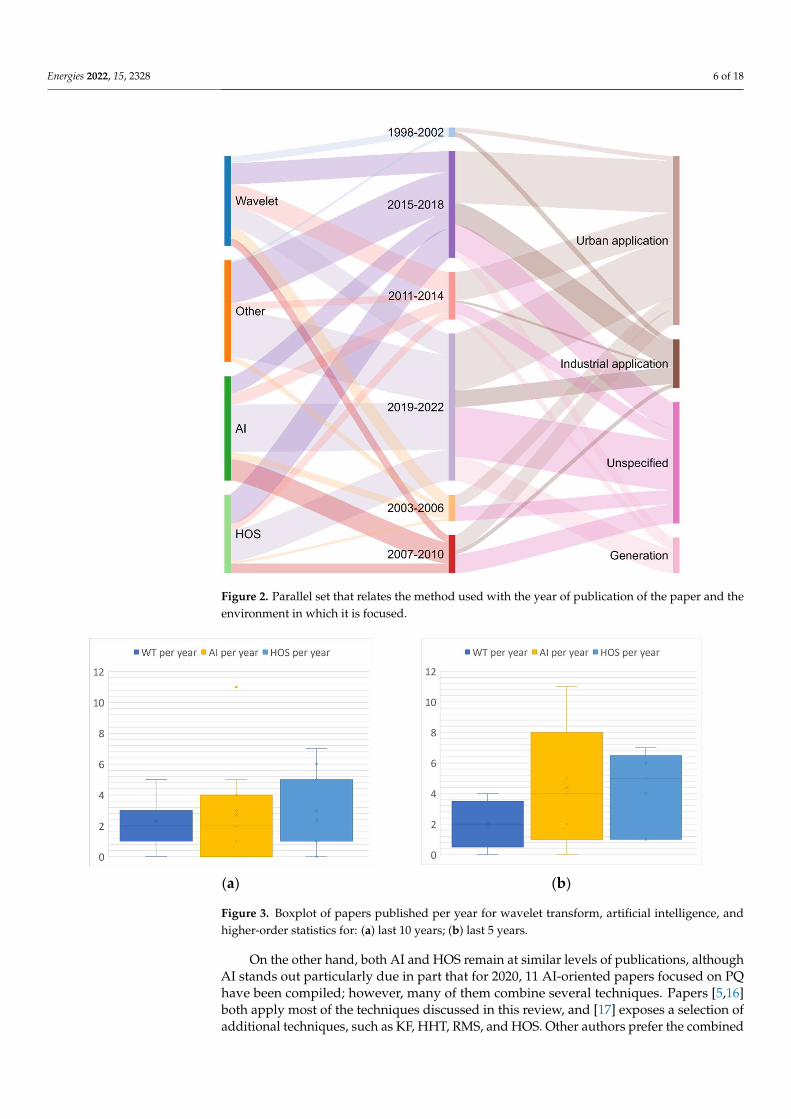
To have a reference of the time evolution regarding the AI, WT, and HOS methods, thechart shown in Figure 2 has been created. As can be seen, there is a greater tendency touse the wavelet transform in the papers published between 1998 and 2006 compared toresearch with AI or HOS. Nevertheless, as of 2007, artificial intelligence techniques begin togain importance, while studies with higher-order statistics begin to develop. Since 2015higher-order statistics have been more commonly used in research of PQ disturbances.
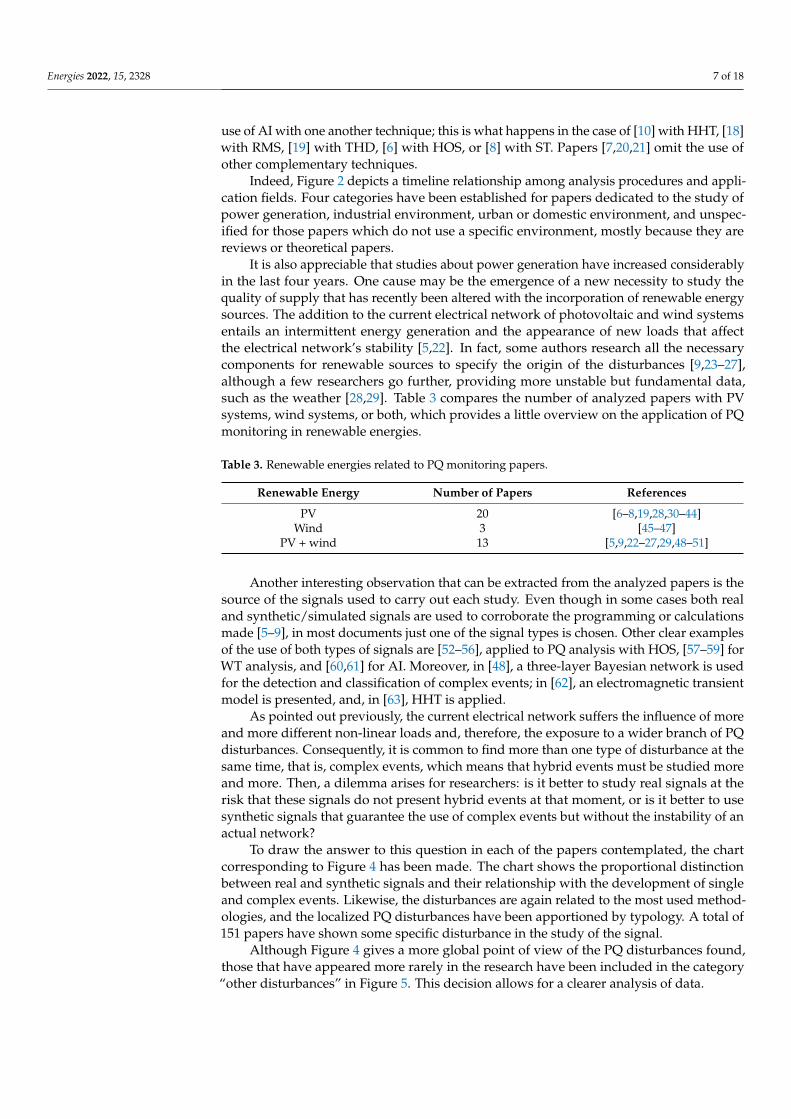
With the aim of obtaining additional analysis of the evolution in the last years of theresearch with these three methods, boxplots have been drawn, corresponding to the lastdecade (a) and the last five years (b), as shown in Figure 3. For the last ten years, a slighttendency for the wavelet transform research to decrease is observed (18 WT publicationsversus 25 about HOS and 27 about AI). This trend has clearly increased in the last five yearssince a greater gap can be appreciated with respect to the annual papers analyzed for AIand HOS (9 about WT versus 13 and 20 about HOS and IA, respectively). This slackeningcould be occasioned by the inability of WT to appropriately handle both the nonlinear andvolatile characteristics of increasingly complex data [15].
Energies 2022, 15, 2328 6 of 18
Energies 2022, 15, x FOR PEER REVIEW 5 of 17
In Section 2, the study criteria of each paper were presented and summarized in Table 1. We consider that the use of more visual classifications can help to understand and pro-cess the obtained data. For this reason, a series of graphs which facilitate the understand-ing of the results have been drawn, including an innovative chart known as parallel set, designed by Kosara et al. [13,14]. In parallel set charts, each line set corresponds to a data set, whose categories are represented in each line divide in that line set. The width of each line and the associated flow path that stems from it is determined by the proportional fraction of the category total.
From a first observation, it is worth indicating that the most used methods during the total period studied are artificial intelligence (AI) (44 papers), wavelet transform (WT) (38), and higher-order statistics (HOS) (33). However, the development of each of these methods during the last 20 years is variable in a certain sense. That is, both methods may have been more or less popular during certain time ranges within those 20 years.
To have a reference of the time evolution regarding the AI, WT, and HOS methods, the chart shown in Figure 2 has been created. As can be seen, there is a greater tendency to use the wavelet transform in the papers published between 1998 and 2006 compared to research with AI or HOS. Nevertheless, as of 2007, artificial intelligence techniques begin to gain importance, while studies with higher-order statistics begin to develop. Since 2015 higher-order statistics have been more commonly used in research of PQ disturbances.
Figure 2. Parallel set that relates the method used with the year of publication of the paper and the environment in which it is focused.
With the aim of obtaining additional analysis of the evolution in the last years of the research with these three methods, boxplots have been drawn, corresponding to the last decade (a) and the last five years (b), as shown in Figure 3. For the last ten years, a slight tendency for the wavelet transform research to decrease is observed (18 WT publications versus 25 about HOS and 27 about AI). This trend has clearly increased in the last five years since a greater gap can be appreciated with respect to the annual papers analyzed for AI and HOS (9 about WT versus 13 and 20 about HOS and IA, respectively). This
Figure 2. Parallel set that relates the method used with the year of publication of the paper and theenvironment in which it is focused.
Energies 2022, 15, x FOR PEER REVIEW 6 of 17
slackening could be occasioned by the inability of WT to appropriately handle both the nonlinear and volatile characteristics of increasingly complex data [15].
On the other hand, both AI and HOS remain at similar levels of publications, alt-hough AI stands out particularly due in part that for 2020, 11 AI-oriented papers focused on PQ have been compiled; however, many of them combine several techniques. Papers [5,16] both apply most of the techniques discussed in this review, and [17] exposes a se-lection of additional techniques, such as KF, HHT, RMS, and HOS. Other authors prefer the combined use of AI with one another technique; this is what happens in the case of [10] with HHT, [18] with RMS, [19] with THD, [6] with HOS, or [8] with ST. Papers [7,20,21] omit the use of other complementary techniques.
(a) (b)
Figure 3. Boxplot of papers published per year for wavelet transform, artificial intelligence, and higher-order statistics for: (a) last 10 years; (b) last 5 years.
Indeed, Figure 2 depicts a timeline relationship among analysis procedures and ap-plication fields. Four categories have been established for papers dedicated to the study of power generation, industrial environment, urban or domestic environment, and un-specified for those papers which do not use a specific environment, mostly because they are reviews or theoretical papers.
It is also appreciable that studies about power generation have increased considera-bly in the last four years. One cause may be the emergence of a new necessity to study the quality of supply that has recently been altered with the incorporation of renewable en-ergy sources. The addition to the current electrical network of photovoltaic and wind sys-tems entails an intermittent energy generation and the appearance of new loads that affect the electrical network’s stability [5,22]. In fact, some authors research all the necessary components for renewable sources to specify the origin of the disturbances [9,23–27], alt-hough a few researchers go further, providing more unstable but fundamental data, such as the weather [28,29]. Table 3 compares the number of analyzed papers with PV systems, wind systems, or both, which provides a little overview on the application of PQ moni-toring in renewable energies.
Table 3. Renewable energies related to PQ monitoring papers.
Renewable Energy Number of Papers References PV 20 [6–8,19,28,30–44]
Wind 3 [45–47] PV + wind 13 [5,9,22–27,29,48–51]
Another interesting observation that can be extracted from the analyzed papers is the source of the signals used to carry out each study. Even though in some cases both real and synthetic/simulated signals are used to corroborate the programming or calculations
Figure 3. Boxplot of papers published per year for wavelet transform, artificial intelligence, andhigher-order statistics for: (a) last 10 years; (b) last 5 years.
On the other hand, both AI and HOS remain at similar levels of publications, althoughAI stands out particularly due in part that for 2020, 11 AI-oriented papers focused on PQhave been compiled; however, many of them combine several techniques. Papers [5,16]both apply most of the techniques discussed in this review, and [17] exposes a selection ofadditional techniques, such as KF, HHT, RMS, and HOS. Other authors prefer the combined
Energies 2022, 15, 2328 7 of 18
use of AI with one another technique; this is what happens in the case of [10] with HHT, [18]with RMS, [19] with THD, [6] with HOS, or [8] with ST. Papers [7,20,21] omit the use ofother complementary techniques.
Indeed, Figure 2 depicts a timeline relationship among analysis procedures and appli-cation fields. Four categories have been established for papers dedicated to the study ofpower generation, industrial environment, urban or domestic environment, and unspec-ified for those papers which do not use a specific environment, mostly because they arereviews or theoretical papers.
It is also appreciable that studies about power generation have increased considerablyin the last four years. One cause may be the emergence of a new necessity to study thequality of supply that has recently been altered with the incorporation of renewable energysources. The addition to the current electrical network of photovoltaic and wind systemsentails an intermittent energy generation and the appearance of new loads that affectthe electrical network’s stability [5,22]. In fact, some authors research all the necessarycomponents for renewable sources to specify the origin of the disturbances [9,23–27],although a few researchers go further, providing more unstable but fundamental data,such as the weather [28,29]. Table 3 compares the number of analyzed papers with PVsystems, wind systems, or both, which provides a little overview on the application of PQmonitoring in renewable energies.
Table 3. Renewable energies related to PQ monitoring papers.
Renewable Energy Number of Papers References
PV 20 [6–8,19,28,30–44]Wind 3 [45–47]
PV + wind 13 [5,9,22–27,29,48–51]
Another interesting observation that can be extracted from the analyzed papers is thesource of the signals used to carry out each study. Even though in some cases both realand synthetic/simulated signals are used to corroborate the programming or calculationsmade [5–9], in most documents just one of the signal types is chosen. Other clear examplesof the use of both types of signals are [52–56], applied to PQ analysis with HOS, [57–59] forWT analysis, and [60,61] for AI. Moreover, in [48], a three-layer Bayesian network is usedfor the detection and classification of complex events; in [62], an electromagnetic transientmodel is presented, and, in [63], HHT is applied.
As pointed out previously, the current electrical network suffers the influence of moreand more different non-linear loads and, therefore, the exposure to a wider branch of PQdisturbances. Consequently, it is common to find more than one type of disturbance at thesame time, that is, complex events, which means that hybrid events must be studied moreand more. Then, a dilemma arises for researchers: is it better to study real signals at therisk that these signals do not present hybrid events at that moment, or is it better to usesynthetic signals that guarantee the use of complex events but without the instability of anactual network?
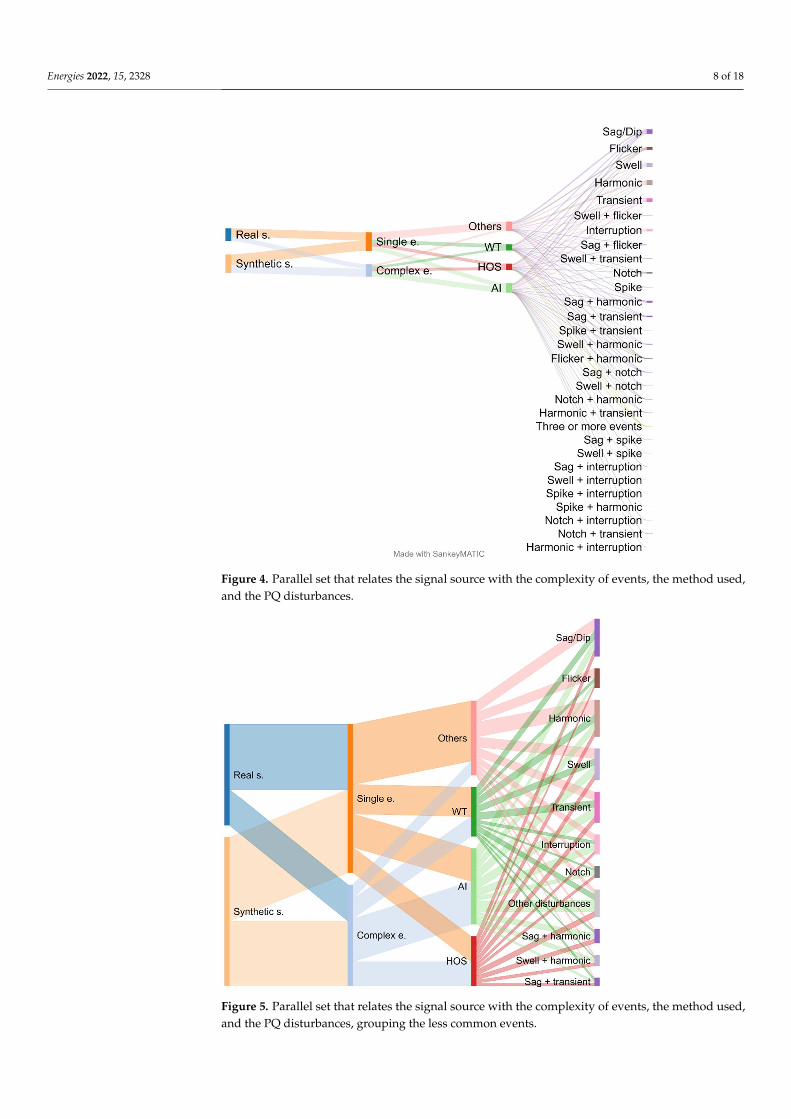
To draw the answer to this question in each of the papers contemplated, the chartcorresponding to Figure 4 has been made. The chart shows the proportional distinctionbetween real and synthetic signals and their relationship with the development of singleand complex events. Likewise, the disturbances are again related to the most used method-ologies, and the localized PQ disturbances have been apportioned by typology. A total of151 papers have shown some specific disturbance in the study of the signal.
Although Figure 4 gives a more global point of view of the PQ disturbances found,those that have appeared more rarely in the research have been included in the category“other disturbances” in Figure 5. This decision allows for a clearer analysis of data.
Energies 2022, 15, 2328 8 of 18
Energies 2022, 15, x FOR PEER REVIEW 7 of 17
made [5–9], in most documents just one of the signal types is chosen. Other clear examples of the use of both types of signals are [52–56], applied to PQ analysis with HOS, [57–59] for WT analysis, and [60,61] for AI. Moreover, in [48], a three-layer Bayesian network is used for the detection and classification of complex events; in [62], an electromagnetic transient model is presented, and, in [63], HHT is applied.
As pointed out previously, the current electrical network suffers the influence of more and more different non-linear loads and, therefore, the exposure to a wider branch of PQ disturbances. Consequently, it is common to find more than one type of disturbance at the same time, that is, complex events, which means that hybrid events must be studied more and more. Then, a dilemma arises for researchers: is it better to study real signals at the risk that these signals do not present hybrid events at that moment, or is it better to use synthetic signals that guarantee the use of complex events but without the instability of an actual network?
To draw the answer to this question in each of the papers contemplated, the chart corresponding to Figure 4 has been made. The chart shows the proportional distinction between real and synthetic signals and their relationship with the development of single and complex events. Likewise, the disturbances are again related to the most used meth-odologies, and the localized PQ disturbances have been apportioned by typology. A total of 151 papers have shown some specific disturbance in the study of the signal.
Figure 4. Parallel set that relates the signal source with the complexity of events, the method used, and the PQ disturbances.
Although Figure 4 gives a more global point of view of the PQ disturbances found, those that have appeared more rarely in the research have been included in the category “other disturbances” in Figure 5. This decision allows for a clearer analysis of data.
In light of the analyzed papers, even though the tendency to work with single signals continues, synthetic signals with hybrids events are increasingly being used. In other
Figure 4. Parallel set that relates the signal source with the complexity of events, the method used,and the PQ disturbances.
Energies 2022, 15, x FOR PEER REVIEW 8 of 17
words, the necessity to research more complex events has incrementally grown to reach a better understanding of the operation of the current network and, therefore, the signals obtained synthetically are being adapted to this phenomenon.
In addition, although the most common network faults are still mostly single events, there is a clear trend towards the combination of sag (usually considered the most com-mon disturbance [32,64,65]) with harmonics or transients. Furthermore, by carefully ana-lyzing the data, the number of papers in which harmonics are located as signal disturb-ances (73) is slightly higher than the number of papers that include sags (71), displacing the last one to second place in most common disturbances.
Figure 5. Parallel set that relates the signal source with the complexity of events, the method used, and the PQ disturbances, grouping the less common events.
An additional observation for Figure 5 is that the AI and HOS methods are more used for the detection and classification of complex events. This could mean that both methods facilitate the study of hybrid events compared to more traditional methods, which would justify the great development they have received in recent years.
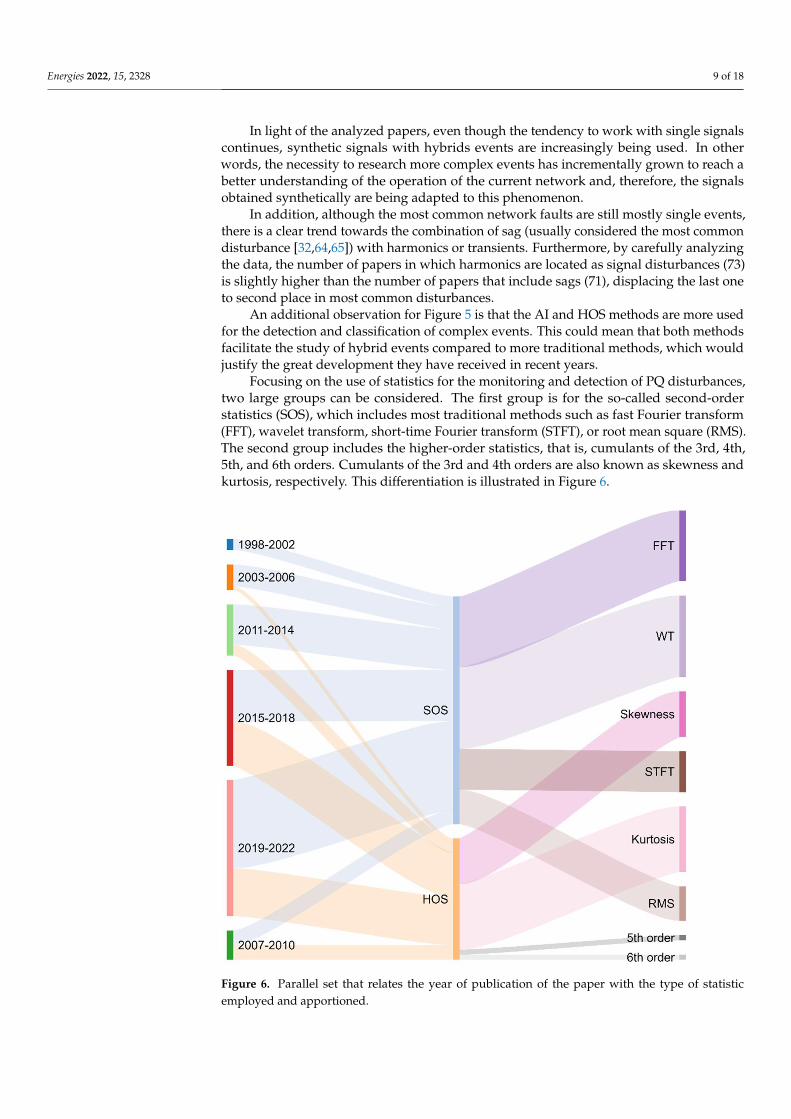
Focusing on the use of statistics for the monitoring and detection of PQ disturbances, two large groups can be considered. The first group is for the so-called second-order sta-tistics (SOS), which includes most traditional methods such as fast Fourier transform (FFT), wavelet transform, short-time Fourier transform (STFT), or root mean square (RMS). The second group includes the higher-order statistics, that is, cumulants of the 3rd, 4th, 5th, and 6th orders. Cumulants of the 3rd and 4th orders are also known as skewness and kurtosis, respectively. This differentiation is illustrated in Figure 6.
Again, the evolution of the HOS over time is portrayed, but, in addition, the type of statistics that is most often used can be seen. While for SOS the wavelet transform stands out as expected, for HOS more cases of kurtosis, or 4th order cumulants, are found (27 papers), followed by 3rd order cumulants (19 papers). Although the use of 5th and 6th order statistics has not yet become very popular, there is a subtle trend towards research with them in recent years: in [6], even order cumulants (2nd, 4th, and 6th) are obtained;
Figure 5. Parallel set that relates the signal source with the complexity of events, the method used,and the PQ disturbances, grouping the less common events.
Energies 2022, 15, 2328 9 of 18
In light of the analyzed papers, even though the tendency to work with single signalscontinues, synthetic signals with hybrids events are increasingly being used. In otherwords, the necessity to research more complex events has incrementally grown to reach abetter understanding of the operation of the current network and, therefore, the signalsobtained synthetically are being adapted to this phenomenon.
In addition, although the most common network faults are still mostly single events,there is a clear trend towards the combination of sag (usually considered the most commondisturbance [32,64,65]) with harmonics or transients. Furthermore, by carefully analyzingthe data, the number of papers in which harmonics are located as signal disturbances (73)is slightly higher than the number of papers that include sags (71), displacing the last oneto second place in most common disturbances.
An additional observation for Figure 5 is that the AI and HOS methods are more usedfor the detection and classification of complex events. This could mean that both methodsfacilitate the study of hybrid events compared to more traditional methods, which wouldjustify the great development they have received in recent years.
Focusing on the use of statistics for the monitoring and detection of PQ disturbances,two large groups can be considered. The first group is for the so-called second-orderstatistics (SOS), which includes most traditional methods such as fast Fourier transform(FFT), wavelet transform, short-time Fourier transform (STFT), or root mean square (RMS).The second group includes the higher-order statistics, that is, cumulants of the 3rd, 4th,5th, and 6th orders. Cumulants of the 3rd and 4th orders are also known as skewness andkurtosis, respectively. This differentiation is illustrated in Figure 6.
Energies 2022, 15, x FOR PEER REVIEW 9 of 17
in [54], the 3rd, 4th, and 5th order cumulants are used, and, in [47], cumulants of the 3rd, 4th, 5th, and 6th orders are utilized for the detection of complex PQ disturbances.
Figure 6. Parallel set that relates the year of publication of the paper with the type of statistic em-ployed and apportioned.
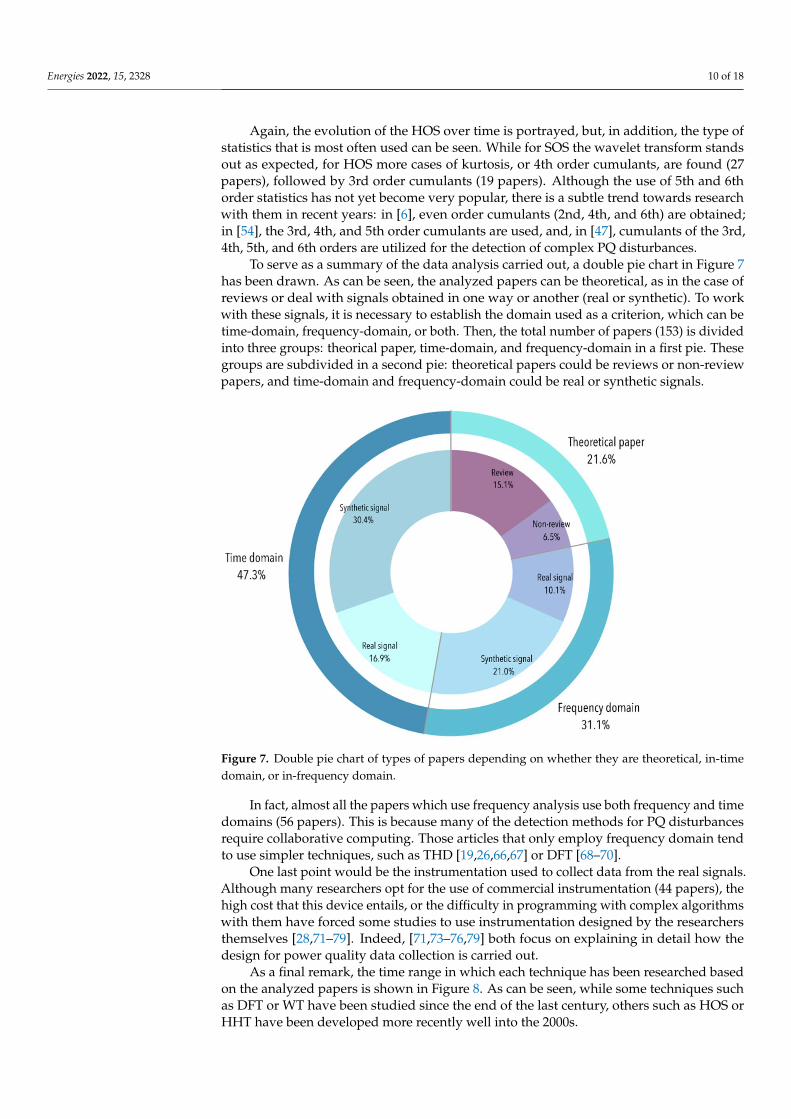
To serve as a summary of the data analysis carried out, a double pie chart in Figure 7 has been drawn. As can be seen, the analyzed papers can be theoretical, as in the case of reviews or deal with signals obtained in one way or another (real or synthetic). To work with these signals, it is necessary to establish the domain used as a criterion, which can be time-domain, frequency-domain, or both. Then, the total number of papers (153) is di-vided into three groups: theorical paper, time-domain, and frequency-domain in a first pie. These groups are subdivided in a second pie: theoretical papers could be reviews or non-review papers, and time-domain and frequency-domain could be real or synthetic signals.
In fact, almost all the papers which use frequency analysis use both frequency and time domains (56 papers). This is because many of the detection methods for PQ disturb-ances require collaborative computing. Those articles that only employ frequency domain tend to use simpler techniques, such as THD [19,26,66,67] or DFT [68–70].
Figure 6. Parallel set that relates the year of publication of the paper with the type of statisticemployed and apportioned.
Energies 2022, 15, 2328 10 of 18
Again, the evolution of the HOS over time is portrayed, but, in addition, the type ofstatistics that is most often used can be seen. While for SOS the wavelet transform standsout as expected, for HOS more cases of kurtosis, or 4th order cumulants, are found (27papers), followed by 3rd order cumulants (19 papers). Although the use of 5th and 6thorder statistics has not yet become very popular, there is a subtle trend towards researchwith them in recent years: in [6], even order cumulants (2nd, 4th, and 6th) are obtained;in [54], the 3rd, 4th, and 5th order cumulants are used, and, in [47], cumulants of the 3rd,4th, 5th, and 6th orders are utilized for the detection of complex PQ disturbances.
To serve as a summary of the data analysis carried out, a double pie chart in Figure 7has been drawn. As can be seen, the analyzed papers can be theoretical, as in the case ofreviews or deal with signals obtained in one way or another (real or synthetic). To workwith these signals, it is necessary to establish the domain used as a criterion, which can betime-domain, frequency-domain, or both. Then, the total number of papers (153) is dividedinto three groups: theorical paper, time-domain, and frequency-domain in a first pie. Thesegroups are subdivided in a second pie: theoretical papers could be reviews or non-reviewpapers, and time-domain and frequency-domain could be real or synthetic signals.
Energies 2022, 15, x FOR PEER REVIEW 10 of 17
Figure 7. Double pie chart of types of papers depending on whether they are theoretical, in-time domain, or in-frequency domain.
One last point would be the instrumentation used to collect data from the real signals. Although many researchers opt for the use of commercial instrumentation (44 papers), the high cost that this device entails, or the difficulty in programming with complex algo-rithms with them have forced some studies to use instrumentation designed by the re-searchers themselves [28,71–79]. Indeed, [71,73–76,79] both focus on explaining in detail how the design for power quality data collection is carried out.
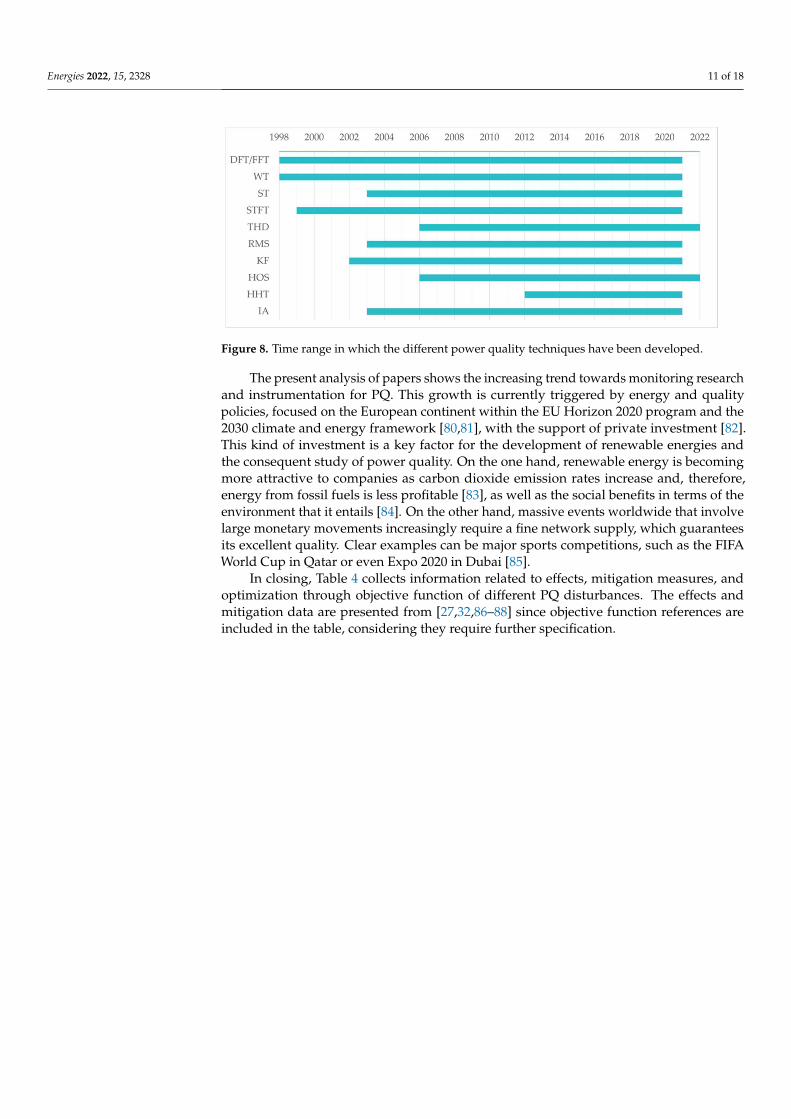
As a final remark, the time range in which each technique has been researched based on the analyzed papers is shown in Figure 8. As can be seen, while some techniques such as DFT or WT have been studied since the end of the last century, others such as HOS or HHT have been developed more recently well into the 2000s.
Figure 8. Time range in which the different power quality techniques have been developed.
The present analysis of papers shows the increasing trend towards monitoring re-search and instrumentation for PQ. This growth is currently triggered by energy and qual-ity policies, focused on the European continent within the EU Horizon 2020 program and the 2030 climate and energy framework [80,81], with the support of private investment [82]. This kind of investment is a key factor for the development of renewable energies and the consequent study of power quality. On the one hand, renewable energy is becom-ing more attractive to companies as carbon dioxide emission rates increase and, therefore, energy from fossil fuels is less profitable [83], as well as the social benefits in terms of the environment that it entails [84]. On the other hand, massive events worldwide that involve large monetary movements increasingly require a fine network supply, which guarantees
Figure 7. Double pie chart of types of papers depending on whether they are theoretical, in-timedomain, or in-frequency domain.
In fact, almost all the papers which use frequency analysis use both frequency and timedomains (56 papers). This is because many of the detection methods for PQ disturbancesrequire collaborative computing. Those articles that only employ frequency domain tendto use simpler techniques, such as THD [19,26,66,67] or DFT [68–70].
One last point would be the instrumentation used to collect data from the real signals.Although many researchers opt for the use of commercial instrumentation (44 papers), thehigh cost that this device entails, or the difficulty in programming with complex algorithmswith them have forced some studies to use instrumentation designed by the researchersthemselves [28,71–79]. Indeed, [71,73–76,79] both focus on explaining in detail how thedesign for power quality data collection is carried out.
As a final remark, the time range in which each technique has been researched basedon the analyzed papers is shown in Figure 8. As can be seen, while some techniques suchas DFT or WT have been studied since the end of the last century, others such as HOS orHHT have been developed more recently well into the 2000s.
Energies 2022, 15, 2328 11 of 18
Energies 2022, 15, x FOR PEER REVIEW 10 of 17
Figure 7. Double pie chart of types of papers depending on whether they are theoretical, in-time domain, or in-frequency domain.
One last point would be the instrumentation used to collect data from the real signals. Although many researchers opt for the use of commercial instrumentation (44 papers), the high cost that this device entails, or the difficulty in programming with complex algo-rithms with them have forced some studies to use instrumentation designed by the re-searchers themselves [28,71–79]. Indeed, [71,73–76,79] both focus on explaining in detail how the design for power quality data collection is carried out.
As a final remark, the time range in which each technique has been researched based on the analyzed papers is shown in Figure 8. As can be seen, while some techniques such as DFT or WT have been studied since the end of the last century, others such as HOS or HHT have been developed more recently well into the 2000s.
Figure 8. Time range in which the different power quality techniques have been developed.
The present analysis of papers shows the increasing trend towards monitoring re-search and instrumentation for PQ. This growth is currently triggered by energy and qual-ity policies, focused on the European continent within the EU Horizon 2020 program and the 2030 climate and energy framework [80,81], with the support of private investment [82]. This kind of investment is a key factor for the development of renewable energies and the consequent study of power quality. On the one hand, renewable energy is becom-ing more attractive to companies as carbon dioxide emission rates increase and, therefore, energy from fossil fuels is less profitable [83], as well as the social benefits in terms of the environment that it entails [84]. On the other hand, massive events worldwide that involve large monetary movements increasingly require a fine network supply, which guarantees
Figure 8. Time range in which the different power quality techniques have been developed.
The present analysis of papers shows the increasing trend towards monitoring researchand instrumentation for PQ. This growth is currently triggered by energy and qualitypolicies, focused on the European continent within the EU Horizon 2020 program and the2030 climate and energy framework [80,81], with the support of private investment [82].This kind of investment is a key factor for the development of renewable energies andthe consequent study of power quality. On the one hand, renewable energy is becomingmore attractive to companies as carbon dioxide emission rates increase and, therefore,energy from fossil fuels is less profitable [83], as well as the social benefits in terms of theenvironment that it entails [84]. On the other hand, massive events worldwide that involvelarge monetary movements increasingly require a fine network supply, which guaranteesits excellent quality. Clear examples can be major sports competitions, such as the FIFAWorld Cup in Qatar or even Expo 2020 in Dubai [85].
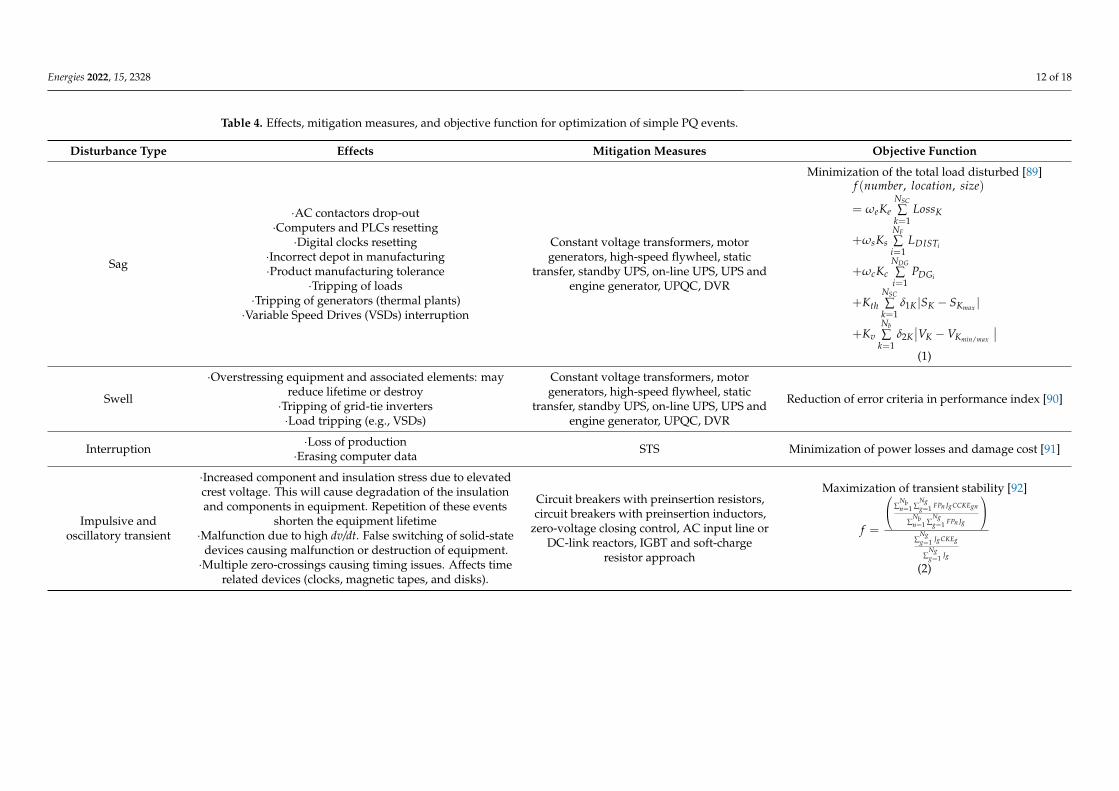
In closing, Table 4 collects information related to effects, mitigation measures, andoptimization through objective function of different PQ disturbances. The effects andmitigation data are presented from [27,32,86–88] since objective function references areincluded in the table, considering they require further specification.
Energies 2022, 15, 2328 12 of 18
Table 4. Effects, mitigation measures, and objective function for optimization of simple PQ events.
Disturbance Type Effects Mitigation Measures Objective Function
Sag
·AC contactors drop-out·Computers and PLCs resetting·Digital clocks resetting
·Incorrect depot in manufacturing·Product manufacturing tolerance
·Tripping of loads·Tripping of generators (thermal plants)·Variable Speed Drives (VSDs) interruption
Constant voltage transformers, motorgenerators, high-speed flywheel, static
transfer, standby UPS, on-line UPS, UPS andengine generator, UPQC, DVR
Minimization of the total load disturbed [89]f (number, location, size)
= ωeKeNSC
∑k=1
LossK
+ωsKsNF
∑i=1
LDISTi
+ωcKcNDG
∑i=1
PDGi
+KthNSC
∑k=1
δ1K |SK − SKmax |
+KvNb
∑k=1
δ2K∣∣VK −VKmin/max
∣∣(1)
Swell
·Overstressing equipment and associated elements: mayreduce lifetime or destroy·Tripping of grid-tie inverters·Load tripping (e.g., VSDs)
Constant voltage transformers, motorgenerators, high-speed flywheel, static
transfer, standby UPS, on-line UPS, UPS andengine generator, UPQC, DVR
Reduction of error criteria in performance index [90]
Interruption ·Loss of production·Erasing computer data STS Minimization of power losses and damage cost [91]
Impulsive andoscillatory transient
·Increased component and insulation stress due to elevatedcrest voltage. This will cause degradation of the insulationand components in equipment. Repetition of these events
shorten the equipment lifetime·Malfunction due to high dv/dt. False switching of solid-state
devices causing malfunction or destruction of equipment.·Multiple zero-crossings causing timing issues. Affects time
related devices (clocks, magnetic tapes, and disks).
Circuit breakers with preinsertion resistors,circuit breakers with preinsertion inductors,
zero-voltage closing control, AC input line orDC-link reactors, IGBT and soft-charge
resistor approach
Maximization of transient stability [92]
f =
∑Nbn=1 ∑
Ngg=1 FPn JgCCKEgn
∑Nbn=1 ∑
Ngg=1 FPn Jg
∑
Ngg=1 JgCKEg
∑Ngg=1 Jg
(2)
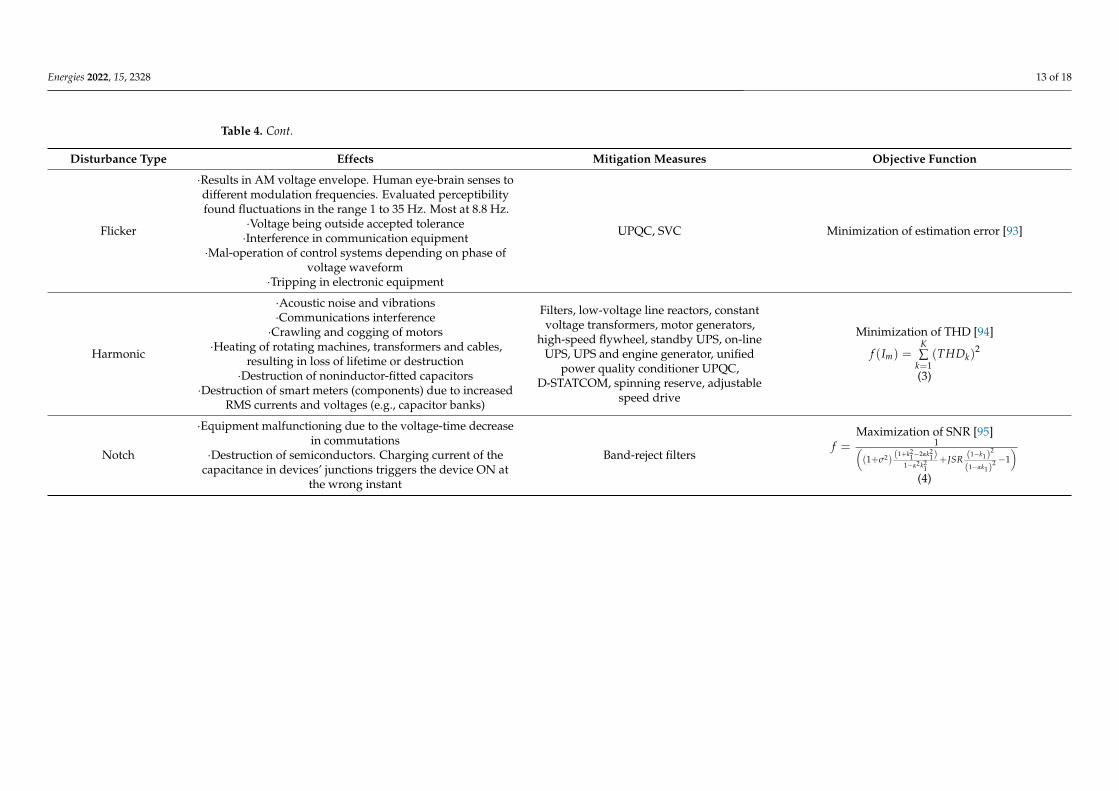
Energies 2022, 15, 2328 13 of 18
Table 4. Cont.
Disturbance Type Effects Mitigation Measures Objective Function
Flicker
·Results in AM voltage envelope. Human eye-brain senses todifferent modulation frequencies. Evaluated perceptibilityfound fluctuations in the range 1 to 35 Hz. Most at 8.8 Hz.
·Voltage being outside accepted tolerance·Interference in communication equipment
·Mal-operation of control systems depending on phase ofvoltage waveform
·Tripping in electronic equipment
UPQC, SVC Minimization of estimation error [93]
Harmonic
·Acoustic noise and vibrations·Communications interference·Crawling and cogging of motors
·Heating of rotating machines, transformers and cables,resulting in loss of lifetime or destruction·Destruction of noninductor-fitted capacitors
·Destruction of smart meters (components) due to increasedRMS currents and voltages (e.g., capacitor banks)
Filters, low-voltage line reactors, constantvoltage transformers, motor generators,
high-speed flywheel, standby UPS, on-lineUPS, UPS and engine generator, unified
power quality conditioner UPQC,D-STATCOM, spinning reserve, adjustable
speed drive
Minimization of THD [94]
f (Im) =K∑
k=1(THDk)
2
(3)
Notch
·Equipment malfunctioning due to the voltage-time decreasein commutations
·Destruction of semiconductors. Charging current of thecapacitance in devices’ junctions triggers the device ON at
the wrong instant
Band-reject filters
Maximization of SNR [95]f = 1(
(1+σ2)(1+k2
1−2αk21)
1−α2k21
+JSR (1−k1)2
(1−αk1)2 −1
)(4)
Energies 2022, 15, 2328 14 of 18
5. Conclusions
A comprehensive and up-to-date systematic literature review about power quality anal-ysis was presented. A total of 153 articles published between 1998 and 2020 were reviewed.
The analysis carried out confirms that the conception of the evaluation and monitoringof the quality of the electrical supply is a multi-choral fact, which involves signal processingtechniques and measurement strategies. This is due to the fact that the connection ofdistributed energy resources and non-linear loads in the modern electrical network hasgiven rise to the appearance of new and more complex electrical disturbances that makenot only the study of the disturbances necessary, but also the characterization of the stateof the network, especially in wind and photovoltaic systems.
We, therefore, conclude a fact that has been happening over the years that the complex-ity of the electrical network leads to new electrical disturbances that are mostly complexor hybrid and that, despite not being too intense, will the quality of energy, which isincreasingly demanding in terms of sensitivity.
The increasing need for performing complex event analysis on PQ disturbances hasdriven the development of methods, such as artificial intelligence and higher-order statisticswhich improve the study of hybrid events, enhancing non-Gaussian features of the power-line signal. However, and especially in the case of HOS, it is still a developing field,currently working on the development of new cumulants of orders higher than skewnessor kurtosis.
Despite the need to incorporate continuous monitoring of PQ, which has especiallybeen seen in the industrial field, this is still an objective to be achieved. The principalcause could be there are still some implementation challenges that sometimes lead tocompanies refusing to invest resources in network analysis. First of all, PQ instrumentationdeployment needs to gain position in the frame of companies’ permissions. Not only that,but an increase in the number of measurement points within the company, as well as thenumber of customized PQ and energy analysis solutions beyond traditional meters, mustbe considered. Also, the implementations of compression techniques in the time domain,spatial compression, and artificial intelligence should be considered in the prediction of PQ.Finally, another challenge to overcome is the enhancement of business benchmarking in aglobal context.
Author Contributions: P.R.-C. and J.-J.G.-d.-l.-R. designed the whole structure of the paper andwrote the document. O.F.-O. collaborated in the first orientation of the research. J.-M.S.-F. put thefocus on the event types. M.-J.E.-G. and J.F.-M. contributed to the criteria used in signal classifications.A.A.-P. and J.-C.P.-S. helped with the review techniques classification. All authors have read andagreed to the published version of the manuscript.
Funding: This research is funded by the Spanish Ministry of Science and Education through theproject PID2019-108953RB-C21 and has been co-financed by the European Union under the 2014–2020ERDF Operational Program.
Institutional Review Board Statement: Not applicable.
Informed Consent Statement: Not applicable.
Acknowledgments: The authors express their gratitude to the Spanish Ministry of Science andEducation for funding the research project PID2019-108953RB-C21, entitled “Strategies for AggregatedGeneration of Photo-Voltaic Plants-Energy and Meteorological Data” (SAGPV-EMOD).
Conflicts of Interest: The authors declare no conflict of interest.
References1. UNE-EN 50160, Características De La Tensión Suministrada Por Las Redes Generales De Distribución. 2011. Available online:
www.aenor.es (accessed on 14 December 2021).2. Bollen, M.H.J.; Gu, I.Y.H. Signal Processing of Power Quality Disturbances; John Wiley & Sons: Hoboken, NJ, USA, 2005. [CrossRef]3. Fuchs, E.F.; Masoum, M.A.S. Power Quality in Power Systems and Electrical Machines; Elsevier: Amsterdam, The Netherlands, 2015.
[CrossRef]
Energies 2022, 15, 2328 15 of 18
4. Arrillaga, J.; Watson, N.R.; Chen, S. Power System Quality Assessment; John Wiley & Sons: Hoboken, NJ, USA, 2000.5. Chawda, G.S.; Shaik, A.G.; Shaik, M.; Padmanaban, S.; Holm-Nielsen, J.B.; Mahela, O.P.; Kaliannan, P. Comprehensive Review on
Detection and Classification of Power Quality Disturbances in Utility Grid with Renewable Energy Penetration. IEEE Access 2020,8, 146807–146830. [CrossRef]
6. Romero-Ramirez, L.A.; Elvira-Ortiz, D.A.; Jaen-Cuellar, A.Y.; Morinigo-Sotelo, D.; Osornio-Rios, R.A.; Romero-Troncoso, R.D.J.Methodology based on higher-order statistics and genetic algorithms for the classification of power quality disturbances. IETGener. Transm. Distrib. 2020, 14, 4580–4592. [CrossRef]
7. Mahela, O.P.; Khan, B.; Alhelou, H.H.; Tanwar, S.; Padmanaban, S. Harmonic mitigation and power quality improvement inutility grid with solar energy penetration using distribution static compensator. IET Power Electron. 2021, 14, 912–922. [CrossRef]
8. Zhang, P.; Feng, Q.; Chen, R.; Wang, D.; Ren, L. Classification and Identification of Power Quality in Distribution Network. InProceedings of the 2020 5th International Conference on Power and Renewable Energy, ICPRE 2020, Shanghai, China, 12–14September 2020; pp. 533–537. [CrossRef]
9. Liu, Y.; Jin, T.; Mohamed, M.A.; Wang, Q. A Novel Three-Step Classification Approach Based on Time-Dependent SpectralFeatures for Complex Power Quality Disturbances. IEEE Trans. Instrum. Meas. 2021, 70, 1–14. [CrossRef]
10. Hemapriya, C.K.; Suganyadevi, M.V.; Krishnakumar, C. Detection and classification of multi-complex power quality events in asmart grid using Hilbert–Huang transform and support vector machine. Electr. Eng. 2020, 102, 1681–1706. [CrossRef]
11. Jamali, S.; Farsa, A.R.; Ghaffarzadeh, N. Identification of optimal features for fast and accurate classification of power qualitydisturbances. Measurement 2018, 116, 565–574. [CrossRef]
12. Ribeiro, E.G.; Dias, G.L.; Barbosa, B.H.G.; Ferreira, D.D. Real-time system for automatic classification of power quality distur-bances. In Proceedings of the International Conference on Harmonics and Quality of Power, ICHQP, Belo Horizonte, Brazil, 16–19October 2016; pp. 908–913. [CrossRef]
13. Kosara, R.; Bendix, F.; Hauser, H. Parallel Sets: Interactive Exploration and Visual Analysis of Categorical Data. IEEE Trans. Vis.Comput. Graph. 2006, 12, 558–568. [CrossRef]
14. Kosara, R. Turning a Table into a Tree: Growing Parallel Sets into a Purposeful Project. 2010. Available online: http://eagereyes.org/parallel-sets (accessed on 14 February 2022).
15. Jnr, E.O.N.; Ziggah, Y.Y.; Relvas, S. Hybrid ensemble intelligent model based on wavelet transform, swarm intelligence andartificial neural network for electricity demand forecasting. Sustain. Cities Soc. 2021, 66, 102679. [CrossRef]
16. Rahul. Review of Signal Processing Techniques and Machine Learning Algorithms for Power Quality Analysis. Adv. Theory Simul.2020, 3, 2000118. [CrossRef]
17. de-la-Rosa, J.-J.G.; Pérez-Donsión, M. Special issue ‘analysis for power quality monitoring’. Energies 2020, 13, 514. [CrossRef]18. Qu, X.; Dong, K.; Zhao, J.; Liu, W.; Shi, Z.; Yu, Y. A novel identification and location method for transient power quality
disturbance sources. In Proceedings of the 2021 IEEE 4th International Electrical and Energy Conference (CIEEC), Wuhan, China,28–30 May 2021. [CrossRef]
19. Rayaguru, N.K.; Sekar, S.; Dash, S.S. A Fuzzy Based Custom Power Device for Grid—PV System to Improve Power Quality. InProceedings of the 2020 International Conference on Computational Intelligence for Smart Power System and Sustainable Energy(CISPSSE), Keonjhar, India, 29–31 July 2020.
20. Hoiem, K.W.; Andresen, C.A.; Santi, V.; Torsaeter, B.N.; Rosenlund, G.H.; Langseth, H. Comparative Study of Event Prediction inPower Grids using Supervised Machine Learning Methods. In Proceedings of the 2020 International Conference on Smart EnergySystems and Technologies (SEST), Istanbul, Turkey, 7–9 September 2020.
21. Qiu, W.; Tang, Q.; Liu, J.; Yao, W. An Automatic Identification Framework for Complex Power Quality Disturbances Based onMultifusion Convolutional Neural Network. IEEE Trans. Ind. Inform. 2020, 16, 3233–3241. [CrossRef]
22. Zhang, X.P.; Yan, Z. Energy Quality: A Definition. IEEE Open Access J. Power Energy 2020, 7, 430–440. [CrossRef]23. Kumar, D.; Zare, F.; Ghosh, A. DC Microgrid Technology: System Architectures, AC Grid Interfaces, Grounding Schemes, Power
Quality, Communication Networks, Applications, and Standardizations Aspects. IEEE Access 2017, 5, 12230–12256. [CrossRef]24. Panigrahi, S.K.; Samal, S.; Dei, G.; Gupta, D.K.; Jena, C.; Barik, P.K. Harmonics analysis of solar photovoltaic wind energy-based
hybrid system. In Proceedings of the 2021 2nd International Conference for Emerging Technology (INCET), Belagavi, India, 21–23May 2021. [CrossRef]
25. Ray, P.K.; Mohanty, A.; Panigrahi, T. Power quality analysis in solar PV integrated microgrid using independent componentanalysis and support vector machine. Optik 2019, 180, 691–698. [CrossRef]
26. Shalukho, A.V.; Lipuzhin, I.A.; Voroshilov, A.A. Power quality in microgrids with distributed generation. In Proceedings ofthe 2019 International Ural Conference on Electrical Power Engineering, UralCon 2019, Chelyabinsk, Russia, 1–3 October 2019;pp. 54–58. [CrossRef]
27. Watson, N.R.; Miller, A. Power Quality Indices Power Quality Indices: A Review Impact of Electric Vehicle Charging ViewProject Other Research View Project Power Quality Indices Power Quality Indices: A Review. 2015. Available online: https://www.researchgate.net/publication/319162831 (accessed on 17 March 2022).
28. Jasinski, M.; Rezmer, J.; Sikorski, T.; Szymanda, J. Integration monitoring of on-grid photovoltaic system: Case study. Period.Polytech. Electr. Eng. Comput. Sci. 2019, 63, 99–105. [CrossRef]
29. Liang, X. Emerging Power Quality Challenges Due to Integration of Renewable Energy Sources. IEEE Trans. Ind. Appl. 2017, 53,855–866. [CrossRef]
Energies 2022, 15, 2328 16 of 18
30. Chakravarthi, B.C.V.; Rao, G.S.K. Impact of Power Quality Issues in Grid Connected Photovoltaic System. In Proceedings of the4th International Conference on Electronics, Communication and Aerospace Technology, ICECA 2020, Coimbatore, India, 5–7November 2020; pp. 155–158. [CrossRef]
31. Cisneros-Magaña, R.; Medina, A.; Fuerte-Esquivel, C.R. Time-Domain Analysis of Power Quality Adverse Effects of GridInterconnected Photovoltaic Generation. In Proceedings of the 2019 North American Power Symposium (NAPS), Wichita, KS,USA, 13–15 October 2019.
32. Deshmukh, A.N.; Chandrakar, V.K. Power quality issues and their mitigation techniques in grid tied Solar Photovoltaic Systems—A review. In Proceedings of the 2021 International Conference on Computer Communication and Informatics (ICCCI), Coimbatore,India, 27–29 January 2021. [CrossRef]
33. Gupta, A. Power quality evaluation of photovoltaic grid interfaced cascaded H-bridge nine-level multilevel inverter systemsusing D-STATCOM and UPQC. Energy 2022, 238, 121707. [CrossRef]
34. Yang, H.; Tao, R.; Chen, J.; Zhao, Y.; Cao, J.; He, J.; Zhou, G.; Min, B. Usage and Application of Power Quality Monitor onHarmonic Measurement. In Proceedings of the 2018 IEEE 3rd International Conference on Integrated Circuits and Microsystems,ICICM 2018, Shanghai, China, 24–26 November 2018; pp. 212–216. [CrossRef]
35. Kaushik, R.; Mahela, O.P.; Bhatt, P.K. Events Recognition and Power Quality Estimation in Distribution Network in the Presenceof Solar PV Generation; Events Recognition and Power Quality Estimation in Distribution Network in the Presence of SolarPV Generation. In Proceedings of the 2021 10th IEEE International Conference on Communication Systems and NetworkTechnologies (CSNT), Bhopal, India, 18–19 June 2021. [CrossRef]
36. Khandelwal, A.; Neema, P. State of Art for Power Quality Issues in PV Grid Connected System. In Proceedings of the 2019International Conference on Nascent Technologies in Engineering, ICNTE 2019, Navi Mumbai, India, 4–5 January 2019; pp. 1–4.[CrossRef]
37. Kow, K.W.; Wong, Y.W.; Rajkumar, R.K.; Rajkumar, R.K. A review on performance of artificial intelligence and conventionalmethod in mitigating PV grid-tied related power quality events. Renew. Sustain. Energy Rev. 2016, 56, 334–346. [CrossRef]
38. Kumary, S.V.S.; Oo, V.A.A.M.T.; Shafiullah, G.M.; Stojcevski, A. Modelling and power quality analysis of a grid-connected solarPV system. In Proceedings of the 2014 Australasian Universities Power Engineering Conference (AUPEC), Perth, WA, Australia,28 September–1 October 2014. [CrossRef]
39. Mahaddalkar, S.L.; Shet, V.N. Comparative analysis of power quality using wavelets for real time implementation. In Proceedingsof the 2016 IEEE 7th Power India International Conference (PIICON), Bikaner, India, 25–27 October 2016. [CrossRef]
40. Mahela, O.P.; Shaik, A.G. Detection of power quality events associated with grid integration of 100 kW solar PV plant. InProceedings of the 2015 International Conference on Energy Economics and Environment (ICEEE), Greater Noida, India, 27–28March 2015. [CrossRef]
41. Mukundan, C.M.N.; Naqvi, S.B.Q.; Singh, Y.; Singh, B.; Jayaprakash, P. A Cascaded Generalized Integral Control for MultiobjectiveGrid-Connected Solar Energy Transfer System. IEEE Trans. Ind. Electron. 2021, 68, 12385–12395. [CrossRef]
42. Palomares-Salas, J.C.; de la Rosa, J.J.G.; Agüera-Pérez, A.; Sierra-Fernandez, J.M. Smart grids power quality analysis based inclassification techniques and higher-order statistics: Proposal for photovoltaic systems. In Proceedings of the IEEE InternationalConference on Industrial Technology, Seville, Spain, 17–19 March 2015; pp. 2955–2959. [CrossRef]
43. Ping, H.; Dong, L.; Xin, Q. Influence of Grid.connected Photovoltaic Systems on Power Quality. In Proceedings of the 2019 IEEE2nd International Conference on Automation, Electronics and Electrical Engineering: AUTEEE 2019, Shenyang, China, 22–24November 2019.
44. Rönnberg, S.; Bollen, M. Power quality issues in the electric power system of the future. Electr. J. 2016, 29, 49–61. [CrossRef]45. Moloi, K.; Hamam, Y.; Jordaan, J.A. Power Quality Assessment of A Wind Power-Integrated System into the Power Grid. In
Proceedings of the 2020 5th International Conference on Renewable Energies for Developing Countries (REDEC), Marrakech,Morocco, 29–30 June 2020.
46. Shen, Y.; Abubakar, M.; Liu, H.; Hussain, F. Power quality disturbance monitoring and classification based on improved PCA andconvolution neural network for wind-grid distribution systems. Energies 2019, 12, 1280. [CrossRef]
47. Saini, M.K.; Beniwal, R.K. Detection and classification of power quality disturbances in wind-grid integrated system using fasttime-time transform and small residual-extreme learning machine. Int. Trans. Electr. Energy Syst. 2018, 28, e2519. [CrossRef]
48. Luo, Y.; Li, K.; Li, Y.; Cai, D.; Zhao, C.; Meng, Q. Three-Layer Bayesian Network for Classification of Complex Power QualityDisturbances. IEEE Trans. Ind. Inform. 2018, 14, 3997–4006. [CrossRef]
49. Ray, P.K.; Mohanty, S.R.; Kishor, N. Disturbance detection in grid-connected distributed generation system using wavelet andS-transform. Electr. Power Syst. Res. 2011, 81, 805–819. [CrossRef]
50. Rodrigues, N.M.; Janeiro, F.M.; Ramos, P.M. Influence of Weather Conditions in Power Quality Events. In Proceedings of the 2020IEEE 14th International Conference on Compatibility, Power Electronics and Power Engineering (CPE-POWERENG), Setúbal,Portugal, 8–10 July 2020.
51. Swarna, K.; Vinayagam, A.; Khoo, S.Y.; Stojcevski, A. International Journal of Sustainable and Green Energy An ExperimentalStudy to Investigate PQ Impacts in a Grid Connected PV System. Int. J. Sustain. Green Energy 2016, 5, 46–58. [CrossRef]
52. Florencias-Oliveros, O. Instrumental Techniques for Power Quality Monitoring. Ph.D. Thesis, University of Cadiz, Algeciras,Cadiz, Spain, 2019.

Energies 2022, 15, 2328 17 of 18
53. de la Rosa, J.J.G.; Sierra-Fernández, J.M.; Agüera-Pérez, A.; Sedeño, D.A.; Palomares-Salas, J.C.; Montero, Á.J.; Moreno-Muñoz,A. HOS and CBR measurement system for PQ assessment. In Proceedings of the International Conference on Electrical PowerQuality and Utilisation, EPQU, Lisbon, Portugal, 17–19 October 2011; pp. 397–402. [CrossRef]
54. Moreira, M.G.; Ferreira, D.D.; Duque, C.A. Interharmonic detection and identification based on higher-order statistics. InProceedings of the International Conference on Harmonics and Quality of Power, ICHQP, Belo Horizonte, Brazil, 16–19 October2016; pp. 679–684. [CrossRef]
55. Nagata, E.A.; Ferreira, D.D.; Bollen, M.H.; Barbosa, B.H.; Ribeiro, E.G.; Duque, C.A.; Ribeiro, P.F. Real-time voltage sag detectionand classification for power quality diagnostics. Measurement 2020, 164, 108097. [CrossRef]
56. Zanoni, M.; Chiappa, C.; Chiumeo, R.; Tenti, L.; Shadmehr, H. Higher-Order Statistics for Voltage Dips Characterization on ItalianMV Networks. In Proceedings of the 2020 AEIT International Annual Conference (AEIT), Catania, Italy, 23–25 September 2020.[CrossRef]
57. Gu, I.Y.H.; Styvaktakis, E. Bridge the gap: Signal processing for power quality applications. Electr. Power Syst. Res. 2003, 66, 83–96.[CrossRef]
58. Poisson, O.; Rioual, P.; Assef, Y.; Bastard, P. Advanced techniques for power quality analysis: A real case study. In Proceedingsof the International Conference on Harmonics and Quality of Power, ICHQP, Athens, Greece, 14–16 October 1998; Volume 1,pp. 376–381. [CrossRef]
59. Tse, N.C.F.; Chan, J.Y.C.; Lau, W.H.; Lai, L.L. Hybrid wavelet and hilbert transform with frequency-shifting decomposition forpower quality analysis. IEEE Trans. Instrum. Meas. 2012, 61, 3225–3233. [CrossRef]
60. Axelberg, P.G.V.; Gu, I.Y.H.; Bollen, M.H.J. Support vector machine for classification of voltage disturbances. IEEE Trans. PowerDeliv. 2007, 22, 1297–1303. [CrossRef]
61. Bollen, M.H.J.; Styvaktakis, E.; Gu, I.Y.H. Categorization and analysis of power system transients. IEEE Trans. Power Deliv. 2005,20, 2298–2306. [CrossRef]
62. Demerval, P.B.J.; Pessanha, J.E.O. Monitoring and Simulation of Power Quality Problems: A Case Study. In Proceedings of the2018 International Conference on Power Energy, Environment and Intelligent Control (PEEIC), Greater Noida, India, 13–14April 2018.
63. Sahani, M.; Dash, P.K. FPGA-based online power quality disturbances monitoring using reduced-sample HHT and class-specificweighted RVFLN. IEEE Trans. Ind. Inform. 2019, 15, 4614–4623. [CrossRef]
64. Sazli, M.H.; Kosalay, I.; Erdenesaikhan, G. A brief review of power quality issues in smart grid and a simple user friendly software.In Proceedings of the 2018 6th International Istanbul Smart Grids and Cities Congress and Fair, ICSG 2018, Istanbul, Turkey,25–26 April 2018; pp. 54–58. [CrossRef]
65. Crotti, G.; D’Avanzo, G.; Landi, C.; Letizia, P.S.; Luiso, M.; Muñoz, F.; van den Brom, H. Instrument Transformers for PowerQuality Measurements: A Review of Literature and Standards. In Proceedings of the 2021 IEEE 11th International Workshop onApplied Measurements for Power Systems (AMPS), Cagliari, Italy, 29 September–1 October 2021. [CrossRef]
66. Nuca, I.; Kostic, D.; Nicolae, P.M.; Nuca, I.; Cazac, V.; Burduniuc, M. Harmonic Decomposition and Power Quality Analysis of aSix-Phase Induction Motor Traction Drive with Fast Fourier Transform. In Proceedings of the 11th International Conference onElectromechanical and Energy Systems (SIELMEN), Iasi, Romania, 6–8 October 2021; pp. 433–437. [CrossRef]
67. Zhong, Q.; Yao, W.; Lin, L.; Wang, G.; Xu, Z. Data Analysis and Applications of the Power Quality Monitoring. Available online:https://www.cisco.com/c/dam/en_us/about/ac79/docs/innov/IoT_IBSG_0 (accessed on 25 January 2022).
68. Cifredo-Chacón, M.Á.; Perez-Peña, F.; Quirós-Olozábal, Á.; González-de-la-Rosa, J.J. Implementation of processing functions forautonomous power quality measurement equipment: A performance evaluation of CPU and FPGA-based embedded system.Energies 2019, 12, 914. [CrossRef]
69. Sierra-Fernández, J.M.; Ronnberg, S.; de la Rosa, J.J.G.; Bollen, M.H.J.; Palomares-Salas, J.C. Application of spectral kurtosis tocharacterize amplitude variability in power systems’ harmonics. Energies 2019, 12, 194. [CrossRef]
70. Caciotta, M.; Giarnetti, S.; Leccese, F.; Leonowicz, Z. Comparison between DFT, Adpative Window DFT and EDFT for PowerQuality Frequency Spectrum Analysis. 2010. Available online: http://www.meps10.pwr.wroc.pl (accessed on 7 March 2022).
71. Arrabal-Campos, F.M.; Alcayde, A.; Montoya, F.G.; Martinez-Lao, J.; Banos, R. A MATLAB application for monitoring theoperation and power quality of electrical machines. In Proceedings of the International Conference on Harmonics and Quality ofPower, ICHQP, Ljubljana, Slovenia, 13–16 May 2018; pp. 1–5. [CrossRef]
72. Barros, J.; de Apráiz, M.; Diego, R.I. Power quality in DC distribution networks. Energies 2019, 12, 848. [CrossRef]73. Carvalho, E.L.N.; Passos, F.O.; Cyrillo, I.O.; Miranda, J.; Filho, J.M.C.; Carneiro, J.R.; Motta, L.J.; de Costa, M.V.; Pereira, N.B.;
Silveira, P.M.; et al. A Proposal for Quality Management System. In Proceedings of the 19th International Conference onHarmonics and Quality of Power (ICHQP), Dubai, United Arab Emirates, 6–7 July 2020; 2020; pp. 1–6. [CrossRef]
74. Guerrero-Rodríguez, J.M.; Cobos-Sánchez, C.; González-De-la-Rosa, J.J.; Sales-Lérida, D. An embedded sensor node for thesurveillance of power quality. Energies 2019, 12, 1561. [CrossRef]
75. Gunal, S.; Gerek, O.N.; Ece, D.G.; Edizkan, R. The search for optimal feature set in power quality event classification. Expert Syst.Appl. 2009, 36, 10266–10273. [CrossRef]
76. Guo, M.; Chen, W.; Jin, Q.; Yao, Z. Research on Online Detection Method of Power Quality Monitoring Device and SystemDesign. In Proceedings of the 2019 14th IEEE Conference on Industrial Electronics and Applications (ICIEA), Xi’an, China, 19–21June 2019.
Energies 2022, 15, 2328 18 of 18
77. Krishna, B.V.; Baskaran, K. Parallel computing for efficient time-frequency feature extraction of power quality disturbances. IETSignal Process. 2013, 7, 312–326. [CrossRef]
78. Martinez-Figueroa, G.D.J.; Morinigo-Sotelo, D.; Zorita-Lamadrid, A.L.; Morales-Velazquez, L.; Romero-Troncoso, R.D.J. FPGA-based smart sensor for detection and classification of power quality disturbances using higher order statistics. IEEE Access 2017,5, 14259–14274. [CrossRef]
79. Rodrigues, N.M.; Janeiro, F.M.; Ramos, P.M. Low-Cost Embedded Meaurement System for Power Quality Frequency Monitoring.In Proceedings of the 2020 IEEE 14th International Conference on Compatibility, Power Electronics and Power Engineering(CPE-POWERENG), Setubal, Portugal, 8–10 July 2020.
80. Commission (EU). Stepping up Europe’s 2030 climate ambition Investing in a climate-neutral future for the benefit of our people(Communication to the European Parliament, the Council. In Proceedings of the European Economic and Social Committee andthe Committee of the Regions, COM(2020) 562 Final, Brussels, Belgium, 17 September 2020.
81. Koronen, C.; Åhman, M.; Nilsson, L.J. Data centres in future European energy systems—Energy efficiency, integration and policy.Energy Effic. 2020, 13, 129–144. [CrossRef]
82. Marafao, F.P.; Alonso, A.M.D.S.; Goncalves, F.A.S.; Brandao, D.I.; Martins, A.C.G.; Paredes, H.K.M. Trends and Constraints onBrazilian Photovoltaic Industry: Energy Policies, Interconnection Codes, and Equipment Certification. IEEE Trans. Ind. Appl.2018, 54, 4017–4027. [CrossRef]
83. Sistema Europeo de Negociación de CO2. Price per Emission Right of Carbon Dioxide and Carbon Credits per ton. SENDECO2.Feb. 2022. Available online: https://www.sendeco2.com/es/precios-co2 (accessed on 7 March 2022).
84. Soeiro, S.; Dias, M.F. Renewable energy community and the European energy market: Main motivations. Heliyon 2020, 6, e04511.[CrossRef] [PubMed]
85. Liu, H.; Khan, A.R.; Aslam, S.; Rasheed, A.K.; Mohsin, M. Financial impact of energy efficiency and energy policies aimed atpower sector reforms: Mediating role of financing in the power sector. Environ. Sci. Pollut. Res. 2022, 29, 18891–18904. [CrossRef][PubMed]
86. Ullah, Z.; Asghar, R.; Ali, N.; Waseem, A.; Khan, A.; Muiahid, T.; Khan, B.; Ali, S.M.; Mehmood, C.A. Digital Signal Process-ing for Power Quality Enhancement within Smart Grid. In Proceedings of the 2021 International Conference on Electrical,Communication, and Computer Engineering (ICECCE), Kuala Lumpur, Malaysia, 12–13 June 2021. [CrossRef]
87. IEEE Guide for Identifying and Improving Voltage Quality in Power Systems. In IEEE Std 1250-2018 (Revision of IEEE Std1250-2011); IEEE: Manhattan, NY, USA, 2018; pp. 1–63. [CrossRef]
88. Moreno-Muñoz, A. (Ed.) Power Quality. Mitigation Technologies in a Distributed Environment; Springer Science & Business Media:Berlin/Heidelberg, Germany, 2007.
89. Biswas, S.; Goswami, S.K.; Chatterjee, A. Optimum distributed generation placement with voltage sag effect minimization. EnergyConvers. Manag. 2012, 53, 163–174. [CrossRef]
90. Sudharani, S.; Immanuel, D.G. Mitigation of voltage sag/swell by dynamic voltage restorer using fuzzy based particle swarmcontroller. Mater. Today Proc. 2021. [CrossRef]
91. Tristiu, I.; Eremia, M.; Bulac, C.; Toma, L. Multi-criteria reconfiguration of distribution electrical networks for minimizationof power losses and damage cost due to power supply interruption. In Proceedings of the 2007 IEEE Lausanne Power Tech,Lausanne, Switzerland, 1–5 July 2007; pp. 385–390. [CrossRef]
92. Jahromi, M.H.M.; Soleymani, S.; Mozafari, B. Optimal allocation of inverter connected DGs: An objective function to minimizedeterioration of transient stability of power system. Int. J. Electr. Power Energy Syst. 2020, 123, 106267. [CrossRef]
93. Al-Hasawi, W.M.; El-Naggar, K.M. A genetic based algorithm for voltage flicker measurement. In Proceedings of the Mediter-ranean Electrotechnical Conference—MELECON, Cairo, Egypt, 7–9 May 2002; Volume 1, pp. 600–604. [CrossRef]
94. Grady, W.M.; Samotyj, M.J.; Noyola, A.H. The application of network objective functions for actively minimizing the impact ofvoltage harmonics in power systems. IEEE Trans. Power Deliv. 1992, 7, 1379–1386. [CrossRef]
95. Choi, J.W.; Cho, N.I. Suppression of Narrow-Band Interference in DS-Spread Spectrum Systems Using Adaptive IIR Notch Ÿlter.2002. Available online: www.elsevier.com/locate/sigpro (accessed on 17 March 2022).
Copyright © 2022 FDOKUMEN