Cultural Adaptations to the Measurement of Attitudes to Ageing
49
The University of Manchester Research Cultural Adaptations to the Measurement of Attitudes to Ageing: Psychometric Assessment of the Malay Reactions to Ageing Questionnaire DOI: 10.1177/1073191118766400 Document Version Accepted author manuscript Link to publication record in Manchester Research Explorer Citation for published version (APA): Mohd Faudzi, F. N. B., Armitage, C. J., Bryant, C., & Brown, L. (2018). Cultural Adaptations to the Measurement of Attitudes to Ageing: Psychometric Assessment of the Malay Reactions to Ageing Questionnaire. Assessment. https://doi.org/10.1177/1073191118766400 Published in: Assessment Citing this paper Please note that where the full-text provided on Manchester Research Explorer is the Author Accepted Manuscript or Proof version this may differ from the final Published version. If citing, it is advised that you check and use the publisher's definitive version. General rights Copyright and moral rights for the publications made accessible in the Research Explorer are retained by the authors and/or other copyright owners and it is a condition of accessing publications that users recognise and abide by the legal requirements associated with these rights. Takedown policy If you believe that this document breaches copyright please refer to the University of Manchester’s Takedown Procedures [http://man.ac.uk/04Y6Bo] or contact [email protected] providing relevant details, so we can investigate your claim. Download date:13. Feb. 2022
-
Upload
khangminh22 -
Category
Documents
-
view
1 -
download
0
Transcript of Cultural Adaptations to the Measurement of Attitudes to Ageing
The University of Manchester Research
Cultural Adaptations to the Measurement of Attitudes toAgeing: Psychometric Assessment of the Malay Reactionsto Ageing QuestionnaireDOI:10.1177/1073191118766400
Document VersionAccepted author manuscript
Link to publication record in Manchester Research Explorer
Citation for published version (APA):Mohd Faudzi, F. N. B., Armitage, C. J., Bryant, C., & Brown, L. (2018). Cultural Adaptations to the Measurement ofAttitudes to Ageing: Psychometric Assessment of the Malay Reactions to Ageing Questionnaire. Assessment.https://doi.org/10.1177/1073191118766400
Published in:Assessment
Citing this paperPlease note that where the full-text provided on Manchester Research Explorer is the Author Accepted Manuscriptor Proof version this may differ from the final Published version. If citing, it is advised that you check and use thepublisher's definitive version.
General rightsCopyright and moral rights for the publications made accessible in the Research Explorer are retained by theauthors and/or other copyright owners and it is a condition of accessing publications that users recognise andabide by the legal requirements associated with these rights.
Takedown policyIf you believe that this document breaches copyright please refer to the University of Manchester’s TakedownProcedures [http://man.ac.uk/04Y6Bo] or contact [email protected] providingrelevant details, so we can investigate your claim.
Download date:13. Feb. 2022
1
Cultural Adaptations to the Measurement of Attitudes to Ageing: Psychometric
Assessment of the Malay Reactions to Ageing Questionnaire
This is a pre-copyedited, author-produced PDF of an article accepted for publication in the journal ‘Assessment’ in February 2018, following peer review. The final published version of the article will
be available from the publisher’s website: http://journals.sagepub.com/home/asm
Farah Nadia M.Faudzi1, Christopher J. Armitage
1, 2,3 , Christina Bryant
4, Laura J.E.
Brown*1
1 Manchester Centre for Health Psychology, Division of Psychology and Mental Health, University of
Manchester, UK.
2 NIHR Manchester Biomedical Research Centre, Manchester University NHS Foundation Trust,
Manchester Academic Health Science Centre, UK
3NIHR Greater Manchester Patient Safety Translational Research Centre
4 Melbourne School of Psychological Sciences, University of Melbourne, Melbourne, Australia
*Address correspondence to Laura J.E. Brown, Manchester Centre for Health Psychology, Division of
Psychology and Mental Health, and The University of Manchester, Zochonis Building, Manchester, M13
9PL. E-mail: [email protected]
Acknowledgments
We thank the study participants and the managers of the participating organizations for
their contribution to this study.
2
Abstract
The aims of this study were to culturally-adapt the Reactions to Ageing Questionnaire
(RAQ) for a non-Western (Malay) population, and explore attitudes to ageing in relation
to age, gender and education. Eight new culturally-relevant items were generated by
asking Malay-speaking participants about their reactions to ageing. A Malay version of
the extended 35-item RAQ was then administered to 911 Malaysian participants aged 18-
60 years. Exploratory factor analysis revealed four factors. Three of the factors were
similar to those identified in the original RAQ, whilst ‘Family and Religion’ emerged as a
new factor. More negative attitudes to ageing were observed in younger and women
respondents. There were no effects of education. This culturally-adapted RAQ exhibits
robust psychometric properties, and could be used to assess attitudes to ageing in
Malaysia and other Southeast Asian countries. Moreover, we have identified a “core set”
of RAQ items with that could be applicable worldwide.
Key words: Validation, Reliability, Attitudes to Ageing, Self-Perception, Personal Ageing
2
Introduction
Attitudes to ageing are defined as feelings, cognitions and behaviours related to the
process of ageing as a personal experience (Hess, 2006), including the views, interpretations,
experiences, expectations and concerns that an individual holds about their own ageing
(Janeckova, Dragomirecka, Holmerova & Vankova, 2013; Levy, 2003; Steverink, Westerhof,
Bode & Dittmann-Kohli, 2001). Attitudes to ageing can be held both by people who have
already experienced ageing (e.g. those over 60 years of age: United Nation, 2013), and by those
who are younger (Kornadt & Rothermund, 2015). However, the nature and determinants of these
attitudes are understood to differ in some important ways. In particular, as people get older, their
attitudes may be informed by their personal experiences of age-related changes (O’Hanlon &
Coleman, 2008), such as to their appearance (e.g., wrinkled skin and graying hair), functioning
(e.g., reduced stamina) or health (Diehl, Brothers, Wahl & Miche, 2015). In contrast, attitudes to
ageing held in younger life are more likely to be informed by observations of other people’s
ageing (Gilbert & Ricketts, 2008), or from cultural stereotypes of old age (Levy, 2009), and thus
are comprised of expectations, hopes, and fears about how the self and life will be in later life
(Kornadt, Voss & Rothermund, 2015).
Empirical studies have shown that negative attitudes to ageing held by adults in
younger life can have important consequences for future health and well-being. For example,
Klusmann, Sproesser, Wolff and Renner (2017) showed that positive attitudes to ageing at
baseline predicted healthier eating patterns over a one-year follow-up period in both middle-aged
(36-64 years) and younger (18-35 years) adults, even after controlling for participants’ gender
and baseline eating behaviour, health, and BMI. More positive attitudes to ageing in middle-aged
adults of good health have also been shown to be positively associated with levels of sporting
3
activity six years later (Wurm, Tomasik & Tesch-Romer, 2010). Such associations between
attitudes to ageing and engagement in health behaviours highlight the importance of
understanding the content and valence of attitudes to ageing held by people before they reach
later life.
There is evidence that attitudes to ageing held before old age can be influenced by a
range of demographic variables, including age, gender, and education level. For instance,
previous studies have demonstrated that attitudes tend to be more negative at younger ages
(Abraham & Silverstein, 2006; Draper, Gething, Fethney & Winfield, 1999; Golden,
Gammonley, Hunt, Olsen, & Issenberg, 2013; Mosher-Ashley & Ball, 1999; Usworth, McKee &
Mulligan, 2001) and among women (Abraham & Silverstein, 2006; Barret & Von Rohr, 2008;
Cumming & Kropf & DeWeaver, 2000; Draper et al.,1999; Golden et al, 2013). These findings
are consistent with the notion that anxiety towards an anticipated event (in this case ageing) is
greater than when that event is actually experienced (Yan, Silverstein & Wilber, 2011), and that
the anticipation of ageing may be more negative for women due to cultural preferences for
youthfulness (Armitage, 2016) and physical appearance (Barret & Vohn Rohr, 2008). The
influence of education in adults younger than 60 years is less clear: although studies with middle
aged participants have shown higher levels of education to be associated with more positive
attitudes to ageing (Joshi, Malhotra, Lim, Ostbye & Wong, 2010), studies with a broader range
of younger participants (e.g. aged 15 – 69 years) have found no effects of education on attitudes
to ageing (Gething, 1994; Gething, Fethney, Mckee, Goff, Churchward & Matthews, 2002;
Gething et al., 2004). One reason for this discrepancy in the effects of education could be that the
younger populations in the studies by Gething (1994) and Gething et al. (2002; 2004) were
4
healthcare workers, who are more likely than the general population to have higher levels of
education.
Despite the importance of measuring attitudes to ageing in younger populations, most of
the commonly-used measures have been specifically developed for use with older adults (i.e.,
those aged over 60). For instance, the Attitudes to Ageing Questionnaire (AAQ: Laidlaw, Wang,
Coelho & Power, 2007) and the Aging Perceptions Questionnaire (APQ; Barker, O'Hanlon,
McGee, Hickey & Conroy, 2007) ask older participants to reflect on their own experiences of
ageing, and so are not suitable for younger individuals who have yet to experience the ageing
process. The Reactions to Ageing Questionnaire (RAQ) is one of the few measures of attitudes to
ageing that has been designed to be administered to people aged under 70 (Gething, 1994), and
operationalises attitudes to personal ageing in terms of an individual’s anticipations of their
future characteristics when they are old (Koder & Helmes, 2008a). The RAQ was first developed
from open-ended responses about how nurses felt about ageing, and then validated using a
sample of 531 health care specialists and a general population sample aged 15-69 years.
Psychometric analysis of this original 27-item version revealed six factors: Anxiety about the
Future; Physical Well-being; Psychological Well-being; Denial of Ageing; Isolation; and
Activity (Gething, 1994).
The RAQ has been validated for use in Australia (Koder & Helmes, 2006; 2008a; 2008b;
Netz, Guthrie, Garamszegi & Dennerstein, 2001; Gething et al., 2004), Canada (Helmes &
Pachana (2015), the UK (Gething et al., 2004; Unsworth et al., 2001) and Sweden (Gething et
al., 2004). However, there are inconsistencies in the numbers and content of the factors
extracted, with some studies extracting as few as three factors (Koder & Helmes, 2006; 2008a;
Gething et al., 2004; Wells, Foreman, Gething & Petralia, 2004), and others identifying four
5
(Koder & Helmes, 2008b) or five factors (Netz et. al., 2001; Usworth et al., 2001). Some items
have also shown low factor loadings (Gething, 1994; Netz et al., 2001), and have been removed
(Gething et al., 2004; Unsworth et al., 2001). Taken together, these inconsistencies in factor
structure and weak factor loadings, suggest that more validation work is needed to refine the
content of the scale.
To develop a full understanding of how attitudes to aging form, develop, and influence
future outcomes, it is important to look beyond Western populations (e.g. those in North
America, Australasia, and Europe). It is therefore notable that the RAQ has not yet been tested in
a non-Western country. Given that the original RAQ items were generated by Western
participants, the content of the RAQ is also likely to be biased towards a Western understanding
of ageing. This omission is important because research to date suggests that there may be key
differences between Western and non-Western societies in the ways they perceive ageing and
older people (Lockenhoff, Lee, Buckner, Moreira, Mertinez & Sun, 2015). For instance, Western
populations, with more individualistic values, tend to value older adults less highly and attach
greater importance to self-fulfilment, freedom and individuality (Wang & Mallinckrodt, 2006).
In contrast, Eastern populations (e.g., Southeast Asian and Middle Eastern) tend to hold more
collectivistic values that play important roles in guiding intergenerational relations, in which
adults are expected to be considerate, respectful and supportive towards their parents (Kim,
Cheng, Zarit & Fingerman, 2015).
Malaysia can be considered representative of Southeast Asia, a region that has a land
mass of 4.5 million km2 (10.5% of Asia), is home to 641.8 million people, and includes countries
such as Singapore, Thailand and Indonesia as well as Malaysia (World Population Prospect,
2017). Malaysia is typical of this region in terms of gross domestic product per capita ($26,141
6
versus mean $22,777 for the Southeast Asian region: International Monetary Fund, 2017) and
subjective well-being (M = 7.13 versus M = 7.21 for other Southeast Asian countries: World
Values Survey, 2017). Moreover, consistent with the idea of “Eastern values”, compared with
“Western values”, Malaysian citizens strongly endorse collectivistic values (Kunhen et al.,
2001), routinely practice values of filial piety (Damulak, Minhat & Rahman, 2015), engage in
high levels of caregiving (Minhat, Hamizah & Nor Afiah, 2015a), show high levels of family
support (Teh, Tey & Ng, 2014), and a high proportion of them live with elderly relatives
(Kooshiar, Yahaya, Hamid, Abu Samah & Jou, 2012). Malaysian people are also more likely to
hold conservative values, and are keener to teach values of thrift and hard work in their
offspring, compared to people in the West (Bomhoff & Gu, 2012).
Given the cultural differences between Eastern and Western cultures, simple translation
of the RAQ from English is unlikely to capture sufficiently the content of the attitudes held by a
non-Western population (Schellingerhout, Heymans, Verhagen, de Vet, Koes & Terwee, 2011).
Instead, measures of attitudes to ageing will likely require some cultural adaptation to ensure that
they fully capture the attitudes held by the population of interest. For this reason, the aims of the
present study were to culturally-adapt and validate a Malay version of the RAQ, and then explore
the effects of key demographic variables (age, gender, and education, which are among the most
frequently explored variables in Western populations) on attitudes to ageing. In order to achieve
this aim, we first generated potential new items for the RAQ by asking Malay participants to
report their thoughts and feelings about their own ageing. A Malay-language version of this
culturally-adapted scale was then administered to a large sample of Malay participants aged 18-
60 years of age. Given the known relationships between attitudes to ageing and age and gender
7
(Draper et al., 1999; Golden et al, 2013), we expected that older participants and men would
have more positive attitudes to ageing. The effect of education was also explored.
Method
Participants
Participants in the present study were employees of public sector organizations around Kedah,
the Northern region of Peninsular Malaysia. Public rather than private sector organizations were
approached because the Ministry of Information was able to supply a list of all such
organisations, making it possible to approach all organisations, and minimise the risk of selection
bias. According to the Department of Statistics, Malaysia (2016), about 1.65 million people
(12.2%) work in this sector out of 13.5 million employees in Malaysia. Inclusion criteria for the
present study were: 1) to be an employee aged 18 to 60 years old, and 2) to be fluent in the
Malay language, with self-reported language proficiency at either level 4 (full professional
proficiency) or 5 (native proficiency) (Interagency Language Roundtable, 2016).
Materials
- Cultural-Adaptation of the RAQ
The original 27-item RAQ (Gething et al., 2004) was first translated into the Malay
language using an English-Malay-English back translation procedure (Ozolins, 2009). Members
of the research team compared the original and the back-translated English versions to identify
any differences in the meanings of the items. Any problems were then resolved through
discussions between a Malay-English bilingual linguistics scholar and members of the research
team. As a final check for clarity, this revised translated version was then administered to 18
Malay-speaking participants living in the North West of the UK. These participants were
8
purposively recruited to ensure approximately equal numbers of women (n = 10) and men (n =
8); and a spread of age ranges (18-29 (n = 6), 30-39 (n = 7), 40-49 (n = 3) and 50-60 (n = 2)) and
ethnicities (Malay (n = 14), Chinese (n = 3) and Indian (n = 1)). All participants were native
Malay speakers who were born in Malaysia and had spent fewer than five years in the UK.
Participants were asked to ‘think aloud’ (Kaklamanou, Armitage & Jones, 2013) when
completing the questionnaire. This required the participants to complete the questionnaire whilst
telling the researcher everything they were thinking as they did so. Any ambiguities or
misunderstandings about the items arising from this procedure were then addressed through
discussion within the research team.
Candidate new items for inclusion in the culturally-adapted version of the Malay RAQ
were identified by asking the same 18 participants to respond to an item in the Malay language
that asked them to: “Imagine that you are over the age of 65. Tell me how you feel about your
own ageing”. This open-ended question was based on that used by Gething (1994) when
developing the original version of the RAQ. Although the precise question used to elicit
participants’ responses was not reported, Gething (1994, p.77) states that participants ‘were
asked to write open-ended responses about how they felt about their own ageing’. This task was
presented before participants completed the Malay translated RAQ in order to prevent their
responses from being influenced by the contents of the RAQ.
- Content Analysis of Open-Ended Responses
In line with the concept mapping of open-ended responses procedure described by
Jackson and Trochim (2002), each response to the open-ended question was first split into single
concept phrases. These phrases were then sorted into groups of similar statements (themes), and
9
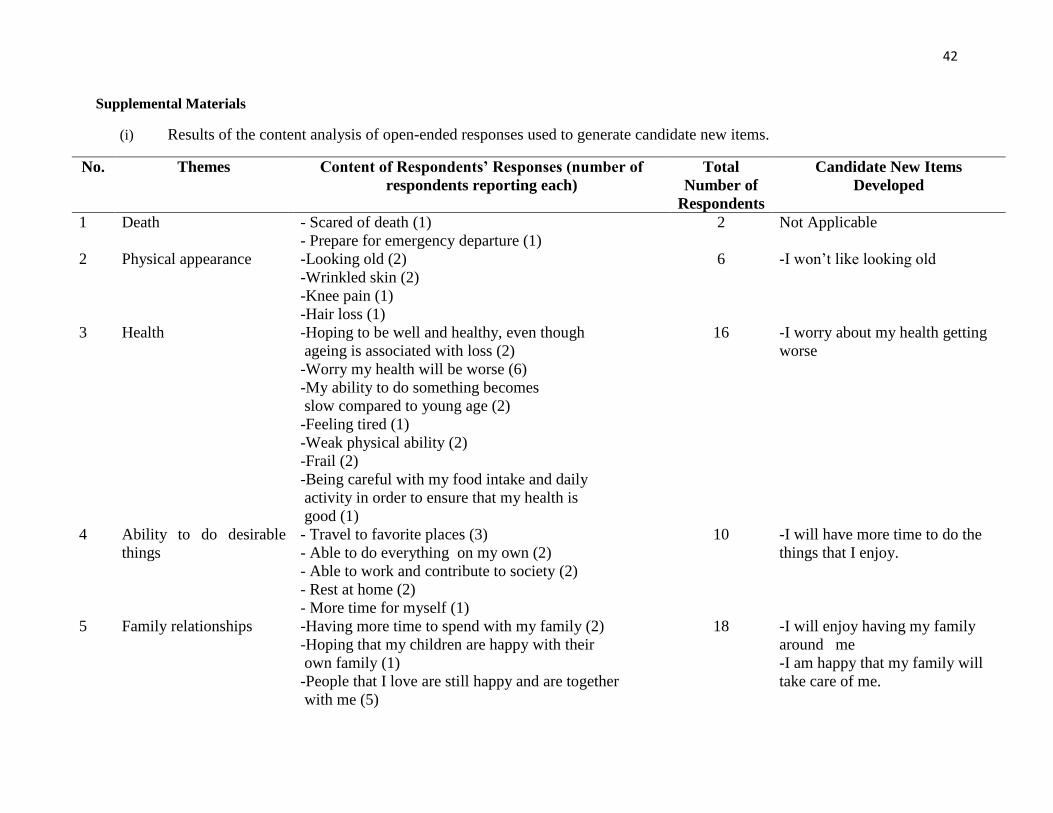
the frequency of responses within each theme calculated. This procedure produced eight themes
relating to attitudes to ageing (Supplemental materials (i)). The content of the themes was then
compared to the existing items of the RAQ to identify any topics that were not sufficiently
covered by the existing items, so that candidate new items could be developed, where necessary.
The content of one of these themes (death) was already represented in the original version
of the RAQ (e.g: Item 7- I worry about dying and leaving behind those I love), and so no new
items related to this theme were generated. An additional four themes (themes 2-5) were already
covered in the original RAQ, but the existing items did not capture the full breadth of
participants’ responses. For example, although the physical appearance (theme 2) theme was
partly covered in the original RAQ (item 21: I won’t like growing old), the item did not refer to
physical appearance, and so a new item was generated to capture this (I won’t like looking old).
Theme 3 (health), was covered by a number of items in the original RAQ (e.g.: Item 2- I worry
that I might become senile and lose my mind; Item 17- I worry about becoming frail), but none
of these items related to the more general health worries reported by our participants, and so a
new item was generated to capture this (I worry about my health getting worse). For theme 4
(ability to do desirable things), item 25 of the original RAQ, ‘there is a lot to look forward to in
regard to being old’ was relevant, but very general, and did not specifically mention being able
to undertake desirable activities. Therefore, a more specific new item (‘I will have more time to
do things that I enjoy’) was generated. Two new items were also developed to capture the
content of theme 5 (family relationships). This is because participants’ responses to this theme
mainly focused on family or parent-child relationships, whereas existing relationship items in the
RAQ were more general, and seemed to refer more to relationships with partners (e.g: item 16 ‘I
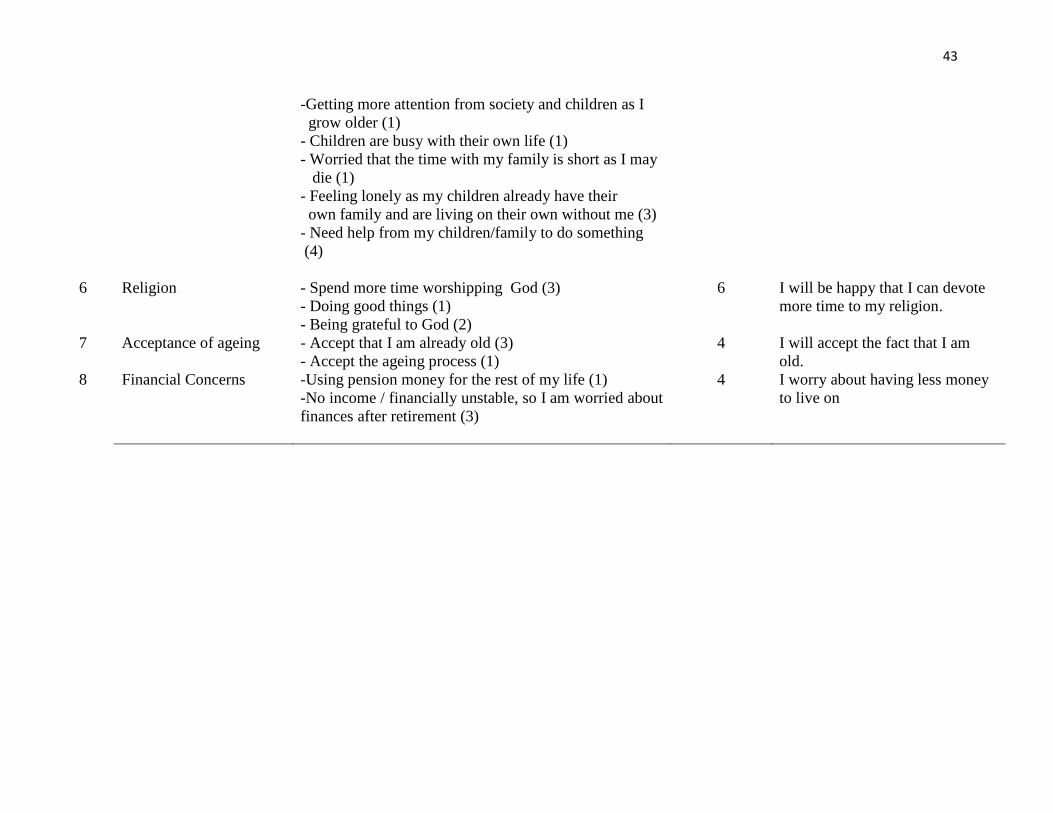
look forward to growing old with someone I love’). The final three themes (6-8: religion;

10
acceptance of ageing; and financial concerns) were not represented in the original version of the
RAQ, and so new items relating to these themes were generated to capture the meaning of
participants’ responses. The results of content analyses, participants’ responses, and the
candidate new items generated are presented in the Supplemental materials (i).
The final questionnaire therefore comprised 27 translated items from the original RAQ
and eight new items (see Supplemental materials (ii)). Participants were asked to indicate how
much they agreed or disagreed with each statement in relation to how they might feel when they
are over the age of 65. Responses were given on a 5-point Likert-type scale ranging from
strongly disagree (1)-strongly agree (5). This response scale differed slightly from the 6-point
scale used by Gething (1994). This was because the RAQ was administered as part of a larger
battery of questionnaires, and a consistent response style between questionnaires was used to
minimize the potential for confusion. Eighteen of the 35 items (2, 4, 7, 8, 9, 11, 13, 17, 18, 19,
20, 21, 23, 26, 27, 29, 30 & 31) were reverse scored so that a higher score always indicated more
positive attitudes. Total scores on the RAQ could therefore range from 35 to 175, with higher
scores on all items indicating more positive attitudes to ageing.
Procedure
The study was approved by the University of Manchester Research Ethics Committee
(Reference: 15223) and the Malaysian Economic Planning Unit (MEPU). The data were
collected between October and December 2015. Letters asking permission to conduct the study
were sent to 68 organisations listed by the Ministry of Information, Kedah, including schools, the
immigration department and religious centres. Sixty seven of these organisations agreed to be
involved with the study. The researcher then provided packs of questionnaires to the managers of

11
each of these organisations. Managers were asked to distribute the questionnaires to all
employees in their organization, and ask them to complete and return them within the next two
weeks. This approach was taken as using legitimate authority, such as management support, has
been found to increase participant response rates, particularly in Asian countries (Krishnan &
Poulose, 2016).
Each questionnaire pack contained a participant information sheet, the culturally-adapted
Malay RAQ, demographic questions (date of birth, gender, language proficiency, and levels of
education, for which participants indicated which of four categories (high school;
certificate/diploma; undergraduate; or postgraduate) best represented their highest level of
education), plus a number of other measures of attitudes, health, and well-being that were
collected as part of a larger study. The questionnaires were completed anonymously and the
participants were asked to seal the opaque envelope provided after the completion of the
questionnaire to ensure confidentiality. The researcher subsequently collected the envelopes
from the manager.
Data Analysis
The analyses were carried out using IBM SPSS 23. We first used Exploratory Factor Analysis to
examine the basic structure of the culturally-adapted RAQ, and to identify items with low factor
loadings. Cronbach's alpha coefficients were then calculated to evaluate internal consistency.
The interactions between socio-demographic variables (age, gender, level of education) and the
subscales of the RAQ were tested using an alpha value of .05 (i.e., p < .05), using analysis of
variance (ANOVA). To maximise comparability with the original RAQ validation by Gething
(1994), four age groups (18-29, 30-39, 40-49, 50-60) were used for these analyses. To minimise
12
the number of small sample sizes within each cell of the factorial design (Tabachnick & Fidell,
1996), the four educational background categories were collapsed into two broader categories of
lower (high school and certificate/diploma) and higher (undergraduate/postgraduate) education.
Results
Participant Characteristics
Overall, 1731 questionnaire packs were distributed to the managers of the 67 participating
organisations. Of these, employees returned 957 questionnaires to their managers. Thirty-one
questionnaires contained at least one full scale that had not been completed, and so were
excluded from subsequent analyses. Data from an additional nine participants were excluded
because they had missed one or more items of the RAQ, and from one participant who was an
extreme outlier (more than 3 interquartile ranges from the rest of the scores). The data from a
further five participants were excluded for not meeting language inclusion criteria (i.e. indicating
that their Malay proficiency was lower than full professional proficiency). The final sample
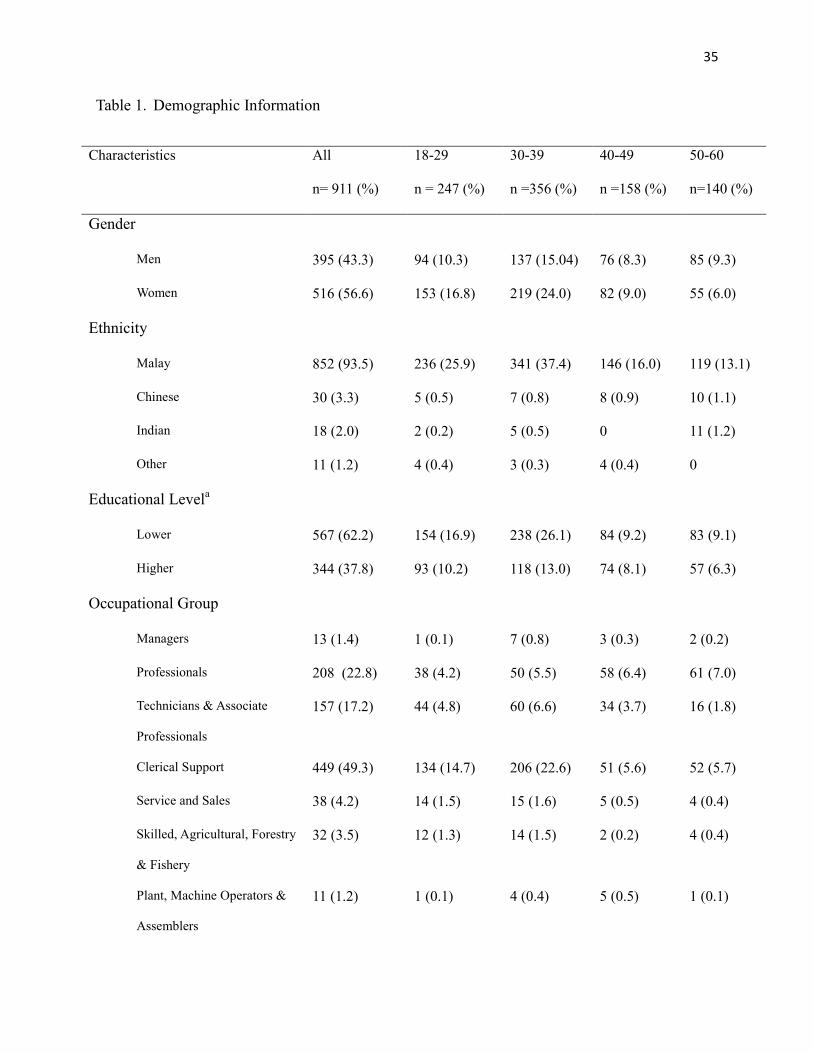
therefore comprised 911 participants (Table 1). The sample size was considered appropriate on
the basis of meeting the recommendation by Hair, Black, Babin and Anderson (2014) of
achieving a minimum participant: item ratio of 1:20 (i.e. 700 participants for a 35-item measure),
and being close to the 1000 participant level that is considered “excellent” (Comree & Lee,
1992). Ten of these participants did not provide their year of birth. Data for these participants
was included in the factor analysis, but not in the analyses involving age.
Table 1 about here.
More women (n = 516) than men (n = 395) participated in the research (Table 1), whereas
national census data indicate that there are 0.84 million men and 0.81 million women employed
13
in the public sector (Department of Malaysia Statistics, 2016). In the present study, the majority
of participants (94%) were of Malay ethnicity, followed by Chinese (3.3%), Indian (2.0%) and
others (1.2%). These proportions differ slightly from Malaysian population levels, which are
reported as 68.6%, 23.4%, 7.0 % and 1.0 % for Malay, Chinese, Indian and others respectively
(Department of Statistics Malaysia, 2016). In terms of education levels, more participants had
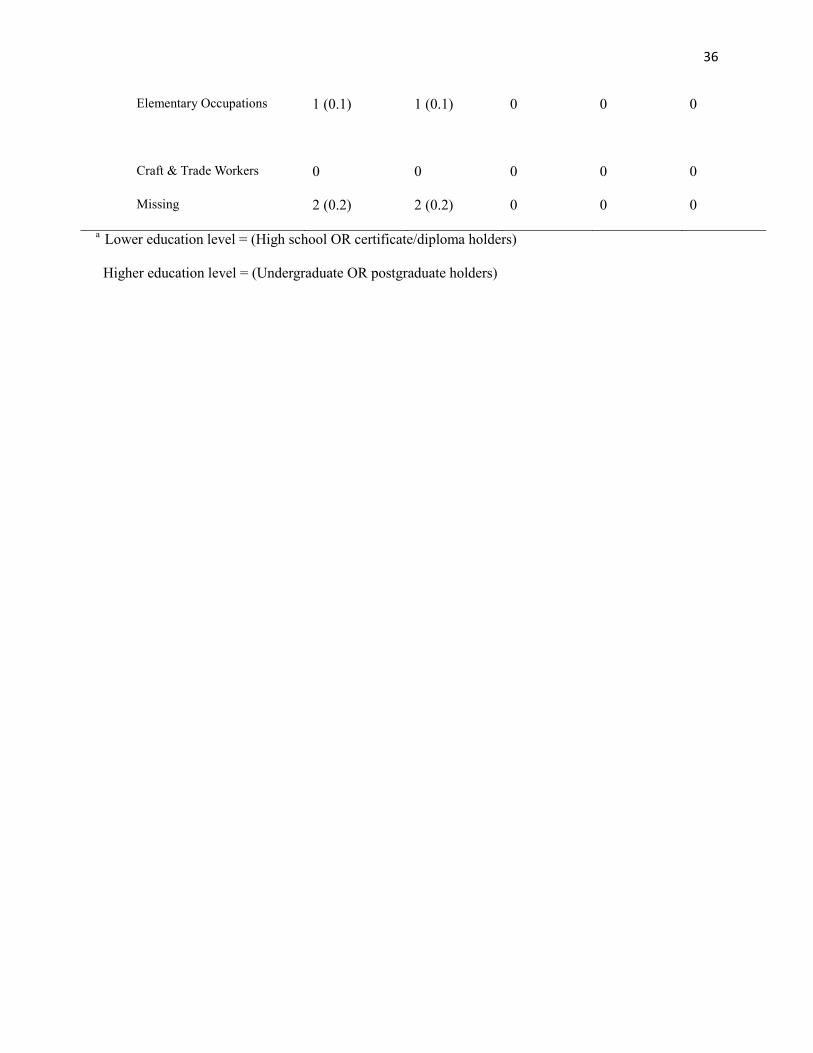
lower (n = 567) than higher levels of education (n= 344). Job types were classified into nine
categories, as specified by the Malaysian Standard Classification of Occupations (2008). Almost
half of the respondents (49.3%) were categorised as being clerical support workers (e.g., clerks
or secretaries), 22.8% as professionals (e.g., lecturers or engineers), with technicians and
associate professionals (e.g., nurses or laboratory assistants) making up the remaining 17.2%.
The present sample differed from the general Malaysian population, with those in lower-level
occupations (e.g., cleaner, street vendor, machine operators) being under-represented (Ministry
of Human Resources, 2015).
Factorial Structure of the RAQ
An exploratory factor analysis was conducted on participants’ responses to the 35 items of the
Malay RAQ. The coefficient value of the Kaiser-Meyer-Olkin test revealed an excellent level of
sampling adequacy (0.91), and the Bartlett’s Test of Sphericity was statistically significant (p <
.05), suggesting that the data were meaningful. The exploratory factor analysis produced six
components with eigenvalues greater than one. However, the scree plot showed a sharp decrease
after the fifth factor, suggesting that a four-factor model was more appropriate. This was
confirmed by a Monte Carlo Parallel Analysis (MCPA: Ladesma & Valero – Mora, 2007), which
showed that random ordered eigenvalues were below the actual eigenvalues for only four factors.

14
As the data were normally distributed, and there are possible correlations among the
factors tested, Maximum likelihood (ML) extraction and oblique rotation methods were used
(Costello & Osborne, 2005). These methods are consistent with previous analyses of the RAQ
(Gething, 1994; Gething et al., 2004). In order to identify items that most clearly represent the
four extracted factors, any items loading less than .45 were excluded. Comrey and Lee (1992)
recommend this cut-off on the grounds that only items loading above this value can be
considered to be fair descriptors of the underlying construct. Ten items were excluded using this
criterion, only one of which was one of the new items generated for the present study (item 32: I
will accept the fact that I am old). The other seven new items were retained, indicating a broader
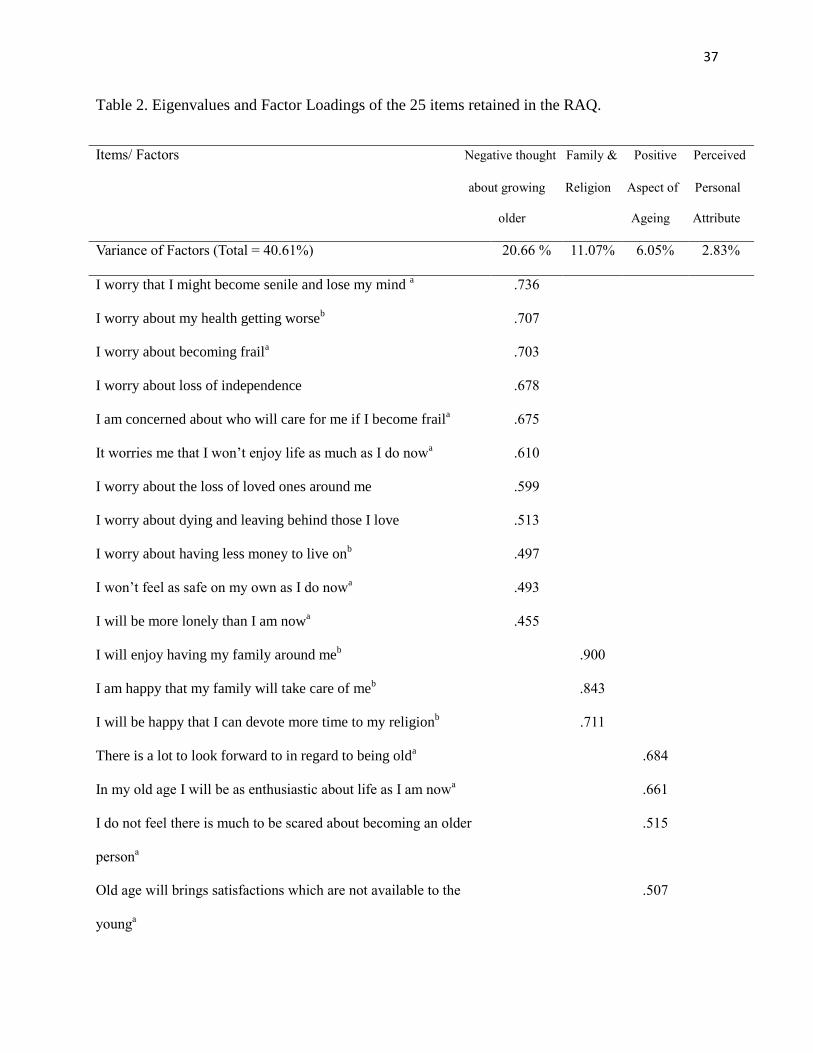
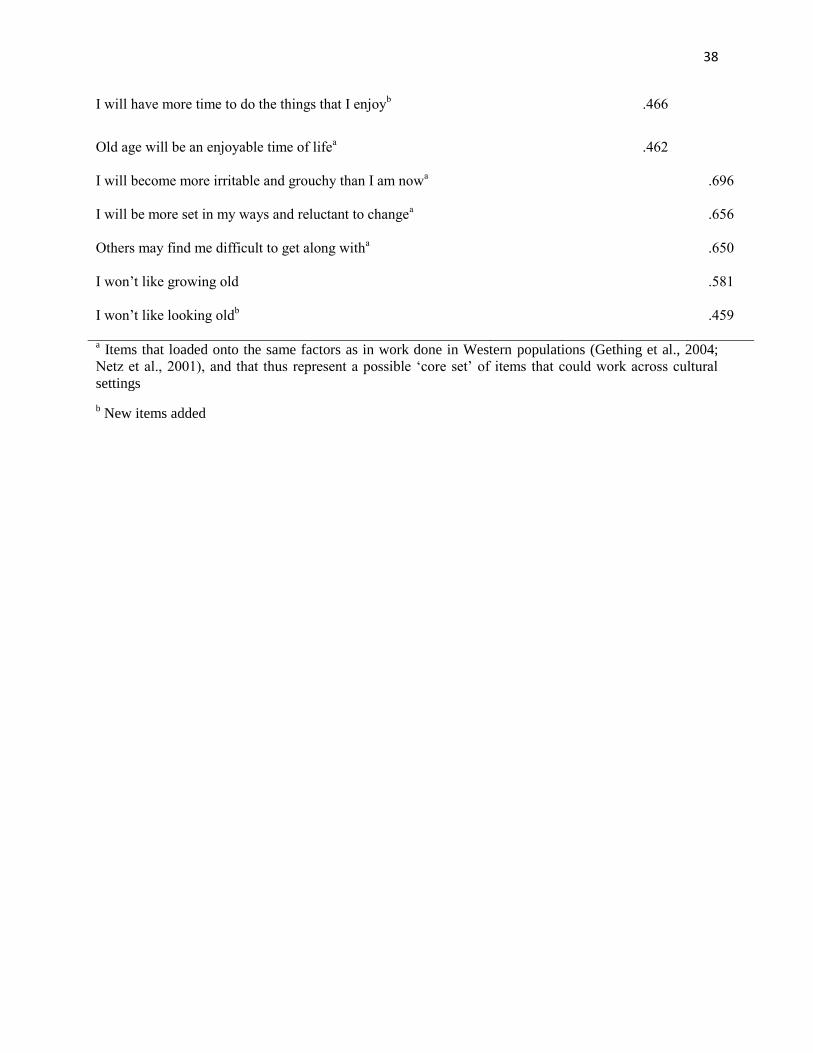
relevance of the new items to participants’ attitudes to ageing. The final culturally-adapted scale
therefore comprised 25 items as shown in Table 2: eleven for ‘Negative Thoughts about Growing
Older’; three for ‘Family and Religion’; six for ‘Positive Aspects of Ageing’; and five for the
‘Perceived Personal Attributes’ factor. Supplemental materials (iii) provide results for the full
35-items.
Table 2 about here
As shown in Table 2, the first, third and fourth factors were similar to those found by
Gething et al., (2004), Netz et al. (2001), Koder and Helmes (2006, 2008a; 2008b) and Unsworth
et al. (2001), namely ‘Negative Thoughts about Growing Older’ (Factor 1); ‘Positive Aspects of
Ageing’ (Factor 3) and ‘Perceived Personal Attributes’ (Factor 4). In particular, 14 of the
original items loaded onto the same factors as in previous work, thus representing a possible
‘core set’ of items that may work well across cultures (Table 2). The second factor represented a
novel dimension of attitudes to ageing, namely, ‘Family and Religion’, which comprised solely
of new items generated by Malay participants.
15
Internal Consistency
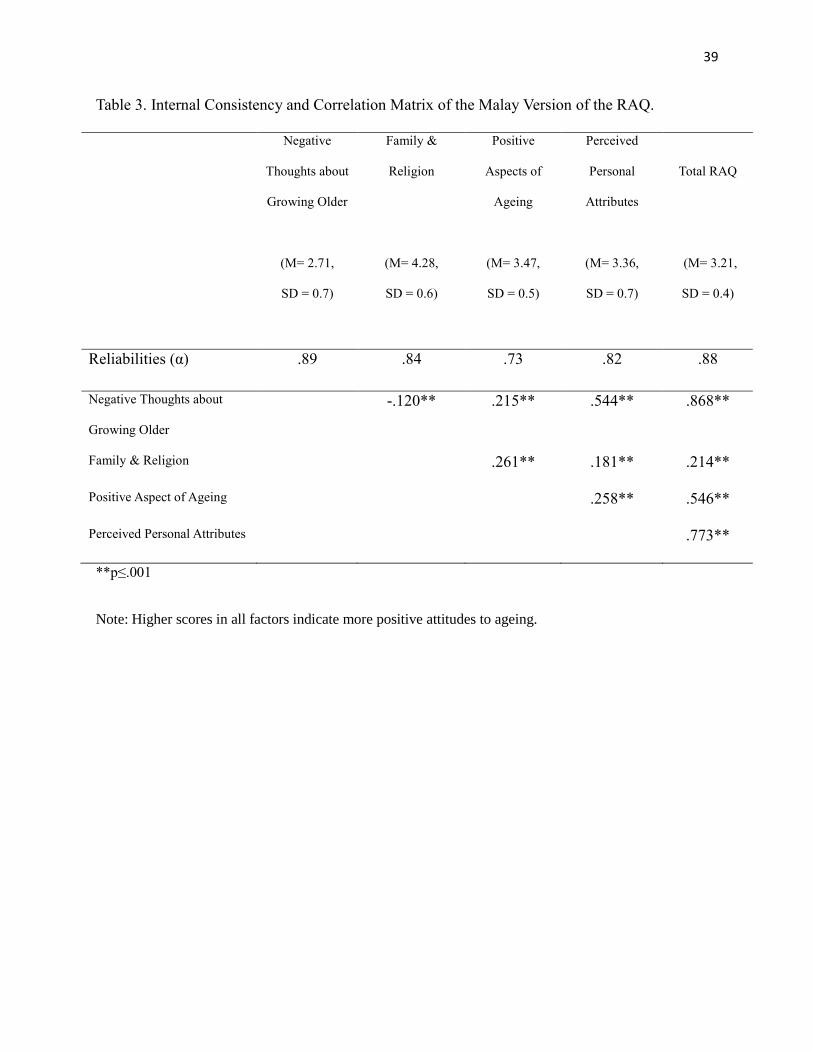
Overall, the revised Malay version of the RAQ had an internal reliability of α = .88. The
reliabilities of each subscale ranged from α = .73 to .89 (Table 3), indicating good internal
consistency (Field, 2005). The ‘Negative Thoughts about Growing Older’ factor and the
‘Perceived Personal Attitudes’ factor were strongly correlated with the total RAQ score (r = .87
and .77, respectively), while the ‘Positive Aspects of Ageing’ factor showed a moderate
correlation (r = .55). The ‘Family and Religion’ factor correlated less strongly with total RAQ
scores (r = .21). This is probably due to the smaller number of items in this factor, and indicates
that the factors may be best considered as separate variables that together form a meaningful
construct, rather than interchangeable dimensions (Mokkink et al., 2012).
Table 3 about here
Demographic Differences in Total Reactions to Ageing Scores
The effects of demographic variables on overall RAQ scores were analysed using a 4 (age group:
18-29 vs. 30-39 vs. 40-49 vs. 50-60) × 2 (gender: women vs. men) × 2 (education level: low vs.
high) analysis of variance (ANOVA). There was a significant main effect of age group, F (3,
885) = 6.413, p < .001, ŋp² = .021. Post hoc Scheffe tests revealed that attitudes to ageing were
significantly (p < .05) more positive in the oldest age group (50-60: M = 83.97, SD = 1.04)
compared to the two younger age groups (18-29: M = 78.53, SD = 0.74, d = 6.03; 30-39: M =
79.85, SD = 0.64, d = 4.77). However, there were no differences in scores between the 40-49 (M
= 80.91, SD = 0.89) and 50-60-year age groups, or between the 18-29 and 30-39 year age groups.
There was also a significant main effect of gender, F (1, 885) = 4.192, p = .041, ŋp² = .005, with
men reporting more positive attitudes (M = 81.67, SD = 0.58) than women (M = 79.95, SD =

16
0.61). There was no significant main effect of education levels, F (1, 885) = 1.421, p = .234, ŋp²
= .002, and no significant interactions. Mean scores for all levels of each factor are presented in
Table 4.
Table 4 about here
Reactions to Ageing Subscales
A three-way univariate ANOVA was conducted for each of the four subscales of the Malay RAQ,
in order to observe the effects of age, gender and education levels. To facilitate comparison
between subscales with different numbers of items, mean scores for each subscale were
calculated per item (i.e., out of a maximum of 5). Note that higher scores for each subscale
indicate more positive attitudes to ageing.
Negative Thoughts about Growing Older
With regards to negative thoughts about growing older, there was a significant main effect of age
group, F (3, 885) = 4.540, p = .004, ŋp² = .015. Post-hoc Scheffe tests showed that scores in the
oldest group (50-60: M = 2.92, SD = 0.06) were significantly higher (reflecting more positive
attitudes to ageing) than the youngest two age groups (18-29: M = 2.66, SD = 0.04, d = 5.10; 30-
39: M = 2.68, SD = 0.04, d = 4.71). There was also a significant main effect of gender, F (1, 885)
= 6.429, p = .011, ŋp² = .007, with higher scores on this subscale in men (M = 2.81, SD = 0.03)
compared to women (M = 2.68, SD = 0.04) (Table 4). There was no main effect of education
levels, F (1, 885) = 2.860, p = .091, ŋp² = .003, and no significant interactions between variables.
Positive Aspects of Ageing
For positive aspects of ageing, there was a significant main effect of age group F (1, 885) =
17
7.695, p < .001, ŋp² = .025. Scheffe tests showed that, as with the Negative Thoughts about
Growing Older factor, positive aspects of ageing scores were significantly higher (indicating
more positive attitudes to ageing) in the oldest group (50-60: M = 3.60, SD = 0.05) compared to
people in the 18-29 (M = 3.35, SD = 0.04, d = 5.52) and 30-39 (M = 3.45, SD = 0.03, d = 3.31)
groups. Scores were also significantly higher in people aged 40-49 (M = 3.54, SD = 0.04)
compared to people aged 18-29 (d = 4.75) (Table 4). No other groups were significantly different
from one another. There were no significant main effects of gender, F (1, 885) = 3.006, p = .083,
ŋp² = .003; or education levels, F (1, 885) = 0.024, p = .876, ŋp² = .001, and no significant
interactions.
Perceived Personal Attributes
For the Perceived Personal Attributes domain, there were no main effects of age group F (3, 885)
= 1.603, p = .187, ŋp² = .005; gender F (1, 885) = 0.130, p = .719, ŋp² = .001; or education F (1,
885) = .557, p = .456, ŋp² = .001; and no significant interactions between them.
Family and Religion
For the Family and Religion factor, there were no significant main effects of age group F (3,
888) = 0.757, p = .518, ŋp² = .003; gender, F (3, 885) = 1.804, p = .180, ŋp² = .002; or education
levels, F (1, 885) = 1.466, p = .226, ŋp² = .002; and no interactions between these variables.
Discussion
The aims of this study were to develop a culturally adapted Malay version of the RAQ, and to
explore the effects of key demographic variables on RAQ scores in adults younger than 60 years
of age. An exploratory factor analysis revealed four factors, including a ‘Family and Religion’
18
factor that has not been identified in Western versions of the RAQ. Items with low factor
loadings were deleted, resulting in high levels of internal consistency across the remaining scale
and subscales. Overall, the total Malay RAQ scores were significantly affected by age and
gender, in that men and older people had more positive attitudes to their ageing. Age and gender
effects were also observed for some of the sub-scales, but no effects of education were seen for
any subscale. Together, these results suggest that this culturally-adapted Malay version of the
RAQ provides a reliable measure of attitude to ageing that is differentially sensitive to age and
gender.
Three of the four factors identified (Negative Thoughts about Growing Older; Perceived
Personal Attributes and Positive Aspect of Ageing) were conceptually similar to those found by
Gething et al. (2004); Koder and Helmes (2006; 2008a; 2008b); Netz et al. (2001) and Unsworth
et al. (2001) in Australian, British and Swedish samples, although the precise contents of the
scales differed for some factors. In particular, six items were identified in this study as loading
on the ‘Perceived Personal Attributes’ factor, whereas Gething et al. (2004); and Netz et al.
(2004) only found three items, whilst Unsworth et al. (2001) found four items. Moreover, two of
the six items that loaded onto the ‘Perceived Personal Attributes’ factor in the current study (‘I
find the thought of growing older is depressing’; and ‘I won’t like growing old’) loaded onto the
‘Negative Thoughts about Growing Older’ by Gething et al. (2004) and Netz et al. (2004). Items
loading on the ‘Positive Aspects of Ageing’ factor were generally consistent with the findings
from Gething et al. (2004); Netz et al. (2001) and Unsworth et al. (2001). The content of the
‘Negative Thoughts about Growing Older’ factor was also similar to that reported by Gething et
al. (2004), although it contained items that made up two different scales (Negative Thoughts
about Growing Older and Fear of Becoming Frail) in data from Netz et al. (2001). In addition,
19
of the nine original RAQ items that were removed in the current study, four of these (items 6, 15,
16 and 22) were also removed due to their low factor loadings in validations with Australian,
Swedish and British participants (Gething et al., 2004), whilst a further five of the items were
shown to load poorly onto factors in at least one other Western population (Gething et al., 2004;
Unsworth et al., 2001). Taken together, these findings suggest that at least some of the original
items of the RAQ show consistency across Eastern and Western populations, and that could be
investigated as a potential “core set” of RAQ items that are applicable worldwide.
A new dimension of ‘Family and Religion’ was identified in this culturally-adapted scale.
This factor reflects the concept of a strong family relationship that is traditionally embraced by
Eastern cultural groups (Lockenhoff et al., 2015). Filial-piety, for example, has become a basic
principle of the family system in Malaysia (Ismail, Jo-Pei & Ibrahim, 2009), where adults are
expected to be attentive to, respectful towards, and supportive of, their parents (Kim et. al.,
2015). People in Malaysia also still emphasize the importance of family relationships (Minhat et
al., 2015a; Teh et al., 2014). Consistent with this, Kooshiar et al. (2012) reported that about 70%
of older Malaysians live with their adult children, providing companionship for the older people,
and enabling interaction and contact across generations. Additionally, this factor reflects the
significant role that religion plays in the Malaysian population (Abu Bakar, 2013), which is
believed to facilitate adjustment to the ageing process (Jianbin & Mehta, 2003). The link
between religious practice and family is also supported by the close relationships between them
that often occur in day-to-day life. For instance, individuals often pray for a happy and healthy
family, and for the wellbeing of their descendants (Tohit, Browning & Radermacher, 2012).
Elders in the family also play a central role in transmitting religious beliefs to their offspring,
such as informing their children about religious rituals and traditions (Mehta, 1997).
20
Another contribution of the present study was the examination of the relationships
between RAQ scores and demographic variables. The results are broadly in line with previous
findings into the relationship between age and RAQ scores in Western populations (Draper, et
al., 1999; Golden et al., 2013; Unsworth et al., 2001), which indicate that attitudes to ageing are
more positive among older people. In the current study, these effects of age were only seen in
two of the four RAQ subscales (Negative Thoughts about Growing Older; Positive Aspects of
Ageing), with attitudes towards ‘Perceived Personal Attributes’ and the ‘Family and Religion’
aspects of ageing being more consistent across age groups. This is consistent with previous
findings suggesting that the effects of age may be limited to certain aspects of attitudes to ageing
(Unsworth et al., 2001), and that younger people in Malaysia express concerns about being old
that manifest as declining physical ability, health, and changes in physical appearances, as well
as being more sensitive (Minhat et al., 2015b). The lack of age effect in the Family and Religion
factor may be due to the traditional cultural beliefs around filial piety (Damulak et al., 2015) and
religion in Malaysia that are emphasized and transmitted in childhood, and reinforced in
adulthood (Mehta, 1997), making the positive roles of family and religion similarly salient to
people of different age groups.
Consistent with previous studies that have explored the RAQ (e.g., Draper et al., 1999;
Golden et al, 2013), attitudes to ageing were also linked to gender in the present study, with men,
overall, reporting more positive attitudes compared to women. However, in the current study,
gender effects were only seen in the ‘Negative Thoughts about Growing Older’ subscale, which
focuses on age-related changes in cognitive and physical functioning, such as health status,
frailty, safety, mortality, and independence. This is consistent with work reporting that men have
fewer anxieties about declining cognitive and physical abilities than women (Barrett & Von
21
Rohr, 2008). Similarly, women may find it more challenging to overcome the negative attitudes
held about their ageing due to the increased emphasis that is placed on beauty and youth for
women: a so-called ‘double standard of ageing’ (Halliwell & Dittmar, 2003). Women may also
have greater exposure to negative aspects of ageing due to their increased levels of experience in
dealing with disabled older parents (Hequembourg & Brallier, 2005). Indeed, in Malaysia,
women are traditionally more involved in caring for elderly parents (Alavi & Sail, 2010), and are
highly concerned about their physical changes (Minhat et al., 2015a; 2015b). This may help to
explain why Malaysian women may feel more anxious about their personal ageing, and have
more negative expectancies about their personal ageing process, compared to men. The finding
that gender effects were limited to just one of the four RAQ sub-scales also highlights the
importance of measuring attitudes at this more focused level of description. Education levels did
not influence RAQ scores, which chimes with a broader picture of a lack of association between
education and RAQ scores in other populations (Gething, 1994; Gething et al., 2002; Gething et
al., 2004).
Although the present research takes the literature on attitudes to ageing forward in
important respects, some limitations need to be acknowledged. First, the new items generated
and added to the scale were based on responses from a relatively small number of participants,
who were currently living in the UK, and so may not fully reflect attitudes to ageing held by
people in Malaysia. However, these participants were purposefully sampled to be
demographically diverse, ensuring at least some variety in the views expressed. Other limitations
relate to the sample used to validate the Malay RAQ. For one thing, whilst asking managers of
the organizations to distribute the surveys will likely have increased the response rate (Krishnan
& Poulose, 2016), it may also have introduced some sampling or response biases, for instance
22
due to managers purposefully targeting or avoiding certain employees. Furthermore, although the
sample was large, it consisted almost exclusively of government employees, who were
predominantly ethnically Malay. Although this homogeneity made it easier to determine the
effects of age, gender and education, it also limits the generalizability of our findings to other
ethnicities, or to unemployed or self-employed individuals. In particular, as government
employees in Malaysia have to achieve a minimum level of education of high school in order to
take on these positions (Malaysia Public Service Department, 2017), participants with very low
levels of formal education were not included, and so the full effect of education levels could not
be examined. Our use of a categorical measure of education, rather than a continuous one, such
as years of education, will also have reduced the sensitivity of our analyses involving educational
level. The cross sectional nature of the data also means that it is not possible to establish the
extent to which differences between age groups truly represent the effects of age, rather than
generational differences. This is particularly important given that longitudinal studies assessing
participants’ reflections on their experiences of ageing show a trend towards more negative
attitudes to ageing with increasing age (Miche, Elsasser, Schilling, & Wahl, 2014), suggesting
that similar effects could be present when assessing participants’ attitudes to their future ageing.
Finally, the present study only investigated some of the factors that may be related to attitudes to
ageing. Future studies that examine whether such responses are also dependent on other factors,
such as personality or health, would now be beneficial in order to gain a more complete
understanding of the factors that relate to attitudes to ageing in those aged under 60.
23
Conclusion
The present study identified an additional element of attitudes to ageing not currently captured in
Western measures, namely, ‘Family and Religion’ and demonstrated that the culturally-adapted
Malay RAQ had good levels of reliability and validity among Malay adults aged under 60. In
addition, the present study provides evidence that, as seen in other cultures, attitudes to ageing
are influenced by age and gender, but that levels of education seem to be unrelated to attitudes to
ageing in adults aged under 60. Perhaps more importantly, we identified a “core set” of RAQ
items that seem to work across cultural settings and would be amenable to testing worldwide.
Declaration of Conflicting Interests
The author(s) declared no potential conflicts of interest with respect to the research, authorship,
and/or publication of this article.
Funding
The research was supported by the NIHR Manchester Biomedical Research Centre and the
NIHR Greater Manchester Patient Safety Translational Research Centre, and a PhD studentship
from the Malaysian Ministry of Education awarded to FNMF.
24
References
Abu Bakar, I. (2013). The religious tolerance in Malaysia: An exposition. Advances in Natural
and Applied Sciences 7, 90-97.
Abramson, A., & Silverstein, M. (2006). Images of aging in America 2004. Washington, DC:
AARP and University of Southern California
Alavi, K., & Sail, R.M. (2010). Roles of Malay women in the process of caring for elderly
parents: dilemma and challenges in the era of globalisation. Kajian Malaysia, 28, 71-105.
Armitage, C. J. (2016). A brief psychological intervention to protect subjective well-being in a
community sample. Quality of Life Research, 25, 385-391. doi:10.1007/s111360151076
6
Barker, M., O’Hanlon, A., McGee, H.M., Hickey, A., & Conroy, R.M. (2007). Cross-sectional
validation of the Aging Perception Questionnaire: A multidimensional instrument for
assessing self-perceptions of aging. BMC Geriatrics, 7, 1 - 13.
doi:10.1186/14712318-7-9
Barrett, A.E., & Von Rohr, C. (2008). Gendered perceptions of aging: An examination college
students. The International Journal of Aging & Human Development, 67, 359-386.
doi: 10.2190/AG.67.4.d
Bomhoff, E.J., & Gu, M.M-L. (2012). East Asia remains different: A comment on the index of
‘self-expression values’ by Inglehart and Welzel. Journal of Cross-Cultural Psychology,
43, 372-383. doi: 10.1177/0022022111435096
Comrey, A.L., & Lee, H.B. (1992). A first course in factor analysis. Hillsdale, NJ: Erlbaum.
25
Costello, A. B., & Osborne, J.W. (2005). Best practices in exploratory factor analysis: four
recommendations for getting the most from your analysis. Practical Assessment Research
& Evaluation, 10, 1-9.
Cummings, S. M., Kropf, N. P., & De Weaver, K. L. (2000). Knowledge of and attitudes toward
aging among non-Elders: Gender and race differences. Journal of Women & Aging,
12, 77-91. doi: 10.1300/J074v12n01_06
Damulak, P.P., Minhat, H.S., & Rahman A.A. (2015). Attitude towards the elderly among
healthcare related students in Malaysia. International Journal of Health Sciences and
Research, 5, 248- 258.
Department of Statistics Malaysia. (2016). Official Portal. Current population estimates in
Malaysia, 2014-2016. Retrieved from https://www.dosm.gov.my
Diehl, M., Wahl, H., Brothers, A., & Miche, M. (2015). Subjective aging and awareness of
aging: Toward a new understanding of the aging self. Annual Review of Gerontology &
Geriatrics, 35, 1-X. doi: 10.1891/0198-8794.35.1
Draper, B., Gething, L., Fethney, J., & Winfield, S. (1999). The senior Psychiatrist survey III:
attitudes towards personal ageing, life experiences and psychiatric practice. Journal
Australian and New Zealand Journal of Psychiatry, 33, 717-722. doi:10.1080/j.1440
1614.1999.00609.x
Field, A.P. (2005). Discovering statistics using SPSS (2nd
Eds.). London: Sage.
26
Gething, L. (1994). Health professional attitudes towards ageing and older people: preliminary
report of the Reactions to Ageing Questionnaire. Australasian Journal on Ageing, 13, 77
- 81. doi:10.1111/j.1741-6612.1994.tb00646.x/full
Gething, L., Fethney, J., Mckee, K., Goff, M., Churchward, M., & Matthews, S. (2002).
Knowledge, stereotyping and attitudes towards self-ageing. Australasian Journal on
Ageing, 21, 74-79. doi:10.1111/j.1741-6612.2002.tb00421.x
Gething, L., Fethney, J., Mckee, K., Persson, L.O., Goff, M., Churchward, M., & Matthews, S.
et al., (2004). Validation of the reactions to ageing questionnaire. Assessing similarities
across several countries. Journal of Gerontological Nursing, 30, 47–54.
doi:10.3928/0098-9134-20040901-09
Gilbert, C.N., & Ricketts, K.G. (2008). Children's attitudes toward older adults and aging: A
synthesis of research. Educational Gerontology, 34, 570-586. doi:
10.1080/03601270801900420
Golden, A. G., Gammonley, D., Hunt, D., Olsen, E., & Issenberg, S. B. (2013). The attitudes
of graduate healthcare students toward older adults, personal aging, health care reform,
and inter-professional collaboration. Journal of Inter-professional Care, 28, 40-44.
doi:10.3109/13561820.2013.830595
Hair, J.F., Black, W.C., Babin, B.J., & Anderson, R.E. (2014). Multivariate data analysis (7th
Eds.). Essex: Pearson Education Limited.
27
Halliwell, E., & Dittmar, H. (2003). A qualitative investigation of women’s and men’s body
image concerns and their attitudes toward aging. Journal of Research Sex Roles, 49, 675-
684. doi:10.1023/B:SERS.0000003137.71080.97
Helmes, E., & Pachana, N.A. (2015). Dimensions of stereotypical attitudes among older adults:
Analysis of two countries. Geriatric Gerontology International, 16, 1226-1230. doi:
10.1111/ggi.12613
Hess, T.M. (2006). Attitudes toward aging and their effects on behavior. In J.E. Birren, & K.W.
Schaie (Ed.). Handbook of the psychology of aging. (pp. 379–406). San Diego: CA:
Academic Press.
Hequembourg, A., & Brallier, S. (2005). Gendered stories of parental caregiving among siblings.
Journal of Aging Studies, 19, 53–71. doi:10.1016/j.jaging.2003.12.001
Interagency Language Roundtable. (ILR) (2016) Retrieved from gov.tilr.org.
International Monetary Fund (2017). World economic outlook database. Retrieved from
http://www.imf.org/external/pubs/ft/weo/2017/02/weodata/index.aspx
Ismail, N., Tan, J-P., & Ibrahim, R. (2009). The relationship between parental belief on filial
piety and child psychosocial adjustment among Malay families. Pertanika Journal Social
Sciences, 17, 215-224.
Jackson, K.M., & Trochim, W.M.K. (2002). Concept mapping as an alternative approach for the
analysis of open-ended survey responses. Organizational Research Methods, 5, 307-336.
doi:10.1177/109442802237114
28
Janeckova, H., Dragomirecka, E., Holmerova, I., & Vankova, H. (2013). The attitudes of older
adults living in institutions and their caregivers to ageing. Central European Journal of
Public Health, 21, 63–71.
Jianbin, X., & Mehta, K.K. (2003). The effects of religion on subjective aging in Singapore: An
interreligious comparison. Journal of Aging Studies, 17, 485–502.
doi:10.1016/S08904065(03)00065-3
Joshi, V. D., Malhotra, R., Lim, J.F.Y., Ostbye, T., & Wong, M. (2010). Validity and reliability
of the expectations regarding aging (ERA-12) instrument among middle-aged
Singaporeans. Annals of the Academy of Medicine Singapore, 39, 394–398
Kaklamanou, D., Armitage, C.J., & Jones, C.R. (2013). A further look into compensatory health
beliefs: A think aloud study. British Journal of Health Psychology, 18, 139-154.
doi:10.1111/j.2044-8287.2012.02097.x
Kim, K., Cheng, Y-P., Zarit, S.H., & Fingerman, K.L. (2015). Relationship between adults and
parents in Asia. In. C. Sheung- Tak, C. Iris, H.H. Fung, W.L. Lydia, & W. Jean.
Successful aging: Asian perspectives (pp. 101- 120). New York, NY: Springer
Dordrencht, Heildelberg.
Klusmann, V., Sproesser, G., Wolff, J.K., Renner, B. (2017). Positive self-perceptions of aging
promote healthy eating behavior across the life span via social-cognitive process.
Journals of Gerontology: Psychological Sciences. Advance online publication.
doi:10.1093/geronb/gbx139
29
Koder, D.A., & Helmes, E. (2006). Clinical psychologists in aged care in Australia: A question
of attitude or training? Journal of Australian Psychologists, 41, 179-185.
Koder, D.A., & Helmes, E. (2008a). Predictors of working with older adults in an Australian
psychologist sample: Revisiting the influence of contact. Professional Psychology:
Research and Practice, 39, 276-282. doi:10.1037/0735-7028.39.3.276
Koder, D.A., & Helmes, E. (2008b). Predictors of interest in working with older adults: A survey
of postgraduate trainee psychologist. Gerontology & Geriatric Education, 29, 158-
171. doi:10.1080/02701960802223233
Kooshiar. H., Yahaya, N., Hamid, T.A., Abu Samah, A., & Sedaghat, J.V. (2012) Living
arrangement and life satisfaction in older Malaysians: The mediating role of social
support function. PLoS ONE 7, 1-6. doi:10.1371/journal.pone.0043125
Kornadt, A.E., & Rothermund, K. (2015). Views on aging: Domain-specific approaches and
implications for developmental regulation. Annual Review of Gerontology and
Geriatrics, 35, 121-144. doi:10.1891/0198-8794.35.121
Kornadt, A.E., Voss, P., & Rothermund, K. (2015). Hope for the best, prepare for the worst?
Future self-views and preparation for age-related changes. Psychology and Aging, 30,
doi:10.1037/pag0000048
Krishnan, T.N., & Poulose, S. (2016). Response rate in industrial surveys conducted in India:
Trends and implications. IIMB Management Review, 28, 88-97.
doi:10.1016/j.iimb.2016.05.001
30
Kunhen, U., Hannover, B., Roeder, U., Shah, A.A., Schubert, B, Upmeyer, A., & Zakaria, S.
(2001). Cross-cultural variations in identifying embedded figures: Comparisons from the
United States, Germany, Russia, and Malaysia. Journal of Cross-Cultural Psychology,
32, 366-372. doi:10.1177/0022022101032003007
Ladesma, R.D., & Valero- Mora, P. (2007). Determining the number of factors to retain in
EFA: an easy-to-use computer program for carrying out Parallel Analysis. Practical
Assessment, Research & Evaluation, 12, 1-11.
Laidlaw, K., Power, M., & Schmidt, S. (2007). The WHOQOL– OLD Group. The attitudes to
ageing questionnaire (AAQ): development and psychometric properties. International
Journal Geriatric Psychiatry, 22, 367-379. doi:10.1002/gps.1683
Levy, B.R. (2003). Mind matters: cognitive and physical effects of aging self-stereotypes.
Journal of Gerontology, Psychological Science, 58, 203–211.
doi:10.1093/geronb/58.4.P203
Levy, B.R. (2009). Stereotype embodiment. A psychosocial approach to aging. Current
Directions in Psychological Science, 18, 332 – 336. doi:10.1111/j.1467
8721.2009.01662.x
Lockenhoff, C.E., Lee, D.S., Buckner, K.M.L., Moreira, R.O., Mertinez, S.J. & Sun, M.Q.
(2015). Cross-cultural differences in attitudes about aging: Moving beyond the East-West
dichotomy. In.Sheung- Tak, C., Iris, C., Fung, H.H., Lydia, W.L. Jean, W. Successful
aging: Asian perspectives (pp. 321- 333). New York: Springer Dordrencht,
Heildelberg.
31
Malaysia Public Service Department (2017). Scheme of service and position. Retrieved from
www.jpa.gov.my
Malaysia Standard Classification of Occupations (2008). Malaysia standard classification of
occupations (3rd
Eds.). Kuala Lumpur: Ministry of Human Resources.
Mehta, K.K. (1997). The impact of religious belief and practices on aging: A cross-cultural
comparison. Journal of Aging Studies, 11, 101-114. doi:10.1016/S0890
4065(97)90015-3
Miche, M., Elsasser, V.C., Schilling, O.K., & Wahl, H-W. (2014). Attitude toward own aging
in midlife and early old age over a year 12 year period: examination of measurement
equivalence and developmental trajectories. Psychology and Aging, 29, 588-600.
doi:10.1037/a0037259
Minhat, H.S., Hamizah, S., & Nor Afiah, Z. (2015a). A qualitative study on ageing related
anxiety among middle aged women in Malaysia. Malaysian Journal of Public Health
Medicine, 15, 1-7.
Minhat, H.S., Hamizah, S., & Nor Afiah, Z. (2015b). View on ageing: A qualitative study among
Malay middle-aged women in urban setting in Malaysia. International Journal of Health
Science and Research, 5, 248-256.
Ministry of Human Resources. Job statistics 1/2015. Retrieved from myhos.mohr.gov.my
Mokkink, L.B., Terwee, C.B., Patrcik, D.L., Alonso, J., Stratford, P.W., Knol, D.L., et al., (2012).
COSMIN Checklist manual. Retrieved from www.cosmin.nl
Mosher-Ashley, P.M., & Ball, P. (1999). Attitudes of college students toward elderly persons
32
and their perceptions of themselves at age 75. Educational Gerontology, 25, 89-102.
doi:10.1080/036012799268034
Netz, Y., Guthrie, J. R., Garamszegi, C., & Dennerstein, L. (2001). Attitudes of middle-aged
women to aging: contribution of the Reactions to Aging Questionnaire. Climacteric, 4,
306–313. doi:10.1080/713605141.
O’Hanlon, A., & Coleman, P. (2008). Attitudes towards aging: Adaptation, development and
growth into later years. In. J.F. Nussbaum & J. Coupland (2nd
Eds.). Handbook of
communication and aging research (pp. 31-67). New York, NY: Routledge.
Ozolins, U. (2009). Back translation as a means of giving translators a voice. The International
Journal for Interpreting and Translation Research, 1, 1-13.
Schellingerhout, J.M., Heymans, M.W., Verhagen, A.P., de Vet, H., Koes, B.W., & Terwee,
C.B. (2011). Measurement properties of translated versions of neck-specific
questionnaires: a systematic review. BMC Medical Research Methodology, 11, 1-14.
Steverink, N., Westerhof, G., Bode, C., & Ditmann-Kohli, F. (2001). The personal experience of
aging, individual resources, and subjective well-being. Journal of Gerontology:
Psychological Sciences, 56, 364–373. doi:10.1093/geronb/56.6.P364
Tabachnick, B.G., & Fidell, L.S. (1996). Using multivariate statistics (3rd
Ed.). Northridge:
Harper Collins College Publishers
Teh, J.K., Tey, N.P., & Ng, S.T. (2014). Family support and loneliness among older person in
multiethnic in Malaysia. The Scientific World Journal, 1-11.
doi:10.1155/2014/654382
33
Tohit, N., Browning, C. & Radermacher, H. (2012. We want a peaceful life here and hereafter:
healthy ageing perspectives of older Malays in Malaysia. Ageing and Society, 32, 405-
424. doi:10.1017/S0144686X11000316
United Nations. (2013). Department of economic and social affairs, population division world
population ageing 2013. New York, NY: United Nations Publication.
Unsworth, K.L., McKee, K.J., & Mulligan, C. (2001). When does old age begin? The role of
attitudes in age parameter placement. Social Psychology Review, 3, 5-15.
Wang, C., & Mallinckrodt, B.S. (2006). Differences between Taiwanese and US cultural beliefs
about ideal adult attachment. Journal of Counseling Psychology, 53, 192-204.
doi:10.1037/0022-0167.53.2.192
Wells, Y., Foreman, P., Gething, L., & Petralia, W. (2004). Nurses' attitudes toward aging and
older adults. Journal of Gerontological Nursing, 30, 5-9. doi:10.3928/00989134
20040901-04
World Population Prospect. (2017). United Nations desa /population division. Retrieved from
https://esa.un.org/unpd/wpp/
World Value Survey. (2017). Online analysis 2010-2014. Retrieved from
http://www.worldvaluessurvey.org/WVSOnline.jsp
Wurm, S., Tomasik, M.J., & Tesch-Römer, C. (2010) On the importance of a positive view
on ageing for physical exercise among middle-aged and older adults: Cross
sectional and longitudinal findings, Psychology and Health, 25, 25-42,
doi:10.1080/08870440802311314.
34
Yan, T., Silverstein, M., & Wilber, K.H. (2011). Does race/ethnicity affect aging anxiety in
American baby boomers? Research on Aging, 33, 361-378
35
Table 1. Demographic Information
Characteristics All 18-29 30-39 40-49 50-60
n= 911 (%) n = 247 (%) n =356 (%) n =158 (%) n=140 (%)
Gender
Men 395 (43.3) 94 (10.3) 137 (15.04) 76 (8.3) 85 (9.3)
Women 516 (56.6) 153 (16.8) 219 (24.0) 82 (9.0) 55 (6.0)
Ethnicity
Malay 852 (93.5) 236 (25.9) 341 (37.4) 146 (16.0) 119 (13.1)
Chinese 30 (3.3) 5 (0.5) 7 (0.8) 8 (0.9) 10 (1.1)
Indian 18 (2.0) 2 (0.2) 5 (0.5) 0 11 (1.2)
Other 11 (1.2) 4 (0.4) 3 (0.3) 4 (0.4) 0
Educational Levela
Lower 567 (62.2) 154 (16.9) 238 (26.1) 84 (9.2) 83 (9.1)
Higher 344 (37.8) 93 (10.2) 118 (13.0) 74 (8.1) 57 (6.3)
Occupational Group
Managers 13 (1.4) 1 (0.1) 7 (0.8) 3 (0.3) 2 (0.2)
Professionals 208 (22.8) 38 (4.2) 50 (5.5) 58 (6.4) 61 (7.0)
Technicians & Associate
Professionals
157 (17.2) 44 (4.8) 60 (6.6) 34 (3.7) 16 (1.8)
Clerical Support 449 (49.3) 134 (14.7) 206 (22.6) 51 (5.6) 52 (5.7)
Service and Sales 38 (4.2) 14 (1.5) 15 (1.6) 5 (0.5) 4 (0.4)
Skilled, Agricultural, Forestry
& Fishery
32 (3.5) 12 (1.3) 14 (1.5) 2 (0.2) 4 (0.4)
Plant, Machine Operators &
Assemblers
11 (1.2) 1 (0.1) 4 (0.4) 5 (0.5) 1 (0.1)
36
Elementary Occupations 1 (0.1) 1 (0.1) 0 0 0
Craft & Trade Workers 0 0 0 0 0
Missing 2 (0.2) 2 (0.2) 0 0 0
a Lower education level = (High school OR certificate/diploma holders)
Higher education level = (Undergraduate OR postgraduate holders)
37
Table 2. Eigenvalues and Factor Loadings of the 25 items retained in the RAQ.
Items/ Factors Negative thought Family & Positive Perceived
about growing Religion Aspect of Personal
older Ageing Attribute
Variance of Factors (Total = 40.61%) 20.66 % 11.07% 6.05% 2.83%
I worry that I might become senile and lose my mind a
I worry about my health getting worseb
.736
.707
I worry about becoming fraila
.703
I worry about loss of independence .678
I am concerned about who will care for me if I become fraila
.675
It worries me that I won’t enjoy life as much as I do nowa
.610
I worry about the loss of loved ones around me .599
I worry about dying and leaving behind those I love
I worry about having less money to live onb
.513
.497
I won’t feel as safe on my own as I do nowa
.493
I will be more lonely than I am nowa
.455
I will enjoy having my family around meb .900
I am happy that my family will take care of meb .843
I will be happy that I can devote more time to my religionb .711
There is a lot to look forward to in regard to being olda
.684
In my old age I will be as enthusiastic about life as I am nowa
.661
I do not feel there is much to be scared about becoming an older
persona
.515
Old age will brings satisfactions which are not available to the
younga
.507
38
I will have more time to do the things that I enjoyb
.466
Old age will be an enjoyable time of lifea
.462
I will become more irritable and grouchy than I am nowa
.696
I will be more set in my ways and reluctant to changea
.656
Others may find me difficult to get along witha
.650
I won’t like growing old
I won’t like looking oldb
.581
.459
a Items that loaded onto the same factors as in work done in Western populations (Gething et al., 2004;
Netz et al., 2001), and that thus represent a possible ‘core set’ of items that could work across cultural
settings
b New items added
39
Table 3. Internal Consistency and Correlation Matrix of the Malay Version of the RAQ.
Negative
Thoughts about
Growing Older
(M= 2.71,
SD = 0.7)
Family &
Religion
(M= 4.28,
SD = 0.6)
Positive
Aspects of
Ageing
(M= 3.47,
SD = 0.5)
Perceived
Personal
Attributes
(M= 3.36,
SD = 0.7)
Total RAQ
(M= 3.21,
SD = 0.4)
Reliabilities (α) .89 .84 .73 .82 .88
Negative Thoughts about
Growing Older
-.120** .215** .544** .868**
Family & Religion .261** .181** .214**
Positive Aspect of Ageing .258** .546**
Perceived Personal Attributes .773**
**p≤.001
Note: Higher scores in all factors indicate more positive attitudes to ageing.

40
Table 4. Means (and standard deviations) for scores on the Total RAQ and each subscale. To facilitate comparison of scores across the
subscales (which differ in the number of items they contain), scores for each subscale have been reported as the mean score per item (i.e. total
subscale score divided by the number of items in the subscale). Superscript letters indicate significant differences between specific levels of each
factor.
Total RAQ Negative Thought
about Growing Older
Positive Aspects
of Ageing
Perceived Personal
Attributes
Family and
Religion
Age Group
18-29 78.53 (0.74)a 2.66 (0.04)
a 3.35 (0.04)
a,b 3.29 (0.05) 4.22 (0.04)
30-39 79.85 (0.64)a 2.68 (0.04)
a 3.45 (0.03)
a 3.35 (0.04) 4.30 (0.04)
40-49 80.91 (0.89) 2.72 (0.05) 3.54 (0.04)d
3.39 (0.06) 4.25 (0.03)
50-60 83.97 (1.04)c,d
2.92 (0.06)c,d
3.60 (0.05)c,d
3.47 (0.07) 4.28 (0.03)
Gender
Men 81.67 (0.58)e 2.81 (0.03) 3.52 (0.03) 3.39 (0.04) 4.23 (0.03)
Women 79.95 (0.61) e 2.68 (0.04) 3.45 (0.03) 3.37 (0.04) 4.30 (0.03)
Education Levels
Lower 80.31 (0.52) 2.71 (0.03) 3.48 (0.02) 3.36 (0.03) 4.29 (0.03)
41
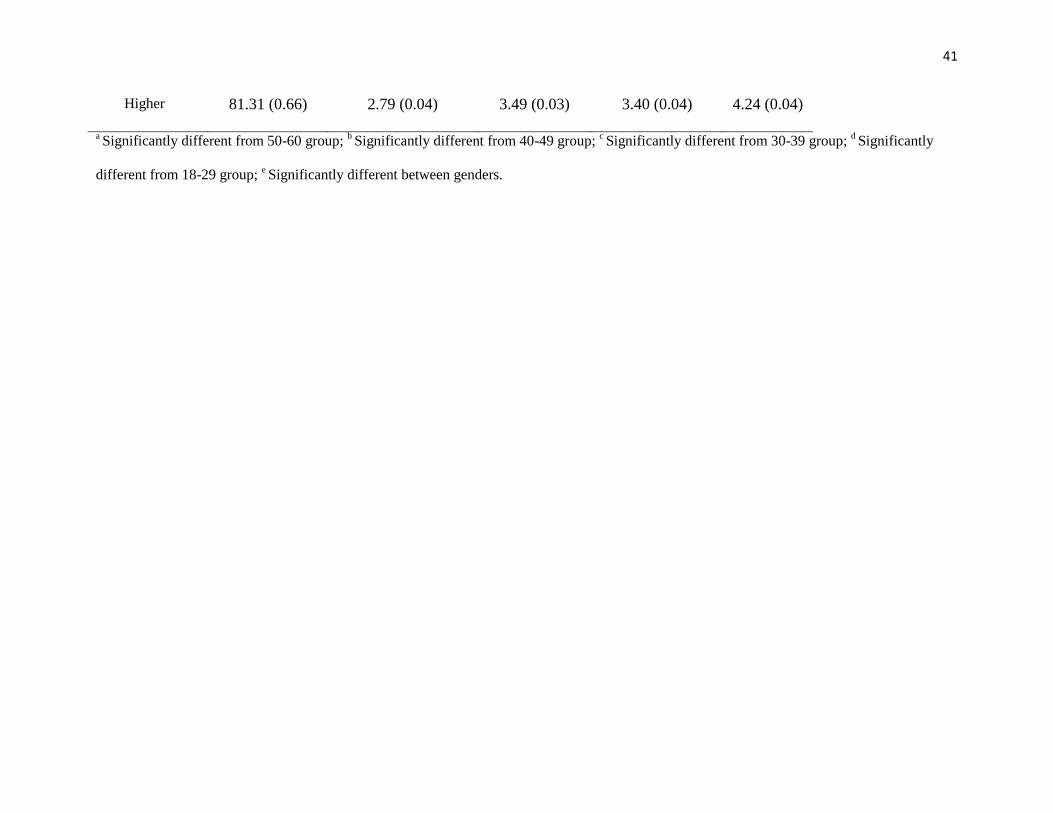
Higher 81.31 (0.66) 2.79 (0.04) 3.49 (0.03) 3.40 (0.04) 4.24 (0.04)
a Significantly different from 50-60 group;
b Significantly different from 40-49 group;
c Significantly different from 30-39 group;
d Significantly
different from 18-29 group; e Significantly different between genders.
42
Supplemental Materials
(i) Results of the content analysis of open-ended responses used to generate candidate new items.
No. Themes Content of Respondents’ Responses (number of
respondents reporting each)
Total
Number of
Respondents
Candidate New Items
Developed
1 Death - Scared of death (1)
- Prepare for emergency departure (1)
2 Not Applicable
2 Physical appearance -Looking old (2)
-Wrinkled skin (2)
-Knee pain (1)
-Hair loss (1)
6 -I won’t like looking old
3 Health
-Hoping to be well and healthy, even though
ageing is associated with loss (2)
-Worry my health will be worse (6)
-My ability to do something becomes
slow compared to young age (2)
-Feeling tired (1)
-Weak physical ability (2)
-Frail (2)
-Being careful with my food intake and daily
activity in order to ensure that my health is
good (1)
16 -I worry about my health getting
worse
4 Ability to do desirable
things
- Travel to favorite places (3)
- Able to do everything on my own (2)
- Able to work and contribute to society (2)
- Rest at home (2)
- More time for myself (1)
10 -I will have more time to do the
things that I enjoy.
5 Family relationships -Having more time to spend with my family (2)
-Hoping that my children are happy with their
own family (1)
-People that I love are still happy and are together
with me (5)
18 -I will enjoy having my family
around me
-I am happy that my family will
take care of me.
43
-Getting more attention from society and children as I
grow older (1)
- Children are busy with their own life (1)
- Worried that the time with my family is short as I may
die (1)
- Feeling lonely as my children already have their
own family and are living on their own without me (3)
- Need help from my children/family to do something
(4)
6 Religion
- Spend more time worshipping God (3)
- Doing good things (1)
- Being grateful to God (2)
6
I will be happy that I can devote
more time to my religion.
7 Acceptance of ageing
- Accept that I am already old (3)
- Accept the ageing process (1)
4
I will accept the fact that I am
old.
8 Financial Concerns
-Using pension money for the rest of my life (1)
-No income / financially unstable, so I am worried about
finances after retirement (3)
4
I worry about having less money
to live on
44
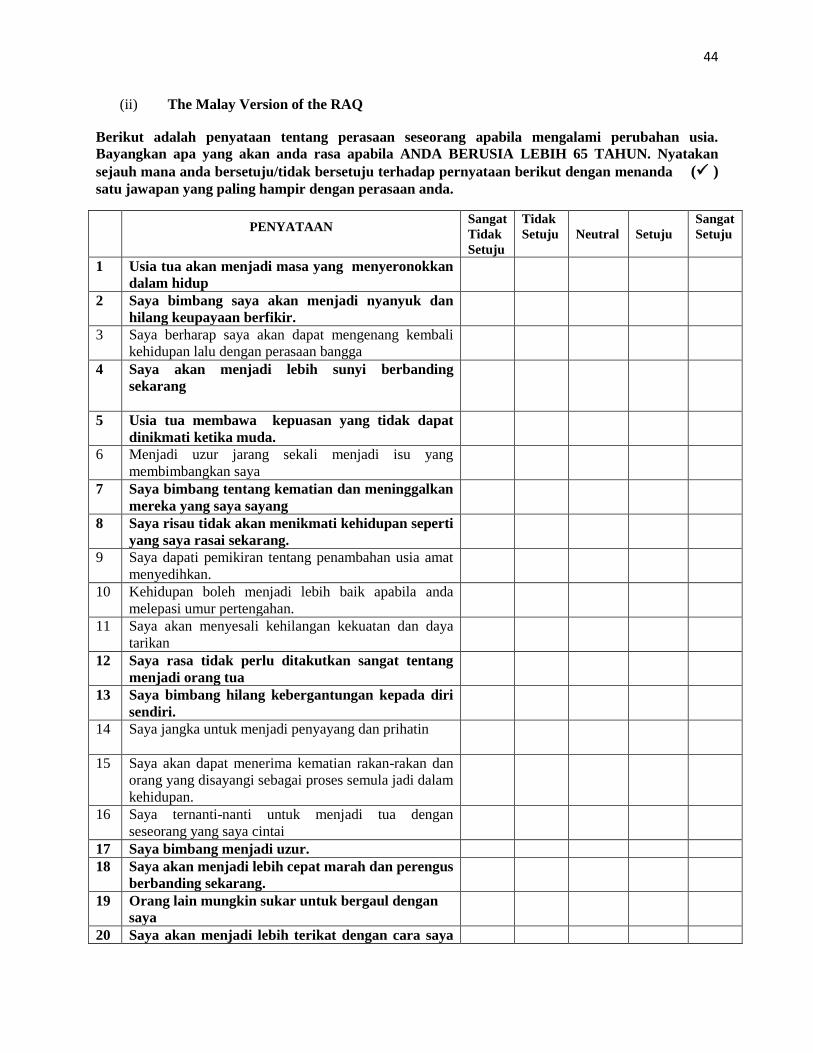
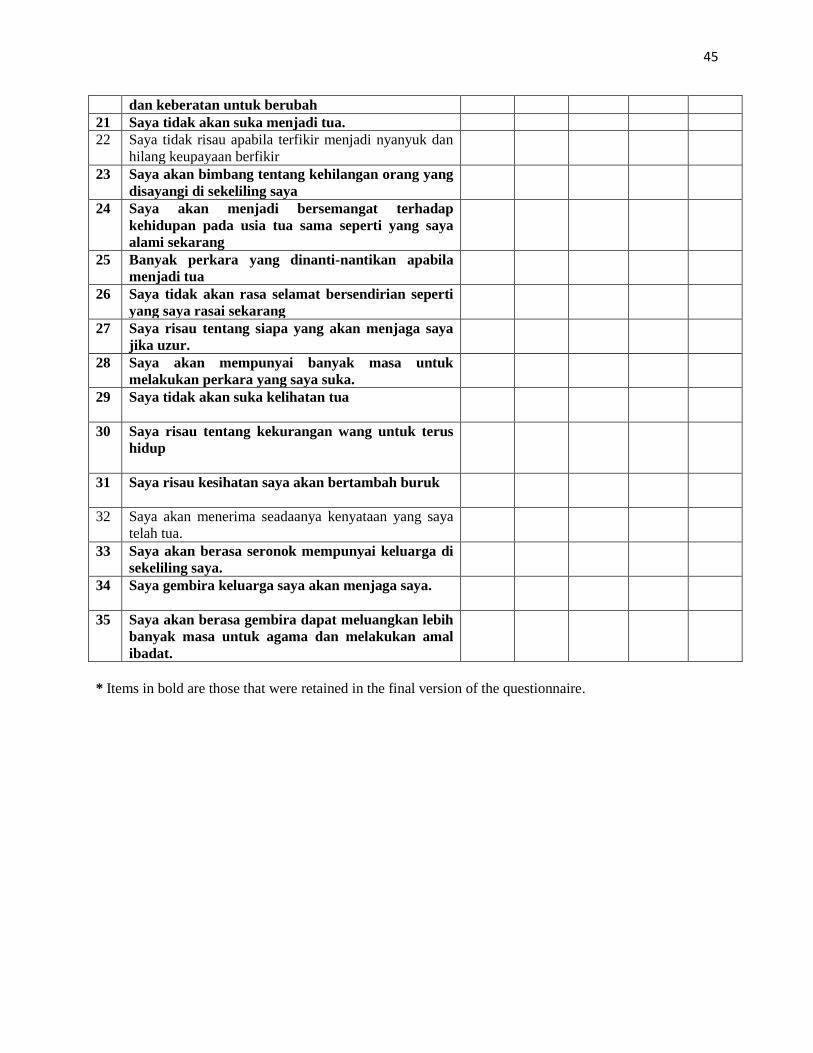
(ii) The Malay Version of the RAQ
Berikut adalah penyataan tentang perasaan seseorang apabila mengalami perubahan usia.
Bayangkan apa yang akan anda rasa apabila ANDA BERUSIA LEBIH 65 TAHUN. Nyatakan
sejauh mana anda bersetuju/tidak bersetuju terhadap pernyataan berikut dengan menanda ( ) satu jawapan yang paling hampir dengan perasaan anda.
PENYATAAN
Sangat
Tidak
Setuju
Tidak
Setuju
Neutral
Setuju
Sangat
Setuju
1 Usia tua akan menjadi masa yang menyeronokkan
dalam hidup
2 Saya bimbang saya akan menjadi nyanyuk dan
hilang keupayaan berfikir.
3 Saya berharap saya akan dapat mengenang kembali
kehidupan lalu dengan perasaan bangga
4 Saya akan menjadi lebih sunyi berbanding
sekarang
5 Usia tua membawa kepuasan yang tidak dapat
dinikmati ketika muda.
6 Menjadi uzur jarang sekali menjadi isu yang
membimbangkan saya
7 Saya bimbang tentang kematian dan meninggalkan
mereka yang saya sayang
8 Saya risau tidak akan menikmati kehidupan seperti
yang saya rasai sekarang.
9 Saya dapati pemikiran tentang penambahan usia amat
menyedihkan.
10 Kehidupan boleh menjadi lebih baik apabila anda
melepasi umur pertengahan.
11 Saya akan menyesali kehilangan kekuatan dan daya
tarikan
12 Saya rasa tidak perlu ditakutkan sangat tentang
menjadi orang tua
13 Saya bimbang hilang kebergantungan kepada diri
sendiri.
14 Saya jangka untuk menjadi penyayang dan prihatin
15 Saya akan dapat menerima kematian rakan-rakan dan
orang yang disayangi sebagai proses semula jadi dalam
kehidupan.
16 Saya ternanti-nanti untuk menjadi tua dengan
seseorang yang saya cintai
17 Saya bimbang menjadi uzur.
18 Saya akan menjadi lebih cepat marah dan perengus
berbanding sekarang.
19 Orang lain mungkin sukar untuk bergaul dengan
saya
20 Saya akan menjadi lebih terikat dengan cara saya
45
dan keberatan untuk berubah
21 Saya tidak akan suka menjadi tua.
22 Saya tidak risau apabila terfikir menjadi nyanyuk dan
hilang keupayaan berfikir
23 Saya akan bimbang tentang kehilangan orang yang
disayangi di sekeliling saya
24 Saya akan menjadi bersemangat terhadap
kehidupan pada usia tua sama seperti yang saya
alami sekarang
25 Banyak perkara yang dinanti-nantikan apabila
menjadi tua
26 Saya tidak akan rasa selamat bersendirian seperti
yang saya rasai sekarang
27 Saya risau tentang siapa yang akan menjaga saya
jika uzur.
28 Saya akan mempunyai banyak masa untuk
melakukan perkara yang saya suka.
29 Saya tidak akan suka kelihatan tua
30 Saya risau tentang kekurangan wang untuk terus
hidup
31 Saya risau kesihatan saya akan bertambah buruk
32 Saya akan menerima seadaanya kenyataan yang saya
telah tua.
33 I will enjoy having my family around me Saya akan berasa seronok mempunyai keluarga di
sekeliling saya.
34 Saya gembira keluarga saya akan menjaga saya.
35 Saya akan berasa gembira dapat meluangkan lebih
banyak masa untuk agama dan melakukan amal
ibadat.
* Items in bold are those that were retained in the final version of the questionnaire.
46
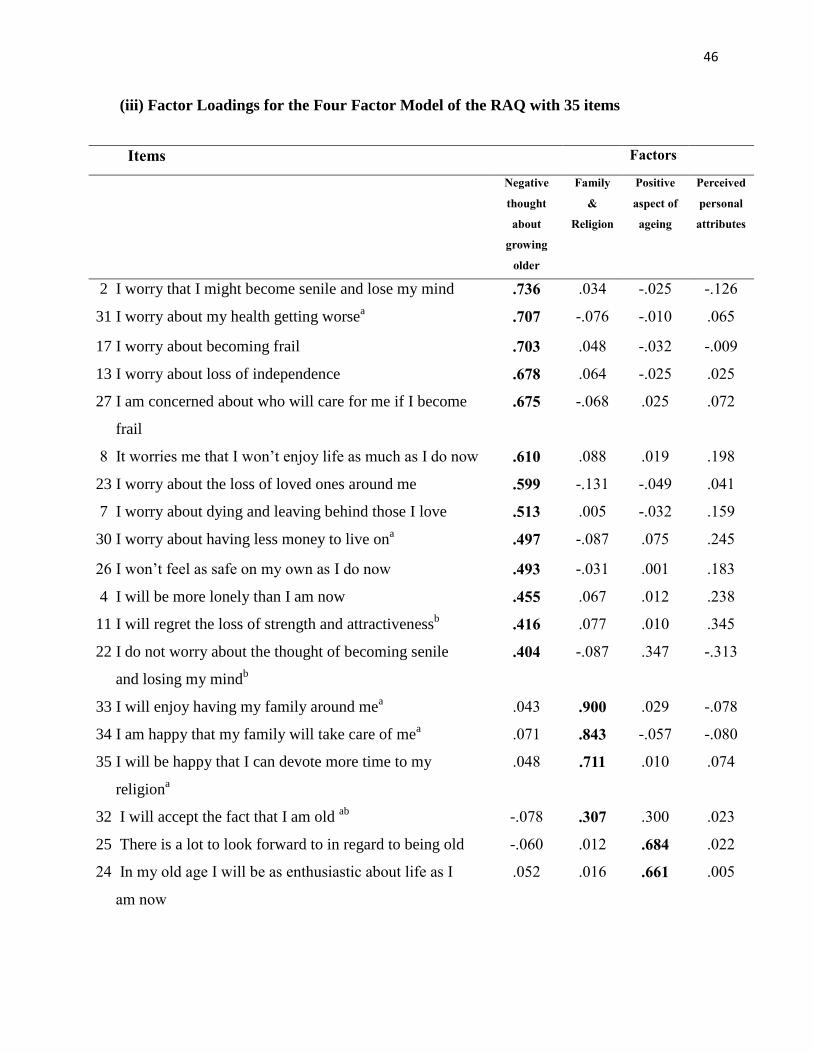
(iii) Factor Loadings for the Four Factor Model of the RAQ with 35 items
Items Factors
Negative
thought
about
growing
older
Family
&
Religion
Positive
aspect of
ageing
Perceived
personal
attributes
2 I worry that I might become senile and lose my mind
.736 .034 -.025 -.126
31 I worry about my health getting worsea .707 -.076 -.010 .065
17 I worry about becoming frail .703 .048 -.032 -.009
13 I worry about loss of independence .678 .064 -.025 .025
27 I am concerned about who will care for me if I become
frail
.675 -.068 .025 .072
8 It worries me that I won’t enjoy life as much as I do now .610 .088 .019 .198
23 I worry about the loss of loved ones around me .599 -.131 -.049 .041
7 I worry about dying and leaving behind those I love
.513 .005 -.032 .159
30 I worry about having less money to live ona .497 -.087 .075 .245
26 I won’t feel as safe on my own as I do now .493 -.031 .001 .183
4 I will be more lonely than I am now .455 .067 .012 .238
11 I will regret the loss of strength and attractivenessb
.416 .077 .010 .345
22 I do not worry about the thought of becoming senile
and losing my mindb
.404
-.087
.347 -.313
33 I will enjoy having my family around mea .043 .900 .029 -.078
34 I am happy that my family will take care of mea .071 .843 -.057 -.080
35 I will be happy that I can devote more time to my
religiona
.048 .711 .010 .074
32 I will accept the fact that I am old ab
-.078 .307 .300 .023
25 There is a lot to look forward to in regard to being old -.060 .012 .684 .022
24 In my old age I will be as enthusiastic about life as I
am now
.052 .016 .661 .005
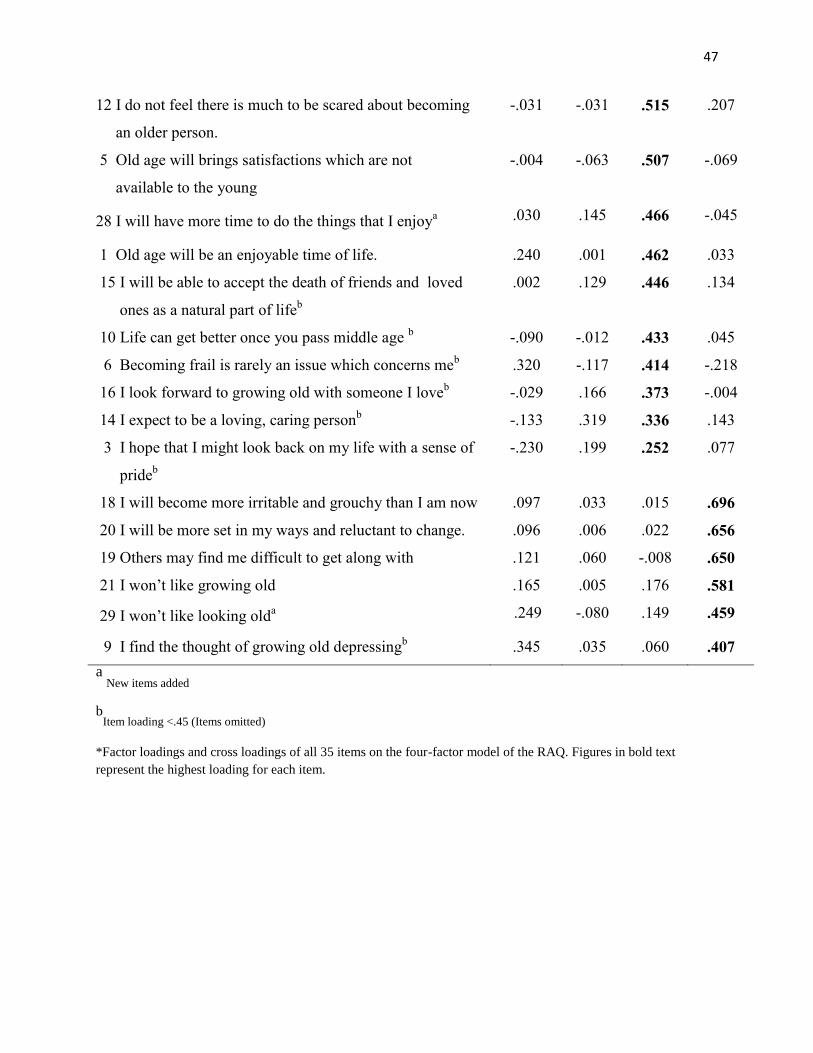
47
12 I do not feel there is much to be scared about becoming
an older person.
-.031 -.031 .515 .207
5 Old age will brings satisfactions which are not
available to the young
-.004 -.063 .507
-.069
28 I will have more time to do the things that I enjoya .030 .145 .466 -.045
1 Old age will be an enjoyable time of life. .240 .001 .462 .033
15 I will be able to accept the death of friends and loved
ones as a natural part of lifeb
.002 .129 .446 .134
10 Life can get better once you pass middle age b
-.090 -.012 .433 .045
6 Becoming frail is rarely an issue which concerns meb
.320 -.117 .414 -.218
16 I look forward to growing old with someone I loveb
-.029 .166 .373 -.004
14 I expect to be a loving, caring personb
-.133 .319 .336 .143
3 I hope that I might look back on my life with a sense of
prideb
-.230 .199 .252 .077
18 I will become more irritable and grouchy than I am now .097 .033 .015 .696
20 I will be more set in my ways and reluctant to change. .096 .006 .022 .656
19 Others may find me difficult to get along with .121 .060 -.008 .650
21 I won’t like growing old
.165 .005 .176 .581
29 I won’t like looking olda .249 -.080 .149 .459
9 I find the thought of growing old depressingb
.345 .035 .060 .407
a New items added
bItem loading <.45 (Items omitted)
*Factor loadings and cross loadings of all 35 items on the four-factor model of the RAQ. Figures in bold text
represent the highest loading for each item.