CS 365 Project Report Digital Image Forensics - CSE - IIT ...
11
CS 365 Project Report Digital Image Forensics Abhijit Sharang (10007) Pankaj Jindal (Y9399) Advisor: Prof. Amitabha Mukherjee 1
-
Upload
khangminh22 -
Category
Documents
-
view
4 -
download
0
Transcript of CS 365 Project Report Digital Image Forensics - CSE - IIT ...

CS 365 Project ReportDigital Image Forensics
Abhijit Sharang (10007)Pankaj Jindal (Y9399)
Advisor: Prof. Amitabha Mukherjee
1

Abstract
Determining the authenticity of an image is now an important area of research .Inour work,we attempt to classify whether a digital image is a genuine image or is a ma-nipulated version of some authentic image.We have applied three different algorithmsdiscussed in [1] and [2] with modifications of our own. We have then implemented twotechniques discussed in [5] and [6] to detect the fake regions in the image. Our approachis invariant to the type of manipulation that has been done to the images.From ourmethods,we are able to classify nearly 80% manipulated images.
1 Introduction
By looking at the two images of Monalisa, the image on the left 1 and image on theright 2 by naked eyes, one can deduce that image on the right is fake but the same is notan easy task for image 2 3.With the advancement in the technology in the field of computergraphics, it is very easy to manipulate digital images that are impossible to differentiatefrom authentic photographic images. This undermines the use of images as a credible sourceof some event .Moreover, digitally manipulated images can trigger off major controversies.Hence, there is a need for more sophisticated and mathematically sound techniques that canperform this task of classification of the image into real ones and digitally manipulated ones.
Presently, there are methods that can ensure the authenticity of an image like by insert-ing watermarks in it. But, such methods are not always feasible. Hence passive techniquesfor classifying the images are more popular and desired. One such passive technique exploitsthe fact that all camera clicked real images share a set of statistical features that are differentfrom the statistical features that are possessed by the images that are manipulated by anysoftware[7]. We exploit these features to classify the images and then detect the region oftampering in the manipulated images.Much of our work is based on the ideas presented in[1],[2],[5] and [6].
1source:wikipedia.org2source:weheartit.com3source:theiranianhome.com
2

2 Preliminaries
In this section, we discuss the application of wavelets in Digital Image Forensics.
The discrete wavelet transform of an image results in four sub-bands of varying orientation,namely the Diagonal sub-band(Di), the horizontal sub-band(Hi), the Vertical Sub-band(Vi)and the low frequency sub-band which contains the approximation coefficients for decompo-sition to scale i+1.This transform is achieved by passing the image through a low pass filterand a high pass filter, which are orthogonal to each other.
The three high frequency sub-bands exhibit a statistical regularity which can be exploited inImage Forensics. Their distribution for clean images is non-Gaussian[1]. More specifically,the distribution is Laplacian with sharp peak at zero and large symmetrical tail[2]. Moreoverit has been observed that a strong correlation exists between the sub-bands at scale i andscale i+1.[2]Hence, if there is a large coefficient for a sub-band at scale i, it is highly likelythat the coefficient is also high at scale i+1 [3].
Fig: A distribution of Diagonal Sub-band
These statistical properties hold good for natural images which have not undergone anytampering. When a tampering operation is done on the image,it is likely that the waveletproperties are modified to conceal the tampering.
3

3 Methods
• Detection of digital image manipulation
Three different classifiers were designed using feature vectors that exploited three dis-tinct statistical properties of authentic images. Two of these were based on the methodused by paper[1] and the third was based on the method used by paper[2]. The authorsof [2] had restricted their domain to classifying an image as photographic or photo-realistic, but we found that the method works equally well with image manipulation.
– In the first classifier, the RGB image was filtered using a locally adaptive Weinerfilter with a neighbourhood size of 5× 5 to remove the high frequency noise. Theimage was separately filtered using a median filter with a neighbourhood size of4 × 4 to remove the salt and pepper noise. For each of the two matrices of noiseobtained, the mean, standard deviation and kurtosis were calculated. Hence,6 × 3 = 18 feature vectors were obtained.Relevant Code: denois.m
– In the second classifier, the RGB image was first converted to its gray-scale equiv-alent(Reason explained below). For each image, a single level discrete wavelettransform was performed to obtain the high frequency Hi, Di and Vi sub-bands.The distances of their distribution was calculated from the corresponding GaussianDistribution. The Gaussian distribution was used as a benchmark in conforma-tion with the Central Limit Theorem.These distances and the standard deviationof the sub-band coefficients were used as feature vectors. Hence, 6 feature vectorswere obtained from each image. The conversion to gray-scale was done to preventthe feature vectors of the standard deviation from dominating the feature vectorsof the distances. Authors of [1] had solved the problem by normalising the energyof each image, but we found that normalising tends to disturb the Laplacian dis-tribution of the sub-band coefficients.Relevant Code: wavelet.m
– In the third classifier, the RGB image was again converted to its gray-scale equiv-alent(Details below). For each image, a multi-scale discrete wavelet transform wasdone to obtain the wavelet sub-band coefficients for the first three scales. For thefirst two ”parent” sub-bands, a neighbourhood prediction model was constructedfor each coefficient as follows:Oi(x, y) = w1Oi(x − 1, y) + w2Oi(x, y − 1) + w3Oi(x, y + 1) + w4Oi(x + 1, y) +
w5Oi+1(x/2, y/2)where Oi is the ith scale diagonal, vertical or horizontal sub-band.Using the method of least squares, the residue matrix was obtained for each sub-band for the first two scales. The standard deviation and kurtosis were used asfeature vectors. Hence, a total of 6 × 2 = 12 features vectors were obtained.The conversion to gray-scale was done to reduce the computational complexity incalculating the residues.Relevant Code: neigh.m
4

• Detection of manipulated regions
Two methods were employed for manipulated region detection. The first was basedon the idea used in [6] but with a different set of features, and the second used thealgorithm described in [5].
– In the first method, a wavelet based de-noising filter was applied on each colourchannel of the RGB image. The standard deviation for each noise matrix wasobtained. Moreover, a discrete wavelet transform was performed for each blockand the standard deviation of the coefficients was obtained.A k-means classifier was used to obtain the suspicious regions based on thesefeatures.Then the cluster with the minimum number of blocks was chosen as thecluster containing the susupicious blocks.To reduce false positives, the value of kwas different for different images.Moreover,clusters with size less than a minimumthreshold were discarded since these could have been outliers.Relevant Code: patchy.m
– In the second method, we divide the image into non-overlapping blocks and thenwe lexicographically sort them. After sorting, we take lexicographically ”close”blocks and compute the distance between their positions. If the distance is lessthan a minimum threshold, then we mark both the blocks as manipulated blocks.Relevant Code: tro4.m
4 Results and discussions
• Digital Image manipulation detection
We used 61 digitally manipulated images and 71 authentic images obtained from theDresden Image Database[4] for training the classifier.The classifier used was a SupportVector Machine with a radial basis function as the kernel.The test dataset consistedof 61 authentic images obtained from www.dpreview.com and 59 manipulated imagesfrom various sources on the internet.The following results were obtained:
– Classifier from image de-noisingTrue positive: 50/59False positive: 19/61
– Classifier from wavelet statistical propertiesTrue positive: 48/59False positive: 18/61
– Classifier from wavelet neighbourhood predictionTrue positive: 44/59False positive:13/61
– Voting from the three classifiersTrue positive: 46/59False positive: 13/61
5

We did not have any pre-assumption on the kind of manipulation that has been doneon the image.The original paper we worked upon has assumptions about the kindof manipulation.Their result was detection of 90% true positive images and 5% falsepositive images. Their results seem to be better than our results because of the pre-assumption..
• Fake region detection
We took a random sample of 30 images from the test and the training data-set whichwere digitally manipulated. Barring 3 images,the algorithm using the de-noising tech-nique was able to detect the manipulated region in the images.However,blocks havinghigh similarity with the tampered blocks were wrongly classified. This points at theneed to improve the algorithm by using a better de-noising filter than the waveletde-noising filter as this causes some amount of loss of information in the original im-age. This seems to blur the thin line of divide between manipulated regions and otherregions. We did not proceed with the experiment on other images because of thishandicap.
The experiment was also conducted using the method as described in [5]. In thismethod, we mostly obtained bad results. The reasons for such results are:
– The image need not be a of a size multiple of the block size, so we extended theincomplete blocks by filling zeros in them which affected the sorting and hence,the overall results.
– Reasons why method is not a appropriate:
∗ It does a lexicographically sorting but this method is not useful if the manip-ulated region is copy pasted from some other image.
∗ The copy-pasted regions must completely fit into the blocks and the corre-sponding rows and columns should be same for this method to work.
∗ A simple rotation of the copied region while pasting in the image will renderthis method useless.
6

4 5
6 7
8 9
Some manipulated images correctly classified by all 3 classifiers
4Source: Wikipedia5Source: Dresden Image Database6Source: Wikipedia7Source: Own Image8Source: Wikipedia9Source: Wikipedia
7

10 11 12
Some authentic images wrongly classified as manipulated images
13 14
Some manipulated images classified as authentic
10Source: www.dpreview.com11Source: www.dpreview.com12Source: www.dpreview.com13Source: www.existingvisual.com14Source: www.bollywoodhungama.com
8

Some results by using our method for detection of manipulated regions
15
16
15Source: annanedelcheva.wordpress.com16Source: www.umaxforum.com
9
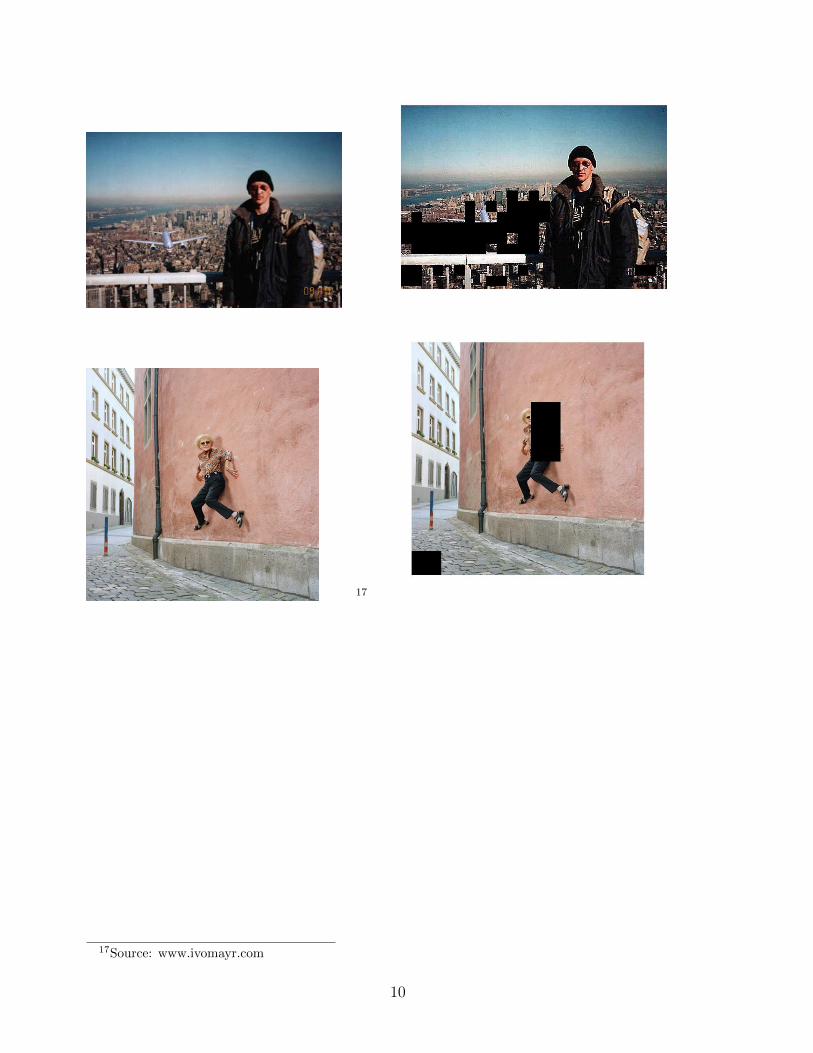
17
17Source: www.ivomayr.com
10

References
1. Hongmei Gou; Swaminathan, A.; Min Wu; ,”Noise Features for Image TamperingDetection and Steganalysis,” Image Processing, 2007. ICIP 2007. IEEE InternationalConference on, vol.6, no., pp.VI-97-VI-100, Sept. 16 2007-Oct. 19 2007
2. S. Lyu and H. Farid, ”How realistic is photorealistic?” IEEE Trans. SignalProcessing,vol. 53, no. 2, pp. 845-850, 2005
3. Lu, W., et al. 2008. Digital image forensics using statistical features and neuralnetwork classifier, Proc. The 7th International Conference on Machine Learning andCybernetics, pp. 2831–2834, July 2008.
4. Gloe, T., Bhome, R. (2010). ”The Dresden Image Database for benchmarking digitalimage forensics”. In Proceedings of the 25th Symposium on Applied Computing (ACMSAC 2010) (Vol. 2, pp. 1585-1591).
5. Xunyu Pan, Xing Zhang, Siwei Lyu, ”Exposing image forgery with blind noise esti-mation”. Proceedings of the thirteenth ACM multimedia workshop on Multimedia andsecurity, 2011
6. A. C. Popescu and H. Farid, Exposing Digital Forgeries by Detecting Duplicated ImageRegions, 2004 :Dartmouth College
7. S.Dehnie,H.T. Sencar,and N.Memon,””Digital image forensics for identifying computergenerated and digital camera images” in Proc. IEEE Int. Conf.Image Processing(ICIP), Atlanta, GA, 2006, pp. 2313-2316.
11