Crystal structure characterization of nautilus shell at different length scales
10
Biomaterials 27 (2006) 4508–4517 Crystal structure characterization of nautilus shell at different length scales Rodrigo Rafael Vela´zquez-Castillo ,1 , Jose Reyes-Gasga 2 , Domingo I. Garcı´a-Gutierrez, Miguel Jose-Yacaman Texas Materials Institute and Department of Chemical Engineering, University of Texas at Austin, TX 78712, USA Received 21 November 2005; accepted 2 April 2006 Abstract In this work, we studied the shell structure of the Nautilus pompilius Linnaeus by using analytical techniques of scanning (SEM) and transmission electron microscopy (TEM) and X-ray diffraction. The main objective of this study is the structural characterization of Nautilus shell at different length levels, from micron to nano-scale. The results were also used to try to determine the shell structure mechanism of formation. The information obtained in this work will place our particular knowledge a closer step to understand how self- assembly works in nature, and will increase the opportunities of using this information in the future synthesis of new advanced materials. r 2006 Elsevier Ltd. All rights reserved. Keywords: Nautilus shell; SEM; TEM; HRTEM; X-ray diffraction 1. Introduction Natural composite materials are very important in several fields, including Material Science. Their study is essential to understand how they are created by nature and then, to use this knowledge to reproduce them for human use with specific applications. It has been found that most of these natural composites have much better mechanical properties than those from their corresponding pure components [1]. One clear example is the case of the mollusk’s shell and bird-egg shells. Therefore, researchers have aimed their effort on revealing their microstructure and growth mechanism [2–6]. In the case of shells, some of them have focused their efforts on the study of the abalone [7–10] and nacre [11–14]. In those previous works, the authors have found that the main components of both abalone and nacre shells are aragonite and some organic compounds as acidic proteins, polyanionic proteins, glycoproteins and other organic components. In fact, these components play an important role in the shell structure— not only to control the crystallization of CaCO 3 into aragonite instead of calcite, which is more stable at low temperature and pressure [10,15], but also to guide and order the small aragonite crystals to make small plates. It is also reported that those small plates are aligned to form inorganic layers and the whole shell structure is built by alternating inorganic–organic layers, which are stacked along the normal direction of the surface shell. Many efforts have also been made to extract, purify, identify and use the proteins from abalone [8,16,17] and nacre [18] shells to grow CaCO 3 crystals in vitro. A better understanding of the role that the organic compounds play on the natural crystal growth process has been obtained from those works and that knowledge has also been applied to synthesize new highly organized composite materials, as a flat pearl [16] and artificial nacre [18]. Those types of works are the basis of the controlled biofabrication. Another shell less studied in the literature, the Nautilus pompilius Linnaeus, is also made of CaCO 3 in the form of aragonite. This shell has a beautiful and symmetrical ARTICLE IN PRESS www.elsevier.com/locate/biomaterials 0142-9612/$ - see front matter r 2006 Elsevier Ltd. All rights reserved. doi:10.1016/j.biomaterials.2006.04.003 Corresponding author. Tel.: +512 471 67 09; fax: +512 471 76 81. E-mail address: [email protected] (R.R. Vela´zquez-Castillo). 1 Also from Centro de Fı´sica Aplicada y Tecnologı´a Avanzada, UNAM. Apdo. Postal 1-1010, Quere´taro 76000, Me´xico. 2 Also from Instituto de Fı´sica UNAM. Apdo. Postal 20-364, Me´xico D.F. 01000, Me´xico.
Transcript of Crystal structure characterization of nautilus shell at different length scales

ARTICLE IN PRESS
0142-9612/$ - se
doi:10.1016/j.bi
�CorrespondE-mail addr
(R.R. Velazque1Also from C
Apdo. Postal 12Also from I
D.F. 01000, M
Biomaterials 27 (2006) 4508–4517
www.elsevier.com/locate/biomaterials
Crystal structure characterization of nautilus shell atdifferent length scales
Rodrigo Rafael Velazquez-Castillo�,1, Jose Reyes-Gasga2,Domingo I. Garcıa-Gutierrez, Miguel Jose-Yacaman
Texas Materials Institute and Department of Chemical Engineering, University of Texas at Austin, TX 78712, USA
Received 21 November 2005; accepted 2 April 2006
Abstract
In this work, we studied the shell structure of the Nautilus pompilius Linnaeus by using analytical techniques of scanning (SEM) and
transmission electron microscopy (TEM) and X-ray diffraction. The main objective of this study is the structural characterization of
Nautilus shell at different length levels, from micron to nano-scale. The results were also used to try to determine the shell structure
mechanism of formation. The information obtained in this work will place our particular knowledge a closer step to understand how self-
assembly works in nature, and will increase the opportunities of using this information in the future synthesis of new advanced materials.
r 2006 Elsevier Ltd. All rights reserved.
Keywords: Nautilus shell; SEM; TEM; HRTEM; X-ray diffraction
1. Introduction
Natural composite materials are very important inseveral fields, including Material Science. Their study isessential to understand how they are created by nature andthen, to use this knowledge to reproduce them for humanuse with specific applications. It has been found that mostof these natural composites have much better mechanicalproperties than those from their corresponding purecomponents [1]. One clear example is the case of themollusk’s shell and bird-egg shells. Therefore, researchershave aimed their effort on revealing their microstructureand growth mechanism [2–6]. In the case of shells, some ofthem have focused their efforts on the study of the abalone[7–10] and nacre [11–14]. In those previous works, theauthors have found that the main components of bothabalone and nacre shells are aragonite and some organic
e front matter r 2006 Elsevier Ltd. All rights reserved.
omaterials.2006.04.003
ing author. Tel.: +512 471 67 09; fax: +512 471 76 81.
ess: [email protected]
z-Castillo).
entro de Fısica Aplicada y Tecnologıa Avanzada, UNAM.
-1010, Queretaro 76000, Mexico.
nstituto de Fısica UNAM. Apdo. Postal 20-364, Mexico
exico.
compounds as acidic proteins, polyanionic proteins,glycoproteins and other organic components. In fact, thesecomponents play an important role in the shell structure—not only to control the crystallization of CaCO3 intoaragonite instead of calcite, which is more stable at lowtemperature and pressure [10,15], but also to guide andorder the small aragonite crystals to make small plates. It isalso reported that those small plates are aligned to forminorganic layers and the whole shell structure is built byalternating inorganic–organic layers, which are stackedalong the normal direction of the surface shell.Many efforts have also been made to extract, purify,
identify and use the proteins from abalone [8,16,17] andnacre [18] shells to grow CaCO3 crystals in vitro. A betterunderstanding of the role that the organic compounds playon the natural crystal growth process has been obtainedfrom those works and that knowledge has also beenapplied to synthesize new highly organized compositematerials, as a flat pearl [16] and artificial nacre [18].Those types of works are the basis of the controlledbiofabrication.Another shell less studied in the literature, the Nautilus
pompilius Linnaeus, is also made of CaCO3 in the formof aragonite. This shell has a beautiful and symmetrical

ARTICLE IN PRESS
Fig. 1. Frontal (left) and lateral (right) views of the Nautilus pompilius
Linnaeus shell. Some lines on the shell surface are indicated by arrows.
R.R. Velazquez-Castillo et al. / Biomaterials 27 (2006) 4508–4517 4509
shape. As it is possible to see in Fig. 1, in a frontal view theshell has a U-like-curve shape, with a smaller curve in thetop (near to its center) and a larger one in the bottom withan average size of 15 cm from the top to the bottom. In thelateral view, we see its characteristic spiral curve with anaverage diameter of 20.5 cm. On its surface, the shell showsmany lines that run from one lateral side to the other.
In this work, we studied the shell structure of theN. pompilius Linnaeus, an ancient creature that still lives onearth, by using analytical techniques of scanning (SEM)and transmission electron microscopy (TEM) and X-raydiffraction. The main objective of this study is thestructural characterization of Nautilus shell at differentlength levels, from micron to nano-scale. The results werealso used to try to determine the shell structure mechanismof formation. The information obtained in this work willplace our particular knowledge a closer step to understandhow self-assembly works in nature, and will increase theopportunities of using this information in the futuresynthesis of new advanced materials.
2. Experimental procedure
The Nautilus shells studied here were collected from the sea. Soft
tissues were completely removed using a small knife, avoiding making any
damage on the shells. Then, shells were cleaned with distilled water and
dried for several days at room conditions.
2.1. X-ray diffraction
For X-ray analysis, small pieces of 2� 2 cm2 approximately from the
inner and outer surfaces of the shell were cut as plain as possible with a
diamond saw. In addition, some cross-section cuts were made to analyze
the structure of the shell along its thickness. Small pieces of 10� 4mm2
were also cut from the lateral side of the shell by using as much as possible
the lines observed on its surface (Fig. 1). In some cuts, their larger sides
were parallel to those shell surface lines and in others, their larger sides
were perpendicular to those lines. The average cross-section thickness of
the shell was 0.81mm. The X-ray diffraction spectra were obtained with
an Advance Diffraction System X1 Scintag Inc.
Some other shell pieces were finely grounded into powders using a
mortar and pestle, filtered using a 420 mesh grill and then analyzed with a
Phillips PW 1720 Diffractometer (Cu Ka 45 kV), in order to identify
inorganic components. The 2y range used in all the X-ray analyses was
from 101 to 901 with a step of 0.041 at room temperature.
2.2. Thermal gravimetric analysis
This calorimetric technique was carried out in the powder sample to
quantify the weight percentage of the organic phase in the shell. Thermal
gravimetric analysis (TGA) was performed with a Perkin Elmer TGA 7
Series within the temperature range from room temperature (25 1C) to
500 1C with a heating rate of 2 1C/min with an Argon flow of 20mL/min.
For this analysis, 32mg of the same shell powder was used.
2.3. Scanning electron microscopy
Small shell pieces of about 1 cm2 were cut, their surfaces were slightly
polished and then chemical attacked during 10min using an etching gel
that contains 37wt% of ortho-phosphoric acid. Afterwards, the samples
were washed with deionized water and coated with a gold thin film by
sputtering. The observations were carried out with a Hitachi S-4500 field
emission SEMmicroscope using 15 kV in the accelerating voltage. Internal
and external faces and shell transversal section were morphologically
analyzed.
2.4. Transmission electron microscopy
In previous works, the samples were prepared by cutting the shell using
either an ultra-microtome [19] or onion beam milling [20]. Although these
sample preparation methods have presented good results in the study of
the shell structure, the probability of spurious artifacts in TEM
observations can be reduced. Therefore, a sample preparation method
different than those reported was used in this work.
A cross-sectional TEM sample was prepared using the following
procedure. A 1� 2mm2 piece of the shell was cut using a diamond saw.
Then, a ‘‘sandwich’’ was made with two pieces of silicon wafer of the same
size. The silicon was glued to both sides of the shell piece using M-610
adhesive (Gatan product). The three pieces were clamped together and
cured for an hour on a hotplate at 140 1C. The silicon was used not only
for mechanical support but also as a guide for polishing the sample. Using
a disk grinder and polishing papers with increasing fineness, two non-
opposing sides of the shell were polished to keep sample orientation. The
sample was then glued to half a piece of a Cu TEM grid and cured for
20min. The last step involved polishing the opposing side of the TEM grid
until the width of the sample reached 50 mm or less. After completion of
these processes, the sample was ready for cutting using a focused ion beam
(FIB) equipment.
An FIB FEI Strata DB235 was used and the sample was thinned from
50mm to a thickness no longer than 100 nm. The FIB thinned the sample
by removing layer by layer of the shell with the use of a Ga+ ion beam
until it reached the desired thickness.
The ion beam in the FIB is rather small (20 nm) with a much smaller
current than that in the ion milling device, and therefore, the cuts made in
the shell were more accurate and produced less damage in the structure
and the possibility of artifacts introduced by the sample preparation
method was reduced [21]. Moreover, the FIB also has the capability of
monitoring the milling process in real time through a high-resolution
observation. Images of the shell were taken between each step of this
cutting procedure for observation. They were used to analyze the
structural characteristics of the shell at a microscopic level. Once the
sample was thinner than 100 nm, it was carbon amorphous coated by
sputtering to minimize the TEM electron beam damage and to improve its
stability under the electron beam.
TEM observations were performed with the following: a JEOL 2010-F
TEM featuring a Schottky-type field emission gun; ultra-high-resolution
observation system; scanning image devices to be operated as a STEM
from TEM; and several atom-level probes connected to an Oxford INCA
energy-dispersive spectrometry (EDS), using an accelerating voltage of

ARTICLE IN PRESSR.R. Velazquez-Castillo et al. / Biomaterials 27 (2006) 4508–45174510
200 kV. This microscope has a point resolution of 1.9 nm and capabilities
for obtaining bright field, dark field, high-resolution TEM (HRTEM) and
high-angle annular dark field (HAADF) images.
Fig. 3. Comparative X-ray diffraction patterns in function of the
orientation of the shell. Notice the remarkable change of the preferential
orientation of the aragonite crystal along the different orientations. These
diffractograms were useful in determining orientation of the plates inside
the shell. More intense peaks are plane-indexed.
3. Results and discussion
Fine powder X-ray diffractogram (Fig. 2) allowed us toidentify the mineral phase of the shell, aragonite (CaCO3
PDF ] 41-1475) with orthorhombic unit cell withparameters a ¼ 4:9623, b ¼ 7:968 and c ¼ 5:7439 A. Thediffractogram of Fig. 2 was obtained from very fine shellpowders. Grosser powder was also analyzed by X-raydiffraction and its spectrum showed the signal correspond-ing to (0 1 2) plane of the aragonite crystals as the mostintense (Fig. 2). The peaks of planes (1 1 3) and (2 0 0) arealso intense, and the rest of the diffractogram is similar tothat corresponding to fine powders.
The X-rays diffraction spectra from both the inner andouter shell surfaces present the same profile (Fig. 3),indicating a consistence in the crystal growth orientation:they show a textured crystal arrangement whose prefer-ential orientation is in the [0 0 2] direction of the aragonitecrystals. Therefore, the c-axis of the aragonite unit cell isperpendicular to the surface of the shell. In addition, Fig. 3also shows the X-ray spectra from the rectangular pieces ofshell in which the faces were both perpendicular andparallel to the surface lines of the shell. They also showpreferential directions. In the face where the cutting lineswere perpendicular to the shell surface lines, the prefer-
Fig. 2. X-ray diffractograms from the fine and gross-grain-powder shell
sample. The fine one was used to identify inorganic constituents. Its
analysis indicated that aragonite is the only component. Gross sample
analysis indicates the existence of preferential crystal orientations. Main
peaks are plane-indexed.
ential orientations were along the (2 0 0) and (2 2 0) planes,both parallel to c-axis of the aragonite unit cell. In the facewhere the lines were parallel, the preferential orientationswere along the (1 3 0) and (2 2 0) planes, which are alsoparallel to the c-axis. Therefore, the surface of shells isperpendicularly oriented to the c-axis of the aragonite unitcell, while the lines run parallel to the a-axis. Similar crystalorientation was found by Wise [12] for the nacre structure.SEM images of the pieces of the outer surface of the shell
showed a topology formed of many aragonite plates, whichbuilt layers or platforms stacked from bottom to top alongthe normal direction of the surface, i.e. the c-axis (Fig. 4a).This observation reveals that the surface is formed byseveral small plates with well-defined edges joined asmosaics in a wall to fill the entire layer’s space (Fig. 4b).Each plate had an area of approximately 4 mm� 5 mm.On the cross-sectional cutting of the shell (Fig. 5a), the
plates are seen stacked to build up the thickness ofthe shell. Note that this arrangement is slightly similar tothe bricks in a wall and that the thickness of a plate is360 nm on average. Fig. 5b shows the ‘‘grain boundary’’between two plates and the suggested protein film aroundthem is clearly observed. A remnant of the film forms abridge between two layers and a close-up of this bridge isalso shown in Fig. 5c.To determine and evaluate the presence of protein and
other organic compounds, TGA analysis was performed.The analysis obtained from powder of the shell indicatesthat the organic phase is 4.2wt% and 2.5wt% correspondsto water, and no more thermal transitions were registered.

ARTICLE IN PRESS
Fig. 4. SEM images of outer shell surface showing (a) platforms or layers stacked to form different steps and (b) the plates are arranged to fill a layer and
they are joined together in such a way to observe boundaries of plates.
Fig. 5. SEM images of a cross-section of the shell showing (a) the alignment of the plates to form the layers and the stacking of these layers to build the
shell thickness, (b) the film between two layers and (c) a mineralized bridge-like film.
R.R. Velazquez-Castillo et al. / Biomaterials 27 (2006) 4508–4517 4511
This result is consistent with similar determinations forabalone shells in the literature [8,9].
Employing a stronger chemical attack during 15min inthe preparation of the shell surfaces, it was possible toreveal the nanometric structure of the plates. Fig. 6a showshow the nanometric crystals are arranged to produce theplates. Observations like this make it evident that the platesare not single crystals, but they are made of smaller singlecrystals in which most of them grow with a preferentialorientation perpendicular to the c-axis of the aragonite unitcell, as it was indicated by the X-ray diffraction analysis. Asimilar result was found by Rousseau on the nacrestructure [13].
Another stronger chemical attack of 20min removedmost of the inorganic material and left the organiccompounds almost isolated (in fact, this is the purpose of
the orthophosphoric acid, which is to remove the inorganicmaterial and leave the organic part almost intact) [22].Therefore, the chemical attack was useful to confirm thatthe films were made of protein and other organiccomponents and it was possible to observe their morphol-ogy and topology (Fig. 6b). The film had several holes andlooked like a network, which was extended over all theinter-plate spaces. The transversal view of several organicfilms allowed seeing the parallel arrangement of films andthe empty spaces where the plates were before the chemicalattack (Fig. 6c).The sample preparation for TEM observation is better
described with images (Fig. 7). A small cross-sectionsample of the shell was cut with the FIB equipment. Atthe time of the preparation, the sample was oriented insuch a way that the transversal section of the plates went

ARTICLE IN PRESSR.R. Velazquez-Castillo et al. / Biomaterials 27 (2006) 4508–45174512
vertically in the images obtained (Fig. 7a). First, largerectangular areas were carefully cut by the Ga+ ion beamalong the perpendicular direction to the cross-section ofplates as shown in Fig. 7b. The largest and deepest areas
Fig. 7. FIB-SEM images (a–c) showing the sample preparation process insid
made by Ga ions (b). (d) TEM image of this shell sample.
Fig. 6. SEM images after a severe chemical attacked on (a) a cross-section
of shell revealing the morphology inside the plate, (b) a protein film
developing its morphology, the organic film had a network shape and
some crystals were still attached to it and (c) a cross-section view of shell
revealing the arrangement of several films with no inorganic crystals.
were cut near the upper and bottom parts of the edges.Then smaller and less deep areas were cut until we reachedthe central zone of the sample. A close-up to one of the firstcuttings is shown in Fig. 7c. Note in this figure that thesurface is very irregular with several small step-like
e this equipment. Note the layered arrangement and the rectangular cuts
Fig. 8. TEM images of (a) some plates and their interspacing where the
organic films are, and (b) a higher amplification of a bridge-like structure
and an organic matrix in its left side, both show black dots, which are
aragonite nanocrystals.
ARTICLE IN PRESSR.R. Velazquez-Castillo et al. / Biomaterials 27 (2006) 4508–4517 4513
platforms. At the end, the ion beam of the FIB allowed forobtaining a very thin slice of the shell such that the electron
Fig. 9. TEM images of the organic matrix. (a) Its boundary with a bridge-
like structure, (b) high-resolution image of one of the spots observed in (a)
and (c) higher magnification of the zone observed in (b), where the
interplanar distances of (0 2 0) and (0 2 1) planes of the aragonite can be
observed.
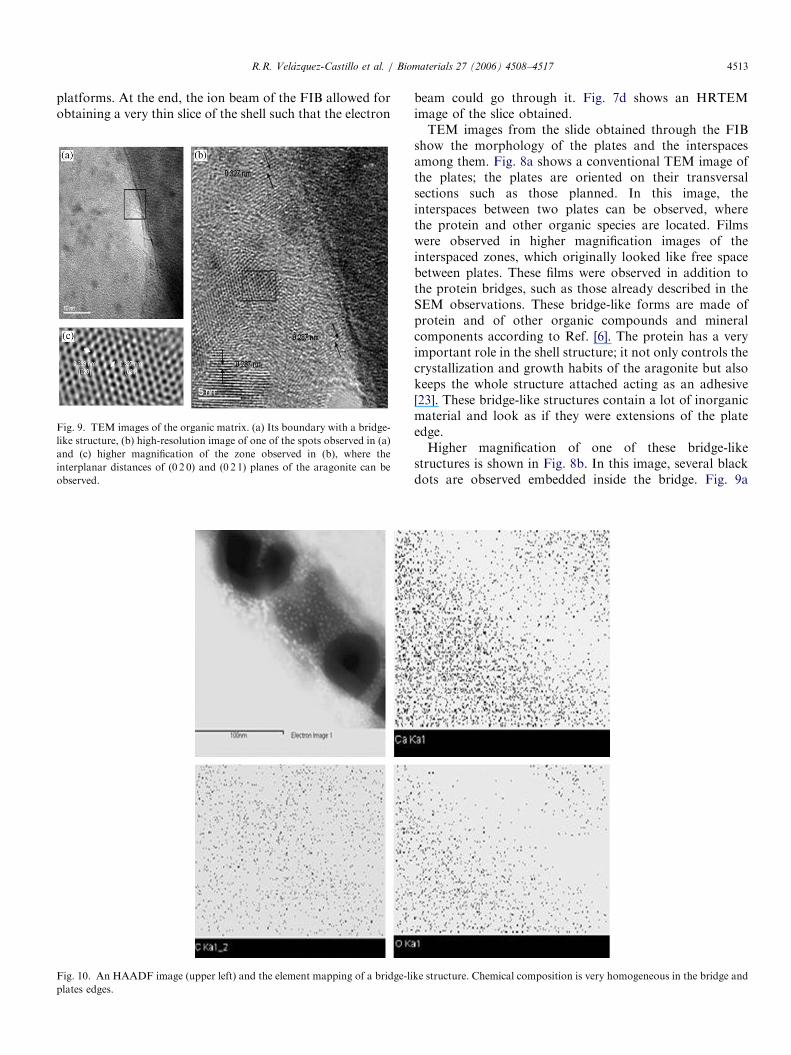
Fig. 10. An HAADF image (upper left) and the element mapping of a bridge-li
plates edges.
beam could go through it. Fig. 7d shows an HRTEMimage of the slice obtained.TEM images from the slide obtained through the FIB
show the morphology of the plates and the interspacesamong them. Fig. 8a shows a conventional TEM image ofthe plates; the plates are oriented on their transversalsections such as those planned. In this image, theinterspaces between two plates can be observed, wherethe protein and other organic species are located. Filmswere observed in higher magnification images of theinterspaced zones, which originally looked like free spacebetween plates. These films were observed in addition tothe protein bridges, such as those already described in theSEM observations. These bridge-like forms are made ofprotein and of other organic compounds and mineralcomponents according to Ref. [6]. The protein has a veryimportant role in the shell structure; it not only controls thecrystallization and growth habits of the aragonite but alsokeeps the whole structure attached acting as an adhesive[23]. These bridge-like structures contain a lot of inorganicmaterial and look as if they were extensions of the plateedge.Higher magnification of one of these bridge-like
structures is shown in Fig. 8b. In this image, several blackdots are observed embedded inside the bridge. Fig. 9a
ke structure. Chemical composition is very homogeneous in the bridge and

ARTICLE IN PRESS
Fig. 11. HAADF images of some plates to observe (a) the homogeneity of
chemical composition in their interspaces and (b) some mineralized bridge-
like structures connecting two plates.
Fig. 12. (a) TEM image of a matrix and a bridge-like structure and electron di
and (d) a plate region near the bridge. The regions analyzed are marked by
orientations from region to region.
R.R. Velazquez-Castillo et al. / Biomaterials 27 (2006) 4508–45174514
shows HRTEM images of this zone. Here it is possible toobserve at the atomic level these dots and the inter-atomicdistances 0.268 and 0.312 nm that correspond to aragonitecrystal structure (Fig. 9b). The black-dotted arrangementshown in Fig. 9c has inter-atomic distances of 0.399 and0.327 nm, which correspond to (0 2 0) and (0 2 1) planes ofthe aragonite crystal structure; therefore, the black dots arearagonite nanocrystals.Fig. 10 shows HAADF images of the inter-plate zone
and also shows X-ray EDS mappings of the bridge-likestructure. EDS images indicate a homogeneous distribu-tion of Ca, C and O elements, and no contaminatingelements were detected. Therefore, the presence of anotherinorganic compound was not determined by the EDSanalysis.The HAADF images of Figs. 10 and 11, and the EDS
mapping allow us to state the homogeneous chemical
ffraction patterns from (b) the organic matrix, (c) the bridge-like structure
their corresponding (b), (c) and (d) squares. Note the different crystal

ARTICLE IN PRESSR.R. Velazquez-Castillo et al. / Biomaterials 27 (2006) 4508–4517 4515
composition in the plates and confirm the presence ofnanometric aragonite crystals embedded on the proteinmaterial of both matrix and the bridges. The concentrationof nanocrystals increased nearer to the edge of plates in anordered way to produce a thin layer as it is seen in Fig. 10,which will be attached to the edge. In addition, in theHAADF image shown in Fig. 11a, it is possible to observethe saw-like contrast on the edges of the plates, whichcould be bridges in formation; these structures were alsoobserved in some SEM images. This figure also showsmany dark rhombic-like and oval dots immersed in theplate. These holes or ‘‘voids’’ are an indication of theelectron beam damage occurring on the plate. Theelectrons dig these voids revealing some specific crystaldirections. Similar type of electron beam damage has beenreported for hydroxyapatite in dental enamel [24]. In Fig.11b, it is possible to see some mineralized bridge-likestructures connecting two plates.
Fig. 13. TEM dark field images of some plates and their interspaces. Som
All these observations give support to the theory ofgrowth through mineral bridges elaborated by Schaffer etal. [25] for abalone and nacre. The matrixes mineralizewhen reached by the growing plates and the bridge-likesstructures mineralize and start the growth of new platessegments; then these segments grow laterally and newbridges can be formed and finally, a new plate is built.A selected area electron diffraction (SAED) pattern from
the matrix layer is shown in Fig. 12b and, as it wasexpected, it is a ringed diffraction pattern that correspondsto a polycrystalline matter. This diffraction pattern wastaken from the area marked by the (b) square in Fig. 12a.These rings correspond to interplanar distances of arago-nite crystal and the indexation indicated that some of themost intense (h k l) rings were missing; for example, therings corresponding to the (1 1 1) and (2 0 0) planes do notappear. All of this is an indication of the preferentialorientations observed in the shells. This SAED pattern also
e bridges are also present. Note that the plates are not single crystals.

ARTICLE IN PRESSR.R. Velazquez-Castillo et al. / Biomaterials 27 (2006) 4508–45174516
supports the fact that aragonite nanocrystals were locatedover and inside the protein films. Fig. 12c shows the SAEDpattern from a bridge-like structure as it is marked by the(c) square in Fig. 12a. It shows not only a ringed diffractionpattern but also a spot pattern. The pattern correspondingto a portion of a plate (Fig. 12d) also shows rings andspots, but the material in that area is more organized andtherefore, the pattern looked similar to that correspondingto a single crystal. This SAED pattern corresponds to[1 1 0] zone axe.
Dark field TEM images also provide us importantinformation on the structure of the shell. Fig. 13 showsfour dark field images of the same portion of the sample.They show that the plates are not single crystals but areformed of many crystals, supporting the result obtainedfrom Fig. 5, where it was indicated that a single layer in thecrosssection of the shell thickness was made of severalplates and each plate was made of single crystal orientedaccording to the preferential crystalline directions.
In order to study the reciprocal space of the aragonitewhich forms the shell, the fine powder sample was alsoobserved with TEM due to the individual powder grainsthat will allow the observation of mono-crystallineSAED patterns and the tilting of the sample. The SAEDpattern from a zone with many grains shows a ringedpattern corresponding to a polycrystalline material as itwas expected and similar to that is shown in Fig. 12b.Figs. 14a and b show SAED patterns from individualgrain. These patterns only show spots and that is indicative
Fig. 14. SAED pattern from some grains of the powder shell sample. In (a) and
Schematic representation (left side) of the reciprocal space unit cell of the ara
of single crystals. The SAED patterns correspond to the[1 0 1] and [0 0 1] zone axes of the aragonite unit cell.From the analysis of all SAED patterns, the reciprocal
space unit cell of the aragonite of the shell was obtained.This is shown in Fig. 14. Here it must be said that thisreciprocal space has the kinematical condition that all the{h 0 0}, {0 k 0} and {0 0 l}, with h, k or l odd, respectively,are forbidden. The observation of these spots in the SAEDpatterns, as shown in Figs. 12d and 14, is produced bydouble diffraction effects.
4. Conclusions
The Nautilus shell is made of calcium carbonate(CaCO3) with the orthorhombic unit cell of the aragonitein a strongly texturized arrangement of plates. The c-axis ofthe aragonite’s unit cell is perpendicular to the shell’ssurfaces and the a-axis is parallel to the lines observed inthe shell’s surface. These plates are stacked one over theother to build the cross-section (thickness) of the shell. Theorganic phase forms a film that keeps the plates togetherand also forms a bridge-like structure between them. Manyaragonite nanocrystals are observed on this matrix. Allthese results give support to the hypothesis made by severalprevious authors that the organic phase guides the crystalgrowth and keeps together the shell structure. Besides, theresults suggest that it is possible that the organic matrixesare the places where the inorganic nanocrystals grow; themineralized bridge-like structures allow the growth of new
(b), small crystals produce a spot pattern, characteristic of a single crystal.
gonite observed in the shell.

ARTICLE IN PRESSR.R. Velazquez-Castillo et al. / Biomaterials 27 (2006) 4508–4517 4517
crystal plates and connect them. Future work will be aimedto confirm or refute the theory just mentioned.
Acknowledgements
We thank Jose Luis Elechiguerra for helpful suggestions,as well as DGAPA-UNAM (RV).
References
[1] Smith BL, Schaffer TE, Viani M, Thompson JB, Frederick NA,
Kindt J, et al. Molecular mechanistic origin of the toughness of
natural adhesives, fibres and composites. Nature 1999;399:761–3.
[2] Belcher AM, Wu XH, Christensen RJ. Control of crystal phase
switching and orientation by soluble mollusk-shell proteins. Nature
1996;381:56–8.
[3] Su X, Belcher AM, Zaremba CM, Morse DE, Stucky GD, Heuer AH.
Structural and microstructural characterization of the growth lines and
prismatic microarquitecture in Red Abalone Shell and the micro-
structures of Abalone ‘‘Flat pearls’’. Chem Mater 2002;14:3106–17.
[4] Zaremba CM, Belcher AM, Fritz M, Li Y, Mann S, Hansma PK,
et al. Critical transitions in the biofabrication of abalone shell and flat
pearls. Chem Mater 1996;8:679–90.
[5] Garcia-Ruiz JM, Rodriguez-Navarro A, Kalin O. Textural analysis
of eggshells. Mater Sci Eng C 1995;3:95–100.
[6] Heredia A, Rodrıguez-Hernandez AG, Lozano LF, Pena-Rico MA,
Velazquez R, Basiuk VA, et al. Microstructure and thermal change of
texture of calcite crystals in Ostrich eggshell Struthio camelus. Mater
Sci Eng C 2005;25:1–9.
[7] Falini G, Albeck S, Weiner S, Addadi L. Control of aragonite or
calcite polymorphism by mollusk shell macromolecules. Science
1996;271:67–9.
[8] Wang J, Xu Y, Zhao Y, Huang Y, Wang D, Jiang L, et al.
Morphology and crystalline characterization of abalone shell and
mimetic mineralization. J Cryst Growth 2003;252:367–71.
[9] Lin A, Meyers MA. Growth and structure in abalone shell. Mater Sci
Eng A 2005;390:27–41.
[10] Tsuno H, Kagi H, Akagi T. Effects of trace Lanthanum ion on the
Stability of vaterite and transformation from vaterite to calcite in an
aquatic system. Br Chem Soc Japan 2001;74:479–86.
[11] Wada K. Crystal growth of molluscan shells. Bull Natl Pearl Res Lab
1961;7:703–828.
[12] Wise SW. Microarquitecture and mode of formation of nacre
(mother of pearl) in Pelecypods, Gastropods and Cephalopods.
Eclogae Geol Helv 1970;63:775–97.
[13] Rousseau M, Lopez E, Stempfle P, Brendle M, Franke L, Guette A,
et al. Multiscale structure of sheet nacre. Biomaterials 2005;26:
6254–62.
[14] Checa AG, Rodrıguez-Navarro AB. Self organisation of nacre
in the shell Pterioida (Bivalvia: Mollusca). Biomaterials 2005;26:
1071–9.
[15] Bevan DJM, Rossmanith E, Mylrea DK, Ness SE, Taylor MR, Cuff
C. On the structure of aragonite-Lawrence Bragg revisited. Acta
Crystallogr B 2002;58:448–56.
[16] Fritz M, Belcher AM, Radmacher M, Walters DA, Hansma PK,
Stucky GD, et al. Flat pearls from biofabrication of organized
composites on inorganic substrates. Nature 1994;371:49–51.
[17] Aizenberg J, Albeck S, Weiner S, Addadi L. Crystal protein
interactions studied by overgrowth of calcite on biogenic skeletal
elements. J Cryst Growth 1994;142:156–64.
[18] Tang Z, Kotov NA, Magonov S, Ozturk B. Nanostructured artificial
nacre. Nat Mater 2003;2:413–8.
[19] Gunnison K, Sarikaya M, Liu J, Aksay IA. Structure–mechanical
property relationship in a biological ceramic-polymer composite:
nacre. Proceedings of MRS Pittsburg USA, MRS 1992;255:171–83.
[20] Towe KM, Hamilton GH. Ultrastructure and inferred calsification of
the mature and developing nacre in bivalve mollusks. Calcif Tissue
Res 1968;1:306–18.
[21] Langford RM, Dale G, Hopkins PJ, Ewen PJS, Petford-Long AK.
Fucused ion beam micromaching of three-dimensional structures and
three-dimensional reconstruction to assess their shape. J Micromech
Microeng 2002;12:111–4.
[22] Wang L, Tang R, Bonstein T, Orme CA, Bush PJ, Nancollas GH. A
new model for nanoscale enamel dissolution. Phys Chem B 2005;
109:999–1005.
[23] Weiss IM, et al. Perlustrin, a Haliotis laevigata (Abalone) nacre
protein, is homologous to the insulin-like growth factor binding
protein N-terminal module of vertebrates. Biochem Biophys Co
2001;285:244–9.
[24] Senger B, Bres EF, Hutchison JL, Voegel JC, Frank RM. Ballistic
damage induced by electron in hydroxyapatite. Philos Mag A
1992;65:665–82.
[25] Schaffer TE, Ionescu-Zanetti C, Proksch R, Fritz M, Walters DA,
Almqvist N, et al. Does Abalone Nacre form by heteroepitaxial
nucleation or by growth minela bridges? Chem Mater 1997;9:
1731–40.