Cross-Border E-Commerce Trends
28
FLOW.IO GLOBAL RESEARCH REPORT Cross-Border E-Commerce Trends
-
Upload
khangminh22 -
Category
Documents
-
view
1 -
download
0
Transcript of Cross-Border E-Commerce Trends
F L O W. I O
G L O B A L R E S E A R C H R E P O R T
Cross-Border E-Commerce Trends
2C R O S S B O R D E R E - C O M M E R C E G L O B A L C O N S U M E R R E P O R T | F L O W. I O
Table of ContentsOverview . . . . . . . . . . . . . . . . . . . . . . . . . . . . . . . . . . . . . . . . . . . . . . . . . . . . . . . . . . . . . 3
Research Methodology . . . . . . . . . . . . . . . . . . . . . . . . . . . . . . . . . . . . . . . . . . . . . . . 4
Cross-Border Shopping . . . . . . . . . . . . . . . . . . . . . . . . . . . . . . . . . . . . . . . . . . . . . . . 5
Who Are Cross-Border Shoppers? . . . . . . . . . . . . . . . . . . . . . . . . . . . . . . . . . . . . 6
Most Popular Countries for Cross-Border Purchases . . . . . . . . . . . . . . . . . 13
What Categories Do Cross-Border Shoppers Buy? . . . . . . . . . . . . . . . . . . . 15
What Are the Barriers to Cross-Border Shopping? . . . . . . . . . . . . . . . . . . . . 17
Do Cross-Border Shoppers Care about Localized Language? . . . . . . . . . 21
Do Cross-Border Shoppers Expect the Same Retail Catalog? . . . . . . . . . 24
How Do Cross-Border Shoppers Prefer to Remit Taxes And Duties? . . . 26
What’s Next? . . . . . . . . . . . . . . . . . . . . . . . . . . . . . . . . . . . . . . . . . . . . . . . . . . . . . . . . 27
3C R O S S B O R D E R E - C O M M E R C E G L O B A L C O N S U M E R R E P O R T | F L O W. I O
Overview The state of e-commerce is rapidly evolving, and it has become increasingly challenging for
retailers to keep pace with technological innovation and consumer expectations. To that end, Flow
commissioned a multi-market research report in order to:
• Understand the current landscape of e-commerce websites from a supply-side and
demand-side perspective for the top 11 markets: Australia, Brazil, China, Canada,
France, Germany, India, Japan, South Korea, UK, USA .*
• Evaluate all aspects of the e-commerce experience to establish “best practices” in
each market .
• Unearth opportunities in high-demand areas that are not currently fulfilled by those
e-commerce sites in respective markets .
*Top websites by traffic based on Similar Web data within the clothing category for 2017
4C R O S S B O R D E R E - C O M M E R C E G L O B A L C O N S U M E R R E P O R T | F L O W. I O
Research MethodologyThe research methodology for this project included two phases:
1. SUPPLY-SIDE: The first phase of the project included crowd-
sourced data collection across 122 variables for 137 websites
in 11 markets (10-15 websites per market). Retail websites
included brand.coms, department stores, and marketplace sites.
The researched variables ranged from Homepage features and
Product Description Page to the Shopping Cart and Checkout.
2. DEMAND-SIDE: This phase included an in-depth survey of
44 questions related to consumer attitudes and behaviors on
e-commerce sites. The sample was defined as ages 18-54 who
had shopped for apparel online in the past year. Each market had
a total of 385 respondents. The data was analyzed and reported a
95% confidence level. Survey questions covered 4 major areas:
• Cross-border shopping behaviors (e .g ., categories, barriers, expectations, etc .)
• General shopping behaviors (e .g ., apparel shopping, promotions used, etc .)
• Customer service and shipping (e .g ., delivery windows, free shipping, out-of-
stock handling, etc .)
• Retail website user experience and checkout preferences (e .g ., product
description page, currency display, payment, navigation, etc .)
This report will explore the demand-side of the research and examine online cross-border
shopping across the top 11 markets. By “cross-border,” we are referring to an online retailer
that is located outside of the shopper’s home country.
5C R O S S B O R D E R E - C O M M E R C E G L O B A L C O N S U M E R R E P O R T | F L O W. I O
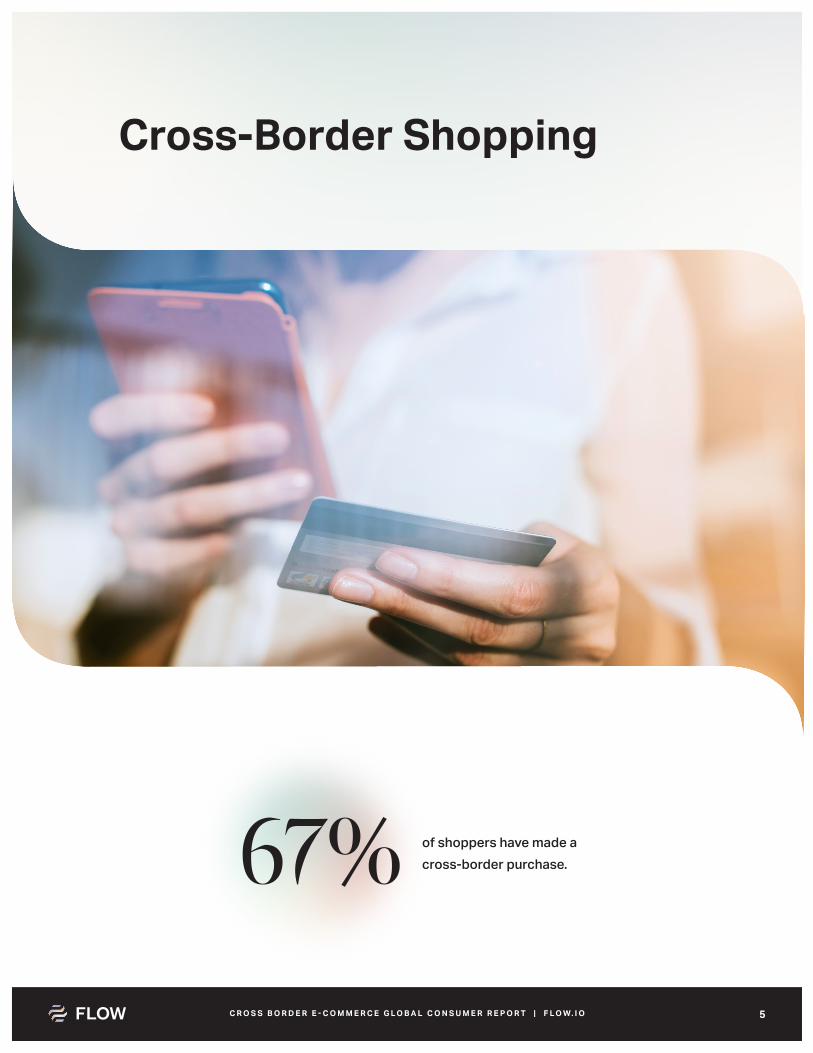
Cross-Border Shopping
67% of shoppers have made a cross-border purchase .
6C R O S S B O R D E R E - C O M M E R C E G L O B A L C O N S U M E R R E P O R T | F L O W. I O
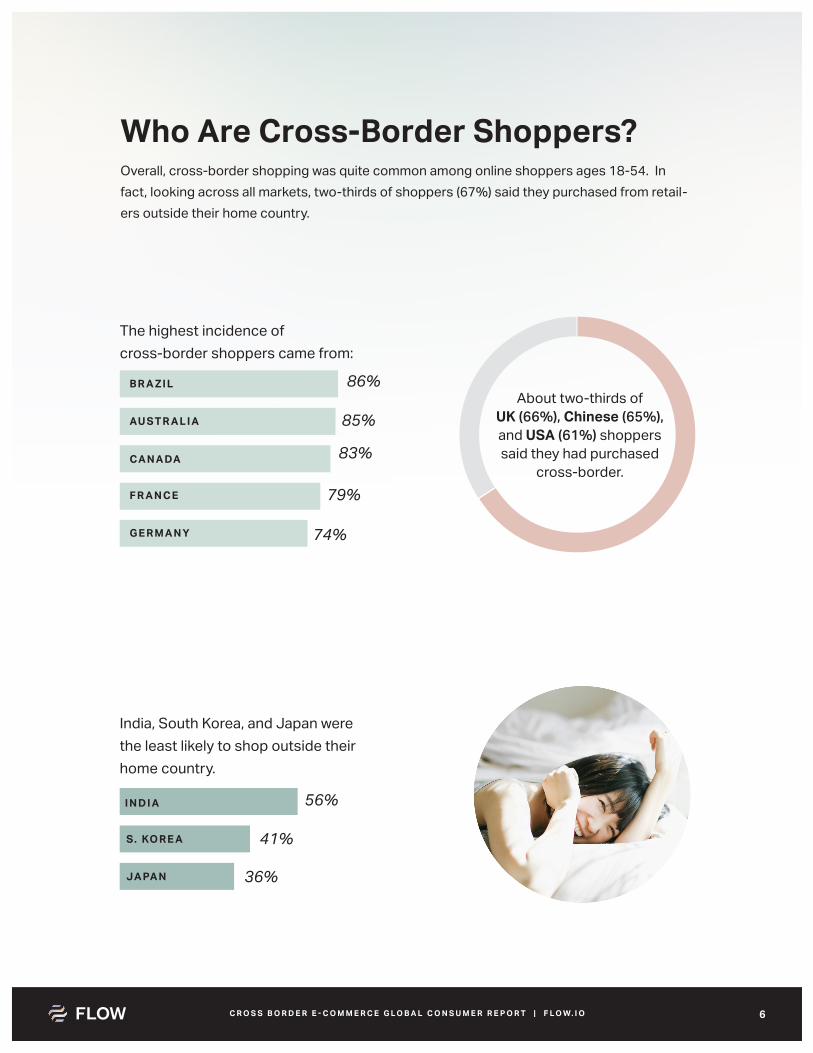
Who Are Cross-Border Shoppers?Overall, cross-border shopping was quite common among online shoppers ages 18-54. In fact, looking across all markets, two-thirds of shoppers (67%) said they purchased from retail-ers outside their home country.
The highest incidence of cross-border shoppers came from:
India, South Korea, and Japan were the least likely to shop outside their home country.
About two-thirds of UK (66%), Chinese (65%), and USA (61%) shoppers said they had purchased
cross-border.
86%
85%
83%
79%
74%
56%
41%
36%
B R A Z I L
CA N A DA
AU ST R A L I A
F R A N C E
G E R M A N Y
I N D I A
S. KO R E A
JA PA N
7C R O S S B O R D E R E - C O M M E R C E G L O B A L C O N S U M E R R E P O R T | F L O W. I O
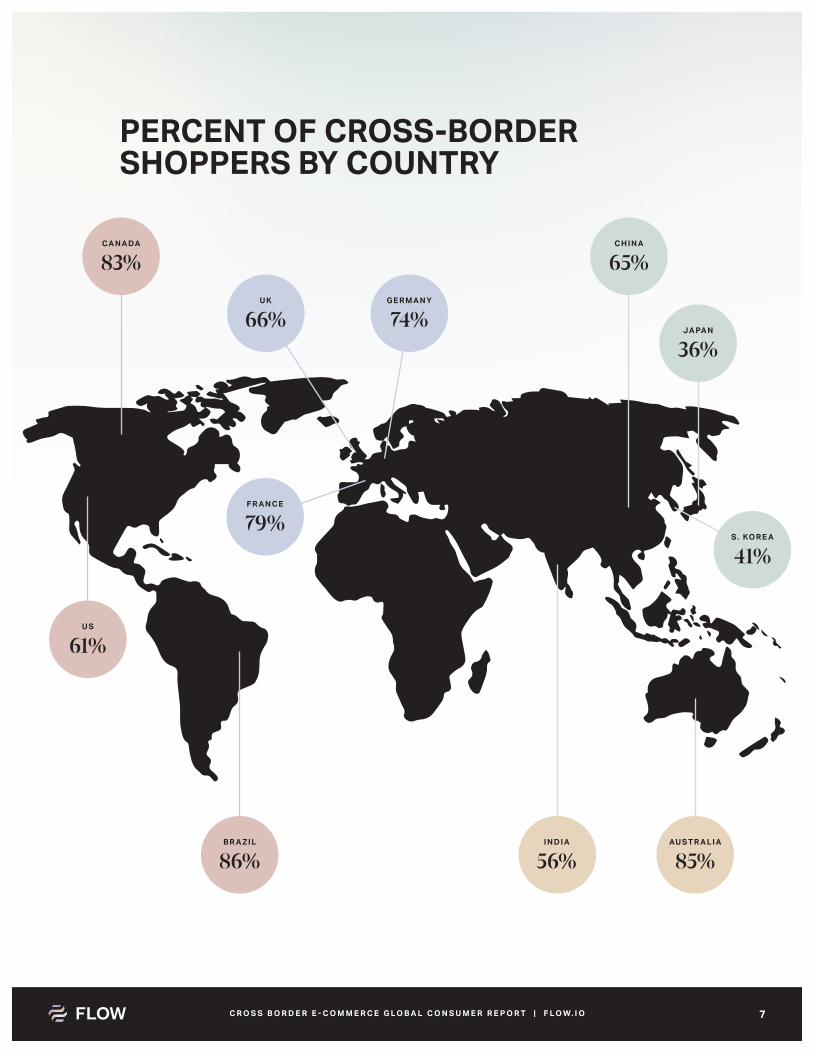
PERCENT OF CROSS-BORDER SHOPPERS BY COUNTRY
CA N A DA
B R A Z I L
U S
83%
86%
61%
U K
66%G E R M A N Y
JA PA N74%
36%
F R A N C E
79%
C H I N A
65%
S. KO R E A
41%
I N D I A AU ST R A L I A
56% 85%
8C R O S S B O R D E R E - C O M M E R C E G L O B A L C O N S U M E R R E P O R T | F L O W. I O
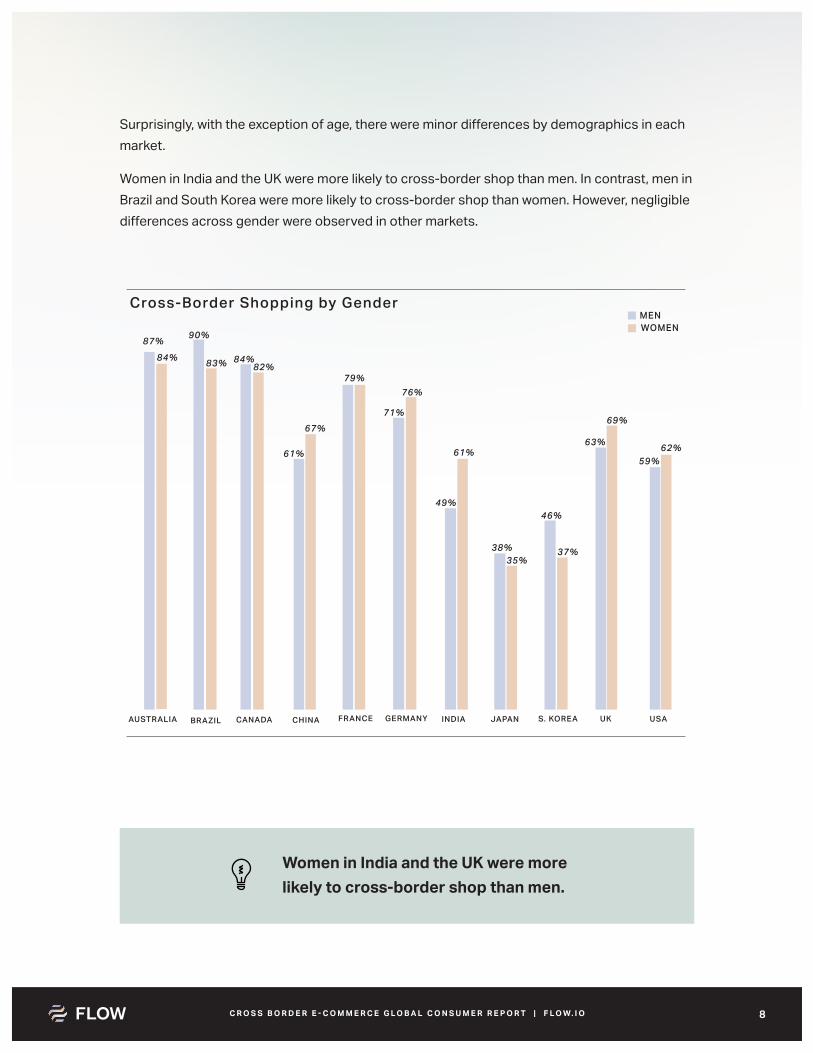
Surprisingly, with the exception of age, there were minor differences by demographics in each market.
Women in India and the UK were more likely to cross-border shop than men. In contrast, men in Brazil and South Korea were more likely to cross-border shop than women. However, negligible differences across gender were observed in other markets.
Cross-Border Shopping by Gender
AUSTRALIA BRAZIL CANADA CHINA FRANCE GERMANY INDIA JAPAN S . KOREA UK USA
90%
83% 84%82%
61%
67%
79%
71%
76%
49%
61%
38%35%
46%
37%
63%
69%
MENWOMEN
59%62%
87%84%
Women in India and the UK were more likely to cross-border shop than men.
9C R O S S B O R D E R E - C O M M E R C E G L O B A L C O N S U M E R R E P O R T | F L O W. I O
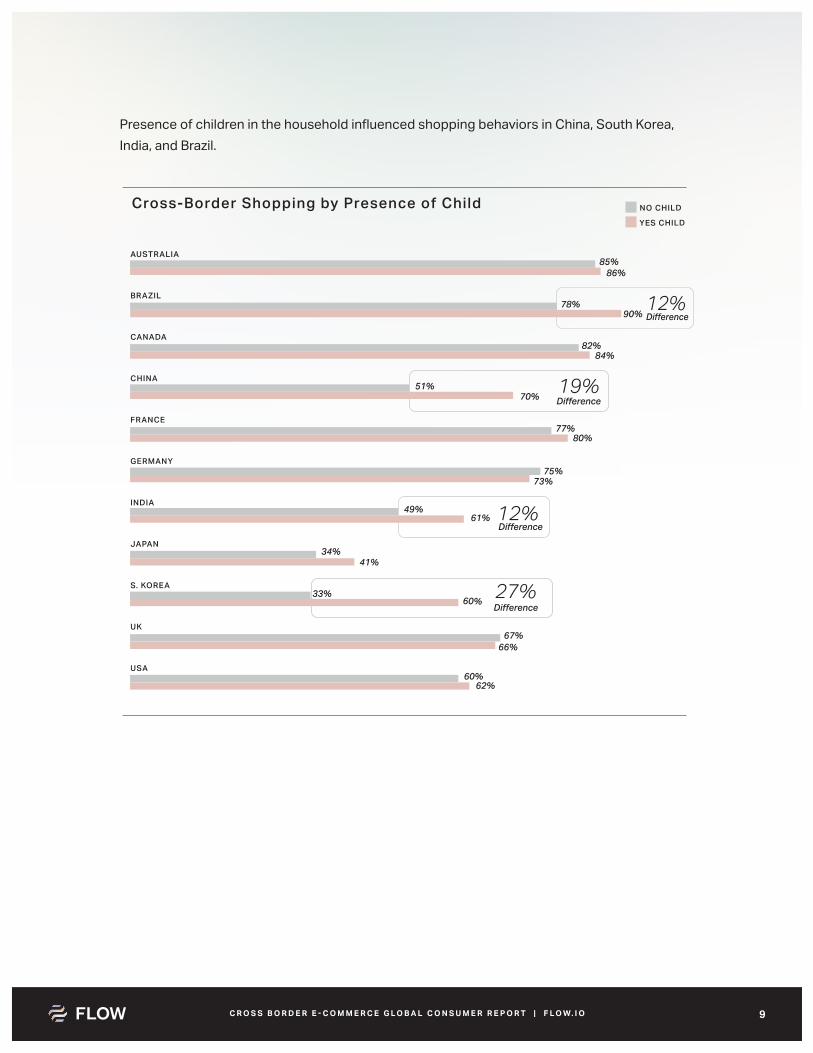
Presence of children in the household influenced shopping behaviors in China, South Korea, India, and Brazil.
NO CHILD
YES CHILD
AUSTRALIA
BRAZIL
CANADA
CHINA
FRANCE
INDIA
JAPAN
S . KOREA
UK
USA
GERMANY
85%86%
78%90%
82%84%
51%70%
77%80%
75%73%
49%
34%41%
33%60%
67%66%
60%62%
61%
27%
12%Difference
Difference
Difference
Difference
12%
19%
Cross-Border Shopping by Presence of Child
1 0C R O S S B O R D E R E - C O M M E R C E G L O B A L C O N S U M E R R E P O R T | F L O W. I O
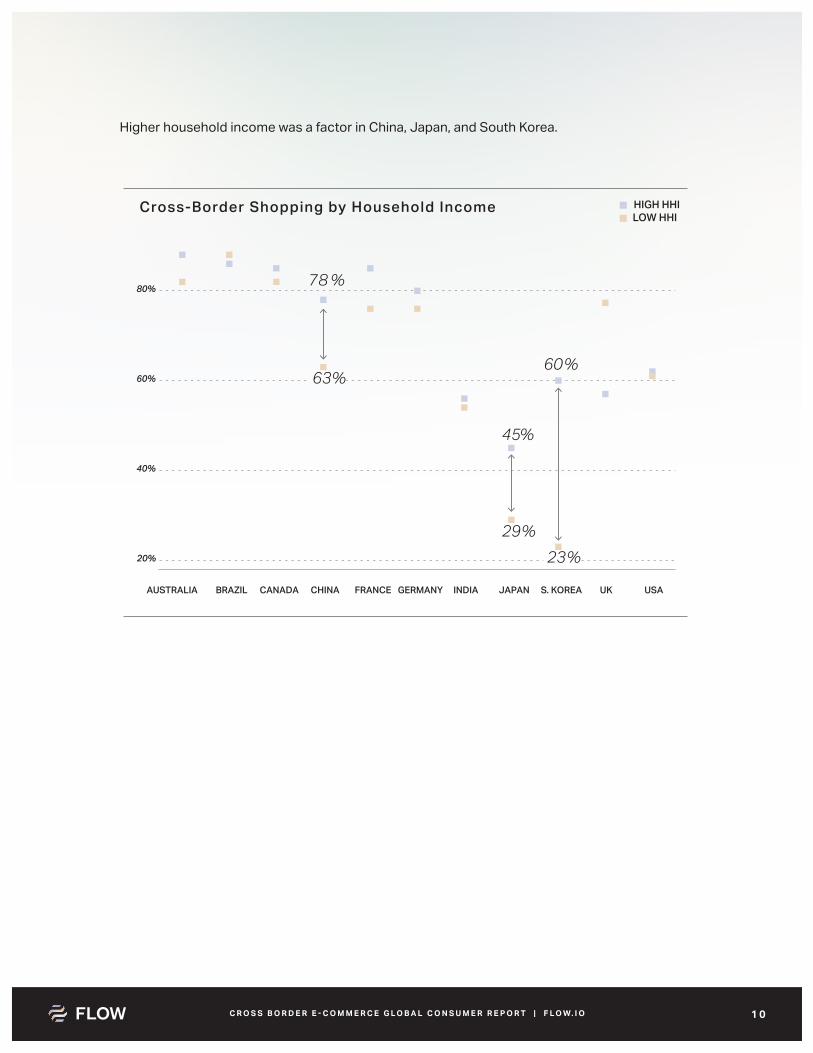
Higher household income was a factor in China, Japan, and South Korea.
87 %
63%
HIGH HHILOW HHI
Cross-Border Shopping by Household Income
20%
40%
60%
80%
USAUKS . KOREAJAPANINDIAGERMANYFRANCECHINACANADABRAZILAUSTRALIA
45%
29%
60%
23%
1 1C R O S S B O R D E R E - C O M M E R C E G L O B A L C O N S U M E R R E P O R T | F L O W. I O
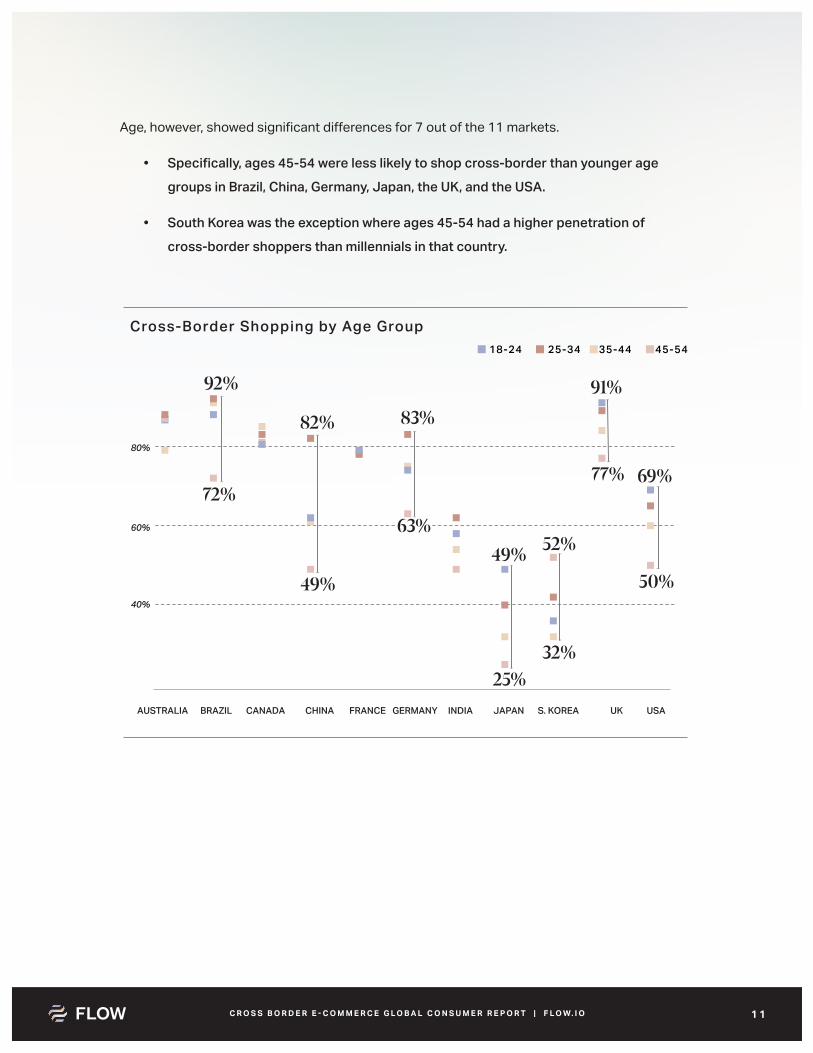
Age, however, showed significant differences for 7 out of the 11 markets.
• Specifically, ages 45-54 were less likely to shop cross-border than younger age
groups in Brazil, China, Germany, Japan, the UK, and the USA .
• South Korea was the exception where ages 45-54 had a higher penetration of
cross-border shoppers than millennials in that country .
Cross-Border Shopping by Age Group
USAUKS . KOREAJAPANINDIAGERMANYFRANCECHINACANADABRAZILAUSTRALIA
18-24 25-34 35-44 45-54
80%
92%
82% 83%
63%49% 52%
25%32%
50%
69%77%
91%
49%
72%
60%
40%
1 2C R O S S B O R D E R E - C O M M E R C E G L O B A L C O N S U M E R R E P O R T | F L O W. I O
Cross-border shopping showed significant differences by
age for 7 out of the 11 markets.
1 3C R O S S B O R D E R E - C O M M E R C E G L O B A L C O N S U M E R R E P O R T | F L O W. I O
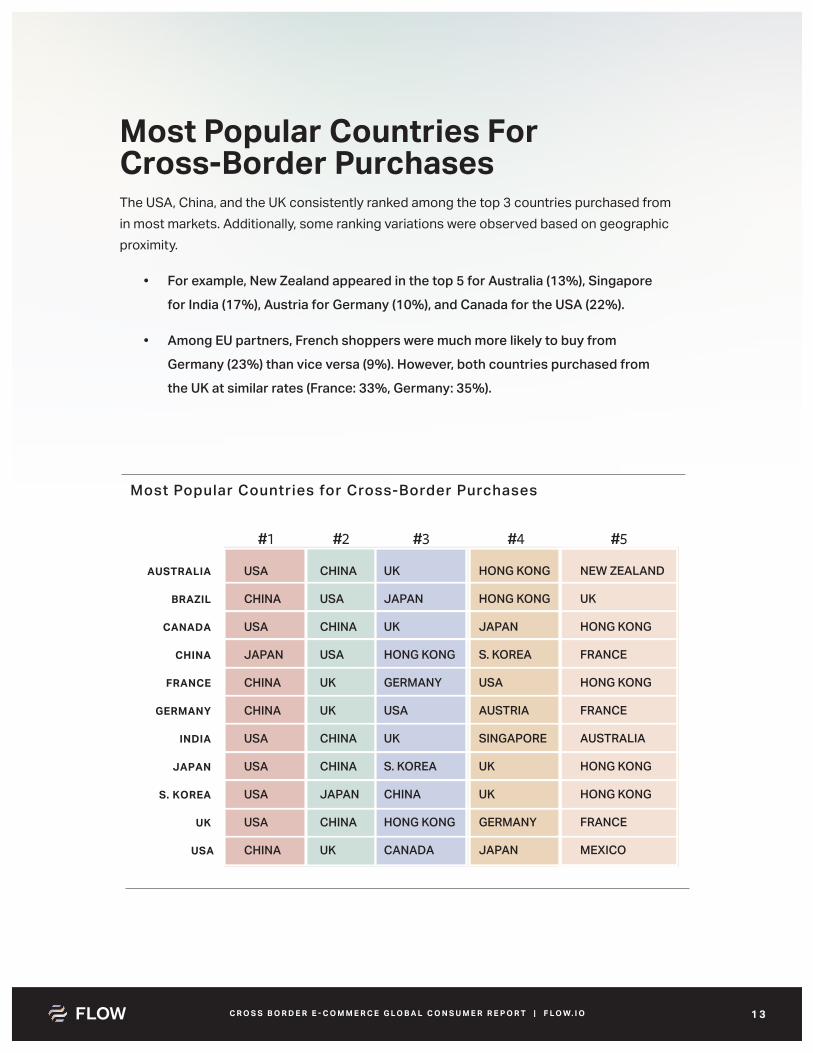
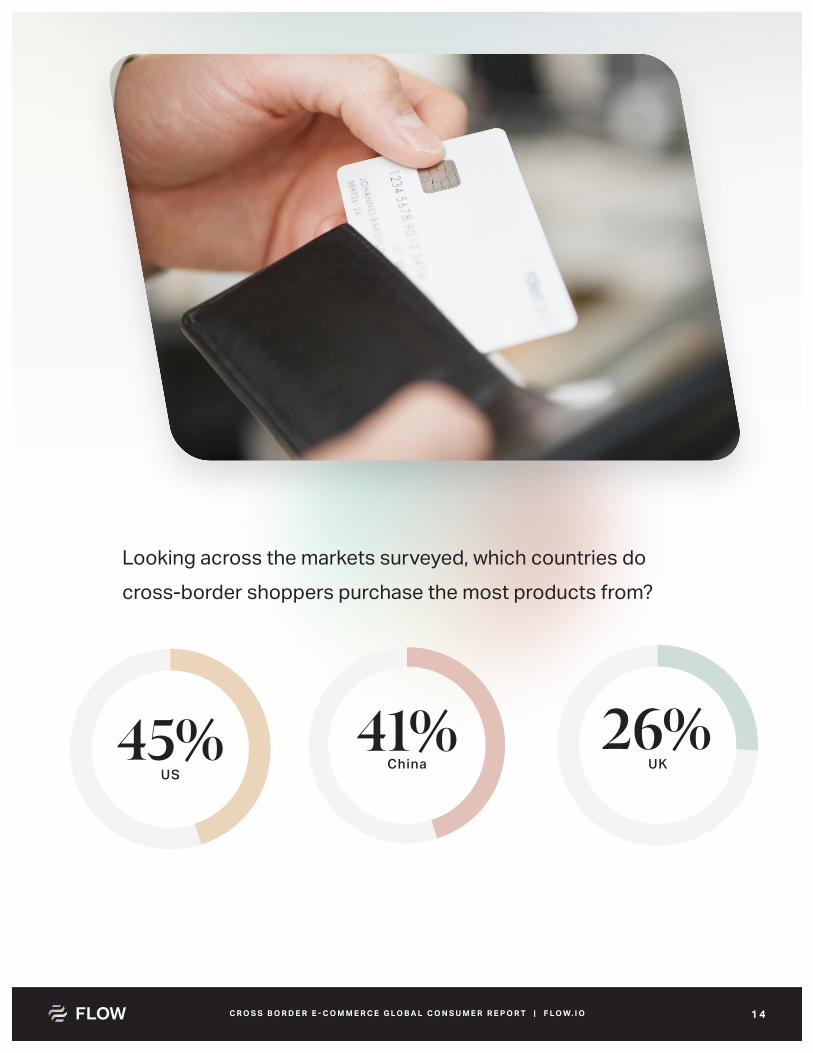
Most Popular Countries For Cross-Border PurchasesThe USA, China, and the UK consistently ranked among the top 3 countries purchased from in most markets. Additionally, some ranking variations were observed based on geographic proximity.
• For example, New Zealand appeared in the top 5 for Australia (13%), Singapore
for India (17%), Austria for Germany (10%), and Canada for the USA (22%) .
• Among EU partners, French shoppers were much more likely to buy from
Germany (23%) than vice versa (9%) . However, both countries purchased from
the UK at similar rates (France: 33%, Germany: 35%) .
AUSTRALIA
BRAZIL
CANADA
CHINA
FRANCE
GERMANY
INDIA
JAPAN
S. KOREA
UK
USA
CHINA
USA
CHINA
USA
UK
UK
CHINA
CHINA
JAPAN
CHINA
UK
UK
JAPAN
UK
HONG KONG
GERMANY
USA
UK
S . KOREA
CHINA
HONG KONG
CANADA
HONG KONG
HONG KONG
JAPAN
S . KOREA
USA
AUSTRIA
SINGAPORE
UK
UK
GERMANY
JAPAN
NEW ZEALAND
UK
HONG KONG
FRANCE
HONG KONG
FRANCE
AUSTRALIA
HONG KONG
HONG KONG
FRANCE
MEXICO
USA
CHINA
USA
JAPAN
CHINA
CHINA
USA
USA
USA
USA
CHINA
# # # # #
Most Popular Countries for Cross-Border Purchases
1 4C R O S S B O R D E R E - C O M M E R C E G L O B A L C O N S U M E R R E P O R T | F L O W. I O
26%UK
Looking across the markets surveyed, which countries do cross-border shoppers purchase the most products from?
45%US
41%China
1 5C R O S S B O R D E R E - C O M M E R C E G L O B A L C O N S U M E R R E P O R T | F L O W. I O
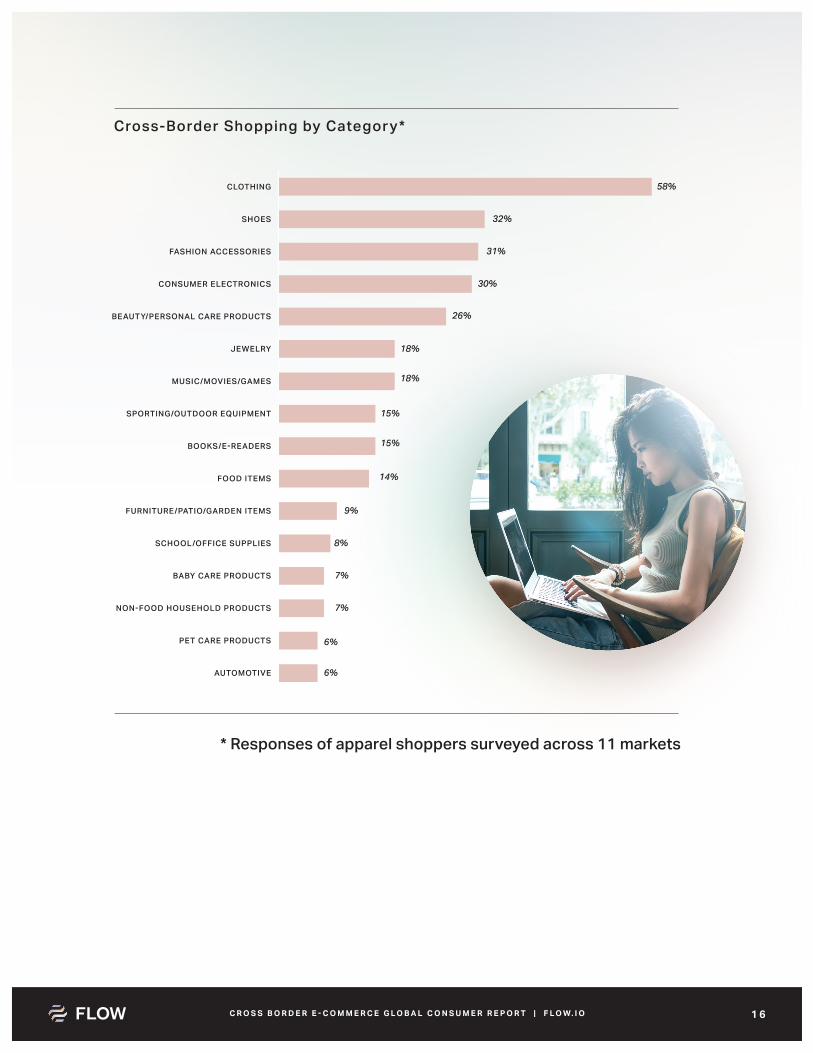
What Categories Do Cross-Border Shoppers Buy?In looking at apparel shoppers, this group was interested in a wide variety of categories when buying cross-border.
The most popular product categories include shoes (32%), fashion accessories (31%), con-sumer electronics (31%), and beauty/personal care (26%). Several cross-border shoppers also mentioned jewelry (18%), music/games (18%), sporting goods (15%), and books/e-readers (15%).
Country specific highlights include:
• Across the 11 markets, Brazilian shoppers over-indexed for almost all
categories, including niche items such as automotive, pet care, and baby care .
• Chinese shoppers were more likely to shop beauty/personal care, sporting
goods, food items, and baby care .
• Indian shoppers were more interested in fashion accessories, consumer
electronics, jewelry, and sporting goods .
• USA over-indexed on jewelry, but they did not over-index on other categories .
• Apparel shopping was most popular among Brazilian and Canadian shoppers .
1 6C R O S S B O R D E R E - C O M M E R C E G L O B A L C O N S U M E R R E P O R T | F L O W. I O
* Responses of apparel shoppers surveyed across 11 markets
Cross-Border Shopping by Category*
AUTOMOTIVE
PET CARE PRODUCTS
NON�FOOD HOUSEHOLD PRODUCTS
BABY CARE PRODUCTS
SCHOOL�OFFICE SUPPLIES
FURNITURE�PATIO�GARDEN ITEMS
FOOD ITEMS
BOOKS�E�READERS
SPORTING�OUTDOOR EQUIPMENT
MUSIC�MOVIES�GAMES
JEWELRY
BEAUTY�PERSONAL CARE PRODUCTS
CONSUMER ELECTRONICS
FASHION ACCESSORIES
SHOES
CLOTHING 58%
32%
31%
30%
26%
18%
18%
15%
15%
14%
9%
8%
7%
7%
6%
6%
1 7C R O S S B O R D E R E - C O M M E R C E G L O B A L C O N S U M E R R E P O R T | F L O W. I O
What Are the Barriers to Cross-Border Shopping?When asked about barriers to cross-border shopping, respondents who had not shopped cross-border cited similar concerns.
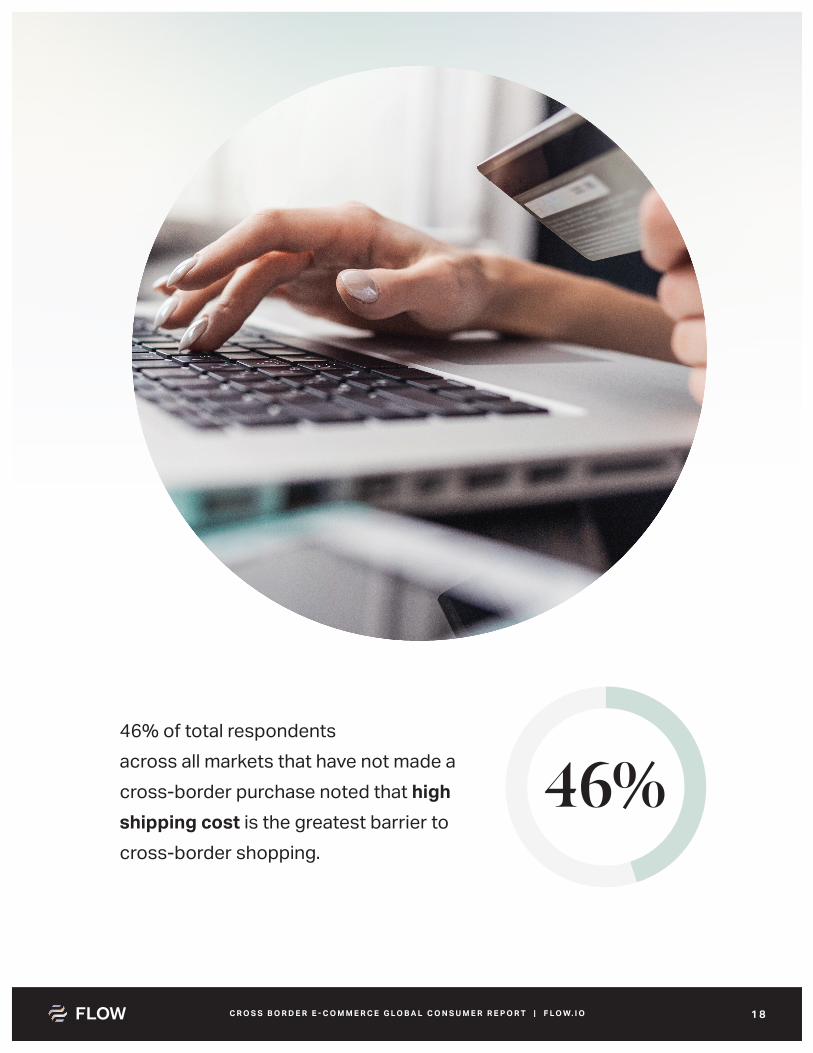
Looking at these non-cross-border shoppers, high shipping costs were the overall biggest concern noted by 46% of total respondents, followed by slow product delivery (38%). The next three most important factors cited include: preference for local retailers (28%), high taxes & du-ties (28%), and concerns over site security (28%).
Almost 1-in-5 respondents were also concerned with the lack of language translation on the site (21%), lack of trust for cross-border retailers (21%), and unclear final tax & duty amounts (20%).
Country specific highlights include:
• In Canada, Brazil, and Australia, where cross-border shopping was highest,
taxes and duties ranked in the top three most common barriers to cross-border
shopping (61%, 33%, and 30%) among those who never shopped outside their
home country .
• Chinese non-cross-border shoppers also cited distinct concerns, such as
inability to find products/brands they are interested in (23%), the acceptance of
preferred payment methods (22%), and ability to talk to customer service (19%) .
• In Japan and South Korea where cross-border shopping was lowest,
respondents noted that a website not in their home language is a key reason for
not shopping cross-border (41% and 36% respectively) .
1 8C R O S S B O R D E R E - C O M M E R C E G L O B A L C O N S U M E R R E P O R T | F L O W. I O
46% of total respondents across all markets that have not made a cross-border purchase noted that high shipping cost is the greatest barrier to cross-border shopping.
46%
1 9C R O S S B O R D E R E - C O M M E R C E G L O B A L C O N S U M E R R E P O R T | F L O W. I O
Similar to non-cross-border shoppers, the high cost of shipping and slow delivery were not-ed by over half of respondents who did purchase outside their home country (54% and 50% respectively). Cross-border shoppers also said that high taxes and duties (36%) and currency exchange rates (28%) made it costly to buy more from other countries.
Meanwhile, “preference for local retailers” and “lack of trust for cross-border retailers” were significantly less important among cross-border shoppers versus non-cross-border shoppers (14% versus 28%; 11% versus 21% respectively).
Cross-border shoppers highlighted different factors as barriers to buying more from other countries:
• When looking across markets, the currency exchange rate was a significant
factor for Canadian (49%) and Australian (45%) shoppers .
• Site security remained an issue for shoppers in France, Japan, and the USA
(32% each) .
• More than 1-in-5 shoppers in India were concerned with local payment options
not being offered (21%).
Site security remained an issue for shoppers in France, Japan, and the USA (32% each).

2 0C R O S S B O R D E R E - C O M M E R C E G L O B A L C O N S U M E R R E P O R T | F L O W. I O
Cross-border shoppersNon-cross-border shoppers
SHIPPING IS TOO EXPENSIVE
I PREFER BUYING FROM LOCAL RETAILERS
TAXES AND DUTIES ARE TOO HIGH
I’M CONCERNED ABOUT SITE SECURITY
CURRENCY EXCHANGE MAKES IT TOO COSTLY
I DO NOT TRUST CROSS�BORDER RETAILERS
THE SITE IS NOT IN MY HOME LANGUAGE
I DON’T UNDERSTAND WHAT THE fiNAL TAX AND DUTY AMOUNT WILL BE
I CAN’T fiND THE PRODUCT�BRAND I AM INTERESTED IN
MY PREFERRED PAYMENT METHODS ARE NOT AVAILABLE
THE RETAILER DOESN’T ACCEPT MY LOCAL CURRENCY
I WANT TO BE ABLE TO TALK TO CUSTOMER SERVICE
DELIVERY OF PRODUCT IS TOO SLOW
Primary Barriers to Cross-Border Shopping
46%54%
38%50%
28%
28%
28%
28%24%
36%
21%
21%
21%
20%22%
11%
11%
10%9%
9%
14%
14%
15%
12%8%
14%
Customer service availability was most important to shoppers in the USA (23%) and India (22%).
2 1C R O S S B O R D E R E - C O M M E R C E G L O B A L C O N S U M E R R E P O R T | F L O W. I O
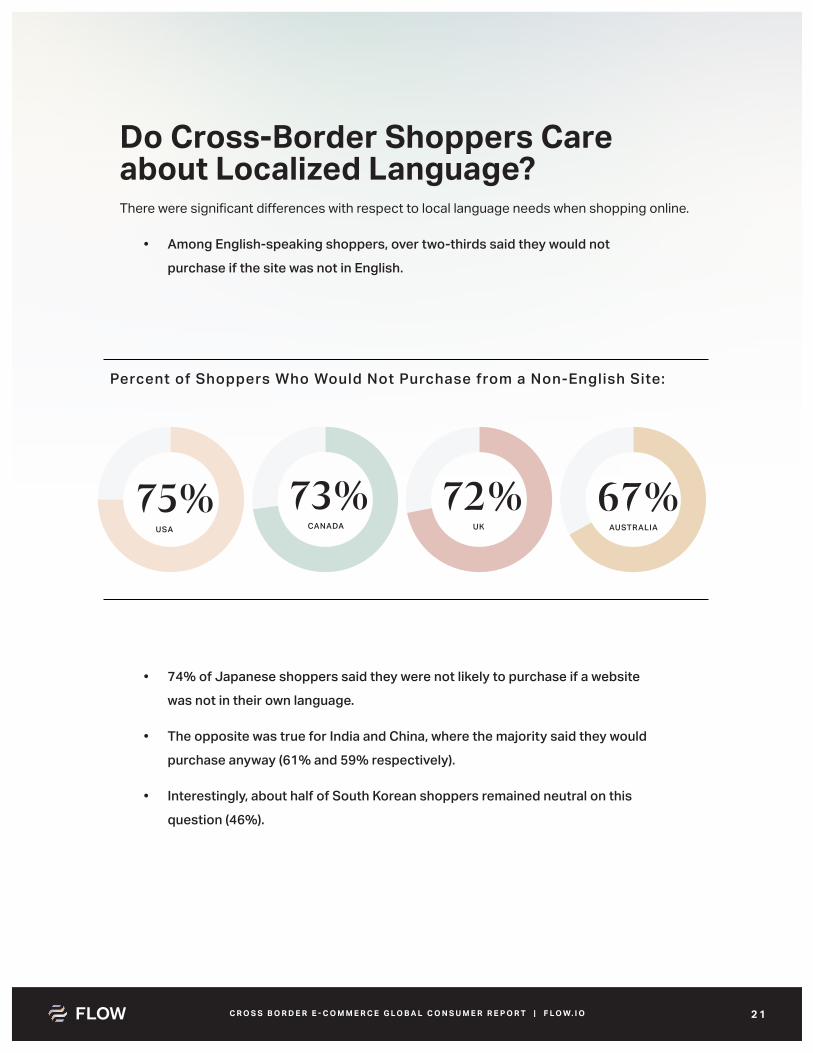
Do Cross-Border Shoppers Care about Localized Language?There were significant differences with respect to local language needs when shopping online.
• Among English-speaking shoppers, over two-thirds said they would not
purchase if the site was not in English .
Percent of Shoppers Who Would Not Purchase from a Non-English Site:
USA
75%CANADA
73%UK
72%AUSTRALIA
67%
• 74% of Japanese shoppers said they were not likely to purchase if a website
was not in their own language .
• The opposite was true for India and China, where the majority said they would
purchase anyway (61% and 59% respectively) .
• Interestingly, about half of South Korean shoppers remained neutral on this
question (46%) .
2 2C R O S S B O R D E R E - C O M M E R C E G L O B A L C O N S U M E R R E P O R T | F L O W. I O
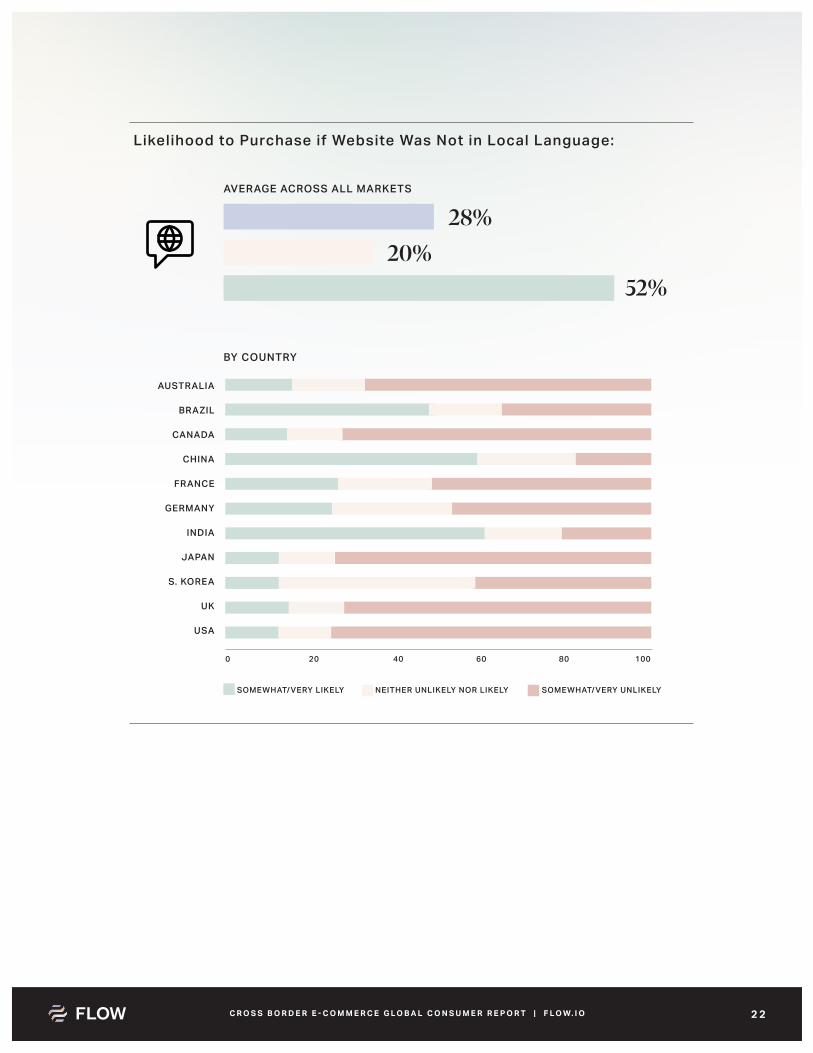
Likelihood to Purchase if Website Was Not in Local Language:
SOMEWHAT�VERY LIKELY
0 20 40 60 80 100
SOMEWHAT�VERY UNLIKELYNEITHER UNLIKELY NOR LIKELY
AVERAGE ACROSS ALL MARKETS
BY COUNTRY
AUSTRALIA
BRAZIL
CANADA
CHINA
FRANCE
GERMANY
INDIA
JAPAN
S. KOREA
UK
USA
28%20%
52%
2 3C R O S S B O R D E R E - C O M M E R C E G L O B A L C O N S U M E R R E P O R T | F L O W. I O
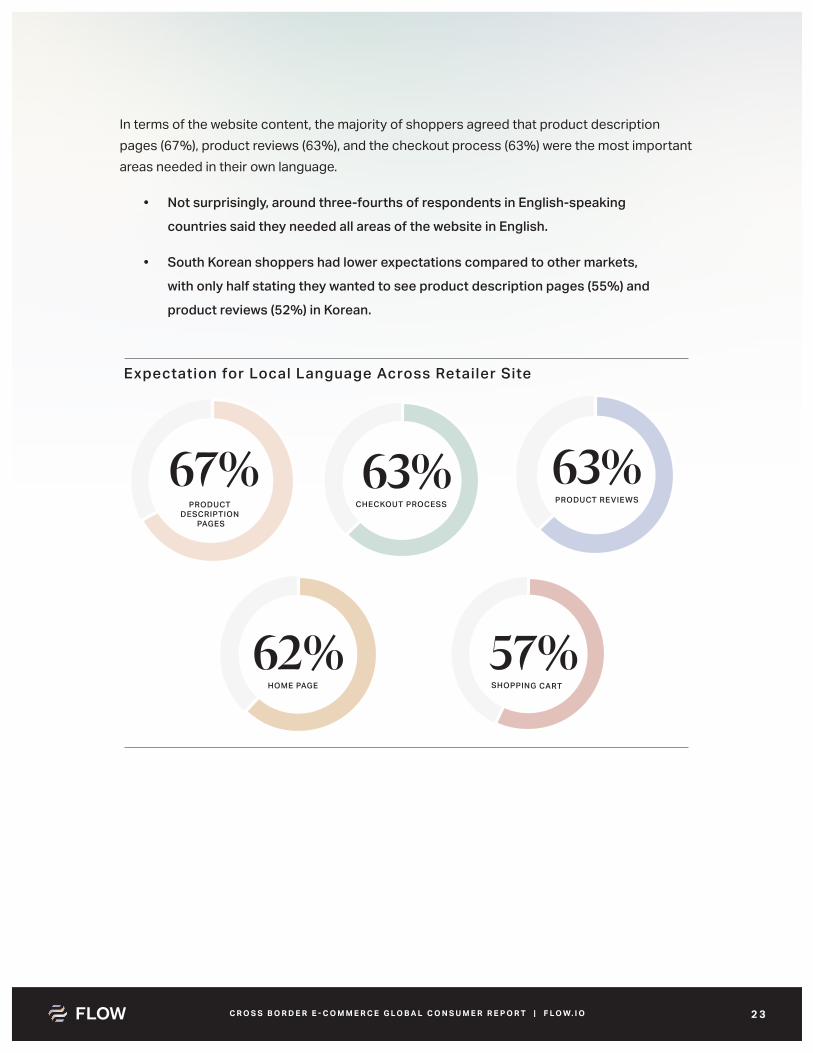
In terms of the website content, the majority of shoppers agreed that product description pages (67%), product reviews (63%), and the checkout process (63%) were the most important areas needed in their own language.
• Not surprisingly, around three-fourths of respondents in English-speaking
countries said they needed all areas of the website in English .
• South Korean shoppers had lower expectations compared to other markets,
with only half stating they wanted to see product description pages (55%) and
product reviews (52%) in Korean .
Expectation for Local Language Across Retailer Site
67% 63% 63%
62% 57%
PRODUCT DESCRIPTION
PAGES
CHECKOUT PROCESS PRODUCT REVIEWS
HOME PAGE SHOPPING CART
2 4C R O S S B O R D E R E - C O M M E R C E G L O B A L C O N S U M E R R E P O R T | F L O W. I O
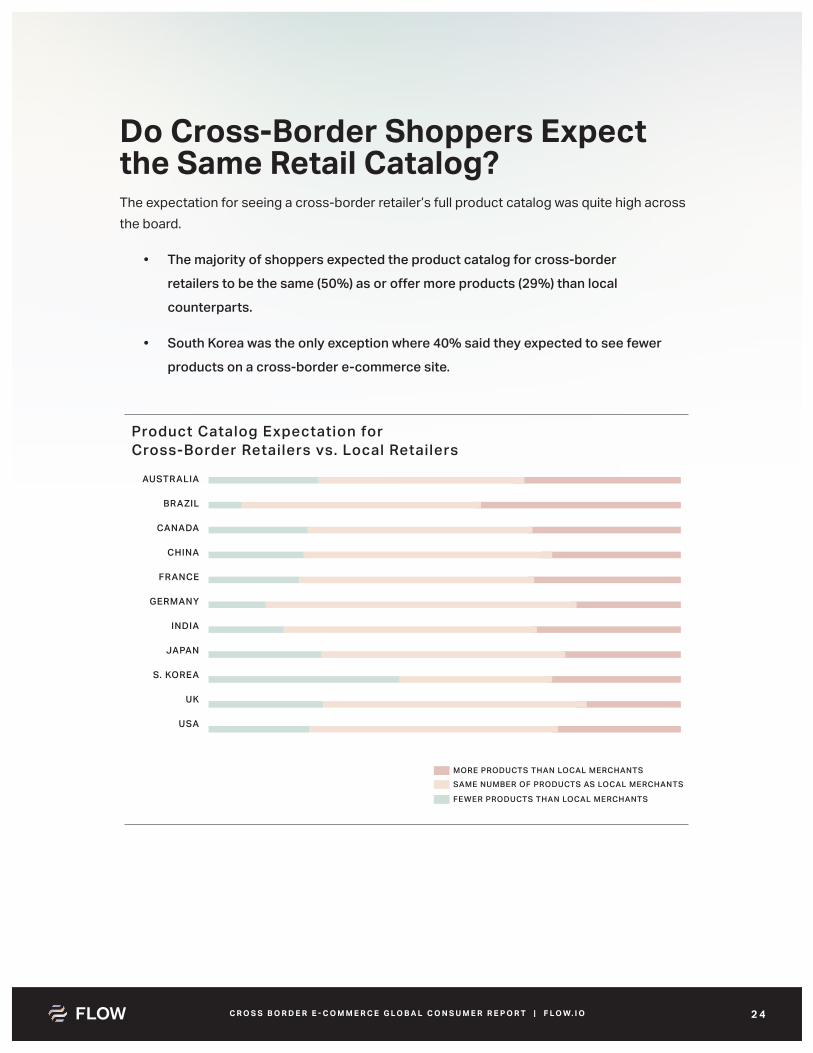
Do Cross-Border Shoppers Expect the Same Retail Catalog?The expectation for seeing a cross-border retailer’s full product catalog was quite high across the board.
• The majority of shoppers expected the product catalog for cross-border
retailers to be the same (50%) as or offer more products (29%) than local
counterparts .
• South Korea was the only exception where 40% said they expected to see fewer
products on a cross-border e-commerce site .
Product Catalog Expectation for Cross-Border Retailers vs . Local Retailers
FEWER PRODUCTS THAN LOCAL MERCHANTS
MORE PRODUCTS THAN LOCAL MERCHANTSSAME NUMBER OF PRODUCTS AS LOCAL MERCHANTS
AUSTRALIA
BRAZIL
CANADA
CHINA
FRANCE
GERMANY
INDIA
JAPAN
S . KOREA
UK
USA
2 5C R O S S B O R D E R E - C O M M E R C E G L O B A L C O N S U M E R R E P O R T | F L O W. I O
Cross-border shoppers expect as many or more products
than local merchants.
2 6C R O S S B O R D E R E - C O M M E R C E G L O B A L C O N S U M E R R E P O R T | F L O W. I O
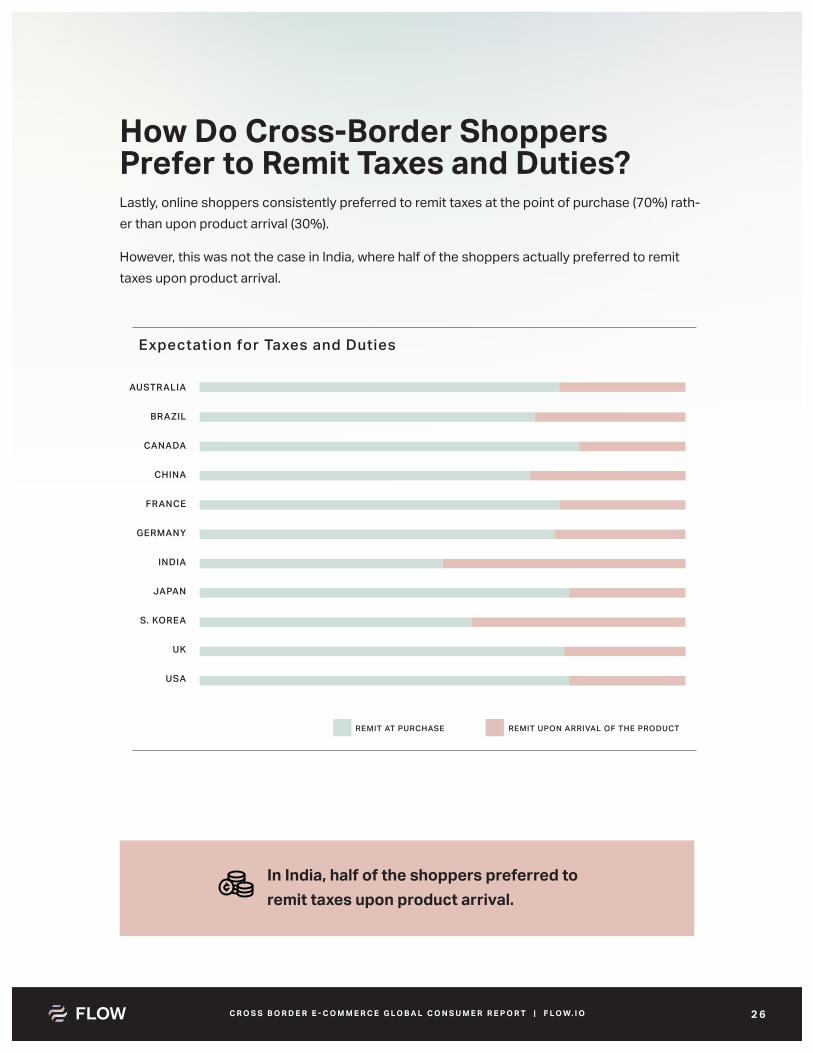
How Do Cross-Border Shoppers Prefer to Remit Taxes and Duties?Lastly, online shoppers consistently preferred to remit taxes at the point of purchase (70%) rath-er than upon product arrival (30%).
However, this was not the case in India, where half of the shoppers actually preferred to remit taxes upon product arrival.
Expectation for Taxes and Duties
REMIT UPON ARRIVAL OF THE PRODUCTREMIT AT PURCHASE
AUSTRALIA
BRAZIL
CANADA
CHINA
FRANCE
GERMANY
INDIA
JAPAN
S . KOREA
UK
USA
In India, half of the shoppers preferred to remit taxes upon product arrival.
2 7C R O S S B O R D E R E - C O M M E R C E G L O B A L C O N S U M E R R E P O R T | F L O W. I O
What’s Next?The results of this study reveal important implications for cross-border retailers. Overall, each market has distinct shopper profiles and concerns that need to be addressed in a localized fashion.
As illustrated in this report, when it comes to selling internationally, there are various factors retailers and brands need to consider including:
• Demographic differences across markets for cross-border shopping
• Most popular countries for cross-border purchases
• Product categories most commonly purchased cross-border
• The barriers preventing customers from cross-border shopping
• Impact of localized language across different markets
• Other specific needs and expectations of customers across different locales
To learn how you can maximize revenue and grow your cross-border e-commerce business, contact us today at [email protected] and speak with a Flow expert.
2 8C R O S S B O R D E R E - C O M M E R C E G L O B A L C O N S U M E R R E P O R T | F L O W. I O
Most e-commerce businesses struggle with the complexities of selling their products internationally. The problem is they don’t have the tools nor the flexibility they need to sell cross-border, and existing solutions are missing the mark. At Flow, we believe there’s a better way and that global e-commerce should simply work. We have first-hand experience with cross-border challenges from our days working at well-known global brands, which is why we built a next-generation engine to power global growth for ambitious e-commerce businesses. Our solution automates and simplifies every aspect of the international e-commerce process for our customers. We remove the barriers of cross-border commerce by offering benefits such as multi-currency pricing, cost-efficient and rapid shipping, international payment options, well-defined taxes and duties, and simple returns. Now global brands like MVMT Watches, MZ Wallace, Outerknown, Charles & Colvard, and others can increase their customer conversion and grow international revenue starting today. Let it Flow.
For more information, visit www.flow.io.
© Flow Commerce Inc. 2019. All rights reserved. The material contained herein may not be
reproduced or distributed, in whole or in part, without the prior written permission of the Flow
Commerce. Any reproduction or distribution, in whatever form and by whatever media, is
expressly prohibited without the prior written consent of the Flow Commerce. Please contact
[email protected] for further information.