CRisk FF JFQA
82
Religion and Stock Price Crash Risk Jeffrey L. Callen Joseph L. Rotman Professor of Accounting Rotman School of Management University of Toronto 105 St. George St., Toronto, Ontario, Canada M5S 3E6 Email: [email protected] Xiaohua Fang Assistant Professor J. Mack Robinson College of Business Georgia State University 35 Broad Street, Atlanta, GA USA 30303 Email: [email protected] Tel. : +1 404 413 7235 March 2013 We are grateful to the anonymous reviewer of this Journal and Paul Malatesta (the Editor) for constructive comments. We thank Larry
Transcript of CRisk FF JFQA

Religion and Stock Price Crash Risk
Jeffrey L. Callen
Joseph L. Rotman Professor of Accounting
Rotman School of Management
University of Toronto
105 St. George St., Toronto, Ontario, Canada M5S 3E6
Email: [email protected]
Xiaohua Fang
Assistant Professor
J. Mack Robinson College of Business
Georgia State University
35 Broad Street, Atlanta, GA USA 30303
Email: [email protected]
Tel. : +1 404 413 7235
March 2013
We are grateful to the anonymous reviewer of this Journal and Paul
Malatesta (the Editor) for constructive comments. We thank Larry

Brown, Siu Kai Choy, Kelly Huang, Baohua Xin, and Yi Zhao for helpful
insights. Comments from other colleagues at University of Toronto and
Georgia State University are also appreciated. We are also thankful to
Patty Dechow and Alastair Lawrence for expediting access to the
Berkeley AAER database. Xiaohua Fang acknowledges financial support
for this research from Georgia State University.
Religion and Stock Price Crash Risk
Abstract
This study examines whether religiosity at the county level
is associated with future stock price crash risk. We find robust
evidence that firms headquartered in counties with higher levels
of religiosity exhibit lower levels of future stock price crash
risk. This finding is consistent with the view that religion, as
a set of social norms, helps to curb bad news hoarding activities
by managers. Our evidence further shows that the negative
relation between religiosity and future crash risk is stronger
2

for riskier firms and for firms with weaker governance mechanisms
measured by shareholder takeover rights and dedicated
institutional ownership.
JEL Classification: G12; G34; Z12
Keywords: religion, crash risk, external monitoring, risk-taking
3

I. Introduction
The economics of religion has been viewed traditionally
either through the prism of economic development or individual
decision-making (e.g., Smith (1776), Weber (1905), Barro and
McCleary (2003), and Guiso, Sapienza, and Zingales (2003)). The
latter perspective is encapsulated in Barro and McCleary’s (2003)
view that religion influences economic outcomes mostly by
fostering religious beliefs that affect personality traits such
as honesty and work ethics. But, their view ignores an additional
and arguably more important motivational feature of religion: the
impact of social norms on economic behavior. Major religions
uniformly condemn manipulation of one’s fellow man (e.g., Ali
(1983), Mawdudi (1989), Friedman (2002), Rai (2005), and Kim,
Fisher, and McCalman (2009)). We conjecture that the anti-
manipulative ethos of religion forms a powerful social norm
against withholding bad news from investors. If our conjecture is
correct then religion should mitigate the incidence of stock
price crash risk, a consequence of bad news hoarding.
The social norm perspective of religion operates in three
ways to reduce bad news hoarding. First, consistent with the view
4

of Barro and McCleary (2003), religious managers are more likely
to internalize the social norms associated with anti-manipulation
and so are less likely to manipulate the flow of corporate
information. Second, even if their religiosity is only “skin
deep”, managers pay a potentially high price in terms of social
stigma if they are caught violating social norms by manipulating
the flow of corporate information, especially if they are
employed in a more religious environment. Third, a religious
milieu fosters potential whistle blowers who have internalized
religious social norms and feel religion-bound to unmask
manipulators (Javers (2011)). Thus, social norms generated by the
religious ethos against manipulation, bolstered by religious
adherents in the firm acting as potential whistle blowers,
operate in tandem as a potentially powerful deterrent against
managers manipulating the flow of corporate information by
withholding bad news. Even if managers are tempted to withhold
bad news for personal gain, say because their compensation is
tied to earnings and the bad news affects earnings, they are
likely to trade-off the gain from additional compensation against
the cost of social stigma should the manipulation become public
5

knowledge. The potential social stigma costs mitigate against
withholding bad news regarding earnings, especially if the
expected marginal social stigma costs exceed the expected
marginal compensation benefits.
A series of recent academic studies argues that bad news
hoarding brings about future stock price crash risk. These
studies maintain that managers withhold bad news from investors
because of career and short-term compensation concerns and that
when a sufficiently long-run of bad news accumulates and reaches
a critical threshold level, managers tend to give up. At that
point, all of the negative firm-specific shocks become public at
once leading to a crash—a large negative outlier in the
distribution of returns (Jin and Myers (2006), Kothari, Shu, and
Wysocki (2009), and Hutton, Marcus, and Tehranian (2009)).
Empirical evidence supports the bad news hoarding theory of stock
price crash risk by showing that financial opacity, tax avoidance
and CFO’s equity incentives act to increase future crash risk
(Jin and Myers (2006), Hutton, Marcus, and Tehranian (2009), and
Kim, Li, and Zhang (2011a), (2011b)). Thus, based on the
arguments that bad news hoarding creates stock price crash risk
6

and that the social norms engendered by religion exert a
disciplinary effect on managerial manipulative behavior, leads us
to hypothesize that a more religious business environment reduces
managerial bad news hoarding activities and decreases future
stock price crash risk.
This study examines the empirical link between religion and
future stock price crash risk with reference to U.S. firms
headquartered in counties with different levels of religiosity.
Consistent with the view that religion, as a set of social norms,
effectively curbs bad news hoarding, we find robust empirical
evidence that firms headquartered in counties with higher levels
of religiosity exhibit significantly lower levels of future stock
price crash risk. We further explore whether this negative
relation varies with the protection of shareholder takeover
rights, the monitoring of dedicated institutions, and firm risk.
These additional analyses are motivated by extant studies on the
influence of organizational context on the impact of religion.
Tittle and Welch (1983) and Weaver and Agle (2002) indicate that
weak organizational norms and authorities both enhance the
salience of religion in an organization and make religiously
7

influenced behavior easier to put into effect. Grullon, Kanatas,
and Weston (2010) and McGuire, Omer, and Sharp (2012) provide
empirical evidence implying that the impact of religion on
investor welfare is contingent on the strength of a firm’s
governance mechanism. We find that the observed negative relation
between the degree of county-level religiosity and future crash
risk is more salient for firms with weaker shareholder takeover
rights, firms with lower ownership by dedicated institutions and
riskier firms. These findings enrich our understanding of the
influence of religion on future stock price crash risk, and shed
light on how social norms interact with corporate monitoring
mechanisms to reduce agency costs.
Our study contributes to the literature in several ways.
First, to our knowledge, this is the first study to assess the
relation between religion and future crash risk. By focusing on a
unique perspective—higher moments of the stock return
distribution (i.e., extreme negative returns) —this study
provides new evidence concerning the economic consequences of
religion. In particular, our findings identify significant
benefits that religion brings to firms and their shareholders.
8

Xing, Zhang, and Zhao (2010) and Yan (2011) suggest that extreme
outcomes in the equity market have a material impact on the
welfare of investors and that investors are concerned about the
occurrence of these extreme outcomes. Thus, our empirical
evidence is useful for understanding the role that religion plays
in influencing both corporate behavior and investor welfare.
Second, we extend the literature on corporate governance by
showing that the inverse relation between religiosity and stock
price crash risk is stronger (more negative) for firms with
weaker corporate governance mechanisms. Reinforcing the
governance perspective of religion, our results suggest that
religious social norms serve as substitutes for conventional
governance mechanisms in monitoring the flow of corporate
information when corporate governance mechanisms are weak.
Third, this study extends research on the bad news hoarding
theory of stock price crash risk. In particular, the implication
of religion for future crash risk yields valuable insights into
the behavioral-sociological nature of managerial manipulation of
information. Recent studies on crash risk suggest that managerial
bad new hoarding activities are related to corporate financial
9

opacity, tax avoidance and CFO’s equity incentives. However, it
is not clear what role manager’s personality traits and/or social
norms play in influencing her behavior to conceal bad news. Our
study helps to fill this gap in the literature by providing
evidence on a negative relation between religiosity and crash
risk and, implying as a consequence that religion has a
disincentive effect on managerial bad news hoarding activities.
Finally, this study provides investors with a preliminary
analysis of how the local social/religious business environment
affects firm behavior, which may help them to predict and eschew
future stock price crash in their portfolio investment decisions.
The paper proceeds as follows. Section 2 reviews prior
literature on religion in corporate decision making and further
develop our hypotheses. Section 3 describes the sample, variable
measurement, and research design. Empirical results are presented
in Section 4. Section 5 concludes.
II. Literature Review and Hypotheses Development
Psychology research indicates that an individual’s
religiosity often has a positive and constructive impact on
10

personality, cognition, attitude and behavior both in non-
business and business contexts (see Miller and Hoffmann (1995),
Khavari and Harmon (1982), Maltby (1999), Smith (2003), Waite and
Lehrer (2003), and Lehrer (2004), among others). Cunningham
(1988), Turner (1997), and Calkins (2000) argue that business
ethics have a religious tradition and illustrate how religious
perspectives serve as a teaching tool in addressing ethical
behavior. Kennedy and Lawton (1998) and Agle and Van Buren (1999)
among others show connections between individual religiosity and
business ethics such as attitudes toward corporate social
responsibility. Overall, psychology and ethics research maintains
that individuals with stronger religious beliefs are: (i) more
likely to exhibit self-regulation and self-control, (ii) more
likely to have ethical intentions, and (iii) are less likely to
accept morally questionable decisions in a business environment
(Longenecker, McKinney, and Moore (2004), McCullough and
Willoughby (2009), and Vitell (2009)).1 Organizational behavior
1 Admittedly, the evidence in the literature is not unanimous. For instance, Smith,
Wheeler, and Diener (1975) and Hood, Spilka, Hunsberger, and Gorsuch (1996) find no
difference between religious and nonreligious persons regarding dishonesty or
cheating. The mixed results could reflect a number of issues including the
11

research provides theoretical justifications for the conjecture
that religion induces social norms that foster sound moral
judgement and ethical behavior in organizations (Weaver and Agle
(2002)).
Economics and business research are supportive of the social norm
perspective of religion. Economic studies show for the most part
that religiosity reduces criminal activity (see the surveys by
Torgler (2006), Akers (2010), and Johnson and Jang (2010)).
Recent empirical business research examines the role of religion
in corporate decision-making. Most of the findings suggest that
religiosity constrains manipulative, and even illegal, managerial
behavior in firms.2 Grullon, Kanatas and Weston (2010) find that
firms located in counties with higher levels of religiosity are
less likely to be targets of class action securities lawsuits,
engage in backdating options, grant excessive compensation
packages to their managers and practise aggressive earningsgeneralizability of student samples, the social desirability biases induced by self-
reported attitudinal measures of ethics, and the use of varying definitions of
religiosity (Weaver and Agle (2002)).
2 In a different vein, Hilary and Hui (2009) argue that community religion is
associated with risk aversion at the individual level (Miller and Hoffmann (1995),
Diaz (2000), and Osoba (2003)) and this is reflected in corporate culture and
12

management.3McGuire, Omer and Sharp (2012) provide evidence that
firms headquartered in areas with stronger religious social norms
display fewer financial reporting irregularities as measured by
accounting risk, shareholder lawsuits, and accounting
restatements. They also find a negative association between
religiosity and accruals manipulation. Similarly, Dyreng, Mayew
and Williams (2012) find that firms in counties with higher
levels of religiosity are less likely to meet or beat analyst
earnings forecasts, engage in fraudulent accounting practices,
restate financial reports, and exhibit low accruals quality. The
latter two studies conclude that religious social norms mitigate
managerial manipulative behavior in corporate financial reporting
decisions.
This paper extends prior research by examining the relation
between religion and future stock price crash risk which is based
on the idea that managers withhold bad news as long as possiblebehavior. They find that firms headquartered in U.S. counties with higher levels of
religiosity are associated with higher degrees of risk aversion in investment
decision-making.
3 Again, the evidence is not unanimous. In a small sample cross-country study, Callen,
Morel, and Richardson (2011) fail to find a relation between religiosity and earnings
management.
13

(that is, bad news hoarding) from investors because of career and
short-term compensation concerns.4 Consistent with this idea,
Graham, Harvey, and Rajgopal’s (2005) survey finds that managers
with bad news tend to delay disclosure more than those with good
news. Focusing on dividend changes and management earnings
forecasts, Kothari, Shu, and Wysocki (2009) provide empirical
evidence consistent with the view that managers, on average,
delay the release of bad news to investors.
Anecdotal evidence during the past two decades also
highlights the issue of bad news hoarding in public firms. Enron
set up off-balance-sheet Special Purpose Vehicles to hide assets that
4 Basu (1997) claims that managers often possess valuable inside information about firm
operations and asset values, and that if their compensation is linked to earnings
performance, then they are inclined to hide any information that will negatively
affect earnings and, hence, their compensation. Ball (2009) argues that empire
building and maintaining the esteem of one’s peers motivate managers to conceal bad
news. Kothari, Shu, and Wysocki (2009) contend that managers will leak or reveal good
news immediately to investors but they will act strategically with bad news by
considering the costs and benefits of disclosing bad news, e.g., litigation risk,
career concern, compensation plan, and other considerations. Kim, Li, and Zhang
(2011b) maintain that the linking of compensation to equity incentives (e.g., stock
holdings and option holdings) induces managers to hide poor performance from investors
in order to maintain equity prices.
14

were losing money until accumulated losses were no longer
sustainable. (Report of Investigation by the Special Investigative Committee of the
Board of Directors of Enron Corp., February 2002). Similarly, WorldCom
used fraudulent accounting methods to mask a declining earnings
trend until the accounting data were no longer deemed realistic.
(Report of Investigation by the Special Investigative Committee of the Board of
Directors of WorldCom Inc., March 2003). New Century failed to disclose
dramatic increases in early default rates, loan repurchases and
pending loan repurchase requests until this was no longer
sustainable with the collapse of the subprime mortgage business
(Schapiro, M. L. Testimony Concerning the State of the Financial
Crisis before the Financial Crisis Inquiry Commission. 2010,
SEC).
Longenecker, McKinney, and Moore (2004)’s survey also
suggests that the influence of religiosity on business judgement
extends to bad news hoarding. They conduct a questionnaire survey
of 1,234 business managers and professionals in the United
States. Respondents were asked to evaluate the moral issues
inherent in 16 business scenarios, three of which relate to bad
15

news hoarding.5 The authors find that respondents who indicate
that religion is of high or moderate importance to them
demonstrate a significantly higher level of moral judgement
regarding these three scenarios than do other respondents.6
Jin and Myers (2006) provide a theoretical analysis linking
bad news hoarding to stock price crash risk. They maintain that
managers control the disclosure of information about the firm to
the public, and that a threshold level exists at which managers
will stop withholding bad news. They argue that lack of full
transparency concerning managers’ investment and operating
decisions and firm performance allows managers to capture a
portion of cash flows in ways not perceived by outside investors.
Managers are willing to personally absorb limited downside risk
5 These three scenarios are: 1) because of pressure from his brokerage firm, a
stockbroker recommended a type of bond which he did not consider a good investment; 2)
an engineer discovered what he perceived to be a product design flaw which constituted
a safety hazard. His company declined to correct the flaw. The engineer decided to
keep quiet, rather than taking his complaint outside the company; 3) a controller
selected a legal method of financial reporting which concealed some embarrassing
financial facts, which would otherwise become public knowledge.
6 However, Longenecker, McKinney, and Moore (2004) do not further explore the intention
to follow that moral judgement and the ultimate behavioral resolution.
16

and losses related to temporary bad performance by hiding firm-
specific bad news. However, if a sufficiently long run of bad
news accumulates to a critical threshold level, managers choose
to give up, and all of the negative firm-specific shocks become
public at once. This disclosure brings about a corresponding
crash—a large negative outlier in the distribution of returns,
generating long left tails in the distribution of stock returns.
The empirical evidence supports the bad news hoarding theory. Jin
and Myers’s (2006) cross-country evidence indicates that firms in
more opaque countries are more likely to experience stock crashes
(i.e., large negative returns). Hutton, Marcus, and Tehranian
(2009) find a positive relation between firm-level financial
reporting opacity and crash risk.7 Kim, Li, and Zhang (2011a,
2011b) show that corporate tax avoidance and CFO’s equity
incentives are positively related to firm-specific stock price
crash risk.8
7 The prior literature also documents that future stock price crash risk is associated
with divergence of investor opinion (Chen, Hong, and Stein (2001)); and political
incentives in state-controlled Chinese firms (Piotroski, Wong, and Zhang (2010)).
8 Kothari, Shu, and Wysocki (2009) use stock market responses to voluntary disclosure
of specific information to infer bad news hoarding. In contrast, the crash risk
17

This paper argues that firms headquartered in areas with
higher levels of religiosity will be associated with reduced
future stock price crash risk. People’s behavior is influenced by
social norms, that is, people’s perceptions of how other members
of their social group should behave. Social norms in a locality
induce conformity that allows people to become socialized to the
environment in which they live (Perkins and Berkowitz (1986) and
Scott and Marshall (2005)). Failure to behave in conformity to a
locality’s social norms generates strong levels of cognitive
dissonance and emotional discomfort, and brings about social
sanctions imposed on deviants (Festinger (1957) and Akerlof
(1980)).9 Thus, it is to be expected that managers will prefer to
abide by local religious social norms in order to minimize the
disutility incurred by deviating from them. Importantly, Kennedy
and Lawton (1998) provide evidence indicating that the extent to
literature uses firm-specific return distributions to detect bad news hoarding. We
would argue that crash risk measures are better at capturing bad news hoarding because
concealed bad news is revealed through a variety of information channels over the
time, not just firm specific voluntary disclosure at a specific point in time.
9 Akerlof (1980) presents a utility-maximization model, incorporating social sanction
imposed by loss of reputation from breaking the custom, to explain why social customs
that are costly to the individual persist nevertheless.
18
which managers are influenced by religious social norms increases
with the level of religiosity in the area where the firm is
located.
Because religion acknowledges the overall importance of
ethical behavior and rejects manipulation, we expect that
religious social norms will counter managers’ incentives to hoard
bad news from investors. Assuming that managers maximize expected
utility, each manager will weigh the expected pecuniary gain of
hoarding bad news for personal wealth against expected litigation
costs and the costs of breaking religious social norms (i.e.
reputation loss, emotional dissonance, social stigma and other
social sanctions).10 Ceteris paribus, managers of a firm
headquartered in areas with high levels of religiosity will
assign a higher cost to the activities of deviating from
religious norms, including bad news hoarding, than will managers
in areas with low levels of religiosity. Furthermore, firms
headquartered in localities with a higher level of religiosity
are more likely to employ a larger percentage of religious people
10 Akerlof (1980), Sunstein (1996), and Weaver and Agle (2002) indicate reputational
loss and emotional distress as the major costs of breaking (religious) social norms.
19

in their organizations. Therefore, deviations from religious
norms are more likely to be “outed” by religious whistleblowers
in firms that are headquartered in areas with high levels of
religiosity.11 This argument is in line with Javers (2011)’s
report that “religion, not money, often motivates corporate
whistleblowers … whistleblowers can be deeply religious people,
whose faith gives them an identity outside their corporate life”.
Based on the above considerations, we predict that managers
of a firm headquartered in areas with high levels of religiosity
will be more likely to follow religious norms compared to
managers in areas with lows levels of religiosity, thereby
reducing bad news hoarding. As a result, this will lead to a
lower level of future stock price crash risk. This leads to our
first hypothesis stated in the alternative:
11 The degree to which religious managers will tend to avoid bad news hoarding
activities and the degree to which employees will act as whistle blowers is likely to
be reflected in the firm’s culture because “people determine organizational behavior”
(e.g., Schneider (1987) and Schneider, Goldstein, and Smith (1995)). Nevertheless, the
extent of whistleblowing by employees should not be underestimated. Evidence by Dyck,
Morse, and Zingales (2010) indicates that employees are more likely to blow the
whistle on corporate fraud, for example, than many other parties of interest.
20

H1: Firms headquartered in counties with higher levels of religiosity are
associated with lower levels of future stock price crash risk.
Tittle and Welch (1983) examine the influence of contextual
properties on the strength of the relation between individual
religiosity and deviant behavior. Their research indicates that
individual religiosity constrains deviant behavior most
effectively in environments where secular controls are absent or
weak. They note that “when secular moral guidelines are
unavailable, in flux, or have lost their authority and hence
their power to compel, the salience of religious proscriptions is
enhanced”. Likewise, Weaver and Agle (2002) develop a social
structural theory to assess religion’s influence on individual’s
behavior in organizations. They analyze how organizational
context affects the relation between religion and ethical
behavior. They emphasize that in an organization featuring weak
organizational culture and norms, religion more frequently
provides guidance. All other things being equal, the more salient
religion is for a person in an organization, the more likely he
or she will behave in accordance with religious social norms
21

absent secular moral guidelines. Thus, both studies imply that
religiosity can distinctly affect managerial behavior especially
when the corporation lacks effective mechanisms for curtailing
deviant behavior.
Grullon, Kanatas, and Weston (2010) and McGuire, Omer, and
Sharp (2012) provide empirical evidence on the influence of
corporate governance on the relation been religion and
opportunistic managerial behavior. Grullon, Kanatas, and Weston
(2010) find that the impact of religion on reducing option
backdating weakened significantly after the passage of Sarbanes-
Oxley (SOX). McGuire, Omer, and Sharp (2010) show that religious
social norms have a larger effect on curbing accounting risk when
dedicated institutional ownership in the firm is lower. These
findings suggest that the impact of religiosity on investor
welfare is contingent on the strength of the firm’s governance
environment and that religiosity and the monitoring role of
governance are substitutes for each other. The weaker external
governance mechanisms are in monitoring managerial activities,
the stronger will be the impact of religious norms on managerial
22

bad news hoarding activity and, hence on future stock price crash
risk. These considerations lead to our next hypothesis:
H2: The relation between religiosity and future stock price crash risk is stronger
(more negative), the weaker the firm’s governance monitoring mechanisms.
Research studies and anecdotal evidence suggest that managers
try to reduce investors’ perception of high firm risk taking
behavior. For example, Lambert (1984), Dye (1988), and Trueman
and Titman (1988) show that managers will rationally try to
reduce investor’s estimates of the volatility of the firm’s
underlying earnings process by income smoothing. Kim, Li, and
Zhang (2011b) contend that managers of firms with high levels of
risk-taking are concerned about investor’s perception of firm
riskiness and will hide risk-taking information in order to
support share price. Owens and Wu (2011) find a significantly
positive relation between financial leverage and downward window
dressing in short-term borrowings for publicly traded banks,
suggesting that managers have an incentive to mask the true risk
level of the firm in order to obtain a lower risk premium and
23

higher equity values. The latter study is consistent with the
report of Wall Street Journal (2010) that “major banks have
masked their risk levels in the past five quarters by temporarily
lowering their debt just before reporting it to the public… banks
have become more sensitive about showing high levels of debt and
risk, worried that their stocks and credit ratings could be
punished”.12 In response to the concern that similar incentives
to mask true risk levels exist in non-financial industries, the
SEC voted unanimously in 2010 to propose measures requiring all
public companies to provide additional disclosure to investors
regarding their short-term borrowings arrangements.
12 Wall Street Journal, “Big banks mask risk levels” (April 9, 2010). In a similar
vein, Lehman employed off-balance-sheet “Repo 105” transactions to temporarily remove
securities inventory from its balance sheet and reduce its publicly reported net
leverage, thereby creating a materially misleading picture of its financial condition
(Lehman Brothers Holdings Inc. Chapter 11 Proceedings Examiner’s Report, March 2010). Similarly, part
of the SEC probe of JPMorgan Chase’s trading scandal in 2012 was related to the
latter’s failure to disclose a major change to a risk metric in a timely fashion. By
omitting any mention of the change from its earnings release in April, the bank
disguised a spike in the riskiness of a particular trading portfolio by cutting in
half its value-at-risk number. (See http://www.cnbc.com/id/47776292 and
http://www.reuters.com/article/2012/06/19/us-jpmorgan-loss-schapiro-
idUSBRE85I12Y20120619 )
24

Following on this line of reasoning, we argue that managers
of firms with high levels of risk-taking are more likely to
conceal and hoard bad news information from investors because bad
news may be perceived by investors to be the realization of
excessive risk taking behavior by managers.13 If so, religion
will play a larger role in pre-empting bad news hoarding in
riskier firms and, hence, further reduce future stock price crash
risk. This conjecture is also consistent with the implication of
Tittle and Welch (1983) and Weaver and Agle (2002) that where
governance controls are weak, including presumably corporate risk
controls, religiosity will constrain excessive risk-related bad
news hoarding deviant behavior more effectively. These
considerations yield the following hypothesis:
H3: The relation between religiosity and future stock price crash risk is stronger
(more negative), the riskier the firm.
13 Concealing bad news would be supported in equilibrium as long as investors cannot
tell if the bad news is a result of normal risk or excessive risk taking and if the
ability to take excessive risks varies exogenously among firms.
25

III. Sample, Variable Measurement and Descriptive
Statistics
A. Data Sources and Sample
Following Hilary and Hui (2009), we obtain religiosity data
from the American Religion Data Archive (ARDA). Once every
decade, the Glenmary Research Center collects data from surveys
on religious affiliation in the U.S. (1971, 1980, 1990 and 2000).
Based on the survey results, the centre reports county-level data
on the number of churches and the number of total adherents by
religious affiliation. These reports are available on ARDA’s
website under the title “Churches and Church Membership.” Our
main variable of interest is the degree of religiosity at time T
(RELT) of the county in which the firm’s headquarter is located.
We calculate RELT as the number of religious adherents in the
county to the total population in the county as reported by
ARDA.14 Following previous studies (e.g., Hilary and Hui (2009)
14 ARDA indicates that “for [the] purposes of this study, adherents were defined as
‘all members’, including full members, their children and the estimated number of
other regular participants who are not considered as communicant, confirmed or full
members, for example, the ‘baptized,’ ‘those not confirmed,’ ‘those not eligible for
communion’ and the like.”
26

and Alesina and La Ferrara (2000)), we linearly interpolate the
data to obtain the values for missing years (1972 to 1979, 1981
to 1989, and 1991 to 1999).
In addition, we collect stock return data from the Centre for
Research in Security Prices (CRSP) daily stock files and
accounting data from Compustat annual files. Compustat also
provides information on the location of firms’ headquarters.
Following prior research (e.g., Coval and Moskowitz (1999),
Ivkovic and Weisbenner (2005), Loughran and Schultz (2004),
Pirinsky and Wang (2006), and Hilary and Hui (2009)), we define a
firm’s location as the location of its headquarters “given that
corporate headquarters are close to corporate core business
activities (Pirinsky and Wang (2006))”. Our final sample consists
of 80,404 firm-year observations for the years 1971 to 2000.
B. Measures of Firm-Specific Crash Risk
Following prior literature (Chen, Hong, and Stein (2001), Jin
and Myers (2006), and Hutton, Marcus, and Tehranian (2009)), we
employ three firm-specific measures of stock price crash risk for
each firm-year observation: 1) the negative coefficient of
27

skewness of firm-specific daily returns (NCSKEW); 2) the down-
to-up volatility of firm-specific daily returns (DUVOL); 3) the
difference between the number of days with negative extreme firm-
specific daily returns and the number of days with positive
extreme firm-specific daily returns (CRASH_COUNT).15
To calculate firm-specific measures of stock price crash
risk, we first estimate firm-specific residual daily returns from
the following expanded market and industry index model regression
for each firm and year (Hutton, Marcus, and Tehranian (2009)):
(1) rj,t=αj+β1,jrm,t−1+β2,jri,t−1+β3,jrm,t+β4,jri,t+β5,jrm,t+1+β6,jri,t+1+εj,t ,
where rj,t is the return on stock j in day t, rm,t is the return on
the CRSP value-weighted market index in day t, and ri,tis the
return on the value-weighted industry index based on two-digit
SIC codes. We correct for non-synchronous trading by including
lead and lag terms for value-weighted market and industry indices
(Dimson (1979)). 15 We also measure firm-specific crash risk by an indicator variable equal to one for a
firm-year if the firm experiences one or more firm-specific daily returns falling 3.09
standard deviations below the mean value for that year, and zero otherwise. Our
results (available upon request) remain robust. To conserve on space, we do not report
the results here.
28

We define the firm-specific daily return, Rj,t , as the natural
log of one plus the residual return from Equation (1). We log
transform the raw residual returns to reduce the positive skew in
the return distribution and help ensure symmetry (Chen, Hong, and
Stein (2001)). We also estimated the measures of crash risk based
on raw residual returns, and obtain robust (untabulated) results.
Our first firm-specific measure of stock price crash risk is
the negative coefficient of skewness of firm-specific daily
returns (NCSKEW) computed as the negative of the third moment of
each stock’s firm-specific daily returns, divided by the cubed
standard deviation. Thus, for any stock j over the fiscal year T,
(2)
NCSKEWj,T=−(n(n−1)32∑ Rj,t
3 ) /((n−1)(n−2)(∑Rj,t2 )
32) ,
where n is the number of observations of firm-specific daily
returns during the fiscal year T. The denominator is a
normalization factor (Greene (1993)). This study adopts the
convention that an increase in NCSKEW corresponds to a stock
being more “crash prone,” i.e., having a more left-skewed
29

distribution; hence, the minus sign on the right-hand side of
Equation (2).
The second measure of firm-specific crash risk is called
“down-to-up volatility” (DUVOL) calculated as follows:
(3)
DUVOLj,T=log {(nu−1) ∑DOWN
Rj,t2 /(nd−1)∑
UPRj,t2 } ,
where nu and nd are the number of up and down days over the
fiscal year T, respectively. For any stock j over a one-year
period, we separate all the days with firm-specific daily returns
above (below) the mean of the period and call this the “up”
(“down”) sample. We further calculate the standard deviation for
the “up” and “down” samples separately. We then compute the log
ratio of the standard deviation of the “down” sample to the
standard deviation of the “up” sample. Similar to NCSKEW, a
higher value of DUVOL corresponds to a stock being more “crash
prone.” This alternative measure does not involve the third
moment and, hence, is less likely to be excessively affected by a
small number of extreme returns.
30

The last measure, CRASH_COUNT, is based on the number of
firm-specific daily returns exceeding 3.09 standard deviations
above and below the mean firm-specific daily return over the
fiscal year, with 3.09 chosen to generate frequencies of 0.1% in
the normal distribution (Hutton, Marcus, and Tehranian (2009)).
COUNT is the downside frequencies minus the upside frequencies.
A higher value of COUNT corresponds to a higher frequency of
crashes. Like Hutton, Marcus, and Tehranian, (2009) and Kim, Li,
and Zhang (2011a), we use the 0.1% cut-off of the normal
distribution as a convenient way of obtaining reasonable
benchmarks for extreme firm-specific daily returns to calculate
the stock price crash risk measure COUNT.16
We employ one-year-ahead NCSKEW (NCSKEWT+1), DUVOL (DUVOLT+1),
and CRASH_COUNT (CRASH_COUNTT+1) as the dependent variables in our
empirical tests below.
C. Control Variables
16 We also estimate all of our regressions with measures of stock price crash risk
based on market-adjusted returns and beta adjusted returns, and our results remain
qualitatively similar.
31

Following prior literature (Chen, Hong, and Stein (2001) and
Jin and Myers (2006)), we control for the following set of
variables: NCSKEWT, defined as the negative coefficient of
skewness for firm-specific daily returns in fiscal year T; KURT,
defined as the kurtosis of firm-specific daily returns in fiscal
year T; SIGMAT, defined as the standard deviation of firm-
specific daily returns in fiscal year T; RETT, defined as the
cumulative firm-specific daily returns in fiscal year T; MBT,
defined as the market-to-book ratio at the end of fiscal year T;
LEVT, defined as the book value of all liabilities divided by the
total assets at the end of fiscal year T; ROET, defined as income
before extraordinary items divided by the book value of equity at
the end of fiscal year T; LNSIZET, defined as the log of market
value of equity at the end of fiscal year T; and DTURNOVERT,
defined as the average monthly share turnover over fiscal year T
minus the average monthly share turnover over the previous year,
T-1, where monthly share turnover is calculated as the monthly
share trading volume divided by the number of shares outstanding
over the month.
32

Following Hutton, Marcus, and Tehranian (2009), we also
include the regressor of accrual manipulation, AMT, computed as
the three-year moving sum of the absolute value of annual
performance-adjusted discretionary accruals (Kothari, Leone, and
Wasley (2005)) from fiscal years T-2 to T, to proxy for financial
reporting opacity.17 Following Fang, Liu, and Xin (2009), we also
control for the impact of industry-level litigation risk
(LITIG_RISKT) on stock price crash risk. LITIG_RISKT is equal to one
when the firm is in the biotechnology (4-digit SIC codes 2833-
2836 and 8731-8734), computer (4-digit SIC codes 3570-3577 and
7370-7374), electronics (4-digit SIC codes 3600-3674), or retail
(4-digit SIC codes 5200-5961) industries, and zero otherwise
(Francis, Philbrick, and Schipper (1994)). An appendix summarizes
the variable definitions used in this study.
D. Descriptive Statistics
Table 1, Panel A presents descriptive statistics for key
variables used in our regression models across the period 1971 to17 We also use a modified Dechow and Dichev’s (2002) accrual quality measure in
Francis, LaFond, Olsson, and Schipper (2005) to measure firm-level reporting quality,
and the results (untabulated) remain robust.
33
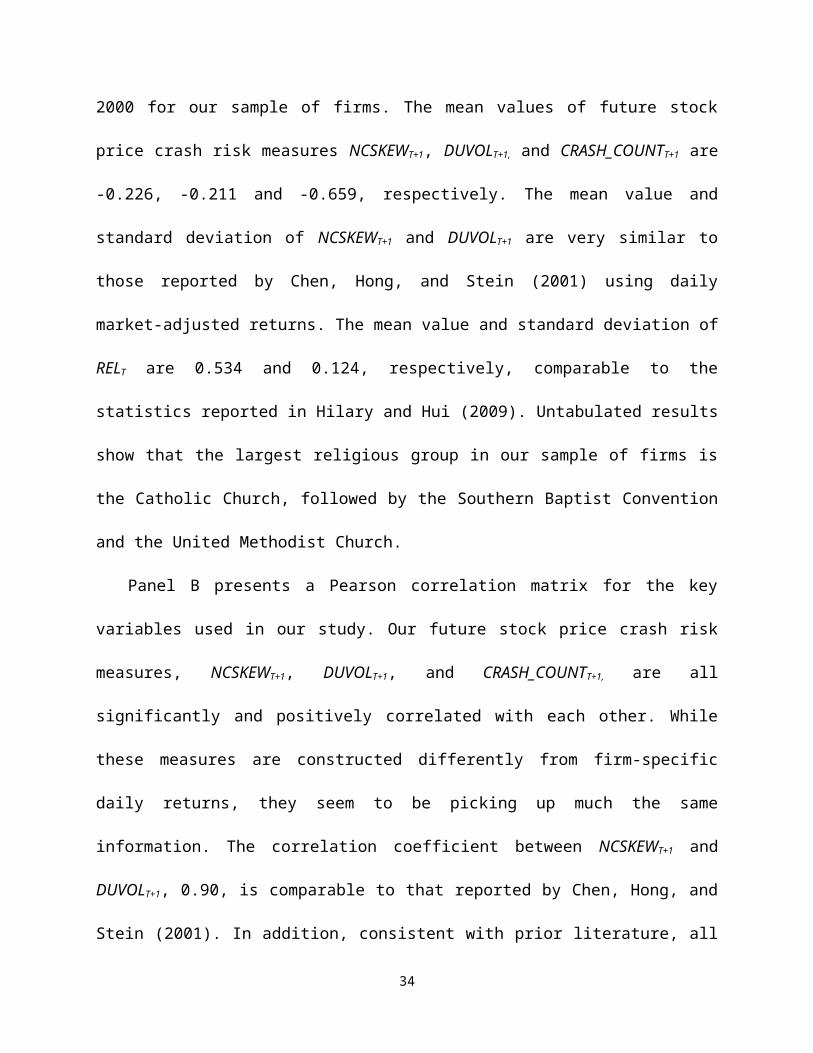
2000 for our sample of firms. The mean values of future stock
price crash risk measures NCSKEWT+1, DUVOLT+1, and CRASH_COUNTT+1 are
-0.226, -0.211 and -0.659, respectively. The mean value and
standard deviation of NCSKEWT+1 and DUVOLT+1 are very similar to
those reported by Chen, Hong, and Stein (2001) using daily
market-adjusted returns. The mean value and standard deviation of
RELT are 0.534 and 0.124, respectively, comparable to the
statistics reported in Hilary and Hui (2009). Untabulated results
show that the largest religious group in our sample of firms is
the Catholic Church, followed by the Southern Baptist Convention
and the United Methodist Church.
Panel B presents a Pearson correlation matrix for the key
variables used in our study. Our future stock price crash risk
measures, NCSKEWT+1, DUVOLT+1, and CRASH_COUNTT+1, are all
significantly and positively correlated with each other. While
these measures are constructed differently from firm-specific
daily returns, they seem to be picking up much the same
information. The correlation coefficient between NCSKEWT+1 and
DUVOLT+1, 0.90, is comparable to that reported by Chen, Hong, and
Stein (2001). In addition, consistent with prior literature, all
34

future crash risk measures are significantly positively
correlated with NCSKEWT, LNSIZET, and DTURNOVERT. Importantly, RELT is
significantly negatively correlated with NCSKEWT+1 and DUVOLT+1 at
the 1% and 2% significance level (two-tailed), respectively, and
negatively correlated with CRASH_COUNTT+1 at the 10% level (one-
tailed). The univariate results are consistent with our
expectation that firms located in more religious counties display
lower levels of future stock price crash risk.
-------Insert Table 1------
IV. Multivariate Empirical Tests
A. Main Results
We examine the effect of religion on future firm-specific
stock price crash risk (H1) with reference to the regression
equation:
(4) CRASHRISKj,T+1=¿
α0+α1RELj,T+∑kαkControlsj,T
k +YearDummies+IndustryDummies+εj,T,
where CRASHRISKT+1 is measured by NCSKEWT+1, DUVOLT+1, or CRASH_COUNTT+1.
All regressions control for year and industry (two-digit SIC)
35

fixed effects. Regression equations are estimated using pooled
ordinary least squares (OLS) with White standard errors corrected
for firm clustering.18 Our focus is on the effect of RELT on
future stock price crash risk, that is, on the coefficient α1.19
Table 2 shows the results of our regression analysis of
equation (4), where we measure future firm-specific crash risk by
NCSKEWT+1, DUVOLT+1, and CRASH_COUNTT+1 in columns 1 to 3,
respectively. Across all three models, the estimated coefficients
for RELT are significantly negative at less than 5% significance
levels (t-statistics= -2.06, -2.62, and -2.34). The results
indicate that religiosity is negatively associated with future
stock price crash risk, consistent with H1. These findings are
consistent with the view that religion effectively curbs
managerial incentive to hide bad news, thus reducing future stock
price crash risk.
18 Standard errors corrected for the clustering by both firm and year, by both industry
and year, or by both county and year yield very similar results.
19 To control for potential outliers, we winsorize top and bottom 1% regressor outliers
—but not the dependent variables following Jin and Myers (2006) and Hutton, Marcus,
and Tehranian (2009). The regression results are qualitatively similar (untabulated)
without winsorization.
36

To further examine the economic significance of the results,
we followed Hutton, Marcus, and Tehranian (2009) by setting RELT
to their 25th and 75th percentile values, respectively, and
comparing crash risk at the two percentile values while holding
all other variables at their mean values. On average, the drop in
stock price crash risk in any year corresponding to a shift from
the 25th to the 75th percentile of the distribution of
religiosity is 4.99% of the sample mean (across alternative
measures of crash risk). The specific percentages for NCSKEWT+1,
DUVOLT+1, and CRASH_COUNTT+1 are 6.34%, 4.85%, and 3.78%,
respectively. Comparing these results to evidence provided
further below indicates that the estimated impact of religiosity
on firm-specific crash risk is similar in economic significance
to the impact of leverage on crash risk and to about half of the
impact of accrual manipulation on crash risk.
Hilary and Hui (2009) find a negative relation between
religiosity and corporate risk exposure measured by variance in
equity return and Chen, Hong, and Stein (2001) argue that more
volatile stock is more likely to crash in the future. Thus, we
explicitly control for SIGMAT to make sure that the relation
37

between religiosity and future crash risk is not simply driven by
stock return volatility. Unreported robustness results show that
the regression results on RELT are very similar, even if we
exclude SIGMAT from the regression equation. In a similar vein,
we also explicitly control for AMT to make sure that the relation
between religiosity and future crash risk are not driven by
accounting accrual manipulation (Hutton, Marcus, and Tehranian
(2009) and McGuire, Omer, and Sharp (2012)). Untabulated reports
show that, after we exclude AMT from the regression equation, the
regression results on RELT become even stronger, suggesting that
accounting accrual manipulation is only one of multiple ways to
hide bad news.20
We now turn to our other control variables. Consonant with
the findings of Chen, Hong, and Stein (2001), the coefficients on
LNSIZET, NCSKEWT, MBT, and DTURNOVERT are significantly positive
across all three models. In addition, we observe significantly
negative coefficients on LEVT and significantly positive
coefficients on AMT, both of which are consistent with the20 Untabulated results show that the estimated coefficients (t-statistics) on RELT are -
0.111 (-3.40), -0.073 (-3.99), and -0.184 (-3.74) at the 0.001 significance levels
(two-tailed) for the three models of NCSKEWT+1, DUVOLT+1, and CRASH_COUNTT+1.
38

findings of Hutton, Marcus, and Tehranian (2009). We calculated
the change in NCSKEWT+1 (DUVOLT+1, and CRASH_COUNTT+1) corresponding
to a shift from the 25th to the 75 percentile of AMT, while
holding all other variables at their mean values. The economic
impact of AMT on NCSKEWT+1 (DUVOLT+1, COUNTT+1) is 13.98% (8.49%,
5.41%) of the sample mean.21 Similarly, the economic impact of
LEVT on NCSKEWT+1 (DUVOLT+1, COUNTT+1) is 5.67% (6.06%, 5.87%) of the
sample mean.
-------Insert Table 2 ------
B. Robustness Checks
We perform a number of robustness checks (untabulated) of our
main results. We first re-estimates regression equation (4)
including dummy variables for each four-digit SIC industry rather
than for each two-digit SIC industry, and the results hold. We
also include firm fixed-effects to address the concern that
omitted time-invariant firm characteristics may be driving the
results. When analyzing the effect of religion on future stock
21 Here, accrual manipulation has a larger economic impact on crash risk than does
religion. However, the results in sections 4.2 and 4.3 indicate that the economic
impact of religion on crash risk are sometimes much greater than those of accrual
manipulation.
39

price crash risk, endogeneity concerns arise because of omitted
unobservable firm characteristics. Omitted variables affecting
people’s faith in religion and future stock price crash risk
could lead to spurious correlations between religion and future
stock price crash risk. We find that our results still hold when
we include dummies for each firm. Similarly, we include county or
state fixed-effects to control for county-level or state-level
macroeconomic conditions (e.g., differences in the legal and
cultural environment or in employee costs). We find that our
results remain robust. The t-statistics for RELT range between -
1.93 and -2.83 for the series of tests.
Following Iannaccone (1998) and Hilary and Hui (2009), we
also control for different county-level demographic variables,
including the size of the population in the county, the
percentage of people aged 25 years and older who have a
bachelor’s, graduate, or professional degree, the percentage of
married people in the county, the male-to-female ratio in the
county, the average income in the county, and the percentage of
minorities in the county. We obtain the latter data from the 1990
40

and 2000 Surveys of the U.S. Census Bureau.22 We linearly
interpolate the data to obtain the values in the missing years
from 1991 to 1999. Unreported results indicate that the negative
coefficients for RELT are robust to including these demographic
variables in regression equation (4) (t-statistics= -1.73, -2.62,
and -2.61).
As shown above, our robustness checks are focused on the
issue of omitted correlated variables. Reverse causality, that
is, the change in the religiosity of the headquarter county due
to firm-specific crash risk, seems unlikely. We are also unaware
of any theory suggesting a reverse relation. Therefore, we treat
the religiosity of the county in which the headquarters of a firm
is located as exogenous to the firm (e.g., Guiso, Sapienza, and
Zingales (2006)). In addition, using current RELT to predict
future crash risk in the main regression analyses helps to
alleviate any concern of reverse causality. Final, our focus on
interaction effects for H2 and H3 makes it much hard to argue for
reverse causality.23
22 The U.S. Census Bureau website provides survey data of county-level demographic
variables only for 1990 and 2000.
41

C. Testing the Other Hypotheses
1. Governance Monitoring Mechanisms and Religiosity
We utilize the number of state-level antitakeover statutes
(STATUTEST), the governance index of Gompers, Ishii, and Metrick
(2003) (GINDEXT), and the percentage of shares outstanding held by
dedicated institutions (DEDT) to proxy for governance monitoring
mechanisms. Prior studies indicate that state antitakeover laws
can impede the threat of a hostile takeover and shield managers
from shareholder pressure (e.g., Hackl and Testani (1988) and
Schwert (2000)), reducing the effectiveness of shareholder
governance and monitoring. STATUTEST is computed from the data
provided by Bebchuk and Cohen (2003) on the number of state-level
antitakeover statutes from 1986 to 2001. GINDEXT measures the
number of antitakeover provisions at the firm level. Gompers,
Ishii, and Metrick (2003) establish that more antitakeover
23 Following Hilary and Hui (2009), we also employed an instrumental variable two-stage
least squares (2SLS) approach to control for the possible reverse causality
(untabulated). We re-estimated regression equation (4) using the fitted values of RELT
estimated from the first-stage regression of RELT on instrumental variables, RELT lagged
by three years and the county population lagged by three years. Consistent with our
main findings, the results remain robust.
42

provisions are associated with poorer corporate governance and
fewer shareholder rights.24 DEDT is the percentage of shares
outstanding held by dedicated institutions at the year-end. A
larger percentage suggests better investor oversight and better
corporate governance. Bushee (1998, 2001) provides evidence
suggesting that dedicated institutional investors serve a
monitoring role in effectively curtailing short-term myopic
investment behavior by management. In a similar vein, Chen,
Harford, and Li (2007) find that monitoring of acquisitions is
facilitated by independent long-term institutions (ILTIs) with
concentrated holdings.
To allow for a more nuanced interpretation of the
coefficients and to mitigate measurement problems, Panel A of
Table 3 splits the sample into two subsamples based on the median
number of state antitakeover laws and estimates each sub-sample
24 The Investor Responsibility Research Center (IRRC) collects and reports data about
every two years (1990, 1993, 1995, 1998, 2000, 2002, 2004, and 2006). Similar to
Gompers, Ishii, and Metrick (2003), we assume that the index remains constant in the
year(s) following the most recent report for years in which IRRC does not report
GINDEX.
43

separately.25 Table 3, Panel A shows that the coefficients on RELT
are negative for both subsamples, but significant only for firms
in states with an above median (high) number of antitakeover
statutes (t-statistics= -3.84, -4.30, and -3.51). Further, the
coefficients on RELT are much larger in absolute value for the
subsample with the above median number of state antitakeover
statutes than for the subsample with below median number of state
antitakeover statutes.
In a similar fashion, Table 3, Panel B splits the sample by
above and below median GINDEX, and estimates each sub-sample
separately. The coefficients on RELT are negative and significant
only for the above median GINDEX group (t-statistics= -2.68, -
2.70, and -2.23). Further, the coefficients on RELT are much
larger in absolute value for the above median GINDEX group than
for the below median GINDEX groups. Panel C examines the role of
dedicated institutions in mediating the relation between religion
and future price crash risk. It shows that the coefficients on
25 Another advantage is to avoid having to discuss whether 3 state antitakeover
statutes is “very different” from 4, or whether a GINDEX of 12 is ‘‘very different’’
from 13, or whether 6% dedicated institutional ownership yields much better investor
monitoring than 5% dedicated ownership.
44

RELT are negative for both above median and below median holdings
by dedicated institutional investors, but significant only for
below median holdings in two out of three stock price crash risk
specifications (t-statistics= -2.18 and -2.46).
To compare the differences in the estimated coefficients of
RELT across the subsamples, we also interact RELT with a binary
dummy, HISTATUTES, which takes a value of 1 for above median
number of state antitakeover laws, and zero otherwise. The
results (untabulated) show that the estimated coefficients on the
interaction term RELT*HISTATUTEST, which captures the differential
impact of RELT on future stock price crash risk from above median
number of state antitakeover statutes, are significantly negative
for NCSKEWT+1 and DUVOLT+1 (t-statistics= -2.21 and -2.03) and
marginally significantly negative for CRASH_COUNTT+1 at the level
of 10.5% (t-statistics= -1.62). We also obtain the similar
results when we interact RELT with the binary variable of GINDEXT
and dedicated institutional holdings
Overall, the findings in Tables 3 are consistent with H2,
namely, that religiosity functions as a substitute mechanism for
(external) monitoring in curbing managerial bad news hoarding
45

behavior. These results are also consistent with those of
Grullon, Kanatas, and Weston (2010) and McGuire, Omer, and Sharp
(2012) who find that the impact of religion on investor welfare
is contingent on the strength of the firm’s governance
environment.
-------Insert Table 3------
2. Firm Risk and Religiosity
Next we investigate whether the riskiness of the firm has an
impact on the relation between religiosity and future stock price
crash risk. Empirically, we use leverage, LEVT, and earnings
volatility, EARNINGS_VOLT, to proxy for the riskiness of the
firm.26 To the extent that bankruptcy costs are significant,
levered firms are going to be more risky on average than
unlevered firms. EARNINGS_VOLT is measured by the standard
deviation of earnings excluding extraordinary items and
discontinued operations, deflated by the lagged total equity over
the current and prior four years.
26 Given that our dependent variables are defined in terms of returns, we do not
measure firm risk using a return metric.
46

Table 4, Panel A estimates regression equation (4) separately
for subsamples with above and below median leverage. We find that
while the coefficients on RELT are negative for both subsamples,
the coefficients are significant only for firms with above median
leverage (t-statistics= -2.30, -2.65, and -2.52). Further, the
coefficients on RELT are much larger in absolute value for the
subsample with above median leverage than for the subsample with
below median leverage. Similarly, Table 4, Panel B estimates
regression equation (4) separately for subsamples with above and
below median earnings volatility. We find that while the
coefficients on RELT are negative for both subsamples, the
coefficients are significant only for firms with above median
volatility (t-statistics= -2.05, -3.03, and -2.52). Further, the
coefficients on RELT are much larger in absolute value for the
subsample with above median volatility than for the subsample
with below median volatility.
We also run the regression equation (4) incorporating the
interaction of RELT with the binary dummy, HILEVT, which takes a
value of 1 for above median leverage, and 0 otherwise. The
estimated coefficients (untabulated) on the interaction term
47

RELT*HILEVT, are significantly negative for DUVOLT+1 (t-statistics= -
2.28) and marginally significantly negative for NCSKEWT+1 and
CRASH_COUNTT+1 at the level of 17.6% and 10.3% (t-statistics= -1.35
and -1.63). The results remain similar when we incorporate the
interaction of RELT with the binary variable of earnings
volatility.
Taken together, the results in Table 4 are by and large
consistent with H3, namely, that the influence of religiosity on
future crash risk is more concentrated (negative) in riskier
firms.
-------Insert Table 4------
D. Verification of Bad News Hoarding in Stock Price Crash
The literature on crash risk is based on the maintained
hypothesis that idiosyncratic crashes are caused by bad news
hoarding. By and large, the literature tests the implications of
this maintained hypothesis but refrains from testing the
maintained hypothesis per se because of empirical difficulties.
How is the researcher to know if bad news is being hoarded ex
ante if the market does not know? But, even ex post after the
48

crash, it is impossible to determine in all but the most infamous
cases that bad news hoarding was the cause of the crash based on
public information such as firm press releases or from the press
itself. But then how are we to know whether the crash is a result
of bad news hoarding or simply because of “unexpected events”,
that is idiosyncratic risk?27
To try to ensure that the subsequent crash is a consequence
of bad news hoarding, we focus on the firms that restated
accounting data and suffered a stock price crash as a result. The
restatement firms in our sample are those involved in accounting
irregularities that resulted in material misstatements of
financial results. Generally, these irregularities are discovered
at least one year, and often many years, after the event and
involve hiding poor revenues or increased expenses (or both) by
management.28 In other words, these are firms that we are fairly
certain suffered a crash because management hid negative
information.
27 Note that we control for idiosyncratic risk in our regression analysis.
28 Irregularities discovered within the year are corrected in that year and do not
result in restatements.
49

We initially collect data for a sample of restatement firms
identified by the General Accounting Office (GAO (2002))
available from January 1997. These restatements “involved
accounting irregularities resulting in material misstatements of
financial results”. To complement this sample, we also include
non-overlapping restatements from the SEC’s Accounting and
Auditing Enforcement Releases (AAERs) available from September
1995.29 We also hand-collect data on the impact of the
restatement on net income from the restatement announcements. We
further impose the restriction that restating firms have the
necessary financial and equity data on Compustat and CRSP. We
restrict the restatement sample to the period that overlaps our
primary results yielding a total of 458 distinct restatements
from 1995 to 2000.
Based on equation (1), we calculate firm-specific daily
returns for the restatement sample on the day of and the day
after the restatement announcement. Following Hutton, Marcus, and
Tehranian (2009), we define a stock price crash if the firm-29 The SEC website
(http://www.sec.gov/divisions/enforce/friactions/friactions1999.shtml) is the source
of the AAER data.
50

specific daily return on either of the two days is 3.09 standard
deviations below the annual mean. Table 5 shows that of the 458
firms in the restatement sample, 140 restatements result in stock
price crash over the two-day window. The mean firm-specific daily
return for the 140 crash events is -35.33% (t-statistic = -17.43,
p- value < 0.0001). These restatements also show a non-trivial
adverse impact on net income, a mean reduction of -16.91% of
shareholders’ equity (t-statistic = -2.47, p-value = 0.016).
Thus, restatements followed by crashes are consistent with the
bad news hoarding interpretation of firm-specific stock price
crashes. Specifically, managers withhold firm-specific income-
decreasing news from investors by overstating financial results,
and accumulate the adverse information until the restatement
announcement date when the revelation of bad news results in a
corresponding crash—an extreme negative return.
For each of 140 firms in the sample, we further identify
firms in the same industry from the group of restatements firms
that did not suffer a crash. From the latter, we choose a control
firm whose total assets are closest to those of the treatment
firm (and in the same industry). We compare the mean of the firm-
51

specific daily returns and the mean impact on net income for both
groups. As shown in Table 5, the mean firm-specific daily return
for the control group is -1.58%, which is much less negative than
for the treatment group. The difference in returns for the two
groups is statistically significant (t-statistics = 10.54, p-
value < 0.0001). The mean impact of restatements on net income
for the control group is -4.80% of shareholder’s equity, which is
significantly smaller than the group of restatements with crashes
(t-statistics = 2.25, p-value = 0.026). The comparison suggests
that relative to the control group, the group of restatement
firms that suffered a crash were much more likely to have hoarded
material bad news from investors.
We further calculate mean and median values of REL for the
restatement group with crashes and the control group.30 The
difference in mean and median values of REL between the two
groups are -6.40% (= (0.5155-0.5505)/0.5505) and -11.92% (=
(0.5076-0.5763)/0.5763), respectively. The restatement group with
crashes demonstrates significantly lower levels of religiosity as
compared to the control group (t-statistic = 2.40, p-value =30 The inference remains similar when we use non-restatement Compustat firms (matched by
industry and size) as an alternative control group.
52

0.017 for the difference in means). These results are broadly
consistent with the idea that firms headquartered in areas with
higher levels of religiosity are less likely to hoard bad news
and, thus, are less prone to crashes.
-------Insert Table 5------
V. Conclusion
This study investigates whether religiosity is negatively
associated with future stock price crash risk. We find robust
evidence that firms located in U.S. counties with high levels of
religiosity exhibit low levels of future stock price crash risk.
This negative association is incrementally significant even after
controlling for accruals manipulation (Hutton, Marcus, and
Tehranian (2009)), trading volumes and past returns (Chen, Hong,
and Stein (2001)), and other factors known to affect stock price
crash risk. These results are consistent with our conjecture that
religious social norms can effectively curb managerial bad news
hoarding activities within firms, thus decreasing future stock
price crash risk.
53

Our evidence further shows that the negative relation between
religiosity and future stock price crash risk is more salient for
firms with weak governance monitoring mechanisms as measured by
shareholder takeover rights and dedicated institutional
ownership. These findings enrich our understanding of the
influence of religion on future stock price crash risk and shed
light on how social norms interact with corporate monitoring
mechanisms to reduce agency costs. We also find a more pronounced
negative relation between the degree of county-level religiosity
and future crash risk for riskier firms.
This study complements the existing literature on religion
and corporate behavior. Our study supports extant evidence that
religiosity brings significant benefits to firms and their
shareholders. In addition, our results are consistent with the
view that sociological factors matter in influencing corporate
culture and behavior (Hilary and Hui (2009)). We expect that
numerous other noneconomic cultural factors besides religious
norms also affect corporate behavior and have similar economic
implications. These factors are worth researching further
especially if they help to mitigate the kinds of corporate crises
54

we are currently experiencing and reduce the incidences of
extreme outcomes in the capital markets that have a material
impact on the welfare of investors.
55

Appendix. Variable Definitions
Crash Risk Measures:
NCSKEW is the negative coefficient of skewness of firm-specific daily
returns over the fiscal year.
DUVOL is the log of the ratio of the standard deviation of firm-
specific daily returns for the “down-day” sample to standard deviation
of firm-specific daily returns for the “up-day” sample over the fiscal
year.
CRASH_COUNT is the number of firm-specific daily returns exceeding
3.09 standard deviations below the mean firm-specific daily return
over the fiscal year, minus the number of firm-specific daily returns
exceeding 3.09 standard deviations above the mean firm-specific daily
return over the fiscal year, with 3.09 chosen to generate frequencies
of 0.1% in the normal distribution.
We estimate firm-specific daily returns from an expanded market and
industry index model regression for each firm and year (Hutton,
Marcus, and Tehranian (2009)):
(1)
rj,t=αj+β1,jrm,t−1+β2,jri,t−1+β3,jrm,t+β4,jri,t+β5,jrm,t+1+β6,jri,t+1+εj,t ,
56

where rj,t is the return on stock j in day t, rm,t is the return on the
CRSP value-weighted market index in day t, and ri,tis the return on the
value-weighted industry index based on the two-digit SIC code. The
firm-specific daily return is the natural log of one plus the residual
return from the regression model.
Religious Measure:
REL is the number of religious adherents in the county compared to the
total population in the county (as reported by ARDA).
Other Variables:
KUR is the kurtosis of firm-specific daily returns over the fiscal
year.
SIGMA is the standard deviation of firm-specific daily returns over the
fiscal year.
RET is the cumulative firm-specific daily returns over the fiscal year.
MB is the ratio of the market value of equity to the book value of
equity measured at the end of the fiscal year.
LEV is the book value of all liabilities divided by total assets at the
end of the fiscal year.
57

ROE is the income before extraordinary items divided by the book value
of equity at the end of the fiscal year.
LNSIZE is the log value of market capitalization at the end of the
fiscal year.
DTURNOVER is the average monthly share turnover over the fiscal year T
minus the average monthly share turnover over the previous year, where
monthly share turnover is calculated as the monthly share trading
volume divided by the number of shares outstanding over the month.
AM is accrual manipulation, computed as the three-year moving sum of
the absolute value of annual performance-adjusted discretionary
accruals developed by Kothari, Leone, and Wasley (2005).
LITIG_RISK is equal to 1 for all firms in the biotechnology (4-digit SIC
codes 2833-2836 and 8731-8734), computer (4-digit SIC codes 3570-3577
and 7370-7374), electronics (4-digit SIC codes 3600-3674), and retail
(4-digit SIC codes 5200-5961) industries, and zero otherwise (Francis,
Philbrick, and Schipper (1994)).
STATUTES is the number of state-level antitakeover statutes.
HISTATUTES is an indicator variable that takes the value of one if the
number of the state antitakeover statutes is greater than the sample
median, and zero otherwise.
GINDEX is the governance index of Gompers, Ishii, and Metrick (2003).
58

DED is the percentage of shares outstanding held by dedicated
institutions at the end of the year.
HILEV is an indicator variable that takes the value of one if LEV is
greater than the sample median, and zero otherwise.
EARNINGS_VOL is the standard deviations of earnings excluding
extraordinary items and discontinued operations, deflated by the
lagged total equity over the current and prior four years.
ReferencesAgle, B. R., and H. V. Buren. “God and Mammon: The Modern
Relationship.” Business Ethics Quarterly, 9 (1999), 563- 582.
Akerlof, G. “The Theory of Social Custom, of Which Unemployment
May Be One Consequence.” The Quarterly Journal of Economics, 94
(1980), 749- 775.
Akers, R.L. “Religion and Crime.” The Criminologist, 35 (2010), 1-6.
Alesina, A., and E. L. Ferrara. “Participation in Heterogeneous
Communities.” Quarterly Journal of Economics, 115 (2000), 847-904.
Ali, A. Y. The Holy Quran: English Translation of the Meanings and Commentary.
In: Madina-al-Munawwara: King Fahad Holy Quran Printing
Complex (1983).
59

Ball, R. “Market and Political/Regulatory Perspectives on the
Recent Accounting Scandals.” Journal of Accounting Research, 47
(2009), 277-323.
Barro, R., and R. McCleary. “Religion and Economic Growth.”
American Sociological Review, 68 (2003), 760–781.
Basu, S. “The Conservatism Principle and the Asymmetric
Timeliness of Earnings.” Journal of Accounting and Economics, 24
(1997), 3-37.
Bebchuk, L. A., and A. Cohen. “Firms’ Decisions Where to
Incorporate.” Journal of Law and Economics, 46 (2003), 383-425.
Bushee, B. “The Influence of Institutional Investors on Myopic
R&D Investment Behavior.” The Accounting Review, 73 (1998), 305-
333.
Bushee, B. “Do Institutional Investors Prefer Near-term Earnings
over Long-run Value?” Contemporary Accounting Research, 18 (2001),
207-46.
Callen, J. L.; M. Morel; and G. Richardson. “Do Culture and
Religion Mitigate Earnings Management? Evidence from a Cross-
country Analysis.” International Journal of Disclosure and Governance, 8
(2011), 103-121.
60

Calkins, M. “Recovering Religion’s Prophetic Voice for Business
Ethics.” Journal of Business Ethics, 23 (2000), 339-352.
Chen, J.; H. Hong; and J. C. Stein. “Forecasting Crashes: Trading
Volume, Past returns, and Conditional Skewness in Stock
Prices.” Journal of Financial Economics, 61 (2001), 345-381.
Chen, X.; J. Harford; and K. Li. “Monitoring: Which Institutions
Matter?” Journal of Financial Economics, 86 (2007), 279-305.
Coval, J., and T. Moskowitz. “Home Bias at Home: Local Equity
Preference in Domestic Portfolios.” Journal of Finance, 54 (1999),
2045-2073.
Cunningham, C. P. “The Golden Rule as Universal Ethical Norm.”
Journal of Business Ethics, 17 (1988), 105-109.
Dechow, P. M., and I. D. Dichev. “The Quality of Accruals and
Earnings: the Role of Accrual Estimation Errors.” The Accounting
Review, 77 (2002), 35-59.
Diaz, J. “Religion and Gambling in Sin-city: A Statistical
Analysis of the Relationship between Religion and Gambling
Patterns in Las Vegas Residents.” Social Science Journal, 37
(2000), 453–458.
61

Dimson, E. “Risk Measurement When Shares are Subject to
Infrequent Trading.” Journal of Financial Economics, 7 (1979), 197-
227.
Dyck, A.; A. Morse; and L. Zingales. “Who Blows the Whistle on
Corporate Fraud.” Journal of Finance, 65 (2010), 2213-2253.
Dye, R. A. “Earnings Management in an Overlapping Generations
Model.” Journal of Accounting Research, 26 (1988), 195-235.
Dyreng, S. D.; W. J. Mayew; and C. D. Williams. “Religious Social
Norms and Corporate Financial Reporting.” Journal of Business
Finance and Accounting, 39 (2012), 845-875.
Fang, X.; Y. Liu; and B. Xin. “Accounting Conservatism, the
Sarbanes-Oxley Act, and Crash Risk.” Working Paper,
University of Toronto (2009).
Festinger, L. A. A Theory of Cognitive Dissonance. Stanford, CA:
Stanford University Press (1957).
Francis, J.; R. LaFond; P. Olsson; and K. Schipper. “The Market
Pricing of Accruals Quality.” Journal of Accounting and Economics, 39
(2005), 295-327.
62

Francis, J.; D. Philbrick; and K. Schipper. “Shareholder
Litigation and Corporate Disclosures.” Journal of Accounting
Research, 32 (1994), 137-164.
Friedman, H. H. “Placing a Stumbling Block Before the Blind
Person: An In-depth Analysis.” Working Paper, Brooklyn
College (2002).
Gompers, P.; J. Ishii; and A. Metrick. “Corporate Governance and
Equity Prices.” Quarterly Journal of Economics, 118 (2003), 107-155.
Graham, J. R.; C. R. Harvey; and S. Rajgopal. “The Economic
Implications of Corporate Financial Reporting.” Journal of
Accounting and Economics, 40 (2005), 3-73.
Greene, W. H. Econometric Analysis. New York: Macmillan (1993).
Grullon, G.; G. Kanatas; and J. Weston. “Religion and Corporate
(Mis)behavior.” Working Paper, Rice University (2010).
Guiso, L.; P. Sapienza; and L. Zingales. “People’s Opium?
Religion and Economic Attitudes.” Journal of Monetary Economics, 50
(2003), 225–282.
Guiso, L.; P. Sapienza; and L. Zingales. “Does Culture Affect
Economic Outcome?” Journal of Economic Perspectives, 20 (2006), 23–
48.
63

Hackl, J. W., and R. Testani. “Note, Second-generation State
Takeover Statutes and Shareholder Wealth: An Empirical
Study.” Yale Law Journal, 97 (1988), 1193-1231.
Hilary, G., and K. W. Hui. “Does Religion Matter in Corporate
Decision Making in America?” Journal of Financial Economics, 93
(2009), 455-473.
Hong, H., and J. C. Stein. “Differences of Opinion, Short-sales
Constraints, and Market Crashes.” Review of Financial Studies, 16
(2003), 487-525.
Hood, R. W. Jr.; B. Spilka; B. Hunsberger; and R. Gorsuch. The
Psychology of Religion: An Empirical Approach. New York: Guilford Press
(1996).
Hutton, A. P.; A. J. Marcus; and H. Tehranian. “Opaque Financial
Reports, R2, and Crash Risk.” Journal of Financial Economics, 94
(2009), 67-86.
Iannaccone, L. “Introduction to the Economics of Religion.”
Journal of Economic Literature, 36 (1998), 1465-1496.
Ivkovic, Z., and S. Weisbenner. “Local Does as Local is:
Information Content of the Geography of Individual Investors’
Common Stock Investments.” Journal of Finance, 60 (2005), 267-306.
64

Javers, E. “Religion, Not Money, Often Motivates Corporate
Whistleblowers.” CNBC, Feb 12 (2011).
Jin, L., and S.C. Myers. “R2 around the World: New Theory and New
Tests.” Journal of Financial Economics, 79 (2006), 257-292.
Johnson, B. R., and S. J. Jang. “Crime and Religion: Assessing
the Role of the Faith Factor.” Paper presented in a
Presidential Panel Session of American Society of Criminology
Annual Meeting, San Francisco, California, November (2010).
Kelly, K.; T. McGinty; and D. Fitzpatrick. “Big Banks Mask Risk
Levels.” Wall Street Journal, April 9 (2010).
Kennedy, E. J., and L. Lawton. “Religiousness and Business
Ethics.” Journal of Business Ethics, 17 (1998), 163-175.
Khavari, K. A., and T. M. Harmon. “The Relationship between the
Degree of Professed Religious Belief and Use of Drugs.”
International Journal of the Addictions, 17 (1982), 847-857.
Kim, D.; D. Fisher; and D. McCalman. “Modernism, Christianity,
and Business Ethics: A Worldwide Perspective.” Journal of Business
Ethics, 90 (2009), 115-121.
65

Kim, J-B.; Y. Li; and L. Zhang. “Corporate Tax Avoidance and
Stock Price Crash Risk: Firm-level Analysis.” Journal of Financial
Economics, 100 (2011a), 639-662.
Kim, J-B.; Y. Li; and L. Zhang. “CEO vs. CFO: Equity Incentives
and Crashes.” Journal of Financial Economics, 101 (2011b), 713-730.
Kothari, S. P.; A. J. Leone; and C. E. Wasley. “Performance
Matched Discretionary Accrual Measures.” Journal of Accounting and
Economics, 39 (2005), 163-197.
Kothari, S. P.; S. Shu; and P. D. Wysocki. “Do Managers Withhold
Bad News?” Journal of Accounting Research, 47 (2009), 241-276.
Lambert, R. A. “Income Smoothing as Rational Equilibrium
Behavior.” The Accounting Review, 59 (1984), 604-618.
Lehrer, E. L. “Religion as a Determinant of Economic and
Demographic Behavior in the United States.” Population and
Development Review, 30 (2004), 707–726.
Longenecker, J. G.; J. A. McKinney; and C. W. Moore. “Religious
Intensity, Evangelical Christianity, and Business Ethics: An
Empirical Study.” Journal of Business Ethics, 55 (2004), 373–386.
66

Loughran, T., and P. Schultz. “Dissemination of Information:
Urban versus Rural Stock Return Patterns.” Working Paper,
University of Notre Dame (2004).
Maltby, J. “Personality Dimensions of Religious Orientation.”
Journal of Psychology, 133 (1999), 631-640.
Mawdudi, S. A. A. 1989. “Towards Understanding the Quran: English
Version of Tafhmul Quran.” In The Islamic Foundation, Vol. IV,
Zafar Ishaq Ansari, ed. Leicester (1989).
McCullough, M. E., and B. L. B. Willoughby. “Religion, Self-
Regulation and Self-Control: Association, Explanation and
Implications.” Psychological Bulletin, 135 (2009), 69-93.
McGire, S. T.; T. C. Omer; and N. Y. Sharp. “The Impact of
Religion on Financial Reporting Irregularities.” The Accounting
Review, 87 (2012), 645-673.
Miller, A., and J. Hoffmann. “Risk and Religion: An Explanation
of Gender Differences in Religiosity.” Journal for the Scientific Study
of Religion, 34 (1995), 63-75.
Osoba, B. “Risk Preferences and the Practice of Religion:
Evidence from Panel Data.” Working Paper, West Virginia
University (2003).
67

Owens, E. L., and J. S. Wu. “Window Dressing of Financial
Leverage.” Working Paper, University of Rochester (2011).
Perkins, H. W., and A. D. Berkowitz. “Perceiving the Community
Norms of Alcohol Use among Students: Some Research
Implications for Campus Alcohol Education Programming.”
International Journal of the Addictions, 21 (1986), 961–976.
Piotroski, J. D.; T. J. Wong; and T. Zhang. “Political Incentives
to Suppress Negative Financial Information: Evidence from
State-controlled Chinese Firms.” Working Paper, Stanford
University, The Chinese University of Hong Kong, and City
University of Hong Kong (2010).
Pirinsky, C., and Q. Wang. “Does Corporate Headquarters Location
Matter for Stock Returns?” Journal of Finance, 61 (2006), 1991-
2015.
Rai, H. “The Role of Hinduism in Global India and Her Business
Ethics.” In Business and Religion: A Clash of Civilizations, Nicholas
Capaldi, ed. Salem: M & M Scrivener Press (2005).
Schneider, B. “The People Make the Place.” Personnel Psychology, 40
(1987), 437-453.
68

Schneider, B.; H. Goldstein; and D. Smith. “The ASA Framework: An
Update.” Personnel Psychology, 48 (1995), 747-773.
Schwert, G.W. “Hostility in Takeover: In the Eyes of the
Beholder?” Journal of Finance, 55 (2000), 2599-2640.
Scott, J., and G. Marshall. A Dictionary of Sociology. 3rd edition.
Oxford: Oxford University Press (2005).
Smith, A. An Inquiry into the Nature and Causes of the Wealth of Nations.
London: W. Strahan and T. Cadell (1776).
Smith, C. “Theorizing Religious Effects among American
Adolescents.” Journal for the Scientific Study of Religion, 42 (2003), 17-
30.
Smith, R. E.; G. Wheeler; and E. Diener. “Faith Without Works:
Jesus People, Resistance to Temptation, and Altruism.” Journal
of Applied Social Psychology 5 (1975), 320-330.
Sunstein, C. R. “Social Norms and Social Rules.” Columbia Law
Review, 96 (1996), 903-968.
Tittle, C., and M. Welch. “Religiosity and Deviance: Toward a
Contingency Theory of Constraining Effects.” Social Forces, 61
(1983), 653-682.
69

Torgler, B. “The Importance of Faith: Tax Morale and
Religiosity.” Journal of Economic Behavior and Organization, 61 (2006),
81-109.
Trueman, B., and S. Titman. “An Explanation for Accounting Income
Smoothing.” Journal of Accounting Research, 26 (1988), 127-139.
Turner, J. H. The Institutional Order. New York: Addison-Wesley
Educational Publishers (1997).
U.S. General Accounting Office. Financial Statement Restatements:
Trends, Market Impacts, Regulatory Responses, and Remaining
Challenges. Report to the Chairman, Senate Committee on
Banking, Housing, and Urban Affairs. GAO-03-138, October 4
(2002).
Vitell, S. J. “The Role of Religiosity in Business and Consumer
Ethics: A Review of the Literature.” Journal of Business Ethics, 90
(2009), 155-167.
Waite, L. J., and E. L. Lehrer. “The Benefits from Marriage and
Religion in the United States: A Comparative Analysis.”
Population and Development Review, 29 (2003), 255-275.
70

Weaver, G. R., and B. R. Agle. “Religiosity and Ethical Behavior
in Organizations: A Symbolic Interactionist Perspective.”
Academy of Management Review, 27 (2002), 77–97.
Weber, M. The Protestant Ethic and the Spirit of Capitalism. London: Allen &
Unwin (1905).
Xing, Y.; X. Zhang; and R. Zhao. “What Does the Individual Option
Volatility Smirk Tell Us about Future Equity Returns?” Journal
of Financial and Quantitative Analysis, 45 (2010), 641–662.
Yan, S. “Jump Risk, Stock Returns, and Slope of Implied
Volatility Smile.” Journal of Financial Economics, 99 (2011), 216–
233.
71

Table 1: Descriptive Statistics and Correlation Matrix
This table presents descriptive statistics and correlation matrix of key variables of interest for the
sample of firms included in our study. The sample covers firm-year observations with non-missing values for
all control variables for the period 1971 to 2000. Panel A presents descriptive statistics of key variables
of interest. Panel B presents a Pearson correlation matrix. The p-values are below the correlation
coefficients in Panel B. All variables are defined in the Appendix.
Panel A. Descriptive Statistics
Variables N MeanStd.dev.
5stPctl.
25thPctl. Median
75thPctl.
95thPctl.
NCSKEWT+1 80391 -0.226 1.145 -1.604 -0.603 -0.226 0.098 1.204DUVOLT+1 80387 -0.211 0.592 -1.050 -0.518 -0.215 0.069 0.653CRASH_COUNTT+1 80404 -0.659 1.702 -3.000 -2.000 -1.000 0.000 2.000RELT 80404 0.534 0.124 0.345 0.433 0.539 0.619 0.739NCSKEWT 80404 -0.234 0.942 -1.580 -0.605 -0.232 0.086 1.147KURT 80404 5.080 8.282 0.322 1.239 2.408 5.027 19.388SIGMAT 80404 0.033 0.021 0.011 0.018 0.028 0.042 0.076RETT 80404 -0.194 0.275 -0.726 -0.222 -0.096 -0.042 -0.015MBT 80404 2.289 3.483 0.311 0.849 1.441 2.548 7.411LEVT 80404 0.503 0.219 0.146 0.351 0.511 0.642 0.848ROET 80404 -0.006 0.559 -0.677 0.008 0.097 0.152 0.276LNSIZET 80404 18.275 2.109 15.007 16.703 18.149 19.768 21.914DTURNOVERT 80404 0.004 0.051 -0.059 -0.010 0.001 0.013 0.081AMT 80404 0.202 0.158 0.038 0.092 0.157 0.261 0.530LITIG_RISKT 80404 0.048 0.214 0.000 0.000 0.000 0.000 0.000
72
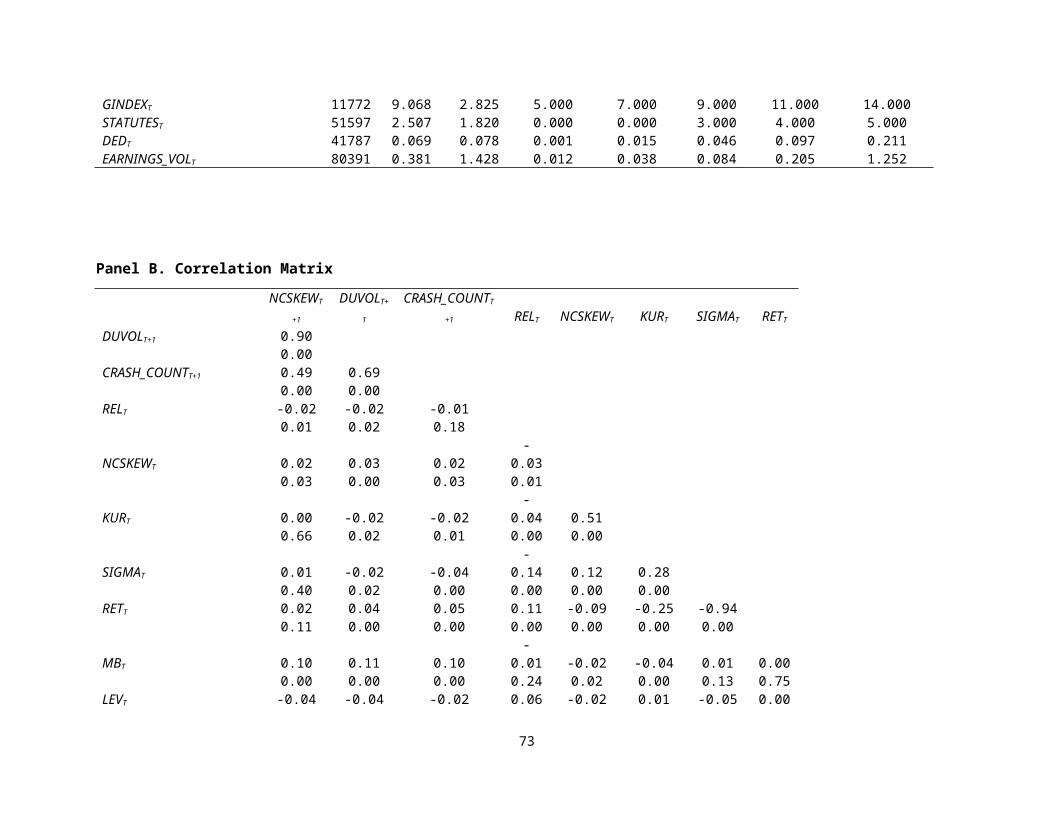
GINDEXT 11772 9.068 2.825 5.000 7.000 9.000 11.000 14.000STATUTEST 51597 2.507 1.820 0.000 0.000 3.000 4.000 5.000DEDT 41787 0.069 0.078 0.001 0.015 0.046 0.097 0.211EARNINGS_VOLT 80391 0.381 1.428 0.012 0.038 0.084 0.205 1.252
Panel B. Correlation MatrixNCSKEWT
+1
DUVOLT+
1
CRASH_COUNTT
+1 RELT NCSKEWT KURT SIGMAT RETT
DUVOLT+1 0.900.00
CRASH_COUNTT+1 0.49 0.690.00 0.00
RELT -0.02 -0.02 -0.010.01 0.02 0.18
NCSKEWT 0.02 0.03 0.02-
0.030.03 0.00 0.03 0.01
KURT 0.00 -0.02 -0.02-
0.04 0.510.66 0.02 0.01 0.00 0.00
SIGMAT 0.01 -0.02 -0.04-
0.14 0.12 0.280.40 0.02 0.00 0.00 0.00 0.00
RETT 0.02 0.04 0.05 0.11 -0.09 -0.25 -0.940.11 0.00 0.00 0.00 0.00 0.00 0.00
MBT 0.10 0.11 0.10-
0.01 -0.02 -0.04 0.01 0.000.00 0.00 0.00 0.24 0.02 0.00 0.13 0.75
LEVT -0.04 -0.04 -0.02 0.06 -0.02 0.01 -0.05 0.00
73

0.00 0.00 0.04 0.00 0.03 0.20 0.00 0.73ROET 0.02 0.05 0.05 0.02 -0.01 -0.05 -0.19 0.19
0.04 0.00 0.00 0.01 0.13 0.00 0.00 0.00LNSIZET 0.12 0.15 0.15 0.02 0.02 -0.08 -0.37 0.34
0.00 0.00 0.00 0.07 0.04 0.00 0.00 0.00
DTURNOVERT 0.03 0.04 0.03-
0.02 0.12 0.12 0.14-
0.130.00 0.00 0.00 0.04 0.00 0.00 0.00 0.00
AMT 0.02 -0.01 -0.01-
0.07 0.02 0.09 0.38-
0.320.02 0.37 0.22 0.00 0.06 0.00 0.00 0.00
LITIG_RISKT 0.03 0.01 -0.01-
0.08 0.04 0.07 0.21-
0.180.00 0.18 0.48 0.00 0.00 0.00 0.00 0.00
GINDEXT -0.01 0.00 0.00 0.06 -0.01 -0.02 -0.17 0.150.34 0.73 0.78 0.00 0.47 0.02 0.00 0.00
STATUTEST 0.01 0.03 0.02 0.25 0.01 0.00 -0.15 0.120.24 0.01 0.06 0.00 0.42 0.98 0.00 0.00
DEDT -0.02 -0.02 -0.02 0.01 -0.01 0.01 0.02 0.020.07 0.04 0.06 0.13 0.14 0.22 0.05 0.04
EARNINGS_VOLT -0.01 -0.02 -0.03 0.00 -0.01 0.03 0.18-
0.180.22 0.01 0.01 0.95 0.16 0.00 0.00 0.00
(Panel B: Continued)
MBT LEVT ROET LNSIZET
DTURNOVERT AMT LITIG_RISKT GINDEXT STATUTEST DEDT
LEVT -0.070.00
ROET 0.14-
0.05
74

0.00 0.00LNSIZET 0.36 0.00 0.17
0.00 0.73 0.00
DTURNOVERT 0.05-
0.01 0.00 0.050.00 0.19 0.78 0.00
AMT 0.10-
0.07 -0.04 -0.17 0.020.00 0.00 0.00 0.00 0.09
LITIG_RISKT 0.13-
0.13 -0.02 0.01 0.01 0.150.00 0.00 0.03 0.26 0.20 0.00
GINDEXT -0.03 0.15 0.02 0.10 0.00 -0.10 -0.090.00 0.00 0.03 0.00 0.92 0.00 0.00
STATUTEST 0.01 0.07 0.04 0.04 -0.01 -0.11 -0.09 0.140.42 0.00 0.00 0.00 0.42 0.00 0.00 0.00
DEDT 0.03 0.05 0.00 0.09 -0.01 0.00 -0.01 0.05 0.000.00 0.00 0.79 0.00 0.38 0.68 0.12 0.00 0.99
EARNINGS_VOLT 0.07 0.17 0.03 -0.07 0.01 0.12 0.05 -0.04 -0.03 0.040.00 0.00 0.01 0.00 0.29 0.00 0.00 0.00 0.00 0.00
75

Table 2: The Impact of Religion on Crash Risk
This table estimates the cross-sectional relation between religiosity and
future stock price crash risk. The sample covers firm-year observations with
non-missing values for all variables for the period 1971 to 2000. t-statistics
reported in parentheses are based on White standard errors corrected for firm
clustering. Year and industry fixed effects are included. *, **, and ***
indicate statistical significance at the 10%, 5%, and 1% levels, respectively.
All variables are defined in the Appendix.
Dependent Variable NCSKEWT+1 DUVOLT+1 CRASH_COUNTT+1
Test VariablesRELT -0.077** -0.055*** -0.134**
(-2.06) (-2.62) (-2.34)Control VariablesNCSKEWT 0.071*** 0.045*** 0.104***
(9.06) (10.34) (13.53)KURT -0.003*** -0.001 -0.000
(-2.83) (-1.26) (-0.40)SIGMAT 6.141*** -0.148 -4.657***
(5.40) (-0.24) (-3.37)RETT 0.353*** -0.007 -0.365***
(5.49) (-0.19) (-4.22)MBT 0.010*** 0.006*** 0.014***
(6.69) (8.23) (6.14)LEVT -0.044** -0.044*** -0.133***
(-1.99) (-3.52) (-4.03)ROET 0.040*** 0.021*** 0.071***
(4.19) (4.14) (5.46)LNSIZET 0.080*** 0.023*** 0.093***
(18.42) (9.68) (17.72)DTURNOVERT 0.357*** 0.132*** 0.430***
(4.42) (3.42) (3.62)AMT 0.187*** 0.106*** 0.211***
(5.89) (6.16) (4.42)
76

LITIG_RISKT 0.006 -0.010 -0.076(0.18) (-0.53) (-1.45)
Intercept -1.585*** -0.453*** -1.862***(-16.05) (-8.51) (-15.22)
Year fixed effects Yes Yes YesIndustry fixed effects Yes Yes YesNo. of observations 80391 80387 80404Adj. R-square 4.03% 5.03% 4.79%
Table 3: Differential Impact of Religion on Crash Risk: Governance Monitoring Mechanisms
This table estimates the cross-sectional relation between religion, governance
monitoring mechanisms, and future stock price crash risk. The sample covers
firm-year observations with non-missing values for all variables for the
period 1971 to 2000. To economize on space, all the control variables (as in
Table 2) are suppressed. t-statistics reported in parentheses are based on
White standard errors corrected for firm clustering. Year and industry fixed
effects are included. *, **, and *** indicate statistical significance at the
10%, 5%, and 1% levels, respectively. All variables are defined in the
Appendix.
Panel A: State Antitakeover StatutesDependent Variable NCSKEWT+1 DUVOLT+1 CRASH_COUNTT+1
STATEANTITAKEOVERSTATUTES
STATEANTITAKEOVERSTATUTES
STATEANTITAKEOVERSTATUTES
High Low High Low High LowTest Variables
RELT
-0.266*** -0.030
-0.159*** -0.035
-0.368*** -0.103
(-3.84) (-0.45) (-4.30) (-1.02) (-3.51) (-1.07)No. of 23046 28542 23045 28539 23047 28550
77

observationsAdj. R-square 3.41% 3.16% 4.34% 3.15% 3.67% 2.82%
Panel B: Gompers, Ishii, and Metrick’s Antitakeover Index (GINDEX)Dependent Variable NCSKEWT+1 DUVOLT+1 CRASH_COUNTT+1
GINDEX GINDEX GINDEXHigh Low High Low High Low
Test Variables
RELT
-0.392*** 0.088
-0.177*** 0.031
-0.433** 0.070
(-2.68) (0.72) (-2.70) (0.53) (-2.23) (0.39)No. of observations 5226 6545 5226 6545 5226 6546Adj. R-square 4.28% 5.08% 9.30% 8.91% 7.85% 6.58%
Panel C: Dedicated Institutional OwnershipDependent Variable NCSKEWT+1 DUVOLT+1 CRASH_COUNTT+1
DEDICATEDINSTITUTIONS
DEDICATEDINSTITUTIONS
DEDICATEDINSTITUTIONS
High Low High Low High LowTest Variables
RELT -0.065-0.148** -0.036
-0.084** -0.128 -0.113
(-1.00) (-2.18) (-1.04) (-2.46) (-1.22) (-1.13)No. of observations 20892 20893 20892 20892 20892 20895Adj. R-square 4.32% 3.55% 6% 4.54% 4.87% 3.85%Table 4: Differential Impact of Religion on Crash Risk: Risk-taking
78

This table estimates the cross-sectional relation between religion, risk-
taking, and future stock price crash risk. The sample covers firm-year
observations with non-missing values for all variables for the period 1971 to
2000. To economize on space, all the control variables (as in Table 2) are
suppressed.t-statistics reported in parentheses are based on White standard
errors corrected for firm clustering. Year and industry fixed effects are
included. *, **, and *** indicate statistical significance at the 10%, 5%, and
1% levels, respectively. All variables are defined in the Appendix.
Panel A: Financial LeverageDependent Variable NCSKEWT+1 DUVOLT+1 CRASH_COUNTT+1
FINANCIALLEVERAGE
FINANCIALLEVERAGE
FINANCIALLEVERAGE
High Low High Low High LowTest Variables
RELT
-0.119** -0.034
-0.075*** -0.036
-0.197** -0.070
(-2.30) (-0.67) (-2.65) (-1.26) (-2.52) (-0.90)No. of observations 40195 40196 40191 40196 40204 40200Adj. R-square 3.29% 5.15% 4.84% 5.81% 4.65% 5.42%
Panel B: Earnings VolatilityDependent Variable NCSKEWT+1 DUVOLT+1 CRASH_COUNTT+1
EarningsVolatility
EarningsVolatility
EarningsVolatility
High Low High Low High LowTest VariablesRELT - -0.037 - -0.019 - -0.065
79

0.110**0.090*** 0.194**
(-2.05) (-0.77) (-3.03) (-0.73) (-2.52) (-0.82)No. of observations 40189 40189 40185 40189 40201 40190Adj. R-square 3.16% 5.75% 4.18% 8.16% 3.72% 6.89%
80

Table 5: Bad News Hoarding, Restatements and Crash Risk
This table describes the mean firm-specific daily returns for the day of and the day after the restatement
announcement, the impact of the restatement on net income, and the mean and median REL for the group of
restatements with crashes versus a matched control group of restatements without crashes (matched by
industry and size). *, **, and *** indicate statistical significance at the 10%, 5%, and 1% levels,
respectively.
# ofobservations
Mean Firm-specificdailyreturns
Mean Impact of restatement on netincome (% of shareholders' equity)
MeanREL
Median REL
Treatment group:
Restatements with crash 140 -35.33% -16.91% 51.55%
50.76%
t-statistic for H0 =0 -17.43*** -2.47**
Matched Control group (matched byindustry and size):
Restatements without crash 140 -1.58% -4.80% 55.05 57.63
81

% %t-statistic for H0 =0 -2.74*** -1.56
t-statistic for difference between groups 10.54*** 2.25** 2.40** 3.92**
*
82