CRISIL Inclusix
88
CRISIL Inclusix February 2018 | Volume 4 Financial inclusion surges, driven by Jan-Dhan Yojana
-
Upload
khangminh22 -
Category
Documents
-
view
0 -
download
0
Transcript of CRISIL Inclusix

CRISIL Inclusix
February 2018 | Volume 4
Financial inclusion surges, driven by Jan-Dhan Yojana

Acknowledgement
CRISIL would like to thank the Ministry of Finance, the Reserve Bank of India, the Pension Fund Regulatory and Development Authority, the Insurance Information Bureau of India and the MicroFinance Institutions Network* for their support, guidance and contributions.
EditorialRaj Nambisan, DirectorSubrat Mohapatra, Associate DirectorVarsha D’Souza, Editor
DesignHarshal Bhavsar, Rajesh Gawade, Kedarnath Khandalkar
Analytical contactsRaman UberoiSenior Advisor, Corporate Affairs CRISIL [email protected]
Pawan AgrawalChief Analytical Officer CRISIL [email protected]
Maya VengurlekarChief Operating Officer CRISIL [email protected]
Somasekhar VemuriSenior Director, Criteria & Product DevelopmentCRISIL [email protected]
Jiju VidyadharanSenior Director, Fixed Income and Fund ServicesCRISIL [email protected]
Ramesh KarunakaranDirector, Criteria & Product DevelopmentCRISIL [email protected]
Abhijit RoyAssociate Director, LCG Finance SectorCRISIL [email protected]
Aparna KirubakaranAssociate Director, LCG Corporate SectorCRISIL [email protected]
Piyush GuptaAssociate Director, CRISIL Fixed Income and Fund ServicesCRISIL [email protected]
Richa DhariwalAssociate Director, CRISIL Fixed Income and Fund ServicesCRISIL [email protected]
Rahul MalikManager, LCG Finance SectorCRISIL [email protected]
*For the current publication, MFIN has sourced data from Equifax Credit Information Services Pvt Ltd

Foreword Financial inclusion is the key to bridging the social divide and achieving a well distributed, robust and sustainable economic growth.
CRISIL Inclusix, India’s first financial inclusion index, was launched in 2013 with the objective of creating a dependable yardstick that would become a policy input to further the cause of inclusion.
I am happy to share that this edition of CRISIL Inclusix is more comprehensive than before, and provides insights beyond banking. This time, life insurance data has been added to the index calculus to make it a more inclusive barometer.
CRISIL Inclusix, thus, weighs three service providers (banks, insurers and microfinance institutions) on four dimensions (branch, credit, deposit and insurance) now.
The analysis shows that the Jan-Dhan, Aadhaar and mobile trinity is slowly but surely making a seminal difference to financial inclusion. Since launch in August 2014, more than 31 crore Jan-Dhan accounts have been opened.
Given this one-time jump, it was important that the index be rebased. Had this not been done, and should the insurance dimension not have been taken, the all-India CRISIL Inclusix score would have shot up to 62.2 instead of 58. The move to 58.0 from 56.2 in 2015 and 50.1 in 2013 is significant progress itself.
Coming to insurance, the total number of life cover policies issued in India is 34 crore, which is barely a fifth of the 165 crore deposit accounts. And over 90% of these are savings-linked insurance products. Clearly, there exists big opportunity for more inclusion.
The district-level data for the National Pension System (NPS) was also obtained. However, given that this offering is relatively new compared with deposits or life insurance, and that its subscribers are very few compared with other pension plans, we are presenting NPS coverage separately here.
One of the key takeaways from this exercise is the conspicuous lack of a central repository of pension data in India. Setting this up will contribute to effective pension planning and policy-making, especially as India’s population ages over the coming decades.
CRISIL Inclusix as an initiative, and the additional dimensions covered in this edition, would not have been possible without the active support of the teams within the Reserve Bank of India, the MicroFinance Institutions Network, the Pension Fund Regulatory and Development Authority, and the Insurance Information Bureau of India. I would like to take the opportunity to express my gratitude and thank them for their support.
I hope that you find this report insightful and actionable, and may some of the findings here contribute to the expansion and penetration strategies of the financial services sector.
I look forward to your feedback.
Warm regards,
Ashu SuyashManaging Director & CEO
CRISIL Ltd

Contents
Notable numbers of fiscal 2016 6
Centre steps on the gas 9
Need for a financial inclusion index 11
CRISIL Inclusix 15
Conclusions 19
NPS coverage 43
Tables 53
Methodology 81

6
Notable numbers of fiscal 2016
58.0India’s financial inclusion score on a scale of 100
19.6 croreTotal credit accounts in India with banks or MFIs
164.6 croreTotal deposit accounts in India
14Districts with CRISIL Inclusix score of 100
7
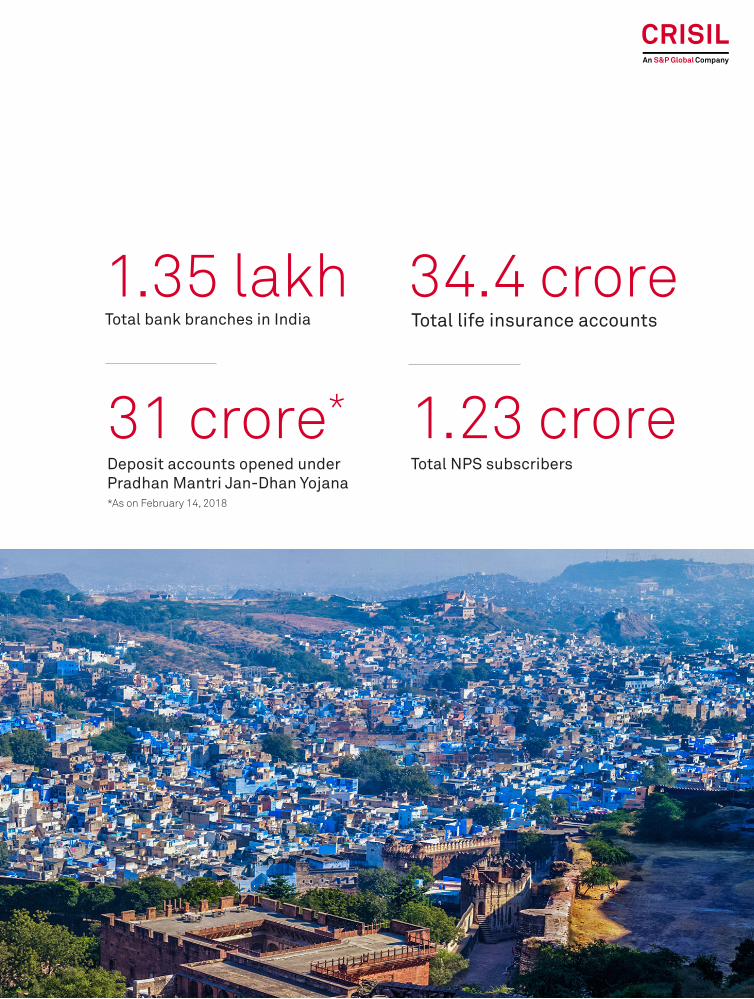
34.4 croreTotal life insurance accounts
1.23 croreTotal NPS subscribers
1.35 lakhTotal bank branches in India
31 crore*Deposit accounts opened under Pradhan Mantri Jan-Dhan Yojana*As on February 14, 2018

8

9
Centre steps on the gas

10
The central government has indeed been ratcheting up financial inclusion initiatives of late.
Recent policy measures have focussed on extend-ing insurance and social security services to the excluded sections.
The National Health Protection Scheme announced in the budget for next fiscal is a landmark initiative that aims to take basic health insurance cover to over 10 crore economically disadvantaged families.
In 2015, the government launched its life insurance scheme, the Pradhan Mantri Jeevan Jyoti Bima Yojana and the accident insurance scheme, Prad-han Mantri Suraksha Bima Yojana. The Atal Pension
Yojana (APY), which was another initiative launched that year, provides basic pension services.
The Pradhan Mantri Jan-Dhan Yojana launched in August 2014 has made astounding progress, gar-nering over 30 crore deposit accounts. While its first phase targets provision of universal access to bank facilities in all areas, except areas with connectivity constraints and increase in the level of financial literacy, the second phase provides access to credit, insurance and pension services.
A look at how some of these measures implemented in the past couple of years have impacted the over-all mandate of financial inclusion:
Cause Impact Effect
Jan-Dhan Yojana Led to 60 crore new deposit accounts or twice the number opened between fiscals 2010 and 2013. Half of the 42 crore new deposit accounts opened between fiscals 2015 and 2016 were under Jan-Dhan
DP score improved to 78.3 in 2016 from 60.3 in 2013
Focus on financial inclusion Over 2 crore new credit accounts opened during two years ended fiscal 2016
CP score inched up to 56.0 in fiscal 2016 from 45.7 in fiscal 2013, and caught up with BP
Insurance schemes Wide agency network benefited insurance penetration in the south and the west
West registered an IP score of 67.0, very close to 72.2 for the south. The east registered an IP score of 49.1: higher than the north (44.3)
APY Over 75.2 lakh subscribers were added to the National Pension System (NPS) between fiscals 2013 and 2016. Three-fourths of this pertained to the non-government segments, largely driven by APY
NPS coverage catapulted almost 3 times to 18.7 in fiscal 2016

11
Need for a financial inclusion index

12
As India forges ahead with its vision to become an economic behemoth in the next few years, the average level of prosperity among its populace and the degree of equitable distribution of wealth will, to a large extent, be determined by the scale of inclusive growth achieved.
Financial inclusion ensures that a range of appropriate financial services are available to every individual and that the individual understands and accesses those services. These include basic, no-frills banking account for making and receiving payments, savings products suited to the cash flows of poor households, money transfer facilities, small loans, overdrafts, and insurance (life and non-life).
An inclusive financial system is among the top priorities for many countries, and considered to be instrumental in achieving equitable growth. Although India has adopted several measures to advance financial inclusion, a significant percentage of its population is still without access even to basic financial services. Financial inclusion, therefore, isn’t just an economic imperative for India, but also a socio-political one.
Lack of awareness, poverty and illiteracy are among factors that lead to low demand for financial services, and consequently, to exclusion. On the supply side, distance from the branch, inconvenient branch timings, cumbersome documentation and procedures, unsuitable products, language barriers and staff attitudes contribute to exclusion. Because of the procedural hassles involved in formal banking services, people feel it is easier to borrow from informal credit sources even though it results in compromised standards of living, higher costs on account of dependence on unethical and unregulated providers, greater incidence of crime, and increased unemployment. Financial inclusion, thus, is not just about opening of saving bank accounts; it includes creation of awareness about financial products and offering of advice on money management and debt counselling.
Definition
Financial inclusion, in its broadest sense, refers to the delivery of financial services at affordable costs to all sections, including disadvantaged and low-income groups.
A committee on financial inclusion headed by Dr. C Rangarajan in 2008 defined financial inclusion as: “The process of ensuring access to financial services and timely and adequate credit where needed by vulnerable groups such as weaker sections and low income groups at an affordable cost.”
In a similar vein, Dr. Raghuram Rajan’s committee on financial sector reforms defined financial inclusion as: “Expanding access to financial services such as payment services, savings products, insurance products and inflation-protected pensions.”
CRISIL defines financial inclusion as: “The extent of access by all sections of society to formal financial services such as credit, deposit, insurance and pension services.”
The term ‘formal’ in this definition refers to service providers that maintain official books of accounts. It is important to distinguish this aspect as several non-formal channels of financing exist in the Indian rural landscape, though these cannot be considered effective.
Policymakers’ efforts
Financial inclusion is certainly not a recent phenomenon. In India, the earliest effort at financial inclusion can be traced back to 1904, to the beginning of the co-operative movement. A focal event in the evolution of financial inclusion was the bank nationalisation programme in 1969, when 14 major commercial banks were nationalised; the lead bank scheme was introduced subsequently. As a result, branches were opened in large numbers
The criticality of financial inclusion

13
across the nation, even in areas that were outside the reach of banks until then.
The agenda for financial inclusion was galvanised in the early 2000s in India following the publication of a spate of findings about the lack of financial inclusion and its direct correlation to poverty. Varied studies have proved that exclusion from the banking system results in a loss of 1% to the country’s gross domestic product (GDP).
Policymakers in India are acutely aware of the ramifications of leaving a huge section of the population out of the development process, and, hence, are designing appropriate policies for financial inclusion. Complementing the government’s efforts, the Reserve Bank of India (RBI) has, over the years, undertaken numerous initiatives such as introduction of priority sector lending requirements for banks, establishment of regional rural banks (RRBs) and self-help group-bank linkage programmes to augment the availability of financial services to the poor and marginalised segments of the society.
In February 2011, the Government of India and the Indian Banks’ Association (IBA) jointly launched Swabhimaan, a nationwide programme for financial inclusion. Swabhimaan aimed to bring the deprived sections of society into the banking network and ensure that the benefits of economic growth percolate to all levels. It looked to facilitate opening of bank accounts, provide need-based credit and remittance facilities, and promote financial literacy in rural India.
The RBI also initiated the requirement that banks provide no-frills accounts, improve the outreach of banking services through the business facilitator and business correspondent models, and set up goals to provide access to formal banking to unbanked villages. In this regard, the RBI formulated two financial inclusion plans (FIPs). The first one was rolled out for 2010-2013 targeting 74,414 unbanked villages with population more than 2,000 and achieved 99.7% of the target. The second one was for 2013-2016 targeting 491,825 unbanked villages with population less than 2,000 and achieved 96%. Following the progress of these two, the third FIP has been outlined for 2016-2019.
Recent measures
The Government of India has been strongly establishing its financial inclusion mandate. Recent policy measures have been focusing on extending insurance and social security services to the financially excluded sections. The National Health Protection Scheme announced in the Union Budget 2018-19 is a landmark measure that aims to take basic health insurance cover to over 10 crore economically disadvantaged families. In 2015, the government launched its life insurance scheme under Pradhan Mantri Jeevan Jyoti Bima Yojana and its accident insurance scheme under Pradhan Mantri Suraksha Bima Yojana – benefiting over 18 crore people. APY, another GoI initiative launched in 2015, provides basic pension services. These measures will help widen the financial inclusion goal since a slew of measures hitherto have been largely focusing only on basic bank services.
The government’s Pradhan Mantri Jan-Dhan Yojana launched in August 2014 has made remarkable progress with over 30 crore deposit accounts opened since the launch. While the first phase of Jan-Dhan Yojana targets the provision of universal access to bank facilities in all areas, except areas with connectivity constraints, and increase in the level of financial literacy, the second phase provides access to credit, insurance and pension services.
The RBI has also taken several measures to augment financial inclusion. Based on the new guidelines on differentiated banking licences for small banks and payments banks, approvals for 10 small finance banks were issued. Most of them have commenced operations. Besides, the RBI has been emphasising on financial literacy through its bank networks, complementing business correspondents with technology and actively exploring alternate delivery channels to further the financial inclusion cause. Adoption of Aadhaar and Aadhaar-based identification will also help improve financial inclusion.
CRISIL believes these measures should lead to a significant increase in the level of financial inclusion in the country over the medium term.
14
If you can’t measure it, you can’t manage it. Peter Drucker, management guru
One of the critical factors in the successful implementation of any programme is effective tracking of its progress so that course corrections can be undertaken if necessary.
Given its importance, it is necessary to measure the extent of financial inclusion. A credible tool to measure inclusion will help policymakers and market participants tangibly measure the progress achieved and align policies to further the cause of financial inclusion. Till now, most measures of financial inclusion focused on analysis of the aggregate amount of deposits or loans in a particular region. However, these measures are not comprehensive enough to incorporate different forms of financial services and do not attempt to look at the number of people included.
As the buzz around financial inclusion grew louder in the country a few years ago, CRISIL realised that its expertise and understanding of the entire financial services sector placed it in an ideal position to deliver something unique and significant to the society on this front.
Over the years, CRISIL has developed proven expertise in creating and maintaining various indices. CRISIL is the leading provider of fixed income and hybrid indices to mutual funds and insurance companies in India. More pertinently, in the context of financial inclusion, CRISIL has a deep understanding of all critical facets of the financial services sector – it has outstanding ratings on nearly 50 banks that together account for 90% of assets in the banking system. CRISIL has also evaluated more than 250 MFIs till date.
Financial awareness is vital for wealth creation, and fostering financial awareness is a key component of CRISIL’s corporate social responsibility agenda. As the leader in financial analytics, CRISIL believes that the best way for it to give back to society is by doing more of what it is good at. The financial awareness agenda fits perfectly with CRISIL’s strengths and CRISIL is proud to launch this significant initiative.
The raison d’etre

15
CRISIL Inclusix

16
CRISIL embarked on the task of designing a comprehensive methodology to create a tool that would enable policymakers and market participants to frame and align policies to further the cause of financial inclusion and tangibly measure progress.
The issues were manifold, but the principal challenges were two:
1. Development of a methodology relevant to the circumstances prevalent in India.
2. Identification and availability of data.
There were several meetings with stakeholders including the Ministry of Finance, the RBI, the IBA, commercial banks and leading industry experts – and all of them provided invaluable assistance. The methodology developed was validated by the RBI, the primary driver of innovative financial inclusion ideas in recent years.
The upshot was the evolution of a new tool that not only met, but perhaps even exceeded CRISIL’s initial expectations. CRISIL has breached yet another frontier, showing the way and pioneering the development of a comprehensive financial inclusion measurement tool, CRISIL Inclusix - the first-of-its-kind index in India.
Critical data for computing the index was provided by the RBI and the MicroFinance Institutions Network (MFIN), and the first edition of CRISIL Inclusix was published in June 2013. Subsequently, the second and third editions were published in January 2014 and June 2015, respectively
In the current edition, we have incorporated the contribution of insurance for the first time, based on data provided by Insurance Information Bureau of India (IIB), promoted by the Insurance Regulatory Development Authority of India (IRDAI). We could do this because of the scalable and modular architecture of CRISIL Inclusix.
Data of scheduled commercial banks is downloaded from https://dbie.rbi.org.in, the official website of the RBI, whereas data of MFIs was provided by MFIN, the self-regulatory organisation recognised by the RBI.
A distinct chapter on the coverage of NPS has also been included based on data provided by the Pension Fund Regulatory and Development Authority (PFRDA).
At present, data available at the district level pertains to NPS, which had 1.23 crore subscribers as of March 2016. This constitutes a small percentage (less than 10%) of the total estimated population covered under pension. Hence, including NPS coverage as a part of CRISIL Inclusix may not represent the actual coverage of pension services in the country. The reason why NPS coverage has been presented separately without including it as part of CRISIL Inclusix.
Over time, additional financial services and financial service providers could also be included, as consistent and comprehensive data become available.
Going by the response so far, it is expected that policymakers, regulators, financial service providers and other stakeholders will embrace CRISIL Inclusix wholeheartedly, and it will prove to be one of the most potent tools for broad-basing financial inclusion in years to come.
Features
The premise of CRISIL Inclusix is analogous to other well-known global indices such as
• United Nations Development Programme’s Human Development Index
Developing the index
17
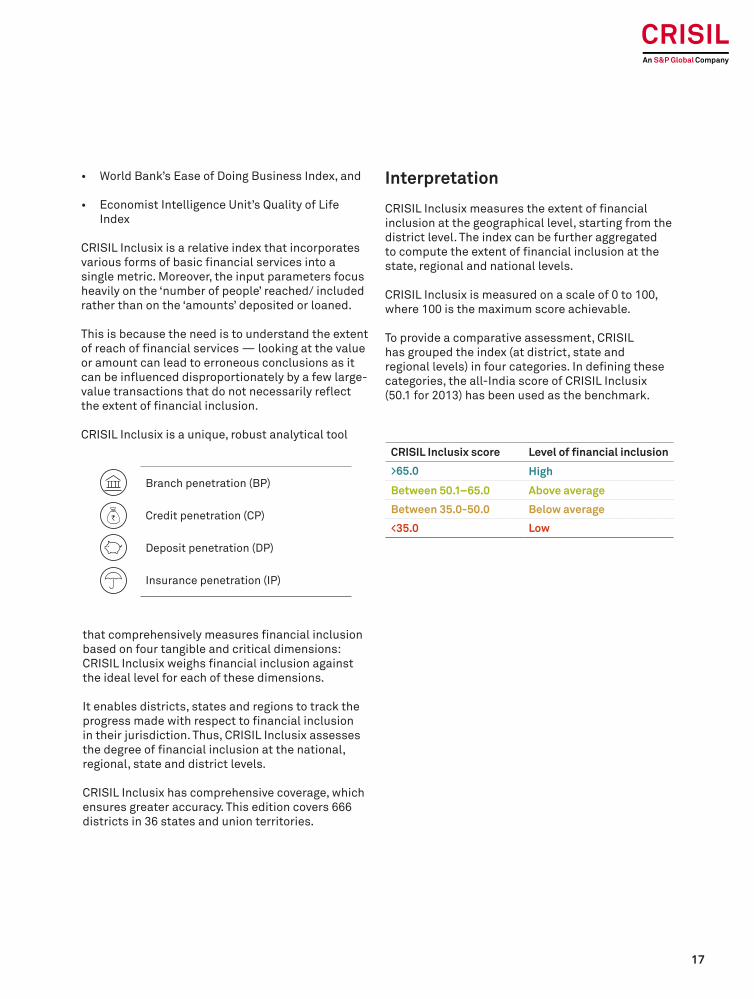
• World Bank’s Ease of Doing Business Index, and
• Economist Intelligence Unit’s Quality of Life Index
CRISIL Inclusix is a relative index that incorporates various forms of basic financial services into a single metric. Moreover, the input parameters focus heavily on the ‘number of people’ reached/ included rather than on the ‘amounts’ deposited or loaned.
This is because the need is to understand the extent of reach of financial services — looking at the value or amount can lead to erroneous conclusions as it can be influenced disproportionately by a few large-value transactions that do not necessarily reflect the extent of financial inclusion.
CRISIL Inclusix is a unique, robust analytical tool CRISIL Inclusix score Level of financial inclusion
>65.0 High
Between 50.1–65.0 Above average
Between 35.0-50.0 Below average
<35.0 Low
that comprehensively measures financial inclusion based on four tangible and critical dimensions:CRISIL Inclusix weighs financial inclusion against the ideal level for each of these dimensions.
It enables districts, states and regions to track the progress made with respect to financial inclusion in their jurisdiction. Thus, CRISIL Inclusix assesses the degree of financial inclusion at the national, regional, state and district levels.
CRISIL Inclusix has comprehensive coverage, which ensures greater accuracy. This edition covers 666 districts in 36 states and union territories.
Interpretation
CRISIL Inclusix measures the extent of financial inclusion at the geographical level, starting from the district level. The index can be further aggregated to compute the extent of financial inclusion at the state, regional and national levels.
CRISIL Inclusix is measured on a scale of 0 to 100, where 100 is the maximum score achievable.
To provide a comparative assessment, CRISIL has grouped the index (at district, state and regional levels) in four categories. In defining these categories, the all-India score of CRISIL Inclusix (50.1 for 2013) has been used as the benchmark.
Branch penetration (BP)
Credit penetration (CP)
Deposit penetration (DP)
Insurance penetration (IP)

18
Potential uses
There are several potential uses of CRISIL Inclusix for various constituents. Some thoughts and suggestions are mentioned below:
By financial service providers
• Formulation of a financial inclusion plan with measurable outcomes through use of CRISIL Inclusix.
• Continuous monitoring of implementation of the financial inclusion plan.
• Performance evaluation of field staff.
By the regulator
• Deciding differential prudential requirements for business generated from districts with low level of financial inclusion.
• Considering priority sector status to lending in areas with low levels of financial inclusion.
By government and policy makers
• Objectively measuring the level of financial inclusion.
• Designing special provisions or dispensations specifically for providers of financial services in areas with low levels of financial inclusion.
• Prioritising financial education in districts with low levels of financial inclusion.
Limitations
As is the case with any index, the effectiveness of CRISIL Inclusix is largely determined by the quantity and quality of data. Since the parameters were carefully chosen on the basis of the kind of data that is available in the districts and with various other stakeholders, the scope of CRISIL Inclusix is perforce restricted at the moment to assess the level of financial inclusion at the geographical level.
The silver lining, though, is that the tool has been designed such that as and when more varied, reliable data becomes available, the scope of the index can be expanded to measure the contribution towards financial inclusion by each player (such as banks and non-banking financial companies) as well as accommodate more parameters and refinements and encompass other forms of lending (such as by non-banking financial companies) and other financial services (including health insurance and pension). In the current edition of CRISIL Inclusix, CRISIL has added data pertaining to life insurance for the first time.
The conclusions of the report are critically dependent on data available at the district level for banks, MFIs and insurance from the RBI, MFIN and IIB, respectively, and CRISIL has not independently verified the accuracy of this data.
CRISIL has observed minor data discrepancies at the district level that have been flagged to the RBI and MFIN. Additionally, one person can have multiiple bank accounts or insurance policies. However, these have had no bearing on the final conclusions because of the robust methodology.
Another limitation is that the data used in the analysis is granular and available with a lag. This report, for instance, assesses the extent of financial inclusion up to March 2016.
Further, insurance data is available only for fiscal 2016. Hence, insurance data could not be combined with the bank and MFI data for prior years for a like-to-like inter-temporal comparison. Even MFI data is available from fiscal 2013 onwards.
19
Conclusions

20
This is the fourth edition of CRISIL Inclusix, India’s most comprehensive and granular index that measures the progress of financial inclusion across 666 districts of India (as of end-2016).
In this edition, we have updated CRISIL Inclusix scores based on data downloaded from the official website of the RBI until March 31, 2016 (latest available). For the first time, we have measured the contribution of insurance (life) based on data from IIB. We have also measured the contribution of MFIs over the years. In the previous edition, the contribution of MFIs was measured only for 2013.
Financial inclusion gathers strength
The all-India CRISIL Inclusix registered a score of 58.0 at the end of fiscal 2016, propelled by two major factors:
1. Significant increase in the number of deposit accounts, largely because of the Jan-Dhan initiative.
2. Sharp increase in the number of credit accounts across regions.
The score would have been even higher at 62.2 if we exclude the effect of rebasing and insurance.
Jan-Dhan Yojana drives strong momentum in deposit accounts
Strong momentum in banking services was reflected in a sharp increase in the number of deposit accounts. As many as 60 crore deposit accounts were opened between fiscals 2013 and 2016 – twice the number opened between fiscals 2010 and 2013. Nearly, one-third of these were on account of Jan-Dhan.
Strong growth in number of credit accounts, MFIs contribute too
The number of credit accounts increased sharply over two years ended fiscal 2016. MFI credit accounts also witnessed a spike. Notably, MFIs contributed significantly to the financially underpenetrated regions.
Despite strong growth in credit accounts in fiscal 2016, only 20 crore borrowers have access to credit. CP remained low at 56.0 compared with 78.3 for DP. It is important to deepen credit penetration to improve the overall financial inclusion score.
Banks focus on digital channels, as branch growth moderates
New branch openings dropped in fiscal 2016 owing to the proliferation of digital channels (mobile phones/internet) for delivery of financial products.
Number of life insurance policies low
The number of life insurance policies at 34 crore is also fairly low compared with 165 crore deposit accounts. Over 90% of these pertain to savings-linked insurance products.
South leads, but other regions catching up
The south retained its top position with a significant margin, though other regions are slowly catching up. It is important to sustain the momentum to close the gap. While the west and the east benefited from the inclusion of insurance as a dimension, the north and the east gained from MFIs. Though there has been significant growth in the number of microfinance loan accounts in the north-east as
Key takeaways

21
well, the number of microfinance loan accounts in the region is still fairly low.
Success stories
Kerala attains the top spot for the first time
For the first time, Kerala moved to the top spot with a CRISIL Inclusix score of 90.9. This is way ahead of the all-India CRISIL Inclusix score of 58.0. Almost all the districts enjoy a high score on CRISIL Inclusix.
Goa benefits from deep insurance penetration
Goa moved to the second spot from the fourth. High level of insurance penetration has been a good augury for this state. It scored 100 in branch, deposit and insurance penetration.
Rajasthan moves to ‘above average’ from ‘below average’
For the first time, Rajasthan moved to ‘above average’ from ‘below average’ by reaching a CRISIL Inclusix score of 50.9 in fiscal 2016 versus 39.4 in fiscal 2013. Increase in credit and deposit penetration improved the state’s position.
Haryana climbs to ‘high’ from ‘above average’
In another first, Haryana climbed to ‘high’ from ‘above average’ with a CRISIL Inclusix score of 67.7 in fiscal 2016 against 53.2 in fiscal 2013. Haryana, similar to Rajasthan, enjoyed significant improvement in credit and deposit penetration.

22
Findings, rankings and trends
The CRISIL Inclusix rankings and scores discussed are based on analysis and calculations for the year ended March 31, 2016.
The conclusions and scores have also been compared with the CRISIL Inclusix scores of the previous years to assess improvement or deterioration, if any, in the degree of financial inclusion.
And for the first time, we have added insurance as a new dimension, based on data received from IIB, promoted by IRDA. We could do so because of the scalable and modular architecture of CRISIL Inclusix.
Data of scheduled commercial banks is downloaded from https://dbie.rbi.org.in, the RBI’s official website, whereas data of microfinance institutions (MFIs) is received from MFIN.
The national scene
Jan-Dhan Yojana lends momentum to financial inclusion
The all-India CRISIL Inclusix score for India improved to 58.01 at the end of fiscal 2016 (chart 1) from 50.12 at the end of fiscal 2013 driven by two factors:
• Significant increase in the number of deposit accounts largely because of Jan-Dhan Yojana.
• Sharp increase in the number of credit accounts across regions.
The score would have been higher at 62.2 if we exclude the effect of rebasing and insurance.
Chart 1: Inclusion on an uptrend
1 The index value of 58.0 for fiscal 2016 is not comparable with the index value for previous years, as data for insurance is available only for fiscal 2016. Moreover, the index has been rebased from fiscal 2014 onwards based on the progress made over the years and the latest distribution of parametric values across districts.2The index value of 50.1 for fiscal 2013 is also not comparable with the index value for previous years, as data for MFIs is available only from fiscal 2013 onwards.
35.4 37.6 40.1 42.850.1 53.2 56.2 58.0
54.857.4
62.2
0
10
20
30
40
50
60
2009 2010 2011 2012 2013 2014 2015 2016
Excluding effect of rebasing and addition of life insurance
MFI data included from fiscal 2013Insurance data availableonly for fiscal 2016
23
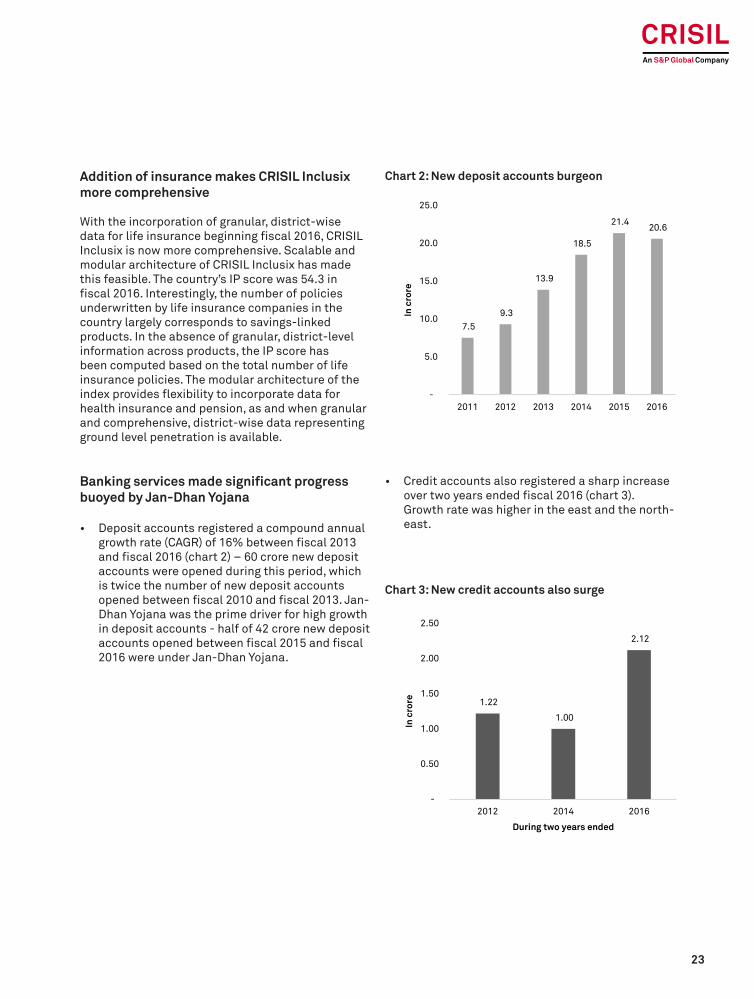
Addition of insurance makes CRISIL Inclusix more comprehensive
With the incorporation of granular, district-wise data for life insurance beginning fiscal 2016, CRISIL Inclusix is now more comprehensive. Scalable and modular architecture of CRISIL Inclusix has made this feasible. The country’s IP score was 54.3 in fiscal 2016. Interestingly, the number of policies underwritten by life insurance companies in the country largely corresponds to savings-linked products. In the absence of granular, district-level information across products, the IP score has been computed based on the total number of life insurance policies. The modular architecture of the index provides flexibility to incorporate data for health insurance and pension, as and when granular and comprehensive, district-wise data representing ground level penetration is available.
Banking services made significant progress buoyed by Jan-Dhan Yojana
• Deposit accounts registered a compound annual growth rate (CAGR) of 16% between fiscal 2013 and fiscal 2016 (chart 2) – 60 crore new deposit accounts were opened during this period, which is twice the number of new deposit accounts opened between fiscal 2010 and fiscal 2013. Jan-Dhan Yojana was the prime driver for high growth in deposit accounts - half of 42 crore new deposit accounts opened between fiscal 2015 and fiscal 2016 were under Jan-Dhan Yojana.
Chart 2: New deposit accounts burgeon
7.5 9.3
13.9
18.5
21.4 20.6
-
5.0
10.0
15.0
20.0
25.0
2011 2012 2013 2014 2015 2016In
cro
re
Chart 3: New credit accounts also surge
• Credit accounts also registered a sharp increase over two years ended fiscal 2016 (chart 3). Growth rate was higher in the east and the north-east.
1.22
1.00
2.12
-
0.50
1.00
1.50
2.00
2.50
2012 2014 2016
In c
rore
During two years ended

24
• Microfinance branches registered a modest CAGR of 5% between fiscal 2013 and fiscal 2016.
• Bank branches showed progress between fiscal 2013 and fiscal 2016, albeit at a modest CAGR of 7%. The number of new bank branches opened in fiscal 2016 was the lowest in the past six years (chart 4). With increasing penetration of mobile phones, the idea of branchless banking is gaining popularity, resulting in moderate growth of bank branches. However, we expect the number of new bank branches to increase over the medium term because of small finance banks.
Chart 4: Fewer bank branches opened
Chart 5: New MFI loan accounts3 spurt
Chart 6: New MFI branches3 improve
5,158
8,688 8,473
11,686
9,517
4,382
-
2,000
4,000
6,000
8,000
10,000
12,000
14,000
2011 2012 2013 2014 2015 2016
MFIs3 also chip in
• MFIs play a crucial role in financial inclusion owing to strong presence in the unbanked and under-banked regions, especially in semi-urban and rural India. Healthy growth (19% CAGR) in the number of microfinance credit accounts was witnessed between fiscal 2013 and fiscal 2016.
3 It is pertinent to note that the movement across parameters for MFIs in fiscal 2015 is on account of transformation of a large MFI into a bank
0.37
0.17
0.88
-
0.10
0.20
0.30
0.40
0.50
0.60
0.70
0.80
0.90
1.00
2014 2015 2016
In c
rore
(106)
(1,351)
2,712
(2,000)
(1,500)
(1,000)
(500)
-
500
1,000
1,500
2,000
2,500
3,000
2014 2015 2016
25
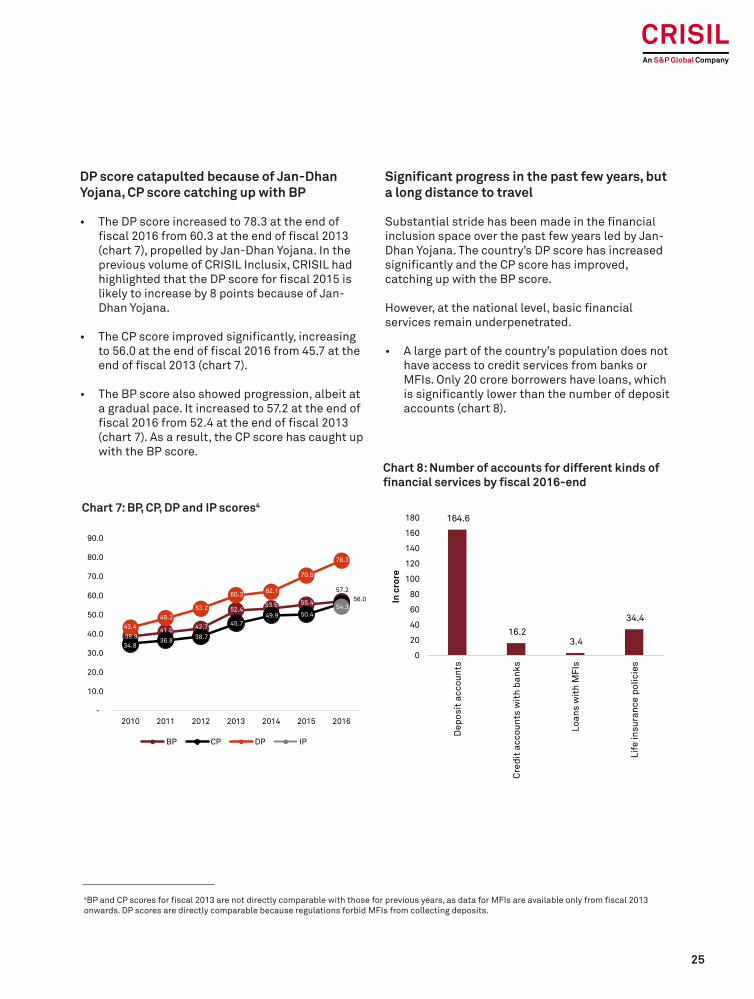
DP score catapulted because of Jan-Dhan Yojana, CP score catching up with BP
• The DP score increased to 78.3 at the end of fiscal 2016 from 60.3 at the end of fiscal 2013 (chart 7), propelled by Jan-Dhan Yojana. In the previous volume of CRISIL Inclusix, CRISIL had highlighted that the DP score for fiscal 2015 is likely to increase by 8 points because of Jan-Dhan Yojana.
• The CP score improved significantly, increasing to 56.0 at the end of fiscal 2016 from 45.7 at the end of fiscal 2013 (chart 7).
• The BP score also showed progression, albeit at a gradual pace. It increased to 57.2 at the end of fiscal 2016 from 52.4 at the end of fiscal 2013 (chart 7). As a result, the CP score has caught up with the BP score.
Significant progress in the past few years, but a long distance to travel
Substantial stride has been made in the financial inclusion space over the past few years led by Jan-Dhan Yojana. The country’s DP score has increased significantly and the CP score has improved, catching up with the BP score.
However, at the national level, basic financial services remain underpenetrated.
• A large part of the country’s population does not have access to credit services from banks or MFIs. Only 20 crore borrowers have loans, which is significantly lower than the number of deposit accounts (chart 8).
Chart 7: BP, CP, DP and IP scores4
Chart 8: Number of accounts for different kinds of financial services by fiscal 2016-end
4BP and CP scores for fiscal 2013 are not directly comparable with those for previous years, as data for MFIs are available only from fiscal 2013 onwards. DP scores are directly comparable because regulations forbid MFIs from collecting deposits.
38.9 41.0 42.7
52.4 53.5 55.4
57.2
34.8 36.8 38.7
45.7 49.9 50.4
56.0
43.4 48.3
53.2
60.3 62.1
70.5
78.3
54.3
-
10.0
20.0
30.0
40.0
50.0
60.0
70.0
80.0
90.0
2010 2011 2012 2013 2014 2015 2016
BP CP DP IP
164.6
16.2 3.4
34.4
0
20
40
60
80
100
120
140
160
180
Dep
osit
acc
ount
s
Cre
dit
acco
unts
wit
h ba
nks
Loan
s w
ith
MFI
s
Life
insu
ranc
e po
licie
s
In c
rore

26
• The number of life insurance policies at 34 crore is also fairly low compared with 165 crore deposit accounts. Over 90% of these policies pertain to savings-linked insurance products.
• Population covered under various pension schemes is low. NPS subscribers are lower at 1.23 crore as of the end of fiscal 2016. CRISIL has analysed the level of NPS coverage in detail in a distinct chapter. The same could not be included in CRISIL Inclusix owing to the absence of granular district-level data for a large number of subscribers, who are covered under various other pension schemes.
• Moreover, the gap between the south and the rest remains wide. While CP has been a drag on the overall Inclusix score, it is the frontrunner in the south. Consequently, the region’s CP score is nearly one-and-half times the all-India number. The region also outperforms other regions in the IP score, supported by the presence of a large agency network.
The improvement in Inclusix could be much faster with increased focus on enhancing branch and credit penetration beyond the south. Branch and credit penetration is currently highly focused in the south and large cities, and needs to be expanded to other regions. Tailwinds from policy steps such as differentiated banking licences are expected to expand branch and credit services in other regions, and boost financial inclusion over the medium term. However, policy makers will have to continue to incentivise expansion of branch and credit in districts with low CRISIL Inclusix score to hasten financial inclusion across the country. Protection-linked insurance products and pension schemes also need to be expanded significantly.

27
The south continued to lead in deposit penetration with a score of 95.3 at the end of fiscal 2016 (chart 10). Other regions have also displayed significant improvement because of a large number of new deposit accounts opened under the Jan-Dhan Yojana. The improvement was substantial in the
east followed by the north-east and the north. Resultantly, the all-India DP score witnessed a significant improvement. However, the north-east and the east continue to lag the all-India DP score, indicating scope for improvement.
Chart 10: Region-wise DP scores for fiscal 2016
DP score for south inches towards 100, other regions also improved a lot because of Jan-Dhan Yojana
Chart 9: Region-wise CRISIL Inclusix scores for fiscal 2016
The regional sceneSouth on top, though gap with others narrowing because of insurance
The south continues to lead with a score of 79.8, substantially higher than the all-India Inclusix score of 58.0 (chart 9). It not only leads overall, but also in all the four dimensions of financial inclusion. However, with the incorporation of insurance, other regions have closed the gap with the south. Stronger
presence of insurance in the west has helped it score higher than all-India score. The east has also benefitted from sizable insurance penetration and has inched closer to the north.
79.8
62.851.7
48.2 46.5
0.0
10.0
20.0
30.0
40.0
50.0
60.0
70.0
80.0
90.0
South West North East North-east
58.0
95.3
78.5 77.068.1
63.7
0.0
20.0
40.0
60.0
80.0
100.0
120.0
South West North East North-east
78.3

28
The widest regional disparity in CP scores continues with the south being way ahead of other regions (chart 12). This indicates the prevalence of credit culture in the south through formal channels. At the end of fiscal 2016, the south’s CP score of 91.6 was
one-and-half-times the all-India number of 56.0. The west has crossed the all-India average for the first time. The east and the north-east have also shown remarkable improvement in the recent past, benefitting from the sizable presence of MFIs.
Chart 12: Region-wise CP scores for fiscal 2016
CP score differentiates south, places it miles ahead
The south’s BP score at 77.3 at the end of fiscal 2016 (chart 11) is significantly higher than the all-India average of 57.2. The west’s BP score of 60.1 was marginally higher than the all-India average, whereas the north with a BP score of 55.9 was marginally lower. Again, the east and the north-east
lagged with scores of 42.8 and 42.5, respectively. The east and the north-east, however, are expected to benefit from the advent of new and differentiated banks, and improve their BP score over the medium term.
Chart 11: Region-wise BP scores for fiscal 2016
BP score reinforces southern supremacy
77.3
60.155.9
42.8 42.5
0.0
10.0
20.0
30.0
40.0
50.0
60.0
70.0
80.0
90.0
South West North East North-east
57.2
91.6
59.1
44.8 42.547.7
0.0
10.0
20.0
30.0
40.0
50.0
60.0
70.0
80.0
90.0
100.0
South West North East North-east
56.0

29
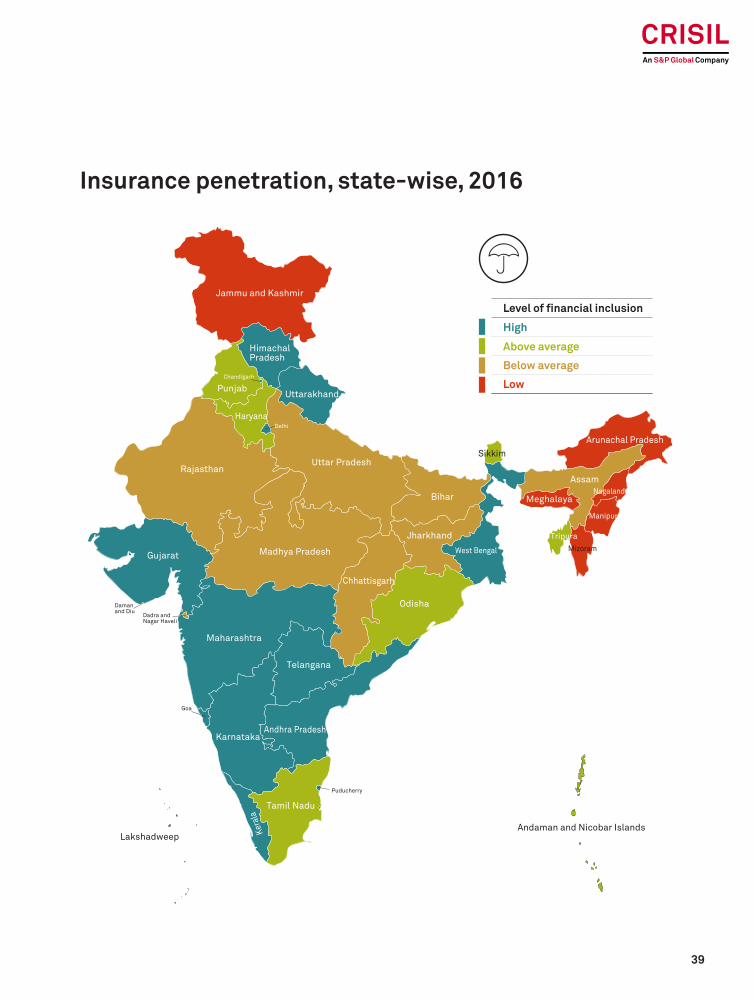
Benefitting from a wide network of agents, the south and the west have built considerable lead in IP scores over the other regions (chart 13). The east has outperformed the north and enjoys a comfortable
lead over the latter in IP scores. The north-east lags the most with a score of 41.5. IP scores are, however, largely driven by savings-linked products.
Chart 13: Region-wise IP scores for fiscal 2016
South also leads in IP score, closely followed by west
Variation within the region was the least in the south, as indicated by the coefficient of variation of 0.18 (table 1). The highest variation continues to be
in the north-east, indicating the presence of remote areas with difficult terrain which poses a challenge to financial inclusion.
The number of deposit and credit accounts witnessed a sharp increase in the east and the north-east in fiscal 2016 (chart 14). These are moves
in the right direction, which will narrow the gap of these regions with others.
Table 1: Coefficient of variation in financial inclusion across districts
Region 2016 2015 2014
South 0.18 0.16 0.18
West 0.28 0.29 0.31
North 0.32 0.33 0.35
East 0.34 0.36 0.36
North-east 0.41 0.41 0.42
India 0.36 0.37 0.39
South also demonstrates least variability across districts
Banking services in east and north-east increase sharply
72.267.0
44.349.1
41.5
0.0
10.0
20.0
30.0
40.0
50.0
60.0
70.0
80.0
South West North East North-east
54.3

30
Nearly 60% of incremental loan accounts opened by MFIs in fiscal 2016 are in the north and the east (chart 15). This helped the regions narrow the gap in their CP scores with the south and the west. Though
there has been significant growth in the number of microfinance loan accounts in the north-east as well, the number is still fairly low.
Key focus areas to reduce disparity in performance across regions would be:
• Improve all the three dimensions (BP, CP, IP) in the east and the north-east.• Improve CP and IP in the north.
Chart 15: Growth in microfinance loan accounts across regions in fiscal 2016
MFIs playing pivotal role in credit penetration in north and east
Chart 14: Growth in banking services across regions in fiscal 2016
24.6%
27.2%
46.9%
43.0%
46.8%
South
West
North
East
North-East
Growth in microfinance loan accounts
3.2% 2.2% 3.5% 3.9%6.4%
3.3%
18.4%
12.4%
29.2%
45.4%
7.2%10.7%
17.0%
22.4%20.1%
South West North East North-east
Bank branches Credit accounts Deposit accounts
31
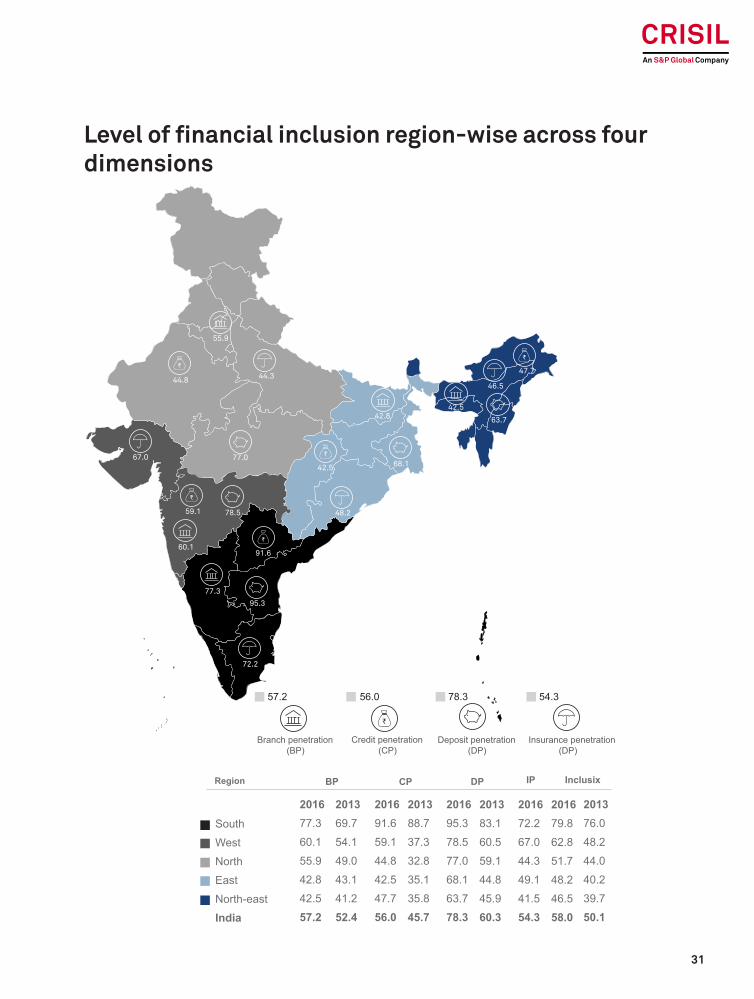
Level of financial inclusion region-wise across four dimensions
77.3
95.3
72.2
91.660.1
59.1 78.5
67.0 77.0
44.844.3
55.9
42.8
42.5
48.2
68.1
63.7
42.5
46.5
47.7
South
West
North
East
North-east
India
Region BP IP
2016
77.3
60.1
55.9
42.8
42.5
57.2
2013
69.7
54.1
49.0
43.1
41.2
52.4
CP DP
2016
91.6
59.1
44.8
42.5
47.7
56.0
2013
88.7
37.3
32.8
35.1
35.8
45.7
2016
95.3
78.5
77.0
68.1
63.7
78.3
2013
83.1
60.5
59.1
44.8
45.9
60.3
2016
72.2
67.0
44.3
49.1
41.5
54.3
2016
79.8
62.8
51.7
48.2
46.5
58.0
Inclusix
2013
76.0
48.2
44.0
40.2
39.7
50.1
Credit penetration(CP)
56.0
Deposit penetration(DP)
78.3
Branch penetration(BP)
57.2
Insurance penetration(DP)
54.3

32
South continues to lead, but other outper-formers are emerging
Six of the top 10 states/union territories are from the south, while six of the bottom 10 states/union territories are from the north-east.
CRISIL has rebased the scores for categorisation into ‘high’, ‘above average’, ‘below average’ and ‘low’. Interestingly, 14 states/union territories have ‘high’ level of financial inclusion as of the end of fiscal 2016.
• Haryana moved up to ‘high’ from ‘above average’.
• Rajasthan moved up to ‘above average’ from ‘below average’.
• Odisha and Lakshadweep slipped to ‘above average’ from ‘high’ on account of rebasing and lower insurance penetration, respectively.
• Mizoram, Uttar Pradesh, Jammu & Kashmir and Madhya Pradesh slipped to ‘below average’ from ‘above average’ owing to rebasing.
• Nagaland, Meghalaya and Arunachal Pradesh slipped to ‘low’ from ‘below average’ because of rebasing.
Kerala attains the top rank for the first time
• Kerala attained the top spot for the first time with a CRISIL Inclusix score of 90.9.
• All the districts in the state except Malappuram scored ‘high’ on CRISIL Inclusix.
− Malappuram’s score is ‘above average’ because of moderate level of insurance penetration.
• Five districts from the state attained a CRISIL Inclusix score of 100 and 10 districts scored 90 or higher.
Goa also benefits from high insurance pen-etration and moves to second spot in overall ranking
• Benefiting from a high level of insurance penetration, Goa moved to the second rank from fourth.
• Both the districts from the state - North Goa and South Goa - scored well across all the dimensions.
• The state scored a perfect 100 in BP, DP and IP.
• Though the CP score is high at 77.8, there is scope for further improvement.
Mizoram slips
• With Inclusix score of 43.2, Mizoram slipped in ranks to the bottom six.
• This is despite significant improvement in BP, CP and DP as the state ranks lowest in terms of IP, which pulled down the state’s CRISIL Inclusix score.
• Seven out of eight districts got an IP score of below 10, and two districts below 1.
Other key findings
• The top five states are Kerala, Goa, Puducherry, Chandigarh and Delhi.
Status of states

33
• All north-eastern states, except for Tripura and Sikkim, feature in the bottom 10.
The divergence in performance across states and regions is the widest on the CP front (refer to maps on the following pages).
Table 2: Top scoring states on CRISIL Inclusix
Large states Small states/ Union territories
Kerala Goa
Karnataka Puducherry
Andhra Pradesh Chandigarh
Table 3: Bottom scoring states on CRISIL Inclusix
Large states Small states/ Union territories
Bihar Manipur
Uttar Pradesh Nagaland
Assam Meghalaya

34
Andhra Pradesh
Arunachal Pradesh
Assam
Bihar
Chhattisgarh
Goa
Gujarat
Haryana
Himachal Pradesh
Jammu and Kashmir
Jharkhand
Karnataka
Ker
ala
Madhya Pradesh
Maharashtra
Manipur
Meghalaya
Mizoram
Nagaland
Punjab
Rajasthan
Sikkim
Tamil Nadu
Tripura
Uttar Pradesh
Uttarakhand
West Bengal
Chandigarh
Dadra and Nagar Haveli
Daman and Diu
Delhi
Telangana
Andaman and Nicobar IslandsLakshadweep
Odisha
Puducherry
Picture of progress: How states fared in 2014...
Level of financial inclusion
High
Above average
Below average
Low

35
...and 2016 on financial inclusion
Andhra Pradesh
Arunachal Pradesh
Assam
Bihar
Chhattisgarh
Goa
Gujarat
Haryana
Himachal Pradesh
Jammu and Kashmir
Jharkhand
Karnataka
Ker
ala
Madhya Pradesh
Maharashtra
Manipur
Meghalaya
Mizoram
Nagaland
Punjab
Rajasthan
Sikkim
Tamil Nadu
Tripura
Uttar Pradesh
Uttarakhand
West Bengal
Chandigarh
Dadra and Nagar Haveli
Daman and Diu
Delhi
Telangana
Andaman and Nicobar IslandsLakshadweep
Odisha
Puducherry
Level of financial inclusion
High
Above average
Below average
Low
Note: Data for fiscal 2016 includes life insurance, which is not the case for fiscal 2014

36
Andhra Pradesh
Arunachal Pradesh
Assam
Bihar
Chhattisgarh
Goa
Gujarat
Haryana
Himachal Pradesh
Jammu and Kashmir
Jharkhand
Karnataka
Ker
ala
Madhya Pradesh
Maharashtra
Manipur
Meghalaya
Mizoram
Nagaland
Odisha
Punjab
Rajasthan
Sikkim
Tamil Nadu
Tripura
Uttar Pradesh
Uttarakhand
West Bengal
Chandigarh
Dadra and Nagar Haveli
Daman and Diu
Delhi
Puducherry
Telangana
Andaman and Nicobar IslandsLakshadweep
Branch penetration, state-wise, 2016
Level of financial inclusion
High
Above average
Below average
Low
37
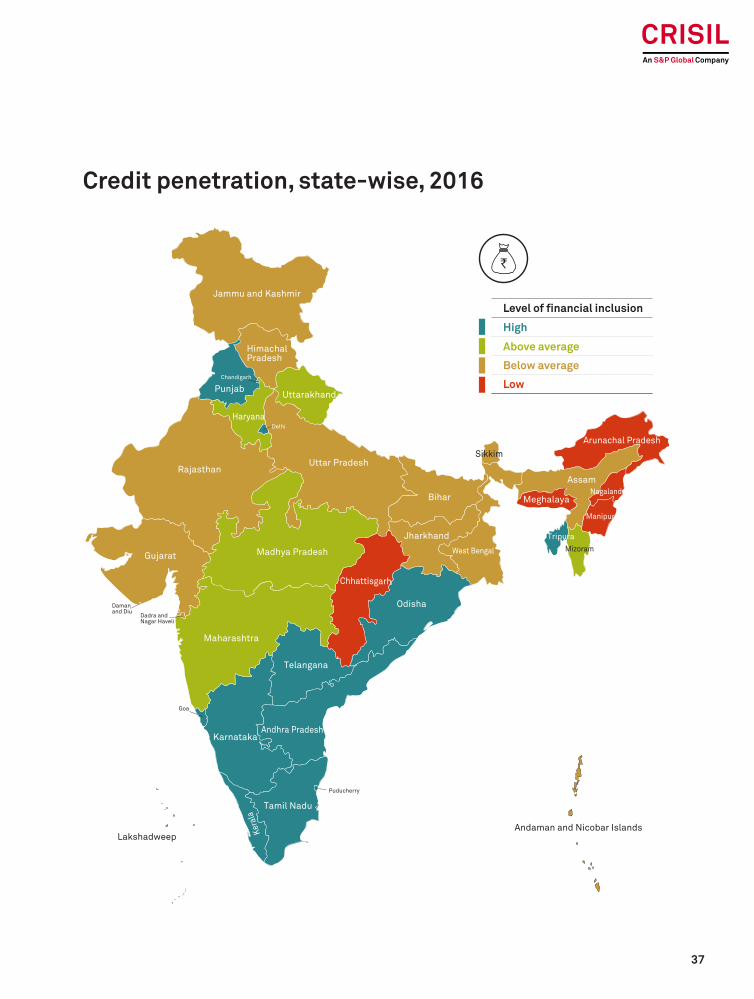
Credit penetration, state-wise, 2016
Andhra Pradesh
Arunachal Pradesh
Assam
Bihar
Chhattisgarh
Goa
Gujarat
Haryana
Himachal Pradesh
Jammu and Kashmir
Jharkhand
Karnataka
Ker
ala
Madhya Pradesh
Maharashtra
Manipur
Meghalaya
Mizoram
Nagaland
Punjab
Rajasthan
Sikkim
Tamil Nadu
Tripura
Uttar Pradesh
Uttarakhand
West Bengal
Chandigarh
Dadra and Nagar Haveli
Daman and Diu
Delhi
Telangana
Andaman and Nicobar IslandsLakshadweep
Odisha
Puducherry
Level of financial inclusion
High
Above average
Below average
Low

38
Deposit penetration, state-wise, 2016
Andhra Pradesh
Arunachal Pradesh
Assam
Bihar
Chhattisgarh
Goa
Gujarat
Haryana
Himachal Pradesh
Jammu and Kashmir
Jharkhand
Karnataka
Ker
ala
Madhya Pradesh
Maharashtra
Manipur
Meghalaya
Mizoram
Nagaland
Punjab
Rajasthan
Sikkim
Tamil Nadu
Tripura
Uttar Pradesh
Uttarakhand
West Bengal
Chandigarh
Dadra and Nagar Haveli
Daman and Diu
Delhi
Telangana
Andaman and Nicobar IslandsLakshadweep
Odisha
Puducherry
Level of financial inclusion
High
Above average
Below average
Low
39
Insurance penetration, state-wise, 2016
Andhra Pradesh
Arunachal Pradesh
Assam
Bihar
Chhattisgarh
Goa
Gujarat
Haryana
Himachal Pradesh
Jammu and Kashmir
Jharkhand
Karnataka
Ker
ala
Madhya Pradesh
Maharashtra
Manipur
Meghalaya
Mizoram
Nagaland
Punjab
Rajasthan
Sikkim
Tamil Nadu
Tripura
Uttar Pradesh
Uttarakhand
West Bengal
Chandigarh
Dadra and Nagar Haveli
Daman and Diu
Delhi
Telangana
Andaman and Nicobar IslandsLakshadweep
Odisha
Puducherry
Level of financial inclusion
High
Above average
Below average
Low
40
South continues to dominate
District-level performances mirror the trend across states and regions. There is wide disparity in Inclusix scores across districts. Only 267 out of the 666 districts have scored more than the all-India score of 58. The dominance of the south is clearly evident with most districts from the region (100 of 107 dis-tricts) having CRISIL Inclusix scores higher than the all-India average. In the top 15 districts, 11 are from the south, five each from Karnataka and Kerala, and one from Tamil Nadu.
Fourteen districts hit the maximum CRISIL Inclusix score of 100
• 10 of the 14 are from the south. For the first time, we have districts from other regions, too.
− Two from the east (Kolkata and Khordha), one each from the west (Mumbai) and the north-east (west Tripura).
• 22 districts would have had a maximum score of 100 based on penetration of branch, credit and deposit services, and eight districts lost the maximum score owing to lower penetration on insurance services.
− Seven of the eight districts are from the south – Kerala (Thiruvananthapuram), Karnataka (Bengaluru urban, Bengaluru rural and Mysore), Tamil Nadu (Coimbatore), and Puducherry (Mahe, Karaikal).
− One from Punjab (Ferozpur).
Top 50 districts by CRISIL Inclusix score 2016
• The average CRISIL Inclusix score of top 50 is 93.7 against the national score of 58.0. BP is 95.7 (57.2), DP is 99.6 (78.3), CP is 96.1 (56.0) and IP is 93.7 (54.3).
• Of the top 50 districts in 2013, 31 remained in the list in 2016. Five districts have retained
their position among the top 10 scoring districts between 2013 and 2016. All five are from Kerala.
• Karnataka had the maximum representation in the top 50 with 13, followed by Kerala with 12.
− With the inclusion of insurance as one of the parameters, Karnataka has gained significantly in the top 50. This, because of the total 45 districts, which have achieved 100 in insurance penetration. Karnataka has the maximum representation with 16 districts.
• On the other hand, Tamil Nadu has only six districts in the top 50 as against maximum representation in 2013 with 17.
− This is because of the inclusion of insurance as one of the parameters of financial inclusion. Tamil Nadu ranks 14th in insurance penetration with several large states such as Karnataka, Telangana, Andhra Pradesh, Maharashtra, Gujarat and West Bengal ranking above Tamil Nadu in insurance penetration.
• Contrary to the national trend, the top 50 districts have shown higher improvement in BP by over 9 points. Within the top 50 districts, over 4,800 branches have been added between 2013 and 2016, accounting for one-fifth of additions.
Bottom 50 districts by CRISIL Inclusix score 2016
• The average CRISIL Inclusix score of bottom 50 is 20.5 against the national score of 58.0.
• While the average DP at 40.3 (national - 78.3) has improved significantly driven by Jhan Dhan, these districts continue to perform poorly on other parameters - BP is 26 (57.2), DP is 40.3 (78.3), CP is 14.7 (56.0) and IP is 6.9 (54.3).
• 31 districts that were in the bottom 50 in 2013 remained there.
The district-level picture

41
• The north-east has maximum number of representation in the bottom 50 – over 50%. Besides, all the bottom 10 districts are from the north-east.
• On the other hand, the east has reduced its representations in the bottom 50 to only nine districts from 14 in 2013. Seven of the nine districts are from Chhattisgarh.
Top 50 districts by population
• They comprise 24% of the total population.
• The average CRISIL Inclusix score of these districts is 62.3 compared with the all-India Inclusix score of 58.

42

43
NPS coverage
44
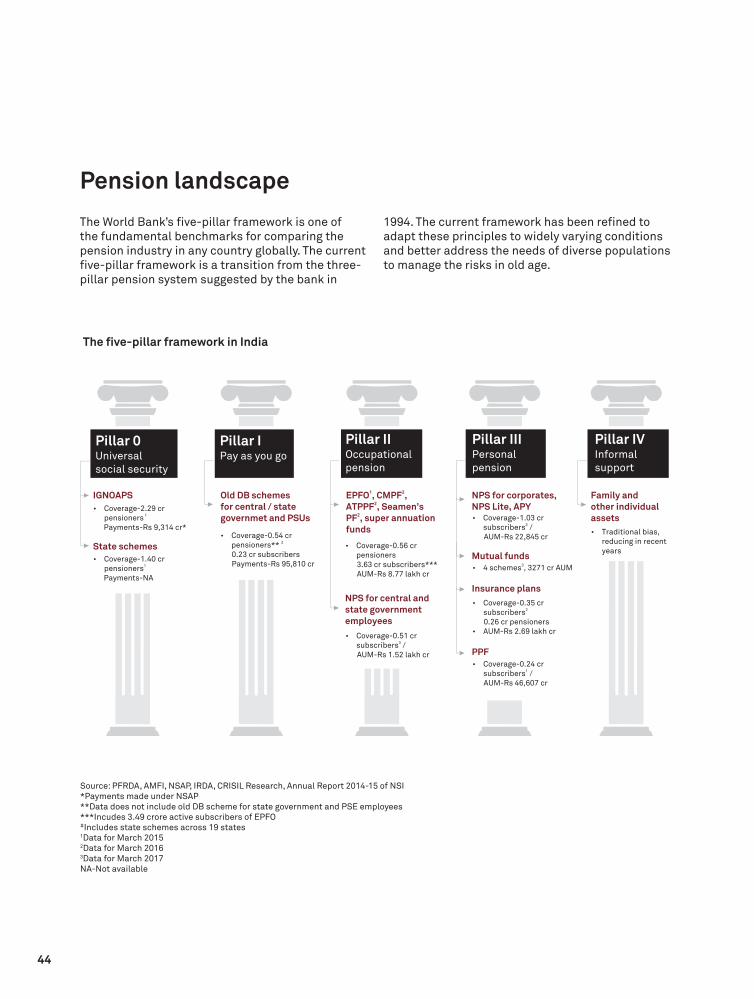
The World Bank’s five-pillar framework is one of the fundamental benchmarks for comparing the pension industry in any country globally. The current five-pillar framework is a transition from the three-pillar pension system suggested by the bank in
1994. The current framework has been refined to adapt these principles to widely varying conditions and better address the needs of diverse populations to manage the risks in old age.
The five-pillar framework in India
Pillar 0Universal social security
Pillar IPay as you go
Pillar IIIPersonal pension
Pillar IVInformal support
IGNOAPS
Coverage-2.29 cr 1pensioners
Payments-Rs 9,314 cr*
Old DB schemes for central / state governmet and PSUs
Coverage-0.54 cr 2 pensioners**
0.23 cr subscribers Payments-Rs 95,810 cr
Pillar IIOccupational pension
1 2EPFO , CMPF ,
2ATPPF , Seamen’s
2PF , super annuation funds
NPS for central and state government employees
Coverage-0.56 cr pensioners
3.63 cr subscribers*** AUM-Rs 8.77 lakh cr
Coverage-0.51 cr 3subscribers /
AUM-Rs 1.52 lakh cr
NPS for corporates, NPS Lite, APY
Mutual funds3
4 schemes , 3271 cr AUM
Insurance plans
Coverage-0.35 cr 2subscribers
0.26 cr pensioners AUM-Rs 2.69 lakh cr
PPF Coverage-0.24 cr
1subscribers / AUM-Rs 46,607 cr
Family and other individual assets
Traditional bias, reducing in recent years
Coverage-1.03 cr 3subscribers /
AUM-Rs 22,845 cr
State schemes
Coverage-1.40 cr 1pensioners
Payments-NA
Source: PFRDA, AMFI, NSAP, IRDA, CRISIL Research, Annual Report 2014-15 of NSI*Payments made under NSAP**Data does not include old DB scheme for state government and PSE employees***Incudes 3.49 crore active subscribers of EPFO#Includes state schemes across 19 states1Data for March 20152Data for March 20163Data for March 2017NA-Not available
Pension landscape
45
Pillar 0 (non-contributory):
Pillar 0 is a non-contributory social pension framework, typically financed by the government, which provides a minimal level of old age income. In India, this is provided by the central government under the Indira Gandhi National Old Age Pension Scheme (IGNOAPS) through a pension that touched over 2.3 crore people at the end of fiscal 2015.
Pillar I (mandatory – pay as you go):
Pillar I is a pay-as-you-go/ defined benefit (DB) pension framework, which is tax/expense funded, respectively, and seeks to replace some portion of pre-superannuation income. In India, this pillar was done away with for government employees in 2004, when the government transitioned from DB to defined contribution (DC) pension for all employees joining from January 2004 (excluding defence services).
Pillar II (mandatory – organised section): Pillar II is also mandatory, but in the form of direct contribution from the subscriber. Mostly, it targets the organised section of the economy. In India, this pillar has a long history in the form of Employees’ Provident Fund (EPF) but lacks depth because of the low share of the organised sector in the country’s economy.
Pillar III (voluntary):
This pillar is voluntarily opted for by subscribers. Plans such as the voluntary segment of NPS, APY, mutual fund retirement plans, pension plans from insurance companies and Public Provident Fund (PPF) come under this pillar.
Pillar IV (non-financial):
Pillar IV is family or other informal financial and non-financial support. This has been the traditional pension support in India. However, it has been failing in recent times with the onset of urbanisation and nuclear families.
NPS:
NPS is a direct contribution pension system administered and regulated by PFRDA. It is mandatory for all employees joining services of central government and central autonomous bodies on or after January 1, 2004. Most states have also made it mandatory for their employees, including for those in autonomous institutions that joined on or after their respective cut-off dates. Tamil Nadu is yet to implement the scheme, while West Bengal and Tripura are yet to adopt.
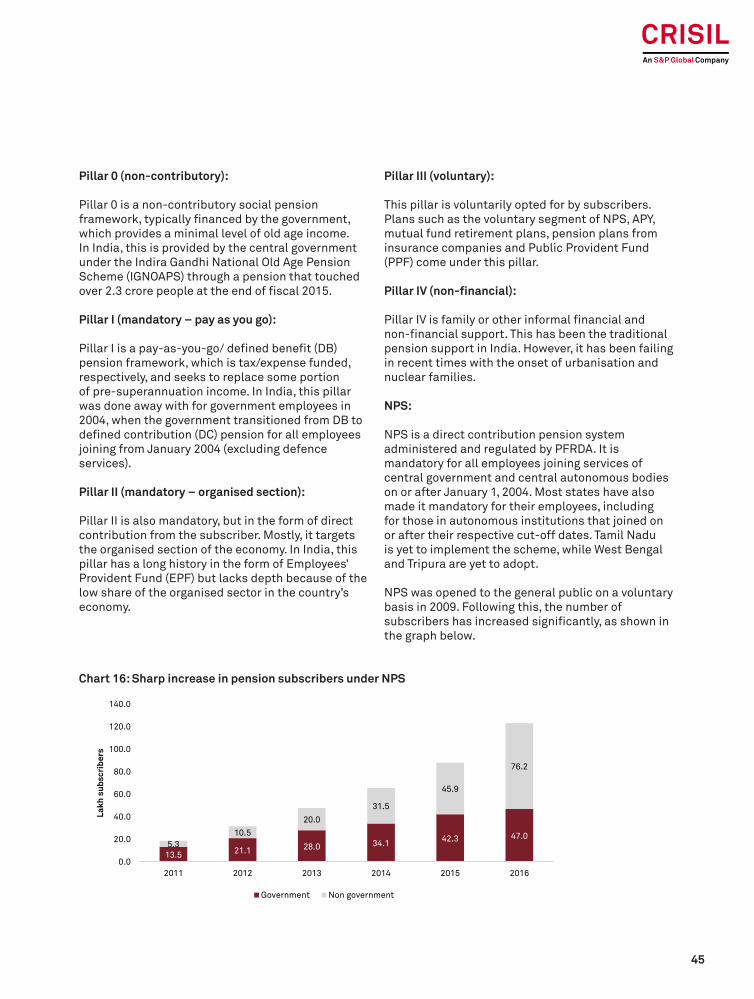
NPS was opened to the general public on a voluntary basis in 2009. Following this, the number of subscribers has increased significantly, as shown in the graph below.
Chart 16: Sharp increase in pension subscribers under NPS
13.5 21.1 28.0 34.1 42.3 47.05.3
10.520.0
31.5
45.9
76.2
0.0
20.0
40.0
60.0
80.0
100.0
120.0
140.0
2011 2012 2013 2014 2015 2016
Lakh
sub
scri
bers
Government Non government
46
NPS coverage uses two main parameters which were normalised
Parameters Significance Interpretation
Total number of NPS subscribers per lakh of population in a district
Measures the ease with which all sections in a particular territory have access to NPS
Higher the better
Total number of NPS subscribers covered under specific schemes such as APY or NPS Lite per lakh of population in a district
Measures the ease with which underprivileged people in a particular territory have access to NPS
Higher the better
Parameters
Data: NPS data was received from PFRDA. For population, same set of data has been used as is used for CRISIL Inclusix.
Since both parameters measure NPS coverage along a single dimension, the overall NPS coverage has been arrived at by giving equal weightage to total NPS and APY/NPS Lite. Giving additional
emphasis to APY/NPS Lite enables the index to better reflect the level of NPS coverage among the underprivileged.
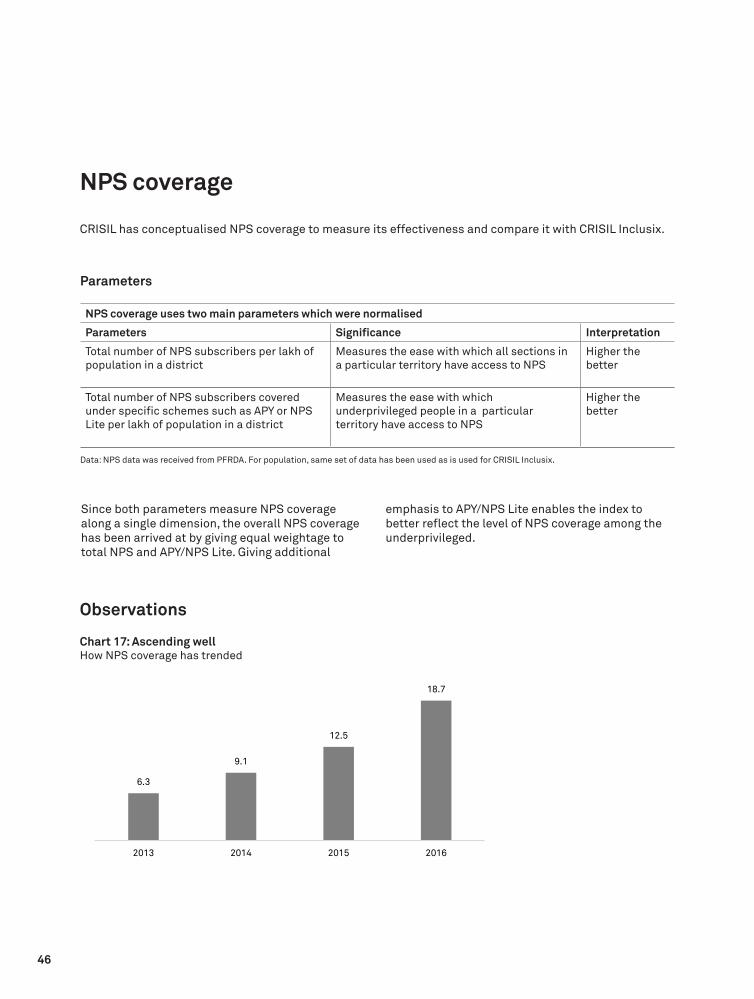
Observations
Chart 17: Ascending wellHow NPS coverage has trended
6.3
9.1
12.5
18.7
2013 2014 2015 2016
NPS coverage
CRISIL has conceptualised NPS coverage to measure its effectiveness and compare it with CRISIL Inclusix.

47
• NPS coverage rocketed threefold to 18.7 in fiscal 2016 from 6.3 in fiscal 2013, driven by two factors:
− Continuous increase in the number of government employees covered under NPS.
− Strong emphasis on bringing the economically weaker section under NPS through APY (which replaced NPS Lite in June 2015).
National level
NPS coverage remains low in large parts of India, both on an absolute basis and based on CRISIL Inclusix scores. All-India NPS coverage at 18.7 is significantly low compared with the all-India CRISIL Inclusix score of 58.
The reasons for the low level of NPS coverage are two:
1. NPS was started in 2004 and initially covered only government employees. It was opened to the public in 2009.
2. A few state governments (such as Tamil Nadu) are yet to implement the scheme, while West Bengal and Tripura are yet to adopt for employees who have joined after 2004.
Notably, however, there has been significant improvement in NPS coverage since 2013. Between fiscals 2013 and 2016, over 75.2 lakh subscribers were added to the scheme. Three-fourths of this pertained to non-government segments. The primary parameter responsible for this is the strong focus on APY. The broad-based nature of the gains showed as NPS coverage improved across all the districts analysed.
Chart 18: Trends in NPS segment mix
Chart 19: Trends in NPS growth (total, government and APY+NPS Lite + GDS)
40% 30% 24% 21% 17% 14%
31%37%
35% 31% 31%24%
26% 31% 37% 43% 47% 56%
3%4%
4%
4%2% 2% 2% 1% 1%2%
Cent. Gov State Gov
NPS Lite + APY + GDS Corporate
UOS
37%
22%
58%
34%
24%
47%
40%
11%
68%
0%
10%
20%
30%
40%
50%
60%
70%
80%
Total Gov NPS Lite + APY +GDS
2014 2015 2016
48
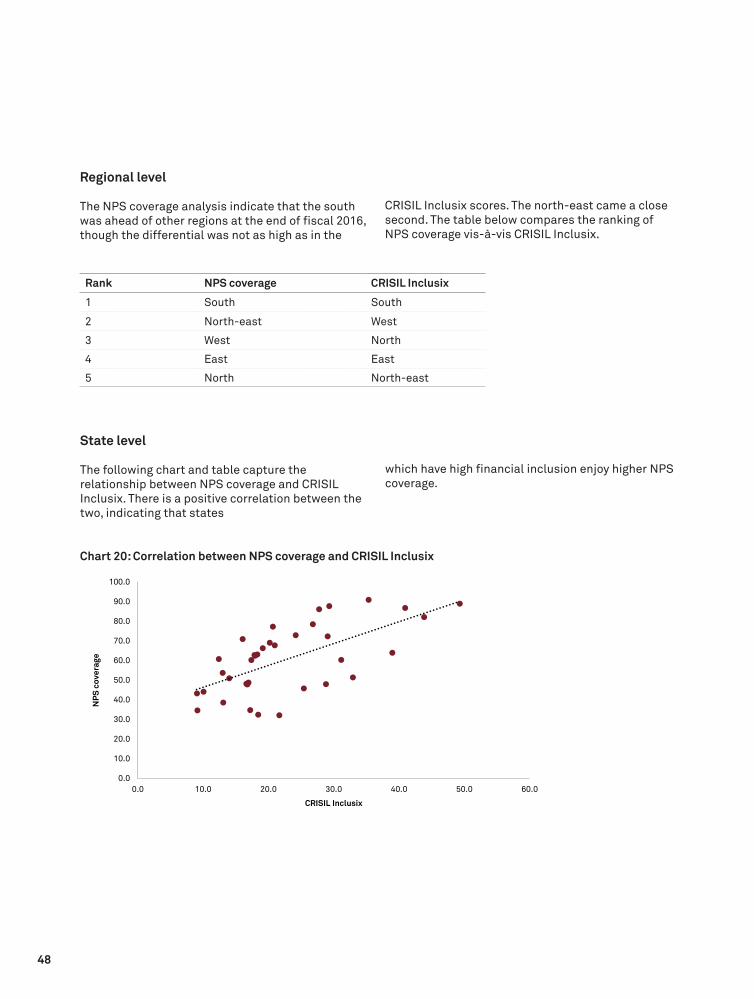
Regional level
The NPS coverage analysis indicate that the south was ahead of other regions at the end of fiscal 2016, though the differential was not as high as in the
CRISIL Inclusix scores. The north-east came a close second. The table below compares the ranking of NPS coverage vis-à-vis CRISIL Inclusix.
State level
The following chart and table capture the relationship between NPS coverage and CRISIL Inclusix. There is a positive correlation between the two, indicating that states
which have high financial inclusion enjoy higher NPS coverage.
Rank NPS coverage CRISIL Inclusix
1 South South
2 North-east West
3 West North
4 East East
5 North North-east
Chart 20: Correlation between NPS coverage and CRISIL Inclusix
0.0
10.0
20.0
30.0
40.0
50.0
60.0
70.0
80.0
90.0
100.0
0.0 10.0 20.0 30.0 40.0 50.0 60.0
NPS
cov
erag
e
CRISIL Inclusix

49
CRISIL Inclusix
High
Hig
h
Above average
Abo
ve a
vera
ge
Below average
Bel
ow a
vera
ge
Low
Low
KeralaKarnatakaGoaChandigarh
SikkimAndaman & NicobarLakshadweep
Tamil NaduAndhra PradeshPuducherryTelanganaHimachal PradeshDelhi UttarakhandHaryana
MaharashtraGujaratOdishaDaman & DiuDadra Nagar & HaveliWest Bengal Rajasthan
Uttar PradeshMadhya PradeshJharkhandJammu & KashmirBihar
NagalandArunachal Pradesh
Mizoram
Meghalaya
PunjabTripura
ChhattisgarhAssam
Manipur
NPS coverage

50
Top scoring states in terms of NPS coverage:
Large states Small states/ Union territories
Karnataka Goa
Kerala Chandigarh
Assam Andaman & Nicobar
Bottom scoring states in terms of NPS coverage:
Large states Small states/ Union territories
Uttar Pradesh Mizoram
Bihar Meghalaya
West Bengal Daman & Diu
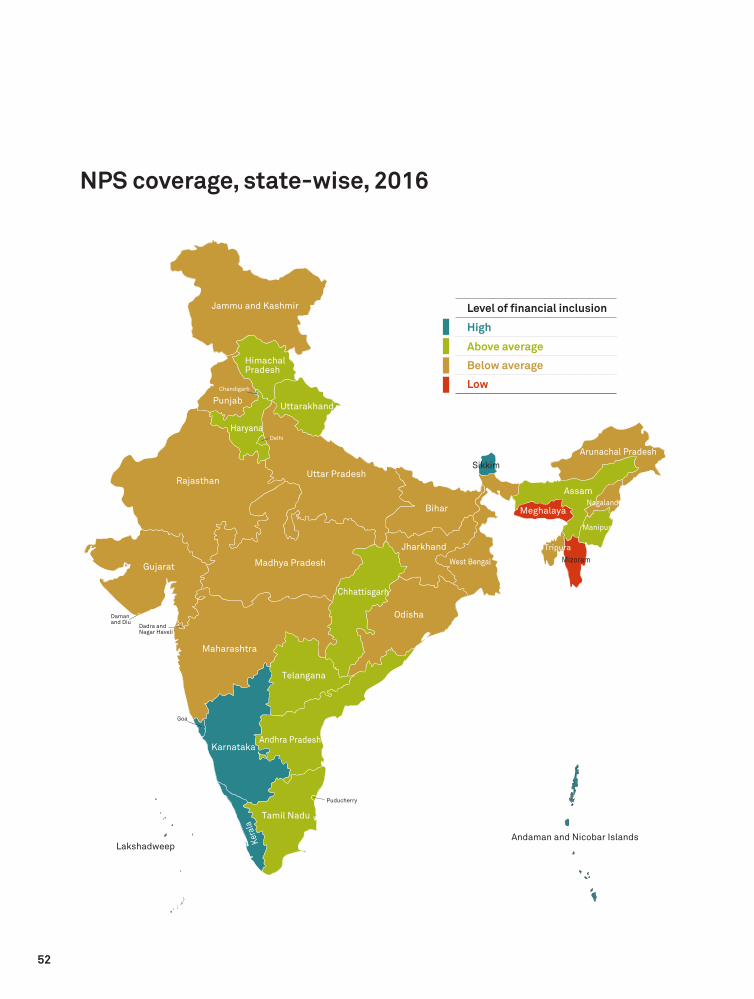
District level
The district level performance mirrored the state and regional trends discussed in the previous sections. Most districts in the south scored ‘high’ or ‘above-average’ in NPS coverage.
As many as 27 districts from the south featured in the top 50. Karnataka had the highest proportion of districts (16) in the list of top 50. The rest was mostly split between several states with no state having any high concentration of districts. Among the top 10 districts, six were from Karnataka, indicating high level of NPS coverage in the state.
Most (20) of the bottom 50 districts belonged to the north, predominantly Jammu & Kashmir (8) and Uttar Pradesh (6). The north-east also had 17 districts featuring in the bottom 50, largely from Arunachal Pradesh, Meghalaya and Mizoram.
Role of service providers
The government has opened NPS to all citizens from May 1, 2009.
This has necessitated various facilities for all citizens (known as ‘subscribers’ in the NPS architecture), such as the opening of permanent retirement account numbers and allowing them to contribute to NPS at various locations across India.
These processes are carried out through points of presence (POPs) appointed by PFRDA. POPs provide the services under NPS through their network of branches called POP service providers (POP-SP).
For government employees, drawing and disbursement offices (DDOs), and pay and accounts offices (PAOs) serve the same purpose. For instance, there were 18,331 DDOs as of March 2016 for employees of central government and central autonomous bodies. In addition, there are DDOs for employees of state government and state autonomous bodies.
The role of service providers was assessed by studying their relationship with NPS subscribers. As shown in the next graph, there is a moderate correlation between service providers (per lakh of population) and NPS subscribers (per lakh of population).
This is because apart from POP-SPs, PFRDA leverages the network utilities of over 1.25 lakh branches and the Department of Posts (20,000 offices) for registration and sourcing of subscribers. PFRDA also paved the way to increase the outreach by adding small finance banks and payment banks as new channels. In addition, e-NPS has picked up gradually.
The role of service providers could be enhanced, which, in turn, could increase NPS coverage in India.

51
Chart 21: Steady riseHow points of presence have increased*
Chart 22: Correlation between service providers* vs NPS coverage
* Only POP-SP
* Includes DDOs
8,590
15,767
28,567
33,233
37,294
55,430
2011 2012 2013 2014 2015 2016
Poin
ts o
f pre
senc
e
0
20
40
60
80
100
120
140
160
0 500 1000 1500 2000 2500 3000
NPS
(per
lakh
of p
opul
atio
n)
Service providers (per lakh of population)
52
Andhra Pradesh
Arunachal Pradesh
Assam
Bihar
Chhattisgarh
Goa
Gujarat
Haryana
Himachal Pradesh
Jammu and Kashmir
Jharkhand
Karnataka
Ker
ala
Madhya Pradesh
Maharashtra
Manipur
Meghalaya
Mizoram
Nagaland
Punjab
Rajasthan
Sikkim
Tamil Nadu
Tripura
Uttar Pradesh
Uttarakhand
West Bengal
Chandigarh
Dadra and Nagar Haveli
Daman and Diu
Delhi
Telangana
Andaman and Nicobar IslandsLakshadweep
Odisha
Puducherry
Level of financial inclusion
High
Above average
Below average
Low
NPS coverage, state-wise, 2016

53
Tables

54
CRISIL Inclusix scores CRISIL Inclusix ranks
District State 2016 2015 2014 2013 2016 2015 2014 2013
Chikmagalur Karnataka 100.0 100.0 96.1 94.1 1 1 17 15
Dharwad Karnataka 100.0 100.0 100.0 97.6 1 1 1 11
Hassan Karnataka 100.0 100.0 90.7 88.7 1 1 27 22
Kodagu Karnataka 100.0 100.0 99.9 99.5 1 1 10 10
Shimoga Karnataka 100.0 97.9 93.8 91.5 1 18 20 16
Alapuzha Kerala 100.0 100.0 97.7 100.0 1 1 14 1
Ernakulam Kerala 100.0 100.0 100.0 100.0 1 1 1 1
Kottayam Kerala 100.0 100.0 100.0 100.0 1 1 1 1
Pathanamthitta Kerala 100.0 100.0 100.0 100.0 1 1 1 1
Thrissur Kerala 100.0 100.0 100.0 100.0 1 1 1 1
Mumbai Maharashtra 100.0 91.2 100.0 97.2 1 39 1 12
Khurda Odisha 100.0 100.0 99.3 96.5 1 1 12 13
West Tripura Tripura 100.0 79.1 98.2 89.9 1 96 13 19
Kolkata West Bengal 100.0 100.0 97.7 77.0 1 1 15 59
Chennai Tamil Nadu 99.6 96.0 95.1 94.7 15 25 18 14
Thiruvananthapuram Kerala 99.0 100.0 100.0 100.0 16 1 1 1
Udipi Karnataka 97.2 91.6 94.3 78.4 17 38 19 54
Bengaluru Urban Karnataka 96.8 97.5 96.9 74.6 18 21 16 66
Vadodara Gujarat 96.4 93.0 82.9 65.1 19 31 56 111
Coimbatore Tamil Nadu 94.3 100.0 100.0 100.0 20 1 1 1
Visakhapatnam Andhra Pradesh 93.6 89.7 84.0 71.4 21 42 49 82
Nagpur Maharashtra 92.8 89.5 77.7 65.5 22 43 79 106
Kancheepuram Tamil Nadu 92.3 97.1 92.2 90.1 23 22 22 18
Ambala Haryana 92.3 100.0 79.1 61.2 24 1 69 144
Gadag Karnataka 92.0 89.1 82.9 86.3 25 44 57 30
Kozhikode Kerala 92.0 88.8 85.9 81.2 26 47 43 43
Dakshin Kannad Karnataka 91.8 84.5 83.0 72.5 27 61 55 75
Kamrup Metropolitan Assam 91.8 97.8 84.8 71.3 28 19 45 83
Kollam Kerala 91.2 90.1 86.9 85.2 29 41 39 33
Namakkal Tamil Nadu 90.9 88.4 83.8 83.9 30 48 51 35
Kannur Kerala 90.7 88.9 87.4 82.7 31 46 37 38
Karaikal Puducherry 90.5 100.0 100.0 100.0 32 1 1 1
Kasaragod Kerala 90.5 91.9 89.7 87.1 33 35 30 28
Mysore Karnataka 90.2 97.0 91.7 87.8 34 23 24 27
Mandya Karnataka 90.0 87.0 78.1 77.1 35 52 74 58
Table A1: Top 50
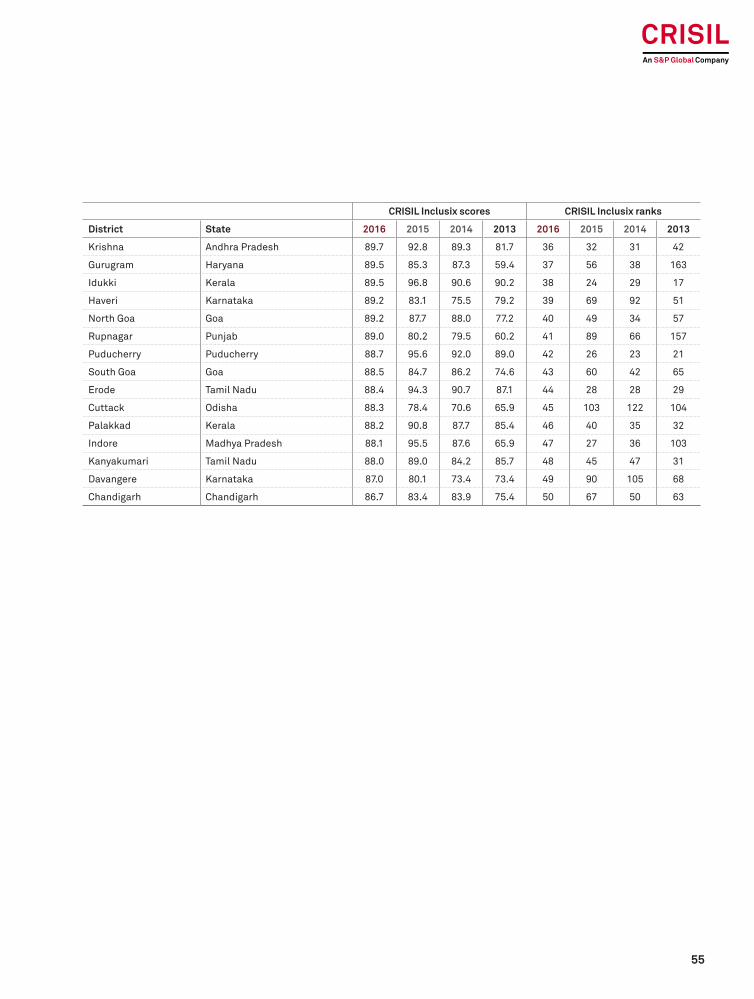
55
CRISIL Inclusix scores CRISIL Inclusix ranks
District State 2016 2015 2014 2013 2016 2015 2014 2013
Krishna Andhra Pradesh 89.7 92.8 89.3 81.7 36 32 31 42
Gurugram Haryana 89.5 85.3 87.3 59.4 37 56 38 163
Idukki Kerala 89.5 96.8 90.6 90.2 38 24 29 17
Haveri Karnataka 89.2 83.1 75.5 79.2 39 69 92 51
North Goa Goa 89.2 87.7 88.0 77.2 40 49 34 57
Rupnagar Punjab 89.0 80.2 79.5 60.2 41 89 66 157
Puducherry Puducherry 88.7 95.6 92.0 89.0 42 26 23 21
South Goa Goa 88.5 84.7 86.2 74.6 43 60 42 65
Erode Tamil Nadu 88.4 94.3 90.7 87.1 44 28 28 29
Cuttack Odisha 88.3 78.4 70.6 65.9 45 103 122 104
Palakkad Kerala 88.2 90.8 87.7 85.4 46 40 35 32
Indore Madhya Pradesh 88.1 95.5 87.6 65.9 47 27 36 103
Kanyakumari Tamil Nadu 88.0 89.0 84.2 85.7 48 45 47 31
Davangere Karnataka 87.0 80.1 73.4 73.4 49 90 105 68
Chandigarh Chandigarh 86.7 83.4 83.9 75.4 50 67 50 63

56
CRISIL Inclusix scores CRISIL Inclusix ranks
District State 2016 2015 2014 2013 2016 2015 2014 2013
Kurung Kumey Arunachal Pradesh 5.2 6.4 5.7 5.3 666 658 656 652
South Garo Hills Meghalaya 9.3 11.0 11.0 8.4 665 656 653 651
Tamenglong Manipur 9.6 11.1 9.7 11.0 664 655 655 648
Mon Nagaland 9.9 12.0 10.6 8.9 663 654 654 650
North Garo Hills* Meghalaya 12.8 662
Phek Nagaland 13.7 17.7 17.5 19.5 661 652 645 632
South West Garo Hills* Meghalaya 14.1 660
Ukhrul Manipur 14.9 16.7 13.7 12.6 659 653 652 647
Kiphire Nagaland 15.6 17.9 14.2 11.0 658 651 651 649
Tuensang Nagaland 15.7 20.0 18.4 16.4 657 648 641 639
Longding Arunachal Pradesh 17.2 21.3 21.3 22.0 656 644 631 619
Sukma Chhattisgarh 18.0 18.7 16.9 16.7 655 650 648 637
East Kameng Arunachal Pradesh 18.0 20.8 18.2 15.1 654 646 642 643
South West Khasi Hills* Meghalaya 18.5 653
Peren Nagaland 18.6 24.6 22.4 21.4 652 631 624 621
Gariyaband Chhattisgarh 19.4 24.0 16.0 16.9 651 634 649 635
Alirajpur Madhya Pradesh 19.6 20.6 17.8 17.6 650 647 644 633
East Jaintia Hills* Meghalaya 20.3 649
Mewat Haryana 20.6 26.3 25.1 25.7 648 620 599 582
Bijapur Chhattisgarh 20.9 22.7 20.3 21.7 647 638 635 620
Longleng Nagaland 21.0 25.2 18.9 15.0 646 627 640 644
Wokha Nagaland 21.1 27.7 26.3 23.6 645 605 581 605
Tirap Arunachal Pradesh 21.3 27.1 24.6 19.9 644 612 606 629
Chandel Manipur 21.6 23.5 24.1 16.8 643 637 615 636
Upper Subansiri Arunachal Pradesh 21.8 27.1 26.4 20.0 642 611 580 628
Chunglang Arunachal Pradesh 22.0 19.3 17.9 16.3 641 649 643 640
Balrampur Chhattisgarh 22.0 26.3 24.2 27.4 640 621 614 564
Singrauli Madhya Pradesh 22.3 26.5 24.6 25.0 639 619 607 589
Zunheboto Nagaland 22.4 28.6 25.2 20.6 638 590 598 626
Pratapgarh Rajasthan 22.8 31.4 24.8 28.6 637 568 604 556
Tapi Gujarat 23.0 32.7 25.6 29.4 636 554 594 548
Churachandpur Manipur 23.5 25.0 22.4 21.1 635 628 623 623
Thoubal Manipur 23.6 24.7 19.7 15.9 634 629 637 642
Chhotaudepur* Gujarat 23.8 10.9 633 657
Baksa Assam 24.0 22.6 19.1 19.8 632 639 639 630
Table A2: Bottom 50
*New district carved after 2013
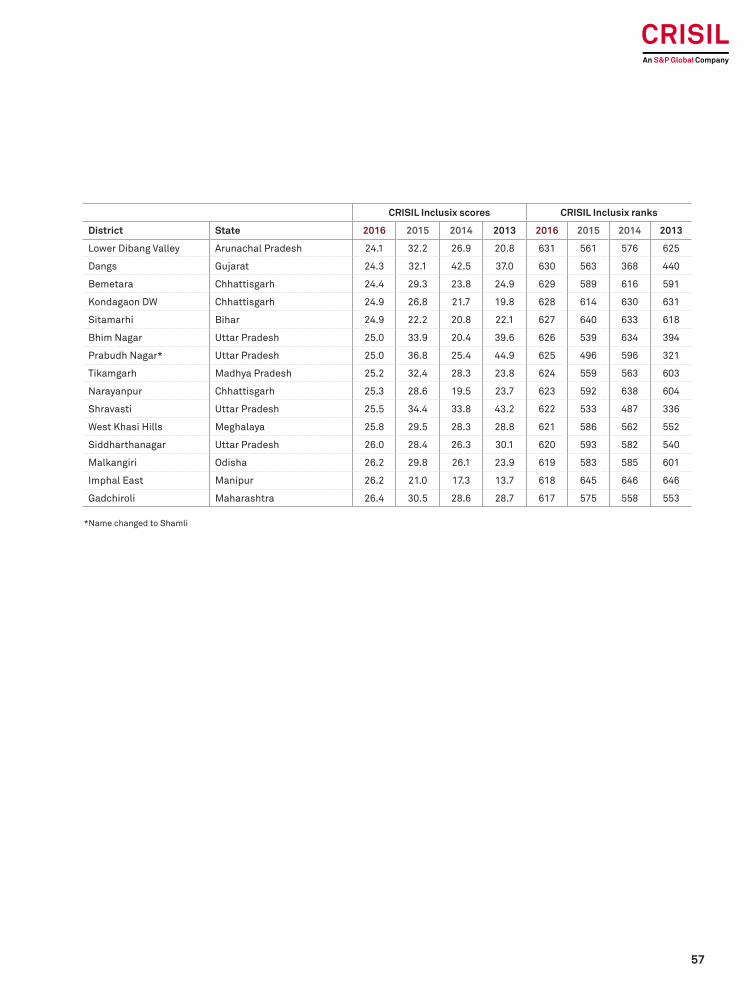
57
CRISIL Inclusix scores CRISIL Inclusix ranks
District State 2016 2015 2014 2013 2016 2015 2014 2013
Lower Dibang Valley Arunachal Pradesh 24.1 32.2 26.9 20.8 631 561 576 625
Dangs Gujarat 24.3 32.1 42.5 37.0 630 563 368 440
Bemetara Chhattisgarh 24.4 29.3 23.8 24.9 629 589 616 591
Kondagaon DW Chhattisgarh 24.9 26.8 21.7 19.8 628 614 630 631
Sitamarhi Bihar 24.9 22.2 20.8 22.1 627 640 633 618
Bhim Nagar Uttar Pradesh 25.0 33.9 20.4 39.6 626 539 634 394
Prabudh Nagar* Uttar Pradesh 25.0 36.8 25.4 44.9 625 496 596 321
Tikamgarh Madhya Pradesh 25.2 32.4 28.3 23.8 624 559 563 603
Narayanpur Chhattisgarh 25.3 28.6 19.5 23.7 623 592 638 604
Shravasti Uttar Pradesh 25.5 34.4 33.8 43.2 622 533 487 336
West Khasi Hills Meghalaya 25.8 29.5 28.3 28.8 621 586 562 552
Siddharthanagar Uttar Pradesh 26.0 28.4 26.3 30.1 620 593 582 540
Malkangiri Odisha 26.2 29.8 26.1 23.9 619 583 585 601
Imphal East Manipur 26.2 21.0 17.3 13.7 618 645 646 646
Gadchiroli Maharashtra 26.4 30.5 28.6 28.7 617 575 558 553
*Name changed to Shamli

58
CRISIL Inclusix scores CRISIL Inclusix ranks
District State 2016 2015 2014 2013 2016 2015 2014 2013
Delhi Delhi 86.1 83.7 83.2 67.0 52 64 54 94
Bengaluru Urban Karnataka 96.8 97.5 96.9 74.6 18 21 16 66
Pune Maharashtra 86.0 82.7 81.3 58.2 53 73 60 175
North 24 Parganas West Bengal 58.4 45.4 49.4 47.5 265 379 294 287
Mumbai Suburban Maharashtra 63.7 79.9 79.2 80.5 216 91 67 45
Thane Maharashtra 70.5 54.7 51.8 34.8 151 279 267 480
South 24 Parganas West Bengal 44.8 33.8 37.8 38.9 405 542 437 408
Barddhaman West Bengal 63.5 49.6 50.5 48.1 218 331 282 279
Murshidabad West Bengal 40.4 34.2 39.8 42.0 460 535 409 357
Ahmedabad Gujarat 83.6 78.5 77.4 51.6 62 102 80 235
Jaipur Rajasthan 76.6 71.4 65.0 51.6 107 143 166 236
Surat Gujarat 63.0 53.8 51.1 37.8 225 289 275 427
Nasik Maharashtra 57.3 51.4 45.3 36.3 273 311 338 455
Allahabad Uttar Pradesh 50.8 46.9 41.9 38.0 331 358 375 423
Patna Bihar 72.9 65.2 64.4 54.8 135 195 173 212
Rangareddy Telangana 70.2 76.9 73.8 61.0 154 107 103 146
Paschim Medinipur West Bengal 50.0 41.8 41.5 40.9 337 421 383 370
Purbi Champaran Bihar 33.9 26.1 24.4 26.2 540 623 612 578
Hugli West Bengal 60.6 45.2 50.8 50.3 249 380 280 252
Nadia West Bengal 54.4 42.0 47.4 48.4 290 418 318 276
Purba Medinipur West Bengal 51.5 38.3 37.6 37.4 321 467 440 432
Muzaffarpur Bihar 48.8 40.4 35.8 34.5 353 439 465 487
East Godavari Andhra Pradesh 78.5 81.4 77.3 74.1 88 81 82 67
Howrah West Bengal 62.0 45.4 50.8 47.8 234 377 281 283
Lucknow Uttar Pradesh 77.3 71.8 76.6 55.6 99 140 88 203
Guntur Andhra Pradesh 85.1 85.0 81.1 77.7 56 58 61 55
Belgaum Karnataka 79.9 80.2 74.6 73.3 79 86 100 70
Madhubani Bihar 30.6 26.1 24.5 23.4 570 624 608 608
Azamgarh Uttar Pradesh 41.6 36.6 35.0 36.0 448 498 476 463
Sitapur Uttar Pradesh 32.0 34.6 33.6 34.6 555 528 490 483
Nagpur Maharashtra 92.8 89.5 77.7 65.5 22 43 79 106
Gaya Bihar 37.3 31.8 28.5 25.3 508 565 560 586
Bareilly Uttar Pradesh 45.4 44.8 40.7 38.6 399 385 392 414
Table A3: Most populous

59
CRISIL Inclusix scores CRISIL Inclusix ranks
District State 2016 2015 2014 2013 2016 2015 2014 2013
Agra Uttar Pradesh 61.6 57.2 53.8 50.1 240 258 250 255
Gorakhpur Uttar Pradesh 62.1 52.6 45.0 41.9 231 303 341 358
Ahmednagar Maharashtra 56.2 48.7 45.1 40.1 283 342 340 389
Jaunpur Uttar Pradesh 44.5 41.5 38.3 40.0 409 424 429 391
Chennai Tamil Nadu 99.6 96.0 95.1 94.7 15 25 18 14
Kanpur nagar Uttar Pradesh 57.7 54.6 52.4 42.7 270 281 264 345
Samastipur Bihar 40.4 33.0 29.4 31.0 459 552 550 532
Kancheepuram Tamil Nadu 92.3 97.1 92.2 90.1 23 22 22 18
Krishna Andhra Pradesh 89.7 92.8 89.3 81.7 36 32 31 42
Solapur Maharashtra 56.8 53.5 48.5 46.4 277 296 302 302
Visakhapatnam Andhra Pradesh 93.6 89.7 84.0 71.4 21 42 49 82
Jalgaon Maharashtra 51.5 40.9 35.9 30.2 320 429 462 539
Kheri Uttar Pradesh 33.5 33.5 32.9 34.6 542 546 504 485
Hardoi Uttar Pradesh 33.2 34.5 32.5 36.2 544 532 512 458
Paschimi Champaran Bihar 29.2 27.4 22.3 23.9 591 606 626 602
Kolkata West Bengal 100.0 100.0 97.7 77.0 1 1 15 59
Chittoor Andhra Pradesh 68.8 80.2 76.0 72.8 175 88 90 72

60
Table A4: State scores
CRISIL Inclusix scores CRISIL Inclusix ranks
State 2016 2015 2014 2013 2016 2015 2014 2013 Dispersion (Coeffi-cient of Variation)
Kerala 90.9 92.1 90.3 88.9 1 2 2 2 0.11
Goa 88.9 86.4 87.2 76.1 2 3 3 4 0.01
Puducherry 87.7 95.0 92.4 89.4 3 1 1 1 0.11
Chandigarh 86.7 83.4 83.9 75.4 4 6 4 5
Delhi 86.1 83.7 83.2 67.0 5 5 5 8
Karnataka 82.1 83.8 78.0 74.4 6 4 7 6 0.19
Andhra Pradesh 78.4 80.3 76.4 69.2 7 8 8 7 0.10
Tamil Nadu 77.2 82.8 78.5 79.2 8 7 6 3 0.14
Telangana* 72.8 73.2 68.3 9 9 11 0.09
Himachal Pradesh 72.3 67.8 66.1 60.5 10 13 13 11 0.10
Punjab 70.9 73.0 70.5 59.7 11 10 9 12 0.14
Uttarakhand 69.0 69.2 66.0 59.3 12 11 14 13 0.13
Haryana 67.7 69.0 63.4 53.2 13 12 15 16 0.24
Tripura 66.2 61.5 67.2 63.8 14 16 12 10 0.31
Andaman & Nicobar Islands 63.9 64.2 62.3 54.6 15 15 16 15 0.38
Odisha 63.0 60.6 54.4 55.2 16 17 22 14 0.26
Maharashtra 62.7 58.9 54.6 49.0 17 21 21 17 0.26
Gujarat 62.4 57.5 56.1 46.0 18 22 20 20 0.31
Daman and Diu 60.7 59.9 59.2 43.2 19 19 18 23 0.06
Sikkim 60.2 59.1 57.7 46.8 20 20 19 18 0.38
Dadra and Nagar Haveli 60.2 60.5 60.4 43.7 21 18 17 22
West Bengal 53.7 43.5 47.0 46.6 22 29 25 19 0.29
Lakshadweep 51.3 67.2 68.7 65.7 23 14 10 9
Rajasthan 50.9 46.6 42.2 39.4 24 26 28 29 0.24
Madhya Pradesh 48.7 50.0 44.7 40.5 25 25 26 25 0.31
Jharkhand 48.2 44.1 40.3 39.4 26 28 30 28 0.31
Assam 47.9 41.5 42.3 39.6 27 31 27 27 0.34
Jammu & Kashmir 47.8 54.4 50.0 45.2 28 24 24 21 0.27
Chhattisgarh 45.7 44.2 38.7 35.4 29 27 32 31 0.36
Uttar Pradesh 44.1 43.5 40.5 40.1 30 30 29 26 0.27
Mizoram 43.2 56.4 52.5 42.6 31 23 23 24 0.17
Bihar 38.5 33.2 30.6 30.2 32 35 35 33 0.22
Arunachal Pradesh 34.7 39.4 36.5 30.5 33 33 33 32 0.49
Meghalaya 34.6 40.0 38.9 36.4 34 32 31 30 0.40
Nagaland 32.4 36.0 32.9 28.9 35 34 34 34 0.51
Manipur 32.0 29.8 26.5 21.6 36 36 36 35 0.49
Total 58.0 56.2 53.2 50.1
*New state formed after 2013

61
Table A5: District scores
CRISIL Inclusix scores CRISIL Inclusix ranks
State District 2016 2015 2014 2013 2016 2015 2014 2013
Andaman & Nicobar Islands Nicobar 33.3 37.9 35.7 33.7 543 475 466 500
Andaman & Nicobar Islands
North and Middle Andaman 39.0 38.5 35.1 32.9 486 460 475 512
Andaman & Nicobar Islands South Andaman 78.4 78.7 77.7 67.0 91 101 78 95
Andhra Pradesh Anantapur 69.3 71.6 69.9 68.2 165 141 126 92
Andhra Pradesh Chittoor 68.8 80.2 76.0 72.8 175 88 90 72
Andhra Pradesh Cuddapah 75.5 76.9 72.8 72.0 115 109 107 79
Andhra Pradesh East Godavari 78.5 81.4 77.3 74.1 88 81 82 67
Andhra Pradesh Guntur 85.1 85.0 81.1 77.7 56 58 61 55
Andhra Pradesh Krishna 89.7 92.8 89.3 81.7 36 32 31 42
Andhra Pradesh Kurnool 68.4 70.8 68.3 63.6 178 148 140 123
Andhra Pradesh Nellore 75.3 81.4 76.8 75.1 117 80 87 64
Andhra Pradesh Prakasam 79.2 79.0 76.2 72.1 83 97 89 78
Andhra Pradesh Srikakulam 73.6 67.9 63.4 64.6 129 170 182 116
Andhra Pradesh Visakhapatnam 93.6 89.7 84.0 71.4 21 42 49 82
Andhra Pradesh Vizianagaram 71.4 73.2 67.1 66.0 145 135 151 102
Andhra Pradesh West Godavari 82.0 82.8 79.2 76.0 72 72 68 62
Arunachal Pradesh Anjaw 28.1 31.0 29.2 26.7 601 572 551 572
Arunachal Pradesh Chunglang 22.0 19.3 17.9 16.3 641 649 643 640
Arunachal Pradesh Dibang Valley 51.9 42.9 41.1 38.8 318 404 389 412
Arunachal Pradesh East Kameng 18.0 20.8 18.2 15.1 654 646 642 643
Arunachal Pradesh East Siang 56.8 61.6 56.3 47.5 276 234 230 288
Arunachal Pradesh Kurung Kumey 5.2 6.4 5.7 5.3 666 658 656 652
Arunachal Pradesh Lohit 26.9 30.5 27.8 25.3 615 576 569 584
Arunachal Pradesh Longding 17.2 21.3 21.3 22.0 656 644 631 619
Arunachal Pradesh Lower Dibang Valley 24.1 32.2 26.9 20.8 631 561 576 625
Arunachal Pradesh Lower Subansiri 38.0 39.4 36.0 25.3 498 453 461 583
Arunachal Pradesh Papumpare 76.0 79.6 74.7 61.3 111 93 99 142
Arunachal Pradesh Tawang 37.1 49.0 45.5 37.1 509 337 336 437
Arunachal Pradesh Tirap 21.3 27.1 24.6 19.9 644 612 606 629
Arunachal Pradesh Upper Siang 35.2 37.7 33.5 25.3 525 480 493 585
Arunachal Pradesh Upper Subansiri 21.8 27.1 26.4 20.0 642 611 580 628
Arunachal Pradesh West Kameng 40.0 51.3 47.8 39.3 470 312 310 399
Arunachal Pradesh West Siang 38.5 55.9 51.7 42.4 490 269 271 350
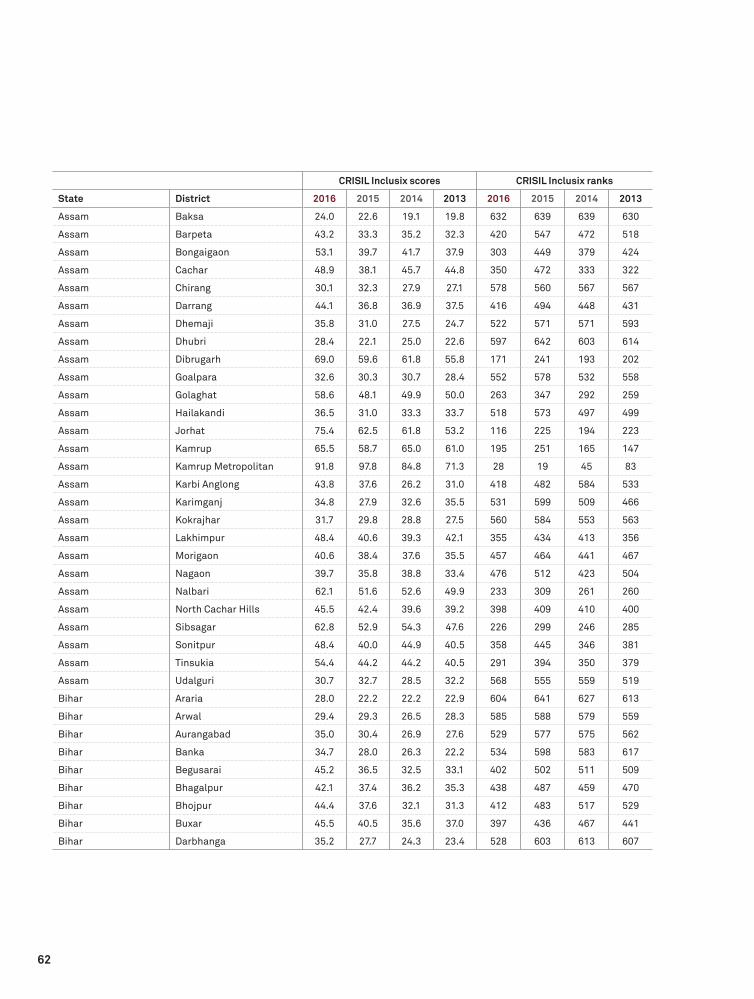
62
CRISIL Inclusix scores CRISIL Inclusix ranks
State District 2016 2015 2014 2013 2016 2015 2014 2013
Assam Baksa 24.0 22.6 19.1 19.8 632 639 639 630
Assam Barpeta 43.2 33.3 35.2 32.3 420 547 472 518
Assam Bongaigaon 53.1 39.7 41.7 37.9 303 449 379 424
Assam Cachar 48.9 38.1 45.7 44.8 350 472 333 322
Assam Chirang 30.1 32.3 27.9 27.1 578 560 567 567
Assam Darrang 44.1 36.8 36.9 37.5 416 494 448 431
Assam Dhemaji 35.8 31.0 27.5 24.7 522 571 571 593
Assam Dhubri 28.4 22.1 25.0 22.6 597 642 603 614
Assam Dibrugarh 69.0 59.6 61.8 55.8 171 241 193 202
Assam Goalpara 32.6 30.3 30.7 28.4 552 578 532 558
Assam Golaghat 58.6 48.1 49.9 50.0 263 347 292 259
Assam Hailakandi 36.5 31.0 33.3 33.7 518 573 497 499
Assam Jorhat 75.4 62.5 61.8 53.2 116 225 194 223
Assam Kamrup 65.5 58.7 65.0 61.0 195 251 165 147
Assam Kamrup Metropolitan 91.8 97.8 84.8 71.3 28 19 45 83
Assam Karbi Anglong 43.8 37.6 26.2 31.0 418 482 584 533
Assam Karimganj 34.8 27.9 32.6 35.5 531 599 509 466
Assam Kokrajhar 31.7 29.8 28.8 27.5 560 584 553 563
Assam Lakhimpur 48.4 40.6 39.3 42.1 355 434 413 356
Assam Morigaon 40.6 38.4 37.6 35.5 457 464 441 467
Assam Nagaon 39.7 35.8 38.8 33.4 476 512 423 504
Assam Nalbari 62.1 51.6 52.6 49.9 233 309 261 260
Assam North Cachar Hills 45.5 42.4 39.6 39.2 398 409 410 400
Assam Sibsagar 62.8 52.9 54.3 47.6 226 299 246 285
Assam Sonitpur 48.4 40.0 44.9 40.5 358 445 346 381
Assam Tinsukia 54.4 44.2 44.2 40.5 291 394 350 379
Assam Udalguri 30.7 32.7 28.5 32.2 568 555 559 519
Bihar Araria 28.0 22.2 22.2 22.9 604 641 627 613
Bihar Arwal 29.4 29.3 26.5 28.3 585 588 579 559
Bihar Aurangabad 35.0 30.4 26.9 27.6 529 577 575 562
Bihar Banka 34.7 28.0 26.3 22.2 534 598 583 617
Bihar Begusarai 45.2 36.5 32.5 33.1 402 502 511 509
Bihar Bhagalpur 42.1 37.4 36.2 35.3 438 487 459 470
Bihar Bhojpur 44.4 37.6 32.1 31.3 412 483 517 529
Bihar Buxar 45.5 40.5 35.6 37.0 397 436 467 441
Bihar Darbhanga 35.2 27.7 24.3 23.4 528 603 613 607
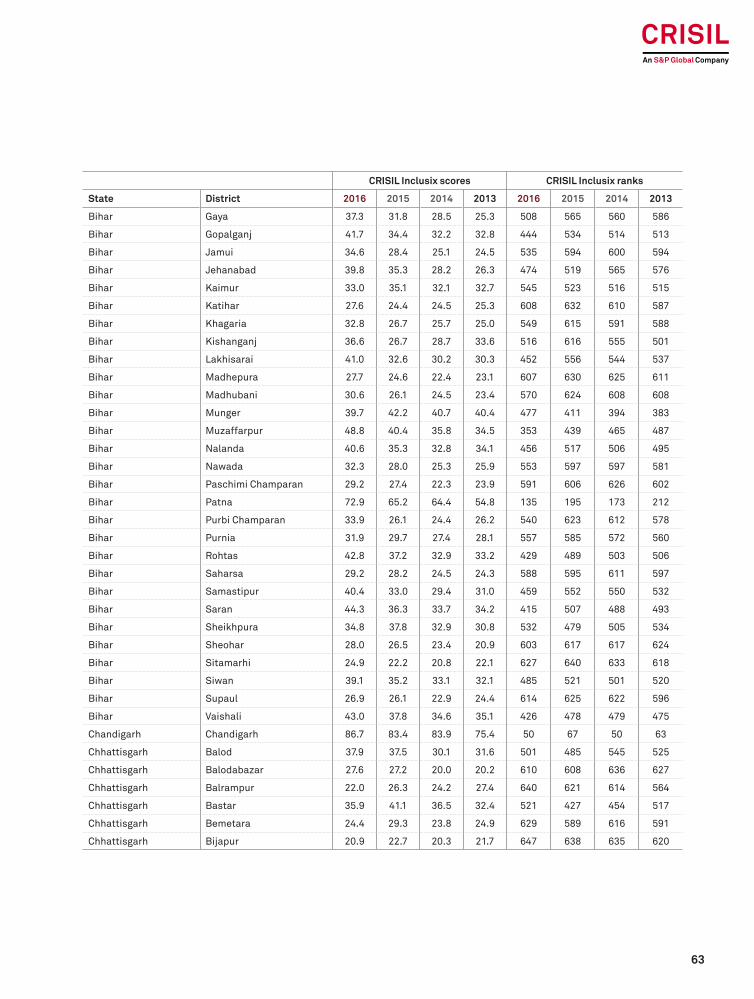
63
CRISIL Inclusix scores CRISIL Inclusix ranks
State District 2016 2015 2014 2013 2016 2015 2014 2013
Bihar Gaya 37.3 31.8 28.5 25.3 508 565 560 586
Bihar Gopalganj 41.7 34.4 32.2 32.8 444 534 514 513
Bihar Jamui 34.6 28.4 25.1 24.5 535 594 600 594
Bihar Jehanabad 39.8 35.3 28.2 26.3 474 519 565 576
Bihar Kaimur 33.0 35.1 32.1 32.7 545 523 516 515
Bihar Katihar 27.6 24.4 24.5 25.3 608 632 610 587
Bihar Khagaria 32.8 26.7 25.7 25.0 549 615 591 588
Bihar Kishanganj 36.6 26.7 28.7 33.6 516 616 555 501
Bihar Lakhisarai 41.0 32.6 30.2 30.3 452 556 544 537
Bihar Madhepura 27.7 24.6 22.4 23.1 607 630 625 611
Bihar Madhubani 30.6 26.1 24.5 23.4 570 624 608 608
Bihar Munger 39.7 42.2 40.7 40.4 477 411 394 383
Bihar Muzaffarpur 48.8 40.4 35.8 34.5 353 439 465 487
Bihar Nalanda 40.6 35.3 32.8 34.1 456 517 506 495
Bihar Nawada 32.3 28.0 25.3 25.9 553 597 597 581
Bihar Paschimi Champaran 29.2 27.4 22.3 23.9 591 606 626 602
Bihar Patna 72.9 65.2 64.4 54.8 135 195 173 212
Bihar Purbi Champaran 33.9 26.1 24.4 26.2 540 623 612 578
Bihar Purnia 31.9 29.7 27.4 28.1 557 585 572 560
Bihar Rohtas 42.8 37.2 32.9 33.2 429 489 503 506
Bihar Saharsa 29.2 28.2 24.5 24.3 588 595 611 597
Bihar Samastipur 40.4 33.0 29.4 31.0 459 552 550 532
Bihar Saran 44.3 36.3 33.7 34.2 415 507 488 493
Bihar Sheikhpura 34.8 37.8 32.9 30.8 532 479 505 534
Bihar Sheohar 28.0 26.5 23.4 20.9 603 617 617 624
Bihar Sitamarhi 24.9 22.2 20.8 22.1 627 640 633 618
Bihar Siwan 39.1 35.2 33.1 32.1 485 521 501 520
Bihar Supaul 26.9 26.1 22.9 24.4 614 625 622 596
Bihar Vaishali 43.0 37.8 34.6 35.1 426 478 479 475
Chandigarh Chandigarh 86.7 83.4 83.9 75.4 50 67 50 63
Chhattisgarh Balod 37.9 37.5 30.1 31.6 501 485 545 525
Chhattisgarh Balodabazar 27.6 27.2 20.0 20.2 610 608 636 627
Chhattisgarh Balrampur 22.0 26.3 24.2 27.4 640 621 614 564
Chhattisgarh Bastar 35.9 41.1 36.5 32.4 521 427 454 517
Chhattisgarh Bemetara 24.4 29.3 23.8 24.9 629 589 616 591
Chhattisgarh Bijapur 20.9 22.7 20.3 21.7 647 638 635 620

64
CRISIL Inclusix scores CRISIL Inclusix ranks
State District 2016 2015 2014 2013 2016 2015 2014 2013
Chhattisgarh Bilaspur 54.3 47.6 41.6 35.4 292 351 381 469
Chhattisgarh Dantewada 40.1 35.7 30.8 30.8 465 513 531 535
Chhattisgarh Dhamtari 51.9 48.9 42.8 37.9 317 338 362 425
Chhattisgarh Durg 80.6 66.4 59.2 50.8 76 184 211 244
Chhattisgarh Gariyaband 19.4 24.0 16.0 16.9 651 634 649 635
Chhattisgarh Janjgir-Champa 40.5 37.1 30.3 30.3 458 492 542 538
Chhattisgarh Jashpur 38.2 35.1 30.2 29.1 495 522 543 550
Chhattisgarh Kanker 41.6 42.0 39.1 39.5 449 415 414 395
Chhattisgarh Kawardha 30.4 33.7 28.5 29.5 573 544 561 545
Chhattisgarh Kondagaon DW 24.9 26.8 21.7 19.8 628 614 630 631
Chhattisgarh Korba 48.3 44.5 39.0 33.0 360 390 415 510
Chhattisgarh Koriya 57.3 63.8 59.5 45.1 272 213 207 320
Chhattisgarh Mahasamund 48.9 48.7 38.0 36.7 351 343 435 448
Chhattisgarh Mungeli 27.0 23.9 14.8 16.6 613 636 650 638
Chhattisgarh Narayanpur 25.3 28.6 19.5 23.7 623 592 638 604
Chhattisgarh Raigarh 50.7 53.7 43.6 42.5 334 291 356 348
Chhattisgarh Raipur 75.0 70.3 67.1 53.5 121 153 150 220
Chhattisgarh Rajnandgaon 37.9 41.8 39.8 39.7 499 422 408 392
Chhattisgarh Sukma 18.0 18.7 16.9 16.7 655 650 648 637
Chhattisgarh Surajpur 39.0 40.1 40.6 37.2 487 443 400 435
Chhattisgarh Surguja 59.1 53.6 50.1 47.5 257 294 289 286
Dadra and Nagar Haveli Dadra & Nagar Haveli 60.2 60.5 60.4 43.7 252 237 204 330
Daman and Diu Daman 61.7 62.7 62.0 42.1 239 222 192 355
Daman and Diu Diu 56.3 48.2 47.5 47.5 282 346 314 289
Delhi Delhi 86.1 83.7 83.2 67.0 52 64 54 94
Goa North Goa 89.2 87.7 88.0 77.2 40 49 34 57
Goa South Goa 88.5 84.7 86.2 74.6 43 60 42 65
Gujarat Ahmedabad 83.6 78.5 77.4 51.6 62 102 80 235
Gujarat Amreli 49.9 50.5 47.4 48.9 338 321 315 267
Gujarat Anand 72.9 67.8 68.9 55.4 136 171 133 205
Gujarat Aravalli* 40.7 37.8 31.6 454 476 523
Gujarat Banas Kantha 38.5 31.5 28.1 26.4 491 567 566 575
Gujarat Bharuch 72.5 66.7 65.1 59.4 137 181 164 164
Gujarat Bhavnagar 52.9 46.7 46.5 36.1 306 362 329 461
Gujarat Botad* 37.5 34.0 26.6 505 538 578
Gujarat Chhotaudepur* 23.8 10.9 633 657
*New district carved after 2013
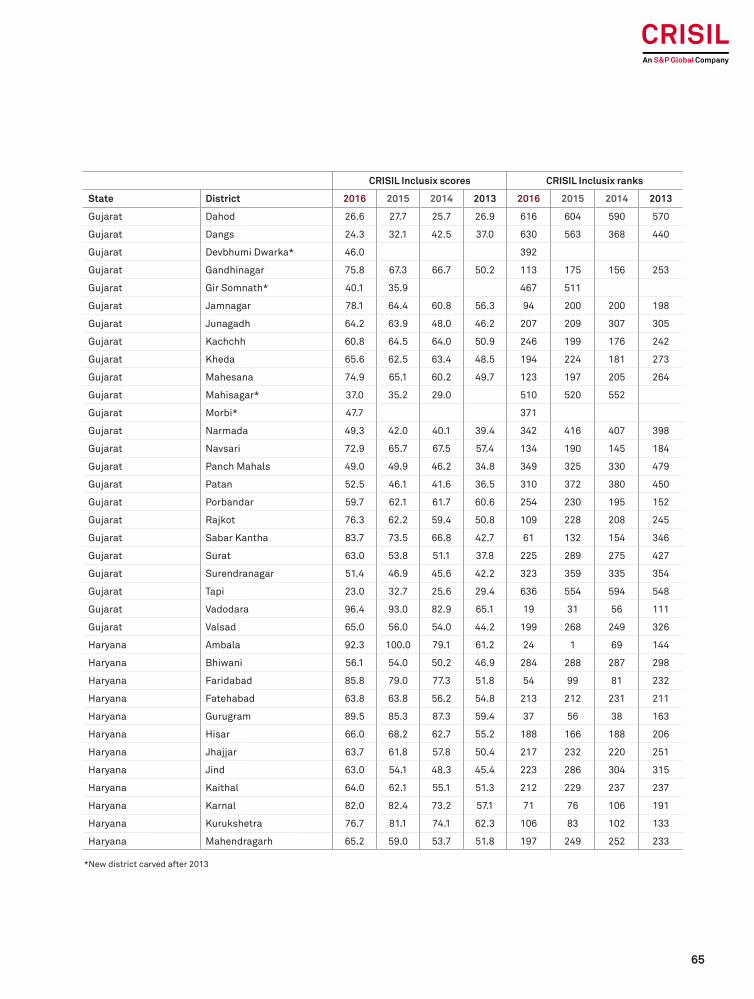
65
CRISIL Inclusix scores CRISIL Inclusix ranks
State District 2016 2015 2014 2013 2016 2015 2014 2013
Gujarat Dahod 26.6 27.7 25.7 26.9 616 604 590 570
Gujarat Dangs 24.3 32.1 42.5 37.0 630 563 368 440
Gujarat Devbhumi Dwarka* 46.0 392
Gujarat Gandhinagar 75.8 67.3 66.7 50.2 113 175 156 253
Gujarat Gir Somnath* 40.1 35.9 467 511
Gujarat Jamnagar 78.1 64.4 60.8 56.3 94 200 200 198
Gujarat Junagadh 64.2 63.9 48.0 46.2 207 209 307 305
Gujarat Kachchh 60.8 64.5 64.0 50.9 246 199 176 242
Gujarat Kheda 65.6 62.5 63.4 48.5 194 224 181 273
Gujarat Mahesana 74.9 65.1 60.2 49.7 123 197 205 264
Gujarat Mahisagar* 37.0 35.2 29.0 510 520 552
Gujarat Morbi* 47.7 371
Gujarat Narmada 49.3 42.0 40.1 39.4 342 416 407 398
Gujarat Navsari 72.9 65.7 67.5 57.4 134 190 145 184
Gujarat Panch Mahals 49.0 49.9 46.2 34.8 349 325 330 479
Gujarat Patan 52.5 46.1 41.6 36.5 310 372 380 450
Gujarat Porbandar 59.7 62.1 61.7 60.6 254 230 195 152
Gujarat Rajkot 76.3 62.2 59.4 50.8 109 228 208 245
Gujarat Sabar Kantha 83.7 73.5 66.8 42.7 61 132 154 346
Gujarat Surat 63.0 53.8 51.1 37.8 225 289 275 427
Gujarat Surendranagar 51.4 46.9 45.6 42.2 323 359 335 354
Gujarat Tapi 23.0 32.7 25.6 29.4 636 554 594 548
Gujarat Vadodara 96.4 93.0 82.9 65.1 19 31 56 111
Gujarat Valsad 65.0 56.0 54.0 44.2 199 268 249 326
Haryana Ambala 92.3 100.0 79.1 61.2 24 1 69 144
Haryana Bhiwani 56.1 54.0 50.2 46.9 284 288 287 298
Haryana Faridabad 85.8 79.0 77.3 51.8 54 99 81 232
Haryana Fatehabad 63.8 63.8 56.2 54.8 213 212 231 211
Haryana Gurugram 89.5 85.3 87.3 59.4 37 56 38 163
Haryana Hisar 66.0 68.2 62.7 55.2 188 166 188 206
Haryana Jhajjar 63.7 61.8 57.8 50.4 217 232 220 251
Haryana Jind 63.0 54.1 48.3 45.4 223 286 304 315
Haryana Kaithal 64.0 62.1 55.1 51.3 212 229 237 237
Haryana Karnal 82.0 82.4 73.2 57.1 71 76 106 191
Haryana Kurukshetra 76.7 81.1 74.1 62.3 106 83 102 133
Haryana Mahendragarh 65.2 59.0 53.7 51.8 197 249 252 233
*New district carved after 2013
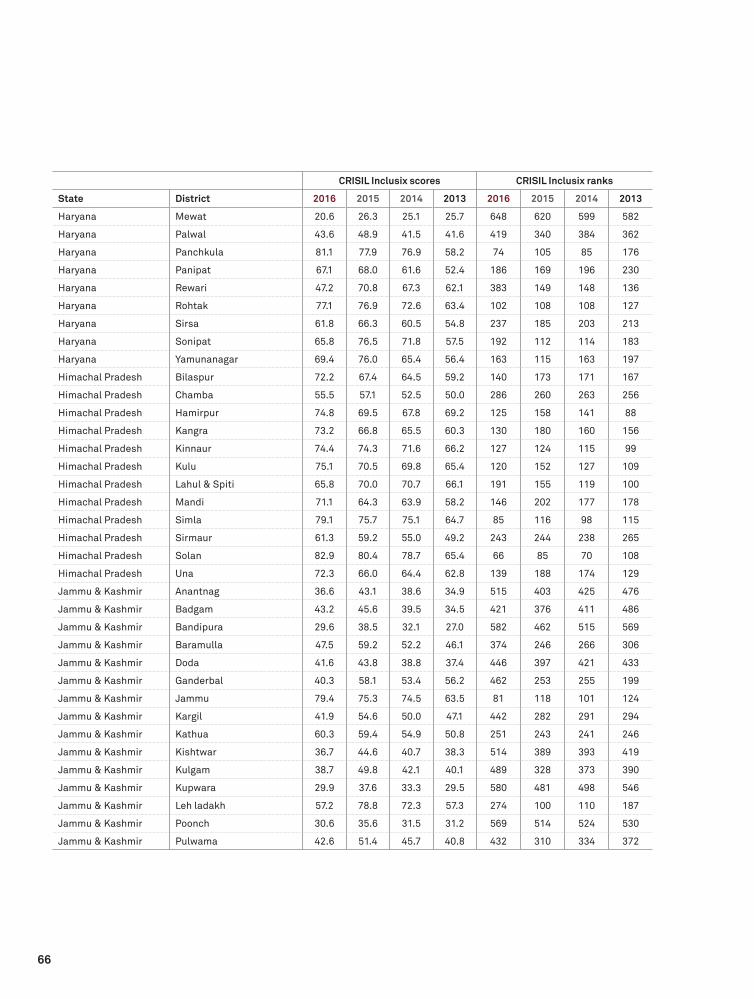
66
CRISIL Inclusix scores CRISIL Inclusix ranks
State District 2016 2015 2014 2013 2016 2015 2014 2013
Haryana Mewat 20.6 26.3 25.1 25.7 648 620 599 582
Haryana Palwal 43.6 48.9 41.5 41.6 419 340 384 362
Haryana Panchkula 81.1 77.9 76.9 58.2 74 105 85 176
Haryana Panipat 67.1 68.0 61.6 52.4 186 169 196 230
Haryana Rewari 47.2 70.8 67.3 62.1 383 149 148 136
Haryana Rohtak 77.1 76.9 72.6 63.4 102 108 108 127
Haryana Sirsa 61.8 66.3 60.5 54.8 237 185 203 213
Haryana Sonipat 65.8 76.5 71.8 57.5 192 112 114 183
Haryana Yamunanagar 69.4 76.0 65.4 56.4 163 115 163 197
Himachal Pradesh Bilaspur 72.2 67.4 64.5 59.2 140 173 171 167
Himachal Pradesh Chamba 55.5 57.1 52.5 50.0 286 260 263 256
Himachal Pradesh Hamirpur 74.8 69.5 67.8 69.2 125 158 141 88
Himachal Pradesh Kangra 73.2 66.8 65.5 60.3 130 180 160 156
Himachal Pradesh Kinnaur 74.4 74.3 71.6 66.2 127 124 115 99
Himachal Pradesh Kulu 75.1 70.5 69.8 65.4 120 152 127 109
Himachal Pradesh Lahul & Spiti 65.8 70.0 70.7 66.1 191 155 119 100
Himachal Pradesh Mandi 71.1 64.3 63.9 58.2 146 202 177 178
Himachal Pradesh Simla 79.1 75.7 75.1 64.7 85 116 98 115
Himachal Pradesh Sirmaur 61.3 59.2 55.0 49.2 243 244 238 265
Himachal Pradesh Solan 82.9 80.4 78.7 65.4 66 85 70 108
Himachal Pradesh Una 72.3 66.0 64.4 62.8 139 188 174 129
Jammu & Kashmir Anantnag 36.6 43.1 38.6 34.9 515 403 425 476
Jammu & Kashmir Badgam 43.2 45.6 39.5 34.5 421 376 411 486
Jammu & Kashmir Bandipura 29.6 38.5 32.1 27.0 582 462 515 569
Jammu & Kashmir Baramulla 47.5 59.2 52.2 46.1 374 246 266 306
Jammu & Kashmir Doda 41.6 43.8 38.8 37.4 446 397 421 433
Jammu & Kashmir Ganderbal 40.3 58.1 53.4 56.2 462 253 255 199
Jammu & Kashmir Jammu 79.4 75.3 74.5 63.5 81 118 101 124
Jammu & Kashmir Kargil 41.9 54.6 50.0 47.1 442 282 291 294
Jammu & Kashmir Kathua 60.3 59.4 54.9 50.8 251 243 241 246
Jammu & Kashmir Kishtwar 36.7 44.6 40.7 38.3 514 389 393 419
Jammu & Kashmir Kulgam 38.7 49.8 42.1 40.1 489 328 373 390
Jammu & Kashmir Kupwara 29.9 37.6 33.3 29.5 580 481 498 546
Jammu & Kashmir Leh ladakh 57.2 78.8 72.3 57.3 274 100 110 187
Jammu & Kashmir Poonch 30.6 35.6 31.5 31.2 569 514 524 530
Jammu & Kashmir Pulwama 42.6 51.4 45.7 40.8 432 310 334 372
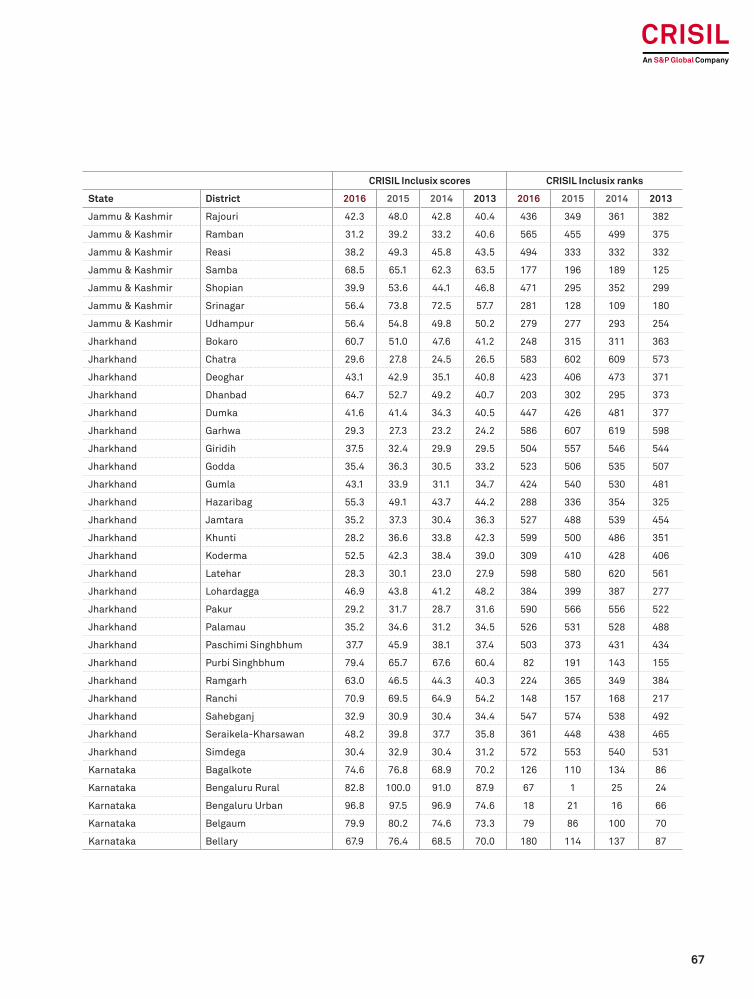
67
CRISIL Inclusix scores CRISIL Inclusix ranks
State District 2016 2015 2014 2013 2016 2015 2014 2013
Jammu & Kashmir Rajouri 42.3 48.0 42.8 40.4 436 349 361 382
Jammu & Kashmir Ramban 31.2 39.2 33.2 40.6 565 455 499 375
Jammu & Kashmir Reasi 38.2 49.3 45.8 43.5 494 333 332 332
Jammu & Kashmir Samba 68.5 65.1 62.3 63.5 177 196 189 125
Jammu & Kashmir Shopian 39.9 53.6 44.1 46.8 471 295 352 299
Jammu & Kashmir Srinagar 56.4 73.8 72.5 57.7 281 128 109 180
Jammu & Kashmir Udhampur 56.4 54.8 49.8 50.2 279 277 293 254
Jharkhand Bokaro 60.7 51.0 47.6 41.2 248 315 311 363
Jharkhand Chatra 29.6 27.8 24.5 26.5 583 602 609 573
Jharkhand Deoghar 43.1 42.9 35.1 40.8 423 406 473 371
Jharkhand Dhanbad 64.7 52.7 49.2 40.7 203 302 295 373
Jharkhand Dumka 41.6 41.4 34.3 40.5 447 426 481 377
Jharkhand Garhwa 29.3 27.3 23.2 24.2 586 607 619 598
Jharkhand Giridih 37.5 32.4 29.9 29.5 504 557 546 544
Jharkhand Godda 35.4 36.3 30.5 33.2 523 506 535 507
Jharkhand Gumla 43.1 33.9 31.1 34.7 424 540 530 481
Jharkhand Hazaribag 55.3 49.1 43.7 44.2 288 336 354 325
Jharkhand Jamtara 35.2 37.3 30.4 36.3 527 488 539 454
Jharkhand Khunti 28.2 36.6 33.8 42.3 599 500 486 351
Jharkhand Koderma 52.5 42.3 38.4 39.0 309 410 428 406
Jharkhand Latehar 28.3 30.1 23.0 27.9 598 580 620 561
Jharkhand Lohardagga 46.9 43.8 41.2 48.2 384 399 387 277
Jharkhand Pakur 29.2 31.7 28.7 31.6 590 566 556 522
Jharkhand Palamau 35.2 34.6 31.2 34.5 526 531 528 488
Jharkhand Paschimi Singhbhum 37.7 45.9 38.1 37.4 503 373 431 434
Jharkhand Purbi Singhbhum 79.4 65.7 67.6 60.4 82 191 143 155
Jharkhand Ramgarh 63.0 46.5 44.3 40.3 224 365 349 384
Jharkhand Ranchi 70.9 69.5 64.9 54.2 148 157 168 217
Jharkhand Sahebganj 32.9 30.9 30.4 34.4 547 574 538 492
Jharkhand Seraikela-Kharsawan 48.2 39.8 37.7 35.8 361 448 438 465
Jharkhand Simdega 30.4 32.9 30.4 31.2 572 553 540 531
Karnataka Bagalkote 74.6 76.8 68.9 70.2 126 110 134 86
Karnataka Bengaluru Rural 82.8 100.0 91.0 87.9 67 1 25 24
Karnataka Bengaluru Urban 96.8 97.5 96.9 74.6 18 21 16 66
Karnataka Belgaum 79.9 80.2 74.6 73.3 79 86 100 70
Karnataka Bellary 67.9 76.4 68.5 70.0 180 114 137 87

68
CRISIL Inclusix scores CRISIL Inclusix ranks
State District 2016 2015 2014 2013 2016 2015 2014 2013
Karnataka Bidar 58.5 59.9 47.4 53.4 264 240 317 222
Karnataka Bijapur 59.1 63.9 54.9 57.6 258 210 239 182
Karnataka Chamarajanagar 77.7 85.0 76.8 79.4 96 57 86 50
Karnataka Chikkaballapura 67.1 76.6 57.4 55.2 185 111 222 207
Karnataka Chikmagalur 100.0 100.0 96.1 94.1 1 1 17 15
Karnataka Chitradurga 79.1 82.3 75.2 76.5 84 77 97 60
Karnataka Dakshin Kannad 91.8 84.5 83.0 72.5 27 61 55 75
Karnataka Davangere 87.0 80.1 73.4 73.4 49 90 105 68
Karnataka Dharwad 100.0 100.0 100.0 97.6 1 1 1 11
Karnataka Gadag 92.0 89.1 82.9 86.3 25 44 57 30
Karnataka Gulbarga 60.0 64.2 50.2 63.4 253 203 286 126
Karnataka Hassan 100.0 100.0 90.7 88.7 1 1 27 22
Karnataka Haveri 89.2 83.1 75.5 79.2 39 69 92 51
Karnataka Kodagu 100.0 100.0 99.9 99.5 1 1 10 10
Karnataka Kolar 64.0 73.6 67.4 72.1 211 131 146 77
Karnataka Koppal 55.3 67.4 61.0 65.0 287 174 198 112
Karnataka Mandya 90.0 87.0 78.1 77.1 35 52 74 58
Karnataka Mysore 90.2 97.0 91.7 87.8 34 23 24 27
Karnataka Raichur 63.2 65.2 57.7 61.4 221 192 221 141
Karnataka Ramanagara 67.6 93.8 81.4 82.3 181 29 59 40
Karnataka Shimoga 100.0 97.9 93.8 91.5 1 18 20 16
Karnataka Tumkur 83.5 82.5 75.5 79.1 64 75 93 52
Karnataka Udipi 97.2 91.6 94.3 78.4 17 38 19 54
Karnataka Uttar Kannad 79.0 72.2 71.6 67.1 86 139 116 93
Karnataka Yadgir 52.5 49.8 47.9 42.4 312 326 308 349
Kerala Alapuzha 100.0 100.0 97.7 100.0 1 1 14 1
Kerala Ernakulam 100.0 100.0 100.0 100.0 1 1 1 1
Kerala Idukki 89.5 96.8 90.6 90.2 38 24 29 17
Kerala Kannur 90.7 88.9 87.4 82.7 31 46 37 38
Kerala Kasaragod 90.5 91.9 89.7 87.1 33 35 30 28
Kerala Kollam 91.2 90.1 86.9 85.2 29 41 39 33
Kerala Kottayam 100.0 100.0 100.0 100.0 1 1 1 1
Kerala Kozhikode 92.0 88.8 85.9 81.2 26 47 43 43
Kerala Malappuram 63.2 70.7 67.4 64.9 220 151 147 114
Kerala Palakkad 88.2 90.8 87.7 85.4 46 40 35 32
Kerala Pathanamthitta 100.0 100.0 100.0 100.0 1 1 1 1

69
CRISIL Inclusix scores CRISIL Inclusix ranks
State District 2016 2015 2014 2013 2016 2015 2014 2013
Kerala Thiruvananthapuram 99.0 100.0 100.0 100.0 16 1 1 1
Kerala Thrissur 100.0 100.0 100.0 100.0 1 1 1 1
Kerala Wayanad 79.6 86.0 84.4 82.4 80 53 46 39
Lakshadweep Lakshadweep 51.3 67.2 68.7 65.7 325 177 136 105
Madhya Pradesh Agar Malwa* 27.8 36.6 30.5 605 499 536
Madhya Pradesh Alirajpur 19.6 20.6 17.8 17.6 650 647 644 633
Madhya Pradesh Anuppur 48.0 40.8 37.5 36.8 366 431 442 446
Madhya Pradesh Ashoknagar 39.5 41.9 33.8 33.6 480 420 484 503
Madhya Pradesh Balaghat 47.6 38.0 36.3 32.0 372 473 458 521
Madhya Pradesh Barwani 34.3 35.5 29.8 28.6 537 515 547 555
Madhya Pradesh Betul 58.7 47.2 45.0 41.2 261 357 342 367
Madhya Pradesh Bhind 29.8 23.9 21.8 21.2 581 635 629 622
Madhya Pradesh Bhopal 84.3 93.6 88.2 70.9 59 30 33 85
Madhya Pradesh Burhanpur 46.1 44.8 31.5 35.5 390 387 526 468
Madhya Pradesh Chhatarpur 37.9 36.3 32.4 26.2 500 505 513 579
Madhya Pradesh Chhindwara 53.5 50.8 48.6 42.9 302 316 299 342
Madhya Pradesh Damoh 41.6 44.2 36.8 32.8 445 392 451 514
Madhya Pradesh Datia 39.3 38.7 35.8 34.6 482 456 464 484
Madhya Pradesh Dewas 53.5 57.2 51.7 55.0 300 259 270 209
Madhya Pradesh Dhar 48.9 47.4 41.9 41.2 352 354 376 364
Madhya Pradesh Dindori 27.7 29.4 25.0 23.4 606 587 602 606
Madhya Pradesh East Nimar 45.6 52.0 46.8 39.2 395 305 326 402
Madhya Pradesh Guna 40.3 46.2 40.7 37.7 461 370 396 429
Madhya Pradesh Gwalior 61.8 57.6 52.6 41.7 236 257 262 360
Madhya Pradesh Harda 50.7 67.0 51.2 59.8 332 178 273 159
Madhya Pradesh Hoshangabad 64.3 85.9 80.8 73.2 206 55 62 71
Madhya Pradesh Indore 88.1 95.5 87.6 65.9 47 27 36 103
Madhya Pradesh Jabalpur 77.7 80.2 69.2 57.1 97 87 131 192
Madhya Pradesh Jhabua 28.5 28.6 25.7 24.0 595 591 592 600
Madhya Pradesh Katni 51.1 47.5 43.6 42.9 327 352 357 339
Madhya Pradesh Mandla 32.8 37.6 32.7 29.7 550 484 508 542
Madhya Pradesh Mandsaur 51.5 46.6 41.8 35.3 322 363 377 472
Madhya Pradesh Morena 28.0 26.1 24.7 24.4 602 622 605 595
Madhya Pradesh Narsimhapur 58.4 65.0 60.7 54.9 266 198 202 210
Madhya Pradesh Neemuch 57.9 55.9 47.0 40.9 268 270 322 369
Madhya Pradesh Panna 34.0 36.6 31.9 28.5 539 501 521 557
*New district carved after 2013

70
CRISIL Inclusix scores CRISIL Inclusix ranks
State District 2016 2015 2014 2013 2016 2015 2014 2013
Madhya Pradesh Raisen 49.2 63.5 53.2 50.7 343 217 256 248
Madhya Pradesh Rajgarh 44.4 45.1 42.6 42.8 410 382 364 343
Madhya Pradesh Ratlam 58.6 54.7 49.2 42.9 262 278 296 341
Madhya Pradesh Rewa 40.1 35.3 31.8 29.7 463 518 522 543
Madhya Pradesh Sagar 55.6 63.5 52.9 48.0 285 216 257 281
Madhya Pradesh Satna 44.4 40.0 36.5 38.6 411 444 456 416
Madhya Pradesh Sehore 51.7 59.4 52.8 54.3 319 242 259 215
Madhya Pradesh Seoni 42.6 38.2 33.4 34.0 434 470 494 496
Madhya Pradesh Shahdol 47.3 40.1 37.1 33.8 381 442 446 497
Madhya Pradesh Shajapur 53.5 54.3 48.0 43.1 301 284 306 337
Madhya Pradesh Sheopur 29.0 30.0 26.0 24.0 592 581 587 599
Madhya Pradesh Shivpuri 27.6 31.1 26.0 23.4 609 570 586 609
Madhya Pradesh Sidhi 34.2 26.5 23.3 22.5 538 618 618 616
Madhya Pradesh Singrauli 22.3 26.5 24.6 25.0 639 619 607 589
Madhya Pradesh Tikamgarh 25.2 32.4 28.3 23.8 624 559 563 603
Madhya Pradesh Ujjain 64.1 68.1 59.8 57.1 209 167 206 190
Madhya Pradesh Umaria 31.6 32.4 31.2 29.4 562 558 529 547
Madhya Pradesh Vidisha 45.6 50.8 43.5 39.2 396 317 358 401
Madhya Pradesh West Nimar 41.5 42.6 38.0 37.0 450 408 433 442
Maharashtra Ahmednagar 56.2 48.7 45.1 40.1 283 342 340 389
Maharashtra Akola 62.3 56.4 47.3 48.4 230 263 319 275
Maharashtra Amravati 70.4 66.8 56.2 57.4 152 179 233 185
Maharashtra Aurangabad 57.8 53.7 48.5 45.3 269 292 300 319
Maharashtra Bhandara 62.6 54.7 50.8 50.5 229 280 279 249
Maharashtra Bid 45.2 40.5 36.5 37.2 403 435 453 436
Maharashtra Buldhana 53.0 53.1 47.2 49.9 305 298 320 261
Maharashtra Chandrapur 56.4 46.1 44.6 47.3 280 371 348 291
Maharashtra Dhule 47.4 40.0 35.2 31.6 378 446 471 524
Maharashtra Gadchiroli 26.4 30.5 28.6 28.7 617 575 558 553
Maharashtra Gondia 47.3 41.5 33.6 34.4 380 425 489 491
Maharashtra Hingoli 41.3 37.0 31.9 36.9 451 493 520 443
Maharashtra Jalgaon 51.5 40.9 35.9 30.2 320 429 462 539
Maharashtra Jalna 46.3 45.6 42.3 48.7 389 375 371 272
Maharashtra Kolhapur 80.7 68.3 60.7 48.8 75 164 201 268
Maharashtra Latur 47.4 44.7 36.5 38.2 376 388 455 421
Maharashtra Mumbai 100.0 91.2 100.0 97.2 1 39 1 12

71
CRISIL Inclusix scores CRISIL Inclusix ranks
State District 2016 2015 2014 2013 2016 2015 2014 2013
Maharashtra Mumbai Suburban 63.7 79.9 79.2 80.5 216 91 67 45
Maharashtra Nagpur 92.8 89.5 77.7 65.5 22 43 79 106
Maharashtra Nanded 48.4 46.8 41.3 47.2 356 361 386 292
Maharashtra Nandurbar 29.2 27.8 25.1 25.0 589 600 601 590
Maharashtra Nasik 57.3 51.4 45.3 36.3 273 311 338 455
Maharashtra Osmanabad 49.9 43.5 40.6 37.8 339 402 401 426
Maharashtra Palghar* 41.0 453
Maharashtra Parbhani 43.2 43.9 41.2 45.9 422 396 388 309
Maharashtra Pune 86.0 82.7 81.3 58.2 53 73 60 175
Maharashtra Raigad 64.7 55.6 52.7 43.2 202 271 260 335
Maharashtra Ratnagiri 69.8 63.6 58.8 52.0 159 215 212 231
Maharashtra Sangli 70.2 61.8 54.5 48.8 153 231 244 269
Maharashtra Satara 62.7 51.7 46.9 38.8 227 308 324 411
Maharashtra Sindhudurg 73.2 67.7 64.9 58.3 131 172 167 174
Maharashtra Solapur 56.8 53.5 48.5 46.4 277 296 302 302
Maharashtra Thane 70.5 54.7 51.8 34.8 151 279 267 480
Maharashtra Wardha 81.3 81.5 75.4 82.1 73 79 95 41
Maharashtra Washim 43.0 40.7 34.8 36.4 425 433 477 453
Maharashtra Yavatmal 54.0 49.5 40.9 45.4 295 332 391 316
Manipur Bishenpur 30.3 22.1 17.0 14.4 576 643 647 645
Manipur Chandel 21.6 23.5 24.1 16.8 643 637 615 636
Manipur Churachandpur 23.5 25.0 22.4 21.1 635 628 623 623
Manipur Imphal East 26.2 21.0 17.3 13.7 618 645 646 646
Manipur Imphal West 64.4 58.0 55.2 47.1 205 254 236 293
Manipur Senapati 33.9 34.1 30.4 17.5 541 536 537 634
Manipur Tamenglong 9.6 11.1 9.7 11.0 664 655 655 648
Manipur Thoubal 23.6 24.7 19.7 15.9 634 629 637 642
Manipur Ukhrul 14.9 16.7 13.7 12.6 659 653 652 647
Meghalaya East Garo Hills 28.6 27.1 25.6 26.4 594 610 593 574
Meghalaya East Jaintia Hills* 20.3 649
Meghalaya East Khasi Hills 59.0 66.5 66.0 59.5 259 182 158 162
Meghalaya Jaintia Hills 31.9 33.1 32.0 31.5 558 550 518 526
Meghalaya North Garo Hills* 12.8 662
Meghalaya Ri Bhoi 36.9 44.4 44.9 38.8 512 391 345 409
Meghalaya South Garo Hills 9.3 11.0 11.0 8.4 665 656 653 651
Meghalaya South West Garo Hills* 14.1 660
*New district carved after 2013

72
CRISIL Inclusix scores CRISIL Inclusix ranks
State District 2016 2015 2014 2013 2016 2015 2014 2013
Meghalaya South West Khasi Hills* 18.5 653
Meghalaya West Garo Hills 28.4 27.8 25.4 24.8 596 601 595 592
Meghalaya West Khasi Hills 25.8 29.5 28.3 28.8 621 586 562 552
Mizoram Aizawl 54.1 71.2 64.7 51.6 294 146 170 234
Mizoram Champhai 38.1 50.2 46.6 34.5 496 324 328 489
Mizoram Kolasib 41.8 48.9 48.9 47.1 443 339 298 295
Mizoram Lawngtlai 31.1 29.8 28.7 16.2 566 582 554 641
Mizoram Lunglei 39.6 56.3 51.2 40.5 479 266 274 378
Mizoram Mamit 30.8 46.2 48.4 46.6 567 369 303 301
Mizoram Saiha 39.4 54.1 46.2 38.6 481 287 331 415
Mizoram Serchhip 39.8 52.7 51.8 49.1 473 301 269 266
Nagaland Dimapur 60.8 59.1 54.9 48.1 247 247 240 280
Nagaland Kiphire 15.6 17.9 14.2 11.0 658 651 651 649
Nagaland Kohima 46.3 53.7 51.0 43.6 388 290 276 331
Nagaland Longleng 21.0 25.2 18.9 15.0 646 627 640 644
Nagaland Mokokchung 44.0 50.3 43.9 40.1 417 323 353 388
Nagaland Mon 9.9 12.0 10.6 8.9 663 654 654 650
Nagaland Peren 18.6 24.6 22.4 21.4 652 631 624 621
Nagaland Phek 13.7 17.7 17.5 19.5 661 652 645 632
Nagaland Tuensang 15.7 20.0 18.4 16.4 657 648 641 639
Nagaland Wokha 21.1 27.7 26.3 23.6 645 605 581 605
Nagaland Zunheboto 22.4 28.6 25.2 20.6 638 590 598 626
Odisha Angul 77.8 74.8 63.4 62.2 95 122 180 134
Odisha Baleshwar 63.8 53.4 52.3 53.9 214 297 265 218
Odisha Bargarh 57.1 61.4 53.4 57.3 275 236 254 188
Odisha Bhadrak 59.6 51.7 44.2 44.2 255 307 351 327
Odisha Bolangir 53.6 55.1 56.4 62.5 299 275 229 130
Odisha Boudh 45.2 50.3 38.8 35.3 401 322 422 471
Odisha Cuttack 88.3 78.4 70.6 65.9 45 103 122 104
Odisha Deogarh 53.1 48.8 39.0 37.6 304 341 416 430
Odisha Dhenkanal 64.8 61.6 56.2 55.4 201 233 232 204
Odisha Gajapati 50.8 44.9 42.7 46.3 330 384 363 303
Odisha Ganjam 67.2 61.6 57.4 62.0 184 235 223 137
Odisha Jagatsinghpur 71.5 64.0 54.6 53.5 144 208 243 221
Odisha Jajpur 69.1 58.8 54.1 50.7 169 250 248 247
Odisha Jharsuguda 77.3 79.3 56.7 48.7 100 94 228 271
*New district carved after 2013

73
CRISIL Inclusix scores CRISIL Inclusix ranks
State District 2016 2015 2014 2013 2016 2015 2014 2013
Odisha Kalahandi 45.8 49.8 41.5 45.4 393 327 382 317
Odisha Kandhamal 45.8 43.8 40.6 45.4 394 398 397 314
Odisha Kendrapara 52.3 45.4 41.8 42.6 314 378 378 347
Odisha Keonjhar 55.2 56.9 50.0 55.1 289 261 290 208
Odisha Khurda 100.0 100.0 99.3 96.5 1 1 12 13
Odisha Koraput 48.7 49.6 43.1 43.9 354 330 360 329
Odisha Malkangiri 26.2 29.8 26.1 23.9 619 583 585 601
Odisha Mayurbhanj 52.5 57.9 53.4 58.2 311 255 253 177
Odisha Nawapara 42.8 48.0 36.8 36.9 428 350 452 445
Odisha Nawrangpur 30.6 33.0 26.9 27.3 571 551 574 566
Odisha Nayagarh 67.5 62.3 57.0 60.6 182 227 227 153
Odisha Puri 69.2 63.7 62.2 62.2 167 214 190 135
Odisha Rayagada 48.3 45.7 41.3 47.8 359 374 385 282
Odisha Sambalpur 83.5 81.4 64.2 61.3 63 82 175 143
Odisha Sonepur 49.8 63.1 52.9 54.6 340 220 258 214
Odisha Sundargarh 67.5 65.2 51.3 47.0 183 193 272 297
Puducherry Karaikal 90.5 100.0 100.0 100.0 32 1 1 1
Puducherry Mahe 80.1 100.0 99.4 100.0 78 1 11 1
Puducherry Puducherry 88.7 95.6 92.0 89.0 42 26 23 21
Puducherry Yanam 68.6 68.3 70.9 52.8 176 165 118 227
Punjab Amritsar 78.8 74.3 73.4 59.1 87 125 104 168
Punjab Barnala 69.7 66.0 57.3 63.6 160 187 224 122
Punjab Bathinda 68.8 82.8 78.0 64.5 174 71 77 118
Punjab Faridkot 69.5 71.2 67.7 58.6 161 145 142 172
Punjab Fatehgarh Sahib 72.0 73.2 70.4 60.8 142 134 124 150
Punjab Fazilka 47.8 46.9 40.5 48.8 368 360 404 270
Punjab Ferozpur 75.1 91.6 90.8 62.3 119 37 26 132
Punjab Gurdaspur 65.2 68.4 66.9 55.9 196 163 152 201
Punjab Hoshiarpur 69.0 68.5 67.2 61.6 172 162 149 139
Punjab Jalandhar 78.2 78.0 78.0 62.4 93 104 76 131
Punjab Kapurthala 73.2 72.8 70.7 60.8 132 136 120 149
Punjab Ludhiana 82.1 79.6 78.5 61.9 70 92 71 138
Punjab Mansa 58.0 65.9 59.4 50.8 267 189 210 243
Punjab Moga 61.2 68.6 64.8 59.1 244 160 169 169
Punjab Muktsar 62.0 69.6 61.1 53.2 235 156 197 224
Punjab Pathankot 61.8 62.4 57.8 56.6 238 226 217 196

74
CRISIL Inclusix scores CRISIL Inclusix ranks
State District 2016 2015 2014 2013 2016 2015 2014 2013
Punjab Patiala 82.5 84.1 85.6 68.6 68 63 44 90
Punjab Rupnagar 89.0 80.2 79.5 60.2 41 89 66 157
Punjab Sahibzada Ajit Singh Nagar 72.4 75.3 72.3 59.9 138 119 111 158
Punjab Sangrur 64.0 72.8 69.7 59.6 210 137 128 160
Punjab Shahid Bhagat Singh Nagar 62.6 68.0 66.8 60.7 228 168 153 151
Punjab Tarn Taran 49.7 55.5 49.1 50.0 341 273 297 258
Rajasthan Ajmer 73.8 63.8 57.8 52.6 128 211 219 229
Rajasthan Alwar 50.9 51.1 46.7 44.7 329 313 327 323
Rajasthan Banswara 34.6 33.1 29.4 30.0 536 548 549 541
Rajasthan Baran 42.7 42.7 42.5 45.7 430 407 369 310
Rajasthan Barmer 31.7 25.9 22.9 23.1 561 626 621 610
Rajasthan Bharatpur 37.4 36.1 34.3 34.6 507 509 480 482
Rajasthan Bhilwara 53.7 46.6 40.6 38.3 298 364 398 418
Rajasthan Bikaner 52.7 50.5 47.6 42.9 308 320 312 340
Rajasthan Bundi 51.1 47.4 44.9 47.6 326 353 344 284
Rajasthan Chittaurgarh 63.8 51.1 46.8 46.0 215 314 325 308
Rajasthan Churu 47.9 42.1 38.5 37.7 367 413 426 428
Rajasthan Dausa 42.1 38.7 33.6 33.3 437 457 492 505
Rajasthan Dholpur 27.1 24.1 21.0 22.6 612 633 632 615
Rajasthan Dungarpur 38.0 33.7 30.3 31.4 497 543 541 527
Rajasthan Ganganagar 63.4 65.2 58.8 53.0 219 194 213 226
Rajasthan Hanumangarh 52.0 53.7 48.3 45.5 315 293 305 313
Rajasthan Jaipur 76.6 71.4 65.0 51.6 107 143 166 236
Rajasthan Jaisalmer 44.6 45.0 40.5 40.6 407 383 403 374
Rajasthan Jalor 40.1 31.9 28.2 29.0 464 564 564 551
Rajasthan Jhalawar 40.1 40.5 38.5 40.5 466 437 427 376
Rajasthan Jhunjhunu 53.8 50.5 44.8 42.3 297 319 347 353
Rajasthan Jodhpur 54.3 46.5 42.6 37.1 293 366 366 438
Rajasthan Karauli 31.4 30.3 27.2 26.9 564 579 573 571
Rajasthan Kota 61.5 59.1 55.4 46.7 241 248 235 300
Rajasthan Nagaur 39.9 32.2 27.9 27.1 472 562 568 568
Rajasthan Pali 58.9 45.2 40.5 40.3 260 381 402 385
Rajasthan Pratapgarh 22.8 31.4 24.8 28.6 637 568 604 556
Rajasthan Rajsamand 46.7 39.4 35.1 33.1 386 452 474 508
Rajasthan Sawai Madhopur 46.8 47.2 42.1 40.3 385 356 372 387

75
CRISIL Inclusix scores CRISIL Inclusix ranks
State District 2016 2015 2014 2013 2016 2015 2014 2013
Rajasthan Sikar 50.4 46.2 42.3 41.8 336 367 370 359
Rajasthan Sirohi 47.4 38.0 34.0 33.0 375 474 483 511
Rajasthan Tonk 50.7 48.3 42.5 42.3 335 345 367 352
Rajasthan Udaipur 48.4 44.8 40.3 34.9 357 386 405 478
Sikkim East Sikkim 83.1 73.4 75.6 57.4 65 133 91 186
Sikkim North Sikkim 42.0 51.9 48.5 43.3 440 306 301 334
Sikkim South Sikkim 48.1 54.2 50.1 46.3 364 285 288 304
Sikkim West Sikkim 30.4 36.1 31.2 26.3 574 508 527 577
Tamil Nadu Ariyalur 70.2 71.1 65.4 62.9 155 147 162 128
Tamil Nadu Chennai 99.6 96.0 95.1 94.7 15 25 18 14
Tamil Nadu Coimbatore 94.3 100.0 100.0 100.0 20 1 1 1
Tamil Nadu Cuddalore 69.9 74.0 70.1 72.4 158 126 125 76
Tamil Nadu Dharmapuri 56.6 62.7 58.4 57.9 278 223 215 179
Tamil Nadu Dindigul 70.8 83.6 78.1 80.2 149 65 75 47
Tamil Nadu Erode 88.4 94.3 90.7 87.1 44 28 28 29
Tamil Nadu Kancheepuram 92.3 97.1 92.2 90.1 23 22 22 18
Tamil Nadu Kanyakumari 88.0 89.0 84.2 85.7 48 45 47 31
Tamil Nadu Karur 80.2 85.9 83.3 80.7 77 54 53 44
Tamil Nadu Krishnagiri 64.9 70.8 65.6 66.7 200 150 159 97
Tamil Nadu Madurai 82.2 91.9 86.9 89.2 69 36 40 20
Tamil Nadu Nagapattinam 74.9 79.0 75.2 76.2 122 98 96 61
Tamil Nadu Namakkal 90.9 88.4 83.8 83.9 30 48 51 35
Tamil Nadu Nilgiris 86.6 92.3 86.8 87.9 51 34 41 26
Tamil Nadu Perambalur 76.6 80.5 77.2 77.5 108 84 83 56
Tamil Nadu Pudukkottai 70.0 77.7 75.5 72.7 157 106 94 74
Tamil Nadu Ramanathapuram 69.5 71.3 67.6 68.4 162 144 144 91
Tamil Nadu Salem 70.7 76.5 72.2 72.0 150 113 112 80
Tamil Nadu Sivaganga 84.3 97.6 92.4 88.0 58 20 21 23
Tamil Nadu Thanjavur 77.2 87.7 81.4 83.5 101 50 58 36
Tamil Nadu Theni 72.1 83.1 78.3 84.4 141 70 73 34
Tamil Nadu Thiruvallur 73.1 73.9 70.5 71.0 133 127 123 84
Tamil Nadu Thiruvarur 69.1 83.6 79.5 82.8 170 66 65 37
Tamil Nadu Tiruchirapalli 85.6 92.4 88.7 87.9 55 33 32 25
Tamil Nadu Tirunelvali 78.5 82.6 78.3 79.7 90 74 72 49
Tamil Nadu Tiruppur 69.2 79.1 63.3 67.0 168 95 184 96
Tamil Nadu Tiruvannamalai 61.4 67.3 62.7 64.3 242 176 187 119
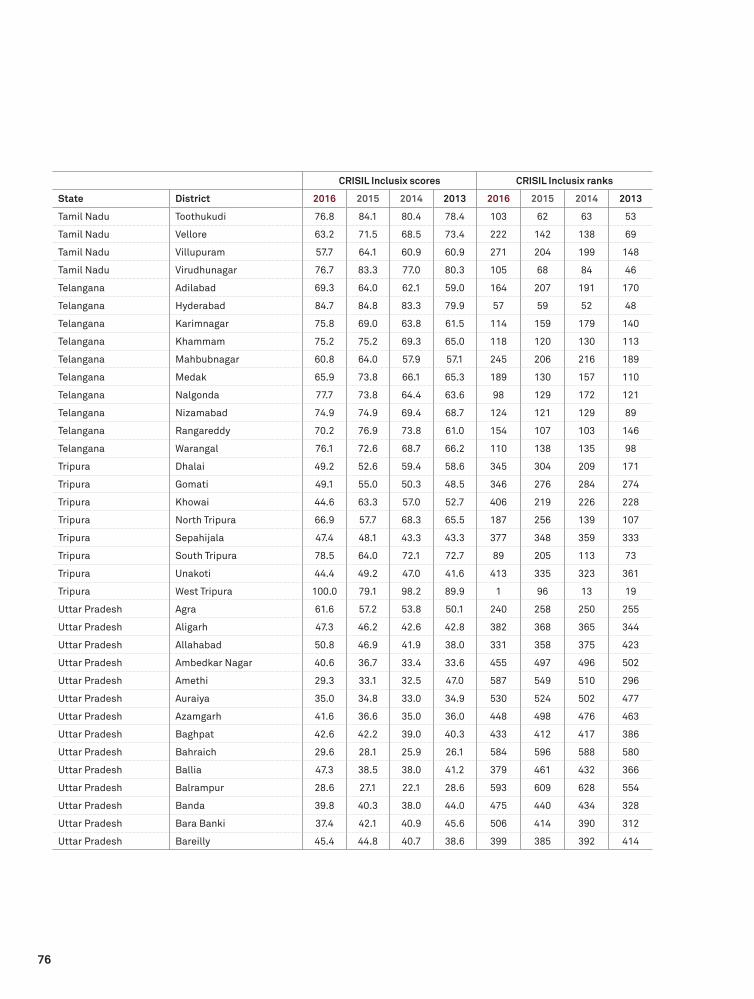
76
CRISIL Inclusix scores CRISIL Inclusix ranks
State District 2016 2015 2014 2013 2016 2015 2014 2013
Tamil Nadu Toothukudi 76.8 84.1 80.4 78.4 103 62 63 53
Tamil Nadu Vellore 63.2 71.5 68.5 73.4 222 142 138 69
Tamil Nadu Villupuram 57.7 64.1 60.9 60.9 271 204 199 148
Tamil Nadu Virudhunagar 76.7 83.3 77.0 80.3 105 68 84 46
Telangana Adilabad 69.3 64.0 62.1 59.0 164 207 191 170
Telangana Hyderabad 84.7 84.8 83.3 79.9 57 59 52 48
Telangana Karimnagar 75.8 69.0 63.8 61.5 114 159 179 140
Telangana Khammam 75.2 75.2 69.3 65.0 118 120 130 113
Telangana Mahbubnagar 60.8 64.0 57.9 57.1 245 206 216 189
Telangana Medak 65.9 73.8 66.1 65.3 189 130 157 110
Telangana Nalgonda 77.7 73.8 64.4 63.6 98 129 172 121
Telangana Nizamabad 74.9 74.9 69.4 68.7 124 121 129 89
Telangana Rangareddy 70.2 76.9 73.8 61.0 154 107 103 146
Telangana Warangal 76.1 72.6 68.7 66.2 110 138 135 98
Tripura Dhalai 49.2 52.6 59.4 58.6 345 304 209 171
Tripura Gomati 49.1 55.0 50.3 48.5 346 276 284 274
Tripura Khowai 44.6 63.3 57.0 52.7 406 219 226 228
Tripura North Tripura 66.9 57.7 68.3 65.5 187 256 139 107
Tripura Sepahijala 47.4 48.1 43.3 43.3 377 348 359 333
Tripura South Tripura 78.5 64.0 72.1 72.7 89 205 113 73
Tripura Unakoti 44.4 49.2 47.0 41.6 413 335 323 361
Tripura West Tripura 100.0 79.1 98.2 89.9 1 96 13 19
Uttar Pradesh Agra 61.6 57.2 53.8 50.1 240 258 250 255
Uttar Pradesh Aligarh 47.3 46.2 42.6 42.8 382 368 365 344
Uttar Pradesh Allahabad 50.8 46.9 41.9 38.0 331 358 375 423
Uttar Pradesh Ambedkar Nagar 40.6 36.7 33.4 33.6 455 497 496 502
Uttar Pradesh Amethi 29.3 33.1 32.5 47.0 587 549 510 296
Uttar Pradesh Auraiya 35.0 34.8 33.0 34.9 530 524 502 477
Uttar Pradesh Azamgarh 41.6 36.6 35.0 36.0 448 498 476 463
Uttar Pradesh Baghpat 42.6 42.2 39.0 40.3 433 412 417 386
Uttar Pradesh Bahraich 29.6 28.1 25.9 26.1 584 596 588 580
Uttar Pradesh Ballia 47.3 38.5 38.0 41.2 379 461 432 366
Uttar Pradesh Balrampur 28.6 27.1 22.1 28.6 593 609 628 554
Uttar Pradesh Banda 39.8 40.3 38.0 44.0 475 440 434 328
Uttar Pradesh Bara Banki 37.4 42.1 40.9 45.6 506 414 390 312
Uttar Pradesh Bareilly 45.4 44.8 40.7 38.6 399 385 392 414
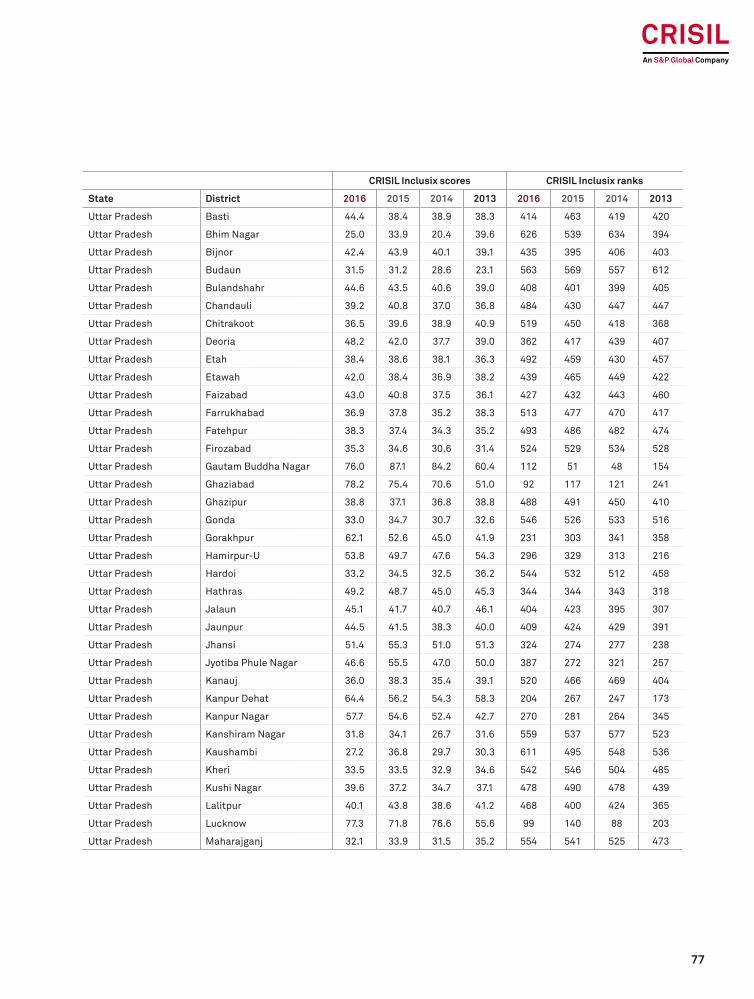
77
CRISIL Inclusix scores CRISIL Inclusix ranks
State District 2016 2015 2014 2013 2016 2015 2014 2013
Uttar Pradesh Basti 44.4 38.4 38.9 38.3 414 463 419 420
Uttar Pradesh Bhim Nagar 25.0 33.9 20.4 39.6 626 539 634 394
Uttar Pradesh Bijnor 42.4 43.9 40.1 39.1 435 395 406 403
Uttar Pradesh Budaun 31.5 31.2 28.6 23.1 563 569 557 612
Uttar Pradesh Bulandshahr 44.6 43.5 40.6 39.0 408 401 399 405
Uttar Pradesh Chandauli 39.2 40.8 37.0 36.8 484 430 447 447
Uttar Pradesh Chitrakoot 36.5 39.6 38.9 40.9 519 450 418 368
Uttar Pradesh Deoria 48.2 42.0 37.7 39.0 362 417 439 407
Uttar Pradesh Etah 38.4 38.6 38.1 36.3 492 459 430 457
Uttar Pradesh Etawah 42.0 38.4 36.9 38.2 439 465 449 422
Uttar Pradesh Faizabad 43.0 40.8 37.5 36.1 427 432 443 460
Uttar Pradesh Farrukhabad 36.9 37.8 35.2 38.3 513 477 470 417
Uttar Pradesh Fatehpur 38.3 37.4 34.3 35.2 493 486 482 474
Uttar Pradesh Firozabad 35.3 34.6 30.6 31.4 524 529 534 528
Uttar Pradesh Gautam Buddha Nagar 76.0 87.1 84.2 60.4 112 51 48 154
Uttar Pradesh Ghaziabad 78.2 75.4 70.6 51.0 92 117 121 241
Uttar Pradesh Ghazipur 38.8 37.1 36.8 38.8 488 491 450 410
Uttar Pradesh Gonda 33.0 34.7 30.7 32.6 546 526 533 516
Uttar Pradesh Gorakhpur 62.1 52.6 45.0 41.9 231 303 341 358
Uttar Pradesh Hamirpur-U 53.8 49.7 47.6 54.3 296 329 313 216
Uttar Pradesh Hardoi 33.2 34.5 32.5 36.2 544 532 512 458
Uttar Pradesh Hathras 49.2 48.7 45.0 45.3 344 344 343 318
Uttar Pradesh Jalaun 45.1 41.7 40.7 46.1 404 423 395 307
Uttar Pradesh Jaunpur 44.5 41.5 38.3 40.0 409 424 429 391
Uttar Pradesh Jhansi 51.4 55.3 51.0 51.3 324 274 277 238
Uttar Pradesh Jyotiba Phule Nagar 46.6 55.5 47.0 50.0 387 272 321 257
Uttar Pradesh Kanauj 36.0 38.3 35.4 39.1 520 466 469 404
Uttar Pradesh Kanpur Dehat 64.4 56.2 54.3 58.3 204 267 247 173
Uttar Pradesh Kanpur Nagar 57.7 54.6 52.4 42.7 270 281 264 345
Uttar Pradesh Kanshiram Nagar 31.8 34.1 26.7 31.6 559 537 577 523
Uttar Pradesh Kaushambi 27.2 36.8 29.7 30.3 611 495 548 536
Uttar Pradesh Kheri 33.5 33.5 32.9 34.6 542 546 504 485
Uttar Pradesh Kushi Nagar 39.6 37.2 34.7 37.1 478 490 478 439
Uttar Pradesh Lalitpur 40.1 43.8 38.6 41.2 468 400 424 365
Uttar Pradesh Lucknow 77.3 71.8 76.6 55.6 99 140 88 203
Uttar Pradesh Maharajganj 32.1 33.9 31.5 35.2 554 541 525 473
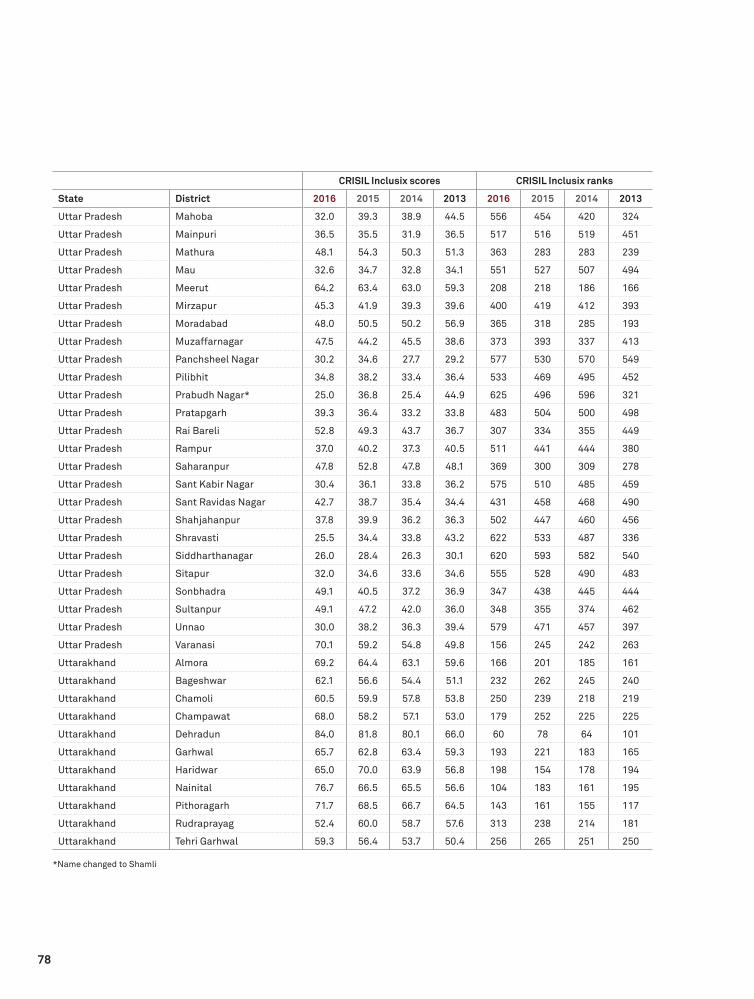
78
CRISIL Inclusix scores CRISIL Inclusix ranks
State District 2016 2015 2014 2013 2016 2015 2014 2013
Uttar Pradesh Mahoba 32.0 39.3 38.9 44.5 556 454 420 324
Uttar Pradesh Mainpuri 36.5 35.5 31.9 36.5 517 516 519 451
Uttar Pradesh Mathura 48.1 54.3 50.3 51.3 363 283 283 239
Uttar Pradesh Mau 32.6 34.7 32.8 34.1 551 527 507 494
Uttar Pradesh Meerut 64.2 63.4 63.0 59.3 208 218 186 166
Uttar Pradesh Mirzapur 45.3 41.9 39.3 39.6 400 419 412 393
Uttar Pradesh Moradabad 48.0 50.5 50.2 56.9 365 318 285 193
Uttar Pradesh Muzaffarnagar 47.5 44.2 45.5 38.6 373 393 337 413
Uttar Pradesh Panchsheel Nagar 30.2 34.6 27.7 29.2 577 530 570 549
Uttar Pradesh Pilibhit 34.8 38.2 33.4 36.4 533 469 495 452
Uttar Pradesh Prabudh Nagar* 25.0 36.8 25.4 44.9 625 496 596 321
Uttar Pradesh Pratapgarh 39.3 36.4 33.2 33.8 483 504 500 498
Uttar Pradesh Rai Bareli 52.8 49.3 43.7 36.7 307 334 355 449
Uttar Pradesh Rampur 37.0 40.2 37.3 40.5 511 441 444 380
Uttar Pradesh Saharanpur 47.8 52.8 47.8 48.1 369 300 309 278
Uttar Pradesh Sant Kabir Nagar 30.4 36.1 33.8 36.2 575 510 485 459
Uttar Pradesh Sant Ravidas Nagar 42.7 38.7 35.4 34.4 431 458 468 490
Uttar Pradesh Shahjahanpur 37.8 39.9 36.2 36.3 502 447 460 456
Uttar Pradesh Shravasti 25.5 34.4 33.8 43.2 622 533 487 336
Uttar Pradesh Siddharthanagar 26.0 28.4 26.3 30.1 620 593 582 540
Uttar Pradesh Sitapur 32.0 34.6 33.6 34.6 555 528 490 483
Uttar Pradesh Sonbhadra 49.1 40.5 37.2 36.9 347 438 445 444
Uttar Pradesh Sultanpur 49.1 47.2 42.0 36.0 348 355 374 462
Uttar Pradesh Unnao 30.0 38.2 36.3 39.4 579 471 457 397
Uttar Pradesh Varanasi 70.1 59.2 54.8 49.8 156 245 242 263
Uttarakhand Almora 69.2 64.4 63.1 59.6 166 201 185 161
Uttarakhand Bageshwar 62.1 56.6 54.4 51.1 232 262 245 240
Uttarakhand Chamoli 60.5 59.9 57.8 53.8 250 239 218 219
Uttarakhand Champawat 68.0 58.2 57.1 53.0 179 252 225 225
Uttarakhand Dehradun 84.0 81.8 80.1 66.0 60 78 64 101
Uttarakhand Garhwal 65.7 62.8 63.4 59.3 193 221 183 165
Uttarakhand Haridwar 65.0 70.0 63.9 56.8 198 154 178 194
Uttarakhand Nainital 76.7 66.5 65.5 56.6 104 183 161 195
Uttarakhand Pithoragarh 71.7 68.5 66.7 64.5 143 161 155 117
Uttarakhand Rudraprayag 52.4 60.0 58.7 57.6 313 238 214 181
Uttarakhand Tehri Garhwal 59.3 56.4 53.7 50.4 256 265 251 250
*Name changed to Shamli

79
CRISIL Inclusix scores CRISIL Inclusix ranks
State District 2016 2015 2014 2013 2016 2015 2014 2013
Uttarakhand Udham Singh Nagar 65.9 74.5 69.0 64.0 190 123 132 120
Uttarakhand Uttar Kashi 50.7 56.4 51.8 49.8 333 264 268 262
West Bengal Alipurduar* 28.2 600
West Bengal Bankura 46.0 36.5 33.6 39.5 391 503 491 396
West Bengal Barddhaman 63.5 49.6 50.5 48.1 218 331 282 279
West Bengal Birbhum 52.0 42.9 45.3 45.7 316 405 339 311
West Bengal Cooch Behar 47.7 41.1 56.0 61.1 370 428 234 145
West Bengal Dakshin Dinajpur 51.0 38.2 47.4 47.3 328 468 316 290
West Bengal Darjeeling 70.9 66.1 71.2 71.7 147 186 117 81
West Bengal Howrah 62.0 45.4 50.8 47.8 234 377 281 283
West Bengal Hugli 60.6 45.2 50.8 50.3 249 380 280 252
West Bengal Jalpaiguri 68.9 39.4 51.0 56.2 173 451 278 200
West Bengal Kolkata 100.0 100.0 97.7 77.0 1 1 15 59
West Bengal Maldah 40.0 33.7 35.9 35.9 469 545 463 464
West Bengal Murshidabad 40.4 34.2 39.8 42.0 460 535 409 357
West Bengal Nadia 54.4 42.0 47.4 48.4 290 418 318 276
West Bengal North 24 Parganas 58.4 45.4 49.4 47.5 265 379 294 287
West Bengal Paschim Medinipur 50.0 41.8 41.5 40.9 337 421 383 370
West Bengal Purba Medinipur 51.5 38.3 37.6 37.4 321 467 440 432
West Bengal Puruliya 32.9 27.0 25.8 27.3 548 613 589 565
West Bengal South 24 Parganas 44.8 33.8 37.8 38.9 405 542 437 408
West Bengal Uttar Dinajpur 41.9 34.7 37.9 43.1 441 525 436 338
Total 58.0 56.2 53.2 50.1
*New district carved after 2013
80
81
Methodology

82
This section describes the methodology for calculating CRISIL Inclusix.
Objective
CRISIL Inclusix measures the extent of financial inclusion at a geographical level, starting with the district and aggregating across state, region and national levels.
Coverage
CRISIL Inclusix covers all 666 districts, 36 states/union territories and five regions in the country as of the end of March 31, 2016.
CRISIL Inclusix also measures financial inclusion for different periods to enable inter-temporal comparison. It currently measures financial inclusion on an annual frequency from 2009 to 2016.
Depending on the availability of data, the frequency can be increased.
Parameters
Several dimensions are used to evaluate the extent of financial inclusion in a country. CRISIL has followed a multidimensional approach to compute financial inclusion.
CRISIL Inclusix is a composite index, currently measuring financial inclusion as an aggregate of four key dimensions: branch, credit, deposit and insurance penetration.
CRISIL Inclusix uses six parameters as proxies to measure the four key dimensions of financial inclusion (table 9).
Dimensions and parameters used to measure financial inclusion
Parameters Significance Interpretation
Branch penetration (BP)
No. of branches per lakh of population in a district
Measures the ease with which people in a particular territory can access financial services
The higher the better
Credit penetration (CP)
No. of loan accounts per lakh of population in a district
Measures the extent of access to loan products offered in a particular territory
The higher the better
No. of loan accounts classified in “personal loans” occupation group as per the RBI’s definition or number of microfinance loans per lakh of population in a district
Measures access to credit forretail borrowers, who typicallyface financial non-inclusion
The higher the better
No. of agricultural advances per lakh of population in a district
Measures farmers’ access to credit
The higher the better
Deposit penetration (DP)
No. of deposit accounts per lakh of population in a district
Measures the extent of access to deposit products offered by banks in a particular territory
The higher the better
Insurance penetration (IP)
No. of life insurance policies per lakh of population in a district
Measures the extent of access to insurance services offered by insurance companies in a particular territory
The higher the better
Methodology for calculating CRISIL Inclusix
83
As CRISIL defines financial inclusion in terms of coverage, reach and penetration, and not in terms of size or volume, all CRISIL Inclusix parameters are measured in non-monetary units.
Data
• Data on banks has been downloaded from the RBI’s official website - https://dbie.rbi.org.in.
• Data on MFIs from fiscal 2013 onwards has been provided by MFIN.
• Data on insurance has been provided by IIB and is available only for fiscal 2016.
• Data on population for 2011 has been used as per Census of India 2011.
• Data on population for other years has been estimated using population data as per Census of India 2001 and 2011. The estimation was done using the growth factor for population between 2001 and 2011.
• Population of the reorganised and newly formed districts has been obtained from the state ministries or estimated based on the taluka-wise composition of the existing and newly carved-out districts or sourced from their official state or district websites, to the extent available.
• Data reckoned for evaluating deposit penetration has been revised to include all deposits (current, savings and term) as against only savings deposit reckoned in the earlier editions. This change enlarges the measure of deposit accounts.
• Data reckoned for evaluating credit penetration has been revised to include total loan, retail loan and agri loan accounts as against total loan, small borrower loan and agri loan accounts in the earlier editions. Small borrower loan account has been replaced with retail loan account as the latter provides more granularity on household consumption-linked credit.
• In case there has been a sharp increase or decrease in the parametric value for any district
followed by a reversal in trend in the subsequent year, the parametric value for the impacted year has been rationalised by taking the median value of the previous and subsequent years.
Calculations: CRISIL Inclusix
The calculation of CRISIL Inclusix involves the following steps:
Step 1 Normalisation of parametersAs noted above, CRISIL Inclusix is a composite index that measures financial inclusion as an aggregate of six parameters. However, these parameters have different units and cannot, therefore, be aggregated directly to arrive at a composite index. Every parameter is first normalised using the Min-Max method of normalisation:
Xi value for a particular parameter for the district ‘i’
X (min) minimum value for a particular parameter observed across all districts
X (max) maximum value for a particular parameter observed across all districts
Normalisation converts data for every parameter into numbers between 0 and 100; 0 depicts the worst performer and 100 the best. Normalised values of all the six parameters may be referred to as parameter indices. The normalised parameter indices are free of units and dimensions, and are easily aggregated. This approach is similar to the one used by
Xi (Normalised) =Xi - X(min)
X(max) - X(min)*100

84
United Nations Development Programme (UNDP) for computation of well-known development indices such as the Human Development Index.
CRISIL Inclusix, however, employs a modified version of the Min-Max method of normalisation. Its minimum and maximum values are different from the observed minimum and maximum values. Moreover, the minimum and maximum values it uses are rebased only after five years. This facilitates inter-temporal comparison of the index to assess progress in financial inclusion over time.
The maximum is set at a defined ideal value for each parameter. This ensures that the normalised scores for districts with lower values do not cluster. Hence, capping the maximum value at a lower-than-observed maximum ensures a meaningful differentiation among districts with low scores.
Aggregation using the displaced ideal methodAggregation entails aggregation of the four dimension indices (BP, average of the three CP parameter indices, DP and IP).
The four dimension indices - BP, CP, DP and IP - may be represented in a four-dimensional space with 0 as the minimum value and 100 as the maximum (ideal) for each dimension.
Each district may be represented by a particular point in the four dimensional space (0, 0, 0, 0 and 100, 100, 100, 100) shown above. CRISIL Inclusix is measured as the inverse of the Euclidean distance
Step 2
from the ideal point (100, 100, 100, 100). The Euclidean Distance Method is used to calculate the distance between any two points in an n-dimensional space.
In the formula, the numerator of the second component is the Euclidean distance of the district ‘i’ from the ideal point (100, 100, 100, 100), normalising it in order to make the value lie between 0 and 100, and the inverse distance is considered so that the higher value corresponds to higher financial inclusion.
This method of aggregation, as opposed to the averaging method, satisfies all the intuitive properties of an index, including
• Normalisation• Anonymity• Monotony• Proximity• Uniformity• Signaling
All these properties, together called NAMPUS, are discussed in IGIDR Working Paper 2008, authored by Hippu Salk, Kristle Nathan, Srijit Mishra, and B Sudhakara Reddy.
100
BP
0,0,0,0 DP
IP
100
100
CP 100
CRISIL Inclusix - District (I) = 100 - (100-BPi)ˆ2+(100-CPi)ˆ2+(100-DPi)ˆ2+(100-IPi)ˆ2
4

85
This method of aggregation does away with the assumption of perfect substitutability among the four dimensions of the averaging method. Hence, a good performance in one dimension, say DP, does not fully compensate for poor performance in another dimension, say CP.
CRISIL believes that all four dimensions are critical and independent of each other. For a district to score well in financial inclusion, it should score well in all the dimensions.
Recalibration of ideals and score cut-offs
In the first three editions of the index, ideals and score cut-offs (indicating different levels of financial inclusion - high, above average, below average and low) have been kept constant to facilitate inter-temporal comparison. However, like most other indices, CRISIL revisits the ideals and score cut-offs on a periodic basis for their continued relevance, and recalibrates them as and when needed.
As mirrored in the progress of CRISIL Inclusix since 2013, financial inclusion metrics have steadily expanded over these years. This has entailed recalibration of the ideals to ensure meaningful coverage of and differentiation among districts across all years.
In the current edition, we have rebased the ideals across the existing three dimensions viz., BP, CP and DP, and calibrated ideals for the newly included dimension IP. Based on these changes we have revised cut-off scores as well.
Incorporation of life insurance data in the index in 2016
Insurance has been added as the fourth dimension in the index and incorporation in index calculation is described in step 2. In future, health insurance can also be added along with life insurance as and when granular district-wise data is available.
Incorporation of MFIs in the index in 2013
The index value for any district from 2013 onwards has been arrived at by combining the bank and MFI data at an individual dimension level. Say, for example, the BP score for any district has been arrived at by combining the normalised BP scores of banks and MFIs. The CP score for any district has been arrived at in a similar manner. MFIs do not contribute to the DP score. Rest of the methodology remains identical.
We have considered the following unique aspects pertaining to MFIs in this process:
1. While banks contribute to all the three dimensions of financial inclusion, MFIs’ contribution is limited to only two of the three dimensions, as regulation forbids them from accepting deposits.
2. MFIN has provided data on MFIs for 513 districts (out of 666 districts), reflecting their current presence.
3. CRISIL has only considered active MFI loan accounts in its Inclusix score. Most of the loan accounts in Andhra Pradesh and Telangana are inactive as there is limited microfinance activity after the promulgation of ordinance by the state government in October 2010.

86


Argentina | China | Hong Kong | India | Poland | Singapore | UK | USACRISIL Limited: CRISIL House, Central Avenue, Hiranandani Business Park, Powai, Mumbai – 400076. IndiaPhone: + 91 22 3342 3000 | Fax: + 91 22 3342 3001 | www.crisil.com
About CRISIL LimitedCRISIL is an agile and innovative, global analytics company driven by its mission of making markets function better.
We are India’s foremost provider of ratings, data, research, analytics and solutions. A strong track record of growth, culture of innovation and global footprint sets us apart. We have delivered independent opinions, actionable insights, and efficient solutions to over 100,000 customers. CRISIL’s businesses operate from India, the US, the UK, Argentina, Poland, China, Hong Kong and Singapore.
CRISIL is majority owned by S&P Global Inc., a leading provider of transparent and independent ratings, benchmarks, ana-lytics and data to the capital and commodity markets worldwide.
CRISIL Privacy CRISIL respects your privacy. We use your contact information, such as your name, address, and email id, to fulfil your re-quest and service your account and to provide you with additional information from CRISIL and other parts of S&P Global Inc. and its subsidiaries (collectively, the “Company”) you may find of interest.
For further information, or to let us know your preferences with respect to receiving marketing materials, please visit www.crisil.com/privacy. You can view the Company’s Customer Privacy at https://www.spglobal.com/privacy
Last updated: April 2016