Criminal thinking in a Middle Eastern prison sample of thieves, drug dealers, and murderers
40
1 Criminal thinking in a Middle Eastern prison sample of thieves, drug dealers and murderers Ahmed M. Megreya 1,2 , Markus Bindemann 3 & Anna Brown 3 1 Department of Psychology, Menoufia University, Egypt 2 Department of Psychological Sciences, Faculty of Education, Qatar University, Qatar 3 School of Psychology, University of Kent, UK Address Correspondence to Dr Ahmed M. Megreya Department of Psychology, Faculty of Arts, Menoufia University, Shebin El-Kom, Egypt E-mail: [email protected] Word count (excluding abstract, references and table captions): 6094
Transcript of Criminal thinking in a Middle Eastern prison sample of thieves, drug dealers, and murderers

1
Criminal thinking in a Middle Eastern prison sample of thieves, drug dealers and
murderers
Ahmed M. Megreya1,2
, Markus Bindemann3 & Anna Brown
3
1 Department of Psychology, Menoufia University, Egypt
2 Department of Psychological Sciences, Faculty of Education, Qatar University, Qatar
3 School of Psychology, University of Kent, UK
Address Correspondence to
Dr Ahmed M. Megreya
Department of Psychology,
Faculty of Arts,
Menoufia University,
Shebin El-Kom, Egypt
E-mail: [email protected]
Word count (excluding abstract, references and table captions): 6094

2
Abstract
Purpose: The Psychological Inventory of Criminal Thinking Styles (PICTS) has been
applied extensively to the study of criminal behaviour and cognition. This study aimed to
explore the psychometric characteristics (factorial structure, reliability and external
validity) of an Arabic version of the PICTS, to explore cross-cultural differences between
a sample of Middle-Eastern (Egyptian) prisoners and Western prison samples, and to
examine the influence of type of crime on criminal thinking styles.
Method: A group of 130 Egyptian male prisoners who had been sentenced for theft, drug
dealing or murder completed the PICTS. Their scores were compared with the reported
data of American, British, and Dutch prisoners.
Results: The Arabic PICTS showed scale reliabilities estimated by coefficient alpha
comparable to the English version, and reliabilities estimated as test-retest correlations
were high. Confirmatory factor analysis showed that the PICTS subscale scores of
Egyptian prisoners best fitted a two-factor model, in which one dimension comprised
mollification, entitlement, superoptimism, sentimentality and discontinuity, and the
second dimension reflected the thinking styles of power orientation, cut-off and cognitive
indolence. Observed levels of thinking styles varied by type of crime, specifically
between prisoners sentenced for theft, drug dealing, and murder. Cultural differences in
criminal thinking styles were also found, whereby the Egyptian prisoners recorded the
highest scores in most thinking styles, while American, Dutch and English prisoners were
more comparable to each other.
Conclusions: This study provides one of the first investigations of criminal thinking
styles in a non-Western sample and suggests that cross-cultural differences in the
structure of these thinking styles exist. In addition, the results indicate that criminal
thinking styles need to be understood by the type of crime for which a person has been
sentenced.
Keywords: PICTS, criminal, assessment, thinking styles, culture

3
Introduction
Understanding criminal behaviour requires an insight into how criminals think
about themselves, about other people, and about their position within the world. Without
such knowledge, any theory of criminal behaviour is inevitably incomplete. And with
such knowledge, it may be possible to predict who is likely to commit a first criminal
offense or likely to re-offend (e.g., Palmer & Hollin, 2004a; Walters, 1997; Walters &
Elliott, 1999), and it might be possible to design more effective rehabilitation
programmes for correctional settings (e.g., Walters, 2003; Walters, Trgovac, Rychlec, Di
Fazio, & Olson, 2002; Wilson, Attrill, & Nugent, 2003). The potential benefits of
studying criminal thinking are therefore substantial, and research in this area is
increasingly attracting the attention of psychologists in the legal, forensic, and
criminological divisions (for reviews, see, e.g., Eysenck, 1996; Gendreau, Little, &
Goggin, 1996; Palmer, 2007; Walters, 2009a).
Despite recent advances in understanding criminal thinking, some considerable
gaps in knowledge still remain. Many aspects of cognition and behaviour are, for
example, subject to substantial cross-cultural differences (see, e.g., Henrich, Heine, &
Norenzayan, 2010). So far, the vast majority of research into criminal thinking has
focused only on prison populations in Western countries (for reviews, see, e.g., Palmer,
2007; Walters, 2006a; 2009a). It therefore remains unresolved whether previous research
findings generalize more widely or whether criminal thinking styles differ across
cultures. In this study, we aim to contribute by providing such data for a prison
population in a Middle Eastern country (Egypt). We compare data from the Egyptian
prisoners with reported data from the Netherlands, the UK, and the USA.

4
The existing research in this domain has assessed criminal thinking with one of
four available self-report tests: the Criminal Sentiments Scale (CSS: Gendreau, Grant,
Leipciger, & Collins, 1979; Simourd, 1997), the Measures of Criminal Attitudes and
Associates (MCAA: Mills, Kroner, & Forth, 2002), the Psychological Inventory of
Criminal Thinking Styles (PICTS: Walters, 1995), and the Texas Christian University
Criminal Thinking Scale (CTS: Knight, Garner, Simpson, Morey, & Flynn, 2006). Of
these, the PICTS has been the most widely used test, not only in the USA (for reviews,
see, e.g., Walters, 2002b, 2006a, 2009a), but also in the UK (Palmer & Hollin, 2003,
2004a, 2004b), Ireland (Healy & O’Donnell, 2006), and the Netherlands (Bulten, Nijman,
& van der Staak, 2009). This widespread use appears to be justified as the PICTS shows
good psychometric characteristics across these national studies, which indicates that it
provides a stable assessment of criminal thinking styles in a variety of population
samples.
Overview of the PICTS
The PICTS assessment is based on the lifestyle model of criminal conduct
(Walters, 1990). This model defines criminal lifestyles in terms of interpersonal
intrusiveness, irresponsibility, self-indulgence, and social rule breaking, and stipulates
that these behaviours arise from three influences: conditions, choice, and cognition.
Conditions refer to the internal (e.g., heredity), external (e.g., family), or interactive
(person and situation) influences that shape individual behaviours, while choices reflect
the range of options that are available to a person in life. Finally, cognition refers to the
explanations and rationalizations of choice decisions in order to reduce or even eliminate

5
any feelings of guilt that might arise from these. These three influences are seen to be
interdependent, but the cognition component appears to play a particularly decisive role.
For example, while cognition processes may provide a retrospectively supportive role for
specific choices, they could also affect the perception of conditions and modify ongoing
decision-making processes (see, e.g., Walters, 1990, 2006b, 2009a). The general purpose
of the PICTS is, therefore, to assess the cognition influence.
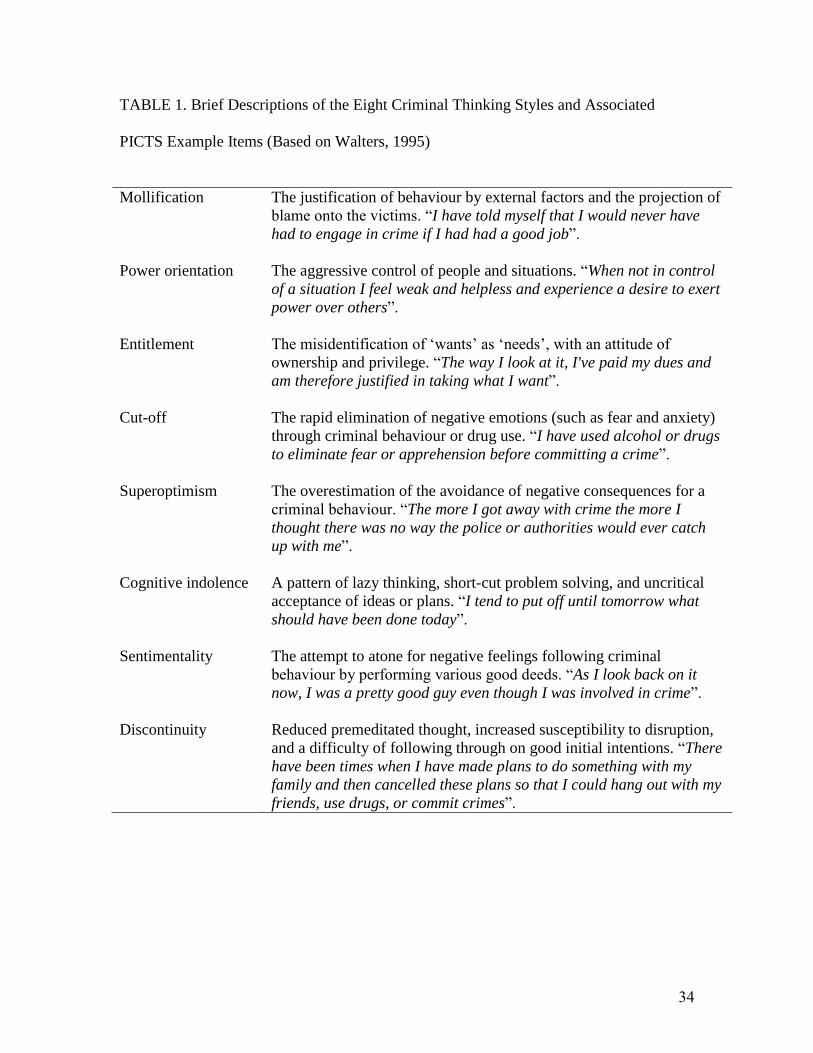
The PICTS measures eight different thinking styles: mollification (Mo), power
orientation (Po), entitlement (En), cut-off (Co), superoptimism (So), cognitive indolence
(Ci), sentimentality (Sn), and discontinuity (Ds). Brief descriptions of these thinking
styles are provided in Table 1 (for a fuller description, see, e.g., Walters, 1995, 2002b,
2009a). Factor analyses of these thinking styles have led to several structural models of
the PICTS, across different studies. In the original validation study, Walters (1995)
identified a four-factor model as the basis for understanding criminal thinking. In this
model, the first factor (“problem avoidance”) describes a general tendency to ignore
problems by eliminating them from consideration (Co), finding shortcuts (Ci), or by
being easily distracted (Ds). The second factor (“inter-personal hostility”) is not
associated with any of the eight sub-scales but appears to reflect hostility and arrogance
according to the individual questionnaire items which loaded on this factor. The third
factor (“self deception”) involves self-deception (En), over-estimation of getting away
with criminal behaviour (So), and justification of irresponsible acts (Mo). Finally, the
fourth factor (“denial of harm”) describes a tendency to ignore, deny or minimize the
harmful consequences of criminal behaviour.

6
--------------- TABLE 1 HERE PLEASE ---------------
Subsequent studies have, however, suggested different numbers of factors to
explain variance in the PICTS. Egan, McMurran, Richardson and Blair (2000), for
example, performed a principal-components analysis on the eight PICTS styles using the
same data as in Walters’s (1995) study and argued that only two principal components
explained most variance. Of these, the first principal component described a lack of
thoughtfulness and was formed by six thinking styles (Ci, Co, Ds, Mo, Sn, and So),
whereas the second component, labeled willful hostility, was formed by four thinking
styles (En, Mo, Po, and Sn). However, this solution is unlikely to be a viable alternative
model for the PICTS due to the inappropriateness of the employed analyses (i.e.,
principal-components analysis where factor analysis was called for, varimax rotation
where an oblique rotation would have been more appropriate).
In subsequent work, Walters (2005) also re-examined the factorial structure of the
PICTS using new samples of male and female American adult prisoners. In this study, a
four-factor model again achieved the best fit. This model appears to consist of two
primary factors, which reflect problem avoidance and self-assertion/deception, and two
secondary factors reflecting interpersonal hostility and denial of harm (Walters, 2005).
Further factorial studies have conceptualized criminal thinking as a higher order construct
that is supported by proactive and reactive criminal thinking (Walters, 2007a, 2008,
2009b). These two factors distinguish instrumental prisoners, who are more likely to plan
crimes in advance and aggress against strangers, from impulsive individuals, who are
more likely to react against acquaintances in response to provocation (Cornell et al.,

7
1996). Within the PICTS, the factor of self-assertion/deception appears to provide a good
proxy for proactive criminal thinking based on its association with mollification,
entitlement, and superoptimism, while problem avoidance seems to capture reactive
criminality due to its association with cutoff, cognitive indolence, and discontinuity
(Walters, 2008).
More recently, Walters, Hagman, and Cohn (2011) have applied confirmatory
factor analysis to categorical item responses (item response theory) to provide a further
assessment for the structure of the PICTS. This approach has provided preliminary
support for a hierarchical structure, with general criminal thinking (GCT) at the top,
proactive and reactive criminal thinking in the middle, and individual PICTS items at the
bottom of the hierarchy. Items measuring four styles (mollification, entitlement, power
orientation, and superoptimism) largely loaded on the proactive factor, and items
measuring three styles (cutoff, cognitive indolence, and discontinuity) formed the
reactive factor, while items from the PICTS sentimentality scale were poor indicators of
general criminal thinking.
Cross-national investigations on the PICTS
The factorial studies reviewed so far were conducted using American prisoners.
However, it appears possible that the factor stucture of criminal thinking as measured by
the PICTS may vary according to the cultural context in which this assessment is
obtained. For example, Palmer and Hollin (2003) argued that only one factor was
sufficient to explain variance in eight clinical scales of the PICTS in a sample of English
adult prisoners. However, this study employed principal-components analysis with

8
varimax rotation, which is not a suitable technique for identifying common sources of
variance in correlated scales (e.g., Borsboom, 2006). With a sample of young English
prisoners, Palmer and Hollin (2004b) also extracted two principal components, indicated
by five (cutoff, power orientation, superoptimism, cognitive indolence, and discontinuity)
and three (mollification, entitlement, and sentimentality) thinking styles, respectively.
This same two-component solution was then replicated using a population of Dutch
prisoners (Bulten et al., 2009). However, due to the psychometric inappropriateness of
the above analyses, the jury is still out on the factorial structure of criminal thinking
styles as measured by the PICTS in non-American populations.
In addition to structural differences, cross-cultural differences in the levels of
thinking styles also appear to exist in criminal thinking styles. In one notable study,
Palmer and Hollin (2003) compared English and American adult male prisoners using the
descriptive statistics reported in Walters’s (1995) original study. This comparison showed
that English prisoners scored higher than American prisoners in all criminal thinking
styles except for sentimentality. In a subsequent study, Bulten et al. (2009) reported a
further comparison of Dutch, American and English prisoners, by combining the means
and standard deviations that were reported by Walters (1995) and Palmer and Hollin
(2003) with data from a Dutch sample. In contrast to Palmer and Hollin (2003), however,
Bulten et al. (2009) only used Walters’s (1995) data of maximum-security prisoners for
these comparisons. As a consequence, Bulten et al. (2009) found no differences between
the English prisoners and this selection of American prisoners. By contrast, the Dutch
prisoners scored lower than American and English prisoners in entitlement, cognitive
indolence, and cut-off, and also lower than the American sample in superoptimism.

9
Taken together, these findings therefore suggest that cultural differences in
criminal thinking styles might exist. Unfortunately, such comparisons are still limited to a
small selection of Western countries. A recent investigation into the link between
criminal thinking and emotional intelligence has begun to extend research in this field to
a small sample of Arab prisoners (N = 56), but this work is still very limited (Megreya,
2013). As a consequence, the extent to which current knowledge of criminal thinking
styles can be generalized more widely, to prison populations in non-Western cultures,
remains largely unknown.
Type of crime as a moderator of criminal thinking styles
There is, as far as we know, also only very limited information as to whether any
differences in criminal thinking styles might be related to the type of crime that a person
has committed (for a review see, e.g., Walters, 2006a). This is an important issue.
Capturing the differences between distinct types of crime is not only essential for the
implementation of any credible justice system, but this might also be central to explaining
differences in the data between studies that have investigated criminal thinking. Palmer
and Hollin (2003) suggest, for example, that type of crime might account for the
discrepancies found between the PICTS scores of English and American prisoners. In line
with such reasoning, there is evidence that prisoners sentenced for violent crimes score
higher on a criminal attitude test than prisoners convicted for nonviolent offences
(Polaschek, Collie, & Walkey, 2004). Similarly, it seems possible to predict re-offending
for violent but not for non-violent crimes (Simourd & van de Ven, 1999). These studies
therefore suggest that criminal thinking should be studied also by type of crime to

10
understand whether particular thought processes contribute to specific criminal activities
(for similar suggestions, see, e.g., Walters et al., 2011).
Research objectives
In the present study, we administered the PICTS to a Middle Eastern (Egyptian)
sample of adult male prisoners to begin to investigate these outstanding questions. Our
first aim was to test the basic psychometric characteristics of the PICTS with a non-
Western prisoner sample, and to explore the factorial model that best fits data from this
population. Secondly, we wished to investigate any potential differences in criminal
thinking between this Egyptian prison sample and American (Walters, 1995), English
(Palmer & Hollin, 2003), and Dutch (Bulten et al., 2009) samples. Finally, we sought to
examine whether criminal thinking styles vary as a function of type of crime, by
comparing prisoners who had been sentenced for theft, drug dealing or murder.
Method
Participants
This study was approved by an Egyptian University and the prison branch of the
Interior Ministry of Egypt. A total of 750 detainees are typically housed in a Public
Prison in Egypt for the execution of judicial rulings of imprisonment or for awaiting trial.
Although it is difficult to obtain a precise figure, this prison population includes hundreds
of illiterates. We only invited prisoners who had already been sentenced and had at least
an intermediate level of education to participate in this study, by advertising with posters
in the prison. According to the prison’s rules, no fees or other reward could be given for

11
participation, and this information was included on the advert. One hundred and ninety-
five prisoners approached us to participate. Of these, 37 had been sentenced for between
3 and 6 months for signing cheques exceeding their bank balances. These prisoners had
no history of crime and considering that such offences were unlikley to result in prison
sentences in the western world, we decided to exclude these individuals from this study.
In addition, we excluded 16 prisoners who failed to complete all test items on the PICTS.
Of the remaining prisoners, the majority could be classified into three categories, namely
offences related to theft, drug dealing, and murder, whereas 12 prisoners were sentenced
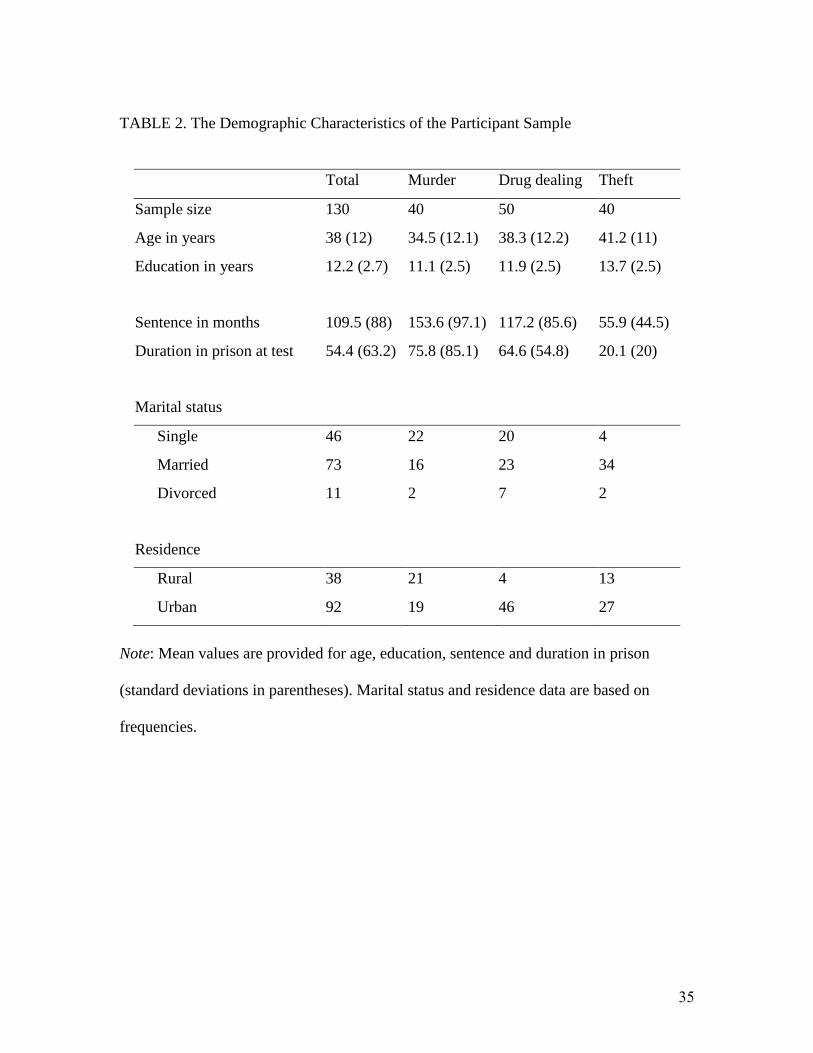
for a wide variety of offences and were therefore also excluded from this study. Table 2
provides demographics for the thieves, drug dealers and murderers. All of these prisoners
had good reading ability (as reflected from the years in education provided in Table 2).
It is important to note that there is no regular screening for mental disorders in
Egyptian prisons. Persons who are suspected to suffer from mental illness during criminal
proceedings are refered to a state hospital for assessment. Perpetrators who are diagnosed
with mental disorders at this stage (except neurotic disorders) are not send to prison but
instead serve out their criminal sentences in a secure mental health institution. In
addition, prison inmates are referred for mental health assessments if they are deemed to
show abnormal behaviour by prison staff. None of the participants in this study had been
diagnosed with mental disorders according to these methods.
--------------- TABLE 2 HERE PLEASE ---------------
Measures

12
The PICTS
The PICTS is an 80-item self-report measure, which consists of two validity
scales, the Confusion-revised scale (Cf-R) and the Defensiveness-revised (Df-R) scale,
and eight thinking-style scales (see Table 1). Each of the thinking-style scales consists of
eight individual items; and responses to each item are made on a four-point Likert scale
(strongly agree, agree, uncertain, and disagree).
For this study, version 4.0 of the PICTS (Walters, 2001) was adapted from
English into Arabic. Two independent translations were obtained, from the first author of
this study and from a professional translator who had no prior experience with the test.
These two Arabic versions were then compared with each other and with the original
PICTS to check for the accuracy of translation to compile a final version of the
questionnaire. This forward translation method by two independent translators (the
committee method; van de Vijver & Leung, 1997) with subsequent judgemental review
was deemed superior to the popular back-translation method for the following reasons.
The back translation method ‘puts a premium on literal translation’ (van de Vijver &
Leung, 1997; p. 39), whereby word-for-word translations rather than translations that
capture the essence and the meaning of the behaviour in question are preferred. Capturing
the essence of concepts described by each questionnaire item becomes even more crucial
when translations into languages from very different linguistic families are conducted.
Linked to the literal translation problem is the fact that the back-translation method tends
to miss serious problems in the translated version because the back-translator
compensates for any errors by ‘recovering’ the original phrase into the source language
(Grisay, 2003; Hambleton, 2005; van de Vijver & Leung, 1997).

13
Procedure
The PICTS was administered in small groups, which did not exceed five
prisoners, in the prison’s library. Two social-service specialists assisted in recruiting
prisoners to the testing room. The prisoners were then asked to read a consent form and to
sign it if they were willing to participate in the study. This consent form included a
summary of the nature and purpose of the study, and confidentiality was also assured.
Specifically, participants were informed that they were not required to write their name or
any other identifying information on the study materials, that they had the right to
withdraw from the study at any time, that their data was collected exclusively for research
purposes, and that only the researchers would have access to their data. The PICTS was
then administered according to the original instructions (“The following items, if
answered honestly, are designed to help you better understand your thinking and
behaviour. Please take the time to complete each of the eighty items on this inventory
using the four-point scale defined below”). In order to examine the test-retest stability of
the Arabic version of the PICTS, a sub-sample of 30 prisoners was asked to complete this
inventory twice, within a two-week interval.
Results
Descriptives
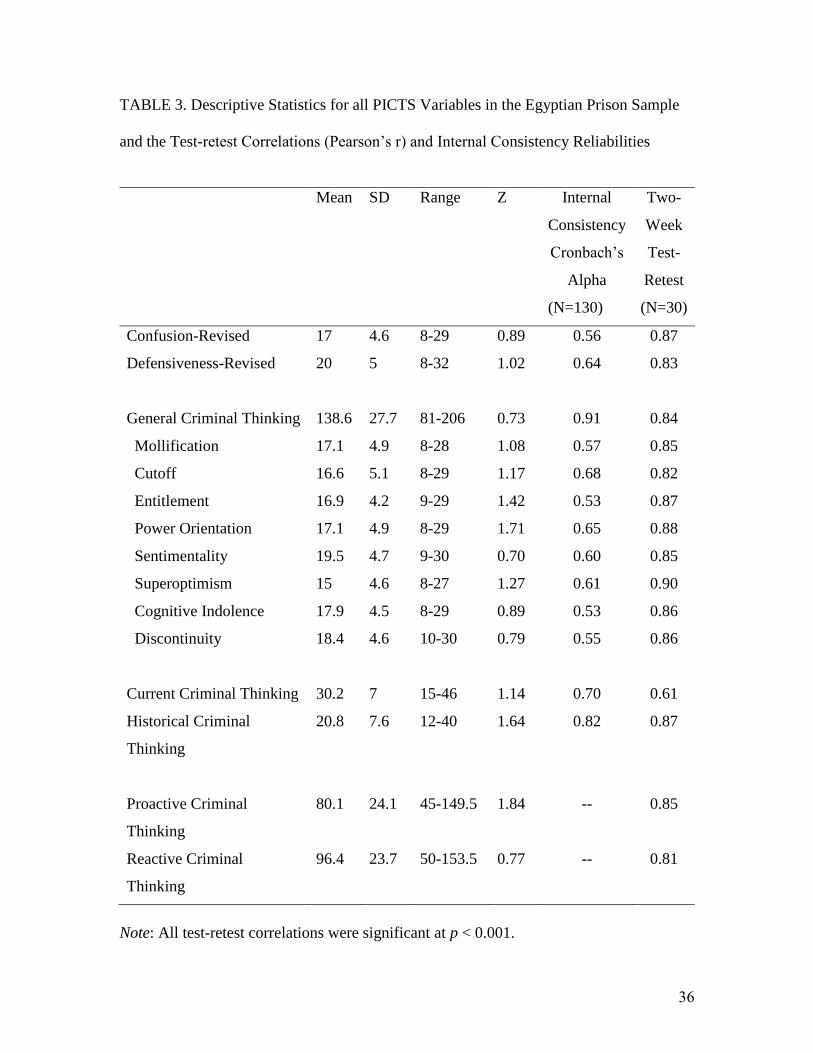
The summary statistics for all of the PICTS variables are shown in Table 3. The
standard deviations and the range in values indicate that prisoners varied considerably in
their responses. However, a series of one-sample Kolmogorov-Smirnov tests shows that

14
these individual differences fit normal-distribution curves (Z scores ranged from 0.70 to
1.80, all ps 0.05).
--------------- TABLE 3 HERE PLEASE ---------------
Psychometric characteristics of the PICTS
Reliability
The reliability of the Arabic PICTS was examined using Cronbach’s alpha and
test-retest correlations. We provide alpha coefficients for comparability with existing
reports on the PICTS1, although better estimates of reliability exist such as McDonald’s
Omega (McDonald, 1999). The results of these reliability analyses are summarized in
Table 3 and reveal a very high internal consistency level for general criminal thinking (
= 0.91), but moderate levels across the PICTS sub-scales, with alphas ranging from 0.53
to 0.68. Test-retest estimates for subscales were higher, with individual r values ranging
from 0.82 to 0.90 across all subscales.
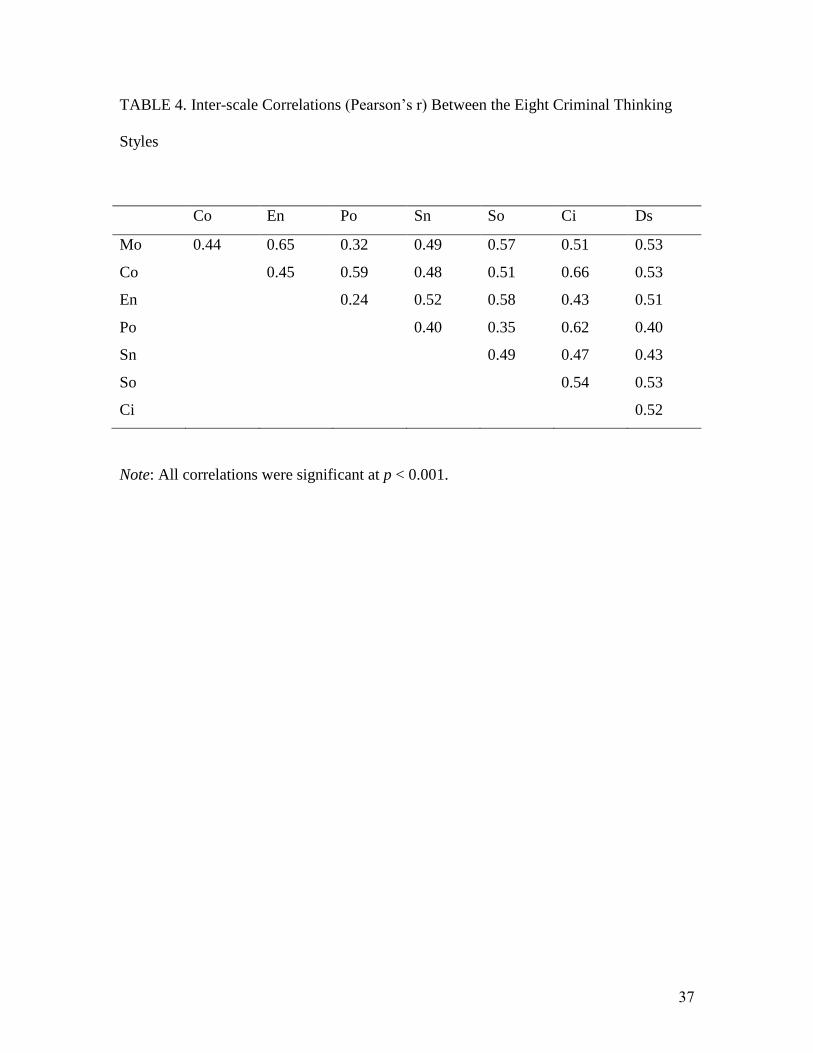
Inter-scale correlations
Table 4 shows the inter-scale correlations between all of the eight criminal
thinking styles. All of these styles correlated positively and significantly with each other
(all ps 0.01). The correlations were moderate (ranging from 0.24 to 0.66, with the
median correlation of 0.51).
1 Alpha underestimates test reliability unless very stringent conditions are met, namely, the test
items have to conform to a single-factor model with equal factor loadings (tau-equivalent items).

15
--------------- TABLE 4 HERE PLEASE ---------------
Factor analysis
To assess the homogeneity (unidimensionality) of adapted scales, we fitted
single-factor models to categorical item responses making up each of the 8 scales, one at
a time. Testing was performed on polychoric correlations in Mplus version 7 (Muthen &
Muthen, 2012), using a diagonally weighted least squares estimator. Fit of the factor
model for each scale is reported in Table 5. It can be seen that Arabic versions of scales
mollification, power orientation, cognitive indolence and discontinuity were confirmed
unidimensional; sentimentality closely approached unidimensionality; and entitlement
and superoptimism showed relatively minor problems. Only scale cutoff departed from
unidimensionality, and further analysis indicated that the problem was down to two
items, item 20 and item 40 having substantially correlated residuals.
--------------- TABLE 5 HERE PLEASE ---------------
The sample size in this study (N=130) was too small to perform factor analysis on
the item-level data due to a very high number of estimable parameters compared to the
number of subjects in the sample. Since the individual scales have been shown to largely
conform to single-factor models, we chose to work with the summated scores for each of
the eight subscales instead. To examine the factorial structure of the eight criminal
thinking styles, we tested a series of factor models assuming continuous variables and
using the maximum likelihood estimator. We began by testing a hierarchical model of

16
criminal thinking, which was recently suggested based on an American sample (Walters
et al., 2011). According to this model, ‘general criminal thinking’ is a factor at the top of
a hierarchy, indicated by a ‘proactive’ factor (comprising mollification, entitlement,
power orientation, and superoptimism items), a ‘reactive’ factor (comprising cutoff,
cognitive indolence, and discontinuity items), and sentimentality, which was modeled as
another indicator of the general factor. This hierarchical model was not supported by our
data (χ2
= 62.6, df = 18, p < 0.0001, RMSEA = 0.138, CFI = 0.906). The main source of
misfit was the lack of connection between power orientation and the ‘reactive’ factor, as
indicated by modification indices obtained for the model (χ2
change = 32.02).
In order to find a more suitable structure, we first established the number of
factors underlying our data. Parallel analysis (e.g., Hoyle & Duvall, 2004) suggested
presence of two factors. An oblique rotation of two factors yielded a nearly independent
clusters structure. The first factor was indicated by mollification, entitlement,
sentimentality, superoptimism and discontinuity; the second factor was indicated by
cutoff, power orientation, and cognitive indolence.
Constraining the above model to conform strictly to the independent clusters
structure described above (i.e., allowing no cross-loadings), we confirmed that the model
with two correlated factors indicated by mollification, entitlement, sentimentality,
superoptimism and discontinuity; and cutoff, power orientation, and cognitive indolence,
respectively, fitted the data well (χ2
= 26.9, df = 19, p = 0.106; RMSEA = 0.057, CFI =
0.98). Table 5 provides the standardized factor loadings for this model. The two factors
correlated strongly at 0.77 (this is the estimated correlation between the latent factors, not
attenuated by unreliability).
17
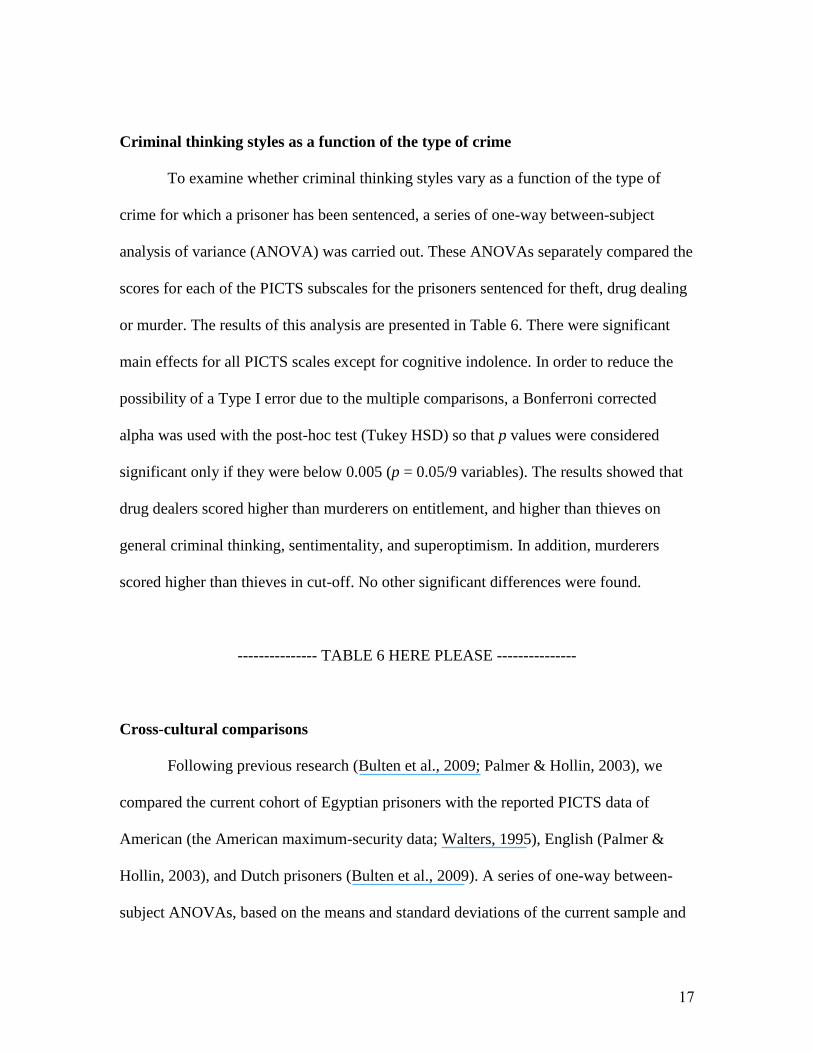
Criminal thinking styles as a function of the type of crime
To examine whether criminal thinking styles vary as a function of the type of
crime for which a prisoner has been sentenced, a series of one-way between-subject
analysis of variance (ANOVA) was carried out. These ANOVAs separately compared the
scores for each of the PICTS subscales for the prisoners sentenced for theft, drug dealing
or murder. The results of this analysis are presented in Table 6. There were significant
main effects for all PICTS scales except for cognitive indolence. In order to reduce the
possibility of a Type I error due to the multiple comparisons, a Bonferroni corrected
alpha was used with the post-hoc test (Tukey HSD) so that p values were considered
significant only if they were below 0.005 (p = 0.05/9 variables). The results showed that
drug dealers scored higher than murderers on entitlement, and higher than thieves on
general criminal thinking, sentimentality, and superoptimism. In addition, murderers
scored higher than thieves in cut-off. No other significant differences were found.
--------------- TABLE 6 HERE PLEASE ---------------
Cross-cultural comparisons
Following previous research (Bulten et al., 2009; Palmer & Hollin, 2003), we
compared the current cohort of Egyptian prisoners with the reported PICTS data of
American (the American maximum-security data; Walters, 1995), English (Palmer &
Hollin, 2003), and Dutch prisoners (Bulten et al., 2009). A series of one-way between-
subject ANOVAs, based on the means and standard deviations of the current sample and

18
the corresponding values reported in previous work, showed cross-cultural differences
between these four national groups in all criminal thinking styles, except for
superoptimism (see Table 6). Tukey HSD tests (Bonferroni corrected) revealed that
Egyptian prisoners scored higher on mollification, entitlement, power orientation,
sentimentality, and discontinuity in comparison to American, English, and Dutch
prisoners. Moreover, the Egyptian prisoners also scored higher on cognitive indolence
and cut-off than the Dutch prisoners. In addition, the English prisoners scored higher than
the Dutch prisoners in cognitive indolence. Finally, the American prisoners showed
higher levels of entitlement than the Dutch prisoners. No other cross-cultural differences
were found. For full details of this analysis, see Table 7.
--------------- TABLE 7 HERE PLEASE ---------------
Discussion
This study applied an Arabic version of the PICTS to a sample of Egyptian
prisoners. We sought to explore the psychometric characteristics of this version of the
PICTS and the construct of criminal thinking that it can provide for an Arabic sample. In
addition, we also examined whether criminal thinking styles vary across three different
offences (theft, drug dealing, and murder), and across different cultures by comparing the
data from Egyptian prisoners with previously published data from the USA (Walters,
1995), the UK (Palmer & Hollin, 2003), and the Netherlands (Bulten et al., 2009).
In this translated version of the PICTS, the internal reliability levels (measured by
alpha) across all of the criminal thinking styles were moderate and similar to the levels
19
reported in the original validation study (Walters, 1995) and other cross-national
investigations (Bulten et al., 2009; Healy & O’Donnell, 2006; Palmer & Hollin, 2003).
However, general criminal thinking was measured with a very high level of reliability. In
addition, the current and historical criminal thinking scales also showed high levels of
internal consistency that converge with previous studies (Walters, 2006b, 2007a). The
two revised validity scales (Cf-R and Df-R) also showed higher rates of internal
consistency than the original measures (Palmer & Hollin, 2003; Walters, 1995), which
supports this particular revision (version 4.0) of the PICTS (see Walters, 2001). In
addition, the two-week test-retest stability was very high for all PICTS scales.
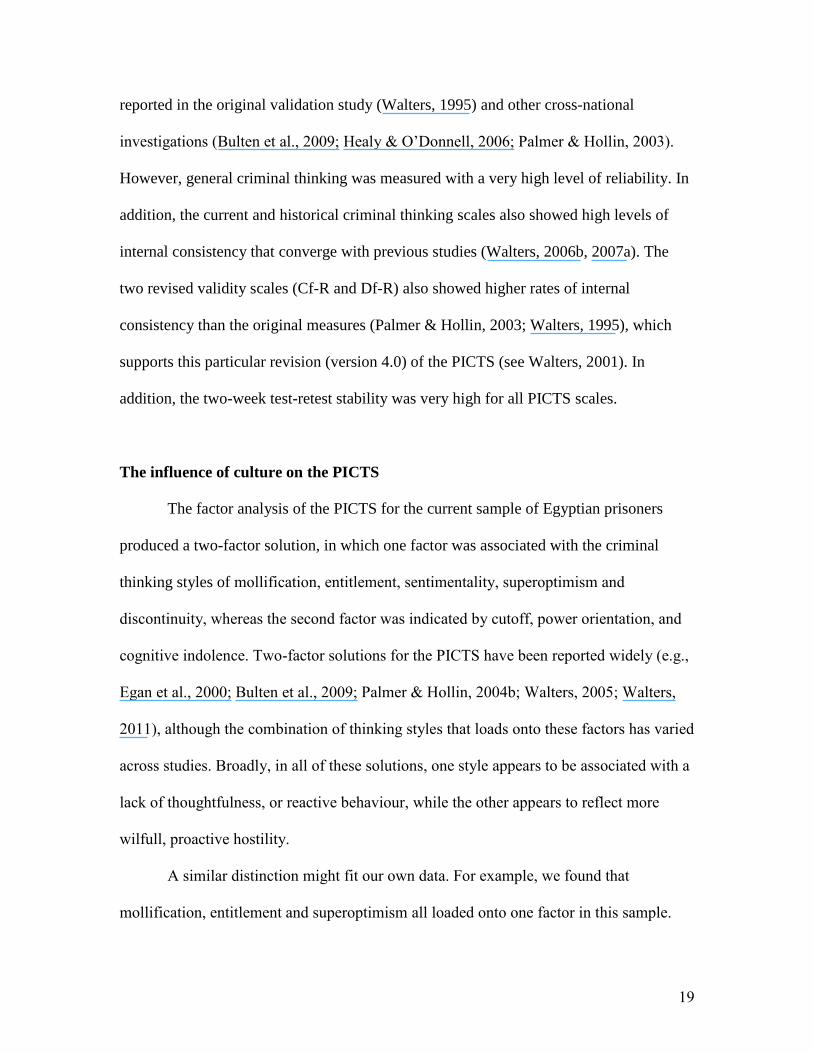
The influence of culture on the PICTS
The factor analysis of the PICTS for the current sample of Egyptian prisoners
produced a two-factor solution, in which one factor was associated with the criminal
thinking styles of mollification, entitlement, sentimentality, superoptimism and
discontinuity, whereas the second factor was indicated by cutoff, power orientation, and
cognitive indolence. Two-factor solutions for the PICTS have been reported widely (e.g.,
Egan et al., 2000; Bulten et al., 2009; Palmer & Hollin, 2004b; Walters, 2005; Walters,
2011), although the combination of thinking styles that loads onto these factors has varied
across studies. Broadly, in all of these solutions, one style appears to be associated with a
lack of thoughtfulness, or reactive behaviour, while the other appears to reflect more
wilfull, proactive hostility.
A similar distinction might fit our own data. For example, we found that
mollification, entitlement and superoptimism all loaded onto one factor in this sample.

20
These thinking styles reflect a justification of criminal behaviour by external factors, an
attitude of deservedness or ownership, and an overestimation of the negative
consequences that might arise from criminal behaviour, and therefore reflect different
facets of a proactive criminal thinking style (see, e.g., Walters et al., 2011). We also
found that cut-off and cognitive indolence loaded onto a second factor. These thinking
styles reflect more impulsive behaviours, such as the rapid elimination of emotions
through criminal behaviour, short-cut problem solving, and the uncritical acceptance of
ideas, and are indicative of a more reactive thinking style. These findings therefore seem
to fit to a considerable extent with a two-factor solution along proactive and reactive
dimensions of criminal thinking. Overall, however, the exact combination of thinking
styles that loaded onto these factors in the current sample also differed from previous
studies (c.f., Egan et al., 2000; Bulten et al., 2009; Palmer & Hollin, 2004b; Walters,
2005). Ultimately, our findings therefore add to a body of data, which suggests that
slightly different factor structures might fit the PICTS depending on the specific context
for which criminal thinking styles are measured.
One contextual factor that may contribute to this variety of outcomes appears to
be related to the nationality of prisoners, as different factor structures are required to best
model the data of American (Egans et al., 2000; Walters, 1995, 2005), Dutch (Bulten et
al., 2009), English (Palmer & Hollin, 2003) and Egyptian (the present study) adult
prisoners. This suggests that culture might be one of the key influences that affect the
factorial structure of the PICTS. Further support for this suggestion comes from the
cross-cultural comparisons that were made among American, English, Dutch, and
Egyptian prisoners in this study, which revealed differences between nationalities in all
21
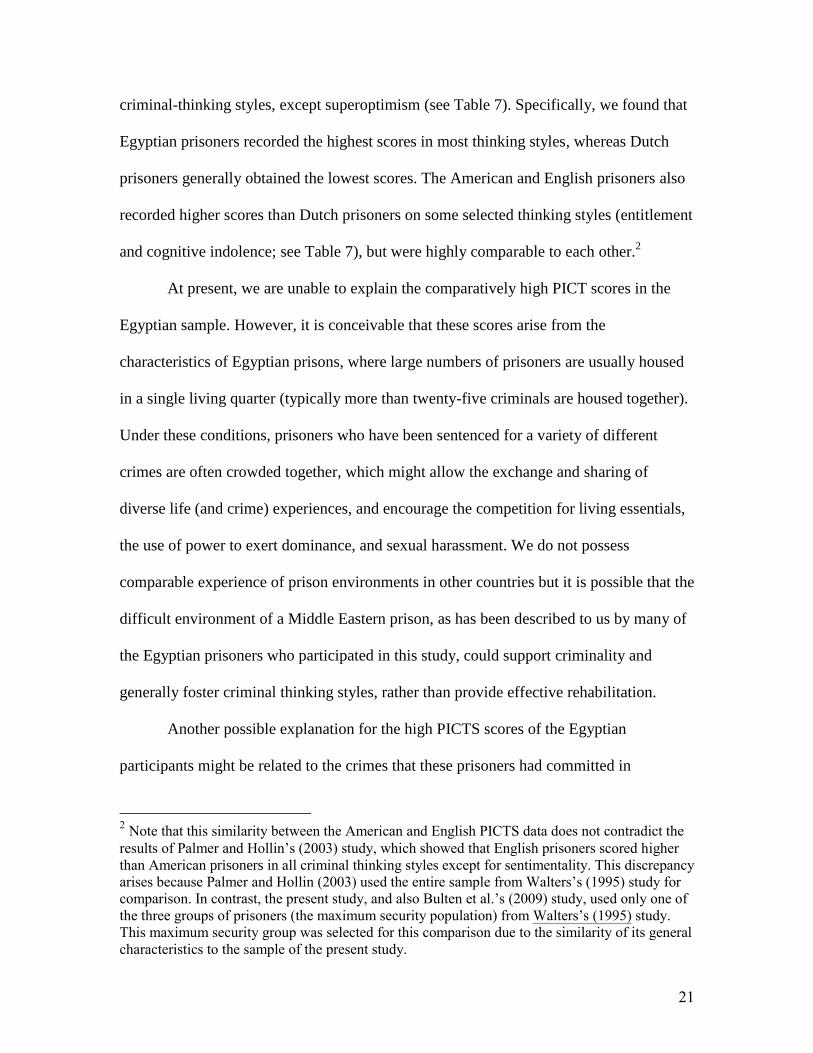
criminal-thinking styles, except superoptimism (see Table 7). Specifically, we found that
Egyptian prisoners recorded the highest scores in most thinking styles, whereas Dutch
prisoners generally obtained the lowest scores. The American and English prisoners also
recorded higher scores than Dutch prisoners on some selected thinking styles (entitlement
and cognitive indolence; see Table 7), but were highly comparable to each other.2
At present, we are unable to explain the comparatively high PICT scores in the
Egyptian sample. However, it is conceivable that these scores arise from the
characteristics of Egyptian prisons, where large numbers of prisoners are usually housed
in a single living quarter (typically more than twenty-five criminals are housed together).
Under these conditions, prisoners who have been sentenced for a variety of different
crimes are often crowded together, which might allow the exchange and sharing of
diverse life (and crime) experiences, and encourage the competition for living essentials,
the use of power to exert dominance, and sexual harassment. We do not possess
comparable experience of prison environments in other countries but it is possible that the
difficult environment of a Middle Eastern prison, as has been described to us by many of
the Egyptian prisoners who participated in this study, could support criminality and
generally foster criminal thinking styles, rather than provide effective rehabilitation.
Another possible explanation for the high PICTS scores of the Egyptian
participants might be related to the crimes that these prisoners had committed in
2 Note that this similarity between the American and English PICTS data does not contradict the
results of Palmer and Hollin’s (2003) study, which showed that English prisoners scored higher
than American prisoners in all criminal thinking styles except for sentimentality. This discrepancy
arises because Palmer and Hollin (2003) used the entire sample from Walters’s (1995) study for
comparison. In contrast, the present study, and also Bulten et al.’s (2009) study, used only one of
the three groups of prisoners (the maximum security population) from Walters’s (1995) study.
This maximum security group was selected for this comparison due to the similarity of its general
characteristics to the sample of the present study.

22
comparison to studies conducted in other countries (for similar suggestions, see Palmer &
Hollin, 2003). For instance, almost 31% of participants in the Egyptian sample had been
imprisoned for theft and an equivalent proportion had been sentenced for murder, while
39% were convicted for drug dealing. By comparison, 44% of the American sample had
been convicted for robbery and 61% of the Dutch sample had been convicted for violent
offences, while a wide variety of offences was represented within the English sample,
with the most common convictions for violent offences (28%) and burglary, theft and the
handling of stolen goods (23%). Interestingly, the comparison between thieves, drug
dealers, and murderers in the present study showed that drug dealers provided the highest
scores on most criminal thinking styles whereas the thieves had the lowest. This variation
of criminal thinking styles as a function of type of crime could explain why the total
Egyptian sample (which contained a large proportion of drug offences) recorded higher
PICTS scores than the American sample (which contained mostly theft crimes) and the
English and Dutch samples (which included none or only very few drug offences).
However, these are obviously speculative explanations for the cross-cultural differences
in criminal thinking styles and further research is clearly needed to put these to test.
At this stage, we would recommend caution in interpreting these cross-cultural
differences for another reason. In these comparisons, and particularly those in which
measurement tools require translation into languages of different origins (e.g., from
English to Arabic), it is inherently difficult to establish measurement equivalence (see,
e.g., van de Vijver & Leung, 1997; van de Vijver & Poortinga, 2005). This applies not
only to the questionnaire items but also to the rating scales. For example, the response
categories on the Arabic PICTS may have slightly different strengths compared to the

23
English version, which could shift the response scale and render cross-cultural
comparisons of quantitative differences (e.g., mean values, as in Table 7) quite
meaningless. We are aiming to address these issues as more data from Egyptian prisoners
becomes available, as this is clearly an important topic for further work. Despite these
caveats, the current data is of considerable significance because it provides a so far
unique insight into cross-cultural differences in criminal thinkling styles between
Western and non-Western prison populations.
Type of crime and the PICTS
To our knowledge, the relationship between criminal thinking styles and type of
crime has so far not been investigated systematically. The data from the Egyptian
prisoners therefore also provides several novel insights into this matter. For example,
these data suggest that cognitive indolence, that is, a tendency for short-cut problem
solving and the uncritical acceptance of ideas, is the only factor that does not vary across
the three crime categories considered here. By contrast, cut-off, which represents the
elimination of negative emotions through criminal behaviour, differed markedly across
all three crime categories and increased in magnitude with crime severity (i.e., lowest for
theft, higher for drug dealing, and highest for murder). This finding appears to converge
with other studies that have also reported high levels of cut-off in crimes of murder (see,
e.g., Guttmacher, 1960; Hickey, 2006; Stone, 1998).
In addition, several other thinking styles also appear to differ according to type of
crime. For example, high levels of entitlement, superoptimism, and discontinuity appear
to be characteristics of drug dealing, as these thinking styles are enhanced in these

24
individuals in comparison to thieves and murderers. This suggest that the criminal
tendency to deal drugs might be supported by a misplaced sense of deservingness, a
difficulty of following through on good intentions, and the belief that this type of crime is
unlikely to be punished. By contrast, power orientation, which refers to the aggressive
control of people and situations, is elevated in murderers compared to thieves, and may
support the life-destroying nature of these specific criminal offences.
This variation in criminal thinking styles as a function of type of crime was also
evident from the general criminal thinking (GCT) scale, which was added to the original
PICTS during later development phases (see, e.g., Walters, 2009a). The GCT possesses
some important qualities, as it appears to be one of the most effective predictors of
institutional adjustment and recidivism (e.g., Walters, 2007a, 2007b; Walters & Mandell,
2007). In the current study, murderers and drug dealers recorded comparable scores on
this scale, and both of these groups recorded higher scores than thieves. These differences
might perhaps arise because the thieves were simply more “minor” criminals, who
generally committed fewer or less severe offences. This suggestion receives some support
from the prison sentences for these two groups of criminals, which were much shorter in
duration for the thieves (see Table 2).
Limitations of the study
This study is not without limitations. Compared to research with prisoners from
the USA, UK, and the Netherlands, our sample size is relatively small (see, e.g., Bulten et
al., 2009; Palmer & Hollin, 2003; Walters, 1995) and decreases further still when the data
is broken down by type of crime. Our participant pool of Egyptian prisoners represents

25
one of the first non-Western samples in the study of criminal thinking (see also Megreya,
2013), and this small sample size partly reflects the lack of an established infrastructure
for conducting such research in judicial settings in Egypt. Data collection was disrupted
further by the ‘Arab spring’ and it remains currently impossible to add to this participant
sample. In addition, our findings are also restricted to adult male prisoners and the three
types of crime under investigation here. These methodological concerns clearly limit the
generalizability of this study, so it remains to be seen if similar patterns can be replicated
in other populations. A further caveat exists for our analysis by type of crime, which
focused only on offences for which the participants were currently imprisoned. We were
unable to establish the full criminal background of these prisoners, but it seems likely that
at least some may have committed a variety of crimes. Accordingly, the type of crime
data should be viewed with some caution.
Finally, while we have been able to use the Arabic PICTS to measure criminal
thinking in an Egyptian prison sample, an important outstanding question is whether this
version of the PICTS also has clinical utility, by predicting recidivism in samples from
the Middle East. Investigations of prisoners in the USA suggest that the PICTS is capable
of predicting reconviction (e.g., Walters, 2007b, 2009c, 2011, 2012). However, the extent
to which these findings generalize to other prison samples, outside the USA, awaits
further clarification (see, e.g., Palmer & Hollin, 2004a; Walters, 2012).
Despite these limitations, we believe that this research contributes some novel
perspectives on a topic that has so far been studied only within populations of Western
prisoners. Human cognition and behaviour is subject to substantial cross-cultural
differences (see, e.g., Henrich et al., 2010), and it is not at all clear whether existing

26
research on criminal thinking styles, with its focus on Western prison populations, is
more widely generalizable. Our study provides a valuable starting point here.
Conclusions
This study provides evidence that the PICTS is a suitable test for measuring
criminal thinking in Egyptian adult male prisoners, which indicates that this assessment
might be universally useful for assessing criminal thinking. In turn, this study also
provides the first data on criminal thinking styles for a non-Western prison sample and
shows that criminal thinking styles may vary across cultures. In addition, our findings
also indicate that criminal thinking styles may vary in people committed for different
types of crime, and suggest that this could explain some cross-cultural differences in the
data. This novel, and so far unique, non-Western prison sample in the criminal thinking
literature therefore raises many important questions for further research.

27
References
Borsboom, D. (2006). The attack of the psychometricians. Psychometrika, 71, 425-440.
doi: 10.1007/s11336-006-1447-6
Bulten, E., Nijman, H., & van der Staak, C. (2009). Measuring criminal thinking styles:
The construct validity and utility of the PICTS in a Dutch prison sample. Legal &
Criminological Psychology, 14, 35-49. doi: 10.1348/135532507X255368
Cornell, D. G., Warren, J., Hawk, G., Stafford, E., Oram, G., & Pine, D. (1996).
Psychopathy in instrumental and reactive offenders. Journal of Consulting and
Criminal Psychology, 64, 783-790. doi: 10.1037//0022-006X.64.4.783
Egan, V., McMurran, M., Richardson, C., & Blair, M. (2000). Criminal cognitions and
personality: What does the PICTS really measure? Criminal Behaviour & Mental
Health, 10, 170-184. doi: 10.1002/cbm.355
Eysenck, H. J. (1996). Personality and crime: Where do we stand? Psychology, Crime &
Law, 2, 143-152. doi:10.1080/10683169608409773
Gendreau, P., Grant, B. A., Leipciger, M., & Collins, C. (1979). Norms and recidivism
rates for the MMPI and selected experimental scales on a Canadian delinquent
sample. Canadian Journal of Behavioral Science, 11, 21-31. doi:
10.1037/h0081569
Gendreau, P., Little, T., & Goggin, C. (1996). A meta-analysis of the predictors of adult
offender recidivism: What works! Criminology, 34, 575-607. doi: 10.1111/j.1745-
9125.1996.tb01220.x
Grisay, A. (2003). Translation procedures in OECD/PISA 2000 international assessment.
Language Testing, 20, 225–240. doi: 10.1191/0265532203lt254oa

28
Guttmacher, M. S. (1960). The Mind of the Murderer. New York: Farrar, Straus &
Cudahy.
Hambleton, R. K. (2005). Issues, Designs and Technical Guidelines for Adapting Tests
Into Multiple Languages and Cultures. In R. K. Hambleton, P. F. Merenda and C.
D. Spielberger (Eds.). Adapting Psychological and Educational Tests for Cross-
Cultural Assessment. NJ: Lawrence Erlbaum.
Healy, D., & O’Donnell, I. (2006). Criminal Thinking on Probation: A Perspective From
Ireland. Criminal Justice & Behavior, 33, 782-802. doi:
10.1177/0093854806288066
Henrich, J., Heine, S. J., & Norenzayan, A. (2010). The weirdest people in the world?
Behavioral and Brain Sciences, 33, 61-83. doi: 10.1017/S0140525X0999152X
Hickey, E. W. (2006). Serial murderers and their victims (4th ed.). Belmont CA.
Wadsworth Press
Hoyle, R. H., & Duvall, J. L. (2004). Determining the number of factors in exploratory
and confirmatory factor analysis. In D. Kaplan (Ed.): The Sage handbook of
quantitative methodology for the social sciences. Thousand Oaks, CA: Sage.
Knight, K., Garner, B. R., Simpson, D. D., Morey, J. T., & Flynn, P. M. (2006). An
assessment of criminal thinking. Crime & Delinquency, 52, 159-177. doi:
10.1177/0011128705281749
Megreya, A. M. (2013). Criminal thinkling styles and emotional intelligence in Egyptian
offenders. Criminal Behaviour and Mental Health, 23, 56-71. doi:
10.1002/cbm.1854

29
Mills, J. F., Kroner, D. G., & Forth, A. E. (2002). Measures of Criminal Attitudes and
Associates (MCAA): Development, factor structure, reliability and validity.
Assessment, 9, 240-253. doi: 10.1177/1073191102093003
McDonald, R. P. (1999). Test theory. A unified approach. Mahwah, NJ: Lawrence
Erlbaum.
Palmer, E. J. (2007). Criminal thinking. In D. Carson, B. Milne, F. Pakes, K. Shalev, &
A. Shawyer (Eds.), Applying psychology to criminal justice (pp. 147-165).
Chichester: John Wiley & Sons.
Palmer, E. J., & Hollin, C. R. (2003). Using the psychological inventory of criminal
thinking styles with English prisoners. Legal & Criminological Psychology, 8, 175-
187. doi: 10.1348/135532503322362951
Palmer, E. J., & Hollin, C. R. (2004a). Predicting reconviction using the Psychological
Inventory of Criminal Thinking Styles with English prisoners. Legal &
Criminological Psychology, 9, 57-68. doi: 10.1348/135532504322776852
Palmer, E. J., & Hollin, C. R. (2004b). The use of the psychological inventory of criminal
thinking styles with English young offenders. Legal & Criminological Psychology,
9, 253-263. doi: 10.1348/1355325041719374
Polaschek, D. L. L., Collie, R. M., & Walkey, F. H. (2004). Criminal attitudes to
violence: Development and preliminary validation of a scale for male prisoners.
Aggressive Behavior, 30, 484-503. doi: 10.1002/ab.20081
Simourd, D. J. (1997). The Criminal Sentiments Scale–Modified and Pride in
Delinquency Scale: Psychometric properties and construct validity of two measures

30
of criminal attitudes. Criminal Justice & Behavior, 24, 52-70. doi:
10.1177/0093854897024001004
Simourd, D. J., & van de Ven, J. (1999). Assessment of criminal attitudes: criterion-
related validity of the Criminal Sentiments Scale-Modified and Pride in
Delinquency Scale. Criminal Justice & Behavior, 26, 90-106. doi:
10.1177/0093854899026001005
Stone, M. H. (1998). The personalities of murderers: the importance of psychopathy and
sadism. In: Skodol, A. E. (Ed.). Psychopathology & Violent Crime, (pp. 29–52).
Washington, DC: American Psychiatric Press.
van de Vijver, F. J. R., & Leung, K. (1997). Methods and data analysis of comparative
research. In J. W. Berry, Y. H. Poortinga, & J. Pandey (Eds.), Handbook of cross-
cultural psychology, 2nd ed. (pp. 257-300). Boston: Allyn & Bacon.
van de Vijver, F. J. R., & Poortinga, Y. H. (2005). Conceptual and methodlogical issues
in adapting tests. In R. K. Hambleton, P. F. Merenda, and C. D. Spielberger (Eds.).
Adapting Psychological and Educational Tests for Cross-Cultural Assessment. NJ:
Lawrence Erlbaum.
Walters, G. D. (1990). The criminal lifestyle: Patterns of serious criminal conduct.
Newbury Park, CA: Sage.
Walters, G. D. (1995). The Psychological Inventory of Criminal Thinking Styles, Part I:
Reliability and preliminary validity. Criminal Justice & Behavior, 22, 437-455. doi:
10.1177/0093854895022003008
Walters, G. D. (1997). Predicting short-term release outcome using the LCSF and PICTS.
Journal of Mental Health in Corrections Consortium, 43, 18-25.

31
Walters, G. D. (2001). Revised validity scales for the Psychological Inventory of
Criminal Thinking Styles (PICTS). Journal of Offender Rehabilitation, 32, 1-13.
doi: 10.1300/J076v32n04_01
Walters, G. D. (2002a). Current and historical content scales for the Psychological
Inventory of Criminal Thinking Styles (PICTS). Legal & Criminological
Psychology, 7, 73-86. doi: 10.1348/135532502168397
Walters, G. D. (2002b). The psychological inventory of criminal thinking styles (PICTS).
A review and meta-analysis. Assessment, 9, 278-291. doi:
10.1177/1073191102009003007
Walters, G. D. (2003). Changes in criminal thinking and identity in novice and
experienced inmates: Prisonization revisited. Criminal Justice & Behavior, 30, 399-
421. doi: 10.1177/0093854803253137
Walters, G. D. (2005). How many factors are there on the PICTS? Criminal Behaviour &
Mental Health, 15, 273-283. doi: 10.1002/cbm.25
Walters, G. D. (2006a). Appraising, researching and conceptualizing criminal thinking: A
personal view. Criminal Behaviour & Mental Health, 16, 87-99. doi:
10.1002/cbm.50
Walters, G. D. (2006b). Proactive and reactive composite scales for the Psychological
Inventory of Criminal Thinking Styles (PICTS). Journal of Offender
Rehabilitation, 42, 23-36. doi: 10.1300/J076v42n04_02
Walters, G. D. (2007a). Measuring proactive and reactive criminal thinking with the
PICTS: Correlations with outcome expectancies and hostile attribution biases.
Journal of Interpersonal Violence, 22, 371-385. doi: 10.1177/0886260506296988

32
Walters, G. D. (2007b). Response style versus crime-specific cognition: Predicting
disciplinary adjustment and recidivism in male and female offenders with the
PICTS. Assessment, 14, 35-43. doi: 10.1177/1073191106292957
Walters, G. D. (2008). Self-report measures on psychophathy, antisocial personality, and
criminal lifestyle: Testing and validating a two-dimensional model. Criminal
Justice and Behavior, 35, 1459-1483. doi: 10.1177/0093854808320922
Walters, G. D. (2009a). Criminal thinking. In M. McMurran & R. Charles (Eds.).
Personality, personality disorder and violence (pp. 281-298). London: John Wiley
& Sons Ltd.
Walters, G. D. (2009b). Latent structure of a two-dimensional model of antisocial
personality disorder: Construct validation and taxonometric analysis. Journal of
Personality Disorders, 23, 647-660. doi: 10.1521/pedi.2009.23.6.647
Walters, G. D. (2009c). Effect of a longer versus shorter test-release interval on the
recidivism prediction with the Psychological Inventory of Criminal Thinking Styles
(PICTS). International Journal of Offender Therapy and Comparative
Criminology, 53, 665-678. doi: 10.1177/0306624x08321867
Walters, G. D. (2011). Predicting recidivism with the Psychological Inventory of
Criminal Thinking Styles and Level of Service Inventory-Revised: Screening
Version. Law and Human Behavior, 35, 211-220. doi: 10.1007/s10979-010-9231-7
Walters, G. D. (2012). Criminal thinking and recidivism: Meta-analytic evidence on the
predictive and incremental validity of the Psychological Inventory of Criminal
Thinking Styles (PICTS). Aggression and Violent Behavior, 17, 272-278. doi:
10.1016/j.avb.2012.02.010

33
Walters, G. D., & Elliott, W. N. (1999). Predicting release and disciplinary outcome with
the Psychological Inventory of Criminal Thinking Styles: Female data. Legal &
Criminological Psychology, 4, 15-21. doi: 10.1348/135532599167743
Walters, G. D., Hagman, B. T., & Cohn, A. M. (2011). Toward a hierarchical model of
criminal thinking: Evidence from item response theory and confirmatory factor
analysis. Psychological Assessment, 23, 925-936. doi: 10.1037/a0024017
Walters, G. D., & Mandell, W. (2007). Incremental Validity of the Psychological
Inventory of Criminal Thinking Styles and Psychopathy Checklist: Screening
Version in Predicting Disciplinary Outcome. Law & Human Behavior, 31, 141–
157. doi: 10.1007/s10979-006-9051-y
Walters, G. D., Trgovac, M., Rychlec, M., Di Fazio, R., & Olson, J. R. (2002). Assessing
psychotherapeutically assisted change with the Psychological Inventory of Criminal
Thinking Styles : A controlled analysis and multisite cross-validation. Criminal
Justice & Behavior, 29, 308-331. doi: 10.1177/0093854802029003004
Wilson, S., Attrill, G., & Nugent, F. (2003). Effective interventions for acquisitive
offenders: An investigation of cognitive skills programmes. Legal &
Criminological Psychology, 8, 83-101. doi: 10.1348/135532503762871264
34
TABLE 1. Brief Descriptions of the Eight Criminal Thinking Styles and Associated
PICTS Example Items (Based on Walters, 1995)
Mollification The justification of behaviour by external factors and the projection of
blame onto the victims. “I have told myself that I would never have
had to engage in crime if I had had a good job”.
Power orientation The aggressive control of people and situations. “When not in control
of a situation I feel weak and helpless and experience a desire to exert
power over others”.
Entitlement The misidentification of ‘wants’ as ‘needs’, with an attitude of
ownership and privilege. “The way I look at it, I've paid my dues and
am therefore justified in taking what I want”.
Cut-off The rapid elimination of negative emotions (such as fear and anxiety)
through criminal behaviour or drug use. “I have used alcohol or drugs
to eliminate fear or apprehension before committing a crime”.
Superoptimism The overestimation of the avoidance of negative consequences for a
criminal behaviour. “The more I got away with crime the more I
thought there was no way the police or authorities would ever catch
up with me”.
Cognitive indolence A pattern of lazy thinking, short-cut problem solving, and uncritical
acceptance of ideas or plans. “I tend to put off until tomorrow what
should have been done today”.
Sentimentality The attempt to atone for negative feelings following criminal
behaviour by performing various good deeds. “As I look back on it
now, I was a pretty good guy even though I was involved in crime”.
Discontinuity Reduced premeditated thought, increased susceptibility to disruption,
and a difficulty of following through on good initial intentions. “There
have been times when I have made plans to do something with my
family and then cancelled these plans so that I could hang out with my
friends, use drugs, or commit crimes”.
35
TABLE 2. The Demographic Characteristics of the Participant Sample
Total Murder Drug dealing Theft
Sample size 130 40 50 40
Age in years 38 (12) 34.5 (12.1) 38.3 (12.2) 41.2 (11)
Education in years 12.2 (2.7) 11.1 (2.5) 11.9 (2.5) 13.7 (2.5)
Sentence in months 109.5 (88) 153.6 (97.1) 117.2 (85.6) 55.9 (44.5)
Duration in prison at test 54.4 (63.2) 75.8 (85.1) 64.6 (54.8) 20.1 (20)
Marital status
Single 46 22 20 4
Married 73 16 23 34
Divorced 11 2 7 2
Residence
Rural 38 21 4 13
Urban 92 19 46 27
Note: Mean values are provided for age, education, sentence and duration in prison
(standard deviations in parentheses). Marital status and residence data are based on
frequencies.
36
TABLE 3. Descriptive Statistics for all PICTS Variables in the Egyptian Prison Sample
and the Test-retest Correlations (Pearson’s r) and Internal Consistency Reliabilities
Mean SD Range Z Internal
Consistency
Cronbach’s
Alpha
(N=130)
Two-
Week
Test-
Retest
(N=30)
Confusion-Revised 17 4.6 8-29 0.89 0.56 0.87
Defensiveness-Revised 20 5 8-32 1.02 0.64 0.83
General Criminal Thinking 138.6 27.7 81-206 0.73 0.91 0.84
Mollification 17.1 4.9 8-28 1.08 0.57 0.85
Cutoff 16.6 5.1 8-29 1.17 0.68 0.82
Entitlement 16.9 4.2 9-29 1.42 0.53 0.87
Power Orientation 17.1 4.9 8-29 1.71 0.65 0.88
Sentimentality 19.5 4.7 9-30 0.70 0.60 0.85
Superoptimism 15 4.6 8-27 1.27 0.61 0.90
Cognitive Indolence 17.9 4.5 8-29 0.89 0.53 0.86
Discontinuity 18.4 4.6 10-30 0.79 0.55 0.86
Current Criminal Thinking 30.2 7 15-46 1.14 0.70 0.61
Historical Criminal
Thinking
20.8 7.6 12-40 1.64 0.82 0.87
Proactive Criminal
Thinking
80.1 24.1 45-149.5 1.84 -- 0.85
Reactive Criminal
Thinking
96.4 23.7 50-153.5 0.77 -- 0.81
Note: All test-retest correlations were significant at p < 0.001.
37
TABLE 4. Inter-scale Correlations (Pearson’s r) Between the Eight Criminal Thinking
Styles
Co En Po Sn So Ci Ds
Mo 0.44 0.65 0.32 0.49 0.57 0.51 0.53
Co 0.45 0.59 0.48 0.51 0.66 0.53
En 0.24 0.52 0.58 0.43 0.51
Po 0.40 0.35 0.62 0.40
Sn 0.49 0.47 0.43
So 0.54 0.53
Ci 0.52
Note: All correlations were significant at p < 0.001.

38
TABLE 5. Goodness of Fit for the Single-factor Models for Each of the PICTS
Subscales, and Standardised Factor Loadings for the Two-factor Model of the Egyptian
PICTS Scores
Goodness of Fit
Standardised Factor
Loadings
Scale Chi-Square
(df=20) p-value RMSEA
Factor 1
(SE)
Factor 2
(SE)
Mo 27.3 0.126 0.053 .770 (.045) --
Co 74.9 <0.001 0.145 -- .803 (.045)
En 41.5 0.003 0.091 .757 (.046) --
Po 21.9 0.348 0.027 -- .706 (.053)
Sn 33.2 0.032 0.071 .665 (.056) --
So 44.2 0.001 0.096 .760 (.045) --
Ci 29.5 0.079 0.060 -- .848 (.040)
Ds 29.8 0.073 0.061 .703 (.052) --
Note: All loadings were significant at p < 0.001.

39
TABLE 6. One-way Between-subject ANOVAs and Pairwise Contrasts (Bonferroni-
corrected) for PICTS Measures Among Three Criminal Groups
Scales Descriptives F
(2, 127)
Tukey HSD pairwise
comparisons Murder Drug
dealing
Theft
GCT M 141.4 147.3 124.9 8.17*** D>T; M=D; M=T
SD 27.2 25.9 26.2
Mo M 16.5 18.5 15.8 3.63* M=D=T
SD 4.5 4.8 5
Co M 19.4 16.6 13.8 15.69*** M>T; M=D; D=T
SD 4.6 4.6 4.3
En M 15.4 18.8 15.9 8.81*** D>M; M=T; D=T
SD 3.7 4.3 3.8
Po M 19.2 16.8 15.6 6.39** M=D=T
SD 6.3 3.8 3.8
Sn M 20.3 20.9 17.1 9.12*** D>T; M=D; M=T
SD 4.1 4.7 4.4
So M 14.5 17 13.2 8.68*** D>T; M=D; M=T
SD 4.7 4.4 3.7
Ci M 18.6 18.4 16.6 2.92 ----
SD 5.1 3.9 4.2
Ds M 17.5 20.3 17 7.19** M=D=T
SD 3.9 4.4 4.6
Note: M = murderers; D = drug dealers; T = thieves. For the ANOVAs, * p < 0.05, ** p <
0.01, and *** p < 0.001. For planned contrasts, the > symbol indicates a significant
difference (using a Bonferroni correction, p values were considered significant only if
they were below p < 0.005), the = symbol indicates no significant difference.

40
TABLE 7. One-way Between-subject ANOVAs and Tukey HSD Post-hoc Tests
(Bonferroni-corrected) for the Comparison of PICTS Scores Across Prisoners from Egypt
(Current Sample), the Netherlands, the UK, and the USA
Note: EG = Egyptian prisoners; NL = Dutch prisoners; UK = British prisoners; US =
American prisoners. For the ANOVAs, * p < 0.05, ** p < 0.01, and *** p < 0.001. For
planned contrasts, the > symbol indicates a significant difference (using a Bonferroni
correction, p values were considered significant only if they were below p < 0.005), the =
symbol indicates no significant difference.
Scales
Descriptives F
(3, 711)
Tukey HSD pairwise
comparisons Egypt
(N=130)
NL
(N=180)
UK
(N=255)
US
(N=150)
Mo M 17.1 14 14.5 14 17.28*** EG>NL, UK&US;
NL=UK=US SD 4.9 3 4.5 4.3
Co M 16.6 13.6 15.2 15.2 9.08*** EG>NL; EG=UK&US;
NL=UK=US SD 5.1 4.6 5.4 5
En M 16.8 12.8 13.3 14.4 28.45*** EG>NL, UK&US;
US>NL; UK=NL&US SD 4.2 3.5 4.5 3.9
Po M 17.1 14.3 14 13.6 17.25*** EG>NL, UK&US;
NL=UK=US SD 4.9 3.8 4.8 4.6
Sn M 19.6 17.4 17.7 18 9.89*** EG>NL, UK&US;
NL=UK=US SD 4.7 3.7 3.4 3.5
So M 15 14.6 15.4 15.8 2.45 --------
SD 4.6 3.7 4.4 4.4
Ci M 17.9 15.2 17.4 16.7 10.96*** EG>NL; UK>NL;
EG=UK&US; NL=US;
UK=US
SD 4.5 4.5 4.8 4.7
Ds M 18.4 15.1 16.2 16.4 10.71*** EG>NL, UK&US;
NL=UK=US SD 4.6 4.9 5.5 5