
"Creative Universities?“ Organization and Innovation after 2008
17
PETER MURPHY JAMES COOK UNIVERSITY PAPER FOR ORGANISATION UND DAS NEUE CONFERENCE UNIVERSITY OF MARBURG 28 FEBRUARY -1 MARCH, 2013 „Creative Universities?“ Organization and Innovation after 2008
Transcript of "Creative Universities?“ Organization and Innovation after 2008

P E T E R M U R P H Y J A M E S C O O K U N I V E R S I T Y
P A P E R F O R O R G A N I S A T I O N U N D D A S N E U E
C O N F E R E N C E U N I V E R S I T Y O F M A R B U R G
2 8 F E B R U A R Y - 1 M A R C H , 2 0 1 3
„Creative Universities?“ Organization and Innovation after 2008

Peter Murphy
Professor of Creative Arts and Social Aesthetics
Head of the School of Creative Arts
James Cook University
Townsville
AUSTRALIA

1. The more we spend the less we achieve
From 1994–2008, GERD (gross domestic expenditure on R&D) as a percentage of GDP rose from 2.1% to 2.3% across the OECD, from 2.4% to 2.75% in the United States, and 2.6% to 3.4% in Japan. Yet globally, amongst the wealthy countries, productivity has been trending down since the 1970s. Australia is a typical example. In the 1960s, its annual average rate of growth of labour productivity was 3.1. After 1970, this falls sharply. In the 1970s the rate was 1.8. In the 1980s it was 1.1. This improved a bit in the 1990s, mainly in the second half of that decade, averaging 2.3. Then it fell away again to 1.7 in the 2000s.

2. Declining academic productivity
In 1993, Australian academics produced 1.5 publications per head.
In 1997, 0.6 publications per head.
Since 2004, 1.0 per head.
During the period Australia increased its real external funding of research.
Total university research income (in 2011 dollar terms) rose from $744 million in 1992 to $3,172 million in 2010. Yet the number of research publications per $100,000 income fell from 3.6 in 1992 to 1.5 in 2010.

3. The mass bureaucratic university
The ratio of administrative to academic staff in universities rose from 0.2:1 in the 1960s to 0.4:1 in the 1980s.
In Australia the ratio inflated rapidly in the late 1980s and early 1990s as a ‘unified national system’ of bureaucratic centralism and aggressive legal-rational proceduralism was instituted in the universities.
By 1996, the ratio of administrative to academic staff in Australia had reach 1.3:1 where it has remained ever since.

The economist Deidre McCloskey puts it this way: Two centuries ago the world’s economy stood at the present level of Bangladesh. In 1800 (in our dollar terms) the average human being lived on $3 a day; a person today in France or Japan today lives on $100 a day. In Norway, the average person earns forty-five times more than their predecessor did in 1800, a remarkable $145 a day. Chinese today have got to an average of $13 a day—four times the 1800 level and rising. Only 1.1 billion of the world’s 6.7 billion people still live on $3 a day.
Deirdre N. McCloskey, Bourgeois Dignity: Why Economics Can't Explain the Modern World, Kindle Edition, 1-2.
4. The social-scientific-industrial epoch

5. Declining growth in real GDP per capita
The data collated by Northwestern University economist Robert Gordon indicates that growth in real GDP per capita from 1300 to 1700 was 0.2 per cent per annum. Between the first Industrial Revolution and the beginning of the twentieth century, Britain increased that to just over 1% per annum. In the 1940s and 1950s, the United States achieved a remarkable 2.5% growth in real GDP per capita. After that heroic peak, the US growth begins to ratchet downwards. It does this in a series of steep step-like movements in 1964, 1972, 1987 and 2008 to 1.3% growth in real GDP per capita.
Robert J. Gordon, ‘Is U.S. Economic Growth Over? Faltering Innovation Confronts the Six Head-Winds.’ National Bureau of Economic Research (NBER) Working Paper Series, August 2012. http://www.nber.org/papers/w18315

6. Slowing growth in real income per capita
In the UK in the 1300s average real income was $1,150 per person in 2010 prices. By 1800 average income was $3450. It almost doubled a century later, reaching $6350 in 1906. In the United States in 28 years between 1929 and 1959, real income doubled again rising from $8,000 in 1929 to $16,000 in 1959. But then the pace starts to slow. US per capita income doubles again, this time in the thirty-one years to 1988. Then the pace slows once more.
George Mason University economist Tyler Cowen suggests that a key moment is the early 1970s. He points out that 1947 median family income (calculated in 2004 real dollar terms) was $21,771. By 1973 (that is 26 years later) it had more than doubled to $44,381. In the following thirty one years, from 1973 to 2004, median family income rose only to $54,061, which was less than a 22% increase. Cowen points out that with a growth rate of 2% a year, real income doubles in size about every thirty-five years. At a 3% rate of growth, living standards double about every twenty-three years or more. At today’s 1 plus per cent growth rate, things are not looking very good.
T. Cowen, The Great Stagnation, Penguin Group Kindle Edition, 2011, Kindle Locations 154-159.

7. Declining social creativity
Analyzing data from the TTCT-Figural test, Kim found declines across all the Torrance-defined elements of creativity including: Fluency, Originality, Elaboration, Abstractness of Titles, Resistance to Premature Closure and the 13 creative personality traits that comprise the Creative Strengths (Strengths) subscale of the test. Fluency scores decreased from 1966 to 1974, increased from 1974 to 1990, and decreased from 1990 to 2008. Originality scores increased from 1966 to 1974, decreased from 1990 to 1998, and remained static from 1998 to 2008. Elaboration scores increased from 1966 to 1974 and decreased from 1984 to 2008. Abstractness of titles scores increased until 1998 and decreased from 1998 to 2008. Resistance to premature closure scores decreased from 1984 to 1990, increased from 1990 to 1998, and decreased again from 1998 to 2008. Creative strength scores decreased from 1990 to 2008.
What the Torrance Test tests for (in its essentials) is:
Fluency: The total number of ideas generated in response to test stimuli.
Originality: The statistical rarity of test responses.
Elaboration: The amount of embellishment and development in test responses.
Abstractness: The ability to capture the abstract essence of test stimuli
Resistance to premature closure: Complete the test but in an unexpected way
Strengths: emotional expressiveness, story-telling articulateness, movement or actions, expressiveness of titles, syntheses of incomplete figures, synthesis of lines, synthesis of circles, unusual visualization, extending or breaking boundaries, humor, richness of imagery, colorfulness of imagery, and fantasy.

8. Output in cultural theory
Decade of Output Works per million capita (pmc)
1900s 0.072 Pmc
1910s 0.050 Pmc
1920s 0.132 Pmc
1930s 0.102 Pmc
1940s 0.120 Pmc
1950s 0.203 Pmc
1960s 0.269 Pmc
1970s 0.274 Pmc
1980s 0.236 Pmc
1990s 0.203 Pmc#
# adjusted upwards by 15% as data excludes 1999 and part of 1998

9. Top 500 music albums
Rolling Stone magazine’s 2012 music industry poll of the top 500 music
albums lists:
11 works from the 1950s,
105 from the 1960s,
187 from the 1970s,
82 from the 1980s,
75 from the 1990s,
38 from the 2000s,
2 from the truncated 2010s.
50% of the best 1970s albums came from the first four years of the decade 1970-1973, and immediately after that point there is sharp drop-off in first-class output.
The list was principally based on two industry surveys, one in 2003 of 271 industry experts and one in 2009 of 100 industry experts.
10. The innovative 1820s
A list of the 50 greatest British inventions was compiled by BBC science experts in a 2013 Radio Times poll.
Notably the decade of the 1820s accounted for a tenth of the poll-nominated ‘biggest breakthroughs’ in 350 years of British innovation.
The decade included Charles MacIntosh’s waterproof material, Michael Faraday’s electric motor, Joseph Aspdin’s cement, George Stephenson’s passenger railway, and Edward Beard Budding’s lawnmower.
Budding and Stephenson were both engineers, Aspdin was a bricklayer, Faraday was a self-taught scientist who ended up as Fullerian Professor of Chemistry at the Royal Institution of Great Britain, and MacIntosh was an amateur chemist.

11. Downhill run
The physicist Jonathan Huebner calculated that the peak of global technological innovation occurred in 1870.
My calculation is that the peak of US patent registration per capita occurred in 1914 and the peak of US copyright registration per capita occurred in the 1890s.
Patents In spite of its comparative global creative power in all areas of the arts and sciences in the last one hundred years, the peak year for patents registered per capita in the United States was 1914. The registration rate trended downward till 1985 where it stood at 50% of the 1914 peak. It rose again, as might be expected, in step with the information technology boom from 1985 to the present day. But even at its renewed highest in 2005 it was still only 95% of the 1914 per capita figure.
Copyrights Again taking the case of the United States, we find that the registration of copyrights per capita increased in a nominal sense slightly between 1900 and today. But only because the number of kinds of copyrightable objects increased markedly in the same period—meaning that copyright registration per capita in real terms fell. The 1890s appears to be the peak time for per capita copyright creation in the United States once we take into account the increase in copyrightable objects during the last century and a half.
Murphy, ‘Discovery’ in P. Murphy, M. Peters, S. Marginson, Imagination, New York: P.Lang, 2010, 93.

12. The Alexandrian twilight (it began in 1974)
For me, that much is certain on the level, so to speak, of massive and significant facts. It is much more difficult to understand why these developments took place. As you know, Hegel thought that he understood the rise and fall of cultures. I do not think he really did. All he could say was that the spirit of a certain people (Volksgeist) had exhausted itself, which is, of course, a tautology. When we look at a culture on the rise, we see an amazing number of geniuses and great oeuvres, as well as the genius of the entire community. For instance, Pindar, Aeschylus, Sophocles, and many important philosophers existed within a short span of time, along with the buildings of the Acropolis and the Demos of the Athenians. This same sort of extraordinary string can be seen from Dante and Giotto through Shakespeare and Bach to Proust, Kafka, Joyce, and Picasso. And then, in the same places, with the same geography, under the same sun, the “same” people, practically the “same” society does not create anything new. For centuries it just goes on imitating, rather poorly, what has been done before—like the thousands of statues remaining from the third century B.C. to the victory of Christianity. Even if you know nothing about sculpture, it is impossible to confuse these with the products of the previous period. I think that the same phenomenon is starting to happen today. This is what has been called postmodernism: eclecticism and imitation. In fact, it is a rather cheap version of Alexandrianism. The only really significant contribution of postmodernism is that is has shown how great and creative modernism was.
See Castoriadis, ‘Transformation sociale and creation culturelle’ in Sociologie et Sociétés, April 1979 which was the basis of the 1986 English-language paper ‘The Crisis of Culture and the State’ reprinted in Castoriadis, Philosophy, Politics, Autonomy (Oxford: Oxford University Press, 1991), 219-241.
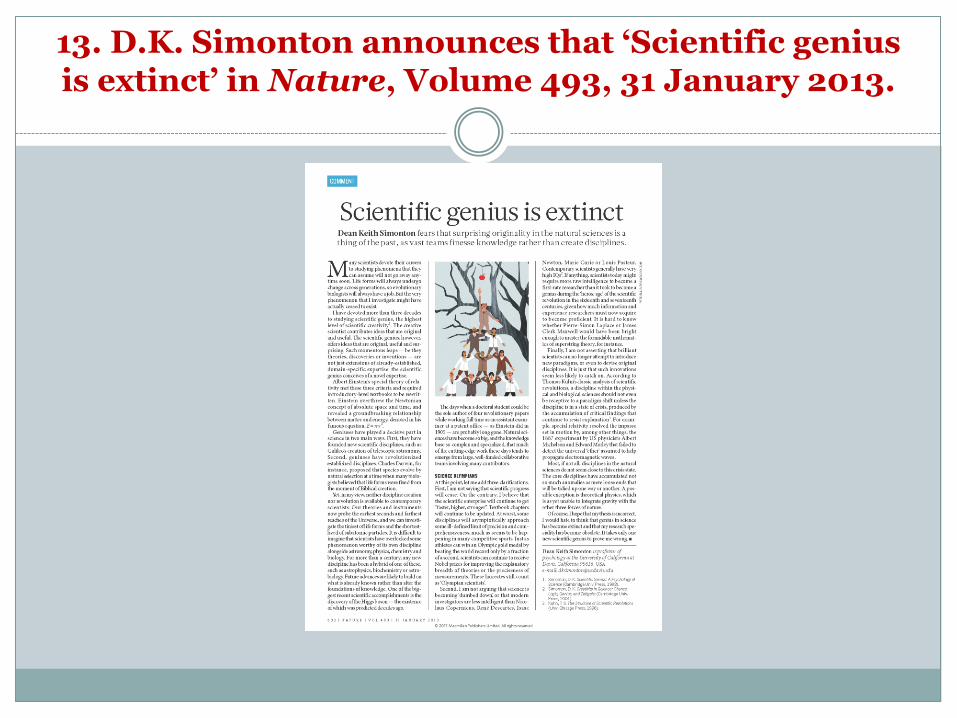
13. D.K. Simonton announces that ‘Scientific genius is extinct’ in Nature, Volume 493, 31 January 2013.
14. Connecting the unconnected
innovation depends on the ability to see relationships between hitherto unconnected ideas or methods and then to fuse them into a new synthesis.
D.K. Simonton, Genius, Creativity and Leadership, Cambridge MA: Harvard
University Press, 1984, 74.

15. Mr Edward Beard Budding’s lawn mower