
Country Report by Philippine Constructors Association
17
Country Report by Philippine Constructors Association I. Overview of the Macroeconomy and the Construction Industry a. Key Macroeconomic Indicators The global economic conditions heavily influence the performance of Philippine economy. In 2009, global economy declined by 2.2%, as a result of economic and financial crises in US and Euro countries, which was also the main culprit for low exports demand and weak consumer and business confidence. While the Philippine economy avoided a negative growth rate, it nevertheless posted a dismal GDP growth rate of 1.1% in 2009. Global economy bounced back faster‐than‐expected by around 4% in 2010 as the series of economic stimulus pumped by the government around the world somehow enabled to reverse the negative growth rates in 2009. Renewed confidence among the investors and consumers also propelled the economy back to positive growth territory. As expected, the Philippine economy also accelerated faster and increased by 7.6% in 2010, the highest in post‐Marcos era. Given recovery in the global economy and renewed confidence, Philippine exports and investments reversed its negative growth rates in 2009 to 21% and 31.6% respectively in 2010. In terms of production side, industry sector reestablished itself as the main growth driver by posting an 11.6% growth rate in 2010. Global Financial Source: National Statistical Coordination Board
-
Upload
khangminh22 -
Category
Documents
-
view
1 -
download
0
Transcript of Country Report by Philippine Constructors Association
Country Report by Philippine Constructors Association
I. Overview of the Macroeconomy and the Construction Industry
a. Key Macroeconomic Indicators
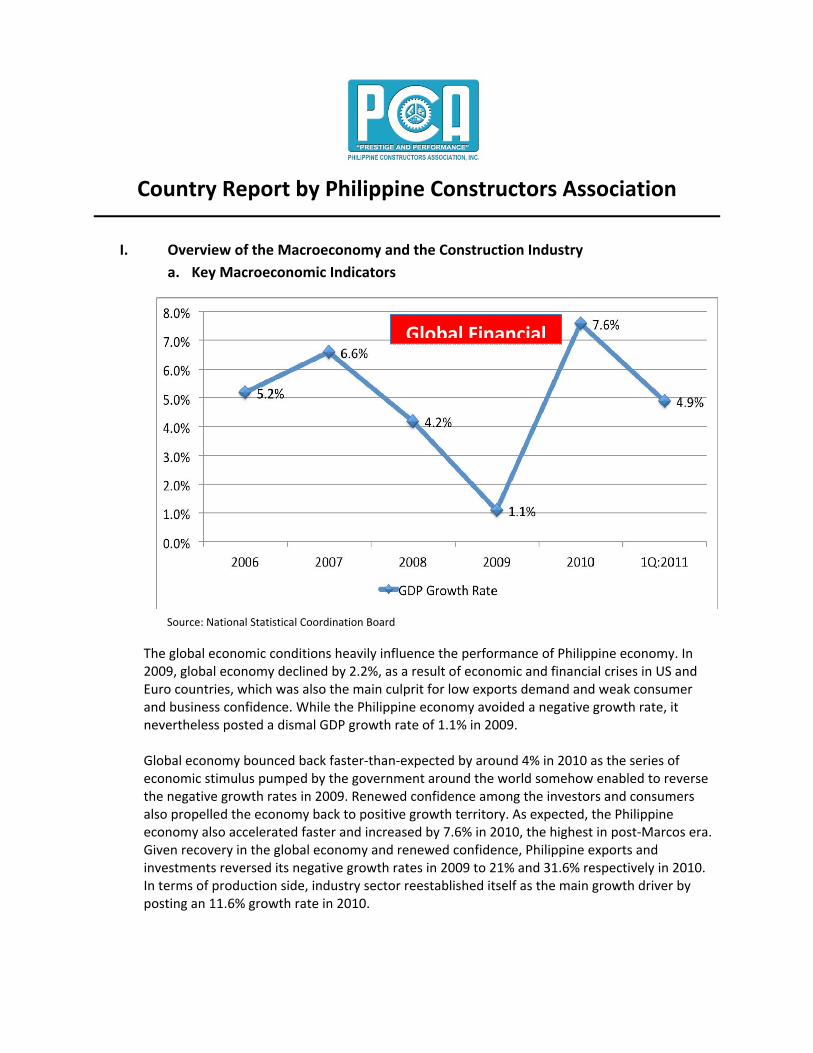
The global economic conditions heavily influence the performance of Philippine economy. In 2009, global economy declined by 2.2%, as a result of economic and financial crises in US and Euro countries, which was also the main culprit for low exports demand and weak consumer and business confidence. While the Philippine economy avoided a negative growth rate, it nevertheless posted a dismal GDP growth rate of 1.1% in 2009.
Global economy bounced back faster‐than‐expected by around 4% in 2010 as the series of economic stimulus pumped by the government around the world somehow enabled to reverse the negative growth rates in 2009. Renewed confidence among the investors and consumers also propelled the economy back to positive growth territory. As expected, the Philippine economy also accelerated faster and increased by 7.6% in 2010, the highest in post‐Marcos era. Given recovery in the global economy and renewed confidence, Philippine exports and investments reversed its negative growth rates in 2009 to 21% and 31.6% respectively in 2010. In terms of production side, industry sector reestablished itself as the main growth driver by posting an 11.6% growth rate in 2010.
Global Financial
Source: National Statistical Coordination Board
Ocoececgr
DFith4FiThec
Ogr
Wtibedcoin
Of course, anooming from aconomy showconomy‐deperowth.
espite a fasteirst, inflation he short‐term.2% in 2009 tilipinos remithis combinaticonomy in 20
Overall, it was rowth rate an
GDP Note:and W
With major risme sustainingeen increasinisruptions in ommodity prncreases high
0.
2.
4.
6.
8.
10.
Sourc
other factor foa very low valwed that as loendent) susta
er growth in trate manage
m interest rateo 3.5% in 201tances (OFWion of key ma010.
a very brightnd stable/sup
Indicator
growth rate : Projections for World Bank
ks in the globg its 2010 grong due to highoil producingices will add per than expec
0%
0%
0%
0%
0%
0%
2006
Pe
ce: Bangko Sent
or the very hiue in 2009 orong as exportsain positive gr
the 2010 econd to increasee (as measure10. Finally, dus), the peso‐dacroeconomic
t economy fopportive inflat
1Q:20
4.2011 and 2012
bal economy, owth rate. Reher demand fg countries anpressure to thcted, this can
6 2007
eso‐Dollar ra
ral ng Pilipinas
gh GDP growr the so‐calleds & investmerowth rates, i
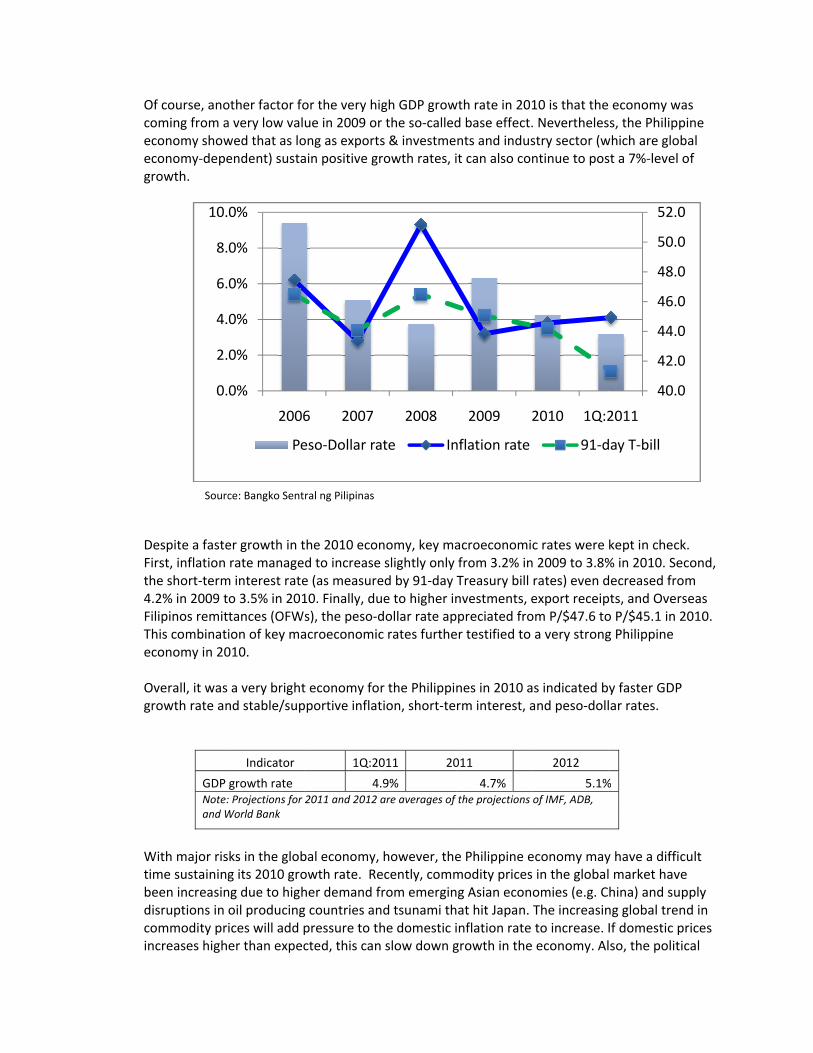
nomy, key ma slightly only ed by 91‐day ue to higher indollar rate apc rates furthe
r the Philippition, short‐te
011 20
.9% are averages of
however, theecently, commfrom emerginnd tsunami thhe domestic in slow down g
2008
ate In
wth rate in 201d base effect.nts and indusit can also con
acroeconomifrom 3.2% inTreasury bill nvestments, eppreciated froer testified to
nes in 2010 arm interest, a
011
4.7% the projections
e Philippine emodity pricesng Asian econhat hit Japan. inflation rate growth in the
2009 2
nflation rate
10 is that the. Neverthelesstry sector (wntinue to pos
c rates were n 2009 to 3.8%rates) even dexport receipom P/$47.6 toa very strong
as indicated band peso‐doll
2012
5.1%of IMF, ADB,
economy may in the globalomies (e.g. CThe increasinto increase. economy. Al
2010 1Q:2
91‐d
economy wass, the Philippwhich are globst a 7%‐level o
kept in check% in 2010. Secdecreased fropts, and Overso P/$45.1 in 2g Philippine
y faster GDP lar rates.
%
y have a difficl market havehina) and supng global trenIf domestic plso, the politic
40.0
42.0
44.0
46.0
48.0
50.0
52.0
2011
day T‐bill
as pine bal of
k. cond, m seas 2010.
cult e pply nd in rices cal
0
0
0
0
0
0
0
uinin N20agFuecec
Th20uG
Thinpasulik
Cpgoac
nrest in Middnvestors and cnvestments.
evertheless, 011 as domesgricultural seund (IMF), Asconomy to grconomy to slo
he Philippine 016. This projnder the AquDP growth.
b. Constr
here are two ndustry, constutting up of bs the provisiondertaken byke repair and
onstruction arivate and puovernment coctivities are c
i. Share
0
1
2
3
4
5
6
7
So
dle East and Nconsumers, w
Philippine ecstic consumpctor also contsian Developmrow by 4.7% iow down from
governmentjection hingeuino administr
ruction Indus
ways to undetruction sectobuildings and on of technicay horizontally maintenance
as an investmublic construcorporations alassified as p
of Construct
0.0%
1.0%
2.0%
3.0%
4.0%
5.0%
6.0%
7.0%
200
C
ource: National S
North African which can furt
onomy recortion and invetributed to a ment Bank (An 2011 and 5m its 2010 gr
, however, is s on the implration and ot
stry Performa
erstand “consor includes “astructures anal/engineeringintegrated coe and own‐ac
ent or capitaction. In particare classified arivate.”
ion industry t
06 2007
Construction
Statistical Coord
(MENA) counther slow dow
ded a modesestment weremodest GDP DB), and Wor5.1% in 2012. owth rate giv
sticking withlementation oher fiscal and
ance
struction” in tactivities of esnd other landg services andonstruction ficcount constr
l formation, ocular, “all conas public con
to the Gross
2008
Industry Outp
dination Board
ntries can undwn domestic
t growth ratee able to sustagrowth rate.rld Bank (WBThese three iven the risks p
its 7‐8% GDPof Public‐Privd monetary po
the Philippinestablishmentd improvemend the manufairms; and inforuction.”
on the other hnstruction owstruction; wh
Domestic Pro
2009 2
put Con
dermine confeconomy if th
e of 4.9% in fiain its growth The Internat) projected thinstitutions sepreviously me
P growth ratevate Partnersholicies condu
e economy. Fs primarily ennts; secondaracture of consormal constru
hand, is classwned by the ghile all other c
oduct
2010 1Q:20
nstruction‐to‐
fidence amonhey lead to lo
rst quarter ofh. The recovetional Monetahe Philippine ee the Philippentioned.
e from 2011 tohip (PPP) Projcive for high‐
First, as an ngaged in thery activities sustruction matuction activiti
ified either aovernment aconstruction
‐
50,00
100,0
150,0
200,0
250,0
300,0
350,0
011
‐GDP ratio
ng ower
f ry in ary
pine
o jects ‐level
e uch terials es
s a nd
0
00
00
00
00
00
00
Fra Dcom
Ino(mintoinin
Thwcoufr
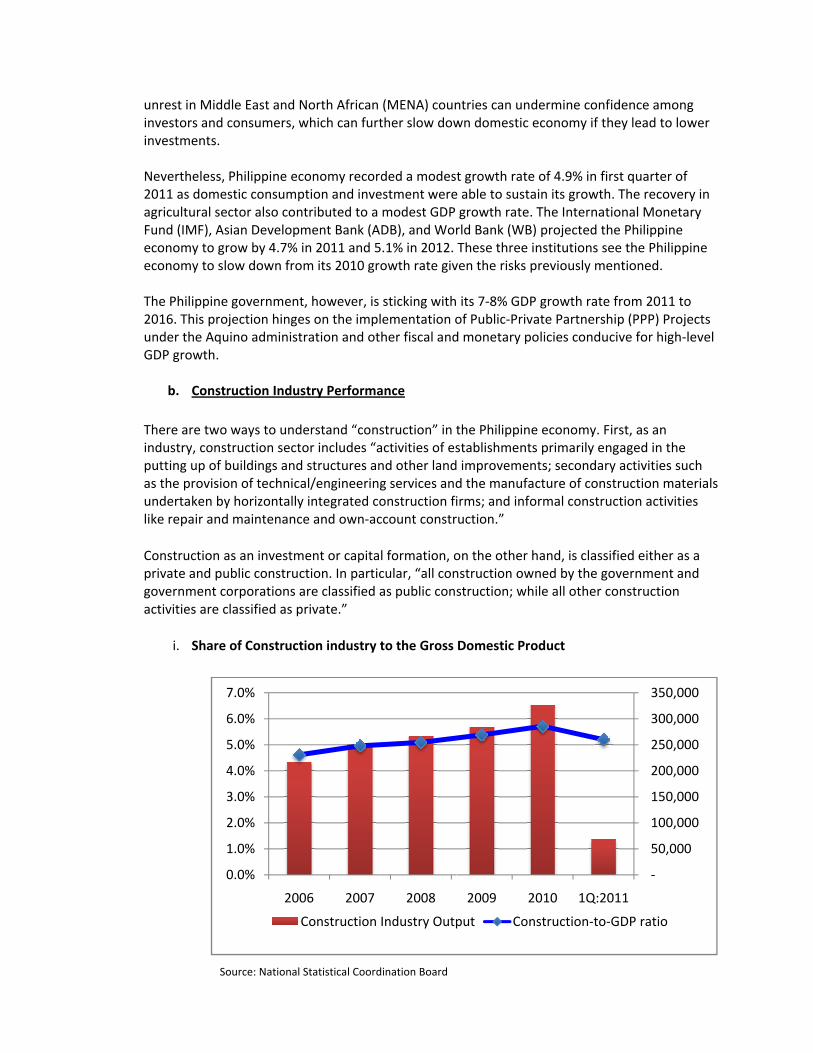
rom 2006 to testament touring this fionstruction inmore dollar ea
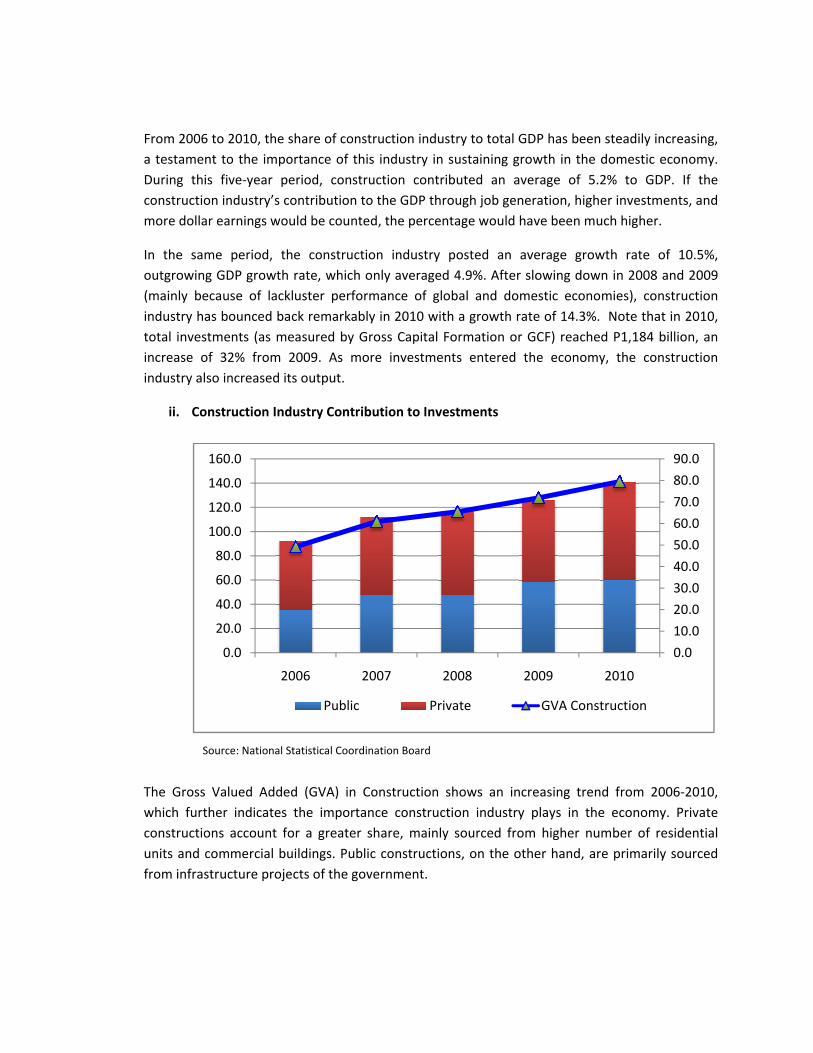
n the same utgrowing GDmainly becaundustry has botal investmencrease of 32ndustry also in
ii. Constr
he Gross Vawhich further onstructions nits and comrom infrastruc
0
20
40
60
80
100
120
140
160
Sourc
2010, the shao the importave‐year perindustry’s conarnings would
period, the DP growth rause of lacklusounced back ents (as meas2% from 200ncreased its o
ruction Indus
lued Added indicates thaccount for
mmercial buildcture project
0.0
0.0
0.0
0.0
0.0
0.0
0.0
0.0
0.0
2006
ce: National Stat
are of construance of this iod, constructribution to td be counted,
constructionate, which onster performremarkably sured by Gro09. As moreoutput.
stry Contribut
(GVA) in Conhe importanca greater shdings. Public s of the gove
6 200
Public
tistical Coordinat
uction industindustry in suction contribthe GDP throu, the percenta
n industry ply averaged 4ance of globin 2010 with oss Capital Foe investment
tion to Invest
nstruction shce constructioare, mainly sconstructionsrnment.
07 20
Priva
tion Board
ry to total GDustaining grouted an aveugh job geneage would ha
osted an av4.9%. After slbal and domea growth rat
ormation or Gs entered th
tments
hows an incron industry psourced froms, on the oth
008 20
ate
DP has been swth in the derage of 5.2%ration, higherave been muc
verage growtlowing down estic economte of 14.3%. GCF) reached he economy,
easing trendplays in the m higher numher hand, are
009 2
GVA Constr
steadily increomestic econ% to GDP. Ir investmentsch higher.
th rate of 1 in 2008 and
mies), construNote that in P1,184 billio the constru
from 2006‐economy. P
mber of resid primarily so
0.
10
20
30
40
50
60
70
80
90
2010
ruction
asing, nomy. If the s, and
10.5%, 2009
uction 2010, on, an uction
2010, rivate ential urced
0
0.0
0.0
0.0
0.0
0.0
0.0
0.0
0.0
0.0
Cecaneccoco
Obinstcoac
Apere20
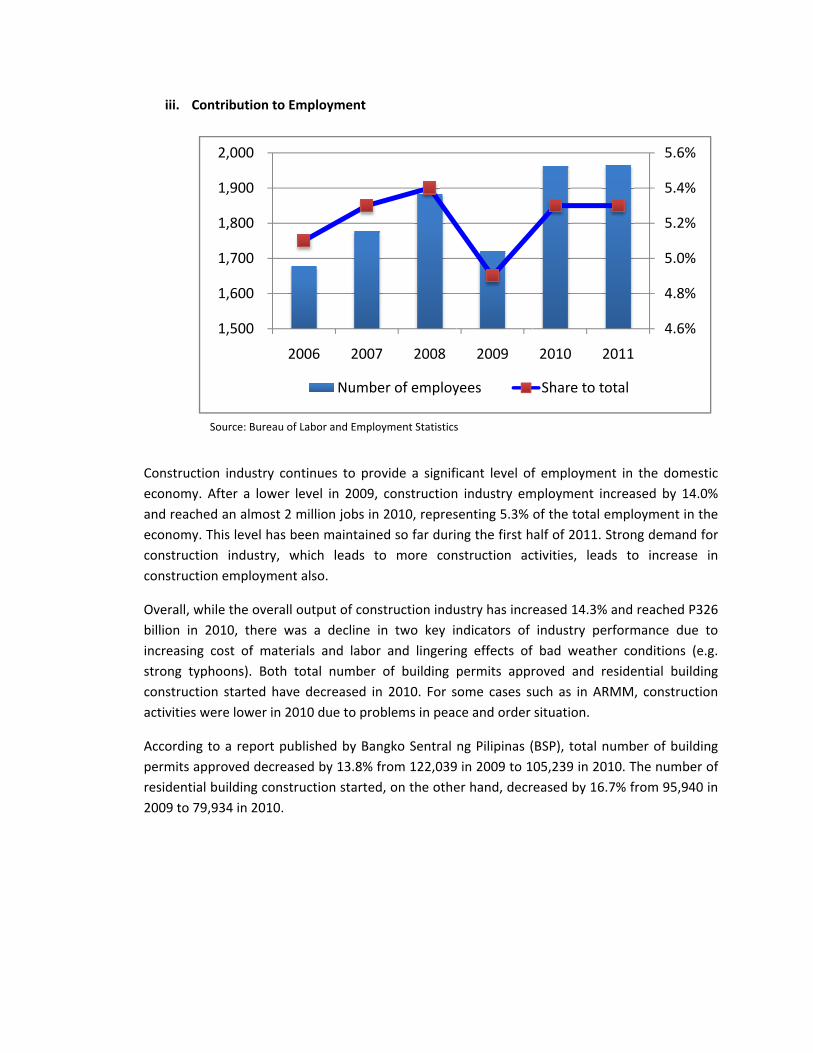
iii. Contri
onstruction iconomy. Aftend reached aconomy. Thisonstruction onstruction e
Overall, while illion in 2010ncreasing costrong typhooonstruction sctivities were
ccording to aermits approesidential bui009 to 79,934
1,
1,
1,
1,
1,
2,
Sou
bution to Em
ndustry conter a lower len almost 2 ms level has beindustry, whemployment a
the overall o0, there wasst of materiaons). Both tostarted have e lower in 201
a report publved decreaselding constru4 in 2010.
,500
,600
,700
,800
,900
,000
20
rce: Bureau of L
mployment
tinues to proevel in 2009, million jobs in en maintainehich leads toalso.
utput of conss a decline ials and laborotal number decreased in10 due to pro
lished by Baned by 13.8% fuction started
06 2007
Numbe
Labor and Emplo
ovide a signifconstruction2010, represed so far durio more con
struction indun two key ir and lingerinof building
n 2010. For sblems in peac
ngko Sentral from 122,039d, on the othe
7 2008
er of employ
oyment Statistics
icant level ofn industry emsenting 5.3% ng the first hnstruction ac
ustry has incrndicators of ng effects ofpermits apprsome cases sce and order
ng Pilipinas (9 in 2009 to 1er hand, decr
2009
yees
s
f employmenmployment inof the total ehalf of 2011. Sctivities, lead
eased 14.3% industry per
f bad weatheroved and reuch as in ARsituation.
(BSP), total n05,239 in 20reased by 16.
2010 2
Share to to
nt in the domncreased by 1employment iStrong demands to increa
and reachedrformance der conditionsesidential buRMM, constru
umber of bu10. The numb7% from 95,9
4.6
4.8
5.0
5.2
5.4
5.6
2011
otal
mestic 14.0% in the nd for se in
P326 ue to s (e.g. uilding uction
uilding ber of 940 in
%
%
%
%
%
%
II. Updates/Issues related to the construction industry in Philippines
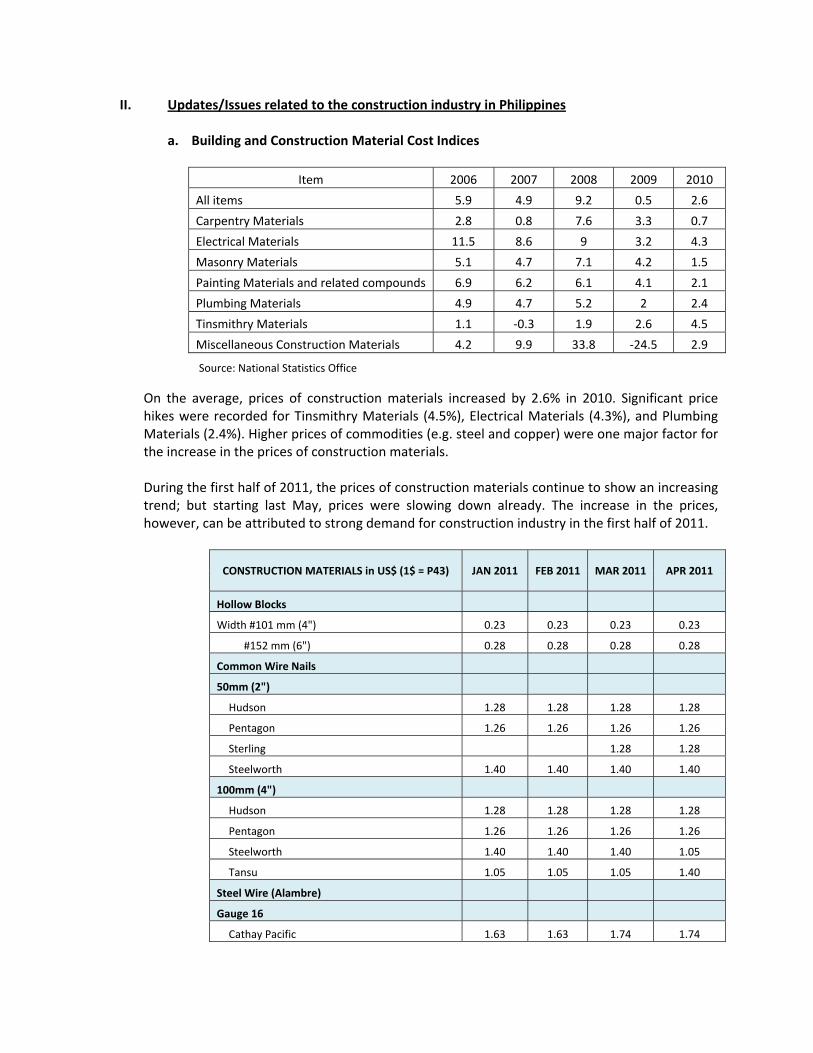
a. Building and Construction Material Cost Indices
Item 2006 2007 2008 2009 2010
All items 5.9 4.9 9.2 0.5 2.6
Carpentry Materials 2.8 0.8 7.6 3.3 0.7
Electrical Materials 11.5 8.6 9 3.2 4.3
Masonry Materials 5.1 4.7 7.1 4.2 1.5
Painting Materials and related compounds 6.9 6.2 6.1 4.1 2.1
Plumbing Materials 4.9 4.7 5.2 2 2.4
Tinsmithry Materials 1.1 ‐0.3 1.9 2.6 4.5
Miscellaneous Construction Materials 4.2 9.9 33.8 ‐24.5 2.9
On the average, prices of construction materials increased by 2.6% in 2010. Significant price hikes were recorded for Tinsmithry Materials (4.5%), Electrical Materials (4.3%), and Plumbing Materials (2.4%). Higher prices of commodities (e.g. steel and copper) were one major factor for the increase in the prices of construction materials.
During the first half of 2011, the prices of construction materials continue to show an increasing trend; but starting last May, prices were slowing down already. The increase in the prices, however, can be attributed to strong demand for construction industry in the first half of 2011.
CONSTRUCTION MATERIALS in US$ (1$ = P43) JAN 2011 FEB 2011 MAR 2011 APR 2011
Hollow Blocks
Width #101 mm (4") 0.23 0.23 0.23 0.23
#152 mm (6") 0.28 0.28 0.28 0.28
Common Wire Nails
50mm (2")
Hudson 1.28 1.28 1.28 1.28
Pentagon 1.26 1.26 1.26 1.26
Sterling 1.28 1.28
Steelworth 1.40 1.40 1.40 1.40
100mm (4")
Hudson 1.28 1.28 1.28 1.28
Pentagon 1.26 1.26 1.26 1.26
Steelworth 1.40 1.40 1.40 1.05
Tansu 1.05 1.05 1.05 1.40
Steel Wire (Alambre)
Gauge 16
Cathay Pacific 1.63 1.63 1.74 1.74
Source: National Statistics Office
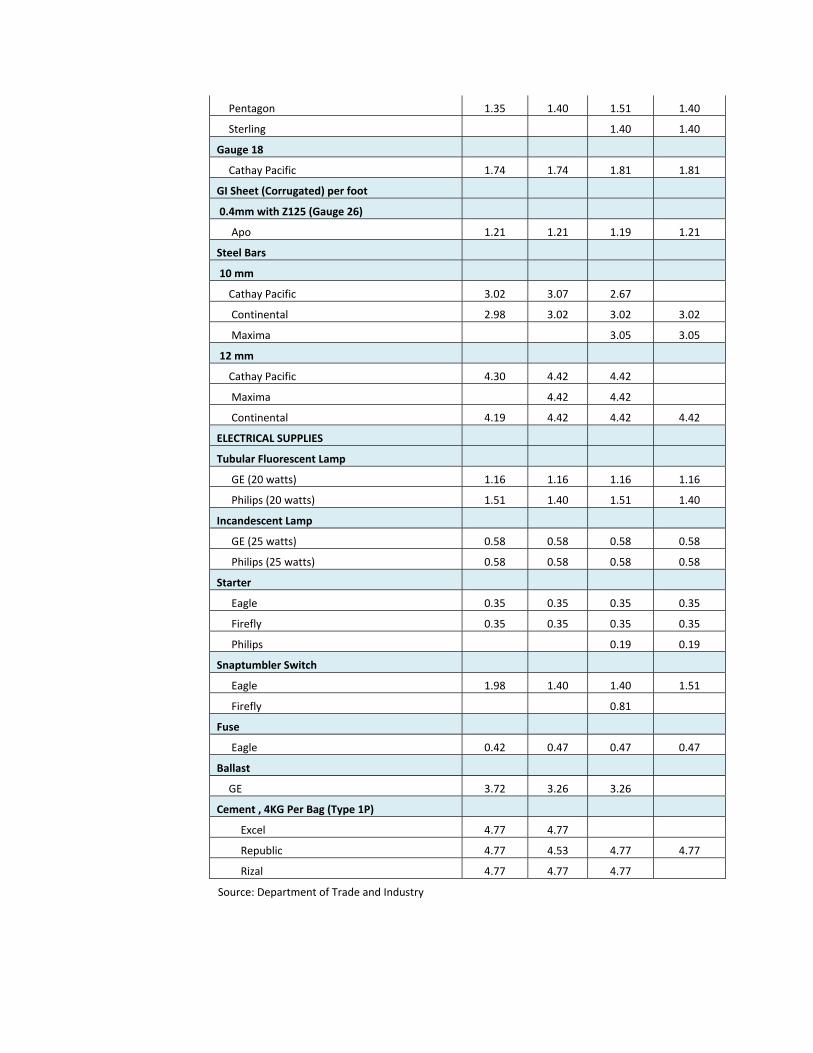
Pentagon 1.35 1.40 1.51 1.40
Sterling 1.40 1.40
Gauge 18
Cathay Pacific 1.74 1.74 1.81 1.81
GI Sheet (Corrugated) per foot
0.4mm with Z125 (Gauge 26)
Apo 1.21 1.21 1.19 1.21
Steel Bars
10 mm
Cathay Pacific 3.02 3.07 2.67
Continental 2.98 3.02 3.02 3.02
Maxima 3.05 3.05
12 mm
Cathay Pacific 4.30 4.42 4.42
Maxima 4.42 4.42
Continental 4.19 4.42 4.42 4.42
ELECTRICAL SUPPLIES
Tubular Fluorescent Lamp
GE (20 watts) 1.16 1.16 1.16 1.16
Philips (20 watts) 1.51 1.40 1.51 1.40
Incandescent Lamp
GE (25 watts) 0.58 0.58 0.58 0.58
Philips (25 watts) 0.58 0.58 0.58 0.58
Starter
Eagle 0.35 0.35 0.35 0.35
Firefly 0.35 0.35 0.35 0.35
Philips 0.19 0.19
Snaptumbler Switch
Eagle 1.98 1.40 1.40 1.51
Firefly 0.81
Fuse
Eagle 0.42 0.47 0.47 0.47
Ballast
GE 3.72 3.26 3.26
Cement , 4KG Per Bag (Type 1P)
Excel 4.77 4.77
Republic 4.77 4.53 4.77 4.77
Rizal 4.77 4.77 4.77
Source: Department of Trade and Industry
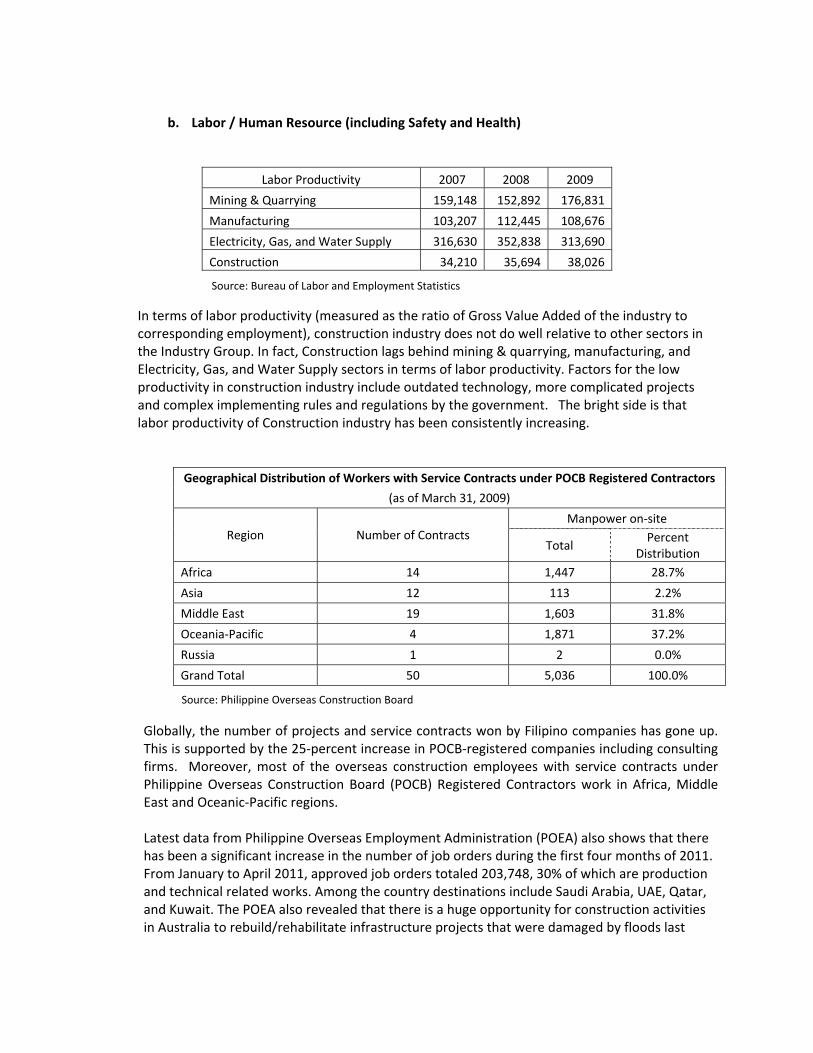
b. Labor / Human Resource (including Safety and Health)
Labor Productivity 2007 2008 2009
Mining & Quarrying 159,148 152,892 176,831
Manufacturing 103,207 112,445 108,676
Electricity, Gas, and Water Supply 316,630 352,838 313,690
Construction 34,210 35,694 38,026 In terms of labor productivity (measured as the ratio of Gross Value Added of the industry to corresponding employment), construction industry does not do well relative to other sectors in the Industry Group. In fact, Construction lags behind mining & quarrying, manufacturing, and Electricity, Gas, and Water Supply sectors in terms of labor productivity. Factors for the low productivity in construction industry include outdated technology, more complicated projects and complex implementing rules and regulations by the government. The bright side is that labor productivity of Construction industry has been consistently increasing.
Geographical Distribution of Workers with Service Contracts under POCB Registered Contractors
(as of March 31, 2009)
Region Number of Contracts Manpower on‐site
Total Percent
Distribution Africa 14 1,447 28.7%
Asia 12 113 2.2%
Middle East 19 1,603 31.8%
Oceania‐Pacific 4 1,871 37.2%
Russia 1 2 0.0%
Grand Total 50 5,036 100.0%
Globally, the number of projects and service contracts won by Filipino companies has gone up. This is supported by the 25‐percent increase in POCB‐registered companies including consulting firms. Moreover, most of the overseas construction employees with service contracts under Philippine Overseas Construction Board (POCB) Registered Contractors work in Africa, Middle East and Oceanic‐Pacific regions. Latest data from Philippine Overseas Employment Administration (POEA) also shows that there has been a significant increase in the number of job orders during the first four months of 2011. From January to April 2011, approved job orders totaled 203,748, 30% of which are production and technical related works. Among the country destinations include Saudi Arabia, UAE, Qatar, and Kuwait. The POEA also revealed that there is a huge opportunity for construction activities in Australia to rebuild/rehabilitate infrastructure projects that were damaged by floods last
Source: Bureau of Labor and Employment Statistics
Source: Philippine Overseas Construction Board
December 2010. POEA also identifies construction as one of the major sources of overseas employment for Filipinos in the next 5‐10 years.
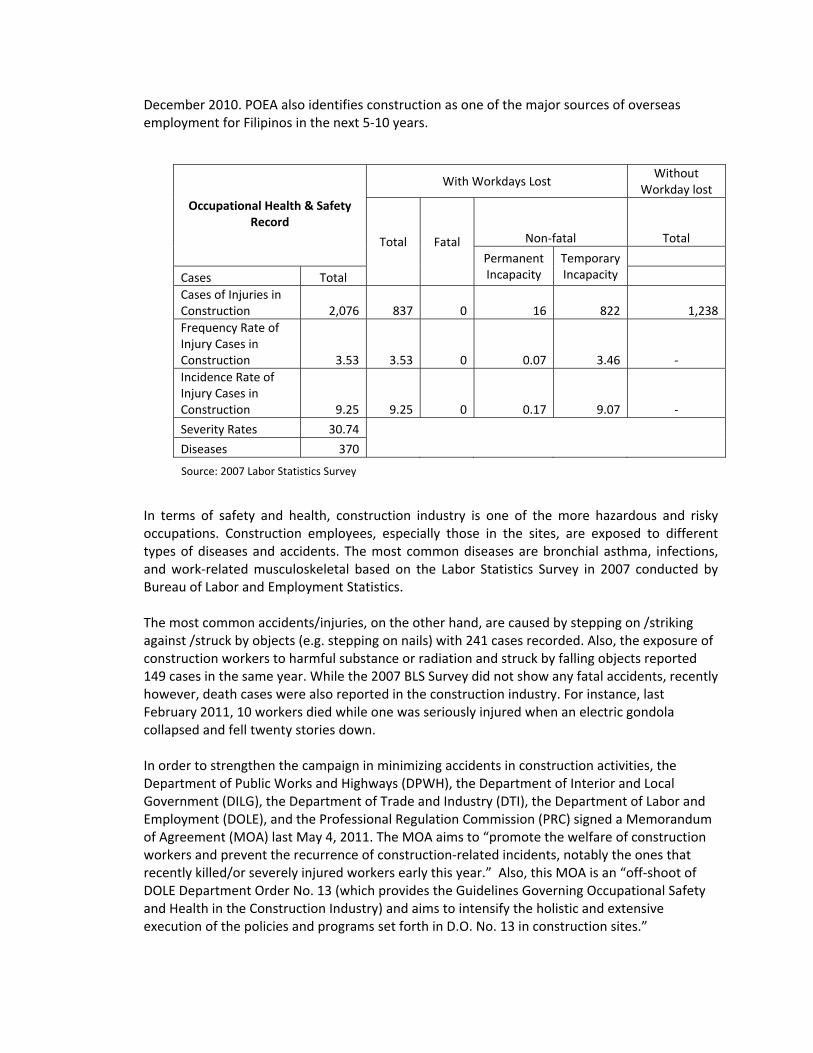
In terms of safety and health, construction industry is one of the more hazardous and risky occupations. Construction employees, especially those in the sites, are exposed to different types of diseases and accidents. The most common diseases are bronchial asthma, infections, and work‐related musculoskeletal based on the Labor Statistics Survey in 2007 conducted by Bureau of Labor and Employment Statistics. The most common accidents/injuries, on the other hand, are caused by stepping on /striking against /struck by objects (e.g. stepping on nails) with 241 cases recorded. Also, the exposure of construction workers to harmful substance or radiation and struck by falling objects reported 149 cases in the same year. While the 2007 BLS Survey did not show any fatal accidents, recently however, death cases were also reported in the construction industry. For instance, last February 2011, 10 workers died while one was seriously injured when an electric gondola collapsed and fell twenty stories down.
In order to strengthen the campaign in minimizing accidents in construction activities, the Department of Public Works and Highways (DPWH), the Department of Interior and Local Government (DILG), the Department of Trade and Industry (DTI), the Department of Labor and Employment (DOLE), and the Professional Regulation Commission (PRC) signed a Memorandum of Agreement (MOA) last May 4, 2011. The MOA aims to “promote the welfare of construction workers and prevent the recurrence of construction‐related incidents, notably the ones that recently killed/or severely injured workers early this year.” Also, this MOA is an “off‐shoot of DOLE Department Order No. 13 (which provides the Guidelines Governing Occupational Safety and Health in the Construction Industry) and aims to intensify the holistic and extensive execution of the policies and programs set forth in D.O. No. 13 in construction sites.”
Occupational Health & Safety
Record
With Workdays Lost Without
Workday lost
Total Fatal Non‐fatal Total
Permanent Incapacity
Temporary Incapacity
Cases Total Cases of Injuries in Construction 2,076 837 0 16 822 1,238 Frequency Rate of Injury Cases in Construction 3.53 3.53 0 0.07 3.46 ‐ Incidence Rate of Injury Cases in Construction 9.25 9.25 0 0.17 9.07 ‐
Severity Rates 30.74
Diseases 370
Source: 2007 Labor Statistics Survey
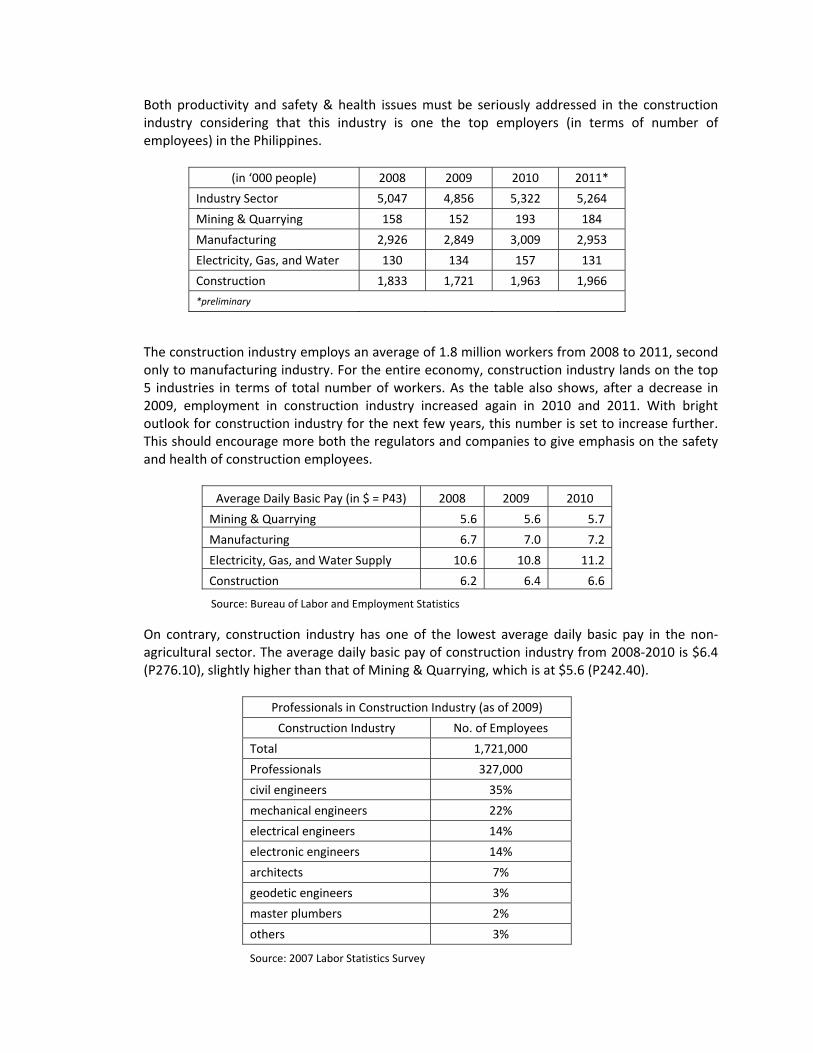
Both productivity and safety & health issues must be seriously addressed in the construction industry considering that this industry is one the top employers (in terms of number of employees) in the Philippines.
(in ‘000 people) 2008 2009 2010 2011*
Industry Sector 5,047 4,856 5,322 5,264
Mining & Quarrying 158 152 193 184
Manufacturing 2,926 2,849 3,009 2,953
Electricity, Gas, and Water 130 134 157 131
Construction 1,833 1,721 1,963 1,966
*preliminary
The construction industry employs an average of 1.8 million workers from 2008 to 2011, second only to manufacturing industry. For the entire economy, construction industry lands on the top 5 industries in terms of total number of workers. As the table also shows, after a decrease in 2009, employment in construction industry increased again in 2010 and 2011. With bright outlook for construction industry for the next few years, this number is set to increase further. This should encourage more both the regulators and companies to give emphasis on the safety and health of construction employees.
Average Daily Basic Pay (in $ = P43) 2008 2009 2010
Mining & Quarrying 5.6 5.6 5.7
Manufacturing 6.7 7.0 7.2
Electricity, Gas, and Water Supply 10.6 10.8 11.2
Construction 6.2 6.4 6.6
On contrary, construction industry has one of the lowest average daily basic pay in the non‐agricultural sector. The average daily basic pay of construction industry from 2008‐2010 is $6.4 (P276.10), slightly higher than that of Mining & Quarrying, which is at $5.6 (P242.40).
Professionals in Construction Industry (as of 2009)
Construction Industry No. of Employees
Total 1,721,000
Professionals 327,000
civil engineers 35%
mechanical engineers 22%
electrical engineers 14%
electronic engineers 14%
architects 7%
geodetic engineers 3%
master plumbers 2%
others 3%
Source: Bureau of Labor and Employment Statistics
Source: 2007 Labor Statistics Survey
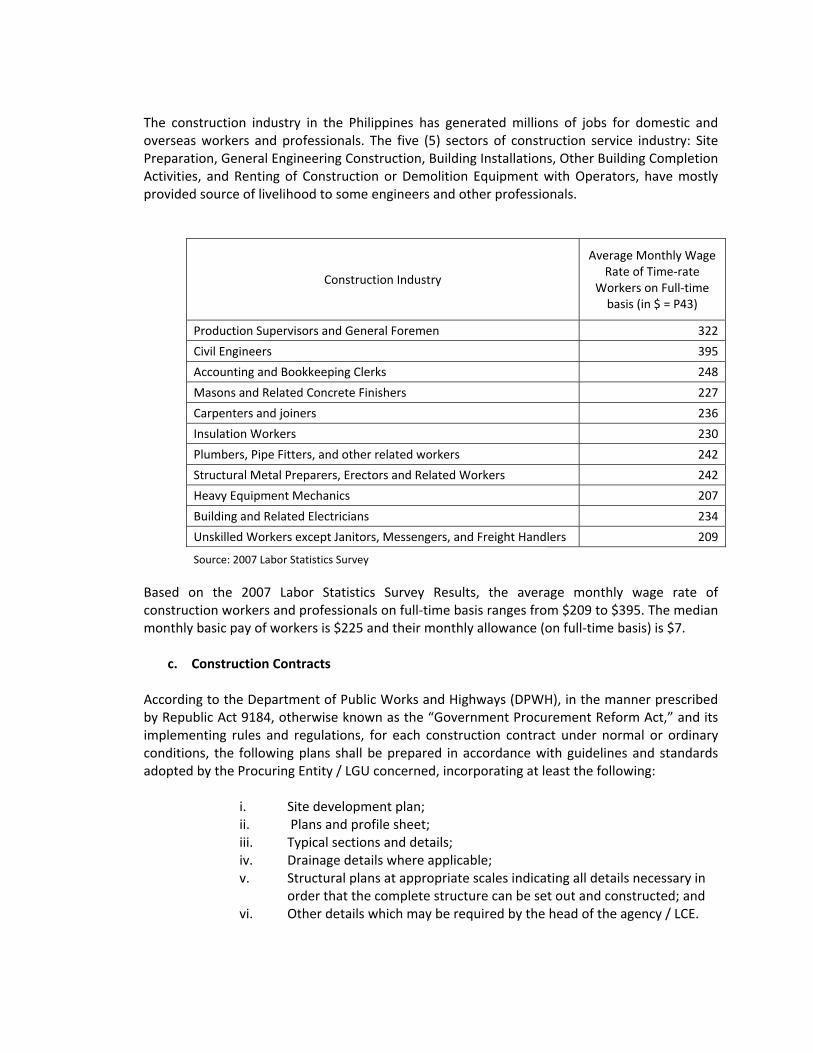
The construction industry in the Philippines has generated millions of jobs for domestic and overseas workers and professionals. The five (5) sectors of construction service industry: Site Preparation, General Engineering Construction, Building Installations, Other Building Completion Activities, and Renting of Construction or Demolition Equipment with Operators, have mostly provided source of livelihood to some engineers and other professionals.
Construction Industry
Average Monthly Wage Rate of Time‐rate
Workers on Full‐time basis (in $ = P43)
Production Supervisors and General Foremen 322
Civil Engineers 395
Accounting and Bookkeeping Clerks 248
Masons and Related Concrete Finishers 227
Carpenters and joiners 236
Insulation Workers 230
Plumbers, Pipe Fitters, and other related workers 242
Structural Metal Preparers, Erectors and Related Workers 242
Heavy Equipment Mechanics 207
Building and Related Electricians 234
Unskilled Workers except Janitors, Messengers, and Freight Handlers 209
Based on the 2007 Labor Statistics Survey Results, the average monthly wage rate of construction workers and professionals on full‐time basis ranges from $209 to $395. The median monthly basic pay of workers is $225 and their monthly allowance (on full‐time basis) is $7.
c. Construction Contracts
According to the Department of Public Works and Highways (DPWH), in the manner prescribed by Republic Act 9184, otherwise known as the “Government Procurement Reform Act,” and its implementing rules and regulations, for each construction contract under normal or ordinary conditions, the following plans shall be prepared in accordance with guidelines and standards adopted by the Procuring Entity / LGU concerned, incorporating at least the following:
i. Site development plan; ii. Plans and profile sheet; iii. Typical sections and details; iv. Drainage details where applicable; v. Structural plans at appropriate scales indicating all details necessary in
order that the complete structure can be set out and constructed; and vi. Other details which may be required by the head of the agency / LCE.
Source: 2007 Labor Statistics Survey
In addition, based from the Manual of Procedures for the Procurement of Infrastructure Projects made by DPWH, the bidding documents should clearly state the type of contract to be entered into and contain the proposed contract provisions appropriate therefore. The most common types of contracts provide for payments on the basis of a lump sum, unit price, or combinations thereof.
A typical construction contract between the owner and the contractor include the following items:
i. General Conditions of project ii. Duration of project iii. Amount of project iv. Variation orders (e.g. changes from original plans) v. Liquidated damages (e.g. delays) vi. Scope of Work
The size and scope of individual contracts will depend on the magnitude, nature, and location of the project, for example:
i. For projects requiring a variety of goods and works, separate contracts
may be awarded for the supply and/or installation of different items of equipment and plant (“plant” refers to installed equipment, as in a production facility) and for the works.
ii. For a project requiring similar but separate items of equipment or works, bids may be invited under alternative contract options that would attract the interest of both small and large firms, which could be allowed, at their option, to bid for individual contracts (slices) or for a group of similar contracts (package). All bids and combinations of bids should be received by the same deadline and opened and evaluated simultaneously so as to determine the bid or combination of bids offering the lowest calculated cost to the procuring entity / LGU.
iii. In certain cases, the procuring entity / LGU may require a turnkey contract under which the design and engineering, the supply and installation of equipment, and the construction of a complete facility or works are provided under one (1) contract. Alternatively, the procuring entity / LGU may remain responsible for the design and engineering, and invite bids for a single responsibility contract for the supply and installation of all goods and works required for the project component. Also acceptable where appropriate are contracts such as, but not limited to:
• design and build; • design, build and operate; • design, build and lease; and • management contract.
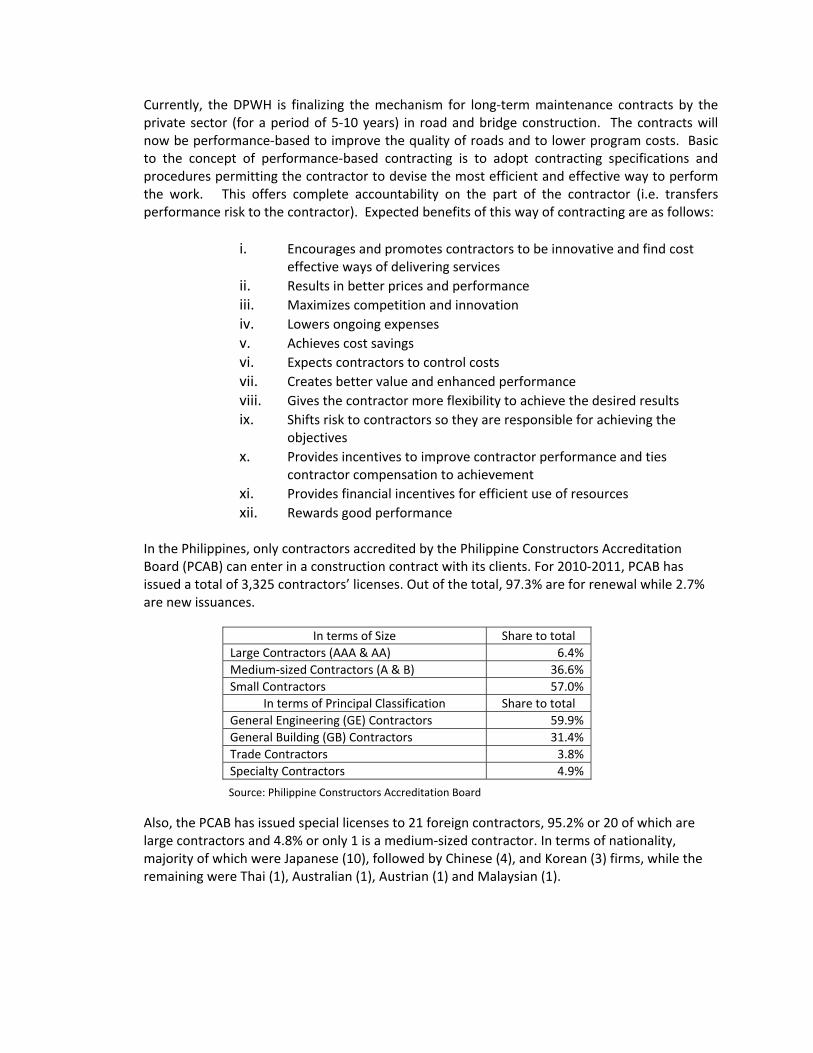
Currently, the DPWH is finalizing the mechanism for long‐term maintenance contracts by the private sector (for a period of 5‐10 years) in road and bridge construction. The contracts will now be performance‐based to improve the quality of roads and to lower program costs. Basic to the concept of performance‐based contracting is to adopt contracting specifications and procedures permitting the contractor to devise the most efficient and effective way to perform the work. This offers complete accountability on the part of the contractor (i.e. transfers performance risk to the contractor). Expected benefits of this way of contracting are as follows:
i. Encourages and promotes contractors to be innovative and find cost
effective ways of delivering services ii. Results in better prices and performance iii. Maximizes competition and innovation iv. Lowers ongoing expenses v. Achieves cost savings vi. Expects contractors to control costs vii. Creates better value and enhanced performance viii. Gives the contractor more flexibility to achieve the desired results ix. Shifts risk to contractors so they are responsible for achieving the
objectives x. Provides incentives to improve contractor performance and ties
contractor compensation to achievement xi. Provides financial incentives for efficient use of resources xii. Rewards good performance
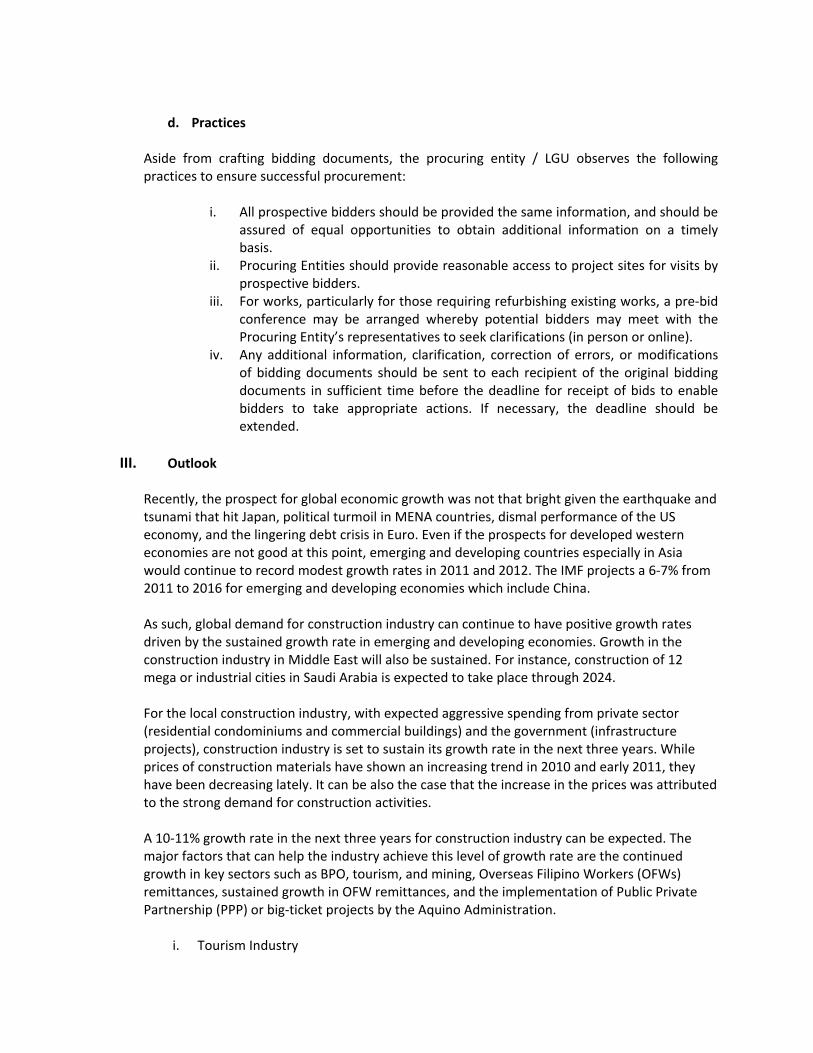
In the Philippines, only contractors accredited by the Philippine Constructors Accreditation Board (PCAB) can enter in a construction contract with its clients. For 2010‐2011, PCAB has issued a total of 3,325 contractors’ licenses. Out of the total, 97.3% are for renewal while 2.7% are new issuances.
In terms of Size Share to total
Large Contractors (AAA & AA) 6.4% Medium‐sized Contractors (A & B) 36.6% Small Contractors 57.0%
In terms of Principal Classification Share to total General Engineering (GE) Contractors 59.9% General Building (GB) Contractors 31.4% Trade Contractors 3.8% Specialty Contractors 4.9%
Also, the PCAB has issued special licenses to 21 foreign contractors, 95.2% or 20 of which are large contractors and 4.8% or only 1 is a medium‐sized contractor. In terms of nationality, majority of which were Japanese (10), followed by Chinese (4), and Korean (3) firms, while the remaining were Thai (1), Australian (1), Austrian (1) and Malaysian (1).
Source: Philippine Constructors Accreditation Board
d. Practices
Aside from crafting bidding documents, the procuring entity / LGU observes the following practices to ensure successful procurement:
i. All prospective bidders should be provided the same information, and should be
assured of equal opportunities to obtain additional information on a timely basis.
ii. Procuring Entities should provide reasonable access to project sites for visits by prospective bidders.
iii. For works, particularly for those requiring refurbishing existing works, a pre‐bid conference may be arranged whereby potential bidders may meet with the Procuring Entity’s representatives to seek clarifications (in person or online).
iv. Any additional information, clarification, correction of errors, or modifications of bidding documents should be sent to each recipient of the original bidding documents in sufficient time before the deadline for receipt of bids to enable bidders to take appropriate actions. If necessary, the deadline should be extended.
III. Outlook
Recently, the prospect for global economic growth was not that bright given the earthquake and tsunami that hit Japan, political turmoil in MENA countries, dismal performance of the US economy, and the lingering debt crisis in Euro. Even if the prospects for developed western economies are not good at this point, emerging and developing countries especially in Asia would continue to record modest growth rates in 2011 and 2012. The IMF projects a 6‐7% from 2011 to 2016 for emerging and developing economies which include China. As such, global demand for construction industry can continue to have positive growth rates driven by the sustained growth rate in emerging and developing economies. Growth in the construction industry in Middle East will also be sustained. For instance, construction of 12 mega or industrial cities in Saudi Arabia is expected to take place through 2024. For the local construction industry, with expected aggressive spending from private sector (residential condominiums and commercial buildings) and the government (infrastructure projects), construction industry is set to sustain its growth rate in the next three years. While prices of construction materials have shown an increasing trend in 2010 and early 2011, they have been decreasing lately. It can be also the case that the increase in the prices was attributed to the strong demand for construction activities.
A 10‐11% growth rate in the next three years for construction industry can be expected. The major factors that can help the industry achieve this level of growth rate are the continued growth in key sectors such as BPO, tourism, and mining, Overseas Filipino Workers (OFWs) remittances, sustained growth in OFW remittances, and the implementation of Public Private Partnership (PPP) or big‐ticket projects by the Aquino Administration.
i. Tourism Industry
From January‐April 2011, inbound visitors to the Philippines have increased by 13.3% from 1.2 million to 1.3 arrivals in 2011. Most of the arrivals came from East Asia region. On the other hand, based on 2009 Household Survey on Domestic Visitors (NSO and DOT), there are 22.8 million domestic travelers in the Philippines.
In 2010, total foreign tourist arrivals were at a record‐high of 3.52 million. DOT sets a target of 3.74 million tourist arrivals in 2011. With 1.3 million arrivals already recorded in first 4 months of 2011, this target will likely be achieved. Moreover, the DOT aims to increase foreign tourist arrivals to 6 million by 2016.
Higher foreign tourist arrivals and increase in the number of domestic travelers can lead to construction of additional resorts, hotels, and even condominiums for those who want to stay a little longer in the Philippines. Increase in number of travelers can also lead to construction of additional airports and improvement of existing ones. Also, due to the Republic Act of 9593 or Tourism Act of 2009, roads that are not classified as national but lead to tourism sites, airports, and seaports can be now included in the budget of DPWH. As such, we can expect an increase in construction of “tourism roads” during the Aquino Administration.
ii. Business Process Outsourcing (BPO)
According to Export Development Council (EDC) and BPAP, the BPO industry is expected to grow by 18% in 2011 and 20% in 2012 after posting a growth rate of 26.9% to reach US$8.9 billion revenues in 2009. The major driver of BPO industry is the IT‐BPO sector (i.e. information technology‐business process outsourcing), which has been growing at an average rate of 30% for the past years. Moreover, the Contact Center Association of the Philippines (CCAP) also believes that a 15%‐20% growth rate 2011 target for BOP industry is achievable. Expansion of BPO companies both in and outside Metro Manila can lead to additional construction of commercial buildings. This will be a huge opportunity for the construction industry to increase its output to meet the demand of still growing BPO industry.
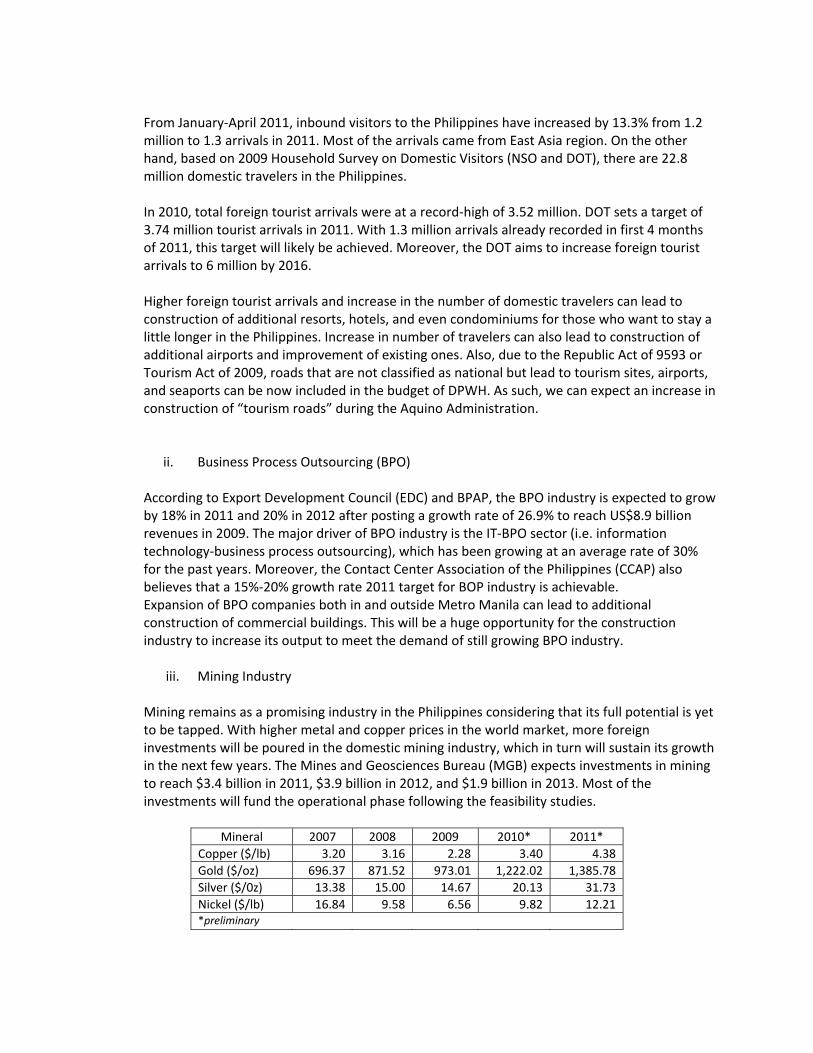
iii. Mining Industry
Mining remains as a promising industry in the Philippines considering that its full potential is yet to be tapped. With higher metal and copper prices in the world market, more foreign investments will be poured in the domestic mining industry, which in turn will sustain its growth in the next few years. The Mines and Geosciences Bureau (MGB) expects investments in mining to reach $3.4 billion in 2011, $3.9 billion in 2012, and $1.9 billion in 2013. Most of the investments will fund the operational phase following the feasibility studies.
Mineral 2007 2008 2009 2010* 2011* Copper ($/lb) 3.20 3.16 2.28 3.40 4.38 Gold ($/oz) 696.37 871.52 973.01 1,222.02 1,385.78 Silver ($/0z) 13.38 15.00 14.67 20.13 31.73 Nickel ($/lb) 16.84 9.58 6.56 9.82 12.21 *preliminary
At the very least, construction industry can build the office sites and barracks for mining companies. As large mining activities are expected to attract more investments, this business opportunity can be also huge in the future for the construction industry.
iv. OFW remittances
The OFW remittances increased by 8.2% and reached a record‐high of $18.8 billion in 2010. The BSP expects another 8% increase in 2011. With an even brighter outlook for overseas deployment, growth rate in remittances can be sustained.
While food and education get the bulk share of their remittances, OFW families also allot a significant share of their money to purchase of housing. Based on the latest BSP Consumer Expectations Survey (CES), from 12.3% in 1st quarter of 2011, percentage of OFW households who used their remittances for purchase of house has increased to 15.2%. As more OFW households consider putting their money for housing, this is also an opportunity for the construction industry to build more residential houses or condominiums.
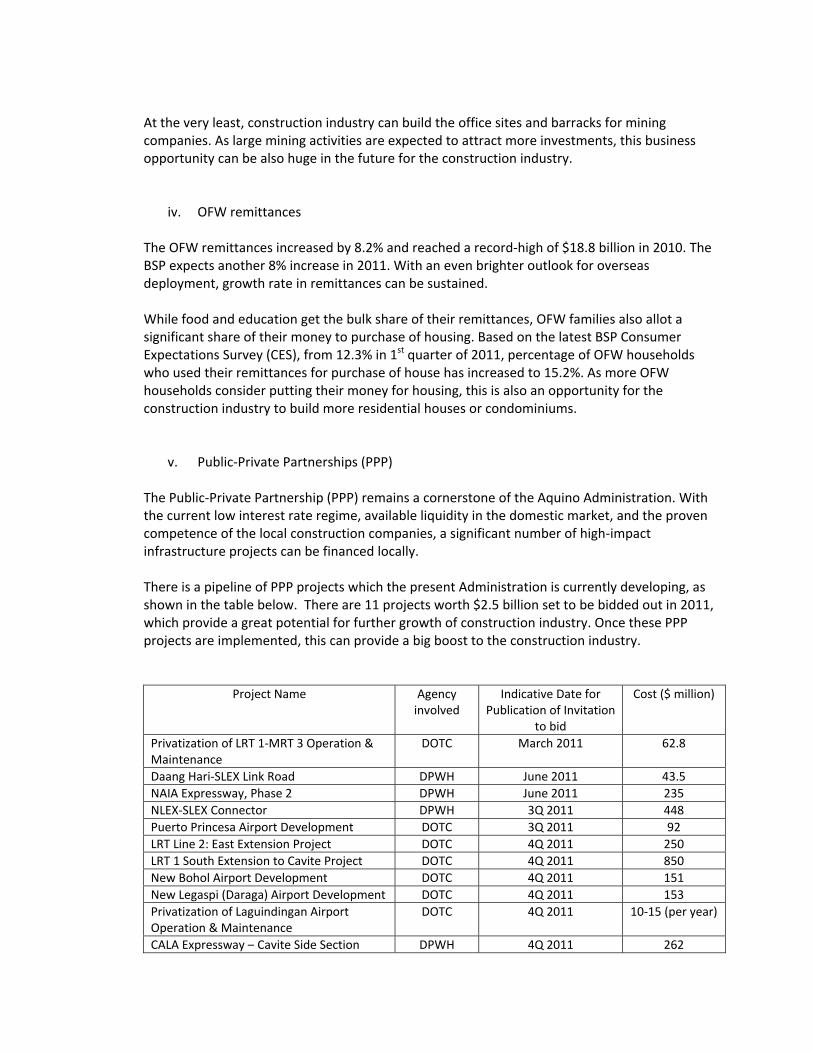
v. Public‐Private Partnerships (PPP) The Public‐Private Partnership (PPP) remains a cornerstone of the Aquino Administration. With the current low interest rate regime, available liquidity in the domestic market, and the proven competence of the local construction companies, a significant number of high‐impact infrastructure projects can be financed locally. There is a pipeline of PPP projects which the present Administration is currently developing, as shown in the table below. There are 11 projects worth $2.5 billion set to be bidded out in 2011, which provide a great potential for further growth of construction industry. Once these PPP projects are implemented, this can provide a big boost to the construction industry.
Project Name Agency involved
Indicative Date for Publication of Invitation
to bid
Cost ($ million)
Privatization of LRT 1‐MRT 3 Operation & Maintenance
DOTC March 2011 62.8
Daang Hari‐SLEX Link Road DPWH June 2011 43.5NAIA Expressway, Phase 2 DPWH June 2011 235NLEX‐SLEX Connector DPWH 3Q 2011 448Puerto Princesa Airport Development DOTC 3Q 2011 92LRT Line 2: East Extension Project DOTC 4Q 2011 250LRT 1 South Extension to Cavite Project DOTC 4Q 2011 850New Bohol Airport Development DOTC 4Q 2011 151New Legaspi (Daraga) Airport Development DOTC 4Q 2011 153Privatization of Laguindingan Airport Operation & Maintenance
DOTC 4Q 2011 10‐15 (per year)
CALA Expressway – Cavite Side Section DPWH 4Q 2011 262
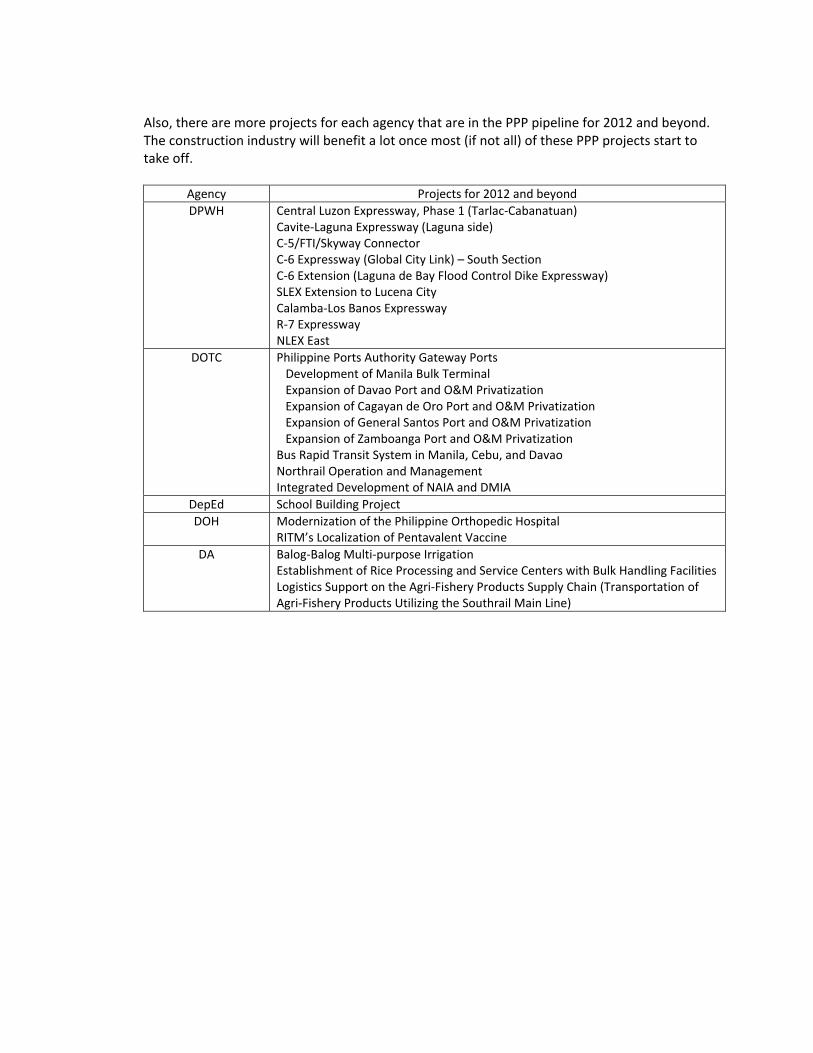
Also, there are more projects for each agency that are in the PPP pipeline for 2012 and beyond. The construction industry will benefit a lot once most (if not all) of these PPP projects start to take off.
Agency Projects for 2012 and beyond DPWH Central Luzon Expressway, Phase 1 (Tarlac‐Cabanatuan)
Cavite‐Laguna Expressway (Laguna side) C‐5/FTI/Skyway Connector C‐6 Expressway (Global City Link) – South Section C‐6 Extension (Laguna de Bay Flood Control Dike Expressway) SLEX Extension to Lucena City Calamba‐Los Banos Expressway R‐7 Expressway NLEX East
DOTC Philippine Ports Authority Gateway Ports Development of Manila Bulk Terminal Expansion of Davao Port and O&M Privatization Expansion of Cagayan de Oro Port and O&M Privatization Expansion of General Santos Port and O&M Privatization Expansion of Zamboanga Port and O&M Privatization Bus Rapid Transit System in Manila, Cebu, and Davao Northrail Operation and Management Integrated Development of NAIA and DMIA
DepEd School Building ProjectDOH Modernization of the Philippine Orthopedic Hospital
RITM’s Localization of Pentavalent Vaccine DA Balog‐Balog Multi‐purpose Irrigation
Establishment of Rice Processing and Service Centers with Bulk Handling Facilities Logistics Support on the Agri‐Fishery Products Supply Chain (Transportation of Agri‐Fishery Products Utilizing the Southrail Main Line)