Country Case. Social Security in Mexico: Brief Revision
40
Noida, India. December 2012 International Training in Managment Development and Social Security Measures Nayeli Salgado ([email protected]) V.V. Giri National Labor Institute NOTE: Responsibility for the information and views set out in this presentation lies entirely with the author.
Transcript of Country Case. Social Security in Mexico: Brief Revision
Noida, India. December 2012
International Training in Managment Developmentand Social Security Measures
Nayeli Salgado([email protected])
V.V. Giri National Labor Institute
NOTE: Responsibility for the information and views set out in this presentation lies entirely with the author.
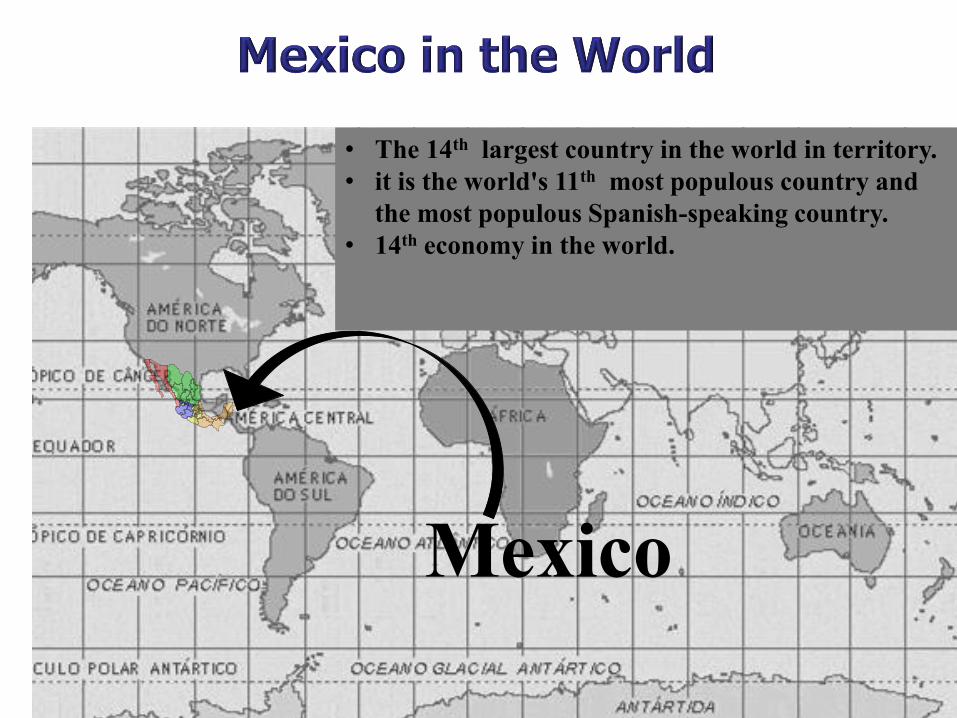
Mexico
• The 14th largest country in the world in territory.
• it is the world's 11th most populous country and
the most populous Spanish-speaking country.
• 14th economy in the world.
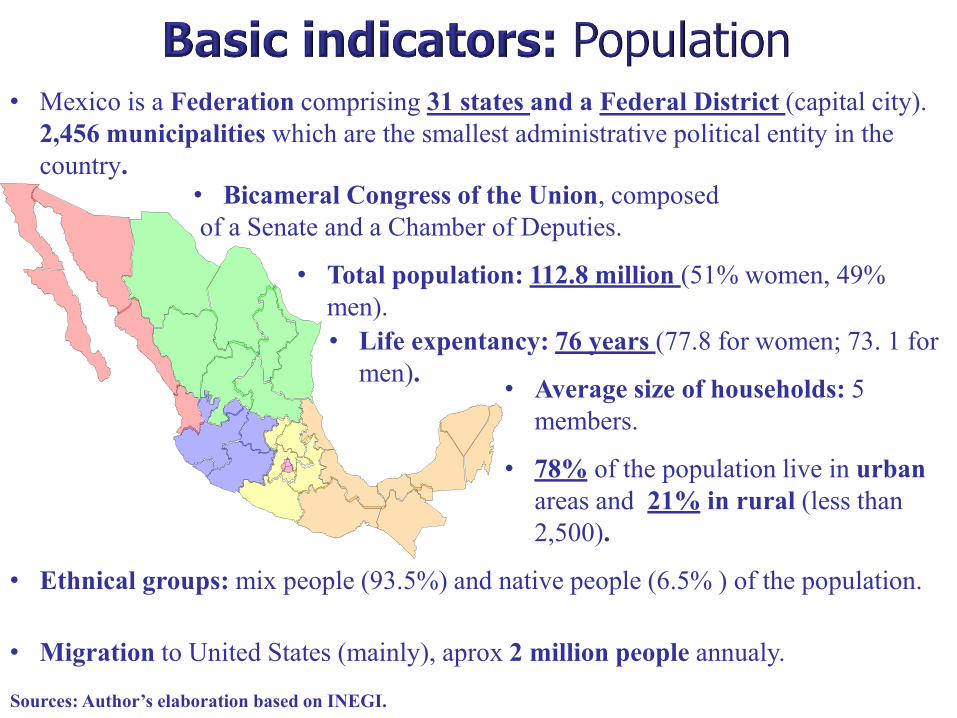
• Mexico is a Federation comprising 31 states and a Federal District (capital city).
2,456 municipalities which are the smallest administrative political entity in the
country.• Bicameral Congress of the Union, composed
of a Senate and a Chamber of Deputies.
• Total population: 112.8 million (51% women, 49%
men).
• Life expentancy: 76 years (77.8 for women; 73. 1 for
men).• Average size of households: 5
members.
• 78% of the population live in urban
areas and 21% in rural (less than
2,500).
• Ethnical groups: mix people (93.5%) and native people (6.5% ) of the population.
• Migration to United States (mainly), aprox 2 million people annualy.
Sources: Author’s elaboration based on INEGI.
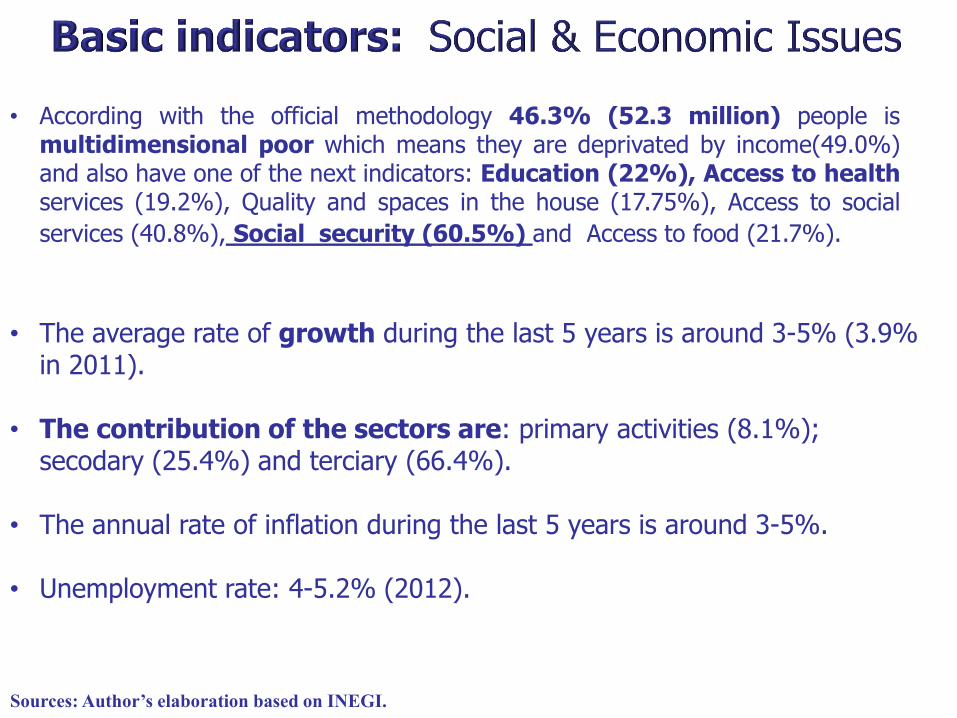
• According with the official methodology 46.3% (52.3 million) people ismultidimensional poor which means they are deprivated by income(49.0%)and also have one of the next indicators: Education (22%), Access to healthservices (19.2%), Quality and spaces in the house (17.75%), Access to social
services (40.8%), Social security (60.5%) and Access to food (21.7%).
• The average rate of growth during the last 5 years is around 3-5% (3.9% in 2011).
• The contribution of the sectors are: primary activities (8.1%); secodary (25.4%) and terciary (66.4%).
• The annual rate of inflation during the last 5 years is around 3-5%.
• Unemployment rate: 4-5.2% (2012).
Sources: Author’s elaboration based on INEGI.
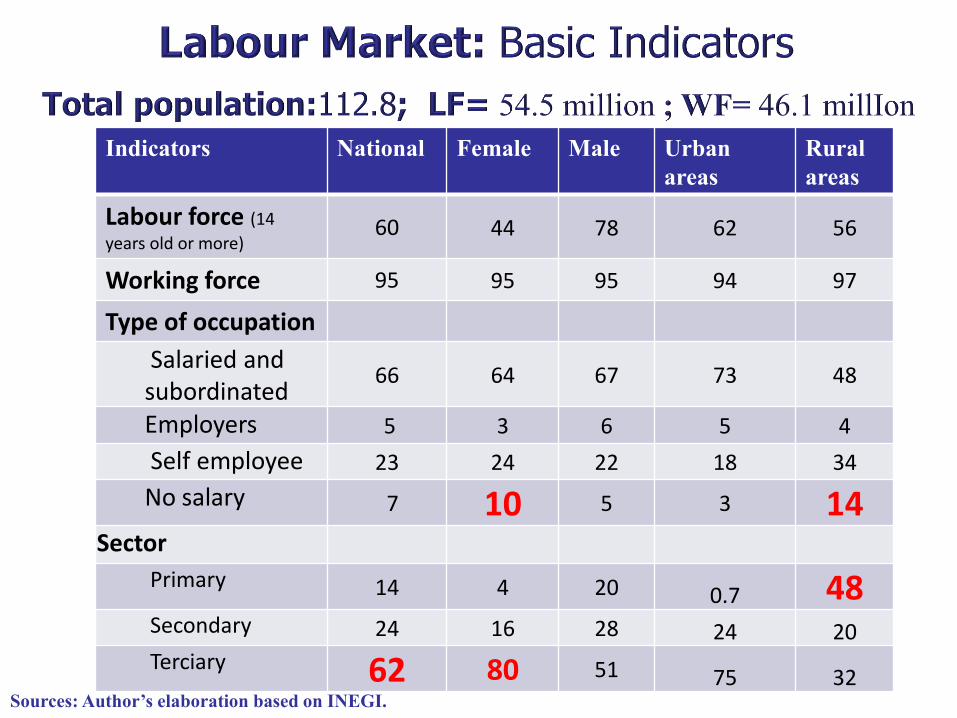
Indicators National Female Male Urban
areas
Rural
areas
Labour force (14
years old or more)60 44 78 62 56
Working force 95 95 95 94 97
Type of occupation
Salaried and subordinated
66 64 67 73 48
Employers 5 3 6 5 4
Self employee 23 24 22 18 34
No salary 7 10 5 3 14Sector
Primary 14 4 20 0.7 48Secondary 24 16 28 24 20Terciary 62 80 51 75 32
Sources: Author’s elaboration based on INEGI.
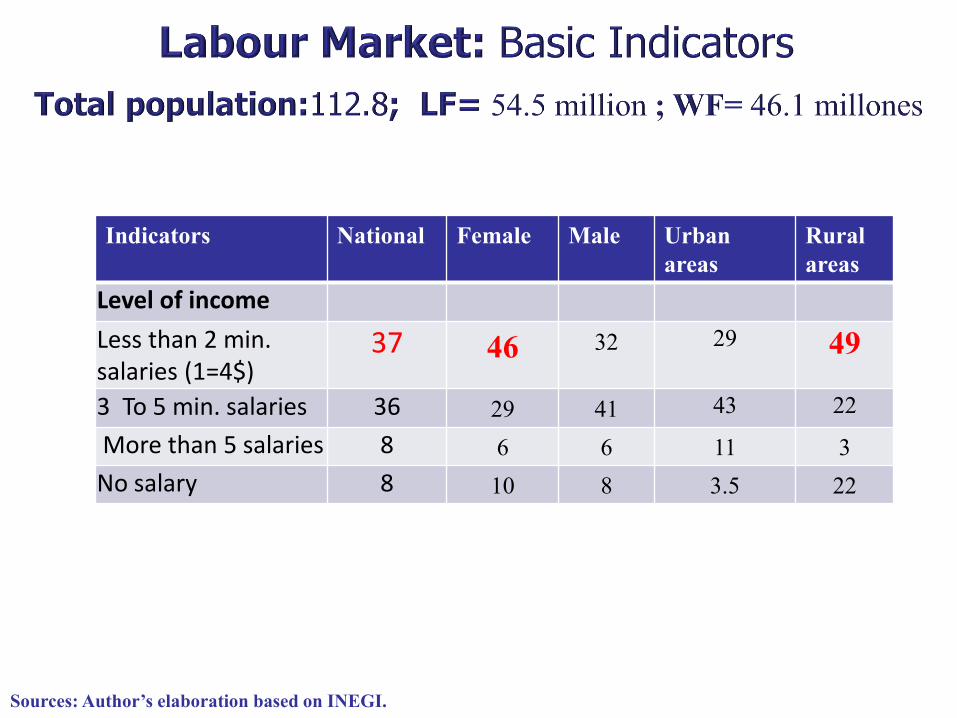
Indicators National Female Male Urban
areas
Rural
areas
Level of income
Less than 2 min.salaries (1=4$)
37 46 32 29 49
3 To 5 min. salaries 36 29 41 43 22
More than 5 salaries 8 6 6 11 3
No salary 8 10 8 3.5 22
Sources: Author’s elaboration based on INEGI.
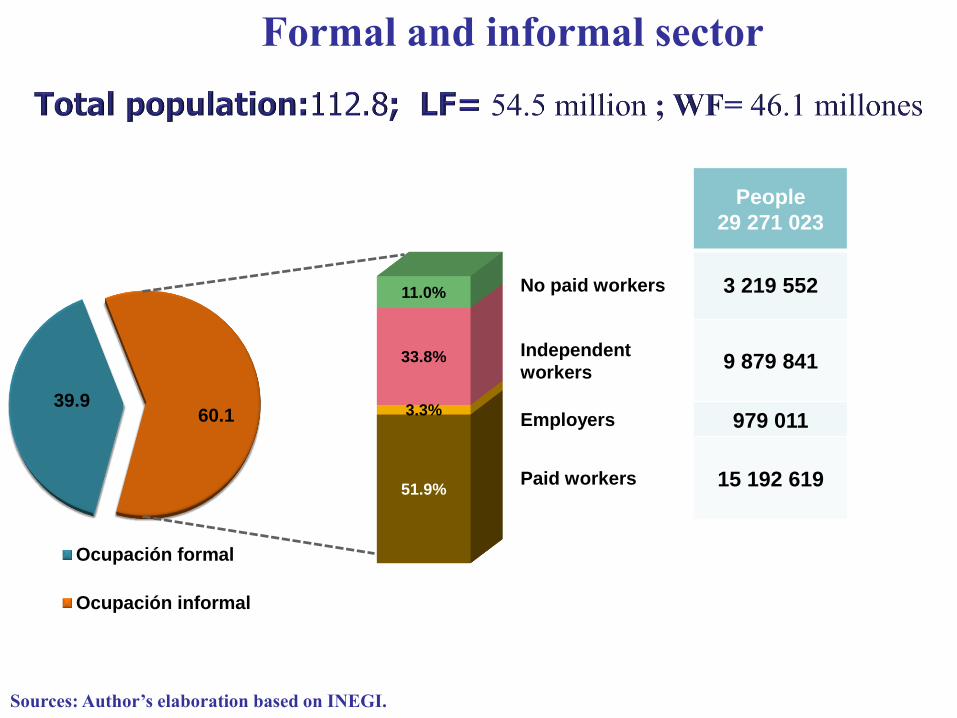
39.960.1
Ocupación formal
Ocupación informal
Formal and informal sector
People
29 271 023
No paid workers 3 219 552
Independent
workers9 879 841
Employers 979 011
Paid workers 15 192 61951.9%
3.3%
33.8%
11.0%
Sources: Author’s elaboration based on INEGI.
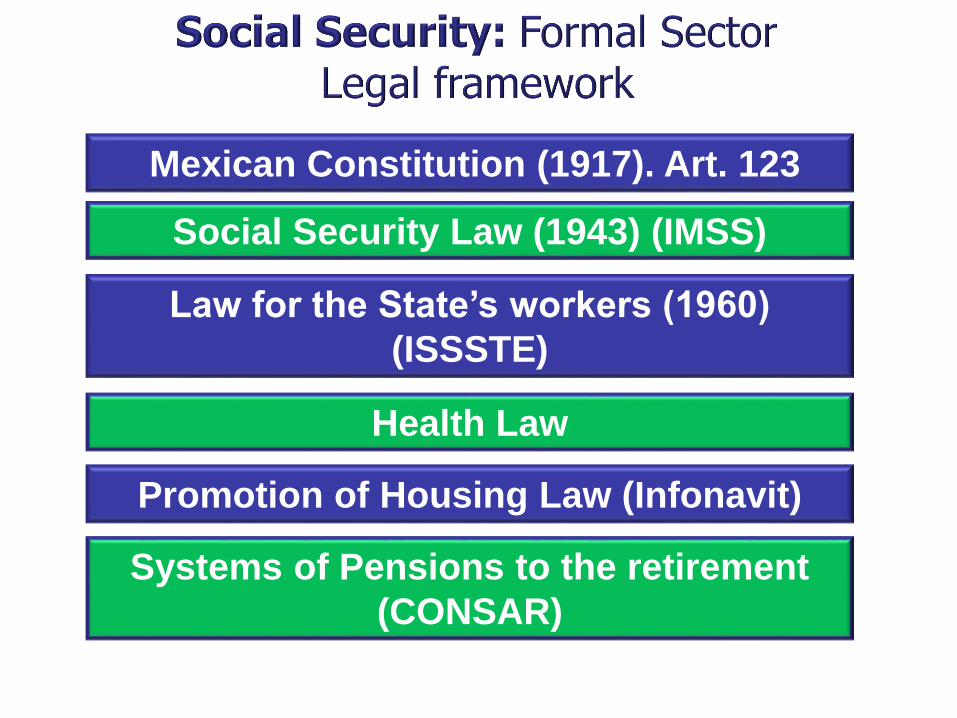
Mexican Constitution (1917). Art. 123
Social Security Law (1943) (IMSS)
Law for the State’s workers (1960)
(ISSSTE)
Health Law
Promotion of Housing Law (Infonavit)
Systems of Pensions to the retirement
(CONSAR)
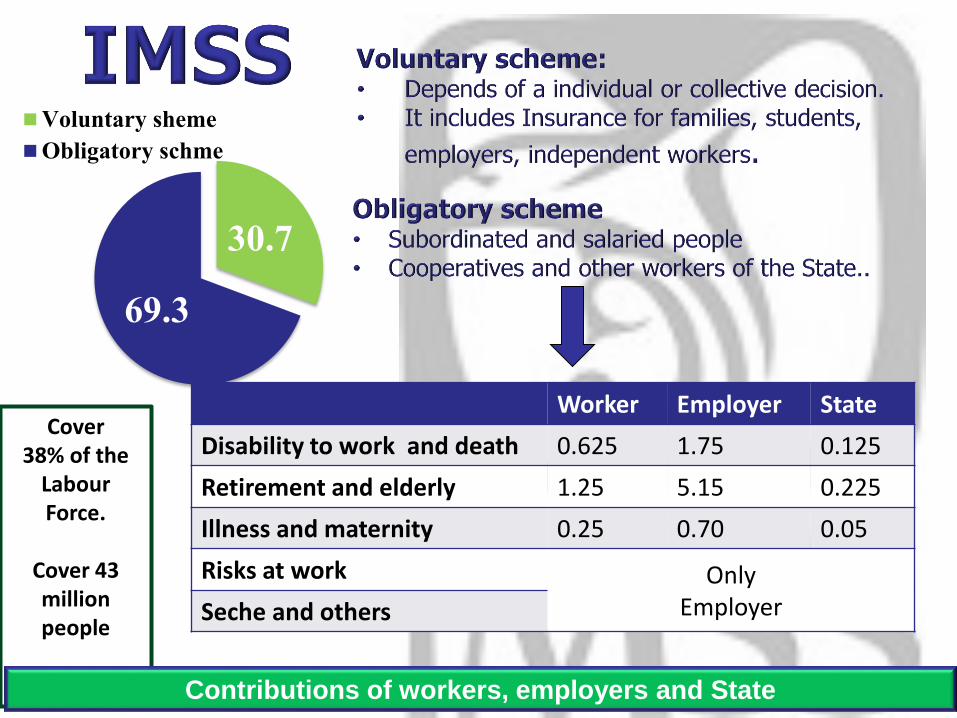
30.7
69.3
Voluntary sheme
Obligatory schme
Worker Employer State
Disability to work and death 0.625 1.75 0.125
Retirement and elderly 1.25 5.15 0.225
Illness and maternity 0.25 0.70 0.05
Risks at work OnlyEmployerSeche and others
Cover 38% of the
LabourForce.
Cover 43 millionpeople
Contributions of workers, employers and State
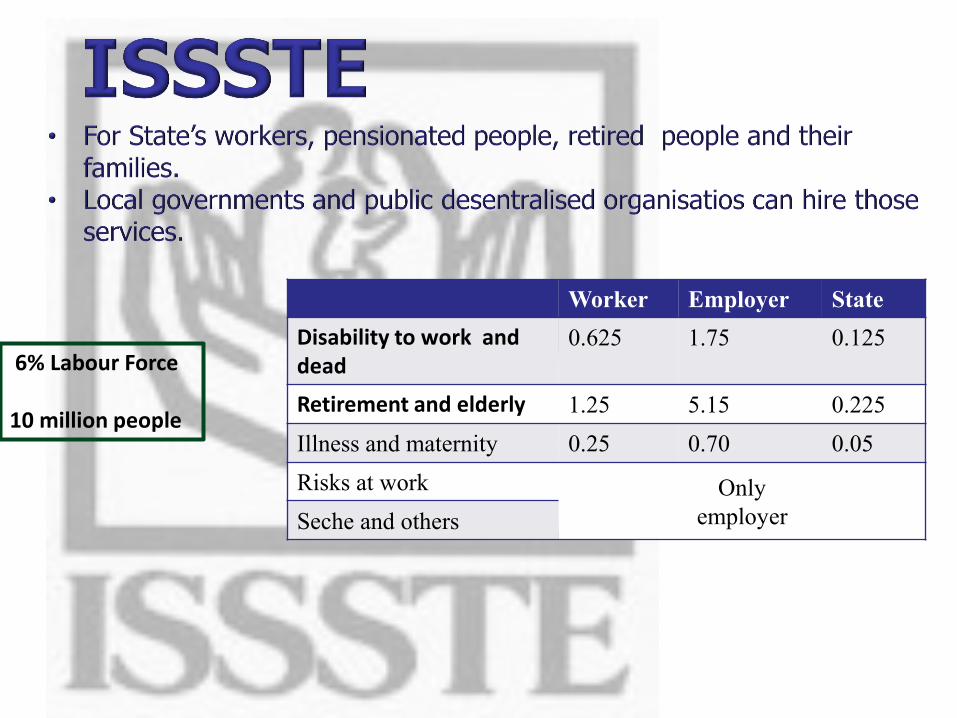
Worker Employer State
Disability to work and dead
0.625 1.75 0.125
Retirement and elderly 1.25 5.15 0.225
Illness and maternity 0.25 0.70 0.05
Risks at work Only
employerSeche and others
6% Labour Force
10 million people
• Marine
• Electricity Company
• Others
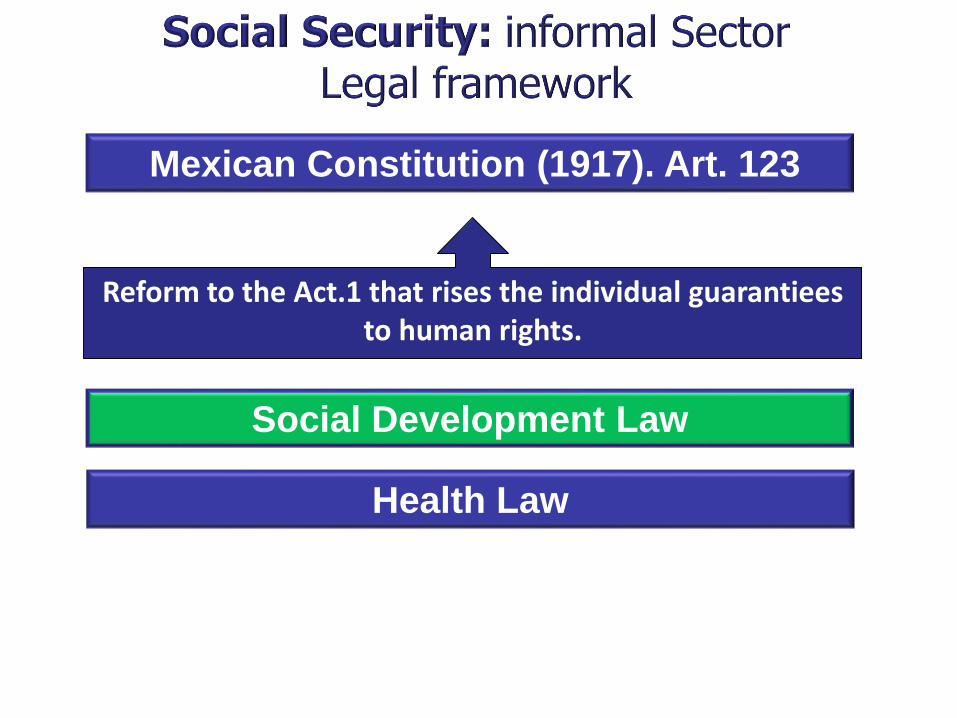
Mexican Constitution (1917). Art. 123
Social Development Law
Health Law
Reform to the Act.1 that rises the individual guarantieesto human rights.

• Implemented in 2003.Covered 48.0 million of the population. It covers284 health interventions, 522 kinds of medicines, laboratory studies, radiodiagnostic. Preventive medicine an curative, emergencies, hospitalisation, especialised services.
• Children below 5 years are covered in all aspects. • Independent workers, self employees, indigenous people, agricultural
workers, and others who don’t have access to IMSS or ISSSTE.
Without services
Social security
Seguro popular
Fuente: elaboración CONEVAL. (2012).
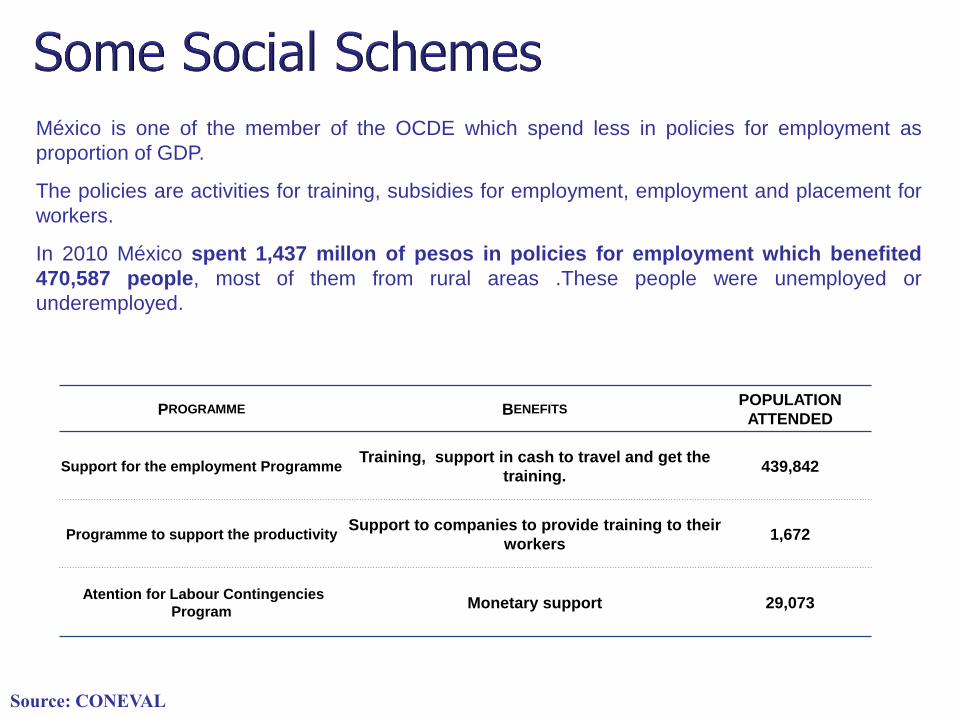
México is one of the member of the OCDE which spend less in policies for employment as
proportion of GDP.
The policies are activities for training, subsidies for employment, employment and placement for
workers.
In 2010 México spent 1,437 millon of pesos in policies for employment which benefited
470,587 people, most of them from rural areas .These people were unemployed or
underemployed.
PROGRAMME BENEFITSPOPULATION
ATTENDED
Support for the employment ProgrammeTraining, support in cash to travel and get the
training. 439,842
Programme to support the productivitySupport to companies to provide training to their
workers1,672
Atention for Labour Contingencies
ProgramMonetary support 29,073
65Source: CONEVAL
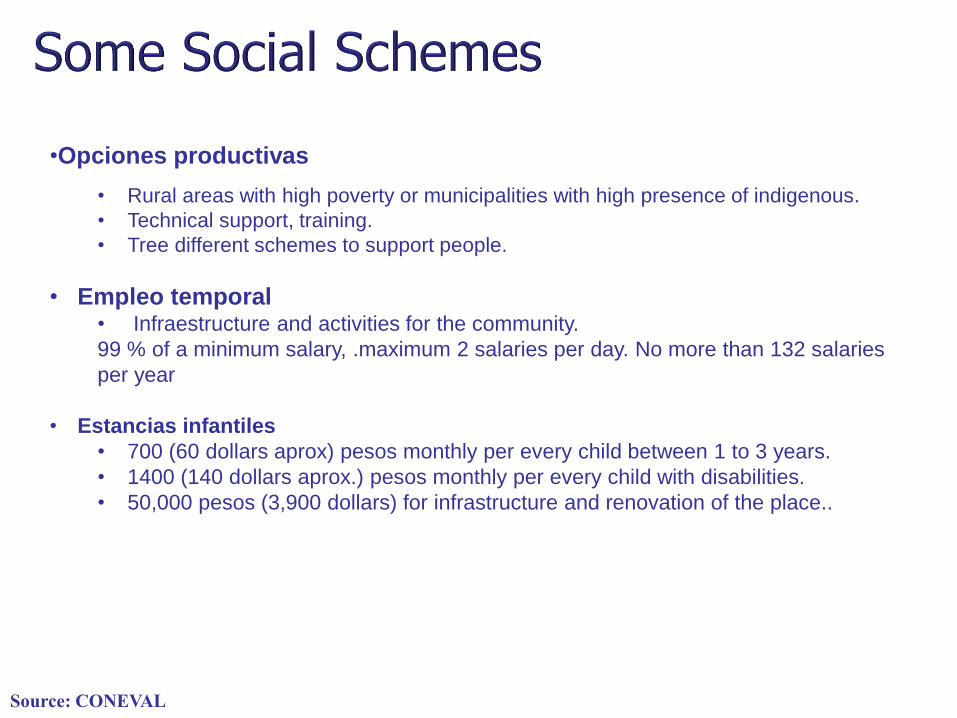
•Opciones productivas
• Rural areas with high poverty or municipalities with high presence of indigenous.
• Technical support, training.
• Tree different schemes to support people.
• Empleo temporal• Infraestructure and activities for the community.
99 % of a minimum salary, .maximum 2 salaries per day. No more than 132 salaries
per year
• Estancias infantiles
• 700 (60 dollars aprox) pesos monthly per every child between 1 to 3 years.
• 1400 (140 dollars aprox.) pesos monthly per every child with disabilities.
• 50,000 pesos (3,900 dollars) for infrastructure and renovation of the place..
Source: CONEVAL

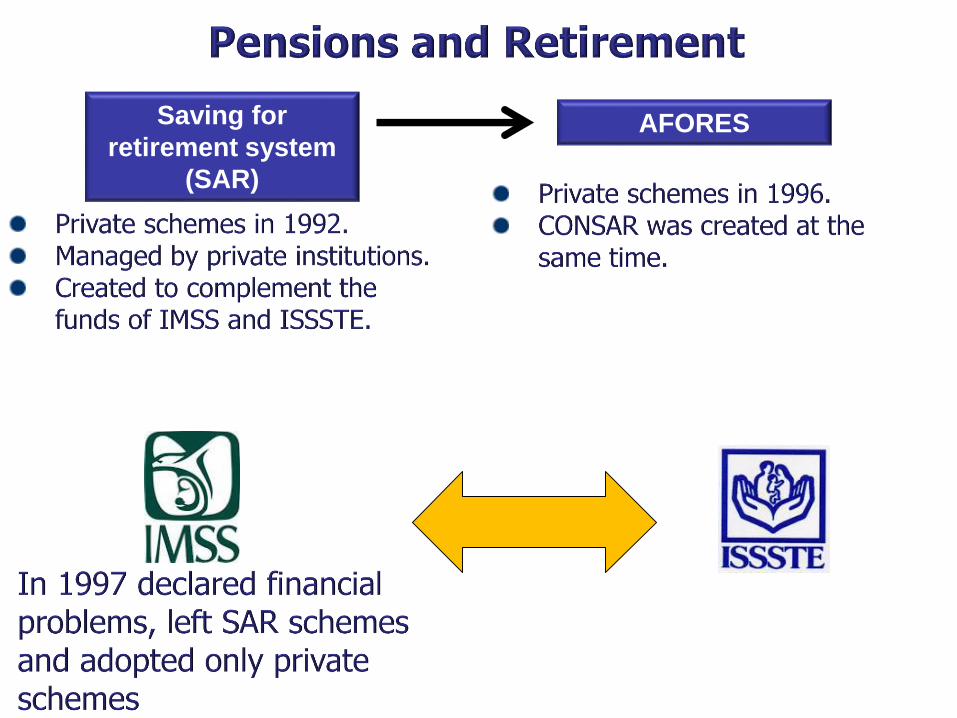
Saving for
retirement system
(SAR)
AFORES
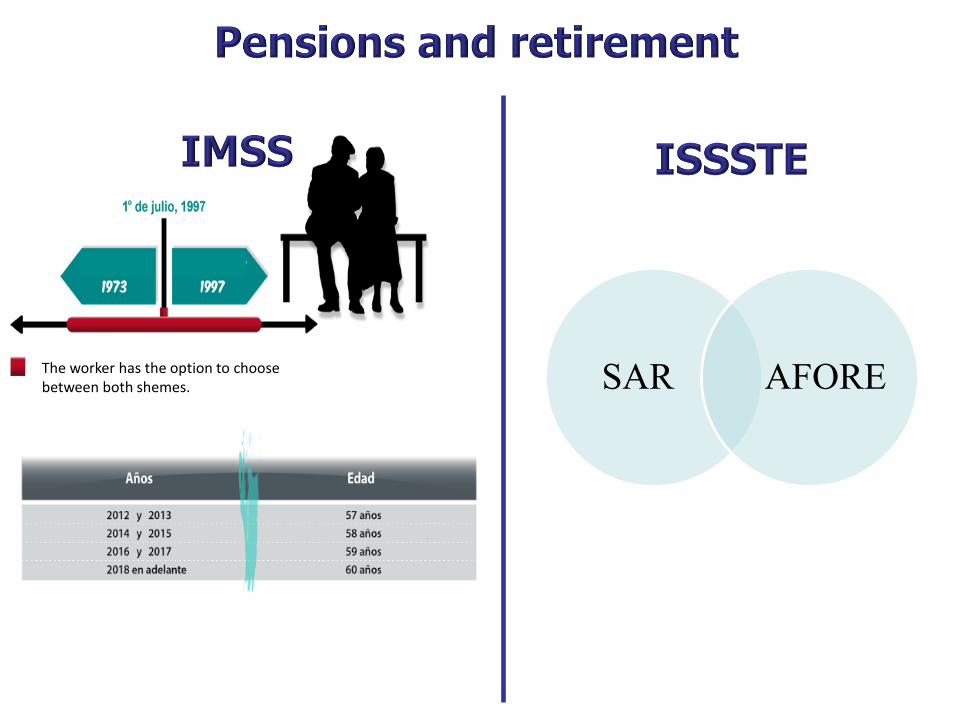
The worker has the option to choosebetween both shemes. SAR AFORE

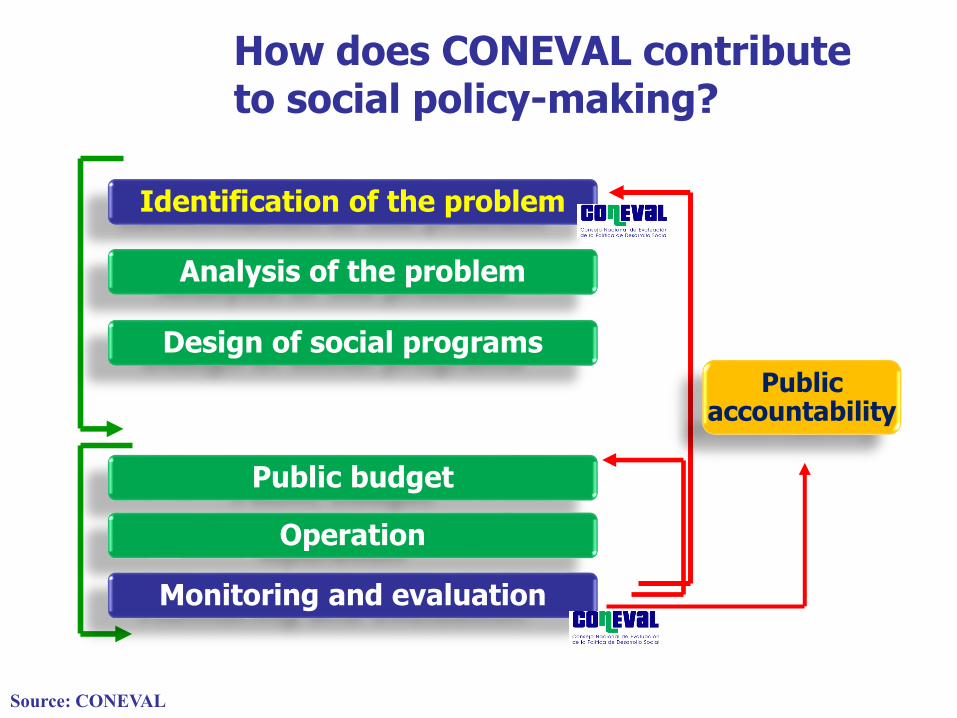
How does CONEVAL contribute to social policy-making?
Identification of the problem
Analysis of the problem
Design of social programs
Public budget
Operation
Monitoring and evaluation
Public accountability
Source: CONEVAL
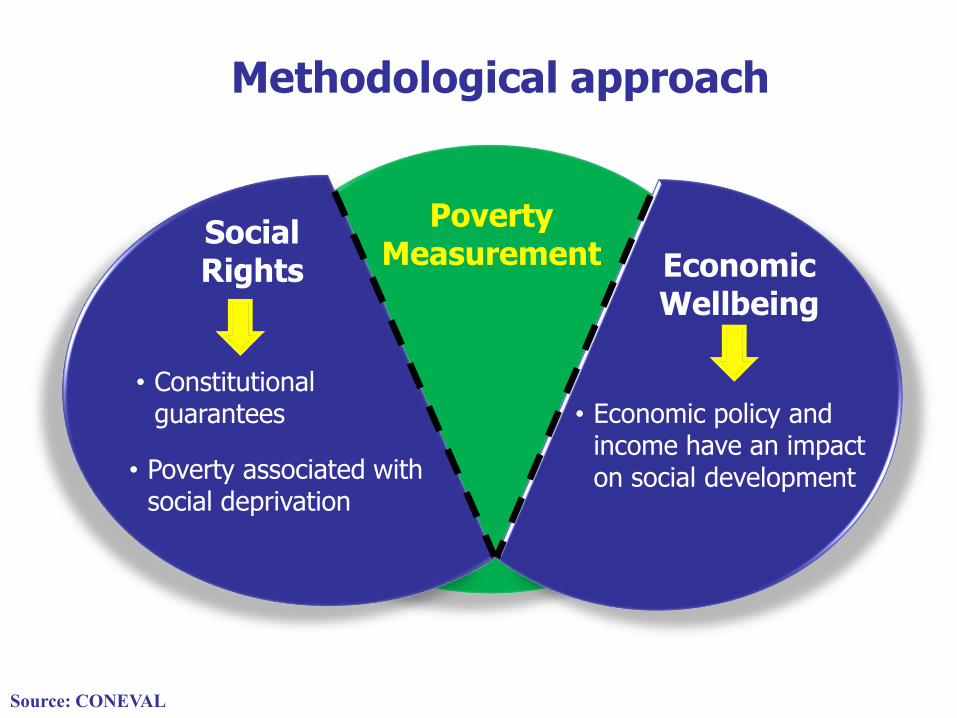
Methodological approach
PovertyMeasurement
Social Rights Economic
Wellbeing
• Constitutional guarantees
• Poverty associated with social deprivation
• Economic policy and income have an impact on social development
Source: CONEVAL
Degree of social cohesion
Territorial
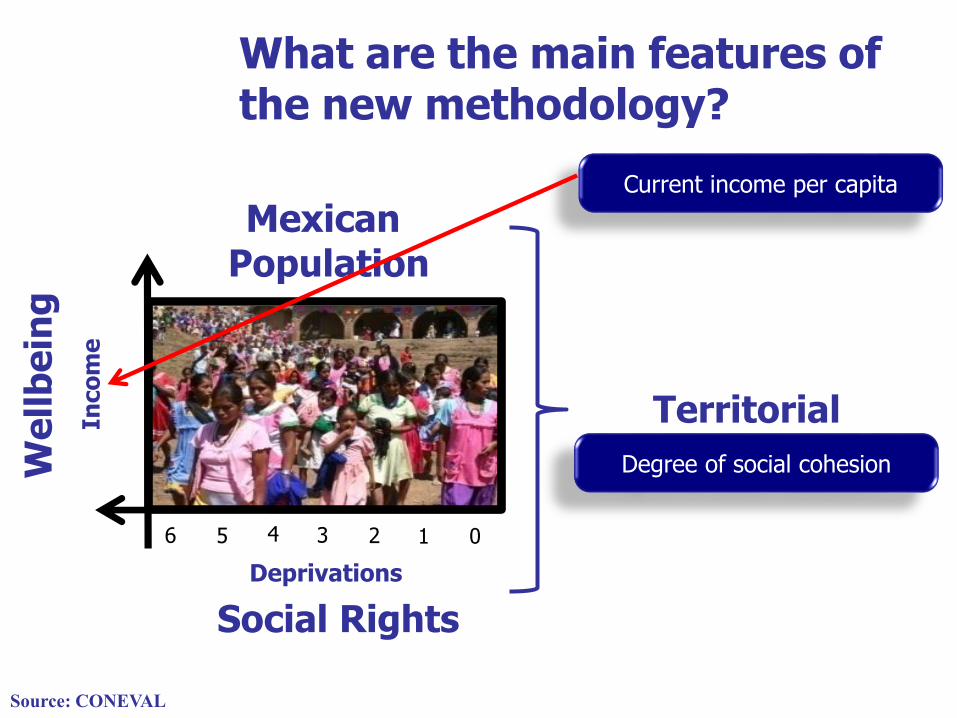
What are the main features of the new methodology?
Social Rights
Deprivations
Mexican Population
We
llb
ein
g
In
co
me
Current income per capita
03 2 1456
Source: CONEVAL
Territorial
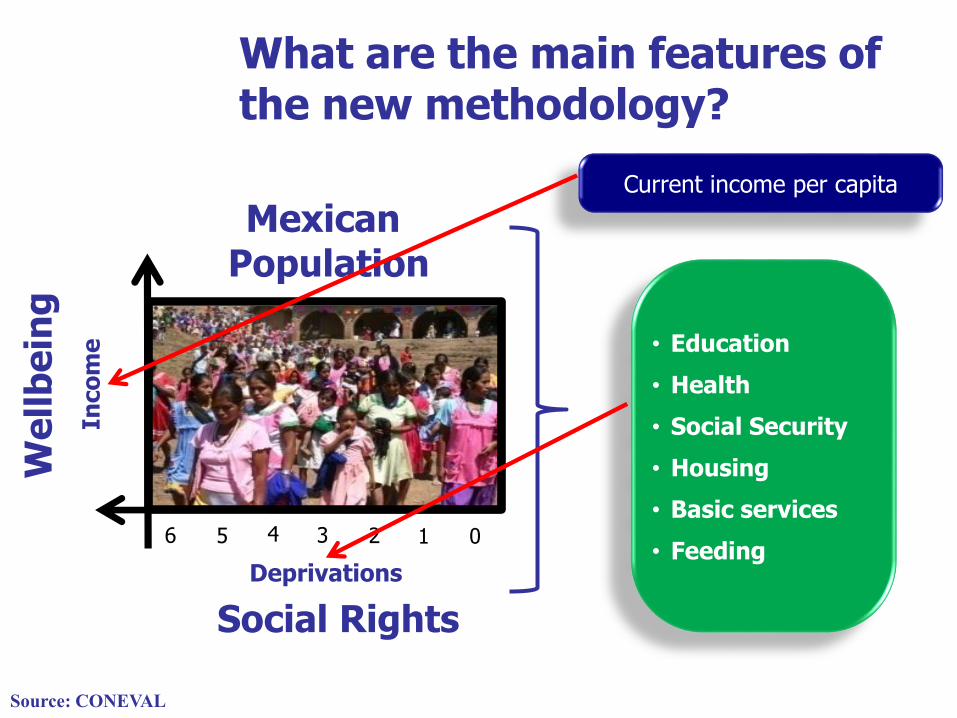
What are the main features of the new methodology?
Social Rights
Deprivations
Mexican Population
We
llb
ein
g
In
co
me
Current income per capita
• Education
• Health
• Social Security
• Housing
• Basic services
• Feeding03 2 1456
Source: CONEVAL
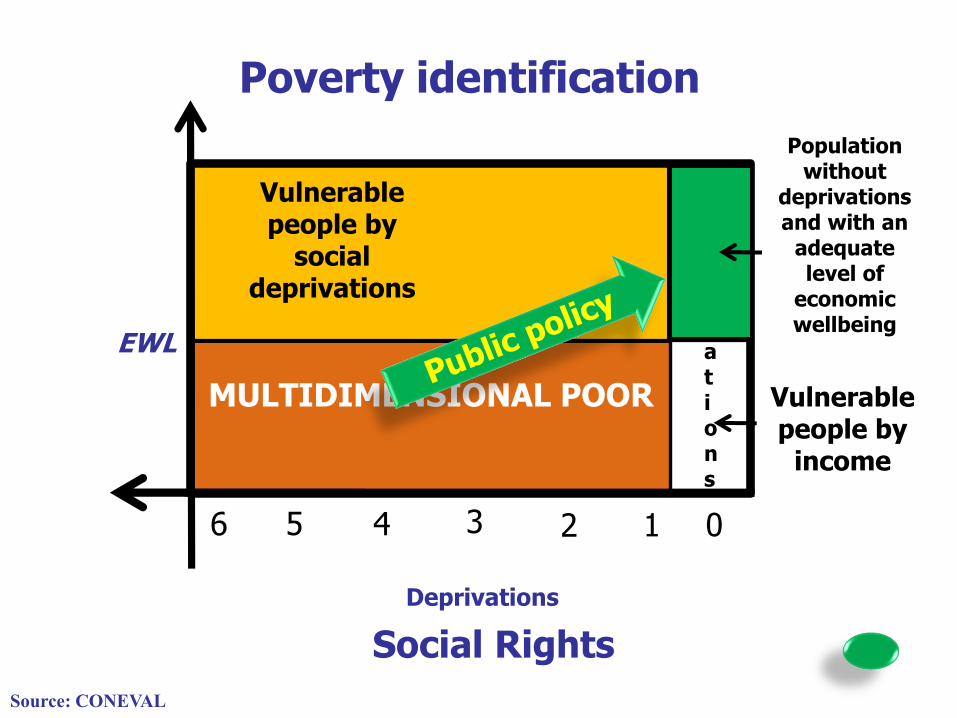
Social Rights
Deprivations
Poverty identification
EWL
WithoutDeprivations
035 24 16
MULTIDIMENSIONAL POOR
Vulnerable people by
social deprivations
Vulnerable people by
income
Population without
deprivations and with an
adequate level of
economic wellbeing
Source: CONEVAL
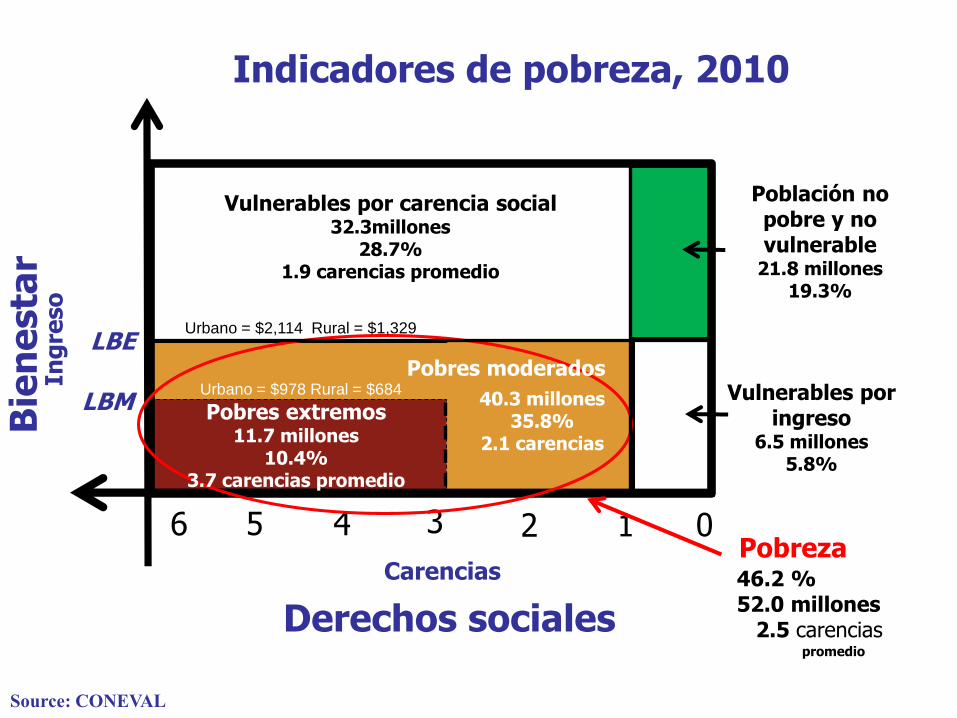
Derechos sociales
Carencias
LBE
03
Vulnerables por carencia social32.3millones
28.7%1.9 carencias promedio
Vulnerables por ingreso
6.5 millones5.8%
5 24 16
Población no pobre y no vulnerable
21.8 millones19.3%
LBM
Bie
ne
sta
rIn
gre
so
Indicadores de pobreza, 2010
40.3 millones35.8%
2.1 carencias
Fuente: estimaciones del CONEVAL con base en el MCS-ENIGH 2008 y 2010
Pobreza46.2 %52.0 millones
2.5 carenciaspromedio
Urbano = $978 Rural = $684
Urbano = $2,114 Rural = $1,329
Pobres moderados
Pobres extremos11.7 millones
10.4%3.7 carencias promedio
Source: CONEVAL
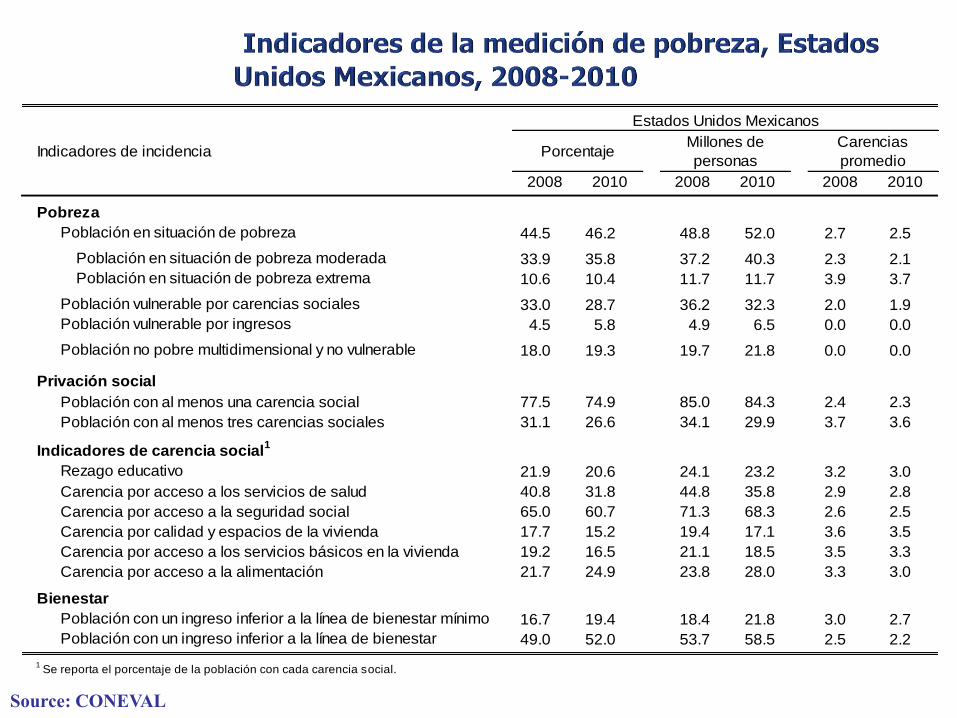
Fuente: estimaciones del CONEVAL con base en el MCS-ENIGH 2008 y 2010
Indicadores de incidencia
2008 2010 2008 2010 2008 2010
Pobreza
Población en situación de pobreza 44.5 46.2 48.8 52.0 2.7 2.5
Población en situación de pobreza moderada 33.9 35.8 37.2 40.3 2.3 2.1
Población en situación de pobreza extrema 10.6 10.4 11.7 11.7 3.9 3.7
Población vulnerable por carencias sociales 33.0 28.7 36.2 32.3 2.0 1.9
Población vulnerable por ingresos 4.5 5.8 4.9 6.5 0.0 0.0
Población no pobre multidimensional y no vulnerable 18.0 19.3 19.7 21.8 0.0 0.0
Privación social
Población con al menos una carencia social 77.5 74.9 85.0 84.3 2.4 2.3
Población con al menos tres carencias sociales 31.1 26.6 34.1 29.9 3.7 3.6
Indicadores de carencia social1
Rezago educativo 21.9 20.6 24.1 23.2 3.2 3.0
Carencia por acceso a los servicios de salud 40.8 31.8 44.8 35.8 2.9 2.8
Carencia por acceso a la seguridad social 65.0 60.7 71.3 68.3 2.6 2.5
Carencia por calidad y espacios de la vivienda 17.7 15.2 19.4 17.1 3.6 3.5
Carencia por acceso a los servicios básicos en la vivienda 19.2 16.5 21.1 18.5 3.5 3.3
Carencia por acceso a la alimentación 21.7 24.9 23.8 28.0 3.3 3.0
Bienestar
Población con un ingreso inferior a la línea de bienestar mínimo 16.7 19.4 18.4 21.8 3.0 2.7
Población con un ingreso inferior a la línea de bienestar 49.0 52.0 53.7 58.5 2.5 2.2
1 Se reporta el porcentaje de la población con cada carencia social.
Estados Unidos Mexicanos
PorcentajeMillones de
personas
Carencias
promedio
31Source: CONEVAL
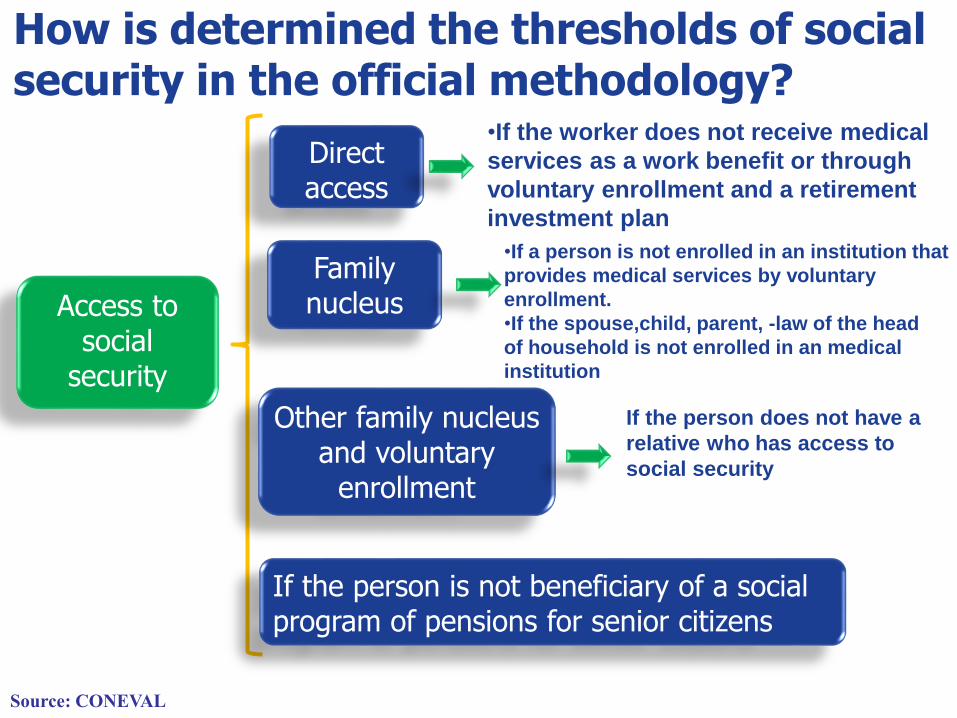
Access tosocial
security
•If the worker does not receive medical
services as a work benefit or through
voluntary enrollment and a retirement
investment plan
Directaccess
Familynucleus
Other family nucleusand voluntary
enrollment
•If a person is not enrolled in an institution that
provides medical services by voluntary
enrollment.
•If the spouse,child, parent, -law of the head
of household is not enrolled in an medical
institution
If the person does not have a
relative who has access to
social security
If the person is not beneficiary of a social program of pensions for senior citizens
How is determined the thresholds of social security in the official methodology?
Source: CONEVAL
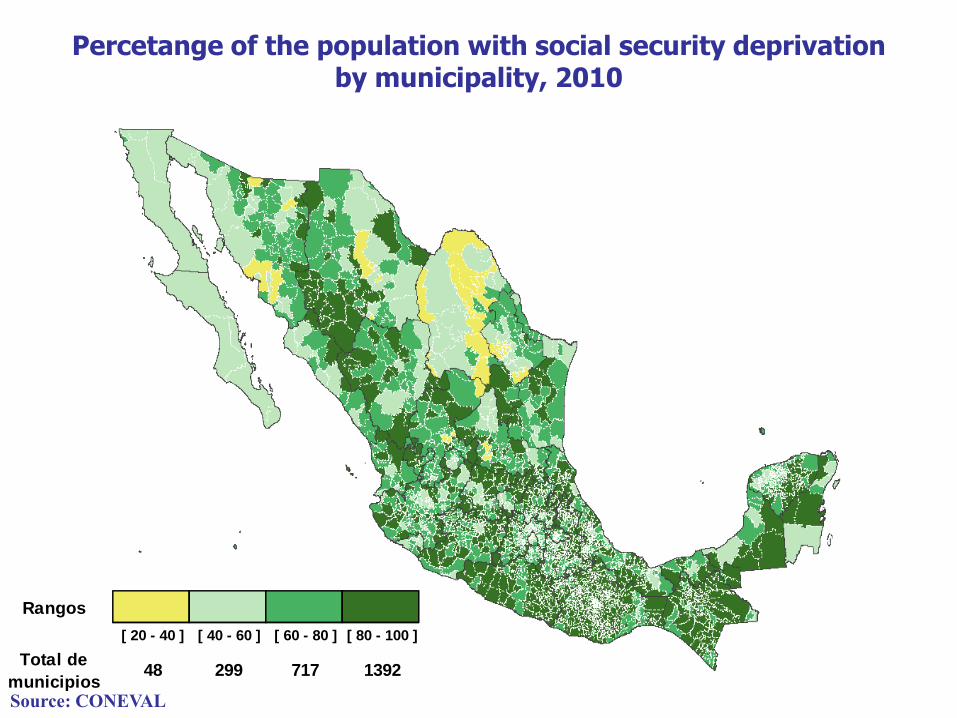
Fuente: estimaciones del CONEVAL con base en el MCS-ENIGH 2010 y la muestra del Censo de Población y Vivienda 2010.
Percetange of the population with social security deprivationby municipality, 2010
Rangos
[ 20 - 40 ] [ 40 - 60 ] [ 60 - 80 ] [ 80 - 100 ]
Total de
municipios48 299 717 1392
Source: CONEVAL
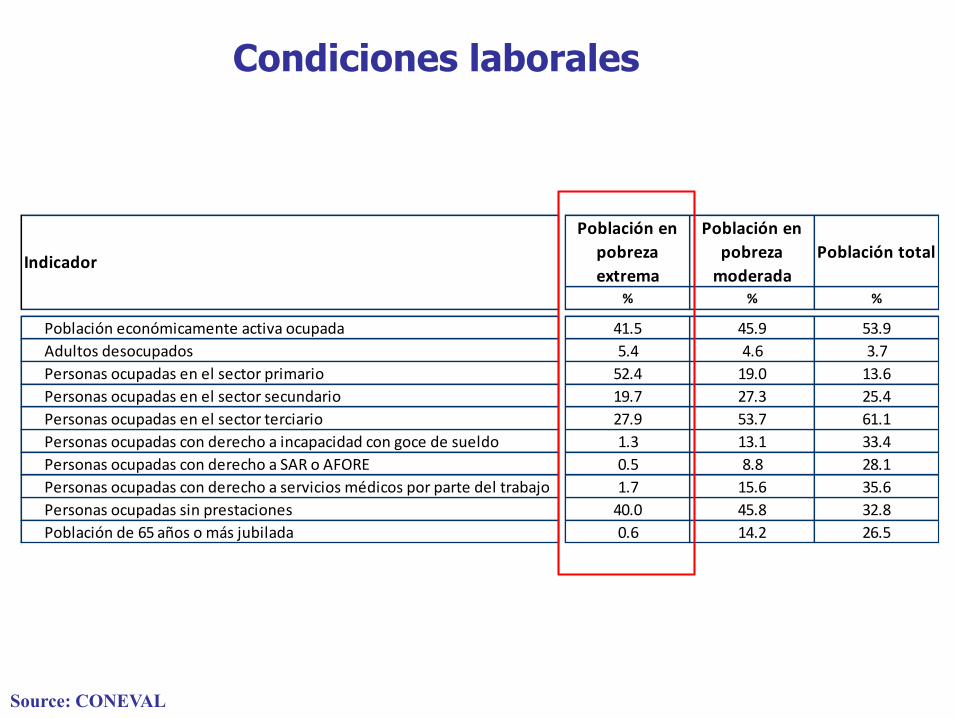
Condiciones laborales
Población en
pobreza
extrema
Población en
pobreza
moderada
Población total
% % %
Población económicamente activa ocupada 41.5 45.9 53.9
Adultos desocupados 5.4 4.6 3.7
Personas ocupadas en el sector primario 52.4 19.0 13.6
Personas ocupadas en el sector secundario 19.7 27.3 25.4
Personas ocupadas en el sector terciario 27.9 53.7 61.1
Personas ocupadas con derecho a incapacidad con goce de sueldo 1.3 13.1 33.4
Personas ocupadas con derecho a SAR o AFORE 0.5 8.8 28.1
Personas ocupadas con derecho a servicios médicos por parte del trabajo 1.7 15.6 35.6
Personas ocupadas sin prestaciones 40.0 45.8 32.8
Población de 65 años o más jubilada 0.6 14.2 26.5
Indicador
Fuente: estimaciones del CONEVAL con base en el MCS-ENIGH 2010 34Source: CONEVAL
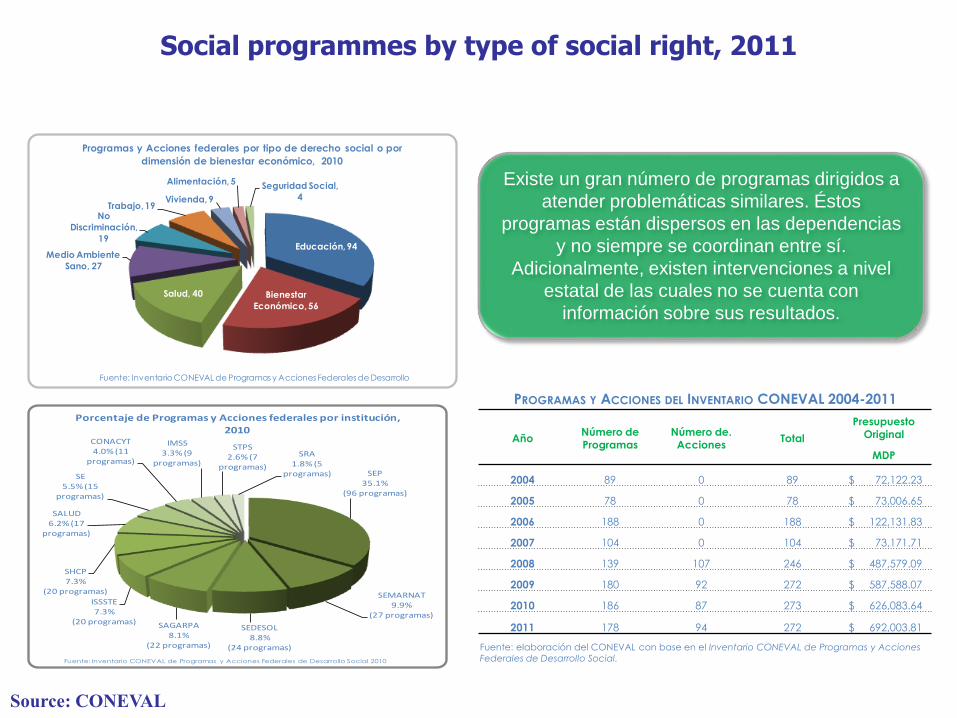
Fuente: Inventario CONEVAL de Programas y Acciones Federales de Desarrollo Social, 2010.
Existe un gran número de programas dirigidos a
atender problemáticas similares. Éstos
programas están dispersos en las dependencias
y no siempre se coordinan entre sí.
Adicionalmente, existen intervenciones a nivel
estatal de las cuales no se cuenta con
información sobre sus resultados.
PROGRAMAS Y ACCIONES DEL INVENTARIO CONEVAL 2004-2011
AñoNúmero de Programas
Número de. Acciones
Total
Presupuesto Original
MDP
2004 89 0 89 $ 72,122.23
2005 78 0 78 $ 73,006.65
2006 188 0 188 $ 122,131.83
2007 104 0 104 $ 73,171.71
2008 139 107 246 $ 487,579.09
2009 180 92 272 $ 587,588.07
2010 186 87 273 $ 626,083.64
2011 178 94 272 $ 692,003.81
Fuente: elaboración del CONEVAL con base en el Inventario CONEVAL de Programas y Acciones
Federales de Desarrollo Social.
94
Educación, 94
Bienestar
Económico, 56
Salud, 40
Medio Ambiente
Sano, 27
No
Discriminación,
19
Trabajo, 19Vivienda, 9
Alimentación, 5 Seguridad Social,
4
Programas y Acciones federales por tipo de derecho social o por
dimensión de bienestar económico, 2010
Fuente: Inventario CONEVAL de Programas y Acciones Federales de Desarrollo
SEP35.1%
(96 programas)
SEMARNAT9.9%
(27 programas)
SEDESOL8.8%
(24 programas)
SAGARPA8.1%
(22 programas)
ISSSTE7.3%
(20 programas)
SHCP7.3%
(20 programas)
SALUD6.2% (17
programas)
SE5.5% (15
programas)
CONACYT4.0% (11
programas)
IMSS3.3% (9
programas)
STPS2.6% (7
programas)
SRA1.8% (5
programas)
Porcentaje de Programas y Acciones federales por institución, 2010
Fuente: Inventario CONEVAL de Programas y Acciones Federales de Desarrollo Social 2010
Social programmes by type of social right, 2011
Source: CONEVAL
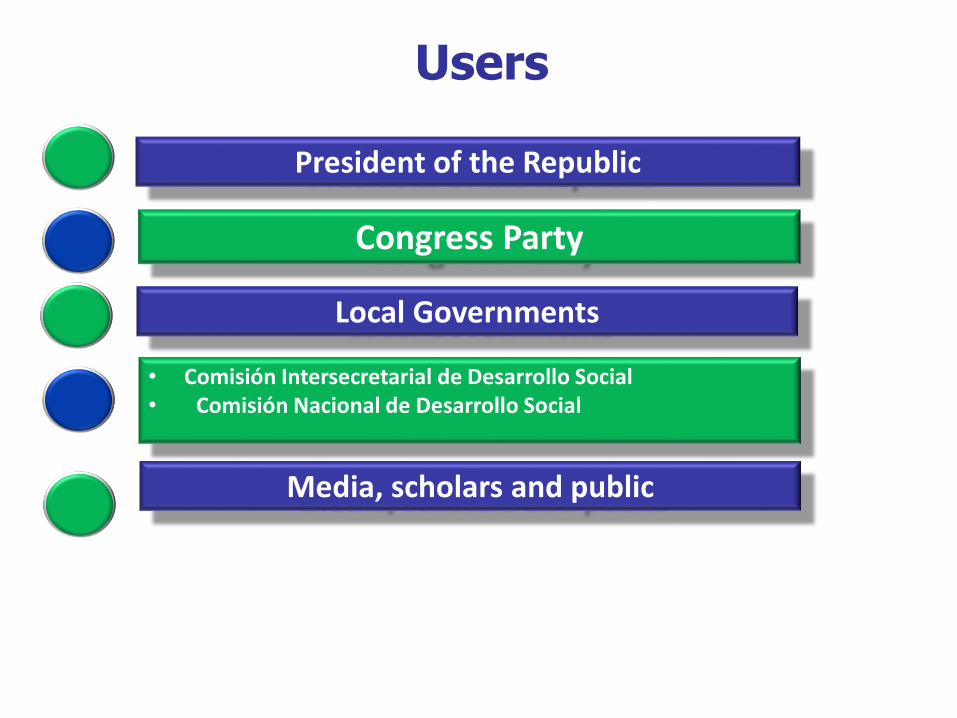
Users
President of the Republic
Congress Party
Local Governments
• Comisión Intersecretarial de Desarrollo Social• Comisión Nacional de Desarrollo Social
Media, scholars and public
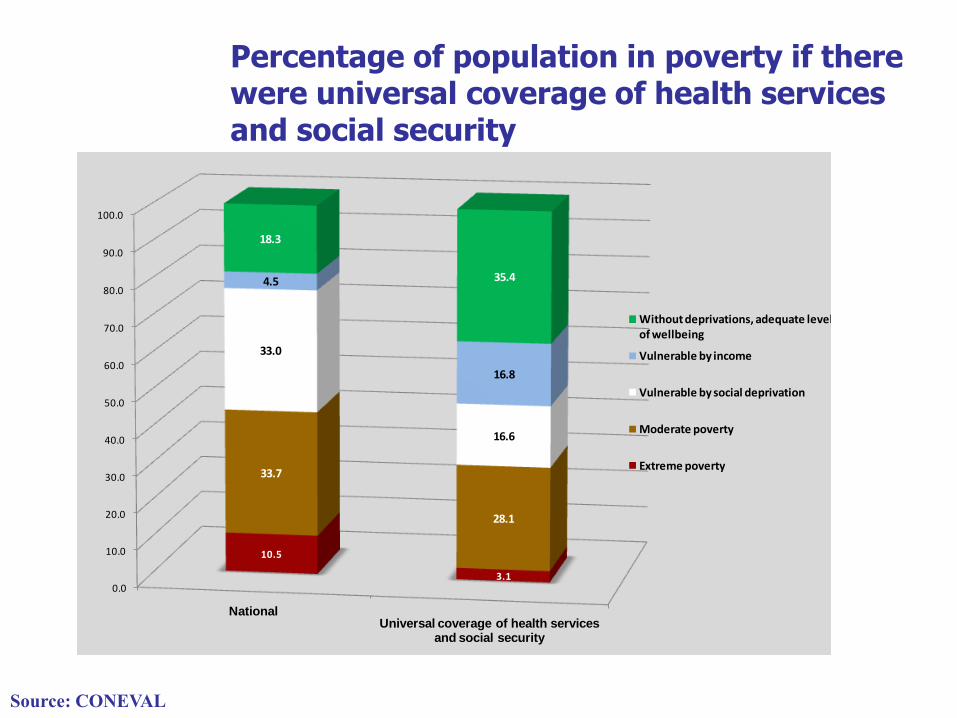
Percentage of population in poverty if there were universal coverage of health services and social security
0.0
10.0
20.0
30.0
40.0
50.0
60.0
70.0
80.0
90.0
100.0
NationalUniversal coverage of health services
and social security
10.5
3.1
33.7
28.1
33.0
16.6
4.5
16.8
18.3
35.4
Without deprivations, adequate level of wellbeing
Vulnerable by income
Vulnerable by social deprivation
Moderate poverty
Extreme poverty
Source: estimates of the CONEVAL based on the MCS-ENIGH 2008. Source: CONEVAL
Now weare goingto cut yourpension
Source: Internet