Costs of a Community Pharmacist-Led Medicines Management Service for Patients with Coronary Heart...
16
Pharmacoeconomics 2007; 25 (5): 397-411 ORIGINAL RESEARCH ARTICLE 1170-7690/07/0005-0397/$44.95/0 © 2007 Adis Data Information BV. All rights reserved. Costs of a Community Pharmacist-Led Medicines Management Service for Patients with Coronary Heart Disease in England Healthcare System and Patient Perspectives Anthony Scott, 1,2 Michela Tinelli, 1,3 Christine Bond 3 on behalf of the Community Pharmacy Medicines Management Evaluation Team 1 Health Economics Research Unit, University of Aberdeen, Aberdeen, Scotland 2 Melbourne Institute of Applied Economic and Social Research, University of Melbourne, Melbourne, Victoria, Australia 3 Department of General Practice and Primary Care, University of Aberdeen, Aberdeen, Scotland Background: Coronary heart disease (CHD) is the most common cause of death Abstract in the UK. CHD cost the UK National Health Service (NHS) £3.5 billion in 2003. The economic impact of community pharmacists providing a medicines manage- ment service for patients with CHD has not been rigorously evaluated; the full economic costs of such interventions are rarely presented in the literature. Objective: To examine the incremental costs of a 1-year community pharmacist- led medicines management service for patients with CHD in the UK, from a healthcare system and patient perspective. Methods and participants: A cost-minimisation analysis was conducted along- side a multicentre randomised controlled trial. The primary study participants were patients with CHD identified from general practice computer records. Patients (intervention, n = 980; control, n = 500) from 38 general practices in nine geographical areas in the UK were included in the study. Intervention and outcomes measures: The intervention consisted of a review of pharmaceuticals and lifestyle advice by pharmacists in their premises, with recommendations communicated to the patient’s GP. The main outcome measure was the incremental cost per patient in the intervention group compared with the control group. Annual costs (£, 2003/4 values) included the costs of the interven- tion (training and delivery costs), the usual costs of NHS treatment (costs of pharmaceuticals, GP and hospital visits) and costs borne by patients. Data were collected in the 12 months before and 12 months after the intervention.
Transcript of Costs of a Community Pharmacist-Led Medicines Management Service for Patients with Coronary Heart...

Pharmacoeconomics 2007; 25 (5): 397-411ORIGINAL RESEARCH ARTICLE 1170-7690/07/0005-0397/$44.95/0
© 2007 Adis Data Information BV. All rights reserved.
Costs of a Community Pharmacist-LedMedicines Management Service forPatients with Coronary Heart Diseasein EnglandHealthcare System and Patient Perspectives
Anthony Scott,1,2 Michela Tinelli,1,3 Christine Bond3 on behalf of the CommunityPharmacy Medicines Management Evaluation Team
1 Health Economics Research Unit, University of Aberdeen, Aberdeen, Scotland2 Melbourne Institute of Applied Economic and Social Research, University of Melbourne,
Melbourne, Victoria, Australia3 Department of General Practice and Primary Care, University of Aberdeen,
Aberdeen, Scotland
Background: Coronary heart disease (CHD) is the most common cause of deathAbstractin the UK. CHD cost the UK National Health Service (NHS) £3.5 billion in 2003.The economic impact of community pharmacists providing a medicines manage-ment service for patients with CHD has not been rigorously evaluated; the fulleconomic costs of such interventions are rarely presented in the literature.Objective: To examine the incremental costs of a 1-year community pharmacist-led medicines management service for patients with CHD in the UK, from ahealthcare system and patient perspective.Methods and participants: A cost-minimisation analysis was conducted along-side a multicentre randomised controlled trial. The primary study participantswere patients with CHD identified from general practice computer records.Patients (intervention, n = 980; control, n = 500) from 38 general practices in ninegeographical areas in the UK were included in the study.Intervention and outcomes measures: The intervention consisted of a review ofpharmaceuticals and lifestyle advice by pharmacists in their premises, withrecommendations communicated to the patient’s GP. The main outcome measurewas the incremental cost per patient in the intervention group compared with thecontrol group. Annual costs (£, 2003/4 values) included the costs of the interven-tion (training and delivery costs), the usual costs of NHS treatment (costs ofpharmaceuticals, GP and hospital visits) and costs borne by patients. Data werecollected in the 12 months before and 12 months after the intervention.

398 Scott et al.
Results: The total NHS cost increased between baseline and follow-up in bothgroups (from £1243 to £1286 [3%] in the control group and from £1410 to £1433[2%] in the intervention group).The greater cost in the intervention group largelyreflects the additional cost of the pharmacist training and the time taken to deliverthe intervention; the difference in costs between the intervention and controlgroups, after controlling for differences in costs at baseline at follow-up, wasstatistically significant (p = 0.001). The costs of pharmaceuticals was higher in theintervention group (£769.20 vs £742.3; p = 0.04).
According to the sensitivity analysis, the intervention cost would need todecrease by 35% to achieve equivalence between costs in each arm of the trial.Difference to costs of patients and their carers at follow-up were not statisticallysignificant.
Conclusions: The introduction of a 1-year pharmacist-led medicines managementservice is likely to increase the total cost of CHD treatment and prevention fromthe healthcare perspective, as the cost of the intervention outweighed the observedreduction in the cost of drugs in the intervention group. No changes in costs fromthe patient perspective were found.
Coronary heart disease (CHD) is the most com- recognised as a way to help optimise prescribing.mon cause of death in the UK. Although CHD This strategy could potentially support the imple-mortality rates have halved in most industrialised mentation of the NSF and assist in the attainment ofcountries since the 1970s, the mortality rate has national targets to reduce CHD morbidity and mor-decreased to a relatively lesser extent in the UK.[1] tality. In the UK, the national contract for communi-Furthermore, according to health surveys conducted ty pharmacists in England and Scotland includesin England in 1994 and 2003, the overall prevalence payments for medicines management services.[4]
of CHD morbidity continues to increase; the rate However, the cost effectiveness of these activitiesincreased from 6.0% to 7.4% in men and from 4.1% has not been rigorously evaluated.[5]
to 4.5% in women.[2] The aim of this study was to measure and valuethe difference in costs between a control group andCHD has major economic consequences in termsan intervention group who received a communityof both direct and indirect costs. In the UK, the totalpharmacist-led medicines management service forestimated CHD cost for the healthcare system inCHD, from both the NHS and patient perspectives.2003 was £3.5 billion, with 19% of this cost attribu-
table to primary care and prescribing.[2] This repre-Methodssented only 45% of the total societal cost of £7.9
billion, which included estimated productivitylosses and the cost of informal care.[2]
Study Design and InterventionTo deal with this problem, the CHD National
Service Framework (NSF) and the UK NHS Plan We conducted a cost-minimisation analysishave set national standards for both the prevention alongside The Community Pharmacy Medicinesand the treatment of CHD.[3] Medicines manage- Management Project, a large multicentre randomis-ment by community pharmacists has been ed controlled trial that evaluated the introduction of
© 2007 Adis Data Information BV. All rights reserved. Pharmacoeconomics 2007; 25 (5)

Costs of Pharmacist-Led Medicines Management Service 399
a community pharmacist-led medicines manage- The cost-minimisation analysis included an as-ment service for patients with CHD;[6] details on sessment of resource utilisation costs in the yearoverall costs of the interventions are also provided. before the intervention (baseline) and during the
year of the intervention (follow-up), for patients inIn the context of this study, ‘medicines manage-both the intervention and the control groups. Threement’ was defined as “helping optimise prescribing,main areas of costs were examined: the costs of theplus the experiences and health outcomes for eachintervention; the costs of NHS treatment in bothpatient, wherever medicines are involved.”[7] Thegroups; and costs borne by the patients in bothservice included a medication review and advice ongroups. Table I summarises the type of costs andhealth and lifestyle for the selected sample of pa-sources of data used. All costs (£, 2003/4 values)tients with a diagnosis of CHD, based on informa-were expressed as annual costs.tion extracted from medical notes by practice-em-
ployed audit staff, and patient interviews in the Data Collectioncommunity pharmacy. Any recommended changes Audit clerks, blind to the randomisation status ofin prescribing were fed back to the patient’s GP. each patient, extracted baseline data from GP
The study involved 1480 patients (intervention, records using a form designed for the study. Thesen = 980; control, n = 500), 62 pharmacists and 164 data included confirmation of inclusion criteria, rel-GPs in nine sites in England. Details of the design of evant medical history (e.g. significant diagnoses andthe trial and the results of the main outcomes are known allergies), clinical indicators (e.g. last bloodreported elsewhere and are summarised in the sup- pressure, lipid measurement, pulse rate, blood glu-plementary material (see “ArticlePlus” at www.adis cose, weight and height), current medication, docu-online.com/phe).[6] The main primary outcomes mented use of over-the-counter (OTC) medicineswere appropriate treatment defined using guidelines and use of health service resources in the previousfrom the National Service Framework for CHD,[3] 12 months. All forms were returned to the researchhealth status and quality of life, and economic evalu- team who forwarded a copy to the pharmacist ofation; there were no significant differences between those patients in the intervention group. Postal ques-the intervention and control groups, although pa- tionnaires were sent to patients immediately aftertients’, pharmacists’ and GPs’ views of the interven- randomisation and at 12 months to collect self-tion were ‘positive’. We therefore conducted a cost- reported information on cost of accessing healthcareminimisation analysis. Both the NHS and the patient services, as well as other demographic, attitudinalperspectives were adopted. and experiential information.
It has been argued that, where the main outcomeCostsis statistically equivalent in the intervention and
comparator groups, the results on costs and effectsInterventionshould still be combined, i.e. cost-minimisationThe intervention involved two main elements:analysis is only relevant in very special circum-
the training of community pharmacists (comprisingstances.[8] However, there were multiple primarya series of three events) and the delivery of theoutcome measures in this study. Presenting the re-medicines management service through face-to-facesults in terms of a single effect would provide mis-interviews with patients.leading information, hence the preference to present
the results on cost differences only in the context of Data on the costs of training community pharma-a cost-minimisation analysis. cists for the medicines management project were
© 2007 Adis Data Information BV. All rights reserved. Pharmacoeconomics 2007; 25 (5)

400 Scott et al.
Table I. Resource utilisation: type of costs (£, 2003/04 values) and data sources
Type of cost Source of unit cost Source of resource utilisation data(retrospective 12-month baseline andprospective 12-month follow-up data)
Cost of the intervention
Delivery of training CPPE CPPE
Attendance cost of delegates (community PSNC PSNCpharmacists, GPs and practice nurses)
Face-to-face interviews with patients PSNC PSNC
NHS costs
Cost of pharmaceuticals BNF 46[9] (prescription drugs) Chemist Medical records (drug name, dose,a,b
and Druggist[10] and the OTC directory[11] frequency, strength and formulation)(OTC drugs)
GP, practice nurse visits Standard unit costs[12] Medical records (type/number of visits)
Hospital inpatient/outpatient visits NHS reference costs[13] Medical records (type/number of visits)
Patient/carer costs
Time spent travelling to the pharmacy/ Gross average wage[12] Patients’ questionnaire (items included paidGP, and time spent for the last visit work, voluntary work, housework, leisure
activity)
Public transport fare paid Patients’ questionnaire Patients’ questionnaire
Distance of car journey Cost per mile from the AA[14] Patients’ questionnaire
Parking charges Patients’ questionnaire Patients’ questionnaire
a If the dosage was not reported, the maximum daily dosage recommended in the BNF 46[9] was applied; if a range of dosages wasreported, an average was calculated.
b Drugs were excluded if they were no longer reported in the BNF 46[9] or if the daily quantity was difficult to derive (e.g. cream,lotion, shampoo).
AA = Automobile Association; BNF 46 = British National Formulary, 46th edition; CPPE = Centre for Postgraduate Pharmacy Education;OTC = over the counter; PSNC = Pharmaceutical Service Negotiating Committee.
supplied by the Centre for Postgraduate Pharmacy GPs and practice staff who attended the eventswere paid £100 per event.Education (CPPE) who organised and delivered the
training. Costs included those borne by the CPPE in The average costs of training per communityorganising the training events; these costs com- pharmacist and per patient in the intervention groupprised development (staff time, travel and accom- was calculated by dividing the total cost of trainingmodation, venue, office supplies, professional fees, by the number of community pharmacists and num-publications and reprographics) and delivery costs ber of patients, respectively. The annual total cost of(staff time, travel and accommodation, computer, training was calculated as an annual equivalent costvenue, postage/couriers, publications and repro- calculated using a 3.5% discount rate and a 25-yeargraphics). The time costs of pharmacists’ who at- time period.[15] Training is a ‘one-off’ cost that istended the events were also included. A number of incurred in the intervention year but the benefits oftraining events were held and data were collected on that training occur well into the future, such that thewhich pharmacists attended each event. Pharma- opportunity costs of training need to be spread overcists’ time was valued using the fees paid by the the period of time before each pharmacist wouldproject to community pharmacists attending the need to be retrained. In addition, we assumed thattraining (£100 per event). refresher training is provided at annual intervals.
© 2007 Adis Data Information BV. All rights reserved. Pharmacoeconomics 2007; 25 (5)

Costs of Pharmacist-Led Medicines Management Service 401
The main part of the intervention was the phar- tional Formulary (BNF) 46[9] and on over-the-macist-conducted interviews with the patients. The counter (OTC) drug costs from the Chemist andforms used by the pharmacists as a clinical record Druggist[10] and the OTC Directory.[11] Some as-also included fields to collect additional data for the sumptions were made in calculating drug costsevaluation. One such item was pharmacist self-re- where data were missing. If the medical record didported interview time. Where this entry was miss- not include a drug dosage, the suggested maximuming, the visit duration was estimated from the fee daily dosage reported by the BNF 46[9] was used. If aclaim forms sent to the Pharmaceutical Services range of dosages was reported, an average value wasNegotiating Committee who administered payments calculated. Drugs were excluded if a daily quantityto community pharmacists during the study. The was difficult to derive, e.g. cream, lotion and sham-value of the pharmacists’ time spent per patient was poo formulations, or if the drug was no longer listed.the fee per patient paid by the Pharmaceutical Ser- Patients were assumed to be receiving eachvice Negotiating Committee (PSNC). This repre- medicine for the duration of the retrospectivesented the market value of pharmacist time. Pharma- 12-month baseline and prospective 12-month fol-cists were asked to keep a log of their activities low-up periods, unless start and end dates forrelated to the intervention before and after the con- medicines were specified in the GP medical records.sultation, including time spent on preparation, This information was used to calculate an annualphone calls and contact with GPs. cost for each drug.
GPs were also paid a fee to cover the costs of The costs of each medicine used by each patientaudit clerks accessing patients’ medical records were summed to obtain a total pharmaceutical cost(£20 per patient in the intervention group). per patient.
Usual Treatment GP and Hospital Visits
All NHS costs were considered, including phar- Data on the number of GP and/or practice nursemaceutical costs (CHD and non-CHD related), GP visits (both at home and at the practice), hospitaland hospital visits (CHD related only). outpatient visits and inpatient stays at baseline and
at follow-up were also collected from the GPPharmaceutical Acquisition Costs records. Standard unit costs for GP and practiceTwenty-six audit clerks, blinded to group alloca- nurse visits were used.[12] The unit costs for hospital
tion, visited 38 general practices across nine Health outpatient and elective inpatient visits were takenAuthorities in England. Data were extracted from from the NHS Reference Costs database.[13]
each patient’s GP medical records, at baseline and atfollow-up (12 months before and after the interven- Cost to Patients and Their Carers
tion, respectively). These data included details of the It was not possible to collect data on all visits todrugs used, for both CHD and non-CHD indications, the community pharmacy during the baseline andby the patients in each 12-month period, including follow-up periods since pharmacies do not routinelythe name, dose, frequency, strength and formula- record visits. Requesting such information retro-tion. Provision of this information to the community spectively from patients for a 12-month periodpharmacist was an integral part of the intervention; might have resulted in serious recall bias. Therefore,these data were also used in the economic analysis. it was assumed that the number of visits made by
For the identified drugs, information on prescrip- patients in both groups remained unchanged aparttion drug costs were obtained from the British Na- from the extra documented visits made by patients
© 2007 Adis Data Information BV. All rights reserved. Pharmacoeconomics 2007; 25 (5)

402 Scott et al.
in the intervention group to receive the medicines Statistical Analysis
management service.
Basic descriptive statistics are presented as meanAdditional visits to the pharmacy, as well as(SD) values and categorical data are presented aspotential changes to the number of GP visits maypercentages. Since cost data were calculated at theshift the burden of costs faced by patients. The timepatient level, the effect of the intervention on totaland travel costs of patients and those accompanyingNHS costs for each patient was examined using
them to the pharmacy or GP were therefore calculat-regression analysis. This enabled differences in
ed with reference to the last GP or pharmacy visitcosts at follow-up to be adjusted for any differences
(see table I). These data were collected from a in patient characteristics and for differences in costssection in one of the questionnaires completed by at baseline.[17] Separate regression models were alsopatients at baseline and follow-up.[6] The unit cost used for each of the main cost categories (see Costs).obtained was then multiplied by the total number of Each regression model was also used to test andvisits made in the 12 months before the start (base- adjust for intra-class correlation between patientsline) and during the 12-month intervention period seen by the same pharmacist, registered with the
same GP and living in the same geographical area.(follow-up) by each patient. Other sections of theThe following regression model (equation 1) wasquestionnaires collected information regarding
used to estimate the effects of the intervention, whilehealth status (using the SF-36 and EuroQol), com-adjusting for baseline differences and other factors.pliance with treatment, experience and satisfaction
with community pharmacy services, and yiF = α + β1yiB + β2Ti + ei
demographics. (Eq. 1)Patient costs were collected using standard meth- This is the basic model set out by Vickers and
ods. The cost of travelling to the pharmacy or gener- Altman,[17] where yiF is the cost of patient i in thefollow-up period F; α is a constant term reflectingal practice was ascertained by asking whether athe mean cost, conditional on the other variables; yiBpublic transport fare was paid, the length of any caris the cost of patient i at baseline (and β1 is thejourney and whether any parking charges were in-coefficient to be estimated); β2Ti is the effect of thecurred. A cost per mile was obtained from the Auto-intervention on the cost yiF, with Ti a dummy varia-mobile Association[14] for the use of private trans-ble with a value of one if the patient was in theport. The opportunity costs of the time of patientsintervention group and zero if they were in the
and those travelling with them depended upon thecontrol group, and the β2 coefficient representing
activities given up to attend the visit. Standard val-the difference in cost between the intervention and
ues for time were based on the gross average wagecontrol group at follow-up, after adjustment for all
rate if the individuals forfeited paid work,[12] 57% of of the other covariates. ei is the unexplained part ofthe gross average wage if voluntary work, house- the model: the individual level error term showingwork or caring activities were forfeited and 43% of unexplained random variation in the outcome acrossthe average wage if leisure activities were forfeit- individuals. Since costs were non-negative and noted.[16] The amount of time lost included time spent Normally distributed, the natural logarithm of thetravelling and the duration of the visit itself. A total dependent variable was used.cost per patient was calculated for both general Equation 1 assumes that e1 is independent. How-practice- and intervention-related pharmacy visits. ever, this is unlikely to be the case, as the costs of
© 2007 Adis Data Information BV. All rights reserved. Pharmacoeconomics 2007; 25 (5)

Costs of Pharmacist-Led Medicines Management Service 403
patients treated by the same pharmacist, by the same random effect. The random effects model usesGP or within the same geographic area may be generalised least squares to estimate the parameters.correlated. For example, each pharmacist may have The data used in the regression models were fromspecific abilities, skills, attitudes and practice style those individuals who had valid values at both base-that are common to all patients they see but unob- line and follow-up. Hence, patients who were lost toserved by the researcher. follow-up or who had missing data for at least one of
the variables included in the regression model, ei-The model was therefore extended to account forther at baseline or at follow-up, were excluded fromthese correlations (intra-class correlations). If thethe statistical analysis. Thus, those included in theobservations were not independent and we estimat-regression model were a non-random selection ofed the effects of the intervention using equation 1,individuals from the intervention and controlthen the standard errors of the independent variablesgroups. The Heckman selection correction was ap-would be too small, thus overestimating the statisti-plied to test and adjust for potential selection bias.[20]cal significance of the variables, including β2Ti. One
way to account for this is to use a random effectsSensitivity Analysismodel (equivalent to a two-level multilevel
model).[18]Most of the unit cost data were measured with
This is shown in equation 2, where j is the group relative certainty using standardised methods and(e.g. pharmacy), yijF refers to the outcome of patient unit costs; these were used across all sites. Uncer-i of pharmacist j in the follow-up period; and uj is tainty in terms of variation in the cost data wasthe random effect (a measure of the correlation in accounted for by the regression analysis. However,costs within pharmacies). in practice, there may be local variation in unit costs
and quantities of resources used with the interven-yijF = α + β1yijB + β2Tij + uj + eij
tion. A threshold analysis was therefore conducted(Eq. 2)to examine the sensitivity of the results to variationsThis model captures unobserved heterogeneityin the intervention costs.that can be attributed to community pharmacies. The
random effects model assumes that uj was uncorre- Resultslated with observed independent variables, includ-ing the effect of the intervention. This is a reasona- The costs presented in the tables are unadjustedble assumption given randomisation and was con- costs, but the p-values in the text refer to the statisti-firmed using a Hausman test[19] for all models where cal significance of the effect of the intervention onthe random effects were statistically significant (re- costs (β2Tij) from the regression models, after ad-sults available from the corresponding author). The justing for differences in baseline costs, intra-classstatistical significance of uj can be used to test correlation and selection bias (see Statistical Analy-whether there were correlations in costs within phar- sis). The coefficients of the regression models alsomacies. estimate the effect of the intervention as a percent-
age difference in costs between the study and con-Separate models were also used with j defined astrol groups. Table II summarises the regression anal-the GP practice and area, to test whether costs withinysis results for each component of cost and for theGP practices were correlated. Where correlationstotal costs.were found in more than one group (e.g. within
practices and pharmacies), the results presented are Most of the models used had statistically signifi-those for the model with the lowest p-value for the cant random effects at either the GP, pharmacist or
© 2007 Adis Data Information BV. All rights reserved. Pharmacoeconomics 2007; 25 (5)

404 Scott et al.
local area level. This suggests that there is unob-served heterogeneity among GPs, pharmacists andlocal areas that influence costs. For GPs and phar-macists, this may reflect their practice style, prefer-ences, ability or skills. For local areas, this mayreflect community-level broad socioeconomic fac-tors, or geographic factors influencing access toNHS services.
Cost of NHS Treatment
Intervention
The total cost of the training programme wasalmost £200 000, which included development anddelivery costs, and the value of pharmacists’ andGPs’ time when attending the various events (tableIII). A total of 103 pharmacists undertook the train-ing, of whom 62 delivered the intervention. Costsfor the pharmacists who were trained but who subse-quently withdrew from the study and did not deliverthe intervention were included in the total cost perpharmacist who delivered the intervention. The totalmean training cost per pharmacist was £808. Themean cost of training per patient was £53; eachpharmacist delivered the intervention to a mean of8.5 patients (range 1–59 per pharmacist).
The cost of pharmacists’ interviews with patientswas valued using the £60 capitation fee paid topharmacists for each patient. Most patients (91%)had one visit with the pharmacist, lasting a mean of40 minutes.
A total of 738 patients had 785 intervention vis-its. The combined mean cost of the intervention perpatient was £118.
Pharmaceuticals
There were some differences between the groupsin the mean annual costs of CHD-relatedpharmaceuticals at baseline and at follow-up (tableIV). CHD-related pharmaceutical costs increasedover time in both groups, from £409 to £468(12.4%) in the intervention group and from £377.50
© 2007 Adis Data Information BV. All rights reserved. Pharmacoeconomics 2007; 25 (5)
Tab
le I
I. S
umm
ary
of t
he r
egre
ssio
n an
alys
is d
ata;
sin
ce c
osts
a w
ere
non-
nega
tive
and
not
Nor
mal
ly d
istr
ibut
ed,
the
natu
ral l
ogar
ithm
was
use
d
Par
amet
erC
osts
with
out
the
inte
rven
tion
Cos
ts w
ith t
he in
terv
entio
n
CH
D-r
elat
edno
n-C
HD
-rel
ated
all
cost
of
GP
and
cost
of
usua
lto
tal c
ost
(V p
lus
tota
l cos
t (V
plu
sto
tal c
ost
(V p
lus
phar
mac
eutic
als
phar
mac
eutic
als
phar
mac
eutic
als
hosp
ital v
isits
NH
S t
reat
men
ttr
aini
ng c
osts
)in
terv
entio
n co
st)
trai
ning
and
(I)
(II)
(III)
[I
+ I
I](I
V)
(V)
[III
+ I
V]
inte
rven
tion
cost
)
Effe
ct o
f th
e– 0
.004
, p
=0.
92– 0
.02,
p=
0.81
– 0.0
8, p
=0.
05– 0
.05,
p=
0.65
– 0.0
5, p
=0.
220.
03,
p=
0.41
0.05
, p
=0.
180.
13,
p=
0.00
1in
terv
entio
n (β
,p-
valu
e)
Ran
dom
effe
ctsb
GP
pra
ctic
e:N
onec
GP
pra
ctic
e:Lo
cal a
rea:
Pha
rmac
y:P
harm
acy:
Pha
rmac
y:P
harm
acy:
(IC
C,
p-va
lue)
0.10
, p
<0.
0001
0.04
, p
<0.
0001
0.03
, p
<0.
0001
0.11
, p
<0.
0001
0.12
, p
<0.
0001
0.13
, p
<0.
0001
0.14
, p
<0.
0001
Sel
ectio
n bi
asY
esN
one
Yes
Non
eN
one
Non
eN
one
Non
e
aE
xclu
ding
pat
ient
s’ t
ime,
tra
vel c
osts
and
labo
rato
ry c
osts
.
bF
or e
ach
depe
nden
t va
riabl
e, t
hree
bas
ic m
odel
s w
ere
used
, ea
ch w
ith a
diff
eren
t ra
ndom
effe
ct (
phar
mac
y, G
P p
ract
ice
and
loca
l are
a).
The
mod
el p
rese
nted
in t
heta
ble
is t
hat
whi
ch h
as t
he lo
wes
t p-
valu
e fo
r th
e ra
ndom
effe
ct.
The
sta
tistic
al s
igni
fican
ce o
f th
e in
terv
entio
n w
as a
lway
s th
e sa
me
acro
ss a
ll th
ree
mod
els.
cA
ll th
ree
mod
els
had
sign
ifica
nt r
ando
m e
ffect
s.
CH
D =
cor
onar
y he
art
dise
ase;
IC
C =
intr
a-cl
ass
corr
elat
ion
coef
ficie
nt;
β =
the
est
imat
ed c
oeffi
cien
ts f
rom
the
reg
ress
ion
mod
els.

Costs of Pharmacist-Led Medicines Management Service 405
Table III. Cost (£; 2003/04 values) of the intervention
Parameter Development costs Delivery costs Total cost
Training
Staff time, travel and accommodation 19 910 102 886 122 797
Venue 5 722 2 265 7 987
Office supplies 308 83 391
Professional fees 11 437 0 11 437
Publications and reprographics 1 473 12 206 13 678
Fees to pharmacists who delivered the intervention 18 300(£100 per training event)
Fees to pharmacists who did not deliver the intervention 11 400(£100 per training event)
Fees to GPs (£100 per training event) 13 300
Total cost of training 199 824
Total annual equivalent cost 43 156
Cost per pharmacist [mean (SD)] 808.5 (25.3)
Cost per patient [mean (SD)] 53.3 (81.2)
Pharmacy visit
Pharmacy fee (per visit) 60
GP fee (per patient) 20
Cost per patient [mean (SD)] 64.8 (42.1)
Total cost 59 040
Total cost per patient (training plus pharmacist visit) [mean (SD)] 118 (97)
to £468 (19.2%) in the control group. However, the due to missing values, the regression model showedcost differences between groups at follow-up were that the costs in the intervention group were 8%not statistically significant after controlling for dif- lower than in the control group and that this resultferences at baseline (table II). This result was robust was statistically significant (table II).to a number of different model specifications, in- These results suggest that community pharma-cluding pooled and random effects models. cists slowed the overall growth in drug costs over
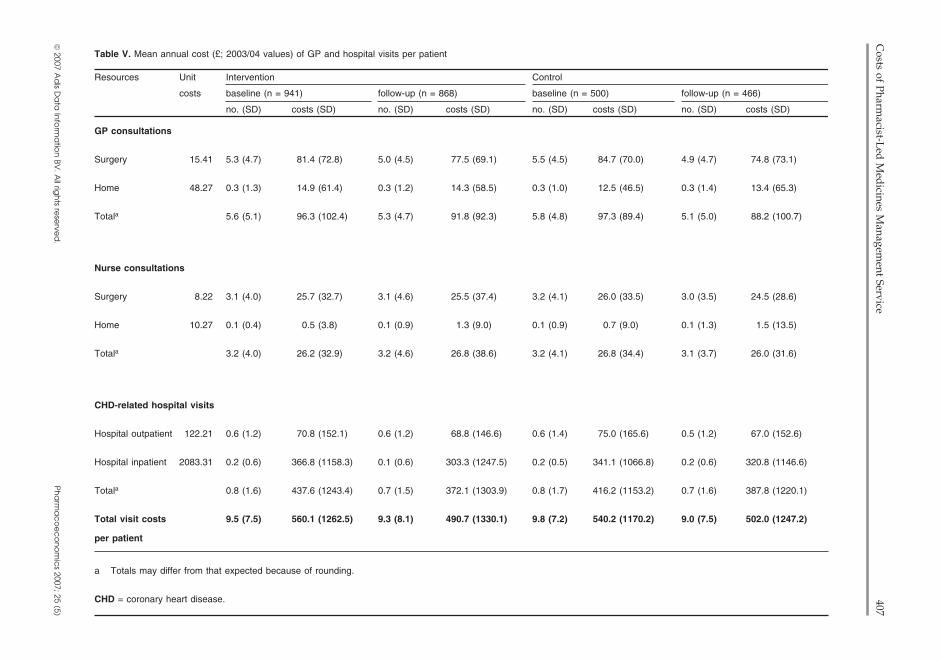
the study period.The mean costs of non-CHD-related pharmaceu-ticals decreased between baseline and follow-up in GP and Hospital Visitsboth groups, from £512 to £381 (–25.8%) in the NHS visits comprised GP and nurse consulta-intervention group and from £387 to £468 (–17.3%) tions, both at the surgery and at home, and hospitalin the control group (table IV). Regression analysis outpatient and inpatient visits related to CHD (tableshowed that the cost differences between the groups V). The mean cost of GP consultations decreased inat follow-up were not significantly different from both groups, from £96 to £92 (–4.7%) in the inter-zero (table II). vention group and from £97 to £88 (–9.4%) in the
The cost of all pharmaceuticals decreased slight- control group. There were no between-group differ-ly in both groups, from £785.50 at baseline to £769 ences in mean costs of other services. The total cost(–2.2%) at follow-up in the intervention group and of NHS visits decreased in both groups betweenfrom £774 to £742 (–4.1%) in the control group baseline and follow-up, from £560 to £491 (–12.4%)(table IV). After adjusting for non-random selection in the intervention group and from £540 to £502
© 2007 Adis Data Information BV. All rights reserved. Pharmacoeconomics 2007; 25 (5)

406Scott et al.
© 2007 A
dis D
ata
Info
rma
tion
BV. A
ll righ
ts rese
rved
.P
ha
rma
co
ec
on
om
ics 2007; 25 (5)
Table IV. Mean (SD) annual cost (£; 2003/04 values) of pharmaceuticals per patient (pt)a
Drug/cost parameter Control Intervention
baseline (n = 494) follow-up (n = 461) baseline (n = 932) follow-up (n = 861)
pts [% (n)] cost (SD) pts [% (n)] cost (SD) pts [% (n)] cost (SD) pts [% (n)] cost
Thiazide diureteics 11.7 (58) 14.2 (25.3) 12.4 (57) 11.1 (9.2) 12.9 (120) 14.2 (25.3) 14.3 (123) 11.1 (10.4)
Loop diuretics 20.0 (99) 22.3 (48.7) 18.2 (84) 13.5 (10.4) 19.5 (182) 30.5 (67.3) 19.7 (170) 15.7 (14.7)
β-Adrenoceptor antagonists 48.6 (240) 33.4 (54.2) 48.6 (224) 37.3 (57.8) 45.6 (425) 33.9 (64.9) 46.0 (396) 31.3 (39.1)
Vasodilators 36.2 (179) 130.2 (125.3) 36.0 (166) 137.5 (74.5) 36.6 (341) 113.4 (81.9) 35.1 (302) 122.6 (64.9)
Nitrates 63.8 (315) 51.6 (82.2) 60.7 (280) 51.7 (69.5) 65.9 (614) 68.8 (190.7) 58.1 (500) 52.7 (72.0)
Calcium channel antagonists 36.8 (182) 110.5 (52.6) 39.3 (181) 134.0 (68.5) 39.2 (365) 113.3 (73.8) 39.1 (337) 135.1 (62.2)
Potassium channel antagonists 7.7 (38) 232.2 (260.1) 8.4 (39) 250.1 (242.0) 9.4 (88) 233.3 (217.9) 9.3 (80) 285.9 (248.9)
Oral anticoagulants 9.1 (45) 38.2 (52.8) 9.5 (44) 35.5 (22.3) 6.3 (59) 37.8 (46.6) 7.2 (62) 32.8 (19.0)
Antiplatelet drugs 72.5 (358) 42.2 (161.9) 76.6 (353) 36.9 (115.8) 79.3 (739) 39.9 (101.3) 79.2 (682) 38.6 (117.2)
Lipid-regulating drugs 67.8 (335) 223.4 (107.5) 77.6 (358) 284.3 (122.8) 72.8 (679) 230.3 (126.7) 79.2 (682) 288.2 (122.3)
Others 22.1 (109) 127.7 (133.1) 23.6 (109) 149.2 (146.6) 19.4 (181) 138.3 (138.9) 21.6 (186) 143.6 (136.8)
Total costs of CHD-related 82.6 (408) 377.5 (288.4) 99.3 (458) 467.8 (316.2) 77.6 (723) 409.3 (326.6) 99.3 (855) 467.5 (302.6)
pharmaceuticals
Total costs of non-CHD-related 79.9 (395) 387.1 (664.4) 80.5 (371) 344.9 (503.1) 81.9 (762) 511.8 (862.0) 80.1 (690) 380.6 (672.7)
pharmaceuticals
Total costs of all 100 (494) 774.4 (855.1) 100 (461) 742.3 (568.4) 100 (932) 785.5 (790.8) 100 (861) 769.2 (716.4)
pharmaceuticals
a Information on prescription drug costs came from the BNF 46.[9]
BNF = British National Formulary; CHD = coronary heart disease.
Costs of Pharm
acist-Led
Med
icines Managem
ent Service407
© 2007 A
dis D
ata
Info
rma
tion
BV. A
ll righ
ts rese
rved
.P
ha
rma
co
ec
on
om
ics 2007; 25 (5)
Table V. Mean annual cost (£; 2003/04 values) of GP and hospital visits per patient
Resources Unit Intervention Control
costs baseline (n = 941) follow-up (n = 868) baseline (n = 500) follow-up (n = 466)
no. (SD) costs (SD) no. (SD) costs (SD) no. (SD) costs (SD) no. (SD) costs (SD)
GP consultations
Surgery 15.41 5.3 (4.7) 81.4 (72.8) 5.0 (4.5) 77.5 (69.1) 5.5 (4.5) 84.7 (70.0) 4.9 (4.7) 74.8 (73.1)
Home 48.27 0.3 (1.3) 14.9 (61.4) 0.3 (1.2) 14.3 (58.5) 0.3 (1.0) 12.5 (46.5) 0.3 (1.4) 13.4 (65.3)
Totala 5.6 (5.1) 96.3 (102.4) 5.3 (4.7) 91.8 (92.3) 5.8 (4.8) 97.3 (89.4) 5.1 (5.0) 88.2 (100.7)
Nurse consultations
Surgery 8.22 3.1 (4.0) 25.7 (32.7) 3.1 (4.6) 25.5 (37.4) 3.2 (4.1) 26.0 (33.5) 3.0 (3.5) 24.5 (28.6)
Home 10.27 0.1 (0.4) 0.5 (3.8) 0.1 (0.9) 1.3 (9.0) 0.1 (0.9) 0.7 (9.0) 0.1 (1.3) 1.5 (13.5)
Totala 3.2 (4.0) 26.2 (32.9) 3.2 (4.6) 26.8 (38.6) 3.2 (4.1) 26.8 (34.4) 3.1 (3.7) 26.0 (31.6)
CHD-related hospital visits
Hospital outpatient 122.21 0.6 (1.2) 70.8 (152.1) 0.6 (1.2) 68.8 (146.6) 0.6 (1.4) 75.0 (165.6) 0.5 (1.2) 67.0 (152.6)
Hospital inpatient 2083.31 0.2 (0.6) 366.8 (1158.3) 0.1 (0.6) 303.3 (1247.5) 0.2 (0.5) 341.1 (1066.8) 0.2 (0.6) 320.8 (1146.6)
Totala 0.8 (1.6) 437.6 (1243.4) 0.7 (1.5) 372.1 (1303.9) 0.8 (1.7) 416.2 (1153.2) 0.7 (1.6) 387.8 (1220.1)
Total visit costs 9.5 (7.5) 560.1 (1262.5) 9.3 (8.1) 490.7 (1330.1) 9.8 (7.2) 540.2 (1170.2) 9.0 (7.5) 502.0 (1247.2)
per patient
a Totals may differ from that expected because of rounding.
CHD = coronary heart disease.

408 Scott et al.
Table VI. Total NHS-related cost (£; 2003/04 values) per patienta
Parameter Intervention [mean (SD)] Control [mean (SD)]
baseline follow-up baseline follow-up
Patients (n) 930 859 494 461
Total cost of usual treatment 1410 (1601) 1307 (1616) 1243 (1420) 1286 (1487)(pharmaceuticals plus NHS visits)
Cost of the intervention 0 118 (97) 0 0
Total NHS-related cost (pharmaceuticals 1410 (1601) 1433 (1618) 1243 (1420) 1286 (1487)plus NHS visits plus intervention costs)
a Numbers of patients in each group refer to only those patients who had complete data available at baseline and at follow-up, andcomplete data available for all components of costs. Therefore, numbers may be different from those reported in previous tables.
(–7.1%) in the control group (not statistically signif- Sensitivity Analysisicant).
The main finding of a higher total NHS cost inthe intervention group was sensitive to the level ofTotal NHS Costintervention cost included in the analysis. ExcludingThe estimated total cost per patient of the inter-either the costs of training the pharmacists or thevention to the NHS, including the cost of all phar-costs of pharmacist and GP time in delivering themaceutical treatments and NHS visits and the directactual intervention led to a non-significant differ-cost of the intervention, is shown in table VI.ence in costs. This suggests the result is sensitive toIn the intervention group, mean costs increasedthe level of costs incurred by the intervention (tablefrom £1410 to £1433 (2.0%) between baseline andII).follow-up. Costs also increased in the control group
The mean intervention cost per patient was £118.from £1243 to £1286 (3.3%). The difference in costsA threshold analysis was conducted to identify theat follow-up between the intervention and controlreduction in intervention costs necessary to rendergroups was statistically significant (p = 0.001) afterthe between-group cost difference not statisticallyadjusting for differences at baseline and the correla-significant at the 5% significance level. Interventiontion in costs within pharmacies (table II). Total NHScosts (both training and pharmacist visits costs)costs were 13% higher in the intervention groupwere therefore reduced for each patient in 5% incre-than in the control group.ments until the cost difference between the interven-tion and control groups became insignificant. This
Cost to Patients and Their Carersoccurred when the intervention cost per patient hadbeen reduced by 35% to a mean cost of £76.
The total cost of visiting the GP decreased in boththe intervention and control groups. Since data on Discussionthe number of pharmacist visits were not collected,it was assumed that they increased by one in the The introduction of a 1-year pharmacy-ledintervention group. The total costs to patients and medicines management service for CHD resulted incarers decreased from £25 at baseline to £20 a statistically significant net increase in costs to the(–20.0%) at follow-up in the intervention group and NHS. Although there was evidence that pharmacistsfrom £29 to £19 (–34.5%) in the control group. slowed the growth in drug costs in this patientDifferences between groups at follow-up were not group, the greater NHS cost in the delivery of thestatistically significant. intervention reflects the cost of delivering the actual
© 2007 Adis Data Information BV. All rights reserved. Pharmacoeconomics 2007; 25 (5)

Costs of Pharmacist-Led Medicines Management Service 409
training and the time taken to deliver the interven- range of costs from both the patients’ and NHStions. The total cost of visiting the GP and the total perspectives. Furthermore, the pharmacy-ledindirect costs to patients and carers decreased but medicines management service was delivered by adid not differ significantly between the groups. large number of community pharmacists in contrastSince the measured outcomes in the main trial were to one or two highly specialised pharmacists inno different after the intervention was introduced, specific settings, and involved close collaborationthe results suggest that this type of medicines man- between healthcare team members and patients inagement service by community pharmacists, as as- the management of CHD. Therefore, the results aresessed by short-term clinical outcomes, may not generalisable to the wider UK population of com-represent an efficient use of resources for the NHS. munity pharmacists.
This result, in part, depends on the magnitude of The economic evaluation used standardisedthe intervention costs. A reduction in the interven- methods to determine the costs for each patient intion cost of 35% (achieved, for example, by either the study. A number of assumptions were madereducing the length of the training or by specifying a about the dosage of medicines used when calculat-shorter consultation time) would ensure that the cost ing drug costs. This was because the available datadifference between the intervention and control had incomplete dosage information for somegroups was not statistically significant. This is a medicines. Since this affected only a small numberlarge reduction and it is doubtful whether it could be of medicines (mostly non-CHD drugs) per patientachieved without further compromising the quality (mean of 0.29 vs 0.27 at baseline and follow-up,of the intervention. respectively, in the intervention group, and 0.28 vs
The total annual NHS cost in the control group at 0.21 in the control group), our assumptions arebaseline is similar to that reported by Liu et al.[21]
unlikely to have greatly influenced the total costwho estimated the burden of CHD in the UK from figures. Assumptions were also made when calculat-the NHS perspective. A more recent randomised ing the duration of therapy during the baseline andcontrolled trial looked at the cost effectiveness of a follow-up periods. However, these assumptionshome-based medication review in older people.[22]
were applied equally to both groups thus having noThere are few other studies that have examined the effect on the differences in total costs between thecosts of pharmacist-led medication reviews. The groups.introduction of a secondary CHD prevention clinic
It was not possible to quantify the costs to GPs ofjointly run by a practice pharmacist and a practice
the intervention. No measure of GP workload wasnurse, directly reviewing patients’ therapy and im-
collected. There was no evidence that GP visitsplementing changes, showed a reduction in pharma-
declined as a result of the intervention. Althoughceutical costs within the 2.5-year follow-up peri-
pharmacists were asked to record the number ofod.[23] However, this study did not examine the total
contacts they made with the GP (time spent oncosts of the intervention.
visits, phone calls), few pharmacists did so and thisinformation was not included. Therefore, the costs
Study Limitationsattributed to the intervention are likely to have beenunderestimated.Our cost-minimisation analysis has several
strengths and weaknesses. Firstly, the analysis was The data were also limited by the lack of infor-conducted alongside a multicentre randomised con- mation on the total number of usual communitytrolled trial and included a full assessment of a large pharmacy visits. It is therefore unknown whether the
© 2007 Adis Data Information BV. All rights reserved. Pharmacoeconomics 2007; 25 (5)

410 Scott et al.
additional intervention visit increased or decreased Acknowledgementsthe usual number of visits to the community phar-
The views expressed are those of the authors. This studymacy; there is no other evidence that could be used was funded by the British Department of Health and wasto estimate this effect. However, any decrease in the managed jointly by a consortium of national pharmacy bodies
led by the PSNC. The Health Economics Research Unit isnumber of usual community pharmacy visits wouldfunded by the Scottish Executive Health Department and thehave to be large to offset the additional cost of theUniversity of Aberdeen, Aberdeen, Scotland.intervention. One option for collecting this informa-
The authors have no conflicts of interest relevant to thetion would have been to ask the patients in the content of the study. C. Bond had full access to all the data inquestionnaires. However, this is likely to have re- the study and final responsibility for the decision to submit
for publication.sulted in important information recall bias, as pa-The Community Pharmacy Medicines Management Eval-tients would have been asked to recall all visits over
uation Team included the following:a 12-month period. Instead, we asked patients onlyUniversity of Aberdeen, Abderdeen, Scotland: Christine
about their last visit to a community pharmacy. A Bond, Philip Hannaford, Mariesha Jaffray, Amanda J. Lee,prospective data collection exercise would not have Gladys McPherson, Anthony Scott, Michela Tinelli, Mar-been feasible from either the patient or pharmacist garet Watson, Elizabeth Dinnie and Elizabeth Shirran.
University of Keele, Keele, Staffordshire, England: Ali-perspective, and might have resulted in the Haw-son Blenkinsopp, Steve Chapman, Helen Hooper and Duncanthorne effect (whereby an individual alters theirShort.
behaviour because they know they are being stud-University of Nottingham, Nottingham, England: Claire
ied).[24]Anderson, Anthony Avery, Paul Bissell and Stacey Sadler.
The College of Pharmacy Practice, Coventry, England:Janet Krska.
ConclusionThe authors would like to thank the patients and health-
care professionals who took part in the study, the PSNC andall the local project and research coordinators who helpedThe introduction of a 1-year pharmacy-ledwith the delivery of the service, and the secretarial staff (H.medicines management service is likely to increaseRobertson, A. McAteer, A. Thompson, M. Ross) who helped
the total costs of CHD treatment and preventionwith the project.
from an NHS and patient perspective. Given thatmeasured patient outcomes did not change, this par-
Referencesticular type of medicines management service is 1. Marmot M, Elliott P. Coronary heart disease epidemiology:
from aetiology to public health. 2nd ed. London: Oxfordunlikely to represent an efficient use of healthcareUniversity Press, 2005resources. Future research in this area should focus
2. British Heart Foundation Statistics. Health survey for Englandon the nature of the intervention, particularly the 2003 [online]. Available from URL: http://www.heartstats.org
[Accessed 2007 Mar 31]uptake of the service and the relationship between3. Department of Health. National service framework for coronary
pharmacists and GPs. It is also necessary to investi- heart disease, 2000 [online]. Available from URL: http://www.dh.gov.uk/PolicyAndGuidance/HealthAndSocialCaregate the possibility that patients may gain utilityTopics/CoronaryHeartDisease/CoronaryArticle/fs/en?.contfrom the intervention and from having more infor-ent_ID=4108602&chk=nf93gd [Accessed 2006 Feb 28]
mation and being reassured, independent of clinical 4. Lutener S, Rhodes H. What do the contract regulations mean?Pharmaceutical J 2005; 275: 692-3and health outcomes. Studies should also continue
5. Departments of General Practice and Primary Care, and Man-to focus on the cost effectiveness of innovative agement Studies, University of Aberdeen. Evolution and
change in community pharmacy: synopsis, November 2003.services, whether delivered by pharmacists or otherLondon: Royal Pharmaceutical Society of Great Britain, 2003healthcare providers, in the management of CHD [online]. Available from URL: http://www.rpsgb.org.uk/pdfs/
patients. chevcommphsyn.pdf [Accessed 2006 Feb 28]
© 2007 Adis Data Information BV. All rights reserved. Pharmacoeconomics 2007; 25 (5)
Costs of Pharmacist-Led Medicines Management Service 411
6. The Community Pharmacy Medicines Management Project 16. Department of Transport. COBA 9 manual. London: Depart-Evaluation Team. The MEDMAN study: a randomised con- ment of Transport, 1989trolled trial of community pharmacy-led medicines manage- 17. Vickers A, Altman D. Analysing controlled trials with baselinement for patients with coronary heart disease. J Fam Pract and follow-up measurements. BMJ 2001; 233: 1123-42007; 24 (2) [online]. Available from URL: http://fampra.
18. Wooldridge JM. Econometric analysis of cross section andoxfordjournals.org/current.dtl#randomised_controlled_trialpanel data. Cambridge (MA): MIT Press, 2002[Accessed 2007 Apr 23]
19. Greene W. Econometric analysis. 5th ed. New Jersey (NJ):7. National Prescribing Centre (NPC). Medicines managementPrentice Hall, 2003[online]. Available from URL: http://www.npc.co.uk/mms/
mmsc/index.htm [Accessed 2006 Sep 30] 20. Heckman J. Sample selection bias as a specification error.Econometrica 1979; 47: 153-618. Briggs A, O’Brien BJ. The death of cost-minimisation analysis.
Health Econ 2001; 10: 179-84 21. Liu JL, Maniadakis N, Gray A, et al. The economic burden of9. British National Formulary. 46th ed. London: British Medical coronary heart disease in the UK. Heart 2002; 88: 597-603
Association and Royal Pharmaceutical Society of Great Brit- 22. Pacini M, Smith R, Wilson E, et al. Home-based medicationain, 2003 review in older people: is it cost effective? Pharmacoeco-
10. Chemist and Druggist directory 2003. Tonbridge: CMP Infor- nomics 2007; 25 (2): 171-80mation Limited, 2002
23. Reilly V, Cavanagh M. The clinical and economic impact of a11. Proprietor’s Association of Great Britain (PAGB). OTC directo- secondary heart disease prevention clinic jointly implemented
ry 2002/03: treatment for common ailments. London: PAGB, by practice nurse and pharmacist. Pharm World Sci 2003; 25:2003 294-8
12. Netten A, Curtis L. Unit costs of health and social care. Canter-24. Last JM. A dictionary of epidemiology. Oxford: Oxford Univer-
bury: University of Kent, 2003sity Press, 2001
13. NHS reference costs [online]. Available from URL: http://www.doh.gov.uk/nhsexec/REFCOSTS/2002appl.xls [Ac-cessed 2004 Jan 31] Correspondence: Dr Michela Tinelli, Health Care Centre,
14. Automobile Association (AA) motoring costs 2002 [online].Department of General Practice and Primary Care, Univer-Available from URL: http://www.theaa.com/staticdocs/pdf/allsity of Aberdeen, Westburn Road, Aberdeen, AB25 2AY,aboutcars/fuel/petrol2002.pdf [Accessed 2004 Apr 30]UK.15. HM Treasury. The green book: appraisal and evaluation in
central government. London: The Stationary Office, 2003 E-mail: [email protected]
© 2007 Adis Data Information BV. All rights reserved. Pharmacoeconomics 2007; 25 (5)

All in-text references underlined in blue are linked to publications on ResearchGate, letting you access and read them immediately.