
Correction of twilight measurements of influence of night sky
12
CORRECTION OF TWILIGHT MEASUREMENTS OF INFLUENCE OF NIGHT SKY LUD~K NEU~.IL Astronomical Institute, Czechosl. Acad. Sci., Ond~ejov*) 1. INTRODUCTION The study of twilight phenomena makes it possible to determine some of the properties of the upper atmosphere (e.g. the dependence of the density on the height or the presence of dust particles) and their time variations. The light of the twilight sky is usually measured in suitable spectral regions apart from the emission line of the night sky and the resu'lt of the measurement is the twilight curve, i.e. the dependence of the brightness logarithm on the solar depression. At the beginning of twilight this curve decreases, at higher solar depressions its decrease becomes more gradual and towards the end of the astronomical twilight, at an 18~ depression, it reaches a constant value and night falls. The above character of the curve is caused by the simultaneous effect of several components occurring in the light of the twilight sky. These components come from a) molecular diffusion of the first order, b) molecular diffusion of the second and higher orders, c) diffusion on dust particles and d) direct and scattered stellar light. The Sun is the source of illumination for the first three components and their contribution to the total brightness of the sky continually decreases with increasing solar depression. The contribution of the last component, on the other hand, is practi- cally constant. The role of the light of the night sky is negligible at the beginning of twilight but at the end (at a depression of 18~ the diffusion component is absolutely negligible. The character of the curve is then dependent on the colour of the light. The magnitude of the diffusion component rapidly decreases with increasing wave- length, while the brightness of the night sky depends only very little on the colour. The influence of the night sky thus first begins to play a role in the long-wave part of the spectrum. Twilight ends earlier in the red eolour that at shorter wave-lengths. The representation of the component coming from the night sky increases with increasing solar depression and gradually balances the diffusion component from the Earth's atmosphere. For example, in the green colour (5300 A) the two components are equal around the 14 ~ depression and in the orange (6100 A) around 13~ The rest of the twilight curve is practically meaningless for studying the upper atmo- sphere apart from the possibility of determining the value of the night sky brightness necessary for making the correction. If the aim of twilight measurements is to study the atmosphere of the Earth or its immediate neighbourhood, the values measured must be corrected for the influence of the night sky. Such a correction was made earlier by some authors [-1-3] but was not taken into consideration by others [4]. *) Address: ObservatoL Ond~ejov u Prahy. 352 Studia geoph, et geod. 8 (19~4)
Transcript of Correction of twilight measurements of influence of night sky

C O R R E C T I O N OF T W I L I G H T M E A S U R E M E N T S OF I N F L U E N C E OF N I G H T SKY
LUD~K NEU~.IL
Astronomical Institute, Czechosl. Acad. Sci., Ond~ejov*)
1. I N T R O D U C T I O N
The study of twilight phenomena makes it possible to determine some of the properties of the upper atmosphere (e.g. the dependence of the density o n the height or the presence of dust particles) and their time variations. The light of the twilight sky is usually measured in suitable spectral regions apart from the emission line of the night sky and the resu'lt of the measurement is the twilight curve, i.e. the dependence of the brightness logarithm on the solar depression.
At the beginning of twilight this curve decreases, at higher solar depressions its decrease becomes more gradual and towards the end of the astronomical twilight, at an 18 ~ depression, it reaches a constant value and night falls. The above character of the curve is caused by the simultaneous effect of several components occurring in the light of the twilight sky. These components come from a) molecular diffusion of the first order, b) molecular diffusion of the second and higher orders, c) diffusion on dust particles and d) direct and scattered stellar light.
The Sun is the source of illumination for the first three components and their contribution to the total brightness of the sky continually decreases with increasing solar depression. The contribution of the last component, on the other hand , is practi- cally constant. The role of the light of the night sky is negligible at the beginning of twilight but at the end (at a depression of 18 ~ the diffusion component is absolutely negligible. The character of the curve is then dependent on the colour o f the light. The magnitude of the diffusion component rapidly decreases with increasing wave- length, while the brightness of the night sky depends only very little on the colour. The influence of the night sky thus first begins to play a role in the long-wave part of the spectrum. Twilight ends earlier in the red eolour that at shorter wave-lengths. The representation of the component coming from the night sky increases with increasing solar depression and gradually balances the diffusion component from the Earth's atmosphere. For example, in the green colour (5300 A) the two components are equal around the 14 ~ depression and in the orange (6100 A) a round 13 ~ The rest of the twilight curve is practically meaningless for studying the upper atmo- sphere apart from the possibility of determining the value of the night sky brightness necessary for making the correction.
If the aim of twilight measurements is to study the atmosphere of the Earth or its immediate neighbourhood, the values measured must be corrected for t he influence of the night sky. Such a correction was made earlier by some authors [-1-3] but was not taken into consideration by others [4].
*) Address: ObservatoL Ond~ejov u Prahy.
352 Studia geoph, et geod. 8 (19~4)
Correction of Twilight Measurements of Influence of Night Sky
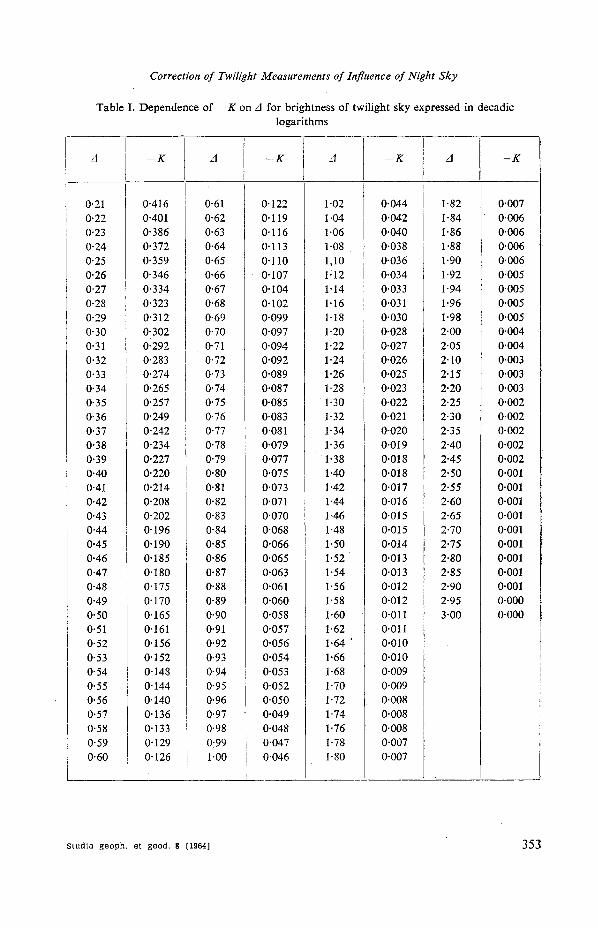
Table I. Dependence of - - K on A for brightness of twilight sky expressed in decadic logarithms
A - - K A - - K A - - K A - - K
0"21 0"22 0"23 0"24 0'25 0'26 0"27 0"28 0"29 0-30 0"31 0"32 0"33 0"34 0"35 0"36 0"37 0"38 0"39 0"40 0-41 0"42 0'43 0"44 0"45 0"46 0'47 0"48 0"49 0"50 0"51 0-52 0"53 0"54 0"55 0"56 0"57 0"58 0"59 0"60
0"416 0"401 0"386 0"372 0"359 0"346 0"334 0"323 0"312 0"302 0"292 0"283 0"274 0"265 0"257 0"249 0"242 0"234 0"227 0"220 0-214 0"208 0"202 0"196 0"190 0"185 0"180 0"175 0"170 0"165 0"161 0"156 0"152 0-148 0"144 0'140 0"136 0"133 0"129 0"126
0"61 0"62 0"63 0"64 0"65 0"66 0"67 0"68 0"69 0"70 0"71 0"72 0"73 0"74 0"75 0"76 0"77 0"78 0"79 0"80 0"81 0"82 0"83 0"84 0"85 0"86 0"87 0"88 0"89 0"90 0"91 0"92 0"93 0"94 0"95 0"96 0"97 0"98 0:99
I 1.oo
0"122 0"119 0"116 0"113 0"110 0"107 0"104 0"102 0"099 0"097 0"094 0"092 0"089 0"087 0"085 0"083 0'081 0"079 0'077 0"075 0"073 0"071 0"070 0"068 0"066 0'065 0"063 0"061 0"060 0"058 0"057 0'056 0"054 0"053 0'052 0"050 0"049 0-048 0'047 0"046
1"02 1 "04 1"06 1'08 1,10 l q 2 1"14 1"16 1"18 1"20 1"22 1"24 1"26 1'28 1"30 1"32 1"34 1"36 1"38 1"40 I "42 1"44 1 "46 1"48 1"50 1"52 1"54 1"56 1"58 1"60 1'62 1"64 1"66 1'68 1"70 1-72 1.74 1"76 1'78 1.80
0"044 0"042 0"040 0"038 0"036 0"034 0'033 0"031 0"030 0"028 0"027 0"026 0"025 0"023 0"022 0"021 0"020 0"019 0.018 0"018 0.017 0-016 0-015 0.015 0-014 0"013 0.013 0.012 0-012 0.011 0-011 0.010 0.010 0.009 0.009 0.008 0.008 0'008 0-007 0.007
1"82 1"84 1'86 1 "88 1"90 1"92 1"94 1"96 1"98 2"00 2"05 2"10 2"15 2"20 2"25 2"30 2"35 2"40 2"45 2"50 2"55 2"60 2"65 2"70 2"75 2"80 2"85 2"90 2"95 3"00
0"007 0"006 0-006 0"006 0.006 0.005 0-005 0"005 0"005 0"004 0"004 0"003 0"003 0.003 0"002 0-002 0-002 0"002 0.002 0.001 0-001 0-001 0"001 0"001 0-001 0"001 0"001 0-001 0"000 0-000
sludia geoph, et geod. $ [1964] 35~
&
2. BRIGHTNESS OF TWILIG H T SKY
If b denotes the brightness of the twilight sky at a depression U an d B that at a depression of 18 ~ i.e. the brightness of the night sky, then the corrected value bk corresponding to the diffusion of the solar light in the Earth's atmosphere is
( l) bk = b - B = [(A' - 1)/X] b = k 'b ,
(2) logbk = l o g k ' . + I o g b = k + I o g b ,
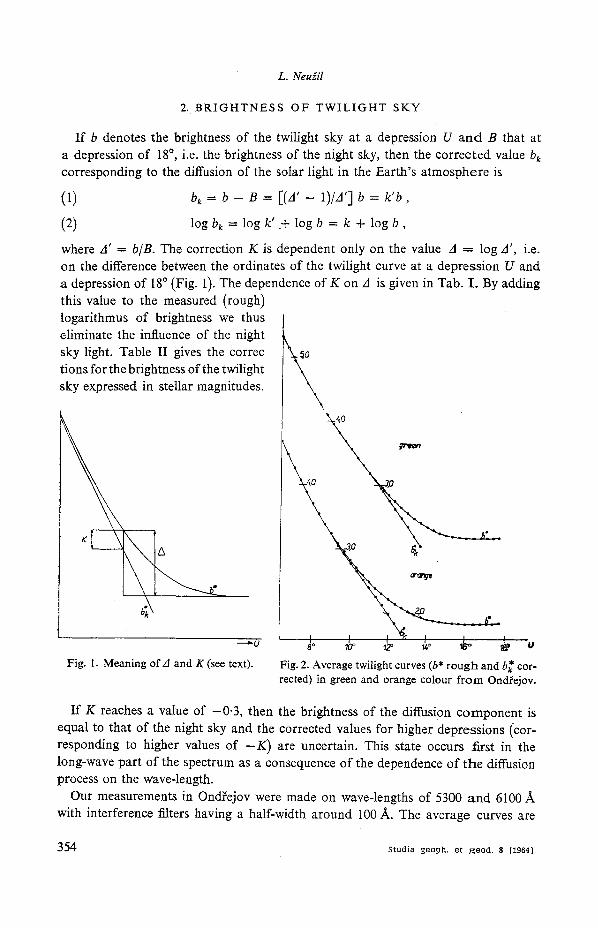
where B' = b/B. The correction K is dependent only on the value A = log A', i.e. on the difference between the ordinates of the twilight curve at a depression U and a depression of 18 ~ (Fig. 1). The dependence of K on A is given in Tab. I . By adding this value to the measured (rough) logarithmus of brightness we thus eliminate the influence of the night sky light. Table II gives the correc tions for the brightness of the twilight sky expressed in stellar magnitudes.
L. Neu$il
---'-~ U
Fig. 1. Meaning of A and K (see text).
,,0
t0
Fig. 2. Average twilight curves (b* rough and b* cor- rected) in green and orange colour from Ond~ejov.
If K reaches a value of -0 .3 , then the brightness of the diffusion component is equal to that of the night sky and the corrected values for higher depressions (cor- responding to higher values of - K ) are uncertain. This state occurs first in the long-wave part of the spectrum as a consequence of the dependence of the diffusion process on the wave-length.
Our measurements in Ond~ejov were made on wave-lengths of 5300 and 6100 A with interference filters having a half-width around 100 A. The average curves are
3 5 4 Studia geoph, et geod. 8 (1964]
Correction of Twilight Measurements of Influence of Night Sky
Table II. Dependence of K on --A for brightness of twilight sky expressed in stellar magnitudes
--A K --A K --A K --A K
0"55 0-60 0-65 0"70 0"75 0-80 0-85 0-90 0-95 1"00 1.05 1"10 1"15 1"20 1"25 1"30 1"35 1-40 1"45 1-50
1 '002 0-930 0"866 0"808 0-755 0.707 0-663 0-623 0-586 0-551 0-519 0"490 0"462 0"437 0-413 0-390 0-369 0-350 0"331 0.314
1-55 1"60 1"65 1 "70 1.75 1"80 1.85 1"90 1"95 2"00 2"05 2"10 2-15 2"20 2"25 2"30 2-35 2"40 2-45 2"50
0"298 0-282 0-268 0 254 0 242 0-230 0"218 0-207 0-197 0"187 0"178 0"170 0-161 0"153 0-146 0"139 0.132 0"126 0-120 0"114
2"60 2"70 2-80 2"90 3.00 3-10 3-20 3-30 3"40
3.50 3"60 3.70 3"80 3-90 4"00 4.10 4-20 4"30 4-40 4-50
0"104 0"094 0"086 0"078 0"071 0"064 0"059 0"053 0"048 0"044 0.040 0-037 0.033 0"030 0.028 0"025 0.023 0"021 0"019 0-017
4"60 4"70 4"80 4"90 5"00 5"50 6"00 6"50 7-00 7"50 8"00 8"50 9-00 9"50
10-00
0"016 0"014 0"013 0012 0011 0-007 0.004 0-003 0"002 0"001 0.001 0"000 0"000 0-000 0"000
shown in Fig. 2. The rough curves have different characters in the two colours, as has already been mentioned, the twilight ending earlier in the orange colour. After performing the correction a quite different picture is obtained. The slopes of the curves in the two colours are approximately the same according to the requirement of the simplified theory of twilight phenomena [5].
For the function K = f(A) the following relation is valid when K = - 0-3
(3) IdK/dAI = I .
This means that the error committed in determining 10g B (i.e. the value from the end of the twilight curve), necessary for determining K, appears in the same absolute value on the corrected curves in the depression region where correction ceases to be made. The normal inaccuracy in determining log B does not exceed 0.02 and cannot in any case influence the total character of the curves. At lower depressions the error is smaller.
When making the correction a further inaccuracy arises due to assuming the time invariability of the background. In reality, different parts of the sky pass through the measuring point (in our case the zenith) and the value of the correction is really variable. The brighter stars (which can be identified and their influence eliminated)
studiageeph, et geod. $ (1964) 355

L. Neu3il
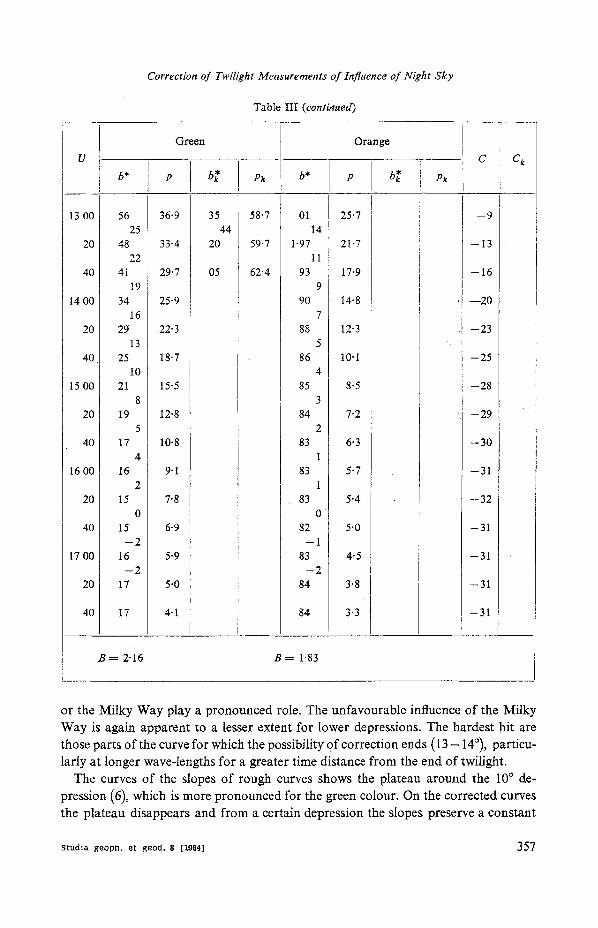
Table IIL Average twilight curves from 20 measurements in Ondfejov from 1961--62: b* loga- r i thm of brightness with differences to 1 ~ p degree of polarization in % for measured (uncor- rected) curves, b~ and Pk values corrected for influence of night sky, C colour o f twilight (see
text), C k corrected colour.
Green Orange
U C C k b* Pk b* Pk I
6 20
40
7 00
20
40
8 00
20
40
9 00
20
40
10 00
20
40
11 00
20
40
12 00
20
40
5"33
15 56
4"96 56
77 54
59 52
42 49
25 46
10 43
3"96 41
82 39
69 38
57 37
44 37
32 36
20 35
08 34
2.97 32
86 31
76 30
66 28
p b*
63"3 5"33
61-1 15 56
58-7 4'96 56
56" 1 77 54
53'6 59 52
51"6 42 49
50"0 25 47
49"0 10 44
48"3 3"95 42
47"9 8I 40
47.7 68 39
47"3 55 39
47" 1 42 39
46-8 29 39
46"3 16 39
45"4 03 40
45"1 2"90 40
44.0 76 41
42"2 63 41
39"7 49 43
63"3
61"1
58.7
56-1
53'6
51-6
50"0
49"0
49"3
48"8
48"7
49"6
49"4
49"6
50.5
50-4
52"3
54.1
55"7
57"2
4-69
49 60
29 59
09 57
3-90 54
72 5O
55 47
40 45
25 43
10 41
2"97 38
84 36
72 34
61 32
50 30
40 28
31 26
22 24
14 21
07 17
p b~'
i 70"2 4"69
67"9 49 r 60
65-4 29 59
62"6 09 58
59"8 3'90 55
57"4 71 51
55"4 54 48
53"9 39 i 46
52"7 23 45
51"5 08
43
50"I 2'94
42
48"7 80 : 41
47"4 i 66 [ 40
46"0 53 40 i
44.3 i 40 40
42-1 26 41
39"5 13 41
36-6 1"99 43
33-3 85
29-7 70 [
, J
70-2
67-9
65-4
62"6
59"8
58"5
56-5
55'0
55"3
54"1
53-1
53-0
54"0
54"7
54-5
56-8
57.7
59"6
61 "5
64"7
0 ~
2
3
4
5
6
6
6
7
8
8
9
8
71
6
I 4
2
0
- -2
- -5
0
2
3
4
5
7
7
7
8
9
10
11
12
12
12
13
t3
13
14
15
356 Studia geoph , et g e o d . 8 (lSS4]
Correction of Twilight Measurements of Influence of Night Sky
TabIe III (continued)
13 00
20
40
14 00
20
40
15 00
20
�9 40
16 00
20
40
17 00
20
40
U
b*
56 25
48 22
4i 19
34 16
29 13
25 10
21 8
19 5
17 4
16 2
15 0
15 - 2
16 - - 2
17
p
;6.9 3544
13-4 20
:9.7 05
:5.9
:2.3
8.7
5.5
2.8
0 .8
9.1
7.8
6-9
5.9
5.0
4.1
G r e e n O r a n g e
C C k
Pk b* p b~ Pk
58"7
59"7
62"4
17
B = 2"16 B = 1"83
1
1
83 0
82 1
83 2
84
84
25"7
21'7
17'9
14"8
12'3
10"1
8"5
7"2
6"3
5"7
5"4
5"0
4"5
3"8
3"3
--9
--13
--16
--20
--23
--25
--28
--29
--30
--31
--32
--31
--31
--31
--31
or the Milky Way play a p ronounced role. The unfavourable influence of the Milky
Way is again apparent to a lesser extent for lower depressions. The hardest hit are
those parts of the curve for which the possibility 0f correction ends (13 - 14~ particu-
larly at longer wave-lengths for a greater time distance from the end of twilight.
The curves of the slopes of rough curves shows the plateau a round the 10 ~ de-
pression (6), which is more p ronounced for the green colour. On the corrected curves
the plateau disappears and from a certain depression the slopes preserve a cons tant
studia geoph, et geod. 8 (19841 357
L. Neu$il
Table IV. Corrections for average twilight: - - K correction from Tab. I (in hundredths) with difference to 1 ~ (p.b)* logarithm ofp.b, A value of term in brackets in relation (10), k correction
factor from same relation
Green Orange
U
-- K (p.b)* A k - K (p .b)* A k
o i
6 20
40
7 00
2O
40
8 00
20
40
9 00
20
40
10 00
20
40
11 00
20
40
12 00
20
40
0 0
0 0
0 0
0 0
0 0
0 0
0 1
0 1
1 1
1 1
1 1
2 2
2 2
3 3
4 4
5 6
7 8
10 10
13 12
17 15
4"13
3"95
79
64
50
37
25
11
2"99
87
74
62
50
39
26
1"00
00
0"99
99
99
99
98
98
97
1"00
02
02
02
05
05
06
09
11
16
23
32
44
0 0
0 0
0 3
0 I
0 1
1 I
1 1
1 I
!
2 !
2 3
4 4
5 6
6 8
8 10
10 14
13 18
15 23
19 29
24 37
r I ]
I
] 3.48 ! i 29 I ~ 13
2-97
81 1-00
67 0"99
l 53 99
E 40 99
27 99
i I 15 98 I 4
02 98 I i
i 1"90 97 r
78 96
i ~, 66 95 i
54 93 J !
1 "00
02
02
02
05
05
06
09
14
19
23
35
46
63 i
i 85
~ 2.18
3 5 8 S t u d i a g e o p h , e t g e o d . 8 [ 1 9 6 4 )
Correction of Twilight Measurements of Influence of Night Sky
Table IV (continued)
Green Orange
U --K (p.b)* A k --K (p.b)* A k
o t
13 00
2O
40
22 19
28 25
36
13
DO
1"88
96
94
92
59
79
2.10
7 0 0 20 40
0.93 87 78
0-48 42 36
value or slightly rise. The difference between the behaviour of the curves in the two colours consists in the fact that the influence of the night sky decreases the slope of the curve more in the orange colour than in the green and prevents the formation of a plateau (Tab. IV).
3. COLOUR OF T W I L I G H T
The difference between the ordinates of twilight curves in the green and orange colours is a sort of characteristic of the twilight colour analogical to the colour index of stars. If, at the beginning of our measurements at the 6 ~ depression, we put bg . . . . = = bo*a~r the above difference gives the relative change in colour (C in Tab. III) during twilight. With the rough curves, the twilight becomes greener up to about the 10 ~ depression and later rapidly reddens up to a value of 0.31. The reduced curves behave differently. Up to the 13 ~ depression, when the correction can still be used, the difference Ck indicates that the twilight graduaUy becomes greener. Qualita- tively, the difference between the two curves can be explained by the fact that the mea- sured green curve decreases further into the night than the orange one and at the end of twilight it is practically the colour of the night sky which is measured. Again it is clear that conclusions as to the character of the diffusion component can be drawn only from the corrected curves and then at relatively low depressions around 10 ~
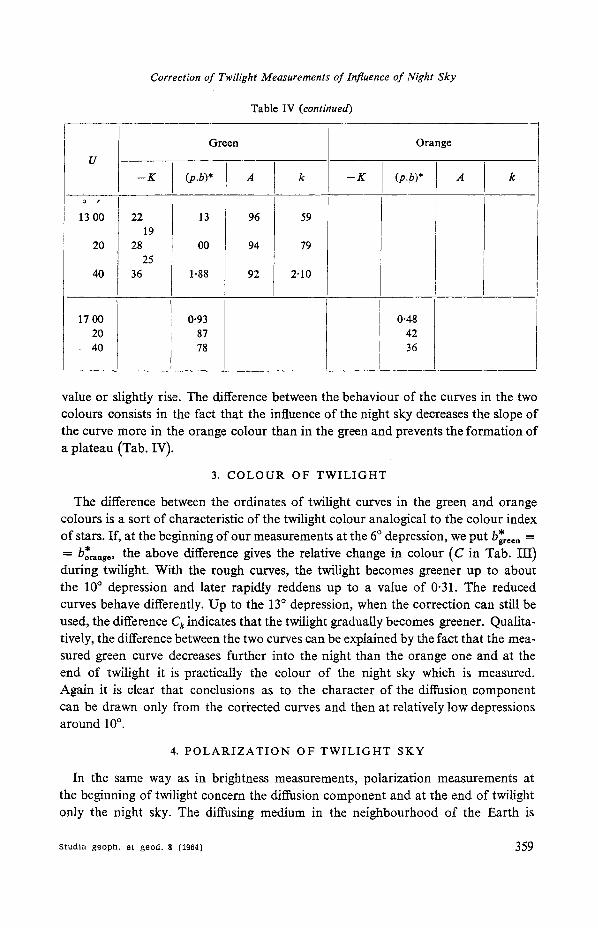
4. P O L A R I Z A T I O N OF T W I L I G H T SKY
In the same way as in brightness measurements, polarization measurements at the beginning of twilight concern the diffusion component and at the end of twilight only the night sky. The diffusing medium in the neighbourhood of the Ea r th is
Studia geoph, et geod. 8 (1964] 359
L. NeuSil
characterized by the corrected values so that, for example, the conclusions drawn from uncorrected values [5] can be regarded as justified at the most o n ly when the depressions are small, not exceeding 10 or 11 ~
The corrected value of the polarization is
(4) pk = k . p ,
where k is the corresponding correction coefficient. Further, bm,x = D § N is the sum of the components from the diffusion and the night sky or for a posi t ion of the
omnge
I ~ I I I 12 ~ 14 ~ "!6 ~
I 18 ~ U
Fig. 3. Degree of polarization of twilight sky as a function of solar depression U in green and orange colour from
Ond~ejov (p rough values, p~ corrected values).
For the correction coefficient we obtain
polaroid corresponding to maxi- mum reading of the photometer , bmi. = d + n is the same quantity for the polaroid ro ta ted by 90 ~ . The total brightness (uncorrected) is b = bm,x + bmi. and, in the same way, for the corrected values
bma x = D, bml n = d and b k = D + d, and for the values for t h e night sky B = N + n and the polarization
(5) P = ( N - n)/(N + n ) .
The measured value of the polarization is
(6) p = [ ( D + N ) - ( d + n ) ] :
: [ ( D + N ) + (d + n)]
and the sought corrected value
(7) Pk = (D -- a)/(D + d) .
(8) k = Pk/P = [(D - d)(D + N + d + n)]/E(D + d)(D - d + N - - n)]
and, considering relations (4), (5) and (7), finally,
(9) k = pg b/(pkbk + PB) = kpb/(K*kpb + PB)
and
(10) k = ( l /K*) ( I - PB/pb) .
As long as the second term in brackets is negligible compared with unity, i.e. up to about an 1 1 - 12 ~ depression, the correction coefficient reduces to the inverse value of the anti-logarithm in Tab. I. For higher depressions, the second term must also be taken into consideration. In any case it is obvious that when determining
360 studia geoph, et geod. 8 {1984}

Correction of Twilight Measurements o f Influence of Night Sky
the percentage of the polarization it is not enough to carry out only relative measure- ments but the values of the brightnesses must also be known in order to be able to make the necessary correction.
The characteristic plateau on the polarization curves of the twilight sky is found around the 10 ~ depression, the length of the plateau being dependent on the wave- lengths of the light measured. For shorter wave-lengths it is very large, while for longer wave-lengsth it is hardly visible. After reduction, the curves have quite a different look. After the fiat minimum at the 10 ~ depression, they again rise. The length of the plateau on the rough curves is thus quite insignificant and de- pends only on when the correction factor begins to play a role. There is an obvious analogy here with the slopes of the curves
20
70 ~ ,
o I I u
-2G
-20
Ao
Fig. 4. Colour of twilight as a function of solar depression U (C -- rough values, C k -- corrected
values, see text).
o(
5h. / . .~ , . I Per
And ,< oh Cos
L~
/ _f"
Fig. 5. Rectascence of zenith as a function of season for beginning (6 ~ and end (18 ~ of twilight morning M and evening S. Regions of Milky Way through which zenith passes are denoted by abbreviations of constellations, t M and t s are sections of time when end of twilight is influenced
by Milky Way morning and evening.
Studia geoph, et geod. 8 (1964) 361
L. Neu~il
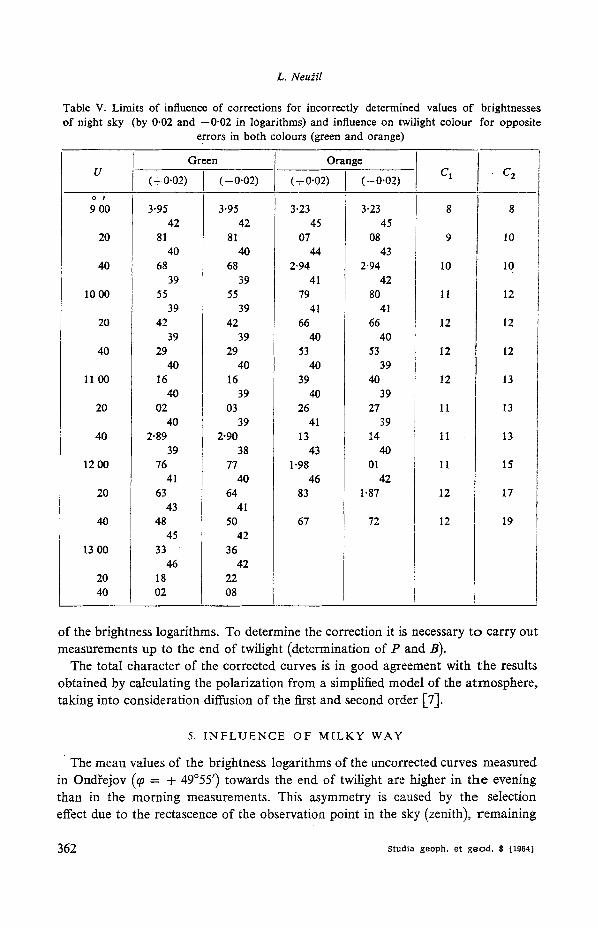
Table V. Limits of influence of corrections for incorrectly determined values of brightnesses of night sky (by 0.02 and --0.02 in logarithms) and influence on twilight colour for opposite
errors in both colours (green and orange)
U
O l
9 O0
20
40
I000
20
40
1100
20
4O
1200
20
40
13 O0
2O 4O
Green
(+0.02) (--0-02)
3.95 3.95 42 42
81 81 40 40
68 68 39 39
55 55 39 39
42 42 39 39
29 29 40 40
16 16 40 39
02 03 40 39
2.89 2-90 39 38
76 77 41 40
63 64 43 41
48 50 45 42
33 36 46 42
18 22 02 08
Orange
(+0.02) (--0.02)
3.23 3.23 45 45
07 08 44 43
2.94 2-94 41 42
79 80 41 41
66 66 40 40
53 53 40 39
39 40 40 39
26 27 41 39
13 14 43 40
1.98 01 46 42
83 1.87
67 72
I Ct
I 8
9
10
11
12
12
12
11
11
11
12
12 i I
c2
8
10
10
12
12
12
13
13
13
15
17
19
o f the br ightness logar i thms. To de termine the correct ion it is necessary t o ca r ry out
measurements up to the end o f twilight (de terminat ion o f P and B).
The to ta l cha rac te r o f the cor rec ted curves is in good agreement with t h e results
ob ta ined by calculat ing the po la r iza t ion f rom a simplified mode l o f the a t m o s p h e r e ,
t ak ing into cons idera t ion diffusion o f the first and second o rde r [7].
5. I N F L U E N C E O F M I L K Y W A Y
The mean values of the br ightness logar i thms o f the uncorrec ted curves measu red
in Ond~ejov (q~ = + 49055 ') towards the end o f twilight are h igher in t h e evening
than in the morn ing measurements . This a symmet ry is caused by the selection
effect due to the rectascence o f the observa t ion po in t in the sky (zenith), r e m a i n i n g
362 studia geoph, et geod. 8 (1984}
Correction of Twilight Measurements of Influence of Night Sky
longer in the region of the Milky Way during the final phase of the evening twilight
than during the morning, and its greater brightness compared with the night sky
causes the asymmetry (time sections t s and t M in the region of the Cyg, Lac and Cas constellations in Fig. 5). Here, again, it is not an expression of the atmosphere and
the correction eliminates this influence.
6. CONCLUSION
Table IV shows the magnitude of the corrections for both colours and their dif-
ference per 1 ~ influencing the slope of the curves. It also gives the magnitude of
the correction factor for the polarization k and its second term from relation (10). Table V shows the limits of the corrected curves of the brightness logarithms
when the brightness Gf the night sky is determined with an inaccuracy of+0.02 and -0-02 in logarithms and the maximum influence of these inaccuracies on the
twilight colour. It is clear from the above that the influence of the night sky can be neglected only
when the depressions are quite small. From 9 to 10 ~ the appropriate corrections must be made so that the influences which are not due to the structure of the Earth's
atmosphere can be eliminated from the measured values.
Received 2. 12. 1963 Reviewer: L. Kresdk
References
[1] B. Fesenkoff: Sur la constitution de l'atrnosph~re. Astr. Nachr., 220 (1924), 33. [2] W. Brunner: Beitrige zur Photometric des Nachthimmels. Publ. Sternw. Ziirich, 6 (1935). [3] F. Link: Situation actuelle des recherches cr6pusculaires. BAC, 1 (1949), 135. [4] R. Grandrnontagne: ]~tudes photo~lectriques sur la lumi6re du ciel nocturne. Ann. de
Phys., 11 c s6r., 16 (1941), 253. [5] F. Link: Sondages de la haute atmosph6re a l'aide des ph6nom%nes cr6pusculaires. Journ.
des Obs., 17 (1934), 161. [6] L. Neuti l : Fluctuations de la diffusion au cours du crdpuscule pendant I'AGI et la CGI
dans les stations Ond[ejov et Lomnick@ ~tit. Studia geoph, et geod., 5 (1961). 352. [7] J. V. Dave: On the Intensity and Polarisation of the Light from the Sky During Twilight.
Proe. Ind. Acad. Sci., 43A (1956), 336.
P e 3 1 o M e
r I O I I P A B K A P E 3 Y / I I , T A T O B C Y M E P E q H b l X H 3 M E P E H H I T I
H A BJII / IYlHHE H O N H O F O H E B A
LUD~K NEU~IL
AcmponoMu,~ec~u[t uncmumym rarCAH, Om)p~ce[to6
B p a 6 o T e pacCMaTpHBaeTc~t BnJlsHHe HO~l~oro H e 6 a Ha f l pKoc r s , I/BeT 14 IIOJISpI43allgIO cyMepe,~-
HOFO r le6a . BI, r.llO IIOKa3aHo, '-ITO 3a.MepeHH/,ie 3HK".'IeHH~{ H a l O cKoppeKTHpOBaTI~ Ha 3TO n a p y u l a l o m e e
~ a H a n r l e B TeX cay~Iaax , K o r e a pe3yrmTaaT~i a s M e p e H n R HCnOm~ByroTca ~.rr~ aBy~ienrm CBOfICTB BblCO-
Ko~t aTMocqbepr~. rlocTyxmao 2. 12. 1963
studia geoph, et geod. 8 [1964] 363