corporate value creation for japan's construction firms in the
153
CORPORATE VALUE CREATION FOR JAPAN'S CONSTRUCTION FIRMS IN THE SHRINKING AND CHANGING DOMESTIC MARKET by Masahiko Kanari B. Eng., Department of Architecture Waseda University, Tokyo, Japan (1991) Submitted to the Department of Civil and Environmental Engineering in Partial Fulfillment of the Requirements for the Degree of MASTER OF SCIENCE in Civil and Environmental Engineering at the Massachusetts Institute of Technology June 2003 © 2003 Masahiko Kanari, All right reserved. MASSACHUSETS INSTITUTE OF TECHNOLOGY JUN 0 2 2003 LIBRAR IES The author hereby grants to MIT permission to reproduce and distribute publicly paper and electronic copies of this thesis document in whole or in part. Signature of Author Certified by Department of Civil and Environmental Engineering May 1, 2003 #lred Moavenzadeh James Mason Crafts Professor of Engineering Systems Professor of 9ivil and Environmental Engineering Thesis Supervisor Accepted by Oral Buyukozturk Chairman, Departmental Committee on Graduate Studies BARK-R
-
Upload
khangminh22 -
Category
Documents
-
view
1 -
download
0
Transcript of corporate value creation for japan's construction firms in the
CORPORATE VALUE CREATION FOR JAPAN'S CONSTRUCTION FIRMS IN THE
SHRINKING AND CHANGING DOMESTIC MARKET
by
Masahiko Kanari
B. Eng., Department of Architecture
Waseda University, Tokyo, Japan
(1991)
Submitted to the Department of Civil and Environmental Engineeringin Partial Fulfillment of the Requirements for the Degree of
MASTER OF SCIENCE
in Civil and Environmental Engineering
at the
Massachusetts Institute of Technology
June 2003
© 2003 Masahiko Kanari, All right reserved.
MASSACHUSETS INSTITUTEOF TECHNOLOGY
JUN 0 2 2003
LIBRAR IES
The author hereby grants to MIT permission to reproduce and distribute publiclypaper and electronic copies of this thesis document in whole or in part.
Signature of Author
Certified by
Department of Civil and Environmental EngineeringMay 1, 2003
#lred MoavenzadehJames Mason Crafts Professor of Engineering Systems
Professor of 9ivil and Environmental EngineeringThesis Supervisor
Accepted byOral Buyukozturk
Chairman, Departmental Committee on Graduate Studies
BARK-R

CORPORATE VALUE CREATION FOR JAPAN'S CONSTRUCTION FIRMS IN THE
SHRINKING AND CHANGING DOMESTIC MARKET
by
Masahiko Kanari
Submitted to the Department of Civil and Environmental Engineeringon May 1, 2003 in Partial Fulfillment of the requirements for
the Degree of Master of Science in Civil and Environmental Engineering.
ABSTRACT
As Japan's bubble economy collapsed, the time when the economy was surely growingwas finished. In this high economic growth period, the social system such as Keiretsu (anetwork of Japan's firms organized around main bank), the seniority system, and lifetimeemployment, had formed centering on harmony. But now this system is disappearing. Inaddition, the introduction of International Accounting Standards (IAS) ruthlessly discloses thereal financial conditions of Japan's firms and drives the firms to adverse circumstances. Thefirms have to sustain these changes and compete to survive in the shrinking market.
It is the time also for Japan's construction firms to change their business policy. Thetime when keeping a constant share always brought promised profits and the all firms coexistedin harmony has ended. The firms now have to pay attention to their profit rates and promoteshareholders' interests as a top priority. At last, the firms have started to take serious approachto create their corporate value.
The main purpose of this thesis is to find ways for the construction firms to createcorporate value in Japan's shrinking construction market. To accomplish this purpose, thethesis studies the following three points: (1) the profit structure of Japan's construction firms,(2) the effect of introduction of IAS, especially introduction of cash flow statements, and (3)valuation methods. These three points lead the following three factors to value firms: (1)Invested capital, (2) Free cash flows, and (3) Weighted average cost of capital. The discountedcash flow model including EVA and MVA uses these three factors to value firms. Moreover,the real option method can add the value of the firms' management flexibilities. Real optionsare becoming crucial for corporate valuation in this uncertain market.
In the end of the thesis, it verifies these valuation methods by using the financial dataof Japan's construction firms in fiscal 2001. These valuation methods allow the firms to findright directions in which they should follow in order to create their value in the changing andshrinking construction market.
Thesis Supervisor: Fred MoavenzadehTitle: Professor of Civil and Environmental Engineering

-4-

ACKNOWLEDGEMENTS
I would like to express my gratitude, first, to Professor Moavenzadeh, who was my
academic and thesis advisor. His encouragement and suggestions were invaluable for me to
finish my research.
I also would like to express my appreciation to Obayashi Corporation for generously
supporting my research and giving me the opportunity to study at MIT. Moreover, during his
stays in Boston, Mr. Takeo Obayashi, a vice chairman of Obayashi Corporation, gave me a lot
of insightful suggestions and ideas for my research. His clear and acute perspective on the
construction industry impressed me very much.
I also would like to express my thanks to my colleagues whom I worked with at
Obayashi. They understood my desire to study abroad, and supported me greatly before I
came here. Without their supports, I could not have been here.
I am grateful to my classmates in the Construction Engineering and Management
program, who gave me friendship, warm supports, and fun throughout two years at MIT. They
also spared their precious time for my research. Their valuable comments and advice always
pulled my research back onto the right track.
I wish to thank my father Tsunetomo, my mother Michiko, and my
support, help, and encouragement was indispensable during my research.
Finally, I wish to thank Ko-Hsin, my fiancee.
this work could not have been completed.
sister Yoko whose
Without your love, support, and fun,
Masahiko Kanari
Boston, Massachusetts
May, 2003
-5-

-6-
TABLE OF CONTENTS
TITLE ................................................................................................ ... ...............................- 1
ABSTRACT .............................................................................................. ...........................- .. 3
ACKNOW LEDGEM ENT ....................................................................................................... 5
TABLE OF CONTENTS ......................................................................................................... 7
LIST OF FIGURES ..................................................................................................................... 11
LIST OF TABLES ....................................................................................................................... 13
CHAPTER 1 INTRODUCTION .......................................................................................... 15
1.1 Need for Value Creation ........................................................................................ 15
1.2 Value Creation for the Construction Industry ...................................................... 15
1.3 Purpose of the Thesis ............................................................................................ 15
1.4 Scope of the Thesis .............................................................................................. 16
CHAPTER 2 BACKGROUND ............................................................................................ 17
2.1 Changing the Driving Force of Japan's Economy ............................................... 17
2.1.1 Harmony ..................................................................................................... 17
2.1.2 Competition ............................................................................................... 23
2.2 Interests of Shareholders ...................................................................................... 25
2.3 Struggles for Survival .......................................................................................... 28
2.4 Construction Industry Revitalization Program ................................................... 30
CHAPTER 3 SALES, COSTS, AND PROFITS ...................................................................... 33
3.1 Characteristics of the Construction Industry ......................................................... 33
3.2 Financial Structure Analysis ................................................................................ 34
3.2.1 Financial Structure ..................................................................................... 34
3.2.2 Ratio Analysis for Financial Structure ...................................................... 37
3.2.3 Off-balance Sheet ........................................................................................ 39
3.3 Process of Construction and Revenue Recognition ............................................. 40
3.3.1 Percentage of Completion Method and Completed Contract Method ...... 40
-7-
3.3.2 Process of Construction and Accounting Treatments ................................. 41
3.4 Profit Structure Analysis ..................................................................................... 42
3.4.1 Profit Structure .......................................................................................... 42
3.4.2 Ratio Analysis for Profit Structure ............................................................. 45
3.5 Break-even Analysis ............................................................................................. 48
3.6 Declining in Profitability ...................................................................................... 53
CHAPTER 4 CASH FLOW S .............................................................................................. 55
4 .1 C ash F lo w s ............................................................................................................... 5 5
4.1.1 Changes in Business Environment ............................................................ 55
4.1.2 Definition of Cash Flows .......................................................................... 56
4.1.3 Relation between Income Statements and Cash Flows ............................. 58
4.2 International Accounting Standard Setting .......................................................... 61
4.2.1 Introduction of IAS ................................................................................... 61
4.2.2 New Consolidated Accounting Rule ........................................................... 62
4.2.3 Fair Value Accounting ............................................................................... 64
4.2.4 Retirement Benefit Accounting .................................................................. 64
4.3 Statement of Cash Flows ..................................................................................... 66
4.3.1 Cash Flow from Operating Activities (CFO) ................................................. 67
4.3.2 Cash Flow from Investing Activities (CFI) ................................................... 68
4.3.3 Cash Flow from Financing Activities (CFF) ................................................. 68
CHAPTER 5 CASH FLOW ANALYSIS ................................................................................. 69
5.1 Relation among Statement of Cash Flows and Other Financial Statements ........ 69
5.2 Cash Flow Analysis ............................................................................................... 71
5.2.1 Solvency Assessment ................................................................................. 71
5.2.2 Cash Flow Profile Analysis ........................................................................ 73
5.2.3 Ratio Analysis for Cash Flows .................................................................... 77
5.3 M anagement of Cash Flows ................................................................................. 80
5.3.1 M anagement of CFO ................................................................................. 80
5.3.2 M anagement of CFI ................................................................................... 87
-8-
5.3.3 M anagement of CFF ................................................................................. 88
5.4 Contractor Rating System for Public Works and Cash Flows ................ 89
5.4.1 New indexes of business condition analysis ............................................. 89
5.4.2 Indexes by Cash Flows .............................................................................. 93
CHAPTER 6 INVESTED CAPITAL, RETURN AND COST OF CAPITAL ............ 95
6.1 Free Cash Flows ................................................................................................... 95
6.1.1 Free Cash Flows (FCF) ............................................................................... 95
6.1.2 Free Cash Flow and Other Cash Flow M easures ...................................... 97
6.1.3 Use of Free Cash Flows ............................................................................ 98
6.2 Cost of Capital ....................................................................................................... 100
6.2.1 W eighted Average Cost of Capital (W ACC) ................................................ 100
6.2.2 W ACC and Capital Structure ....................................................................... 103
6.3 Return on Invested Capital ..................................................................................... 105
6.3.1 Return on Invested Capital (ROIC) ............................................................. 105
6.3.2 Disaggregating ROIC ................................................................................... 106
CHAPTER 7 VALUATION .................................................................................................... 109
7.1 Discounted Cash Flow M odel (DCF) ...................................................................... 109
7.1.1 Net Present Value (NPV) ............................................................................. 109
7.1.2 Economic Value Added (EVA) .................................................................... 111
7.1.3 M arket Value Added (M VA) ........................................................................ 112
7.2 Real Options Value (ROV) ...................................................................................... 113
CHAPTER.8 VALUE CREATION ........................................................................................ 115
8.1 Value of Firm s in the Construction Industry .......................................................... 115
8.1.1 M easuring Value of Firm ............................................................................. 115
8.1.2 Cash Flow M anagement .............................................................................. 116
8.1.3 Capital Structure .......................................................................................... 118
8.1.4 Cost of Equity and Debt ............................................................................... 120
8.1.5 Cost of Capital ............................................................................................. 127
-9-

8.1.6 Return on Invested Capital ........................................................................... 129
8.1.7 EVA and M VA .............................................................................................. 131
8.1.8 Real Option Value ........................................................................................ 133
8.2 Value Creation ........................................................................................................ 139
8.3 Corporate Value ......................................................................... 143
CHAPTER.9 CONCLUSIONS ............................................................. 145
BIBLIOGRAPHY ............................................................................................... 149
- 10 -
LIST OF FIGURES
Figure 2.1-1:
Figure 2.2-1:
Figure 2.2-2:
Figure 2.3-1:
Figure 2.3-2:
Figure 3.2-1:
Figure 3.3-1:
Figure 3.4-1:
Figure 3.5-1:
Figure 3.5-2:
Figure 3.5-3:
Figure 3.5-4:
Figure 3.6-1:
Figure 4.1-1:
Figure 4.1-2:
Figure 4.1-3:
Figure 4.1-4:
Figure 4.1-5:
Figure 4.3-1:
Figure 5.1-1:
Figure 5.2-1:
Figure 5.2-2:
Figure 5.3-1:
Figure 5.3-2:
Figure 5.3-3:
Figure 5.3-4:
Figure 5.3-5:
Figure 5.3-6:
Figure 6.1-1:
Trend of Construction Investments ................................................................. 24
Ratio of Mutual Shareholding ........................................................................ 25
Equity Ratio of Construction Industry ............................................................ 26
Trend of Bankruptcy in Construction Industry ............................................... 28
Trend of Market Share in Construction Industry ............................................. 29
Financial Structure of Obayashi in 2002 ........................................................ 36
Construction Process and Accounting Treatments ........................................... 41
The Process of Construction and Revenue Recognition ................................. 44
B reak-E ven Point ............................................................................................ 48
Marginal Profit & Break-Even Point .................................................................. 49
Income Structure of Japan's Major Construction Firms in 2002 .................... 50
Profit M axim ization ....................................................................................... 51
Declining Profitability of Construction Industry ............................................. 53
Difference between Profit and Cash .............................................................. 57
Difference between Cash Flows and Income Statements ............................... 58
Relation between Sales and Cash Flows ........................................................ 59
Relation between COGP and Cash Flows ...................................................... 59
Net Income and Cash Flow with Capital Expenditure .................................... 60
Three Categories of the Statement of Cash Flows .......................................... 66
Relationship among Financial Statements ..................................................... 70
Important Factors in Solvency Assessment ................................................... 72
Relationship of Income Flows and Cash Flows ............................................. 76
Cash Inflows from Construction of Completion ................................................. 81
Computing for Cash Inflows from Construction of Completion ............ 82
Cash Outflows for Costs of Construction ........................................................ 85
Computing for Cash Outflows for Costs of Construction ............................... 86
Cash Inflows from Investing Activities .............................................................. 87
Cash Flows from Financing Activities ................................................................ 88
C oncept of FC F .............................................................................................. 95
- 11 -
Figure 6.1-2:
Figure 6.1-3:
Figure 6.2-1:
Figure 6.2-2:
Figure 6.2-3:
Figure 7.1-1:
Figure 8.1-1:
Figure 8.1-2:
Figure 8.1-3:
Figure 8.1-4:
Figure 8.1-5:
Figure 8.1-6:
Figure 8.1-7:
Figure 8.1-8:
Figure 8.1-9:
Figure 8.1-10:
Figure 8.1-11:
Figure 8.1-12:
Figure 8.1-13:
Figure 8.1-14:
Figure 8.2-1:
FCF and Other M easures ................................................................................. 97
U se of FCF ..................................................................................................... 99
CAPM (Risk & Return) .................................................................................... 102
Beta ................................................................................................................... 102
W ACC & Capital Structure ............................................................................... 103
EVA and M VA ............................................................................................... 112
Cash flows from Operating Activities ............................................................... 116
Interest Bearing Debt Ratio of Japan's Construction Firms in 2002 ................ 118
Beta and ROE (1) .............................................................................................. 121
Beta and ROE (2) .............................................................................................. 123
Beta and D/Capital ............................................................................................ 123
Yield Curve in D ecem ber 2002 ......................................................................... 124
Stock Price, Rating, and Yield Curve of JD C Corporation ............................... 125
W ACC and ROE ............................................................................................... 127
W ACC and Interest Bearing Debt Ratio ........................................................... 128
W ACC and Return on Invested Capital .......................................................... 130
Growth Option Payoff Diagram ...................................................................... 134
Option to Alter Operating Scale Payoff Diagram ........................................... 135
Option to Abandon Payoff Diagram ............................................................... 136
Public Construction Investments and Construction Stock Price Index ........... 138
Business Domain and Added Value in the Construction Industry .................... 139
-12 -

LIST OF TABLES
Table 2.1-1:
Table 2.1-2:
Table 2.1-3:
Table 2.2-1:
Table 4.2-1:
Table 4.2-2:
Table 5.2-1:
Table 5.2-2:
Table 5.2-3:
Table 5.3-1:
Table 5.4-1:
Table 5.4-2:
Table 8.1-1:
Table 8.1-2:
Table 8.1-3:
Table 8.1-4:
Table 8.1-5:
Table 8.1-6:
Table 8.1-7:
Table 8.1-8:
Top 32 Japan's Construction Firms in 2002 ...................................................... 18
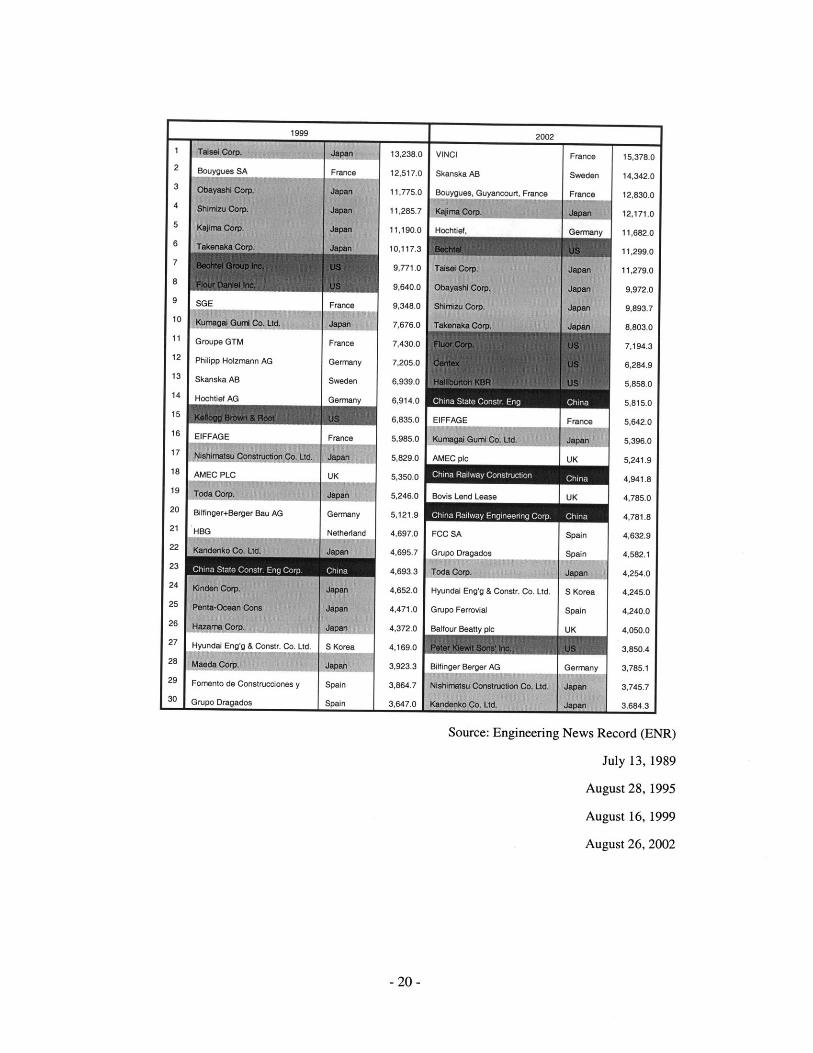
ENR Top 30 Global Contractors ..................................................................... 19, 20
Construction Firms and M ain Banks ............................................................... 21
Awards for Excellence in Corporate Disclosure ............................................... 27
Schedule of the introduction of IAS ................................................................. 62
The Number of Consolidated Subsidiaries ...................................................... 63
Cash Flow Assessment ......................................................................................... 73
Cash Flow Profiles ............................................................................................ 74
Cash Flow Profiles of Japan's Construction Firms .......................................... 75
Ratio of Cash Received to Expenditure of Japan's Top 35 Construction Firms ... 83
New Indexes of Business Condition Analysis ................................................. 91
Indexes of Business Condition of Construction Firms in 2002 ........................ 92
Beta of Japan's Construction Firms .................................................................... 120
Beta and ROE ..................................................................................................... 122
Beta and D/Capital .............................................................................................. 124
Rating and Interest Bearing Debt Rate ............................................................... 126
W ACC and ROE ................................................................................................. 127
W ACC and Interest Bearing Debt Ratio ............................................................. 128
W ACC, ROIC and EVA ...................................................................................... 132
Real Option Examples ........................................................................................ 133
- 13 -

- 14 -
CHAPTER 1
INTRODUCTION
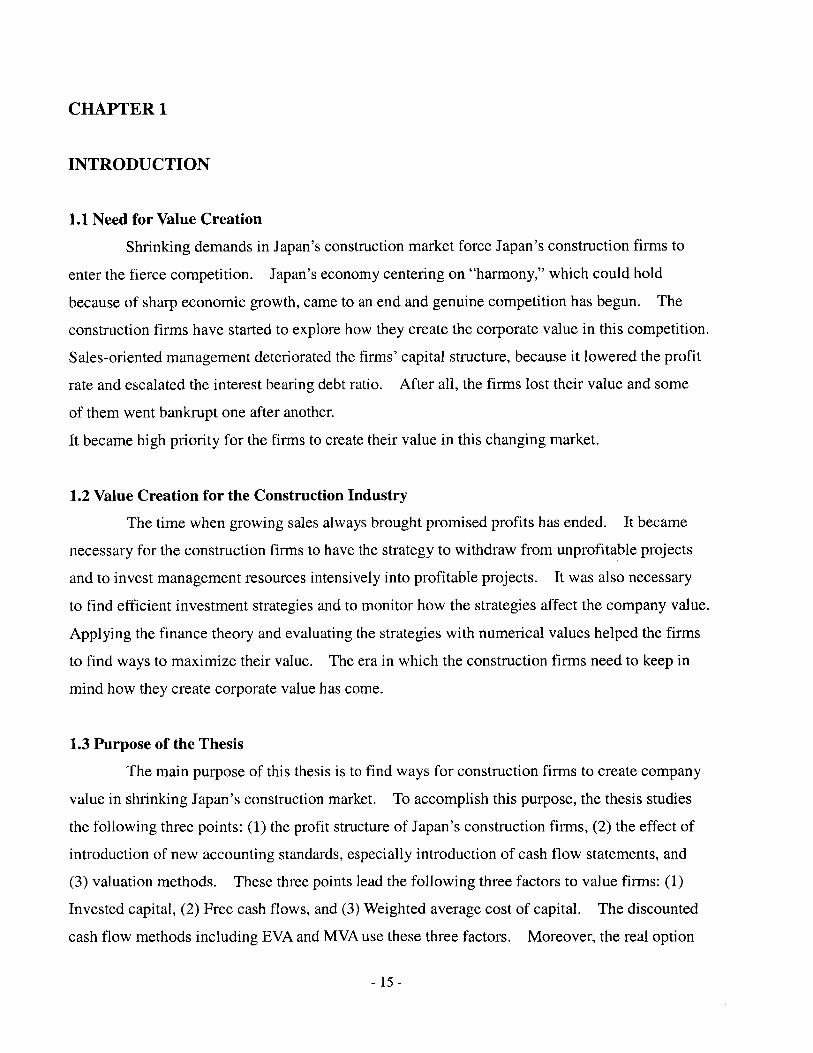
1.1 Need for Value Creation
Shrinking demands in Japan's construction market force Japan's construction firms to
enter the fierce competition. Japan's economy centering on "harmony," which could hold
because of sharp economic growth, came to an end and genuine competition has begun. The
construction firms have started to explore how they create the corporate value in this competition.
Sales-oriented management deteriorated the firms' capital structure, because it lowered the profit
rate and escalated the interest bearing debt ratio. After all, the firms lost their value and some
of them went bankrupt one after another.
It became high priority for the firms to create their value in this changing market.
1.2 Value Creation for the Construction Industry
The time when growing sales always brought promised profits has ended. It became
necessary for the construction firms to have the strategy to withdraw from unprofitable projects
and to invest management resources intensively into profitable projects. It was also necessary
to find efficient investment strategies and to monitor how the strategies affect the company value.
Applying the finance theory and evaluating the strategies with numerical values helped the firms
to find ways to maximize their value. The era in which the construction firms need to keep in
mind how they create corporate value has come.
1.3 Purpose of the Thesis
The main purpose of this thesis is to find ways for construction firms to create company
value in shrinking Japan's construction market. To accomplish this purpose, the thesis studies
the following three points: (1) the profit structure of Japan's construction firms, (2) the effect of
introduction of new accounting standards, especially introduction of cash flow statements, and
(3) valuation methods. These three points lead the following three factors to value firms: (1)
Invested capital, (2) Free cash flows, and (3) Weighted average cost of capital. The discounted
cash flow methods including EVA and MVA use these three factors. Moreover, the real option
- 15 -
method can value the management flexibility. This method is becoming critical for corporate
valuation. In the end, the valuation methods allow firms to find directions in which they should
follow in order to create their value in the changing industry.
1.4 Scope of the Thesis
The valuation methods for Japan's construction firms can be applicable to other industry
and firms. However, the thesis limits its scope to Japan's construction market by Japan's
construction firms and shows its applicability to the defined scope through data analyses in
Chapter 8.
- 16 -
CHAPTER 2
BACKGROUND
In this chapter, we explore the background of this thesis. In the first section, we
examine how Japan's market has changed after bursting Japan's bubble economy. And in the
subsequent two sections, we study the effects of the market changes on the construction industry
and the current situation of the construction firms. In the last section of this chapter, we review
the Construction Industry Revitalization Program released by Ministry of Land, Infrastructure
and Transport and further analyze the current situation of the industry.
2.1 Changing the Driving Force of Japan's Economy
2.1.1 Harmony
When we think of what drives the capitalistic economy, we definitely arrive at the word,
"competition." In the intensely competitive society, firms make every effort to (1) increase the
market share as far as possible and (2) decrease fixed costs and expenses and raise profit rates.
In the end, the firms make maximum returns to their shareholders and extend their business.
As we look over the sales ranking of Japan's large construction firms from the end of
the 1980s to the present time (Figure 2.1-1 and Figure 2.1-2), we find that the sales ranking did
not change significantly until the middle of the 1990s. What does this unchanged trend of
ranking for nearly ten years tell us? One possibility is that there could be no real sense of
competition during this period. Of course, there are no ways to prove it.
As we examine the trend of sales ranking of overseas construction firms in Figure 2.1-2,
not only did their ranking considerably change but also many firms no longer exist now.
Then, how can Japan's firms harmonize their share with each other without
competition?
- 17 -
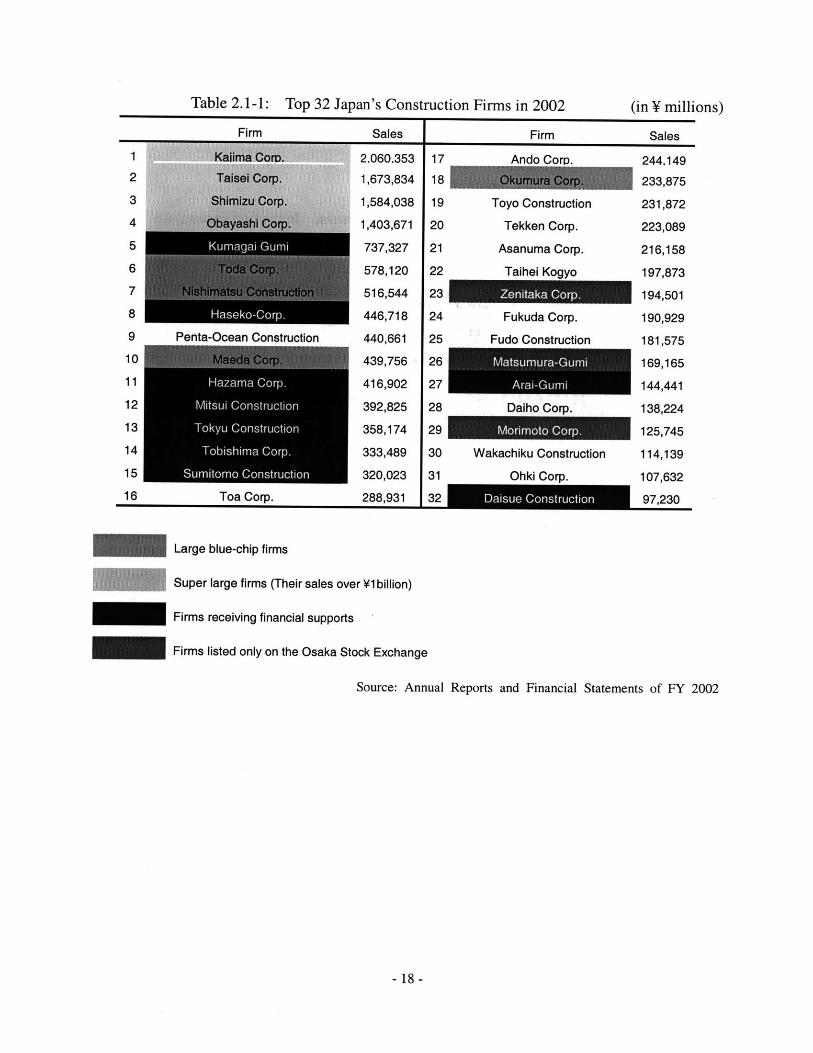
Table 2.1-1: Top 32 Japan's Construction Firms in 2002
Firm Sales
1
2
3
4
5
6
7
8
9
10
11
12
13
14
15
16 Toa Corp.
Firm
Ando CorD.
Toyo Construction
Tekken Corp.
Asanuma Corp.
Taihei Konvo
2,060.353
1,673,834
1,584,038
1,403,671
737,327
578,120
516,544
446,718
440,661
439,756
416,902
392,825
358,174
333,489
320,023
288,931
17
18
19
20
21
22
23
24
25
26
27
28
29
30
31
32
Large blue-chip firms
Super large firms (Their sales over V1 billion)
Firms receiving financial supports
Firms listed only on the Osaka Stock Exchange
Source: Annual Reports and Financial Statements of FY 2002
- 18 -
Penta-Ocean Construction
Sales244.149
233,875
231,872
223,089
216,158
197,873
194,501
190,929
181,575
169,165
144,441
138,224
125,745
114,139
107,632
97,230
Fukuda Corp.
Fudo Construction
Wakachiku Construction
Ohki Corp.
,
(in Y millions)
Sales
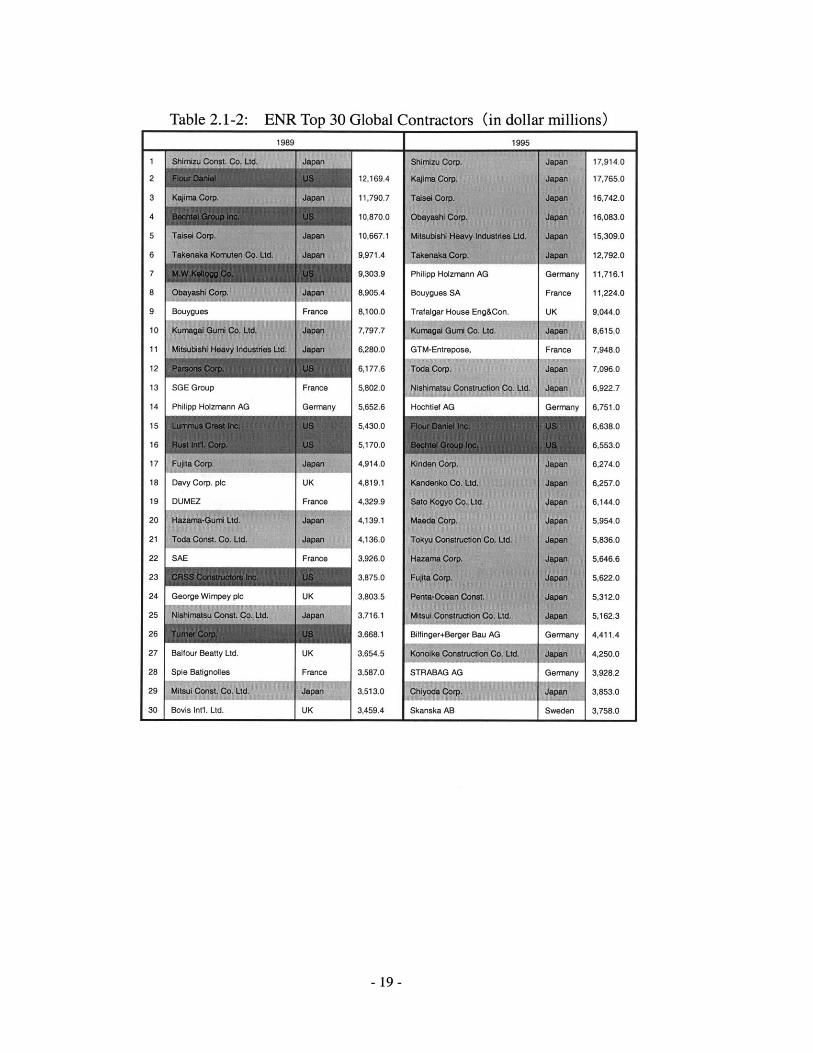
Table 2.1-2: ENR Top 30 Global Contractors (in dollar millions)1989
1 Shinizu onst. Co. Wt. Japn
2 12,169.4
3 Kfm or pn 11,790.7
4 10,870.0
5 Tals4l Coras 10,667.1
6 Takwnak ,pa 9,971.4
7 9,303.9
8 Obavashl Corp. Japan 8,905.4
9 Bouygues France 8,100.0
10 Kumagal Gumi CO. Ltd Japan 7,797.7
11 MitsubisN Heavy Industrie Ltd 6,280.0
12 6,177.6
13 SGE Group France 5,802.0
14 Philipp Holzmann AG Germany 5,652.6
15 5,430.0
16 5,170.0
17 Fujn Cop apan 4,914.0
18 Davy Corp. plc UK 4,819.1
19 DUMEZ France 4,329.9
20 Hazama-Gumni Ltd. Japan 4,139.1
21 To-da Const. Co. Ltd, Japan 4,136.0
22 SAE France 3,926.0
23 3,875.0
24 George Wimpey plc UK 3,803.5
25 Nishimatsu Const. Co. Ltd., aa 3,716.1
26 3,668.1
27 Balfour Beatty Ltd. UK 3,654.5
28 Spie Batignolles France 3,587.0
29 Mitsui Const. Co. Ltd, Japan 3,513.0
30 Bovis Int'l. Ltd. UK 3,459.4
1995
Philipp Holzmann AG
Bouygues SA
Trafalgar House Eng&Con.
Kumagai GumGo. Ltd.
GTM-Entrepose,
Hochtief AG
Bilfinger+Berger Bau AG
Konolke Construction Go. Ltd.
STRABAG AG
Chiyoda Corp
Skanska AB
JFan 17,914.0
Fane 17,765.0
16,742.0
16,083.0
15309.0
12,792.0
Germany 11,716.1
France 11,224.0
UK 9,044.0
jawa 8,615.0
France 7,948.0
5apan 7,096.0
jawe 6,922.7
Germany 6,751.0
6,638.0
6,553.0
Gan 6,274.0
6,257.0
japw 6,144.0
Japan 5,954.0
Japan 5,836.0
Jpn 5,646.6
-Japa 5,622.0
Japan 5,312.0
Japan 5,162.3
Germany 4,411.4
jawa 4,250.0
Germany 3,928.2
Japan 3,853.0
Sweden 13,758.0
- 19 -
I
1999
1
2
3
4
5
6
7
8
9
10
11
12
13
14
15
16
17
18
19
20
21
22
23
24
25
26
AMEC PLC
Toda Corp.
Bilfinger+Berger Bau AG
HBG
Kandenko Co, Ltd.
Chn .tate sr EgCr.
Kinden Corp.
Hazama Corp.
Hyundai Eng'g & Constr. Co. Ltd.
Maeda Corp,
Fomento de Construcciones y
Grupo Dragados
TA"se Corp.-r
July 13, 1989
August 28, 1995
August 16, 1999
August 26, 2002
-20 -
SGE
Kurmagai Gumi Co. Ltd,
Groupe GTM
Philipp Holzmann AG
Skanska AB
Hochtief AG
27
28
29
30
Japah 13,238.0
France 12,517.0
Jawn 11,775.0
11,285.7
Japan 11,190.0
Jgpan 10,117.3
9,771.0
9,640.0
France 9,348.0
Japan 7,676.0
France 7,430.0
Germany 7,205.0
Sweden 6,939.0
Germany 6,914.0
6,835.0
France 5,985.0
Japan 5,829.0
UK 5,350.-0
Japan 5,246.0
Germany 5,121.9
Netherland 4,697.0
6 Japan 4,695.7
-1 4,693.3
Japan 4,652.0
Japa .n 4,471.0
Japan 4,372.0
S Korea 4,169.0
Japan 3,923.3
Spain 3,864.7
Spain 3,647.0
EIFF AGE
Nishimatsu Construction Go. Ltd.
2002
VINCI France 15,378.0
Skanska AB Sweden 14,342.0
Bouygues, Guyancourt, France France 12,830.0
12,171.0
Hochtief, Germany 11,682.0
11,299.0
Talsi Cop. Jpan 11,279.0
Obayashl Corp. Japan 9,972.0
Shirizu Corp. Japan 9,893.7
Takenaka Corp. Japan 8,803.0
7,194.3
6,284.9
5,858.0
Chin Stte onst. Eg Cina 5,815.0
EIFFAGE France 5,642.0
Kumagai Gum-0 Co. Ltd. Japan 5,396.0
AMEC plc UK 5,241.9
China Rilway Construc"4,941.8
Bovis Lend Lease UK 4,785.0
.hn .. a.iwa Egineen Cor China. 4,781.8
FCC SA Spain 4,632.9
Grupo Dragados Spain 4,582.1
Toda Corp. Japan 4,254.0
Hyundai Eng'g & Constr. Co. Ltd. S Korea 4,245.0
Grupo Ferrovial Spain 4,240.0
Balfour Beatty plc UK 4,050.0
3,850.4
Bilfinger Berger AG Germany 3,785.1
Nishimatsu Construction Co. Ltd, Japan 3,745.7
Kandenko Co. Ltd. Japan 3,684.3
Source: Engineering News Record (ENR)
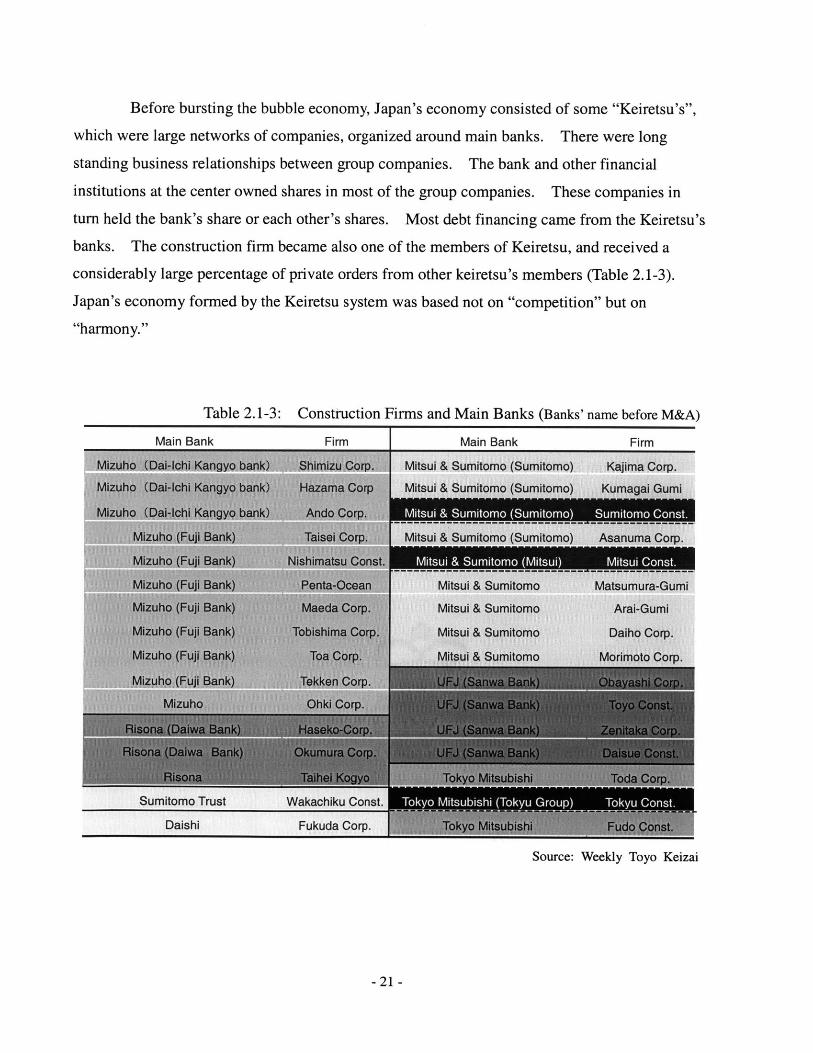
Before bursting the bubble economy, Japan's economy consisted of some "Keiretsu's",
which were large networks of companies, organized around main banks. There were long
standing business relationships between group companies. The bank and other financial
institutions at the center owned shares in most of the group companies. These companies in
turn held the bank's share or each other's shares. Most debt financing came from the Keiretsu's
banks. The construction firm became also one of the members of Keiretsu, and received a
considerably large percentage of private orders from other keiretsu's members (Table 2.1-3).
Japan's economy formed by the Keiretsu system was based not on "competition" but on
"harmony."
Table 2.1-3: Construction Firms and Main Banks (Banks' name before M&A)
Main Bank Firm I Main Bank Firm
Source: Weekly Toyo Keizai
-21-
Traditionally, Japan's employment system was also developed by a sense of harmony.
When Japan's firms hired employees, the firms guaranteed them lifetime job security and asked
them to swear their absolute loyalty to the firms. In addition, promotions and pay were
determined by the length of the service to the company. It was called seniority ranking system.
These systems, in which employees cooperate with each other harmoniously, played an
important role only at the time of Japan's high economic growth period in the 1970s and 1980s.
Furthermore, in the public works, selective competitive bidding had been mainly
adopted for one hundred years for public bidding. Depending on the scale of project, selective
competitive bidding system chose qualified firms that were allowed to bid the project. Because
of this, large firms were able to receive large projects and also small firms were able to receive
small projects. There was no severe competition between different scales of firms and they
could be segregated from each other. Moreover, the Dango system, whereby public projects are
divided among certain preselected contractors in a "share the wealth" scheme, still sometimes
exists. The Dango system could be the product of the contractors' seeking for not competition
but harmony.
- 22 -
2.1.2 Competition
Following the collapse of Japan's bubble economy, Japan's growing economy was
forced into negative growth (Figure 2.1-1).
At the same time, the information revolution by the Internet happened, economic
activities across national boarders and expanding business overseas became common, and,
finally it became required to introduce the International Accounting Standards (IAS) to Japan.
Under this situation, Japan's original economic system, the harmony-oriented system, reached its
limit of existence.
IAS includes (1) the introduction of the statement of cash flows that reflects the real
flows of funds, (2) the new consolidated financial statements that show the financial condition of
a parent company and its subsidiaries, (3) the fair value accounting that valuates the fair value of
securities holdings, (4) the accounting for retirement benefits that place retirement benefits on
balance sheets, (5) accounting for impairment of assets that will be adopted in 2005. Japan's
conventional accounting rule was able to absorb some changes in the financial conditions to
maintain Japan's inflexible systems, such as the lifetime employment system, the seniority
ranking system, and the Keiretsu system. However, the new IAS has disclosed all fluctuations
of the financial conditions of Japan's firms.
In the construction industry, the construction firms have started to lay off their
employees to reduce their fixed costs and expenses. The introduction of fair value accounting
has forced the firms to sell off valueless equity stakes the firms have long held under the
cross-shareholding system. Moreover, the firms are ending the seniority ranking system and
putting more emphasis on merit-based promotion systems. To receive new construction orders,
the firms cannot help entering new markets beyond the Keiretsu system. New Accounting
Standards force the construction industry to enter from the harmony-oriented economic system to
the competitive market.
At the same time, in the procurement of public construction projects, Japan's
government aimed to accelerate competitiveness, fairness, and accountability for the construction
industry. The government adopted (1) general competitive bidding corresponding to Agreement
on Government Procurement of WTO, (2) introduced an electronic bidding system by using the
internet, and (3) accepted various kinds of project delivery systems including Construction
Management.
- 23 -
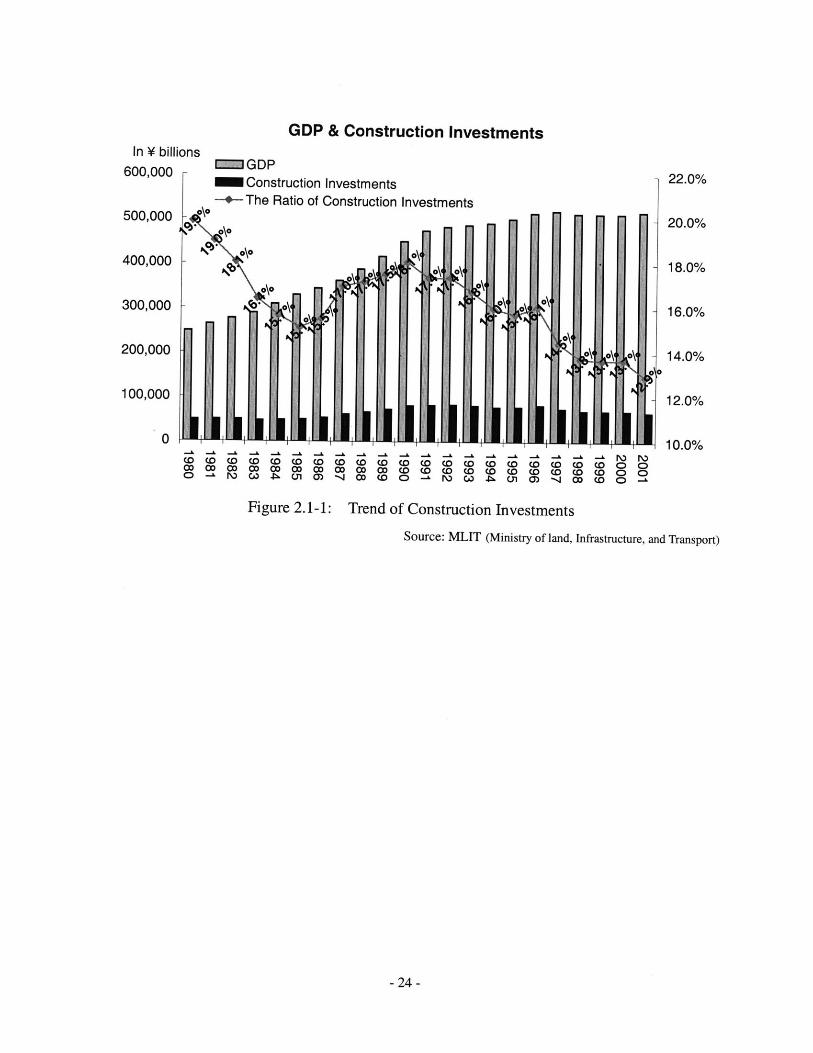
GDP & Construction InvestmentsIn V billions
600,000 - - 22.0%Construction Investments-+- The Ratio of Construction Investments
500,000 -\ - 20.0%d' o\o
400,000 A 1 - 18.0%
200,000 \14.0%200,000o 6\ 140o k'
100,000 12.0%
0 10.0%
00 O O 00 00 O O 00 00 O CO W CO ( W CO CO CO CO COCO --. 0 M - 0.n CO 0 - N) W -P .n M -4 00 CO 0
Figure 2.1-1: Trend of Construction Investments
Source: MLIT (Ministry of land, Infrastructure, and Transport)
-24 -
2.2 The Interests of Shareholders
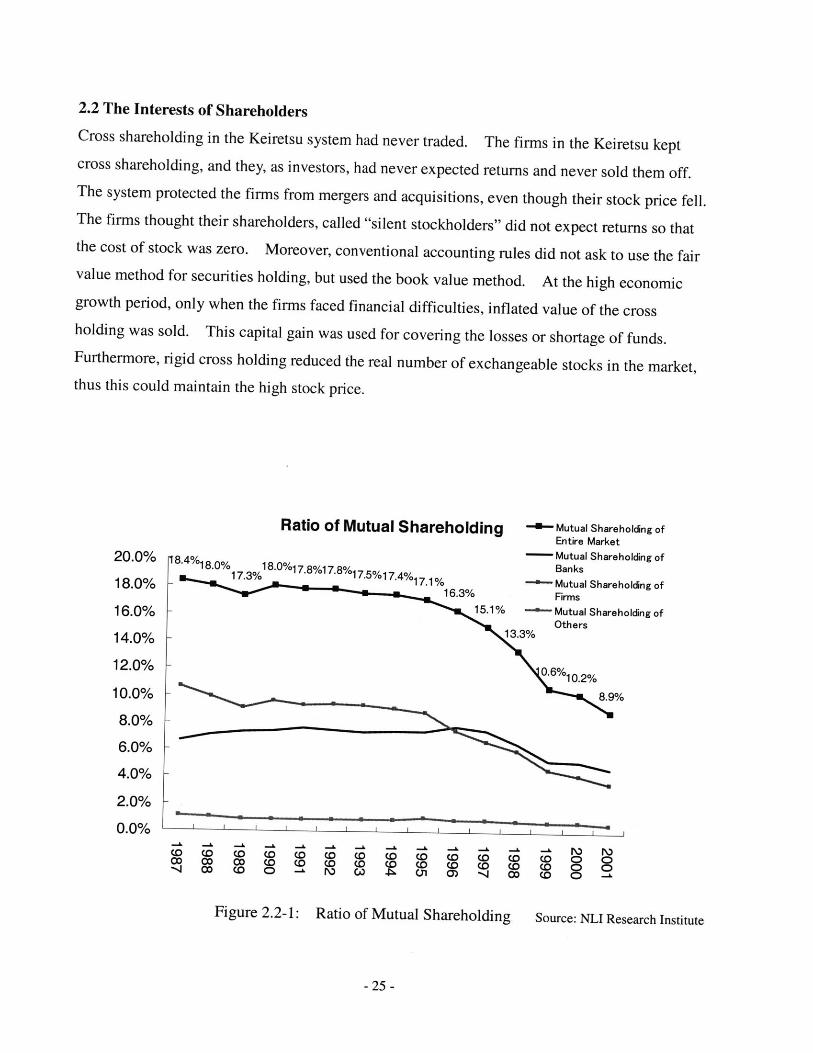
Cross shareholding in the Keiretsu system had never traded. The firms in the Keiretsu keptcross shareholding, and they, as investors, had never expected returns and never sold them off.The system protected the firms from mergers and acquisitions, even though their stock price fell.The firms thought their shareholders, called "silent stockholders" did not expect returns so thatthe cost of stock was zero. Moreover, conventional accounting rules did not ask to use the fairvalue method for securities holding, but used the book value method. At the high economicgrowth period, only when the firms faced financial difficulties, inflated value of the crossholding was sold. This capital gain was used for covering the losses or shortage of funds.Furthermore, rigid cross holding reduced the real number of exchangeable stocks in the market,thus this could maintain the high stock price.
Ratio of Mutual Shareholding -Mutual Shareholding ofEntire Market
20- Mutual Shareholding of20.0% 11.4% .% 7.8%1 7 . 8%j7.5%17.4% Banks13% 17.1% - Mutual Shareholding of18.0% -16.3% Firms
16.0% 15.1% - Mutual Shareholding of
13.3%14.0% -
12.0% -0.6%10.2%
10.0% - 8.*
8.0% -
6.0% -
4.0% -
2.0% -
0.0% ' ' ' '
D W r 2- C W Co M a C a(CD Wn CD CD 0 aWO CO CW W C (D(W (0 to (0 W t (0 D 0 04 W (0 0 -~ N\ W~ . M7 M -4 0W W 0 -
Figure 2.2-1: Ratio of Mutual Shareholding. Source: NLI Research Institute
-25 -
However, Japan's economy has deteriorated. And new accounting rule was introduced.
Then, the Keiretsu system collapsed. Finally, the ratio of cross holding has started to decline
and stocks have moved freely around the market since the late 1990s (Figure 2.2-1). All at
once, the main bank at the Keiretsu's center lost its financial power and could not play afund-raising role for other Keretsu's firms. Under this circumstance, corporate managers
cannot help attaching more importance to their firm's stock price than ever before, because they
need to collect funds from the stock markets and keep the stock price high.
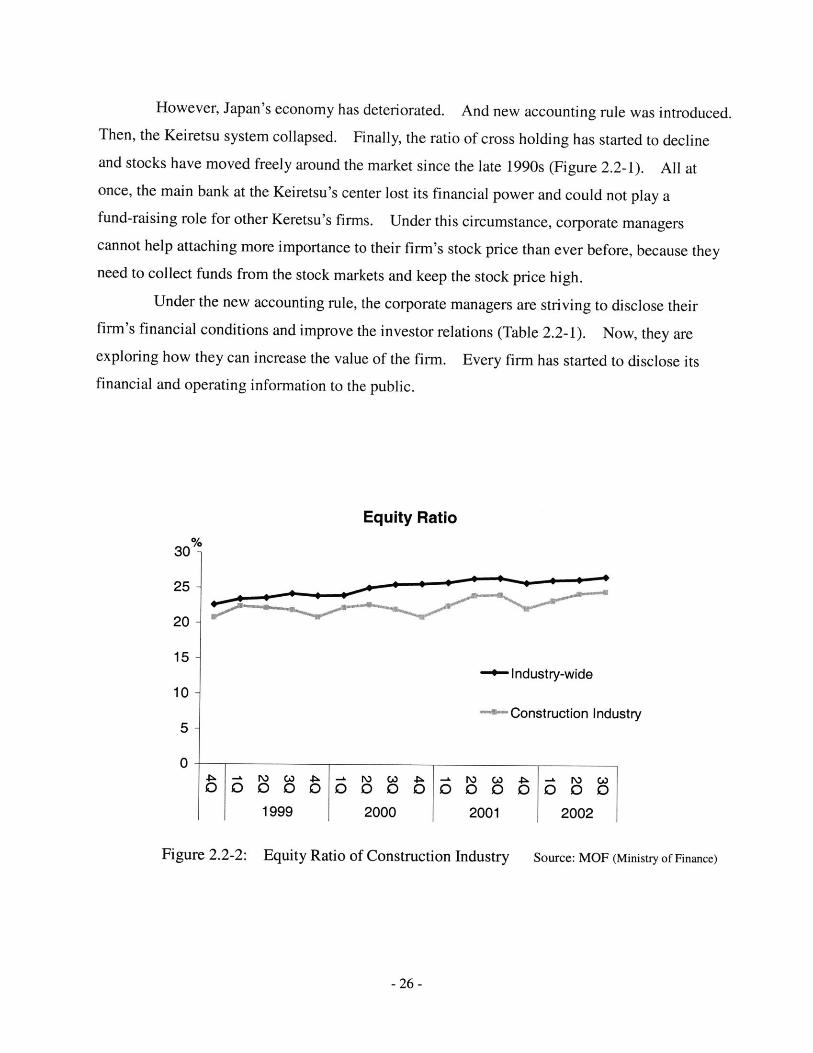
Under the new accounting rule, the corporate managers are striving to disclose their
firm's financial conditions and improve the investor relations (Table 2.2-1). Now, they are
exploring how they can increase the value of the firm. Every firm has started to disclose itsfinancial and operating information to the public.
Equity Ratio
30 -
25 J
20-
15 -p Industry-wide
10-Construction Industry
5-
0PO O CO -Pi - N LO 40k -0 00 00 0 00 0 00 00 00 0
1999 2000 2001 2002
Figure 2.2-2: Equity Ratio of Construction Industry Source: MOF (Ministry of Finance)
- 26 -
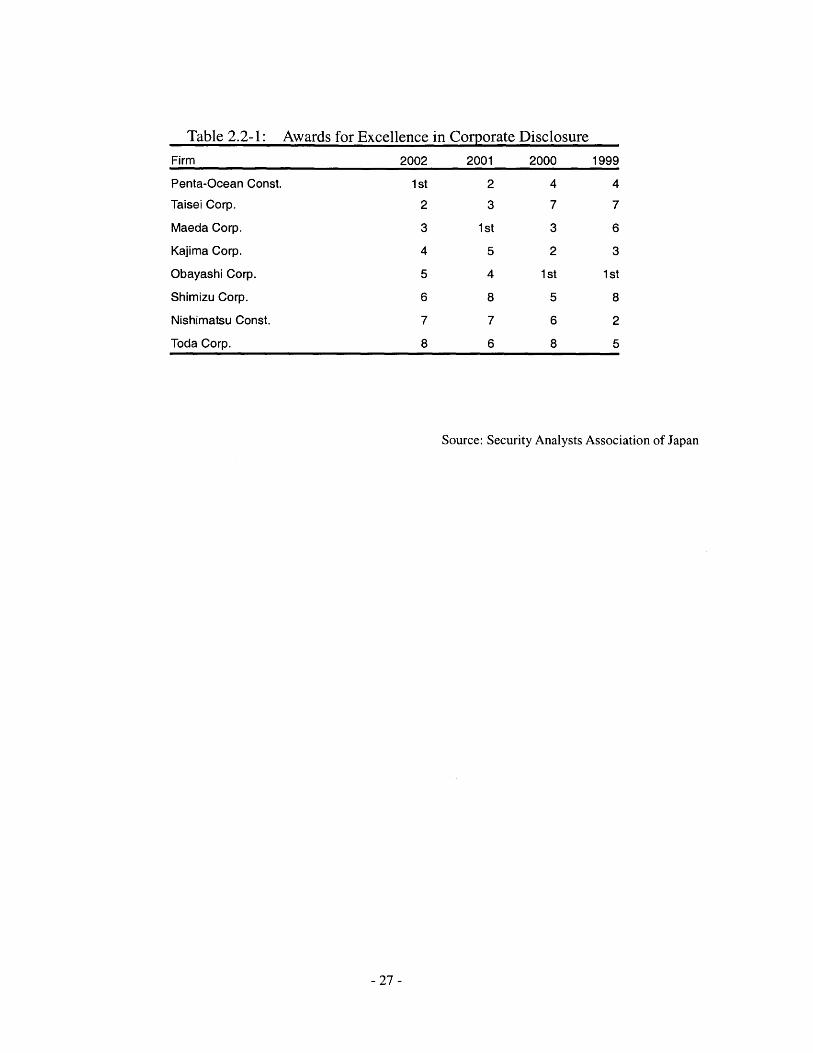
Table 2.2-1: Awards for Excellence in Corporate Disclosure
Firm 2002 2001 2000 1999
Penta-Ocean Const. 1st 2 4 4
Taisei Corp. 2 3 7 7
Maeda Corp. 3 1st 3 6
Kajima Corp. 4 5 2 3
Obayashi Corp. 5 4 1st 1st
Shimizu Corp. 6 8 5 8
Nishimatsu Const. 7 7 6 2
Toda Corp. 8 6 8 5
Source: Security Analysts Association of Japan
- 27 -
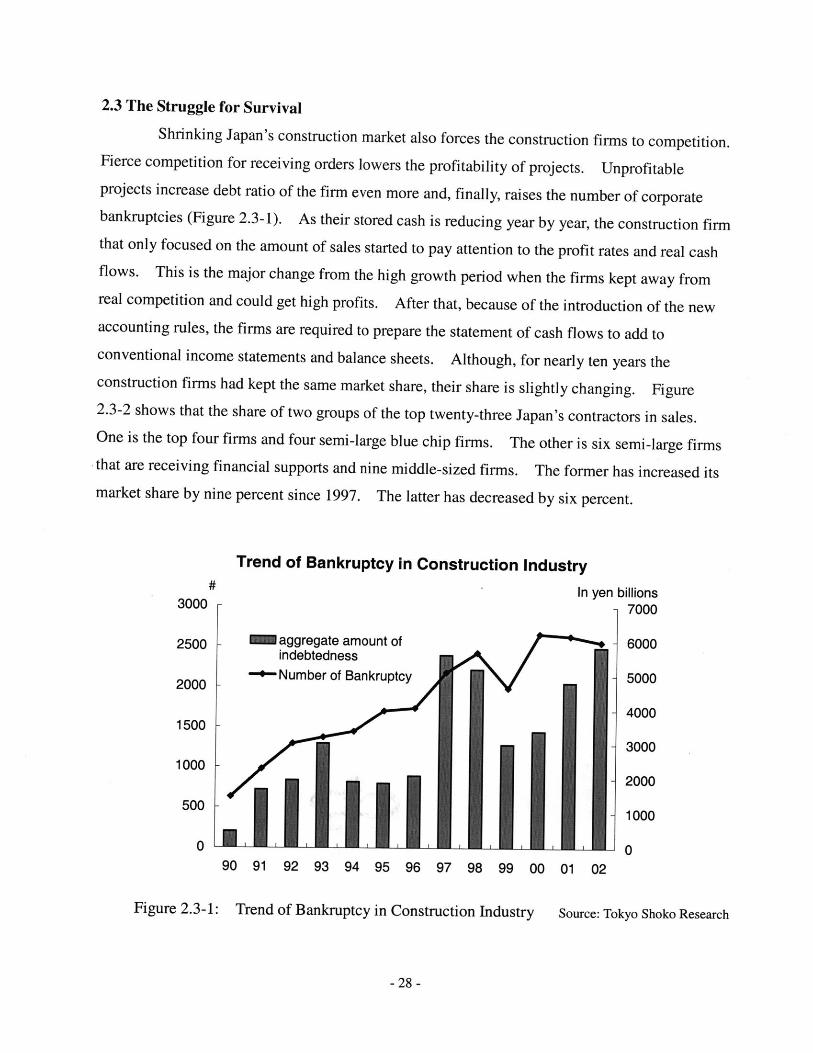
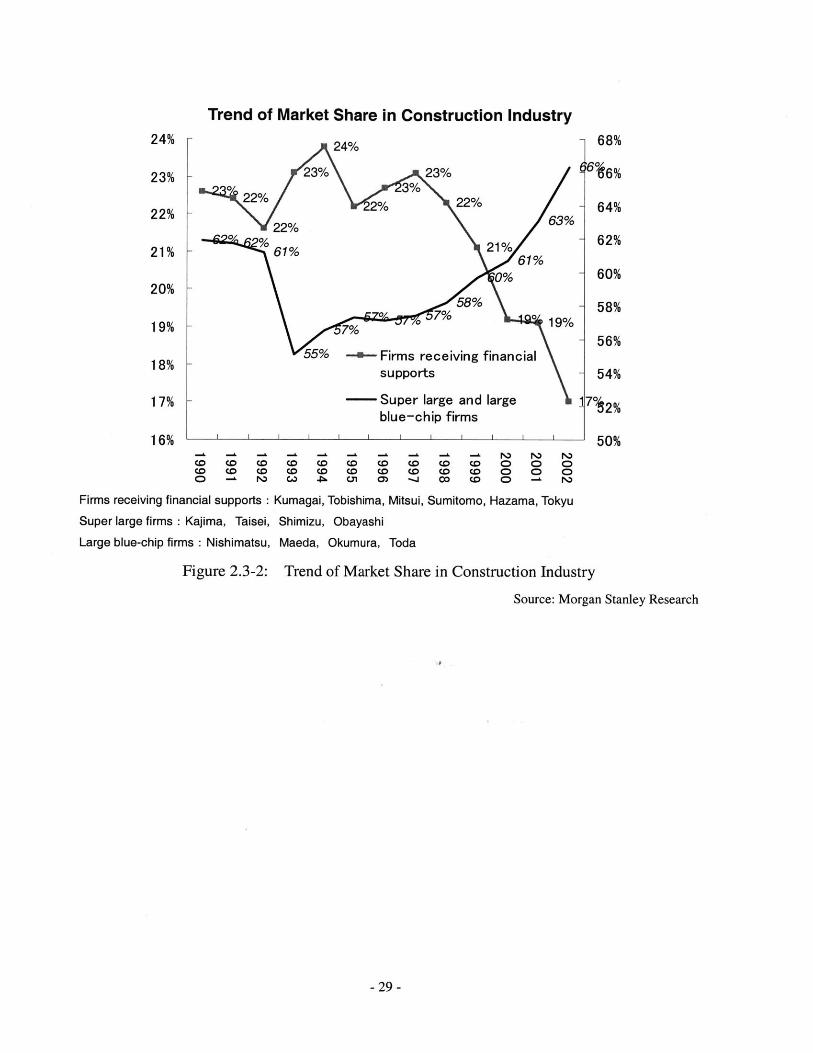
2.3 The Struggle for Survival
Shrinking Japan's construction market also forces the construction firms to competition.Fierce competition for receiving orders lowers the profitability of projects. Unprofitableprojects increase debt ratio of the firm even more and, finally, raises the number of corporatebankruptcies (Figure 2.3-1). As their stored cash is reducing year by year, the construction firmthat only focused on the amount of sales started to pay attention to the profit rates and real cashflows. This is the major change from the high growth period when the firms kept away fromreal competition and could get high profits. After that, because of the introduction of the newaccounting rules, the firms are required to prepare the statement of cash flows to add toconventional income statements and balance sheets. Although, for nearly ten years theconstruction firms had kept the same market share, their share is slightly changing. Figure2.3-2 shows that the share of two groups of the top twenty-three Japan's contractors in sales.One is the top four firms and four semi-large blue chip firms. The other is six semi-large firmsthat are receiving financial supports and nine middle-sized firms. The former has increased itsmarket share by nine percent since 1997. The latter has decreased by six percent.
Trend of Bankruptcy in Construction Industry
In yen billions3000 - 7000
2500 aggregate amount of - 6000indebtedness
2000 --- Number of Bankruptcy - 5000
- 40001500
- 0001000
- 000500
- 1000
0 090 91 92 93 94 95 96 97 98 99 00 01 02
Figure 2.3-1: Trend of Bankruptcy in Construction Industry Source: Tokyo Shoko Research
- 28 -
Trend of Market Share in Construction Industry
24% -
23% 23%0 3%
22% 2% 22% -
% 22 21% 63%
61% 2 1%
58% -
7% 7% 19%
55% -- Firms receiving financialsupports -
-- Super large and large
24%
23%
22%
21%
20%
19%
18%
17%
16%
Firms receiving financial supports:
Super large firms : Kajima, Taisei,
Large blue-chip firms : Nishimatsu,
W .% 01 0) -1
Kumagai, Tobishima, Mitsui,
Shimizu, Obayashi
Maeda, Okumura, Toda
cc Coco Co00 co
Sumitomo,
INa !3 %oD 0Do oD 0o -
Hazama, Tokyu
Figure 2.3-2: Trend of Market Share in Construction Industry
Source: Morgan Stanley Research
- 29 -
blue-chip firms' ' ' ' ' ' ' ' '
68%
64%
62%
60%
58%
56%
54%
50%' 'I
2.4 The Construction Industry Revitalization Program
In July 1999, the Ministry of Construction (the current Ministry of Land, Infrastructure
and Transport (MLIT)) made up the Construction Industry Revitalization Program as a new
strategic approach for the construction industry. In the current stagnation of Japan's economy,
the construction industry is being required to find urgent restructuring to revive itself again.
The revitalization program mentioned, "Through fair competition among firms, the construction
industry will revitalize its creativity and strength to meet the needs of economic society of the
2 1st century."(Translation mine) Moreover, the program suggests four main directions of the
corporate strategy that could critically influence the management of construction firms:
a) Concentrate the management resources on core business
Analyzing the profit structure and concentrating the management resources on core
business. This strategy suggests the promotion of restructuring the profit structure by
reducing debts and cutting personnel costs that have increased during the bubble
economy.
b) Strategic investment in growth areas
Investing the management resources in growing areas in which firms could have future
competitive advantages.
c) Clarification of the cost structure
Strengthen the cost competitive power. It is necessary to examine the cost structure of
construction firms and reduce the costs. Disclosing the cost structure is essential.
d) Strengthen the competitive power
Strengthen and differentiate the competitive power with quality, software, and
engineering.
Then, in December 2002, the Ministry of Land, Infrastructure and Transport released the
basic policy for the construction industry revitalization. The first part of the policy says that the
construction market keeps shrinking, and the construction firms lost their balance between the
- 30 -
earning power and the debt ratio. The policy also refers to two basic directions for the
revitalization: (1) the curtailment of unprofitable departments and shifting management resources
to profitable departments, and (2) the improvement of profitability by changing from
sales-oriented to profit-oriented management (Translation mine).
In order to implement those management reforms, it is essential for the construction
firms to analyze their profit structures and clarify the current management conditions. And then,
by using cash flows, the firm analyzes and evaluates its departments. Moreover, the changes in
the accounting standards, such as new consolidated financial statements rule, fair value
accounting, and the statement of cash flows also help clarify the advantage and profitability of
the construction firms.
-31 -

-32-
CHAPTER 3
SALES, COSTS, AND PROFITS
In this chapter, we elucidate the characteristics of the construction industry and examine
its financial and profit structures. Ratio analyses are useful for capturing these structures.
This chapter introduces some of useful ratio analyses. These ratio analyses are based on
finance and accounting books (Palepu, Bernard and Healy, 1999, Pratt, 2003, Myers and Brealey,
1999, Adrian, 1999). This chapter also explains two types of revenue recognition methods, the
percentage of completion method and the completed contract method. Depending on these
methods, accounted revenues are varied. This is the one of the reasons why the statement of
cash flows that discloses the firm's real financial condition is becoming important now. In the
end, we analyze profit creation ways by using financial and profit structures.
3.1 Characteristics of the Construction Industry
Each firm has its profit structure that has been developed for a long period. We can
read the structure's characteristics from the trend of the numbers in the financial statements.
The process of making profits and the level of the profits are unique because the profit structure
is made up of the firm's system and model. Whether the profitability of the firm is high or low
depends on the nature and features of the firm's profit structure. The precise understanding of
the profit structure will lead to some clear solutions to improve the profitability.
The construction firms have several different characteristics from those of other firm in
the manufacturing industry. The unique characteristics of the construction firms are the
following:
a) The construction industry is the general assembling production industry.
b) Each project a construction firm employs is somewhat unique as to its design and
required construction methods.
c) Often the construction project takes more than one year to complete.
d) Construction projects are usually manufactured away from the firm's central office.
e) The percentage of subcontract cost is high. The industry's production system
highly relies on subcontractors.
- 33 -
3.2 Financial Structure Analysis
3.2.1 Financial Structure
Unique external factors tend to shape the total financial structure of the construction
firm. These characteristics of the financial structure can be gathered from the financial
statements:
a) The percentage of the fix assets is relatively small:
Because the construction projects are implemented out of doors by single production,
the construction firm does not need to own the large amount of fixed assets. Compared
to the manufacturing firm, the construction firm has a relatively small percent of fixed
assets.
b) The expenditure for uncompleted projects is huge:
The expenditure of construction costs is, at first, treated as the expenditure for
uncompleted projects. The expenditure shown on the balance sheets is the results of
subtracting the cost of completed construction at the end of the fiscal year from the total
expenditure of construction in the fiscal year.
The expenditure deals with the current assets and it corresponds to the inventory in
the balance sheet. In the manufacturing industry, the large amount of work-in-process
is considered bad inventory and likely to be reduced. In the construction industry,
however, each project has its owner and fixed contract price so that the inventory is the
promised sales for the next fiscal years.
c) The advanced received for uncompleted projects is huge:
Under a contract for a construction project, the owner often makes payments to a
contractor as a deposit paid on the construction project along with its progress. The
received payments are, at first, recorded as the advanced received for uncompleted
projects and after the project is completed, the payments transfer to the construction of
completion.
In Japan, public projects pay forty percent of the total contract price as an advance
payment before starting the projects. The payments are also the advanced received.
While the advanced receives for uncompleted projects are treated as the current
- 34 -
liabilities, the firm has a roughly corresponding expenditure for executed work to
subcontractors.
d) The percentage of equity capital is relatively small:
Because the construction industry does not need to own the large amount of fixed
assets, its equity capital is usually small. The industry's equity ratio is smaller than
that of the manufacturing industry.
e) The percentage of subcontract costs among the cost of completion is high:
The construction industry is the general assembling production industry. The
materials that are the main components of the buildings are processed by the
subcontractors. The labors and machines that assembled the materials in the
construction sites are also subcontractors.
f) The percentage of marketing costs and the administrative costs is small:
The construction industry adopts the job order cost system so that the personnel
expenditures in the sites and the overhead expenditures for construction are included in
the cost of construction.
g) The component percentage of the depreciation expenses is small:
The ratio of the fixed assets is small so that the depreciation expenses are also small.
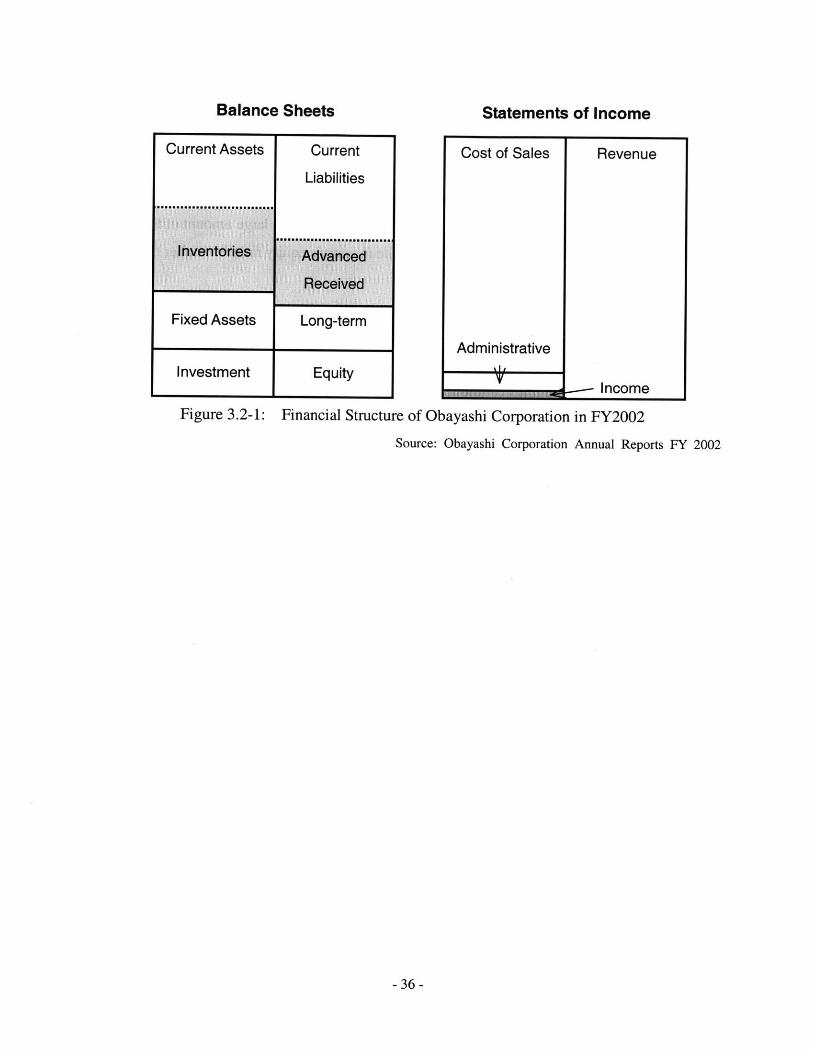
Figure 3.2-1 shows the percentage of each item in Obayashi's financial statements
- 35 -
Balance Sheets
Current Assets
Fixed Assets
Current
Liabilities
Long-term
Investment J Equity
Cost of Sales
Administrative
Revenue
Income
Figure 3.2-1: Financial Structure of Obayashi Corporation in FY2002
Source: Obayashi Corporation Annual Reports FY 2002
- 36 -
Statements of Income
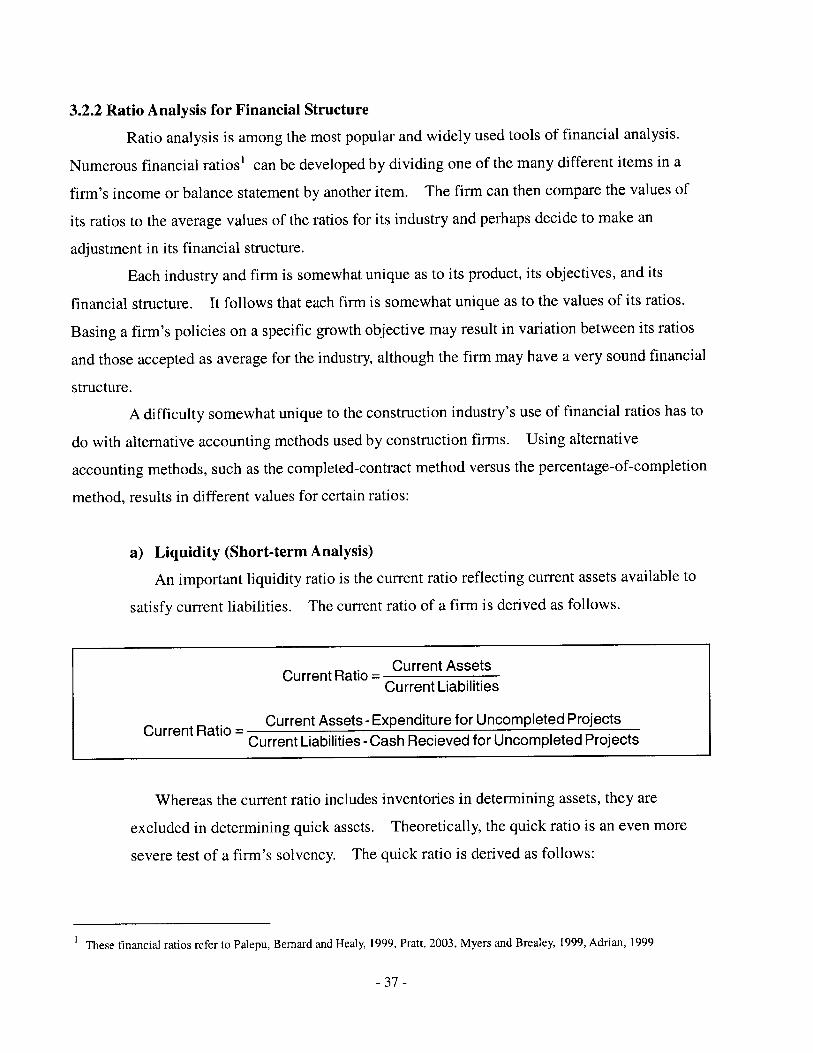
3.2.2 Ratio Analysis for Financial Structure
Ratio analysis is among the most popular and widely used tools of financial analysis.
Numerous financial ratios' can be developed by dividing one of the many different items in a
firm's income or balance statement by another item. The firm can then compare the values of
its ratios to the average values of the ratios for its industry and perhaps decide to make an
adjustment in its financial structure.
Each industry and firm is somewhat unique as to its product, its objectives, and its
financial structure. It follows that each firm is somewhat unique as to the values of its ratios.
Basing a firm's policies on a specific growth objective may result in variation between its ratios
and those accepted as average for the industry, although the firm may have a very sound financial
structure.
A difficulty somewhat unique to the construction industry's use of financial ratios has to
do with alternative accounting methods used by construction firms. Using alternative
accounting methods, such as the completed-contract method versus the percentage-of-completion
method, results in different values for certain ratios:
a) Liquidity (Short-term Analysis)
An important liquidity ratio is the current ratio reflecting current assets available to
satisfy current liabilities. The current ratio of a firm is derived as follows.
Current Ratio = Current AssetsCurrent Liabilities
Current Ratio =Current Assets -Expenditure for Uncompleted ProjectsCurrent Liabilities -Cash Recieved for Uncompleted Projects
Whereas the current ratio includes inventories in determining assets, they are
excluded in determining quick assets. Theoretically, the quick ratio is an even more
severe test of a firm's solvency. The quick ratio is derived as follows:
1 These financial ratios refer to Palepu, Bernard and Healy, 1999, Pratt, 2003, Myers and Brealey, 1999, Adrian, 1999
- 37 -
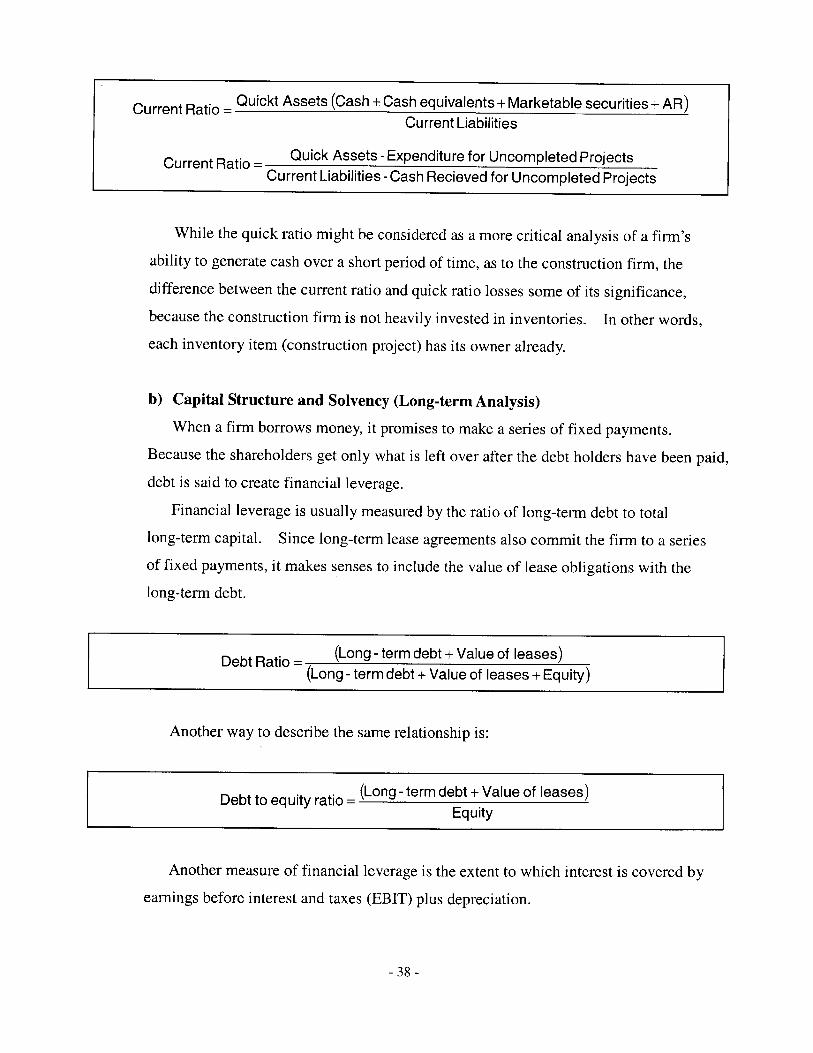
Current Ratio = Quickt Assets (Cash + Cash equivalents+ Marketable securities + AR)Current Liabilities
Current Ratio -Quick Assets - Expenditure for Uncompleted ProjectsCurrent Liabilities -Cash Recieved for Uncompleted Projects
While the quick ratio might be considered as a more critical analysis of a firm's
ability to generate cash over a short period of time, as to the construction firm, the
difference between the current ratio and quick ratio losses some of its significance,
because the construction firm is not heavily invested in inventories. In other words,
each inventory item (construction project) has its owner already.
b) Capital Structure and Solvency (Long-term Analysis)
When a firm borrows money, it promises to make a series of fixed payments.
Because the shareholders get only what is left over after the debt holders have been paid,
debt is said to create financial leverage.
Financial leverage is usually measured by the ratio of long-term debt to total
long-term capital. Since long-term lease agreements also commit the firm to a series
of fixed payments, it makes senses to include the value of lease obligations with the
long-term debt.
Debt Ratio = (Long - term debt + Value of leases)(Long - term debt + Value of leases + Equity)
Another way to describe the same relationship is:
Debt to equity ratio = (Long - term debt + Value of leases)Equity
Another measure of financial leverage is the extent to which interest is covered by
earnings before interest and taxes (EBIT) plus depreciation.
-38-
Times interest earned - (EBIT + depereciation)Interest
The regular interest payment is a hurdle that companies must keep jumping if they
are to avoid default. The times-interest-earned ratio measures how much room there is
between hurdle and hurdler.
3.2.3 Off-Balance-Sheet
Financing that does not add debt on a balance sheet and thus does not affect borrowing
capacity as it would be determined by financial ratios is called off-balance financing. The most
common example would be a lease structured as an operating lease rather than a capital lease and
where management's intent is to acquire an asset and corresponding liability without reflecting
either on its balance sheet. In efficient capital markets investors will see through the firm's
accounting results to the true value of the asset and liability incurred to finance it.
- 39 -
3.3 Process of Construction and Revenue Recognition
3.3.1 Percentage of Completion Method and Completed Contract Method
Current accounting principles for business enterprise allow use of the both the
percentage of completion method on an accrual basis and the completed contract method on a
realization basis. The major accounting difference between the two methods is the point in time
at which the revenue or expense is recognized.
The percentage of completion method is generally the preferable method for recording
income on long duration projects. Its major advantage is that it recognizes income on a current
basis and, as such, results in a more regular flow income. On the other hand, the method has
the disadvantages of dependence on cost estimates, which are subjects to uncertainties, and
spending time and money to estimate costs.
When the completed contract method of recognizing revenue and expense is used, the
construction firm recognizes no revenue or expense (or resulting profit or loss) until the
completion of the construction project. During construction all costs incurred by the
construction firm for building a project are accumulated in the expenditure for uncompleted
projects (a construction in progress account), which is an asset account.
The gross profits of construction are varied by the revenue recognition method that the
companies choose.
-40 -
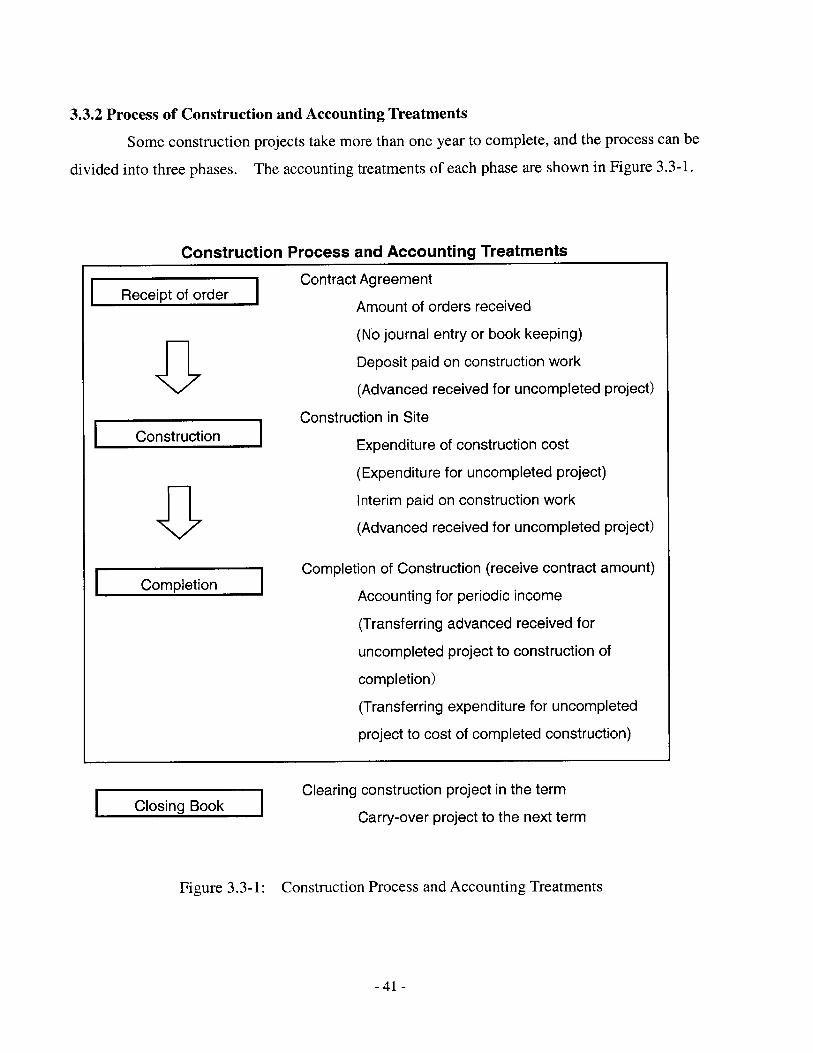
3.3.2 Process of Construction and Accounting Treatments
Some construction projects take more than one year to complete, and the process can be
divided into three phases. The accounting treatments of each phase are shown in Figure 3.3-1.
Construction Process and Accounting Treatments
Receipt of order
Construction
Completio
I Closing Book
Contract Agreement
Amount of orders received
(No journal entry or book keeping)
Deposit paid on construction work
(Advanced received for uncompleted project)
Construction in Site
Expenditure of construction cost
(Expenditure for uncompleted project)
Interim paid on construction work
(Advanced received for uncompleted project)
Completion of Construction (receive contract amount)
Accounting for periodic income
(Transferring advanced received for
uncompleted project to construction of
completion)
(Transferring expenditure for uncompleted
project to cost of completed construction)
Clearing construction project in the term
Carry-over project to the next term
Figure 3.3-1: Construction Process and Accounting Treatments
-41-
I
3.4 Profit Structure Analysis
3.4.1 Profit Structure
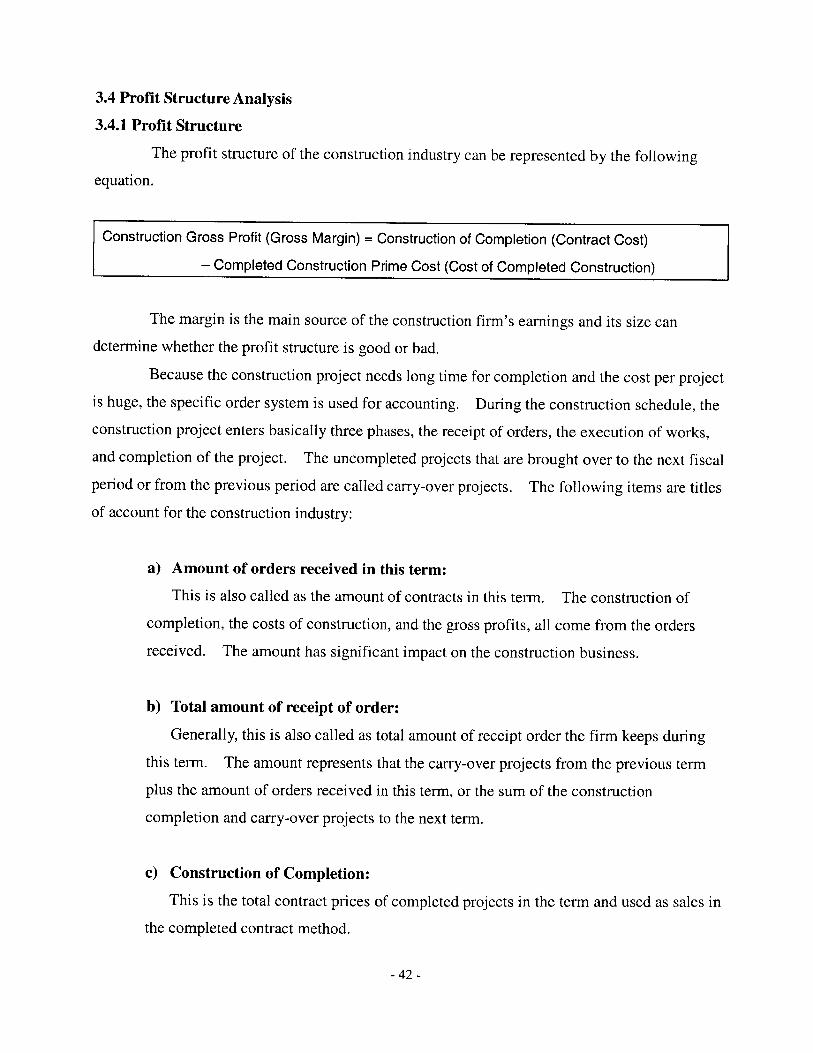
The profit structure of the construction industry can be represented by the following
equation.
Construction Gross Profit (Gross Margin) = Construction of Completion (Contract Cost)
- Completed Construction Prime Cost (Cost of Completed Construction)
The margin is the main source of the construction firm's earnings and its size can
determine whether the profit structure is good or bad.
Because the construction project needs long time for completion and the cost per project
is huge, the specific order system is used for accounting. During the construction schedule, the
construction project enters basically three phases, the receipt of orders, the execution of works,
and completion of the project. The uncompleted projects that are brought over to the next fiscal
period or from the previous period are called carry-over projects. The following items are titles
of account for the construction industry:
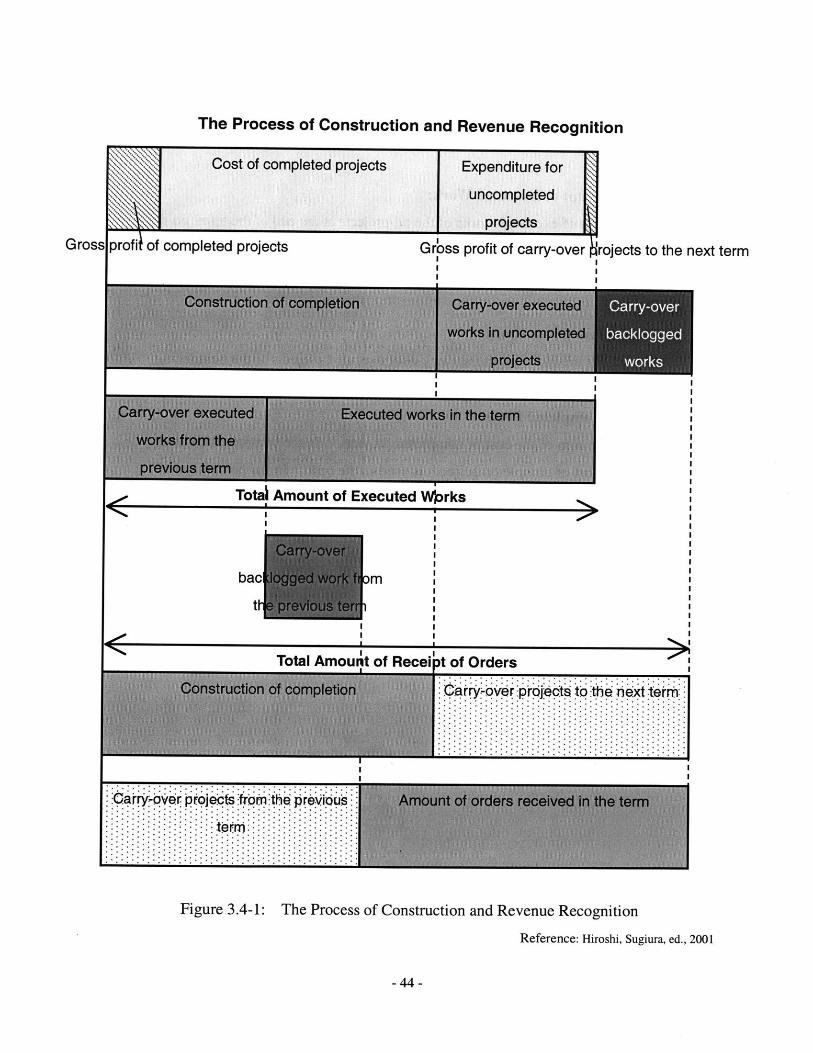
a) Amount of orders received in this term:
This is also called as the amount of contracts in this term. The construction of
completion, the costs of construction, and the gross profits, all come from the orders
received. The amount has significant impact on the construction business.
b) Total amount of receipt of order:
Generally, this is also called as total amount of receipt order the firm keeps during
this term. The amount represents that the carry-over projects from the previous term
plus the amount of orders received in this term, or the sum of the construction
completion and carry-over projects to the next term.
c) Construction of Completion:
This is the total contract prices of completed projects in the term and used as sales in
the completed contract method.
-42 -
d) Carry-Over Project:
This is the contract price of uncompleted projects to the next term.
e) Total Amount of Executed Work:
The amount of executed works of the all projects at the end of the term, no matter if
a whole project is completed or not. This is used as sales in the percentage of
completion method
f) Carry-Over Gross Profit:
The profits are included in the carry-over executed projects to the next term.
g) Cost of Completed Project:
This is the sum of the cost of completed projects. In the completed contract
method, the cost of completed projects is used as the cost. In the percentage of
completion method, the sum of the cost of completed construction and the expenditure
for uncompleted work is used.
Figure 3.4-1 shows the process of construction and revenue recognition.
-43 -
The Process of Construction and Revenue Recognition
Cost of completed projects Expenditure for
uncompleted
projects
completed projectsGross profii of Gssprofit of carry-over 'rojects to the next termG I'ls I
I II I
I I II I
Total Amount of Executed Works
bac
ti
Total Amount of Receipt of Orders....................................a, tr ''-.b, V i r id't' 't i i 6' x' t 't e' tr'p pjp. . ..................' - ............................................- * ....................................................................................................................................................4 .........................I .,....................................................................................t .......................................4 ............................................................................
. . . . . . . . . . . . . . . . . . . . . . . .. . . . . . . . . . . . . . . . . . . . . . . .qrry qver p qjqcf .I rom:the _10US9 Wev .................................* .......................................................................................... ............................................................................................................................................................................................................................................................................................................
Figure 3.4-1: The Process of Construction and Revenue Recognition
Reference: Hiroshi, Sugiura, ed., 2001
-44-
>M
I
.000
3.4.2 Ratio Analysis for Profit Structure
a) Trends in Orders Received
Figure 3.4-1 tells that the increase in the total amount of orders received year by year
makes the size of the profit structure larger. This is the favorable situation unless the
projects are unprofitable.
Growth Rate of Order Receivedt = (Order Received, - Order Received. 1)Order Received. 1
The trend percentage method is a simple way to represent continuous trends in
numbers over several periods. The method uses a number in a certain year as the
benchmark and finds change ratio to numbers in other years. The equation is as
follows.
Number ya
Percentage Changet year =Number year
Numberbenchmark year
b) Total Amount of Receipt of Order and Total Amount of Construction
Although it is important to catch the trends of the current term's orders received and
construction of completion year-on year, the factor with the most influence on the profit
structure is the company's total amount of receipt of orders and executed works in the
end of the term. The total amount of receipt of orders is related with the amount of
orders received in the term and the carry-over projects from the previous term. The
following equations represent the relation.
Total Amount of Receipt of Orderst = CarryOver Projectst-1 + Orders Receivedt
= Constructon of Completion + CarryOver Proectst+1
Total Amount of Executed Workst
= CarryOver Executed Works in Uncompleted Projectst 1 + Executed Workst
= Constructon of Completion + CarryOver Executed Works in Uncompleted Projectst+1
- 45 -
CarryOver Projectst±1= CarryOver Executed Works in Uncompleted Projectst+1 + CarryOver Backlogged Workst+1
The total amount of receipt of order is considered the most important number
because it could show the scale or capacity of the construction firm. Moreover, when
the profit was promised from any projects, the increase in the amount of orders means
the increase in profits. The increase ratio and trend of the number can considerably
influence the profit structure.
The ratio of the total amount of the executed works to the total amount of receipt of
orders is called the execution rate and is represented by the following formula.
Execution Rate = Total amount of executed worksTotal amount of receipt of orders
Usually, the ratio does not fluctuate significantly unless the size and type of the
received orders change significantly. If the ratio moves drastically during a certain
period, there should be some particular reasons in the firm.
c) Total Amount of Executed Works and Construction of Completion
The construction of completion is the sum of the contract prices of completed
projects. When the project is completed and delivered to the owner, the contract price
of the construction is entered the construction of completion. The ratio of the
construction of completion to the total amount of executed works is called the
completion rate and is obtained by the following formula.
Completion rate = Construction of completionTotal amount of executed works
- 46 -
d) Gross Profit
The total gross profit is the total profit of the firm at the end of the term. In
the completed contract method, the gross profit is the construction of completion minus
the total cost of completed projects. In the percentage completion method, the gross
profit is the total amount of executed works minus the total cost of executed works.
Gross profit (Completed contract method)= Construction of Completion -Total cost of completed projects
= Gross profit of completed projects
Total Gross profit (Percentage completion method)
= Total amount of executed works -Total cost of executed works
= Gross profit of completed projects+ Gross profit of carryover projects
- 47 -
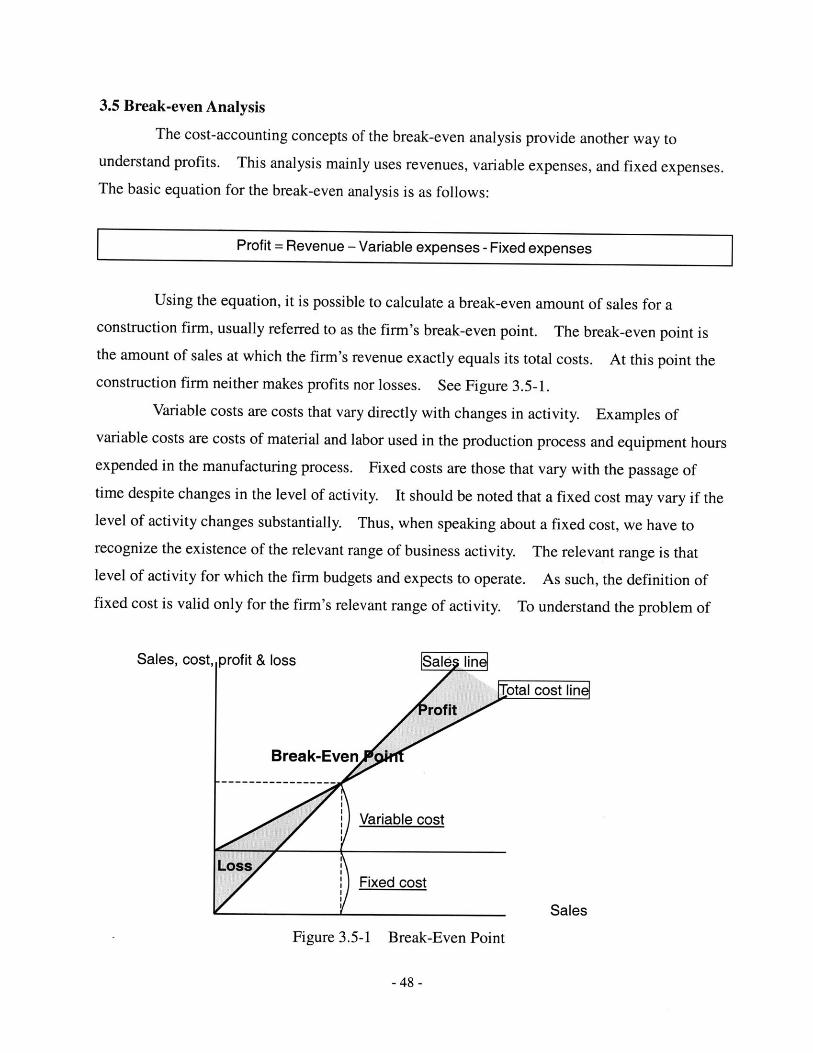
3.5 Break-even Analysis
The cost-accounting concepts of the break-even analysis provide another way tounderstand profits. This analysis mainly uses revenues, variable expenses, and fixed expenses.The basic equation for the break-even analysis is as follows:
Profit = Revenue - Variable expenses - Fixed expenses
Using the equation, it is possible to calculate a break-even amount of sales for a
construction firm, usually referred to as the firm's break-even point. The break-even point isthe amount of sales at which the firm's revenue exactly equals its total costs. At this point theconstruction firm neither makes profits nor losses. See Figure 3.5-1.
Variable costs are costs that vary directly with changes in activity. Examples of
variable costs are costs of material and labor used in the production process and equipment hours
expended in the manufacturing process. Fixed costs are those that vary with the passage of
time despite changes in the level of activity. It should be noted that a fixed cost may vary if the
level of activity changes substantially. Thus, when speaking about a fixed cost, we have to
recognize the existence of the relevant range of business activity. The relevant range is that
level of activity for which the firm budgets and expects to operate. As such, the definition of
fixed cost is valid only for the firm's relevant range of activity. To understand the problem of
Sales, cost, profit & loss Sale [in
Jptal cost linerof it
Break-Even
Variable cost
LossFixed cost
Sales
Figure 3.5-1 Break-Even Point
-48 -
fixed costs not being fixed over unexpected activity levels, the term semifixed is introduced.
Break-even analysis is a useful method for the construction firm to determine what level
of sales is needed to cover its planned overhead expenses. In order to perform this analysis, we
usually assume that a construction firm's costs of sales are variable expenses, and its general and
administrative costs are fixed costs. While there are exceptions to these assumptions, most
construction costs are variable, and most operating costs may be considered fixed within a given
range of volume.
Establishing a required volume needed to cover overhead effectively sets a minimum
goal for the firm. Setting a goal often motivates the firm to achieve it and also serves as the
basis for justifying certain marketing plans and expenditures. Periodically the break-even point
should be recalculated to recognize charges in overhead expenditures and modifications in thegross margin.
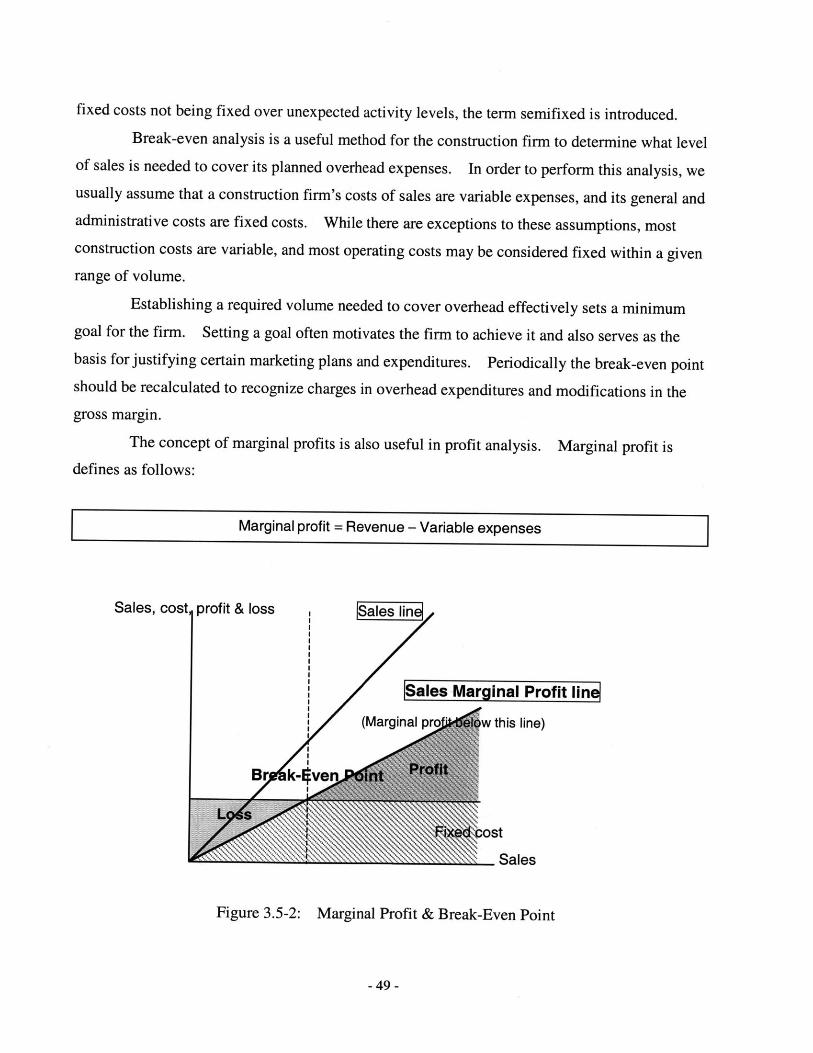
The concept of marginal profits is also useful in profit analysis. Marginal profit is
defines as follows:
Marginal profit = Revenue - Variable expenses
Sales, cost, profit & loss , Sales linl
ales Marginal Profit In
(Marginal pro w this line)
Br k- ven
Sales
Figure 3.5-2: Marginal Profit & Break-Even Point
-49 -
A specific construction project yields the construction firm a positive marginal profit aslong as the dollar contract amount is greater than the cost of construction (in this case, the cost ofconstruction is defined as mainly a variable cost). As long as a project has positive marginalprofit, it contributes to covering some of the firm's overhead.
Having introduced the concept of marginal profits, we can understand the commonpractice of some construction firms occasionally signing a contract to build a project for less thantotal costs. The above figure (Figure 3.5-2) shows this case. By total costs is meant the costsof construction and an allocated percentage of the firm's overhead costs.
A construction firm's success is measured by its profitability. The objective oraccomplishments of construction firm might include improving its public image and serving acommunity and employees. However, these seemingly non-monetary objectives are usuallytied to making money.
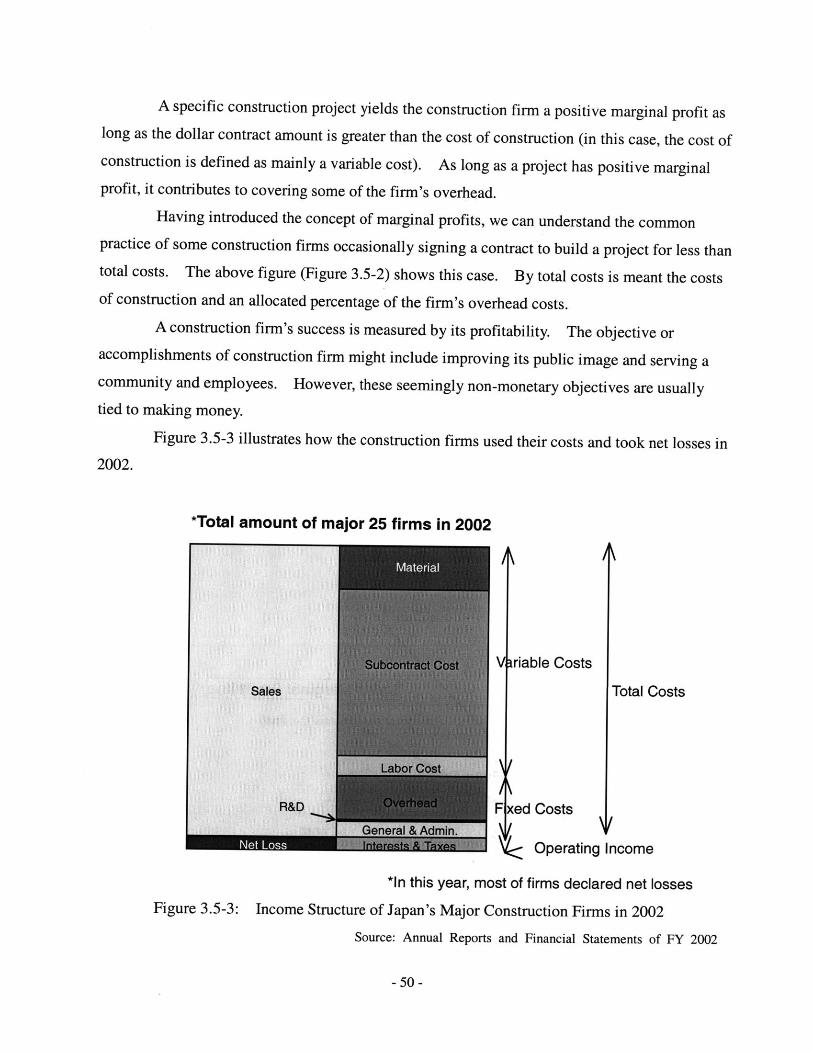
Figure 3.5-3 illustrates how the construction firms used their costs and took net losses in2002.
*Total amount of major 25 firms in 2002
Variable Costs
Sales Total Costs
R&D F ed Costs
Net Loss Operating Income
*In this year, most of firms declared net losses
Figure 3.5-3: Income Structure of Japan's Major Construction Firms in 2002
Source: Annual Reports and Financial Statements of FY 2002
-50 -
Increased Volume Approach
Sales, cost, profit & loss Sales lir.
P fit maximization
Total cost lin
.. irefis'ed Gross Margin Approach
- ' Variable cost
Loss -ixed cost
Control of Overhead Approach Sales
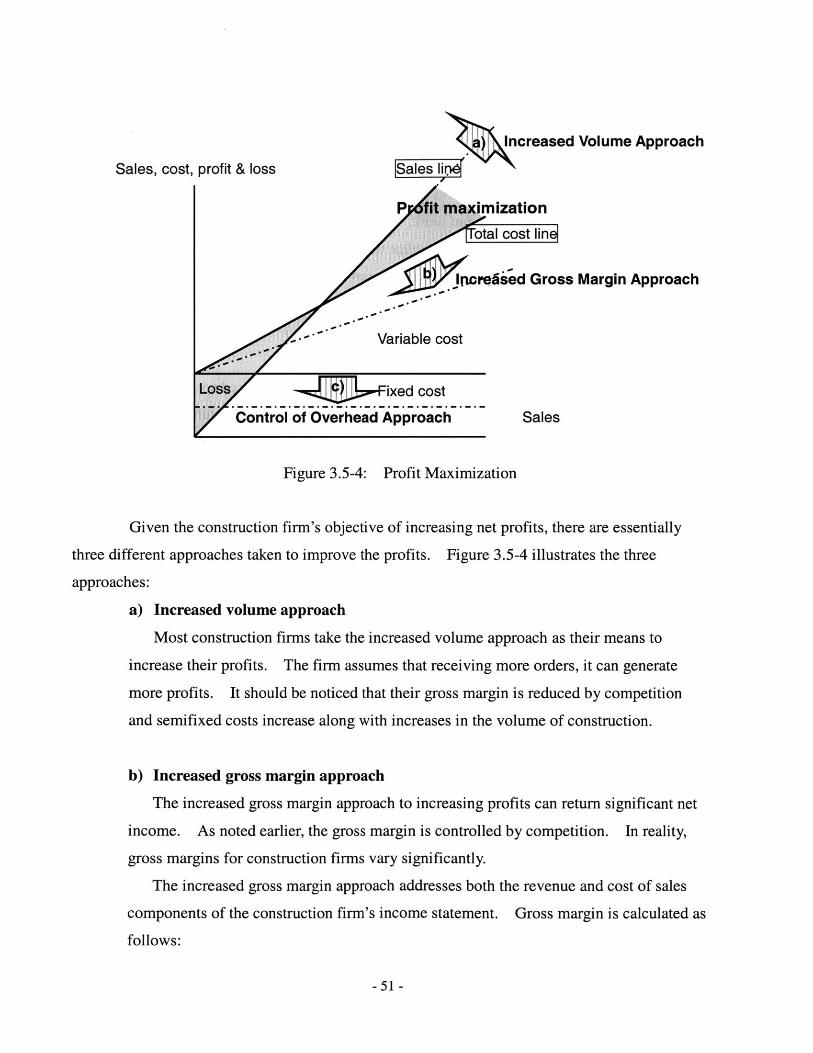
Figure 3.5-4: Profit Maximization
Given the construction firm's objective of increasing net profits, there are essentially
three different approaches taken to improve the profits. Figure 3.5-4 illustrates the three
approaches:
a) Increased volume approach
Most construction firms take the increased volume approach as their means to
increase their profits. The firm assumes that receiving more orders, it can generate
more profits. It should be noticed that their gross margin is reduced by competition
and semifixed costs increase along with increases in the volume of construction.
b) Increased gross margin approach
The increased gross margin approach to increasing profits can return significant net
income. As noted earlier, the gross margin is controlled by competition. In reality,
gross margins for construction firms vary significantly.
The increased gross margin approach addresses both the revenue and cost of sales
components of the construction firm's income statement. Gross margin is calculated as
follows:
-51-
Gross margin = Gross profitRevenue
One means of increasing gross margin is for the construction firm to decrease its
cost of doing a given volume of work. Instead of merely seeking greater volume, the
construction firm should look for volume that includes significant gross margin. But
the competitive nature of the normal lump sum construction contract weakens the
construction firm's ability to secure contracts with an improved profit margin.
c) Control of overhead approach
Many of the construction firm's overhead costs tend to be fixed costs. Examples
include cost of maintaining the company office, cost of the clerical staff, and marketing
expense. The controlling overhead costs approach to increase total profits requires
keeping the firm's overhead costs less than the gross profits. The smaller the overhead
costs are relative to the firm's gross profits, the larger the total profits.
- 52 -

3.6 Declining Profitability
As it is getting harder to make profits in the shrinking market, construction firms are
attempting to secure high profitability. In order to enhance profitability, there are three different
approaches, (1) Increased sales, (2) Increased gross margin approach, and (3) Control of
overhead approaches. However, it is not easy to adopt these three approaches all at once. In
the shrinking construction market, increasing sales leads share competition with each other and
could reduce profitability. As for every firm, decreasing construction costs that includes fixed
costs is approaching its limit. Unreasonable downsizing and slash capital investments sacrifice
the firm's future growth. Moreover, construction firms' technical capabilities highly rely on
their engineers' ability. The reduction of the number of engineers could lead to lose their
technical advantages and, consequently, lower their profits from construction projects.
Every construction firm is making every effort to earn profits, such as the introduction of cost
down methods, value engineering, the reduction of time for completion, and optimization for the
material and subcontract procurement. However, these efforts at cost reduction are included in
construction contracts beforehand and the contractors could not have their merits.
Operating Margin -o-Industry-wide
0 - Construction
5.505- 4.90 5.00
S4.50
1.- 01.501 - 1.00 0 -10
0.60 .60 0 4- 0 i .30 -- - - - - - - - - - - - - - - - - - - - - - - .20)
-1 -(.20)
-2-
1999 2000 2001 2002
Figure 3.6-1: Declining Profitability of Construction Industry Source: MOF
- 53 -

In the bubble economy, the construction firms rejected to disclose the costs of
construction projects. The projects and their costs became black boxes. Once they received
the orders from the owner, the general contractors had the responsibility to take the risk of the
projects, surely complete the projects within the schedule, and build high quality buildings with
high technology. Because the firms take all responsibilities of the project for the owner, the
owner allowed them to make the real costs of projects vague.
However, as the bubble economy was bursting, these vague costs adversely affected the
firms. Low costs are becoming the most critical factor for the owners to choose contractors.
The other factors, such as firm's historical performances, technical capabilities, risk management
ability, and brand strength are losing their importance. Furthermore, the firms did not clearly
add their costs in contracts. Hence, these costs are completely ignored by the owners.
To make this situation worse, in recent years, some firms have attempted to get orders at
minimum prices that only have minimum marginal profit (Figure 3.5-3). This is because they
still believe the more sales they accept, the more corporate value they can create. And also
because they are unsuccessful at reducing their overhead costs, they have to cover the costs by
accepting orders without profits. Because of this dumping contract prices, the profitability of
all the construction projects is harshly declining. In this circumstance, the construction firms
are required to disclose their profit structure and the costs of construction clearly. Especially
for the public works, it is becoming necessary for the firms to have accountability for every cost
of the works.
The governments introduced new delivery methods like Construction Management
(CM). CM is employed in order to manage multiple contracts with subcontractors and to clear
the costs of construction.
The profitability of the construction firms has been harshly declining most recently
(Figure 3.6-1), so, in fact, disclosing the costs could be a good solution to make profits.
- 54 -
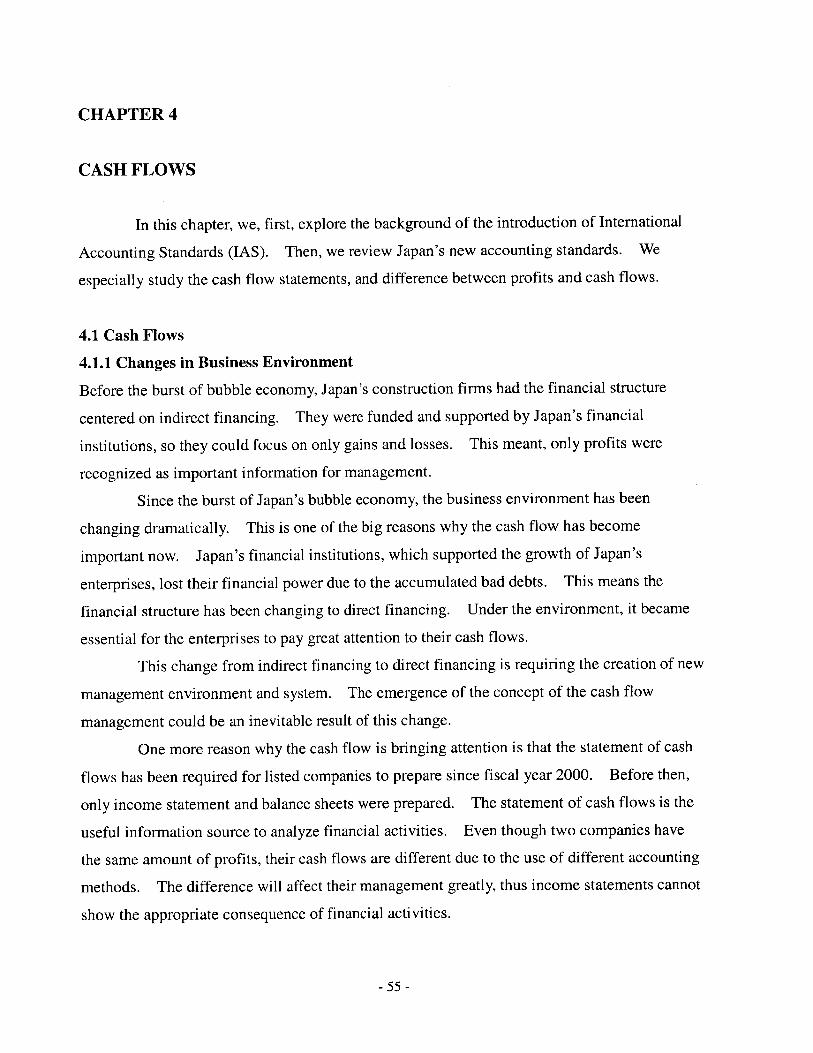
CHAPTER 4
CASH FLOWS
In this chapter, we, first, explore the background of the introduction of International
Accounting Standards (IAS). Then, we review Japan's new accounting standards. We
especially study the cash flow statements, and difference between profits and cash flows.
4.1 Cash Flows
4.1.1 Changes in Business Environment
Before the burst of bubble economy, Japan's construction firms had the financial structure
centered on indirect financing. They were funded and supported by Japan's financial
institutions, so they could focus on only gains and losses. This meant, only profits were
recognized as important information for management.
Since the burst of Japan's bubble economy, the business environment has been
changing dramatically. This is one of the big reasons why the cash flow has become
important now. Japan's financial institutions, which supported the growth of Japan's
enterprises, lost their financial power due to the accumulated bad debts. This means the
financial structure has been changing to direct financing. Under the environment, it became
essential for the enterprises to pay great attention to their cash flows.
This change from indirect financing to direct financing is requiring the creation of new
management environment and system. The emergence of the concept of the cash flow
management could be an inevitable result of this change.
One more reason why the cash flow is bringing attention is that the statement of cash
flows has been required for listed companies to prepare since fiscal year 2000. Before then,
only income statement and balance sheets were prepared. The statement of cash flows is the
useful information source to analyze financial activities. Even though two companies have
the same amount of profits, their cash flows are different due to the use of different accounting
methods. The difference will affect their management greatly, thus income statements cannot
show the appropriate consequence of financial activities.
- 55 -
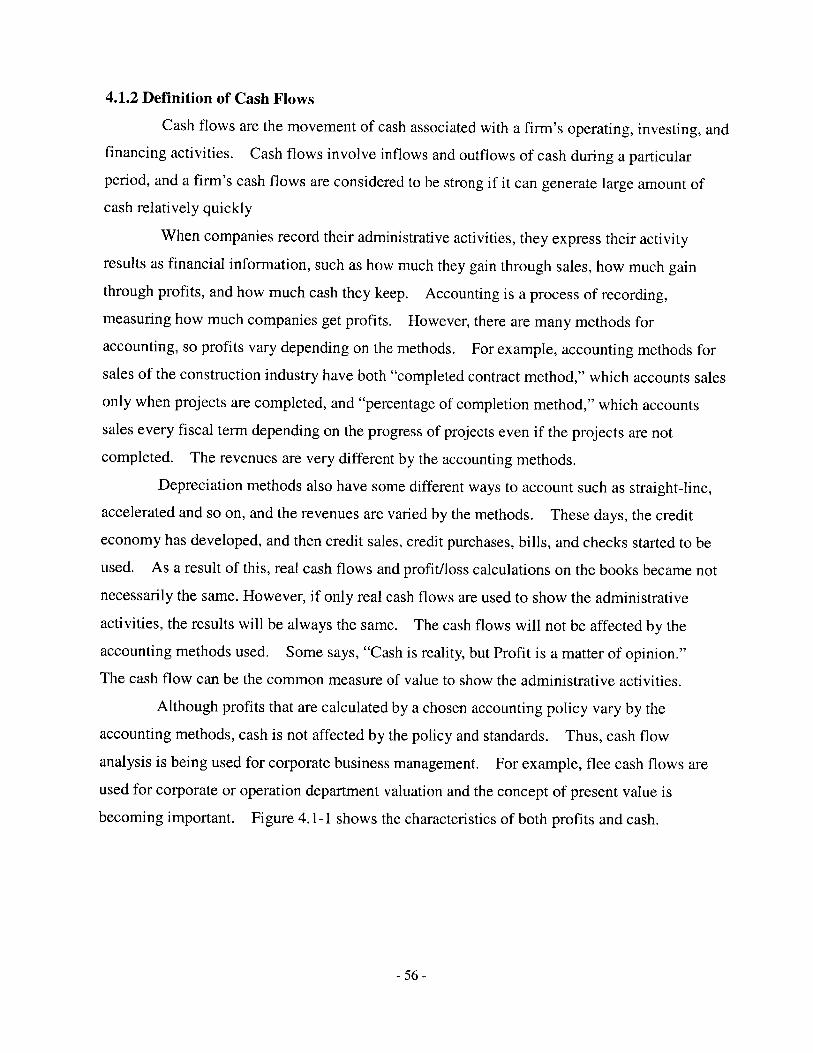
4.1.2 Definition of Cash Flows
Cash flows are the movement of cash associated with a firm's operating, investing, and
financing activities. Cash flows involve inflows and outflows of cash during a particular
period, and a firm's cash flows are considered to be strong if it can generate large amount of
cash relatively quickly
When companies record their administrative activities, they express their activity
results as financial information, such as how much they gain through sales, how much gain
through profits, and how much cash they keep. Accounting is a process of recording,
measuring how much companies get profits. However, there are many methods for
accounting, so profits vary depending on the methods. For example, accounting methods for
sales of the construction industry have both "completed contract method," which accounts sales
only when projects are completed, and "percentage of completion method," which accounts
sales every fiscal term depending on the progress of projects even if the projects are not
completed. The revenues are very different by the accounting methods.
Depreciation methods also have some different ways to account such as straight-line,
accelerated and so on, and the revenues are varied by the methods. These days, the credit
economy has developed, and then credit sales, credit purchases, bills, and checks started to be
used. As a result of this, real cash flows and profit/loss calculations on the books became not
necessarily the same. However, if only real cash flows are used to show the administrative
activities, the results will be always the same. The cash flows will not be affected by the
accounting methods used. Some says, "Cash is reality, but Profit is a matter of opinion."
The cash flow can be the common measure of value to show the administrative activities.
Although profits that are calculated by a chosen accounting policy vary by the
accounting methods, cash is not affected by the policy and standards. Thus, cash flow
analysis is being used for corporate business management. For example, flee cash flows are
used for corporate or operation department valuation and the concept of present value is
becoming important. Figure 4.1-1 shows the characteristics of both profits and cash.
- 56 -
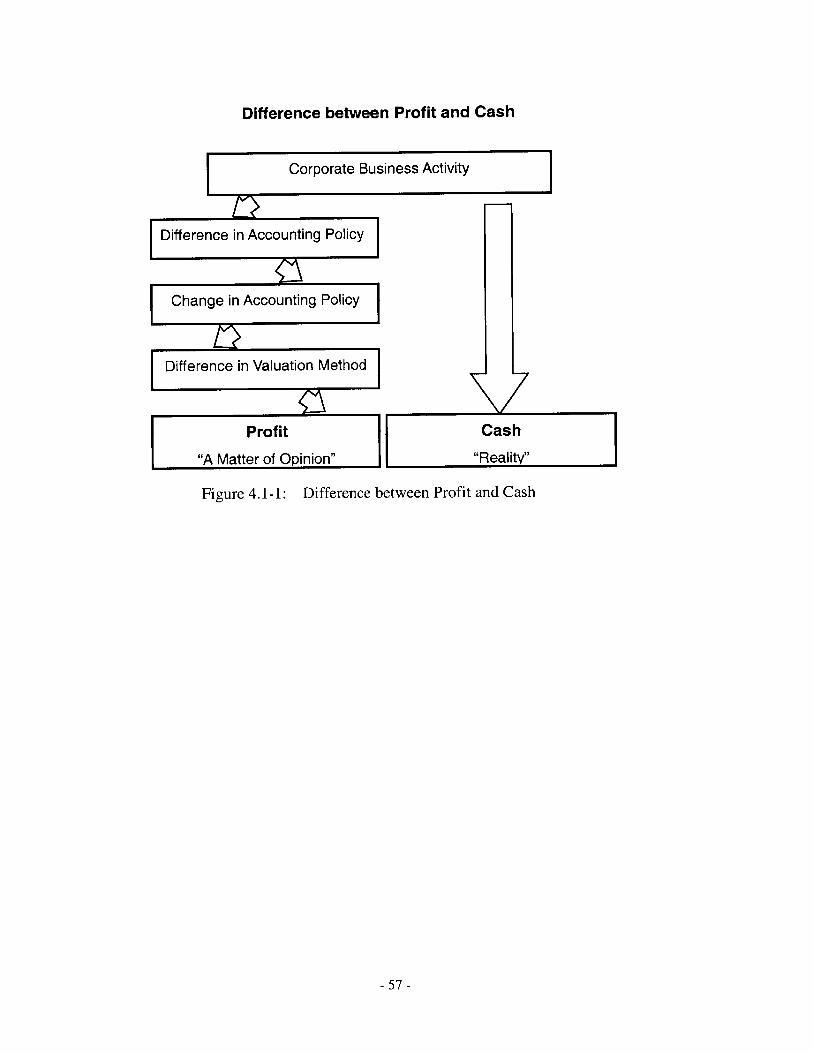
Difference between Profit and Cash
Corporate Business Activity
r>mI I
Difference in Accounting Policy I
Profit
"A Matter of Opinion"
Figure 4.1-1: Difference between Profit and Cash
- 57 -
Change in Accounting Policy
tIDifference in Valuation Method
I
Cash
"Reality"
42I
II
I
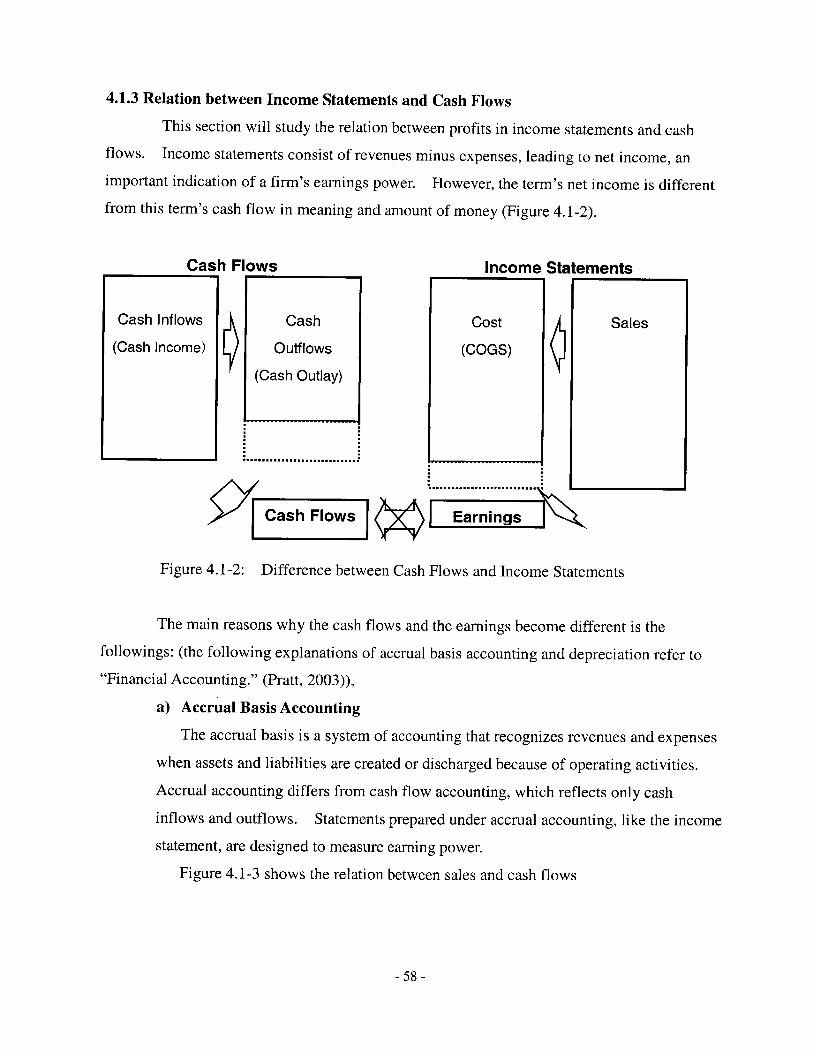
4.1.3 Relation between Income Statements and Cash Flows
This section will study the relation between profits in income statements and cash
flows. Income statements consist of revenues minus expenses, leading to net income, an
important indication of a firm's earnings power. However, the term's net income is different
from this term's cash flow in meaning and amount of money (Figure 4.1-2).
Cash Flows
Cash Inflows A Cash
Outflows
(Cash Outlay)
Cash Flows
Income StatementsI I
Earnings
Figure 4.1-2: Difference between Cash Flows and Income Statements
The main reasons why the cash flows and the earnings become different is the
followings: (the following explanations of accrual basis accounting and depreciation refer to
"Financial Accounting." (Pratt, 2003)),
a) Accrual Basis Accounting
The accrual basis is a system of accounting that recognizes revenues and expenses
when assets and liabilities are created or discharged because of operating activities.
Accrual accounting differs from cash flow accounting, which reflects only cash
inflows and outflows. Statements prepared under accrual accounting, like the income
statement, are designed to measure earning power.
Figure 4.1-3 shows the relation between sales and cash flows
-58-
(Cash Income)
Cost
(COGS)
Sales
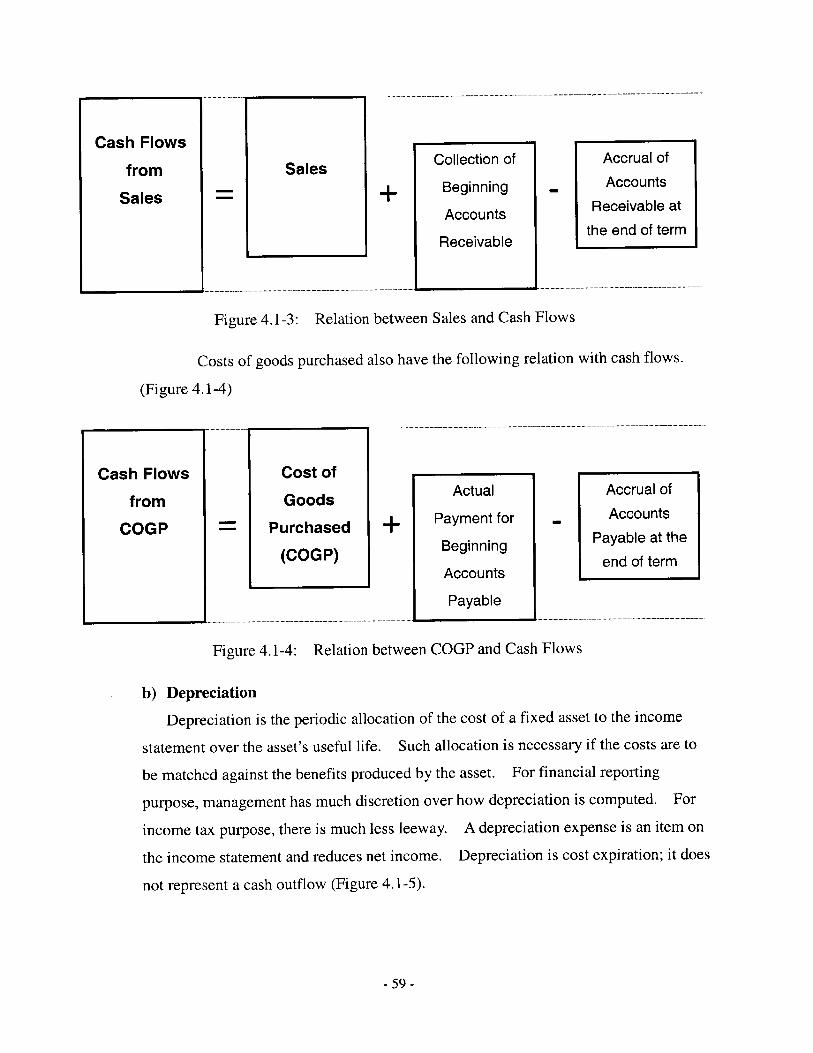
Cash Flows
from
Sales
Sales+
Collection of
Beginning
Accounts
RIe LeIVblUIe JFigure 4.1-3: Relation between Sales and Cash Flows
Costs of goods purchased also have the following relation with cash flows.
(Figure 4.1-4)
Cash Flows
from
COGP
Cost of
Goods Actual
- Purchased + Payment for
(COGP) Beginning
Accounts
Payable
Figure 4.1-4: Relation between COGP and Cash Flows
b) Depreciation
Depreciation is the periodic allocation of the cost of a fixed asset to the income
statement over the asset's useful life. Such allocation is necessary if the costs are to
be matched against the benefits produced by the asset. For financial reporting
purpose, management has much discretion over how depreciation is computed. For
income tax purpose, there is much less leeway. A depreciation expense is an item on
the income statement and reduces net income. Depreciation is cost expiration; it does
not represent a cash outflow (Figure 4.1-5).
- 59 -
Accrual of
Accounts
Receivable at
the end of term
Accrual of
Accounts
Payable at the
end of term
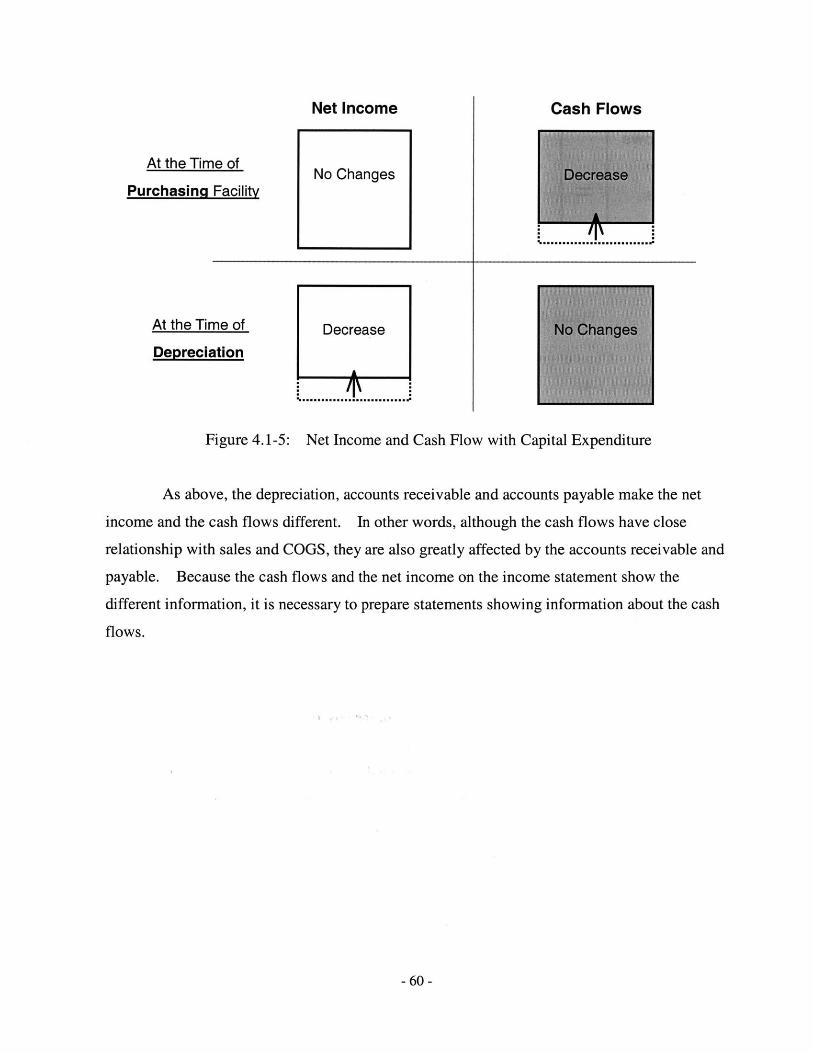
At the Time of
Purchasing Facility
At the Time of
Depreciation
Net Income
No Changes
Cash Flows
fi\
Figure 4.1-5: Net Income and Cash Flow with Capital Expenditure
As above, the depreciation, accounts receivable and accounts payable make the net
income and the cash flows different. In other words, although the cash flows have close
relationship with sales and COGS, they are also greatly affected by the accounts receivable and
payable. Because the cash flows and the net income on the income statement show the
different information, it is necessary to prepare statements showing information about the cash
flows.
- 60 -
Decrease
4.2 International Accounting Standard Setting
The International Accounting Standard (IAS) is internationally accepted accounting
standards proposed by the International Accounting Standards Committee (IASC). The
following explanation of IAS is extracted from "Financial Accounting" (Pratt, 2003).
Just as nations have different histories, economies, cultures, and political systems, they
also have different systems of financial accounting. Indeed, accounting systems have evolved
in response to the demands of the business environment, and the business environments faced
by companies in different parts of the world are vastly dissimilar. For example, financial
reporting in North America, the United Kingdom, and Australia tends to be oriented toward the
decision needs of investors and designed to measure effectiveness of management. The
accounting methods used in Japan and most of the countries in Western Europe were not
oriented toward the needs of investors. Rather, they provide information that is used to satisfy
government requirements, such as computing income taxes. South American accounting
methods are oriented toward the needs of government planners, and uniform rules are imposed
on virtually all business entities.
The fact that so much diversity exists in worldwide accounting standards and practice
makes it difficult for investors and creditors to compare the performances of companies
operating in different companies. The differences in the accounting system can lead to a loss
of credibility in the financial statements and investment decisions based on misunderstanding.
Many efforts have been made to achieve greater international understanding and
uniformity of accounting practices. The most active, and increasingly important, is the
International Accounting Standard Committee (ISAC), formed in 1973 to develop worldwide
accounting practice. Japan has accepted the International Accounting Standards and revised
the law in 1998.
4.2.1 Introduction of International Accounting Standards, (IAS)
Now, the Japanese accounting system is undergoing significant changes. Japan's
Finance Ministry accepted the International Accounting Standards (IAS) and Japan's listed
firms have had to introduce the new accounting standards since fiscal 2000. This new rule
mainly covers (1) the introduction of new consolidated financial statement rules, (2) fair value
accounting, (3) accounting for retirement benefits, and (4) the statement of cash flows.
- 61--
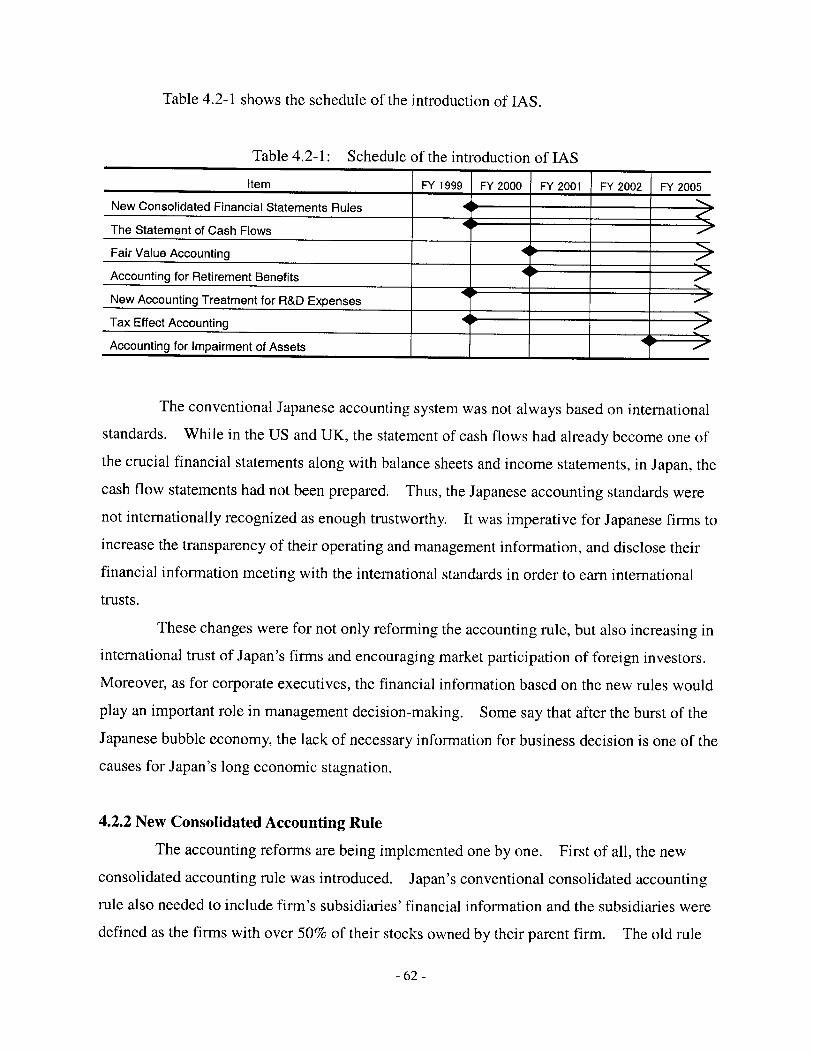
Table 4.2-1 shows the schedule of the introduction of IAS.
Table 4.2-1: Schedule of the introduction of IAS
Item FY 1999 FY 2000 FY 2001 FY 2002 FY 2005
New Consolidated Financial Statements Rules
The Statement of Cash Flows
Fair Value Accounting
Accounting for Retirement Benefits
New Accounting Treatment for R&D Expenses TTax Effect Accounting
Accounting for Impairment of Assets
The conventional Japanese accounting system was not always based on international
standards. While in the US and UK, the statement of cash flows had already become one of
the crucial financial statements along with balance sheets and income statements, in Japan, the
cash flow statements had not been prepared. Thus, the Japanese accounting standards were
not internationally recognized as enough trustworthy. It was imperative for Japanese firms to
increase the transparency of their operating and management information, and disclose their
financial information meeting with the international standards in order to earn international
trusts.
These changes were for not only reforming the accounting rule, but also increasing in
international trust of Japan's firms and encouraging market participation of foreign investors.
Moreover, as for corporate executives, the financial information based on the new rules would
play an important role in management decision-making. Some say that after the burst of the
Japanese bubble economy, the lack of necessary information for business decision is one of the
causes for Japan's long economic stagnation.
4.2.2 New Consolidated Accounting Rule
The accounting reforms are being implemented one by one. First of all, the new
consolidated accounting rule was introduced. Japan's conventional consolidated accounting
rule also needed to include firm's subsidiaries' financial information and the subsidiaries were
defined as the firms with over 50% of their stocks owned by their parent firm. The old rule
- 62 -
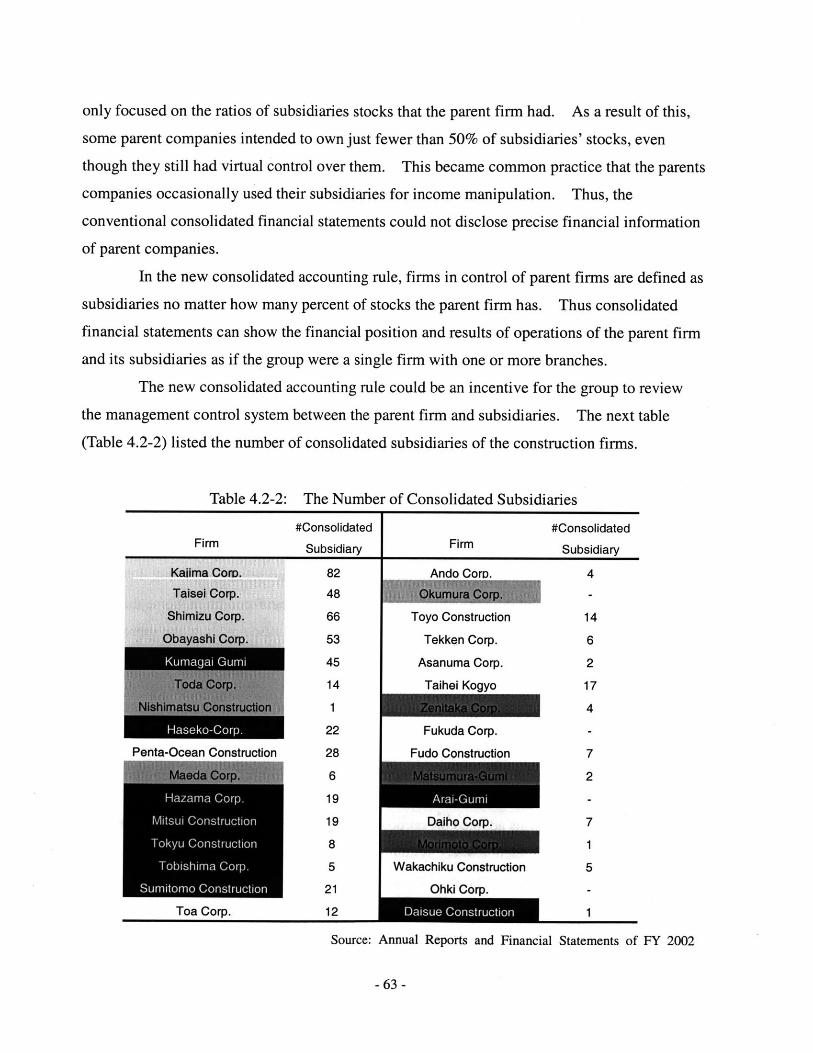
only focused on the ratios of subsidiaries stocks that the parent firm had. As a result of this,
some parent companies intended to own just fewer than 50% of subsidiaries' stocks, even
though they still had virtual control over them. This became common practice that the parents
companies occasionally used their subsidiaries for income manipulation. Thus, the
conventional consolidated financial statements could not disclose precise financial information
of parent companies.
In the new consolidated accounting rule, firms in control of parent firms are defined as
subsidiaries no matter how many percent of stocks the parent firm has. Thus consolidated
financial statements can show the financial position and results of operations of the parent firm
and its subsidiaries as if the group were a single firm with one or more branches.
The new consolidated accounting rule could be an incentive for the group to review
the management control system between the parent firm and subsidiaries. The next table
(Table 4.2-2) listed the number of consolidated subsidiaries of the construction firms.
Table 4.2-2: The Number of Consolidated Subsidiaries
#Consolidated #ConsolidatedFirm Subsidiary Firm Subsidiary
Kaiima CorD. 82 Ando CorD. 4Taisei Corp. 48
Shimizu Corp. 66 Toyo Construction 14
Obayashi Corp. 53 Tekken Corp. 6
Kumagai Gum 45 Asanuma Corp. 2
14 Taihei Kogyo 17
1 4
Haseko-Corp. 22 Fukuda Corp. -
Penta-Ocean Construction 28 Fudo Construction 7
6 2
H(I/"1ma, Corp. 19 .-
19 Daiho Corp. 7oku Cos Luction 8 1
I Ohshima Gorp 5 Wakachiku Construction 5Sumitmo ConstrUC On 21 Ohki Corp. -
Toa Corp. 12 1
Source: Annual Reports and Financial Statements of FY 2002
-63 -
4.2.3 Fair Value Accounting
In 1999, Japan's Business Accounting Council announced the report on the installation
of accounting standard for financial products. The report mentioned about four main purposes
for the installation:
a) Promotion of investment in Japan's stock market from both domestic and outside
investors
b) The investors can make appropriate investment decisions with self-responsibility
c) Firms can also make appropriate management decision based on actual condition
d) Establishment of accounting disclosure system equivalent to international
standards
These improvements of the accounting standard aimed at creating the vital and orderly
market.
In Japan, the valuation method for assets was conventionally applied the book value
method (i.e., the value was based on the price when assets are gained). Therefore, after
gaining assets, even if the market value of the assets become significantly below the book value,
no gain or loss is recognized. Because book value is based on historical cost, it will differ
from market value. Book loss often deteriorated corporate financial condition worse than
reported numbers. This means that reported financial statements did not show the appropriate
financial condition so that the statements were not necessarily useful information. The fair
value accounting will be a good solution for this problem.
4.2.4 Retirement Benefit Accounting
In 1998, Japan's Business Accounting Council announced the report on the installation
of the accounting standard for retirement benefits.
In Japan, many firms adopted the corporate pension plan such as employees' pension
scheme and approved retirement annuity system. However, nowadays yields to investment
assets are declining and unrealized capital losses on assets are growing. As a result, pension
assets that are needed to pay future pension tend to fall short. In addition, the shortage of the
pension assets could deteriorate the corporate financial condition. The information about
- 64 -
corporate pension is becoming very important for both investment information and corporate
management. For this reason, to clarify the current condition of pension assets and liabilities,
it was necessary to set up accounting standards about corporate pension.
The features of retirement benefit accounting are the following:
a) Comprehensive standards that will not be affected by the difference of retirement
benefit schemes
b) Comparable between enterprises
c) Adopting Fair value Accounting
d) Adopting Present Value
- 65 -
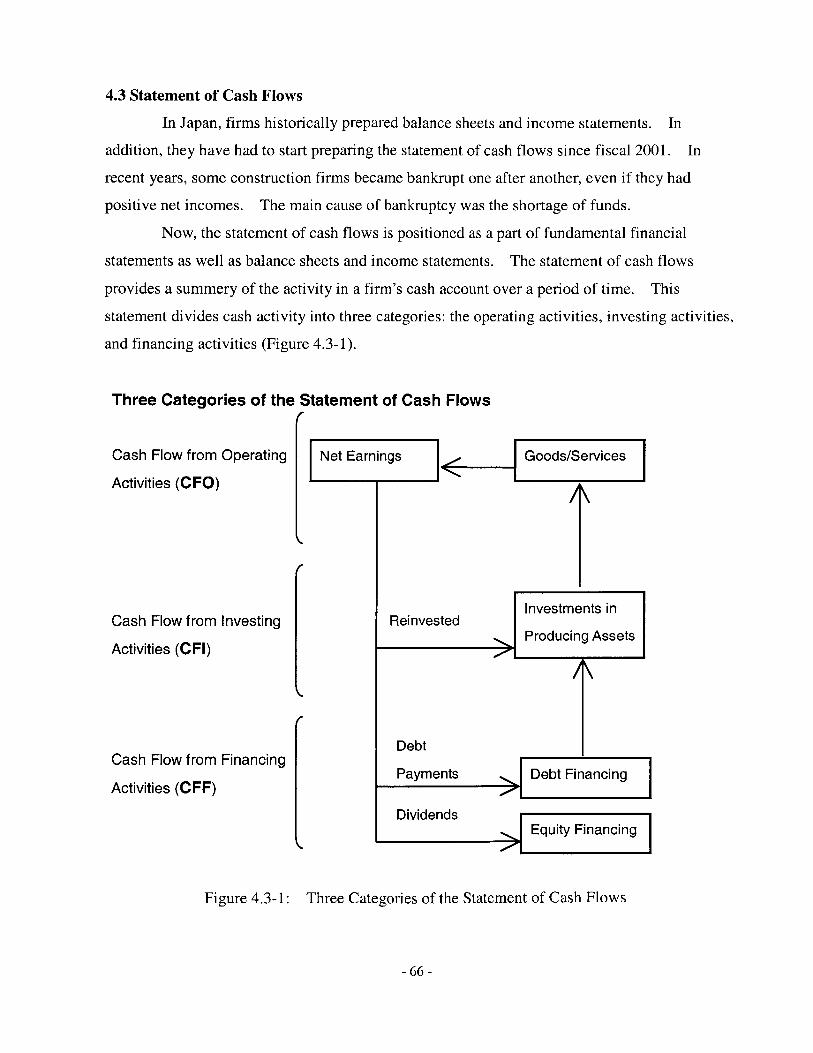
4.3 Statement of Cash Flows
In Japan, firms historically prepared balance sheets and income statements. In
addition, they have had to start preparing the statement of cash flows since fiscal 2001. In
recent years, some construction firms became bankrupt one after another, even if they had
positive net incomes. The main cause of bankruptcy was the shortage of funds.
Now, the statement of cash flows is positioned as a part of fundamental financial
statements as well as balance sheets and income statements. The statement of cash flows
provides a summery of the activity in a firm's cash account over a period of time. This
statement divides cash activity into three categories: the operating activities, investing activities,
and financing activities (Figure 4.3-1).
Three Categories of the Statement of Cash Flowsr-
Cash Flow from Operating
Activities (CFO)
Cash Flow from Investing
Activities (CFI)
Cash Flow from Financing
Activities (CFF)
Net Earnings Goods/Services
Investments inReinvested
Producing Assets
Debt PPayments Debt Financing
DividendsEquity Financing
Figure 4.3-1: Three Categories of the Statement of Cash Flows
- 66 -
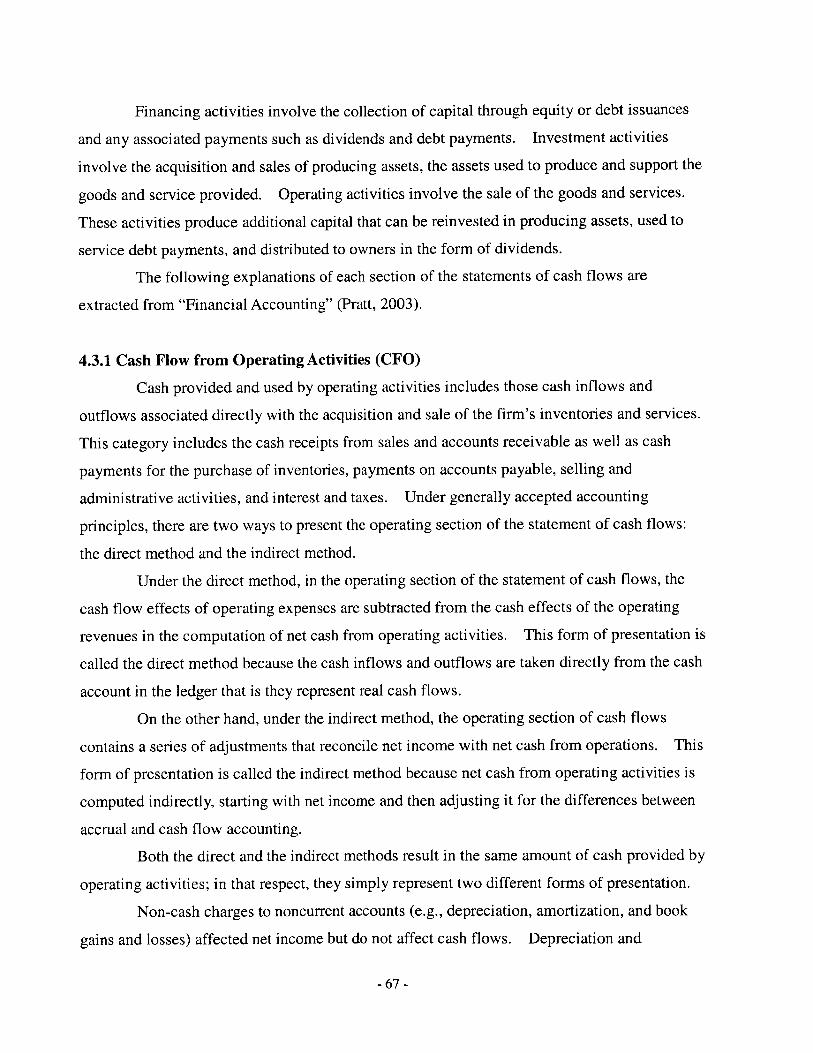
Financing activities involve the collection of capital through equity or debt issuances
and any associated payments such as dividends and debt payments. Investment activities
involve the acquisition and sales of producing assets, the assets used to produce and support the
goods and service provided. Operating activities involve the sale of the goods and services.
These activities produce additional capital that can be reinvested in producing assets, used to
service debt payments, and distributed to owners in the form of dividends.
The following explanations of each section of the statements of cash flows are
extracted from "Financial Accounting" (Pratt, 2003).
4.3.1 Cash Flow from Operating Activities (CFO)
Cash provided and used by operating activities includes those cash inflows and
outflows associated directly with the acquisition and sale of the firm's inventories and services.
This category includes the cash receipts from sales and accounts receivable as well as cash
payments for the purchase of inventories, payments on accounts payable, selling and
administrative activities, and interest and taxes. Under generally accepted accounting
principles, there are two ways to present the operating section of the statement of cash flows:
the direct method and the indirect method.
Under the direct method, in the operating section of the statement of cash flows, the
cash flow effects of operating expenses are subtracted from the cash effects of the operating
revenues in the computation of net cash from operating activities. This form of presentation is
called the direct method because the cash inflows and outflows are taken directly from the cash
account in the ledger that is they represent real cash flows.
On the other hand, under the indirect method, the operating section of cash flows
contains a series of adjustments that reconcile net income with net cash from operations. This
form of presentation is called the indirect method because net cash from operating activities is
computed indirectly, starting with net income and then adjusting it for the differences between
accrual and cash flow accounting.
Both the direct and the indirect methods result in the same amount of cash provided by
operating activities; in that respect, they simply represent two different forms of presentation.
Non-cash charges to noncurrent accounts (e.g., depreciation, amortization, and book
gains and losses) affected net income but do not affect cash flows. Depreciation and
- 67 -
amortization charges, for example, simultaneously reduce the dollar amounts of long-lived
assets and create expenses, which reduce net income. The entries to record depreciation and
amortization, however, do not reduce cash. Consequently, when deriving cash flows from net
income, as is done under the indirect method, depreciation and amortization charges are added
back. Similarly, gains and losses on the disposal of long-lived assets do not affect operating
cash flows.
4.3.2 Cash Flow from Investing Activities (CFI)
Cash provided by investing activities includes the cash flows and out flows associated
with the purchase and sale of a firm's noncurrent assets. This section of the statement of cash
flows includes the cash effects from purchases and sales of long-term investments, long-lived
assets, and intangible assets. The cash inflows and outflows can also be traced to entries in
the cash account in the firm's ledger.
4.3.3 Cash Flow from Financing Activities (CFF)
Cash provided by financing activities includes cash inflows and outflows associated
with a firm's two sources of outside capital: liabilities and contributed capital. This category
primary includes the cash inflows associated with borrowings and equity issuances as well as
the cash outflows related to debt repayments, treasury stock purchases, and dividend payments.
The cash flows can also be traced to the cash account in the firm's ledger.
Note also that cash interest payments are not included in this section of the statement
of cash flows, even though they represent a cost of financing. Instead, such payments are
included in the operating section.
- 68 -
CHAPTER 5
CASH FLOW ANALYSIS
In the previous chapter, we examined the concept of cash flows. In this chapter we
first explore cash flow profile analysis and ratio analysis, and then study how construction firms
should manage their cash flows with cash flow statements. These analyses also refer to
accounting and finance books (Palepu, Bernard and Healy, 1999, Pratt, 2003, Myers and Brealey,
1999, Adrian, 1999). The end of this chapter explains how Japan's contractor rating system for
public works reflected the concepts of cash flows at the time of its revision in 1999.
5.1 Relation among Statement of Cash Flows and Other Financial Statements
The entire financial accounting process may be seen as preparing financial statements.
While financial statements are prepared to meet the needs of external parties, the statements can
also serve internal purposes of firms. In particular, the prepared financial statements can assist
construction firms in making business decisions.
Financial statements consist of the income statement, balance sheet, statement of cash
flows, statement of stockholder's equity, and related footnotes. The balance sheet lists the
firm's assets, liabilities, and stockholders' equity as of a certain date. On the income statement,
expenses are subtracted from revenues to produce a number called net income. The statement
of retained earnings describes the increases and decreases of retained earnings. The statement
of cash flows summarizes the increase and decreases in cash over a period of time and includes
net cash flows from operating, investing, and financing activities (Figure 5.1-1).
- 69 -
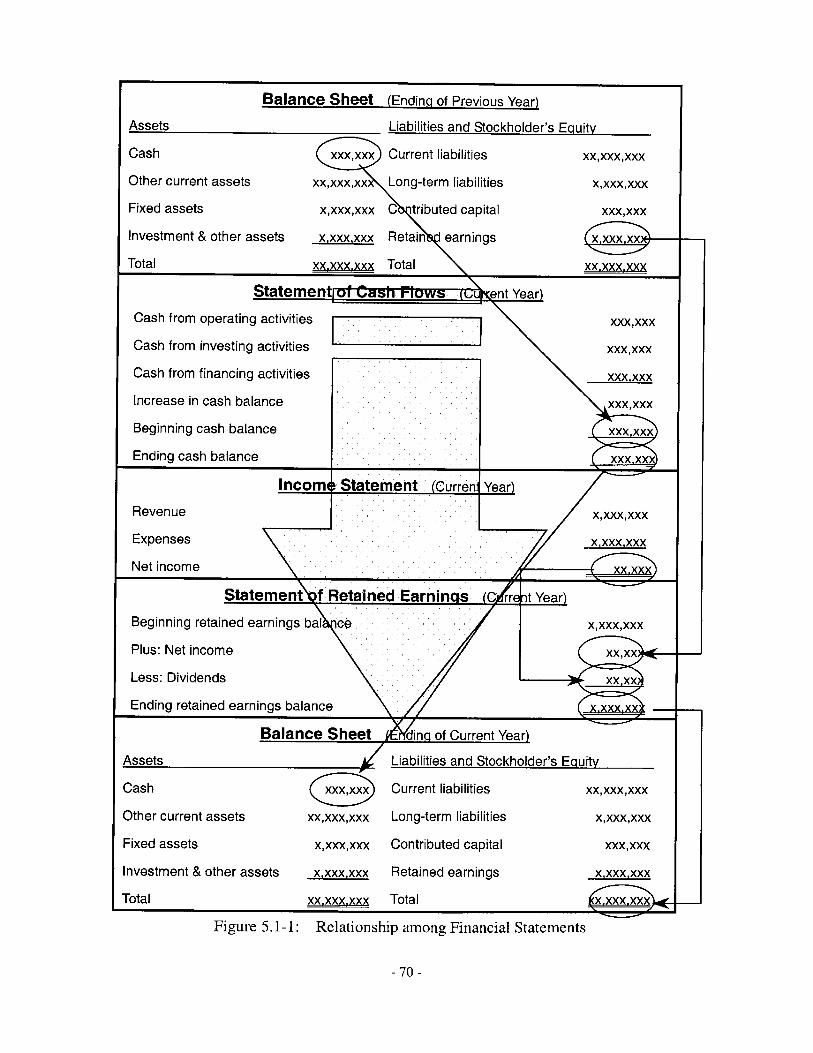
Balance Sheet (Ending of Previous Year)
Assets Liabilities and Stockholder's Equity
Cash xxx,xxx Current liabilities xx,xxx,xxx
Other current assets xx,xxx,xx Long-term liabilities x,xxx,xxx
Fixed assets x,xxx,xxx C tributed capital xxx,xxx
Investment & other assets x,xxx,xxx Retain earnings
Total xx,xxx,xxx Total xx xxx,xxx
Statement CsFl )uSent Year)
Cash from operating activities xxxxxx
Cash from investing activities xxxxxx
Cash from financing activities xxx,xxx
Increase in cash balance xxxxxx
Beginning cash balance xxx xxx
Ending cash balance xxx xx
Incomh Statement (Curren Year)
Revenue xxxxxxx
Expenses x xxx xxx
Net income xx xxx
Statementtsf Retained Earninils tCrrt i t Year)
Beginning retained earnings bal ce x,xxx,xxx
Plus: Net income xx,xx
Less: Dividends xx xx
Ending retained earnings balaings x xx
Balance Sheet /ding of Current Year)
Assets Liabilities and Stockholder's Equity
Cash Current liabilities xx,xxx,xxx
Other current assets xx,xxx,xxx Long-term liabilities x,xxx,xxx
Fixed assets x,xxx,xxx Contributed capital xxx,xxx
Investment & other assets x,xxx,xxx Retained earnings x xxx xxx
Total xxxxx xxx Total x xxx xxx
Figure 5.1-1: Relationship among Financial Statements
- 70 -
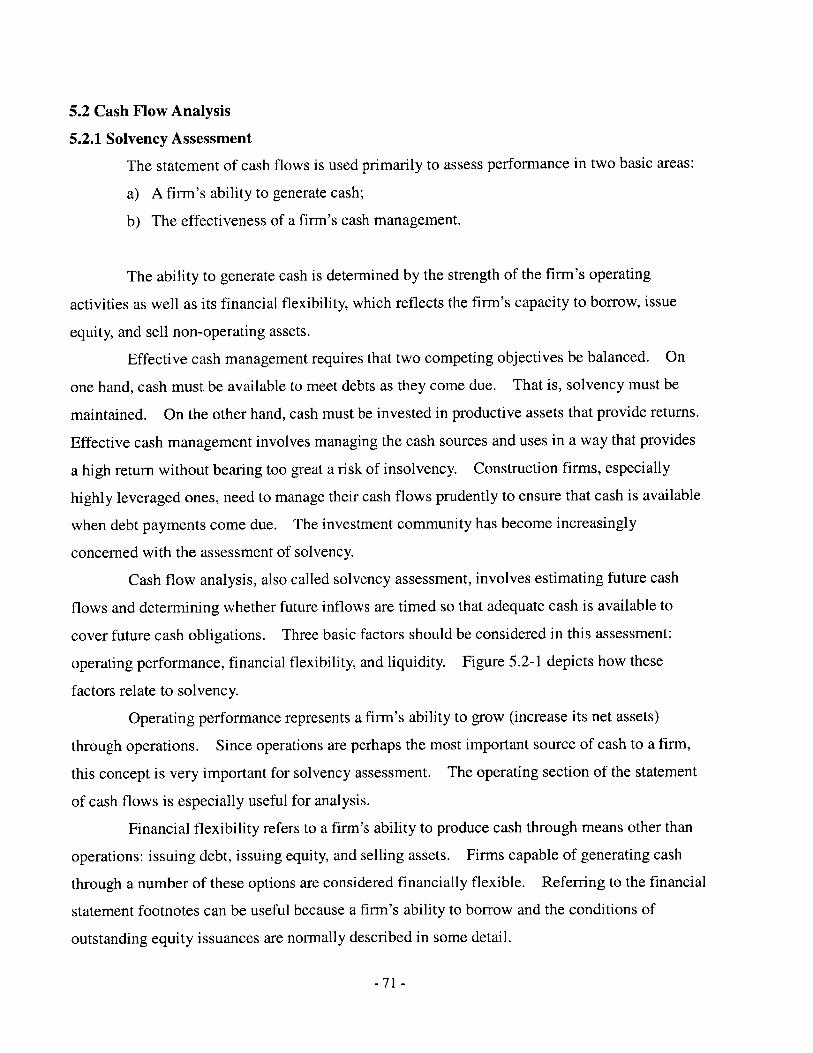
5.2 Cash Flow Analysis
5.2.1 Solvency Assessment
The statement of cash flows is used primarily to assess performance in two basic areas:
a) A firm's ability to generate cash;
b) The effectiveness of a firm's cash management.
The ability to generate cash is determined by the strength of the firm's operating
activities as well as its financial flexibility, which reflects the firm's capacity to borrow, issue
equity, and sell non-operating assets.
Effective cash management requires that two competing objectives be balanced. On
one hand, cash must be available to meet debts as they come due. That is, solvency must be
maintained. On the other hand, cash must be invested in productive assets that provide returns.
Effective cash management involves managing the cash sources and uses in a way that provides
a high return without bearing too great a risk of insolvency. Construction firms, especially
highly leveraged ones, need to manage their cash flows prudently to ensure that cash is available
when debt payments come due. The investment community has become increasingly
concerned with the assessment of solvency.
Cash flow analysis, also called solvency assessment, involves estimating future cash
flows and determining whether future inflows are timed so that adequate cash is available to
cover future cash obligations. Three basic factors should be considered in this assessment:
operating performance, financial flexibility, and liquidity. Figure 5.2-1 depicts how these
factors relate to solvency.
Operating performance represents a firm's ability to grow (increase its net assets)
through operations. Since operations are perhaps the most important source of cash to a firm,
this concept is very important for solvency assessment. The operating section of the statement
of cash flows is especially useful for analysis.
Financial flexibility refers to a firm's ability to produce cash through means other than
operations: issuing debt, issuing equity, and selling assets. Firms capable of generating cash
through a number of these options are considered financially flexible. Referring to the financial
statement footnotes can be useful because a firm's ability to borrow and the conditions of
outstanding equity issuances are normally described in some detail.
-71 -
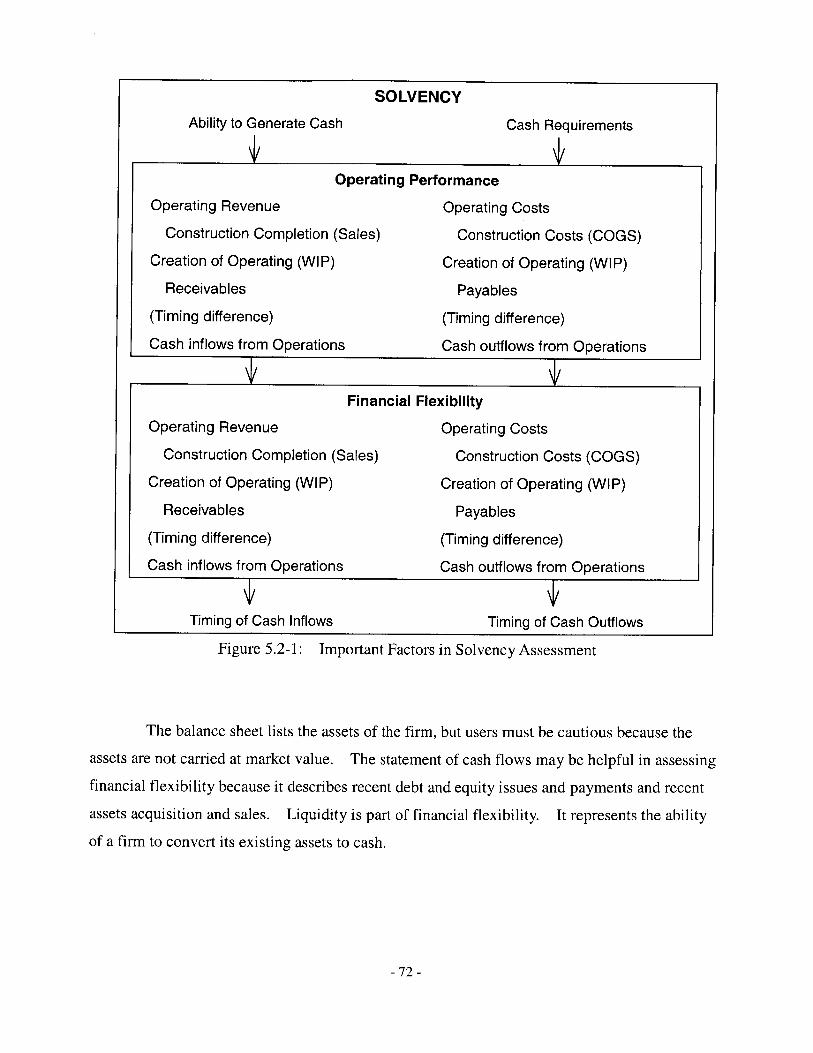
SOLVENCY
Operating Revenue
Construction Completion
Creation of Operating (WIP
Receivables
(Timing difference)
Cash inflows from Operatio
Operating Revenue
Construction Completion (Sales)
Creation of Operating (WIP)
Receivables
(Timing difference)
Cash inflows from Operations
Operating Performance
Operating Costs
(Sales) Construction Costs (COGS)
Creation of Operating (WIP)
Payables
(Timing difference)
is Cash outflows from Operations
ncial Flexibility
Operating Costs
Construction Costs (COGS)
Creation of Operating (WIP)
Payables
(Timing difference)
Cash outflows from Operations
Figure 5.2-1: Important Factors in Solvency Assessment
The balance sheet lists the assets of the firm, but users must be cautious because the
assets are not carried at market value. The statement of cash flows may be helpful in assessing
financial flexibility because it describes recent debt and equity issues and payments and recent
assets acquisition and sales. Liquidity is part of financial flexibility. It represents the ability
of a firm to convert its existing assets to cash.
- 72 -
Ability to Generate Cash
Timing of Cash InflowsTiming of Cash Inflows Timing of Cash Outflows
Timing of Cash Outflows
IF
Cash Requirements
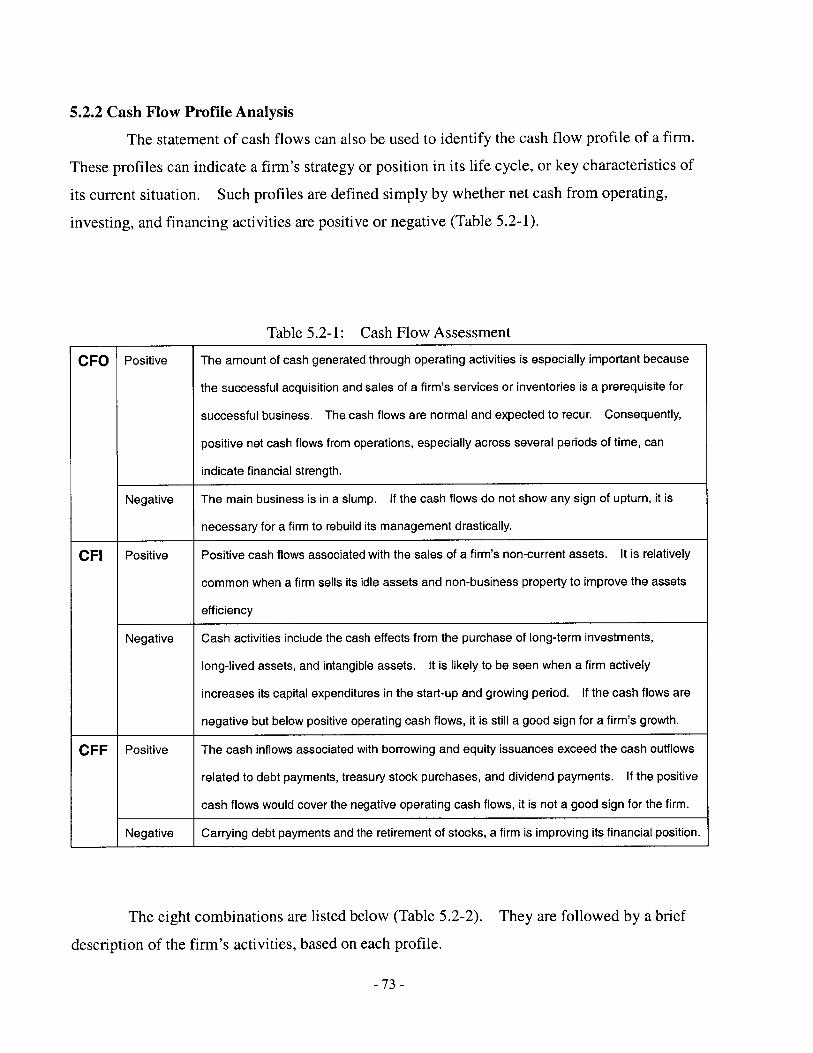
5.2.2 Cash Flow Profile Analysis
The statement of cash flows can also be used to identify the cash flow profile of a firm.
These profiles can indicate a firm's strategy or position in its life cycle, or key characteristics of
its current situation. Such profiles are defined simply by whether net cash from operating,
investing, and financing activities are positive or negative (Table 5.2-1).
Table 5.2-1: Cash Flow Assessment
CFO Positive The amount of cash generated through operating activities is especially important because
the successful acquisition and sales of a firm's services or inventories is a prerequisite for
successful business. The cash flows are normal and expected to recur. Consequently,
positive net cash flows from operations, especially across several periods of time, can
indicate financial strength.
Negative The main business is in a slump. If the cash flows do not show any sign of upturn, it is
necessary for a firm to rebuild its management drastically.
CFI Positive Positive cash flows associated with the sales of a firm's non-current assets. It is relatively
common when a firm sells its idle assets and non-business property to improve the assets
efficiency
Negative Cash activities include the cash effects from the purchase of long-term investments,
long-lived assets, and intangible assets. It is likely to be seen when a firm actively
increases its capital expenditures in the start-up and growing period. If the cash flows are
negative but below positive operating cash flows, it is still a good sign for a firm's growth.
CFF Positive The cash inflows associated with borrowing and equity issuances exceed the cash outflows
related to debt payments, treasury stock purchases, and dividend payments. If the positive
cash flows would cover the negative operating cash flows, it is not a good sign for the firm.
Negative Carrying debt payments and the retirement of stocks, a firm is improving its financial position.
The eight combinations are listed below (Table 5.2-2). They are followed by a brief
description of the firm's activities, based on each profile.
-73-
Table 5.2-2: Cash Flow Profiles
Profile CFO CFI CFF
This firm is generating large amounts of cash from all activities, perhaps in
1 + + + anticipation of a large investment. It is necessary to verify the reason for
positive cash flows from investing and financing activities.
This firm is financing its growth through operations and by issuing debt and/or
2 + - + equity. If the funds are raised by debt, the firm must pay attention to its
solvency.
This firm is using operating cash and selling off long-term assets to reduce debt
3 + + - or pay stockholders. The firm needs to consider whether delaying capital
investments is sacrificing the firm's future growth.
This firm is financing both its growth and payments to capital providers with
4 + - - cash from operations. The firm is in good condition but must verify the effects
of capital expenditures (CAPEX).
This firm is selling off long-term assets and collecting cash from capital
5 - + + providers to finance operating cash flow losses. The firm must examine the
profitability of the current activities and its capital structure.
This firm is collecting cash from capital providers to finance growth and6 - - +
operating cash flow losses.
This firm is selling off long-term assets to finance operating cash flow losses
7 - + - and payments to capital providers. It is essential for the firm to improve the
operating activities.
This firm is using its cash reserves to finance operating cash flow losses,
8 - - - payments to capital providers, and growth.
Improving its profitability from operating activities is the immediate priority.
Reference: "Financial Accounting" (Pratt, 2003)
Table 5.2-3 represents Japan's top thirty-two construction firms, categorized according
to these eight cash flow profiles, in fiscal 2002. Most of them had lost their power to generate
cash flows.
- 74 -
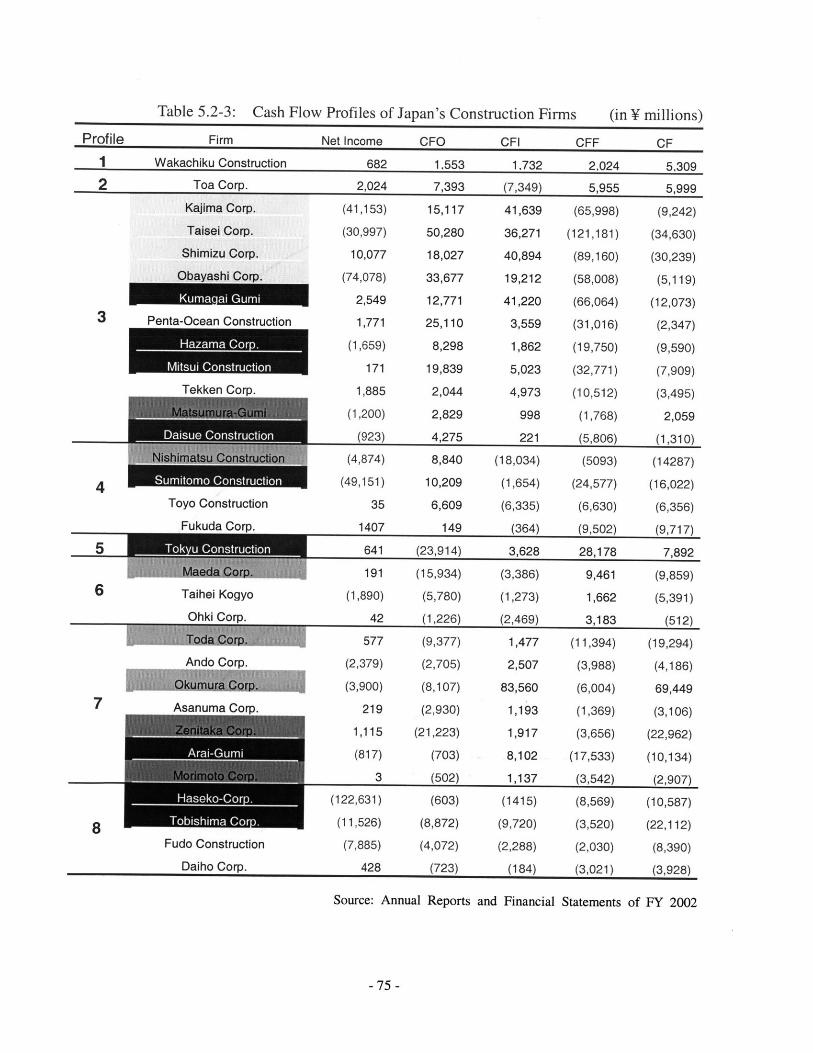
Table 5.2-3: Cash Flow Profiles of Japan's Construction Firms
Firm
Wakachiku Construction
Toa Corp.
Kajima Corp.
Taisei Corp.
Shimizu Corp.
Obayashi Corp.
Kuma6ai Gumi
Penta-Ocean Construction
Hazama Corp.
Mitsui Construction
Toyo Construction
Fukuda Corp.
Profile
12
5 641 (23,914) 3,628 28,178 7,892-M 191 (15,934) (3,386) 9,461 (9,859)
Taihei Kogyo (1,890) (5,780) (1,273) 1,662 (5,391)
Ohki Corp. 42 (1,226) (2,469) 3,183 (512)
Toda,577 (9,377) 1,477 (11,394) (19,294)
Ando Corp. (2,379) (2,705) 2,507 (3,988) (4,186)
(3,900) (8,107) 83,560 (6,004) 69,4497 Asanuma Corp. 219 (2,930) 1,193 (1,369) (3,106)
1,115 (21,223) 1,917 (3,656) (22,962)
(817) (703) 8,102 (17,533) (10,134)
3 (502) 1,137 (3,542) (2,907)
W (122,631) (603) (1415) (8,569) (10,587)
e (11,526) (8,872) (9,720) (3,520) (22,112)
Fudo Construction (7,885) (4,072) (2,288) (2,030) (8,390)
Daiho Corp. 428 (723) (184) (3,021) (3,928)
Source: Annual Reports and Financial Statements of FY 2002
-75 -
3
4
(in Y millions)
Net Income
682
2,024
(41,153)
(30,997)
10,077
(74,078)
2,549
1,771
(1,659)
171
1,885
(1,200)
(923)
(4,874)
(49,151)
35
1407
CFO
1.553
7,393
15,117
50,280
18,027
33,677
12,771
25,110
8,298
19,839
2,044
2,829
4,275
8,840
10,209
6,609
149
CF
1.732
(7,349)
41,639
36,271
40,894
19,212
41,220
3,559
1,862
5,023
4,973
998
221
(18,034)
(1,654)
(6,335)
(364)
CFF
2,024
5,955
(65,998)
(121,181)
(89,160)
(58,008)
(66,064)
(31,016)
(19,750)
(32,771)
(10,512)
(1,768)
(5,806)
(5093)
(24,577)
(6,630)
(9,502)
CF
5.309
5,999
(9,242)
(34,630)
(30,239)
(5,119)
(12,073)
(2,347)
(9,590)
(7,909)
(3,495)
2,059
(1,310)
(14287)
(16,022)
(6,356)
(9,717)
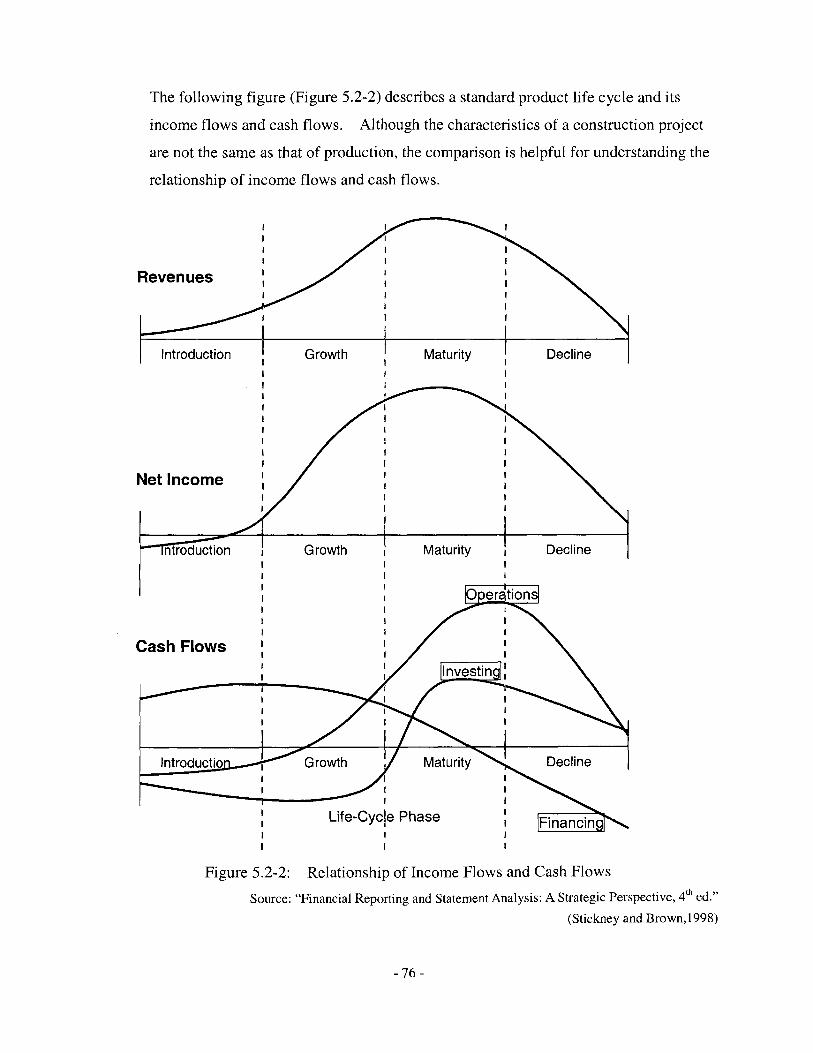
The following figure (Figure 5.2-2) describes a standard product life cycle and its
income flows and cash flows. Although the characteristics of a construction project
are not the same as that of production, the comparison is helpful for understanding the
relationship of income flows and cash flows.
Revenues
Introduction Growth Maturity Decline
Net Income
n Growth Maturity Decline
0 er tion
Cash FlowsInvestin
IntodutioGrowth Maturity Decline
Life-Cycle Phase Financin
Figure 5.2-2: Relationship of Income Flows and Cash Flows
Source: "Financial Reporting and Statement Analysis: A Strategic Perspective, 4h ed."
(Stickney and Brown,1998)
- 76 -
C
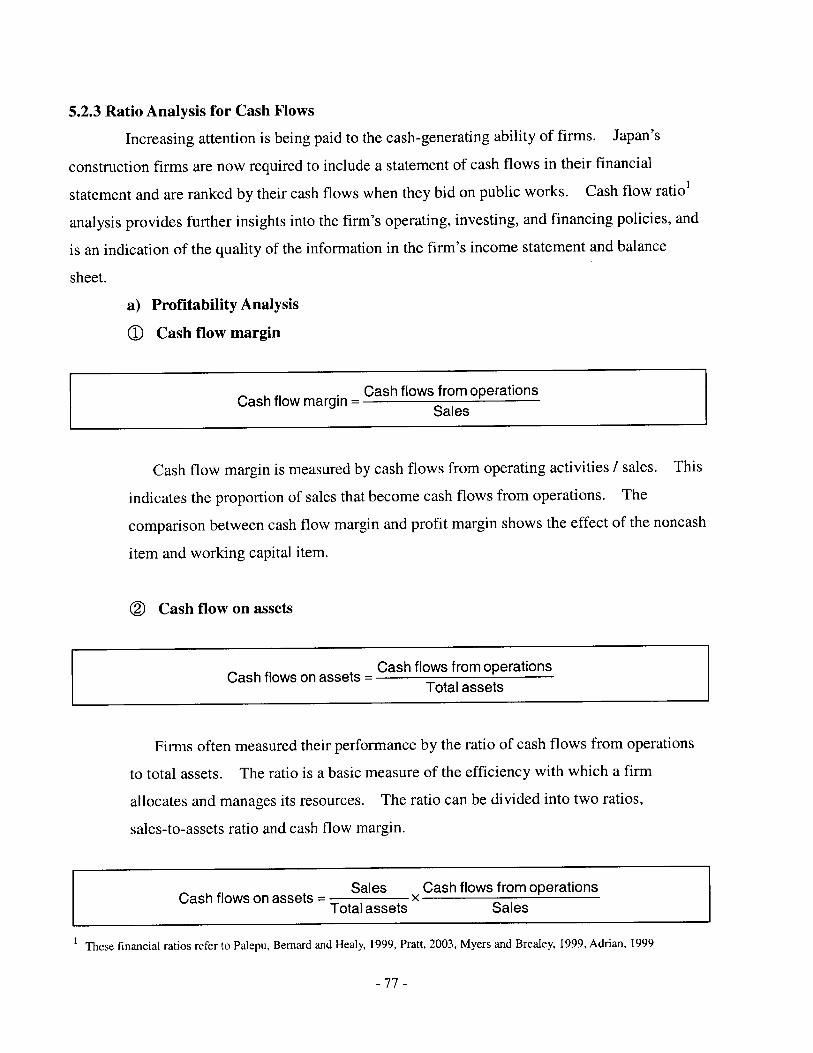
5.2.3 Ratio Analysis for Cash Flows
Increasing attention is being paid to the cash-generating ability of firms. Japan's
construction firms are now required to include a statement of cash flows in their financial
statement and are ranked by their cash flows when they bid on public works. Cash flow ratio'
analysis provides further insights into the firm's operating, investing, and financing policies, and
is an indication of the quality of the information in the firm's income statement and balance
sheet.
a) Profitability Analysis
(1) Cash flow margin
Cash flow m Cash flows from operationsSales
Cash flow margin is measured by cash flows from operating activities / sales. This
indicates the proportion of sales that become cash flows from operations. The
comparison between cash flow margin and profit margin shows the effect of the noncash
item and working capital item.
( Cash flow on assets
Cash flows from operationsCash flows on assets =
Total assets
Firms often measured their performance by the ratio of cash flows from operations
to total assets. The ratio is a basic measure of the efficiency with which a firm
allocates and manages its resources. The ratio can be divided into two ratios,
sales-to-assets ratio and cash flow margin.
Sales Cash flows from operationsCash flows on assets = Toaxset ae
Total assets Sales
iThese financial ratios refer to Palepu, Bernard and Healy, 1999, Pratt, 2003, Myers and Brealey, 1999, Adrian, 1999
- 77 -
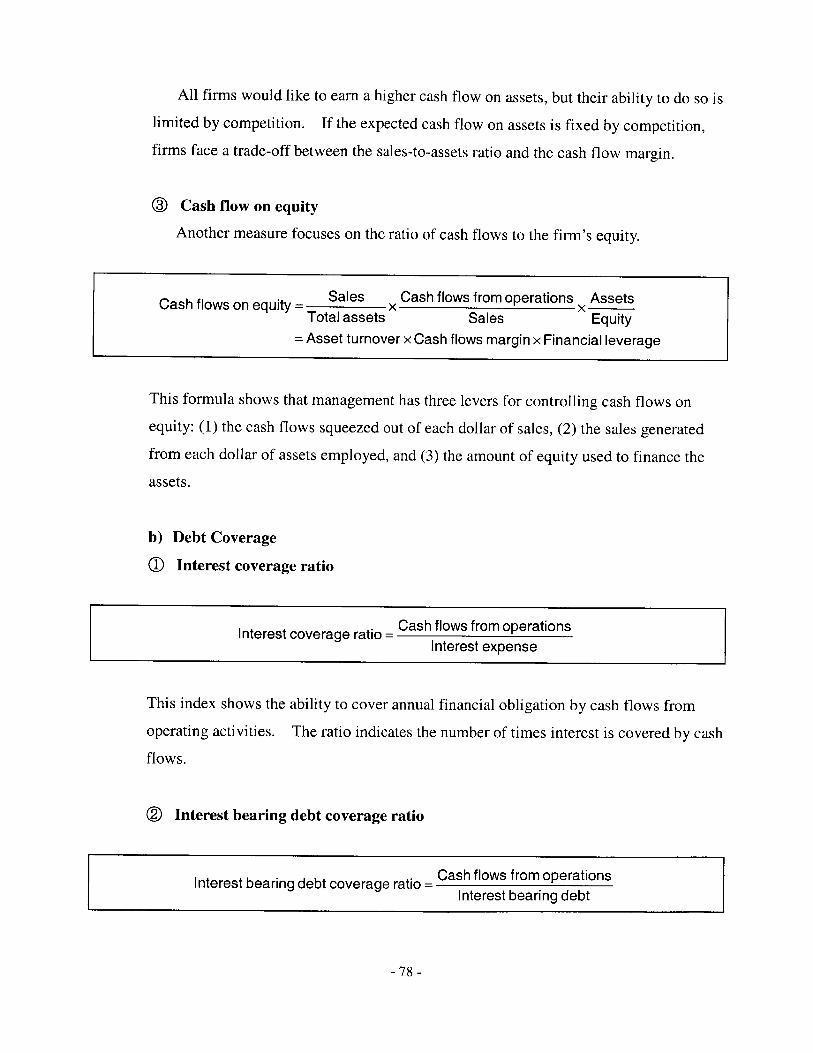
All firms would like to earn a higher cash flow on assets, but their ability to do so is
limited by competition. If the expected cash flow on assets is fixed by competition,
firms face a trade-off between the sales-to-assets ratio and the cash flow margin.
Z Cash flow on equity
Another measure focuses on the ratio of cash flows to the firm's equity.
Cash flows on equity = Sales Cash flows from operations AssetsTotal assets Sales Equity
= Asset turnover x Cash flows margin x Financial leverage
This formula shows that management has three levers for controlling cash flows on
equity: (1) the cash flows squeezed out of each dollar of sales, (2) the sales generated
from each dollar of assets employed, and (3) the amount of equity used to finance the
assets.
b) Debt Coverage
(1) Interest coverage ratio
Interest coverage ratio = Cash flows from operationsInterest expense
This index shows the ability to cover annual financial obligation by cash flows from
operating activities. The ratio indicates the number of times interest is covered by cash
flows.
( Interest bearing debt coverage ratio
Interest bearing debt coverage ratio = Cash flows from operationsInterest bearing debt
-78-
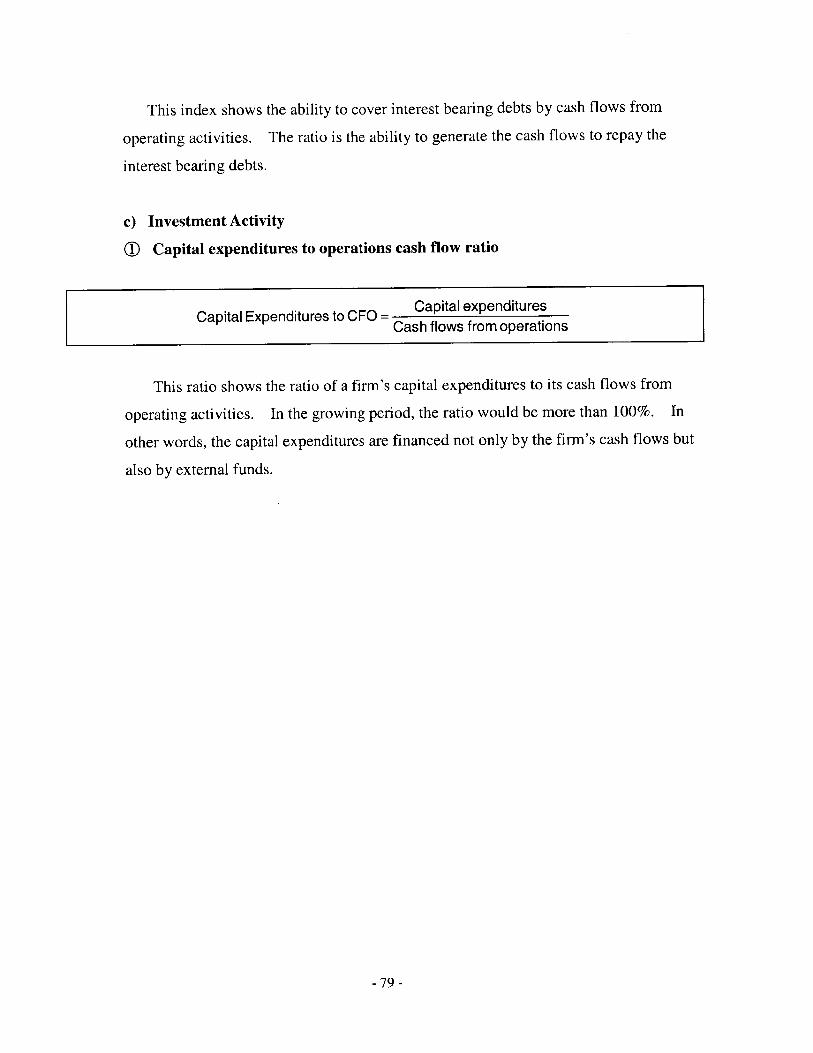
This index shows the ability to cover interest bearing debts by cash flows from
operating activities. The ratio is the ability to generate the cash flows to repay the
interest bearing debts.
c) Investment Activity
(D Capital expenditures to operations cash flow ratio
Capital Expenditures to CFO = Capital expendituresCash flows from operations
This ratio shows the ratio of a firm's capital expenditures to its cash flows from
operating activities. In the growing period, the ratio would be more than 100%. In
other words, the capital expenditures are financed not only by the firm's cash flows but
also by external funds.
- 79 -

5.3 Management of Cash Flows
Often a construction project takes more than a year to complete. Because a large
amount of money is injected into the project for years, cash flow management is very essential
for firms in the construction industry.
5.3.1 Management of Cash Flows from Operating Activities
Cash flows from operating activities (CFO) include cash receipts and payments during a
particular period associated with a firm's operating activities. The major inflows of
construction firms derive from the revenue from completed works. The outflows are
construction costs, such as material, labor, subcontract, and overhead costs, and general
administrative and selling expenses.
For the construction firms, the completion of construction is the major source of CFO.
There are two main revenue-recognition methods for the construction industry. These are the
percentage of completion method and the completed contract method. The percentage of
completion method recognizes income on a current basis and the completed contract method
recognizes no revenue or expense until the completion of the construction project. Whichever
method the firm chooses, the net cash flows from construction projects do not change. The
choice of revenue-recognition method is a matter of accounting method and does not affect the
net cash flows.
The features of the construction projects' cash flows are as follows:
a) Payment methods
In the construction industry, the duration of building a project often exceeds a year
and the payments of the project are usually allocated and made during the project. The
payment method is determined at the time of the contract.
(1) Progress payment (Private works)
The progress of the project is measured and the firm asks for payment at
regular intervals.
() Payment at the time of inspections (Private works)
The payments are divided and made after inspections between processes, and at
the end of the project.
- 80 -
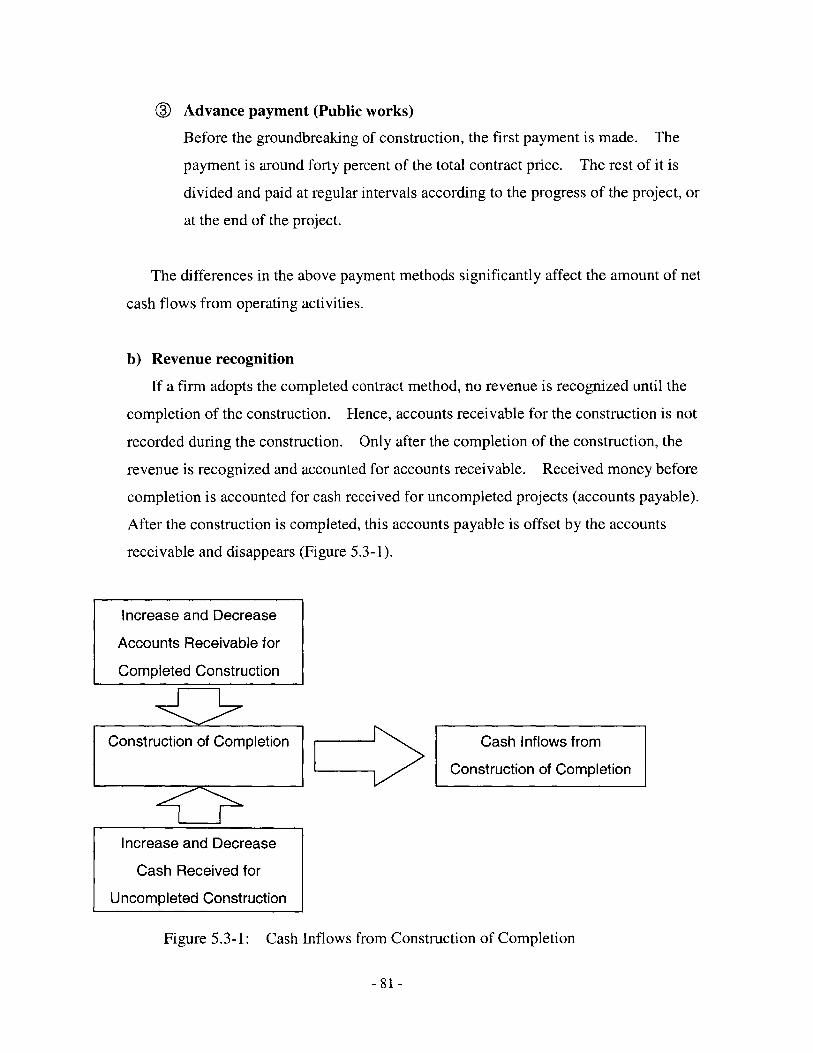
Advance payment (Public works)
Before the groundbreaking of construction, the first payment is made. The
payment is around forty percent of the total contract price. The rest of it is
divided and paid at regular intervals according to the progress of the project, or
at the end of the project.
The differences in the above payment methods significantly affect the amount of net
cash flows from operating activities.
b) Revenue recognition
If a firm adopts the completed contract method, no revenue is recognized until the
completion of the construction. Hence, accounts receivable for the construction is not
recorded during the construction. Only after the completion of the construction, the
revenue is recognized and accounted for accounts receivable. Received money before
completion is accounted for cash received for uncompleted projects (accounts payable).
After the construction is completed, this accounts payable is offset by the accounts
receivable and disappears (Figure 5.3-1).
Increase and Decrease
Accounts Receivable for
Completed Construction
Construction of Completion Cash Inflows from
Construction of Completion
Increase and Decrease
Cash Received for
Uncompleted Construction
Figure 5.3-1: Cash Inflows from Construction of Completion
- 81 -
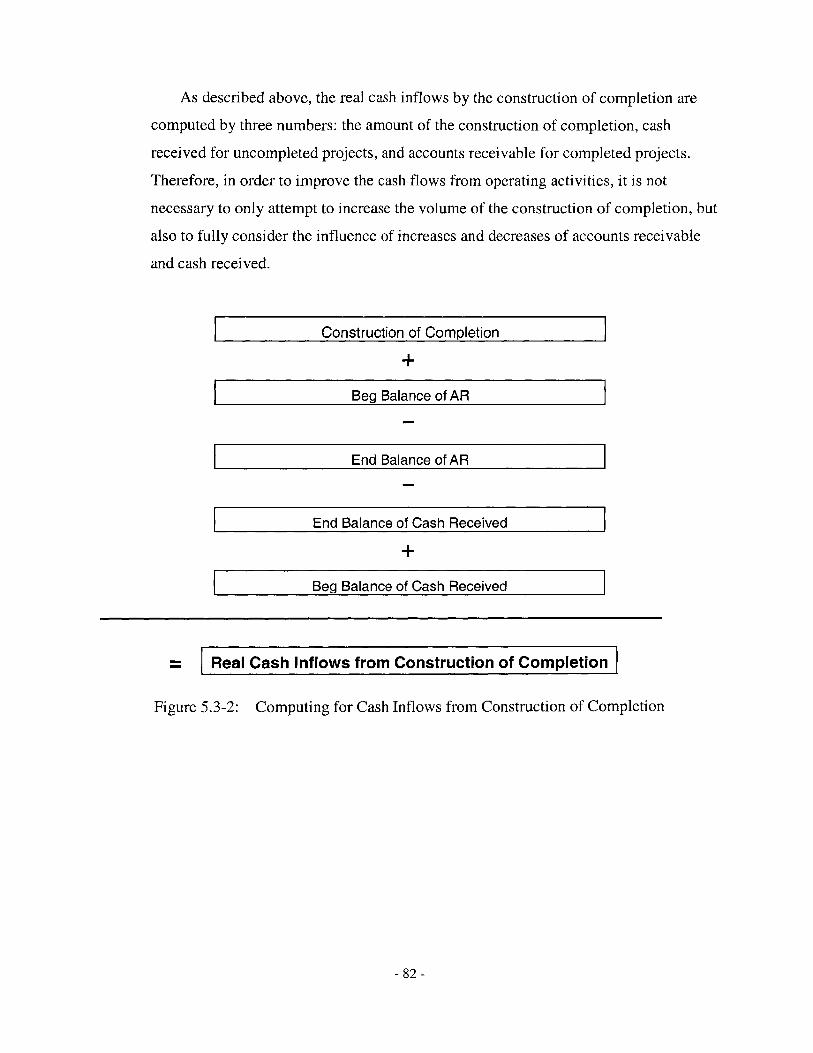
As described above, the real cash inflows by the construction of completion are
computed by three numbers: the amount of the construction of completion, cash
received for uncompleted projects, and accounts receivable for completed projects.
Therefore, in order to improve the cash flows from operating activities, it is not
necessary to only attempt to increase the volume of the construction of completion, but
also to fully consider the influence of increases and decreases of accounts receivable
and cash received.
Construction of Completion
Beg Balance of AR
End Balance of AR
End Balance of Cash Received
Beg Balance of Cash Received
= Real Cash Inflows from Construction of Completion
Figure 5.3-2: Computing for Cash Inflows from Construction of Completion
- 82 -
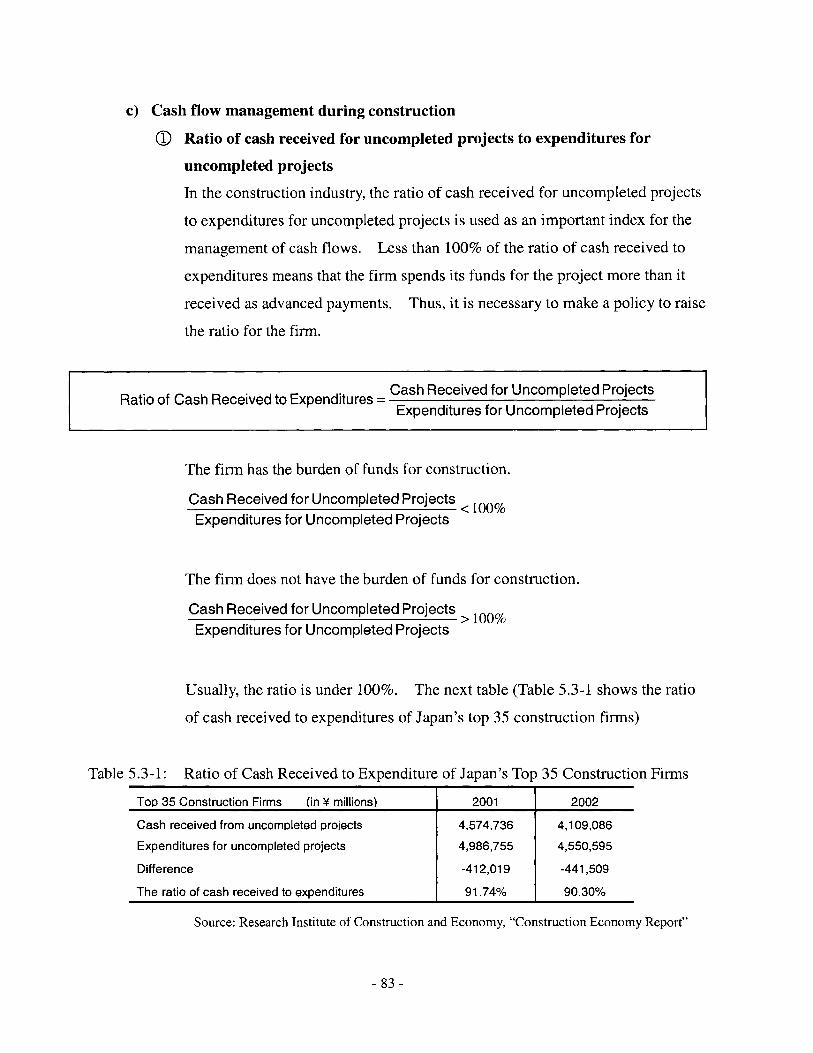
c) Cash flow management during construction
M Ratio of cash received for uncompleted projects to expenditures for
uncompleted projects
In the construction industry, the ratio of cash received for uncompleted projects
to expenditures for uncompleted projects is used as an important index for the
management of cash flows. Less than 100% of the ratio of cash received to
expenditures means that the firm spends its funds for the project more than it
received as advanced payments. Thus, it is necessary to make a policy to raise
the ratio for the firm.
. . Cash Received for Uncompleted ProjectsRatio of Cash Received to Expenditures = Expeie for Uncompleted ProjectsExpenditures for Uncompleted Projects
The firm has the burden of funds for construction.
Cash Received for Uncompleted Projects <100%Expenditures for Uncompleted Projects
The firm does not have the burden of funds for construction.
Cash Received for Uncompleted Projects >100%Expenditures for Uncompleted Projects
Usually, the ratio is under 100%. The next table (Table 5.3-1 shows the ratio
of cash received to expenditures of Japan's top 35 construction firms)
Table 5.3-1: Ratio of Cash Received to Expenditure of Japan's Top 35 Construction Firms
Top 35 Construction Firms (in Y millions) 2001 2002
Cash received from uncompleted proiects 4,574,736 4,109,086
Expenditures for uncompleted projects 4,986,755 4,550,595
Difference -412,019 -441,509
The ratio of cash received to expenditures 91.74% 90.30%
Source: Research Institute of Construction and Economy, "Construction Economy Report"
- 83 -

( Timely reports of construction inspections and progress
The payment method is chosen in the contract. If the progress payment
method is adopted, the construction progress information is critical for the
payment. If the payments are made at the time of inspection, the inspection
information becomes important. Therefore, the timely reports of the progress
and inspection information lead the cash flow improvement.
d) Cash flow management after construction
(D Analysis of accounts receivable for completed construction
Accounts receivable for completed construction is an uncollected balance of the
contract price. This is the final step of cash collecting management for the
project, and the collecting money largely affects the cash flows.
The collection period highlights the firm's management of accounts receivable.
Collection Period = Accounts Receivable for Completed ConstructionConstruction of Completion -12months
In addition, the receivable that the construction firm receives for the projects is
sometimes not only accounts receivable for completed projects but also bills
and notes. Thus, the following formula is also used as a total collecting period
of the firm.
Collection Period = Accounts Receivable for Completed Construction + Bills + Notes(Construction of Completion + Other Operation) + 12months
Z Receivable management
Although it is preferable for the firm to collect accounts receivables for
completed construction, it usually gets behind with payments for certain
reasons. Thus, receivable management plays an important role for
maintaining the firm's cash flow management.
84 -

e) Cash flow management of construction costs
Another way to improve the cash flows is that the improvement of cash
outflows for construction costs. Construction costs are first entered as
expenditures for uncompleted projects until the project is completed. When the
project is completed, the costs are transferred to the costs of completed construction.
The unpaid construction costs are collected in accounts payable for completed
projects.
As mentioned above, the cash outflows of the construction costs are computed
with the expenditures for uncompleted projects and the accounts payable for
completed projects.
Increase or Decrease
Expenditures for
Uncompleted Construction
Costs of Completed Cash Outflows for
Construction ICosts of Construction
Increase or Decrease
Accounts Payable for
Completed Construction
Figure 5.3-3: Cash Outflows for Costs of Construction
The real cash outflows for the construction costs are derived from three numbers,
the costs of completed construction, expenditures for uncompleted projects, and
accounts payable for completed projects. Therefore, in order to improve the cash
flows from operating activities, it is not necessary to only attempt to decrease the
construction costs but also to fully consider the influence of increase or decrease of
accounts receivable and payable.
- 85 -
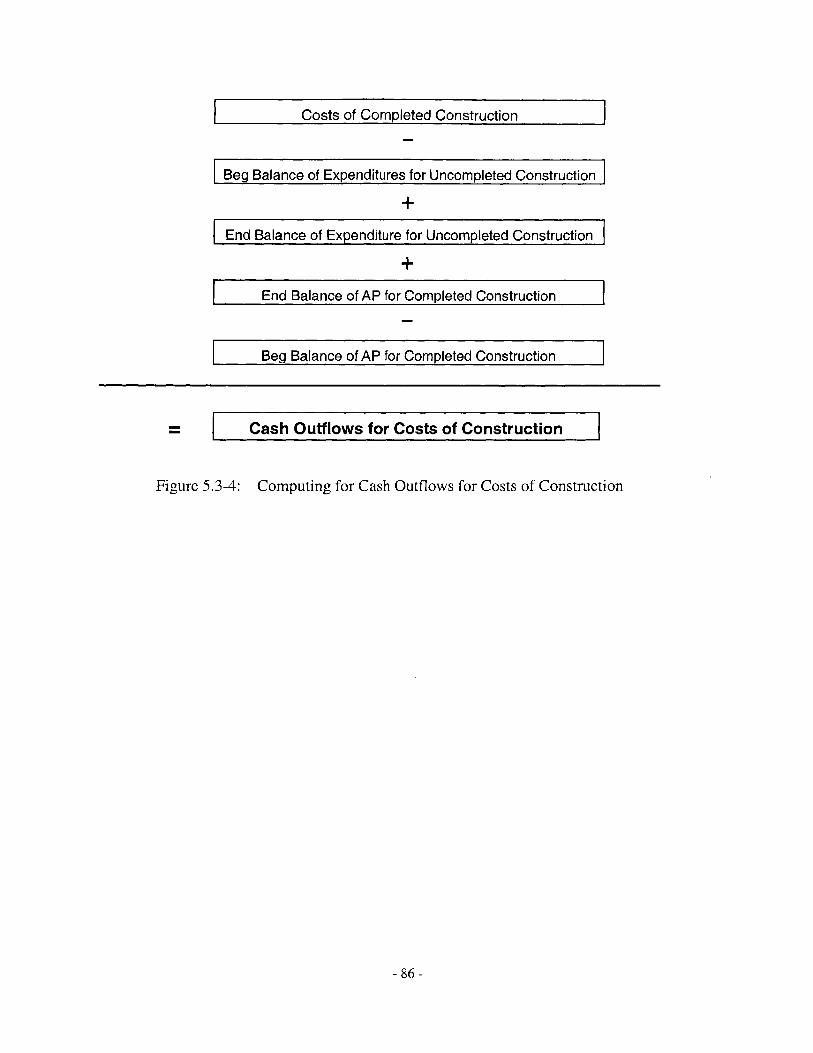
Costs of Completed Construction
Beg Balance of Expenditures for Uncompleted Construction
End Balance of Expenditure for Uncompleted Construc
End Balance of AP for Completed Construction
Beg Balance of AP for Completed Construction
Cash Outflows for Costs of Construction I
Figure 5.3-4: Computing for Cash Outflows for Costs of Construction
- 86 -
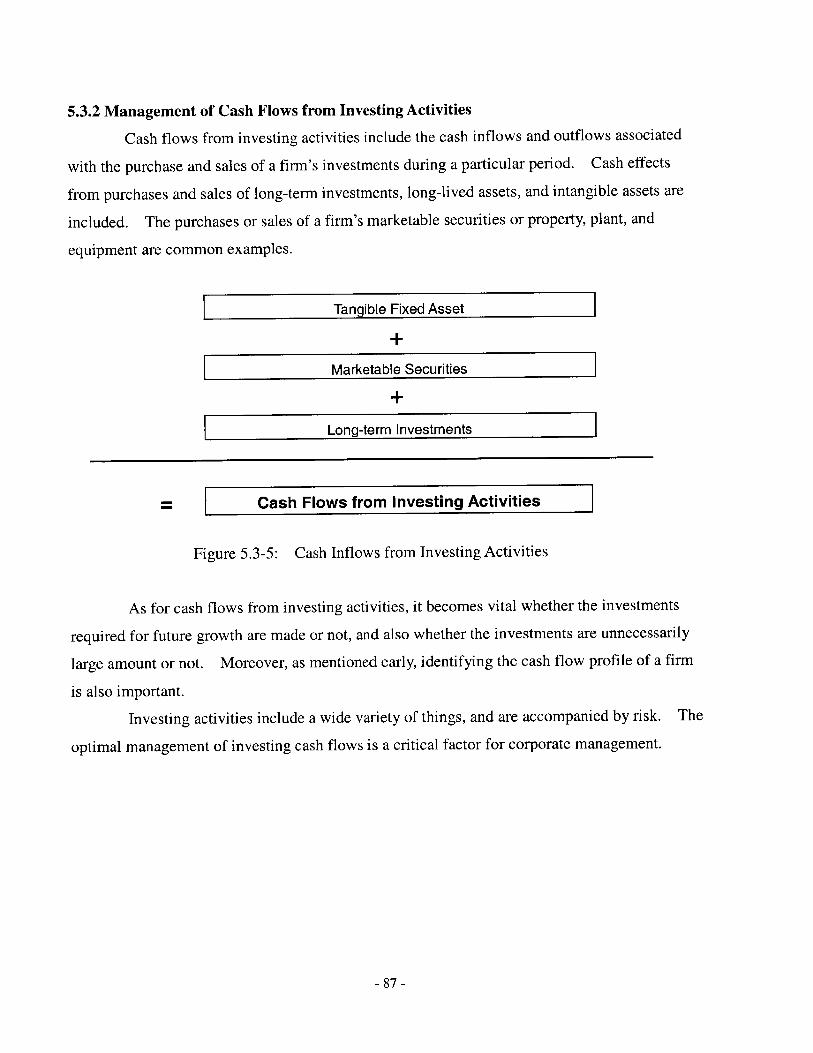
5.3.2 Management of Cash Flows from Investing Activities
Cash flows from investing activities include the cash inflows and outflows associated
with the purchase and sales of a firm's investments during a particular period. Cash effects
from purchases and sales of long-term investments, long-lived assets, and intangible assets are
included. The purchases or sales of a firm's marketable securities or property, plant, and
equipment are common examples.
Tangible Fixed Asset
Marketable Securities
Long-term Investments
Cash Flows from Investing Activities
Figure 5.3-5: Cash Inflows from Investing Activities
As for cash flows from investing activities, it becomes vital whether the investments
required for future growth are made or not, and also whether the investments are unnecessarily
large amount or not. Moreover, as mentioned early, identifying the cash flow profile of a firm
is also important.
Investing activities include a wide variety of things, and are accompanied by risk. The
optimal management of investing cash flows is a critical factor for corporate management.
- 87 -
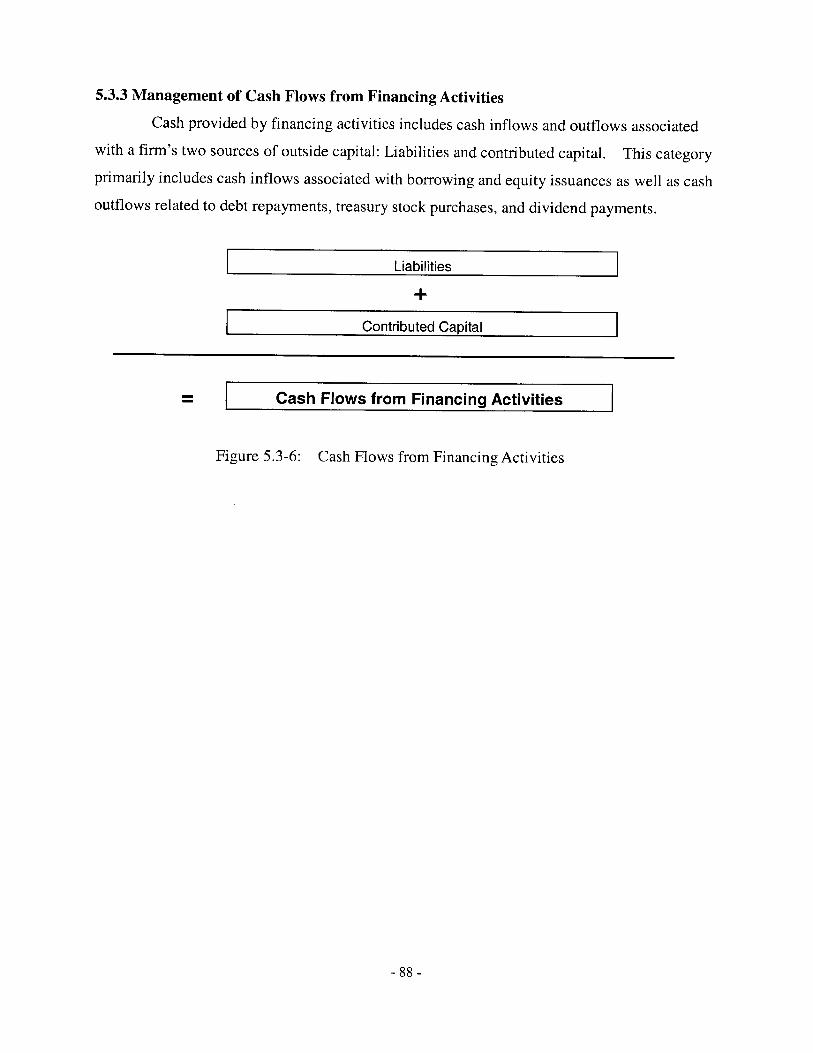
5.3.3 Management of Cash Flows from Financing Activities
Cash provided by financing activities includes cash inflows and outflows associated
with a firm's two sources of outside capital: Liabilities and contributed capital. This category
primarily includes cash inflows associated with borrowing and equity issuances as well as cash
outflows related to debt repayments, treasury stock purchases, and dividend payments.
Liabilities
Contributed Capital
Cash Flows from Financing Activities
Figure 5.3-6: Cash Flows from Financing Activities
- 88 -
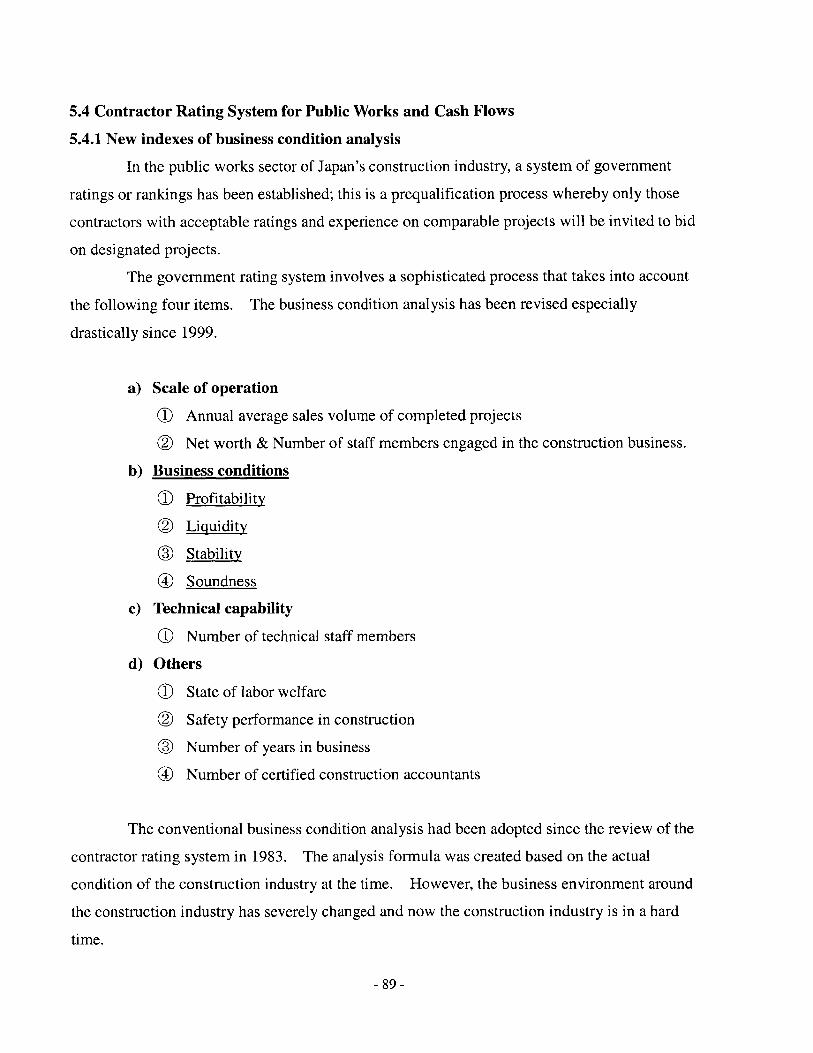
5.4 Contractor Rating System for Public Works and Cash Flows
5.4.1 New indexes of business condition analysis
In the public works sector of Japan's construction industry, a system of government
ratings or rankings has been established; this is a prequalification process whereby only those
contractors with acceptable ratings and experience on comparable projects will be invited to bid
on designated projects.
The government rating system involves a sophisticated process that takes into account
the following four items. The business condition analysis has been revised especially
drastically since 1999.
a) Scale of operation
( Annual average sales volume of completed projects
Z Net worth & Number of staff members engaged in the construction business.
b) Business conditions
I Profitability
Z Liquidity
( Stability
O Soundness
c) Technical capability
O Number of technical staff members
d) Others
( State of labor welfare
(Z Safety performance in construction
Number of years in business
Number of certified construction accountants
The conventional business condition analysis had been adopted since the review of the
contractor rating system in 1983. The analysis formula was created based on the actual
condition of the construction industry at the time. However, the business environment around
the construction industry has severely changed and now the construction industry is in a hard
time.
- 89 -
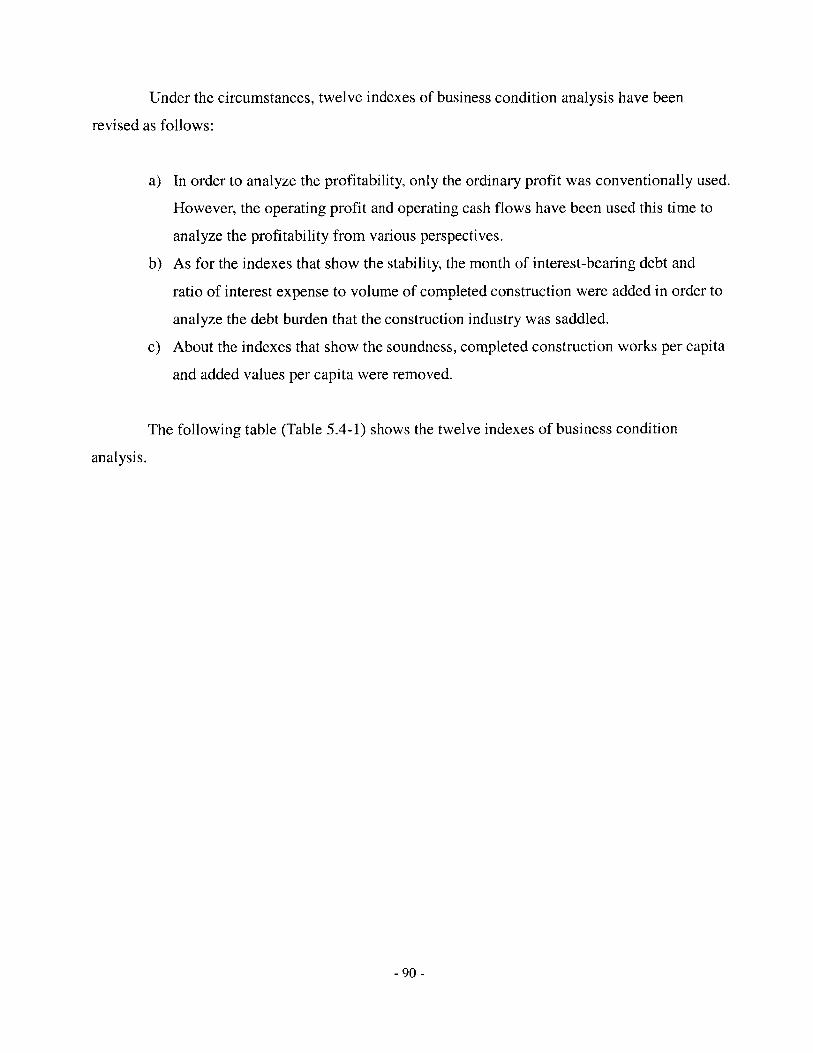
Under the circumstances, twelve indexes of business condition analysis have been
revised as follows:
a) In order to analyze the profitability, only the ordinary profit was conventionally used.
However, the operating profit and operating cash flows have been used this time to
analyze the profitability from various perspectives.
b) As for the indexes that show the stability, the month of interest-bearing debt and
ratio of interest expense to volume of completed construction were added in order to
analyze the debt burden that the construction industry was saddled.
c) About the indexes that show the soundness, completed construction works per capita
and added values per capita were removed.
The following table (Table 5.4-1) shows the twelve indexes of business condition
analysis.
- 90 -
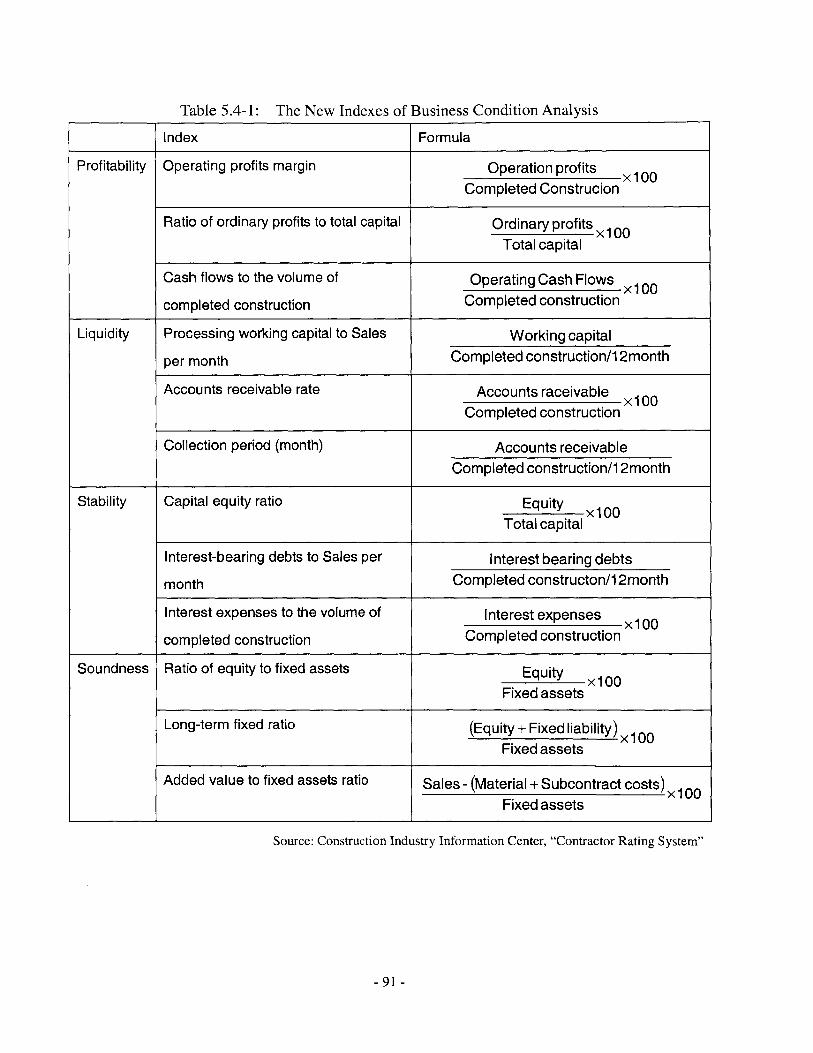
The New Indexes of Business Condition Analysis
Index Formula
Profitability Operating profits margin Operation profits X100Completed Construcion
Ratio of ordinary profits to total capital Ordinary profits X100Total capital
Cash flows to the volume of Operating Cash Flowsx1 00
completed construction Completed construction
Liquidity Processing working capital to Sales Working capital
per month Completed construction/1 2month
Accounts receivable rate Accounts raceivablex1 00
Completed construction
Collection period (month) Accounts receivableCompleted construction/1 2month
Stability Capital equity ratio Equity x10OTotal capital
Interest-bearing debts to Sales per Interest bearing debts
month Completed constructon/1 2month
Interest expenses to the volume of Interest expenses X100
completed construction Completed construction
Soundness Ratio of equity to fixed assets Equity X100Fixed assets
Long-term fixed ratio (Equity + Fixed liability) X 00Fixed assets
Added value to fixed assets ratio Sales - (Material + Subcontract costs) x100Fixed assets
Source: Construction Industry Information Center, "Contractor Rating System"
- 91 -
Table 5.4-1:
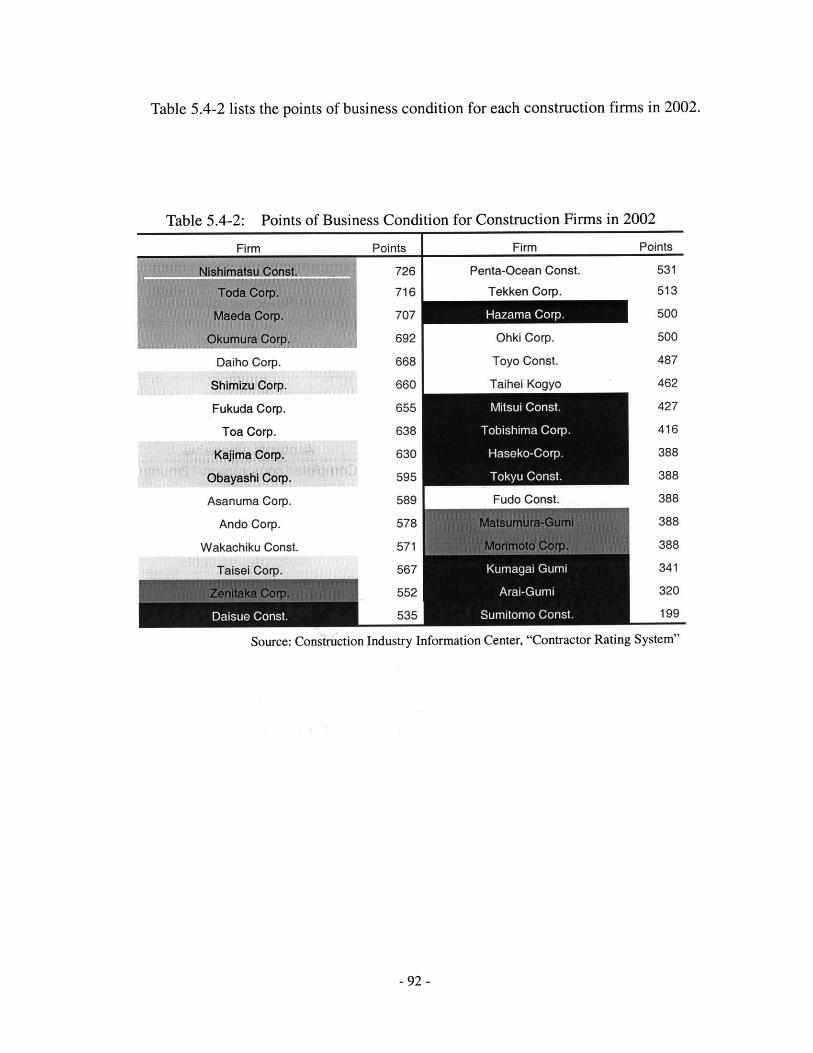
Table 5.4-2 lists the points of business condition for each construction firms in 2002.
Table 5.4-2: Points of Business Condition for Construction Firms in 2002
Fi
Daiho
Shimiz
Fukud
Toa
Asanur
Ando
Wakachi
rm Points Firm Points
726 Penta-Ocean Const. 531
716 Tekken Corp. 513
707 C500
692 Ohki Corp. 500
Corp. 668 Toyo Const. 487
u Corp. 660 Taihei Kogyo 462
a Corp. 655 427
C Co.p. 416
iCorp. 630 388
hi Corp. 595 388
a Corp. 589 Fudo Const. 388
Corp. 578 388
ku Const. 571 388
Corp. 567 341
55e C320
053519
Source: Construction Industry Information Center, "Contractor Rating System"
- 92 -
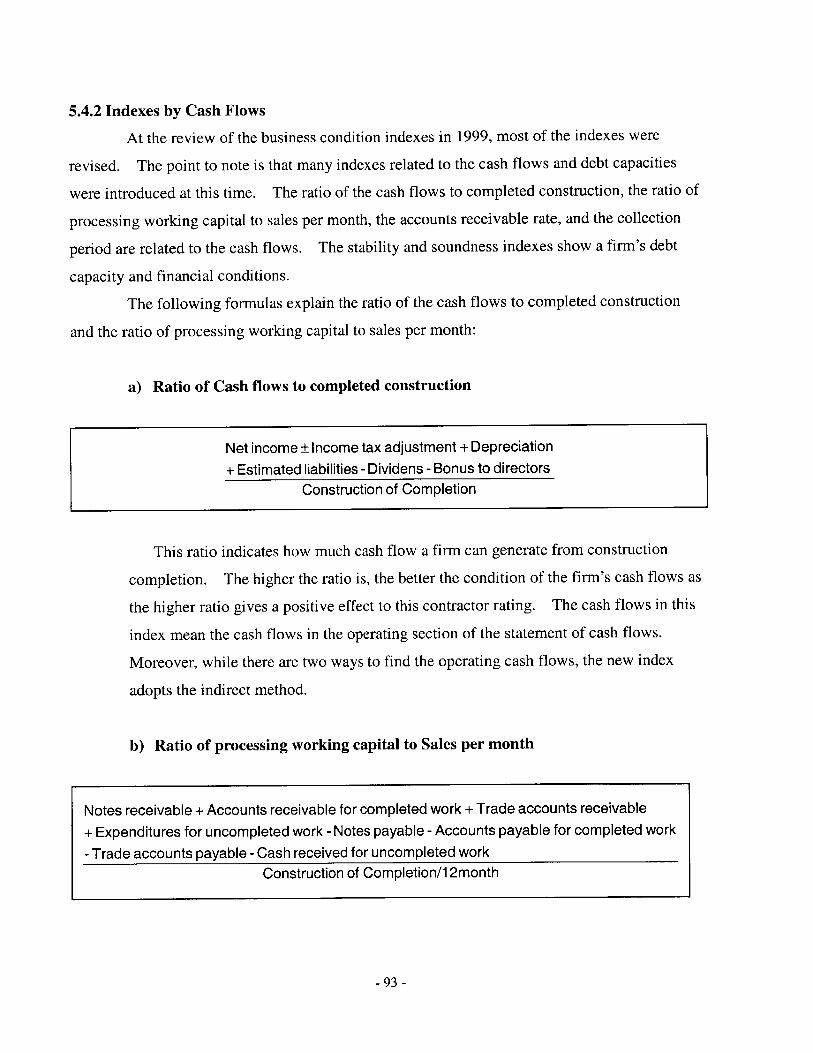
5.4.2 Indexes by Cash Flows
At the review of the business condition indexes in 1999, most of the indexes were
revised. The point to note is that many indexes related to the cash flows and debt capacities
were introduced at this time. The ratio of the cash flows to completed construction, the ratio of
processing working capital to sales per month, the accounts receivable rate, and the collection
period are related to the cash flows. The stability and soundness indexes show a firm's debt
capacity and financial conditions.
The following formulas explain the ratio of the cash flows to completed construction
and the ratio of processing working capital to sales per month:
a) Ratio of Cash flows to completed construction
Net income ± Income tax adjustment + Depreciation
+ Estimated liabilities -Dividens -Bonus to directors
Construction of Completion
This ratio indicates how much cash flow a firm can generate from construction
completion. The higher the ratio is, the better the condition of the firm's cash flows as
the higher ratio gives a positive effect to this contractor rating. The cash flows in this
index mean the cash flows in the operating section of the statement of cash flows.
Moreover, while there are two ways to find the operating cash flows, the new index
adopts the indirect method.
b) Ratio of processing working capital to Sales per month
Notes receivable + Accounts receivable for completed work + Trade accounts receivable
+ Expenditures for uncompleted work -Notes payable -Accounts payable for completed work
-Trade accounts payable - Cash received for uncompleted work
Construction of Completion/1 2month
- 93 -
The outstanding balance of the trade receivable and inventory assets, such as the
notes receivable and accounts receivable for completed project, is the invested cash, and
the outstanding balance of the trade payable, such as the notes receivable and accounts
payable for completed work, is the postponement of payment. Thus, the difference
between them is the net invested cash in the operating activities, which is called
necessary working capital. The ratio of processing working capital to sales per month
is the index that indicates the condition of working capital and the smaller this number
is, the better the effect on the cash flows and the better the contractor rating points are.
In the U.S., performance bonds and payment bonds show a guarantee from a surety that
the contract will be fulfilled in the event of failure or default by the contractor.
- 94 -
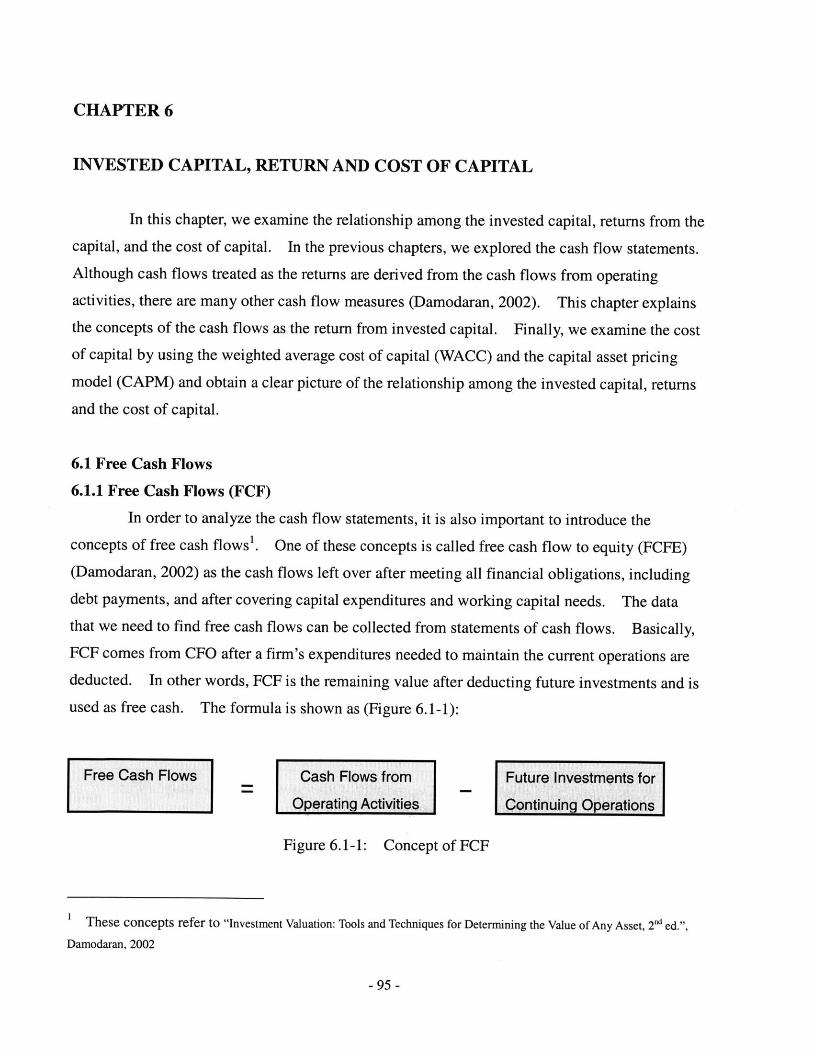
CHAPTER 6
INVESTED CAPITAL, RETURN AND COST OF CAPITAL
In this chapter, we examine the relationship among the invested capital, returns from the
capital, and the cost of capital. In the previous chapters, we explored the cash flow statements.
Although cash flows treated as the returns are derived from the cash flows from operating
activities, there are many other cash flow measures (Damodaran, 2002). This chapter explains
the concepts of the cash flows as the return from invested capital. Finally, we examine the costof capital by using the weighted average cost of capital (WACC) and the capital asset pricing
model (CAPM) and obtain a clear picture of the relationship among the invested capital, returns
and the cost of capital.
6.1 Free Cash Flows
6.1.1 Free Cash Flows (FCF)
In order to analyze the cash flow statements, it is also important to introduce the
concepts of free cash flows'. One of these concepts is called free cash flow to equity (FCFE)(Damodaran, 2002) as the cash flows left over after meeting all financial obligations, including
debt payments, and after covering capital expenditures and working capital needs. The data
that we need to find free cash flows can be collected from statements of cash flows. Basically,
FCF comes from CFO after a firm's expenditures needed to maintain the current operations arededucted. In other words, FCF is the remaining value after deducting future investments and isused as free cash. The formula is shown as (Figure 6.1-1):
Free Cash Flows Cash Flows from Future Investments forOperating Activities Continuing Operations
Figure 6.1-1: Concept of FCF
1 These concepts refer to "Investment Valuation: Tools and Techniques for Determining the Value of Any Asset, 2"" ed.",
Damodaran, 2002
- 95 -
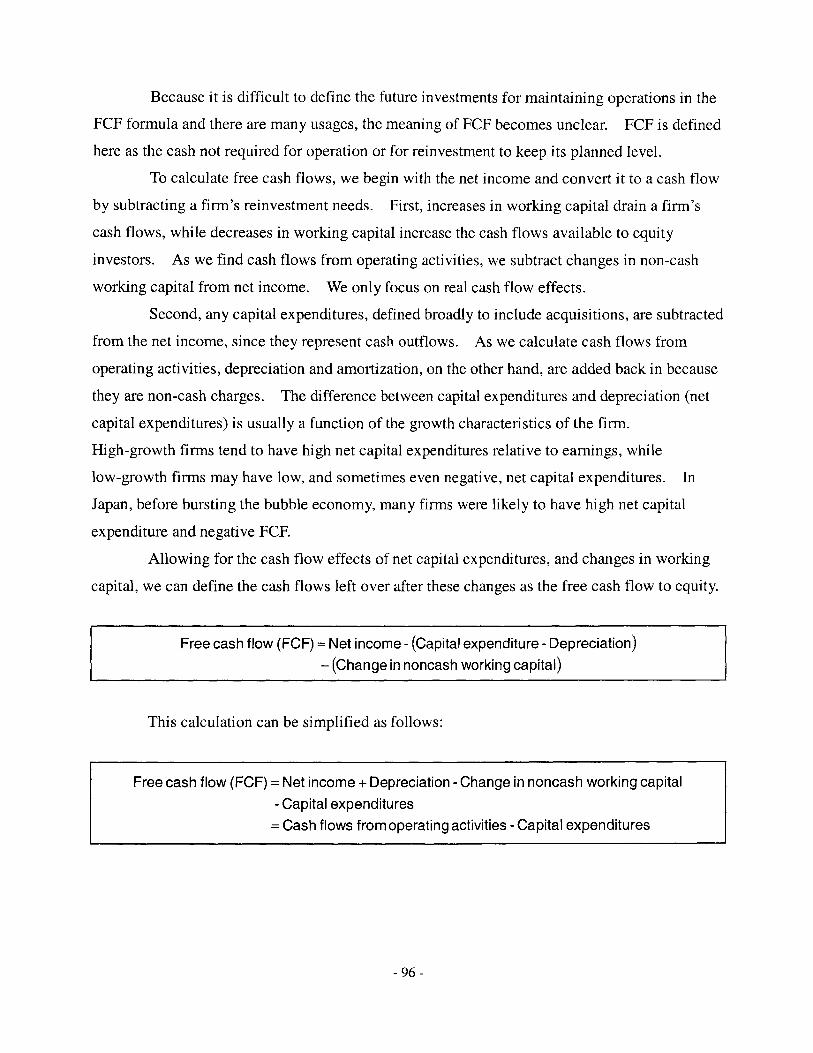
Because it is difficult to define the future investments for maintaining operations in the
FCF formula and there are many usages, the meaning of FCF becomes unclear. FCF is defined
here as the cash not required for operation or for reinvestment to keep its planned level.
To calculate free cash flows, we begin with the net income and convert it to a cash flow
by subtracting a firm's reinvestment needs. First, increases in working capital drain a firm's
cash flows, while decreases in working capital increase the cash flows available to equity
investors. As we find cash flows from operating activities, we subtract changes in non-cash
working capital from net income. We only focus on real cash flow effects.
Second, any capital expenditures, defined broadly to include acquisitions, are subtracted
from the net income, since they represent cash outflows. As we calculate cash flows from
operating activities, depreciation and amortization, on the other hand, are added back in because
they are non-cash charges. The difference between capital expenditures and depreciation (net
capital expenditures) is usually a function of the growth characteristics of the firm.
High-growth firms tend to have high net capital expenditures relative to earnings, while
low-growth firms may have low, and sometimes even negative, net capital expenditures. In
Japan, before bursting the bubble economy, many firms were likely to have high net capital
expenditure and negative FCF.
Allowing for the cash flow effects of net capital expenditures, and changes in working
capital, we can define the cash flows left over after these changes as the free cash flow to equity.
Free cash flow (FCF) = Net income - (Capital expenditure -Depreciation)- (Change in noncash working capital)
This calculation can be simplified as follows:
Free cash flow (FCF) = Net income + Depreciation -Change in noncash working capital
- Capital expenditures
= Cash flows from operating activities -Capital expenditures
- 96 -
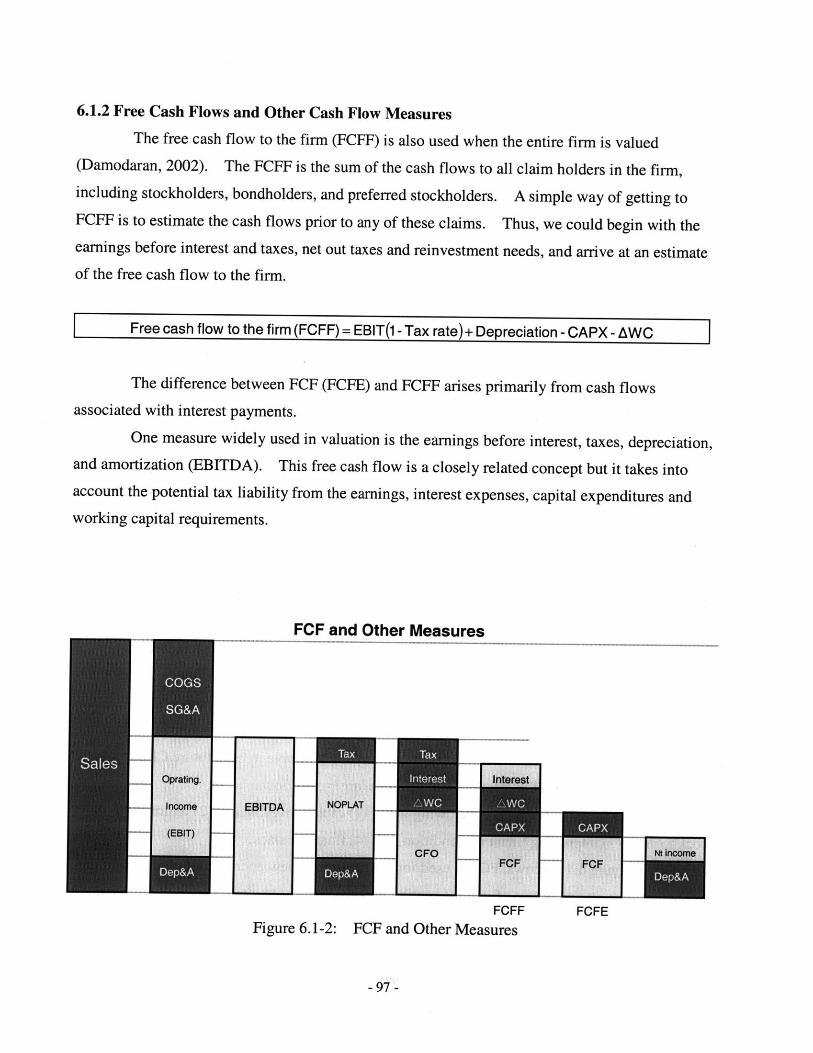
6.1.2 Free Cash Flows and Other Cash Flow Measures
The free cash flow to the firm (FCFF) is also used when the entire firm is valued
(Damodaran, 2002). The FCFF is the sum of the cash flows to all claim holders in the firm,
including stockholders, bondholders, and preferred stockholders. A simple way of getting toFCFF is to estimate the cash flows prior to any of these claims. Thus, we could begin with theearnings before interest and taxes, net out taxes and reinvestment needs, and arrive at an estimateof the free cash flow to the firm.
Free cash flow to the firm (FCFF) = EBIT(1 -Tax rate)+ Depreciation -CAPX - AWC
The difference between FCF (FCFE) and FCFF arises primarily from cash flowsassociated with interest payments.
One measure widely used in valuation is the earnings before interest, taxes, depreciation,and amortization (EBITDA). This free cash flow is a closely related concept but it takes intoaccount the potential tax liability from the earnings, interest expenses, capital expenditures andworking capital requirements.
FCF and Other Measures
FCFFFigure 6.1-2: FCF and Other Measures
FCFE
-97 -
EBITDA
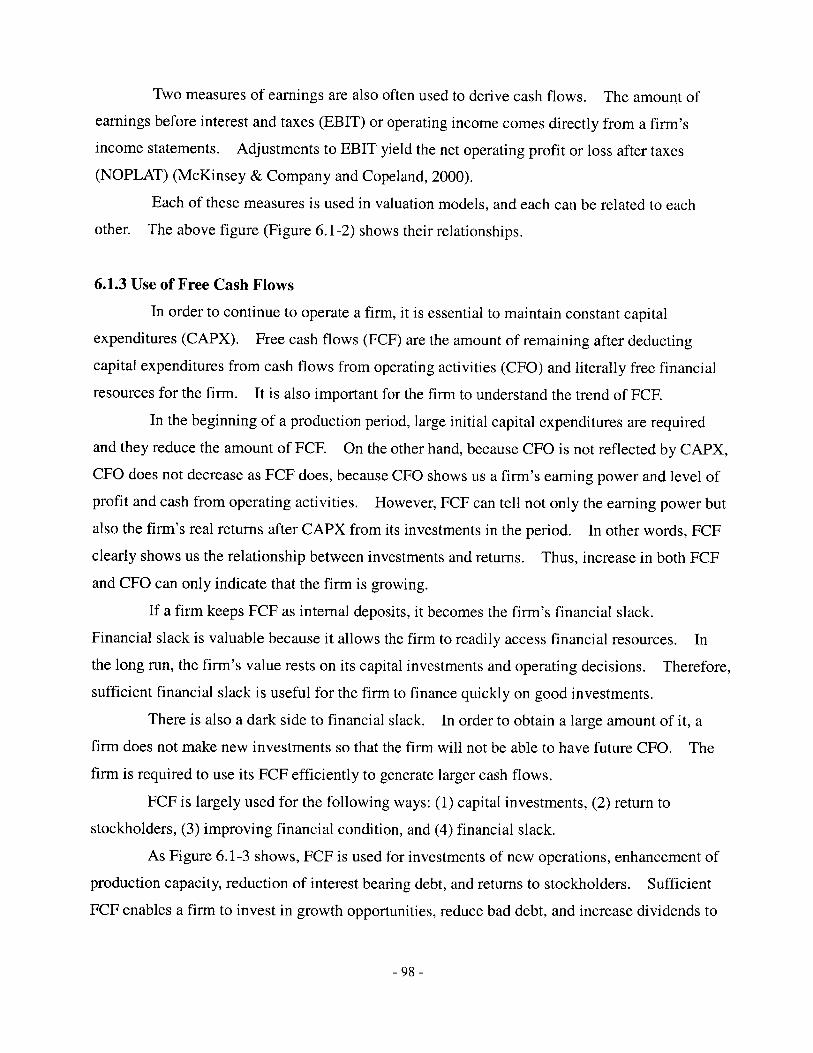
Two measures of earnings are also often used to derive cash flows. The amount of
earnings before interest and taxes (EBIT) or operating income comes directly from a firm's
income statements. Adjustments to EBIT yield the net operating profit or loss after taxes
(NOPLAT) (McKinsey & Company and Copeland, 2000).
Each of these measures is used in valuation models, and each can be related to each
other. The above figure (Figure 6.1-2) shows their relationships.
6.1.3 Use of Free Cash Flows
In order to continue to operate a firm, it is essential to maintain constant capital
expenditures (CAPX). Free cash flows (FCF) are the amount of remaining after deducting
capital expenditures from cash flows from operating activities (CFO) and literally free financial
resources for the firm. It is also important for the firm to understand the trend of FCF.
In the beginning of a production period, large initial capital expenditures are required
and they reduce the amount of FCF On the other hand, because CFO is not reflected by CAPX,
CFO does not decrease as FCF does, because CFO shows us a firm's earning power and level of
profit and cash from operating activities. However, FCF can tell not only the earning power but
also the firm's real returns after CAPX from its investments in the period. In other words, FCF
clearly shows us the relationship between investments and returns. Thus, increase in both FCF
and CFO can only indicate that the firm is growing.
If a firm keeps FCF as internal deposits, it becomes the firm's financial slack.
Financial slack is valuable because it allows the firm to readily access financial resources. In
the long run, the firm's value rests on its capital investments and operating decisions. Therefore,
sufficient financial slack is useful for the firm to finance quickly on good investments.
There is also a dark side to financial slack. In order to obtain a large amount of it, a
firm does not make new investments so that the firm will not be able to have future CFO. The
firm is required to use its FCF efficiently to generate larger cash flows.
FCF is largely used for the following ways: (1) capital investments, (2) return to
stockholders, (3) improving financial condition, and (4) financial slack.
As Figure 6.1-3 shows, FCF is used for investments of new operations, enhancement of
production capacity, reduction of interest bearing debt, and returns to stockholders. Sufficient
FCF enables a firm to invest in growth opportunities, reduce bad debt, and increase dividends to
- 98 -
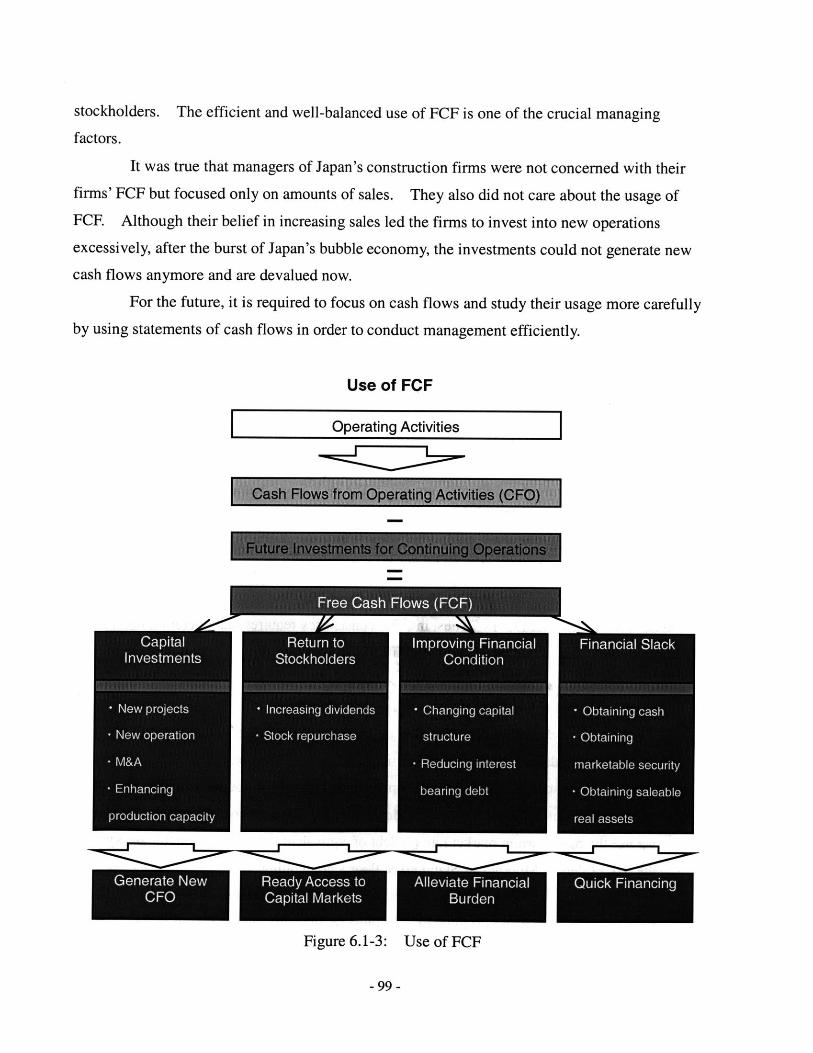
stockholders. The efficient and well-balanced use of FCF is one of the crucial managing
factors.
It was true that managers of Japan's construction firms were not concerned with theirfirms' FCF but focused only on amounts of sales. They also did not care about the usage ofFCF. Although their belief in increasing sales led the firms to invest into new operations
excessively, after the burst of Japan's bubble economy, the investments could not generate newcash flows anymore and are devalued now.
For the future, it is required to focus on cash flows and study their usage more carefullyby using statements of cash flows in order to conduct management efficiently.
Use of FCF
Operating Activities
Figure 6.1-3: Use of FCF
- 99 -
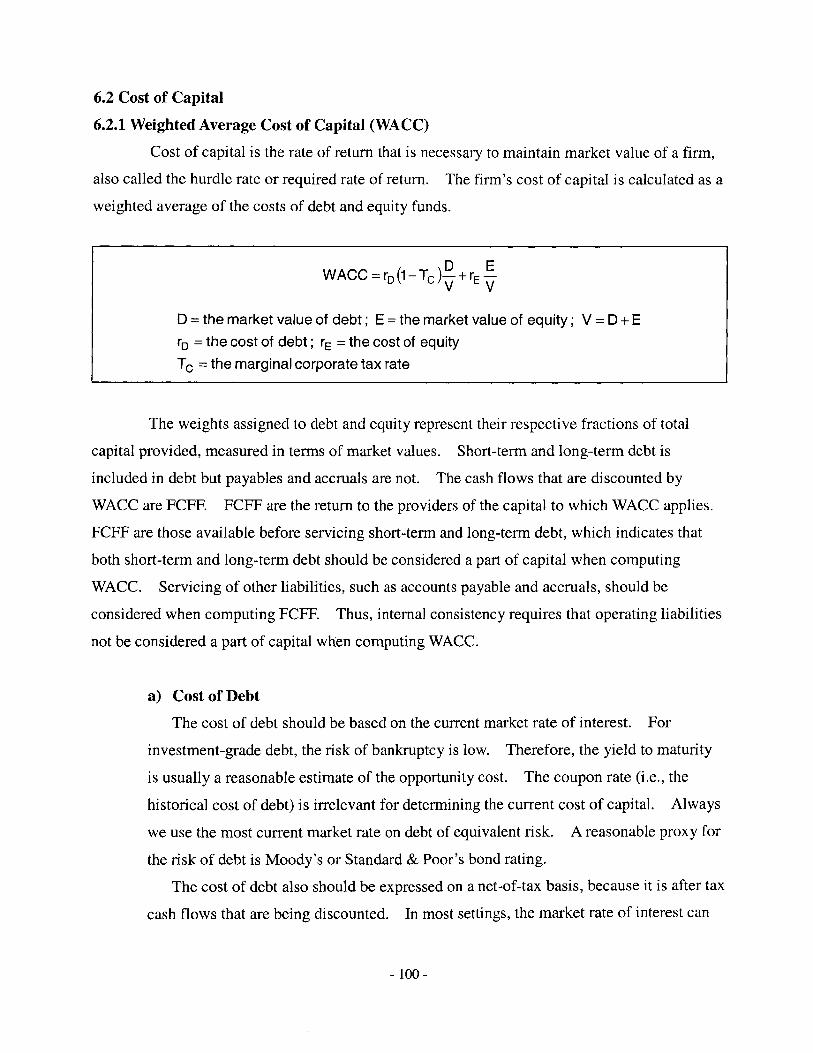
6.2 Cost of Capital
6.2.1 Weighted Average Cost of Capital (WACC)
Cost of capital is the rate of return that is necessary to maintain market value of a firm,
also called the hurdle rate or required rate of return. The firm's cost of capital is calculated as a
weighted average of the costs of debt and equity funds.
D EWACC = rD ~1 - Tc + rE~V V
D = the market value of debt; E = the market value of equity; V = D + E
rD = the cost of debt; rE = the cost of equityTc = the marginal corporate tax rate
The weights assigned to debt and equity represent their respective fractions of total
capital provided, measured in terms of market values. Short-term and long-term debt is
included in debt but payables and accruals are not. The cash flows that are discounted by
WACC are FCFF. FCFF are the return to the providers of the capital to which WACC applies.
FCFF are those available before servicing short-term and long-term debt, which indicates that
both short-term and long-term debt should be considered a part of capital when computing
WACC. Servicing of other liabilities, such as accounts payable and accruals, should be
considered when computing FCFF. Thus, internal consistency requires that operating liabilities
not be considered a part of capital when computing WACC.
a) Cost of Debt
The cost of debt should be based on the current market rate of interest. For
investment-grade debt, the risk of bankruptcy is low. Therefore, the yield to maturity
is usually a reasonable estimate of the opportunity cost. The coupon rate (i.e., the
historical cost of debt) is irrelevant for determining the current cost of capital. Always
we use the most current market rate on debt of equivalent risk. A reasonable proxy for
the risk of debt is Moody's or Standard & Poor's bond rating.
The cost of debt also should be expressed on a net-of-tax basis, because it is after tax
cash flows that are being discounted. In most settings, the market rate of interest can
- 100 -
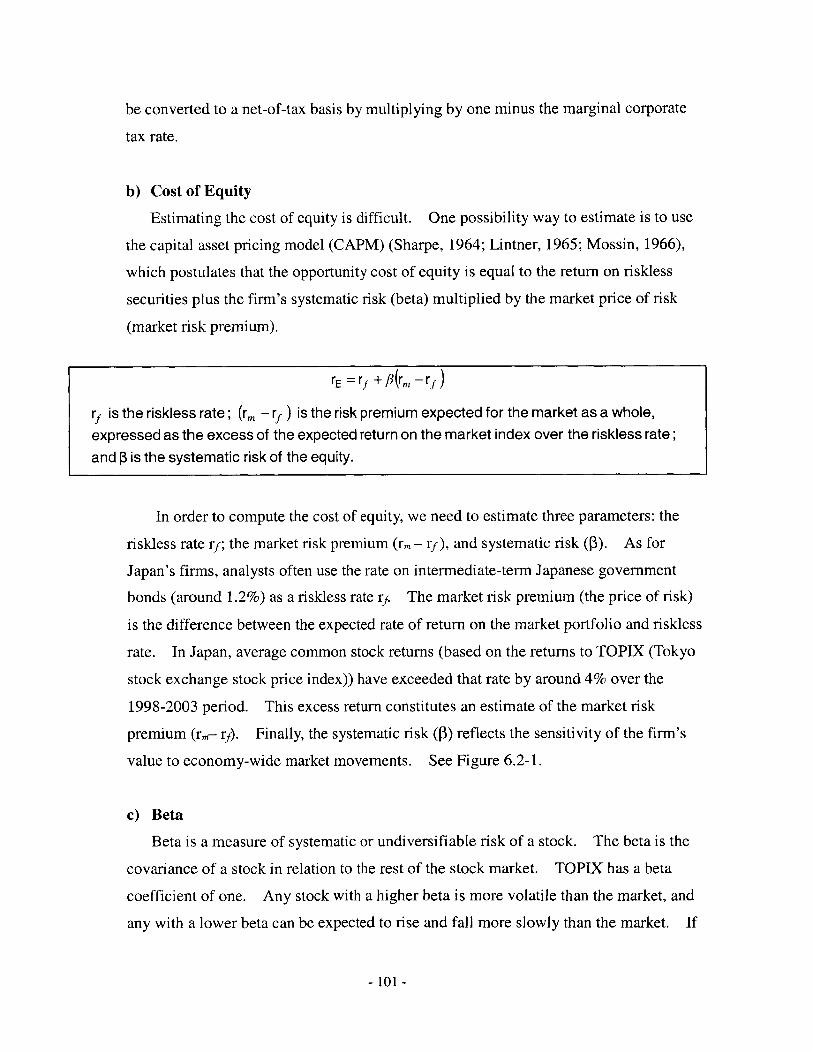
be converted to a net-of-tax basis by multiplying by one minus the marginal corporate
tax rate.
b) Cost of Equity
Estimating the cost of equity is difficult. One possibility way to estimate is to use
the capital asset pricing model (CAPM) (Sharpe, 1964; Lintner, 1965; Mossin, 1966),
which postulates that the opportunity cost of equity is equal to the return on riskless
securities plus the firm's systematic risk (beta) multiplied by the market price of risk
(market risk premium).
rE = rf + f(rM - rf
rf is the riskless rate; (r. - rf ) is the risk premium expected for the market as a whole,expressed as the excess of the expected return on the market index over the riskless rate;
and 1 is the systematic risk of the equity.
In order to compute the cost of equity, we need to estimate three parameters: the
riskless rate rj; the market risk premium (rm - rf), and systematic risk ($). As for
Japan's firms, analysts often use the rate on intermediate-term Japanese government
bonds (around 1.2%) as a riskless rate rf. The market risk premium (the price of risk)
is the difference between the expected rate of return on the market portfolio and riskless
rate. In Japan, average common stock returns (based on the returns to TOPIX (Tokyo
stock exchange stock price index)) have exceeded that rate by around 4% over the
1998-2003 period. This excess return constitutes an estimate of the market risk
premium (r,- rf). Finally, the systematic risk (P) reflects the sensitivity of the firm's
value to economy-wide market movements. See Figure 6.2-1.
c) Beta
Beta is a measure of systematic or undiversifiable risk of a stock. The beta is the
covariance of a stock in relation to the rest of the stock market. TOPIX has a beta
coefficient of one. Any stock with a higher beta is more volatile than the market, and
any with a lower beta can be expected to rise and fall more slowly than the market. If
101 -
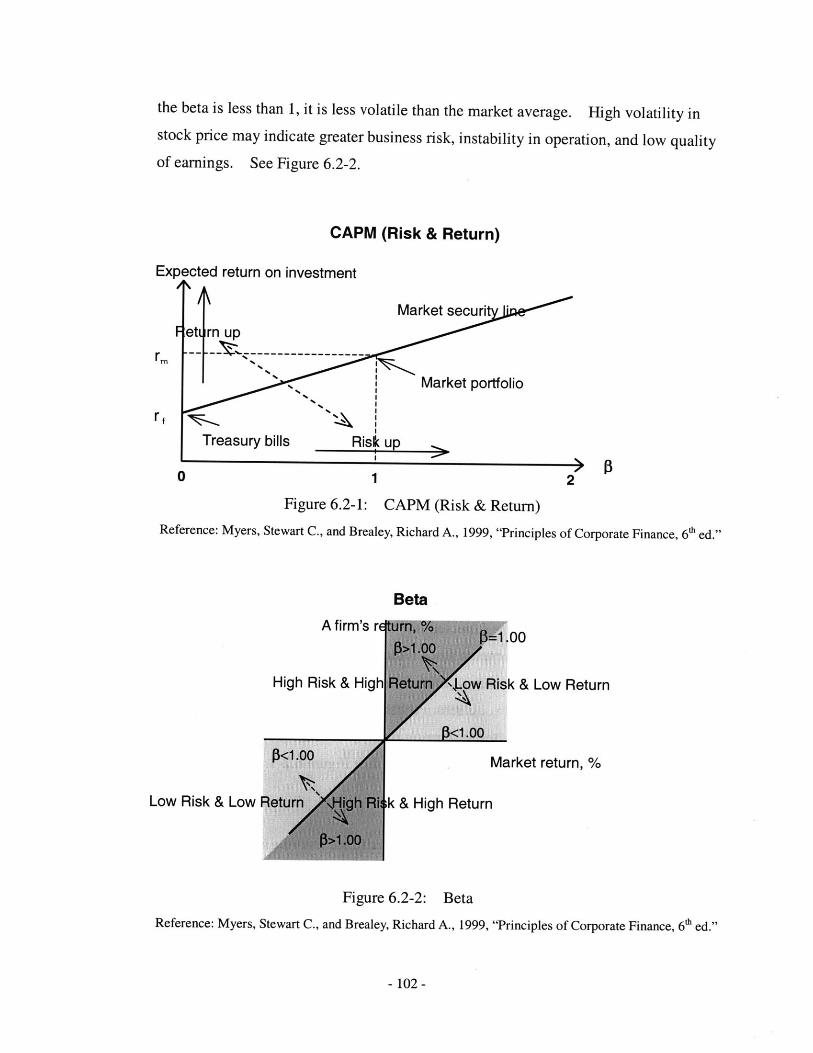
the beta is less than 1, it is less volatile than the market average. High volatility instock price may indicate greater business risk, instability in operation, and low qualityof earnings. See Figure 6.2-2.
CAPM (Risk & Return)
Expected return on investment
i Market securit
R etu rn up
Market portfolio
rTbsTreasury bills Risyp
0 1 2
Figure 6.2-1: CAPM (Risk & Return)
Reference: Myers, Stewart C., and Brealey, Richard A., 1999, "Principles of Corporate Finance, 6h ed."
Beta
isk & Low Return
Market return, %
Low Risk & Low
Figure 6.2-2: Beta
Reference: Myers, Stewart C., and Brealey, Richard A., 1999, "Principles of Corporate Finance, 6" ed."
-102-

6.2.2 WACC and Capital Structure
Suppose a firm were all-equity-financed (D/V=O). At that point WACC equals cost of
equity, and both equal the opportunity cost of capital. The firm starts to be leveraged by debt
from this point. As the debt ratio increases, the cost of equity increases, because of financial
risk, but notice that WACC declines. The decline is not caused by use of "cheap" debt instead
of "expensive" equity. It decreases because of the tax shields on debt interest payments.
However, a highly leveraged firm faces financial distress (Myers and Brealey, 2000)
when promises to creditors are broken or fulfilled with difficulty. Sometimes financial distress
leads to bankruptcy, but not always. Direct distress costs are legal costs associated with
bankruptcy, financing fees and delayed cash flows. Indirect costs are the losses of customers
and suppliers.
Financial distress is costly. Investors know that leveraged firms may fall into financial distress,
and they worry about it. That worry is reflected in the current market value of leveraged firms'
securities. Thus, the value of the firm can be broken down into three parts:
WACC & Capital StructureARat
r
of Return
Opportunity CopX-f
Cost oWACC:
Capital
f F ncial Distress
|Cost of Deb
Unleveraged < High leveraged
Debt/Equity Ratio (D/E)
Figure 6.2-3: WACC & Capital Structure
Reference: Myers, Stewart C., and Brealey, Richard A., 1999, "Principles of Corporate Finance, 6" ed."
- 103 -
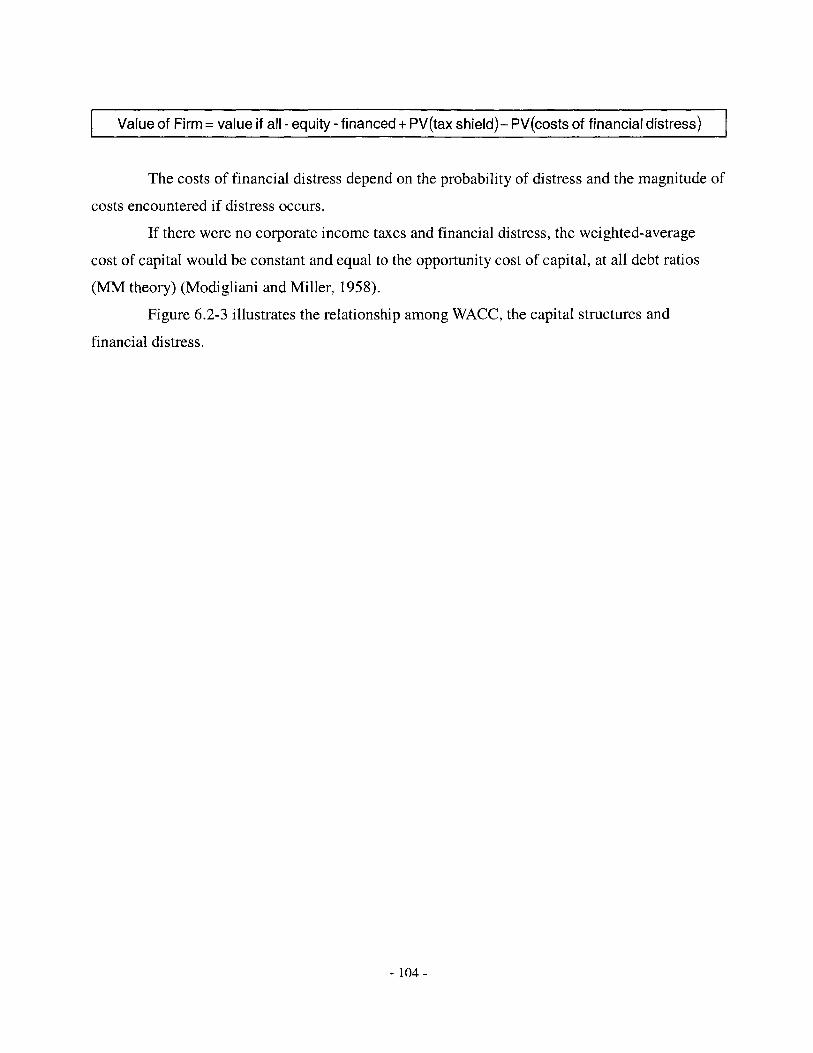
Valueof Firm=valueif all -equity -financed+ PV(tax shield)- PV(costs of financial distress)
The costs of financial distress depend on the probability of distress and the magnitude of
costs encountered if distress occurs.
If there were no corporate income taxes and financial distress, the weighted-average
cost of capital would be constant and equal to the opportunity cost of capital, at all debt ratios
(MM theory) (Modigliani and Miller, 1958).
Figure 6.2-3 illustrates the relationship among WACC, the capital structures and
financial distress.
- 104 -
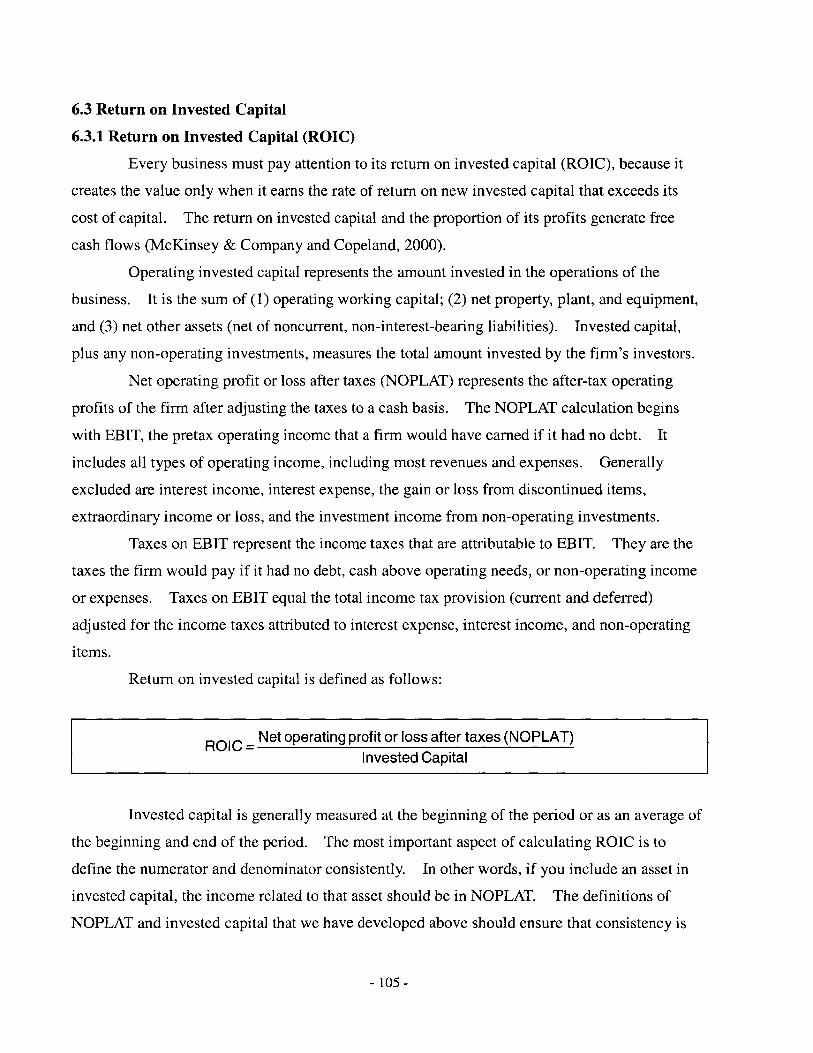
6.3 Return on Invested Capital
6.3.1 Return on Invested Capital (ROIC)
Every business must pay attention to its return on invested capital (ROIC), because it
creates the value only when it earns the rate of return on new invested capital that exceeds its
cost of capital. The return on invested capital and the proportion of its profits generate free
cash flows (McKinsey & Company and Copeland, 2000).
Operating invested capital represents the amount invested in the operations of the
business. It is the sum of (1) operating working capital; (2) net property, plant, and equipment,
and (3) net other assets (net of noncurrent, non-interest-bearing liabilities). Invested capital,
plus any non-operating investments, measures the total amount invested by the firm's investors.
Net operating profit or loss after taxes (NOPLAT) represents the after-tax operating
profits of the firm after adjusting the taxes to a cash basis. The NOPLAT calculation begins
with EBIT, the pretax operating income that a firm would have earned if it had no debt. It
includes all types of operating income, including most revenues and expenses. Generally
excluded are interest income, interest expense, the gain or loss from discontinued items,
extraordinary income or loss, and the investment income from non-operating investments.
Taxes on EBIT represent the income taxes that are attributable to EBIT. They are the
taxes the firm would pay if it had no debt, cash above operating needs, or non-operating income
or expenses. Taxes on EBIT equal the total income tax provision (current and deferred)
adjusted for the income taxes attributed to interest expense, interest income, and non-operating
items.
Return on invested capital is defined as follows:
ROIC = Net operating profit or loss after taxes (NOPLAT)Invested Capital
Invested capital is generally measured at the beginning of the period or as an average of
the beginning and end of the period. The most important aspect of calculating ROIC is to
define the numerator and denominator consistently. In other words, if you include an asset in
invested capital, the income related to that asset should be in NOPLAT. The definitions of
NOPLAT and invested capital that we have developed above should ensure that consistency is
- 105 -
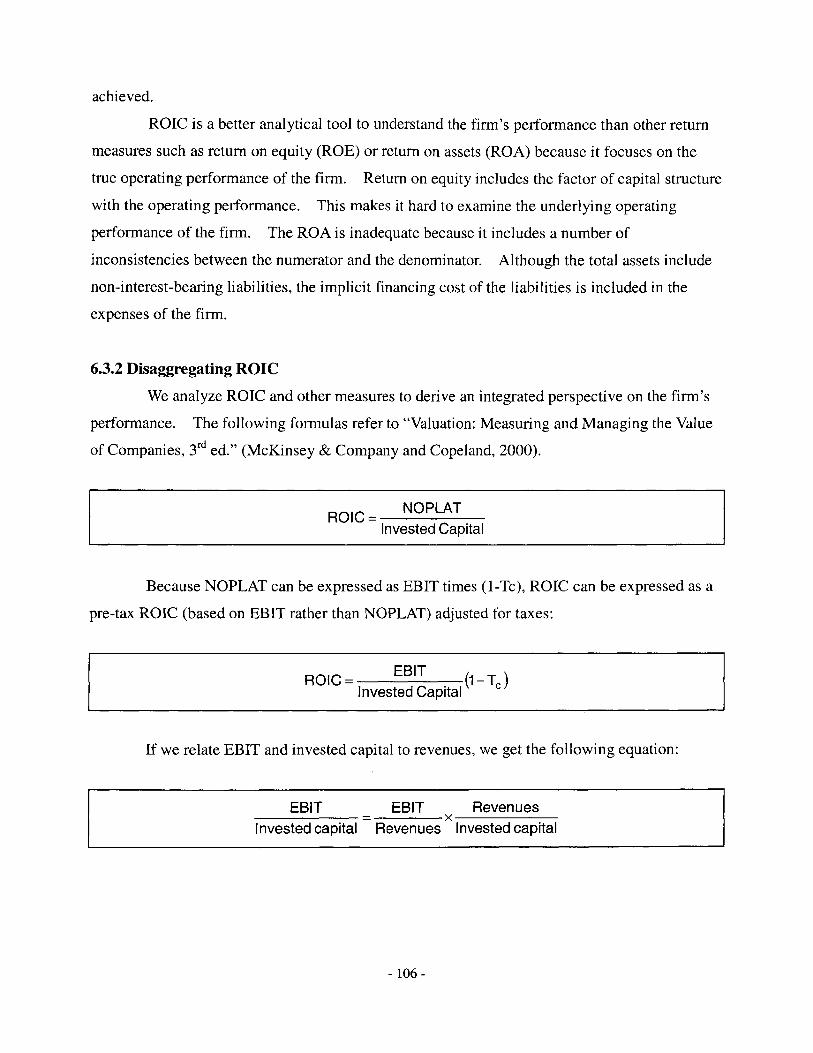
achieved.
ROIC is a better analytical tool to understand the firm's performance than other return
measures such as return on equity (ROE) or return on assets (ROA) because it focuses on the
true operating performance of the firm. Return on equity includes the factor of capital structure
with the operating performance. This makes it hard to examine the underlying operating
performance of the firm. The ROA is inadequate because it includes a number of
inconsistencies between the numerator and the denominator. Although the total assets include
non-interest-bearing liabilities, the implicit financing cost of the liabilities is included in the
expenses of the firm.
6.3.2 Disaggregating ROIC
We analyze ROIC and other measures to derive an integrated perspective on the firm's
performance. The following formulas refer to "Valuation: Measuring and Managing the Value
of Companies, 3 rd ed." (McKinsey & Company and Copeland, 2000).
ROIC= NOPLATInvested Capital
Because NOPLAT can be expressed as EBIT times (1-Tc), ROIC can be expressed as a
pre-tax ROIC (based on EBIT rather than NOPLAT) adjusted for taxes:
ROIC = EBIT (1- TC)Invested Capital
If we relate EBIT and invested capital to revenues, we get the following equation:
EBIT EBIT Revenuest cx
Invested capital Revenues Invested capital
-106-
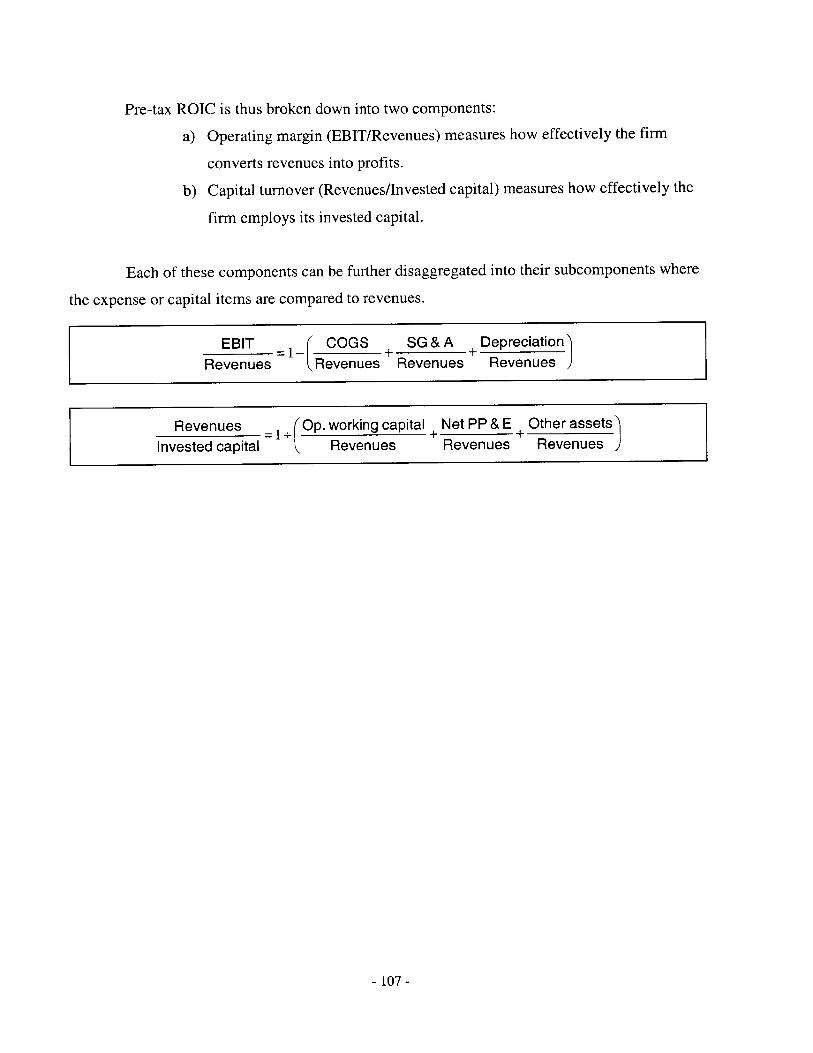
Pre-tax ROIC is thus broken down into two components:
a) Operating margin (EBIT/Revenues) measures how effectively the firm
converts revenues into profits.
b) Capital turnover (Revenues/Invested capital) measures how effectively the
firm employs its invested capital.
Each of these components can be further disaggregated into their subcomponents where
the expense or capital items are compared to revenues.
EBIT COGS SG&A DepreciationRevenues (Revenues Revenues Revenues
Revenues Op. working capital Net PP & E + Other assetsInvested capital Revenues Revenues Revenues )
- 107 -
-V ,

- 108 -
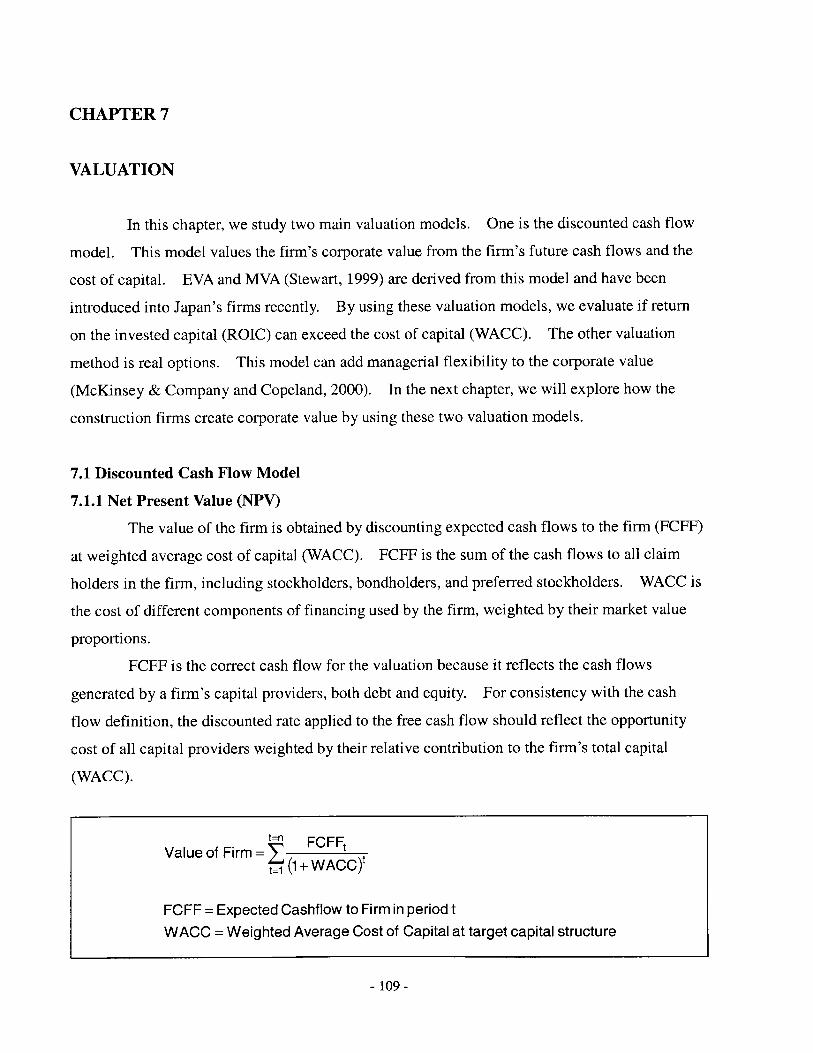
CHAPTER 7
VALUATION
In this chapter, we study two main valuation models. One is the discounted cash flow
model. This model values the firm's corporate value from the firm's future cash flows and the
cost of capital. EVA and MVA (Stewart, 1999) are derived from this model and have been
introduced into Japan's firms recently. By using these valuation models, we evaluate if return
on the invested capital (ROIC) can exceed the cost of capital (WACC). The other valuation
method is real options. This model can add managerial flexibility to the corporate value
(McKinsey & Company and Copeland, 2000). In the next chapter, we will explore how the
construction firms create corporate value by using these two valuation models.
7.1 Discounted Cash Flow Model
7.1.1 Net Present Value (NPV)
The value of the firm is obtained by discounting expected cash flows to the firm (FCFF)
at weighted average cost of capital (WACC). FCFF is the sum of the cash flows to all claim
holders in the firm, including stockholders, bondholders, and preferred stockholders. WACC is
the cost of different components of financing used by the firm, weighted by their market value
proportions.
FCFF is the correct cash flow for the valuation because it reflects the cash flows
generated by a firm's capital providers, both debt and equity. For consistency with the cash
flow definition, the discounted rate applied to the free cash flow should reflect the opportunity
cost of all capital providers weighted by their relative contribution to the firm's total capital
(WACC).
109-
tnFCFFtValue of Firm = F
t (1+ WACC)t
FCFF = Expected Cashf low to Firm in period tWACC = Weighted Average Cost of Capital at target capital structure
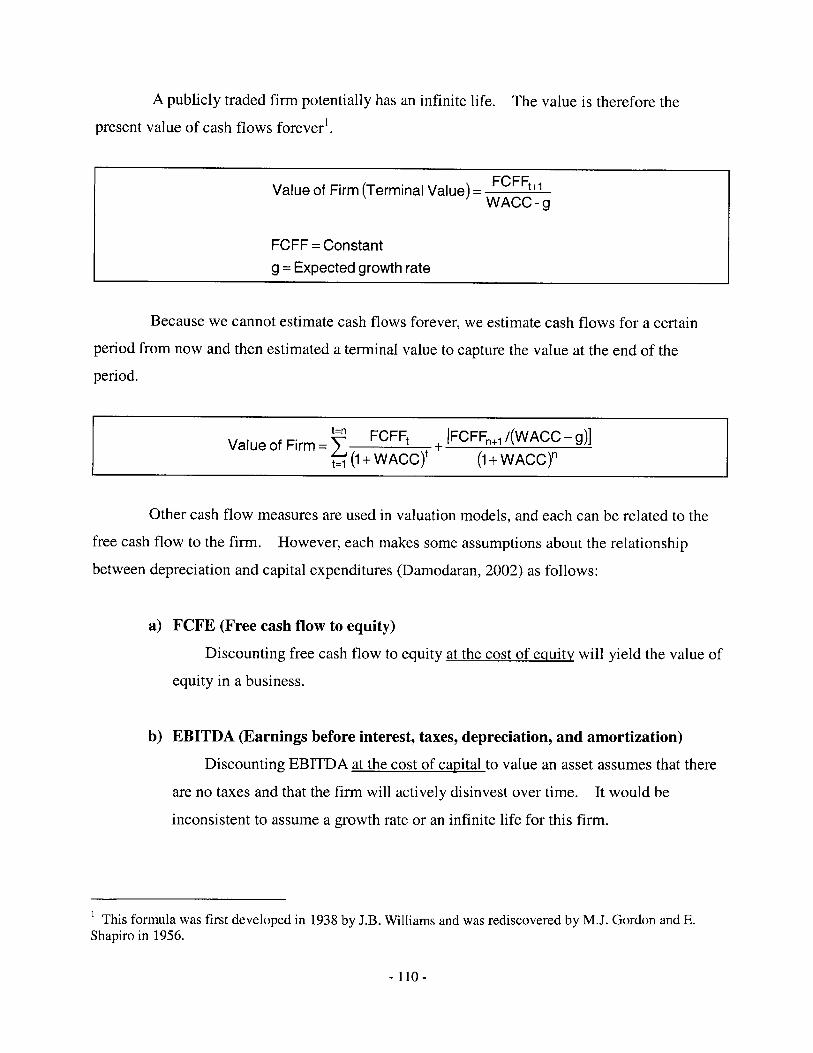
A publicly traded firm potentially has an infinite life. The value is therefore the
present value of cash flows forever .
Value of Firm (Terminal Value) = FC t+WACC-g
FCFF = Constant
g = Expected growth rate
Because we cannot estimate cash flows forever, we estimate cash flows for a certain
period from now and then estimated a terminal value to capture the value at the end of the
period.
t=n FCFF + [FCFFn+1 /(WACC - g)]Value of Firm= +t=1 (1+ WACC)t (1+ WACC)"
Other cash flow measures are used in valuation models, and each can be related to the
free cash flow to the firm. However, each makes some assumptions about the relationship
between depreciation and capital expenditures (Damodaran, 2002) as follows:
a) FCFE (Free cash flow to equity)
Discounting free cash flow to equity at the cost of equity will yield the value of
equity in a business.
b) EBITDA (Earnings before interest, taxes, depreciation, and amortization)
Discounting EBITDA at the cost of capital to value an asset assumes that there
are no taxes and that the firm will actively disinvest over time. It would be
inconsistent to assume a growth rate or an infinite life for this firm.
This formula was first developed in 1938 by J.B. Williams and was rediscovered by M.J. Gordon and E.Shapiro in 1956.
-110-
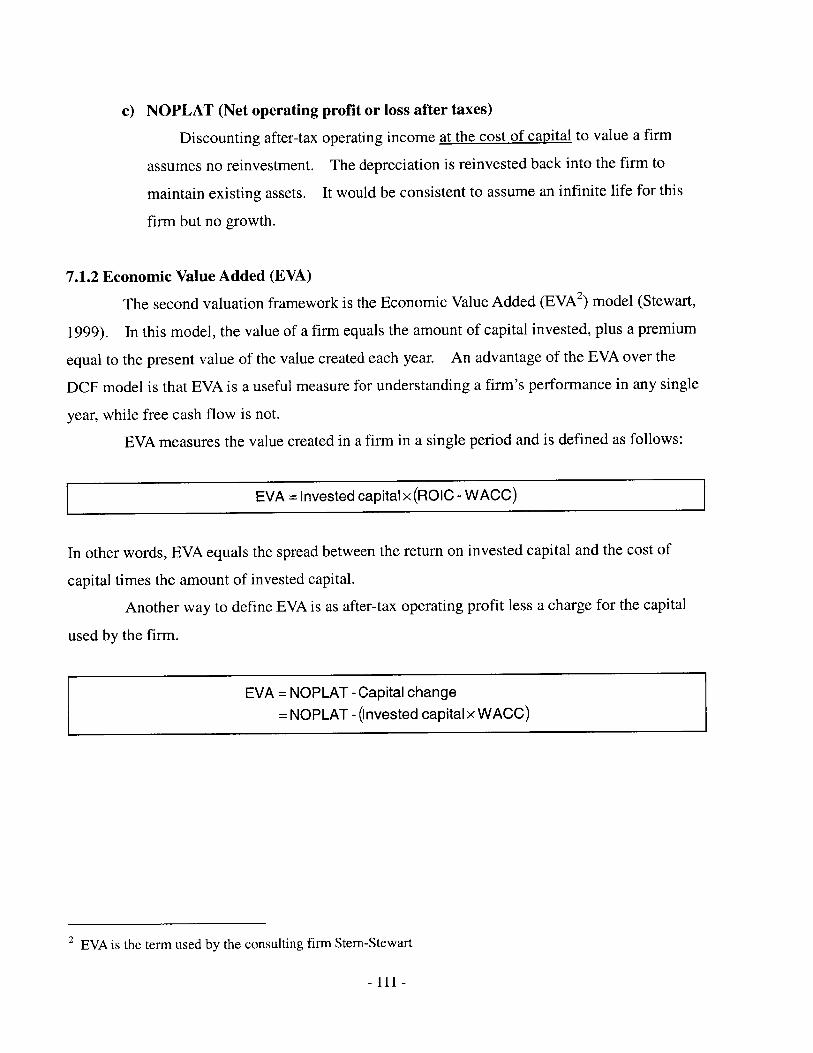
c) NOPLAT (Net operating profit or loss after taxes)
Discounting after-tax operating income at the cost of capital to value a firm
assumes no reinvestment. The depreciation is reinvested back into the firm to
maintain existing assets. It would be consistent to assume an infinite life for this
firm but no growth.
7.1.2 Economic Value Added (EVA)
The second valuation framework is the Economic Value Added (EVA2 ) model (Stewart,
1999). In this model, the value of a firm equals the amount of capital invested, plus a premium
equal to the present value of the value created each year. An advantage of the EVA over the
DCF model is that EVA is a useful measure for understanding a firm's performance in any single
year, while free cash flow is not.
EVA measures the value created in a firm in a single period and is defined as follows:
EVA = Invested capital x (ROIC - WACC)
In other words, EVA equals the spread between the return on invested capital and the cost of
capital times the amount of invested capital.
Another way to define EVA is as after-tax operating profit less a charge for the capital
used by the firm.
EVA = NOPLAT -Capital change
= NOPLAT - (Invested capital x WACC)
2 EVA is the term used by the consulting firm Stem-Stewart
- 111 -
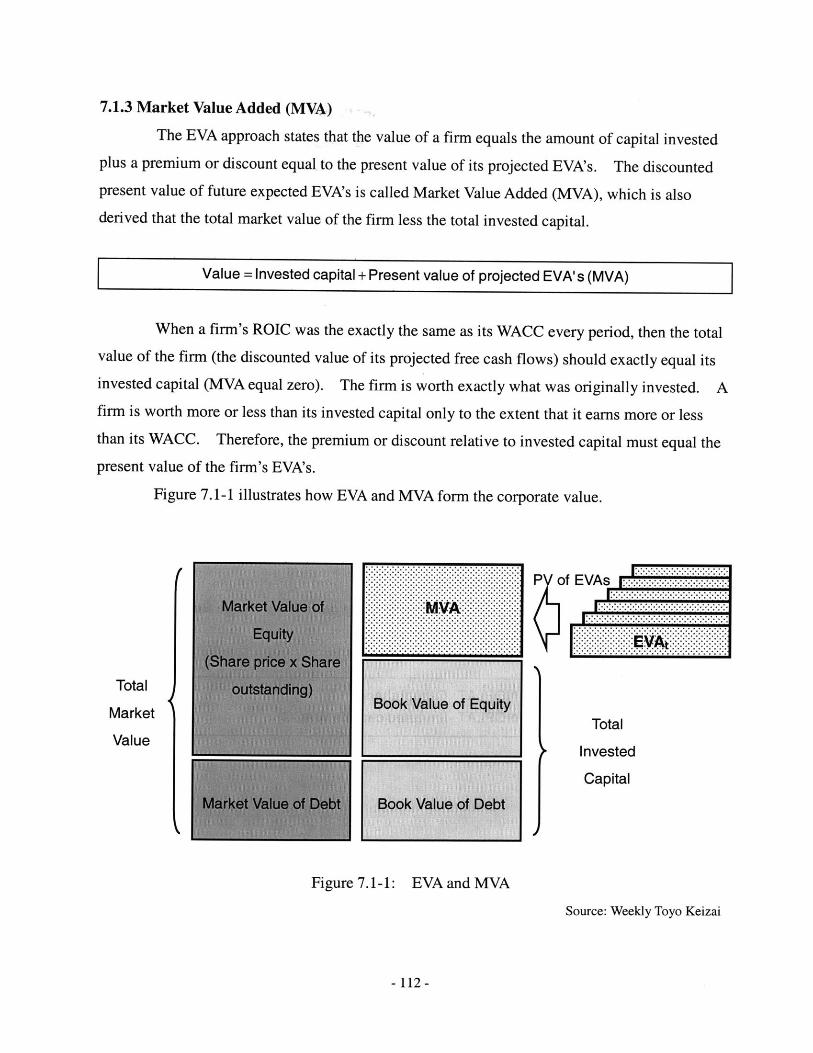
7.1.3 Market Value Added (MVA)
The EVA approach states that the value of a firm equals the amount of capital investedplus a premium or discount equal to the present value of its projected EVA's. The discountedpresent value of future expected EVA's is called Market Value Added (MVA), which is alsoderived that the total market value of the firm less the total invested capital.
Value = Invested capital + Present value of projected EVA's (MVA)
When a firm's ROIC was the exactly the same as its WACC every period, then the totalvalue of the firm (the discounted value of its projected free cash flows) should exactly equal itsinvested capital (MVA equal zero). The firm is worth exactly what was originally invested. Afirm is worth more or less than its invested capital only to the extent that it earns more or lessthan its WACC. Therefore, the premium or discount relative to invested capital must equal thepresent value of the firm's EVA's.
Figure 7.1-1 illustrates how EVA and MVA form the corporate value.
........................................................................................................................................................................................................................................................................................................
............... M V ................................................................................................................................................................................................... ........................................................................................................................................................
Pof EVAs ~.....
Total.
Invested ..........Capital
.........
Figure 7.1-1: EVA and MVA
Source: Weekly Toyo Keizai
-112-
CTotal
Market
Value
7.2 Real Options Value (ROV)
Although the DCF method was originally applied for investment valuation, over the past
decade, theoretical and computational progresses have allowed us to adopt financial option
pricing techniques to the valuation of investment decisions, so-called real options. Real option
methods are superior to traditional DCF approaches because they explicitly capture the value of
flexibility (McKinsey & Company and Copeland, 2000). As a result, real option approaches
will replace DCF approaches for investment decisions where there is significant future flexibility.
DCF approaches tell us that positive net present value projects only can create the value
of firms. This straightforward approach cannot account for the flexibility that management has.
We sometimes have some flexibility to run projects. If the project goes badly, it may be shrunk
or abandoned immediately. If it is successful, it may be extended more. Finally, the
investment may not be made immediately. The real options framework takes these types of
managerial flexibility into account, while the NPV approach assumes them away.
An option gives its owner the right but not the obligation to buy or sell an asset at a
predetermined price, called the strike or exercise price, for a predetermined period of time, called
the time to maturity. The right to take an action is flexibility. The necessity of taking an
action is inflexibility. Call options give the right to buy, and put options give the right to sell.
Options can be found on both the assets and the liabilities side of the balance sheet.
In order to calculating the real option value, using the binominal method and the
Black-Scholes formula are very useful. Here explains the Black-Scholes formula, because it is
quite straightforward to apply.
Here are the data that we need:
so= Current stock price
X = Exercise price
a = Standard deviation of annualized continuously compounded rate of return on the
stock.
T = Time to maturity of the option in year
r = Risk-free interest rate (annualizes continuously compounded with the same maturity
as the option.)
- 113 -

The formula is the follows:
CO =SON(d 1)-Xe-TN(d 2 )
dj= [in(SO /X)+ (r +a 2 /2)T]/(a T 1 2)
d2 =d 1 -(a T1 2 )
CO = Current call option value
N(d) = probability a random draw from a normal dist. Will be less than d.
e = 2.71828, the base of the natural log
In = Natural log function
-114-
CHAPTER 8
VALUE CREATION
In this chapter, we study how the construction firms create corporate value by using the
valuation methods that we reviewed in Chapter 7. At the same time, we verify the methods by
using the financial data of the firms in fiscal 2002. Finally, the valuation methods lead the
firms to finding directions in which they should follow in order to create their value in the
changing and shrinking construction market.
8.1 Value of Firms in the Construction Industry
8.1.1 Measuring Value of Firm
Until recently, firms in Japan's construction industry set their business goal to increase
their sales as much as possible. In the promised growing market, expanding the sales
immediately tied to increasing the profits and value of firms. In the current shrinking and
changing market, however, it is not possible to ensure the profit margins of projects and thus
simply increasing the sales does not directly lead to increasing the corporate value. Hence, this
section analyzes the process through which a construction firm creates its value hereafter.
As the previous chapter describes, the present value of the firm can be most simply
represented by the following formula:
Value of Firm (Terminal Value) = FCFFt+lWACC-g
FCFF = Constant
g = Expected growth rateWACC (capital structure) is constant.
The value of the firm is represented by the present value of the total future cash flows
the firm will generate. The formula assumes that the cash flows will grow at a constant rate
forever and the capital structure of the firm will be constant. Although the formula is simple
enough, the value of the firm can be basically represented by it.
- 115 -
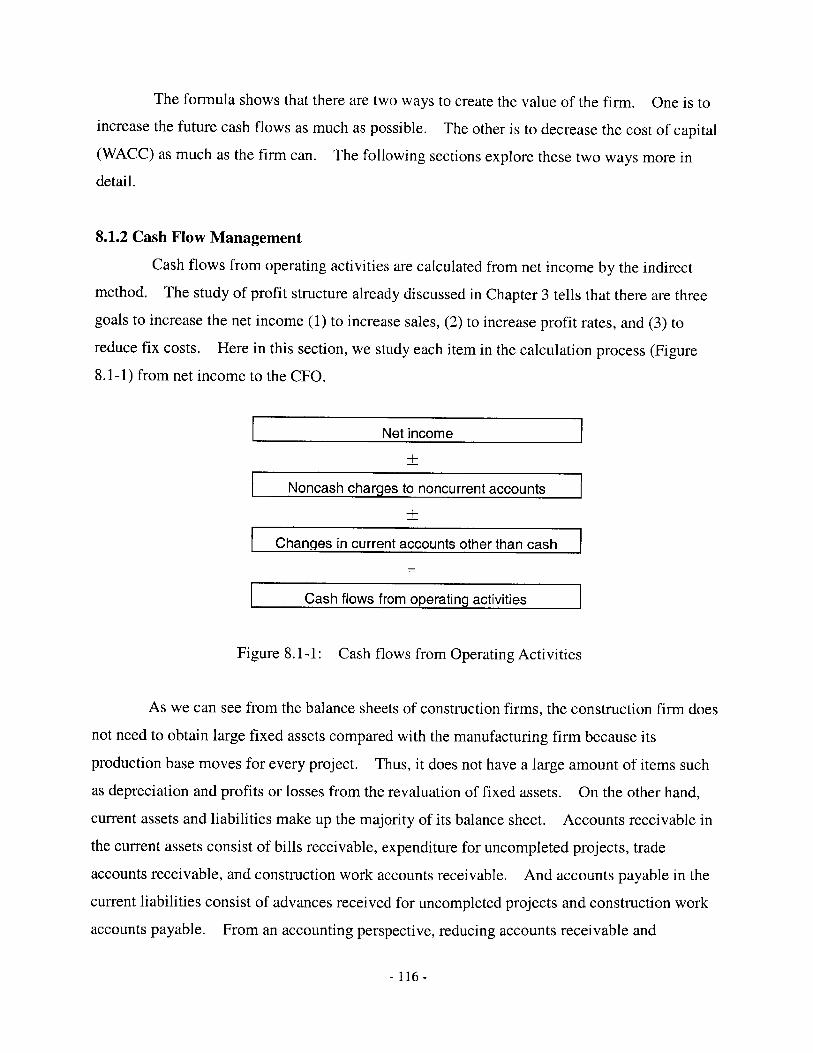
The formula shows that there are two ways to create the value of the firm. One is to
increase the future cash flows as much as possible. The other is to decrease the cost of capital
(WACC) as much as the firm can. The following sections explore these two ways more in
detail.
8.1.2 Cash Flow Management
Cash flows from operating activities are calculated from net income by the indirect
method. The study of profit structure already discussed in Chapter 3 tells that there are three
goals to increase the net income (1) to increase sales, (2) to increase profit rates, and (3) to
reduce fix costs. Here in this section, we study each item in the calculation process (Figure
8.1-1) from net income to the CFO.
Net income
Noncash charges to noncurrent accounts
Changes in current accounts other than cash
Cash flows from operating activities
Figure 8.1-1: Cash flows from Operating Activities
As we can see from the balance sheets of construction firms, the construction firm does
not need to obtain large fixed assets compared with the manufacturing firm because its
production base moves for every project. Thus, it does not have a large amount of items such
as depreciation and profits or losses from the revaluation of fixed assets. On the other hand,
current assets and liabilities make up the majority of its balance sheet. Accounts receivable in
the current assets consist of bills receivable, expenditure for uncompleted projects, trade
accounts receivable, and construction work accounts receivable. And accounts payable in the
current liabilities consist of advances received for uncompleted projects and construction work
accounts payable. From an accounting perspective, reducing accounts receivable and
-116-
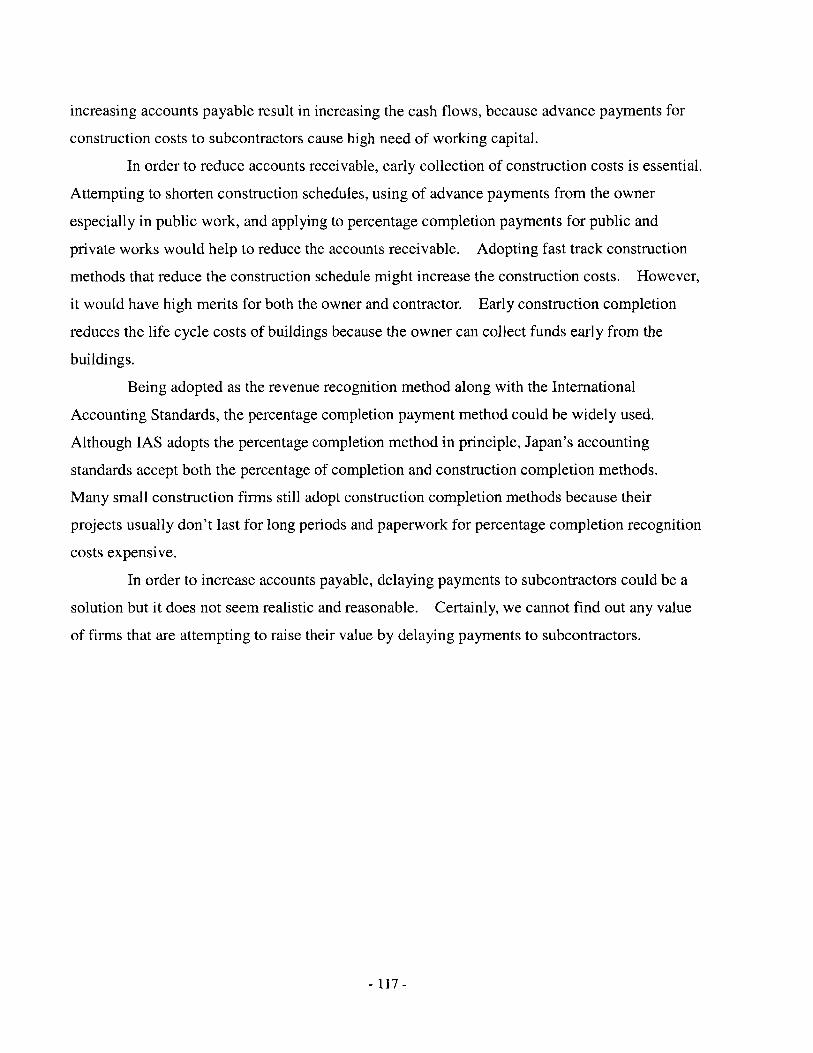
increasing accounts payable result in increasing the cash flows, because advance payments for
construction costs to subcontractors cause high need of working capital.
In order to reduce accounts receivable, early collection of construction costs is essential.
Attempting to shorten construction schedules, using of advance payments from the owner
especially in public work, and applying to percentage completion payments for public and
private works would help to reduce the accounts receivable. Adopting fast track construction
methods that reduce the construction schedule might increase the construction costs. However,
it would have high merits for both the owner and contractor. Early construction completion
reduces the life cycle costs of buildings because the owner can collect funds early from the
buildings.
Being adopted as the revenue recognition method along with the International
Accounting Standards, the percentage completion payment method could be widely used.
Although IAS adopts the percentage completion method in principle, Japan's accounting
standards accept both the percentage of completion and construction completion methods.
Many small construction firms still adopt construction completion methods because their
projects usually don't last for long periods and paperwork for percentage completion recognition
costs expensive.
In order to increase accounts payable, delaying payments to subcontractors could be a
solution but it does not seem realistic and reasonable. Certainly, we cannot find out any value
of firms that are attempting to raise their value by delaying payments to subcontractors.
-117-
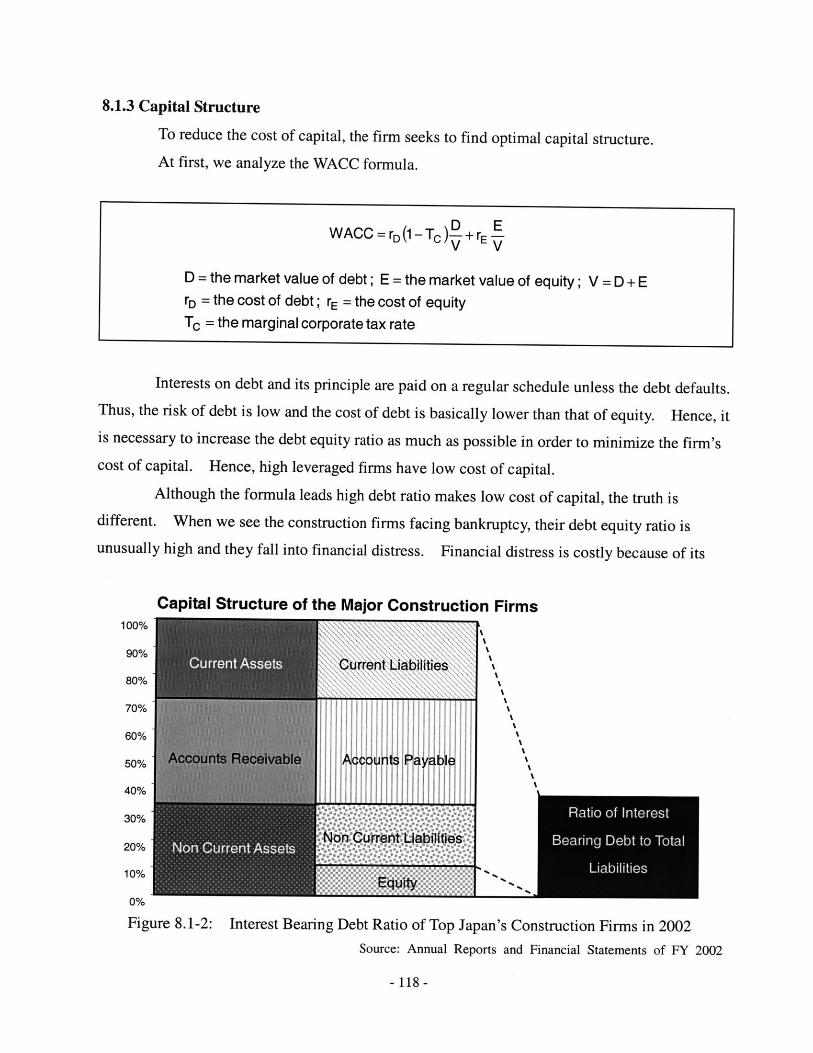
8.1.3 Capital Structure
To reduce the cost of capital, the firm seeks to find optimal capital structure.
At first, we analyze the WACC formula.
D EWACC = rD (1 - Tc )-+ rE ~V V
D = the market value of debt; E = the market value of equity; V = D + ErD = the cost of debt ; rE = the cost of equityTc = the marginal corporate tax rate
Interests on debt and its principle are paid on a regular schedule unless the debt defaults.Thus, the risk of debt is low and the cost of debt is basically lower than that of equity. Hence, itis necessary to increase the debt equity ratio as much as possible in order to minimize the firm'scost of capital. Hence, high leveraged firms have low cost of capital.
Although the formula leads high debt ratio makes low cost of capital, the truth isdifferent. When we see the construction firms facing bankruptcy, their debt equity ratio isunusually high and they fall into financial distress. Financial distress is costly because of its
Capital Structure of the Major Construction Firms100%
90%Current Liabilities,
80%
70%
60%
50%
40%
30%
20% -
10%
0%
Figure 8.1-2: Interest Bearing Debt Ratio of Top Japan's Construction Firms in 2002Source: Annual Reports and Financial Statements of FY 2002
- 118 -
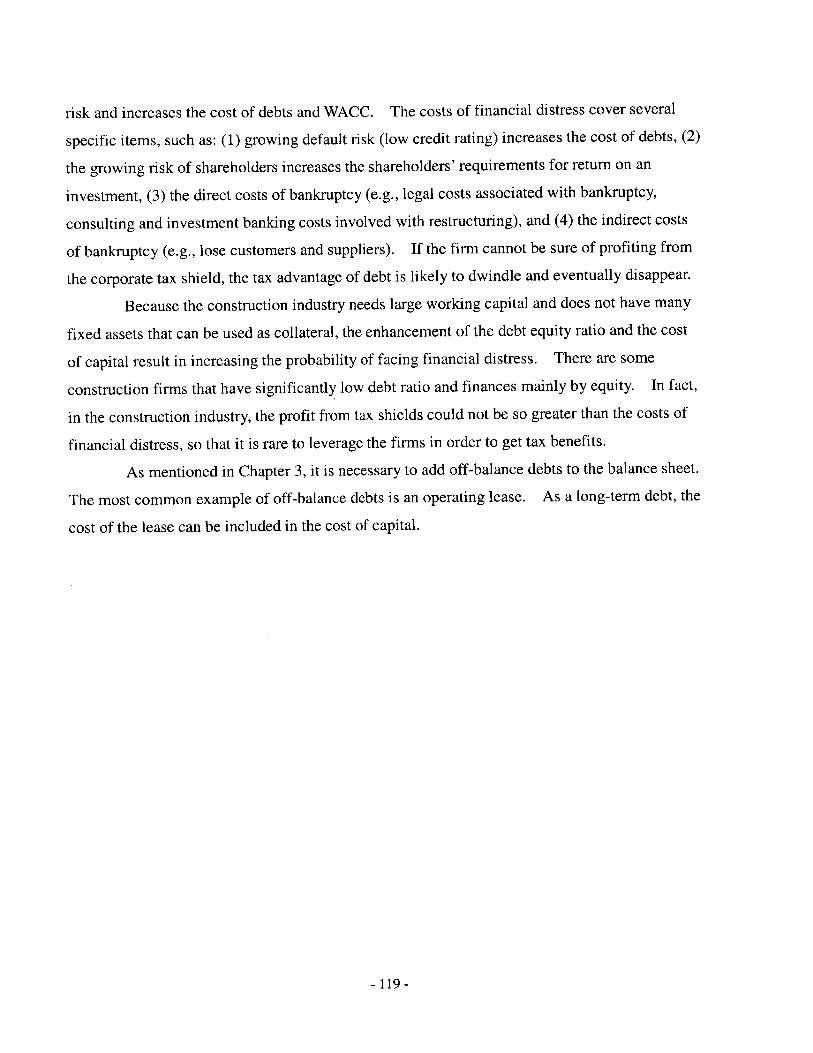
risk and increases the cost of debts and WACC. The costs of financial distress cover several
specific items, such as: (1) growing default risk (low credit rating) increases the cost of debts, (2)
the growing risk of shareholders increases the shareholders' requirements for return on an
investment, (3) the direct costs of bankruptcy (e.g., legal costs associated with bankruptcy,
consulting and investment banking costs involved with restructuring), and (4) the indirect costs
of bankruptcy (e.g., lose customers and suppliers). If the firm cannot be sure of profiting from
the corporate tax shield, the tax advantage of debt is likely to dwindle and eventually disappear.
Because the construction industry needs large working capital and does not have many
fixed assets that can be used as collateral, the enhancement of the debt equity ratio and the cost
of capital result in increasing the probability of facing financial distress. There are some
construction firms that have significantly low debt ratio and finances mainly by equity. In fact,
in the construction industry, the profit from tax shields could not be so greater than the costs of
financial distress, so that it is rare to leverage the firms in order to get tax benefits.
As mentioned in Chapter 3, it is necessary to add off-balance debts to the balance sheet.
The most common example of off-balance debts is an operating lease. As a long-term debt, the
cost of the lease can be included in the cost of capital.
- 119-
8.1.4 Cost of Equity and Debt
The cost of debt is determined by the firm's solvency and credit. The credit rating bycredit rating agencies is one way to gauge default risk. The lower the rating, the higher the riskof default, and thus the return required by investors is higher. In the mid-1960s, threeeconomists (William Sharpe, John Lintner, and Jack Treynor) discovered that the cost of equityhad the same relationship between risk and return. Capital asset pricing model (CAPM) is thesophisticated model of the relationship between expected risk and expected return. The modelis grounded in the theory that investors demand higher returns for higher risks.
The risk of an investment is measured by the price volatility relative to the market andcalled beta.
Table 8.1-1: Beta of Japan's Construction Firms
Firm
Shimizu Corp.
Tekken Corp.
Asanuma Corp.
Penta-Ocean Const.
Toyo Const.
Fudo Const.
Tobishima Corp.
Wakachiku Const.
Firm
1
2
3
4
5
6
7
8
9
10
11
12
13
14
15
Fukuda Corp.
Kajima Corp.
Ohki Corp.
Ando Corp.
Toa Corn.
Daiho Corp.
Taihei Kovo
Beta
0.1851
0.2641
0.2831
0.4103
0.4169
0.4508
0.4992
0.5389
0.5984
0.6042
0.6048
0.6349
0.6611
0.7274
0.7403
16
17
18
19
20
21
22
23
24
25
26
27
28
29
Beta
0.7756
0.7929
0.803
0.8342
0.931
0.9461
0.9509
0.9773
0.9948
1.1275
1.5022
1.6371
1.743
1.7776
-120-
,
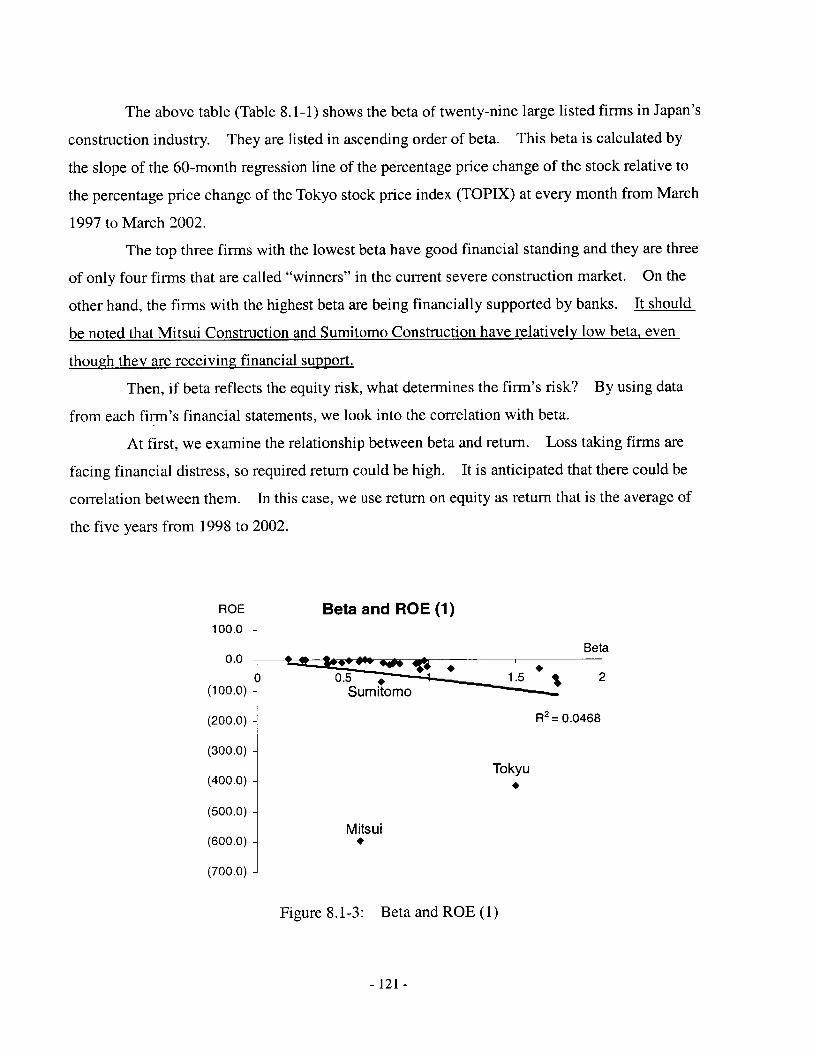
The above table (Table 8.1-1) shows the beta of twenty-nine large listed firms in Japan's
construction industry. They are listed in ascending order of beta. This beta is calculated by
the slope of the 60-month regression line of the percentage price change of the stock relative to
the percentage price change of the Tokyo stock price index (TOPIX) at every month from March
1997 to March 2002.
The top three firms with the lowest beta have good financial standing and they are three
of only four firms that are called "winners" in the current severe construction market. On the
other hand, the firms with the highest beta are being financially supported by banks. It should
be noted that Mitsui Construction and Sumitomo Construction have relatively low beta, even
though they are receiving financial support.
Then, if beta reflects the equity risk, what determines the firm's risk? By using data
from each firm's financial statements, we look into the correlation with beta.
At first, we examine the relationship between beta and return. Loss taking firms are
facing financial distress, so required return could be high. It is anticipated that there could be
correlation between them. In this case, we use return on equity as return that is the average of
the five years from 1998 to 2002.
ROE Beta and ROE (1)100.0 -
Beta
0.5S 1 1.52(100.0) Sumitomo
(200.0) R2 = 0.0468
(300.0) -
(400.0) -Tokyu
(500.0) -Mitsui
(600.0) -
(700.0) -
Figure 8.1-3: Beta and ROE (1)
- 121 -
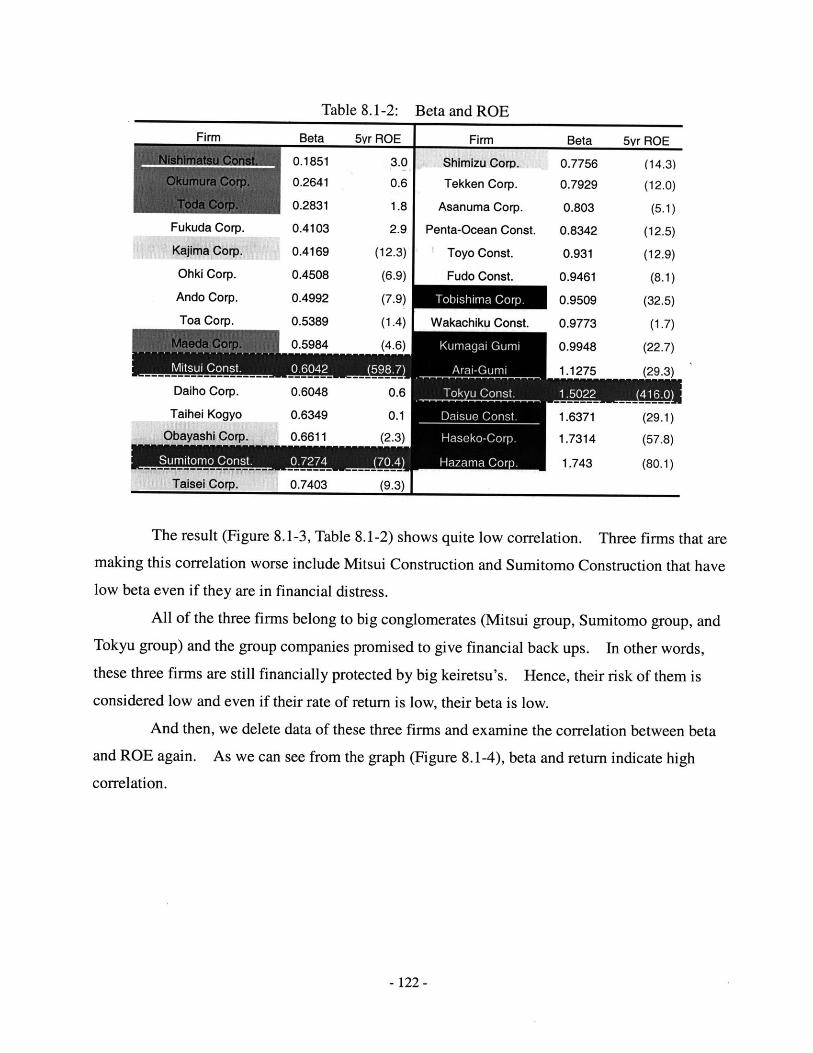
Table 8.1-2: Beta and ROE
rirm
Fukuda Corp.
Kajima Corp.
Ohki Corp.
Ando Corp.
Toa Corp.
Beta 5yr ROE
0.1851
0.2641
0.2831
0.4103
0.4169
0.4508
0.4992
0.5389
0.5984
3.0
0.6
1.8
2.9
(12.3)
(6.9)
(7.9)
(1.4)
(4.6)
Firm
Shimizu Corp.
Tekken Corp.
Asanuma Corp.
Penta-Ocean Const.
Toyo Const.
Fudo Const.
Tobishima Corp.
Wakachiku Const.
Beta Syr ROE
0.7756
0.7929
0.803
0.8342
0.931
0.9461
0.9509
0.9773
0.9948
1.1275
(14.3)
(12.0)
(5.1)
(12.5)
(12.9)
(8.1)
(32.5)
(1.7)
(22.7)
(29.3)
The result (Figure 8.1-3, Table 8.1-2) shows quite low correlation. Three firms that are
making this correlation worse include Mitsui Construction and Sumitomo Construction that have
low beta even if they are in financial distress.
All of the three firms belong to big conglomerates (Mitsui group, Sumitomo group, and
Tokyu group) and the group companies promised to give financial back ups. In other words,
these three firms are still financially protected by big keiretsu's. Hence, their risk of them is
considered low and even if their rate of return is low, their beta is low.
And then, we delete data of these three firms and examine the correlation between beta
and ROE again. As we can see from the graph (Figure 8.1-4), beta and return indicate high
correlation.
-122-
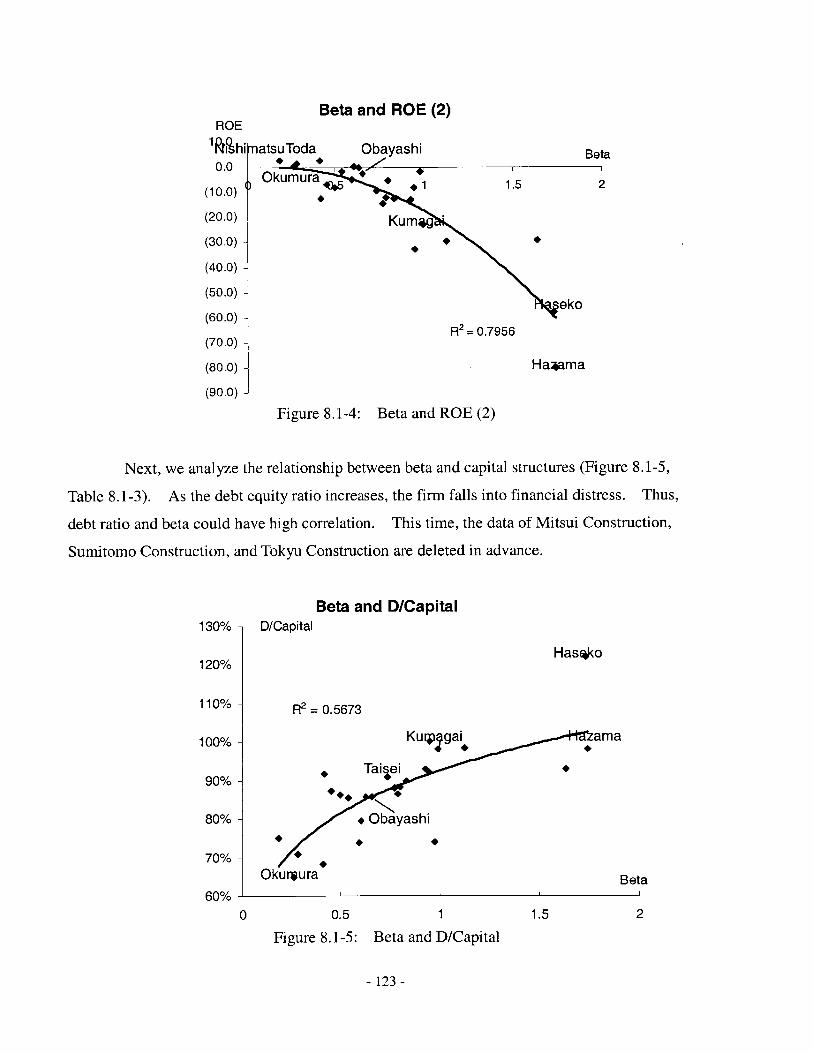
Beta and ROE (2)ROE
1 rhimatsuToda Obayashi Beta0.0 * * . Il
Okumura * 1.5 2(10.0) 1% .
(20.0) - Kumag
(30.0) -
(40.0) -
(50.0) -eko
(60.0) -R = 0.7956
(70.0) -
(80.0) _ Hamama
(90.0) -
Figure 8.1-4: Beta and ROE (2)
Next, we analyze the relationship between beta and capital structures (Figure 8.1-5,
Table 8.1-3). As the debt equity ratio increases, the firm falls into financial distress. Thus,
debt ratio and beta could have high correlation. This time, the data of Mitsui Construction,
Sumitomo Construction, and Tokyu Construction are deleted in advance.
Beta and D/Capital130% - D/Capital
120% -Hasako
110% ~ R2 = 0.5673
100% _ Kurpgai ama
90% -
80% - Obayashi
70% - ,
Okureura Beta60% 1
0 0.5 1 1.5 2
Figure 8.1-5: Beta and D/Capital
- 123 -
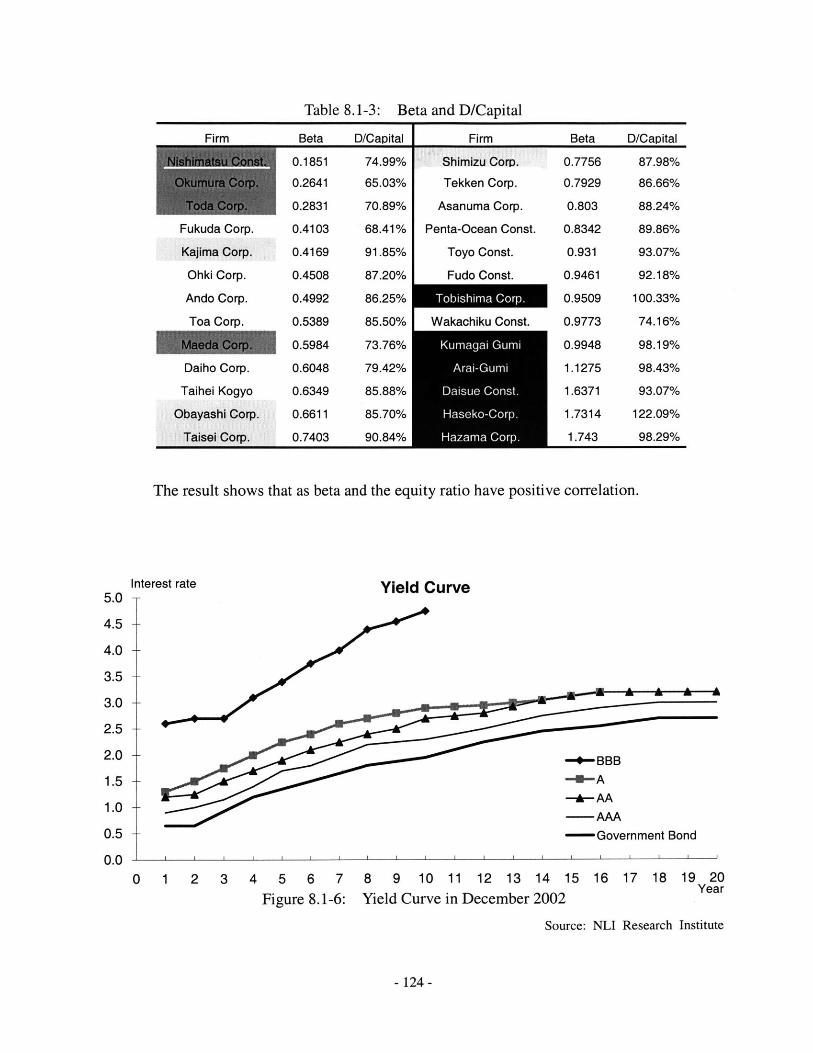
Table 8.1-3: Beta and D/Capital
Firm
Fukuda Corp.
Kajima Corp.
Ohki Corp.
Ando Corp.
Toa Corp.
Daiho Corp.
Taihei Kogyo
Obayashi Corp.
Taisei Corp.
Beta D/Capital
0.1851
0.2641
0.2831
0.4103
0.4169
0.4508
0.4992
0.5389
0.5984
0.6048
0.6349
0.6611
0.7403
74.99%
65.03%
70.89%
68.41%
91.85%
87.20%
86.25%
85.50%
73.76%
79.42%
85.88%
85.70%
90.84%
Firm
Shimizu Corp.
Tekken Corp.
Asanuma Corp.
Penta-Ocean Const.
Toyo Const.
Fudo Const.
Tobishima Corp.
Wakachiku Const.
Beta D/Capital
0.7756 87.98%
0.7929 86.66%
0.803 88.24%
0.8342 89.86%
0.931 93.07%
0.9461 92.18%
0.9509 100.33%
0.9773 74.16%
0.9948 98.19%
1.1275 98.43%
1.6371 93.07%
1.7314 122.09%
1.743 98.29%
The result shows that as beta and the equity ratio have positive correlation.
Yield Curve
-Government Bond
0 1 2 3 4 5 6 7
Figure 8.1-6:8 9 10 11 12 13 14 15 16 17 18 19 20
Yield Curve in December 2002 Year
Source: NLI Research Institute
-124-
Interest rate5.0
4.5 +
4.0
3.5
3.0
2.5
2.0
1.5
1.0
0.5
0.0
-*-BBB
-*-A-A- AA
-- AAA
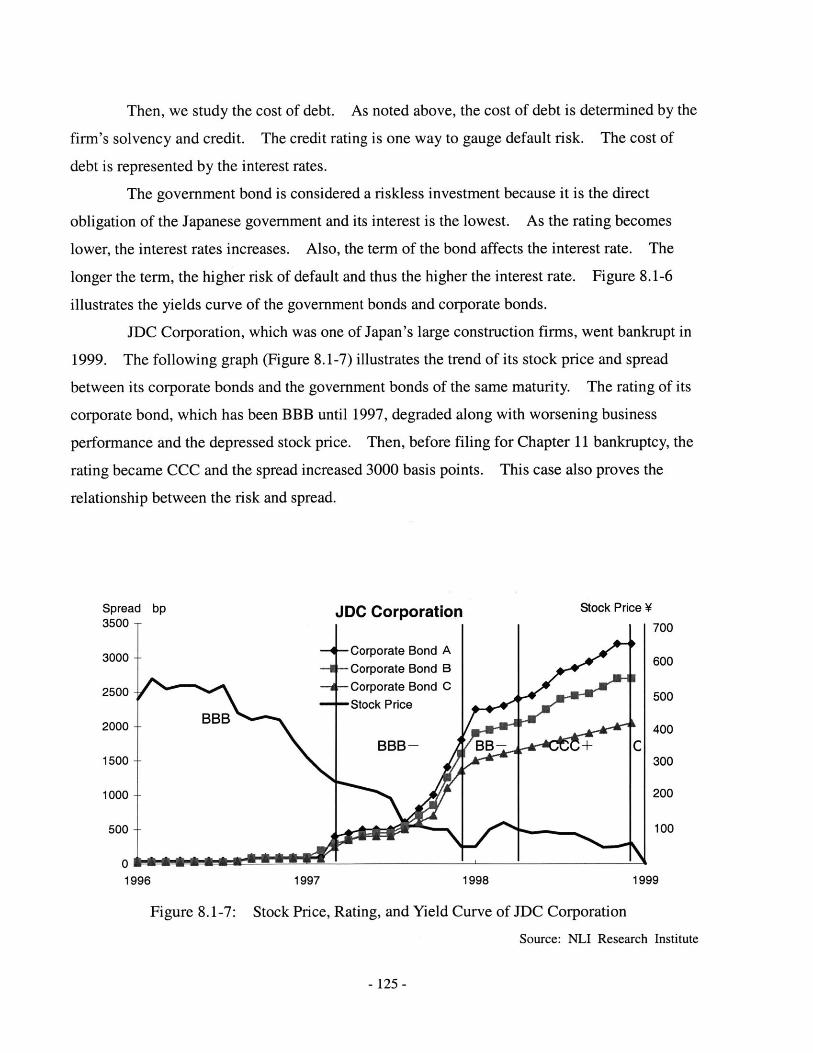
Then, we study the cost of debt. As noted above, the cost of debt is determined by the
firm's solvency and credit. The credit rating is one way to gauge default risk. The cost of
debt is represented by the interest rates.
The government bond is considered a riskless investment because it is the direct
obligation of the Japanese government and its interest is the lowest. As the rating becomes
lower, the interest rates increases. Also, the term of the bond affects the interest rate. The
longer the term, the higher risk of default and thus the higher the interest rate. Figure 8.1-6
illustrates the yields curve of the government bonds and corporate bonds.
JDC Corporation, which was one of Japan's large construction firms, went bankrupt in
1999. The following graph (Figure 8.1-7) illustrates the trend of its stock price and spread
between its corporate bonds and the government bonds of the same maturity. The rating of its
corporate bond, which has been BBB until 1997, degraded along with worsening business
performance and the depressed stock price. Then, before filing for Chapter 11 bankruptcy, the
rating became CCC and the spread increased 3000 basis points. This case also proves the
relationship between the risk and spread.
Spread bp JDC Corporation Stock Price V3500-- 700
3000-- Corporate Bond A 600Corporate Bond B
2500- BBB Corporate Bond C-Stock Price 500
2000-- BBB- BBC 400
1500-- 300
1000- 200
500 100
01996 1997 1998 1999
Figure 8.1-7: Stock Price, Rating, and Yield Curve of JDC Corporation
Source: NLI Research Institute
- 125 -
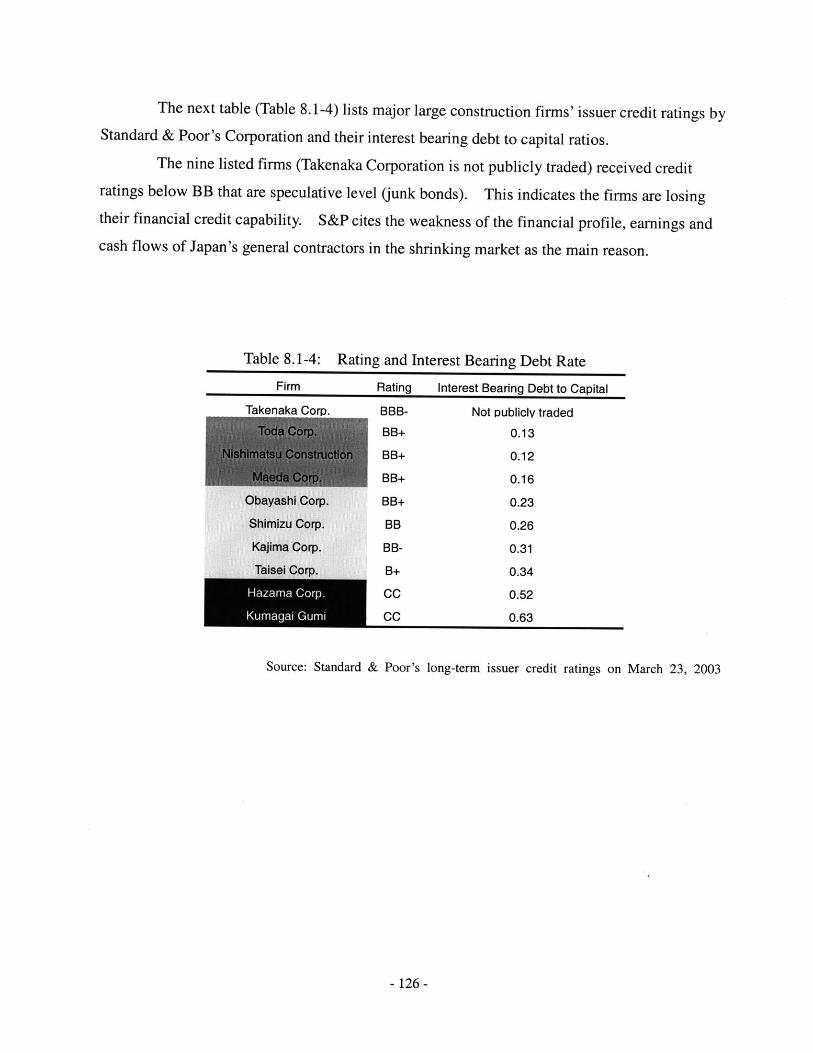
The next table (Table 8.1-4) lists major large construction firms' issuer credit ratings byStandard & Poor's Corporation and their interest bearing debt to capital ratios.
The nine listed firms (Takenaka Corporation is not publicly traded) received credit
ratings below BB that are speculative level (junk bonds). This indicates the firms are losing
their financial credit capability. S&P cites the weakness of the financial profile, earnings andcash flows of Japan's general contractors in the shrinking market as the main reason.
Table 8.1-4: Rating and Interest Bearing Debt Rate
Firm Rating Interest Bearing Debt to Capital
Takenaka Corp. BBB- Not publicly traded
BB+ 0.13
BB+ 0.12
BB+ 0.16
Obayashi Corp. BB+ 0.23
Shimizu Corp. BB 0.26
Kajima Corp. BB- 0.31
Taisei Corp. B+ 0.34
st CC 0.52
.6.cc 0.63
Source: Standard & Poor's long-term issuer credit ratings on March 23, 2003
- 126 -
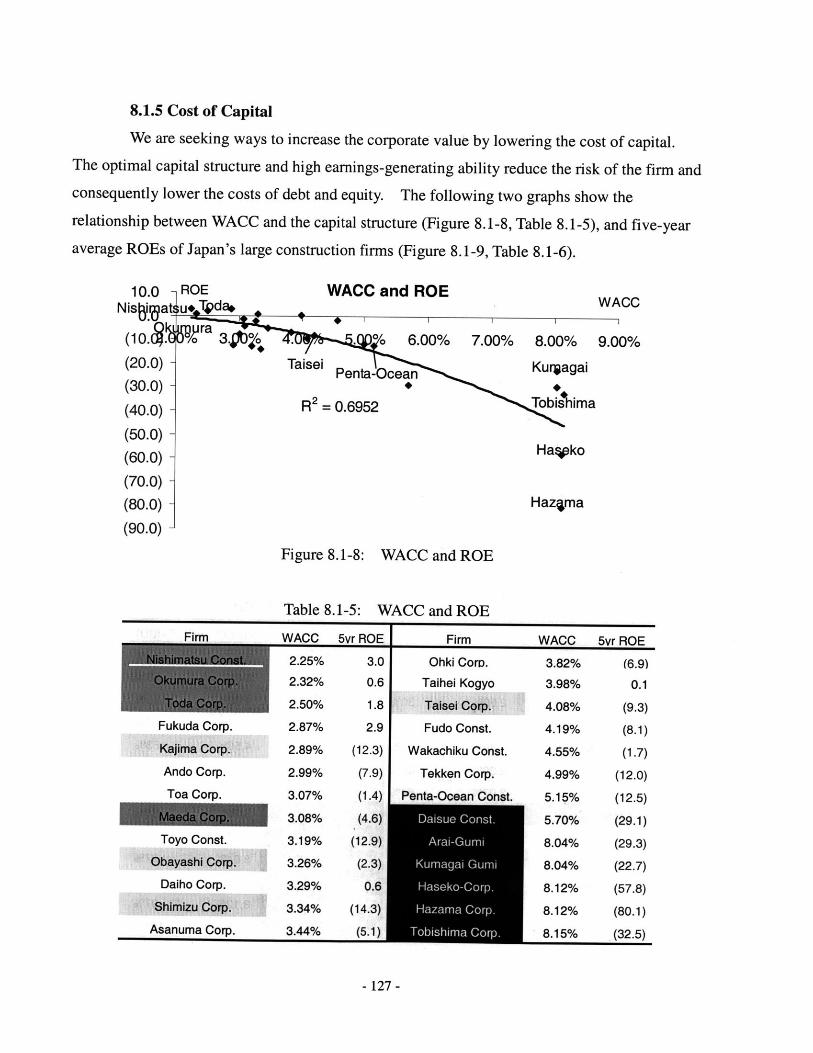
8.1.5 Cost of Capital
We are seeking ways to increase the corporate value by lowering the cost of capital.
The optimal capital structure and high earnings-generating ability reduce the risk of the firm and
consequently lower the costs of debt and equity. The following two graphs show the
relationship between WACC and the capital structure (Figure 8.1-8, Table 8.1-5), and five-year
average ROEs of Japan's large construction firms (Figure 8.1-9, Table 8.1-6).
10.0 -Nisgirat
(10.$.
(20.0) -(30.0) -
(40.0) -
(50.0)(60.0)(70.0) -
(80.0) -
(90.0) -
WACC and ROEROEu.,Tda
ra 3.4g) . . *o 6.00% 7.00% 8.00%
Taisei Penta-Ocean Kurjagai
= 0.6952 Tobishima
WACC
9.00%
Hasko
Hazima
Figure 8.1-8: WACC and ROE
Table 8.1-5: WACC and ROE
WACC 5vr ROE
Fukuda Corp.
Kajima Corp.
Ando Corp.
Toa Corp.
Toyo Const.
Obayashi Corp.
Daiho Corp.
Shimizu Corp.
Asanuma Corp.
2.25%
2.32%
2.50%
2.87%
2.89%
2.99%
3.07%
3.08%
3.19%
3.26%
3.29%
3.34%
3.44%
3.0
0.6
1.8
2.9
(12.3)
(7.9)
(1.4)
(4.6)
(12.9)
(2.3)
0.6
(14.3)
(5.1)
Firm
Ohki Corn.
Taihei Kogyo
Taisei Corp.
Fudo Const.
Wakachiku Const.
Tekken Corp.
Penta-Ocean Const.
WACC 5vr ROE
3.82% (6.9)
3.98% 0.1
4.08% (9.3)
4.19% (8.1)
4.55% (1.7)
4.99% (12.0)
5.15% (12.5)
5.70% (29.1)
8.04% (29.3)
8.04% (22.7)
8.12% (57.8)
8.12% (80.1)
8.15% (32.5)
- 127 -
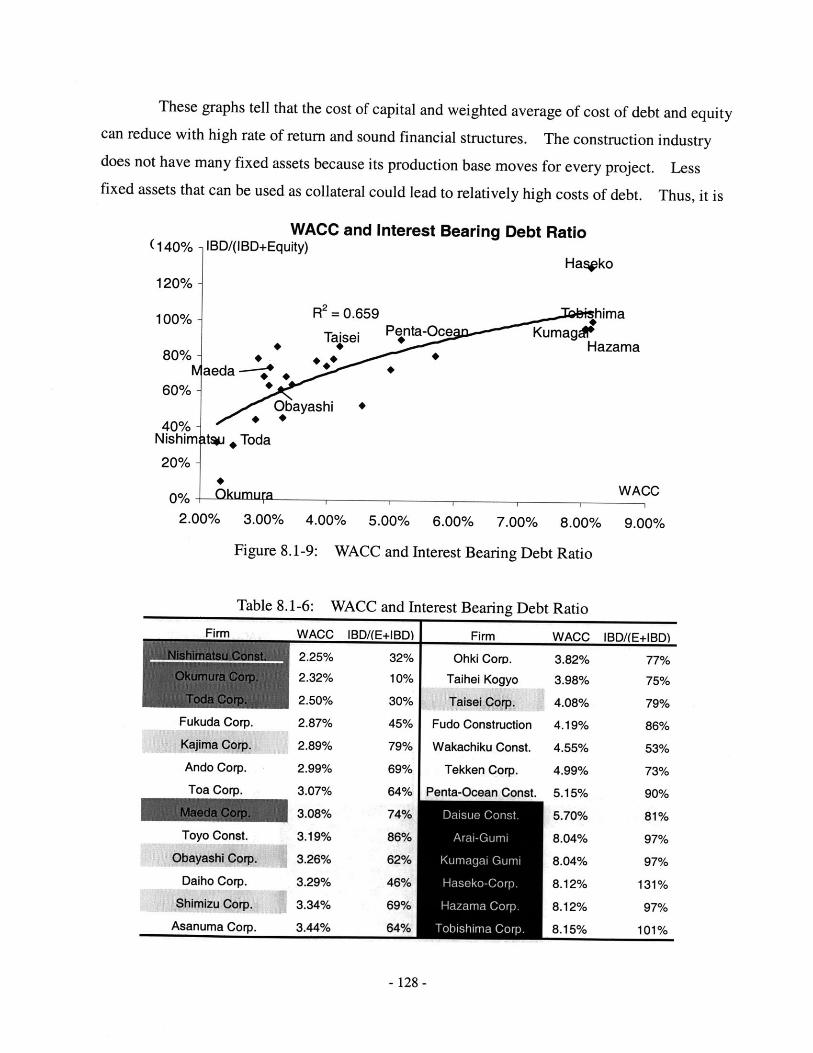
These graphs tell that the cost of capital and weighted average of cost of debt and equitycan reduce with high rate of return and sound financial structures. The construction industrydoes not have many fixed assets because its production base moves for every project. Lessfixed assets that can be used as collateral could lead to relatively high costs of debt. Thus, it is
(140%7
120%
100%
80% -
60%-
40%Nishim,
20%-
WACC and Interest Bearing Debt RatioIBD/(IBD+Equity)
Ha.Vko
R 2 = 0.659 .,Tbihima
Talsei Hazama
aeda--;,
Obayashi +
ItwJ , Toda
"I-. WAI klumu a
2.00% 3.00% 4.00% 5.00% 6.00% 7.00% 8.00% 9.0
Figure 8.1-9: WACC and Interest Bearing Debt Ratio
0%
Table 8.1-6: WACC and Interest Bearing Debt RatioI.
WACC IBD/(E+IBD)
Fukuda Corp.
Kajima Corp.
Ando Corp.
Toa Corp.
Tovo Const.
Daiho Corp.
Shimizu Corp.
Asanuma Corp.
2.25%
2.32%
2.50%
2.87%
2.89%
2.99%
3.07%
3.08%
3.19%
3.26%
3.29%
3.34%
3.44%
32%
10%
30%
45%
79%
69%
64%
74%
86%
62%
46%
69%
64%
Firm
Ohki Corn.
Taihei Kogyo
Taisei Corp.
Fudo Construction
Wakachiku Const.
Tekken Corp.
Penta-Ocean Const.
WACC IBD/(E+IBD)
3.82% 77%
3.98% 75%
4.08% 79%
4.19% 86%
4.55% 53%
4.99% 73%
5.15% 90%
5.70% 81%
8.04% 97%
8.04% 97%
8.12% 131%
8.12% 97%
8.15% 101%
- 128 -
irm
better to reduce debt ratio as much as possible and gain low WACC than to utilize debts for tax
benefits.
8.1.6 Return on invested capital
Firms create their value only when they earn the rate of return on invested capital that
exceeds their cost of capital. In other words, the difference between earnings minus financing
costs for equity and debt interests creates the corporate value. WACC is also called the hurdle
rate.
ROIC= NOPLAT >WACCInvested Capital
NOPLAT: Net Operating Profit or Loss After Taxes
The following graph (Figure 8.1-10) shows the comparison between ROIC and WACC
of the large construction firms in fiscal 2002. Most firms lost their earnings-generating ability
and resulted in low ROIC.
Thus far, we have analyzed the ways to create the corporate value through the present
value formula. The corporate value is dependent on the following two factors. The first one is
how much the firm can continuously generate cash flows on its invested capital. The second is
how far the firm lowers its hurdle rate by keeping its optimal capital structure. In daily
operation, it is important for every manager and employee to keep these two factors in mind and
make every effort to create the corporate value
- 129 -
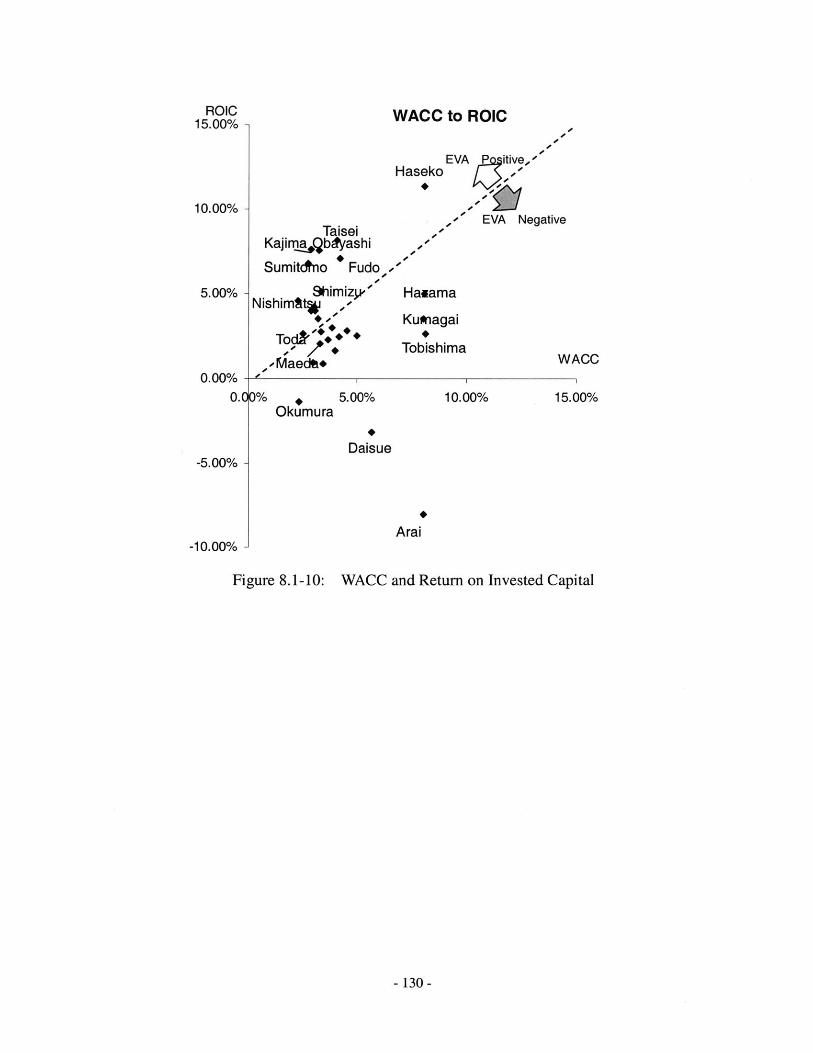
WACC to ROIC
TaiseiKajim.a,Qbtyashi
Sumitdino * Fudo
ShimizW'Nishimftt
- +- '.-Maedti+
0%
10.00% -
5.00% -
0.00%0. c
-5.00% -
-10.00% -
EVA Pitive,Haseko,-
EVA Negative
,#
Haaama
Kusnagai
Tobishima
5.00% 10.00%
Daisue
Arai
Figure 8.1-10: WACC and Return on Invested Capital
-130-
ROIC15.00% -
Okumura
WACC
15.00%
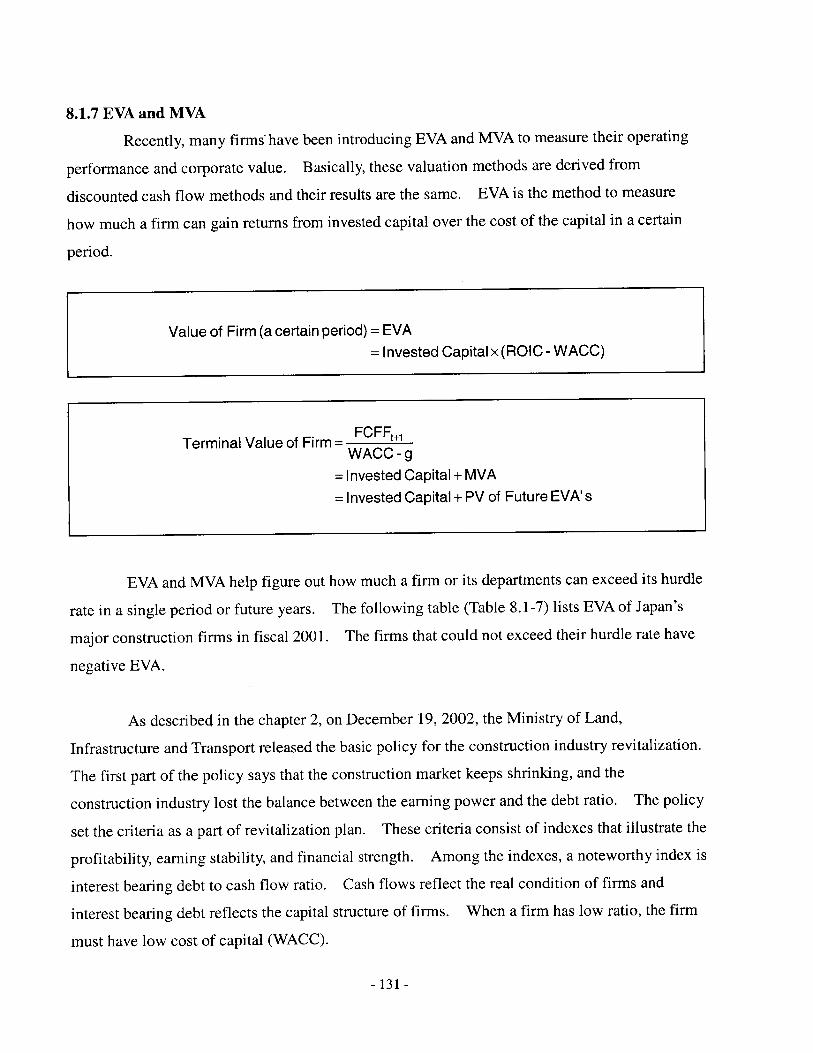
8.1.7 EVA and MVA
Recently, many firms have been introducing EVA and MVA to measure their operating
performance and corporate value. Basically, these valuation methods are derived from
discounted cash flow methods and their results are the same. EVA is the method to measure
how much a firm can gain returns from invested capital over the cost of the capital in a certain
period.
Value of Firm (a certain period) = EVA= Invested Capital x (ROIC -WACC)
Terminal Value of Firm= FCFF+ 1WACC-g= Invested Capital + MVA
= Invested Capital + PV of Future EVA's
EVA and MVA help figure out how much a firm or its departments can exceed its hurdle
rate in a single period or future years. The following table (Table 8.1-7) lists EVA of Japan's
major construction firms in fiscal 2001. The firms that could not exceed their hurdle rate have
negative EVA.
As described in the chapter 2, on December 19, 2002, the Ministry of Land,
Infrastructure and Transport released the basic policy for the construction industry revitalization.
The first part of the policy says that the construction market keeps shrinking, and the
construction industry lost the balance between the earning power and the debt ratio. The policy
set the criteria as a part of revitalization plan. These criteria consist of indexes that illustrate the
profitability, earning stability, and financial strength. Among the indexes, a noteworthy index is
interest bearing debt to cash flow ratio. Cash flows reflect the real condition of firms and
interest bearing debt reflects the capital structure of firms. When a firm has low ratio, the firm
must have low cost of capital (WACC).
- 131 -
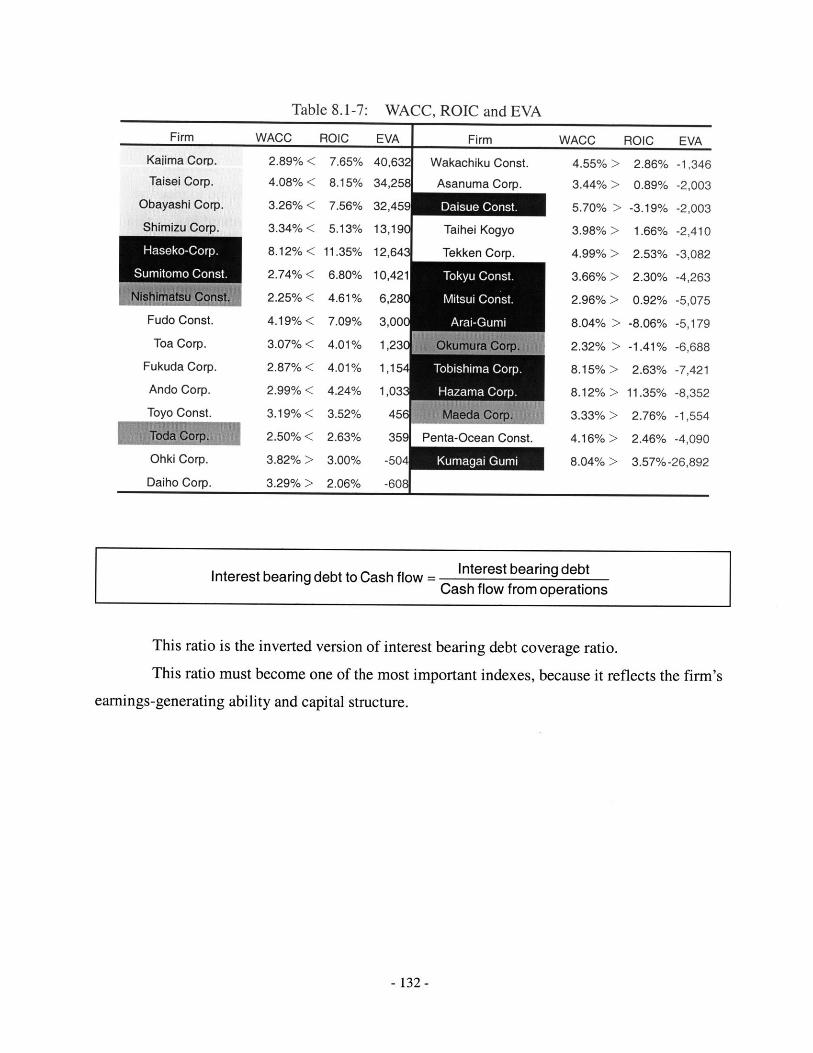
Table 8.1-7: WACC, ROIC and EVAFirm WACC ROIC EVA Firm WACC ROIC EVA
Kajima Corp. 2.89% < 7.65% 40,632 Wakachiku Const. 4.55% > 2.86% -1,346Taisei Corp. 4.08% < 8.15% 34,258 Asanuma Corp. 3.44% > 0.89% -2,003
Obayashi Corp. 3.26% < 7.56% 32,459 5.70% > -3.19% -2,003Shimizu Corp. 3.34% < 5.13% 13,19C Taihei Kogyo 3.98% > 1.66% -2,410Haseko-Corp. 8.12% < 11.35% 12,643 Tekken Corp. 4.99% > 2.53% -3,082
Sumitomo Const. 2.74% < 6.80% 10,421 . . 3.66% > 2.30% -4,263
2.25% < 4.61% 6,28 M 2.96% > 0.92% -5,075Fudo Const. 4.19% < 7.09% 3,00 A 8.04% > -8.06% -5,179Toa Corp. 3.07% < 4.01% 1,23 2.32% > -1.41% -6,688
Fukuda Corp. 2.87% < 4.01% 1,154 s Cr. 8.15% > 2.63% -7,421Ando Corp. 2.99% < 4.24% 1,03 a 8.12% > 11.35% -8,352Toyo Const. 3.19% < 3.52% 45 3.33% > 2.76% -1,554
2.50% < 2.63% 359 Penta-Ocean Const. 4.16%> 2.46% -4,090
Ohki Corp. 3.82% > 3.00% -504 K a. 8.04% > 3.57%-26,892
Daiho Corp. 3.29% > 2.06% -608
Interest bearing debt to Cash flow = Interest bearing debtCash flow from operations
This ratio is the inverted version of interest bearing debt coverage ratio.
This ratio must become one of the most important indexes, because it reflects the firm'searnings-generating ability and capital structure.
-132-
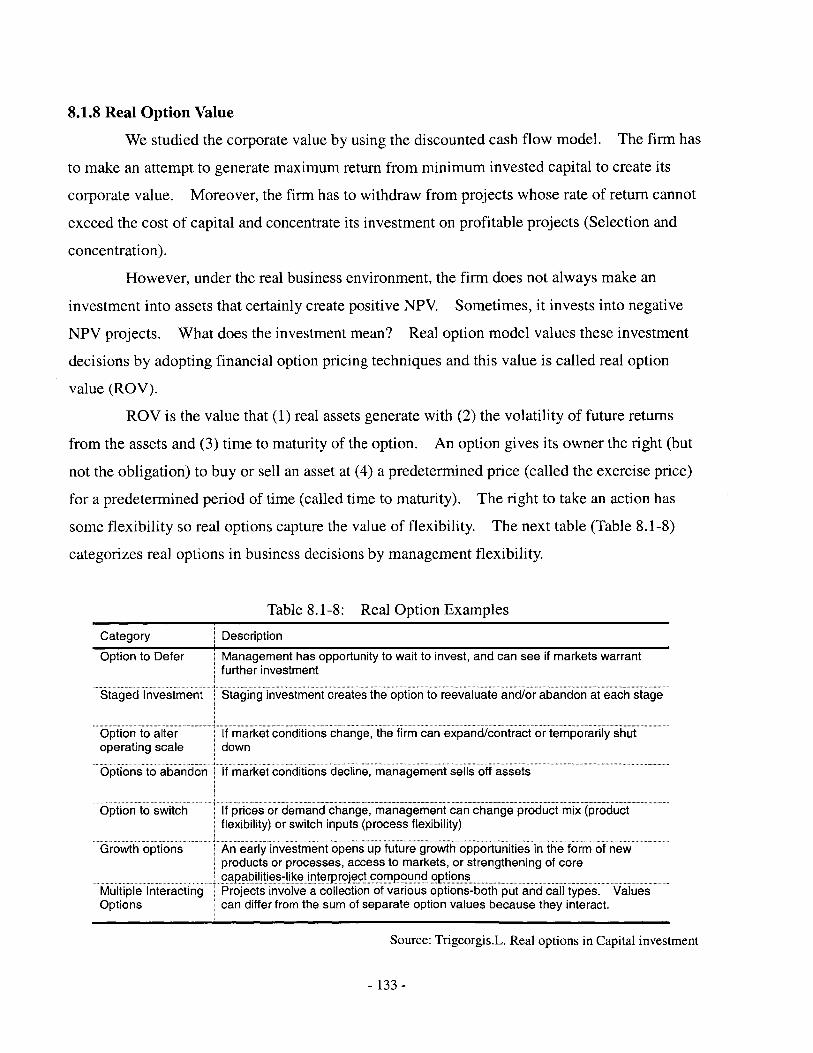
8.1.8 Real Option Value
We studied the corporate value by using the discounted cash flow model. The firm has
to make an attempt to generate maximum return from minimum invested capital to create its
corporate value. Moreover, the firm has to withdraw from projects whose rate of return cannot
exceed the cost of capital and concentrate its investment on profitable projects (Selection and
concentration).
However, under the real business environment, the firm does not always make an
investment into assets that certainly create positive NPV. Sometimes, it invests into negative
NPV projects. What does the investment mean? Real option model values these investment
decisions by adopting financial option pricing techniques and this value is called real option
value (ROV).
ROV is the value that (1) real assets generate with (2) the volatility of future returns
from the assets and (3) time to maturity of the option. An option gives its owner the right (but
not the obligation) to buy or sell an asset at (4) a predetermined price (called the exercise price)
for a predetermined period of time (called time to maturity). The right to take an action has
some flexibility so real options capture the value of flexibility. The next table (Table 8.1-8)
categorizes real options in business decisions by management flexibility.
Table 8.1-8: Real Option Examples
Category Description
Option to Defer Management has opportunity to wait to invest, and can see if markets warrant
further investment
Staged Investment Staging investment creates the option to reevaluate and/or abandon at each stage
Option to alter If market conditions change, the firm can expand/contract or temporarily shutoperating scale down
Options to abandon If market conditions decline, management sells off assets
Option to switch If prices or demand change, management can change produc~trmix (productflexibility) or switch inputs (process flexibility)
Growth options An early investment opens up future growth opportunities in the form of newproducts or processes, access to markets, or strengthening of corecapabilities-lke interproject compound options
Multiple Interacting Projects involve a collection of various options-both put and call types. ValuesOptions can differ from the sum of separate option values because they interact.
Source: Trigeorgis.L. Real options in Capital investment
- 133 -
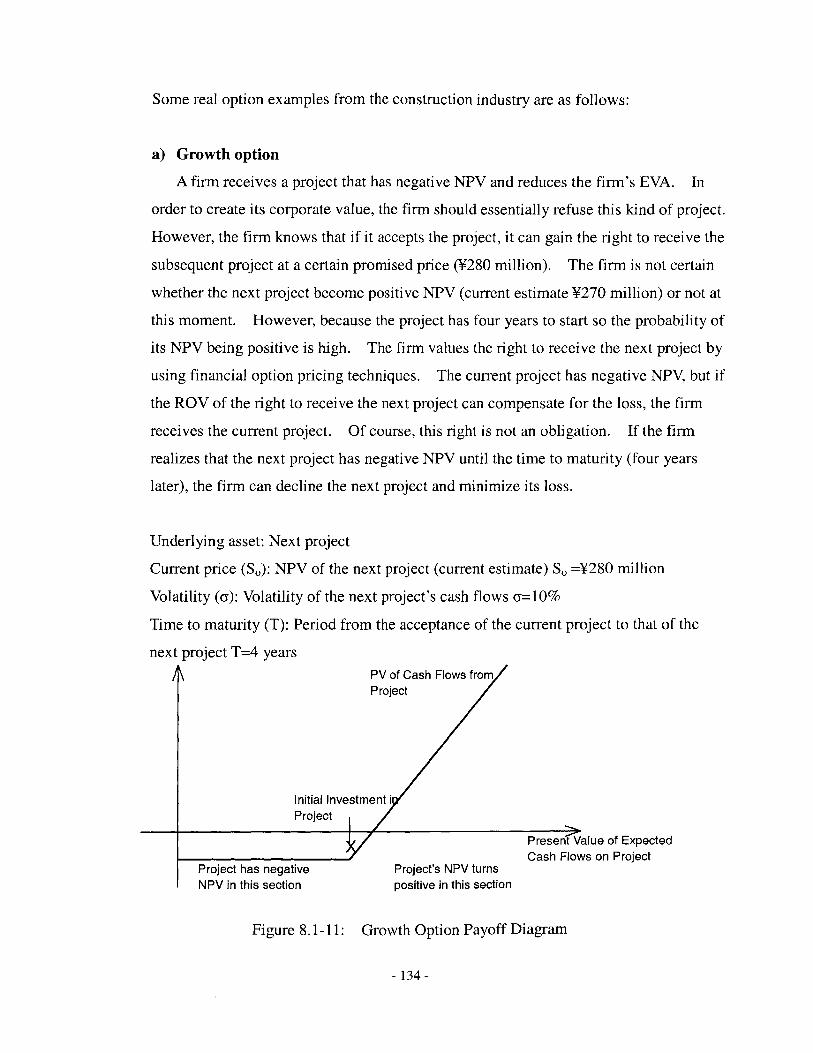
Some real option examples from the construction industry are as follows:
a) Growth option
A firm receives a project that has negative NPV and reduces the firm's EVA. In
order to create its corporate value, the firm should essentially refuse this kind of project.
However, the firm knows that if it accepts the project, it can gain the right to receive the
subsequent project at a certain promised price (Y280 million). The firm is not certain
whether the next project become positive NPV (current estimate Y270 million) or not at
this moment. However, because the project has four years to start so the probability of
its NPV being positive is high. The firm values the right to receive the next project by
using financial option pricing techniques. The current project has negative NPV, but if
the ROV of the right to receive the next project can compensate for the loss, the firm
receives the current project. Of course, this right is not an obligation. If the firm
realizes that the next project has negative NPV until the time to maturity (four years
later), the firm can decline the next project and minimize its loss.
Underlying asset: Next project
Current price (So): NPV of the next project (current estimate) So =Y280 million
Volatility (a): Volatility of the next project's cash flows 7=10%
Time to maturity (T): Period from the acceptance of the current project to that of the
next project T=4 yearsPV of Cash Flows fromProject
Initial Inves tmenProject
Present Value of ExpectedCash Flows on Project
Project has negative Project's NPV turnsNPV in this section positive in this section
Figure 8.1-11: Growth Option Payoff Diagram
-134-
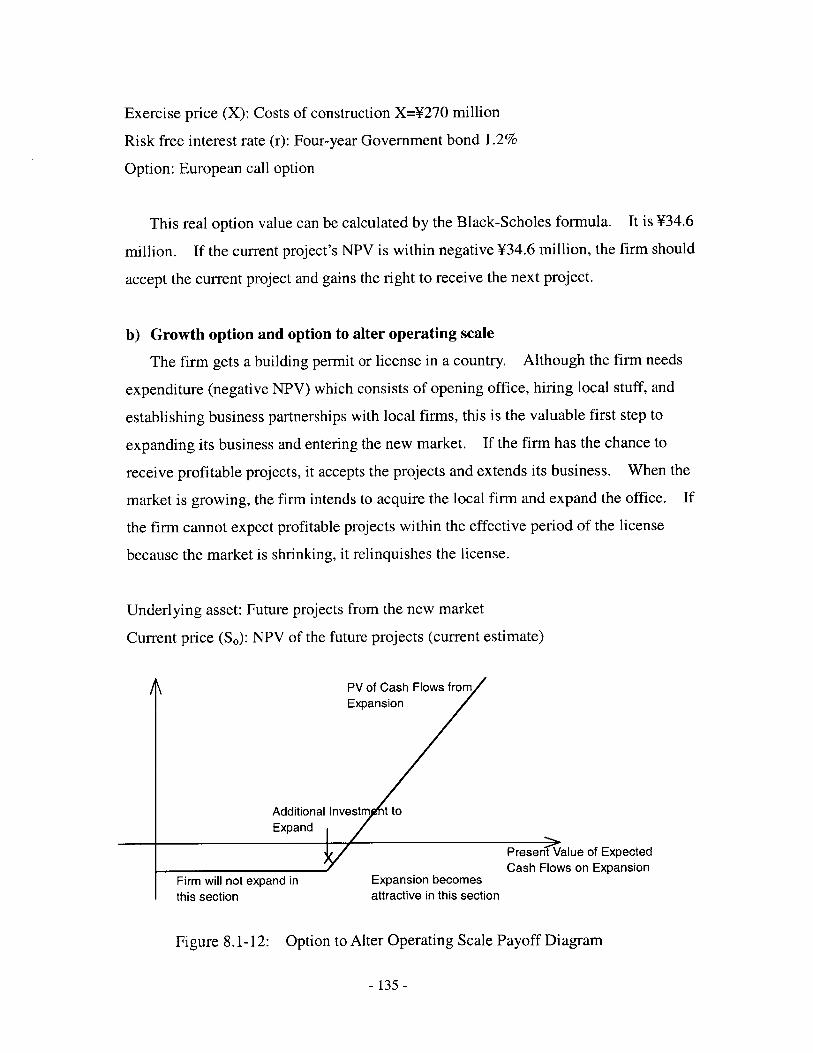
Exercise price (X): Costs of construction X=Y270 million
Risk free interest rate (r): Four-year Government bond 1.2%
Option: European call option
This real option value can be calculated by the Black-Scholes formula. It is Y34.6
million. If the current project's NPV is within negative Y34.6 million, the firm should
accept the current project and gains the right to receive the next project.
b) Growth option and option to alter operating scale
The firm gets a building permit or license in a country. Although the firm needs
expenditure (negative NPV) which consists of opening office, hiring local stuff, and
establishing business partnerships with local firms, this is the valuable first step to
expanding its business and entering the new market. If the firm has the chance to
receive profitable projects, it accepts the projects and extends its business. When the
market is growing, the firm intends to acquire the local firm and expand the office. If
the firm cannot expect profitable projects within the effective period of the license
because the market is shrinking, it relinquishes the license.
Underlying asset: Future projects from the new market
Current price (So): NPV of the future projects (current estimate)
PV of Cash Flows fromExpansion
Additional Investm t toExpandI
Present Value of ExpectedCash Flows on Expansion
Firm will not expand in Expansion becomesthis section attractive in this section
Figure 8.1-12: Option to Alter Operating Scale Payoff Diagram
- 135 -
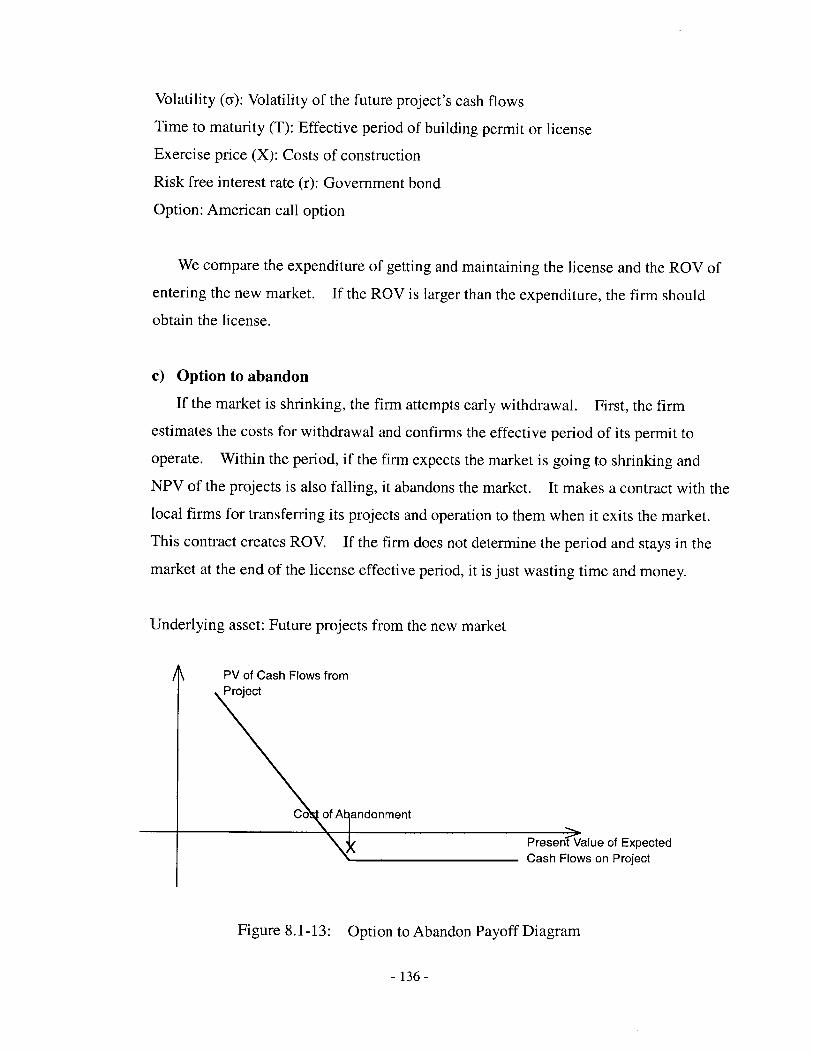
Volatility (a): Volatility of the future project's cash flows
Time to maturity (T): Effective period of building permit or license
Exercise price (X): Costs of construction
Risk free interest rate (r): Government bond
Option: American call option
We compare the expenditure of getting and maintaining the license and the ROV of
entering the new market. If the ROV is larger than the expenditure, the firm should
obtain the license.
c) Option to abandon
If the market is shrinking, the firm attempts early withdrawal. First, the firm
estimates the costs for withdrawal and confirms the effective period of its permit to
operate. Within the period, if the firm expects the market is going to shrinking and
NPV of the projects is also falling, it abandons the market. It makes a contract with the
local firms for transferring its projects and operation to them when it exits the market.
This contract creates ROV. If the firm does not determine the period and stays in the
market at the end of the license effective period, it is just wasting time and money.
Underlying asset: Future projects from the new market
PV of Cash Flows fromProject
Co of A I ndonment
Present Value of ExpectedCash Flows on Project
Figure 8.1-13: Option to Abandon Payoff Diagram
-136-
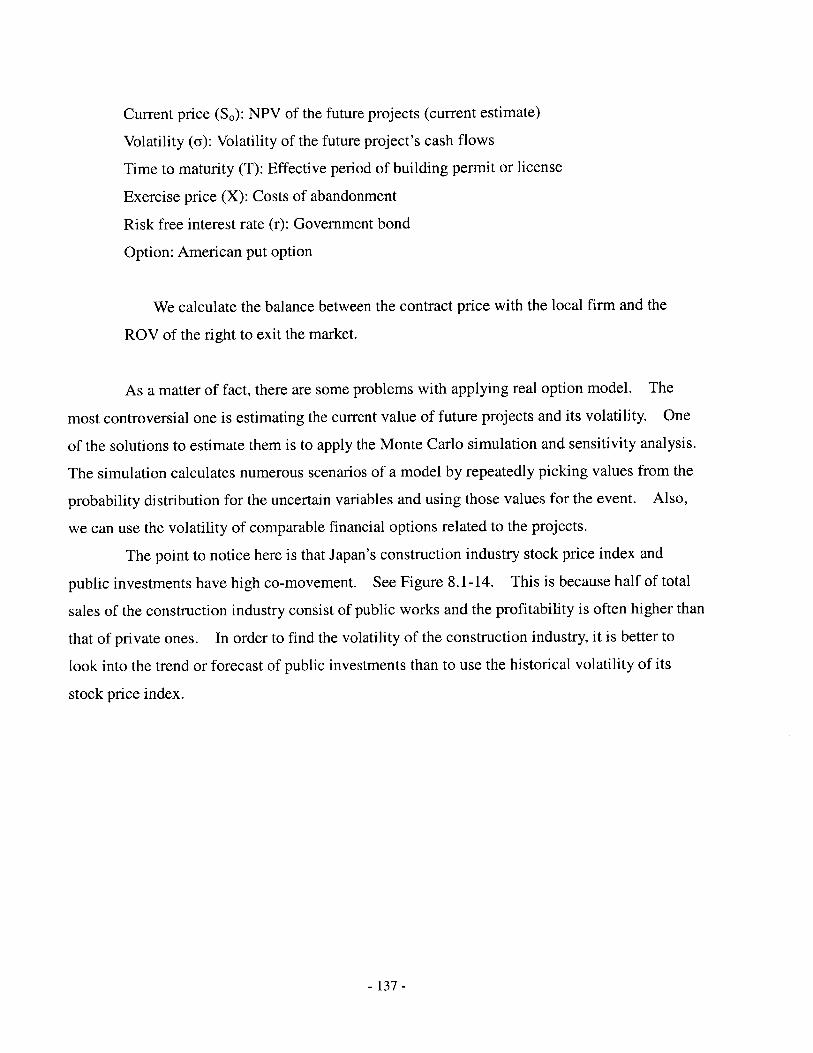
Current price (S,): NPV of the future projects (current estimate)
Volatility (a): Volatility of the future project's cash flows
Time to maturity (T): Effective period of building permit or license
Exercise price (X): Costs of abandonment
Risk free interest rate (r): Government bond
Option: American put option
We calculate the balance between the contract price with the local firm and the
ROV of the right to exit the market.
As a matter of fact, there are some problems with applying real option model. The
most controversial one is estimating the current value of future projects and its volatility. One
of the solutions to estimate them is to apply the Monte Carlo simulation and sensitivity analysis.
The simulation calculates numerous scenarios of a model by repeatedly picking values from the
probability distribution for the uncertain variables and using those values for the event. Also,
we can use the volatility of comparable financial options related to the projects.
The point to notice here is that Japan's construction industry stock price index and
public investments have high co-movement. See Figure 8.1-14. This is because half of total
sales of the construction industry consist of public works and the profitability is often higher than
that of private ones. In order to find the volatility of the construction industry, it is better to
look into the trend or forecast of public investments than to use the historical volatility of its
stock price index.
- 137 -
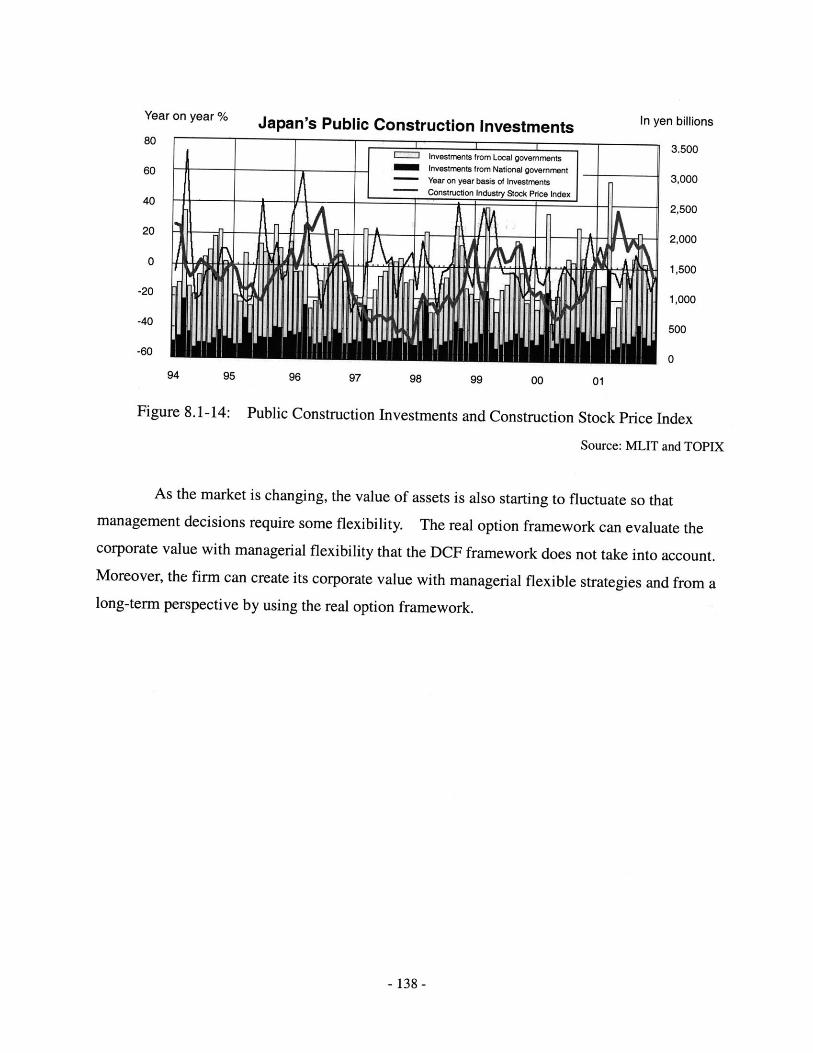
Year on year %
80 1
60
40
20
0
-20
-40
-60
Japan's Public Construction Investments
IILA
Investments from Local governmentsInvestments from National governmentYear on year basis of Investments
- Construction Industry Stock Price Index
&
In yen billions
3.500
3,000
- 2,500
2,000
1,500
1,000
500
094 95 96 97 98 99 00 01
Figure 8.1-14: Public Construction Investments and Construction Stock Price Index
Source: MLIT and TOPIX
As the market is changing, the value of assets is also starting to fluctuate so thatmanagement decisions require some flexibility. The real option framework can evaluate thecorporate value with managerial flexibility that the DCF framework does not take into account.Moreover, the firm can create its corporate value with managerial flexible strategies and from along-term perspective by using the real option framework.
- 138 -
11
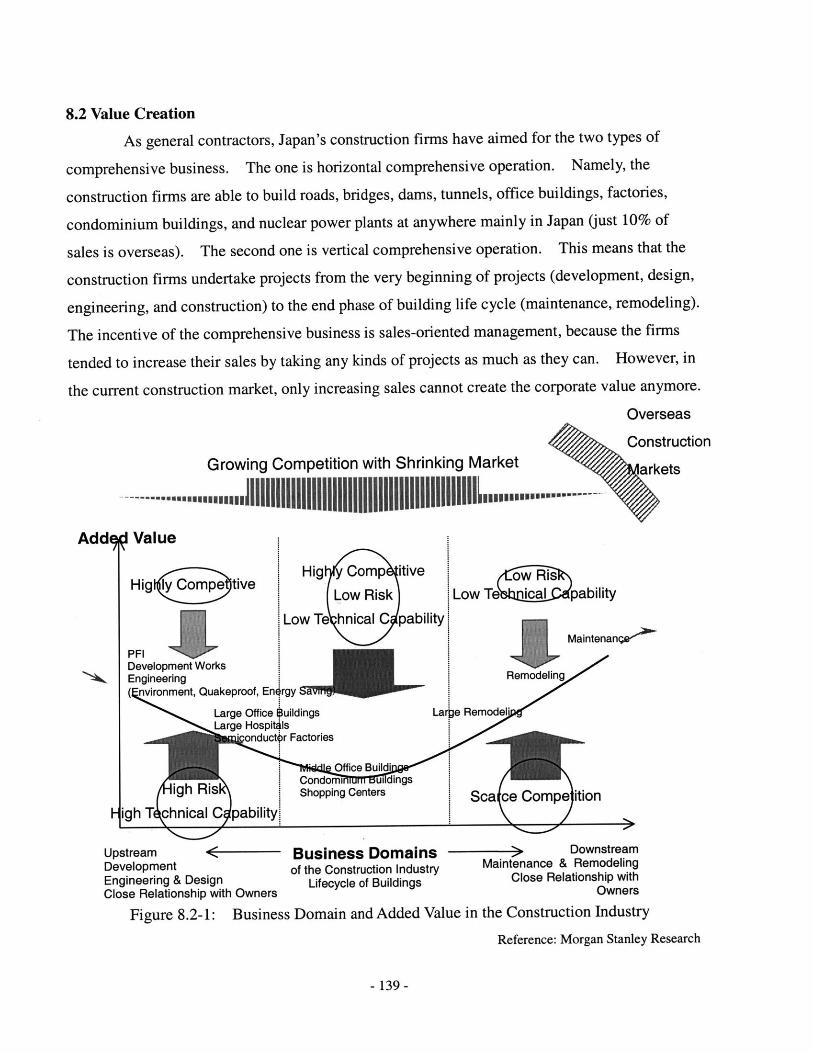
8.2 Value Creation
As general contractors, Japan's construction firms have aimed for the two types of
comprehensive business. The one is horizontal comprehensive operation. Namely, the
construction firms are able to build roads, bridges, dams, tunnels, office buildings, factories,
condominium buildings, and nuclear power plants at anywhere mainly in Japan (just 10% of
sales is overseas). The second one is vertical comprehensive operation. This means that the
construction firms undertake projects from the very beginning of projects (development, design,
engineering, and construction) to the end phase of building life cycle (maintenance, remodeling).
The incentive of the comprehensive business is sales-oriented management, because the firms
tended to increase their sales by taking any kinds of projects as much as they can. However, in
the current construction market, only increasing sales cannot create the corporate value anymore.
Overseas
Construction
Growing Competition with Shrinking Market arkets
........... JI~IIlhflhIIIIIIIIIIII| II I% ar....k
Hig Comp itive
Low Risk
Low Te hnical C pability
Low Te'6hnL Cepability
MaintenangwPFIDevelopment WorksEngineering Remodeling
nvironment, Quakeproof, Energy
Large Office Ouildings Large Remodel*Large Hospitils
'onduct r Factories
Office Build!.Condomi ui dings
igh Ris Shopping Centers Sca Cgh T chnical C pability_
Upstream < Business Domains N> Downstream
Development of the Construction Industry Maintenance & Remodeling
Engineering & Design Lifecycle of Buildings Close Relationship withClose Relationship with Owners Owners
Figure 8.2-1: Business Domain and Added Value in the Construction Industry
Reference: Morgan Stanley Research
-139-
AddeV Value
H
Higl tive
i

In December 2002, the Ministry of Land, Infrastructure and Transport also pointed out
as the basic policy for the construction industry revitalization (1) the curtailment of unprofitable
departments and shifting management resources to profitable departments, and (2) the
improvement of the profitability by changing from sales-oriented to profit-oriented management
(Translation mine). The firms are changing their business strategy to profit-oriented
management.
Next, we explore the profitable areas in the construction industry. The above graph
(Figure 8.2-1) plotted the business domains of the construction industry from upstream, the first
phase of planning and development, to downstream, the final phase of building life cycle, in
order of their added value and profitability.
The graph shows that the added value is determined by the three factors, price
competition, business risk, and required technical capability. The construction of middle size
office buildings, condominium buildings, and shopping centers located in the middle part of the
business domain does not require high technical capability, so the barrier to entry into this
domain is low and thus this domain is highly competitive. Moreover, the business risk is low.
Thus, the added value in this domain is the lowest among business domains in the construction
industry. The upstream domain covers from PFI1, development works, and engineering to the
construction of large office buildings, hospitals, and semiconductor factories and requires high
technical capability and takes high risk. PFI, development, and engineering lead to fee business
and create constant cash flows to the firms. Although, because of its risk and required ability,
the barrier to enter this domain is high, many firms are attempting to enter this profitable domain.
Hence, this domain is going to be more competitive in the future. In addition, high competition
would lower the added value. Remodeling and maintenance that are placed in the downstream
domain also have high added value, because they are fee business. Moreover, owners tend to
ask contractors who built their building to do small remodeling works, so competition is low.
The construction firm that built the building has execution schemes, execution scheme drawings,
and quality assurance data. Thus, they have an advantage to offer these services. However,
when the owners plan the large remodeling project, they choose low cost contractors. Moreover,
I Private Finance Initiative: Under the PFI, building projects that would previously have relied on public money are financed by
the private sector.
-140-
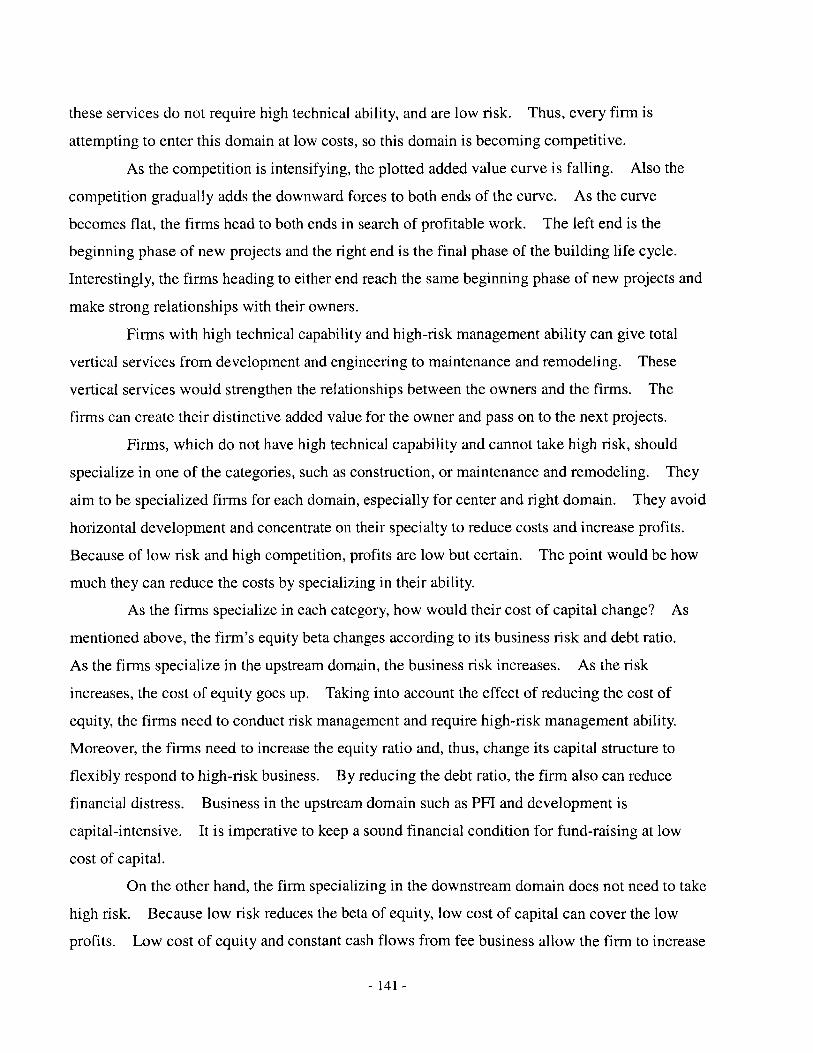
these services do not require high technical ability, and are low risk. Thus, every firm is
attempting to enter this domain at low costs, so this domain is becoming competitive.
As the competition is intensifying, the plotted added value curve is falling. Also the
competition gradually adds the downward forces to both ends of the curve. As the curve
becomes flat, the firms head to both ends in search of profitable work. The left end is the
beginning phase of new projects and the right end is the final phase of the building life cycle.
Interestingly, the firms heading to either end reach the same beginning phase of new projects and
make strong relationships with their owners.
Firms with high technical capability and high-risk management ability can give total
vertical services from development and engineering to maintenance and remodeling. These
vertical services would strengthen the relationships between the owners and the firms. The
firms can create their distinctive added value for the owner and pass on to the next projects.
Firms, which do not have high technical capability and cannot take high risk, should
specialize in one of the categories, such as construction, or maintenance and remodeling. They
aim to be specialized firms for each domain, especially for center and right domain. They avoid
horizontal development and concentrate on their specialty to reduce costs and increase profits.
Because of low risk and high competition, profits are low but certain. The point would be how
much they can reduce the costs by specializing in their ability.
As the firms specialize in each category, how would their cost of capital change? As
mentioned above, the firm's equity beta changes according to its business risk and debt ratio.
As the firms specialize in the upstream domain, the business risk increases. As the risk
increases, the cost of equity goes up. Taking into account the effect of reducing the cost of
equity, the firms need to conduct risk management and require high-risk management ability.
Moreover, the firms need to increase the equity ratio and, thus, change its capital structure to
flexibly respond to high-risk business. By reducing the debt ratio, the firm also can reduce
financial distress. Business in the upstream domain such as PFI and development is
capital-intensive. It is imperative to keep a sound financial condition for fund-raising at low
cost of capital.
On the other hand, the firm specializing in the downstream domain does not need to take
high risk. Because low risk reduces the beta of equity, low cost of capital can cover the low
profits. Low cost of equity and constant cash flows from fee business allow the firm to increase
- 141 -

the debt ratio.
Some firms are attempting to enter overseas operations from the shrinking domestic
market. It is important for the firms to analyze each market and have a strategy for each and
conduct risk management. The overseas markets are out of the scope of the thesis so we don't
study them in more detail.
Four specialized categories are as follows:
a) Strengthen the vertical comprehensive operation from the upstream to downstream
of the business domain. The firm itself stays upstream and uses its technical and
risk management ability for every process of its projects.
b) Specialize in the construction for specific fields.
c) Specialize in remodeling and maintenance.
d) Enter overseas markets.
-142-
8.3 Corporate Value
As the market is shrinking, the construction firms are required to find new ways to
create corporate value. The Introduction of the International Accounting Standards is
accelerating this trend. The market share of the firms is changing, and the mobility of
employment is increasing.
The previous sections mentioned two major approaches to increasing corporate value:
1. Constantly generate cash flows from the invested capital as much as possible
2. Decrease the firm's hurdle rate by optimizing its capital structure as much as
possible
The firms have to make an attempt to generate maximum return from minimum invested
capital to create their corporate value. Thus, the firms have to withdraw from projects whose
rate of return cannot exceed the firms' cost of capital and concentrate their investment on
profitable projects (Selection and concentration). To increase their profitability, the firms have
to change their policy from sales-oriented to profits-oriented. Also, the firms have to reduce
their debts and optimize their capital structure to lower their hurdle rate. EVA and MVA help
the firms value their performance. Moreover, the firms have to aim for not only short-term
interests with fixed strategies but also long-term interests with some flexible strategies by
valuing with real options. Establishing the real option valuation method is helpful for not only
managerial use for the firm itself but also disclosure of the value of the flexible strategies to the
public as important investments.
The firms have to (1) look into their own capability and characteristics, (2) analyze risk,
competition, and required technical capability of each business domain, and (3) choose their
entry domain and invest their management resources intensively. Also, depending on the level
of risk they take, the firms should optimize their capital structures and lower their cost of capital.
Lastly, in the changing market, firms fearing change and challenge will be discarded
from the market.
- 143 -

-144-
CHAPTER 9
CONCLUSION
In Japan's high economic growth period, corporate value was generated from
"harmony." Keiretsu prevented construction firms from competition and formed a system in
which the firms harmoniously supported each other within the keiretsu group. The seniority
system and lifetime employment also preserved employees in the firms and created a system in
which employees put their efforts together and harmoniously corporate with each other for the
firms.
In the shrinking and changing market, however, the construction firms have started to
lose their corporate value. As economic growth has ended and the market has been shrinking,
the firms have been forced into genuine competition. The sales-oriented management has led
the firms to fierce competition and made their profitability negative. In addition, the
introduction of fair value accounting is devaluing the firms' cross-held shares and the
introduction of statements of cash flows is disclosing the real financial conditions of the firms.
The firms are being required to sell off valueless cross-held shares and to increase mobility of
employment in order to adjust their fixed costs.
In Chapter 2, the thesis explained the current situation of the construction industry with
figures and tables. GDP has begun negative growth and the ratio of construction investments to
GDP has also been falling. The percentage of mutual shareholding in the entire market is
decreasing and shows the collapse of the keiretsu system. Because the construction firms have
started share competition for survival beyond keiretsu, their profitability is diminishing. It is
imperative for the firms to collect funds from the security markets and pay more attention to their
security holders' interests. At last, the firms have had to take a serious approach to create their
corporate value.
In Chapter 3, the thesis examined the unique characteristics of the construction industry
and analyzed how these characteristics appeared in its financial statements. Moreover, this
chapter explored two revenue recognition methods: (1) the percentage of completion method and
(2) the completed contract method, and studied how profits are accounted. Finally, using the
profit structure of the construction firms and the break-even point analysis, the thesis found three
- 145 -
ways to raise profits: (1) increasing volume, (2) increasing gross margin, and (3) controlling
overhead.
In Chapter 4, the thesis analyzed the impact of the introduction of International
Accounting Standards (IAS) on the construction industry. Especially, the statement of cash
flows had a great influence on the management of the firms. Whichever revenue recognition
methods the firms choose, their cash flows show their real financial conditions. Moreover, the
thesis analyzed the statements of cash flows.
In Chapter 5, the thesis studied analysis methods for the construction firms' financial
conditions using the statement of cash flows. Also, from these ratio analysis and profile
analysis, the thesis drew on the methods of cash flow management. The new contractor rating
system for public works also reflects the concepts of cash flows.
In Chapter 6, the thesis treated cash flows as returns and examined the relationship
between the invested capital and returns from the capital. The cash flows used in this chapter
were derived from the cash flows from operating activities and called free cash flows. After a
firm's payments for the cost of capital, the free cash flows create its corporate value. The
capital asset pricing model (CAPM) is effective to estimate the cost of the invested capital and
useful to illustrate the relationship between expected risk and expected return. This chapter
explained the relationship among the invested capital, returns from this capital, and the cost of
the capital.
In Chapter 7, the thesis explored two valuation methods. One is the discounted cash
flow (DCF) model and it values the firms' corporate value from the firms' cash flows and cost of
capital. EVA and MVA are derived from this model and have been introduced into Japan's
firms recently. By using these valuation models, we evaluate whether return on the invested
capital (ROIC) can exceed the cost of capital (WACC) or not. The other valuation method is
real options. This method can add the value of strategies with managerial flexibility under
uncertainty to the corporate value.
As the result of analyzing the DCF models, there are two major approaches to
increasing corporate value:
1. Constantly generate cash flows from the invested capital as much as possible
2. Decrease the firms' hurdle rate (WACC) as much as possible by optimizing its
capital structure.
- 146 -
In Chapter 8, the thesis studied how the construction firms create corporate value by
using the valuation methods that we reviewed in Chapter 7. Moreover, this chapter verified the
methods by using the financial data of the firms in fiscal 2002. Finally, the valuation methods
lead the firms to finding directions in which they should follow in order to create their value in
the changing and shrinking construction market.
The firms have to make an attempt to generate maximum returns from minimum
invested capital to create corporate value. Thus, they have to withdraw from projects whose
rate of return cannot exceed the firm's cost of capital and concentrate their investments into
profitable projects (Selection and concentration). To increase profitability, the firms have to
change their policy from sales-oriented to profits-oriented. Also, they have to reduce its debts
and optimize its capital structure in order to lower its hurdle rate. Because the construction firm
does not have many fixed assets as collateral on debts, it is better to reduce interest-bearing debts
as much as possible to diminish cost of financial distress than to increase the debts to obtain tax
benefits. Also, by improving investor relations, the firm discloses their financial condition and
maintains good relationship with security markets in order to obtain easy access to direct
financing. EVA and MVA help the firms value their performance. Using these methods, the
firms have to keep in mind that their return on invested capital must exceed its cost of capital
(WACC).
Moreover, under this uncertain market, the construction firms have to aim for not only
short-term interests with fixed strategies but also long-term interests with some flexible strategies
by valuing with real options. Establishing the real option valuation method is helpful for not
only managerial use for the firms but also disclosure of the value of the flexible strategies to
public as important investments.
The firms have to (1) look into their own capability and characteristics, (2) analyze risk,
competition, and required technical capability of each business domain, and (3) choose their
entry domains, and invest their management resources intensively. Also, depending on the
level of risk they take, the firms should optimize their capital structure and lower their cost of
capital. For example, a firm that enters the business domain with constant and low risk cash
flows can have relatively high debt ratio.
In Japan's changing and shrinking market, firms that fear of changes and challenges will
fall into a fateful crisis.
- 147 -

- 148 -
BIBLOGRAPHY
Financial Data of Japan's Construction Firms
Multex Investor Japan, Meigara Bunseki Repo-to 2002 (Company Reports 2002), 2002
<http://www.multexinvestor.co.jp>
Kajima Corporation, Kajima Annual Report 2002, 2002
<http://www.kajima.co.jp/ir/annual/>
Taisei Corporation, Taisei Corporation Annual Report 2002, 2002
<http://www.taisei.co.jp/english/ir/index.html>
Shimizu Corporation, Shimizu Corporation Annual Report 2002, 2002
<http://www.shimz.co.jp/english/a-report.html>
Obayashi Corporation, Obayashi Corporation Annual Report 2002, 2002
<http://www.obayashi.co.jp/english/ir/index.html>
Kumagai Gumi, Kumagai Gumi Annual Report 2002, 2002
<http://www.kumagaigumi.co.jp/index2.html>
Toda Corporation, Toda Corporation Annual Report 2002, 2002
<http://www.toda.co.jp/level1/gyouseki/html/annual.html>
Nishimatsu Construction, Nishimatsu Construction Annual Report 2002, 2002
<http://www.nishimatsu.co.jp/eng/ar2002/index.html>
Haseko Corporation, Financial Statements 2002 in Japanese, 2002
<http://www.haseko.co.jp/financial/index.html>
Penta-Ocean Construction, Financial Statements 2002 in Japanese, 2002
<http://21 0.157.11.1 04/english/ir/index. html>
Maed Corporation, Maeda Corporation Annual Report 2002, 2002
<http://www.maeda.co.jp/index-e.html>
Hazama Corporation, Hazama Annual Report 2002, 2002
<http://www.hazama.co.jp/indexe.html>
Mitsui Construction, Mitsui Construction Financial Statements 2002 in Japanese, 2002
Mitsui Construction was merged with Sumitomo Construction on April 1, 2003.
Tokyu Construction, Tokyu Construction Financial Statements 2002 in Japanese, 2002
<http://const.tokyu.com/kessan/index.html>
-149-
Tobishima Corporation, Tobishima Corporation Financial Statements 2002 in Japanese, 2002
<http://www.tobishima.co.jp/settlement/pubnoticemenu.htm>
Sumitomo Construction, Sumitomo Construction Financial Statements 2002 in Japanese, 2002
Sumitomo Construction was merged with Mitsui Construction on April 1, 2003.
Toa Corporation, Toa Corporation Annual Report 2002, 2002
<http://www.toa-const.co.jp/ir/index.html>
Ando Corporation, Ando Corporation Financial Statements in Japanese 2002, 2002
<http://www.ando-corp.co.jp/kigyo/kidOOl.htm>
Okumura Corporation, Okumura Corporation Financial Statements in Japanese 2002, 2002
<http://www.okumuragumi.co.jp/index.html>
Toyo Construction, Toyo Construction Financial Statements in Japanese 2002, 2002
<http://www.toyo-const.co.jp/ir/shiryou/index.html>
Tekken Corporation, Tekken Corporation Financial Statements in Japanese 2002, 2002
<http://www.tekken.co.jp/05/index.html>
Asanuma Corporation, Asanuma Corporation Financial Statements in Japanese 2002, 2002
<http://www.asanuma.co.jp/ir-info/gyoseki.html>
Taihei Kogyo, Taihei Kogyo Financial Statements in Japanese 2002, 2002
<http://www.taiheikogyo.co.jp/kessan/index.html>
Fukuda Corporation, Fukuda Corporation Financial Statements in Japanese 2002, 2002
<http://www.fkd.co.jp/zaimu/zaimu.html>
Fudo Construction, Fudo Construction Financial Statements in Japanese 2002, 2002
<http://www.fudo.co.jp/index.html#>
Arai Gumi, Arai Gumi Financial Statements in Japanese 2002, 2002
<http://www.araigumi.co.jp/kessan/index.html>
Daiho Corporation, Daiho Corporation Financial Statements in Japanese 2002, 2002
<http://www.daiho.co.jp/menu/index7.htm>
Wakachiku Construction, Wakachiku Construction Financial Statements in Japanese 2002, 2002
<http://www.wakachiku.co.jp/profile/zaimu/fzaimu.htm>
Ohki Corporation, Ohki Corporation Financial Statements in Japanese 2002, 2002
<http://www.ohki.co.jp/outline/financial.html>
-150-
Daisue Construction, Daisue Corporation Financial Statements in Japanese 2002, 2002
<http://www.daisue.co.jp/>
Accounting
Adrian, James J., and Adrian, Douglas J., "Construction Accounting", Stipes Publishing L.L.C.,
Illinois, 1999
Iino, Toshio, and Toukai, Mikio, ed., "Kaikei Seidokaikaku to Kensetsugyou Keiri (Accounting
for Contractors)", Kensetsu Sangyo Keiri Kenkyuzyo, Tokyo, 1999
Pratt, Jamie, "Financial Accounting, 5 th ed.", John Wiley & Sons, New York, 2003
Palepu, Krishna G., Bernard, Victor L., Healy, Paul M., "Business Analysis & Valuation: Using
Financial Statements, 2 "d ed.", South-Western Publishing Co, Ohio, 1999
Stickney, Clyde P., and Brown, Paul R., "Financial Reporting and Statement Analysis: A
Strategic Perspective, 4 th ed.", South-Western Publishing Co, Ohio, 1998
Sugiura, Hiroshi, ed., "Kensetsugyo no Keieibunnseki (Business Analysis for the Construction
Industry)", Zeimukeiri Kyoukai, Tokyo, 2001
Yamane, Takashi, "Bizinesu Akaunteingu (Accounting & Management)", Tyuuou Keizaishya,
Tokyo, 2001
Finance
Amram, Martha, and Kulatilaka, Nalin, "Real Options", Harvard Business School Press,
Massachusetts, 1999
Barclay, Michael, and Smith, Clifford, "The Determinants of Corporate Leverage, and Dividend
Policies", McGraw-Hill, New York, 1999
Betker, Bnan, and Alderson, Michael, "Lessons on Capital Structure from Chapter 11
Reorganizations", Stern Stewart Management Inc., 1996
Damodaran, Aswath, "Investment Valuation: Tools and Techniques for Determining the Value
of Any Asset, 2 ed.", John Wiley & Sons, New York, 2002
Damodaran, Aswath, "Applied Corporate Finance: A User's Manual", John Wiley & Sons, New
York, 1999
Ide, Masasuke, and Takahashi, Fumio, "Keiei zaimu nyumon (Corporate Finance Manual)",
Nihon Keizai Shinbunshya, Tokyo, 2000
- 151 -
Luehrman, Timothy A., "Using APV: A Better Tool for Valuing Operations", Harvard Business
Review, Massachusetts, 1997
McKinsey & Company, Inc., Copeland, Tom, Koller, Tim, and Jack, Murrin, "Valuation:
Measuring and Managing the Value of Companies, 3 rd ed.", John Wiley & Sons, New
York, 2000
Myers, Stewart C., "The Search for Optimal Capital Structure", McGraw-Hill, New York, 1999
, and Brealey, Richard A., "Principles of Corporate Finance, 6h ed.",
McGraw-Hill, New York, 2000
Pindyck, Robert S., and Rubinfeld, Daniel L., "Microeconomics 5th ed.", Prentice Hall, New
Jersey, 2000
, Dixit, Avinash K., "The Options Approach to Capital Investment", Harvard Business
Review, Massachusetts, 1995
Stewart, G Bennett, "The Quest for Value", HarperCollins Publishers, New York, 1999
Trigeorgis, Lenos, "Real Options", The MIT Press, Massachusetts, 1996
Japan's Construction Industry
Kanemoto, Yoshitsugu, "Nihon no Kensetsu Sangyo (Japan's Construction Industry)", Nihon
Keizai Shinbunshya, Tokyo, 1999.
Levy, Sidney M., "Japanese Construction", Van Nostrand Reinhold, New York, 1990
Muto, Yasuaki, (Mitsubishi Research Institute), "2002nendo no Kokyozigyou no Yukue
(Forecast for Public Works in FY2002)", Seibunsya, Tokyo, 2002
Nishino, Fumio, ed. "Kanzen Moura Nihon-ban PFI (Comprehensive Guide to Japanese PFI)",
San Kai Do, Tokyo, Japan, 2001
Nikkei Architecture, "Mada Tsudukeruno? Uriagezyushigata no Shigoto (Are the Construction
Firms Still Keeping Sales-Oriented Management?)", Nikkei Business Publications Inc.,
Tokyo, September 16, 2002
Takagi, Atsushi, (Morgan Stanley Research), "Kensetsugyoukai (Japan's Construction
Industry)", Seibunsya, Tokyo, 2003
, "Kensetsugyoukai no Toushishiten to Kessanbunseki (Investment Strategy and
Financial Analysis for Japan's Construction Industry)", Seibunsya, Tokyo, 2003
-152-
Weekly Diamond, "Kuni ga Misuteta Zenekon (Abandoned General Contractors by Japan's
Government)" Diamond Inc., Tokyo, February 8, 2003
Weekly Toyo Keizai, "Zenekon Houkai (Collapse of General Contractors)", Toyo Keizai Inc.,
Tokyo, January 25, 2003
Data Resources
Construction Industry Information Center, "Contractor Rating System", cited in Japanese
<http://www.ciic.or.jp/keisin/keyac.html>
Ministry of Land, Infrastructure, and Transport, "Statistical Information", cited in Japanese
<http://www.mlit.go.jp/toukeijouhou/toukei-jouhou.html>
Ministry of Finance, "Statistical Information", cited in Japanese
<http://www.mof.go.jp/siryou.htm>
NLI Research Institute, Monthly Report: "Keizokusuru Mochiai Kaisyo (Disappearing Mutual
shareholdings)", cited in Japanese in December, 2002
<http://www.nli-research.co.jp/pub.html>
NLI Research Institute, "Monthly Report: Shinyo Risuku wo Orikomu Kinyuusai Shizyou
(Credit Rating and Interest Rate of Corporate Bonds)", cited in Japanese in March, 1999<http://www.nli-research.co.jp/pub.html>
Research Institute of Construction and Economy, "Construction Economy Report"
<http://www.rice.or.jp/e-home/e-home.html>
Standard & Poors, "Credit Ratings Lists",
<http://www 2 .standardandpoors.com/NASApp/cs/ContentServer?pagename=sp/Page/HomePg&r=6>
The Security Analysts Association of Japan, "Corporate Disclosure", cited in Japanese
<http://www.saa.or.jp/research/disclosure.html>
Tokyo Stock Exchange: "Stock Price Indices",
<http://www.tse.or.jp/EHISTIDX/index.html>
Tokyo Shoko Research, "Bankruptcy trend in Japan", cited in Japanese
<http://www.tsr-net.co.jp/topics/zenkoku/index.html>
- 153 -