Corporate Social Responsibility Report (Environmental, Social ...
Upload
khangminh22Category
view
0download
0
1
Corporate social responsibility, agency problems and social pressure
by Dion Tops
Student name: D.J.M. Tops
ANR: 546252
U-number: u1250558
Study: MSc. Finance
Contact details:
Supervisor: dr. A.H.F. Verboven
Second reader: prof. dr. H.M. Prast
Date of submission: 23-10-2017

2
Abstract
In this study I find evidence that CSR is partially the result of agency problems. Using an
empirical strategy based on managerial incentives, I find evidence indicating that when top
executives are better incentivized they reduce CSR expenditures, implying the marginal
investment in CSR reduces firm value. The findings also indicate that firms respond to social
pressure by increasing CSR expenditures and social pressure negatively moderates the
positive relation between CSR rating and firm value. Furthermore, when top executives are
better incentivized and consequently reduce CSR expenditures, they reduce CSR
expenditures more strongly the greater the social pressure. These findings are consistent
with the theory that managers may commit to socially responsible behaviour to gain
stakeholder support, at the expense of shareholders. However, the findings indicate that
also in the absence of social pressure top executives reduce CSR expenditures as they are
better incentivized, consistent with (but no direct evidence of) that managers invest in
inefficient CSR because they like to give. Lastly, I find evidence that institutional
shareholders reduce CSR expenditures as their ownership in the firm increases, consistent
with that institutional shareholders in general actively monitor and reduce inefficient CSR
expenditures.
3
Chapter 1 – Introduction
According to Carroll (1979), CSR is defined as corporate integrated responsibilities
encompassing the economic, legal, ethical, and discretionary (or philanthropic) expectations
that the society has of organizations. The classical view in finance on firms takes a
shareholder value maximization view, meaning that firms are accountable only to their
value-maximizing shareholders and have no responsibility for the interests of other
stakeholders, including societal welfare (Friedman, 1970), since these would not increase or
would even decrease shareholder value. However, in reality more and more firms engage in
activities that are not directly linked to shareholder value maximization, such as engaging in
environmental friendly production, avoiding low cost child labour and organizing projects to
help the poor. All of these activities fall under the category of corporate social responsible
activities. In other words, corporate social responsibility is becoming more and more a
mainstream business activity (Kitzmueller & Shimshack 2012). This raises the question for
what drives the phenomenon of CSR.
Extending on the shareholder value maximization view, the view where firms are
accountable only to their shareholders, one of the two common explanations for why firms
invest in CSR is that CSR is simply the result of agency problems within the firm, which is
based on agency theory (e.g. Jensen & Meckling, 1976; Jensen, 1986). In the “traditional”
agency view based on the shareholder view, managers make non-value maximizing decisions
due to being selfish. This implies the incentive of managers to engage in CSR reflects the
poor incentives of managers in socially responsible firms. In other words, firms’ investments
in CSR are a waste of financial resources according to the agency view. Various studies find
evidence for that CSR is driven by agency problems (e.g. Cheng, Hong & Shue, 2014; Liang &
Renneboog, 2016; Benabou & Tirole, 2010; Krüger, 2015). For example, Krüger (2015) argues
that CSR is also part of the firm’s business activities because it benefits managers at the
expense of shareholders.
The other common explanation for why firms invest in CSR is because doing so
increases profitability. This is called the value-enhancing view. Studies that take a stance on
the value enhancing view of CSR generally argue that engaging in CSR leads to higher
profitability in return. There are various studies that show CSR activities may increase
profitability (e.g. Edmans, 2011; Dimson, Karakas & Li, 2015; Derwall et al., 2005; Servaes &

4
Tamayo, 2013; Dowell, Hart & Yeung, 2000). It is important to mention that some studies
argue the reverse; it is not that engaging in CSR leads to higher profitability, but firms that
have higher profitability engage more in CSR (e.g. Waddock & Graves, 1997).
The question that follows is through which mechanisms CSR may enhance firm value.
Mcwilliams and Siegel (2001) provide a general theoretical model on how CSR enhances firm
value through differentiation. They outline a model in which two firms sell identical goods,
except one firm adds an additional social attribute/feature to its product. This social
attribute/feature is valued by some stakeholders, which results in added benefits for the
firm. The benefits of product differentiation (through CSR) may be in the form of new
demand or the ability to ask a premium price. If these benefits offset the higher costs
associated with engaging in CSR, then CSR enhances firm value. Various studies examine
particular mechanisms more in-depth. For example, CSR may enhance firm value because
CSR activities can be valued by consumers, who are consequently willing to pay a premium
price for goods and services provided by socially responsible firms. Lev et al. (2010) show
that individual consumers are sensitive to a firm’s social activities, which suggests CSR affects
the purchase decision making process of the consumer. Other mechanisms through which
CSR may enhance firm value is that the firm may attract more talented employees,
employees are more productive and/or employees accept lower wages if the firm engages in
CSR (e.g. Turban & Greening, 1997) Furthermore, investors may value the firm’s social
activities and thus being socially responsible may increase the investor base which in turn
reduces cost of capital. For example, Hong and Kacperczyk (2009) argue that norm-
constrained investors may consciously decide not to invest in firms with low CSR, which
results in a higher equilibrium price for the shares of firms with high CSR due to higher
demand. This may be an incentive for firms to increase their CSR in order to attract these
norm-constrained investors, which in turn may enhance firm value by lowering the cost of
capital through increasing the investor base. Overall, these mechanisms suggest that
maximizing stakeholder value may be in line with maximizing shareholder value
(stakeholders are generally considered to be the shareholders, customers, employees,
suppliers and the local community).
In the shareholder value maximization view managers may engage in CSR if doing so
is expected to yield a positive net present value (NPV), which in turn is received positively by
shareholders. However, reality is more complex. In reality many firms are required by the

5
law to take into account the interests of other stakeholders. According to Williams and
Aguilera (2008), laws set standards (norms) that influence expectations of society regarding
corporate social responsibility, and these expectations act as a focal point around which
firms structure their behaviour (McAdams & Nadler, 2005), besides sanction. Williams and
Aguilera (2008) further argue that the incentive for firms to engage in CSR is dependent on
the strength of various forces, such as community and consumer demands. Aguilera et al.
(2007) provide a theoretical model of the determinants of CSR and show how a firm’s CSR
expenditures can be influenced by, among others, governments (through law enforcement)
and non-governmental organizations/activists fuelled by communities (through boycotts,
campaigns, dialogues). Various studies have found empirical evidence that external factors,
such as regulation/law (e.g. Liang & Renneboog, 2016) and social activism (Dyck & Zingales,
2002), affect a firm’s decisions about CSR participation. For example, Liang and Renneboog
(2016) show that firms in countries with a legal origin that is more rule-driven (civil law) are
associated with higher CSR ratings compared to firms in countries with common law ,
indicating legislation affects choices for CSR investment. Dyck and Zingales (2002) provide
empirical and anecdotal evidence on that social activists use the media to influence
corporate policies including a firm’s social activities.
Overall, previous studies show that in reality CSR expenditures are likely partly driven
by agency problems and also are the result of a trade-off between shareholder demands and
other stakeholder demands. The existing empirical literature on the two views of CSR yields
mixed evidence for the effect of CSR on firm value, but does tilt towards a small positive
relation (e.g. Margolis, Elfenbein & Walsh, 2007; Orlitzky et al., 2003).
The current studies done on the relation between managers and CSR are limited in
that they only researched whether or not agency problems are present and/or whether or
not CSR contributes to firm value. In this study I examine whether or not managers of firms
overinvest in CSR and whether or not this is due to altruism (managers like to give) or social
pressure (managers give because they are rewarded if they give or punished if they do not
give). The idea is mainly based on Dellavigna, List and Malmendier (2012), who find evidence
for that individuals donate to charity due to both social pressure and altruism. I also
investigate the influence of institutional owners on the CSR activities of the firm as their role
with regards to CSR is not quite clear. As Cheng, Hong and Shue (2014) mention, it is
important to investigate further whether or not potential agency problems with regards to

6
CSR are driven by social pressure or driven by purer altruistic motives. The reason for the
focus on managers and institutional investors is that these two actors have significant
influence on the firm’s business activities and thus likely on CSR activities as well.
Using the MSCI ESG KLD STATS dataset to measure the firm’s CSR rating and social
pressure (in combination with data from various other datasets), I find evidence indicating
that, all else equal, when top executives are better incentivized they reduce CSR
expenditures, which implies that the marginal dollar invested in CSR reduces firm value.
Furthermore, when top executives are better incentivized and consequently reduce CSR
expenditures, they reduce CSR expenditures more strongly the greater the social pressure.
However, the results indicate executives also reduce CSR expenditures when they are better
incentivized and not under social pressure, consistent with that executives invest in
inefficient CSR activities because they like to give. Overall, the evidence indicates that using
mechanisms that should better align the interests of managers with the interests of
shareholders results in lower CSR expenditures by management. This suggests that firms
with less agency problems (i.e. better incentivized management) have more profitable CSR
activities. Furthermore, I find evidence that, all else equal, institutional shareholders reduce
CSR expenditures as their holdings of common stock in the firm increases, reinforcing the
finding that the marginal investment in CSR is reducing firm value and this finding is
consistent with the theory that institutional shareholders in general actively monitor and
reduce inefficient (CSR) expenditures.

7
Chapter 2 – Literature, theoretical framework and hypotheses
The central question in this study is how managers and institutional investors affect
the CSR activities of the firm. In this study I adopt the theory that the relation between CSR
expenditures of a firm and firm value is non-monotonic and concave. In other words,
increasing CSR expenditures contributes to firm value maximization up to a certain point and
beyond that optimal point, investing a unit more in CSR decreases firm value. This theory of
why there is a concave relation between CSR and firm value, meaning high CSR expenditures
do not necessarily enhance firm value, is that the managers of the firm may prefer to
overinvest in CSR, which would decrease firm value. Relatively low expenditures on CSR may
contribute to firm value, for reasons discussed in Chapter 1. As discussed, CSR expenditures
may contribute to firm performance if social activities are valued by stakeholders and/or
prevent legal & social sanctions. Overall, the theory that there exists a concave relationship
between CSR expenditures and firm value is not contradicting the findings that CSR generally
enhances firm value and may contribute to explaining what drives CSR.
In this study, I test this theory by mainly studying the relation between
managerial/institutional incentives and the social expenditures of the firm. In other words, I
test whether or not CSR is at least partially driven by agency problems and investigate the
role is of institutional owners in CSR. I will now discuss how managers and institutional
investors likely affect the CSR activities of the firm and provide accompanying hypotheses. In
Table 1 in chapter 3 I provide a summary of the predicted relationships based on the
hypotheses.
2.1 - Managers
Agency theory (e.g. Jensen & Meckling 1976) argues that managers’ interests are not
necessarily in line with the interests of other shareholders. Various studies find that agency
problems can manifest themselves through non-value-maximizing investment choices (e.g.
Shleifer & Vishny, 1989; Shleifer & Vishny, 2000). CSR expenditures are considered a form of
investment (e.g. McWilliams and Siegel, 2001). Agency problems in the context of CSR is best
described as managers having an incentive to invest in CSR that does not benefit
shareholders due to different preferences, which becomes possible due to the separation of
ownership and control in combination with incomplete contracts. These incentives for

8
managers to overinvest can be driven by altruism such as warm-glow, as described by
Andreoni (1989, 1990), or perhaps a fairness motivation (e.g. Fehr & Schmidt, 1999). Warm-
glow theory (Andreoni 1989, 1990) states that people receive utility from the act of giving in
the form of a good feeling. Empirical evidence supports this. For example, Videras and Owen
(2006) show that individuals who contribute to the public good of environmental protection
report higher levels of life satisfaction and happiness which can be attributed to the warm-
glow effect. However, I argue incentives for managers to overinvest in CSR can also be driven
by social pressure (e.g. Dellavigna, List & Malmendier, 2012), which is discussed in more
detail later. Overall, managers may invest more in CSR than the amount that maximizes firm
value due to altruistic motives and/or social pressure.
According to the agency view, the incentive of managers to engage in CSR reflects the
poor incentives of managers at socially responsible firms. This implies that firms where
managerial incentives are more aligned with shareholder value maximization have less
agency problems. Generally, if CSR is driven by agency problems, then managers who have
their interests more aligned with shareholder value maximization should invest less in CSR.
Demsetz (1983) and Fama and Jensen (1983) argue that with high management ownership
comes entrenchment, as more ownership gives managers more power to do as they please.
However, as shareholders obtain more and more ownership of the firm, they also bear more
and more costs with regards to activities that decrease firm value, such as overinvestments
in CSR. This idea is based on Jensen and Meckling (1976), who claim that management
deviates less from value-maximization as management ownership rises. According to Morck,
Shleifer and Vishny (1988), the relation between management ownership and Tobin’s Q is
negative in the 5% to 25% ownership range. The relation between management ownership
and Tobin’s Q is positive for management ownership smaller than 5% and larger than 25%.
The authors argue that the incentive for managers to maximize firm value is outweighed by
the entrenchment effect in the 5-25% ownership range, meaning that managers make non-
value maximizing investment choices when they have between 5% and 25% of stock
ownership. They further argue that below 5% and beyond 25% ownership, the incentive for
managers to maximize firm value outweighs the entrenchment effect, as an increase in
managerial ownership increases firm value. The authors mention that between 0% and 5%
management ownership, the positive relation between management ownership and Tobin’s
Q might be explained by the presence of firms with a lot of intangible assets, for which

9
Tobin’s Q is high, who might require greater management ownership due to ensure proper
management. This is further discussed by Demsetz and Lehn (1985). Overall, these findings
provide evidence for the presence of agency problems within firms and also provide
evidence for that managers their interest converge to the interests of shareholders as their
ownership in the firm rises. However, Himmelberg, Hubbard and Palia (1999) argue the
significant relationship between firm value (Tobin’s Q) and managerial ownership as found
by Morck, Schleifer and Vishny (1988) is flawed due to omitted variable bias and find no
relationship between firm value and managerial ownership themselves after controlling for
various effects, but acknowledge this is not evidence that managerial ownership does not
mitigate agency problems. In this study I do take the standpoint that increases in managerial
ownership increases managers’ incentive to maximize firm value.
Following up on the above, if managers are entrenched and do make non-value
maximizing CSR investments, then it follows that the more firm ownership the manager has,
the less he/she should be willing to overinvest in corporate social responsible activities and
the more incentive he/she has to invest in CSR such that it contributes to firm value. Thus,
when a manager chooses to reduce CSR expenditures as his/her ownership in the firm
increases, it shows that a unit increase in CSR expenditures driven by this manager decreases
firm value, which implies the manager overinvests in CSR.
Furthermore, according to agency theory, managers that are compensated based on
their performance should act more in line with interests of the shareholders, because
shareholder returns are generally based on firm performance. In other words, pay-for-
performance brings the utility function of the manager closer to the utility function of the
shareholder. As Masulis, Wang and Xie (2009) state; weak pay-for-performance is widely
regarded as a major form of incentive misalignment between managers and shareholders
and indicates bad governance. Overall, all else equal, the manager who is paid for
performance bears more of the costs associated with non-value maximizing investments
compared to the manager that is not paid for performance. Thus, if managers tend to
overinvest in CSR due to agency problems, it follows that the more and more the manager’s
compensation is tied to firm performance, the less he/she should be willing to overinvest in
corporate social activities and the more incentive he/she has to invest in CSR such that it
contributes to firm value. This negative relation between pay-for-performance and CSR
would indicate that a unit increase in CSR expenditures driven by this manager decreases

10
firm value, which implies the manager overinvests in CSR.
Based on above discussion, I hypothesize:
Hypothesis 1a: Managerial ownership of a firm is negatively related to the CSR rating.
Hypothesis 1b: Managerial pay-for-performance is negatively related to the CSR rating.
If Hypothesis 1a and Hypothesis 1b have the predicted beta coefficient sign, it implies
managers overinvest in CSR. If so, I investigate further whether or not managers invest in
CSR (at the expense of shareholders) due to social pressure and/or altruism. This is relevant,
because the literature suggests individuals may overinvest due to altruism and/or social
pressure. Altruism as considered in this study means that individuals derive utility from
enhancing societal welfare (Andreoni 1989, 1990), which may be in the form of a good
feeling (warm-glow effect) and/or because of a fairness motivation (e.g. Fehr & Schmidt,
1999). Such altruism implies individuals like to give and do not have to be rewarded by
others. On the other hand, social pressure means that individuals do not like to give but
giving is rewarded or prevents disutility and therefore individuals do give (see Dellavigna, List
& Malmendier, 2012). Thus, social pressure implies giving is driven by the expectations of
others. In a business context, utility from social pressure may incur if the stakeholders
reward the firm/manager for complying with their demands and disutility may incur when
the stakeholders punish the firm/manager for not complying with their demands.
Possibilities of how stakeholders can reward or punish the firm for their CSR have been
discussed in the introduction. However, stakeholders may also privately reward or punish
managers, which in turn may cause managers to respond to social pressure by investing in
inefficient CSR activities. I will discuss these motives in further detail later. All in all, I theorize
and test the theory that managers may invest in CSR due to both altruism and social
pressure, and do so at the expense of the shareholders. Shareholders are in this study
assumed to be focused on risk/return, although I do examine shareholder preferences
regarding CSR.
First, if managers receive warm-glow effects from giving and/or have a fairness
motivation, they may engage in inefficient CSR activities as long as the positive utility from
doing so outweighs the negative utility from reducing firm value. The literature supports the
possibility that individuals like to give for reasons other than enhancing or protecting their
reputation. Videras and Owen (2006) show that individuals who contribute to the public

11
good of environmental protection report higher levels of life satisfaction and happiness
which can be attributed to the warm-glow effect. Cyert & March (1963) argue that managers
bring personal values and beliefs into a firm, suggesting managers may act on warm-glow
and fairness motivation. If managers overinvest in CSR at least partially due to altruism, then
managers should invest in CSR in the absence of social pressure and should reduce these
investments as they bear more of the costs of inefficient investments. If this is true then, in
the absence of social pressure, the relation between managerial ownership/incentives and
CSR should be negative. This would show that the manager invests in inefficient CSR for
reasons other than social pressure, indicating that the marginal investment in CSR which is
unrelated to social pressure, is decreasing firm value. I hypothesize:
Hypothesis 2a: Managerial ownership is negatively related to the CSR rating in the absence
of social pressure.
Hypothesis 2b: Managerial pay-for-performance is negatively related to the CSR rating in the
absence of social pressure.
Second, if stakeholders who exercise pressure on the firms are able to reward/punish
managers beyond rewarding/punishing the firm or at the cost of the firm, then social
pressure may lead to inefficient CSR expenditures by managers. For example, Cespa and
Cestone (2007) provide a theoretical model where inefficient managers may commit to
socially responsible behaviour to gain stakeholder support, and mention this is especially
true when political lobbying, social activism and media campaigns have the power to
promote/disgrace top executives of large firms. In other words, according to this study
inefficient managers may invest in (costly) CSR to enhance/protect their reputation with
regards to stakeholders other than shareholders, as a means to entrench themselves (i.e.
making themselves more costly to replace by shareholders of the firm). Overall, if
stakeholders can reward (punish) managers personally for complying (not complying) with
their demands, then managers should be sensitive to social pressure by increasing CSR
activities. Furthermore, if managers respond to social pressure by overinvesting in CSR
activities, then social pressure should also at least negatively moderate the relationship
between CSR and firm value. This would be consistent with that managers invest in
stakeholder relationships to protect their reputation, at the expense of the shareholders. I
hypothesize:

12
Hypothesis 3a: Social pressure is positively related to the CSR rating.
Hypothesis 3b: The relationship between CSR rating and Tobin’s Q is negatively moderated
by social pressure.
2.2 - Institutional shareholders
An institutional investor is a nonbank person or organization that trades securities in
large quantities. There is currently mixed evidence on whether or not institutional investors
affect a firm’s CSR activities. The agency theory (e.g. Jensen & Meckling, 1976) argues
institutional shareholders have an incentive to monitor corporate decision-making due to
the size of their investments. This is because investments made by institutions are generally
larger than investments made by other investors. As a result, it is more costly for
institutional investors to change investments, making their investments less liquid (e.g.
Pound, 1992). Consequently, large investors should be more likely to use their power to
influence organizational decisions rather than sell their investments in the firm. This idea is
supported by for example Hill and Snell (1989), who find empirical evidence for that
powerful owners constrain managers' freedom to pursue certain strategies, suggesting that
large investors actively monitor management. In contrast, various studies find evidence that
large shareholders do not discipline management (e.g. Franks, Mayer & Renneboog, 2001).
Franks, Mayer and Renneboog (2001) further argue some large shareholders such as insiders
may even hinder the disciplining of management.
I acknowledge that different institutional investors may have conflicting interests
with regards to CSR. However, if institutional shareholders in general actively monitor
management to reduce inefficient expenditures and if the marginal investment in CSR is
reducing firm value, then institutional ownership should be negatively related to the firm’s
CSR rating. This would indicate that institutional investors actively monitor the management
with regards to CSR and that the marginal investment in CSR is reducing firm value. I
hypothesize:
Hypothesis 4: The relationship between institutional ownership and the firm’s CSR rating is
negative.

13
Chapter 3 – Method
3.1 - Data sources
The data used in this study comes from various datasets available on WRDS. The
various datasets are merged using identifier codes (CUSIP whenever possible, else GVKEY) in
order to create a single dataset, which is then used to conduct the empirical analysis. Table 2
provides an overview of the variables used in this study and the source of these variables. In
this study I take a cross-sectional approach (i.e. I use data from one-specific year for each
variable). The main reason for doing so is that the number of strengths/concerns the firms
have been scored on have changed over the years, which makes the comparison of CSR
ratings across different years prone to errors. Furthermore, I focus only on data regarding
public firms in the United States, as this prevents the possibility of omitting relevant country-
specific variables which may lead to biased regression results.
3.2 - CSR rating & social pressure
The data on CSR comes from the MSCI ESG KLD STATS dataset. This dataset was
initially created by KLD Research & Analytics, Inc. (KLD) in 1991. MSCI was acquired by KLD in
2010. The MSCI ESG KLD STATS is an annual dataset of positive and negative environmental,
social and governance (ESG) performance indicators of publicly traded companies. The data
ranges from the year 1991 to 2014. MSCI ESG KLD STATS provides scores on the following
seven qualitative components of CSR; environment, community, human rights, employee
relations, diversity, product, and governance. Environmental related issues include for
example natural resource use and waste management, community related issues include
community engagement and negative impact, human rights related issues include for
example support for controversial regimes and human rights violations, employee relations
related issues include for example employee health & safety programs and union relations,
diversity related issues include for example gender diversity within the workforce, product
related issues include for example product safety, and governance related issues include for
example corruption and fraud.
The ESG performance indicators are scored using a binary model; if a firm meets the
assessment criteria then the firm receives a score of “1”. If the firm does not meet the
assessment criteria then the firm receives a score of “0”. Firms are scored on a number of

14
strengths and concerns within a component, meaning a score of “1” on a strength related
issue is a positive indicator of the firm’s CSR, while a score of “1” on a concern related issue
is a negative indicator. Firms that have not been assessed with regards to a particular
performance indicator receive a “NR” score. Lastly, the dataset also provides scores on
concerns regarding controversial business. Controversial businesses activities include
activities related to tobacco, alcohol, firearms, gambling, military and nuclear power. The
firm receives a binary score on each individual controversial business activity, with a “1”
indicating if the firm is involved in the particular controversial business, and a “0” otherwise.
Involvement in controversial business activities in included as a control variable in the
model.
In this study, the CSR rating of a firm for an individual component of CSR (such as
“environment”) is determined by adding up the number of strengths regarding the particular
CSR component. The total CSR rating of the firm is the sum of strengths of all the individual
CSR components combined. In a similar fashion, the concerns measure the degree of social
pressure. The proxy I use to measure social pressure is a variable measuring the total
number of concerns regarding social activities of the firm, which is similar to how Baron et
al. (2011) measure social pressure. According to Baron et al. (2011), some concerns measure
social pressure directly (such as the score on the concern ‘Community Other Concern’
reflecting strong community opposition), whereas other concerns measure social pressure
indirectly in the sense that these firm concerns harm the stakeholders which leads to
opposition from these stakeholders or because activists identify such concerns and take
action towards the firm (for example the score on the concern indicating production of
ozone depleting chemicals). It is important to note that corporate governance strengths and
concerns are ignored in this study, following Servaes & Tamayo (2013). The reason being is
that in this study CSR is considered as the engagement in social objectives and stakeholders
other than the shareholders. Corporate governance strengths and concerns in the MSCI ESG
KLD STATS dataset mainly deal with shareholder/investor related issues.
The data on CSR ratings and social pressure is based on the years 2008 and 2009. The
reason being these are the two most recent years prior to the introduction of the industry-
based key issue ratings model, causing firms in different industries to be assessed on a
different number of strengths/concerns related to CSR, making it more difficult to compare
CSR ratings across industries. In the year 2008 and 2009, all firms in all industries were still
15
assessed on the same number of strengths and concerns. This year also contains only data
with regards to U.S. public firms.
It is important to mention that in this study the CSR rating of the firm is used as a
proxy for CSR expenditures, since the actual CSR expenditures of a firm are not observable.
This implies that I assume higher CSR ratings reflect higher CSR expenditures and vice versa.
3.3 - Predictor variables of interest
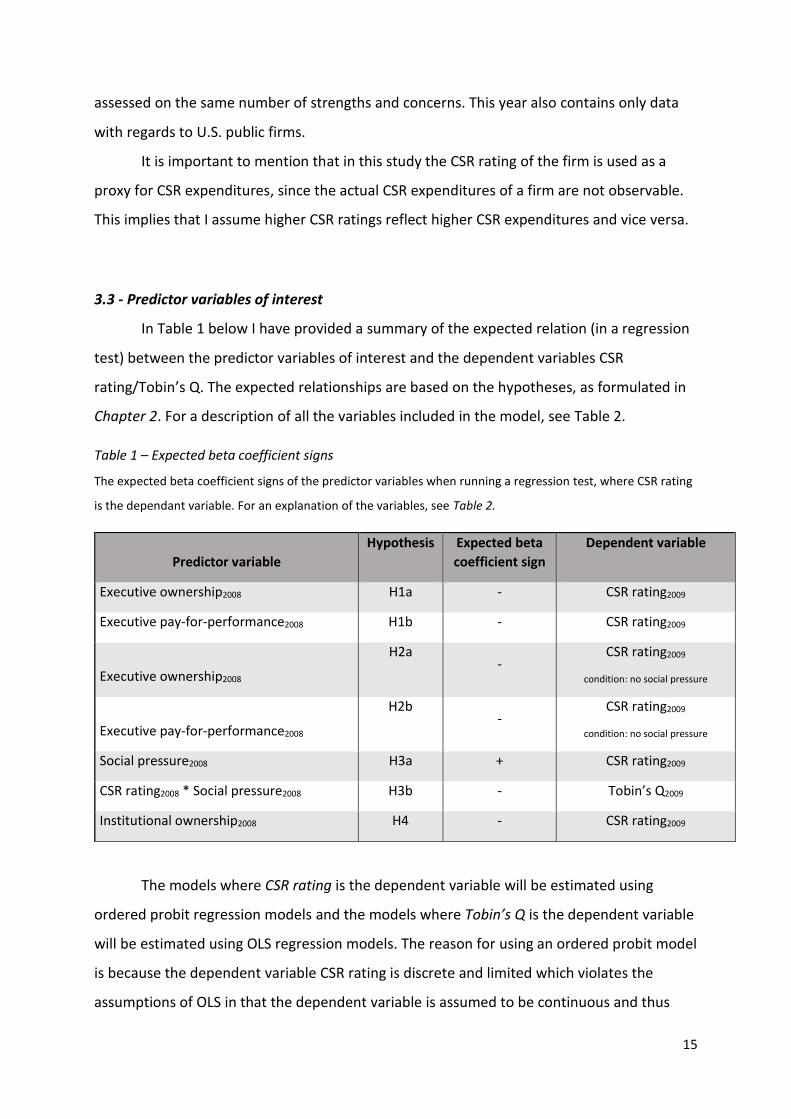
In Table 1 below I have provided a summary of the expected relation (in a regression
test) between the predictor variables of interest and the dependent variables CSR
rating/Tobin’s Q. The expected relationships are based on the hypotheses, as formulated in
Chapter 2. For a description of all the variables included in the model, see Table 2.
Table 1 – Expected beta coefficient signs
The expected beta coefficient signs of the predictor variables when running a regression test, where CSR rating
is the dependant variable. For an explanation of the variables, see Table 2.
Predictor variable
Hypothesis Expected beta
coefficient sign
Dependent variable
Executive ownership2008 H1a - CSR rating2009
Executive pay-for-performance2008 H1b - CSR rating2009
Executive ownership2008
H2a -
CSR rating2009
condition: no social pressure
Executive pay-for-performance2008
H2b -
CSR rating2009
condition: no social pressure
Social pressure2008 H3a + CSR rating2009
CSR rating2008 * Social pressure2008 H3b - Tobin’s Q2009
Institutional ownership2008 H4 - CSR rating2009
The models where CSR rating is the dependent variable will be estimated using
ordered probit regression models and the models where Tobin’s Q is the dependent variable
will be estimated using OLS regression models. The reason for using an ordered probit model
is because the dependent variable CSR rating is discrete and limited which violates the
assumptions of OLS in that the dependent variable is assumed to be continuous and thus

16
using OLS may lead to biased estimates.
It is important to mention that all independent predictor variables are lagged by one
year. In other words, the predictor variables are from the year 2008, whereas the dependent
variable is from the year 2009. The reason for doing so is to reduce potential simultaneity
problems or reverse causality problems and the presence of these problems may lead to
biased regression estimates.
3.4 - Control variables
I include a variety of variables to control for firm- and industry-specific effects. As for
firm-specific effects, Tobin’s Q is included as an independent variable (if not used as a
dependent variable) to capture profitability of the firm. Return On Assets (ROA) is also
included to control for the firm’s profitability. I use ROA, because Waddock and Graves
(1997) find that ROA has the strongest relation with CSR, compared to Return On Equity
(ROE) and Return On Sales (ROS). Leverage is included to control for capital structure effects
besides being an alternative proxy to indicate whether or not CSR is driven by agency
problems, as higher leverage in theory pre-commits management more strongly to maximize
shareholder value. I include firm age as a control variable, because previous research shows
that firm age may be related to the firm’s CSR activities (e.g. Cochran & Wood, 1984). The
authors find that older firms have lower CSR ratings and argue this may be due to older firms
having constructed plants in a period when there were fewer regulations and/or older firms
may be less flexible in adapting to changes with regards to corporate social activities. Firm
size is included as a control variable, because large firms are likely to spend more on CSR due
to e.g. size of investments and visibility to outsiders. Firm risk is measured by the standard
deviation of the returns and included in the model because various studies argue and find
evidence that investors perceive socially irresponsible firms as being more risky (e.g.
Frederick, 1995) and thus firm risk may affect the relation between CSR and ownership
characteristics.
I use two different types of measures to capture industry-specific effects. The first
measure mainly follows Baron et al. (2011), who divide their sample in consumer oriented
firms (B2C) and business oriented firms (B2B) and also control for competitiveness of the
industry, based on Fama & French 48 industry classifications. I include a dummy for whether

17
the firms operates in a business-to-consumer (B2C) or business-to-business (B2B) market.
Firms in the following industries are classified as operating in a B2C market, similar to the
classification of Baron et al. (2011): food products, candy and soda, alcoholic beverages,
tobacco products, recreational products, entertainment, printing and publishing, consumer
goods, apparel, healthcare, miscellaneous, automobiles and trucks, telecommunications,
personal services, computers, business supplies, retail, restaurants, hotels, motels, banking,
insurance. In a B2C industry, firms have individual consumers as their primary customers,
whereas in a business-to-business (B2B) industry, firms have other firms as their primary
customers. According to Lev et al. (2010), individual consumers are more sensitive to a firm’s
social activities, compared to industrial buyers whose purchasing decision-making process is
strongly formalized and subject to cost/value analysis. Competitiveness of the firm is
measured by the sales-based industry HHI. For my first measure I also include a third
industry variable, which is based on Servaes & Tamayo (2013). This third industry variable is
the median industry advertising intensity (=advertising expenses / sales), again based on the
Fama & French 48 industry classifications. Servaes & Tamayo (2013) find a strong correlation
between advertising and firm value and also find that advertising positively moderates the
relationship between CSR and firm value. The second measure is similar to Kotchen & Moon
(2012), who classify firms based on 4-digit SIC codes into various categories and include
dummies for each (except one) category in regression analysis. Table 4 provides an overview
of the industry classifications.
All independent variables are lagged by one year, same as the predictor variables of
interest. The reason for doing so is that various studies find that financial performance
influences future CSR activities (e.g. Waddock & Graves, 1997). This idea is based on slack-
resources theory, which states that financially successful companies have more resources to
spend on CSR and therefore spend more on CSR which results in higher CSR ratings. Lagging
the variables also reduces potential simultaneity problems or reverse causality problems.
3.5 - Robustness tests
I take various measures to check for robustness of the results. First, as mentioned
earlier, I lag the independent variables to reduce simultaneity and reverse causality
problems. As for the OLS regressions I test the assumptions of the model. The results of the

18
assumption tests are provided in Appendix B and Appendix C. Furthermore, I estimate
multiple models for the same hypothesis, to check if the results hold under different
circumstances. I also use multiple variables that intend to measure the same construct for
some of the variables. More specifically, I measure managerial incentives using two
measures; one measure is executive common stock ownership and the second measure is
executive excess pay. Furthermore, I use two different types of controls for industry; the first
type consists of three separate industry variables, constructed based on Fama & French 48
industry classifications, and the second type consists of dummies based on the industry
classifications of Kotchen & Moon (2012), for which I have provided an overview in Table 4.
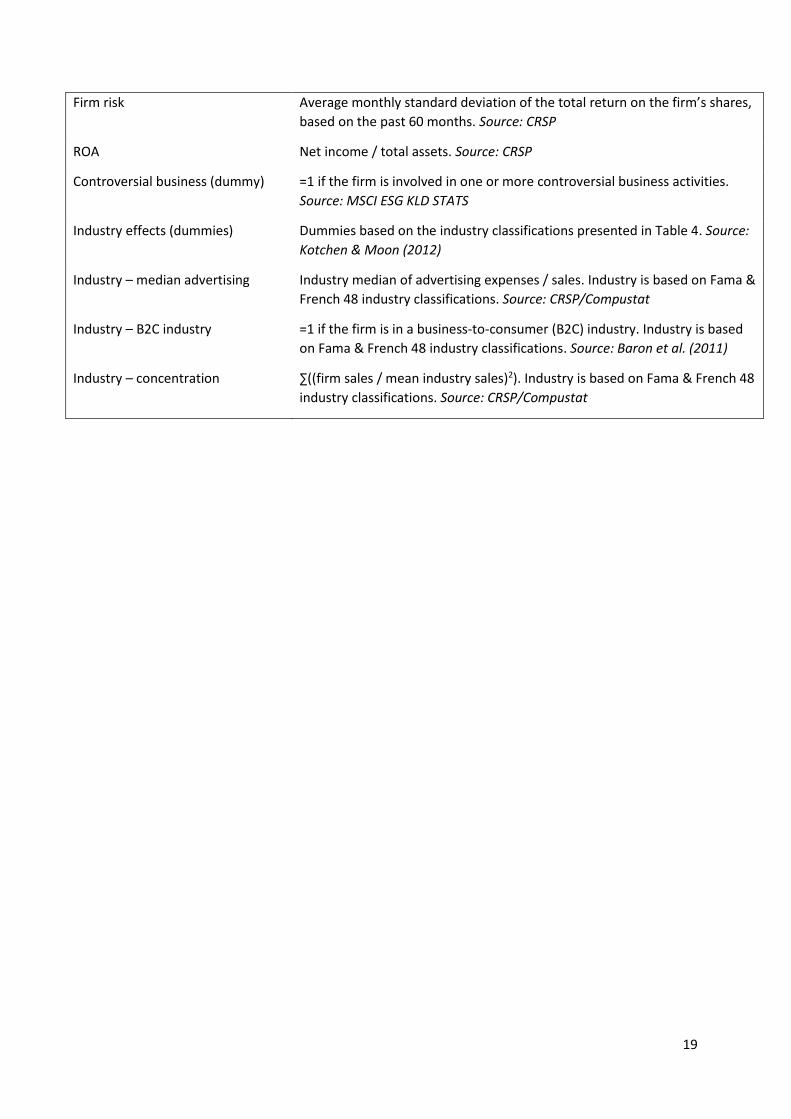
Table 2 – Variable descriptions
Variable Variable description
Dependent variables:
CSR rating
Sum of strengths across the following CSR components; environment,
community, human rights, employee relations, diversity and product.
Source: MSCI ESG KLD STATS
Tobin’s Q (shares outstanding * price per share + book value of debt) / book value of
assets. Source: CRSP/Compustat.
Predictor variables of interest:
Common stock – top 5 executives Percentage of common stock ownership of the top 5 executives. Top 5 is
based on highest compensation and always includes the CEO if the CEO did
not leave before the end of 2009. Source: Execucomp
Excess pay – top 5 executives
Predicted residual when regressing top 5 executive compensation (log) on
Tobin’s Q, ROA and Total assets (log). Source: Execucomp
Social pressure Sum of concerns across the following CSR components; environment,
community, human rights, employee relations, diversity and product.
Source: MSCI ESG KLD STATS
Common stock – institutions Percentage of common stock ownership of the institutional block holders.
Source: Thomson Reuters
Control variables:
Leverage (Short-term debt + long-term debt) / total assets. Source: Compustat
Firm size Natural logarithm of the firm’s total assets. Source: Compustat
Firm age Natural logarithm of the firm’s age in years. Source: CRSP
19
Firm risk Average monthly standard deviation of the total return on the firm’s shares,
based on the past 60 months. Source: CRSP
ROA Net income / total assets. Source: CRSP
Controversial business (dummy) =1 if the firm is involved in one or more controversial business activities.
Source: MSCI ESG KLD STATS
Industry effects (dummies) Dummies based on the industry classifications presented in Table 4. Source:
Kotchen & Moon (2012)
Industry – median advertising Industry median of advertising expenses / sales. Industry is based on Fama &
French 48 industry classifications. Source: CRSP/Compustat
Industry – B2C industry =1 if the firm is in a business-to-consumer (B2C) industry. Industry is based
on Fama & French 48 industry classifications. Source: Baron et al. (2011)
Industry – concentration ∑((firm sales / mean industry sales)2). Industry is based on Fama & French 48
industry classifications. Source: CRSP/Compustat
20
Chapter 4 – Empirical analysis
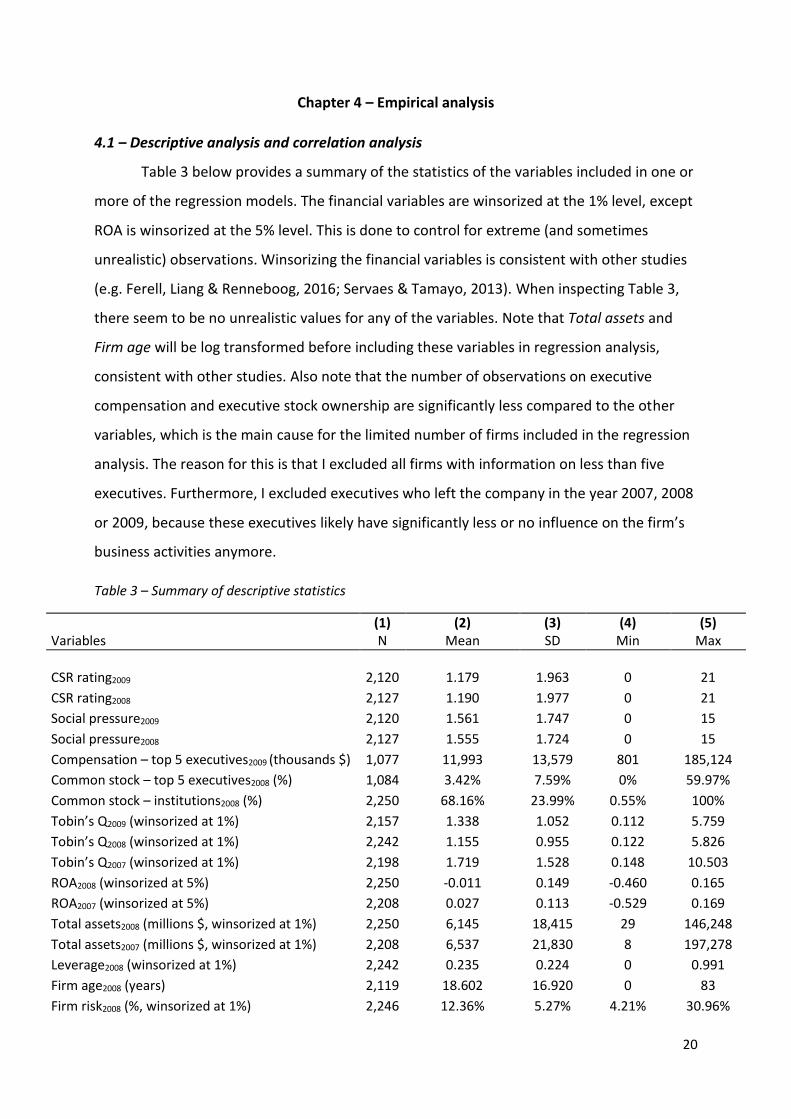
4.1 – Descriptive analysis and correlation analysis
Table 3 below provides a summary of the statistics of the variables included in one or
more of the regression models. The financial variables are winsorized at the 1% level, except
ROA is winsorized at the 5% level. This is done to control for extreme (and sometimes
unrealistic) observations. Winsorizing the financial variables is consistent with other studies
(e.g. Ferell, Liang & Renneboog, 2016; Servaes & Tamayo, 2013). When inspecting Table 3,
there seem to be no unrealistic values for any of the variables. Note that Total assets and
Firm age will be log transformed before including these variables in regression analysis,
consistent with other studies. Also note that the number of observations on executive
compensation and executive stock ownership are significantly less compared to the other
variables, which is the main cause for the limited number of firms included in the regression
analysis. The reason for this is that I excluded all firms with information on less than five
executives. Furthermore, I excluded executives who left the company in the year 2007, 2008
or 2009, because these executives likely have significantly less or no influence on the firm’s
business activities anymore.
Table 3 – Summary of descriptive statistics
(1) (2) (3) (4) (5) Variables N Mean SD Min Max
CSR rating2009 2,120 1.179 1.963 0 21
CSR rating2008 2,127 1.190 1.977 0 21
Social pressure2009 2,120 1.561 1.747 0 15
Social pressure2008 2,127 1.555 1.724 0 15
Compensation – top 5 executives2009 (thousands $) 1,077 11,993 13,579 801 185,124
Common stock – top 5 executives2008 (%) 1,084 3.42% 7.59% 0% 59.97%
Common stock – institutions2008 (%) 2,250 68.16% 23.99% 0.55% 100%
Tobin’s Q2009 (winsorized at 1%) 2,157 1.338 1.052 0.112 5.759
Tobin’s Q2008 (winsorized at 1%) 2,242 1.155 0.955 0.122 5.826
Tobin’s Q2007 (winsorized at 1%) 2,198 1.719 1.528 0.148 10.503
ROA2008 (winsorized at 5%) 2,250 -0.011 0.149 -0.460 0.165
ROA2007 (winsorized at 5%) 2,208 0.027 0.113 -0.529 0.169
Total assets2008 (millions $, winsorized at 1%) 2,250 6,145 18,415 29 146,248
Total assets2007 (millions $, winsorized at 1%) 2,208 6,537 21,830 8 197,278
Leverage2008 (winsorized at 1%) 2,242 0.235 0.224 0 0.991
Firm age2008 (years) 2,119 18.602 16.920 0 83
Firm risk2008 (%, winsorized at 1%) 2,246 12.36% 5.27% 4.21% 30.96%
21
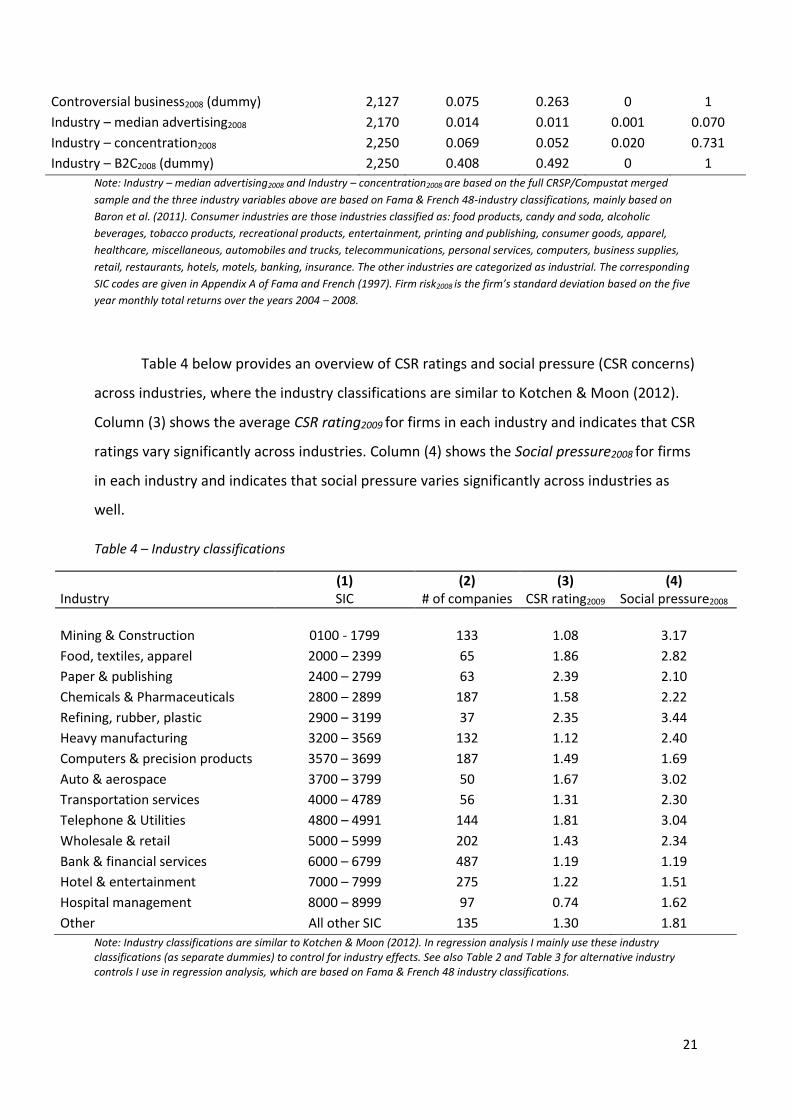
Controversial business2008 (dummy) 2,127 0.075 0.263 0 1
Industry – median advertising2008 2,170 0.014 0.011 0.001 0.070
Industry – concentration2008 2,250 0.069 0.052 0.020 0.731
Industry – B2C2008 (dummy) 2,250 0.408 0.492 0 1
Note: Industry – median advertising2008 and Industry – concentration2008 are based on the full CRSP/Compustat merged
sample and the three industry variables above are based on Fama & French 48-industry classifications, mainly based on
Baron et al. (2011). Consumer industries are those industries classified as: food products, candy and soda, alcoholic
beverages, tobacco products, recreational products, entertainment, printing and publishing, consumer goods, apparel,
healthcare, miscellaneous, automobiles and trucks, telecommunications, personal services, computers, business supplies,
retail, restaurants, hotels, motels, banking, insurance. The other industries are categorized as industrial. The corresponding
SIC codes are given in Appendix A of Fama and French (1997). Firm risk2008 is the firm’s standard deviation based on the five
year monthly total returns over the years 2004 – 2008.
Table 4 below provides an overview of CSR ratings and social pressure (CSR concerns)
across industries, where the industry classifications are similar to Kotchen & Moon (2012).
Column (3) shows the average CSR rating2009 for firms in each industry and indicates that CSR
ratings vary significantly across industries. Column (4) shows the Social pressure2008 for firms
in each industry and indicates that social pressure varies significantly across industries as
well.
Table 4 – Industry classifications
(1) (2) (3) (4) Industry SIC # of companies CSR rating2009 Social pressure2008
Mining & Construction 0100 - 1799 133 1.08 3.17
Food, textiles, apparel 2000 – 2399 65 1.86 2.82
Paper & publishing 2400 – 2799 63 2.39 2.10
Chemicals & Pharmaceuticals 2800 – 2899 187 1.58 2.22
Refining, rubber, plastic 2900 – 3199 37 2.35 3.44
Heavy manufacturing 3200 – 3569 132 1.12 2.40
Computers & precision products 3570 – 3699 187 1.49 1.69
Auto & aerospace 3700 – 3799 50 1.67 3.02
Transportation services 4000 – 4789 56 1.31 2.30
Telephone & Utilities 4800 – 4991 144 1.81 3.04
Wholesale & retail 5000 – 5999 202 1.43 2.34
Bank & financial services 6000 – 6799 487 1.19 1.19
Hotel & entertainment 7000 – 7999 275 1.22 1.51
Hospital management 8000 – 8999 97 0.74 1.62
Other All other SIC 135 1.30 1.81
Note: Industry classifications are similar to Kotchen & Moon (2012). In regression analysis I mainly use these industry classifications (as separate dummies) to control for industry effects. See also Table 2 and Table 3 for alternative industry controls I use in regression analysis, which are based on Fama & French 48 industry classifications.

22
Table 5 below provides the results of a correlation analysis of the key variables of this
study. Overall, the variables have the expected signs and significance with regards to
correlation with other variables, suggesting that the variables are good measures for what
they intend to measure. I will now discuss the results of the correlation analysis.
Table 5 – Correlation analysis of key variables
Common stock Common stock Excess pay Variables CSR rating Social pressure top 5 executives institutions top 5 executives Tobin’s Q
CSR rating 1
Social pressure 0.39** 1
Common stock – top 5 executives -0.14** -0.06** 1
Common stock – institutions 0.06** 0.06** -0.25** 1
Excess pay – top 5 executives -0.01 0.02 -0.04 0.27** 1
Tobin’s Q -0.005 -0.05** 0.07** 0.05** 0.04 1
Note: ** indicates significance at the 5% level. CSR rating and Tobin’s Q are based on 2009 data, the other variables are
based on 2008 data. Excess pay – top 5 executives is the predicted residual of the 1st stage regression in Table 7a.
The negative correlation between executive stock ownership and CSR rating suggests
that firms have lower CSR ratings when ownership by executives is high. The positive
correlation between executive stock ownership and Tobin’s Q suggests that firms with
higher executive ownership are more profitable, consistent with agency theory predicting
that managers have more incentives to maximize firm value as their ownership in the firm
increases. These correlations are consistent with hypothesis 1a/2a, which predict a negative
relationship between executive ownership and CSR ratings.
The positive relation between executive excess pay and CSR rating suggests that firms
where the top executives their pay is less linked to firm performance have higher CSR
ratings, consistent with hypothesis 1b/2b. It is important to note that excess pay measures
the same as pay-for-performance, but the expected sign in a regression analysis is the
opposite. In other words, a negative correlation between the pay-for-performance ratio and
CSR rating is similar to a positive correlation between excess pay and CSR rating. This
approach to measuring the relation between managerial incentives through compensation
and CSR rating is based on other studies (e.g. Ferell, Liang & Renneboog, 2016). There is no
correlation between executive excess pay and Tobin’s Q (at the 5% level), suggesting that
executive pay-for-performance is not linked to firm performance or that my measure of pay-
for-performance is not adequate. An alternative explanation is that the relationship between
pay-for-performance and Tobin’s Q is not captured well via a correlation analysis. For

23
example, more profitable firms are likely to pay their executives a higher compensation
which may lead to a higher excess pay in dollar amounts as well. Regression analysis later on,
which controls for such effects, will provide a more reliable answer.
The positive correlation between social pressure and CSR rating suggests that firms
who face higher social pressure have a higher CSR rating, which is consistent with hypothesis
3a. The negative correlation between social pressure and Tobin’s Q suggests that firms who
face high social pressure are less profitable, which is the expected sign and significance from
a variable that intends to measure social pressure in the sense that social pressure harms
the reputation of a firm which is costly for the firm.
I find no significant correlation (at the 5% level) between CSR rating and Tobin’s Q.
The correlation is insignificant even at the 10% level (not reported). This suggests that firms
with higher/lower CSR ratings are not more profitable.
Lastly, the positive correlation between institutional stock ownership and CSR rating
suggests that firms with high institutional ownership have higher CSR ratings. The positive
correlation between institutional stock ownership and Tobin’s Q suggests that firms with
higher institutional ownership are more profitable, consistent with that institutional
investors (or large investors) actively monitor the firm’s executives and reduce inefficient
business activities.
4.2 – Evaluation of the relation between managerial ownership and CSR
In Table 6a and Table 6b in Appendix A are presented the ordered probit regression
results with regards to top executive stock ownership and the firm’s CSR rating. The
difference between Table 6a and Table 6b lies in the use of different industry controls. In
Table 6a I control for industry based on advertising intensity, competitiveness and whether
or not the firm operates in a business-to-consumer industry, based on Baron et al. (2011)
and Servaes & Tamayo (2013). In Table 6b I control for industry using dummies based on the
industry classifications as presented in Table 4 above. Note that controlling for industry using
industry dummies seems to capture more of the variability in the dependent variable CSR
rating, as indicated by the higher pseudo-R2. This suggests that industry advertising intensity,
industry competitiveness and the B2C indicator do not capture all of the variation in CSR
across industries, or the construction of these variables in this study is suboptimal.

24
Furthermore, note that the regressions in column (2) and column (3) are done on a subset of
firms. Column (2) contains the subset of firms where top 5 executive ownership is equal to
or less than 5% and column (3) contains the subset of firms where top 5 executive ownership
is equal to or less than 25%. As indicated by the total number of observations, almost all
firms are already represented in the subset of firms where top 5 executive ownership is
equal to or less than 25%. These divisions seem rather arbitrarily chosen, however, they are
not. These divisions are based on Morck, Schleifer & Vishny (1988) who find, as discussed
earlier in chapter 2, that an increase in managerial stock ownership increases firm value up
until 5% stock ownership, decreases firm value between 5% and 25% stock ownership and
increases firm value again beyond 25% stock ownership. In other words, according to this
study the incentive effect of managerial ownership is different at different intervals of
managerial ownership, which I account for in this study. I do not have not enough
observations where top 5 executive ownership is between 5 – 25% (120 observations) and
>25% (31 observations) to predict relationships with enough statistical power on these
subsamples, hence I only the focus on the 5% and 25% cut off value to split up the samples.
For the overall sample, common stock ownership – top 5 executives is not significantly
related to CSR rating (see column (1) of Table 6a/6b). However, when I limit the sample to
firms with top executive ownership equal to or less than 5% or 25%, I find a significant
negative relation between executive stock ownership and the CSR rating (see column (2) and
column (3) of Table 6a/6b). One possible explanation for this observation is extreme
observations. Another possibility is that firms with high executive ownership simply do not
engage in inefficient CSR activities due to the effectiveness of ownership as an incentive
mechanism. Overall, the significant and negative coefficients of Common stock – top 5
executives are consistent with hypothesis 1a and indicates that, all else equal, top executives
reduce CSR expenditures as they bear more of the costs of inefficient CSR expenditures,
which implies that the marginal investment in CSR is reducing firm value. Since I find
evidence for that managers engage in inefficient CSR activities and reduce inefficient CSR
expenditures as their ownership in the firm increases. Therefore, I do not reject hypothesis
1a.
25
4.3 - Evaluation of the relation between managerial pay-for-performance and CSR
In Table 7a and Table 7b in Appendix A are presented the OLS regression results (1st
stage) and ordered probit regression results (2nd stage), with regards to executive pay-for-
performance. The difference between Table 7a and Table 7b lies in the use of different
industry controls, similar to the difference between Table 6a and Table 6b. The testable
assumptions of the OLS regressions (1st stage) are tested and discussed in Appendix B.
As for the empirical strategy, I follow other studies (e.g. Ferrell, Liang & Renneboog,
2016) in first estimating excess pay by predicting the residual of a top executive
compensation regression model with the explanatory variables being firm performance
indicators and industry controls, and then in the 2nd stage this residual is being used as an
explanatory variable of a regression model where the dependent variable is the firm’s CSR
rating.
The coefficient of excess pay is positive but statistically insignificant in Table 7a and is
weakly positive significant (at the 10% level) in Table 7b. The weakly positive significant
coefficient of Excess pay in Table 7b indicates that, all else equal, top executives increase
CSR expenditures as their compensation suffers less from inefficient CSR expenditures or
similarly, all else equal, top executives reduce CSR expenditures as their compensation
suffers more from inefficient CSR expenditures. This finding implies that the marginal
investment in CSR is reducing firm value which is consistent with hypothesis 1b, although the
evidence is not strong. Overall, I find (weak) evidence for that managers engage in inefficient
CSR activities and reduce inefficient CSR expenditures as their pay is more strongly based on
performance. Therefore, I do not reject hypothesis 1b.
4.4 - Evaluation of the profitability of CSR in the absence of social pressure
In Table 8 and 9 in Appendix A are presented again the regressions with regards to
the relationship between executive ownership and executive pay-for-performance,
respectively. The regressions are generally similar to those in Table 6b and Table 7b (in
which I used industry dummies to control for industry effects), except these tables also
include an interaction variable between social pressure and executive ownership (Table 8)
and between social pressure and executive excess pay (Table 9). I provide only results where
I control for industry using dummies, since a comparison of Table 6a with Table 6b and a

26
comparison of Table 7a with Table 7b indicates that using dummies to control for industry
seems to capture industry effects better, as indicated by the higher pseudo R2.
First, note that in all regression models where the dependent variable is CSR rating
the coefficient of social pressure is significant and positive, indicating that firms under higher
social pressure have higher CSR ratings, which is consistent with hypothesis 3 in that firms
respond to social pressure by increasing CSR expenditures. Furthermore, as one can observe
from Table 8 when observing column (1), column (2) and column (3), the interaction effect
between social pressure and top executive ownership is negative and significant, while the
top executive ownership variable is not statistically significant. This indicates that, all else
equal, top executives of firms under social pressure reduce CSR expenditures as they bear
more of the costs of inefficient CSR expenditures and the probability of reducing CSR
expenditures is higher the greater the social pressure. When the firm faces zero social
pressure, there is no significant relation between top executive ownership and the firm’s
CSR rating, because the coefficient of the variable Common stock – top 5 executives is
insignificant on its own. These findings suggest that managers only engage in inefficient CSR
expenditures as a response to social pressure, for example to protect their own reputation
as discussed in Chapter 2, and do not engage in inefficient CSR expenditures because they
like to give, for example because they have a fairness motivation or receive warm-glow from
giving. However, there exists the possibility that Common stock – top 5 executives on its own
is insignificant due to the high correlation with the interaction term. A correlation analysis
shows that the interaction term and Common stock – top 5 executives indeed are highly
correlated (correlation of 0.73, significant at the 1% level). Therefore it is not possible to
draw any reliable conclusion from column (1), column (2) and column (3) of Table 8 on
whether or not managers engage in inefficient CSR activities for reasons other than as a
response to social pressure (which would be indicated by the variable Common stock – top 5
executives conditional on that social pressure is zero). Thus, I run another regression on a
subset of the firms that did not face any social pressure at December 2008 or December
2009 according to the MSCI concerns data. This explains why there are only 210
observations for this particular regression. The results are presented in column (4) of Table
8. The coefficient of Common stock – top 5 executives in column (4) of Table 8 indicates that,
all else equal, top executives of firms that did not face social pressure reduce CSR
expenditures as they bear more of the costs of inefficient CSR expenditures. The finding

27
suggests that top executives engage in inefficient CSR expenditures for reasons other than as
a response to social pressures from stakeholders other than shareholders, consistent with
hypothesis 2a and the theory that managers like to give because they have, for example, a
fairness motivation or receive warm-glow from giving.
The findings in Table 8 are consistent with the positive significant coefficient of
Excess pay – top 5 executives and the insignificant coefficient of the interaction term in Table
9. The coefficient indicates that, all else equal, top executives increase CSR expenditures as
their compensation suffers less from inefficient CSR expenditures, regardless of whether or
not the firm faces social pressure. In other words, top executives reduce CSR expenditures as
their compensation suffers more from inefficient CSR expenditures, regardless of whether or
not the firm faces social pressure. One may argue that the significant coefficient of Excess
pay – top 5 executives in Table 9 is significant, because of the high correlation with the
interaction term (correlation of 0.65, significant at the 1% level). Thus, I re-run the model
using demeaned variables of the variables that make up the interaction variable. The results
are provided in column (3) of Table 9. The correlation between Excess pay – top 5 executives
and the interaction term is now reduced to 0.04 and not significant at the 10% level, while
the coefficient of Excess pay – top 5 executives remains positively significant. Overall, the
results indicate that managers engage in inefficient CSR activities for reasons other than as a
response to social pressure, consistent with the theory stating that top executives engage in
inefficient CSR activities because they like to give. Therefore, I do not reject hypothesis 2a
and hypothesis 2b.
4.5 - Evaluation of the profitability of CSR and the role of social pressure
First, note that social pressure is positively significant in all columns throughout Table
6, Table 7, Table 8 and Table 9. This strongly suggests that firms respond to social pressure
by increasing CSR activities, consistent with hypothesis 3a. Also note that the interaction
variable Executive ownership * social pressure in Table 8 is negatively significant, which
indicates that top executives of firms under social pressure reduce CSR expenditures as they
bear more of the costs of inefficient CSR expenditures and do so more strongly the greater
the social pressure. This finding is consistent with the theory stating that managers engage
in inefficient CSR expenditures as a response to social pressure, for example to protect their
28
own reputation as discussed in Chapter 2.
In Table 10 in Appendix A are presented OLS regressions with regards to the relation
between CSR rating, social pressure and Tobin’s Q. Note that the Fama & French 48 industry
classifications is used to capture industry effects. Similar results hold when using the 15
industry classifications as reported in Table 4, but the results are not reported for space
reasons. The assumptions with regards to the full model in column (2) are discussed in
Appendix C. I also tested the assumptions for the models in column (1) and column (3) and
the results are fairly similar, which is why I have not reported the results of the testing
procedure for these two models.
The important column in Table 10 is column (2), which represents the full regression
model, with an alternative specification of the model presented in column (3) which yields
similar results and is for that reason not discussed further. As one can observe from Table
10, the coefficients of Social pressure are statistically insignificant and the coefficient of CSR
rating * social pressure is negatively significant. According to Baron et al. (2011), social
pressure could directly affect market value by driving some investors away from the firm or
could affect profits by harming brand equity or firm reputation. The findings suggest that
social pressure harms firm value only through reducing the effectiveness of the CSR rating,
for example by harming the firm’s reputation/credibility regarding social involvement, and
does not directly harm firm value, for example by driving investors away. Another possibility
consistent with the findings is that social pressure affects firm value by reducing the
effectiveness of CSR investments. As discussed in the Chapter 2, inefficient managers may
commit to socially responsible behaviour to gain stakeholder support, at the expense of
shareholders. Note that social pressure is positively significant in all columns throughout
Table 6, Table 7, Table 8 and Table 9 and that the interaction variable Executive ownership *
social pressure in Table 8 is negatively significant, which indicates that top executives of
firms respond to social pressure by increasing CSR expenditures and under social pressure
more strongly reduce inefficient CSR expenditures when they bear more of the costs of
inefficient CSR expenditures. A similar interpretation is that, all else equal, when the
executive is better incentivized he/she reduces CSR expenditures less strongly when facing
lower social pressure, which strongly suggests that inefficient CSR investments are at least
partially driven by social pressure. Overall, I find evidence for that firms respond to social
pressure by increasing CSR expenditures, that social pressure negatively moderates the

29
relation between CSR and firm value, and find evidence consistent with that firms engage in
inefficient CSR due to social pressure. These findings are consistent with hypothesis 3a/3b
and the theory stating that inefficient managers may commit to socially responsible
behaviour to gain stakeholder support, at the expense of shareholders. Therefore I do not
reject hypothesis 3a and hypothesis 3b.
4.6 - Evaluation of the relation between institutional ownership and CSR
First, as one can observe the coefficient of Common stock – institutions in column (3)
of Table 10 is positive and significant. This indicates that, all else equal, a marginal increase
in institutional ownership as a percentage of the total common shares outstanding increases
firm value (as measured by Tobin’s Q), consistent with that institutional shareholders
actively monitor management and reduce inefficient expenditures.
As one can observe from the regression models in Table 6b, Table 7b, Table 8 and
Table 9 in Appendix A; the coefficient of Common stock – institutions is significant and
negative. This suggests, all else equal, institutional shareholders actively monitor CSR
activities and reduce CSR expenditures as they bear more of the costs of inefficient CSR
expenditures. This finding reconfirms that the marginal investment in CSR is reducing firm
value (under the assumption that institutional shareholders actively monitor to reduce
inefficient expenditures).
I find no significant relation between institutional ownership and CSR rating based on
the regression models in Table 6a and Table 7a. One explanation for this is that the industry
advertising intensity, industry competitiveness and B2C industry indicator variables do not
adequately control for industry effects regarding CSR, which are the industry controls in
Table 6a and Table 7a and these two tables are the only tables presenting regression models
where institutional ownership has no significant effect on the CSR rating. As a result, the
relationship between institutional ownership and CSR rating may be biased. The institutional
ownership variable is not correlated with the industry dummies (at the 10% level or higher,
not reported) in the other tables where institutional ownership is significantly related to CSR
rating, which implies that the significant negative relationship between institutional
ownership and CSR rating is not driven by spurious correlation. Overall, I find evidence for

30
that institutional shareholders actively monitor and reduce CSR expenditures as they bear
more of the costs of inefficient expenditures. Therefore I do not reject hypothesis 4.

31
Chapter 5 – Conclusion
In this cross-sectional study I examined whether or not top executives engage in
inefficient CSR activities and further investigate two possible motives for doing so, with the
first motive being that managers do not like to give but give as a response to social pressure
(e.g. Dellavigna, List & Malmendier, 2012) and the second motive being that managers like
to give, due to for example warm-glow (Andreoni 1989, 1990) and/or a fairness motivation
(e.g. Fehr & Schmidt, 1999). Using an empirical strategy based on managerial incentives, I
find evidence indicating that when top executives are better incentivized they reduce CSR
expenditures, implying the marginal investment in CSR reduces firm value. The findings also
show that firms respond to social pressure by increasing CSR expenditures (consistent with
Baron et al., 2011) and social pressure negatively moderates the positive relation between
CSR and firm value. Furthermore, when top executives are better incentivized and
consequently reduce CSR expenditures, they reduce CSR expenditures more strongly the
greater the social pressure. These findings are consistent with the theory that managers may
commit to socially responsible behaviour to gain stakeholder support, at the expense of
shareholders. However, the results suggest executives do not only invest in inefficient CSR as
a response to social pressure. The results show that also in the absence of social pressure
top executives reduce CSR expenditures as they are better incentivized, consistent with (but
no direct evidence of) that managers invest in inefficient CSR activities because they like to
give. The findings are consistent with Dellavigna, List and Malmendier (2012), who theorize
and find evidence that individuals donate to charity because of social pressure but also
because they like to give. Furthermore, I investigated the role of institutional shareholders
with regards to CSR activities and find evidence that institutional shareholders reduce CSR
expenditures as their holdings of common stock in the firm increases, reinforcing the finding
that the marginal investment in CSR is reducing firm value and the finding is consistent with
the theory that institutional shareholders actively monitor and reduce inefficient (CSR)
expenditures.
This study contributes to the existing literature in that it is, as far as I am aware, the
first study that uses an empirical strategy based on managerial incentives to investigate
possible motives for why managers invest in inefficient CSR activities. Previous studies on
the relation between CSR and financial performance were limited in that they mainly
32
focused on whether or not CSR contributes to or decreases firm value (e.g. Flammer, 2015;
Servaes & Tamayo, 2013, Cheng, Hong & Shue, 2014; Ferell, Liang & Renneboog, 2016),
while it is important to also understand the motives that drive inefficient CSR investments,
as also mentioned by Cheng, Hong and Shue (2014). However, more research should be
done on the motives that drive inefficient CSR expenditures by management, in order to
draw more reliable conclusions.
Unfortunately, this study is not without limitations. First, this study only investigates
the marginal effect of CSR on firm value. Not all CSR activities may be firm value reducing,
however, the marginal investment in CSR is reducing firm value. Second, interpreting
economic significance for various variables with regards to CSR and firm value is limited as
CSR expenditures are not directly observable, but proxied for through social ratings. Further
research should focus on developing better measures for CSR expenditures in order to be
better able to examine economic implications of CSR related activities. Third, there may be
causality problems present as there exists the possibility that the current CSR rating is the
result of investment decisions made many years ago. Hence, using only lagged independent
variables may not be adequate in dealing with possible causality problems, because the CSR
rating may already be established prior to the period in which the independent variables are
observed.

33
References (in alphabetical order)
Aguilera, R. V., Rupp, D. E., Williams, C. A., & Ganapathi, J. (2007). Putting the S back in corporate social
responsibility: A multilevel theory of social change in organizations. Academy of Management Review, 32(3),
836-863.
Andreoni, J. (1989). Giving with impure altruism: Applications to charity and Ricardian equivalence. Journal of
Political Economy, 97(6), 1447-1458.
Andreoni, J. (1990). Impure altruism and donations to public goods: A theory of warm-glow giving. The
Economic Journal, 100(401), 464-477.
Baron, D. P., Harjoto, M. A., & Jo, H. (2011). The economics and politics of corporate social
performance. Business & Politics, 13(2), 1-46.
Bebchuk, L. A., Cremers, K. M., & Peyer, U. C. (2011). The CEO pay slice. Journal of Financial Economics, 102(1),
199-221.
Bénabou, R., & Tirole, J. (2010). Individual and corporate social responsibility. Economica, 77(305), 1-19.
Cespa, G., & Cestone, G. (2007). Corporate social responsibility and managerial entrenchment. Journal of
Economics & Management Strategy, 16(3), 741-771.
Cheng, I.-H., Hong, H., Shue, K., 2014. Do managers do good with other people’s money? Unpublished working
paper, 12-47, University of Chicago Booth School of Business, Chicago, Ill.
Cochran, P. L., & Wood, R. A. (1984). Corporate social responsibility and financial performance. Academy of
Management Journal, 27(1), 42-56.
Cyert, R. M., & March, J. G. (1963). A behavioral theory of the firm. Organizational Behavior 2: Essential
Theories of Process and Structure, 2, 60.
DellaVigna, S., List, J. A., & Malmendier, U. (2012). Testing for altruism and social pressure in charitable
giving. The Quarterly Journal of Economics, 127(1), 1-56.
Demsetz, H. (1983). The structure of ownership and the theory of the firm. The Journal of Law and
Economics, 26(2), 375-390.
Demsetz, H., & Lehn, K. (1985). The structure of corporate ownership: Causes and consequences. Journal of
Political Economy, 93(6), 1155-1177.
Derwall, J., Guenster, N., Bauer, R., & Koedijk, K. (2005). The eco-efficiency premium puzzle. Financial Analysts
Journal, 51-63.
Dimson, E., Karakaş, O., & Li, X., (2015). Active ownership. Review of Financial Studies, 28, 3225-3268.
Dowell, G., Hart, S., & Yeung, B. (2000). Do corporate global environmental standards create or destroy market
value?. Management Science, 46(8), 1059-1074.
Dyck, A., & Zingales, L. (2002). The corporate governance role of the media. The right to tell: The role of mass
media in economic development, 107-37.
34
Edmans, A. (2011). Does the stock market fully value intangibles? Employee satisfaction and equity
prices. Journal of Financial Economics, 101(3), 621-640.
Fama, E. F., & Jensen, M. C. (1983). Separation of ownership and control. The Journal of Law and
Economics, 26(2), 301-325.
Fama, E. F., & French, K. R. (1997). Industry costs of equity. Journal of Financial Economics, 43(2), 153-193.
Fehr, E., & Schmidt, K. M. (1999). A theory of fairness, competition, and cooperation. The Quarterly Journal of
Economics, 114(3), 817-868.
Ferrell, A., Liang, H., & Renneboog, L. (2016). Socially responsible firms. Journal of Financial Economics, 122(3),
585-606.
Flammer, C. (2015). Does corporate social responsibility lead to superior financial performance? A regression
discontinuity approach. Management Science, 61(11), 2549-2568.
Franks, J., Mayer, C., & Renneboog, L. (2001). Who disciplines management in poorly performing
companies?. Journal of Financial Intermediation, 10(3-4), 209-248.
Frederick, W. C. (1995). Values, nature, and culture in the American corporation. Oxford University Press.
Friedman, M. (1970). The social responsibility of business is to increase its profits. New York Times,
September 13, 122-126.
Greening, D. W., & Turban, D. B. (2000). Corporate social performance as a competitive advantage in
attracting a quality workforce. Business & Society, 39(3), 254-280.
Hill, C. W., & Snell, S. A. (1989). Effects of ownership structure and control on corporate productivity. Academy
of Management Journal, 32(1), 25-46.
Himmelberg, C. P., Hubbard, R. G., & Palia, D. (1999). Understanding the determinants of managerial ownership
and the link between ownership and performance. Journal of Financial Economics, 53(3), 353-384.
Hong, H., & Kacperczyk, M. (2009). The price of sin: The effects of social norms on markets. Journal of Financial
Economics, 93(1), 15-36.
Jensen, M. C. (1986). Agency costs of free cash flow, corporate finance, and takeovers. The American Economic
Review, 76(2), 323-329.
Jensen, M. C., & Meckling, W. H. (1976). Theory of the firm: Managerial behavior, agency costs and ownership
structure. Journal of Financial Economics, 3(4), 305-360.
Kitzmueller, M., & Shimshack, J. (2012). Economic perspectives on corporate social responsibility. Journal
of Economic Literature, 50(1), 51-84.
Kotchen, M., & Moon, J. J. (2012) “Corporate Social Responsibility for Irresponsibility,” The B.E. Journal of
Economic Analysis & Policy, 12(1).
Krüger, P. (2015). Corporate goodness and shareholder wealth. Journal of Financial Economics, 115(2), 304-
329.
35
La Porta, R., Lopez-de-Silanes, F., Shleifer, A., & Vishny, R. (2000). Investor protection and corporate
governance. Journal of Financial Economics, 58(1), 3-27.
Lev, B., Petrovits, C., & Radhakrishnan, S. (2010). Is doing good good for you? How corporate charitable
contributions enhance revenue growth. Strategic Management Journal, 31(2), 182-200.
Liang, H., & Renneboog, L. (2016). On the foundations of corporate social responsibility. The Journal of Finance.
Margolis, J. D., Elfenbein, H. A., & Walsh, J. P. (2007). Does it pay to be good? A meta-analysis and
redirection of research on the relationship between corporate social and financial performance. Ann
Arbor, 1001, 48109-1234.
Masulis, R. W., Wang, C., & Xie, F. (2009). Agency problems at dual‐class companies. The Journal of
Finance, 64(4), 1697-1727.
McWilliams, A., & Siegel, D. (2001). Corporate social responsibility: A theory of the firm perspective.
Academy of Management Review, 26(1), 117-127.
Morck, R., Shleifer, A., & Vishny, R. W. (1988). Management ownership and market valuation: An empirical
analysis. Journal of Financial Economics, 20, 293-315.
Orlitzky, M., Schmidt, F. L., & Rynes, S. L. (2003). Corporate social and financial performance: A meta-
analysis. Organization Studies, 24(3), 403-441.
Pound, J. (1992). Raiders, targets, and politics: The history and future of American corporate control. Journal of
Applied Corporate Finance, 5(3), 6-18.
Servaes, H., & Tamayo, A. (2013). The impact of corporate social responsibility on firm value: The role of
customer awareness. Management Science, 59(5), 1045-1061.
Shleifer, A., & Vishny, R. W. (1989). Management entrenchment: The case of manager-specific
investments. Journal of Financial Economics, 25(1), 123-139.
Turban, D. B., & Greening, D. W. (1997). Corporate social performance and organizational attractiveness to
prospective employees. Academy of Management Journal, 40(3), 658-672.
Videras, J. R., & Owen, A. L. (2006). Public goods provision and well-being: empirical evidence consistent with
the warm glow theory. The BE Journal of Economic Analysis & Policy, 5(1).
Waddock, S. A., & Graves, S. B. (1997). The corporate social performance-financial performance link. Strategic
Management Journal, 303-319.
Williams, C., & Aguilera, R. V. (2008). Corporate Social Responsibility in a Comparative Perspective. In The
Oxford Handbook of Corporate Social Responsibility.

36
Appendix A – Regression outputs
Table 6a
The table shows the results from ordered probit regressions where the dependent variable is the firm’s CSR
rating, which is measured by the firm’s total number of strengths regarding environment, community, human
rights, employee relations, diversity and product. Column (1) represents the regression results for all
observations in the sample, column (2) represents the regression results for firms where common stock
ownership of the top 5 executives <= 5% and column (3) represents the regression results for firms where
common stock ownership of the top 5 executives <= 25%. The dependent variable is based on December 2009
data and all independent variables are based on (fiscal year) 2008. The industry variables are based on the
Fama & French 48 industry classifications.
(1) (2) (3) Variable CSR rating CSR rating CSR rating
Common stock – top 5 executives (%) -0.006 -0.155*** -0.028*** (0.005) (0.040) (0.010)
Social pressure 0.083*** 0.091*** 0.083*** (0.021) (0.022) (0.021)
Common stock – institutions (%) -0.002 -0.001 -0.002 (0.002) (0.002) (0.002)
Tobin’s Q (winsorized at 1%) 0.210*** 0.235*** 0.217*** (0.044) (0.047) (0.044)
ROA (winsorized at 5%) -0.449 -0.471 -0.424 (0.334) (0.362) (0.341)
Total assets (log, winsorized at 1%) 0.351*** 0.346*** 0.344*** (0.030) (0.033) (0.031)
Leverage (winsorized at 1%) -0.582*** -0.390* -0.544*** (0.188) (0.203) (0.191)
Firm age (log) 0.182*** 0.204*** 0.194*** (0.046) (0.049) (0.047)
Firm risk (%, winsorized at 1%) 0.015 0.017 0.014 (0.010) (0.011) (0.010)
Controversial business (dummy) -0.117 -0.208 -0.100 (0.132) (0.146) (0.134)
Industry – median advertising 7.384** 4.340 7.289** (3.558) (4.021) (3.666)
Industry – concentration 0.254 -0.309 0.176 (0.657) (0.728) (0.669)
Industry – B2C (dummy) -0.028 -0.020 -0.039 (0.083) (0.090) (0.084)
Number of observations 986 835 955 R2 (McKelvey & Zavoina) 0.298 0.337 0.310 Chi-square 306.86*** 304.13*** 311.40***
Standard errors in parentheses. *** p<0.01, ** p<0.05, * p<0.10
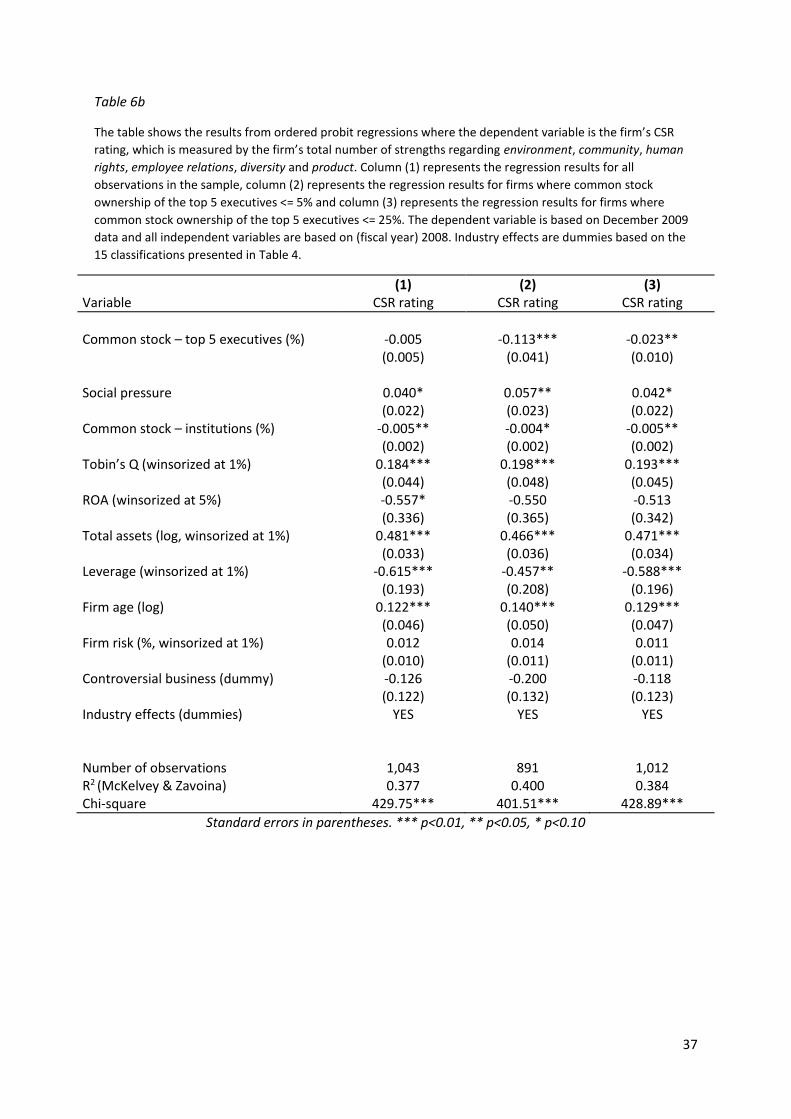
37
Table 6b
The table shows the results from ordered probit regressions where the dependent variable is the firm’s CSR
rating, which is measured by the firm’s total number of strengths regarding environment, community, human
rights, employee relations, diversity and product. Column (1) represents the regression results for all
observations in the sample, column (2) represents the regression results for firms where common stock
ownership of the top 5 executives <= 5% and column (3) represents the regression results for firms where
common stock ownership of the top 5 executives <= 25%. The dependent variable is based on December 2009
data and all independent variables are based on (fiscal year) 2008. Industry effects are dummies based on the
15 classifications presented in Table 4.
(1) (2) (3) Variable CSR rating CSR rating CSR rating
Common stock – top 5 executives (%) -0.005 -0.113*** -0.023** (0.005) (0.041) (0.010)
Social pressure 0.040* 0.057** 0.042* (0.022) (0.023) (0.022)
Common stock – institutions (%) -0.005** -0.004* -0.005** (0.002) (0.002) (0.002)
Tobin’s Q (winsorized at 1%) 0.184*** 0.198*** 0.193*** (0.044) (0.048) (0.045)
ROA (winsorized at 5%) -0.557* -0.550 -0.513 (0.336) (0.365) (0.342)
Total assets (log, winsorized at 1%) 0.481*** 0.466*** 0.471*** (0.033) (0.036) (0.034)
Leverage (winsorized at 1%) -0.615*** -0.457** -0.588*** (0.193) (0.208) (0.196)
Firm age (log) 0.122*** 0.140*** 0.129*** (0.046) (0.050) (0.047)
Firm risk (%, winsorized at 1%) 0.012 0.014 0.011 (0.010) (0.011) (0.011)
Controversial business (dummy) -0.126 -0.200 -0.118 (0.122) (0.132) (0.123)
Industry effects (dummies) YES YES YES
Number of observations 1,043 891 1,012 R2 (McKelvey & Zavoina) 0.377 0.400 0.384 Chi-square 429.75*** 401.51*** 428.89***
Standard errors in parentheses. *** p<0.01, ** p<0.05, * p<0.10
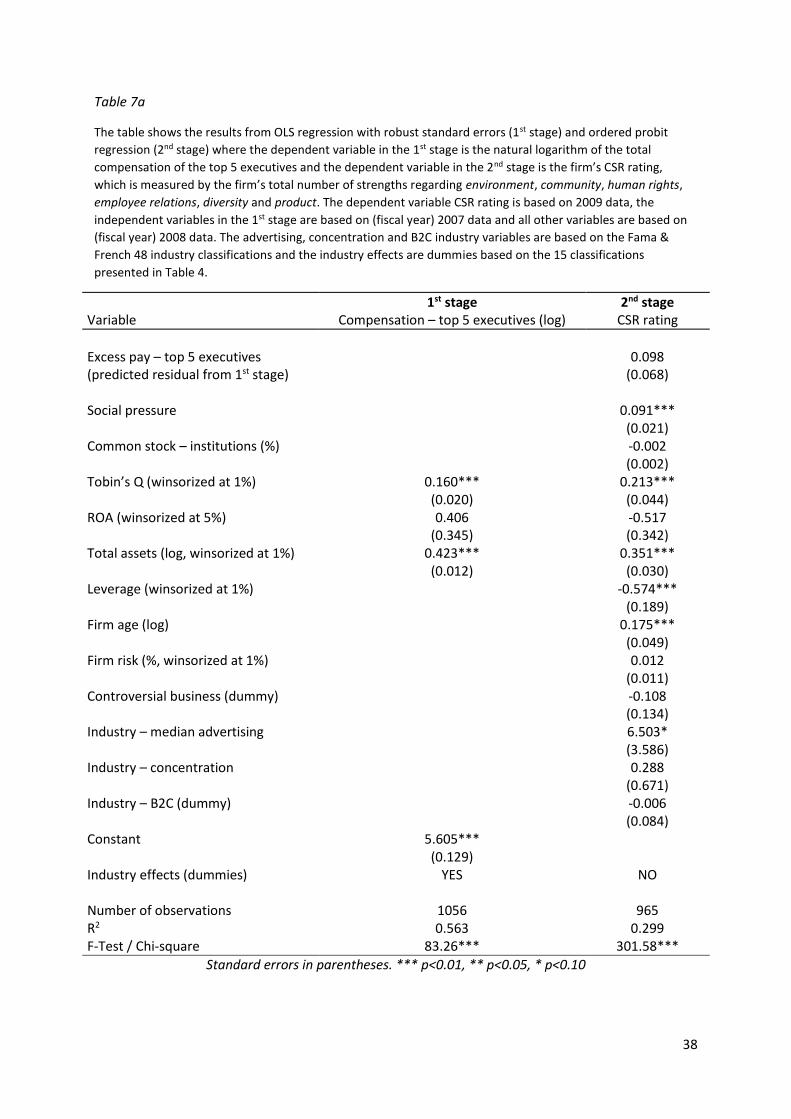
38
Table 7a
The table shows the results from OLS regression with robust standard errors (1st stage) and ordered probit
regression (2nd stage) where the dependent variable in the 1st stage is the natural logarithm of the total
compensation of the top 5 executives and the dependent variable in the 2nd stage is the firm’s CSR rating,
which is measured by the firm’s total number of strengths regarding environment, community, human rights,
employee relations, diversity and product. The dependent variable CSR rating is based on 2009 data, the
independent variables in the 1st stage are based on (fiscal year) 2007 data and all other variables are based on
(fiscal year) 2008 data. The advertising, concentration and B2C industry variables are based on the Fama &
French 48 industry classifications and the industry effects are dummies based on the 15 classifications
presented in Table 4.
1st stage 2nd stage Variable Compensation – top 5 executives (log) CSR rating
Excess pay – top 5 executives (predicted residual from 1st stage)
0.098 (0.068)
Social pressure 0.091*** (0.021)
Common stock – institutions (%) -0.002 (0.002)
Tobin’s Q (winsorized at 1%) 0.160*** 0.213*** (0.020) (0.044)
ROA (winsorized at 5%) 0.406 -0.517 (0.345) (0.342)
Total assets (log, winsorized at 1%) 0.423*** 0.351*** (0.012) (0.030)
Leverage (winsorized at 1%) -0.574*** (0.189)
Firm age (log) 0.175*** (0.049)
Firm risk (%, winsorized at 1%) 0.012 (0.011)
Controversial business (dummy) -0.108 (0.134)
Industry – median advertising 6.503* (3.586)
Industry – concentration 0.288 (0.671)
Industry – B2C (dummy) -0.006 (0.084)
Constant 5.605*** (0.129)
Industry effects (dummies) YES NO
Number of observations 1056 965 R2 0.563 0.299 F-Test / Chi-square 83.26*** 301.58***
Standard errors in parentheses. *** p<0.01, ** p<0.05, * p<0.10

39
Table 7b
The table shows the results from OLS regression with robust standard errors (1st stage) and ordered probit
regression (2nd stage) where the dependent variable in the 1st stage is the natural logarithm of the total
compensation of the top 5 executives and the dependent variable in the 2nd stage is the firm’s CSR rating,
which is measured by the firm’s total number of strengths regarding environment, community, human rights,
employee relations, diversity and product. The dependent variable CSR rating is based on 2009 data, the
independent variables in the 1st stage are based on (fiscal year) 2007 data and all other variables are based on
(fiscal year) 2008 data. The advertising, concentration and B2C industry variables are based on the Fama &
French 48 industry classifications and the industry effects are dummies based on the 15 classifications
presented in Table 4.
1st stage 2nd stage Variable Compensation – top 5 executives (log) CSR rating
Excess pay – top 5 executives (predicted residual from 1st stage)
0.116* (0.068)
Social pressure 0.043* (0.022)
Common stock – institutions (%) -0.006** (0.002)
Tobin’s Q (winsorized at 1%) 0.160*** 0.183*** (0.020) (0.045)
ROA (winsorized at 5%) 0.406 -0.630* (0.345) (0.343)
Total assets (log, winsorized at 1%) 0.423*** 0.490*** (0.012) (0.034)
Leverage (winsorized at 1%) -0.629*** (0.194)
Firm age (log) 0.105** (0.049)
Firm risk (%, winsorized at 1%) 0.009 (0.011)
Controversial business (dummy) -0.124 (0.123)
Constant 5.605*** (0.129)
Industry effects (dummies) YES YES
Number of observations 1056 1022 R2 0.563 0.380 F-Test / Chi-square 83.26*** 426***
Standard errors in parentheses. *** p<0.01, ** p<0.05, * p<0.10

40
Table 8
The table shows the results from ordered probit regressions where the dependent variable is the firm’s CSR
rating, which is measured by the firm’s total number of strengths regarding environment, com- munity, human
rights, employee relations, diversity and product. Column (1) represents the regression results for all
observations in the sample, column (2) represents the regression results for firms where common stock
ownership of the top 5 executives <= 5%, column (3) represents the regression results for firms where common
stock ownership of the top 5 executives <= 25% and column (4) represents the regression results for firms
where common stock ownership of the top 5 executives <= 5% and who faced no social pressure as of
December 2008 and December 2009. The dependent variable is based on December 2009 data and all
independent variables are based on (fiscal year) 2008. Industry effects are dummies based on the 15
classifications presented in Table 4.
(1) (2) (3) (4) Variable CSR rating CSR rating CSR rating CSR rating
Common stock – top 5 executives (%) 0.010 0.019 -0.001 -0.201** (0.007) (0.055) (0.013) (0.097)
Social pressure 0.057** 0.100*** 0.060*** (0.022) (0.026) (0.023)
Executive ownership * social pressure -0.009*** -0.087*** -0.013** (0.003) (0.025) (0.005)
Common stock – institutions (%) -0.005** -0.004 -0.005** 0.003 (0.002) (0.002) (0.002) (0.005)
Tobin’s Q (winsorized at 1%) 0.177*** 0.204*** 0.190*** 0.081 (0.044) (0.048) (0.045) (0.103)
ROA (winsorized at 5%) -0.548 -0.658* -0.550 0.148 (0.336) (0.365) (0.343) (0.748)
Total assets (log, winsorized at 1%) 0.480*** 0.473*** 0.473*** 0.150* (0.033) (0.036) (0.034) (0.086)
Leverage (winsorized at 1%) -0.599*** -0.488** -0.603*** -0.436 (0.193) (0.208) (0.196) (0.411)
Firm age (log) 0.122*** 0.131*** 0.130*** -0.050 (0.046) (0.050) (0.047) (0.104)
Firm risk (%, winsorized at 1%) 0.012 0.012 0.011 0.024 (0.010) (0.011) (0.011) (0.022)
Controversial business (dummy) -0.123 -0.213 -0.109 0.564 (0.122) (0.132) (0.123) (0.460)
Industry effects (dummies) YES YES YES YES
Number of observations 1,043 891 1,012 210 R2 (McKelvey & Zavoina) 0.383 0.409 0.389 0.237 Chi-square 438.29*** 413.90*** 435.35*** 33.92*
Standard errors in parentheses. *** p<0.01, ** p<0.05, * p<0.10

41
Table 9
The table shows the results from OLS regression with robust standard errors (1st stage) and ordered probit
regression (2nd stage) where the dependent variable in the 1st stage is the natural logarithm of the total
compensation of the top 5 executives and the dependent variable in the 2nd stage is the firm’s CSR rating,
which is measured by the firm’s total number of strengths regarding environment, community, human rights,
employee relations, diversity and product. The difference between column (2) and column (3) is that in column
(3) I demeaned the variables that make up the interaction variable. The dependent variable CSR rating is based
on 2009 data, the independent variables in the 1st stage are based on (fiscal year) 2007 data and all other
variables are based on (fiscal year) 2008 data. Industry effects are dummies based on the 15 classifications
presented in Table 4.
(1) 1st stage
(2) 2nd stage
(3) 2nd stage
Variable Compensation – top 5 executives (log)
CSR rating CSR rating
Excess pay – top 5 executives (predicted residual from 1st stage)
0.184** (0.089)
0.125* (0.068)
Social pressure 0.042* 0.042* (0.022) (0.022)
Executive excess pay * social pressure -0.038 -0.038 (0.033) (0.033)
Common stock – institutions (%) -0.006*** -0.006*** (0.002) (0.002)
Tobin’s Q (winsorized at 1%) 0.160*** 0.183*** 0.183*** (0.020) (0.045) (0.045)
ROA (winsorized at 5%) 0.406 -0.622* -0.622* (0.345) (0.343) (0.343)
Total assets (log, winsorized at 1%) 0.423*** 0.490*** 0.490*** (0.012) (0.034) (0.034)
Leverage (winsorized at 1%) -0.631*** -0.631*** (0.194) (0.194)
Firm age (log) 0.106** 0.106** (0.049) (0.049)
Firm risk (%, winsorized at 1%) 0.009 0.009 (0.011) (0.011)
Controversial business (dummy) -0.119 -0.119 (0.123) (0.123)
Constant 5.605*** (0.129)
Industry effects (dummies) YES YES YES
Number of observations 1056 1022 1022 R2 0.563 0.381 0.381 F-Test / Chi-square 83.26*** 427.35*** 427.35***
Standard errors in parentheses. *** p<0.01, ** p<0.05, * p<0.10

42
Table 10
The table shows the results from OLS regressions with robust standard errors where the dependent variable is
the firm’s Tobin’s Q, which is winsorized at 1% and measured by the following formula: (market value of equity
+ book value of debt) / book value of assets). The variable CSR rating (Social pressure) is measured by the firm’s
total number of strengths (concerns) regarding environment, community, human rights, employee relations,
diversity and product. The dependent variable is based on (fiscal year) 2009 data and the independent variables
are based on (fiscal year) 2008 data. Industry effects are dummies based on the Fama & French 48 industry
classifications.
(1) (2) (3) Variable Tobin’s Q Tobin’s Q Tobin’s Q
CSR rating 0.062*** 0.088*** (0.011) (0.015)
Social pressure -0.013 0.012 (0.012) (0.015)
CSR rating * social pressure -0.008*** (0.002)
CSR rating - social pressure 0.042*** (0.009)
Common stock – institutions (%) -0.018*** -0.018*** -0.018*** (0.006) (0.006) (0.006)
Common stock – institutions (%, squared) 0.000*** 0.000*** 0.000*** (0.000) (0.000) (0.000)
ROA (winsorized at 5%) 0.966*** 0.977*** 0.967*** (0.185) (0.185) (0.186)
Total assets (log, winsorized at 1%) -1.199*** -1.234*** -1.267*** (0.125) (0.126) (0.123)
Total assets (log, squared, winsorized at 1%) 0.065*** 0.067*** 0.071*** (0.008) (0.008) (0.007)
Leverage (winsorized at 1%) 0.351*** 0.361*** 0.347*** (0.129) (0.129) (0.130)
Firm age (log) -0.081*** -0.080*** -0.077*** (0.024) (0.024) (0.024)
Firm risk (%, winsorized at 1%) -0.010* -0.011* -0.011* (0.006) (0.006) (0.006)
Controversial business (dummy) -0.063 -0.062 -0.053 (0.059) (0.059) (0.059)
Constant 7.165*** 7.257*** 7.476*** (0.617) (0.628) (0.617)
Industry effects (dummies) YES YES YES
Number of observations 2,025 2,025 2,025 Adjusted R2 0.379 0.381 0.377 F-test 25.87*** 25.61*** 24.91***
Robust standard errors in parentheses. *** p<0.01, ** p<0.05, * p<0.10

43
Appendix B – Assumption testing for 1st stage OLS regression model
I test the following assumptions regarding the OLS regression where the dependent variable is
ln(total compensation – top 5 executives):
Assumption 1: No multicollinearity among the independent variables.
Assumption 2: Linearity in parameters.
Assumption 3: The errors have zero mean.
Assumption 4: The variance of the errors is constant and finite over all values of the predictor
variables.
Assumption 5: The errors are linearly independent of one another (only relevant in time series).
Assumption 6: The error is normally distributed.
As for assumption 1:
Stata automatically drops out variables in the case of extreme multicollinearity. However, I did test
this manually and found no significant multicollinearity (VIF < 10 and tolerance > 0.2 for all predictor
variables).
As for assumption 2, 3 and 4:
Plotting the residuals against the predicted values of y
(= ln(total compensation of top 5 executives)) including
a quadratic fit shows that the residuals are randomly
scattered around zero mean. Therefore, assumption 2
and 3 hold. Furthermore, the residuals seem to be
heteroskedastic, because the variance is not constant.
To overcome the problem of heteroskedasticity, I re-
estimate the model using robust standard errors, so
that assumption 4 is not violated.
As for assumption 6:
A histogram of the residuals of the re-estimated model
(using robust standard errors) with a normal
distribution overlay shows that the residuals are
reasonably normally distributed.
-2-1
01
2
Re
sid
ua
ls
7 8 9 10 11Fitted values
Residuals Fitted values
0.2
.4.6
.8
De
nsity
-2 -1 0 1 2Residuals

44
Appendix C – Assumption testing for OLS regression models with dependent variable Tobin’s Q
I test the following assumptions regarding the OLS regression in column (2) of Table 10:
Assumption 1: No multicollinearity among the independent variables.
Assumption 2: Linearity in parameters.
Assumption 3: The errors have zero mean.
Assumption 4: The variance of the errors is constant and finite over all values of the predictor
variables.
Assumption 5: The errors are linearly independent of one another (only relevant in time series).
Assumption 6: The error is normally distributed.
As for assumption 1:
Stata automatically drops out variables in the case of extreme multicollinearity. However, I did test
this manually. Only the two variables with an additional squared of the variable included show high
multicollinearity, but this is expected and not problematic as I do not interpret them further.
As for assumption 2, 3 and 4:
Plotting the residuals against the predicted values of y (=
Tobin’s Q) including a quadratic fit shows that the residuals
are fairly randomly scattered around zero mean, except at
the tails. Overall, assumption 2 and 3 hold. Furthermore,
the residuals seem to be heteroskedastic, because the
variance is not constant. To overcome the problem of
heteroskedasticity, I re-estimate the model using robust
standard errors, so that assumption 4 is not violated.
As for assumption 6:
A histogram of the residuals of the re-estimated model
(using robust standard errors) with a normal distribution
overlay shows that the residuals are not strongly normally
distributed. However, this should not pose too much of a
problem as the sample size is fairly large (2,025
observations).
-20
24
Re
sid
ua
ls
0 1 2 3 4Fitted values
Residuals Fitted values
0.2
.4.6
.8
De
nsity
-2 0 2 4Residuals
Copyright © 2022 FDOKUMEN