Core Labor Standards and Development: Impact on Long-Term Income
22
Core Labor Standards and Development: Impact on Long-Term Income RE ´ MI BAZILLIER * Universite ´ Paris 1 Panthe ´on Sorbonne – CNRS, France Summary. — The paper focuses on the impact of international core labor standards on long-term per capita income. In order to do that, it is necessary to build a new synthetic indicator of labor standards using multiple correspondence analysis, measuring the four core labor standards recog- nized by ILO. We propose an estimation of the steady-state per capita income for a large panel of countries (104) and then that of developing countries. The two-stage least square method is used to correct potential problems of endogeneity. The findings show that, by and large, countries with higher labor standards have a higher steady-state level. Ó 2007 Elsevier Ltd. All rights reserved. Key words — growth, labor standards, data analysis 1. INTRODUCTION Labor Standards are by no means a new is- sue. We have seen demand for labor standards rise with the globalization process. Many devel- oped countries and workers unions are demanding a social clause in international trade; the idea behind this proposition being that international trade exerts a downward pressure on labor standards in developed coun- tries and constitutes an ‘‘unfair’’ competitive advantage for developing countries. From this perspective, international coordination should be more efficient in order to achieve trade liber- alization and strengthening of labor standards (Beaulieu & Gaisford, 2002). Bagwell and Stai- ger (2000) argue that international negotiations on tariffs alone would lead to a globally ineffi- cient outcome characterized by partial liberal- ization and a lowering of labor standards. They suggest that different approaches of mul- tilateral negotiations could allow governments to reach a globally efficient outcome in terms of trade liberalization and strengthening of la- bor standards. Until now, the debate has focused largely on the link between labor standards and interna- tional trade. However, this approach has its limitations. In the first instance, many develop- ing countries are completely against any kind of links between international trade and labor standards, for fear of a ‘‘hidden protection- ism.’’ Furthermore, trade sanctions can be counter-productive because they harm the peo- ple they are designed to help (Brown, 2000; Brown, Deardorff, & Stern, 1996; Maskus, 1997; Srinivasan, 2004). Many authors (Com- mittee for Economic Development, 2001; Gris- wold, 2001) argue that the best way to improve labor standards is to achieve trade liberaliza- tion (arguments for the endogeneity of labor standards). Yet we might suggest that it is insufficient to study the whole phenomena exclusively from the point of view of the link with international trade, as it is often the case that countries with very weak labor standards are not integrated into international trading. Moreover, the export sectors have very often better standards than the others (Brown, Dear- dorff, & Stern, 2003). The focus of this paper is on the link between labor standards and long-term per capita * I am very grateful to Jean-Louis Arcand (CERDI-CNRS) for the very helpful comments he made on a previous version of this paper. I also want to thank Paul Gyselinck (CERDI), Ariane Tichit (ENS-LHS), and Jean-Claude Berthelemy (CES-CNRS) for their advice, and Nicolas Sirven (Capability and Sustainabil- ity Centre, University of Cambridge) for his help. Final revision accepted: February 26, 2007. World Development Vol. 36, No. 1, pp. 17–38, 2008 Ó 2007 Elsevier Ltd. All rights reserved 0305-750X/$ - see front matter doi:10.1016/j.worlddev.2007.02.010 www.elsevier.com/locate/worlddev 17
-
Upload
univ-orleans -
Category
Documents
-
view
1 -
download
0
Transcript of Core Labor Standards and Development: Impact on Long-Term Income
World Development Vol. 36, No. 1, pp. 17–38, 2008� 2007 Elsevier Ltd. All rights reserved
0305-750X/$ - see front matter
doi:10.1016/j.worlddev.2007.02.010www.elsevier.com/locate/worlddev
Core Labor Standards and Development:
Impact on Long-Term Income
REMI BAZILLIER *
Universite Paris 1 Pantheon Sorbonne – CNRS, France
Summary. — The paper focuses on the impact of international core labor standards on long-termper capita income. In order to do that, it is necessary to build a new synthetic indicator of laborstandards using multiple correspondence analysis, measuring the four core labor standards recog-nized by ILO. We propose an estimation of the steady-state per capita income for a large panel ofcountries (104) and then that of developing countries. The two-stage least square method is used tocorrect potential problems of endogeneity. The findings show that, by and large, countries withhigher labor standards have a higher steady-state level.� 2007 Elsevier Ltd. All rights reserved.
Key words — growth, labor standards, data analysis
* I am very grateful to Jean-Louis Arcand
(CERDI-CNRS) for the very helpful comments he made
on a previous version of this paper. I also want to thank
Paul Gyselinck (CERDI), Ariane Tichit (ENS-LHS),
and Jean-Claude Berthelemy (CES-CNRS) for their
advice, and Nicolas Sirven (Capability and Sustainabil-
ity Centre, University of Cambridge) for his help. Finalrevision accepted: February 26, 2007.
1. INTRODUCTION
Labor Standards are by no means a new is-sue. We have seen demand for labor standardsrise with the globalization process. Many devel-oped countries and workers unions aredemanding a social clause in internationaltrade; the idea behind this proposition beingthat international trade exerts a downwardpressure on labor standards in developed coun-tries and constitutes an ‘‘unfair’’ competitiveadvantage for developing countries. From thisperspective, international coordination shouldbe more efficient in order to achieve trade liber-alization and strengthening of labor standards(Beaulieu & Gaisford, 2002). Bagwell and Stai-ger (2000) argue that international negotiationson tariffs alone would lead to a globally ineffi-cient outcome characterized by partial liberal-ization and a lowering of labor standards.They suggest that different approaches of mul-tilateral negotiations could allow governmentsto reach a globally efficient outcome in termsof trade liberalization and strengthening of la-bor standards.
Until now, the debate has focused largely onthe link between labor standards and interna-tional trade. However, this approach has itslimitations. In the first instance, many develop-ing countries are completely against any kind oflinks between international trade and labor
17
standards, for fear of a ‘‘hidden protection-ism.’’ Furthermore, trade sanctions can becounter-productive because they harm the peo-ple they are designed to help (Brown, 2000;Brown, Deardorff, & Stern, 1996; Maskus,1997; Srinivasan, 2004). Many authors (Com-mittee for Economic Development, 2001; Gris-wold, 2001) argue that the best way to improvelabor standards is to achieve trade liberaliza-tion (arguments for the endogeneity of laborstandards). Yet we might suggest that it isinsufficient to study the whole phenomenaexclusively from the point of view of the linkwith international trade, as it is often the casethat countries with very weak labor standardsare not integrated into international trading.Moreover, the export sectors have very oftenbetter standards than the others (Brown, Dear-dorff, & Stern, 2003).
The focus of this paper is on the link betweenlabor standards and long-term per capita

18 WORLD DEVELOPMENT
income. The raising of labor standards mayhave important consequences on determinantsof long-term income. Opponents of a socialclause into the WTO argue that weak laborstandards are a condition for the developmentof the poorest countries (thanks to their com-parative advantage in nonskilled labor force).It is therefore doubly interesting to study theimpact of core labor standards on long-termper capita income.
The first goal of this paper is to build an in-dex to measure the enforcement of the core la-bor standards recognized in the ILOdeclaration on Fundamental Principles andRights at Work (1998). For that purpose, webuild several indexes to measure child labor,freedom of association, discrimination, andforced labor. We also take into considerationthe number of ILO conventions ratified by eachcountry.
The lack of data is a serious problem. It isnecessary to aggregate different sources ofinformation to minimize this problem. Ghai(2003), Granger (2005), Kucera (2001), andmore generally ILO ‘‘Decent Work’’ ResearchProgram are also working on this issue.
We want to measure the enforcement of allcore labor standards and not the enforcementof each kind of these standards. For that, weaggregate our different indexes using multiplecorrespondence analysis (MCA) in order todetermine endogenously the weight of each var-iable in the aggregated index.
The second goal of this paper is to determinethe impact of these core labor standards onlong-term per capita income. We use a Man-kiw, Romer, and Weil (1992) model augmentedby labor standards. Our goal is to evaluate thelong-term effects of a better enforcement ofthese standards; this in turn brings us to an esti-mation of the long-term steady states of differ-ent countries. 1
2. LABOR STANDARDS: PRESENTATIONAND CONSTRUCTION OF INDEXES
Labor Standards can be defined by the globalprinciples and rules governing work and profes-sional conditions (OECD, 1996). They are mul-tifaceted and may vary from one country toanother depending on the stage of develop-ment, political, social, and cultural conditionsor institutions. Labor standards will then lar-gely depend on given national circumstances(Stern, 1999). However, OECD and ILO distin-
guish four core labor standards: (1) prohibitionof forced labor, (2) freedom of association andthe right to organize and bargain collectively,(3) elimination of child labor exploitation,and (4) nondiscrimination in employment.OECD justifies these choices with the reasoningthat they are fundamental part of the HumanRights and their respect carries more efficiency.ILO argues that these core labor standards rep-resent the fundamental rights of workers, whichcan be applied all over the world irrespective ofthe stage of development. There is an interna-tional consensus 2 to consider that these corelabor standards should be globally recognizedand protected, which correspond in turn toeight ILO conventions. 3
(a) Labor standards and indexes
We build five indexes 4: ratifications of ILO’sconventions, Child labor, freedom of associa-tion, discrimination, and forced labor. Eachof these indexes aggregates different sources ofinformation in order to minimize the problemsof data 5; these we then classify into five groupsin order to have more comparable data. Finallywe obtain a set of ordinal indexes.
For each number of conventions ratified (NR),we build a formula 6 to measure both the num-ber of conventions and the number of core con-ventions ratified. This formula gives a higherweight to ratifications of core conventions.
For child labor (CL), we build a raw and anadjusted index. The raw index is defined bythe percentage of working children between10 and 14 years old. We consider this data asa good proxy of the level of exploitation of chil-dren, and it is the one generally used in the lit-erature to measure child labor (Bescond,Chataignier, & Mehran, 2003; Granger, 2005).However, this raw index is unsatisfactory formany developing countries because of problemsof data. We might suppose that a country inwhich half of the children do not go to primaryschool would have a significant problem withchild labor, even if it is possible that a signifi-cant number of children neither work nor goto school. We observe that countries whichhave an official child labor rate equal to zeroalso have a low level of primary school enroll-ment. Political consideration or lack of datacan explain this paradox. Our adjusted indexis an attempt to correct this bias. It is definedby the raw indicator, adjusted by the percent-age of children who do not attend primaryschool. 7 This method is also suggested by Bes-

CORE LABOR STANDARDS AND DEVELOPMENT: IMPACT ON LONG-TERM INCOME 19
cond et al. (2003) and used by Kucera and Sar-na (2004). Bescond et al. (2003) argue that, ta-ken as a worldwide average, the number ofchildren combining work with school is nearlythe same (9.9% in 2000) as the number of chil-dren neither at work nor school (10.1%). 8 Weuse the gross rather than the net enrollmentrate as it is available for a larger number ofcountries.
For Freedom of Association and CollectiveBargaining (FA), we build a composite index.The goal is to obtain an index available for alarge number of countries, both from a quanti-tative and a qualitative point of view. Theunionization rate, 9 the number of ILO conven-tions on freedom of associations ratified by thecountry, and the civil rights Freedom Houseindex are the criteria taken into account.
Gender discrimination in employment (DIS-CRI) 10 is a multidimensional phenomenon.Our hypothesis is discrimination in educationis an essential and complementary componentof discrimination in employment. Discrimina-tion can be seen indeed as pre-labor market dis-crimination (Altonji & Blank, 1999). Recentwork by Benabou (1996), Durlauf (1999), andLundberg and Startz (1998) builds upon earlierwork by Loury (1977) emphasizing that pre-la-bor market discrimination against a group hasan unfavorable effect on the human capital offuture generations and may lead to persistentgroup differences. Current labor market dis-crimination may also influence pre-labor mar-ket discrimination (Altonji & Blank, 1999). Ifwomen believe they will have difficulties beingaccepted in a particular profession, they are lesslikely to invest in the skills necessary for thisprofession (Coate & Loury, 1993). Because ofthe correlation between pre-labor market dis-crimination and labor market discrimination,several authors (Chamberlain & Van Der Berg,2002; Jolliffe & Campos, 2005) have observed astrong correlation between the unexplainedcomponent of Oaxaca (1973) decomposition(which is seen as the component measuring dis-crimination in employment), and discrimina-tion in education.
Our index takes into account the differencesof several components: differences in alphabet-ization rate, differences in schooling rates, dif-ferences of income, gender empowermentmeasure (GEM) of UNDP, and female activityrate. Hence, we focus on gender discriminationand not all discriminations mentioned in ILOconventions, because of a lack of reliable andcomparable data in racial discrimination at
the international level. The focus on gender dis-crimination is generally accepted in the litera-ture on labor standards (Busse & Spielmann,2006; Ghai, 2003). Moreover, the fundamentalconvention 102 on equal remuneration onlydeals with equal remuneration between menand women.
For Forced Labor (FL) index, we used thefollowing definition: Forced or compulsory laboris defined as work or service exacted under themenace of penalty and for which a person hasnot volunteered (Source: ILO). We used severalsources: Anti-Slavery International and ICF-TU (2001), Busse and Braun (2003), ILO(2001), and US Department of State (2003).Busse and Braun (2003) built two indexes: oneof the core forms of forced labor (scale from0 to 5) and another one of all forms of forcedlabor (scale from 0 to 9). Considering that itis more crucial to focus here on the core formsof forced labor, we propose the following for-mula:
FLRaw ¼ FORCED12 þ FORCED2
with FORCED1, the index of core forms offorced labor and FORCED2, the index of allforms of forced labor. We then obtain valuesbetween 0 and 7.5 and we propose the follow-ing classification: FL = 1 for countries withFLRaw = 0; FL = 2 for countries with FLRaw
between 0.5 and 1; FL = 3 for countries withFLRaw between 1 and 2; FL = 4 for countrieswith FLRaw between 2.5 and 3.5, and FL = 5for countries with FLRaw > 3.5.
For the missing values in the index of Busseand Braun (2003), we rebuilt a similar indexthanks to other sources of information men-tioned above, operating a distinction betweencore forms and all forms in order to obtain acomparable value.
(b) The aggregated index of core labor standards
We assume to study the common impact ofall four core labor standards and not simplythe impact of each standard separately. 11 Thischoice can be justified by several reasons:
• An aggregated index measures the generalindex of labor standards, which can also beseen as an evaluation of the social conscious-ness of the country.• Each standard may have complementaryeffects. For example, the main effect of free-dom of association would be to ensure theeffective enforcement of other standards.
20 WORLD DEVELOPMENT
Trade unions, asking for the respect of therights of workers, will have a positive influ-ence on the respect of other core labor stan-dards. This effect can be measured with theglobal index of labor standards.• This approach is justified by the activity ofinternational organizations such as ILOwhich promote the four core labor standardsand not only one among the four. It is moreinteresting to study the general effect of thefour core labor standards to see if this strat-egy is justified economically.
The first way to obtain a correct measure ofthe enforcement of all core labor standardswould be to sum the different values of eachindividual index. However, this choice is notcompletely satisfactory because it will introducea bias in the measure for two main reasons:
• Totaling each index of every standard toobtain a scalar index would mean that eachnorm has the same explicative power toexplain the general level of workers rights.This is not our hypothesis. We consider thatthe discriminating power of each standardcould differ.• We have to take into consideration the dif-ficulty to obtain good data, without statisti-cal bias for each standard. We areconfronted with a serious problem of imper-fect information. If we suppose the existenceof a ‘‘common tendency,’’ here the generalenforcement of core labor standards, wehave to isolate the effects for each standardcoming from this common tendency anddelete all other effects (statistical bias or mea-sure of different information). Data analysisis a good tool to fulfill this kind of goal byisolating the common factors between differ-ent variables.
We have different indexes measuring differentaspects of labor standards. It is necessary tofind a general index of workers rights’ enforce-ment, which is unobserved. MCA can providethis measure.
(i) MCAMCA is a mathematical technique allowing
an analysis of different discrete variables byprojecting on different axis the common infor-mation contained into these different variables.The goal is to reduce the number of dimensionsminimizing the loss of information (Benzecri,1992; Greenacre, 1984).
The attentive reader may rightfully ask whywe decide to use MCA and not principal com-ponent analysis (PCA), generally used for this
kind of studies. 12 To this attentive reader, wewould like to answer that PCA is a methodadapted for quantitative and continuous vari-ables while correspondence analysis is used toanalyze qualitative, discrete, or ordinal values.Strength of this method is that it allows us toexplore nonlinear relations between variableswhich is not possible with PCA. PCA can beseen as an analysis of correlation between vari-ables. However, a null correlation between twovariables does not mean that there is no rela-tion between the variables but that the relationof first degree is null. MCA allows exploringthe relation of degree higher than one, mainlybecause it is an analysis of the relations betweendifferent modalities and not variables.
(ii) MCA and aggregated index of core laborstandards
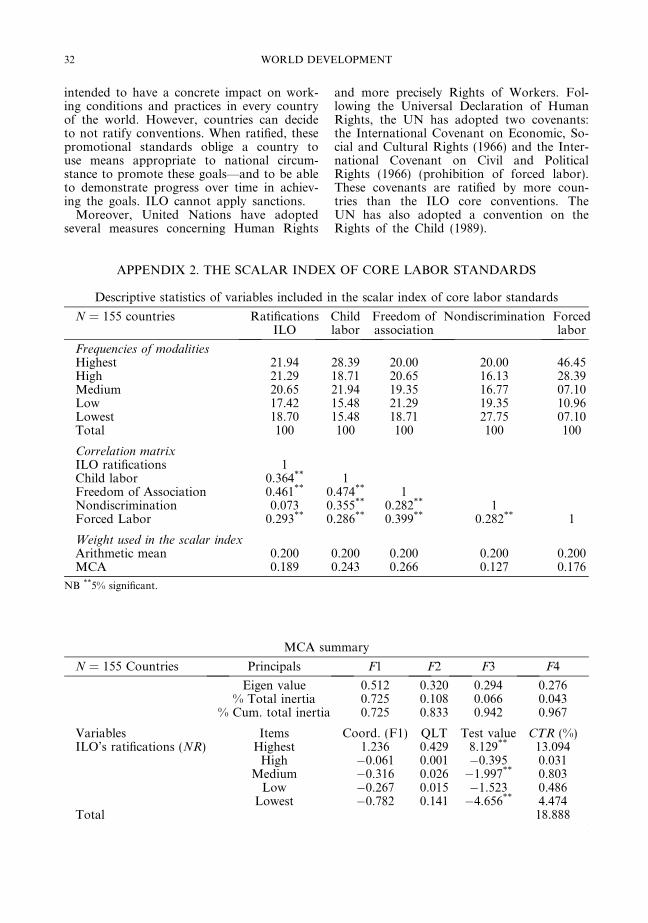
Thanks to MCA, we have different axesexplaining different aspects in respect of core la-bor standards. The question is then how manyaxes (or factor) to retain in order to have agood description of the whole phenomena. Re-sults of the MCA are summarized in Appendix2. Three main comments can be done in light ofthese figures. Firstly, it is very interesting to seethat the first factor (F1) explains by itself about72.5% of the total inertia. Put differently, F1synthesizes much more information on the fivevariables of core labor standards than the accu-mulation of all other factors. According to thescree test (Cattell, 1966), this ‘‘gap’’ between F1and the other factors allows us to think thatcountries’ coordinates on the first axis are agood proxy for the global application of corelabor standards. Secondly, all low items havenegative values and their sign changes whenthey indicate a higher degree of core labor stan-dards. In other words, there is no nonlinear ef-fect among the five variables used; they allevolve in the same direction along the first fac-tor. This confirms the homogeneity of the dataand the choice of F1 as the aggregate index ofcore labor standards. Items coordinates onthe first axis are then re-defined using linearextrapolation in the [0, 1] interval for homoge-neity of the index. Thirdly, it appears that thechoice of the number of ILO ratifications isconsistent with the four other labor standardsbecause its weight (18.9%) is very close to 1/5.Note that the weight of a variable is the sumof the absolute contributions (to the inertia ofF1) of each item. Forced labor (17.6%) is thusclose to average weight, while Freedom of asso-ciation (26.6%) and Child labor (24.3%) are the
CORE LABOR STANDARDS AND DEVELOPMENT: IMPACT ON LONG-TERM INCOME 21
most discriminating variables. The fact thatNonDiscrimination (12.7%) seems to play lessimportant role may be due to the fact that dis-crimination depends on factors (culture, reli-gion, etc.) much less related to laborstandards than any other variables.
This index has three main advantages:• Contrary to other empirical works onlabor standards, it is based on a clear defini-tion of these standards, supported by a realinternational consensus of worldwide orga-nizations, governments, and scientists.• Data analysis means all the statisticalbiases or imperfections of data are not takeninto consideration, therefore measurementerrors are more likely to be reduced.• We have shown, with thanks to MCA,that shared characteristics can be found. Ifdisparities exist, different labor standardsevolve in the same way.
3. IMPACT OF CORE LABORSTANDARDS ON LONG-TERM PER
CAPITA INCOME
(a) Expected impact of labor standards
Labor standards are supposed to have com-mon effects on income per capita. There arethree main determinants of income: productiv-ity, 13 investment in human capital, and invest-ment in physical capital.
Concerning productivity, freedom of associa-tion, abolition of forced labor, discrimination,and child labor are supposed to have a positiveimpact. Unions give workers a direct voice tomanagement making it more likely that conflictswill be resolved through discussion ratherthrough conflict. What is more, unionization re-duces turnover, making it more likely thatemployees will develop valuable job-specificskills and that employers will invest in long-termtraining, which will contribute to productivitygrowth. Aidt and Tzannatos (2002), arguing thatcollective bargaining facilitates coordination,showed that most studies on the issue find thatcoordinated collective bargaining was associatedwith improved macroeconomic performance. 14
Martin and Maskus (2001) show that if productmarkets are competitive, it is likely that associa-tion rights would increase output and competi-tiveness, by raising productivity. Labor Marketdiscriminations impede effective matching inthe labor market between employers and work-ers. Economies are much more productive when
jobs are allocated on the basis of skills and abilityinstead of ethnicity and genders (Brown et al.,1996; Maskus, 1997; OECD, 1996). Child laborand forced labor increase the supply of cheapor free labor within a country, driving downwages for everybody and easy access to cheap la-bor removes incentives for firms to lower theircosts by developing or adopting new technolo-gies. Productivity growth could be slowed. Glob-ally, we expect that core labor standards willhave a positive impact on productivity.
Concerning human capital, child labor, dis-crimination, forced labor, and freedom of asso-ciation are expected to have an effect. The factthat children are working in low-wage jobs in-stead of attending school will impede thegrowth of a human capital country stock(Maskus, 1997). Concerning discrimination,we assume that discrimination in employmentis linked with discrimination in education.The eradication of discrimination in employ-ment can be seen as an incentive for the educa-tion of women or other minorities. Forcedlabor abolition can induce an improvement ofhuman capital efficiency as it is highly probablethat forced workers are overeducated for theirjob. Lastly, unionization makes more likelythat employees will develop valuable job-spe-cific skills and employers will invest in long-term training, which will also be positive forhuman capital accumulation.
Concerning investment in physical capital,only indirect effects can be expected.
(b) The Mankiw, Romer, and Weil (MRW)model augmented by labor standards
We use the Solow (1956) Growth Model,augmented by human capital (Mankiw et al.,1992). 15 Several authors measure the influenceof other factors on long-term per capita incomeusing this model, see for example: Murdochand Sandler (2002). This empirical study willmeasure the impact of core labor standardson growth by means of spillover effects on dif-ferent production factors.
Let the production function be
Y t ¼ Kat Hb
t ðLtAtÞ1�a�b; ð1Þ
where K is the stock of physical capital, H thestock of human capital, A the level of laborproductivity, and L the level of labor. Let sk
be the fraction of income invested in physicalcapital, sh the fraction of income invested in hu-man capital. The evolution of the economy isdetermined by

22 WORLD DEVELOPMENT
_kt ¼ skyt � ðnþ g þ dÞKt; ð2Þ_ht ¼ shyt � ðnþ g þ dÞht; ð3Þwhere y = Y/AL, k = K/AL, h = H/AL, andls = LS/AL are quantities per effective unit oflabor, d is the rate of depreciation. FollowingMRW (1992), we assume that the same produc-tion function applies to human capital, laborstandards, physical capital, and consumption.One unit of consumption can be transformedwithout cost into either one unit of physicalcapital or one unit of human capital. In addi-tion, we assume that human capital depreciatesat the same rate as physical capital.
We suppose that a + b < 1, which impliesthat there are decreasing returns to all capital.Eqns. (2) and (3) imply that the economy con-verges toward a steady state defined by
k� ¼ s1�bk sb
h
nþ g þ d
!1=ð1�a�bÞ
; ð4Þ
h� ¼ s1�ak s1�a
h
nþ g þ d
� �1=ð1�a�bÞ
: ð5Þ
Substituting (5) and (6) into the productionfunction (1) and taking logs gives an equationfor income per capita,
lnY t
Lt¼ ln Að0Þ þ gt þ a
1� a� blnðskÞ
� aþ b1� a� b
lnðnþ g þ dÞ
þ b1� a� b
lnðshÞ: ð6Þ
There is an alternative way to express the roleof human capital in determining income in thismodel. Combining (6) with the equations of thesteady-state level of human capital given in (5)yields an equation for income as a function ofthe rate of investment in physical capital, therate of population growth, and the level of hu-man capital,
lnY t
Lt¼ ln Að0Þ þ gt þ a
1� alnðskÞ
� a1� a
lnðnþ g þ dÞ þ b1� a
lnðshÞ:
ð7Þ
(c) Empirical specification and data
From Eqn. (7), and following the methodol-ogy used by Murdoch and Sandler, we propose
the following estimating equation in order toestimate the effect of labor standards (ls) onlong-term per capita income,
lnðy96Þ ¼ c0 þ c1 lnðsKÞ þ c2 lnðni þ g þ dÞþ c3 lnðh�Þ þ c4 lnðls�Þ þ �; ð8Þ
theoretically with c1 ¼ �c2 ¼ a1�a ; c3 ¼ b
1�a,where ls is the value of our aggregated indexof labor standards. Following MRW, we as-sume that g + d = 0.05. The model is estimatedfor the year 1996 and for two samples: a largesample of 104 countries including developingand developed countries, and the other oneincluding only developing countries.
Data used to estimate the different equationscome from different sources: (i) The PennWorld Tables Mark 6.1 (Heston, Summers, &Atten, 2002), (ii) Barro and Lee (1996) and Bar-ro and Lee (2000), and (iii) our index of laborstandards. We use the GDP per capita, mea-sured in constant dollar (RGDPL) in Hestonet al. (2002) to measure the income. The invest-ment variable is the average of the investmentratio during 1960–96. Data on population arethe annual average of the population growthrate (variable POP in PWT). For the variableof Human Capital, we take here the steady-state level measured by the percentage of thepopulation older than 25 that has attained sec-ondary school in 1996 (Barro & Lee, 1996,2000).
(d) Instruments
As labor standards may have a significant im-pact on long-term per capita income, incomemay also have an impact on the level of laborstandards. It is, moreover, one of the mainarguments of the opponents to a social clausein the WTO. Casella (1996) considers that dif-ferences in labor standards are in part drivenby differences in income. Convergence in in-come levels will so cause an endogenous con-vergence in the levels of labor standards. 16
The problem of endogeneity can create a biasin the estimation and has to be taken into con-sideration in the econometric methodology.This problem can be solved if we have aninstrument for labor standards to correct thebias of endogeneity and measure the real im-pact of labor standards on growth thanks tothe two-stage least square (TSLS) method.Such an instrument must be an important fac-tor in accounting for the variation of labor

CORE LABOR STANDARDS AND DEVELOPMENT: IMPACT ON LONG-TERM INCOME 23
standards that we observe, but have no directeffect on performance.
We propose to test the validity of the follow-ing instruments: (1) a combined polity score(Polity IV) proposed by Gleditsch (2003), 17
(2) the competitiveness of participation (the ex-tent to which nonelites are able to access institu-tional structures for political expression, 18) (3)the executive constraints (operational indepen-dence of chief executive), 19 (4) the openness ofexecutive recruitment (opportunity for nonelitesto attain executive office), 20, and (5) the com-petitiveness of executive recruitment (the extentto which executives are chosen through compet-itive elections). 21 All data have been obtainedfrom Gleditsch (2003). We take the average ofeach variable for the period 1990–2000. 22
The level of democracy (instrument 1) can beseen as a determinant of labor standards with-out direct link to economic growth. The globalconsensus in political sciences considers thatthere is a relation of causality between democ-racy and Human Rights. Carothers (1994) con-siders that democracy and Human Rights arethe ‘‘two sides of the same coin.’’ The formerUnited Nations Secretary General Boutros-Boutros Ghali argued that Human Rights,Equal rights, and government under law areimportant attributes of democracy (Fox & Nol-te, 1995). Davenport and Armstrong (2004) no-tice that political democracy is seen as ‘‘a’’ andeven ‘‘the’’ solution to the problem of staterepression (Dahl, 1966; De Gre, 1964; De Jou-venal, 1945; Goldstein, 1978; Rummel, 1997;Russel, 1993). 23 They argue that above a cer-tain level of democracy, democracy influencesrepression in a negative and roughly linearmanner. Some psychologists tried to study thelink between the perception of Human Rightsand Democracy. Staerkle, Clemence, and Doise(1999) argue that the members of nondemo-cratic countries are viewed as accepting morehuman rights violations than members of dem-ocratic countries because of the pervasive im-pact of information on political judgments onthe population. Last, ILO (1998) observes that‘‘the expansion of the democracy and of thefree market economy has generally improvedthe context in which freedom of associationprinciples are applied.’’
On the other hand, there is no consensus con-cerning the link between democracy and eco-nomic growth, as showed by OECD (2004).Bardham (1993) states the basic dilemma:democracies might actually be more susceptibleto pressure for immediate consumption and other
particularistic demands that may hamper long-run investment. On the other hand, authoritarianrulers who have capacities to resist such pres-sures may instead be self-aggrandizing, plunder-ing the surplus of the economy. The empiricalresearch failed to find a clear relation betweendemocracy and economic growth (Barro,1996, 1997; Durham, 1999).
To justify our choice of the instruments re-lated to nonelites participation (instruments 2and 4), we invoke the relations between rightsand norms and the way to construct norms.Honfeld distinguished between ‘‘the claim-rights’’ and the ‘‘liberty-rights.’’ When an ac-tor’s right to act is transferred by that actor(or by others) to others actors, the first actorloses his liberty-right and the others come tohave a claim-right toward him. Coleman(1990) claims that a norm concerning a specificaction exists when the socially defined right tocontrol the action is held by others. A normneeds a social consensus that placed the rightin the hand of a group of people (the corporateactor in the wording of Coleman). As Colemansaid: the genesis of a norm is based on the exter-nalities of action which cannot be overcome bysimple transactions that would put control ofthe action in hands of those experiencing theexternalities. Thus, the principal question is‘‘how do societies define this social consensusneeded to build these norms.’’ Labor standardshave the objective criteria to give them the stat-ute of ‘‘norms.’’ But to be implemented, thegovernment needs to recognize these rights toindividuals. This is why the democratic regimeis an important factor to put in place laborstandards, as previously demonstrated.
Yet the democratic criteria may not be suffi-cient. A lot of sociologists and political scien-tists have studied the relations of power insidethe societies. Mosca (1896) observed the orga-nized structures of the elites in all societies.The characteristic of these elites is to be aminority group who holds the power with arelation of solidarity between them amidst com-mon values or interests. Mills (1956) made a dis-tinction between social classes and elite, withthree components to his elite: a political elite,an economic elite, and a military elite, all linkedby common interests. Last, Bourdieu and Pass-eron (1977) argue on the power of the ‘‘domi-nant class’’ and the ‘‘symbolic violence’’ usedby this ‘‘dominant class’’ in order to transmitto all the societies their own values and beliefs.
The need to improve labor standards inorder to keep the comparative advantage of

24 WORLD DEVELOPMENT
the country as it is, or the economic interest ofsome strategic firms, may not be in the interestsof the elite. If we assume that the individualswho will benefit from an improvement in laborstandards are not part of this elite, it is crucialthat the ‘‘nonelites’’ can participate in the dem-ocratic process, being able to access institu-tional structures for political expression, orhaving the opportunity to attain executive of-fice. This is what Pareto (1916) called the rotat-ing of the elite.
If we consider that the democratic system isefficient, that is, the goal of the government isto take into account the collective interests ofthe peoples or the interests of the poorest(Rawls, 1971), the crucial point is to give tothe nonelites the capacity to have a real oppor-tunity for expression and not systematically tochange the elite.
So, if we assume that the interest of the non-elites is to improve the labor standards and theworking conditions, the political participationof the nonelites may be a determinant of the le-vel of labor standards. Conversely, this is not adeterminant of economic performance. Thus,we assume these variables can be used as aninstrument.
The two other instruments proposed (com-petitiveness of executive recruitment and opera-tional independence of chief executive)complete the explanation of the level of laborstandards based on the level of democracyand the capacity of nonelites to participate inthe political process.
In our attempt to correct for potential endo-geneity of labor standards, we implement theTSLS method with the instruments proposedabove. As a preliminary step, we carried outthree sets of tests concerning the validity andthe relevance of our instruments (see Appendix4 for details of the various tests performed togauge the validity and relevancy of the subsetsof instruments). The competitiveness of partic-ipation (instrument 2) is a relevant and validinstrument. All the others, excepting executiveconstraints (instrument 3), can be used as aninstrument when they are associated withinstrument 2. We then propose IV estimationswith different subsets of instruments.
(e) IV estimates
(i) The effects of core labor standards at theglobal level
We first estimate Eqn. (8) using IV estimatorsin order to obtain consistent estimates of the
impact of core labor standards on long-termper capita income. 24 According to the resultsof validity and relevance tests, we use alterna-tively, the competitiveness of participation (2),and combinations of this instrument with levelof democracy (1), openness of executive recruit-ment (4), and the competitiveness of executiverecruitment (5). The results of the estimationsare given in Table 1. We then restrict the equa-tion according to the theoretical model and findthe results given in Table 2.
The coefficient of labor standards is alwaysstrongly positive and significant whatever thesubsets of instruments chosen. All things beingequal, labor standards have a positive impacton long-term per capita income which meansthat countries could have different growthpaths according to their levels of labor stan-dards. The coefficient takes a high value witha mean of 0.50, which is higher to the estimatedcoefficient of education or investment. To givea quantitative assessment of this result, a onestandard deviation change in the log variableof labor standards (0.88) will increase theGDP per capita by 44% (0.88 * 0.50). If we take0.42 as a mean of the estimated coefficient forthe variable of investment, a one standard devi-ation change in the log variable of investmentwill increase the GDP per capita by 25%. Andif we take 0.46 as a mean of the estimated coef-ficient for the variable of education, a one stan-dard deviation change in the log variable ofeducation will increase the GDP per capita by42%. The standardized beta coefficient 25 is alsomore important for labor standards than forother variables (0.39 for labor standardsagainst 0.36 for education and 0.22 for invest-ment).
The importance of these quantitative assess-ments should not be underestimated. However,a one standard deviation of labor standards is avery significant change for a country, and can-not occur in a short-term period. For example,if we take the average value of the log-variableof labor standards (3.51), with a one standarddeviation change, the new value of the log-var-iable of labor standards will be 4.39. A countrylike Burundi has a level of labor standards closeto 3.51. Bulgaria has a level of labor standardsclose to 4.39. A one standard deviation changecan be seen as a long-term process that willprobably change the structure of the economy,especially for labor market. In a long-term per-spective, the country will adapt the way oforganizing production with these new stan-dards. A new international specialization can

Table 1. Results of the estimation steady-states per capita income (1996)—TSLS method (world sample)
Dependant variable: y96 (1) (2) (3) (4) (5) (6)Instrument set IV2 IV1,2 IV2,4 IV2,5 IV2,4,5 IV2,3,5
Constant 2.88(1.46)
1.99(1.18)
2.57(1.37)
2.21(1.24)
2.19(1.24)
2.01(1.20)
Investment 0.40(2.75)b
0.43(3.16)b
0.41(2.89)b
0.42(3.05)b
0.43(3.06)b
0.43(3.15)b
(n + g + d) �1.43(�2.08)a
�1.67(�2.75)b
�1.51(�2.29)a
�1.62(�2.55)a
�1.62(�2.56)b
�1.67(�2.75)b
Education 0.45(4.61)b
0.46(4.97)b
0.45(4.73)b
0.46(4.88)b
0.46(4.89)b
0.46(4.97)b
Labor standards 0.58(3.42)b
0.47(3.69)b
0.54(3.44)b
0.50(3.48)b
0.50(3.49)b
0.48(3.75)b
Statistical tests
R2 0.70 0.73 0.71 0.73 0.73 0.73Hansen test na 1.12
(0.50)0.45
(0.31)1.01
(0.68)1.032(0.60)
1.17(0.76)
Partial R2 (excludedinstruments)
0.24 0.38 0.27 0.31 0.31 0.39
F-test 31.47 29.84 18.01 22.17 14.76 15.30Number of
observations104 104 104 104 104 104
a 5%.b 1% level of significance.
Table 2. Restricted equation (world sample)
Dependant variable: y96 (1) (2) (3) (4) (5) (6)Instrument set IV2 IV1,2 IV2,4 IV2,5 IV2,4,5 IV2,3,5
Constant 5.44 (6.40)a 4.95 (6.74)a 5.34 (6.53)a 5.12 (6.61)a 5.11 (6.60)a 4.96 (6.80)a
Investment—(n + g + d) 0.45 (2.89)a 0.50 (3.57)a 0.46 (3.03)a 0.48 (3.32)a 0.48 (3.33)a 0.50 (3.56)a
Education 0.47 (4.48)a 0.49 (5.00)a 0.47 (4.59)a 0.48 (4.82)a 0.48 (4.83)a 0.49 (4.99)a
Labor standards 0.68 (4.40)a 0.56 (4.56)a 0.66 (4.50)a 0.60 (4.48)a 0.60 (4.47)a 0.57 (4.65)a
R2 0.67 0.70 0.68 0.69 0.69 0.70Number of observations 104 104 104 104 104 104
According to the theoretical model, the restriction imposed is: c1 ¼ c2 ¼ a1�a.
a 1% level of significance.
CORE LABOR STANDARDS AND DEVELOPMENT: IMPACT ON LONG-TERM INCOME 25
be expected. In addition, as we have seen be-fore, the labor standards are expected to havea strong impact on the main determinants ofeconomic growth. Investment, education, orproductivity may change positively with animprovement of labor standards. Some cumu-lative effects may occur that will induce a stron-ger impact on long-term per capita income.
We cannot rule out the possibility that othereconomic mechanisms are also taking place.More precisely, we cannot control, because ofdata limitations, for unobserved country-spe-cific effects. In order to minimize this problem,we chose here a traditional growth model in or-
der to control our results with the commonlyaccepted determinants of long-term per capitaincome.
One other limitation is the possible ambiguitybetween the human capital and labor standardvariables. In terms of gender discriminationand child labor, the labor standard indicatorsare defined, in part, in terms of human capitaloutcomes. We justified this choice by the needto measure the effective enforcement of laborstandards. On this matter, the inclusion of avariable on education is necessary to measurethe real level of child labor (Bescond et al.,2003). The discrimination in education is also
26 WORLD DEVELOPMENT
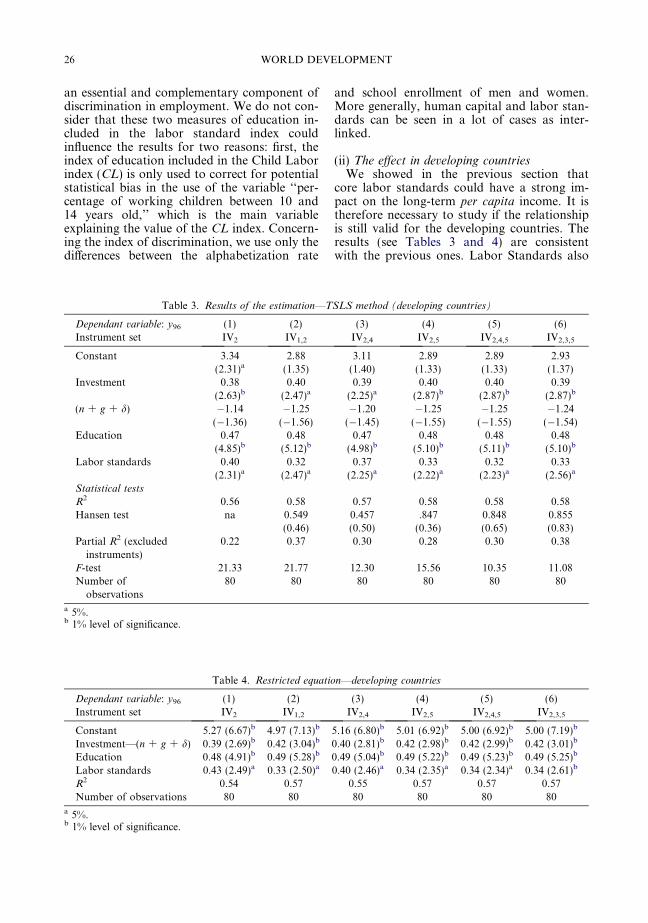
an essential and complementary component ofdiscrimination in employment. We do not con-sider that these two measures of education in-cluded in the labor standard index couldinfluence the results for two reasons: first, theindex of education included in the Child Laborindex (CL) is only used to correct for potentialstatistical bias in the use of the variable ‘‘per-centage of working children between 10 and14 years old,’’ which is the main variableexplaining the value of the CL index. Concern-ing the index of discrimination, we use only thedifferences between the alphabetization rate
Table 3. Results of the estimation—T
Dependant variable: y96 (1) (2)Instrument set IV2 IV1,2
Constant 3.34(2.31)a
2.88(1.35)
Investment 0.38(2.63)b
0.40(2.47)a
(n + g + d) �1.14(�1.36)
�1.25(�1.56)
Education 0.47(4.85)b
0.48(5.12)b
Labor standards 0.40(2.31)a
0.32(2.47)a
Statistical tests
R2 0.56 0.58Hansen test na 0.549
(0.46)Partial R2 (excluded
instruments)0.22 0.37
F-test 21.33 21.77Number of
observations80 80
a 5%.b 1% level of significance.
Table 4. Restricted equatio
Dependant variable: y96 (1) (2)Instrument set IV2 IV1,2
Constant 5.27 (6.67)b 4.97 (7.13)b
Investment—(n + g + d) 0.39 (2.69)b 0.42 (3.04)b
Education 0.48 (4.91)b 0.49 (5.28)b
Labor standards 0.43 (2.49)a 0.33 (2.50)a
R2 0.54 0.57Number of observations 80 80
a 5%.b 1% level of significance.
and school enrollment of men and women.More generally, human capital and labor stan-dards can be seen in a lot of cases as inter-linked.
(ii) The effect in developing countriesWe showed in the previous section that
core labor standards could have a strong im-pact on the long-term per capita income. It istherefore necessary to study if the relationshipis still valid for the developing countries. Theresults (see Tables 3 and 4) are consistentwith the previous ones. Labor Standards also
SLS method (developing countries)
(3) (4) (5) (6)IV2,4 IV2,5 IV2,4,5 IV2,3,5
3.11(1.40)
2.89(1.33)
2.89(1.33)
2.93(1.37)
0.39(2.25)a
0.40(2.87)b
0.40(2.87)b
0.39(2.87)b
�1.20(�1.45)
�1.25(�1.55)
�1.25(�1.55)
�1.24(�1.54)
0.47(4.98)b
0.48(5.10)b
0.48(5.11)b
0.48(5.10)b
0.37(2.25)a
0.33(2.22)a
0.32(2.23)a
0.33(2.56)a
0.57 0.58 0.58 0.580.457 .847 0.848 0.855(0.50) (0.36) (0.65) (0.83)0.30 0.28 0.30 0.38
12.30 15.56 10.35 11.0880 80 80 80
n—developing countries
(3) (4) (5) (6)IV2,4 IV2,5 IV2,4,5 IV2,3,5
5.16 (6.80)b 5.01 (6.92)b 5.00 (6.92)b 5.00 (7.19)b
0.40 (2.81)b 0.42 (2.98)b 0.42 (2.99)b 0.42 (3.01)b
0.49 (5.04)b 0.49 (5.22)b 0.49 (5.23)b 0.49 (5.25)b
0.40 (2.46)a 0.34 (2.35)a 0.34 (2.34)a 0.34 (2.61)b
0.55 0.57 0.57 0.5780 80 80 80

CORE LABOR STANDARDS AND DEVELOPMENT: IMPACT ON LONG-TERM INCOME 27
have a positive effect on long-term per capitaincome in developing countries. The coeffi-cient is now included between 0.32 and 0.43.If we take 0.34 as the average value of theestimated coefficient for labor standards, aone standard deviation change will increasethe GDP by around 30%. 26 It is less than44% observed in the previous section. Thiscan be explained by two elements: (1) thelower value of the standard deviation and(2) the lower value of the estimated coeffi-cient. Nevertheless, the effects are still strongand highly significant.
(iii) Tests of robustnessIn order to make certain that the results pre-
sented in the previous sections are not driven byonly one component of our aggregated index ofcore labor standards, we first estimate an equa-tion in OLS (because of the difficulty to find asmuch instruments as endogeneous variables).Results are given in Table 5. It seems that onlychild labor has a significant impact on long-term per capita income. 27
Table 6. OLS estimation wit
Dependant variable: y96 Coef. t-St
Constant 9.15c 3.1Investment 0.23a 1.7(n + g + d) 0.03 0.0Education 0.24b 2.2Child labor 0.35c 4.5Labor standards without child labor 1.07b 2.1
a 10%.b 5%.c 1% level of significance.
Table 5. OLS estimation with different labor standards
Dependant variable: y96 Coef. t-Stat
Constant 4.68a 2.88Investment 0.36b 3.20(n + g + d) �1.49b �2.78Education 0.09 1.05Number of ratifications �0.02 0.50Child labor 0.47b 7.45Freedom of association 0.008 0.15Discrimination 0.06 1.34Forced labor 0.007 0.16
a 5%.b 1% level of significance.
However, and it is a strong justification forthe use of an aggregated index, we consider thatlabor standards may have complementary ef-fects. We calculate a new aggregated index ofall labor standards except child labor thanksto MCA. We then estimate a new equationincluding both the index of child labor andthe newly aggregated index of all other laborstandards. We use here IV estimations. 28 Bothestimated coefficients are significant (see Table6) justifying our choice of measuring the effectsof all core labor standards jointly. Both prohi-bition of child labor and the enforcement of allother standards have a positive impact on percapita income.
4. CONCLUSION AND IMPLICATION
There is at present an international consensusto recognize four core labor standards as funda-mental rights of workers. These standards areprohibition of forced labor, prohibition of childlabor, freedom of association and collective bar-gaining, and prohibition of discrimination.
The first contribution of this paper is to buildan aggregated index of the effective enforce-ment of these core labor standards. In orderto do this, we identify reliable data and buildseveral indexes of respect of each of these stan-dards. Using MCA, we endogenously attributea weight for each standard according to theirdiscriminating power.
The second contribution of this paper is the re-sult, that, overall, a good enforcement of core la-bor standards has a positive and significantimpact on long-term per capita income. Coun-tries with same characteristics of investment, hu-man capital, and labor force could have differentgrowth path depending on their level of labor
h different labor standards
at With restriction Coef. t-Stat
6 8.45c 9.815 Investment—(n + g + d) 0.23a 1.6731 0.23b 2.291 0.35c 4.502 1.01c 2.93

28 WORLD DEVELOPMENT
standards. This result is obtained by correctingthe problem of endogeneity using the instrumen-tal variables and TSLS method. Following astrict methodology, we show that the instru-ments proposed are valid and pertinent. This re-sult is valid both for a World sample and fordeveloping countries.
These results are suggestive and call for futureresearch on this field. We acknowledge the fol-lowing limitations of this empirical work. First,the labor standards indicators, considering gen-der discrimination and child labor, are definedin terms of human capital outcomes. This is nec-essary to have a good estimation of the effectivelevel of labor standards. Second, it is not possibleto have a temporal analysis and to control forcountry-specific effects, due to the lack of reliabledata on labor standards.
We identify in this paper some empiricalfindings of the impact on labor standardson long-term per capita income. We suggesttwo directions for future researches. First, atheoretical approach seems necessary to moti-vate these empirical evidences. This was, how-ever, out of the scope of this paper. Yet, theexplanation of theoretical linkages between la-bor standards, labor productivity, and humancapital can provide a useful explanation tothe empirical evidences observed here. Sec-ond, we think it is necessary to build a tem-poral index of core labor standards in orderto give a dynamical dimension to our results.It will also be useful to take into account thecountry specific effects which we have beenunable to account for since this study has across-country dimension.
NOTES
1. We first estimate the model for the year 1996 for alarge panel of countries (104) and then only fordeveloping countries. Because of a lack of temporaldata concerning labor standards, it is not possible tomake a temporal analysis.
2. See the conclusions of the Social Summit of Copen-hagen (1995), the WTO declaration of Singapore (1996)or the ILO declaration on fundamental Rights ofWorkers (1998).
3. See Appendix 1: ‘‘Core Labor Standards and ILOconventions.’’
4. The methodology used is quite closed to the one ofGranger (2005). We build a set of indexes measuringdifferent core labor standards. However, our index isavailable for a larger number of countries while the oneof Granger is more precise for a more limited number ofcountries.
5. Further explanations concerning the methodologyused to build each index are available upon request.
6. NRRaw ¼ N1�ðN2Þ211776 with ce:italic>11
the number ofconventions ratified and ce:italic>12
the number of core
conventionsratified.
7. CLAdjusted
¼MAX CLRaw ;CLRaw þ Percentage of children who does not go to primary school
2
� �:
8. Estimation of ILO (2002).
9. Ghai (2003) considers that this category of indicatoris based on the outcome of freedom of association interms of number or proportion of workers belonging toorganizations concerned with work-related matters. In
general, the higher the union density is, the stronger the
defence of workers interests in negotiations with employ-
ers and the government, and the greater the participation
by workers in matters affecting their work. However,there are different problems. Unionization rate is alsobased on historical traditions or political systems (Jose,2002). Ghai (2003) also argues that it is a problem fordeveloping countries because of the small size of thelabor force in the formal economy. Nevertheless, it is theonly index available based on the outcome of freedom ofassociation and therefore is useful for our study.
10. More precisely, we should speak about genderinequality rather than gender discrimination especiallyconcerning employment rate. As noticed by Busse andSpielmann (2006) concerning employment rate, as we
cannot determine whether differences in labor market
participation rates are voluntary or not, we prefer to use
the term gender inequality rather than discrimination.
11. However, we will compare these results with theones obtained using individual sub-component of thisindex. See the part ‘‘Robustness.’’
12. Correspondence analysis has been relatively seldomused in social science research in the united Kingdom orin the United States. However, the French scientists, forexample, use much more this technique, following thework of Benzecri (1992).
CORE LABOR STANDARDS AND DEVELOPMENT: IMPACT ON LONG-TERM INCOME 29
13. In the MRW model, total factor productivity isassumed to be equal for all countries. This hypothesiswas broadly criticized (see Cohen & Soto (2002) & Hall& Jones (1999)). But we consider that it has no impacton what we try to measure. Indeed, the goal is to test thegeneral impact of labor standards and not the impact ofeach determinant.
14. For OECD countries, they find that countries withcoordinated bargaining system performed better thancountries with less coordinated system in the 1970s andthe 1980s. Results in the 1990s are more ambiguoussuggesting that dynamics benefits are more importantthan static effects.
15. Islam (1995) provides an excellent summary of theMRW model.
16. However, this is not triggered by a drive forcompetitiveness but rather by the underlying demandfor standards.
17. See Gleditsch and Ward (1997) for a detailedpresentation of the index. Basically, this is a combinedindex of several sub-dimension measuring differentaspects of ‘authority’ (competitiveness of political par-ticipation, regulation of political participation, compet-itiveness of executive recruitment, openness of executiverecruitment, constraints on chief executive).
18. The index takes values included between 0 and 5.coding: Not Applicable (0), suppressed (1), restricted,(2), fractional (3), transitional (4), and competitive (5).
19. Coding from 1 to 7. unlimited power (1), interme-diate 3 (2) slight to moderate limitations (3), intermedi-ate 2 (4), substantial limitations (5), intermediate 1 (6),parity or subordination (7).
20. Coding from 1 to 7. Closed (1) Dual: hereditaryand designation (3) dual: hereditary and elections (5)election (7).
21. Coding from 1 to 4. Selection (1), Transitional (2),elections (3).
22. As noticed by Gleditsch and Ward (1997), there isvery little change in the degree of democracy forindividual component over relatively short periods oftime. On average, it takes between two and three decadesbefore one observes a propensity for the authoritycharacteristics to change.
23. See Davenport and Armstrong (2004) for a reviewof the literature on this issue.
24. All variables are in log.
25. The standardized beta coefficient is the coefficientobtained by first standardizing all variables to have amean of 0 and a standard deviation of 1.
26. A one standard deviation change in education willincrease the GDP per capita by around 50%.
27. Each individual index of labor standard takes avalue included between 1 and 5 with 1 for a goodenforcement of labor standards and 5 a weak enforce-ment of such a standard. The standardization of thisvariable is different from the one of the aggregated indexof core labor standards.
28. We use here PARCOMP as instrument. However,results are equivalent with the use of other subsets ofinstruments (results not reproduced here).
REFERENCES
Aidt, T., & Tzannatos, Z. (2002). Unions and collectivebargaining: Economic effects in a global environment.Directions in Development series (Vol. 168, p. 3).Washington, DC: The World Bank.
Altonji, J., & Blank, R. (1999). Race and gender in labormarket. In O. Ashenfelter, & D. Card (Eds.),Handbook of labor economics (pp. 3143–3259). Else-vier Science.
Anti-Slavery International & ICFTU (2001). Forcedlabour in the 21st century. Brussels and London:Anti-Slavery International.
Bagwell, K., & Staiger, R. W. (2000). The simpleeconomics of Labor Standards and GATT. In Socialdimensions of U.S. trade policies (pp. 195–231). Ann
Arbor: University of Michigan Press, Studies inInternational Economics.
Bardham, P. (1993). Symposium on democracy anddevelopment. Journal of Economic Perspectives, 7,45–49.
Barro, R. (1996). Democracy and growth. Journal ofEconomic Growth, 1, 1–27.
Barro, R. (1997). Determinants of economic growth: Across-country empirical study. Cambridge: MITPress.
Barro, R., & Lee, J. (1996). International measures ofSchooling Years and Schooling Quality. AmericanEconomic Review, 86(2), 407–443.
30 WORLD DEVELOPMENT
Barro, R., & Lee, J. (2000). International data oneducational attainment. Updates and implications,NBER working paper, 7911.
Beaulieu, E., & Gaisford, J. (2002). The ‘LemonsProblem’ in international trade policy. World Econ-omy, 25(1), 59–78.
Benabou, R. (1996). Equity and efficiency in humancapital investment: The local connection. Review ofEconomic Studies, 62, 237–264.
Benzecri, J. (1992). Correspondence analysis handbook.New York: Marcel Dekker.
Bescond, D., Chataignier, A., & Mehran, F. (2003).Seven indicators to measure decent work: An inter-national comparison. International Labor Review,142(2), 179–211.
Bourdieu, P., & Passeron, J. (1977). Reproduction ineducation, society and culture. London: Sage.
Brown, D. K. (2000). International Standards in theWorld Trade Organization and the InternationalLabor Organization. Federal Reserve Bank of St.Louis Review, 82(4), 105–126.
Brown, D. K., Deardorff, A. V., & Stern, R. M.(1996). International labor standards and trade: Atheoretical analysis. In J. Bhagwati, & R. Hudec(Eds.), Fair trade and harmonization: Prerequisitesfor free trade? Cambridge and London: MITPress.
Brown, D. K., Deardorff, A. V., & Stern, R. M. (2003).The effects of multinational production on wages andworking conditions in developing countries. NBERworking paper, W.9669.
Busse, M., & Braun, S. (2003). Trade and investmenteffects of forced labor. An empirical assessment.International Labor Review, 142(1), 49–71.
Busse, M., & Spielmann, C. (2006). Gender inequalityand trade. Review of International Economics, 14(3),362–379.
Carothers, T. (1994). Democracy and human rights:Policy allies or rivals? The Washington Quarterly,17(3), 109–120.
Casella, A. (1996). Free trade and evolving standards. InJ. Bhagwati, & R. Hudec (Eds.), Fair trade andharmonization: Prerequisites for free trade?(pp. 119–156). Cambridge: MIT Press.
Cattell, R. B. (1966). The Scree Test for the Number ofFactors. Multivariate Behavorial Research, 1(2),245–276.
Chamberlain, D. & Van Der Berg, S. (2002). Earningsfunctions, labor market discrimination and quality ofeducation in South Africa. Stellenbosch workingpapers. 2/2002/.
Coate, S., & Loury, G. (1993). Will affirmative actionpolicies eliminate negative stereotypes? AmericanEconomic Review, 83(5), 1220–1240.
Cohen, D., & Soto, M. (2002). Why are poor coun-tries poor? A message of hope which involves aresolution of a Becker/Lucas Paradox. CEPR DP3528.
Coleman, J. S. (1990). Foundation of social theory.Cambridge and London: The Belknap Press ofHarvard University.
Committee for Economic Development (2001). Fromprotest to progress: Addressing labor and environ-
mental conditions through freer trade. Report ofthe Research and Policy Committee of the Com-mittee for Economic Development, WashingtonDC.
Dahl, R. (1966). Political opposition in Western democ-racies. New Haven: Yale University Press.
Davenport, C., & Armstrong, D. A. (2004). Democracyand the violation of Human Rights: A statisticalanalysis from 1976 to 1996. American Journal ofPolitical Science, 48(3), 538–554.
De Gre, G. (1964). Freedom and social structure.American Sociological Review, 11.
De Jouvenal, B. (1945). On power: Its nature and thehistory of growth. Boston: Beacon Press.
Durham, J. (1999). Economic growth and politicalregimes. Journal of Economic Growth, 4, 81–111.
Durlauf, S. (1999). A theory of persistent incomeinequality. Journal of Economic Growth, 1(1),75–93.
Fox, G., & Nolte, G. (1995). Intolerant democracies.American Journal of International Law, 36(1),1–70.
Ghai, D. (2003). Decent work: Concepts and indicators.International Labor Review, 142(2), 121–157.
Gleditsch, K. S., & Ward, M. (1997). A re-examina-tion of democracy and autocracy in modernpolitics. Journal of Conflict Resolution, 41(3),361–383.
Gleditsch, K. S. (2003). Modified polity P4 and P4Ddata. Version 1.0. URL: <http://weber.ucsd.edu/kgledits/Polity.html>.
Goldstein, R. J. (1978). Political repression in ModernAmerica. Cambridge: Schenkman Publishing Com-pany.
Granger, C. (2005). Normes de travail fondamentales etechanges Nord-Sud. Economie Internationale, 101,47–62.
Greenacre, M. (1984). Theory and applications forcorrespondence analysis. London: Academic Press.
Griswold, D.T. (2001). Trade, labor and the environ-ment: How blue and green sanctions threaten higherstandards. Trade Policy Analysis, CATO Institute,August 2, 2001, No. 15.
Hall, R., & Jones, C. (1999). Why do some countriesproduce so much more output per worker thanothers? Quarterly Journal of Economics, 114(1),83–116.
Heston, A., Summers, R. & Atten, B. (2002). PennWorld Table (PWT) version 6.1. Center for Interna-tional Comparisons at the University of Pennsylva-nia (CICUP).
ILO (1998). Understanding rights at work. Declarationon fundamental principles and rights at work.International Labor Organization, Geneva.
ILO (2001). Stopping forced labour. In Internationallabour conference, 89th session 2001, Report I(B).ILO, Geneva.
ILO (2002). Every child counts: New global estimationof child labor. Discussion paper IPEC programme,ILO. ILO, Geneva.
Islam, N. (1995). Growth empirics: A panel dataapproach. Quarterly Journal of Economics, 110(4),1127–1170.
CORE LABOR STANDARDS AND DEVELOPMENT: IMPACT ON LONG-TERM INCOME 31
Jolliffe, D., & Campos, M. (2005). Does market liber-alisation reduce gender discrimination? Lessons fromHungary, 1986 to 1998. Labor Economics, 12(1),1–22.
Jose, A. (2002). Organized labor in the 21st century.Geneva: International Institute for Labour Stud-ies.
Kucera, D. (2001). Measuring fundamental rights atwork. Statistical Journal, 18(2–3), 175–188.
Kucera, D., & Sarna, R. (2004). How do Trade Unionrights affect trade competitiveness? Policy Integra-tion Department Working Papers No. 39. Geneva,ILO.
Loury, G. (1977). A dynamic theory of racial incomedifferences. In P. Wallace, & A. Lamond (Eds.),Women, minorities and employment discrimination.Lexington, MA: Hearth and Co.
Lundberg, S., & Startz, R. (1998). On the persistence ofracial inequality. Journal of Labor Economics, 16(2),292–324.
Mankiw, N. G., Romer, D., & Weil, D. (1992). Acontribution to the empirics of economicgrowth. Quarterly Journal of Economics, 107,407–438.
Martin, W., & Maskus, K. (2001). Core labor standardsand competitiveness. Implications for global tradepolicy. Review of International Economy, 9(2),317–328.
Maskus, K. E. (1997). Should Core Labor Standards beimposed through international trade policy? WorldBank research working paper, 1817.
Mills, C. (1956). The power of elite. New York: OxfordUniversity Press.
Mosca, G. (1896). Elementi di Scienza Politica. Roma:Bocca.
Murdoch, J. C., & Sandler, T. (2002). Economic growth,civil wars and spatial spillovers. Journal of ConflictResolution, 46(1), 91–110.
Oaxaca, R. (1973). Male-Female Wage Differentials inUrban Labor Markets. International Economic Re-view, 14(3), 693–709.
OECD (1996). Trade, employment and labor standards: Astudy of core worker’s right and international trade.Paris, France: OECD.
OECD (2004). Institutional efficiency and its determi-nants: The role of political factors in economicgrowth. Development Center Studies. OECD Devel-opment Center. Paris.
Pareto, V. (1916). Trattado di Sociologia generale.Firenze: Barbera.
Rawls, J. (1971). A theory of justice. Cambridge:Harvard University Press.
Rummel, R. J. (1997). Power kills. New Brunswick:Transaction Publishers.
Russel, B. (1993). Power. New York: Routledge.Solow, R. M. (1956). A contribution to the theory of
economic growth. Quarterly Journal of Economics,LXX, 65–94.
Srinivasan, T. N. (2004). Labor standards and interna-tional trade. Labor History, 45(4), 509–516.
Staerkle, C., Clemence, A., & Doise, W. (1999). Repre-sentation of Human Rights across different nationalcontexts: The role of democratic and non-democratic
populations and governments. European Journal ofSocial Psychology, 28, 207–226.
Stern, R. M. (1999). Labour standard and internationaltrade. Integration and Trade, 3(7–8), 15–38.
US Department of State (2003). Country reports onhuman rights practices 2002. Bureau of Democracy,Human Rights and Labor.
APPENDIX 1. CORE LABORSTANDARDS AND ILO CONVENTIONS
Adopted in 1998, the ILO Declaration onFundamental Principles and Rights at Workis an expression of commitment by govern-ments, employers’ and workers’ organizationsto uphold basic human values—values thatare vital to our social and economic lives.
• Freedom of association and the right to col-lective bargaining:
– The Freedom of Association and Protec-tion of the Right to Organize Convention(No. 87), 1948, 142 ratifications.– The Right to Organize and CollectiveBargaining Convention (No. 98), 1949,154 ratifications.• The elimination of forced and compulsorylabor:– The Forced labor Convention (No. 29),1930, 163 ratifications.– The abolition of Forced labor Conven-tion (No. 105), 1957, 161 ratifications.
• The abolition of child labor:– Minimum Age Convention (No. 138),1973, 131 ratifications.– The Abolition of the Worst Forms ofChild labor Convention (No. 182), 1998,147 ratifications.
• The elimination of discrimination in theworkplace:– The Equal Remuneration Convention(No. 100), 1951, 159 ratifications.– The Discrimination (Employment andOccupation) Convention (No. 111), 1958,161 ratifications.
The ILO’s standards take the form of inter-national labor Conventions and Recommen-dations. The ILO’s Conventions areinternational treaties, subject to ratificationby ILO member States. Its Recommendationsare nonbinding instruments—typically dealingwith the same subjects as Conventions—which set out guidelines which can orient na-tional policy and action. Both forms are
32 WORLD DEVELOPMENT
intended to have a concrete impact on work-ing conditions and practices in every countryof the world. However, countries can decideto not ratify conventions. When ratified, thesepromotional standards oblige a country touse means appropriate to national circum-stance to promote these goals—and to be ableto demonstrate progress over time in achiev-ing the goals. ILO cannot apply sanctions.
Moreover, United Nations have adoptedseveral measures concerning Human Rights
APPENDIX 2. THE SCALAR INDEX OF CORE LABOR STANDARDS
Descriptive statistics of variables included in the scalar index of core labor standards
N = 155 countries RatificationsILO
Childlabor
Freedom ofassociation
Nondiscrimination Forcedlabor
Frequencies of modalitiesHighest 21.94 28.39 20.00 20.00 46.45High 21.29 18.71 20.65 16.13 28.39Medium 20.65 21.94 19.35 16.77 07.10Low 17.42 15.48 21.29 19.35 10.96Lowest 18.70 15.48 18.71 27.75 07.10Total 100 100 100 100 100
Correlation matrixILO ratifications 1Child labor 0.364** 1Freedom of Association 0.461** 0.474** 1Nondiscrimination 0.073 0.355** 0.282** 1Forced Labor 0.293** 0.286** 0.399** 0.282** 1
Weight used in the scalar indexArithmetic mean 0.200 0.200 0.200 0.200 0.200MCA 0.189 0.243 0.266 0.127 0.176
NB **5% significant.
MCA summary
N = 155 Countries Principals F1 F2 F3 F4
Eigen value 0.512 0.320 0.294 0.276% Total inertia 0.725 0.108 0.066 0.043
% Cum. total inertia 0.725 0.833 0.942 0.967
Variables Items Coord. (F1) QLT Test value CTR (%)ILO’s ratifications (NR) Highest 1.236 0.429 8.129** 13.094
High �0.061 0.001 �0.395 0.031Medium �0.316 0.026 �1.997** 0.803
Low �0.267 0.015 �1.523 0.486Lowest �0.782 0.141 �4.656** 4.474
Total 18.888
CA summary—continuedN = 155 CountriesPrincipalsF1F2F3F4Child labor
Mand more precisely Rights of Workers. Fol-lowing the Universal Declaration of HumanRights, the UN has adopted two covenants:the International Covenant on Economic, So-cial and Cultural Rights (1966) and the Inter-national Covenant on Civil and PoliticalRights (1966) (prohibition of forced labor).These covenants are ratified by more coun-tries than the ILO core conventions. TheUN has also adopted a convention on theRights of the Child (1989).
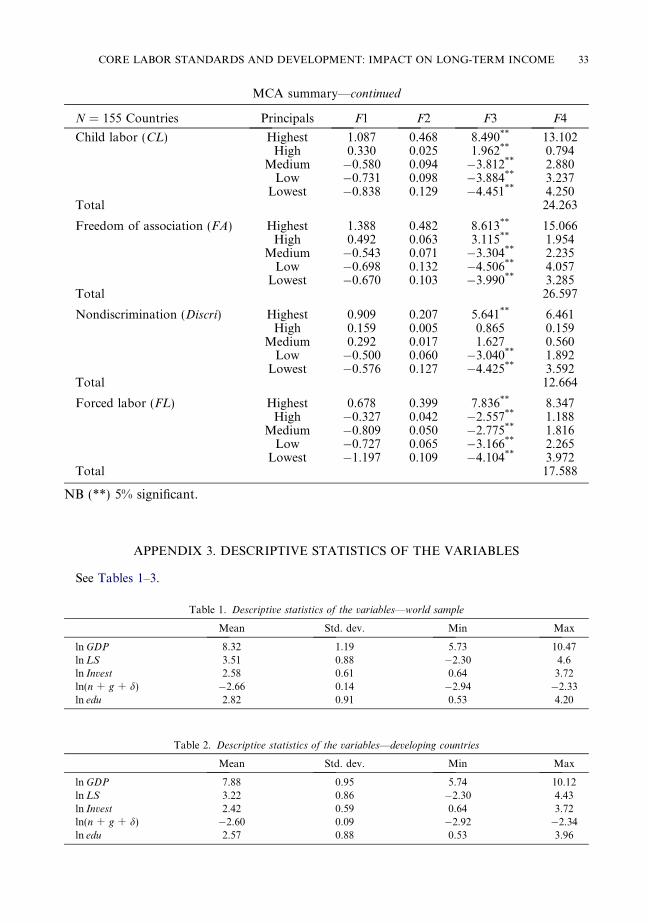
MCA summary—continued
N = 155 Countries Principals F1 F2 F3 F4
Child labor (CL) Highest 1.087 0.468 8.490** 13.102High 0.330 0.025 1.962** 0.794
Medium �0.580 0.094 �3.812** 2.880Low �0.731 0.098 �3.884** 3.237
Lowest �0.838 0.129 �4.451** 4.250Total 24.263
Freedom of association (FA) Highest 1.388 0.482 8.613** 15.066High 0.492 0.063 3.115** 1.954
Medium �0.543 0.071 �3.304** 2.235Low �0.698 0.132 �4.506** 4.057
Lowest �0.670 0.103 �3.990** 3.285Total 26.597
Nondiscrimination (Discri) Highest 0.909 0.207 5.641** 6.461High 0.159 0.005 0.865 0.159
Medium 0.292 0.017 1.627 0.560Low �0.500 0.060 �3.040** 1.892
Lowest �0.576 0.127 �4.425** 3.592Total 12.664
Forced labor (FL) Highest 0.678 0.399 7.836** 8.347High �0.327 0.042 �2.557** 1.188
Medium �0.809 0.050 �2.775** 1.816Low �0.727 0.065 �3.166** 2.265
Lowest �1.197 0.109 �4.104** 3.972Total 17.588
NB (**) 5% significant.
CORE LABOR STANDARDS AND DEVELOPMENT: IMPACT ON LONG-TERM INCOME 33
APPENDIX 3. DESCRIPTIVE STATISTICS OF THE VARIABLES
See Tables 1–3.
Table 1. Descriptive statistics of the variables—world sample
Mean Std. dev. Min Max
ln GDP 8.32 1.19 5.73 10.47ln LS 3.51 0.88 �2.30 4.6ln Invest 2.58 0.61 0.64 3.72ln(n + g + d) �2.66 0.14 �2.94 �2.33ln edu 2.82 0.91 0.53 4.20
Table 2. Descriptive statistics of the variables—developing countries
Mean Std. dev. Min Max
ln GDP 7.88 0.95 5.74 10.12ln LS 3.22 0.86 �2.30 4.43ln Invest 2.42 0.59 0.64 3.72ln(n + g + d) �2.60 0.09 �2.92 �2.34ln edu 2.57 0.88 0.53 3.96

Table 3. Correlation matrix
ln GDP ln LS ln Invest ln(n + g + d) ln edu
ln GDP 1ln LS 0.59 1ln Invest 0.72 0.44 1ln(n + g + d) �0.69 �0.53 �0.47 1ln edu 0.75 0.43 0.64 �0.54 1
APPENDIX 4. RELEVANCE AND VALIDITY OF INSTRUMENTS
See Tables 1 and 2.
Table 1. Instruments relevance
Excluded instrument Partial R2 F-stat
(1) Combined polity score 0.0141 1.04 (0.31)(2) Competitiveness of participation 0.2412 31.47 (0.000)(3) Executive constraints 0.0024 0.24 (0.62)(4) Openness of executive recruitment 0.00 0.00 (0.96)(5) Competitiveness of executive recruitment 0.004 0.42 (0.52)
P-values in parentheses.
Table 2. Instruments validity and relevance
Excluded instrument Hansen-test Diff-Hansen Subset of instruments tested Partial R2 F-stat
(1) and (2) 1.121 0.3785 29.84(0.29) (0.000)
(2) and (3) 3.041 0.35 26.38(0.08) (0.00)
(2) and (4) 0.454 0.2687 18.01(0.50) (0.00)
(2) and (5) 1.013 0.3115 22.17(0.31) (0.00)
(1), (2) and (4) 1.158 0.676 (1) 0.3788 19.71(0.56) (0.41) (0.000)
(1), (2) and (4) 1.158 0.64 (2) 0.3788 19.71(0.56) (0.42) (0.000)
(1), (2) and (4) 1.158 0.036 (4) 0.3788 19.71(0.56) (0.85) (0.000)
(1), (2) and (5) 1.168 0.048 (5) 0.3815 19.95(0.56) (0.83) (0.000)
(2), (4), (5) 1.032 0.3134 14.76(0.60) (0.000)
(1), (2), (4) and (5) 1.170 0.3893 15.30(0.76) (0.000)
P-values in parentheses.
34 WORLD DEVELOPMENT
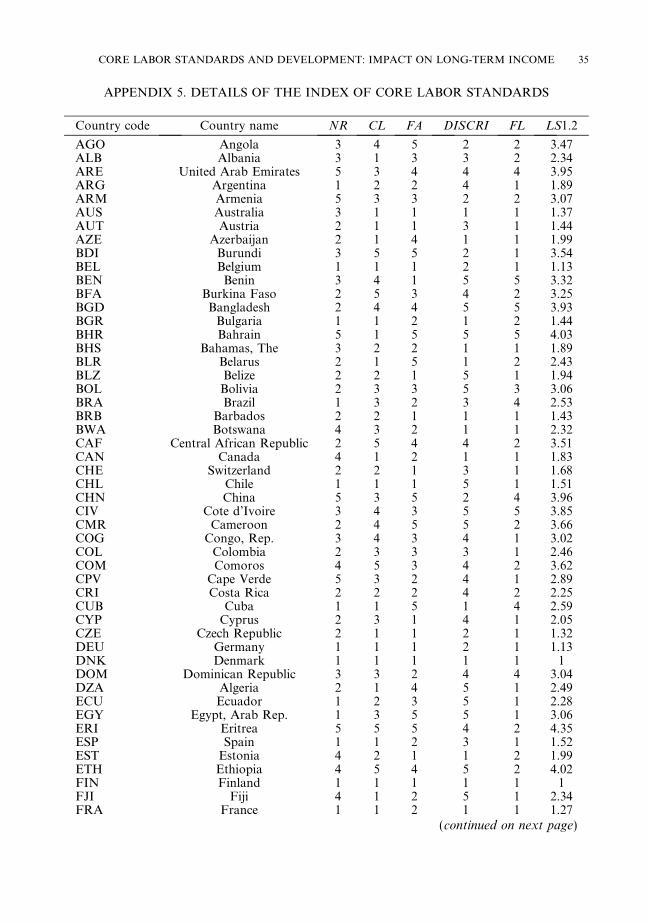
APPENDIX 5. DETAILS OF THE INDEX OF CORE LABOR STANDARDS
Country code Country name NR CL FA DISCRI FL LS1.2
AGO Angola 3 4 5 2 2 3.47ALB Albania 3 1 3 3 2 2.34ARE United Arab Emirates 5 3 4 4 4 3.95ARG Argentina 1 2 2 4 1 1.89ARM Armenia 5 3 3 2 2 3.07AUS Australia 3 1 1 1 1 1.37AUT Austria 2 1 1 3 1 1.44AZE Azerbaijan 2 1 4 1 1 1.99BDI Burundi 3 5 5 2 1 3.54BEL Belgium 1 1 1 2 1 1.13BEN Benin 3 4 1 5 5 3.32BFA Burkina Faso 2 5 3 4 2 3.25BGD Bangladesh 2 4 4 5 5 3.93BGR Bulgaria 1 1 2 1 2 1.44BHR Bahrain 5 1 5 5 5 4.03BHS Bahamas, The 3 2 2 1 1 1.89BLR Belarus 2 1 5 1 2 2.43BLZ Belize 2 2 1 5 1 1.94BOL Bolivia 2 3 3 5 3 3.06BRA Brazil 1 3 2 3 4 2.53BRB Barbados 2 2 1 1 1 1.43BWA Botswana 4 3 2 1 1 2.32CAF Central African Republic 2 5 4 4 2 3.51CAN Canada 4 1 2 1 1 1.83CHE Switzerland 2 2 1 3 1 1.68CHL Chile 1 1 1 5 1 1.51CHN China 5 3 5 2 4 3.96CIV Cote d’Ivoire 3 4 3 5 5 3.85CMR Cameroon 2 4 5 5 2 3.66COG Congo, Rep. 3 4 3 4 1 3.02COL Colombia 2 3 3 3 1 2.46COM Comoros 4 5 3 4 2 3.62CPV Cape Verde 5 3 2 4 1 2.89CRI Costa Rica 2 2 2 4 2 2.25CUB Cuba 1 1 5 1 4 2.59CYP Cyprus 2 3 1 4 1 2.05CZE Czech Republic 2 1 1 2 1 1.32DEU Germany 1 1 1 2 1 1.13DNK Denmark 1 1 1 1 1 1DOM Dominican Republic 3 3 2 4 4 3.04DZA Algeria 2 1 4 5 1 2.49ECU Ecuador 1 2 3 5 1 2.28EGY Egypt, Arab Rep. 1 3 5 5 1 3.06ERI Eritrea 5 5 5 4 2 4.35ESP Spain 1 1 2 3 1 1.52EST Estonia 4 2 1 1 2 1.99ETH Ethiopia 4 5 4 5 2 4.02FIN Finland 1 1 1 1 1 1FJI Fiji 4 1 2 5 1 2.34FRA France 1 1 2 1 1 1.27
(continued on next page)
CORE LABOR STANDARDS AND DEVELOPMENT: IMPACT ON LONG-TERM INCOME 35
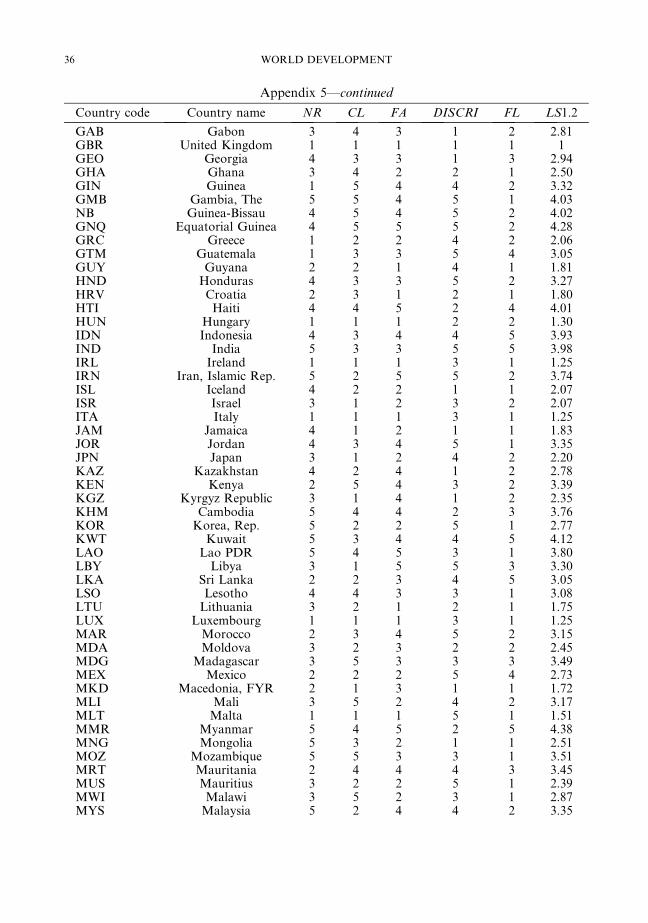
Appendix 5—continued
Country code Country name NR CL FA DISCRI FL LS1.2
GAB Gabon 3 4 3 1 2 2.81GBR United Kingdom 1 1 1 1 1 1GEO Georgia 4 3 3 1 3 2.94GHA Ghana 3 4 2 2 1 2.50GIN Guinea 1 5 4 4 2 3.32GMB Gambia, The 5 5 4 5 1 4.03NB Guinea-Bissau 4 5 4 5 2 4.02GNQ Equatorial Guinea 4 5 5 5 2 4.28GRC Greece 1 2 2 4 2 2.06GTM Guatemala 1 3 3 5 4 3.05GUY Guyana 2 2 1 4 1 1.81HND Honduras 4 3 3 5 2 3.27HRV Croatia 2 3 1 2 1 1.80HTI Haiti 4 4 5 2 4 4.01HUN Hungary 1 1 1 2 2 1.30IDN Indonesia 4 3 4 4 5 3.93IND India 5 3 3 5 5 3.98IRL Ireland 1 1 1 3 1 1.25IRN Iran, Islamic Rep. 5 2 5 5 2 3.74ISL Iceland 4 2 2 1 1 2.07ISR Israel 3 1 2 3 2 2.07ITA Italy 1 1 1 3 1 1.25JAM Jamaica 4 1 2 1 1 1.83JOR Jordan 4 3 4 5 1 3.35JPN Japan 3 1 2 4 2 2.20KAZ Kazakhstan 4 2 4 1 2 2.78KEN Kenya 2 5 4 3 2 3.39KGZ Kyrgyz Republic 3 1 4 1 2 2.35KHM Cambodia 5 4 4 2 3 3.76KOR Korea, Rep. 5 2 2 5 1 2.77KWT Kuwait 5 3 4 4 5 4.12LAO Lao PDR 5 4 5 3 1 3.80LBY Libya 3 1 5 5 3 3.30LKA Sri Lanka 2 2 3 4 5 3.05LSO Lesotho 4 4 3 3 1 3.08LTU Lithuania 3 2 1 2 1 1.75LUX Luxembourg 1 1 1 3 1 1.25MAR Morocco 2 3 4 5 2 3.15MDA Moldova 3 2 3 2 2 2.45MDG Madagascar 3 5 3 3 3 3.49MEX Mexico 2 2 2 5 4 2.73MKD Macedonia, FYR 2 1 3 1 1 1.72MLI Mali 3 5 2 4 2 3.17MLT Malta 1 1 1 5 1 1.51MMR Myanmar 5 4 5 2 5 4.38MNG Mongolia 5 3 2 1 1 2.51MOZ Mozambique 5 5 3 3 1 3.51MRT Mauritania 2 4 4 4 3 3.45MUS Mauritius 3 2 2 5 1 2.39MWI Malawi 3 5 2 3 1 2.87MYS Malaysia 5 2 4 4 2 3.35
36 WORLD DEVELOPMENT

Appendix 5—continued
Country code Country name NR CL FA DISCRI FL LS1.2
NAM Namibia 5 4 3 3 4 3.80NER Niger 3 5 3 5 1 3.39NGA Nigeria 3 4 4 5 2 3.59NIC Nicaragua 1 3 2 3 1 2.00NLD Netherlands 1 1 1 2 1 1.13NOR Norway 1 1 1 1 1 1NPL Nepal 5 5 4 5 5 4.73NZL New Zealand 4 1 2 1 1 1.83OMN Oman 5 3 5 5 3 4.16PAK Pakistan 3 4 4 5 5 4.11PAN Panama 1 2 2 4 1 1.89PER Peru 1 2 3 5 3 2.63PHL Philippines 4 3 2 3 4 3.10PNG Papua New Guinea 3 4 2 4 1 2.75POL Poland 1 1 1 1 1 1PRT Portugal 1 2 1 2 1 1.37PRY Paraguay 3 3 3 5 3 3.25QAT Qatar 5 3 5 4 4 4.21ROM Romania 2 1 1 3 2 1.62RUS Russian Federation 1 1 4 2 2 2.10RWA Rwanda 3 5 5 2 4 4.07SAU Saudi Arabia 5 3 5 5 4 4.34SDN Sudan 4 5 5 5 4 4.64SEN Senegal 2 4 3 3 2 2.88SGP Singapore 5 2 4 4 2 3.35SLB Solomon Islands 5 4 4 1 1 3.28SLE Sierra Leone 4 5 4 5 4 4.37SLV El Salvador 4 3 3 4 2 3.14SVK Slovak Republic 1 1 1 2 1 1.13SVN Slovenia 1 2 1 1 2 1.42SWE Sweden 1 1 1 1 1 1SWZ Swaziland 3 3 4 4 1 3.04SYR Syrian Arab Republic 2 2 5 5 1 3.00TCD Chad 4 5 5 5 1 4.11TGO Togo 4 4 4 5 4 4.13THA Thailand 5 3 3 2 2 3.07TJK Tajikistan 3 2 5 2 4 3.34TKM Turkmenistan 5 1 5 1 3 3.17TTO Trinidad and Tobago 4 1 2 2 1 1.96TUN Tunisia 2 1 4 5 1 2.49TUR Turkey 2 3 4 5 2 3.15TZA Tanzania 3 5 3 2 2 3.18UGA Uganda 4 5 4 3 2 3.76UKR Ukraine 2 3 4 3 2 2.90URY Uruguay 1 2 2 3 1 1.76USA United States 5 1 3 1 1 2.29UZB Uzbekistan 5 3 5 1 1 3.30VEN Venezuela, RB 2 2 4 4 1 2.61VNM Vietnam 5 3 5 2 2 3.61YEM Yemen, Rep. 3 4 5 5 1 3.68ZAF South Africa 4 1 2 3 2 2.26
(continued on next page)
CORE LABOR STANDARDS AND DEVELOPMENT: IMPACT ON LONG-TERM INCOME 37
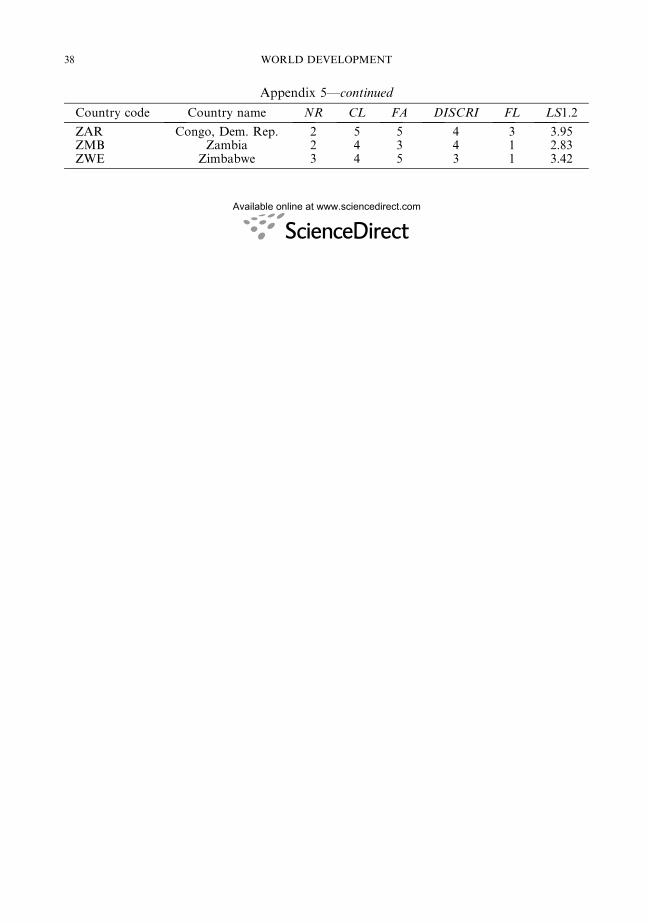
Appendix 5—continued
Country code Country name NR CL FA DISCRI FL LS1.2
ZAR Congo, Dem. Rep. 2 5 5 4 3 3.95ZMB Zambia 2 4 3 4 1 2.83ZWE Zimbabwe 3 4 5 3 1 3.42
38 WORLD DEVELOPMENT
Available online at www.sciencedirect.com