Cordless Power Tool Leader Driven by Technological ...
13
See the last page for disclaimer Page 1 of 13 Equity Research Equity Research Report Company Report 股 票 研 究 创 科 实 业 Techtronic Industries (00669 HK) 公 司 报 告 证 券 研 究 报 告 机 械 行 业 Machinery Sector Company Report: Techtronic Industries (00669 HK) David Feng 冯廷帅 (852) 2509 2113 公司报告:创科实业 (00669 HK) [email protected] 12 November 2020 Cordless Power Tool Leader Driven by Technological Innovations, Initiate With "Accumulate" 技术创新驱动的充电式电动工具领导者,首予“收集” TTI is a global leader of power tools with focus on the North American market. We believe that North America will continue to lead the global power tool market in the incoming five years despite great potential in emerging markets. We expect that TTI will continue to win more market share on its well-positioned branding and strategic focus on cordless technology. TTI's product competitiveness has been strengthened by consistently increasing R&D expenditure and rapidly expanding product family. We believe that TTI will maintain R&D expense ratio above 3%, to significantly outpace its peers. The Home Depot remains as TTI's most powerful distribution channel despite impact from online retailers and the COVID-19 pandemic. In terms of TTI's floor care, we believe a strategic shift towards cordless and carpet washing products will continue to drive its turnaround. We expect TTI's top line and bottom line to grow at a CAGR of 12.5% and 14.7%, respectively, during 2019-2022. We believe that robust sales of power equipment will continue to drive TTI's revenue growth, while floor care will further recover after the strategic shift. Based on an excellent proven record in the past decade plus bright outlook for ongoing product upgrades, we are confident in TTI's sustainable profit margin improvement. Initiate with "Accumulate" and a TP of HK$119.30. We believe that TTI's valuation premium over other major peers could be justified by its higher certainty in consistent improvement in market share and profit margin, despite some short-term pressure on the valuation due to potential reduction of DIY demand once the COVID-19 pandemic is controlled by vaccines. Our TP represents 39.1x/ 34.3x/ 30.2x 2020-2022 PE ratio and 7.3x 2020 PB ratio. 创科实业是一家以北美市场为核心的全球电动工具领导者。尽管新兴市场潜力巨大,我们 认为北美将在未来 5 年内继续引领全球电动工具市场。我们预计凭借其良好的品牌定位以 及在充电式技术上的战略聚焦,创科实业将继续赢得更多市场份额。 创科实业的产品竞争力因持续增加的研发投入和快速扩张的产品系列而得到增强。我们认 为创科实业的研发费用率将维持在 3%以上,显著高于同业。尽管受到电商和新冠疫情的 影响,家得宝仍然是创科实业最为强大的分销渠道。就创科实业的地板护理业务而言,我 们认为向充电式和地毯清洗产品的战略转移将继续带动其好转。 我们预计创科实业 2019-2022 年收入和股东净利将分别以 12.5%和 14.7%的年复合增长 率增长。我们认为,动力设备的强劲销售将继续推动创科实业的收入增长,而地板护理在 战略转型后将进一步复苏。基于过去十年来优秀的业绩表现以及产品持续升级换代的光明 前景,我们对创科实业利润率的持续改善充满信心。 首予“收集”,目标价为 119.30 港元。我们认为创科实业相对其他主要同业的估值溢价, 在其市占率和利润率持续提升的较高确定性下是合理的,尽管一旦新冠疫情被疫苗控制后 DIY 需求可能下滑,估值短期内有一定压力。我们的目标价对应 39.1 倍/ 34.3 倍/ 30.2 倍 的 2020-2022 年市盈率和 7.3 倍的 2020 年市净率。 Rating: Accumulate Initial 评级: 收集 (首次覆盖) 6-18m TP 目标价: HK$119.30 Share price 股价: HK$97.450 Stock performance 股价表现 [Table_PriceChange] Change in Share Price 股价变动 1 M 1 个月 3 M 3 个月 1 Y 1 年 Abs. % 绝对变动 % (6.8) 17.2 64.4 Rel. % to HS Index 相对恒指变动 % (13.2) 13.4 67.6 Avg. Share price(HK$) 平均股价(港元) 105.6 98.6 73.1 Source: Bloomberg, Guotai Junan International. [Table_ Year End Turnover Net Profit EPS EPS PER BPS PBR DPS Yield ROE 年结 收入 股东净利 每股净利 每股净利变动 市盈率 每股净资产 市净率 每股股息 股息率 净资产收益率 12/31 (US$ m) (US$ m) (US$) (△ %) (x) (US$) (x) (US$) (%) (%) 2018A 7,021 552 0.302 17.5 41.2 1.672 7.4 0.113 0.9 19.1 2019A 7,667 615 0.337 11.6 37.1 1.855 6.7 0.133 1.1 19.1 2020F 8,743 716 0.391 16.0 32.2 2.100 6.0 0.162 1.3 19.8 2021F 9,809 817 0.446 14.1 28.2 2.373 5.3 0.193 1.5 19.9 2022F 10,927 929 0.506 13.5 24.8 2.672 4.7 0.228 1.8 20.1 Shares in issue (m) 总股数 (m) 1,832.3 Major shareholder 大股东 Horst Julius Pudwill 20.0% Market cap. (HK$ m) 市值 (HK$ m) 178,557.6 Free float (%) 自由流通比率 (%) 61.7 3 month average vol. 3 个月平均成交股数 (‘000) 3,360.9 FY20 Net gearing (%) FY20 净负债/股东资金 (%) Net cash 52 Weeks high/low (HK$) 52 周高/低 (HK$) 115.000 / 42.100 FY20 Est. NAV (HK$) FY20 每股估值(港元) 119.3 Source: the Company, Guotai Junan International. -40% -20% 0% 20% 40% 60% 80% 100% Nov-19 Feb-20 May-20 Aug-20 Nov-20 TTI HSI Index
-
Upload
khangminh22 -
Category
Documents
-
view
0 -
download
0
Transcript of Cordless Power Tool Leader Driven by Technological ...

See the last page for disclaimer Page 1 of 13
Eq
uit
y R
ese
arc
h
Eq
uit
y R
ese
arc
h R
ep
ort
证 券
研 究
报 告
Co
mp
an
y R
ep
ort
股
票
研
究
[Tabl
e_Inf
o2]
创
科
实
业
Te
ch
tro
nic
In
du
str
ies
(0
066
9 H
K)
公
司
报
告
证
券
研
究
报
告
[Tab
le_I
nfo1
]
机
械
行
业
Ma
ch
ine
ry S
ec
tor
[Table_Title] Company Report: Techtronic Industries (00669 HK)
David Feng 冯廷帅
(852) 2509 2113
公司报告: 创科实业 (00669 HK) [email protected]
12 November 2020
[Table_Summary] Cordless Power Tool Leader Driven by Technological
Innovations, Initiate With "Accumulate" 技术创新驱动的充电式电动工具领导者,首予“收集” TTI is a global leader of power tools with focus on the North American
market. We believe that North America will continue to lead the global power
tool market in the incoming five years despite great potential in emerging
markets. We expect that TTI will continue to win more market share on its
well-positioned branding and strategic focus on cordless technology.
TTI's product competitiveness has been strengthened by consistently
increasing R&D expenditure and rapidly expanding product family. We
believe that TTI will maintain R&D expense ratio above 3%, to significantly
outpace its peers. The Home Depot remains as TTI's most powerful
distribution channel despite impact from online retailers and the COVID-19
pandemic. In terms of TTI's floor care, we believe a strategic shift towards
cordless and carpet washing products will continue to drive its turnaround.
We expect TTI's top line and bottom line to grow at a CAGR of 12.5%
and 14.7%, respectively, during 2019-2022. We believe that robust sales of
power equipment will continue to drive TTI's revenue growth, while floor care
will further recover after the strategic shift. Based on an excellent proven
record in the past decade plus bright outlook for ongoing product upgrades,
we are confident in TTI's sustainable profit margin improvement.
Initiate with "Accumulate" and a TP of HK$119.30. We believe that TTI's
valuation premium over other major peers could be justified by its higher
certainty in consistent improvement in market share and profit margin, despite
some short-term pressure on the valuation due to potential reduction of DIY
demand once the COVID-19 pandemic is controlled by vaccines. Our TP
represents 39.1x/ 34.3x/ 30.2x 2020-2022 PE ratio and 7.3x 2020 PB ratio.
创科实业是一家以北美市场为核心的全球电动工具领导者。尽管新兴市场潜力巨大,我们
认为北美将在未来 5 年内继续引领全球电动工具市场。我们预计凭借其良好的品牌定位以
及在充电式技术上的战略聚焦,创科实业将继续赢得更多市场份额。
创科实业的产品竞争力因持续增加的研发投入和快速扩张的产品系列而得到增强。我们认
为创科实业的研发费用率将维持在 3%以上,显著高于同业。尽管受到电商和新冠疫情的
影响,家得宝仍然是创科实业最为强大的分销渠道。就创科实业的地板护理业务而言,我
们认为向充电式和地毯清洗产品的战略转移将继续带动其好转。
我们预计创科实业 2019-2022 年收入和股东净利将分别以 12.5%和 14.7%的年复合增长
率增长。我们认为,动力设备的强劲销售将继续推动创科实业的收入增长,而地板护理在
战略转型后将进一步复苏。基于过去十年来优秀的业绩表现以及产品持续升级换代的光明
前景,我们对创科实业利润率的持续改善充满信心。
首予“收集”,目标价为 119.30 港元。我们认为创科实业相对其他主要同业的估值溢价,
在其市占率和利润率持续提升的较高确定性下是合理的,尽管一旦新冠疫情被疫苗控制后
DIY 需求可能下滑,估值短期内有一定压力。我们的目标价对应 39.1 倍/ 34.3 倍/ 30.2 倍
的 2020-2022 年市盈率和 7.3 倍的 2020 年市净率。
[Table_Rank] Rating: Accumulate
Initial
评级: 收集 (首次覆盖)
[Table_Price] 6-18m TP 目标价: HK$119.30
Share price 股价: HK$97.450
Stock performance
股价表现
[Table_QuotePic]
[Table_PriceChange] Change in Share Price
股价变动
1 M
1 个月
3 M
3 个月
1 Y
1 年
Abs. %
绝对变动 % (6.8) 17.2 64.4
Rel. % to HS Index
相对恒指变动 % (13.2) 13.4 67.6
Avg. Share price(HK$)
平均股价(港元) 105.6 98.6 73.1
Source: Bloomberg, Guotai Junan International.
[Table_Profit] Year End Turnover Net Profit EPS EPS PER BPS PBR DPS Yield ROE
年结 收入 股东净利 每股净利 每股净利变动 市盈率 每股净资产 市净率 每股股息 股息率 净资产收益率
12/31 (US$ m) (US$ m) (US$) (△ %) (x) (US$) (x) (US$) (%) (%)
2018A 7,021 552 0.302 17.5 41.2 1.672 7.4 0.113 0.9 19.1
2019A 7,667 615 0.337 11.6 37.1 1.855 6.7 0.133 1.1 19.1
2020F 8,743 716 0.391 16.0 32.2 2.100 6.0 0.162 1.3 19.8
2021F 9,809 817 0.446 14.1 28.2 2.373 5.3 0.193 1.5 19.9
2022F 10,927 929 0.506 13.5 24.8 2.672 4.7 0.228 1.8 20.1
[Table_BaseData] Shares in issue (m) 总股数 (m) 1,832.3 Major shareholder 大股东 Horst Julius Pudwill 20.0%
Market cap. (HK$ m) 市值 (HK$ m) 178,557.6 Free float (%) 自由流通比率 (%) 61.7
3 month average vol. 3 个月平均成交股数 (‘000) 3,360.9 FY20 Net gearing (%) FY20 净负债/股东资金 (%) Net cash
52 Weeks high/low (HK$) 52 周高/低 (HK$) 115.000 / 42.100 FY20 Est. NAV (HK$) FY20 每股估值(港元) 119.3
Source: the Company, Guotai Junan International.
-40%
-20%
0%
20%
40%
60%
80%
100%
Nov-19 Feb-20 May-20 Aug-20 Nov-20
TTI HSI Index
See the last page for disclaimer Page 2 of 13
[Table_RightMar2]
Te
ch
tro
nic
In
du
str
ies 创
科实业
(0
06
69
HK
)
[Table_RightMar1]
12
No
ve
mb
er
20
20
[Table_PageHeader] Techtronic Industries (00669 HK)
[Table_RightMar2]
Co
mp
an
y R
ep
ort
COMPANY PROFILE
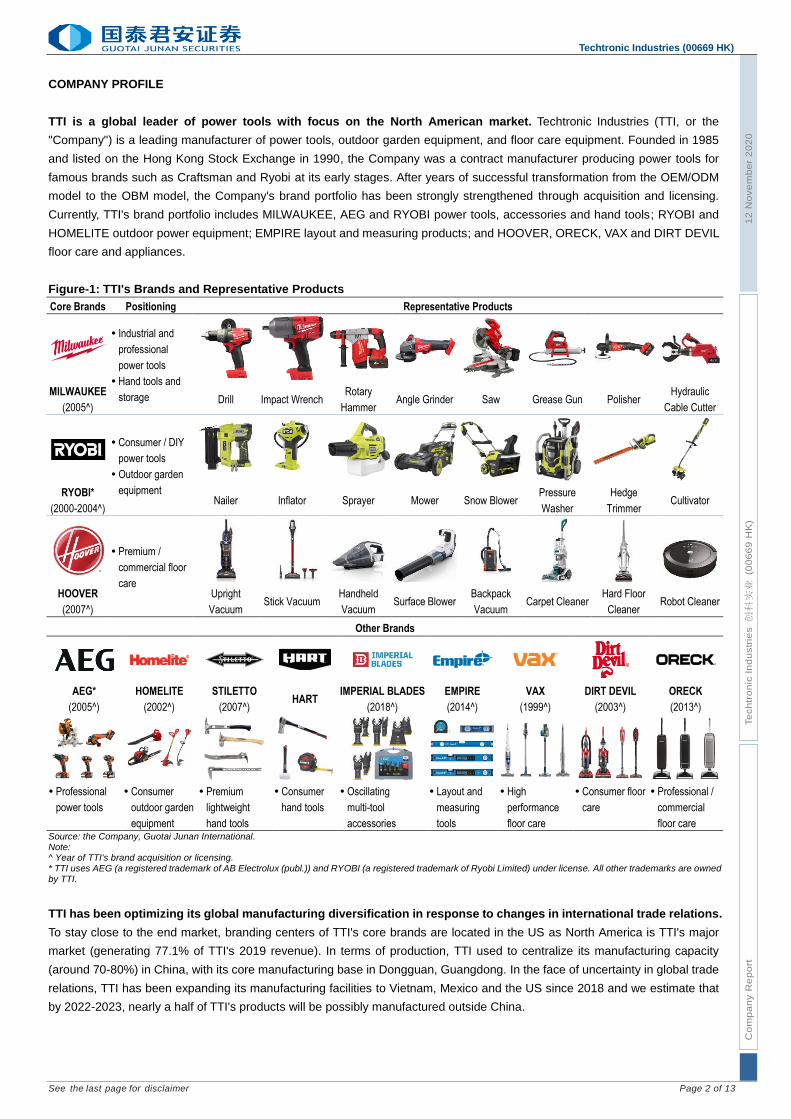
TTI is a global leader of power tools with focus on the North American market. Techtronic Industries (TTI, or the
"Company") is a leading manufacturer of power tools, outdoor garden equipment, and floor care equipment. Founded in 1985
and listed on the Hong Kong Stock Exchange in 1990, the Company was a contract manufacturer producing power tools for
famous brands such as Craftsman and Ryobi at its early stages. After years of successful transformation from the OEM/ODM
model to the OBM model, the Company's brand portfolio has been strongly strengthened through acquisition and licensing.
Currently, TTI's brand portfolio includes MILWAUKEE, AEG and RYOBI power tools, accessories and hand tools; RYOBI and
HOMELITE outdoor power equipment; EMPIRE layout and measuring products; and HOOVER, ORECK, VAX and DIRT DEVIL
floor care and appliances.
Figure-1: TTI's Brands and Representative Products
Core Brands Positioning Representative Products
Industrial and
professional
power tools
Hand tools and
storage
MILWAUKEE
(2005^) Drill Impact Wrench
Rotary
Hammer Angle Grinder Saw Grease Gun Polisher
Hydraulic
Cable Cutter
Consumer / DIY
power tools
Outdoor garden
equipment
RYOBI*
(2000-2004^) Nailer Inflator Sprayer Mower Snow Blower
Pressure
Washer
Hedge
Trimmer Cultivator
Premium /
commercial floor
care
HOOVER
(2007^)
Upright
Vacuum Stick Vacuum
Handheld
Vacuum Surface Blower
Backpack
Vacuum Carpet Cleaner
Hard Floor
Cleaner Robot Cleaner
Other Brands
AEG*
(2005^)
HOMELITE
(2002^)
STILETTO
(2007^) HART
IMPERIAL BLADES
(2018^)
EMPIRE
(2014^)
VAX
(1999^)
DIRT DEVIL
(2003^)
ORECK
(2013^)
Professional
power tools
Consumer
outdoor garden
equipment
Premium
lightweight
hand tools
Consumer
hand tools
Oscillating
multi-tool
accessories
Layout and
measuring
tools
High
performance
floor care
Consumer floor
care
Professional /
commercial
floor care Source: the Company, Guotai Junan International. Note: ^ Year of TTI's brand acquisition or licensing. * TTI uses AEG (a registered trademark of AB Electrolux (publ.)) and RYOBI (a registered trademark of Ryobi Limited) under license. All other trademarks are owned by TTI.
TTI has been optimizing its global manufacturing diversification in response to changes in international trade relations.
To stay close to the end market, branding centers of TTI's core brands are located in the US as North America is TTI's major
market (generating 77.1% of TTI's 2019 revenue). In terms of production, TTI used to centralize its manufacturing capacity
(around 70-80%) in China, with its core manufacturing base in Dongguan, Guangdong. In the face of uncertainty in global trade
relations, TTI has been expanding its manufacturing facilities to Vietnam, Mexico and the US since 2018 and we estimate that
by 2022-2023, nearly a half of TTI's products will be possibly manufactured outside China.

mX9YkWbYaVaXkX9P8Q8OmOoOoMmMkPqRnMlOnMtRaQmOqRMYrRoQvPrQnQ
See the last page for disclaimer Page 3 of 13
[Table_RightMar2]
Te
ch
tro
nic
In
du
str
ies 创
科实业
(0
06
69
HK
)
[Table_RightMar1]
12
No
ve
mb
er
20
20
[Table_PageHeader] Techtronic Industries (00669 HK)
[Table_RightMar2]
Co
mp
an
y R
ep
ort
Figure-2: TTI's Revenue Mix by Segment (2019) Figure-3: TTI's Revenue Mix by Region (2019)
Source: the Company, Guotai Junan International. Source: the Company, Guotai Junan International.
Figure-4: TTI's Global Manufacturing and Product Development Footprint
Source: the Company, Guotai Junan International.
Table-1: TTI's Major Directors and Shareholders
# Person Position Main Responsibility Shareholding Ratio*
1 Horst Julius Pudwill Chairman / Co-founder / Executive Director Strategic planning and development 20.03%
2 Stephan Horst Pudwill Vice Chairman / Executive Director Managing, improving and monitoring internal operations 2.28%
3 Joseph Galli Jr Chief Executive Officer / Executive Director Integrating acquisitions and enhancing global sales potential 0.48%
4 Patrick Kin Wah Chan Operations Director / Executive Director Manufacturing operations 0.15%
5 Frank Chi Chung Chan Chief Financial Officer / Executive Director Corporate affairs and financial management 0.16%
6 Roy Chi Ping Chung Non-executive Director / Co-founder / Former Vice Chairman n.a. 4.73%
7 Camille Jojo Non-executive Director Participating in audit committee and remuneration committee 0.02% Source: the Company, Guotai Junan International. Note *: shareholding ratio as at 30 June 2020.
Power
equipment88.6%
Floor care and
appliances11.4%
North America
77.1%
Europe15.1%
Others7.8%

See the last page for disclaimer Page 4 of 13
[Table_RightMar2]
Te
ch
tro
nic
In
du
str
ies 创
科实业
(0
06
69
HK
)
[Table_RightMar1]
12
No
ve
mb
er
20
20
[Table_PageHeader] Techtronic Industries (00669 HK)
[Table_RightMar2]
Co
mp
an
y R
ep
ort
POWER TOOLS
North America is expected to remain as the largest market of power tools. Based on Euromonitor's estimation, global
sales of power tools will grow at a CAGR of 4.9% during 2019-2024. North America accounts for the largest share of global
sales of power tools thanks to the popularity of DIY culture and lower population density. Despite great potential in emerging
markets, we believe that North America will continue to lead the global power tools market in the incoming five years. Transition
to cordless power tools has been accelerated by cheaper and lighter lithium batteries, but the penetration rate of cordless power
tools in the US is still below 50%. We believe that the trend of upgrading to cordless power tools will continue to drive growth of
power tools sales.
Figure-5: Global Sales of Power Tools by Region Figure-6: Penetration of Cordless Power Tools in the US
Source: Euromonitor, Guotai Junan International. Source: Euromonitor, Guotai Junan International.
TTI's market share gains have been supported by organic growth driven by multi-brand strategy and cordless
leadership. TTI has developed a comprehensive power tool brand portfolio: RYOBI specializes in affordable choices for DIY
and garden hobbyists; AEG mainly targets professional tradesmen; and MILWAUKEE delivers advanced products for industrial
and professional users in sectors including construction, transportation, energy, utilities, etc. We believe that TTI's multi-brand
strategy provides the Company with advantages in catering for all levels of customers from various industries. In addition, since
MILWAUKEE being the first to use lithium-ion batteries in its lines of cordless tools, TTI has been the most aggressive
manufacturer in the transition from legacy power systems such as corded, pneumatic, hydraulic and gas to cordless. Thanks to
its well-positioned branding and leading edge in cordless technology, TTI has tripled its market share in the past decade and
become the world's second largest tool manufacturer in terms of sales of power tools, accessories and hand tools in 2019,
according to Stanley Black & Decker (SBD, SWK US). We believe that the concentration ratio (CR4 in 2019: around 44%) of the
power tool industry will continue to improve, given economies of scale and technological advantage of leading players. In
comparison to SBD's M&A-driven growth, TTI's consecutive market share gains since 2008 were mainly on organic sales
growth of its existing core brands. Overall, we expect that TTI will continue to win more market share on its well-positioned
branding and strategic focus on cordless technology.
Figure-7: Global Tools & Storage Market Breakdown (2018) Figure-8: Brand Positioning of TTI and Other Leading
Power Tool Manufacturers
Source: SBD, Guotai Junan International. Source: the Company, SBD, Bosch, Makita, Guotai Junan International.
-15%
-10%
-5%
0%
5%
10%
0
5
10
15
20
25
200
6A
200
7A
200
8A
200
9A
201
0A
201
1A
201
2A
201
3A
201
4A
201
5A
201
6A
201
7A
201
8A
201
9A
202
0F
202
1F
202
2F
202
3F
202
4F
North America Europe RoW Overall YoY (RHS)
US$ billion
45%
46%
47%
48%
49%
50%
0
1
2
3
4
5
6
7
2014 2015 2016 2017 2018 2019
Cordless Corded % of cordless
US$ billion
Prof essional power tools
22%
Consumer power tools
13%
Power tool accessories
17%
Outdoor tools6%
Hand tools & storage
26%
Others16%
TTI
SBD
Bosch
Makita
Consumer Professional Industr ial

See the last page for disclaimer Page 5 of 13
[Table_RightMar2]
Te
ch
tro
nic
In
du
str
ies 创
科实业
(0
06
69
HK
)
[Table_RightMar1]
12
No
ve
mb
er
20
20
[Table_PageHeader] Techtronic Industries (00669 HK)
[Table_RightMar2]
Co
mp
an
y R
ep
ort
Figure-9: TTI's Global Market Share of Power Tools, Hand
Tools and Garden Equipment
Figure-10: Global Tools and Storage Market Share of TTI
and Other Leading Power Tool Manufacturers (2019)
Source: the Company, Euromonitor, Guotai Junan International. Source: SBD, Guotai Junan International.
Note: + increased; – decreased; = flat.
TTI's product competitiveness has been strengthened by consistently increasing R&D expenditure and rapidly
expanding product family. After continuous aggressive investment in R&D in the past decade, TTI's R&D expense ratio hit a
record high of 3.0% and significantly outpaced its peers. We believe that TTI will maintain an R&D expense ratio above 3% and
put consistent effort into R&D to expand its cordless product family with more in-house technology advances in key components
such as brushless motors, lithium battery packs and electronic control systems. TTI has developed leading universal battery
platforms under its core brands, including M12, M18 and MX FUEL under MILWAUKEE, ONE+ and 40V under RYOBI, as well
as ONEPWR under HOOVER and VAX, and maintained consistent compatibility for products on each of the platforms. For
example, RYOBI ONE+ platform was launched in 1996 with NiCad batteries and then upgraded to lithium batteries in 2007,
while new lithium batteries can be used in old tools and old NiCad batteries can still be used in newly launched tools. The
universal battery platforms not only provide attractive choices of bare tools and replaceable batteries for TTI's customers, but
also maintains customer loyalty to TTI's brands due to higher cross-brand switching costs as well as generation of recurring
battery sales for TTI. We believe that the attractiveness of TTI's battery platforms will be continuously boosted by TTI's rapid
expanding product family. In 2019, MILWAUKEE launched its new MX FUEL system and became a pioneer of introducing
lithium batteries to high-output and heavy-duty tools, targeting to replace traditional powered light construction equipment
(using gas, hydraulic or corded electric) with features including zero emissions and reduced noise and vibration. To illustrate the
competitiveness of TTI's products, we conducted a cross-brand comparison on 1/2-inch cordless power drill, one of the most
representative power tools. We believe that TTI's products strike good balance between cost and performance and stand out
from competition with obvious advantages (in particular, strong torque and long warranty period in our comparison).
Figure-11: R&D Expense Ratios of TTI and Other Leading
Power Tool Manufacturers
Figure-12: Compatible Products on TTI's Major Battery
Platforms
Source: the Company, Stanley Black & Decker, Makita, Guotai Junan International.
Source: the Company, Guotai Junan International.
0%
2%
4%
6%
8%
10%
12%
14%
16%
0
1
2
3
4
5
6
7
8
9
10
20
06
A
20
07
A
20
08
A
20
09
A
20
10
A
20
11
A
20
12
A
20
13
A
20
14
A
20
15
A
20
16
A
20
17
A
20
18
A
20
19
A
20
20
F
20
21
F
20
22
F
TTI's power equipment revenue Global market share (RHS)
US$ billion +
+
−
+−
− −
=
0%
2%
4%
6%
8%
10%
12%
14%
16%
SBD TTI Bosch Makita Snap-on HiKOKI Hilti ITW
1.9% 1.9%2.1%
2.5% 2.5% 2.5%2.7% 2.7%
2.9%3.0%
1.0%
1.5%
2.0%
2.5%
3.0%
3.5%
2010 2011 2012 2013 2014 2015 2016 2017 2018 2019
TTI SBD Makita
0
100
200
300
400
500
2016 2017 2018 2019
Milwaukee M12 Milwaukee M18 Milwaukee MX FUEL
Ry obi ONE+ Ry obi 40V
products

See the last page for disclaimer Page 6 of 13
[Table_RightMar2]
Te
ch
tro
nic
In
du
str
ies 创
科实业
(0
06
69
HK
)
[Table_RightMar1]
12
No
ve
mb
er
20
20
[Table_PageHeader] Techtronic Industries (00669 HK)
[Table_RightMar2]
Co
mp
an
y R
ep
ort
Table-2: Cross-Brand Comparison of Mainstream Products – 1/2-Inch Cordless Power Drill (18V/20V)
Company & Brand TTI Stanley Black & Decker
Bosch Makita Milwaukee Ryobi DeWalt Craftsman Porter-Cable Black+Decker
Product image
Model 2803 P214 DCD996 CMCD721 PCCK607 BDCDHP220 GSR18V-535 XPH12
Motor type Brushless Brushed Brushless Brushless Brushless Brushed Brushless Brushless
Maximum speed (RPM) 2,000 1,600 2,000 2,100 1,800 1,500 1,900 2,000
Torque (inch/lbs.) 1,200 600 841 / 650 UWO(1) 400 UWO(1) 370 UWO(1) 412 535 530
Blows per minute 32,000 24,000 38,250 34,000 n.a. n.a. 28,500 30,000
Weight (lbs.) 3.2 3.2 3.5 2.71 3.3 2.64 2.5 3.4
Warranty (year) 5 3 3 3 3 2 1 3
Price(2) (bare tool) US$139 US$69 US$159 US$119 n.a. n.a. US$149 US$119
Price(2) (batteries incl.) US$279 (2-battery) US$139 (1-battery) US$299 (2-battery) US$179 (2-battery) US$139 (2-battery) US$95 (2-battery) US$199 (1-battery) US$197 (2-battery)
Source: the Company, SBD, Bosch, Makita, Home Depot, Lowe's, Guotai Junan International. Note (1): UWO = Units Watts Out, a new power rating unit used by Stanley Black & Decker based on the drill's speed and torque output. Note (2): List price at Home Depot or Lowe's without promotional discounts.
The Home Depot remains as TTI's most powerful distribution channel despite impact from online retailers and the
COVID-19 pandemic. TTI has established close partnership with The Home Depot (HD), the largest home improvement
retailer (also the No.1 power tool retailer) in North America, in forms of, for example, selling RYOBI products exclusively at The
Home Depot. As TTI's largest distributor in the past decade, The Home Depot contributed 46.8% of TTI's total sales in 2019. As
a proof of TTI's steady market gains in North America, growth of TTI's power equipment revenue outpaced that of The Home
Depot's sales of tools in most years. In the US, specialty stores like The Home Depot has maintained their dominance with over
71% share of distribution channels of home improvement and gardening products during 2014-2019, barely impacted by
fast-growing online retailers. Sales contribution from e-commerce was still relatively minor in 2019 (only 5.1%) due to customer
demand for in-store services and high delivery costs. The Home Depot's online platforms contributed 9.3% of its total sales in
FY19, higher than the market average, while around half of its online orders in the US were picked up in store instead of being
delivered. On the other hand, because of the impact from the COVID-19 pandemic, The Home Depot's online sales surged 90.4%
YoY in 1HFY20 and contributed 14.4% of total sales (FY19: 9.3%). In addition to strong online sales, The Home Depot's offline
sales also recorded decent growth, leading to 15.9% YoY growth in total sales in 1HFY20. In fact, home improvement activities
have increased in the US during the pandemic, since work-from-home arrangements provide homeowners with more time and
boost their needs for home improvement projects. In general, we believe that TTI's sales growth in North America will be
continuously supported by its strategic partnership with The Home Depot.
Figure-13: The Home Depot's Sales Contribution to TTI Figure-14: Sales YoY Growth of TTI's Power Equipment vs.
The Home Depot's Tools
Source: the Company, Guotai Junan International. Source: the Company, The Home Depot, Guotai Junan International.
Note: Home Depot's fiscal years end by the Sunday nearest to 31st January.
36.4% 37.7% 37.9% 37.7% 37.4%
42.7%44.8% 45.5% 45.5% 46.8%
0%
10%
20%
30%
40%
50%
60%
2010 2011 2012 2013 2014 2015 2016 2017 2018 2019
Overall Power equipment Floor care
0%
2%
4%
6%
8%
10%
12%
14%
16%
18%
FY12 FY13 FY14 FY15 FY16 FY17 FY18 FY19
TTI's power equipment HD's too ls

See the last page for disclaimer Page 7 of 13
[Table_RightMar2]
Te
ch
tro
nic
In
du
str
ies 创
科实业
(0
06
69
HK
)
[Table_RightMar1]
12
No
ve
mb
er
20
20
[Table_PageHeader] Techtronic Industries (00669 HK)
[Table_RightMar2]
Co
mp
an
y R
ep
ort
Figure-15: Distribution Channel Mix of Home Improvement
and Gardening Products in the US
Figure-16: The Home Depot's Online Sales
Source: Euromonitor, Guotai Junan International. Source: The Home Depot, Guotai Junan International.
FLOOR CARE
The turnaround in floor care is to be driven by new cordless and carpet washing products despite ongoing
competition from robot vacuums. TTI has been leading the floor care market in North America and Europe with its powerful
brands consisting of HOOVER, ORECK, VAX and DIRT DEVIL. Facing headwinds in the global floor care market since 2015,
TTI has started to shift its strategic focus to cordless and carpet washing products and phase out low-margin corded products
and OEM businesses. In June 2019, TTI launched its ONEPWR battery platform under HOOVER and VAX to leverage the
success of battery platforms for power tools. Although we expect that competition in the floor care market will stay intense with
competition from the fast-growing robot vacuum manufacturers, we believe that TTI's strategic shift towards cordless and carpet
washing products is to be fruitful and will drive further improvement in the profit margin of its floor care businesses.
Figure-17: Global Market Share of Major Vacuum
Manufacturers by Sales Volume (2019)
Figure-18: Global Sales of Vacuums by Region
Source: Euromonitor, Guotai Junan International. Source: Euromonitor, Guotai Junan International.
Figure-19: TTI's Global Floor Care Market Share Figure-20: Sales Volume of Traditional vs. Robot Vacuums
in North America
Source: the Company, Euromonitor, Guotai Junan International. Source: Euromonitor, Guotai Junan International.
0%
10%
20%
30%
40%
50%
60%
70%
80%
90%
100%
2014 2015 2016 2017 2018 2019
Home improvement and gardening stores E-commerce Others
0%
2%
4%
6%
8%
10%
12%
14%
16%
0%
10%
20%
30%
40%
50%
60%
70%
80%
90%
100%
FY14 FY15 FY16 FY17 FY18 FY19 1HFY20
Onl ine sales YoY Tota l sales YoY
% of online sa les (RHS)
Dirt Devil
Hoover
Vax
Oreck
Dyson
ElectroluxBissellMideaPhilips
SharkNinja
BSH
SEB
Others
TTI
-8%
-6%
-4%
-2%
0%
2%
4%
6%
8%
10%
12%
0
5
10
15
20
25
30
200
6A
200
7A
200
8A
20
09
A
20
10
A
201
1A
201
2A
201
3A
201
4A
201
5A
201
6A
201
7A
201
8A
201
9A
20
20
F
20
21
F
202
2F
202
3F
202
4F
NA EU APAC RoW Overall YoY (RHS)
US$ billion
0%
1%
2%
3%
4%
5%
6%
7%
8%
9%
0
0.2
0.4
0.6
0.8
1
1.2
1.4
200
6A
200
7A
200
8A
200
9A
201
0A
201
1A
201
2A
201
3A
201
4A
201
5A
201
6A
201
7A
201
8A
201
9A
202
0F
202
1F
202
2F
TTI's floor care revenue Global market share (RHS)
US$ billion
0%
1%
2%
3%
4%
5%
6%
7%
8%
0
5
10
15
20
25
30
35
40
200
5
200
6
200
7
200
8
200
9
201
0
201
1
201
2
201
3
201
4
201
5
201
6
201
7
201
8
201
9
Traditional Robot % of Robot (RHS)
million units

See the last page for disclaimer Page 8 of 13
[Table_RightMar2]
Te
ch
tro
nic
In
du
str
ies 创
科实业
(0
06
69
HK
)
[Table_RightMar1]
12
No
ve
mb
er
20
20
[Table_PageHeader] Techtronic Industries (00669 HK)
[Table_RightMar2]
Co
mp
an
y R
ep
ort
EARNINGS FORECASTS AND FINANCIAL ANALYSIS
We expect TTI's total revenue to increase YoY by 14.0%/ 12.2% 11.4% in 2020/ 2021/ 2022, respectively. In general, we
believe that robust sales of power equipment will continue to drive TTI's revenue growth, while floor care and appliances wil l
further recover after the strategic shift. Details on each segment are as follows:
Power equipment: On the back of increasing R&D expenditure, we believe that TTI's market share gains are to be fueled
by more aggressive expansion of new products on its leading battery platforms than most of its peers. Pioneer products
such as the latest light equipment products on the MX FUEL platform are expected to accelerate TTI's sales expansion in
more non-residential market segments, including oil and gas, industrial and infrastructure. Therefore, even if the positive
effects from the COVID-19 pandemic on DIY demand fades away in the future, stronger demand from higher-end
professional markets will support TTI's revenue growth momentum.
Floor care and appliances: Thanks to the fruitful strategic transition, we expect TTI's floor care business to further recover
with its competitive edge in battery platform plus its unique leadership in niche markets such as carpet washing. Given
double-digit YoY growth rate outlook for revenue during 2020-2022, we believe that TTI is to recapture market share and
maintain its leadership in spite of the increasing threat from robot vacuum manufacturers.
Basic EPS forecasts for 2020/ 2021/ 2022 are US$0.391/ US$0.446/ US$0.506, respectively. Based on TTI's excellent
proven record in the past decade plus bright outlook for TTI's ongoing product upgrades, we are confident in TTI's sustainable
profit margin improvement. Details on each segment are as follows:
Power equipment: Given fewer comparable products in the market, we expect that TTI's new products targeting high-end
industrial and professional markets (e.g. light equipment products on the MX FUEL platform) will be more profitable and
therefore steadily boost the profit margin of the segment by ongoing optimization of product mix.
Floor care and appliances: Despite the highly competitive global floor care market, we expect that profit margin
improvement of floor care and appliances will continue to be supported by better profitability of fast-growing cordless and
carpet washing products as well as the phasing out of low-margin corded products.
Table-3: Key Assumptions for Earnings Forecasts
2018A 2019A 2020F 2021F 2022F
Revenue by segment (US$ mn)
Power equipment 6,009 6,792 7,752 8,706 9,708
Floor care and appliances 1,012 875 990 1,103 1,219
Operating margin by segment
Power equipment 10.0% 9.8% 10.0% 10.2% 10.3%
Floor care and appliances 0.9% 1.2% 1.4% 1.8% 2.2%
Key financial data (US$ mn)
Revenue 7,021 7,667 8,743 9,809 10,927
Gross profit 2,615 2,893 3,337 3,781 4,253
Shareholders' profit 552 615 716 817 929
Basic EPS (US$) 0.302 0.337 0.391 0.446 0.506 Source: the Company, Guotai Junan International.
Figure-21: TTI's Revenue by Segment Figure-22: TTI's Operating Margin by Segment
Source: the Company, Guotai Junan International. Source: the Company, Guotai Junan International.
0%
2%
4%
6%
8%
10%
12%
14%
16%
18%
0
2
4
6
8
10
12
201
0A
20
11
A
20
12
A
201
3A
201
4A
201
5A
201
6A
201
7A
201
8A
201
9A
20
20
F
20
21
F
20
22
F
Power equipment Floor care Tota l YoY (RHS)
US$ billion
0%
2%
4%
6%
8%
10%
12%
201
0A
201
1A
201
2A
201
3A
201
4A
201
5A
201
6A
201
7A
201
8A
201
9A
202
0F
202
1F
202
2F
Power equipment Floor care Overall

See the last page for disclaimer Page 9 of 13
[Table_RightMar2]
Te
ch
tro
nic
In
du
str
ies 创
科实业
(0
06
69
HK
)
[Table_RightMar1]
12
No
ve
mb
er
20
20
[Table_PageHeader] Techtronic Industries (00669 HK)
[Table_RightMar2]
Co
mp
an
y R
ep
ort
Outstanding ROE has been supported by high asset turnover with ongoing improvement in profit margin. TTI has
maintained higher-than-average revenue growth in most of the past eight years with a CAGR of 9.5% during 2010-2019, which
beat all its major peers and accounted for its steady market share gains. In addition to the outperforming revenue growth, TTI's
ROE has been rising consecutively and consistently outperformed SDB and Makita (6586 JP), and was only second to Snap-on
(SNA US). Based on our DuPont analysis, we believe that TTI's outstanding ROE could be mainly attributable to TTI's top-tier
asset turnover, which demonstrated the Company's excellence in overall operating efficiency. Compared with its peers, TTI has
been moderately leveraged with a net gearing ratio of only 0.5% as at the end of 2019. Despite the underperformance in most
years, TTI's gross margin and net margin has been continuously improving on product mix optimization as well as economies of
scale thanks to rapid top-line growth, playing as the largest driver of rising ROE. Coupled with steady profit growth, TTI has
been consecutively raising its dividend payout ratio since 2012. We expect TTI's dividend CAGR to be 18.0% during 2019-2022
and TTI's dividend payout ratio to reach 45% by 2022, bolstered by robust operating cash inflows.
Figure-23: Revenue Growth of TTI and Its Major Peers Figure-24: ROE of TTI and Its Major Peers
Source: the Company, SDB, Makita, Snap-on, Guotai Junan International. Note: Fiscal years of Makita are ended by 31
st March.
Source: the Company, SDB, Makita, Snap-on, Guotai Junan International.
Figure-25: Asset Turnover of TTI and Its Major Peers Figure-26: Equity Multiplier of TTI and Its Major Peers
Source: the Company, SDB, Makita, Snap-on, Guotai Junan International. Source: the Company, SDB, Makita, Snap-on, Guotai Junan International.
Figure-27: Gross Margin of TTI and Its Major Peers Figure-28: Net Margin of TTI and Its Major Peers
Source: the Company, SDB, Makita, Snap-on, Guotai Junan International. Source: the Company, SDB, Makita, Snap-on, Guotai Junan International.
-5%
0%
5%
10%
15%
20%
25%
2011 2012 2013 2014 2015 2016 2017 2018 2019
TTI SDB Makita Snap-on Mean
6%
8%
10%
12%
14%
16%
18%
20%
22%
24%
2011 2012 2013 2014 2015 2016 2017 2018 2019
TTI SDB Makita Snap-on Mean
0.6
0.7
0.8
0.9
1.0
1.1
1.2
2011 2012 2013 2014 2015 2016 2017 2018 2019
TTI SDB Makita Snap-on Mean
1.0
1.2
1.4
1.6
1.8
2.0
2.2
2.4
2.6
2.8
3.0
2011 2012 2013 2014 2015 2016 2017 2018 2019
TTI SDB Makita Snap-on Mean
30%
32%
34%
36%
38%
40%
42%
44%
46%
48%
50%
2011 2012 2013 2014 2015 2016 2017 2018 2019
TTI SDB Makita Snap-on Mean
0%
2%
4%
6%
8%
10%
12%
14%
16%
18%
20%
2011 2012 2013 2014 2015 2016 2017 2018 2019
TTI SDB Makita Snap-on Mean

See the last page for disclaimer Page 10 of 13
[Table_RightMar2]
Te
ch
tro
nic
In
du
str
ies 创
科实业
(0
06
69
HK
)
[Table_RightMar1]
12
No
ve
mb
er
20
20
[Table_PageHeader] Techtronic Industries (00669 HK)
[Table_RightMar2]
Co
mp
an
y R
ep
ort
Figure-29: TTI's Dividend Payout Figure-30: TTI's Cash Flow
Source: the Company, Guotai Junan International. Source: the Company, Guotai Junan International.
VALUATION AND RECOMMENDATION
Initiate with "Accumulate" and a target price of HK$119.30. We derived our target price from DCF valuation assuming a
perpetual growth rate of 2.5% and a WACC of 6.73% derived from a cost of equity of 8.08%, a cost of debt of 3.60%, and a
target debt/equity ratio of 40%. Our cost of equity of 8.08% is based on a risk-free rate of 0.69%, a market risk premium of 8.21%
and a beta of 0.9 (5-year weekly mean on Bloomberg). Despite that both PE ratio and PB ratio of the Company hit 10-year
record highs, resulting in trading at a valuation premium over other leading power tool manufacturers, we believe that TTI's
valuation premium could be justified by its higher certainty in consistent improvement in both market share and profit margin
that are further tested by the challenging environment due to the COVID-19 pandemic. Despite that valuation of TTI may face
some short-term pressure due to potential reduction in DIY demand once the COVID-19 pandemic is controlled by vaccines, we
expect TTI to continuously strengthen its leadership by consistent R&D expenditures and strategic shift towards more profitable
segments in industrial and professional equipment markets. Our target price of HK$119.30 represents 39.1x/ 34.3x/ 30.2x
2020-2022 PE ratio and 7.3x 2020 PB ratio. We initiate coverage on TTI with an investment rating of "Accumulate".
Key risk factors: 1) sluggishness of home improvement and construction activities in the US; 2) reduction in technology
leadership due to R&D failures; 3) deterioration of global trade environment; 4) increasing reliance on one strong distributor;
and 5) rising raw material costs for brushless motors, lithium battery packs and other key components.
Figure-31: TTI's 12-Month Forward PE Ratio Figure-32: TTI's 12-Month Forward PB Ratio
Source: Bloomberg, Guotai Junan International. Source: Bloomberg, Guotai Junan International.
0%
5%
10%
15%
20%
25%
30%
35%
40%
45%
50%
0
50
100
150
200
250
300
350
400
450
2012A 2013A 2014A 2015A 2016A 2017A 2018A 2019A 2020F 2021F 2022F
Dividend declared Dividend payout ratio (RHS)
US$ million
-600
-400
-200
0
200
400
600
800
1,000
1,200
2012A 2013A 2014A 2015A 2016A 2017A 2018A 2019A 2020F 2021F 2022F
Operating CF Investing CF Financing CF Net CF
US$ million
10
15
20
25
30
35
No
v-1
4
Fe
b-1
5
Ma
y-1
5
Au
g-1
5
No
v-1
5
Fe
b-1
6
Ma
y-1
6
Au
g-1
6
No
v-1
6
Fe
b-1
7
Ma
y-1
7
Au
g-1
7
No
v-1
7
Fe
b-1
8
Ma
y-1
8
Au
g-1
8
No
v-1
8
Fe
b-1
9
Ma
y-1
9
Au
g-1
9
No
v-1
9
Fe
b-2
0
Ma
y-2
0
Au
g-2
0
No
v-2
0
Fwd P/E Mean +1 SD -1 SD
2.0
2.5
3.0
3.5
4.0
4.5
5.0
5.5
6.0
6.5
No
v-1
4
Fe
b-1
5
Ma
y-1
5
Au
g-1
5
No
v-1
5
Fe
b-1
6
Ma
y-1
6
Au
g-1
6
No
v-1
6
Fe
b-1
7
Ma
y-1
7
Au
g-1
7
No
v-1
7
Fe
b-1
8
Ma
y-1
8
Au
g-1
8
No
v-1
8
Fe
b-1
9
Ma
y-1
9
Au
g-1
9
No
v-1
9
Fe
b-2
0
Ma
y-2
0
Au
g-2
0
No
v-2
0
Fwd P/B Mean +1 SD -1 SD
See the last page for disclaimer Page 11 of 13
[Table_RightMar2]
Te
ch
tro
nic
In
du
str
ies 创
科实业
(0
06
69
HK
)
[Table_RightMar1]
12
No
ve
mb
er
20
20
[Table_PageHeader] Techtronic Industries (00669 HK)
[Table_RightMar2]
Co
mp
an
y R
ep
ort
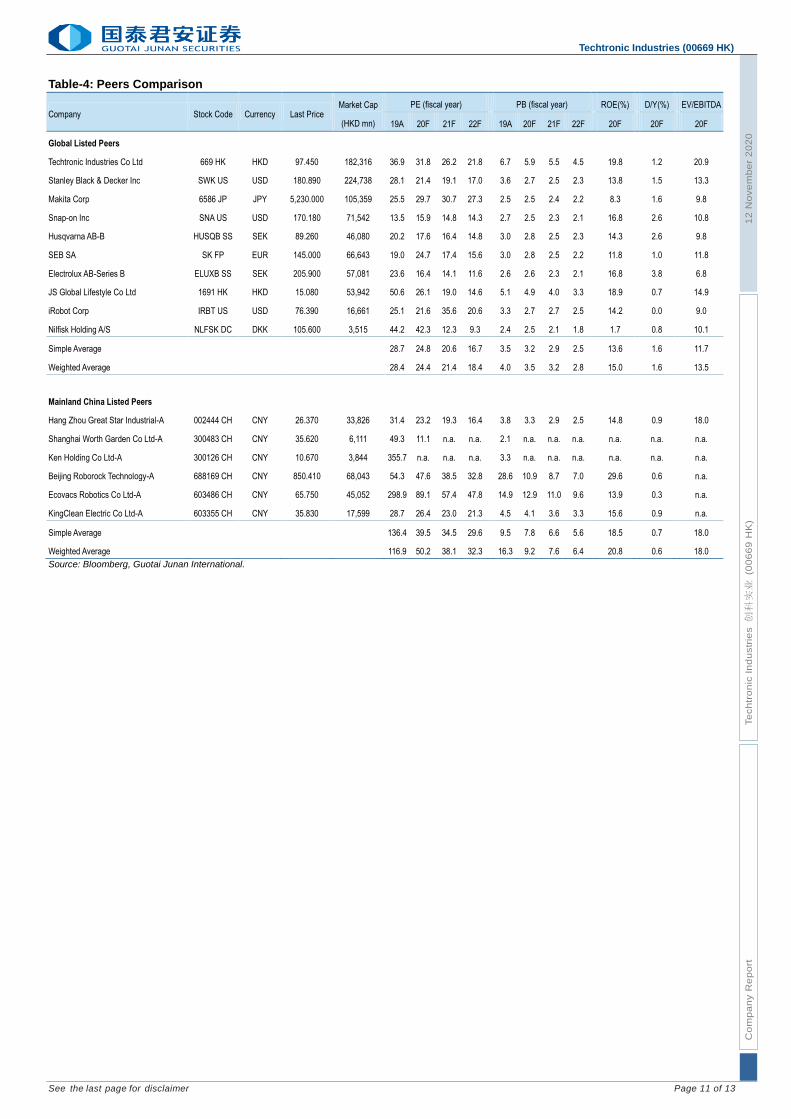
Table-4: Peers Comparison
Company Stock Code Currency Last Price Market Cap
(HKD mn)
PE (fiscal year) PB (fiscal year) ROE(%) D/Y(%) EV/EBITDA
19A 20F 21F 22F 19A 20F 21F 22F 20F 20F 20F
Global Listed Peers
Techtronic Industries Co Ltd 669 HK HKD 97.450 182,316 36.9 31.8 26.2 21.8
6.7 5.9 5.5 4.5
19.8
1.2
20.9
Stanley Black & Decker Inc SWK US USD 180.890 224,738 28.1 21.4 19.1 17.0
3.6 2.7 2.5 2.3
13.8
1.5
13.3
Makita Corp 6586 JP JPY 5,230.000 105,359 25.5 29.7 30.7 27.3
2.5 2.5 2.4 2.2
8.3
1.6
9.8
Snap-on Inc SNA US USD 170.180 71,542 13.5 15.9 14.8 14.3
2.7 2.5 2.3 2.1
16.8
2.6
10.8
Husqvarna AB-B HUSQB SS SEK 89.260 46,080 20.2 17.6 16.4 14.8 3.0 2.8 2.5 2.3 14.3 2.6 9.8
SEB SA SK FP EUR 145.000 66,643 19.0 24.7 17.4 15.6 3.0 2.8 2.5 2.2 11.8 1.0 11.8
Electrolux AB-Series B ELUXB SS SEK 205.900 57,081 23.6 16.4 14.1 11.6 2.6 2.6 2.3 2.1 16.8 3.8 6.8
JS Global Lifestyle Co Ltd 1691 HK HKD 15.080 53,942 50.6 26.1 19.0 14.6 5.1 4.9 4.0 3.3 18.9 0.7 14.9
iRobot Corp IRBT US USD 76.390 16,661 25.1 21.6 35.6 20.6
3.3 2.7 2.7 2.5
14.2
0.0
9.0
Nilfisk Holding A/S NLFSK DC DKK 105.600 3,515 44.2 42.3 12.3 9.3
2.4 2.5 2.1 1.8
1.7
0.8
10.1
Simple Average 28.7 24.8 20.6 16.7 3.5 3.2 2.9 2.5 13.6 1.6 11.7
Weighted Average 28.4 24.4 21.4 18.4 4.0 3.5 3.2 2.8 15.0 1.6 13.5
Mainland China Listed Peers
Hang Zhou Great Star Industrial-A 002444 CH CNY 26.370 33,826 31.4 23.2 19.3 16.4 3.8 3.3 2.9 2.5 14.8 0.9 18.0
Shanghai Worth Garden Co Ltd-A 300483 CH CNY 35.620 6,111 49.3 11.1 n.a. n.a.
2.1 n.a. n.a. n.a.
n.a.
n.a.
n.a.
Ken Holding Co Ltd-A 300126 CH CNY 10.670 3,844 355.7 n.a. n.a. n.a. 3.3 n.a. n.a. n.a. n.a. n.a. n.a.
Beijing Roborock Technology-A 688169 CH CNY 850.410 68,043 54.3 47.6 38.5 32.8
28.6 10.9 8.7 7.0
29.6
0.6
n.a.
Ecovacs Robotics Co Ltd-A 603486 CH CNY 65.750 45,052 298.9 89.1 57.4 47.8 14.9 12.9 11.0 9.6 13.9 0.3 n.a.
KingClean Electric Co Ltd-A 603355 CH CNY 35.830 17,599 28.7 26.4 23.0 21.3
4.5 4.1 3.6 3.3
15.6
0.9
n.a.
Simple Average 136.4 39.5 34.5 29.6 9.5 7.8 6.6 5.6 18.5 0.7 18.0
Weighted Average 116.9 50.2 38.1 32.3 16.3 9.2 7.6 6.4 20.8 0.6 18.0
Source: Bloomberg, Guotai Junan International.

See the last page for disclaimer Page 12 of 13
[Table_RightMar2]
Te
ch
tro
nic
In
du
str
ies 创
科实业
(0
06
69
HK
)
[Table_RightMar1]
12
No
ve
mb
er
20
20
[Table_PageHeader] Techtronic Industries (00669 HK)
[Table_RightMar2]
Co
mp
an
y R
ep
ort
Financial Statements and Ratios
[Table_IncomeStatement] Income Statement
Year end 31 Dec (US$ m) 2018A 2019A 2020F 2021F 2022F
Total revenue 7,021 7,667 8,743 9,809 10,927
Cost of sales (4,407) (4,774) (5,405) (6,027) (6,674)
Gross profit 2,615 2,893 3,337 3,781 4,253
Other income 7 11 13 16 20
Selling expenses (1,103) (1,195) (1,370) (1,546) (1,734)
Administrative expenses (708) (805) (927) (1,047) (1,172)
R&D expenses (203) (230) (262) (300) (343)
Operating profit 607 673 791 905 1,024
Finance costs, net (13) (12) (23) (27) (26)
Share of results of associates 0 0 1 1 1
Profit before tax 595 661 770 879 999
Income tax (42) (46) (54) (61) (70)
Profit after tax 553 615 716 817 929
Non-controlling interest (0) (0) (0) (0) (0)
Shareholders' profit / loss 552 615 716 817 929
Basic EPS 0.302 0.337 0.391 0.446 0.506
[Table_CashFlowStatement] Cash Flow Statement
Year end 31 Dec (US$ m) 2018A 2019A 2020F 2021F 2022F
Profit before tax 595 661 770 879 999
Depreciation & amortization 242 325 372 405 435
Changes in working capital (30) (255) (308) (273) (263)
Income tax paid (85) (87) (105) (127) (146)
Other adjustments 72 79 10 25 20
Cash from operating activities 794 724 739 909 1,044
Capital expenditure (395) (616) (399) (383) (397)
Other investing activities (29) 47 20 37 57
Cash from investing activities (424) (568) (379) (346) (340)
Net changes in borrowings (30) 692 307 270 263
Dividends paid (183) (224) (262) (320) (380)
Other financing activities 107 (305) (16) 5 29
Cash from financing activities (106) 163 30 (46) (88)
Cash at beg of year 864 1,104 1,412 1,796 2,318
Net changes in cash 264 319 390 517 615
Effect of exchange rate changes (24) (11) (6) 5 0
Cash at End of Year 1,104 1,412 1,796 2,318 2,933
Source: the Company, Guotai Junan International.
[Table_BalanceSheet] Balance Sheet
Year end 31 Dec (US$ m) 2018A 2019A 2020F 2021F 2022F
Property, plant and equipment 791 1,087 1,117 1,102 1,077
Intangible assets 621 667 704 736 763
Goodwill 581 581 581 581 581
Others non-current assets 131 340 306 259 202
Total non-current assets 2,124 2,674 2,707 2,678 2,623
Inventories 1,767 2,113 2,533 2,958 3,412
Trade & other receivables 1,127 1,229 1,504 1,703 1,891
Cash & cash equivalents 1,104 1,412 1,796 2,318 2,933
Other current assets 228 271 311 350 401
Total current assets 4,225 5,024 6,144 7,328 8,637
Total assets 6,349 7,698 8,851 10,006 11,260
Trade & other payables 1,921 2,177 2,555 2,900 3,273
ST borrowings 499 741 883 1,007 1,126
Other current liabilities 196 299 313 325 348
Total current liabilities 2,616 3,218 3,750 4,233 4,746
LT borrowings 540 755 918 1,061 1,204
Other non-current liabilities 135 331 336 361 406
Total non-current liabilities 676 1,086 1,254 1,422 1,610
Total liabilities 3,292 4,304 5,004 5,654 6,356
Share capital 655 662 668 672 676
Reserves 2,403 2,732 3,179 3,680 4,228
Total shareholders' equity 3,058 3,395 3,847 4,352 4,904
Minority interest (0) (0) (0) (0) 0
Total equity 3,057 3,394 3,847 4,352 4,904
Total equity & liabilities 6,349 7,698 8,851 10,006 11,260
[Table_FinancialRatio] Financial Ratios
2018A 2019A 2020F 2021F 2022F
Gross margin (%) 37.2 37.7 38.2 38.6 38.9
Operating margin (%) 8.7 8.8 9.1 9.2 9.4
Net margin (%) 7.9 8.0 8.2 8.3 8.5
ROE (%) 19.1 19.1 19.8 19.9 20.1
ROA (%) 9.8 9.4 9.4 9.4 9.5
Dividend payout ratio (%) 37.5 39.5 41.4 43.2 45.0
Net gearing ratio (%) Net cash 0.5 Net cash Net cash Net cash
Interest coverage ratio (x) 16.6 13.6 12.7 12.6 12.6

See the last page for disclaimer Page 13 of 13
[Table_RightMar2]
Te
ch
tro
nic
In
du
str
ies 创
科实业
(0
06
69
HK
)
[Table_RightMar1]
12
No
ve
mb
er
20
20
[Table_PageHeader] Techtronic Industries (00669 HK)
[Table_RightMar2]
Co
mp
an
y R
ep
ort
[Table_CompanyRatingDefinition] Company Rating Definition
The Benchmark: Hong Kong Hang Seng Index
Time Horizon: 6 to 18 months
Rating Definition
Buy 买入 Relative Performance>15%; or the fundamental outlook of the company or sector is favorable.
Accumulate 收集 Relative Performance is 5% to 15%; or the fundamental outlook of the company or sector is favorable.
Neutral 中性 Relative Performance is -5% to 5%; or the fundamental outlook of the company or sector is neutral.
Reduce 减持 Relative Performance is -5% to -15%; or the fundamental outlook of the company or sector is unfavorable.
Sell 卖出 Relative Performance <-15%; or the fundamental outlook of the company or sector is unfavorable.
[Table_IndustryRatingDefinition] Sector Rating Definition
The Benchmark: Hong Kong Hang Seng Index
Time Horizon: 6 to 18 months
Rating Definition
Outperform 跑赢大市 Relative Performance>5%; or the fundamental outlook of the sector is favorable.
Neutral 中性 Relative Performance is -5% to 5%; or the fundamental outlook of the sector is neutral.
Underperform 跑输大市 Relative Performance<-5%; or the fundamental outlook of the sector is unfavorable.
[Table_DISCLOSUREOFINTERESTS] DISCLOSURE OF INTERESTS
(1) The Analysts and their associates do not serve as an officer of the issuer mentioned in this Research Report. (2) The Analysts and their associates do not have any financial interests in relation to the issuer mentioned in this Research Report. (3) Except for GUOTAI JUNAN I (01788 HK), JXR (01951 HK), JINSHANG BANK (02558 HK), HAITIAN ANTENNA (08227 HK), Guotai
Junan and its group companies do not hold equal to or more than 1% of the market capitalization of the issuer mentioned in this Research Report.
(4) Guotai Junan and its group companies have not had investment banking relationships with the issuer mentioned in this Research Report within the preceding 12 months.
(5) Guotai Junan and its group companies are not making a market in the securities in respect of the issuer mentioned in this Research Report.
(6) Guotai Junan and its group companies have not employed an individual serving as an officer of the issuer mentioned in this Research Report. There is no officer of the issuer mentioned in this Research Report associated with Guotai Junan and its group companies.
DISCLAIMER This Research Report does not constitute an invitation or offer to acquire, purchase or subscribe for securities by Guotai Junan Securities (Hong Kong) Limited ("Guotai Junan"). Guotai Junan and its group companies may do business that relates to companies covered in research reports, including investment banking, investment services, etc. (for example, the placing agent, lead manager, sponsor, underwriter or invest proprietarily). Any opinions expressed in this report may differ or be contrary to opinions or investment strategies expressed orally or in written form by sales persons, dealers and other professional executives of Guotai Junan group of companies. Any opinions expressed in this report may differ or be contrary to opinions or investment decisions made by the asset management and investment banking groups of Guotai Junan. Though best effort has been made to ensure the accuracy of the information and data contained in this Research Report, Guotai Junan does not guarantee the accuracy and completeness of the information and data herein. This Research Report may contain some forward-looking estimates and forecasts derived from the assumptions of the future political and economic conditions with inherently unpredictable and mutable situation, so uncertainty may contain. Investors should understand and comprehend the investment objectives and its related risks, and where necessary consult their own financial advisers prior to any investment decision. This Research Report is not directed at, or intended for distribution to or use by, any person or entity who is a citizen or resident of or located in any jurisdiction where such distribution, publication, availability or use would be contrary to applicable law or regulation or which would subject Guotai Junan and its group companies to any registration or licensing requirement within such jurisdiction. © 2020 Guotai Junan Securities (Hong Kong) Limited. All Rights Reserved. 27/F., Low Block, Grand Millennium Plaza, 181 Queen’s Road Central, Hong Kong. Tel.: (852) 2509-9118 Fax: (852) 2509-7793 Website: www.gtja.com.hk