Copyright by Colin Koutney 2018 - The University of Texas at ...
75
Copyright by Colin Koutney 2018
-
Upload
khangminh22 -
Category
Documents
-
view
0 -
download
0
Transcript of Copyright by Colin Koutney 2018 - The University of Texas at ...

Copyright
by
Colin Koutney
2018

The Dissertation Committee for Colin Koutney Certifies that this is the approved
version of the following Dissertation:
Do Analysts Improve on Managers’ Voluntary ETR Forecasts?
Committee: Lillian Mills, Supervisor Michael Clement Jonathan Cohn Dain Donelson Braden Williams
Do Analysts Improve on Managers’ Voluntary ETR Forecasts?
by
Colin Koutney
Dissertation
Presented to the Faculty of the Graduate School of
The University of Texas at Austin
in Partial Fulfillment
of the Requirements
for the Degree of
Doctor of Philosophy
The University of Texas at Austin
December 2018

Dedication
To Mama, Daddy, and Lenore
v
Acknowledgements
This dissertation benefited from the suggestions of my dissertation committee:
Michael Clement, Jonathan Cohn, Dain Donelson, Lillian Mills (Chair), and Braden
Williams. I thank you for your feedback and encouragement throughout the process. I also
thank Alejandra Flores and Vincent Truong for their research assistance and the McCombs
Research Excellence Fund for funding.
I am very grateful to my advisor, Lillian Mills, for her mentorship on all things
research, teaching, and life. With her passion for academia and engagement with the
profession, Lil exemplifies the accounting scholar that I aspire to be.
During the program, I was lucky to meet many great colleagues who helped me in
countless small and large ways. I am very appreciative and grateful to you. I am especially
thankful to Ken Brown, Jakob Infuehr, Prasart Jongjaroenkamol, Antonis Kartapanis,
Daehyun Kim, and Zheng Leitter. Your friendship means a lot to me. Finally, I thank Xinyu
Zhang for helping me to be better each day.
vi
Abstract
Do Analysts Improve on Managers’ Voluntary ETR Forecasts?
Colin Koutney, Ph.D.
The University of Texas at Austin, 2018
Supervisor: Lillian Mills
This study examines whether analysts improve on managers’ voluntary annual
effective tax rate (ETR) forecasts. Although managers frequently issue voluntary ETR
forecasts, we know little about how analysts use this information. I find approximately 33
percent of analyst ETR forecasts materially deviate from management’s ETR forecast (i.e.,
more than half a percentage point). I also find (1) analysts’ after-tax, pretax, and ETR
forecasts are less accurate when deviating from managers’ ETR forecasts, even when
controlling for analyst characteristics; (2) less experienced analysts deviate more often than
more experienced analysts; and (3) investors do not differentiate between analyst forecasts
that deviate versus forecasts that follow managers’ ETR forecasts, suggesting investors do
not find incremental information in these forecasts. Overall, my results indicate that
analysts can be overconfident about their private information and underweight
management information.
vii
Table of Contents
List of Tables ..................................................................................................................... ix
Chapter 1: Introduction ........................................................................................................1
Chapter 2: Background and Hypotheses Development .......................................................6
2.1 Management earnings forecasts ............................................................................6
2.2 Analyst herding literature ...................................................................................10
2.3 Are analyst earnings forecasts that disagree with managers’ ETR forecasts more accurate? ....................................................................................................12
2.4 Do investors react more to analyst forecasts with disagreeing ETR forecasts? ............................................................................................................14
Chapter 3: Sample and Descriptive Statistics ....................................................................15
Chapter 4: Research Design and Empirical Analyses ........................................................18
4.1 Determinants of disagreement (H1) ....................................................................18
4.2 Analyst forecast accuracy (H2)...........................................................................23
4.3 Investor reaction to analyst forecast revisions (H3) ...........................................26
Chapter 5: Supplemental Analyses ....................................................................................28
5.1 What information do disagreeing analysts use to forecast ETR? .......................28
5.2 What firm characteristics influence the percentage of analysts who disagree with management ETR forecasts? ......................................................................30
5.3 Why do managers issue ETR forecasts? .............................................................32
5.4 Does ETR forecasting complexity moderate the association between analyst ETR forecast disagreement and forecast accuracy? ...........................................34
Chapter 6: Robustness Tests ..............................................................................................35
6.1 Minority interest and other income item adjustments ........................................35
6.2 Placebo test .........................................................................................................36
viii
Chapter 7: Discussion and Conclusion ..............................................................................37
Tables .................................................................................................................................38
Appendices .........................................................................................................................51
Appendix A: Example of a Management ETR Forecast—Abbot Laboratories’ 2005 Guidance from 2004 Q4 Earnings Conference Call (Tax-related forecasts underlined) ...........................................................................................52
Appendix B: Examples of Voluntary Management ETR Forecasts—Abbot Laboratories’ time-series of ETR forecasts, 2004-2015 .....................................53
Appendix C: Variable Definitions ............................................................................54
References ..........................................................................................................................58

ix
List of Tables
Table 1: Sample Construction Procedure ..........................................................................39
Table 2: Frequency of Management Voluntary ETR Forecasts ........................................40
Table 3: Descriptive Statistics ...........................................................................................41
Table 4: Analyst Characteristics and Disagreement with Management ETR Forecasts ...42
Table 5: Analyst Absolute After-tax Forecast Error ..........................................................44
Table 6: Analyst Absolute Pretax Forecast Error ..............................................................45
Table 7: Analyst Absolute ETR Forecast Error .................................................................46
Table 8: Stock Return to Analysts Forecasts and Disagreement with Management
ETR Forecasts ...............................................................................................47
Table 9: What Do Disagreeing Analysts Forecast as ETR? ..............................................48
Table 10: What Firm Characteristics Influence the Percent of Analysts Who Disagree
with Management ETR Forecasts? ...............................................................49
Table 11: Which Firms Issue ETR Forecasts? ...................................................................50
1
Chapter 1: Introduction
Do analysts improve on managers’ voluntary effective tax rate (ETR) forecasts?
The question is important because ETR forecasts are the second most common forecast
issued by managers (Lansford, Lev, and Tucker [2013]; NIRI [2016]; Chapman and Green
[2018]). In addition, investors could benefit from comparing analyst and voluntary
manager tax rate forecasts to understand the recent and continuing volatility in tax expense
resulting from 2017 U.S. corporate tax reform and potential future adjustments for its
unintended consequences (Tankersley and Rappeport [2018]; Rubin [2018]; Deloitte
[2018]). Moreover, analysts regularly disagree with managers on ETR forecasts: about 33
percent of analyst forecasts deviate from managers’ voluntary ETR forecasts by more than
half a percentage point.1
Current research suggests several reasons why analysts can improve on managers’
ETR forecasts. First, analysts sometimes have information to improve on management
forecasts. Concerning net earnings forecasts, analysts issue more accurate forecasts than
management when earnings are highly correlated with macroeconomic indicators (Hutton,
Lee, and Shu [2012]). Second, when analysts deviate from public information like analyst
consensus forecasts, they issue more accurate and informative forecasts (Gleason and Lee
[2003]; Clement and Tse [2005]). Third, analysts can improve on managers’ mandatory
quarterly ETR forecasts (Bratten, Gleason, Larocque, and Mills [2017]). In contrast to
these reasons, prior studies find analysts generally do not improve on management net
earnings forecasts by showing analysts’ and managers’ forecasts are equally accurate
1 Hereafter, I use the terms ‘deviate’ and ‘disagree’ to refer to cases when the absolute difference between analysts’ and managers’ voluntary ETR forecasts is greater than 0.5%.
2
(Hutton et al. [2012]; Ruland [1978]; Waymire [1986]). Thus, I examine whether analyst
forecasts that deviate from managers’ ETR forecasts improve on managers’ ETR forecasts.
To investigate this question, I examine the characteristics of analysts that disagree
with managers’ ETR forecasts, whether analyst forecasts with disagreement are more
accurate than forecasts following managers’ ETR forecasts, and whether investors
differentiate between analyst earnings forecasts that disagree versus forecasts that follow
managers’ ETR forecasts. Using firm-year fixed effects and other controls, I can compare
analyst characteristics and forecast accuracy of analysts who disagree to those who agree
with managers’ ETR forecasts. To analyze investor reaction, I examine narrow return
windows centered at the release of the analyst forecast to ensure the forecast is the primary
news event.
I hand-collect managers’ annual voluntary ETR forecasts from S&P 500
corporations between 2004 and 2015 from fourth-quarter earnings conference calls.2 I find
managers frequently issue voluntary ETR forecasts: 2,347 out of 5,411 firm-years (43
percent) have ETR forecasts. I match managers’ annual ETR forecasts to I/B/E/S analyst
forecasts for a total of 44,114 firm-year-analyst forecasts. The large sample allows for
panel and cross-sectional analysis of firms that issue ETR forecasts and an examination of
whether individual analysts improve on managers’ forecasts.
Overall, the results suggest that analysts who disagree with managers’ ETR
forecasts do not improve on managers’ forecasts. First, the analyst characteristics
associated with ETR disagreement portray analysts who are overconfident in their abilities.
2 Throughout the paper, I refer to management voluntary ETR forecasts as simply management ETR forecasts, except to distinguish them from quarterly GAAP ETRs, which are essentially mandatory ETR forecasts. Quarterly GAAP ETRs, calculated as the year-to-date tax expense divided by pretax income, are mandatory because interim period tax expense is reported using estimated annual ETRs based the view that interim periods are integral parts of the annual period (ASC 740-270), but their use as forecasts is distorted because quarterly GAAP tax expense includes discrete items (Bratten et al. [2017]).
3
I find analysts who disagree work at larger brokerages but also have less work experience.
Also, ETR forecast disagreement is not significantly associated with analysts’ workloads
because analysts who follow more companies or industries do not disagree more often than
analysts who follow fewer companies or industries. These findings are contrary to
implications from the analyst herding literature because they suggest analysts who disagree
with public information about taxes do not necessarily have greater access to private
information.
Second, I find analyst forecasts are less accurate when analysts disagree with
managers’ voluntary ETR forecasts, which contrasts with recent evidence (Bratten et al.
[2017]) that analysts are more accurate when disagreeing with mandatory ETR forecasts.
On average, analysts issue less accurate ETR, after-tax earnings, and pretax earnings
forecasts when disagreeing with management’s voluntary ETR forecast. These results are
robust to controlling for analyst characteristics. These results are also robust to specifying
the regression using ranked analyst forecast accuracy to mitigate concerns that inaccurate
and outlier forecasts explain the results.
Third, investors do not appear to differentiate between analyst forecasts that
disagree with managers’ ETR forecasts and analyst forecasts following managers’
forecasts. I examine investor reaction in addition to forecast accuracy because investors
could value analyst forecast deviations from managers’ forecasts for reasons other than
greater accuracy.3 To compare investor reactions, I examine stock price changes in the 40-
minute window centered at the release of the analyst forecast. I do not find a significant
3 Whether analysts contribute tax information to investors is an important question. Lev and Nissim [2004] and Thomas and Zhang [2011] show that current tax information predicts future stock returns. Weber [2009] argues the association between tax information and stock returns is due to the inability of analysts to incorporate tax information into their forecasts.
4
association between analyst forecasts that disagree and stock return, suggesting that
investors do not differentiate between the forecasts.
In two supplemental analyses, I examine why analysts do not appear to improve on
managers’ forecasts. First, I investigate whether mistakes explain why analysts disagree
with managers’ ETR forecasts. I find disagreeing analysts incorporate management’s ETR
forecast, analysts’ own ETR forecast issued before management’s forecast, and the prior
year Street ETR. In addition, analysts do not appear to use GAAP ETRs or a statutory tax
rate. Thus, rather than a mistake, analysts appear to disagree because they attempt to
contribute incremental information. However, it appears they overweight historical
information.
I also examine why managers forecast ETRs. I find managers are more likely to
forecast ETRs when transitory items (special items and nonrecurring income taxes) are
present. Thus, managers’ voluntary ETR forecasts could help investors calculate a
persistent tax rate. Moreover, Bratten et al. [2017] find that analysts do not mimic
managers’ mandatory ETR forecasts when discrete items are present, which implies that
managers’ voluntary ETR forecasts meet a demand for tax rate information from analysts.
These findings imply disagreeing analysts potentially ignore important information in
managers’ ETR forecasts.
This study contributes to the literature in several ways. While my paper is the first
to my knowledge to examine whether analysts improve on managers’ voluntary ETR
forecasts, prior studies compare analysts’ and managers’ EPS forecasts (Hutton et al.
[2012]; Louis, Sun, and Urcan [2013]) and analyst ETR forecasts and managers’
mandatory GAAP ETR forecasts (Bratten et al. [2017]). I highlight some differences
between my study and these to clarify the interpretation of my study. First, I find analysts
do not appear to improve on managers’ voluntary ETR forecasts in normal operating
5
circumstances. In contrast, Hutton et al. [2012] show analysts do not improve on
management EPS forecasts when firms face unusual operating circumstances. Together,
both studies broadly suggest that analysts do not improve on managers’ forecasts that
require firm-specific knowledge. Second, Louis et al. [2013] argue that analysts deviate
from management forecasts to add information for their clients (such as to adjust for
earnings management). My results suggest that although analysts who disagree with
management ETR forecasts attempted to improve on management ETR forecasts, analysts
generally do not succeed. Third, Bratten et al. [2017] find analysts improve on implied
ETR forecasts from GAAP interim reporting by comparing analysts’ non-GAAP ETR
forecasts to managers’ GAAP ETRs. Thus, while analysts improve on managers’
mandatory ETR forecasts, they do not appear to improve on managers’ voluntary ETR
forecasts and my study cautions against broad conclusions that analysts generally out-
perform managers on ETR forecasts.
More broadly, my paper contributes to the analyst herding literature by suggesting
that analysts underweight some public information from managers. It is also important to
note that the empirical analyst herding research finds analysts who deviate from public
information (represented by other analysts’ forecasts) issue more accurate forecasts. Based
on this literature, my findings that analysts issue less accurate ETR forecasts are surprising
because they always have the option to simply copy managers’ public ETR forecasts.
Finally, the findings could be useful for investors who seek additional tax
information due to the uncertainty from 2017 U.S. tax code reform. As investors estimate
the implications of the new tax code to earnings, they could view analyst forecasts as an
alternative to management forecasts, but the findings suggest that managers issue the most
accurate ETR forecasts.
6
Chapter 2: Background and Hypotheses Development
2.1 MANAGEMENT EARNINGS FORECASTS
Management earnings forecasts are important because they provide timely
information about firm earnings. They explain about 55 percent of stock returns—more
than any other accounting-related disclosure, like actual earnings announcements,
mandatory SEC filings, or analyst forecasts (Beyer, Cohen, Lys, and Walther [2010]).
Moreover, an increasing number of firms issue earnings forecasts, rising from about 15
percent in the 1990s to 65 percent in 2013 (Anilowski, Feng, and Skinner [2007]; Chapman
and Green [2018]). Due to the importance and increasing regularity of management
forecasts, numerous studies examine them.
Surveying the literature, Hirst, Koonce, and Venkataraman [2008] organize
management earnings forecast studies into three components: antecedents, characteristics,
and consequences.4 My study relates a forecast characteristic (forecast disaggregation) to
a forecast consequence (whether analysts follow management’s ETR forecast).5
Specifically, I examine whether analysts improve on managers’ ETR forecasts for analyst
forecasts issued after managers’ forecasts. This section discusses prior literature with
respect to the informativeness of management forecasts and whether analysts and investors
use management forecasts.
Prior to the 1970s, the U.S. Securities and Exchange Commission (SEC) prohibited
the issuance of forecasts because managers were considered to be too biased to issue useful
information in voluntary and unverified disclosures. However, after the SEC changed
4 Earlier reviews include Cameron [1986], King, Pownall, and Waymire [1990], and Healy and Palepu [2001]. 5 When issuing a forecast, managers choose forecast characteristics, which encompass decisions managers make about the content in their forecasts. Forecast consequences are the reactions to managers’ forecasts.
7
regulations to allow management forecasts, early studies find that they are informative.6,7
These studies generally find that management earnings forecasts are more accurate than
naïve earnings models and are at least as accurate as analyst consensus earnings forecasts
(Copeland and Marioni [1972]; McDonald [1973]; Basi, Carey, and Twark [1976]; Imhoff
[1978]; Ruland [1978]; Waymire [1986]; Jaggi [1980]; Imhoff and Pare [1982]).8 Given
the substantial research, King, Pownall, and Waymire [1990, p. 117] conclude that “the
evidence indicates that management forecasts are more accurate than analyst forecasts
available to investors prior to release of the management forecast.”
Early studies also show that investors react to management earnings forecasts
(Foster [1973]; Gonedes, Dopuch, and Penman [1976]; Patell [1976]; Jaggi [1978];
Nichols and Tsay [1979]; Penman [1980]; Penman [1983]; Anjinkya and Gift [1984];
Waymire [1984]; McNichols [1989]). Investor reaction suggests managers convey new
information with their forecasts. King et al. [1990, p. 117] conclude that “the literature
unambiguously suggests that management forecasts are price informative.” Thus, despite
the managers’ incentives to issue biased forecasts, management earnings forecasts are
generally accurate and useful to investors.
Moreover, the SEC effectively increased the relative informativeness of
management forecasts with the implementation of Regulation Fair Disclosure (Reg FD) in
6 In addition to removing the prohibition on issuing management forecasts, the SEC reduced the litigation risk associated with the issuance of a management forecast. In 1979, the SEC provided ‘safe harbor’ for good faith forecasts and, in 1996, the Private Securities Litigation Reform Act increased the standard to file lawsuits. These changes likely increased the frequency of management forecasts. 7 Cameron (1986) writes that the SEC allowed forecasts because managers were privately conveying earnings forecasts to analysts, thereby creating an uneven playing field for investors without access to analysts. 8 The timing of analysts’ forecasts relative to the manager’s forecast generally does not matter for relative forecast accuracy. Basi et al. [1976] and Imhoff [1978] examine analyst forecasts issued before managers’ forecasts while Imhoff and Pare [1982] study analyst forecasts issued after management forecasts. Ruland [1978], Jaggi [1980], and Waymire [1986] examine analyst forecasts issued both before and after managers’ forecasts. Regardless of the timing, the results often find analysts and managers have similar forecast accuracy.

8
2000. Reg FD restricts managers from selectively disclosing material information. Before
Reg FD, analysts could improve on managers’ public forecasts simply because analysts
had additional private information from management. Consistent with analysts relying on
private information from managers, Bailey et al. [2003] find analyst forecast dispersion
increases and conclude that analysts have greater difficulty to form forecasts after the
adoption of Reg FD.
Furthermore, analyst incentives or ability could prevent them from improving on
managers’ forecasts. For example, studies show analysts have incentives to disseminate
opportunistic management forecasts and analysts lack expertise to de-bias managers’
opportunistic forecasts (Kasznik [1999]; Matsumoto [2002]; Rogers and Stocken [2005];
Cotter, Tuna, and Wysocki [2006]; Feng and McVay [2010]; Kross, Ro, and Suk [2011];
Larocque [2010]). Thus, in the current environment, it appears difficult for analysts to
improve on management forecasts.
Nevertheless, prior studies find analyst forecasts are just as accurate as management
earnings forecasts both before Reg FD (Ruland [1978]; Imhoff and Pare [1982]; Imhoff
[1978]; Waymire [1986]) and after Reg FD (Hutton et al. [2012]). So why aren’t analyst
forecasts less accurate than management forecasts?
Hutton et al. [2012] argues that analysts have certain information advantages over
management: (1) greater access to macroeconomic forecasts; (2) more objectivity when
evaluating information; and (3) higher ability to process industry-wide information. Hutton
et al. [2012] find that the consensus analyst forecast is more accurate than managers’
forecasts when firm earnings are correlated with macroeconomic trends like gross domestic
product and energy costs. But they also find that the consensus analyst forecast is less
accurate when firms have abnormally high inventories, excess operational capacities, or an
9
operating loss. Thus, whether analysts improve on management earnings forecasts is a
question about the quality of private information that analysts have relative to managers.
For ETR forecasts, analysts’ sources of private tax information are difficult to
identify and it is also unclear why analysts deviate from managers’ public and voluntary
ETR forecasts without relying on useful private information. However, prior research on
analyst herding examines why analysts deviate from public information and the
consequences of deviation. Thus, the analyst herding literature provides relevant
theoretical and empirical findings to examine determinants and consequences of analyst
forecasts deviating from managers’ ETR forecasts.
10
2.2 ANALYST HERDING LITERATURE
Broadly, the subset of analyst literature on “herding” investigates how analysts
weight public and private information in their earnings forecasts. Herding refers to the
phenomenon of many different agents taking similar actions at roughly the same time
(Jegadeesh and Kim [2010]).
Although the financial press criticizes analysts for displaying herding behavior in
their stock recommendations and earnings forecasts, theoretical studies show that analysts
rationally bias their forecasts toward the consensus view in response to career and
reputational concerns (Scharfstein and Stein [1990]; Trueman [1994]). For example,
‘weak’ analysts who lack ability, expertise, or private information strategically herd to
avoid being identified as a weak analyst. In contrast, ‘strong’ analysts (those with higher
ability, greater expertise, or access to private information) issue bold forecasts to showcase
their ability.9 Consistent with these predictions, empirical studies find weak analysts are
more likely to issue herding forecasts (Hong, Kubik, and Solomon [2000]; Clement and
Tse [2005]).
Although the analyst herding literature focuses on analyst reactions to the public
information from other analysts’ forecasts, this paper focuses on analyst reactions to public
information from managers in the form of voluntary ETR forecasts. I classify analyst ETR
forecasts as either agreeing or disagreeing with public management ETR forecasts. When
analysts disagree with a manager’s forecast, analysts reveal that they place heavier weight
on their private information than the manager’s forecast. Alternatively, disagreeing
9 Other analyst herding studies reconsider whether analysts herd and whether analysts who herd are stronger analysts. For example, Bernhardt et al. [2006] find that analysts who issue contrarian (anti-herding) forecasts overweight their private information. In a theoretical study, Aharoni et al. [2017] show that strong analysts rationally herd. In circumstances when information is difficult to obtain, they find that analysts with private information can underweight their private information and strategically bias their forecast toward the consensus. These findings suggest that the type of analyst who herds is not resolved by prior literature.
11
analysts could simply have failed to copy the firm’s ETR forecast. Prior studies note cases
where analysts do not incorporate publicly available tax information into their forecasts
(Plumlee [2003]; Hoopes [2017]). Thus, analysts who disagree with management ETR
forecasts could be weaker analysts. On the other hand, prior research shows that analysts
react to management forecasts (Waymire [1986]; Jennings [1987]; Hassell, Jennings, and
Lasser [1988]; Clement, Frankel, and Miller [2003]). Thus, analysts who disagree with
manager’s ETR forecast should only do so when they have good reasons to disagree.
In summary, the herding literature implies that weaker analysts are more likely to
herd on management’s ETR forecast. However, the tax literature and management earnings
forecast literature suggest that weaker analysts are more likely deviate from management’s
ETR forecast because it is not clear what private information analysts have about taxes.
Given the evidence for opposing predictions, I state my hypothesis in the null form:
H1: The likelihood that analysts disagree with managers’ voluntary ETR forecasts
is not systematically associated with an analyst’s experience and resources.
12
2.3 ARE ANALYST EARNINGS FORECASTS THAT DISAGREE WITH MANAGERS’ ETR
FORECASTS MORE ACCURATE?
In addition to examining characteristics of analysts who herd, analyst herding
studies investigate the effect of analyst herding on forecast accuracy. Analysts have
incentives to issue profitable stock recommendations and accurate forecasts (Keane and
Runkle [1998]; Brown, Call, Clement, and Sharp [2015]). Clement and Tse [2005] find
that bold forecasts are more accurate than herding forecasts. Their finding is consistent
with theoretical arguments that herding represents analysts biasing toward the consensus
(although not necessarily mimicking) and underweighting their useful private information.
Clement and Tse [2005] also find that when analysts issue forecast revisions, the
improvement in forecast accuracy is greater for bold forecasts than herding forecasts. This
finding further suggests that bold forecasts are more reflective of private information than
herding forecasts.
For ETR forecasts, Bratten et al. [2017] show that analysts improve on managers’
mandatory ETR forecasts implied from GAAP interim reporting of tax expense and pretax
earnings. In the presence of complexity (such as discrete tax items), they find analysts tend
not to mimic managers’ mandatory GAAP ETR forecasts. By not mimicking, analysts
could be considered bold forecasters who assign higher weights to their private information
relative to their peers who mimic managers. In addition, Bratten et al. [2017] find analysts
who do not mimic managers’ GAAP ETR forecasts issue more accurate earnings forecasts
than analysts who did mimic. In summary, Bratten et al.’s [2017] results are consistent with
Clement and Tse’s [2005] results as we can view non-mimicking analysts as bold
forecasters and mimicking analysts as herd forecasters. These results would suggest that
analyst forecasts with disagreement over managers’ non-GAAP ETR forecasts are more
accurate than analyst forecasts that agree with managers’ non-GAAP ETR forecasts.
13
However, analysts who disagree with management ETR forecasts potentially issue
less accurate forecasts than analysts who agree for multiple reasons. First, numerous tax
studies argue that analysts are often either unable or unwilling to process tax information.
For example, Donelson et al. [2018] find that analyst forecast accuracy suffers when
managers strategically retain nonrecurring income taxes in non-GAAP earnings. Second,
tax information is difficult for firm outsiders to obtain (Graham et al. [2012]), so it is
unclear what private information analysts use to incrementally improve upon managers’
forecasts. Third, managers have the most useful information for calculating a forecast, so
biased management forecasts can still be informative. In addition, even when analysts can
anticipate managerial forecast bias, they do not entirely correct for the bias (Gong, Li, and
Wang [2010]). Fourth, although Bratten et al. [2017] show that analysts’ non-GAAP ETR
forecasts improve on managers’ GAAP ETR forecasts, it is unclear whether their findings
generalize to non-GAAP ETR forecasts from analysts and managers.
Moreover, analysts’ primary objective when issuing forecasts is to inform clients.
If forecast informativeness and accuracy are conflicting objectives, then analysts could
decide to issue less accurate forecasts. Louis et al. [2013] argue that analyst forecasts
deviate from managers’ pre-announcement earnings guidance to correct for earnings
management, even though deviations result in less accurate analyst forecasts. Overall, these
reasons suggest that analysts who disagree with managers’ voluntary ETR forecasts are
less accurate than analysts who agree.
Given the opposing predictions from the tax literature and the analyst herding
literature, I state my hypothesis in the null form as follows:
H2: Analyst disagreement with managers’ voluntary ETR forecasts is not
systematically associated with their earnings forecast accuracy.
14
2.4 DO INVESTORS REACT MORE TO ANALYST FORECASTS WITH DISAGREEING ETR
FORECASTS?
Prior research on investor reactions to analyst forecasts suggests that investors react
to the incremental information in analyst forecasts. For example, analyst EPS forecasts
with sales forecast information have a greater market reaction than EPS forecasts without
sales forecast information (Keung [2010]). In addition, investors react less to analyst
herding forecasts (Cooper, Day, and Lewis [2001]; Gleason and Lee [2003]). Analysts
could also sacrifice their forecast accuracy to increase the usefulness of their forecast to
clients (Louis et al. [2013]). Thus, even if disagreeing analyst forecasts are less accurate,
investors would still react more strongly to disagreeing analyst forecasts if investors find
useful information in the forecasts relative to agreeing analyst forecasts.
On the other hand, investors could react less to disagreeing analyst forecasts for the
same reasons that suggest disagreeing analyst forecasts are less accurate than agreeing
analyst forecasts. Because investor reaction could be greater or weaker to analysts’
forecasts with ETR disagreement relative to agreeing ETR forecasts, I state my hypothesis
in the null form:
H3: Investor reaction to an analyst’s forecast is not systematically associated with
whether the analyst’s ETR forecast disagrees with voluntary management ETR forecasts.
15
Chapter 3: Sample and Descriptive Statistics
I collect managers’ voluntary ETR forecasts from earnings conference calls on
Thomson Reuters ONE for S&P 500 corporations in Compustat between 2004 and 2015
incorporated in the U.S. as shown in Table 1.10,11 I hand-collect ETR forecasts because
machine-readable databases like First Call Company Issued Guidance (CIG) have sparse
coverage of non-EPS forecasts (Chuk, Matsumoto, and Miller [2013]). A total of 5,411
firm-years (about 451 firms per year) meet the initial sample requirements and potentially
issue ETR forecasts. Like Hutton et al. [2012], my sample consists of annual ETR forecasts
made early in the fiscal year.12 I read fourth-quarter earnings conference calls to find
management ETR forecasts (Appendix A presents an example of ETR guidance from
Abbot Laboratories and Appendix B presents their ETR forecasts from 2004-2015). I find
managers voluntarily issued ETR forecasts in about 43 percent of firm-years (2,347 out of
5,411 firm-years). Table 2 shows that the percentage of firm managers issuing ETR
forecasts ranges from a minimum of 29 percent in 2004 to a maximum of 49 percent in
2014. After excluding observations missing information from I/B/E/S, I have 2,110 firm-
years with ETR forecasts.
I match managers’ voluntary ETR forecasts to analyst forecasts from I/B/E/S for a
total sample of 44,114 analyst-firm-year forecasts issued in the period between the prior
year’s fourth quarter earnings release and before the current fiscal year’s first quarter
10 All analysts should have to access to managers’ voluntary ETR forecasts because my sample begins several years after the implementation of Reg FD in 2000. I do not expect Reg FD to influence my findings, which significantly changed firms’ information environments (Heflin, Subramanyam, and Zhang [2003]; Wang [2007]). Thus, I expect analysts to disagree with managers’ ETR forecasts because they had different expectations of ETR rather than because they did not know managers’ forecasts. 11 I exclude 287 firm-years of non-taxable entities including real estate investment trusts (SIC code 6798), limited partnerships (names ending in “-LP”), trusts (names containing “TRUST”), and mutual funds, because these entities often have insignificant income tax burdens. 12 Manager and analyst forecasts issued later in the year suffer from larger confounding incentives to beat forecasts.
16
earnings release.13 I study analyst forecasts between these dates to keep information
available to analysts consistent across firms. Outside of these dates, other information will
be increasingly important to forecast ETR relative to managers’ ETR forecasts.14 The
sample contains forecasts from 3,178 analysts from 272 brokerages.
Table 3 presents descriptive statistics for regression variables of my main tests. I
document that 33 percent of analyst forecasts disagree with management ETR forecasts.15
Among the analysts with ETR forecast disagreement, the mean (median) absolute ETR
forecast disagreement difference between analysts and managers is 4.8 percent (2.2
percent). Thus, analyst ETR disagreement appears material to the overall earnings forecast.
Descriptive statistics for analyst characteristics exclude duplicate analyst forecasts
in a firm-year. Analysts have a mean (median) of 12.5 (11) years of general forecasting
experience. In a fiscal year, analysts issued a mean (median) of 5.5 (5) forecasts per firm.
They cover a mean (median) of 3.6 (3) industries and 16.6 (16) companies. Thus, analysts
in the sample have significant forecasting experience, update their forecasts throughout the
year, and follow multiple industries and companies.
13 My sample includes all analyst forecasts issued in a firm-year between the prior year’s fourth-quarter earnings release and the current year’s first-quarter earnings release. Thus, the sample can include multiple forecasts by an individual analyst for a single firm-year and it reflects a null hypothesis that analysts update their forecasts to fully reflect their expectations. However, my results are robust to restricting the sample of forecasts to either an analyst’s first-issued forecast or last-issued forecast in a firm-year and including analyst fixed effects. 14 Specifically, I only consider analyst forecasts issued after the fourth-quarter earnings release so analysts can update for managers’ ETR forecasts and the prior fiscal year’s financial performance. I also do not examine analyst forecasts issued after the first-quarter earnings release because first-quarter earnings provide new information about firm prospects. Finally, analyst forecasts issued during this period are less likely to rely on stale information because analysts often update their forecasts following fiscal year-end earnings releases (Asquith et al. [2005]). 15 Bratten et al. [2017] document 73.6 percent of analysts’ ETR forecasts differ from managers’ implied GAAP ETR forecasts by greater than half a percent. As expected, their disagreement frequency is greater than the one reported in this study because they show mandatory inclusion of discrete tax items pollute GAAP ETR forecasts. This paper compares analysts’ and managers’ non-GAAP ETR forecasts, which are generally free of discrete tax items.
17
The main dependent variables for examining the consequences of ETR
disagreement are absolute after-tax forecast error and stock price changes in the 40-minute
windows centered at the releases of analyst forecasts. The mean (median) of absolute after-
tax forecast error is 0.13 (0.07), with slightly larger values for absolute pretax forecast
error. The absolute stock price change in the 40-minute window has a mean (median) of
0.0069 (0.0024), and the forecasts news (the difference between the analyst after-tax
forecast and the consensus analyst forecast) has a mean (median) of 0.0030 (0.0015).
18
Chapter 4: Research Design and Empirical Analyses
4.1 DETERMINANTS OF DISAGREEMENT (H1)
My first research question studies the association between analyst characteristics
and analyst disagreement with managers over ETR forecasts. I use a linear probability
model because nonlinear models with large numbers of fixed effects produce biased
coefficient estimates.16 My dependent variable (Disagreeijt) is an indicator variable for
analyst disagreement. Consistent with Bratten et al. [2017], Disagreeijt equals 1 when
analyst ETR forecasts deviate from manager’s ETR forecast by more the 0.5 percent and
equals 0 otherwise. When managers issue ETR forecast ranges, analyst disagreement
equals 1 if analyst ETR forecasts are outside of a manager’s forecast range by greater than
or equal to 0.5 percent, and equals 0 otherwise.17
I examine analyst characteristics studied by Clement [1999] and Clement and Tse
[2005]. Specifically, I test the association between analyst disagreement with management
ETR forecasts and general forecasting experience, firm forecasting experience, forecast
horizon, number of industries followed, number of companies followed, the size of the
brokerage that employs the analyst, how many forecasts the analysts issued for the firm in
the previous year, and the accuracy of the analyst’s last forecast for the firm in the prior
year. My empirical regression model is as follows:
16 I have 2,066 unique firm-years with manager ETR forecasts. Greene [2004] shows nonlinear fixed effects models such as logit and probit produce biased coefficient estimates because of the incidental parameter problem. 17 Results are not sensitive to measuring analyst disagreement as occurring when an analysts’ ETR forecast differs from the manager’s range midpoint by greater than or equal to 0.5 percent.
19
𝐷𝑖𝑠𝑎𝑔𝑟𝑒𝑒 = 𝛽 + 𝛽 𝐺𝑒𝑛𝐸𝑥𝑝𝑒𝑟𝑖𝑒𝑛𝑐𝑒 + 𝛽 𝐹𝑖𝑟𝑚𝐸𝑥𝑝𝑒𝑟𝑖𝑒𝑛𝑐𝑒
+𝛽 𝐹𝑜𝑟𝐻𝑜𝑟𝑖𝑧𝑜𝑛 + 𝛽 𝐼𝑛𝑑𝑢𝑠𝑡𝑟𝑖𝑒𝑠 + 𝛽 𝐶𝑜𝑚𝑝𝑎𝑛𝑖𝑒𝑠 +𝛽 𝐵𝑟𝑜𝑘𝑒𝑟𝑆𝑖𝑧𝑒 + 𝛽 𝐹𝑜𝑟𝐹𝑟𝑒𝑞𝑢𝑒𝑛𝑐𝑦
+𝛽 𝐹𝑜𝑟𝐴𝑐𝑐𝑢𝑟𝑎𝑐𝑦 + 𝐹𝑖𝑟𝑚-𝑌𝑒𝑎𝑟 𝐹𝑖𝑥𝑒𝑑 𝐸𝑓𝑓𝑒𝑐𝑡𝑠 + 𝜀 (1)
for firm i, analyst forecast j, and fiscal year t. With firm-year fixed effects, the
model compares analysts who disagreed to those who agreed with managers’ ETR
forecasts within a firm-year. In addition, variables for analyst characteristics are raw
amounts because the model includes firm-year fixed effects. For example, general
experience equals the unscaled number of years since an analyst’s first forecast on I/B/E/S.
I double cluster standard errors by analyst and firm-year to mitigate concerns of
heteroscedasticity and correlation of disagreement by an analyst and within a firm-year.
Theoretical and empirical research finds that analysts are more likely to herd when
faced with greater reputation and career concerns. Viewing disagreeing (agreeing) as a bold
(herd) forecast, these studies suggest that analysts with greater forecasting experience are
more likely to disagree with managers than analysts with less forecasting experience
because analysts with greater experience generally have more job security. Also, analyst
forecasts made with longer forecast horizons are more likely to disagree than forecasts
made with shorter horizons, because analysts who issue forecasts with longer horizons can
attribute forecasts errors to reasons other than ability. Analysts who follow more firms and
industries should have less time to focus on forecasting one firm’s earnings and thus are
less likely to disagree. On the other hand, analysts who issue more forecasts are more likely
to disagree as they are confident in their forecasting ability for a firm. Analysts who work
for larger brokerages could be more likely to disagree if they have greater job security and
access to superior information. Finally, analysts with greater prior forecast accuracy are
20
more likely to disagree because prior forecast accuracy could increase general confidence
in forecasting ability. On the other hand, Aharoni et al. [2017] show that strong analysts
underweight their private information. If so, then the associations between analyst
disagreement and career/reputational concerns described above switch from positive to
negative and vice versa.
Table 4 presents the results of estimating equation 1. In column 1, I find an analyst’s
general experience is negatively associated with disagreeing on management ETR
forecasts. This finding suggests that analysts with greater career concerns bias their
forecasts away from public information, contrary to the prevailing view of the analyst
herding literature. In addition, forecast horizon is positively and significantly associated
with disagreement, consistent with Clement and Tse’s [2005] positive association between
forecast horizon and boldness. This result suggests that analysts who issue forecasts later
in the year are more likely to disagree with managers’ ETR forecasts issued earlier in the
fiscal year. However, this result might not be surprising when comparing analyst and
manager ETR forecasts because analysts can often obtain more information as more time
passes or analysts could follow other analysts’ disagreeing ETR forecasts issued later.
I also find a significant positive coefficient between the size of the brokerage an
analyst works at and ETR disagreement, consistent with Clement and Tse [2005]. Analysts
employed at larger brokerages could have access to superior information, and so they issue
forecasts with greater weight placed on their private information. Finally, I find a
significant negative association between the number of companies the analyst follows and
ETR disagreement, suggesting that analysts who follow more companies are less likely to
disagree. Interestingly, other analyst characteristics do not appear to explain analyst ETR
forecast disagreement, despite these characteristics being highly predictive in prior
examinations of analyst herding.
21
I further analyze these results by considering whether the majority of analyst
forecasts in a firm-year agree or disagree with the manager’s forecast. An analyst who
disagrees with managers’ ETR forecasts when the majority of analyst forecasts agree is a
more narrow definition of an analyst issuing a bold forecast. Column 2 confirms that
analysts with greater experience are significantly less likely to issue bold forecasts, but the
coefficient is not significantly different than when the majority of analysts disagree shown
in column 3 (p-value = 0.25).18 The coefficient on forecast horizon is significantly different
depending on whether the majority of analysts disagree or agree (p-value = 0.002). The
positive association between ETR disagreement and forecast horizon is driven by instances
when the majority of analysts disagreed with the management forecast.
In columns 4-6, I examine the robustness of these results and exclude firm-year
fixed effects. Following Clement and Tse [2005], I measure each analysts’ characteristics
relative to other analysts within a firm-year. Specifically, each analyst characteristic
measure is transformed to a value between 0 and 1. The transformed analyst characteristic
equals the difference of the raw analyst characteristic and the minimum of the characteristic
within a firm-year scaled by the range of the characteristic within a firm-year. The results
are generally consistent with those presented in columns 1-3, suggesting that the results are
robust.
In summary, inexperienced analysts appear more likely to issue forecasts with ETR
disagreement. This finding is inconsistent with implications from the analyst herding
literature that analysts with greater experience are more likely to issue bold forecasts. But
some results are consistent with prior literature’s findings – forecasts issued later in the
fiscal year and analysts employed by larger brokerages are more likely to have ETR 18 For tests on the equality of coefficients between the ‘majority agree’ and ‘majority disagree’ columns, I present p-values for the interaction between the coefficient of interest and an indicator variable for whether the majority agree from an untabulated regression.
22
disagreement. Overall, the results appear to portray analyst ETR disagreement as resulting
from analyst overconfidence in their private information. However, based on evidence of
analyst characteristics alone, it is unclear whether analysts’ ETR disagreement forecasts
have consequences for forecast accuracy and investor reaction consistent with prior
literature on analyst herding.
23
4.2 ANALYST FORECAST ACCURACY (H2)
My second research question investigates the consequence of ETR forecast
disagreement for forecast accuracy. Specifically, I examine the association between analyst
disagreement and forecast accuracy using the following regression:
𝐴𝑏𝑠𝑜𝑙𝑢𝑡𝑒 𝐴𝑓𝑡𝑒𝑟-𝑡𝑎𝑥 𝐹𝐸 = 𝛽 + 𝛽 𝐷𝑖𝑠𝑎𝑔𝑟𝑒𝑒 + Σ𝛽 𝐴𝑛𝑎𝑙𝑦𝑠𝑡 𝐶𝑜𝑛𝑡𝑟𝑜𝑙𝑠
+𝐹𝑖𝑟𝑚-𝑌𝑒𝑎𝑟 𝐹𝑖𝑥𝑒𝑑 𝐸𝑓𝑓𝑒𝑐𝑡𝑠 + 𝜀 (2)
Absolute After-tax FEijt is defined as the absolute value of the after-tax forecast
error (the difference of after-tax earnings forecast and I/B/E/S actual earnings) scaled by
absolute I/B/E/S actual earnings.19 I control for analyst characteristics described in
equation 1 and I include firm-year fixed effects, which allows a comparison of the average
absolute forecast error of agreeing analysts versus disagreeing analysts within a firm-year.
I also double cluster standard errors on analyst and firm-year.
Because absolute forecast error measures the distance between the forecast and
actual amount, a positive coefficient on Disagreeijt (β1) suggests that disagreement leads to
less accurate forecasts and a negative coefficient suggests a more accurate forecast. I also
examine the accuracy of analyst pretax forecasts with Absolute Pretax FEijt, defined as the
absolute value of pretax forecast error scaled by absolute I/B/E/S pretax actual earnings.
Finally, I test the accuracy of analyst ETR forecasts with Absolute ETR FEijt, defined as
the absolute value of the analyst ETR forecast minus the Street ETR forecast.
Table 5 shows the results to estimating equation 2. Column 1 reports the empirical
estimates of the model including only an indicator for analyst disagreement and firm-year
fixed effects. Column 2 adds controls for analyst characteristics to the model. Both columns
19 Absolute forecast error results are robust to scaling the absolute difference of analyst earnings forecast and the I/B/E/S actual earnings forecast by fiscal year-end market value of equity.
24
have significantly positive coefficients on Disagreeijt, which suggests that analyst after-tax
forecasts with ETR disagreement are less accurate than analyst after-tax forecasts without
ETR disagreement.
In columns 3 and 4, I examine whether the association between analyst forecast
accuracy and ETR disagreement depends on whether the majority of analyst forecasts agree
or disagree with the manager’s ETR forecast. I find the association between ETR
disagreement and absolute forecast error is driven by analysts who disagreed when the
majority of analysts agreed (column 3). In contrast, when the majority of analyst forecasts
disagree with a manager’s ETR forecast, I do not find evidence of a significant association
between analysts’ forecasts that disagree and absolute forecast error (column 4). The
coefficients in column 3 and 4 are significantly different (p-value = 0.04), suggesting that
it is important to consider public information available to analysts from managers and the
consensus analyst behavior.
Columns 5 and 6 repeat the analysis of columns 3 and 4 using ranked absolute after-
tax forecast errors as the dependent variable. By ranking on absolute forecast error, the
results speak to an analyst’s goal to achieve relative forecast accuracy rather than absolute
forecast accuracy (Aharoni et al. 2017). Moreover, ranking absolute forecast errors
mitigates concerns that results can be attributed to inaccurate outlier forecasts. Column 5
shows a positive and statistically significant coefficient on Disagreeijt, which suggests that
forecasts are less accurate when the majority of analysts agreed. Column 6 shows a
negative and statistically significant coefficient on Disagreeijt, which suggests that
forecasts with ETR agreement are less accurate when the majority of forecasts have ETR
disagreement. In addition, the coefficients in columns 5 and 6 are significantly different
(p-value = 0.002). The results on ranked absolute forecast error confirm those presented
for absolute forecast error.
25
Table 6 shows the analysis for absolute pretax forecast error. Analyst disagreement
over ETR forecasts is associated with less accurate pretax forecasts. Thus, analysts appear
to disagree with managers about firm prospects, which leads to less accurate forecasts
rather than inaccurate forecasts being solely driven by disagreement over ETR. In
untabulated analysis, I also examine whether the differences in pretax forecast accuracy
are material to analyst after-tax earnings forecast accuracy. Specifically, I re-calculate
analysts’ after-tax earnings forecasts so that all forecasts use managers’ ETR forecasts. I
find analysts’ after-tax earnings forecasts adjusted to use managers’ ETR forecasts are
significantly less accurate than after-tax earnings forecasts following managers’ ETR
forecasts. Thus, analysts’ ETR forecast disagreements are associated with disagreements
in pretax earnings forecasts that are material to after-tax earnings overall.
In Table 7, I examine analyst absolute ETR forecast error. Column 1 shows that the
average absolute difference between the actual ETR and the analyst disagreeing ETR
forecast is 1.7%, which likely materially impacts analyst after-tax earnings forecast
accuracy.
In summary, results in Tables 5-7 show a strong association between analyst
absolute forecast errors and whether analyst ETR forecasts disagree with voluntary
management ETR forecasts. These findings speak to the herding literature because the
results suggest that disagreeing analysts are most inaccurate when they issue disagreeing
forecasts and the majority of analysts issued agreeing forecasts.
26
4.3 INVESTOR REACTION TO ANALYST FORECAST REVISIONS (H3)
My final research question examines investor reactions to analyst forecast revisions
when the analyst forecasts disagree with management ETR forecasts. Prior literature shows
that analyst revisions are positively associated with stock price changes, so I control for
analyst revisions and interact the revision with the indicator variable Disagreeijt. My model
is as follows:
𝑅𝑘. 𝑅𝑒𝑡𝑢𝑟𝑛 (−20𝑚𝑖𝑛, +20 𝑚𝑖𝑛) = 𝛽 + 𝛽 𝑅𝑘. 𝐹𝑜𝑟𝑒𝑐𝑎𝑠𝑡 𝑁𝑒𝑤𝑠
+ 𝛽 𝐷𝑖𝑠𝑎𝑔𝑟𝑒𝑒 + 𝛽 𝐹𝑜𝑟𝑒𝑐𝑎𝑠𝑡 𝑁𝑒𝑤𝑠 × 𝐷𝑖𝑠𝑎𝑔𝑟𝑒𝑒 + 𝜀 (3)
Rk. Return (-20min, +20min)ijt is the absolute stock price change in the 40-minute
window beginning 20 minutes before an analyst issue his forecast and ending 20 minutes
after, ranked within the firm-year and scaled by the number of forecasts in a firm-year.20,21
Prior studies use narrow return windows to examine whether analyst stock
recommendations are informative to investors (Altınkılıc and Hansen [2009]; Li et al.
[2015]). I calculate stock return as the change in stock price (proxied as the midpoint of
the national best bid and offer from NYSE Trade and Quote (TAQ) data between 2005-
2014).22 I also control for whether the forecast is issued during regular trading hours
20 I do not use daily stock returns because analysts often issue forecasts on the day of the earnings release or soon after. As a result, daily stock returns comingle investor reactions to an analyst’s forecast with the earnings release and other analyst forecasts. In untabulated robustness test of daily returns, I do not find investors react more analyst forecasts with ETR disagreement than analyst forecasts that follow managers’ ETR forecasts. 21 Similar to Altınkılıc and Hansen [2009], my main results use the 40-minute window centered at the announcement time. I find results similar to those presented in three additional time periods of narrow return windows: (0 min, +10 min), (-10 min, +10 min), and (0 min, +20 min). In addition, while other studies using TAQ data calculate stock returns by averaging the price of actual trades over ten-minute periods, I use the midpoint of bid-ask spreads because bid-ask spread data are available even without actual trades. When using actual trade data and following the return calculation methodology in Altınkılıc and Hansen [2009], the results are similar to those presented, but with a smaller sample. 22 I use ‘monthly product’ TAQ data, which provides intraday transaction data for years between 1993 and 2014.

27
(between 9:30 am and 4:00 pm) or in extended trading hours (including pre-trading hours
between 4:00 am and 9:30 am and after-hours trading between 4:00 pm and 8:00 pm). I
exclude analyst forecasts issued outside of regular and extended trading hours.
Rk. Forecast Newsijt equals the absolute difference between an analyst’s current
forecast and the consensus analyst forecast (calculated as the average of all analyst
forecasts issued before the analyst’s forecast), and ranked within the firm-year and scaled
by the number of forecasts in the firm-year. Standard errors are clustered by forecast
issuance date.
I expect a positive value of Rk. Forecast Newsijt (β1>0) because investors should
react to forecasts with greater news (Ivković and Jegadeesh [2004]). The coefficients of
interest are on Disagreeijt (β2) and the interaction term (β3) between Rk. Forecast Newsijt
and Disagreeijt. The coefficient on Disagreeijt suggests how investors react to analyst
forecasts, irrespective of news in the analyst forecast. The coefficient on the interaction
term between Rk. Forecast Newsijt and Disagreeijt suggests whether analysts disagreement
influences how investors perceive the usefulness of the forecast news.
Table 8 presents results of market reaction to analyst forecasts. As expected,
investors react to analyst forecast news: in the 40-minute window, stock returns are
positively associated with analyst forecasts displaying more forecast news. However,
investors do not distinguish between analyst forecasts that disagree with managers’ ETR
forecast versus analyst forecasts that follow. In addition, disagreeing forecasts do not
moderate the association between investor reaction and forecast news. These results do not
depend on whether the majority of analyst forecasts agree or disagree. In summary,
investors do not appear to find analysts’ disagreeing ETR forecasts as improvements on
managers’ ETR forecasts.
28
Chapter 5: Supplemental Analyses
5.1 WHAT INFORMATION DO DISAGREEING ANALYSTS USE TO FORECAST ETR?
The findings suggest that analysts do not improve on managers’ ETR forecasts.
Given that analysts can use managers’ forecasts rather than forecasting their own ETR,
analysts could have made a mistake when forecasting disagreeing ETRs. I consider this
explanation for disagreeing with managers’ ETR forecasts by examining what information
analysts use when they disagree. Specifically, I consider whether analysts use information
from manager’s ETR forecast range, the analyst’s own prior ETR forecast, the prior year
GAAP ETR, the prior year Street ETR, the prior year Q1 GAAP ETR, and the prior year
Q4 GAAP ETR.23 I also control for firm size and firm growth potential to proxy for the
general complexity of the firm’s business operation. The sample of analyst forecasts
contains only analysts’ ETR disagreement forecasts and it contains only the first forecast
issued by an analyst in a fiscal year to ensure analysts’ revisions are for information in the
fourth-quarter earnings release.
Column 1 of Table 9 shows that an analyst’s prior ETR forecast is significantly
associated with their subsequent ETR forecast. This evidence suggests that analysts have
information influencing their prior forecast that continues to influence their current
forecast, as if they are anchored on using their own prior forecast. Although the sample
contains only analyst forecasts that disagree with management ETR forecasts, I also find a
significant association between management ETR forecasts and analyst ETR forecasts.
Thus, analysts appear to use some of the managers’ ETR forecast information.24
23 Analysts can use the U.S. statutory tax rate as their ETR forecast, but a histogram of disagreeing ETR forecasts does not show “bunching” at the maximum U.S. statutory tax rate in the sample period (35 percent). 24 Because the evidence suggests analysts heavily rely on their prior ETR forecast, I examine whether analysts update their forecasts when managers issue new forecasts. In untabulated tests, I examine the association between analysts’ ETR revisions (the absolute difference between analysts’ current and last
29
Furthermore, the coefficients on management ETR forecast in columns 2 and 3 are
significantly different from one another (p-value = 0.002). This difference suggests that the
association between managers’ and analysts’ ETR forecasts is driven by situations when
the analyst disagreed, but the majority of analysts agreed. Finally, the prior year Street ETR
is significantly associated with analyst current ETR forecasts, suggesting the use of
historical tax information. However, columns 2 and 3 show that the coefficient on prior
year Street ETR is only significant when the majority of analysts disagreed (and
significantly different; p-value = 0.008).25 In summary, these results suggests that analysts
rely on their prior efforts to forecast ETR, but their use of manager’s ETR forecast and
historical ETR information depends on whether the majority of analysts agreed or
disagreed with manager’s forecast. Thus, analysts appear to exert effort to disagree with
managers’ ETR forecasts rather than disagreeing resulting from a casual error.
ETR forecasts) and managers’ forecast updates (the absolute difference between a manager’s ETR forecast and the analyst’s last forecast). For example, if an analyst forecasts a 24.5 percent ETR prior to an earnings announcement and then the manager issues a 26 percent ETR forecast, a disagreeing analyst forecast can revise their ETR upward 0.5 percent to a 25 percent ETR, rather than the full 1.5 percent. Adding to the findings in Table 6, the results suggest that analysts do not substantially revise their forecasts to match managers’ ETR forecasts and appear to be anchored on their prior ETR forecast. 25 These results are consistent with conversations with financial analysts, which confirm that analysts forecast ETRs. In general, they employ various methods to forecast ETRs and they believe ETRs should be stable across years so prior year Street ETRs are useful.
30
5.2 WHAT FIRM CHARACTERISTICS INFLUENCE THE PERCENTAGE OF ANALYSTS WHO
DISAGREE WITH MANAGEMENT ETR FORECASTS?
To understand why analysts disagree with managers, I examine the determinants of
the percentage of analysts’ forecasts that disagree with managers’ ETR forecasts. For
example, analysts potentially disagree with managers in complex situations because
analysts interpret complex information differently. On the other hand, analysts could be
more likely to follow the manager’s ETR forecast when forecasting is complicated because
they realize managers are more informed. I use the absolute difference between Street and
GAAP ETR in the prior year as a proxy for ETR forecast complexity because the absolute
difference between Street and GAAP ETR represents discrete items (Bratten et al. [2017]).
In Column 1 of Table 10, I find that a negative association between the prior-year
absolute difference between Street and GAAP ETR and the percentage of analysts
disagreeing. The result suggests fewer analysts disagree with managers when forecasting
ETR is more complex. I also find a positive association between the prior-year absolute
management ETR forecast error and the percentage of analysts disagreeing, suggesting that
more analysts follow managers’ ETR forecasts when managers are accurate forecasters and
that management credibility is important to analysts (Williams [1996]).
In Column 2, I exclude the absolute difference between Street and GAAP ETR and
include the absolute value of nonrecurring income taxes and special items, because these
items often generate differences between Street and GAAP ETR. The negative signs on
absolute nonrecurring income taxes is consistent with the negative sign on Abs. (Street‒
GAAP ETR)it-1 in column 1, but not statistically significant, which could reflect insufficient
power to observe the effect of nonrecurring income taxes on analyst disagreement.
The negative and statistically significant coefficient on special items suggests that
more analysts follow managers’ ETR forecast when managers disclosed special items in
31
the previous year. In addition, fewer analysts disagree when firms have greater R&D
spending. R&D spending makes forecasting ETR more difficult because R&D expense
generates tax credits in the jurisdiction where the spending occurs. The result further
suggests that greater ETR forecasting complexity is associated with less analyst
disagreement.
In general, these results imply that ETR forecasting complexity is associated with
more analysts following of managers’ ETR forecasts. Analysts also consider past
forecasting accuracy by managers when deciding their forecast. Because analysts appear
to disagree in less complex situations, these findings contribute additional evidence to the
perspective that when analysts disagree with managers’ ETR forecast, the analyst
characteristics describe overconfidence.
32
5.3 WHY DO MANAGERS ISSUE ETR FORECASTS?
Next, I explore why managers issue ETR forecasts. If managers primarily want to
inform market participants of firm-specific events when issuing ETR forecasts, then
analysts are unlikely to have information that improves on managers’ forecasts. Prior
research suggests that managers voluntarily disclose to meet outside demand for
information, such as when environments are complex (Graham et al. [2005]). Wasley and
Wu [2006] find that managers issue cash flow forecasts to signal good news, especially
about cash flows, and conclude that different incentives will drive different disclosures.
Thus, the incentives for managers to forecast ETR could be different than those for
forecasts of net earnings and cash flows.
Higgins [2013] argues that ETR forecasting difficulty motivates managers to issue
ETR forecasts. However, greater ETR forecasting difficulty could lead to increased
differences of opinion between analysts and managers about future ETRs. My study adds
to Higgins [2013] because I collect managers’ ETR forecasts from earnings conference
calls while she collects forecasts from 10-Ks. In general, managers issue forecasts at
earnings releases rather than in 10-Ks so my sample is larger and more representative of
firms that issue ETR forecasts. In Table 11, I examine whether managers issue ETR
forecasts in response to forecasting complexity, while controlling for the firms’ overall
disclosure strategy. MGMT ETR Forecastit is an indicator variable equal to 1 when a
manager issued an ETR forecast and 0 otherwise. My variables of interest proxy for the
firm environment, especially for ETR forecast complexity. To control for managers’
general disclosure strategies, I include indicator variables for whether a manager issued a
pretax earnings forecast or a sales forecast. Thus, the analysis speaks to why managers
issue tax information forecasts rather than why they generally forecast.
33
I find evidence that temporary complexity in ETR is associated with a greater
likelihood that managers issue an ETR forecast, but persistent complexity is associated
with less likelihood that managers issue an ETR forecast. Specifically, in Column 1, I find
a positive association between the issuance of an ETR forecast and whether the firm
reported a nonrecurring income tax in the prior year, but when firms have greater R&D
spending or potential negative earnings, managers are less likely to forecast an ETR. Thus,
managers appear to issue ETR forecasts when prior year’s ETR is temporarily complex
and managers appear less likely to issue ETR forecasts when they also face complexity to
forecast an ETR. In column 2, I add control variables for the historical complexity of ETR,
but I do not find these variables influence managers’ decisions to issue ETR forecasts.
Columns 3 and 4 show similar results when controlling for firm fixed effects rather than
an indicator variable of whether managers issued an ETR in the prior fiscal year. Thus,
managers appear to issue ETR forecasts to communicate firm-specific information.
34
5.4 DOES ETR FORECASTING COMPLEXITY MODERATE THE ASSOCIATION BETWEEN
ANALYST ETR FORECAST DISAGREEMENT AND FORECAST ACCURACY?
Analysts could have information to add to managers’ forecasts under certain types
of complexity, especially when analysts can reply on their macroeconomic information,
unbiased perspectives, or industry knowledge (Hutton et al. [2012]). Thus, I examine
whether complexity moderates the association between analyst ETR forecast disagreement
and forecast accuracy. I identify three situations when forecasting an ETR is potentially
more complex and analysts could rely on their information advantages: (1) firms that
operate in many countries, (2) firms with many legal entities in tax havens, and (3) firms
with weak corporate governance (measured as the percentage of independent directors in
the board).26 In untabulated analyses, I do not find the proxies of ETR forecast complexity
moderate the association between ETR forecast disagreement and forecast accuracy.
Specifically, I compare firms with greater than or equal to the median level of the
complexity proxy to firms with less than the median level. In both subsamples, analysts
issue less accurate forecasts when they disagree with managers’ ETR forecasts and the
average forecast error is about equal. Thus, analysts do not appear improve on managers’
ETR forecasts even in complex forecasting circumstances.
26 Dyreng and Lindsey [2009] find that U.S. firms with subsidiaries in at least one tax haven country have lower ETRs than firms without subsidiaries in tax havens. I thank Scott Dyreng for providing the Exhibit 21 data at https://sites.google.com/site/scottdyreng/Home/data-and-code.
35
Chapter 6: Robustness Tests
6.1 MINORITY INTEREST AND OTHER INCOME ITEM ADJUSTMENTS
Although I calculate analysts’ ETR forecasts following methodology in current
literature (Bratten et al. [2017]; Hutchens [2017]): the difference between pretax and after-
tax earnings forecasts, scaled by the pretax forecast with forecast values from I/B/E/S, this
calculation of analysts’ ETR forecast can lead to inaccurate values because analysts
sometimes submit their after-tax earnings forecasts with other income item adjustments,
but analysts’ pretax forecasts do not include these items.27 Mitigating concerns about
estimation error in analyst ETR forecasts, my results are robust (untabulated) to three large-
sample tests designed to eliminate noise from other income item adjustments. I construct
samples of firm-years with no other income item adjustments (1) in the fiscal year before
the forecast year; (2) in the forecast year; and (3) in both the prior and current forecast year.
Analyst ETR disagreement remains significantly associated with less accurate earnings
forecasts in all three subsamples, so other income item adjustments do not appear to explain
the results.28
27 Consistent with Bratten et al. [2017], other income item adjustments are from minority interest, discontinued operations, extraordinary income, equity in earnings affiliates, and preferred dividends. 28 I also randomly sample 60 firm-years and match analyst forecasts from I/B/E/S to their research reports on Thomson Reuters ONE. Analyst research reports provide the true analyst ETR forecast. However, I lose about 60 percent of analyst forecasts when matching I/B/E/S to Thomson Reuters ONE. Consistent with a loss of statistical power, untabulated results show coefficient signs consistent with the main analysis, but not statistically significant.
36
6.2 PLACEBO TEST
Do analysts who disagree have lower forecasting ability? I examine this possibility
with placebo dates to match analyst and manager forecasts. Specifically, I lag analyst ETR
forecast disagreement (e.g., if an analyst disagrees with the manager in the year 2010, I
examine whether the analyst’s forecast in the year 2009 is less accurate than peer analyst
forecasts who agreed with managers in the year 2010). If analysts of weaker ability issue
forecasts with ETR disagreement, then I should find roughly similar results using placebo
dates. In an untabulated regression, I find no evidence of a relationship between analyst
disagreement and absolute forecast error using a lagged one-year placebo date. Thus, my
results do not appear to result from analysts of weaker ability issuing forecasts with ETR
disagreement.
37
Chapter 7: Discussion and Conclusion
This study examines determinants and consequences of analyst ETR forecast
disagreement with managers. To my knowledge, my study is the first to examine whether
analysts improve on managers’ voluntary ETR forecasts. When viewing analyst forecasts
that disagree with managers’ ETR forecasts as bold forecasts, the results contrast with
implications from the analyst herding literature. I find that analysts with less work
experience and analysts working at larger brokerages are more likely to disagree with
managers. I also find analyst forecasts with disagreement over ETR are less accurate, and
investors do not appear to differentiate between the types of forecasts. These results suggest
that analysts do not improve on management ETR forecasts. While Hutton et al. [2012]
find that analysts do not improve on managers’ forecasts when firms face unusual
circumstances, my findings suggest that, even under regular operating circumstances,
analysts do not improve on managers’ forecasts of firm-specific information like taxes.
Finally, my study informs investors looking to analysts to understand the impact of
taxes on corporate earnings, especially given the 2017 reform of the U.S. corporate income
tax code. Tax reform had a material and complex impact on corporate earnings due to the
reduction of the statutory tax rate and deemed repatriation of permanently reinvested
foreign earnings. In situations of temporary complexity, this study finds evidence that
managers are more likely to issue forecasts and analysts appear more likely to follow
managers’ ETR forecast. However, some of the tax law’s implications remain unclear and
its unintended consequences could require future corrective legislation. Public interest in
the impact of tax reform is high as evidenced by the substantial media coverage. Investors
could seek out analysts appearing to issue a bold ETR forecast because they disagree with
the manager’s ETR forecast. However, my study suggests that investors who seek accurate
earnings forecasts should rely on managers’ ETR forecasts.

38
Tables
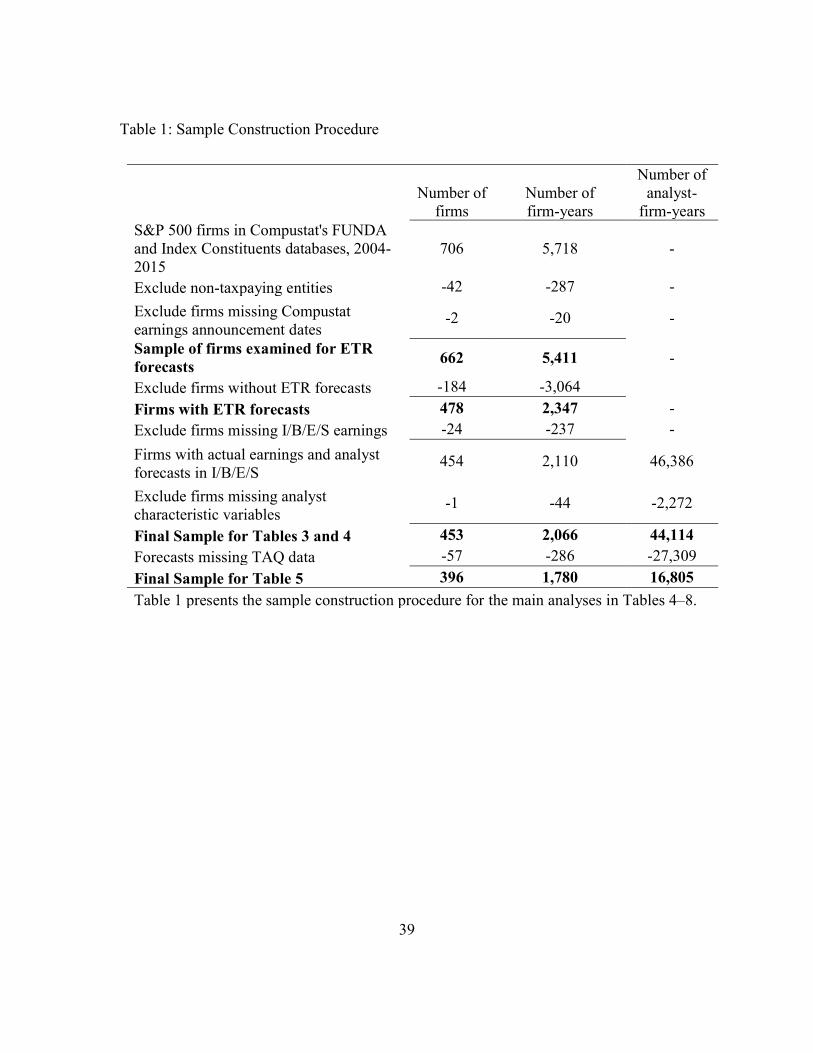
39
Table 1: Sample Construction Procedure
Number of
firms Number of firm-years
Number of analyst-
firm-years S&P 500 firms in Compustat's FUNDA and Index Constituents databases, 2004-2015
706 5,718 -
Exclude non-taxpaying entities -42 -287 -
Exclude firms missing Compustat earnings announcement dates
-2 -20 -
Sample of firms examined for ETR forecasts
662 5,411 -
Exclude firms without ETR forecasts -184 -3,064
Firms with ETR forecasts 478 2,347 -
Exclude firms missing I/B/E/S earnings -24 -237 -
Firms with actual earnings and analyst forecasts in I/B/E/S
454 2,110 46,386
Exclude firms missing analyst characteristic variables
-1 -44 -2,272
Final Sample for Tables 3 and 4 453 2,066 44,114
Forecasts missing TAQ data -57 -286 -27,309
Final Sample for Table 5 396 1,780 16,805
Table 1 presents the sample construction procedure for the main analyses in Tables 4–8.
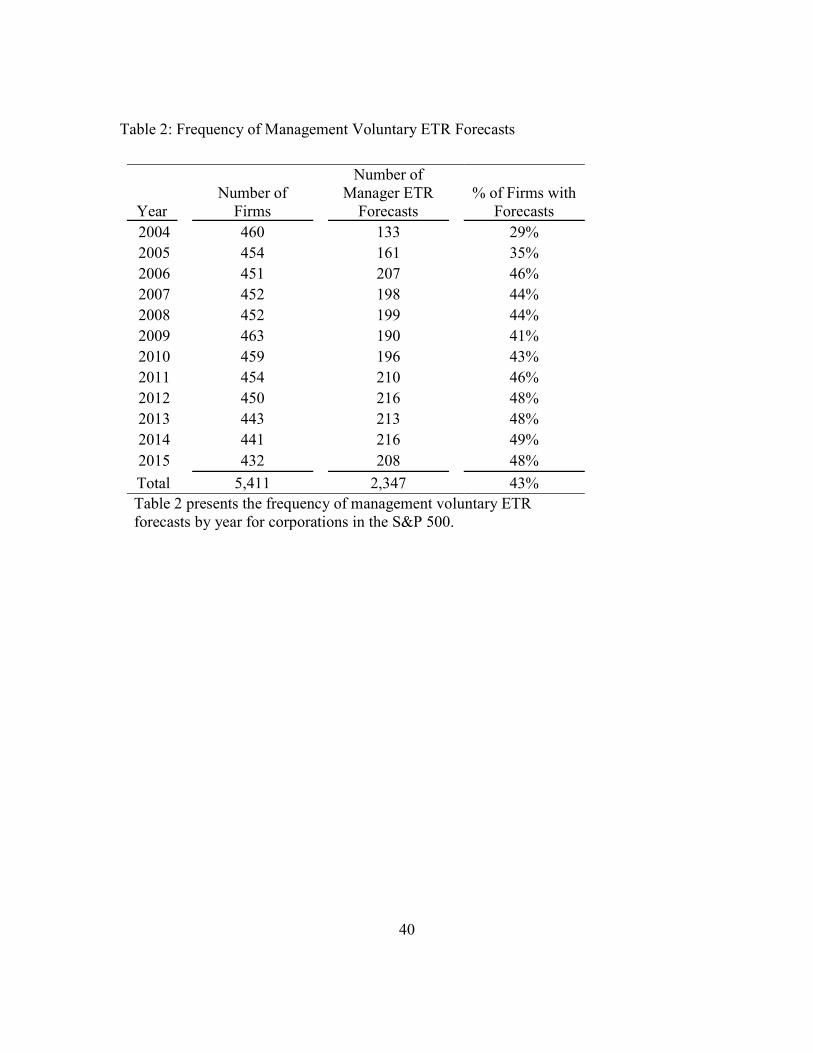
40
Table 2: Frequency of Management Voluntary ETR Forecasts
Year Number of
Firms
Number of Manager ETR
Forecasts % of Firms with
Forecasts 2004 460 133 29% 2005 454 161 35% 2006 451 207 46% 2007 452 198 44% 2008 452 199 44% 2009 463 190 41% 2010 459 196 43% 2011 454 210 46% 2012 450 216 48% 2013 443 213 48% 2014 441 216 49% 2015 432 208 48%
Total 5,411 2,347 43% Table 2 presents the frequency of management voluntary ETR forecasts by year for corporations in the S&P 500.
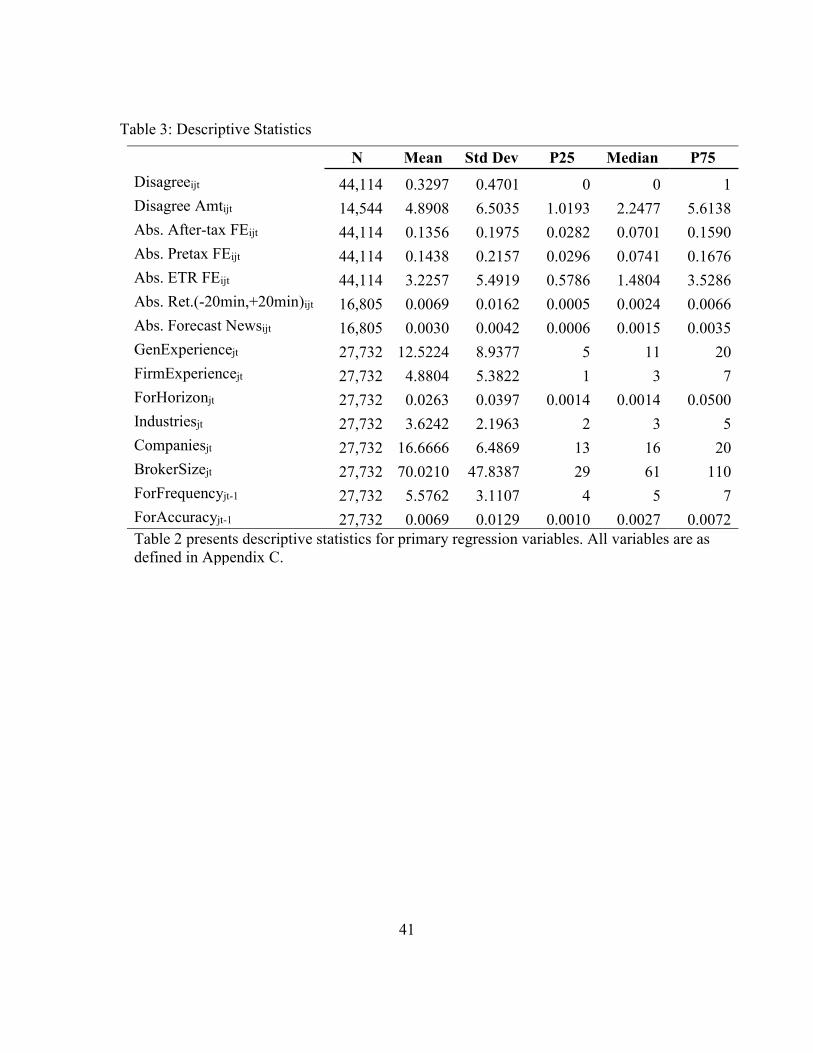
41
Table 3: Descriptive Statistics
N Mean Std Dev P25 Median P75
Disagreeijt 44,114 0.3297 0.4701 0 0 1 Disagree Amtijt 14,544 4.8908 6.5035 1.0193 2.2477 5.6138 Abs. After-tax FEijt 44,114 0.1356 0.1975 0.0282 0.0701 0.1590 Abs. Pretax FEijt 44,114 0.1438 0.2157 0.0296 0.0741 0.1676 Abs. ETR FEijt 44,114 3.2257 5.4919 0.5786 1.4804 3.5286 Abs. Ret.(-20min,+20min)ijt 16,805 0.0069 0.0162 0.0005 0.0024 0.0066 Abs. Forecast Newsijt 16,805 0.0030 0.0042 0.0006 0.0015 0.0035 GenExperiencejt 27,732 12.5224 8.9377 5 11 20 FirmExperiencejt 27,732 4.8804 5.3822 1 3 7 ForHorizonjt 27,732 0.0263 0.0397 0.0014 0.0014 0.0500 Industriesjt 27,732 3.6242 2.1963 2 3 5 Companiesjt 27,732 16.6666 6.4869 13 16 20 BrokerSizejt 27,732 70.0210 47.8387 29 61 110 ForFrequencyjt-1 27,732 5.5762 3.1107 4 5 7 ForAccuracyjt-1 27,732 0.0069 0.0129 0.0010 0.0027 0.0072 Table 2 presents descriptive statistics for primary regression variables. All variables are as defined in Appendix C.
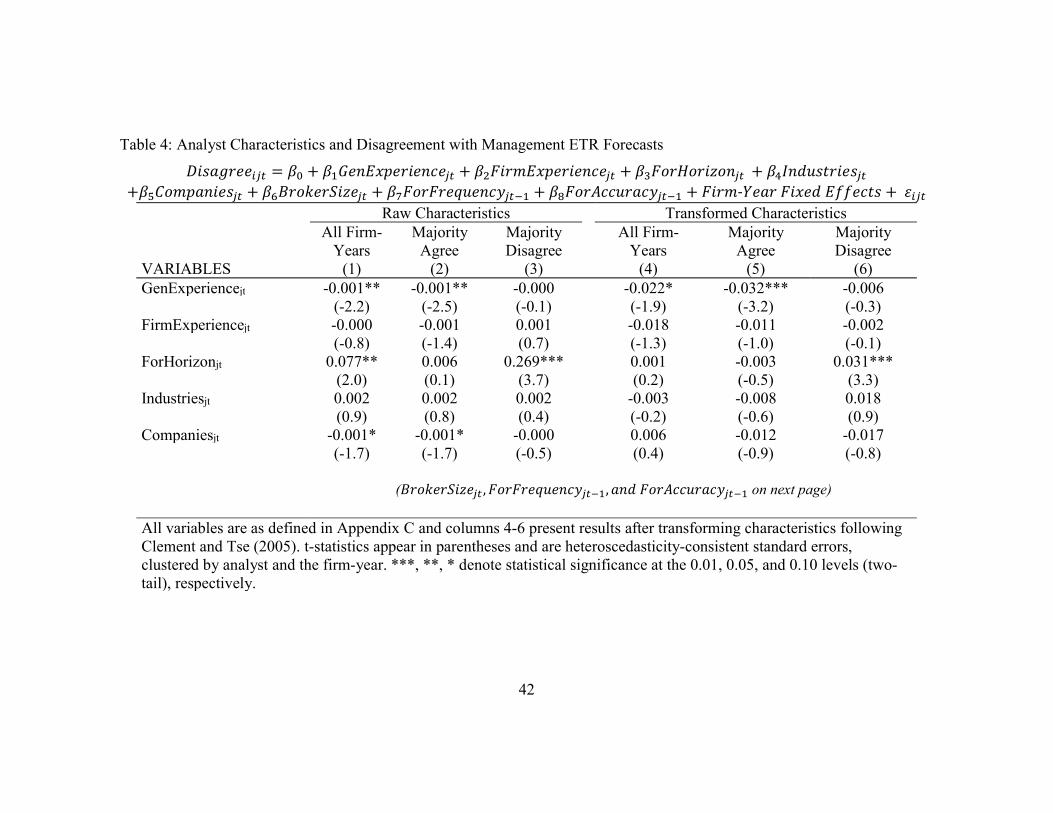
42
Table 4: Analyst Characteristics and Disagreement with Management ETR Forecasts
𝐷𝑖𝑠𝑎𝑔𝑟𝑒𝑒 = 𝛽 + 𝛽 𝐺𝑒𝑛𝐸𝑥𝑝𝑒𝑟𝑖𝑒𝑛𝑐𝑒 + 𝛽 𝐹𝑖𝑟𝑚𝐸𝑥𝑝𝑒𝑟𝑖𝑒𝑛𝑐𝑒 + 𝛽 𝐹𝑜𝑟𝐻𝑜𝑟𝑖𝑧𝑜𝑛 + 𝛽 𝐼𝑛𝑑𝑢𝑠𝑡𝑟𝑖𝑒𝑠 +𝛽 𝐶𝑜𝑚𝑝𝑎𝑛𝑖𝑒𝑠 + 𝛽 𝐵𝑟𝑜𝑘𝑒𝑟𝑆𝑖𝑧𝑒 + 𝛽 𝐹𝑜𝑟𝐹𝑟𝑒𝑞𝑢𝑒𝑛𝑐𝑦 + 𝛽 𝐹𝑜𝑟𝐴𝑐𝑐𝑢𝑟𝑎𝑐𝑦 + 𝐹𝑖𝑟𝑚-𝑌𝑒𝑎𝑟 𝐹𝑖𝑥𝑒𝑑 𝐸𝑓𝑓𝑒𝑐𝑡𝑠 + 𝜀
Raw Characteristics Transformed Characteristics All Firm-
Years Majority
Agree Majority Disagree
All Firm- Years
Majority Agree
Majority Disagree
VARIABLES (1) (2) (3) (4) (5) (6) GenExperiencejt -0.001** -0.001** -0.000 -0.022* -0.032*** -0.006 (-2.2) (-2.5) (-0.1) (-1.9) (-3.2) (-0.3) FirmExperiencejt -0.000 -0.001 0.001 -0.018 -0.011 -0.002 (-0.8) (-1.4) (0.7) (-1.3) (-1.0) (-0.1) ForHorizonjt 0.077** 0.006 0.269*** 0.001 -0.003 0.031*** (2.0) (0.1) (3.7) (0.2) (-0.5) (3.3) Industriesjt 0.002 0.002 0.002 -0.003 -0.008 0.018 (0.9) (0.8) (0.4) (-0.2) (-0.6) (0.9) Companiesjt -0.001* -0.001* -0.000 0.006 -0.012 -0.017 (-1.7) (-1.7) (-0.5) (0.4) (-0.9) (-0.8) (𝐵𝑟𝑜𝑘𝑒𝑟𝑆𝑖𝑧𝑒 , 𝐹𝑜𝑟𝐹𝑟𝑒𝑞𝑢𝑒𝑛𝑐𝑦 , 𝑎𝑛𝑑 𝐹𝑜𝑟𝐴𝑐𝑐𝑢𝑟𝑎𝑐𝑦 on next page) All variables are as defined in Appendix C and columns 4-6 present results after transforming characteristics following Clement and Tse (2005). t-statistics appear in parentheses and are heteroscedasticity-consistent standard errors, clustered by analyst and the firm-year. ***, **, * denote statistical significance at the 0.01, 0.05, and 0.10 levels (two-tail), respectively.
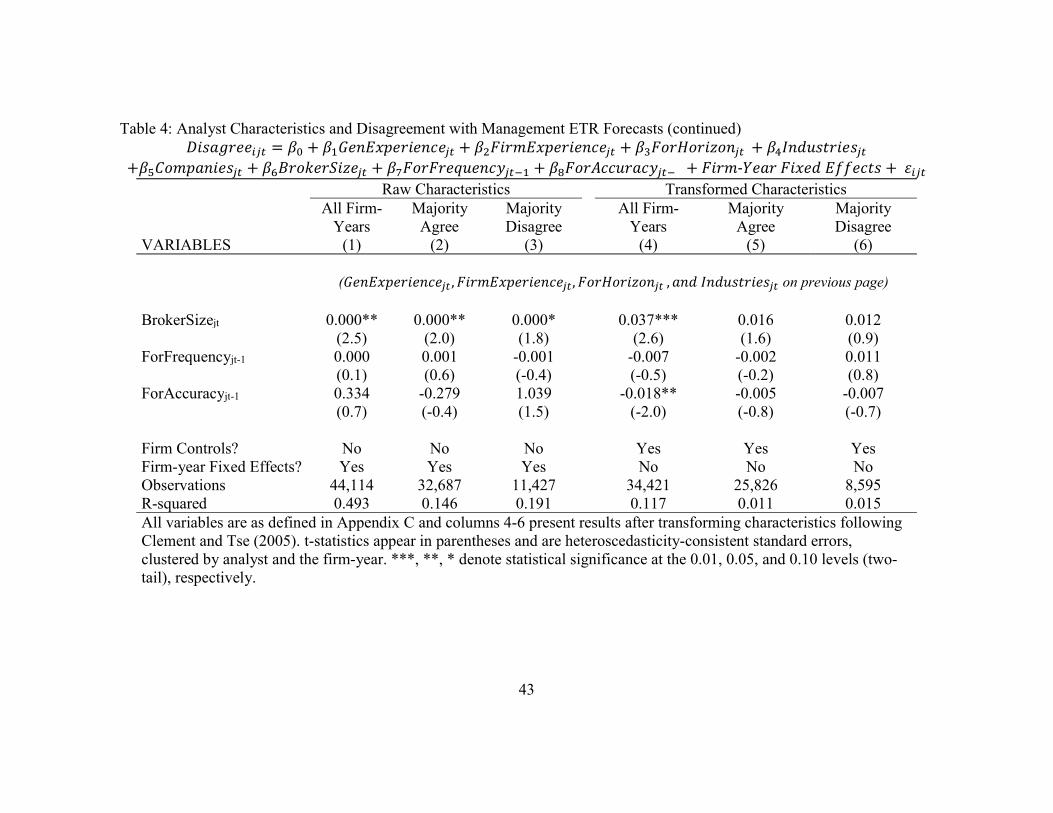
43
Table 4: Analyst Characteristics and Disagreement with Management ETR Forecasts (continued) 𝐷𝑖𝑠𝑎𝑔𝑟𝑒𝑒 = 𝛽 + 𝛽 𝐺𝑒𝑛𝐸𝑥𝑝𝑒𝑟𝑖𝑒𝑛𝑐𝑒 + 𝛽 𝐹𝑖𝑟𝑚𝐸𝑥𝑝𝑒𝑟𝑖𝑒𝑛𝑐𝑒 + 𝛽 𝐹𝑜𝑟𝐻𝑜𝑟𝑖𝑧𝑜𝑛 + 𝛽 𝐼𝑛𝑑𝑢𝑠𝑡𝑟𝑖𝑒𝑠
+𝛽 𝐶𝑜𝑚𝑝𝑎𝑛𝑖𝑒𝑠 + 𝛽 𝐵𝑟𝑜𝑘𝑒𝑟𝑆𝑖𝑧𝑒 + 𝛽 𝐹𝑜𝑟𝐹𝑟𝑒𝑞𝑢𝑒𝑛𝑐𝑦 + 𝛽 𝐹𝑜𝑟𝐴𝑐𝑐𝑢𝑟𝑎𝑐𝑦 + 𝐹𝑖𝑟𝑚-𝑌𝑒𝑎𝑟 𝐹𝑖𝑥𝑒𝑑 𝐸𝑓𝑓𝑒𝑐𝑡𝑠 + 𝜀 Raw Characteristics Transformed Characteristics All Firm-
Years Majority
Agree Majority Disagree
All Firm- Years
Majority Agree
Majority Disagree
VARIABLES (1) (2) (3) (4) (5) (6)
(𝐺𝑒𝑛𝐸𝑥𝑝𝑒𝑟𝑖𝑒𝑛𝑐𝑒 , 𝐹𝑖𝑟𝑚𝐸𝑥𝑝𝑒𝑟𝑖𝑒𝑛𝑐𝑒 , 𝐹𝑜𝑟𝐻𝑜𝑟𝑖𝑧𝑜𝑛 , 𝑎𝑛𝑑 𝐼𝑛𝑑𝑢𝑠𝑡𝑟𝑖𝑒𝑠 on previous page) BrokerSizejt 0.000** 0.000** 0.000* 0.037*** 0.016 0.012 (2.5) (2.0) (1.8) (2.6) (1.6) (0.9) ForFrequencyjt-1 0.000 0.001 -0.001 -0.007 -0.002 0.011 (0.1) (0.6) (-0.4) (-0.5) (-0.2) (0.8) ForAccuracyjt-1 0.334 -0.279 1.039 -0.018** -0.005 -0.007 (0.7) (-0.4) (1.5) (-2.0) (-0.8) (-0.7) Firm Controls? No No No Yes Yes Yes Firm-year Fixed Effects? Yes Yes Yes No No No Observations 44,114 32,687 11,427 34,421 25,826 8,595 R-squared 0.493 0.146 0.191 0.117 0.011 0.015 All variables are as defined in Appendix C and columns 4-6 present results after transforming characteristics following Clement and Tse (2005). t-statistics appear in parentheses and are heteroscedasticity-consistent standard errors, clustered by analyst and the firm-year. ***, **, * denote statistical significance at the 0.01, 0.05, and 0.10 levels (two-tail), respectively.
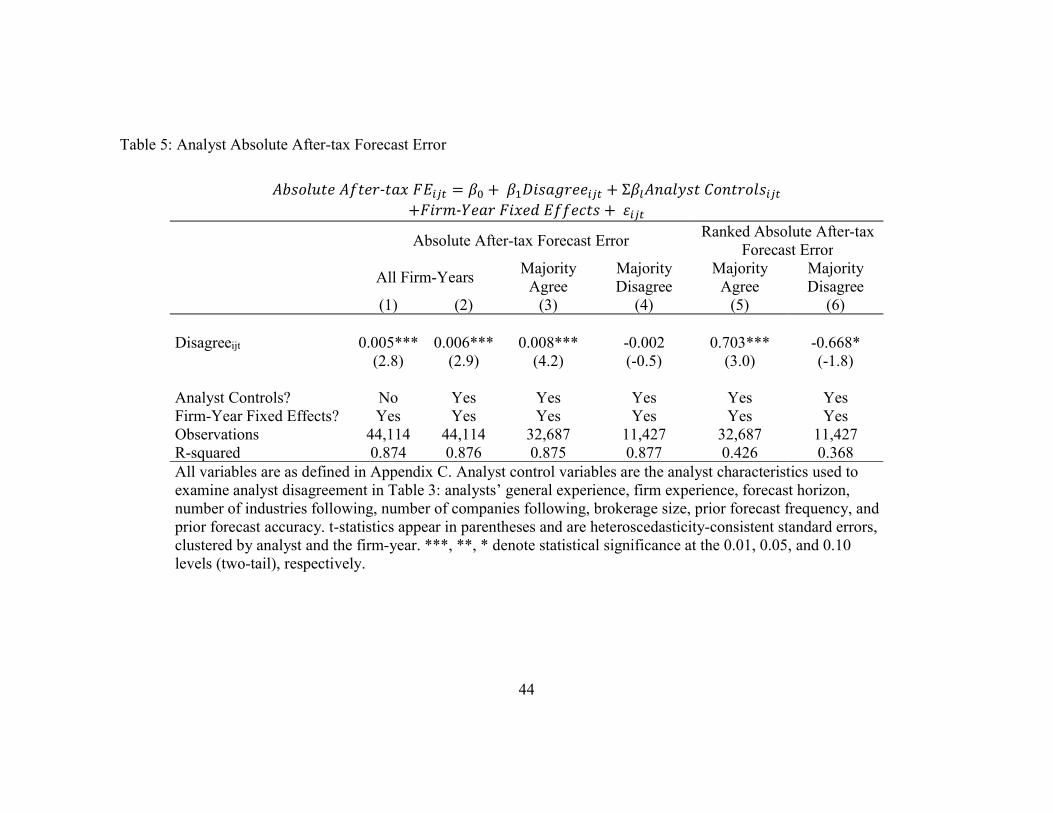
44
Table 5: Analyst Absolute After-tax Forecast Error
𝐴𝑏𝑠𝑜𝑙𝑢𝑡𝑒 𝐴𝑓𝑡𝑒𝑟-𝑡𝑎𝑥 𝐹𝐸 = 𝛽 + 𝛽 𝐷𝑖𝑠𝑎𝑔𝑟𝑒𝑒 + Σ𝛽 𝐴𝑛𝑎𝑙𝑦𝑠𝑡 𝐶𝑜𝑛𝑡𝑟𝑜𝑙𝑠
+𝐹𝑖𝑟𝑚-𝑌𝑒𝑎𝑟 𝐹𝑖𝑥𝑒𝑑 𝐸𝑓𝑓𝑒𝑐𝑡𝑠 + 𝜀
Absolute After-tax Forecast Error Ranked Absolute After-tax
Forecast Error
All Firm-Years Majority
Agree Majority Disagree
Majority Agree
Majority Disagree
(1) (2) (3) (4) (5) (6) Disagreeijt 0.005*** 0.006*** 0.008*** -0.002 0.703*** -0.668* (2.8) (2.9) (4.2) (-0.5) (3.0) (-1.8) Analyst Controls? No Yes Yes Yes Yes Yes Firm-Year Fixed Effects? Yes Yes Yes Yes Yes Yes Observations 44,114 44,114 32,687 11,427 32,687 11,427 R-squared 0.874 0.876 0.875 0.877 0.426 0.368 All variables are as defined in Appendix C. Analyst control variables are the analyst characteristics used to examine analyst disagreement in Table 3: analysts’ general experience, firm experience, forecast horizon, number of industries following, number of companies following, brokerage size, prior forecast frequency, and prior forecast accuracy. t-statistics appear in parentheses and are heteroscedasticity-consistent standard errors, clustered by analyst and the firm-year. ***, **, * denote statistical significance at the 0.01, 0.05, and 0.10 levels (two-tail), respectively.
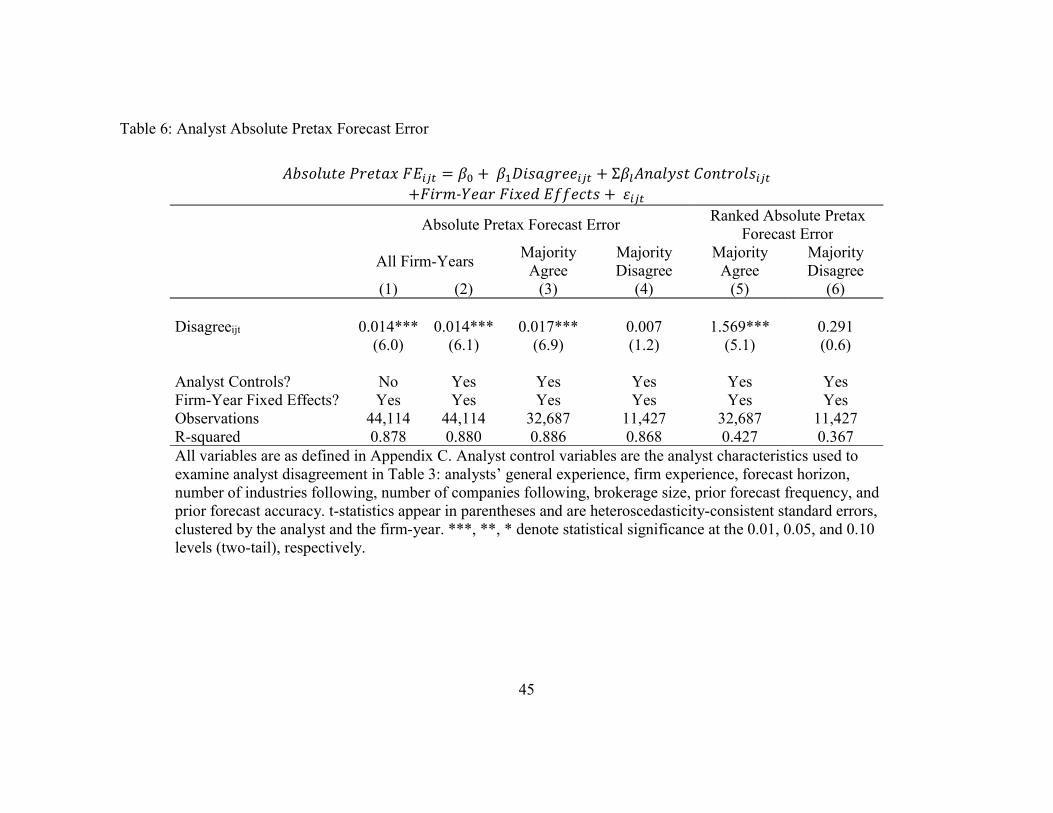
45
Table 6: Analyst Absolute Pretax Forecast Error
𝐴𝑏𝑠𝑜𝑙𝑢𝑡𝑒 𝑃𝑟𝑒𝑡𝑎𝑥 𝐹𝐸 = 𝛽 + 𝛽 𝐷𝑖𝑠𝑎𝑔𝑟𝑒𝑒 + Σ𝛽 𝐴𝑛𝑎𝑙𝑦𝑠𝑡 𝐶𝑜𝑛𝑡𝑟𝑜𝑙𝑠
+𝐹𝑖𝑟𝑚-𝑌𝑒𝑎𝑟 𝐹𝑖𝑥𝑒𝑑 𝐸𝑓𝑓𝑒𝑐𝑡𝑠 + 𝜀
Absolute Pretax Forecast Error Ranked Absolute Pretax
Forecast Error
All Firm-Years Majority
Agree Majority Disagree
Majority Agree
Majority Disagree
(1) (2) (3) (4) (5) (6) Disagreeijt 0.014*** 0.014*** 0.017*** 0.007 1.569*** 0.291 (6.0) (6.1) (6.9) (1.2) (5.1) (0.6) Analyst Controls? No Yes Yes Yes Yes Yes Firm-Year Fixed Effects? Yes Yes Yes Yes Yes Yes Observations 44,114 44,114 32,687 11,427 32,687 11,427 R-squared 0.878 0.880 0.886 0.868 0.427 0.367 All variables are as defined in Appendix C. Analyst control variables are the analyst characteristics used to examine analyst disagreement in Table 3: analysts’ general experience, firm experience, forecast horizon, number of industries following, number of companies following, brokerage size, prior forecast frequency, and prior forecast accuracy. t-statistics appear in parentheses and are heteroscedasticity-consistent standard errors, clustered by the analyst and the firm-year. ***, **, * denote statistical significance at the 0.01, 0.05, and 0.10 levels (two-tail), respectively.

46
Table 7: Analyst Absolute ETR Forecast Error
𝐴𝑏𝑠𝑜𝑙𝑢𝑡𝑒 𝐸𝑇𝑅 𝐹𝐸 = 𝛽 + 𝛽 𝐷𝑖𝑠𝑎𝑔𝑟𝑒𝑒 + Σ𝛽 𝐴𝑛𝑎𝑙𝑦𝑠𝑡 𝐶𝑜𝑛𝑡𝑟𝑜𝑙𝑠
+𝐹𝑖𝑟𝑚-𝑌𝑒𝑎𝑟 𝐹𝑖𝑥𝑒𝑑 𝐸𝑓𝑓𝑒𝑐𝑡𝑠 + 𝜀
Absolute ETR Forecast Error Ranked Absolute ETR
Forecast Error
All Firm-Years Majority
Agree Majority Disagree
Majority Agree
Majority Disagree
(1) (2) (3) (4) (5) (6) Disagreeijt 1.776*** 1.773*** 2.157*** 0.701* 5.762*** 1.773* (11.7) (11.7) (14.7) (1.9) (9.8) (1.9) Analyst Controls? No Yes Yes Yes Yes Yes Firm-Year Fixed Effects? Yes Yes Yes Yes Yes Yes Observations 44,114 44,114 32,687 11,427 32,687 11,427 R-squared 0.752 0.752 0.800 0.686 0.435 0.363 All variables are as defined in Appendix C. Analyst control variables are the analyst characteristics used to examine analyst disagreement in Table 3: analysts’ general experience, firm experience, forecast horizon, number of industries following, number of companies following, brokerage size, prior forecast frequency, and prior forecast accuracy. t-statistics appear in parentheses and are heteroscedasticity-consistent standard errors, clustered by the analyst and the firm-year. ***, **, * denote statistical significance at the 0.01, 0.05, and 0.10 levels (two-tail), respectively.
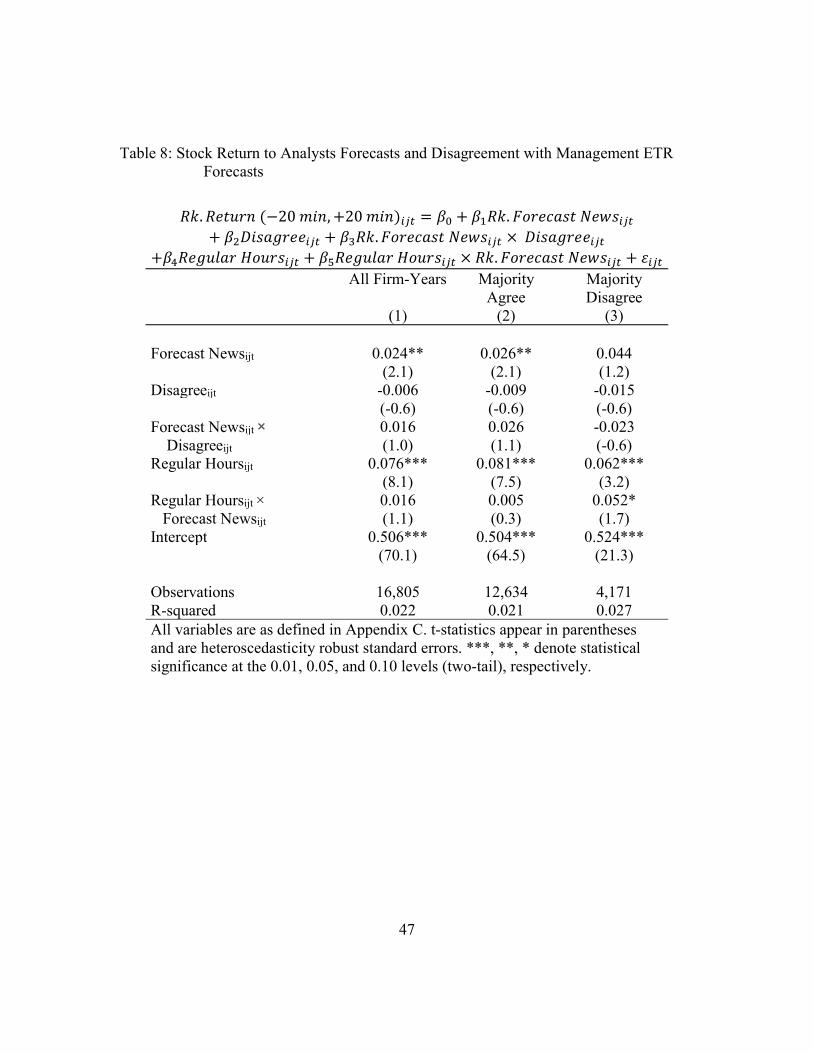
47
Table 8: Stock Return to Analysts Forecasts and Disagreement with Management ETR Forecasts
𝑅𝑘. 𝑅𝑒𝑡𝑢𝑟𝑛 (−20 𝑚𝑖𝑛, +20 𝑚𝑖𝑛) = 𝛽 + 𝛽 𝑅𝑘. 𝐹𝑜𝑟𝑒𝑐𝑎𝑠𝑡 𝑁𝑒𝑤𝑠
+ 𝛽 𝐷𝑖𝑠𝑎𝑔𝑟𝑒𝑒 + 𝛽 𝑅𝑘. 𝐹𝑜𝑟𝑒𝑐𝑎𝑠𝑡 𝑁𝑒𝑤𝑠 × 𝐷𝑖𝑠𝑎𝑔𝑟𝑒𝑒 +𝛽 𝑅𝑒𝑔𝑢𝑙𝑎𝑟 𝐻𝑜𝑢𝑟𝑠 + 𝛽 𝑅𝑒𝑔𝑢𝑙𝑎𝑟 𝐻𝑜𝑢𝑟𝑠 × 𝑅𝑘. 𝐹𝑜𝑟𝑒𝑐𝑎𝑠𝑡 𝑁𝑒𝑤𝑠 + 𝜀 All Firm-Years Majority
Agree Majority Disagree
(1) (2) (3) Forecast Newsijt 0.024** 0.026** 0.044 (2.1) (2.1) (1.2) Disagreeijt -0.006 -0.009 -0.015 (-0.6) (-0.6) (-0.6) Forecast Newsijt × 0.016 0.026 -0.023 Disagreeijt (1.0) (1.1) (-0.6) Regular Hoursijt 0.076*** 0.081*** 0.062*** (8.1) (7.5) (3.2) Regular Hoursijt × 0.016 0.005 0.052* Forecast Newsijt (1.1) (0.3) (1.7) Intercept 0.506*** 0.504*** 0.524*** (70.1) (64.5) (21.3) Observations 16,805 12,634 4,171 R-squared 0.022 0.021 0.027 All variables are as defined in Appendix C. t-statistics appear in parentheses and are heteroscedasticity robust standard errors. ***, **, * denote statistical significance at the 0.01, 0.05, and 0.10 levels (two-tail), respectively.
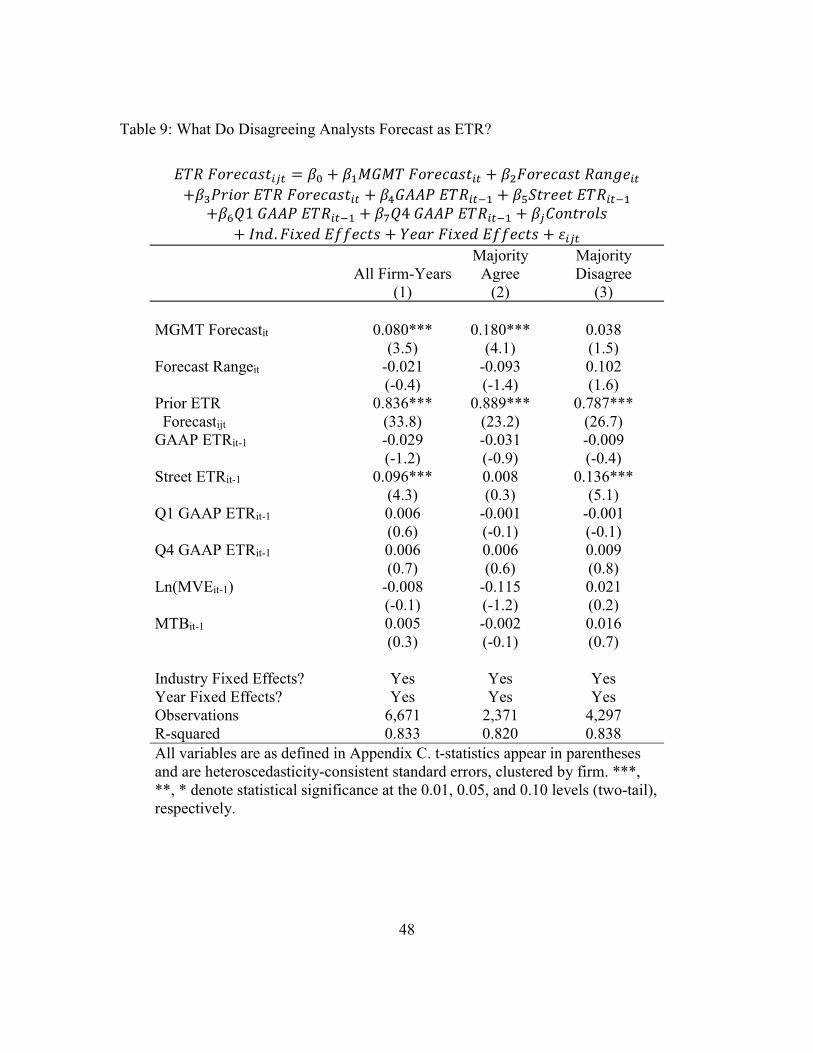
48
Table 9: What Do Disagreeing Analysts Forecast as ETR?
𝐸𝑇𝑅 𝐹𝑜𝑟𝑒𝑐𝑎𝑠𝑡 = 𝛽 + 𝛽 𝑀𝐺𝑀𝑇 𝐹𝑜𝑟𝑒𝑐𝑎𝑠𝑡 + 𝛽 𝐹𝑜𝑟𝑒𝑐𝑎𝑠𝑡 𝑅𝑎𝑛𝑔𝑒
+𝛽 𝑃𝑟𝑖𝑜𝑟 𝐸𝑇𝑅 𝐹𝑜𝑟𝑒𝑐𝑎𝑠𝑡 + 𝛽 𝐺𝐴𝐴𝑃 𝐸𝑇𝑅 + 𝛽 𝑆𝑡𝑟𝑒𝑒𝑡 𝐸𝑇𝑅 +𝛽 𝑄1 𝐺𝐴𝐴𝑃 𝐸𝑇𝑅 + 𝛽 𝑄4 𝐺𝐴𝐴𝑃 𝐸𝑇𝑅 + 𝛽 𝐶𝑜𝑛𝑡𝑟𝑜𝑙𝑠
+ 𝐼𝑛𝑑. 𝐹𝑖𝑥𝑒𝑑 𝐸𝑓𝑓𝑒𝑐𝑡𝑠 + 𝑌𝑒𝑎𝑟 𝐹𝑖𝑥𝑒𝑑 𝐸𝑓𝑓𝑒𝑐𝑡𝑠 + 𝜀
All Firm-Years Majority
Agree Majority Disagree
(1) (2) (3) MGMT Forecastit 0.080*** 0.180*** 0.038 (3.5) (4.1) (1.5) Forecast Rangeit -0.021 -0.093 0.102 (-0.4) (-1.4) (1.6) Prior ETR 0.836*** 0.889*** 0.787*** Forecastijt (33.8) (23.2) (26.7) GAAP ETRit-1 -0.029 -0.031 -0.009 (-1.2) (-0.9) (-0.4) Street ETRit-1 0.096*** 0.008 0.136*** (4.3) (0.3) (5.1) Q1 GAAP ETRit-1 0.006 -0.001 -0.001 (0.6) (-0.1) (-0.1) Q4 GAAP ETRit-1 0.006 0.006 0.009 (0.7) (0.6) (0.8) Ln(MVEit-1) -0.008 -0.115 0.021 (-0.1) (-1.2) (0.2) MTBit-1 0.005 -0.002 0.016 (0.3) (-0.1) (0.7) Industry Fixed Effects? Yes Yes Yes Year Fixed Effects? Yes Yes Yes Observations 6,671 2,371 4,297 R-squared 0.833 0.820 0.838 All variables are as defined in Appendix C. t-statistics appear in parentheses and are heteroscedasticity-consistent standard errors, clustered by firm. ***, **, * denote statistical significance at the 0.01, 0.05, and 0.10 levels (two-tail), respectively.
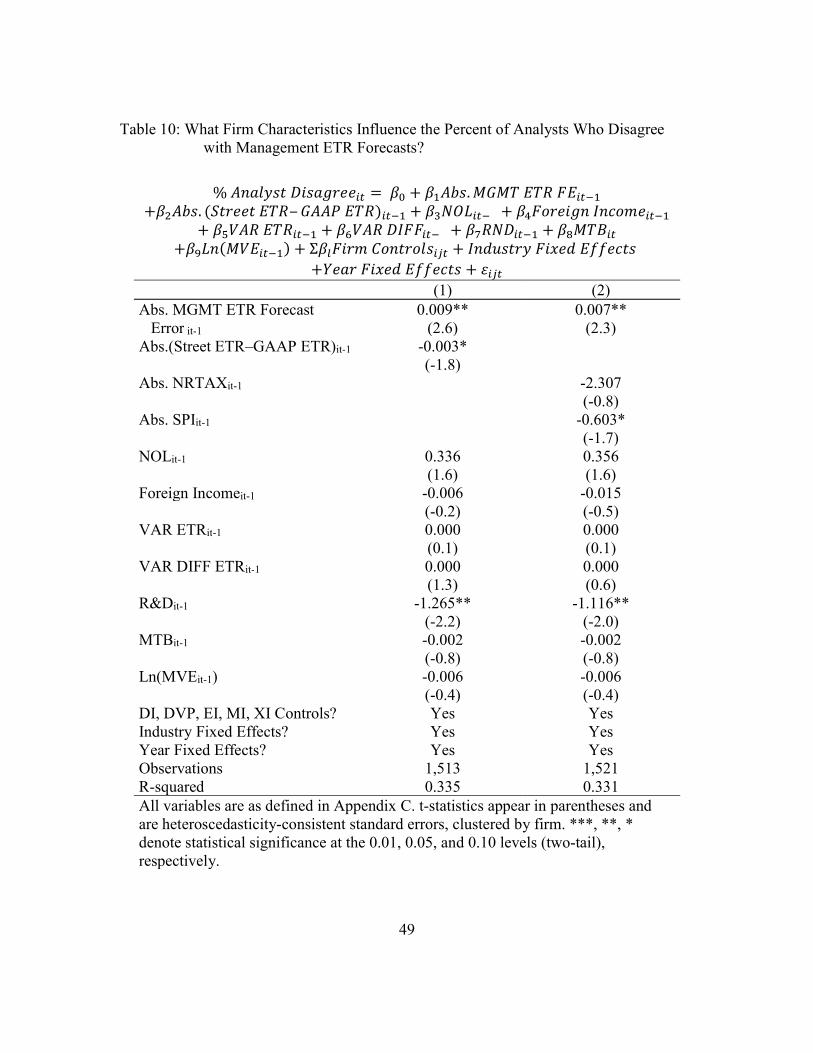
49
Table 10: What Firm Characteristics Influence the Percent of Analysts Who Disagree with Management ETR Forecasts?
% 𝐴𝑛𝑎𝑙𝑦𝑠𝑡 𝐷𝑖𝑠𝑎𝑔𝑟𝑒𝑒 = 𝛽 + 𝛽 𝐴𝑏𝑠. 𝑀𝐺𝑀𝑇 𝐸𝑇𝑅 𝐹𝐸
+𝛽 𝐴𝑏𝑠. (𝑆𝑡𝑟𝑒𝑒𝑡 𝐸𝑇𝑅‒ 𝐺𝐴𝐴𝑃 𝐸𝑇𝑅) + 𝛽 𝑁𝑂𝐿 + 𝛽 𝐹𝑜𝑟𝑒𝑖𝑔𝑛 𝐼𝑛𝑐𝑜𝑚𝑒 + 𝛽 𝑉𝐴𝑅 𝐸𝑇𝑅 + 𝛽 𝑉𝐴𝑅 𝐷𝐼𝐹𝐹 + 𝛽 𝑅𝑁𝐷 + 𝛽 𝑀𝑇𝐵
+𝛽 𝐿𝑛(𝑀𝑉𝐸 ) + Σ𝛽 𝐹𝑖𝑟𝑚 𝐶𝑜𝑛𝑡𝑟𝑜𝑙𝑠 + 𝐼𝑛𝑑𝑢𝑠𝑡𝑟𝑦 𝐹𝑖𝑥𝑒𝑑 𝐸𝑓𝑓𝑒𝑐𝑡𝑠 +𝑌𝑒𝑎𝑟 𝐹𝑖𝑥𝑒𝑑 𝐸𝑓𝑓𝑒𝑐𝑡𝑠 + 𝜀
(1) (2) Abs. MGMT ETR Forecast 0.009** 0.007** Error it-1 (2.6) (2.3) Abs.(Street ETR‒GAAP ETR)it-1 -0.003* (-1.8) Abs. NRTAXit-1 -2.307 (-0.8) Abs. SPIit-1 -0.603* (-1.7) NOLit-1 0.336 0.356 (1.6) (1.6) Foreign Incomeit-1 -0.006 -0.015 (-0.2) (-0.5) VAR ETRit-1 0.000 0.000 (0.1) (0.1) VAR DIFF ETRit-1 0.000 0.000 (1.3) (0.6) R&Dit-1 -1.265** -1.116** (-2.2) (-2.0) MTBit-1 -0.002 -0.002 (-0.8) (-0.8) Ln(MVEit-1) -0.006 -0.006 (-0.4) (-0.4) DI, DVP, EI, MI, XI Controls? Yes Yes Industry Fixed Effects? Yes Yes Year Fixed Effects? Yes Yes Observations 1,513 1,521 R-squared 0.335 0.331 All variables are as defined in Appendix C. t-statistics appear in parentheses and are heteroscedasticity-consistent standard errors, clustered by firm. ***, **, * denote statistical significance at the 0.01, 0.05, and 0.10 levels (two-tail), respectively.
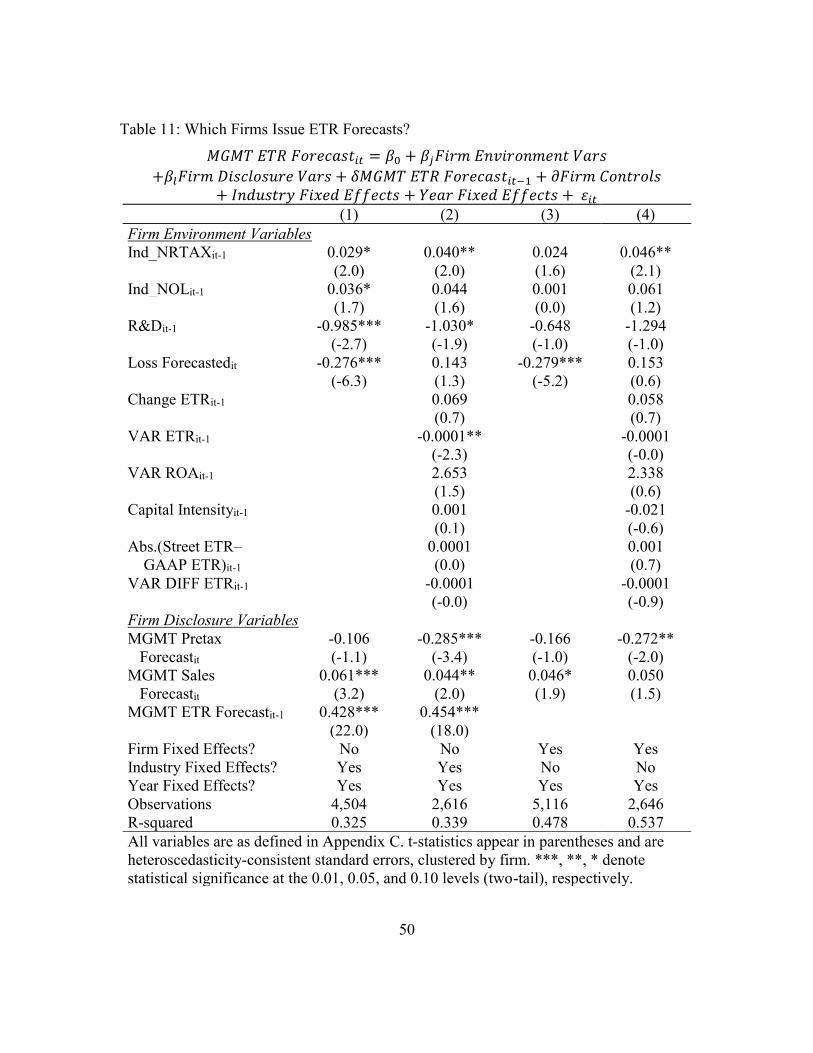
50
Table 11: Which Firms Issue ETR Forecasts?
𝑀𝐺𝑀𝑇 𝐸𝑇𝑅 𝐹𝑜𝑟𝑒𝑐𝑎𝑠𝑡 = 𝛽 + 𝛽 𝐹𝑖𝑟𝑚 𝐸𝑛𝑣𝑖𝑟𝑜𝑛𝑚𝑒𝑛𝑡 𝑉𝑎𝑟𝑠 +𝛽 𝐹𝑖𝑟𝑚 𝐷𝑖𝑠𝑐𝑙𝑜𝑠𝑢𝑟𝑒 𝑉𝑎𝑟𝑠 + 𝛿𝑀𝐺𝑀𝑇 𝐸𝑇𝑅 𝐹𝑜𝑟𝑒𝑐𝑎𝑠𝑡 + 𝜕𝐹𝑖𝑟𝑚 𝐶𝑜𝑛𝑡𝑟𝑜𝑙𝑠
+ 𝐼𝑛𝑑𝑢𝑠𝑡𝑟𝑦 𝐹𝑖𝑥𝑒𝑑 𝐸𝑓𝑓𝑒𝑐𝑡𝑠 + 𝑌𝑒𝑎𝑟 𝐹𝑖𝑥𝑒𝑑 𝐸𝑓𝑓𝑒𝑐𝑡𝑠 + 𝜀 (1) (2) (3) (4) Firm Environment Variables Ind_NRTAXit-1 0.029* 0.040** 0.024 0.046** (2.0) (2.0) (1.6) (2.1) Ind_NOLit-1 0.036* 0.044 0.001 0.061 (1.7) (1.6) (0.0) (1.2) R&Dit-1 -0.985*** -1.030* -0.648 -1.294 (-2.7) (-1.9) (-1.0) (-1.0) Loss Forecastedit -0.276*** 0.143 -0.279*** 0.153 (-6.3) (1.3) (-5.2) (0.6) Change ETRit-1 0.069 0.058 (0.7) (0.7) VAR ETRit-1 -0.0001** -0.0001 (-2.3) (-0.0) VAR ROAit-1 2.653 2.338 (1.5) (0.6) Capital Intensityit-1 0.001 -0.021 (0.1) (-0.6) Abs.(Street ETR‒ 0.0001 0.001 GAAP ETR)it-1 (0.0) (0.7) VAR DIFF ETRit-1 -0.0001 -0.0001 (-0.0) (-0.9) Firm Disclosure Variables MGMT Pretax -0.106 -0.285*** -0.166 -0.272** Forecastit (-1.1) (-3.4) (-1.0) (-2.0) MGMT Sales 0.061*** 0.044** 0.046* 0.050 Forecastit (3.2) (2.0) (1.9) (1.5) MGMT ETR Forecastit-1 0.428*** 0.454*** (22.0) (18.0) Firm Fixed Effects? No No Yes Yes Industry Fixed Effects? Yes Yes No No Year Fixed Effects? Yes Yes Yes Yes Observations 4,504 2,616 5,116 2,646 R-squared 0.325 0.339 0.478 0.537 All variables are as defined in Appendix C. t-statistics appear in parentheses and are heteroscedasticity-consistent standard errors, clustered by firm. ***, **, * denote statistical significance at the 0.01, 0.05, and 0.10 levels (two-tail), respectively.

51
Appendices
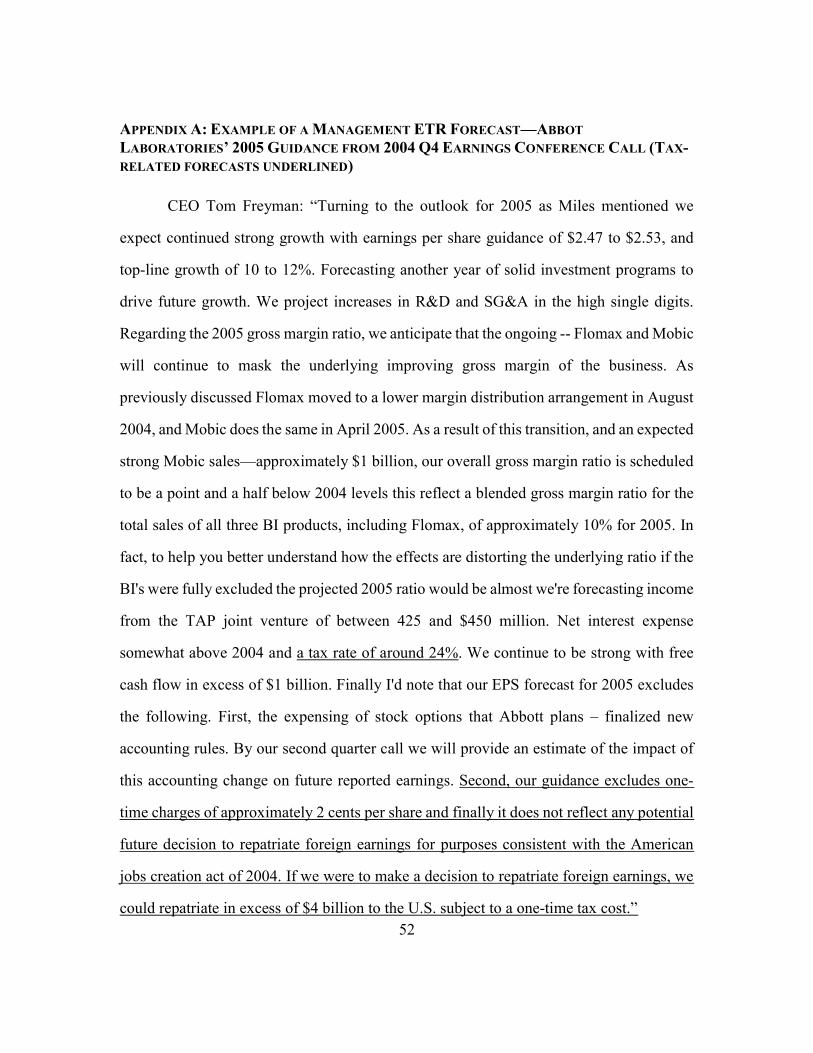
52
APPENDIX A: EXAMPLE OF A MANAGEMENT ETR FORECAST—ABBOT
LABORATORIES’ 2005 GUIDANCE FROM 2004 Q4 EARNINGS CONFERENCE CALL (TAX-RELATED FORECASTS UNDERLINED)
CEO Tom Freyman: “Turning to the outlook for 2005 as Miles mentioned we
expect continued strong growth with earnings per share guidance of $2.47 to $2.53, and
top-line growth of 10 to 12%. Forecasting another year of solid investment programs to
drive future growth. We project increases in R&D and SG&A in the high single digits.
Regarding the 2005 gross margin ratio, we anticipate that the ongoing -- Flomax and Mobic
will continue to mask the underlying improving gross margin of the business. As
previously discussed Flomax moved to a lower margin distribution arrangement in August
2004, and Mobic does the same in April 2005. As a result of this transition, and an expected
strong Mobic sales—approximately $1 billion, our overall gross margin ratio is scheduled
to be a point and a half below 2004 levels this reflect a blended gross margin ratio for the
total sales of all three BI products, including Flomax, of approximately 10% for 2005. In
fact, to help you better understand how the effects are distorting the underlying ratio if the
BI's were fully excluded the projected 2005 ratio would be almost we're forecasting income
from the TAP joint venture of between 425 and $450 million. Net interest expense
somewhat above 2004 and a tax rate of around 24%. We continue to be strong with free
cash flow in excess of $1 billion. Finally I'd note that our EPS forecast for 2005 excludes
the following. First, the expensing of stock options that Abbott plans – finalized new
accounting rules. By our second quarter call we will provide an estimate of the impact of
this accounting change on future reported earnings. Second, our guidance excludes one-
time charges of approximately 2 cents per share and finally it does not reflect any potential
future decision to repatriate foreign earnings for purposes consistent with the American
jobs creation act of 2004. If we were to make a decision to repatriate foreign earnings, we
could repatriate in excess of $4 billion to the U.S. subject to a one-time tax cost.”
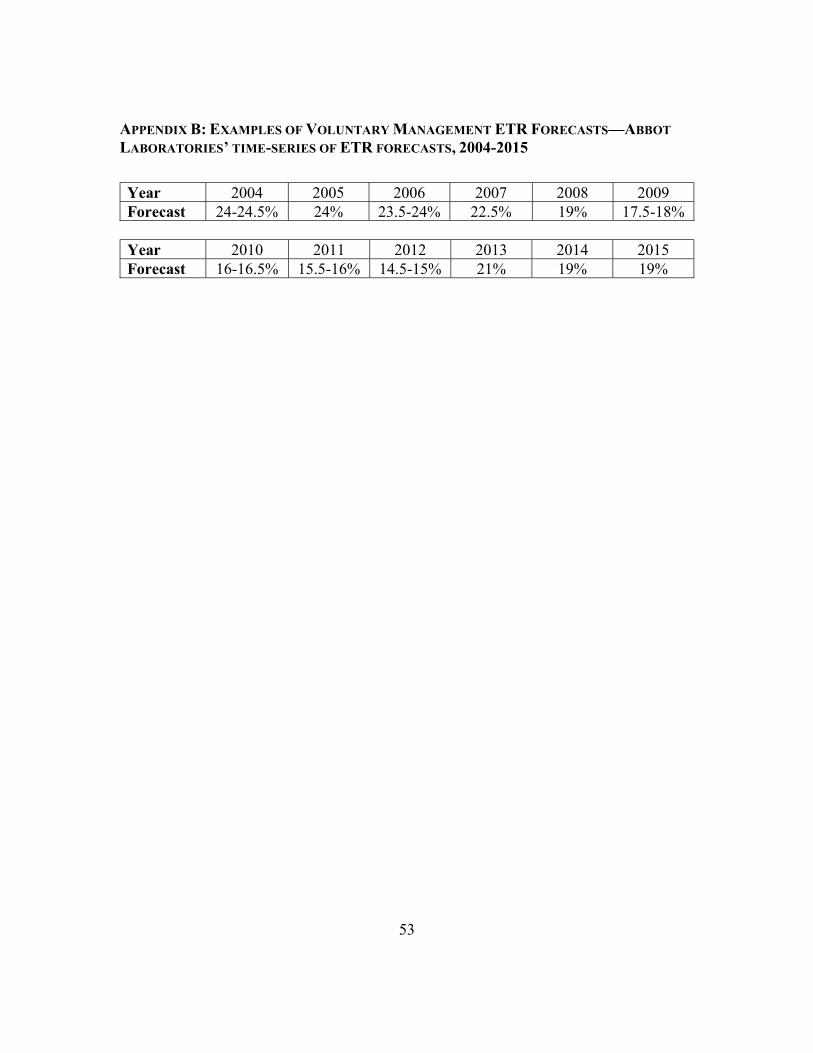
53
APPENDIX B: EXAMPLES OF VOLUNTARY MANAGEMENT ETR FORECASTS—ABBOT
LABORATORIES’ TIME-SERIES OF ETR FORECASTS, 2004-2015
Year 2004 2005 2006 2007 2008 2009 Forecast 24-24.5% 24% 23.5-24% 22.5% 19% 17.5-18%
Year 2010 2011 2012 2013 2014 2015 Forecast 16-16.5% 15.5-16% 14.5-15% 21% 19% 19%
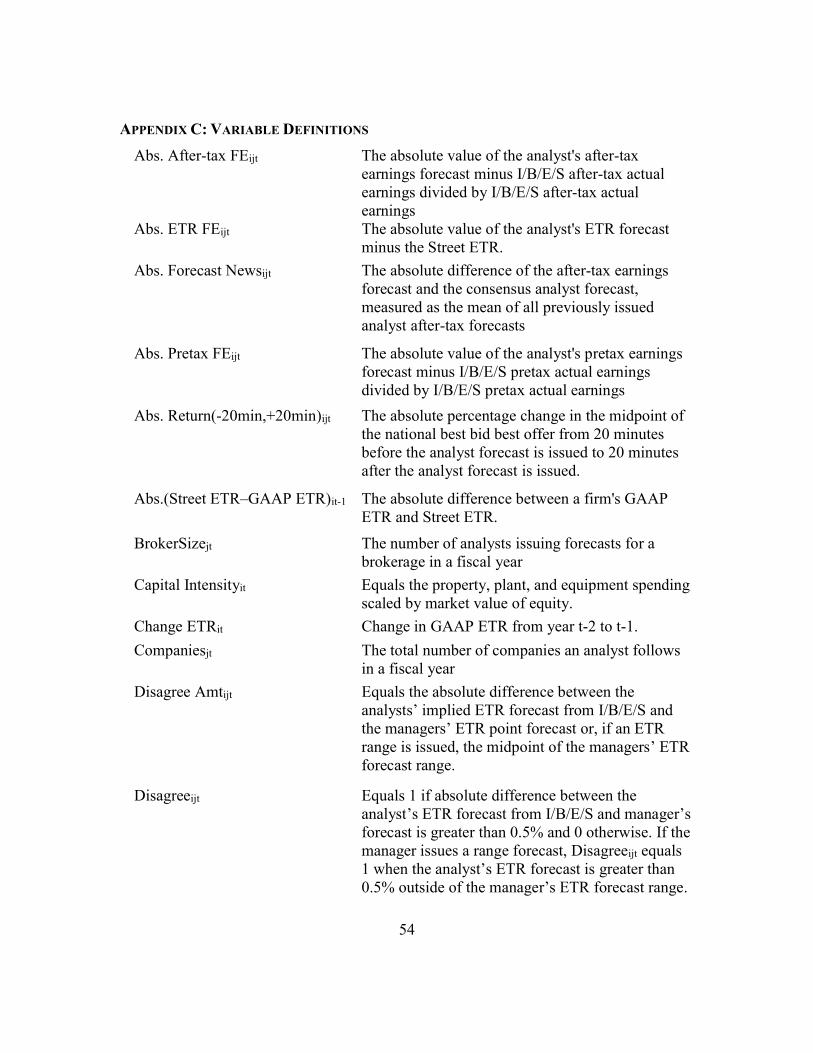
54
APPENDIX C: VARIABLE DEFINITIONS
Abs. After-tax FEijt The absolute value of the analyst's after-tax earnings forecast minus I/B/E/S after-tax actual earnings divided by I/B/E/S after-tax actual earnings
Abs. ETR FEijt The absolute value of the analyst's ETR forecast minus the Street ETR.
Abs. Forecast Newsijt The absolute difference of the after-tax earnings forecast and the consensus analyst forecast, measured as the mean of all previously issued analyst after-tax forecasts
Abs. Pretax FEijt The absolute value of the analyst's pretax earnings forecast minus I/B/E/S pretax actual earnings divided by I/B/E/S pretax actual earnings
Abs. Return(-20min,+20min)ijt The absolute percentage change in the midpoint of the national best bid best offer from 20 minutes before the analyst forecast is issued to 20 minutes after the analyst forecast is issued.
Abs.(Street ETR‒GAAP ETR)it-1 The absolute difference between a firm's GAAP ETR and Street ETR.
BrokerSizejt The number of analysts issuing forecasts for a brokerage in a fiscal year
Capital Intensityit Equals the property, plant, and equipment spending scaled by market value of equity.
Change ETRit Change in GAAP ETR from year t-2 to t-1.
Companiesjt The total number of companies an analyst follows in a fiscal year
Disagree Amtijt Equals the absolute difference between the analysts’ implied ETR forecast from I/B/E/S and the managers’ ETR point forecast or, if an ETR range is issued, the midpoint of the managers’ ETR forecast range.
Disagreeijt Equals 1 if absolute difference between the analyst’s ETR forecast from I/B/E/S and manager’s forecast is greater than 0.5% and 0 otherwise. If the manager issues a range forecast, Disagreeijt equals 1 when the analyst’s ETR forecast is greater than 0.5% outside of the manager’s ETR forecast range.
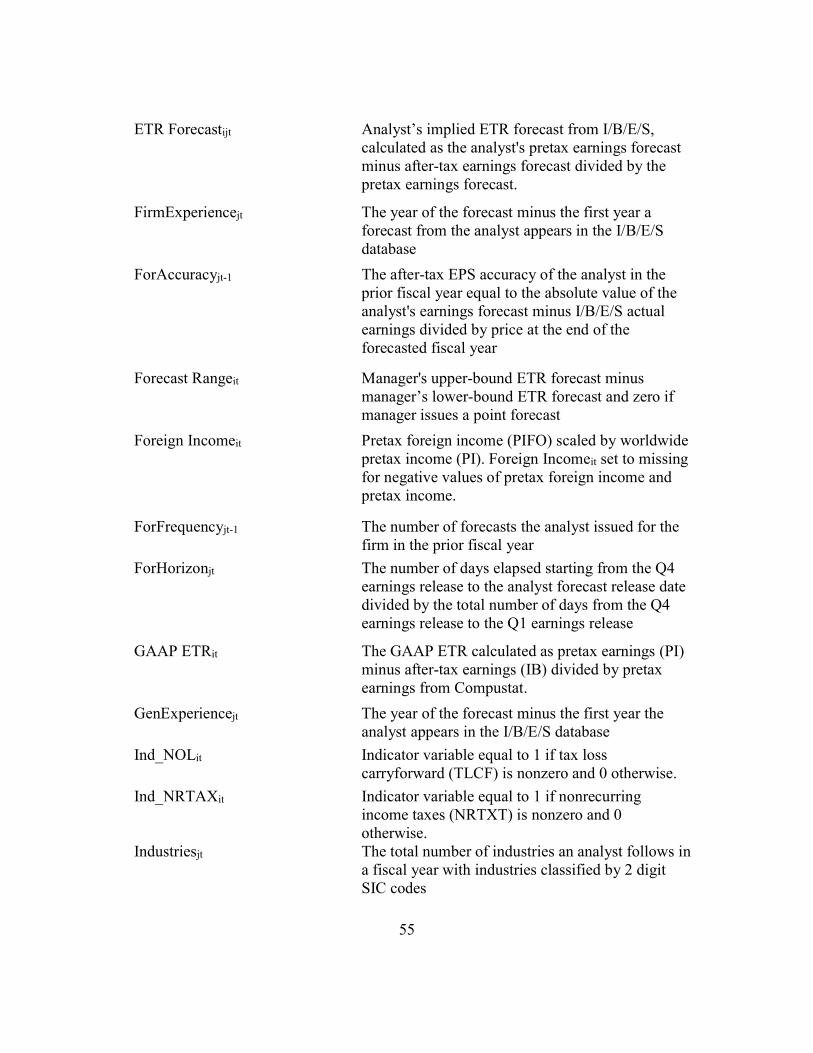
55
ETR Forecastijt Analyst’s implied ETR forecast from I/B/E/S, calculated as the analyst's pretax earnings forecast minus after-tax earnings forecast divided by the pretax earnings forecast.
FirmExperiencejt The year of the forecast minus the first year a forecast from the analyst appears in the I/B/E/S database
ForAccuracyjt-1 The after-tax EPS accuracy of the analyst in the prior fiscal year equal to the absolute value of the analyst's earnings forecast minus I/B/E/S actual earnings divided by price at the end of the forecasted fiscal year
Forecast Rangeit Manager's upper-bound ETR forecast minus manager’s lower-bound ETR forecast and zero if manager issues a point forecast
Foreign Incomeit Pretax foreign income (PIFO) scaled by worldwide pretax income (PI). Foreign Incomeit set to missing for negative values of pretax foreign income and pretax income.
ForFrequencyjt-1 The number of forecasts the analyst issued for the firm in the prior fiscal year
ForHorizonjt The number of days elapsed starting from the Q4 earnings release to the analyst forecast release date divided by the total number of days from the Q4 earnings release to the Q1 earnings release
GAAP ETRit The GAAP ETR calculated as pretax earnings (PI) minus after-tax earnings (IB) divided by pretax earnings from Compustat.
GenExperiencejt The year of the forecast minus the first year the analyst appears in the I/B/E/S database
Ind_NOLit Indicator variable equal to 1 if tax loss carryforward (TLCF) is nonzero and 0 otherwise.
Ind_NRTAXit Indicator variable equal to 1 if nonrecurring income taxes (NRTXT) is nonzero and 0 otherwise.
Industriesjt The total number of industries an analyst follows in a fiscal year with industries classified by 2 digit SIC codes

56
Ln(MVEit) The natural log of the market value of equity.
Loss Forecastedit Indicator variable equal to 1 if analysts forecast a loss for the fiscal year (measured as the I/B/E/S’ last consensus analyst forecast before the prior fiscal year’s fourth quarter earnings announcement) and 0 otherwise.
Majority Disagreeit Equals 1 if more than 50% of analysts' forecasts disagree and 0 otherwise
MGMT ETR Forecastit Indicator variable equal to 1 if management issued an ETR forecast and 0 otherwise.
MGMT Forecastit Manager's ETR forecast collected from earnings conference calls.
MGMT Pretax Forecastit Indicator variable equal to 1 if management issued a pretax earnings forecast and 0 otherwise.
MGMT Sales Forecastit Indicator variable equal to 1 if management issued a sales forecast and 0 otherwise.
MTBit The market-to-book ratio defined as the market value of equity scaled by book value of assets.
NOLit The tax loss carryforward (TLCF) from Compustat, scaled by the market value of equity.
NRTAXit Nonrecurring income taxes (NRTXT) from Compustat, scaled by the market value of equity.
% Analyst Disagreeit The total number of analyst forecasts in a firm-year issued for a firm with ETR disagreement divided by the total number of analyst forecasts issued for a firm.
Prior ETR Forecastijt The analyst's immediately preceding ETR Forecast.
Q1 GAAP ETRit The first quarter GAAP ETR calculated as the pretax earnings (PIQ) minus after-tax earnings (IBQ) divided by pretax earnings in the first quarter from Compustat.
Q4 GAAP ETRit The fourth quarter GAAP ETR calculated as the pretax earnings (PIQ) minus after-tax earnings (IBQ) divided by pretax earnings in the fourth quarter from Compustat.
R&Dit The research and development expense (XRD) from Compustat, scaled by the market value of equity.
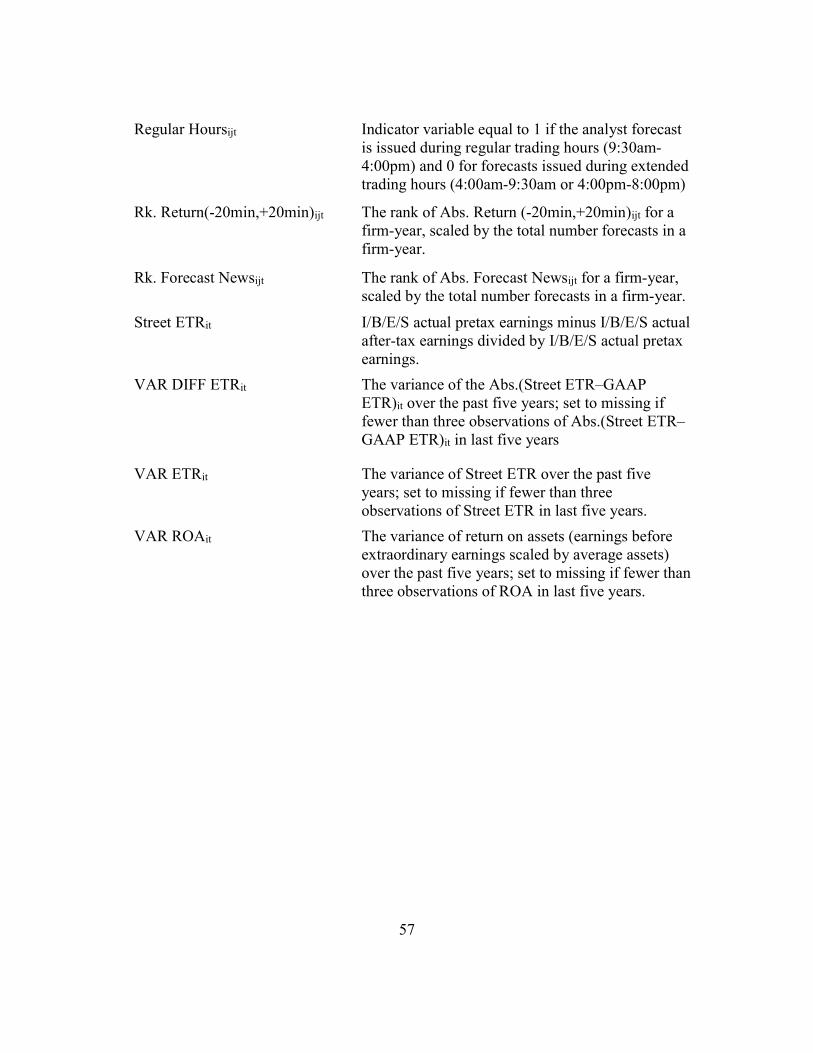
57
Regular Hoursijt Indicator variable equal to 1 if the analyst forecast is issued during regular trading hours (9:30am-4:00pm) and 0 for forecasts issued during extended trading hours (4:00am-9:30am or 4:00pm-8:00pm)
Rk. Return(-20min,+20min)ijt The rank of Abs. Return (-20min,+20min)ijt for a firm-year, scaled by the total number forecasts in a firm-year.
Rk. Forecast Newsijt The rank of Abs. Forecast Newsijt for a firm-year, scaled by the total number forecasts in a firm-year.
Street ETRit I/B/E/S actual pretax earnings minus I/B/E/S actual after-tax earnings divided by I/B/E/S actual pretax earnings.
VAR DIFF ETRit The variance of the Abs.(Street ETR‒GAAP ETR)it over the past five years; set to missing if fewer than three observations of Abs.(Street ETR‒GAAP ETR)it in last five years
VAR ETRit The variance of Street ETR over the past five years; set to missing if fewer than three observations of Street ETR in last five years.
VAR ROAit The variance of return on assets (earnings before extraordinary earnings scaled by average assets) over the past five years; set to missing if fewer than three observations of ROA in last five years.
58
References
AHARONI, G., E. EINHORN, and Q. ZENG. “Underweighting of Private
Information by Top Analysts.” Journal of Accounting Research 55 (2017): 551-590.
ALTINKILIÇ, O., and R. S. HANSEN. “On the Information Role of Stock
Recommendation Revisions.” Journal of Accounting and Economics 48 (2009): 17-36.
ANILOWSKI, C., M. FENG, and D. J. SKINNER. “Does Earnings Guidance
Affect Market Returns? The Nature and Information Content of Aggregate Earnings
Guidance.” Journal of Accounting and Economics 44 (2007): 36-63.
ANJINKYA, B. B., and M. J. GIFT. “Corporate Managers' Earnings Forecasts and
Symmetrical Adjustments of Market Expectations.” Journal of Accounting Research 22
(1984): 425-444.
ASQUITH, P., M. B. MIKHAIL, and A. S. AU. “Information Content of Equity
Analyst Reports.” Journal of Financial Economics 75 (2005): 245-282.
BAILEY, W., H. LI, C. X. MAO, and R. ZHONG. “Regulation Fair Disclosure and
Earnings Information: Market, Analyst, and Corporate Responses.” Journal of Finance 58
(2003): 2487-2514.
BASI, B. A., K. J. CAREY, and R. D. TWARK. “A Comparison of the Accuracy
of Corporate and Security Analysts' Forecasts of Earnings.” The Accounting Review 51
(1976): 244-254.
BERNHARDT, D., M. CAMPELLO, and E. KUTSOATI. “Who Herds?” Journal
of Financial Economics 80 (2006): 657-675.
BEYER, A., D. A. COHEN, T. Z. LYS, and B. R. WALTHER. “The Financial
Reporting Environment: Review of the Recent Literature.” Journal of Accounting and
Economics 50 (2010): 296-343.
59
BRATTEN B., C. GLEASON, S. LAROCQUE, and L. F. MILLS. “Forecasting
Taxes: New Evidence from Analysts.” The Accounting Review 92 (2017): 1-29.
BROWN L. D., A. C. CALL, M. B. CLEMENT, and N. Y. SHARP. “Inside the
“Black Box” of Sell-Side Financial Analysts.” Journal of Accounting Research 53 (2015):
1-47.
CAMERON, A. B. “A Review of Management’s Earnings Forecast Research.”
Journal of Accounting Literature 5 (1986): 57-83.
CHAPMAN, K., and J. R. GREEN. “Analysts' Influence on Managers' Guidance.”
The Accounting Review 93 (2018): 45-69.
CHEN, X., Q. CHENG, and K. LO. “On the Relationship between Analyst Reports
and Corporate Disclosures: Exploring the Roles of Information Discovery and
Interpretation.” Journal of Accounting and Economics 49 (2010): 206-226.
CHUK, E., D. MATSUMOTO, and G. S. MILLER. “Assessing Methods of
Identifying Management Forecasts: CIG vs. Research Collected.” Journal of Accounting
and Economics 55 (2013): 23-42.
CLEMENT, M. B., and S. Y. TSE. “Financial Analyst Characteristics and Herding
Behavior in Forecasting.” Journal of Finance 60 (2005): 307-341.
CLEMENT M., R. FRANKEL, and J. MILLER. “Confirming Management
Earnings Forecasts, Earnings Uncertainty, and Stock Returns.” Journal of Accounting
Research 41 (2003): 653-679.
COOPER, R. A., T. E. DAY, and C. M. LEWIS. “Following the Leader: A Study
of Individual Analysts’ Earnings Forecasts.” Journal of Financial Economics 61 (2001):
383-416.
COPELAND, R. M., and R. J. MARIONI. “Executives' Forecasts of Earnings per
Share versus Forecasts of Naïve Models.” The Journal of Business 45 (1972): 497-512.
60
COTTER, J., I. TUNA, and P. D. WYSOCKI. “Expectations Management and
Beatable Targets: How Do Analysts React to Explicit Earnings Guidance?” Contemporary
Accounting Research 23 (2006): 593-624.
DELOITTE. “Fast Action on Tax Reform Corrections Unlikely, Ryan Says.” Tax
News & Views: Capitol Hill Briefing, March 9, 2018.
DONELSON, D. C., C. Q. KOUTNEY, and L. F. MILLS. “Nonrecurring Income
Taxes,” Unpublished paper, The University of Texas at Austin, 2018. Available at:
https://papers.ssrn.com/sol3/papers.cfm?abstract_id=2720464.
DYRENG, S., and B. P. LINDSEY. “Using Financial Accounting Data to Examine
the Effect of Foreign Operations Located in Tax Havens and Other Countries on U.S.
Multinational Firms' Tax Rates.” Journal of Accounting Research 47 (2009): 1283-1316.
EHINGER, A. C., J. A. LEE, B. STOMBERG, and E. TOWERY. “Let’s Talk
About Tax: The Determinants and Consequences of Income Tax Mentions During
Conference Calls,” Unpublished paper, Indiana University and University of Georgia,
2017.
FENG, M., and S. MCVAY. “Analysts’ Incentives to Overweight Management
Guidance When Revising Their Short-Term Earnings Forecasts.” The Accounting Review
85 (2010): 1617-1646.
FOSTER, G. “Stock Market Reaction to Estimates of Earnings per Share by
Company Officials.” Journal of Accounting Research 11 (1973): 25-37.
GLEASON, C. A., and C. M. C. LEE. “Analyst Forecast Revisions and Market
Price Discovery.” The Accounting Review 78 (2003): 193-225.
GONEDES, N. J., N. DOPUCH, and S. H. PENMAN. “Disclosure Rules,
Information-Production, and Capital Market Equilibrium: The Case of Forecast Disclosure
Rules.” Journal of Accounting Research 14 (1976): 89-137.
61
GONG, G., L. Y. LI, and J. J. WANG. “Serial Correlation in Management Earnings
Forecast Errors.” Journal of Accounting Research 49 (2010): 677-720.
GRAHAM, J. R., C. R. HARVEY, and S. RAJGOPAL. “The Economic
Implications of Corporate Financial Reporting.” Journal of Accounting and Economics 40
(2005): 3-73.
GRAHAM, J. R., J. S. RAEDY, and D. A. SHACKELFORD. “Research in
Accounting for Income Taxes.” Journal of Accounting and Economics 53 (2012): 412-434.
GREENE, W. “The Behaviour of the Maximum Likelihood Estimator of Limited
Dependent Variable Models in the Presence of Fixed Effects.” Econometrics Journal 7
(2004): 98-119.
HASSELL, J. M., R. H. JENNINGS, and D. L. LASSER. “Management Earnings
Forecasts: Their Usefulness as a Source of Firm-specific Information to Security
Analysts.” Journal of Financial Research 11 (1988): 303-319.
HEALY, P. M., and K. G. PALEPU. “Information Asymmetry, Corporate
Disclosure, and the Capital Markets: A Review of the Empirical Disclosure Literature.”
Journal of Accounting and Economics 31 (2001): 405-440.
HEFLIN, F., K. R. SUBRAMANYAM, and Y. ZHANG. “Regulation FD and the
Financial Information Environment: Early Evidence.” The Accounting Review 78 (2003):
1–37.
HIGGINS, D. M. “Communicating Information Beyond the Tax Footnote: An
Empirical Examination of Effective Tax Rate Forecasts in the MD&A,” Unpublished
paper, Fordham University, 2013.
HIRST, D. E., L. KOONCE, and S. VENKATARAMAN. “Management Earnings
Forecasts: A Review and Framework.” Accounting Horizons 22 (2008): 315-338.
62
HONG, H., J. D. KUBIK, and A. SOLOMON. “Security Analysts’ Career
Concerns and herding of Earnings Forecasts.” RAND Journal of Economics 31 (2000):
121-144.
HOOPES, J. “The Effect of Temporary Tax Laws on Understanding and Predicting
Corporate Earnings,” Unpublished paper, University of North Carolina at Chapel Hill,
2018. Available at: https://papers.ssrn.com/sol3/papers.cfm?abstract_id=
2671935.
HUTCHENS, M. “How Do Disclosure Characteristics Affect Analyst Forecast
Accuracy?” Unpublished paper, University of Illinois, 2017.
HUTTON, A. P., L. F. LEE, and S. Z. SHU. “Do Managers Always Know Better?
The Relative Accuracy of Management and Analyst Forecasts.” Journal of Accounting
Research 50 (2012): 1217-1244.
IMHOFF, E. A. “The Representativeness of Management Earnings Forecasts.” The
Accounting Review 53 (1978): 836-850.
IMHOFF, E. A., and P. V. PARE. “Analysis and Comparison of Earnings Forecast
Agents.” Journal of Accounting Research 20 (1982): 429-439.
IVKOVIĆ, Z., and N. JEGADEESH. 2004. “The Timing and Value of Forecast
and Recommendation Revisions.” Journal of Financial Economics 73 (2004): 433-463.
JAGGI, B. “A Note on the Information Content of Corporate Annual Earnings
Forecasts.” The Accounting Review 53 (1978): 961-967.
JAGGI, B. “Further Evidence on the Accuracy of Management Forecasts Vis-à-Vis
Analysts’ Forecasts.” The Accounting Review 55 (1980): 96-101.
JEGADEESH, N., and W. KIM. “Do Analysts Herd? An Analysis of
Recommendations and Market Reactions.” Review of Financial Studies 23 (2010): 901-
937.
63
JENNINGS, R. “Unsystematic Security Price Movements, Management Earnings
Forecasts, and Revisions in Consensus Analyst Earnings Forecasts.” Journal of Accounting
Research 25 (1987): 90-110.
KASZNIK, R. “On the Association between Voluntary Disclosure and Earnings
Management.” Journal of Accounting Research 37 (1999): 57–81.
KEANE, M. P., and D. E. RUNKLE. “Are Financial Analysts’ Forecasts of
Corporate Profits Rational?” Journal of Political Economy 106 (1998): 768-805.
KEUNG, E. C. “Do Supplementary Sales Forecasts Increase the Credibility of
Financial Analysts’ Earnings Forecasts?” The Accounting Review 85 (2010): 2047-2074.
KING, R., G. POWNALL, and G. WAYMIRE. “Expectations Adjustments via
Timely Management Forecasts: Review, Synthesis, and Suggestions for Future Research.”
Journal of Accounting Literature 9 (1990): 113–144.
KROSS, W. J., B. T. RO, and I. SUK. “Consistency in Meeting or Beating Earnings
Expectations and Management Earnings Forecasts.” Journal of Accounting and Economics
51 (2011): 37-57.
LANSFORD, B., B. LEV and J. W. TUCKER. “Causes and Consequences of
Disaggregated Earnings Guidance.” Journal of Business Finance & Accounting 40 (2013):
26-54.
LAROCQUE, S. “Do Managers Issue Guidance to Correct Analysts’ Predictable
Errors?” Unpublished paper, University of Notre Dame, 2010.
LEV, B., and D. NISSIM. “Taxable Income, Future Earnings, and Equity Values.”
The Accounting Review 79 (2004): 1039-1074.
LI, E. X., K. RAMESH, M. SHEN, and J. S. WU. “Do Analyst Stock
Recommendations Piggyback on Recent Corporate News? An Analysis of Regular-Hour
and After-Hours Revisions.” Journal of Accounting Research 53 (2015): 821-861.
64
LOUIS, H., A. X. SUN, and O. URCAN. “Do Analysts Sacrifice Forecast Accuracy
for Informativeness?” Management Science 59 (2013): 1688-1780.
MATSUMOTO, D. A. “Management's Incentives to Avoid Negative Earnings
Surprises.” The Accounting Review 77 (2002): 483-514.
MCDONALD, C. L. “An Empirical Examination of the Reliability of Published
Predictions of Future Earnings.” The Accounting Review 48 (1973): 502-510.
MCNICHOLS, M. “Evidence of Informational Asymmetries from Management
Earnings Forecasts and Stock Returns.” The Accounting Review 64 (1989): 1–27.
NICHOLS, D. R., and J. J. TSAY. “Security Price Reactions to Long-Range
Executive Earnings Forecasts.” Journal of Accounting Research 17 (1979): 140-155.
NATIONAL INVESTOR RELATIONS INSTITUTE (NIRI). “Guidance
Practices.” Available at: https://www.niri.org/NIRI/media/Protected- Documents_Exclude
GlobalSubs/Analytics%20Reports/Analytics_Guidance/NIRI-Earnings-Process-
Practices-Report-2016.pdf. 2016.
PATELL, J. M. “Corporate Forecasts of Earnings per Share and Stock Price
Behavior: Empirical Test.” Journal of Accounting Research 14 (1976): 246-276.
PENMAN, S. H. “An Empirical Investigation of the Voluntary Disclosure of
Corporate Earnings Forecasts.” Journal of Accounting Research 18 (1980): 132-160.
PENMAN, S. H. “The Predictive Content of Earnings Forecasts and Dividends.”
The Journal of Finance 38 (1983): 1181-1199.
PLUMLEE, M. “The Effect of Information Complexity on Analysts’ Use of That
Information.” The Accounting Review 78 (2003): 275-296.
ROGERS, J. L., and P. C. STOCKEN. “Credibility of Management Forecasts.” The
Accounting Review 80 (2005): 1233-1260.
65
RUBIN, R. “New Tax on Overseas Earnings Hits Unintended Targets.” Wall Street
Journal, March 26, 2018.
RULAND, W. “The Accuracy of Forecasts by Management and by Financial
Analysts.” The Accounting Review 53 (1978): 439-447.
SCHARFSTEIN, D., and J. STEIN. “Herd Behavior and Investment.” American
Economic Review 80 (1990): 465-479.
TANKERSLEY, J., and A. RAPPEPORT. “G.O.P. Rushed to Pass Tax Overhaul.
Now It May Need to Be Altered.” New York Times, March 11, 2018.
THOMAS, J., and F. X. ZHANG. “Tax Expense Momentum.” Journal of
Accounting Research 49 (2011): 791-821.
TRUEMAN, B. “Analyst Forecasts and Herding Behavior.” Review of Financial
Studies 7 (1994): 97-124.
WANG, I. Y. “Private Earnings Guidance and Its Implications for Disclosure
Regulation.” The Accounting Review 82 (2007): 1299-1332.
WASLEY, C. E., and J. S. WU. “Why Do Managers Voluntarily Issue Cash Flow
Forecasts?” Journal of Accounting Research 44 (2006): 389-429.
WAYMIRE, G. “Additional Evidence on the Information Content of Management
Earnings Forecasts.” Journal of Accounting Research 22 (1984): 703-718.
WAYMIRE, G. “Additional Evidence on the Accuracy of Analyst Forecasts Before
and After Voluntary Management Earnings Forecasts.” The Accounting Research 61
(1986): 129-142.
WEBER, D. P. “Do Analysts and Investors Fully Appreciate the Implications of
Book-Tax Differences for Future Earnings?” Contemporary Accounting Review 26 (2009):
1175-1206.

66
WILLIAMS, P. A. “The Relation between a Prior Earnings Forecast by
Management and Analyst Response to a Current Management Forecast.” The Accounting
Review 71 (1996): 103-115.