Copyright by Bernard George David 2020 - The University of ...
192
Copyright by Bernard George David 2020
-
Upload
khangminh22 -
Category
Documents
-
view
2 -
download
0
Transcript of Copyright by Bernard George David 2020 - The University of ...

Copyright
by
Bernard George David
2020

The Dissertation Committee for Bernard George David Certifies that this is the approved version of the following Dissertation:
What is the competitive advantage? Exploring the intersection of
charter schools and alternative teacher certification upon STEM
outcomes
Committee: Jill Marshall, Supervisor Michael Marder Maria Gonzalez tristan Huriya Jabbar

What is the competitive advantage? Exploring the intersection of
charter schools and alternative teacher certification upon STEM
outcomes
by
Bernard George David
Dissertation
Presented to the Faculty of the Graduate School of
The University of Texas at Austin
in Partial Fulfillment
of the Requirements
for the Degree of
Doctor of Philosophy
The University of Texas at Austin
December 2020

iv
Acknowledgements
I am tremendously grateful to a number of people who supported me both
throughout my graduate school experience at UT, Austin and as I pursued and completed
this dissertation research project. Without their support, I doubt I would have been
successful in this endeavor, and I almost certainly would not have enjoyed the process as
much as I did!
Having studied both physics and STEM Education at UT, Austin, I was incredibly
fortunate to find a wonderful group of colleagues in each department. To my STEM
Education cohort, thank you for your friendship and camaraderie throughout the duration
of my doctoral studies. I have deeply cherished the opportunities to engage in critical
dialogues about education policy and practice with you, and I appreciate the ways in which
you have challenged me to expand my thinking, confront my assumptions, and strengthen
my arguments. To my physics cohort, thank you for making a “disciplinary outsider” feel
at home. The willingness with which you shared your research and engaged in a variety of
discussions—from the tenets of physics education to the use of quantitative frameworks
inspired by physics to explore social systems—served to advance my own research agenda
innumerably. I am thankful to you for sharing your perspectives with me and for providing
other lenses with which to view my own work. By the way of cohorts, I could not have
anticipated a better set of friends and colleagues with whom to share the successes and
traverse the tribulations of graduate school.
Late in my first year of the STEM Education doctoral program, I happened upon
the EduPhysics group and my research trajectory took a drastically different path from
what I initially imagined. To Caitlin, Sarah, Matt, Valerie, Annelies, and Franki: thank you
for sharing your expertise, for your mentorship, and for your friendship. It was an absolute

v
pleasure to work and learn alongside you, and I cannot thank you enough for being my
sounding board when I was stuck in the depths of code or needed another perspective on
any one of a number of problems I encountered. You have been a wonderful team and you
have pushed me to explore varied methodologies and to articulate the merits of using these
methods in my own research studies.
Prior to UT, Austin, I was a science teacher in Washington, D.C. and a scholar in
the Science Educators for Urban Schools (S.E.U.S.) program at Boston College. My
mentors and colleagues from the S.E.U.S. program equipped me with the critical
disposition that has been essential to my doctoral studies. My experience as a S.E.U.S.
scholar oriented me towards the pursuit of social justice and the importance of working
towards equitable education opportunities and outcomes for all students. Specifically, I
thank Audrey Friedman whose support has been unwavering since I initiated my foray into
education as S.E.U.S. scholar. Her mentorship and enthusiastic willingness to support my
teaching and research efforts have been invaluable. I also thank the students whom I had
the pleasure of teaching in Washington, D.C. Without teaching experience, I do not think
my research would hold much water. My students equipped me with insights that had an
immense impact upon the work I pursued during my doctoral research.
The data analyzed for this dissertation project are housed in the Texas Education
Research Center (ERC), and this project would not have been possible without the tireless
work of the ERC faculty and staff. To Celeste Alexander, Kristi Stillwell, Andres
Rodriguez, and Pedro Reyes, thank you for making this wonderful resource to researchers
and graduate students. I am incredibly thankful that I was able to analyze the rich set of
data available in the ERC, and I learned a vast number of skills in learning to manipulate
and analyze this data. Thank you, also, for your patience and dedication to the success of
this project: from making sure results and tables were released on an accelerated timeline

vi
to making sure the proper packages were available in the ERC, I am indebted to you for
the work you have done to make this critical resource available.
It is hard to articulate the gratitude I have for my dissertation committee: Jill
Marshall, Michael Marder, María González-Howard, and Huriya Jabbar. Prior to graduate
school, I heard many cautionary tales of “dissertation committee drama,” and I can happily
report that I did not experience any of this drama. By contrast, I think I hit the dissertation
committee jackpot, and I am humbled by your willingness to guide this project, to provide
thoughtful feedback on the various studies I conducted, and for your endless
encouragement and support. I think each of my committee members are tremendous
academics, educators, and scholars, and I am incredibly thankful to have been able to
complete this project under the guidance of a group of individuals whom I respect deeply.
In particular, I am incredibly thankful for guidance of Jill Marshall and Michael
Marder, who supported me since the beginning of my time at UT, Austin. Jill: the
dedication you have for your students and your unending commitment to their success is
truly remarkable. I cannot find the words to properly express the gratitude I feel for being
a recipient of such amazing support. Since enrolling at UT, Austin, I have grown as a
scholar and educator, and I think this is largely due to the wonderful guidance I received
from you. Michael: thank you for taking a risk on a graduate student with no coding
experience. Upon enrolling in graduate school, I did not think I would pursue a quantitative
research agenda, but your willingness to add me to your ERC project and help me learn the
nuances of programming languages has ignited a new passion. I am thankful for the ways
in which you have challenged me to build quantitative models while attending to the
structure of the system they represent and for the ways in which you have opened my eyes
to the creativity inherent in quantitative modeling.

vii
I am incredibly lucky to have benefitted from support and unconditional love from
my family, who encouraged me to pursue my academic and professional goals with
unwavering commitment. To Danny, Kaitlin, Sam, Mom, and Dad: I love you all dearly
and cannot even begin to imagine how I would have gotten to where I am today without
your support. The faith you have had in my ability to persist when I doubted my own
capacity to do so has sustained my efforts throughout this graduate program and beyond. I
am thankful not only for your support, but also for your willingness to discuss my research
ideas and for approaching my work with skepticism and a critical lens that has only served
to bolster my rationale and approach for this research.
Finally, my partner-in-crime, Risa, deserves immense recognition for her tireless
support, patience, and dedication to making sure I succeeded in pursuing my dissertation.
You put countless hours into reviewing early drafts of my papers, serving as an audience
and critic to the presentations I made to support my dissertation project, and providing
encouragement and reassurance when the project overwhelmed my emotional resources. I
doubt that I would have been able to make it through the dissertation in one piece were it
not for your ability to provide gentle encouragement—and the occasional prodding—I
needed to make progress on this work.

viii
Abstract
What is the competitive advantage? Exploring the intersection of
charter schools and alternative teacher certification upon STEM
outcomes
Bernard George David, Ph.D.
The University of Texas at Austin, 2020
Supervisor: Jill Marshall
Alternative teacher certification pathways, public charter schools, and other
market-based reforms have become staples of the current educational landscape in the
United States. Since their inception, both alternative teacher preparation pathways and
public charter schools have experienced tremendous growth. Extant research has
investigated the effects of these reforms individually; however, little work has explored
their joint impact on educational outcomes. In addition, research has not investigated how
these two reforms have influenced student performance and participation in the STEM
disciplines, despite the fact that influential government documents cite poor performance
in STEM as a key reason why education reform is desperately needed. The goal of this
dissertation project is to explore how the expansion of charter schools and alternative
certification programs have independently and jointly impacted student engagement with
STEM disciplines, with particular attention to the mechanisms by which these reforms have
either hindered or supported student engagement.
This dissertation project consists of three distinct, yet complimentary, studies that
explore various aspects of how charter schools and alternative certification pathways have

ix
independently and jointly impacted student outcomes in STEM. The first study expands
upon earlier work that explored differences in STEM course offerings and course-taking
patterns between charter and non-charter schools. Specifically, this study investigates how
students’ enrollment in charter schools and in different kinds of STEM courses at the
secondary level impact post-secondary enrollment and post-secondary degree attainment.
Although charter schools increase the likelihood that students enroll in post-secondary
institutions, charter school graduates are no more likely than their peers from non-charter
district schools to earn post-secondary degrees in four years. The types of STEM courses
in which students were enrolled at the secondary level are, however, associated with
differential likelihoods of both pursuing post-secondary education and earning post-
secondary degrees.
The second study identifies and explores how traditionally and alternatively
certified teachers are assigned to STEM courses in charter and non-charter schools.
Alternative certification and charter schools are both associated with increased likelihood
of teacher mobility: either that teachers teach different STEM courses from one year to the
next, find employment in different campuses, or leave the profession entirely. Compared
to traditionally certified teachers, alternatively certified teachers are more likely to be
reassigned to “low-stakes” STEM courses, in which results from standardized exams used
to evaluate school quality are not published publicly. Finally, results indicate that the type
of STEM course to which a teacher is assigned in one year impacts the type of STEM
course that he or she will teach in the subsequent year, suggesting that there are some
common pathways between course assignments across academic years.
The final study of this dissertation uses to different methods to estimate the joint
causal effect of alternative teacher certification and charter schools upon student
performance on standardized exams in STEM subjects. Results from this study indicate

x
there is no joint causal effect of teacher preparation pathway and school sector upon student
performance on standardized exams in STEM disciplines and that alternative certification
negatively impacts student performance. The effect of charter schools, however, is
sensitive to the model specification, underscoring the importance of articulating the
assumptions made when pursuing causal inference with observational data.

xi
Table of Contents
List of Tables ................................................................................................................... xiv
List of Figures .................................................................................................................. xvi
Chapter 1: Introduction ........................................................................................................1
“Our Failing Teachers”: Justifying Alternative Teacher Certification .......................7
“Our Failing Schools”: Justifying Charter Schools and School Choice ...................11
Education Reform for the STEM Disciplines ...........................................................17
Education Reform for Equity ....................................................................................18
Areas for Research ....................................................................................................24
Data and Setting ........................................................................................................28
Chapter 2: Sector Differences in Student’s Secondary STEM Course-taking Patterns and Post-Secondary Outcomes ....................................................................................30
Introduction ...............................................................................................................30
Literature Review .....................................................................................................36
Charter Schools and Post-Secondary Outcomes ...........................................36
Instructional Conditions in Charter Schools .................................................39
Data and Sample .......................................................................................................41
Analytic Methods ......................................................................................................44
Identifying Course-taking Patterns through Social Network Analysis .........44
Statistical Analysis to Determine the Probability of Post-Secondary Outcomes ................................................................................................47
Results .......................................................................................................................50
Discussion .................................................................................................................65

xii
Chapter 3: Teaching in a Parallel Universe: Assignment of Alternatively and Traditionally Certified STEM Teachers to Courses in Charter and Non-charter Public Schools ..............................................................................................................70
Introduction ...............................................................................................................70
Literature Review .....................................................................................................75
Factors Impacting Teacher Hiring, Assignment, and Mobility ....................76
How Teachers Navigate the Educational Labor Market in an Era of School Choice .........................................................................................81
Data and Sample .......................................................................................................86
Analytic Methods ......................................................................................................91
General Assignment to STEM Courses ........................................................92
Teacher Value-Added and Course Assignment ............................................94
Results .......................................................................................................................95
Assignment to Secondary STEM Courses ....................................................95
Teacher Effectiveness and STEM Course Assignment ..............................103
Discussion ...............................................................................................................108
Chapter 4: Estimating the Joint Causal Effect of Teacher Preparation Pathway and Charter Schools upon Student Outcomes in STEM Disciplines ................................113
Introduction .............................................................................................................113
Literature Review ...................................................................................................119
Research on the Effects of School Sector and Teacher Preparation Pathway .................................................................................................119
Causal Analysis ..........................................................................................124
Formulations of Causal Inference ......................................................127
Adopting a Causal Framework ..........................................................133
Data and Sample .....................................................................................................135

xiii
Analytic Methods ....................................................................................................144
Hybrid Crossover and Nonrandomized Block Design ...............................144
Regression Model ..............................................................................145
Directed Acyclic Graphs .............................................................................147
Statistical Models ...............................................................................149
Results .....................................................................................................................151
Crossover Nonrandomized Block Results ..................................................152
Regression and DAG Results .....................................................................154
Discussion ...............................................................................................................155
Chapter 5: Conclusion ......................................................................................................159
References ........................................................................................................................164

xiv
List of Tables
Table 1. Coefficients from models predicting the likelihood of a student enrolling in a
post-secondary institution within one year of graduating from high
school. ...........................................................................................................52
Table 2. Coefficients from model predicting the log odds of a student earning a post-
secondary degree or certificate within 4-years of high school graduation. ..53
Table 3. Regression output from multinomial logistic model predicting the likelihood
of high school graduates enrolling in certain types of post-secondary
institutions. ....................................................................................................56
Table 4. Results from multinomial logistic regression predicting the likelihood of
students achieving different post-secondary outcomes within 4-years of
their graduation from high school. ................................................................61
Table 5. Multinomial regression output giving the probability of earning different
types of post-secondary degrees in STEM disciplines relative to not
earning any degree. .......................................................................................63
Table 6. Coefficients from a logistic regression model predicting the probability of a
teacher being assigned to teach the same STEM course at the same
campus in a subsequent year. ........................................................................96
Table 7. Coefficients from a multinomial regression model predicting the probability
of teachers being assigned to teach specific types of STEM courses in a
subsequent year. These results include all teachers in the sample
analyzed. .......................................................................................................98

xv
Table 8. Coefficients from a multinomial regression model predicting the probability
of teachers being assigned to teach a specific type of STEM course in a
subsequent year. These results are subset to teachers who were not
assigned to teach the same STEM course at the same campus in a
subsequent year. ..........................................................................................101
Table 9. Coefficients from logistic regression models predicting the likelihood of a
teacher continuing to teach the same STEM subject at the same campus
in a subsequent year as a function of that teacher’s value-added
coefficient in the prior year. Variants are run for algebra 1 and biology
teachers separately and jointly in addition to controlling for only teacher
quality and controlling for both teacher and campus quality. .....................104
Table 10. Results from multinomial models predicting the likelihood of being
assigned to teach specific types of courses as a function of certification
pathway, sector, prior year value-added, and prior year STEM course
assignment. ..................................................................................................106
Table 11. Multinomial regression coefficients predicting the likelihood of teachers
being assigned to teach certain STEM courses as a function of
certification, sector, prior year teacher and campus value-added
coefficients, and prior year STEM course assignment. ..............................107
Table 12. Paired-sample t-tests comparing average demographics of students
transitioning from and to charter schools in the present study. ..................143
Table 13. Coefficients from regression model specified for the hybrid crossover,
nonrandomized block research design in mathematics and science. ..........152
Table 14. Regression coefficients for the model specified from the directed acyclic
graph adjustments given in Figure 23. ........................................................154

xvi
List of Figures
Figure 1. Sankey diagram giving the proportion of students enrolling in post-
secondary institutions by secondary STEM courses and sector. ..................51
Figure 2. Proportion of students with continued post-secondary enrollment or degree
attainment within 4-years of high school graduation by post-secondary
institution type. Color represents sector and secondar STEM course
taking. ............................................................................................................54
Figure 3. Sankey diagram showing the proportion of charter and non-charter school
students enrolling in different types of post-secondary institutions from
secondary STEM course enrollment. ............................................................57
Figure 4. Change in odds of enrolling in various types of post-secondary institutions
associated with charter attendance and secondary STEM course-taking. ....58
Figure 5. Sankey diagram showing the proportions of students from different types of
post-secondary institutions achieving post-secondary outcomes. Color
represents sector and secondary STEM course-taking. ................................60
Figure 6. Change in odds of earning various post-secondary degrees associated with
charter school enrollment, enrollment in different sets of secondary
STEM courses and the interaction between the two. ....................................62
Figure 7. Change in odds of earning various types of post-secondary STEM degrees
associated with charter enrollment and in secondary STEM course
taking. ............................................................................................................64
Figure 8. Number (top panels) and proportion (bottom panels) of STEM teachers by
school sector and certification pathway for all years analyzed in this
study. .............................................................................................................87

xvii
Figure 9. Average racial demographics of students in charter and non-charter school
classrooms taught by alternatively and traditionally certified teachers. .......88
Figure 10. Average demographic characteristics of students in charter and non-charter
school classrooms taught by alternatively and traditionally (standard)
certified teachers. ..........................................................................................89
Figure 11. Probability estimates from logistic regression model predicting the
likelihood that a teacher continues to teach the same STEM course at the
same campus from one year to the next given sector employment,
certification, and classroom demographics. ..................................................97
Figure 12. Odds of all teachers being assigned to teach a certain STEM course given
sector employment, certification, and prior year assignment. ......................99
Figure 13. Sankey diagram illustrating how STEM teachers are reassigned to different
courses in secondary schools. Color represents certification pathway and
panels indicate sector employment. ............................................................100
Figure 14. Odds that teachers who are reassigned to different courses are assigned to
specific types of STEM courses given sector employment, certification
pathway, and prior year STEM assignment. ...............................................102
Figure 15. Sankey diagram depicting how STEM teachers are reassigned when they
do not teach the same STEM course from one year to the next. Color
indicates certification pathway and panel indicates sector employment. ...103
Figure 16. Proportion of charter and non-charter schools in Texas by grade level
served. .........................................................................................................114
Figure 17. Proportion of Texas students in charter and non-charter schools by grade
level. ............................................................................................................115

xviii
Figure 18. Top left: Map of Texas counties included and non-included in this study.
Top right and bottom: Maps showing charter and non-charter middle and
high schools in Texas. .................................................................................137
Figure 19. Average racial composition of students enrolled in charter and non-charter
schools by Texas county for all years included in this study. .....................138
Figure 20. Average special population composition students enrolled in charter and
non-charter schools by Texas county for all years included in the study. ..139
Figure 21. Demographic characteristics of teachers included in the study by
preparation pathway and sector. .................................................................141
Figure 22. Directed acyclic graph illustrating the casual mechanism by which teacher
preparation pathway (TPP) and school sector (Sec) are hypothesized to
affect student test scores in STEM subjects (St). Red indicates the
outcome variable of interest, blue represents the causal effects being
estimated, and grey nodes represent other covariates. ................................147
Figure 23. Minimally adjusted sets of the DAG provided in Figure 22. .........................150

1
Chapter 1: Introduction
Alternative teacher certification pathways and public charter schools have become
staples of the current educational landscape in the United States. The growth of alternative
teacher preparation pathways and public charter schools nationwide has been spurred, in
part, by a political climate seeking to disrupt the traditional education system, which has
often been cast and perceived as inefficient and underperforming (National Commission
on Excellence in Education, 1983). In contrast to traditional teacher preparation pathways,
in which pre-service teachers obtain certification through university-based programs after
enrolling in coursework and completing supervised student-teaching coordinated by the
university, alternative certification programs, typically offered through private companies,
provide pre-service teachers an accelerated route to certification in which they become
teachers of record without completing student teaching and while continuing to enroll in
coursework. Charter schools are similarly put forth as an alternative to the “traditional”
public schools that are housed in districts and serve their local communities. In contrast to
“traditional” public schools, charters typically operate independently of local districts and
have greater autonomy over curricular, financial, and staffing decisions. As such, charter
schools are intended to provide communities with educational options outside of their local
districts.
Since their inception, both alternative teacher preparation pathways and public
charter schools have expanded rapidly throughout the United States. After the first charter
school in the United States opened in Minnesota in 1992, charter schools have expanded
to 42 states and the District of Columbia (NAPCS, 2018). As of the 2017-2018 school year,
the National Association of Public Charter Schools (NACPS) reported that more than 3.2
million students were enrolled in over 7000 charter schools operating nationwide (NAPCS,

2
2018). The number of alternative teacher preparation programs across the nation has
similarly grown since the first alternative teacher preparation program was established in
Virginia in 1982, with all states and the District of Columbia providing alternative routes
to certification by 2007 (Suell & Piotrowski, 2007).
Political and academic commentators have long expressed concern over an
incapable teacher work force and the inability of the public education system writ large to
meet the United States’ economic and national security needs. In an article published in
Harper’s Magazine entitled “Can Our Teachers Read and Write?” Koerner (1954)
described the nature of the perceived ineptitude of the teaching force:
There has long been a suspicion in university circles that a large number of teachers in our primary and secondary schools are totally incompetent for the job… [T]o my own astonishment, I have recently turned up a great deal of specific evidence to support the fears of the colleges. (p. 79)
Moreover, in the introduction to Koerner’s 1963 book, The Miseducation of American
Teachers, Sterling McMurrin (1963), former United States Commissioner of Education,
opined, “[W]hatever his conception of the value of education, our average citizen has taken
it for granted that teaching, especially in the secondary and elementary schools, is a
profession entirely appropriate for persons of second- or third-rate ability” (p. x).
McMurrin (1963) continued:
Teaching is an interesting and exciting way of life and now when it is so entirely clear that nothing less than our national security and well-being depend on the quality of teaching in our schools, we should insist that no task that our society now faces deserves more serious and competent attention than that of securing the best education for prospective teachers that our resources can provide. (p. xiii)
The quality (or the perceived lack thereof) of teacher preparation programs and the
teacher work force in the United States is not the only aspect of the public education system
that has been on the receiving end of negative political and public attention. 1983’s A

3
Nation at Risk: The Imperative for Educational Reform prepared by the National
Commission on Excellence in Education expressed in no uncertain terms that the dire state
of the entire public education system warranted the urgent attention of the Nation. This
document detailed how the United States’ “once unchallenged preeminence in commerce,
industry, science, and technological innovation” was at risk due to the “rising tide of
mediocrity” characteristic of the public education system (p. 112).
Rhetoric highlighting the inadequacy of teacher preparation and public education
in the United States, such as that illustrated in the preceding excerpts, has been used to
substantiate calls for widespread education reform in both public and political domains.
Such discourse has often focused upon inequitable educational outcomes by
socioeconomic demographics or poor preparation in the STEM (science, technology,
engineering, and mathematics) disciplines (e.g., Guggenheim, 2010; National Commission
on Excellence in Education, 1983; U.S. Department of Education, 2009). For example,
Waiting for Superman, a 2010 documentary that received widespread attention, positioned
charter schools as a preferable alternative for low-income families who are
disproportionately served by underperforming public schools with ill-equipped teachers
(Guggenheim, 2010). In one scene, Waiting for Superman describes the “dance of the
lemons,” a practice in which ineffective teachers with tenure in non-charter public school1
districts are simply transferred from one school to another because these teachers cannot
be fired. Charter schools, by contrast, are positioned as having greater autonomy in staffing
with the freedom to both fire teachers who do not meet expectations and recruit highly
effective teachers from non-traditional pathways.
1 Typically, research differentiates charter schools from non-charter schools by labeling the latter “traditional public schools.” This term fails to acknowledge the heterogeneity of educational paradigms within public school districts, and instead suggests that schools within public districts operate under a standardized and antiquated model. Since there is substantial variability among district schools, this work uses “non-charter public schools” to distinguish between district-operated schools and charter schools.

4
Similarly, several government documents, including those prepared at the behests
of the Reagan, H. W. Bush, Clinton, W. Bush, and Obama administrations, have cited
inequitable educational outcomes and attainment by socioeconomic status to promote
agendas that support improvements in teacher recruitment and training in addition to
instructional innovation within public schools more generally (Recovery Act, 2009; Goals
2000, 1994; No Child Left Behind, 2002; National Commission on Excellence in
Education, 1983). In addition to citing inequitable educational participation, these
documents also highlight the United States’ declining status as an economic, military, and
technological leader to call for improved STEM preparation. In aggregate, these concerns
have resulted in increased public and political support for and the sustained growth of
alternative teacher preparation programs and charter schools nationally.
The goal of this dissertation project is to explore how alternative teacher
preparation pathways and charter schools have jointly impacted student performance and
attainment in STEM disciplines by analyzing state-wide data from Texas. Although
alternative certification programs and charter schools are educational reforms that were
spawned independently, they share ideologically similar foundations in that they are both
instantiations of market-based reforms designed to spur innovation by expanding options
and introducing competition within the public education sector. Moreover, alternative
certification and charter schools have intersected in several practical ways. Under recent
presidential administrations, federal funding has been used to encourage states to expand
both alternative teacher certification pathways and charter schools (DeVos, 2017; U.S.
Department of Education, 2009), exemplifying how political advocates offer these reforms
jointly as solutions to the problems facing public education. The close relationship between
alternative certification and charter schools is further exemplified by the fact that the
founder of the Knowledge Is Power Program (KIPP), a charter organization with national

5
reach, was founded by a Teach for America alumnus (Kretchmar, 2014) and that
alternatively certified teachers are overrepresented in charter schools (Cannata & Penaloza,
2012).
Despite evidence that these concurrent reforms are interrelated, the effects of
alternative teacher certification and charter schools upon student outcomes have largely
been investigated independently. Charter school researchers have explored how charter
schools affect student performance on standardized exams, with results suggesting that
charter school impacts depend upon both the context in which charter schools are situated
and the educational models adopted by individual charter schools (M. A. Clark et al., 2015;
Dobbie & Fryer, 2011; Gleason et al., 2010). Other charter school researchers have
investigated the effects of charter schools on longer term student outcomes, such as post-
secondary enrollment and future earnings, with results suggesting that students who
attended charter schools enroll in post-secondary institutions at higher rates but do not
benefit from increased earnings in their professional careers (Davis & Heller, 2019; Dobbie
& Fryer, 2016; Place et al., 2019). Research on alternative teacher certification programs
has explored whether teachers from alternative programs are more or less effective than
traditionally prepared teachers at improving student performance on standardized exams.
Although there is research to suggest that traditionally certified teachers are more effective
than alternatively certified teachers at improving student performance on standardized
exams (Marder et al., 2020), results from other studies indicate that it is difficult to assess
the efficacy of individual teacher preparation programs due to noisy statistical estimates
(von Hippel et al., 2016).
While investigating the independent effects of alternative teacher preparation
programs and charter schools upon student outcomes is certainly important given the
expanding role these reforms play in the national educational landscape, it is also important

6
to investigate the joint effects of these reforms. Since alternative teacher certification
pathways and charter schools share ideologically similar foundations, investigating the
independent effects of these reforms has not allowed researchers to evaluate whether or not
the effects of one reform are moderated by the other. I aim to address this gap in the
literature with my dissertation project by conducting studies to better understand the full
breadth of how market-based reforms impact students and teachers.
When investigating how charter schools and alternative certification programs
affect students and teachers, I focus specifically upon the STEM disciplines. As evidenced
by excerpts referenced earlier, poor preparation in STEM disciplines in addition to
inequitable educational outcomes by socioeconomic status are cited as evidence that the
United States’ public education system is failing (National Commission on Excellence in
Education, 1983; U.S. Department of Education, 2009). Although these two issues are
typically positioned as being independent of one another, scholars have argued that “poor
preparation” in STEM reflects disparate educational participation along socioeconomic
divisions (Salzman, 2013). Given both that educational reformers express concern over the
quality of STEM education in the United States and regarding equitable educational
participation and that alternative certification programs and charter schools have expanded
under the backdrop of these concerns, I argue that it is imperative to research whether or
not these market-based reforms are effective at addressing some of the concerns that have
been cited to substantiate calls for reform within the United States public education system.
In the following two sections, I chronicle brief histories of the alternative teacher
certification movement and of the charter school movement. Then, I discuss the ways in
which educational reformers have cited inequitable educational achievement and poor
performance in STEM to garner support for educational reform. The goal of providing
these overviews is to contextualize the broader research agenda I pursue in this dissertation

7
project and the specific research questions and studies I conduct in pursuit of this agenda.
In the final sections of this introductory chapter, I introduce the specific studies included
in this dissertation project and describe the data set analyzed.
“OUR FAILING TEACHERS”: JUSTIFYING ALTERNATIVE TEACHER CERTIFICATION
Formal teacher preparation in the United States began with normal schools in the
mid 19th century (Fraser, 2007). Normal schools were established with the goal of
professionalizing teaching: “the founders…[saw] them as model institutions that would
establish high-quality professional preparation for teachers along with a strong professional
identity” (Labaree, 1996, pp. 30–31). As the number of students enrolling in elementary
and secondary schools grew around the turn of the century, normal schools experienced
pressure to meet an increased demand for teachers. Therefore, producing a large quantity
of teachers often took precedence over ensuring the quality of candidates admitted to
normal schools (Sedlak, 1989). Through the second half of the 19th century and into the
early 20th century, the curricula, admissions requirements, and academic rigor between
normal schools were highly varied (Fraser, 2007). On account of this variation, there were
movements near the end of the 19th century to push teacher preparation toward greater
standardization by centralizing teacher certification at the state level (Sedlak, 1989).
With increased standardization, admissions requirements for normal schools also
changed. Prior to the 1920’s, comparatively few normal schools required a high school
diploma for admission, but by the 1920’s a high school diploma became the norm for
admissions to normal schools (Fraser, 2007). Accompanying this shift in admissions
requirements, normal schools began to increase the rigor of their curricula, making their
academic programs commensurate with other baccalaureate programs and rebranding
themselves as teacher’s and state colleges. By the 1930’s, normal schools typically offered

8
four-year programs leading to baccalaureate degrees, due, in part, to secondary schools
increasingly recruiting university graduates (Fraser, 2007; Labaree, 1996; Sedlak, 1989).
As normal schools morphed into teacher’s colleges, however, they became a more
accessible form of higher education than other universities, and therefore attracted students
who were not necessarily interested in teaching but instead desired to earn a post-secondary
degree so they could ultimately gain entry into other professions. As such, many normal
schools offered general liberal arts classes to students at the expense of rigorous
coursework in teacher preparation (Labaree, 1996). Labaree (1996, 2004) argues that the
emphasis on producing quantity over quality combined with a decline in the rigor of teacher
education coursework in normal schools resulted in a negative view of teacher preparation
that persisted after normal schools became teacher’s colleges and ultimately colleges of
education. Importantly, the transition of normal schools to teacher’s colleges was
emblematic of a deepening national concern both over the adequate preparation of teachers
through rigorous academic coursework and over the increased demand for teachers
resulting from the growth in the number of students attending elementary and secondary
schools in the United States.
By the 1960’s, teacher’s colleges became colleges of education housed within
universities amid continued pressure to increase the rigor of teacher preparation. From the
1960’s to the 1990’s, university-based programs dominated teacher preparation in the
United States (Fraser, 2007; Labaree, 1996, 2004; Sedlak, 1989). Fraser (2007) describes
how pressure to establish reputations as rigorous academic institutions and differentiate
themselves from other forms of education plagued higher education:
[L]eading universities and philanthropic agencies sought to raise standards and clarify terms for what it meant for a school to call itself a college or a university, as opposed to an academy, high school, or normal school, and to accredit those that truly fit the mold…[setting] off a never-ending struggle by virtually all higher

9
education institutions to not only meet the new standards but to do so in a way that would put them at the top of a new pecking order. (p. 188)
With these broader pressures, colleges of education were forced to compete with other
colleges within universities for academic prestige. Colleges of education, however, often
lost out to other departments and were seen as inferior to other departments and colleges
within universities (Labaree, 1996).
Negative portrayals of university-based education programs and their students have
pervaded public and political commentary for decades. In The Miseducation of American
Teachers, Koerner (1963) described several issues he believed afflicted teacher preparation
in the United States. Among his concerns were: “the inferior intellectual quality of the
Education faculty” (p. 17), which Koerner described as “the fundamental limitation of the
field” (p. 17); “administrative inertia,” which resulted in “insufficient forces to oppose the
policy of stagnation” (p. 17); the poor caliber of education students; and “puerile,
repetitious, dull, and ambiguous” coursework typical of education programs (p. 18). In
addition to a widespread belief that the entire teacher preparation enterprise suffers from
mediocrity, concern over teacher shortages have also been commonplace for decades
(Sedlak, 1989). Just as these concerns were cited to reform teacher preparation throughout
the first half of the 20th century, they have also been cited to promote alternative routes to
teacher certification outside of traditional, university-based teacher preparation programs
that came to dominate teacher preparation in the 1960’s (Sedlak, 1989).
Alternative teacher certification programs2 were first established in the early 1980’s
to recruit high-achieving individuals from prestigious universities to the teaching
profession, targeting an untapped source of intellectually capable teachers in efforts to
stave off impending teacher shortages (Sedlak, 1989). Alternative teacher certification
2 The term “alternative teacher certification” is synonymous with “alternative teacher preparation” and “alternative teacher education,” and these terms will be used interchangeably throughout this dissertation.

10
programs exist outside of the university-based programs, typically as accelerated pathways
to teaching with fewer requirements for pre-service teachers. In contrast to university-
based programs, which require pre-service teachers to complete field-based experience
under the supervision of a practicing teacher before obtaining certification and starting full-
time teaching position, graduates of alternative certification programs may become full-
time teachers without any prior field-based experience. In addition, alternative certification
programs typically have substantially less coursework than university-based certification
programs, although alternatively certified teachers often continue to enroll in coursework
while teaching (Darling-Hammond, 2000; Ludlow, 2013; Suell & Piotrowski, 2007).
Suell and Piotrowski (2007) note that Virginia established the first statewide
alternative teacher certification program in 1982; however, pathways to teaching outside
of university-based programs predate Virginia’s statewide program (Fraser, 2007). The
Teacher Corps was established in 1965 with the goal of recruiting graduates from
prestigious schools to work in schools serving low-income and marginalized student
populations (Fraser, 2007). Although pathways to teaching outside of university-based
preparation programs have existed for a long time, two prominent reports following 1983’s
A Nation at Risk criticized university-based teacher preparation programs and served to
galvanize support for alternative teacher certification programs. A Nation Prepared:
Teachers for the 21st Century, prepared by the Carnegie Forum on Education and the
Economy (1986), and Tomorrow’s Teachers, prepared by the Holmes Group (1986), both
described the ills of university-based education programs and advocated for reforms that
would serve to increase the intellectual caliber of the teaching force and recruit more of
these individuals to the teaching profession.
Although reform to teacher preparation has taken various forms since the normal
schools were established in the mid 19th century, two salient themes have pervaded calls

11
for these reforms. First, reformers have claimed that existing teacher certification programs
failed to recruit capable students, were plagued with incompetence, and had mundane and
intellectually dull curricula. Second, reformers have claimed that traditional teacher
certification programs did not have the capacity to produce the number of teachers to meet
the needs of an ever-growing student population. In the current era of market-based reforms
in education, these same concerns are cited to support the expansion of alternative teacher
certification programs in the United States.
“OUR FAILING SCHOOLS”: JUSTIFYING CHARTER SCHOOLS AND SCHOOL CHOICE
Charter schools are publicly funded schools that are free from many of the
regulations to which non-charter public school are accountable. Often, but not always,
charter schools are independent from their local school districts and have greater autonomy
over staffing, finance, and curriculum than non-charter public schools. Charter school
proponents position them as schools of choice that empower families to withdraw from
underperforming non-charter schools and instead enroll their children in schools that are
best tailored to their children’s needs (Anderson, 2018; DeVos, 2017). While widespread
bipartisan support for market-based reforms in education was accelerated in large part by
1983’s A Nation at Risk (C. S. Clark, 2002; Mungal, 2016; Stern, 2013; Worsnop, 1991),
which proclaimed that the United States’ public education system was in dire need of an
overhaul given its inability to adequately educate the nation’s youth (National Commission
on Excellence in Education, 1983), the concept of introducing choice and competition to
public education in order to increase the quality of public education originates in economist

12
Milton Friedman’s Capitalism and Freedom (2002).3 In a chapter dedicated to the role of
government in education, Friedman (2002) wrote:
If…public expenditures on schooling were made available to parents regardless of where they send their children, a wide variety of schools would spring up to meet this demand. Parents could express their views about schools directly by withdrawing their children from one school and sending them to another, to a much greater extent than is now possible. (p. 91)
In addition to more effectively meeting individual families’ educational demands and
“stimulating” the “development and improvement of all schools” (p. 93), Friedman (2002)
argued that introducing market-like competition through parental choice within the public
education system at the elementary and secondary levels would equalize educational access
by giving families—particularly economically disadvantaged families—the option to send
their children to higher quality schools that are more often located in neighborhoods with
higher income. Rather than leading to increased segregation between schools, as some
critics argued, Friedman (2002) posited that giving parents choice in public education
through vouchers would instead serve to decrease the barriers that keep low-families from
accessing high quality schools. Instead of being relegated to attending schools in their local
districts, which receive discrepant funding due to the fact that public schools are funded
through property taxes, families, through vouchers, could exercise choice and send their
students elsewhere. According to Friedman, without vouchers only families of means have
access to school choice because they can afford to either move into a better district or pay
tuition for private schooling.
While the idea of school choice was introduced in Friedman’s Capitalism and
Freedom, the concept of charter schools was conceived by Budde in his 1988 report,
Education by Charter: Restructuring School Districts. In this report, Budde (1988)
3 Milton Friedman’s Capitalism and Freedom was originally published in 1962, but the version I reference herein is a 40th anniversary edition.

13
envisioned an education system in which schools would be issued charters from an
overseeing organization, thereby giving schools and the teachers within them greater
autonomy with which to experiment in implementing creative and innovative educational
models. Just as charters issued during the Age of Exploration “usually called for
exploration into unknown territory and involved a degree of risk to the persons undertaking
the exploration,” Budde (1988) argued that charters in education would enable individuals
with novel ideas for education to put those ideas into practice (p. 49). In addition, Budde
(1988) proposed that schools operating under a charter would be held accountable to the
charter grantor and have permission to operate for a finite time period—between 3 and 5
years. Should a charter school fail to meet its accountability benchmarks, it would not be
allowed to continue its operation.
At its inception, school choice was to be realized through voucher programs, in
which parents would receive vouchers to send their children to schools approved by the
government, and schools could then redeem each voucher for funding commensurate with
the cost of educating a single student (Friedman, 2002). Early choice programs, however,
often took the form of tuition tax benefits for schooling, in which families sending their
students to parochial or private schools could reduce their taxes by a certain percentage of
their educational expenses, including tuition, travel to and from school, and school supplies
(Worsnop, 1991). Early adopters of school choice programs included: St. Paul and
Minneapolis, Minnesota; Scarsdale, New York; Philadelphia, Pennsylvania; San Jose,
California; and Arlington, Virginia (C. S. Clark, 2002; Worsnop, 1991).
A major point of contention in the early days of the school choice movement was
whether or not it was constitutional for the public government to provide families with
vouchers that would ultimately go to parochial schools, thereby muddying a clear
separation between church and state. In the 1971 court case Lemon v. Kurtzman, three

14
criteria were established to determine whether or not government financial aid to religious
schools was constitutional (Worsnop, 1991). This case established that any aid given to a
parochial school must be driven by secular goals, must neither advance nor inhibit any
religious ideology, and must not lead to mixing between governmental and religious
organizations (Worsnop, 1991).
In his 1980 presidential campaign, Ronald Reagan ran on a platform promoting
tuition tax credits to broaden school choice. As president, Reagan submitted a legislative
proposal to Congress in 1982 in addition to subsequent proposals for tuition tax credits
throughout his presidency, but these proposals were never enacted into law, facing
tremendous opposition from the public education lobby (Worsnop, 1991). At the state
level, however, school choice movements made headway. C. S. Clark (2002) reports that
in the late 1980’s, after A Nation at Risk was released, California considered legislation
that would require schools to create alternate educational programs if a sufficient
percentage of the parents in that school requested them, and Minnesota passed two laws
allowing students to transfer between districts.
During his presidency, George H. W. Bush also promoted school choice as a key
component of school reform. In 1991, President Bush released America 2000: An
Educational Strategy to serve as guidelines for achieving educational goals developed at
the 1989 National Education Summit, a meeting between President Bush and the governors
of all 50 states, in Charlottesville, VA (America 2000, 1991; Bush, 1991). President Bush
proposed legislation, the America 2000: Excellence in Education Act, which promoted
school choice and other market-based reforms as necessary means to achieve the
previously established National Education Goals (Bush, 1991). As articulated in America
2000: An Educational Strategy, school choice was proposed as a way to improve the
broader public education system by promoting competition between schools, thereby

15
inducing educational experimentation and innovation (America 2000, 1991). Moreover,
this legislation also proposed accountability measures for all schools in order to empower
families to make informed decisions about the efficacy of different public schools. In
addition to expanding school choice, America 2000 also called for the creation and
expansion of alternative teacher certification programs in order to recruit professionals and
other qualified individuals into the teaching profession who might otherwise not consider
a teaching profession due to the number of barriers to entry (America 2000, 1991; Bush,
1991; Worsnop, 1991).
Although the America 2000: Excellence in Education Act was not written into law,
elements of school choice began to expand at the state level, with charter school legislation
written into law in Minnesota in 1991 and California following suit in 1992 (C. S. Clark,
2002). By the conclusion of the 1990’s, charter school legislation was enacted into law in
36 states and Washington, D.C. Such growth was supported by legislation enacted in 1994
during Bill Clinton’s presidency. The Goals 2000: Educate America Act explicitly
supported school choice by providing funding for the development and expansion of
charter schools (Goals 2000, 1994; Heise, 1994; Stallings, 2002). Like America 2000: An
Educational Strategy, Goals 2000 sought broad educational reform through school choice
to address the educational “mediocrity” in the United States articulated in A Nation at Risk
and to achieve the National Education Goals developed at the National Education Summit
in 1989.
At the federal level, policies and legislation supported both by President George W.
Bush and President Barack Obama continued to expand school choice by providing
funding to charter schools. In 2001, George W. Bush proposed the No Child Left Behind
Act, which established high-stakes accountability metrics for schools and required districts
to allow students to transfer out of low-performing public schools and into other public

16
charter or non-charter schools (Stallings, 2002). The Race to the Top program, which was
a part of Barack Obama’s American Recovery and Reinvestment Act of 2009, similarly
promoted charter schools as a viable way to achieve reform and induce innovation by
providing financial incentives for educational institutions to partner with nonprofit
organizations with a proven record of closing the racial achievement gap (Recovery Act,
2009; Stern, 2013). In addition, the Race to the Top program fortified high-stakes
accountability measures established in the No Child Left Behind Act (Stern, 2013).
That charter schools could either improve or serve as an alternate to the often
underperforming public schools in urban areas led many Black and low-income, ethnic
minority families to embrace the charter school movement (Shokraii, 1996). However,
whereas conservative political rhetoric around charter schools emphasized the potential of
competition and market-based principles to improve public education, Black charter-
school advocates borrowed language from the civil rights movement and sought greater
school choice due to “public schools’ dismal educational record and indifference to
parents” (Shokraii, 1996, p. 20). Several grass-roots movements in Black communities
around the country emerged in support of school choice and charter schools: Cleveland,
Ohio; Milwaukee, Wisconsin; Florida; California; Texas; and Michigan (Shokraii, 1996).
While Shokraii (1996) described the policy impacts of these grass-root movements, a more
recent study designed to identify what characteristics were predictive of charter schools
found that states and districts with higher percentages of Black and Latinx populations
were more likely to have charter schools (Stoddard & Corcoran, 2007). In addition, these
authors found that states and districts with charter schools also had a greater percentage of
adults with post-secondary degrees and were characterized by greater income inequality.
Although support for charter schools and school choice was (and is) by no means universal,

17
Martin and Burke (1990) cite data from a Gallup Poll indicating that twice as many
participants polled supported school choice as those who did not.
EDUCATION REFORM FOR THE STEM DISCIPLINES
The alleged decline in the general quality of the United States public education
system and the inferior intellect of the teachers employed within it have often been cited in
public and political discourse as threatening the United States’ global economic, military,
and technological superiority (Carnegie Forum on Education and the Economy, 1986;
Holmes Group, 1986; National Commission on Excellence in Education, 1983). Of
particular concern, specifically with respect to national security and economic
competitiveness, has been the quality of STEM instruction. Rudolph (2002) explains that
widespread fear within the United States about superior STEM education in Russia during
the Sputnik era prompted the scientific community in the United States to take a greater
role in designing science curricula and instruction for the elementary and secondary levels.
Moreover, concern about inadequate preparation in STEM has been cited in several
government documents to motivate calls for education reform. For example, A Nation at
Risk described the decline in United States’ performance on national science assessments
and the increase in the number of students enrolling in remedial mathematics courses
(National Commission on Excellence in Education, 1983). Improving United States
students’ achievement in math and science—more specifically, ensuring United States
students’ global preeminence in these disciplines—was described in both America 2000
and Goals 2000 (America 2000, 1991; Goals 2000, 1994). In addition to providing funding
to states supportive of charter schools, No Child Left Behind provided funding for the
expansion of alternative teacher certification programs so that these programs could recruit
highly qualified teachers with post-secondary degrees in the STEM disciplines (No Child

18
Left Behind, 2002). Race to the Top, initiated under the American Recovery and
Reinvestment Act, prioritized STEM preparation and called for states to create
environments favorable towards educational innovation, such as expanding opportunities
for charter schools (Recovery Act, 2009). Although alternative pathways to teacher
certification and charter schools are not necessarily positioned as reforms expressly
targeted at addressing STEM education, they are at the forefront of efforts to catalyze
change in an education system that is often portrayed as problematic due to concerns over
the quality of STEM education.
That the United States is falling behind in STEM disciplines is a truism accepted in
public and political circles: “[M]ost policymakers and industry leaders are united in their
belief that the United States faces a high-tech talent crisis. The belief has become a central
theme in discussions…on education and the causes of economic stagnation domestically,
and on the nation’s competitive position globally” (Salzman, 2013, p. 58). Seemingly,
United States student performance on national standardized exams, such as the National
Assessment of Educational Progress (NAEP), and on international standardized exams,
such as the Programme for International Student Assessment (PISA), support these
narratives. However, rather than a decline in educational performance in STEM and a lack
of qualified STEM workforce in the United States, skeptics argue that concerns over these
issues are misplaced and rather the real issue with STEM in the United States is inequitable
participation in these disciplines (Salzman, 2013; Teitelbaum, 2003, 2014).
EDUCATION REFORM FOR EQUITY
In addition to highlighting the United States’ declining status as an economic,
scientific, and technological leader, government documents calling for education reform
have also highlighted inequitable participation in education by ethnic and socioeconomic

19
status. A Nation at Risk expressly acknowledged that although citizens were, on average,
more highly educated than before, the achievement of the average high school and college
graduate was lower than before. Following these observations, the authors wrote, “The
twin goals of equity and high-quality schooling have profound and practical meaning for
our economy and society, and we cannot permit one to yield to the other either in principle
or in practice” (National Commission on Excellence in Education, 1983, p. 117). America
2000 and Goals 2000 also sought to eliminate the gap in achievement between
socioeconomically disadvantaged ethnic minority populations and non-minority
populations (America 2000, 1991; Goals 2000, 1994). The first section of No Child Left
Behind included a number of provisions to support underachieving schools serving
disadvantaged populations (No Child Left Behind, 2002). Finally, Race to the Top called
for increased efforts for recruiting underrepresented ethnic minority populations and
women to the STEM fields (U.S. Department of Education, 2009).
Discrepant participation in STEM fields is evident as early as high school. On
average, Asian and White students take more credits in the physical sciences (physics and
chemistry) during high school than Black, Latinx, and Native American students, although
differences in biology and math credits are not as substantial (National Center for
Education Statistics, 2018). Differences in STEM participation at the post-secondary level
also exist along ethnic and socioeconomic lines. Of the post-secondary student population,
Black, Latinx, Pacific Islander, and American Indian/Alaska Native students are
underrepresented in STEM disciplines—particularly in engineering, mathematics, and the
physical sciences—while White and Asian students are overrepresented in these disciplines
(National Center for Education Statistics, 2018).
Rothwell (2013) reports that, as of 2011, half of all careers requiring STEM
knowledge did not require workers to have a bachelor’s degree in a STEM discipline. In

20
addition, these jobs pay average salaries that are 10% higher than careers in other fields
with equivalent educational requirements. Inequitable access to and participation in STEM
can inhibit students’ ability to pursue jobs and careers that are more lucrative. Moreover,
differences in compensation between STEM and non-STEM fields are not limited to those
that require less than a bachelor’s degree, as Rothwell (2013) reports. Post-secondary
STEM degrees are also associated with higher average earnings than non-STEM fields
(Carnevale et al., 2015; National Center for Education Statistics, 2018).
In addition to the economic benefits associated with STEM careers and degrees
(Carnevale et al., 2015; Rothwell, 2013), understanding of STEM content and facility with
the “habits of mind” characteristic of STEM disciplines (e.g., inquiry, analytical skills, and
critical thinking) are socially and professionally privileged (Metcalf, 2010). Given the
benefits of STEM—both with and without post-secondary education in STEM fields—it is
important for all students to have access to high quality STEM education not only for the
benefit of the broader society, but also for students’ own personal benefit and well-being.
That socioeconomically disadvantaged and ethnic minority populations are
underrepresented in STEM fields both in secondary and in post-secondary education is
therefore a manifestation of inequity in STEM education.
Charter schools and alternative teacher preparation pathways are positioned by
proponents as educational reforms that can promote social mobility. Moreover, adequate
preparation in the STEM fields, at the secondary and post-secondary levels, is a viable way
to achieve social mobility, seeing as STEM knowledge is privileged and STEM careers are
associated with higher than average wages. Public education as a means for social mobility
is one of three competing ideologies that Labaree (1997) argues have been at the center of
educational reform movements. The three competing goals at the center of the political
debate surrounding public education identified by Labaree (1997) are: public education for

21
democratic equality; public education for social efficiency; and public education for social
mobility (p. 42).
Advocates of public education for democratic equality justify this stance because
“a democratic society cannot persist unless it prepares all of its young with equal care to
take on the full responsibilities of citizenship in a competent manner” (Labaree, 1997, p.
42). The democratic equality goal positions education as entirely public—it is a public
good meant to directly benefit and serve public interests by preparing students for
“competent” democratic engagement. Those who believe public education exists for social
efficiency maintain this position because “our economic well-being depends on our ability
to prepare the young to carry out useful economic roles with competence” (p. 42). Whereas
democratic equality is purely public, social efficiency positions education as a public good
serving the needs of the private sector. In so doing, however, there is public benefit because
preparing students for work in the private sector ultimately promotes the nation’s economic
productivity and prosperity. Finally, those who argue public education should promote
social mobility believe “education is a commodity, the only purpose of which is to provide
individual students with a competitive advantage in the struggle for desirable social
positions” (p. 42). Advocates of education as social mobility position education as a public
good serving individual students’ personal interests and students as consumers of this
commodity.
In describing how these three competing interests have impacted public education,
Labaree (1997) argues:
[T]he biggest problem facing American schools is not the conflict, contradiction, and compromise that arise from trying to keep a balance among educational goals. Instead, the main threat comes from the growing dominance of the social mobility goal over the others. Although this goal (in coalition with the democratic equality goal) has been a major factor in motivating a progressive politics of education over the years, the increasing hegemony of the mobility goal and its narrow consumer-

22
based approach to education have led to the reconceptualization of education as a purely private good. (p. 73)
In characterizing the politics of education, ideologies that emphasize the mobility of the
individual have come to dominate at the expense of public interests, namely democratic
equality and social efficiency. Moreover, the goal of social mobility commodifies
education in a way that is concomitant with market ideologies.
Consistent with this notion, Apple (2007) describes the scope of 2002’s No Child
Left Behind (NCLB): “The major components of the legislation center on testing and
accountability but also provide inroads toward a larger agenda of privatization and
marketization” (p. 109-110). Apple (2007) cautions that the education reforms promoted
by this legislation served to couple high accountability, or the auditing of public schools,
via standardized examinations with the marketization and privatization of public education.
Apple (2007) describes that these ideologies “[have] not demonstrated much improvement
in education and [have] marked a dangerous shift in our very idea of democracy…from
‘thick’ collective forms to ‘thin’ consumer-driven and overly individualistic forms” (p.
112). Moreover, these reforms “[misconstrue] and then basically [ignore] the intense
debates over whose knowledge should be taught in schools…and [establish] a false
consensus on what is supposedly common in the United States” (p. 112).
According to these notions, the convergence of accountability measures with
marketization and privatization has served to protect dominant groups’ interests and
resulted in a lack of appreciation for the complexities of classroom practice and the
diversity of cultural ways of knowing. Therefore, conceptions of knowing and learning as
cultural practice, as described by Gutiérrez and Rogoff (2003) and Nasir and Hand (2006),
are neglected in favor of promoting standardization, efficiency, and perpetuation of
knowledge concordant with normative stances.

23
Although charter schools and alternative teacher preparation programs are lauded
as reforms to improve education, some observers note that the innovations induced by
market-based reforms are organizational in nature, while instruction and curricula are left
unchanged (Lubienski, 2003). Moreover, scholars worry that charter school successes,
such as those reported by Clark, Gleason, Tuttle, and Silverberg (2015) and Dobbie and
Fryer (2016), are due, in part, to strict character education in some charter schools that is
enigmatic of a “new paternalism” in which middle-class values are taught to low-income
students as a means to promote social mobility (Curto & Fryer, 2014; McDermott &
Nygreen, 2013). Notably, educational programs imbued with middle class values and that
revert to standardized and more traditional modes of instruction are antithetical to
multicultural education, in which “institutional changes must be made, including changes
in the curriculum; the teaching materials; teaching and learning styles; the attitudes,
perceptions, and behaviors of teachers and administrators; and the goals norms and culture
of the school” (Banks, 1993, p. 4).
In addition to concerns about how “new paternalistic” approaches to education
within charter schools devalue marginalized students’ multicultural ways of knowing,
evidence suggests that the student achievement often attributed to charter schools may
instead be an artifact of “cream-skimming,” in which charter schools specifically target
high-achieving students from historically marginalized populations (Jabbar, 2015;
Lacireno-Paquet et al., 2002). Of concern, cream-skimming serves to exacerbate inequity
by limiting “choice” to families of relative privilege within low-income neighborhoods and
by taking resources from other non-charter public schools who are left to serve students
with lower academic achievement.
Geospatial analyses characterizing how charter schools strategically position
themselves within the educational market provide additional evidence to support the notion

24
that charter schools may engage in cream-skimming. These studies suggest that charter
schools tend to be established in areas of relative privilege (e.g., higher educational
attainment or greater per-capita funding) surrounding communities with
socioeconomically disadvantaged populations (Glomm et al., 2005; Gulosino &
dEntremont, 2011; Koller & Welsch, 2017; Saultz & Yaluma, 2017). In contrast to rhetoric
that positions charter schools as means by which to provide choice to families that
otherwise would not have access to educational options, evidence suggests that charter
schools may be strategically recruiting students with higher academic potential in such a
way that serves to boost their academic reputations and outcomes. It is therefore important
for research on charter schools and other market-based reforms to attend to issues of equity
when evaluating the impacts of these reforms.
AREAS FOR RESEARCH
Expanding alternative certification routes to teacher certification and increasing the
number of charter schools as a means to spur innovation in public education have both been
elements of education reform promoted by federal initiatives since the publication of A
Nation at Risk. Some researchers have suggested that alternative certification and charter
schools have formed an education structure that is parallel to the traditional structure in
which teachers prepared in standard, university-based preparation programs work in non-
charter public schools. In the theorized “parallel” education system, teachers trained in
alternative certification programs are more likely to teach in charter schools (Mungal,
2016). The relationship between charter school expansion and the growth in the number of
alternative teacher certification programs is also highlighted in Waiting for Superman:
charter schools have greater autonomy over staffing and are therefore able to hire highly
qualified individuals who did not come to teaching through traditional certification

25
pathways (Guggenheim, 2010). Thus, while elements of the charter school movement and
elements of teacher education reform have distinct histories, their expansions in the wave
of education reform that has occurred since the publication of A Nation at Risk in 1983 are
dependent. Despite their dependence, the bulk of the existing literature on charter schools
and alternative certification programs explore the effects of these reforms independently,
but do not explore the joint nature of the effects of these reforms on student outcomes.
In addition to promoting charter schools, alternative teacher certification pathways,
and other market-based reforms, federal initiatives advocating these reforms have shared
other common threads. Fear of the “rising tide of mediocrity” of the United States’ public
education system articulated in A Nation at Risk galvanized the public interest in
educational reform in the Reagan era and sustained this interest through Obama’s
presidency (Heise, 1994; National Commission on Excellence in Education, 1983; Smith,
1996; Stern, 2013). Specifically, federal documents highlighted United States students’
declining performance in STEM disciplines and discrepant educational achievement by
socioeconomic status and ethnic identity. School choice reforms have been offered as ways
to improve upon instruction by allowing schools to experiment and innovate with novel
educational models, thereby leading to gains in student achievement. Alternative
certification is positioned as a reform that will serve to recruit highly qualified individuals
to work with disadvantaged populations, with a particular focus on recruiting teachers in
the highly needed STEM disciplines.
While performance in STEM and inequitable educational participation in general
have been factors that have been used to promote educational reform initiatives, most
research on the effects of charter schools and alternative teacher certification routes focuses
upon student outcomes on mathematics and reading exam scores, as these subjects are the
most often tested at the elementary and secondary levels. Although mathematics is one of

26
the STEM disciplines, research solely investigating student outcomes in mathematics does
not provide insight into how education policy initiatives have influenced student
engagement in the STEM disciplines more generally. To date, little research has been
conducted to evaluate the effects of market-based reforms upon student outcomes in the
STEM disciplines (beyond mathematics) or to evaluate the effects of market-based reforms
upon historically disadvantaged populations’ engagement with and participation in STEM,
despite the fact that these concerns are highlighted in political and public discourse to
advance market-based reforms. Moreover, the effects of charter schools and alternative
certification programs have largely been explored independently, despite the fact that they
are interconnected in many critical ways. This dissertation project seeks to address these
gaps in the existing literature by exploring the ways in which the expansion of market-
based reforms, specifically alternative certification pathways and charter schools, in the
United States since the 1980’s have jointly impacted student participation and performance
in STEM disciplines with a particular focus on underrepresented ethnic minority and
socioeconomically disadvantaged populations.
In pursuit of this broader research agenda, this dissertation consists of three distinct
studies, each of which comprises one of the next three chapters. The research questions
addressed by each study are given below:
1. How do students’ STEM course-taking patterns in charter and non-charter
secondary schools predict their participation in and persistence through STEM
fields at the post-secondary level?
2. What factors influence the ways in which alternatively and traditionally certified
teachers are assigned to teach STEM courses in charter and non-charter secondary
schools? What are the characteristics of the teachers assigned to teach various
STEM courses at the secondary level?

27
3. What is the joint causal effect of teacher certification (alternative or traditional) and
school sector (charter or non-charter) upon student performance on standardized
exams in STEM disciplines?
The first research question is an extension upon prior work seeking to identify
differences in STEM course offerings and STEM course-taking patterns between Texas
charter and non-charter secondary schools (David, 2018; David et al., 2020). Findings
indicate that although charter schools are associated with increased rates of college
enrollment, particularly at 4-year institutions, these benefits do not extend to post-
secondary outcomes. Charter school graduates are not more likely than graduates of non-
charter schools to earn post-secondary degrees.
The second research question expands upon a research project exploring the effects
of certification upon student learning in STEM disciplines and a related study exploring
the probability of a teacher being assigned to teach a tested STEM subject based upon that
teacher’s demonstrated ability to improve student test scores in prior years (David &
Marder, 2018; Marder et al., 2020). Findings show that charter school employment and
alternative certification are both associated with decreased likelihood of teaching the same
STEM course at the same campus in a subsequent academic year. In terms of subsequent
year course assignment, a teacher’s prior course assignment is a strong predictor of the
kind of STEM course to which he or she will be assigned in the following year.
The final research question builds upon prior work that employed a mixed
crossover and randomized block research design to estimate the causal effect of
certification pathway and school type upon student test score gains in STEM disciplines.
In this study, I employ two causal methods to estimate the independent and joint causal
effects of teacher preparation pathway and school sector upon student performance on
STEM standardized exams. While results suggest that there is no causal effect due to the

28
interaction between charter school employment and alternative teacher certification upon
student performance on standardized exams, the independent effects of charter schools
upon student performance on standardized exams are sensitive to model specification.
Therefore, it is important for researchers to attend to the assumptions underlying the causal
frameworks employed when estimating the causal effects of education reforms.
DATA AND SETTING
To address these questions, I analyze data available through the Texas Education
Research Center (ERC), which collects and maintains student, school, and district level
demographic and organizational data from the Texas Education Agency (TEA); student
level accountability, course-taking, and course-completion data from the TEA; teacher
certification data from the State Board of Educator Certification (SBEC); and individual
level course-taking and course-completion data for institutes of higher education in Texas
from the Texas Higher Education Coordinating Board (THECB). Although the Texas ERC
maintains longitudinal data from the 1992-1993 school year onward, the project approved
with the Texas ERC for this dissertation was permitted access to data from the 2002-2003
academic year onward. The Texas ERC is one of the largest and most complete public
education information management systems in the world and provides researchers with
opportunities to explore a variety of facets of public education.
In addition to having one of the largest collections of public education data, Texas
is an interesting setting in which to explore the effects of market-based reforms upon
student outcomes in STEM for other reasons. With respect to alternative teacher
certification, the growth of alternative certification programs in Texas has far outpaced that
growth in other parts of the country (Marder et al., 2020). Texas was also one of the first
states to allow charter schools—legislation allowing for charter schools was first passed in

29
1995, just three years after Minnesota became the first state pass charter school legislation
in 1992. That Texas has been a state in which alternative certification and charter schools
have both thrived make it an ideal setting in which to study the effects of these reforms,
particularly considering the rapid growth of these reforms in the rest of the nation. The
lessons learned from data available in Texas can be used to inform education in policy in
other parts of the country.
In addition to being an environment that is generally favorable to market-based
education reforms, Texas has a large and varied student population served by urban,
suburban, and rural school districts. Moreover, the student population in Texas closely
resembles the student population in the United States as a whole. With such a large and
varied student population in a variety of contexts that map comparatively well to the rest
of the United States, insights gleaned from statewide analysis of education policy in Texas
can be reasonably applied to other regions in the United States and used to inform federal
education policy. With a strong charter sector and large number of alternative teacher
certification programs, Texas is representative of what many other parts of the country
could look like as these market-based reforms continue to expand and is therefore an
important policy context in which to conduct research on education reform.

30
Chapter 2: Sector Differences in Student’s Secondary STEM Course-taking Patterns and Post-Secondary Outcomes
INTRODUCTION
Charter schools are publicly funded schools that typically operate outside the
domain of their local districts. Proponents maintain that independence from public school
districts frees charter schools from bureaucratic regulations that limit schools’ abilities to
develop unique and innovative instructional models that meet students’ needs. As the
argument goes, charter schools’ independence from local districts affords them
opportunities to develop innovative educational paradigms within an otherwise stagnant
educational system that is slow to change (Bierlein & Mulholland, 1994; Budde, 1988;
Friedman, 2002). In recent decades, influential policy documents and media portrayals
have contributed to popular support for charter schools by positioning them as schools that
better serve socioeconomically disadvantaged students from historically marginalized
ethnic populations and ultimately bridge achievement gaps that have persisted between
disadvantaged students and their more advantaged peers (Goals 2000, 1994; Guggenheim,
2010; U.S. Department of Education, 2009). With broad popular and political support, the
number of charter schools and the number of students enrolling in them have grown
substantially since they first emerged in the early 1990’s (NAPCS, 2018).
Due to the growth of charter schools, and the premises under which this growth has
occurred, researchers have investigated the degree to which charter schools have impacted
student outcomes, with results suggesting charter school impacts depend on context. In
general, studies indicate that the effects of attending a charter school are positive for
socioeconomically disadvantaged students living in urban settings, but that charter schools
serving privileged student populations in other settings are associated decreases in
students’ scores on standardized exams (M. A. Clark et al., 2015; Gleason et al., 2010;

31
Tuttle et al., 2012). Another line of research suggests that the practices employed in no
excuses4 charter schools—specifically, extended instructional time, data-driven
instruction, a rigid focus on test preparation, and strict behavioral standards—explain why
these schools, which are typically located in urban settings and often serve
socioeconomically disadvantaged student populations from historically marginalized
ethnic minority populations, are more effective than non-charter schools at improving
student outcomes, typically using performance on standardized exams as a proxy for
student achievement (Curto & Fryer, 2014; Dobbie & Fryer, 2011, 2013, 2016).
One limitation of existing studies that have investigated differential student
achievement by school sector (i.e., charter and non-charter public schools) is their
predominant use of student performance on standardized exams as the outcome variable of
interest instead of other student outcomes. That no excuses charter schools increase student
performance on standardized exams to a greater extent than non-charter public schools is
not altogether surprising given that no excuses charter schools often focus explicitly on
preparing students for standardized exams.5 For researchers and policy makers to have a
4 This subset of charter schools is typified by a “no excuses” approach to promoting student achievement. Working primarily with socioeconomically disadvantaged student populations, no excuses charter schools have high academic and behavioral standards and extended instructional time to promote student achievement. Some of the better-known charter school networks, such as KIPP and IDEA, adhere to this no excuses paradigm. 5 Parenthetically, I reference my experience as a middle and high school science teacher at a no excuses public charter school in Washington, D.C. to illustrate the ways in which a rigid emphasis on student performance on high-stakes standardized exams manifested in instructional programming. Given that high-stakes assessments were administered in English language arts (ELA) and mathematics for all 6th, 7th, and 8th grade students, middle school students had more coursework in these two subjects than in any other subjects. During one particular academic year, students had four times more instructional time allocated for ELA and mathematics than instructional time allocated for science and social studies. As a science teacher, I found this organization of instruction problematic, as it limited students’ access to subjects in which they could meaningfully apply what they learned in ELA and mathematics to instead focus on practicing rote skills that would improve their performance on standardized tests. In addition to allocating more instructional time for high-stakes subjects, the school also contracted with a company to administer practice standardized exams in ELA and mathematics periodically throughout the year. The motivation for these practice standardized exams was twofold. First, it gave students additional exposure to standardized exams; and second, these exams served to help teachers identify areas in which students needed extra support in

32
more well-rounded understanding of how charter schools affect student achievement, it is
important for scholars to consider other indicators of student success. Toward that end,
researchers have recently conducted studies investigating the effects of charter schools
upon student enrollment in college (Davis & Heller, 2019; Dobbie & Fryer, 2016; Martinez
et al., 2019; Place et al., 2019; Spees, 2019). As with student performance on standardized
exams, students graduating from no excuses charter schools typically enroll in post-
secondary institutions at higher rates than students from other schools.
The effects of no excuses charter schools upon students’ post-secondary and labor
market outcomes are nuanced, however. Despite the fact that graduates from no excuses
charter schools have higher rates of college enrollment, Dobbie and Fryer (2016) find that
labor market outcomes, as determined by students’ average earnings, do not differ by
sector. This nuance is at odds with the narratives championed by charter schools and charter
school advocates. For example, IDEA public schools, a network of no excuses charter
schools operating primarily in Texas, advertises that 100% of its graduates have been
accepted to college since IDEA graduated its first class in 2007 (IDEA Results, n.d.). The
“results” webpage for the Knowledge Is Power Program (KIPP), a no excuses charter
network operating nationally, similarly advertises a high college acceptance rate as
evidence of its success (KIPP Results, n.d.). KIPP reports that 80% of its graduates enroll
in college and 35% complete college in four years, whereas the national college enrollment
and 4-year graduation rates are 66% and 37%, respectively. That KIPP graduates enroll in
college at a higher rate than the national average, yet have a 4-year college completion rate
that is comparable to the national average brings into question the nature of the post-
secondary outcomes achieved in charter schools, as does the finding that no excuses charter
ELA and mathematics. After analyzing results from these exams, instruction would then be targeted such to give students extra practice in specific areas of need.

33
school graduates’ high rate of college enrollment does not transfer to labor market
outcomes.6 Given the discrepant impacts of charter schools on various student outcomes
beyond performance on standardized exams, it is important for research to investigate these
discrepancies attending to the mechanisms that may be responsible for them.
While it is important for researchers to examine student outcomes other than
standardized test performance, the call to do so with attention to the conditions within
charter and non-charter schools that may be responsible for discrepant student outcomes
underscores another limitation of extant literature on charter school impacts. Specifically,
a wealth of literature exists identifying sector differences in student achievement, but most
of this research has not sought to explore the reasons for these differences by investigating
the practices within charter and non-charter schools that are potentially responsible for
differential student outcomes (Berends et al., 2010; Berends & Donaldson, 2016; Preston
et al., 2012). In light of this gap, Berends and Donaldson (2016) explored tracking in
charter and non-charter schools to investigate whether different tracking practices
explained differences in charter and non-charter student performance on mathematics
6 Once again, I draw upon my experience as a science teacher at a “no-excuses” charter school in an effort to contextualize the difference between charter school students’ college enrollment and college completion rates. Like KIPP, the school at which I worked billed itself as college-preparatory and boasted the statistic that more than 90% of its graduates enrolled in college. The college completion rate, however, was much lower (the exact value was shared at a professional development in-service I attended while working there, but I could not find this number when looking online). While I cannot pinpoint an exact reason for this disparity, plausible explanations come to mind. The emphasis on standardized-test performance over academic enrichment and rigor could mean that students did not develop the skills and aptitudes they needed for success at institutions of higher education. Therefore, while my school was able to leverage connections with institutes of higher education, thus providing pathways to college for students, the academic program offered to students did not prepare them to succeed at college. Another concern I had was the low retention of students. The charter school at which I worked served students in grades 6 to 12. Each year, between 90 and 100 new 6th grade students would enroll; however, the typical graduating class was fewer than 20 students. Therefore, the set of students graduating from the school and subsequently enrolling in college was a small subset of the students who originally began their studies at the school. This made me wonder whether the high college enrollment rate of our graduates was truly a result of the academic programming or instead an artifact of retaining students who were likely to enroll in college anyway.

34
exams. They found that although charter schools typically have higher percentages of
socioeconomically disadvantaged students in higher tracks, this instructional organization
does not translate to differences in math performance on standardized exams. Thus, these
authors argue the instructional conditions in charter and non-charter schools are more alike
than they are different.
In a prior study analyzing public education data in Texas, I extended upon the work
from Berends and Donaldson (2016) by identifying differences in STEM course-offerings
and course-taking patterns between charter and non-charter public schools (David, 2018;
David et al., 2020). Results indicate that Texas charter schools are less likely than non-
charter public schools to offer curricula tailored for students eligible for special education
(SPED) services. Additionally, results suggest that relative to a STEM course-taking
pattern identified as college preparatory, in which students take core STEM courses early
in their high school trajectories and either elective or advanced courses later, charter school
students are more likely to enroll in course-taking patterns in which they take more
advanced courses (e.g., several AP STEM courses) or to enroll in course-taking patterns
identified as basic (e.g., few advanced STEM courses). Given these results, I argue that
charter schools in Texas cater to niche interests, whereas non-charter schools follow a
mandate to serve all students.
In the present study, I draw upon results from prior work using students’ secondary
STEM course-taking patterns and charter school enrollment to predict their post-secondary
achievement. Specifically, I address the following research questions:
1. Do secondary STEM course-taking patterns affect the probability of enrolling in
college and do the effects of secondary STEM course-taking patterns differ by
school sector?

35
2. Do students enrolled in different sets of secondary STEM course-taking patterns
enroll in different kinds of post-secondary institutions (e.g., community college, 4-
year public universities, or 4-year private universities)? Are these relationships
affected by charter school enrollment?
3. How does the probability of obtaining a post-secondary degree in 4 years depend
upon students’ charter school enrollment and secondary STEM course-taking
patterns? Does this relationship change for different kinds of post-secondary
degrees (e.g., certificate, associate degree, bachelor’s degree)? Do these
relationships hold when considering the probability of students earning a post-
secondary degree in a STEM discipline?
By addressing these research questions, I aim to provide insight into how sector
differences in academic programming and instructional design contribute to differential
student outcomes. However, to investigate sector differences in student outcomes, I argue
it is important to move beyond examining sector differences in standardized exam scores
and instead to investigate outcomes that are more meaningful for students. In addition,
looking specifically at students’ post-secondary outcomes provides insight into the degree
to which charter and non-charter public schools are equipping students for success beyond
the secondary level, whereas looking at students’ scores on high-stakes standardized exams
serves as a proxy for learning gains students obtain in high school. While I do not argue
that student performance on standardized assessments is a trivial outcome, I maintain that
one goal of public education is to equip students for success—broadly defined—beyond
the confines of secondary education, be that civic participation, the capacity to pursue
higher education, or a strong foundation upon which students can pursue their personal,
professional, and academic interests. Therefore, in the school choice debate, it is necessary
to consider these outcomes for policy makers and researchers to have a well-rounded idea

36
of how the introduction of market-based principles to the public education system has
affected student achievement and well-being writ large.
LITERATURE REVIEW
The literature germane to this study can be organized into two general strands. The
first strand includes research investigating the effects of charter schools upon various post-
secondary outcomes, including college enrollment, degree attainment, and labor-market
participation. The second set of research explores how sector differences in instructional
programming influence student outcomes. The research questions I pursue within this
study are located at the intersection of these strands.
Charter Schools and Post-Secondary Outcomes
Comprehensive reviews on the relatively nascent research investigating post-
secondary outcomes of charter school graduates reveals that findings are mixed (Cheng et
al., 2017; Spees, 2019). One early study on the effects of charter schools upon post-
secondary and other medium-term outcomes (“medium-term” refers to metrics measured
shortly after high-school graduation) draws upon data from Promise Academy, a no
excuses charter school located in the Harlem Children’s Zone. From their analyses, Dobbie
and Fryer (2015) report that students selected by randomized lottery to attend Promise
Academy were more likely to graduate from high school and to enroll in college than
students who were not admitted. In addition, they find that attending Promise Academy is
associated with other positive outcomes, such as decreased incidences of incarceration and
pregnancy. Dobbie and Fryer (2015) argue that their study contributes evidence to support
the hypothesis that high-quality schools improve student achievement on tests and that
improved student achievement on standardized tests is causally related to other longer-term

37
outcomes. In their study, however, the authors do not evaluate the effects of enrolling in
Promise Academy upon graduation from college, nor do they more substantively evaluate
aspects of students’ post-secondary academic trajectories, such as level of degree pursued
or college major. The authors express optimism at the potential for high-quality, no excuses
charter schools to yield positive outcomes for historically marginalized student
populations, although they also discuss the need for additional research on the topic with
analyses including broader sets of schools.
In a study following their 2015 analysis of Promise Academy, Dobbie and Fryer
(2016) analyze data from Texas to investigate the effects of charter schools upon a variety
of student outcomes. They find that charter schools, on average, do not have a statistically
significant effect on students’ standardized test score gains, a finding that has also been
replicated in analyses of charter schools in other parts of the country (M. A. Clark et al.,
2015; Gleason et al., 2010; Tuttle et al., 2012). Despite the fact that there is no average
effect of charter schools on student test score gains, Dobbie and Fryer (2016) report no
excuses charter schools in Texas increase students’ scores on standardized exams, which
is consistent with the results from studies on no excuses charter schools in New York City
(Dobbie & Fryer, 2011, 2013) and Washington, D.C. (Curto & Fryer, 2014). In addition to
improving student test scores on standardized assessments, students enrolled in no excuses
charter schools in Texas were found to graduate with higher rates and enroll in 4-year
colleges at higher rates than students enrolled non-charter public schools and charter
schools that were not no excuses (Dobbie & Fryer, 2016). Dobbie and Fryer do not evaluate
the effect of charter schools upon degree attainment in their study; however, results suggest
there are no sector differences in labor market outcomes as measured by graduates’
ultimate earnings (Dobbie & Fryer, 2016). As such, the effects of charter schools on short-
and medium-term outcomes (test score gains and college enrollment, respectively, for

38
example) do not translate to longer-term outcomes like earnings, necessitating that
researchers and policy-makers temper some of the enthusiasm for charter schools that are
highly-effective at improving these specific student outcomes.
To estimate the causal effects of charter middle schools upon students’ test score
gains, a set of several studies analyzed data from a nationally representative set of over-
subscribed charter middle schools and took advantage of the randomized lottery admissions
process (M. A. Clark et al., 2015; Gleason et al., 2010; Tuttle et al., 2012). Using data from
the same set of schools, Place et al. (2019) explore how attending a middle charter school
affected students’ college enrollment and degree attainment. Their results indicated that
charter school attendance did not have any statistically significant effects upon the
likelihood of students either enrolling in college or obtaining a degree (associate,
bachelor’s, or certificate) by the conclusion of the study period. Moreover, these trends
were independent of a charter school’s demonstrated ability to improve student
performance on standardized exams. That charter schools effective at improving student
performance on standardized exams do not have any appreciable impact upon longer-term
student outcomes, such as college enrollment and degree attainment, is consistent with the
disparities in charter schools’ effectiveness in improving student performance on exams
without affecting students’ labor market outcomes reported in Dobbie and Fryer (2016).
In contrast to results that suggest the positive effects of charter schools upon student
outcomes on standardized exams do not translate to longer-term outcomes (Dobbie &
Fryer, 2016; Place et al., 2019), results from an analysis of Florida charter schools suggests
that students who attended a charter school were more likely to persist through college and
to have higher earnings by their mid-20’s than comparable students in non-charter schools.
A separate analysis of the Noble Charter network in Chicago suggested that the benefits of
enrolling in this charter network extended beyond increases in standardized exam

39
performance (Davis & Heller, 2019). Graduates from Noble Street College Prep were
found to have higher rates of college enrollment and persistence, and graduates from other
schools in the Noble Charter network were also found to have higher rates of college
enrollment than graduates from comparable schools. Gwynne and Moore (2017) also
analyze post-secondary outcomes of charter school graduates from Chicago public schools,
with results suggesting that charter schools were responsible for increased college
enrollment and persistence among high school graduates. However, when compared to
other students enrolled in college, charter school graduates did not have statistically
significant differences in their persistence.
In a study estimating the causal effects of Boston charter schools upon students’
post-secondary outcomes, Angrist and colleagues (2016) report that although charter
schools do not improve graduates’ rates of college enrollment, charter school graduates are
more likely to enroll in 4-year institutions as opposed to 2-year institutions. In addition,
charter schools positively affect student performance on the SAT and rate of taking
Advanced Placement (AP) exams, suggesting that these charter schools are better at
preparing students for college. Similar findings come from a separate study of charter
schools in Los Angeles that found charter school students outperformed students in non-
charter public schools on metrics of college readiness, including performance on AP exams
(Adzima, 2017).
Instructional Conditions in Charter Schools
Charter school researchers investigating sector differences in student outcomes—
from student performance on standardized exams to college enrollment and persistence—
have focused largely on identifying the direction and magnitude of sector differences but
have not paid much attention to the reasons for these differences. Several scholars have

40
underscored the need for charter school researchers to move beyond a general fixation on
differential outcomes by sector and instead focus their efforts on investigating the
mechanisms and underlying conditions within charter and non-charter public schools that
may explain these differences. Extant research has investigated how staffing differences
(Cannata & Penaloza, 2012; Carruthers, 2012) and differences in instructional organization
(Berends et al., 2010; Berends & Donaldson, 2016; David, 2018) explain sector differences
in student outcomes.
In their study investigating how sector differences in instructional organization
impact student performance on mathematics exams, Berends and Donaldson (2016) find
that socioeconomically disadvantaged students from underrepresented ethnic minority
populations at charter schools are more likely than their peers in non-charter public schools
to enroll in advanced tracks. Despite this difference, however, enrolling in a more advanced
academic track at a charter school is not associated with statistically significantly different
gains in math achievement than enrolling in a similar track at a non-charter public school.
Given these findings, Berends and Donaldson (2016) argue that the instructional conditions
in charter schools are not substantively different than those in non-charter schools, as gains
related to academic tracks are similar between the two sectors.
In a prior study extending upon the work of Berends and Donaldson (2016), I
analyzed secondary STEM course-offerings and course-taking patterns in Texas charter
and non-charter public schools (David, 2018; David et al., 2020). I found that charter
schools were less likely than non-charter schools to offer STEM courses tailored
specifically for students who qualify for special education services. In addition, students in
non-charter public schools were more likely to enroll in STEM-course sequences in which
they took core STEM courses in the early stages of high school and either elective or
advanced courses (such as Advanced Placement and International Baccalaureate courses)

41
in their final years of high school. By contrast, students in charter schools were more likely
than non-charter school students to enroll in sets of courses that were more basic, consisting
of core courses with few electives, or more advanced, consisting of a higher average
number of upper-level STEM courses. While these results point to important differences
in the instructional organization of STEM coursework in charter and non-charter schools,
it is also important evaluate how these differences impact student outcomes.
As Dobbie and Fryer (2016) posit, one plausible explanation for the fact that no
excuses charter schools are effective at improving standardized test scores and college
enrollment without appreciably affecting longer-term outcomes (earnings) is that these
schools have found ways to improve students’ test-taking abilities at the expense of
enhancing students’ skills and aptitudes in other areas that are important for success in the
labor market. Drawing from prior results on STEM course-offerings and students’ STEM
course-taking patterns in charter and non-charter schools provides a potentially fruitful way
to explore this hypothesis. Specifically, if students enrolled in comparable sets of courses
from charter and non-charter schools have different post-secondary outcomes, this may
suggest that the broader benefits afforded to students by virtue of engaging in a curricular
set are not the same across sector, thus affecting students’ engagement and persistence at
the post-secondary level. The goals of this study align with the broader mandate to identify
the mechanisms within charter and non-charter schools that are responsible for differential
outcomes by examining whether or not course-taking in charter and non-charter public
schools is related to students’ post-secondary outcomes.
DATA AND SAMPLE
To investigate how students’ STEM course-taking patterns in charter and non-
charter public schools impact their post-secondary outcomes, this study analyzes

42
administrative data available through the Texas Education Research Center (ERC). The
Texas ERC has student- and teacher- level data for all public schools in Texas from 1993
onward. Specifically, data available in the ERC include demographic, certification, and
employment data for all public school teachers in Texas; demographic, enrollment, and
accountability data for public school students in Texas; and organizational data at the
district and campus levels for all public education institutions. In addition, the ERC
maintains post-secondary data for all students who graduate from Texas public secondary
schools and for any students enrolled in a Texas institution of higher education, including
4-year public and private universities and community colleges. Post-secondary data
include information on students’ enrollment, major, performance, and graduation.
In order to characterize students’ course-taking patterns, a cohort of students
starting the 9th grade for the first time in the 2011-2012 school year is followed over four
consecutive years (to the 2014-2015 school year) because this is the typical amount of time
it takes for students to complete high school in the United States. ERC data include unique
course identifiers that indicate the subjects of the courses in which students are enrolled
(e.g., physics, algebra I). Student demographic, attendance, and exit data are merged onto
their course enrollment data over the duration of the four-year period.
Course enrollment and demographic data are subsequently merged onto graduation
data for students who graduate from high school in the 2014-2015 school year. Not all
students starting in the 9th grade in the 2011-2012 school year graduate in four years.
However, by restricting the data set to students for whom it is possible to track their entire
secondary course-taking and who then graduate at the end of the four year period during
which course-taking data are collected makes it possible to analyze how these course-
taking patterns relate to post-secondary outcomes. The post-secondary outcomes of
students who took either more or less time to complete high school may be affected by

43
unique factors that do not reflect their course-taking patterns at the high school level. For
example, it is possible that a student who completed high school in five, rather than four,
years may have received support during that additional year that would affect that students’
post-secondary enrollment and persistence.
At the secondary level, students may transfer between schools, and thus their
course-taking is distributed over multiple campuses. When students transfer between
schools, a dummy course indicator is added to the course enrollment data set to indicate
whether or not that student transferred from or to a given campus and the year in which
that transfer occurred. A student’s time at a given campus is weighted by 0.25 for each year
spent at that campus, and if a student attends two or more campuses in a given year, the
yearly weight is divided evenly among those campuses.
At the post-secondary level, binary indicators are generated to indicate whether or
not a student enrolled in a post-secondary institution in the year following high school
graduation, earned a post-secondary degree within 4 years of high school graduation, and
earned a post-secondary degree in STEM within 4 years of high school graduation. In
addition to binary indicators, there are also categorical variables for post-secondary
institution type (e.g., private four year, public four year, community college, or out of state
university), degree type/status at 4 years (e.g., bachelor’s, associate, certificate, dropped-
out, or continued enrollment without a degree), and STEM degree type/status at 4 years
(with an extra category indicating that students earned a non-STEM post-secondary
degree).
In addition to restricting the data set to students starting the 9th grade in 2011 and
graduating from high school in 2015, students who exit a school for reasons other than
transfer or dropping out (e.g., such as moving to another state, where continued course-
taking patterns are no longer available in the data set) and students enrolled in schools

44
specifically tailored for students facing criminal disciplinary action are removed from the
data set. Including students with atypical reasons for exiting the school system could
potentially bias results, as these students were not observed during a period in which they
had a potential to enroll in four years of secondary STEM courses. Students enrolled in
disciplinary alternative education programs are often facing criminal charges and therefore
do not have the same access to same sets of courses as students in other schools. These
schools are characteristically not schools of choice and should therefore not be included in
a study exploring the effects of school choice upon students’ post-secondary attainment.
ANALYTIC METHODS
Analysis proceeds in two stages. First, STEM course-taking patterns are identified
through social network analysis and community detection, following the same procedure I
used to identify sector differences in course-offerings and course-taking patterns in prior
work (David, 2018; David et al., 2020). Students’ secondary STEM course-taking patterns
are then used as predictor variables in a set of logistic and multinomial logistic models that
predict how enrolling in specific sets of courses in a charter or non-charter public school
either increase or decrease the probability of a student achieving various post-secondary
outcomes.
Identifying Course-taking Patterns through Social Network Analysis
Social network analysis and community detection are used to identify prominent
STEM course-taking patterns over the four years following students’ initial enrollment in
the 9th grade. In contrast to descriptive statistics that show how certain characteristics are
distributed among a population of interest, social network analysis allows researchers to
evaluate the relationships between actors in the population of interest (Borgatti & Ofem,

45
2010; Carolan, 2014). Sociograms are tools with which it is possible to visualize and
analyze the relationships between actors in a network. A sociogram consists of nodes,
which are used to represent individual agents (such as schools or teachers), and edges exist
between two nodes if they share a common attribute or have some other commonality, like
membership in the same friend group.
Networks in which students are represented by nodes and edges between them
represent that two students are enrolled in the same STEM course in the same year are used
to identify STEM course-taking patterns in Texas charter and non-charter public schools.
Since certain groups of students are often in several STEM courses together throughout the
duration of high school, edges between nodes are weighted by the number of courses in
which two individual students are commonly enrolled. To identify groups of students that
are closely related due to their mutual enrollment in a high number of STEM courses, a
community detection algorithm is applied to the network such to maximize the modularity
of the network. Modularity quantifies the difference between the fraction of edges in a
network that fall within that network’s community structure and the expected fraction of
networks that would fall within that community structure had the same number edges
between nodes been randomly assigned.
Mathematically, modularity, Q, is given by Equation (1):
𝑄 =12𝑚
&'𝐴!" −𝑘!𝑘"2𝑚
+𝛿-𝑐! , 𝑐"0!"
(1)
In Equation (1), Aij gives the weight of the edge connecting nodes i and j, ki represents the
sum of the weights of the edges connected to node i, m is equal to #$∑ 𝑘!𝑘"!" and gives the
sum of the edge weights in the entire graph, and 𝛿-𝑐! , 𝑐"0 is Kronecker’s delta function,
which is equal to one when ci and cj are equal (indicating that nodes i and j belong to the

46
same community) and zero otherwise. When the modularity of a network is maximized,
the optimal underlying community structure has been identified.
A community within a network is defined as a set of nodes that are densely
connected to one another, but loosely connected to nodes outside of the network (Clauset
et al., 2004; Fortunato, 2010; Newman, 2006; Newman & Girvan, 2004). Networks of
students are constructed at the campus level, and communities represent groups of students
within each campus enrolled in similar sets of STEM courses. Within each of the
approximately 1,500 campuses included in this study, it is possible for students to belong
to one of several communities. The sets of courses connecting different groups of students
within a school comprise the different course-taking patterns available in that school. To
differentiate these course-taking patterns, k-means clustering is used. In the k-means
clustering algorithm, N data points with a vector of attributes, xi(j), are partitioned into k
groups such that the within group sum of squares of each group, j, is minimized
(MacQueen, 1967). Mathematically, this is done by minimizing the objective function, J,
given by Equation (2):
𝐽 =&&6𝑥!(") − 𝑐"6
$'
!(#
)
"(#
(2)
As with prior analyses (David, 2018; David et al., 2020), k is set to 6 due to
parameters of the system, meaning the communities identified across the set of schools
analyzed in this study are categorized into six distinct groups based upon the similarity of
the attributes of the groups (e.g., average number of STEM course completed, average
percentage of students enrolling in advanced coursework, average percentage of students
transferring, etc.).

47
Following conventions set forth in David (2018) and David et al. (2020), the six
categories of course sets are: advanced, basic, college preparatory, exit, SPED, and
transitional. The most common set of STEM courses is the college preparatory set, in
which students enroll in several core STEM courses in the beginning half of high school
and subsequently enroll in either elective or advanced STEM courses toward the end of
high school. The percentage of students taking advanced courses in the advanced course
set is higher than the number of students doing so in the college preparatory set, and
students enrolled in a basic course set typically take the core STEM courses followed by
few non-advanced electives. The SPED course set is characterized by the high percentage
of students enrolled in STEM courses tailored for students who qualify for special
education. In both the exit and transitional course sets, high percentages of students transfer
from one school to another; however, the exit course set is characterized by the highest
proportion of students dropping out of high school.
Statistical Analysis to Determine the Probability of Post-Secondary Outcomes
The post-secondary outcomes of interest are either binary or categorical, so logistic
and multinomial regression models are constructed to analyze how course-taking in charter
and non-charter public schools influences the probabilities of students achieving these
outcomes. There are two primary binary outcomes of interest: a) whether or not high school
graduates enroll in college within one year of high school graduation; and, b) whether or
not high school graduates earn a degree within four years of their high school graduation.
The logistic models specified to analyze each of these binomial outcomes are given by
Equations (3) and (4), respectively:
𝑙𝑜𝑔 =𝑝!
1 − 𝑝!? = 𝛽*𝐶! + 𝛽+𝐶𝑟𝑠! + 𝛽,'-𝐶𝑟𝑠!𝐶! + 𝛽.𝑿𝒊 + 𝐶𝑎𝑚𝑝"[!] (3)

48
In Equation (3), pi is the probability that student i enrolls in college within one year
of graduation, Ci is a binary variable indicating whether or not student i attended a charter
school, Crsi is a categorical variable indicating the STEM course-taking pattern in which
student i enrolled, Xi is a vector of demographic characteristics (including race, gender,
eligibility for free and reduced lunch as a proxy for economic disadvantage, designation as
Limited English Proficient (LEP), gifted, or SPED), and Campj[i] represents a categorical
variable for campus j in which student i was enrolled. Campus effects are included in order
to compare students within campuses, and specifications of models include the campus
term included both as fixed effects and a random effects terms.
Equation (4) is specified to predict the probability of students earning a degree
within four years of their high school graduation. It is nearly identical to Equation (3);
however, this model includes a variable for the type of post-secondary institution that
student i attended (represented by Ii) and a flag to indicate whether or not student i
graduated from the same institution in which he or she initially enrolled, Mi:
𝑙𝑜𝑔 =𝑝!
1 − 𝑝!? = 𝛽*𝐶! + 𝛽+𝐶𝑟𝑠! + 𝛽,'-𝐶𝑟𝑠!𝐶! + 𝛽,𝐼! + 𝛽2𝑀! + 𝛽.𝑿𝒊 + 𝐶𝑎𝑚𝑝"[!] (4)
In addition to modeling how enrolling in certain sets of STEM courses at charter
and non-charter public schools in Texas are related to the probabilities of enrolling in post-
secondary institutions and earning a post-secondary degree within 4 years, it is also of
interest to investigate how STEM course-taking in Texas charter and non-charter public
schools influences the probabilities of students enrolling in certain kinds of post-secondary
institutions (e.g., community college, public 4-year universities, or private 4-year
universities) and earning certain kinds of post-secondary degrees (e.g., certificate, associate
degree, or bachelor’s degree). Multinomial regression models specified by Equations (5)
and (6) are used to investigate these questions:

49
𝑙𝑜𝑔 K𝑝!3
𝑝!456L = 𝛽*𝐶! + 𝛽+𝐶𝑟𝑠! + 𝛽,'-𝐶𝑟𝑠!𝐶! + 𝛽.𝑿𝒊 + 𝐶𝑎𝑚𝑝"[!] (5)
In Equation (5), pia gives the probability of student i enrolling in an institution of
higher education of type a (where a indicates private 4-year university, public 4-year
university, community college, or an out-of-state university). piref is the reference and is
taken to be the probability of a student not enrolling in any post-secondary institution. The
predictor variables in Equation (5) are identical to those specified in Equation (3).
As with the logistic models, a separate multinomial specification is constructed to
evaluate the probability of earning different kinds of post-secondary degrees, as described
by Equation (6). This model is employed to evaluate the kinds (e.g., bachelor’s or
associate) of post-secondary degrees students earn in general and in STEM disciplines.
𝑙𝑜𝑔 K𝑝!3
𝑝!456L = 𝛽*𝐶! + 𝛽+𝐶𝑟𝑠! + 𝛽,'-𝐶𝑟𝑠!𝐶! + 𝛽,𝐼! + 𝛽2𝑀! + 𝛽.𝑿𝒊 + 𝐶𝑎𝑚𝑝"[!] (6)
Here, pia gives the probability of student i having status a four years after
graduating from high school, where a indicates a student earned a bachelor’s degree,
associate degree, post-secondary certificate, or is still enrolled in an institution of higher
education. In the model specified for STEM degrees, a indicates a STEM bachelor’s
degree, STEM associate degree, STEM certificate, non-STEM degree, or continued
enrollment in an institution of higher education. In both models, piref is the reference
category representing the probability that a student is no longer enrolled in a post-
secondary institution and has not earned a post-secondary degree by the 4th year following
high school graduation. In addition, the multinomial models for post-secondary degree
attainment include a binomial variable indicating whether or not student i graduated from

50
the same institution type in which he or she first enrolled, Mi, and a categorical variable
representing the type of institution from which the student earned a degree, Ii.
Three separate specifications of the multinomial logistic regression models given
by Equations (5) and (6) are run, one with fixed campus effects, another with random
campus effects, and a third with no campus effects. Running three different variants was
primarily exploratory, and random effects models provide the most reliable estimates and
are therefore described in the results section.
Model specifications with campus effects are run using the Begg and Gray
approximation (Begg & Gray, 1984), in which individual logistic models are computed for
each contrast. Estimating models using the Begg and Gray approximation circumvents the
computational difficulty of estimating a single multinomial model with campus level
effects included. Since multinomial regression models use the Begg and Gray
approximation, sub-setting the original data set for each contrast results in fewer
observations being analyzed for each model. Moreover, relatively few students who enroll
in the exit, transitional, and SPED secondary STEM course sets achieve the post-secondary
outcomes of interest. Thus, to include these students in models and investigate the
statistical effect of their course-taking pattern upon post-secondary outcomes, these three
sets of secondary STEM course taking patterns are collapsed into one category (labeled
other in multinomial output).
RESULTS
The first set of models predicts the likelihood of a student enrolling in a post-
secondary institution as a function of that student’s enrollment in a charter school,
secondary STEM course-taking pattern, the interaction of these two variables, and
demographic covariates. Two specifications of the logistic model given by Equation (3)

51
are run, one including fixed campus effects and the other including random campus effects.
The coefficients for these models are provided in Table 1, and a Sankey diagram giving
the proportion of students from charter and non-charter schools enrolling in post-secondary
institutions disaggregated by high school course-taking pattern is provided in Figure 1.
Figure 1. Sankey diagram giving the proportion of students enrolling in post-secondary institutions by secondary STEM courses and sector.
Exponentiating the coefficients in Table 1 gives the associated change in the odds
of a student enrolling in a post-secondary institution relative to not enrolling in any. For

52
example, the random effects model indicates that, compared to students attending a non-
charter public schools, attending a charter school is associated with 22% increase in the
likelihood of a student enrolling in a post-secondary institution within one year of his or
her graduation from high school as opposed to not enrolling at all. According to the fixed
effects model, a charter school student enrolling in a basic set of STEM courses has 58%
higher odds of enrolling in a post-secondary institution within one year of graduating from
high school as opposed to not enrolling at all than a student enrolling in a basic set of STEM
courses at a non-charter public school.
Table 1. Coefficients from models predicting the likelihood of a student enrolling in a post-secondary institution within one year of graduating from high school.
Fixed Campus Effects Random Campus Effects Coefficients Est SE Sig Est SE Sig
Intercept 0.4 -0.37 0.65 -0.02 *** Charter 0.54 -0.94 0.20 -0.09 *
Adv. Courses 0.37 -0.01 *** 0.36 -0.01 *** Basic Courses -0.61 -0.02 *** -0.6 -0.02 ***
Exit Courses -1.31 -0.14 *** -2.15 -0.23 *** SPED Courses -1.76 -0.26 *** -1.89 -0.29 *** Trans, Courses -0.54 -0.04 *** -0.71 -0.06 ***
Charter, Adv. -0.08 -0.14 0.18 -0.11 Charter, Basic 0.46 -0.15 ** 0.04 -0.13
Charter, Exit 1.27 -0.6 * 0.61 -1.92 Charter, Trans. 0.08 -0.17 -0.41 -0.24 .
Asian 0.37 -0.03 *** 0.36 -0.03 *** Black 0.38 -0.02 *** 0.35 -0.02 ***
Latinx -0.17 -0.01 *** -0.17 -0.01 *** Female 0.41 -0.01 *** 0.42 -0.01 ***
Econ. Dis. -0.7 -0.01 *** -0.71 -0.01 *** Gifted 0.69 -0.02 *** 0.69 -0.02 ***
LEP -1.18 -0.03 *** -1.22 -0.03 *** SPED -0.79 -0.02 *** -0.77 -0.02 ***
*** p < 0.01; ** p < 0.01, * p < 0.05, . p < 0.10
Of note, the charter school effect is not statistically significant in the fixed effects
model but only in the random effects model. The coefficients for enrolling in advanced and
basic courses have similar magnitudes in both models; however, the coefficients for
enrolling in SPED courses or course sets associated with exit or transition increase in

53
magnitude in the random effects model. The coefficients for course-taking patterns are all
significant, but their interaction with school type are only significant for the basic and exit
course sets in the fixed effects model.
Table 2. Coefficients from model predicting the log odds of a student earning a post-secondary degree or certificate within 4-years of high school graduation.
Coefficients Est SE Sig Intercept -1.12 0.02 ***
Charter -0.08 0.1 Adv. Courses 0.27 0.02 *** Basic Courses -0.4 0.02 ***
Exit Courses -0.22 0.28 SPED Courses -0.29 0.61 Trans, Courses -0.75 0.07 ***
Charter, Adv. -0.34 0.13 ** Charter, Basic 0.22 0.17
Charter, Exit 1.48 0.84 . Charter, Trans. 0.74 0.21 ***
Asian 0.19 0.03 *** Black -0.64 0.02 ***
Latinx -0.18 0.02 *** Female 0.5 0.01 ***
Econ. Dis. -0.35 0.02 *** Gifted 0.45 0.02 ***
LEP -0.06 0.06 SPED -0.37 0.04 ***
Private 4-Year 0.38 0.02 *** Public 4-Year -0.07 0.01 ***
Same Inst. Type 0.84 0.01 *** *** p < 0.01; ** p < 0.01, * p < 0.05, . p < 0.10
Coefficients from the model predicting the likelihood of a student earning a post-
secondary degree within 4-years of his or her high school graduation are provided in Table
2. A Sankey diagram giving the proportion of students who either earned a degree of are
still enrolled 4-years following high-school graduation by sector, secondary STEM course
enrollment, and post-secondary institution type is provide in Figure 2. For this model and
all subsequent models, only models including random effects coefficients for campus are
reported, as they provided more reliable estimates and make more sense theoretically.
Campus-level effects are not independent of other covariates, but are related to other

54
factors, such as campus wide demographic composition and school type. In addition, the
effect of a campus is unlikely to be the homogenous for all students—particularly since
several different course-taking patterns are available to students within a single campus—
so random effects coefficients are more appropriate for the models included in this study.
Figure 2. Proportion of students with continued post-secondary enrollment or degree attainment within 4-years of high school graduation by post-secondary institution type. Color represents sector and secondar STEM course taking.

55
As indicated in Table 2, attending a charter school is not associated with any
statistically significant difference in the likelihood of earning a post-secondary degree
within 4-years of high school graduation as compared to attending a non-charter school.
Statistically significant differences in the odds of earning or continuing to pursue a post-
secondary degree 4 years after high school graduation are found for students enrolling in
an advanced STEM course set (31% increase in odds), basic STEM course set (33%
decrease in odds), and transitional STEM course set (53% decrease in odds). Interestingly,
students enrolling in a private 4-year university experienced an increase in the odds of
graduating in 4 years as do students who graduate from the same type of institution in
which they originally enrolled. Students in public 4-year universities have a statistically
significant 6% decrease in the odds of earning a degree within 4-years of graduation from
high schools. Statistically significant interactions are also found: charter school students
enrolling in advanced STEM course sets are 28% less likely than non-charter public school
students enrolling in similar sets of STEM courses of earning a post-secondary degree
within 4-years. The interaction between school type and transitional sets of courses
suggests that charter school students who transition do not experience as much of a
decrease in the odds of earning a post-secondary degree within 4-years as students who
transition in or out of non-charter public schools. Finally, the model results indicate that
relative to students identifying as White, students identifying as Black and Latinx have
statistically significant lower odds of earning a post-secondary degree within 4 years and
students identifying as Asian have statistically significant higher odds of earning a post-
secondary degree within 4 years. Further, students identified as economically
disadvantaged are less likely than their economically advantaged peers to earn a post-
secondary degree within 4 years of graduating from high school.

56
To investigate sector differences in the types of post-secondary institutions in which
high school graduates enrolled, a multinomial logistic regression was constructed to
compute the relative probability of a student enrolling in a certain type of post-secondary
institution as a function of that student’s enrollment in charter schools, set of STEM
courses, and the interaction between the two. The coefficients from these multinomial
regressions are provided in Table 3. Exponentiating the coefficients gives the relative
probability of a student enrolling in the indicated type of post-secondary institution relative
to not enrolling in any post-secondary institution.
Table 3. Regression output from multinomial logistic model predicting the likelihood of high school graduates enrolling in certain types of post-secondary institutions.
Community College
Public 4-Year University
Private 4-Year University
Out-of-State Institution
Coefficients Est SE Sig Est SE Sig Est SE Sig Est SE Sig Intercept -0.07 0.02 *** -0.34 0.03 *** -2.12 0.04 *** -2.31 0.04 ***
Charter -0.07 0.11 0.28 0.13 * 0.82 0.18 *** 0.75 0.21 *** Adv. Courses 0.01 0.02 0.70 0.02 *** 0.58 0.03 *** 0.66 0.03 *** Basic Courses -0.41 0.02 *** -1.22 0.03 *** -1.02 0.05 *** -0.98 0.06 *** Other Courses -0.82 0.06 *** -1.45 0.12 *** -1.61 0.30 *** -1.47 0.32 *** Charter, Adv. 0.04 0.14 0.17 0.15 0.11 0.23 0.72 0.25 ** Charter, Basic 0.14 0.15 0.46 0.2 * 0.04 0.31 0.18 0.36 Charter, Other 0.18 0.26 -0.26 0.40 -0.76 0.89 -2.03 1.70
Asian 0.16 0.04 *** 0.62 0.03 *** -0.24 0.07 *** -0.75 0.07 *** Black 0.17 0.02 *** 0.5 0.02 *** 0.53 0.04 *** 0.55 0.04 ***
Latinx 0.02 0.01 -0.41 0.02 *** -0.37 0.03 *** -0.58 0.04 *** Female 0.35 0.01 *** 0.49 0.01 *** 0.48 0.02 *** 0.45 0.03 ***
Econ. Dis. -0.48 0.01 *** -0.95 0.02 *** -1.16 0.03 *** -1.33 0.04 *** Gifted -0.16 0.02 *** 1.16 0.02 *** 1.00 0.03 *** 0.90 0.04 ***
LEP -0.94 0.03 *** -2.51 0.08 *** -3.32 0.30 *** -2.07 0.22 *** SPED -0.42 0.02 *** -2.11 0.05 *** -1.59 0.09 *** -1.39 0.09 ***
*** p < 0.01; ** p < 0.01, * p < 0.05, . p < 0.10
A Sankey diagram, provided in Figure 3, shows the proportions of students taking
specific STEM course sets in secondary charter and non-charter schools who ultimately
enroll in different types of post-secondary institutions. Exponentiated coefficients of the
main effects (enrollment in a charter school, secondary STEM course sets, and their

57
interaction) from Table 3 are displayed in Figure 4, giving the associated change in odds
of enrolling in a particular type of post-secondary institution relative to not enrolling.
Figure 3. Sankey diagram showing the proportion of charter and non-charter school students enrolling in different types of post-secondary institutions from secondary STEM course enrollment.
As indicated in the output, charter schools are not associated with a statistically
significant difference in the probability of a student enrolling in a community college;
however, attending a charter school is associated with statistically significant increases in

58
the likelihood of a student enrolling in a public 4-year university, private 4-year university,
or out-of-state post-secondary institution. The interaction between charter schools and
enrollment in advanced STEM course sets is associated with increased odds of enrolling in
an out-of-state post-secondary institution, and the interaction between charter schools and
enrollment in basic STEM course sets is associated with an increased probability of
enrolling in a public 4-year university. All other interactions between charter schools and
course offerings are not statistically significant.
Figure 4. Change in odds of enrolling in various types of post-secondary institutions associated with charter attendance and secondary STEM course-taking.

59
Individual course-taking patterns, however, are associated with differences in the
probability of enrolling in different types of institutions, and these trends hold across all
contrasts. Enrolling in an advanced set of STEM courses is associated with increases in the
likelihood of enrolling in public and private 4-year universities in addition to out-of-state
post-secondary institutions relative to students enrolled in a college preparatory set of
STEM courses. By contrast, enrolling in basic or other sets of STEM courses are associated
with decreases in the probability of enrolling in any type of post-secondary institution
relative to students who enrolled in a college preparatory set of STEM courses.
The next multinomial logistic regression model predicts the relative probabilities
of students achieving different post-secondary outcomes 4 years following their high
school graduation (e.g., earning a certificate, associate degree, bachelor’s degree, or
continued enrollment) relative to dropping out (as determined by students who neither
earned a post-secondary degree or certificate nor continued to be enrolled 4 years after their
graduation from high school). These probabilities are modeled as a function of enrollment
in a charter school, enrollment in different STEM course sets, the interaction of these two
variables, demographic covariates, and the type of post-secondary institution in which
students first enrolled following graduation from high school. A Sankey diagram
corresponding to this model and illustrating the proportions of students achieving post-
secondary outcomes just listed after enrolling in different types of post-secondary
institutions is included in Figure 5. Flows from post-secondary institution type to post-
secondary outcome are colored according student enrollment in various STEM course-
taking patterns and enrollment in charter or non-charter schools. Results from this model
are provided in Table 4 with coefficients of the predictor variables of interest (charter
school, STEM course-taking patterns, and their interaction) exponentiated and visualized
in Figure 6, giving the relative change in odds associated with these predictor variables.

60
Figure 5. Sankey diagram showing the proportions of students from different types of post-secondary institutions achieving post-secondary outcomes. Color represents sector and secondary STEM course-taking.
Results from the multinomial logistic regression model detailed in Table 4 and
Figure 6 indicate that attending a charter schools (as compared to attending a non-charter
school) is not associated with any statistically significant difference in the likelihood of a
student earning a post-secondary degree or certificate or continuing to be enrolled in an
institute of higher education relative to dropping out. Enrolling in an advanced STEM

61
curriculum at the secondary level is associated with increased likelihoods of earning
associate and bachelor’s degrees and of continued enrollment in a post-secondary
institution 4 years following graduation from high school. Compared to secondary
enrollment in a college preparatory STEM course set, enrollment in basic or other STEM
course sets are associated with decreased probabilities of earning a degree or continued
enrollment as relative to dropping out, and enrollment in basic STEM course sets is
associated with a decreased probability of earning a post-secondary certificate.
Table 4. Results from multinomial logistic regression predicting the likelihood of students achieving different post-secondary outcomes within 4-years of their graduation from high school.
Certificate Associate Bachelor’s Still Enrolled Coefficients Est SE Sig Est SE Sig Est SE Sig Est SE Sig
Intercept -2.09 0.05 *** -1.29 0.03 *** -2.58 0.05 *** -1.49 0.03 *** Charter -0.32 0.32 0.12 0.18 -0.36 0.32 0.04 0.17
Adv. Courses 0.08 0.05 . 0.28 0.03 *** 0.37 0.04 *** 0.17 0.03 *** Basic Courses -0.32 0.06 *** -0.64 0.04 *** -0.85 0.07 *** -0.5 0.04 *** Other Courses -0.38 0.23 . -1.27 0.15 *** -1.02 0.22 *** -0.86 0.13 *** Charter, Adv. 0.17 0.40 -0.48 0.25 . -0.40 0.42 0.07 0.21 Charter, Basic 0.32 0.50 0.14 0.29 0.65 0.52 0.26 0.27 Charter, Other -0.13 1.22 0.25 0.42 1.75 0.54 ** -0.35 0.46
Asian 0.47 0.11 *** 0.57 0.07 *** 0.61 0.09 *** 0.94 0.06 *** Black -0.78 0.08 *** -0.48 0.05 *** -0.9 0.07 *** 0.07 0.04 .
Latinx -0.04 0.05 0.07 0.03 * -0.35 0.04 *** 0.06 0.03 . Female -0.06 0.04 0.44 0.02 *** 1.03 0.04 *** 0.19 0.02 ***
Econ. Dis. -0.36 0.05 *** -0.48 0.03 *** -1.11 0.05 *** -0.76 0.03 *** Gifted 0.08 0.07 0.37 0.04 *** 0.81 0.05 *** 0.1 0.04 *
LEP 0.31 0.13 * -0.21 0.10 * -0.69 0.24 ** -0.31 0.12 ** SPED 0.14 0.07 . -0.73 0.06 *** -1.76 0.19 *** -0.79 0.07 ***
Private 4-Yr -0.84 0.13 *** -0.79 0.07 *** 1.02 0.06 *** 1.21 0.04 *** Public 4-Yr -0.82 0.05 *** -1.49 0.04 *** 0.39 0.04 *** 0.38 0.03 ***
*** p < 0.01; ** p < 0.01, * p < 0.05, . p < 0.10
The interaction between charter school attendance and enrollment in an advanced
STEM course set are associated with decreased likelihoods of earning post-secondary
degrees; however, these coefficients are not statistically significant. A statistically
significant positive coefficient for the interaction between charter school attendance and
enrollment in an “other” course set is associated with increased likelihood of earning a
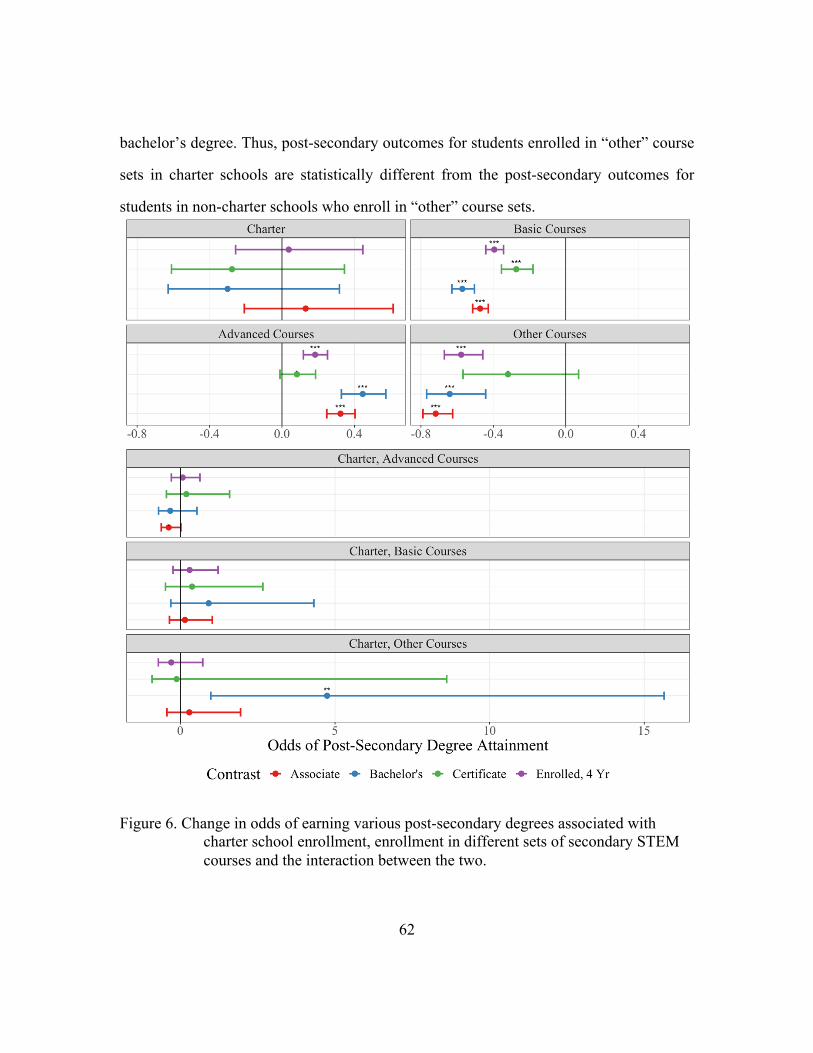
62
bachelor’s degree. Thus, post-secondary outcomes for students enrolled in “other” course
sets in charter schools are statistically different from the post-secondary outcomes for
students in non-charter schools who enroll in “other” course sets.
Figure 6. Change in odds of earning various post-secondary degrees associated with charter school enrollment, enrollment in different sets of secondary STEM courses and the interaction between the two.

63
The final multinomial logistic regression predicts the likelihood of earning different
kinds of STEM degrees within four years of graduating high school. The coefficients from
this model are provided in Table 5. As with the coefficients from the other models
constructed, exponentiating the values in Table 5 gives the change in the odds of a student
earning the indicated type of STEM degree relative to not earning any degree. The
exponentiated coefficients for charter schools and secondary STEM course-taking are
plotted in Figure 7.
Table 5. Multinomial regression output giving the probability of earning different types of post-secondary degrees in STEM disciplines relative to not earning any degree.
Non STEM
Degree STEM Certificate STEM Associate Degree
STEM Bachelor’s Degree
Coefficients Est SE Sig Est SE Sig Est SE Sig Est SE Sig Intercept -0.90 0.03 *** -4.61 0.13 *** -3.09 0.08 *** -4.78 0.11 ***
Charter -0.10 0.16 0.28 0.58 -0.87 0.74 -0.50 0.77 Adv. Courses 0.27 0.03 *** -0.04 0.11 0.24 0.07 ** 0.53 0.09 *** Basic Courses -0.58 0.04 *** -0.37 0.15 * -0.81 0.11 *** -0.77 0.18 *** Other Courses -0.77 0.10 -0.88 0.65 -4.14 1.63 * -1.23 1.14 Charter, Adv. -0.26 0.22 -1.74 1.17 -0.33 1.02 -0.41 0.97 Charter, Basic 0.30 0.25 *** -0.05 0.96 -6.17 25.1 1.33 1.13 Charter, Other 0.72 0.30 -5.42 28.6 4.26 2.04 * -1.38 8.29
Asian 0.50 0.06 -0.41 0.43 0.31 0.20 1.48 0.14 *** Black -0.65 0.04 -0.74 0.19 *** -0.78 0.13 *** -0.52 0.15 ***
Latinx -0.03 0.03 ** 0.03 0.12 -0.01 0.07 -0.22 0.09 * Female 0.54 0.02 *** 0.27 0.09 ** -0.29 0.06 *** 0.92 0.08 ***
Econ. Dis. -0.59 0.03 *** -0.17 0.12 -0.58 0.07 *** -1.03 0.10 *** Gifted 0.43 0.03 0.33 0.15 * 0.49 0.09 *** 1.13 0.09 ***
LEP -0.05 0.08 *** 0.36 0.28 0.15 0.25 -0.41 0.48 SPED -0.48 0.05 *** -0.05 0.19 -0.86 0.18 *** -1.47 0.42 ***
Private 4-Yr -0.15 0.05 *** -0.42 0.27 -0.70 0.18 *** 1.18 0.13 *** Public 4-Yr -0.76 0.03 -0.40 0.12 *** -0.91 0.08 *** 0.72 0.08 ***
*** p < 0.01; ** p < 0.01, * p < 0.05, . p < 0.10
Although enrolling in a charter school is associated with statistically significant
increases in the probability that a student enrolls in a private or public 4-year university or
an out-of-state post-secondary institution, charter schools are not associated with any
statistically significant differences in the likelihood of a student earning a STEM degree

64
within 4-years of graduating from high school. In addition, this effect is not mediated by
course-taking in STEM.
Figure 7. Change in odds of earning various types of post-secondary STEM degrees associated with charter enrollment and in secondary STEM course taking.
Individually, enrolling in an advanced STEM course set is associated with an
increased likelihood that a student earns a non-STEM, STEM associate, or STEM
bachelor’s degree relative to no degree at all. Enrolling in a basic high school set of STEM
courses, by contrast, is associated with a decreased probability that a student earns a non-

65
STEM degree, STEM certificate (such as a certificate in information technology), STEM
associate degree, or STEM bachelor’s degree relative to earning no degree at all. That
charter schools are associated with increased college enrollment, but not differences in
post-secondary outcomes other than enrollment (e.g., degree attainment) is consistent with
literature elsewhere. Possible reasons for this and implications are explored in the
discussion.
DISCUSSION
Consistent with extant literature and achievements celebrated on charter school
websites (e.g., KIPP and IDEA), charter school attendance was associated with increased
odds of a student attending a post-secondary institution following their graduation from
high school. In addition, students’ secondary STEM course-taking patterns are related to
the likelihood of pursuing post-secondary education the year following high school
graduation. Relative to a set of STEM courses categorized as college preparatory, in which
students take core STEM courses in addition to additional elective or advanced courses,
students who enroll in more advanced STEM elective courses are more likely to pursue
higher education and students enrolling in basic sets of STEM courses at the secondary
level or students in course sets characterized by high mobility or coursework tailored for
students eligible for special education services are less likely to pursue post-secondary
education.
These findings are not altogether surprising. Many charter schools—particularly
“no excuses” charters—imbue the virtues of higher education upon their students and have
a college preparatory focus. Moreover, that charter schools advertise high college
admissions figures may indicate that charter schools support students’ post-secondary
pursuits differently than non-charter schools, as this affords them a competitive edge in

66
recruiting students. This is an area that warrants additional qualitative research. In addition,
it is reasonable that students taking more rigorous coursework at the secondary level are
more likely to pursue post-secondary education. The rigor of secondary academic
coursework is one metric by which students are granted admissions to post-secondary
institutions, and “Advanced Placement” courses are designed specifically as means by
which high school students can earn college credits.
It is of concern, however, that the advantage charter school attendees experience in
terms of post-secondary enrollment does not extend to other, and arguably more important,
post-secondary outcomes as indicated in results from the second logistic regression model
detailed in Table 2. There is no statistically significant difference in the probability of
earning a post-secondary degree or certificate within four years of graduating from high
school between students who attended a charter school and those who attended a non-
charter public school. Of note, a statistically significant interaction between attending a
charter schools and enrolling in an advanced set of STEM courses is associated with a
decreased likelihood of earning a post-secondary degree or certification within 4 years of
graduating from high school relative to the likelihood of dropping out of post-secondary
education. Thus, students in non-charter public schools enrolling in advanced sets of
secondary STEM courses are more successful at the post-secondary level than students
enrolling in comparable sets of courses in charter schools. Together, these findings suggest
that charter schools may be able to improve the likelihood of enrolling in post-secondary
education, but they may not be equipping students with the skills they need to succeed at
the post-secondary level, particularly among students taking advanced STEM courses,
providing some evidence to support the hypothesis offered by Dobbie and Fryer (2016).
Multinomial regression models make it possible to explore how charter school
attendance and secondary STEM course enrollment affect post-secondary enrollment and

67
outcomes with greater nuance. Rather than explore the probability of pursuing post-
secondary education or earning a post-secondary degree or certificate, multinomial
regression models made it possible to explore the probability of enrolling in different kinds
of post-secondary institutions and of earning different kinds of post-secondary degrees.
Consistent with results from the first logistic regression model (Table 1), output
from the multinomial regression model predicting the likelihood of students enrolling in
different types of post-secondary institutions (Table 3) indicates that charter schools are
associated with increases in the likelihood of students enrolling in 4-year universities
(public, private, and out-of-state). The interaction between charter school attendance and
enrollment in advanced STEM courses at the secondary level is associated with an
additional increase in the probability of enrolling in an out-of-state post-secondary
institution, and the interaction between charter school attendance and enrollment in a basic
set of STEM courses is associated with an increased probability of enrolling in a public 4-
year university.
The multinomial regression model giving the probability of students earning
different kinds of post-secondary degrees (Table 4) reveals that there is no statistically
significant difference in post-secondary outcomes between students attending charter
schools and students attending non-charter public schools. As results from other models
indicate, STEM course-taking patterns are better predictors of the post-secondary degree
attainment. Compared to students enrolled in college preparatory STEM courses, those
enrolled in advanced secondary STEM courses are more likely to earn associate degrees,
bachelor’s degrees, or to continue to be enrolled than they are to have dropped out 4 years
after graduating from high schools. The statistically significant interaction between charter
school attendance and enrollment in a set of STEM courses designated as “other” indicates

68
that enrolling in this set of courses in charter schools is associated with increased likelihood
of earning a bachelor’s degree.
Secondary course pathways associated with mobility are grouped in this category,
and charter school students are more likely than non-charter public school students of being
mobile. It is reasonable that charter school students are more mobile than non-charter
school students, as to enroll in a charter school requires families to submit applications to
these schools and leave the non-charter public school to which a student would have
attended. Moreover, arguments for increasing school choice posit that families dissatisfied
with a given school can simply move elsewhere, so enrollment in a charter school could
plausibly indicate that these students’ families are more amenable to moving between
schools to search for academic environments they perceive as superior. If concern over the
academic quality in a given school is what drives mobile students to both transfer into and
out of charter schools, then such concern over academic quality—either on the part of
individual students or their families—may also explain why these students also are more
likely to earn bachelor’s degrees than mobile peers in non-charter public schools.
Although a statistically significant interaction between charter school attendance
and enrollment in an advanced set of secondary STEM courses was statistically significant
in the logistic regression model predicting the likelihood of post-secondary degree
attainment, this interaction is not statistically significant in the multinomial regression
model predicting the likelihood of earning certain kinds of post-secondary degrees.
Nevertheless, this interaction is negative in magnitude for contrasts predicting the
probability of earning an associate or bachelor’s degree relative to the probability of
dropping out of post-secondary education. Thus, the decreased likelihood charter school
attendees who had enrolled in advanced sets of STEM courses is driven primarily by
students not earning these two degrees.

69
With respect to post-secondary attainment in STEM disciplines, charter schools are
not associated with any statistically significant change in the likelihood of earning a post-
secondary degree or certificate in STEM disciplines. Significant interactions between
charter school attendance and enrollment in either basic sets of STEM courses or “other”
sets of STEM courses are significant predictors of the likelihood of earning a non-STEM
bachelor’s degree and of earning an associate degree in a STEM discipline. That students
enrolling in basic sets of STEM courses at the secondary level in charter schools have a
higher probability of earning a non-STEM post-secondary degree or certificate as
compared to peers taking similar STEM courses in non-charter schools suggests academic
programming in some charter schools may equip students for post-secondary success better
than non-charter public schools; however, it would be instructive for future research to
investigate what kinds of post-secondary degrees and certificates are driving this
interaction. That charter school students enrolling in “other” sets of STEM courses have
higher probabilities of earning a STEM associate degree is likely an artifact of the types of
“other” courses identified in charter and non-charter schools. As posited earlier, charter
school students are more likely to be associated with mobility, which may signify that these
students are concerned with school quality to a greater degree than mobile students in non-
charter schools. By contrast, non-charter public school students are more likely to enroll in
sets of STEM courses tailored for SPED students, and SPED designation is associated with
decreased probabilities of post-secondary enrollment and degree attainment. Since both
“mobility” and “SPED” course patterns are grouped in the “other” category, sector
differences for students enrolled in “other” sets of STEM courses likely reflects that charter
and non-charter public schools serve different populations of students instead of suggesting
that charter schools offer better academic programming in “other” STEM courses.

70
Chapter 3: Teaching in a Parallel Universe: Assignment of Alternatively and Traditionally Certified STEM Teachers to Courses in Charter and
Non-charter Public Schools
INTRODUCTION
Charter schools and alternative teacher certification programs are concurrent
education reforms in the United States that have grown substantially since their inception.
Typically, charter schools operate independently of the local districts in which they are
situated and are therefore not subjected to many of the same regulations as non-charter
district schools. Charter school proponents argue that this independence from local school
districts frees charter schools from stifling bureaucracy and affords them opportunities to
more flexibly and effectively meet the needs of students and families (Bierlein &
Mulholland, 1994; Budde, 1988; Friedman, 2002). In a similar vein, alternative teacher
certification pathways exist outside of traditional, university-based teacher preparation
programs (TPPs) and are positioned by proponents as institutions that are equipped to
recruit and train high-quality teachers with greater efficacy. Critics of traditional TPPs have
leveraged concerns over the quality and quantity of teachers prepared in these programs,
and alternative TPPs emerged in response to these concerns by reducing barriers to entering
the teaching profession and by providing accelerated pathways to certification (Adelman
et al., 1986; Ludlow, 2013; Suell & Piotrowski, 2007).
Charter schools and alternative pathways to teacher certification are both market-
based reforms in which deregulation and competition are introduced to spur innovation and
increase efficiency within public education structures that have been widely cast in political
and public circles as inadequate and resistant to change (C. Clark, 2000; Guggenheim,
2010; Labaree, 1996; National Commission on Excellence in Education, 1983; Shokraii,
1996). Recently, both charter schools and alternative teacher preparation pathways have

71
benefitted from political support as federal initiatives have provided financial incentives
for states to expand deregulation within their public education systems. The motivations
for these federal incentives include increasing teacher recruitment—particularly in hard to
staff content areas such as the STEM (science, technology, engineering and mathematics)
disciplines—and encouraging educational innovation to improve outcomes among
socioeconomically disadvantaged students who have historically performed more poorly
than their advantaged peers (U.S. Department of Education, 2009). In addition to
benefitting from federal incentives, both charter schools and alternative teacher preparation
programs have received positive media attention, such as in 2010’s Waiting for Superman,
which chronicled the ways by which inefficiency and stagnation within the public
education system resulted in subpar outcomes, particularly for students from
socioeconomically disadvantaged backgrounds (Guggenheim, 2010).
Although charter schools and alternative teacher preparation are reforms that were
initiated independently, they have many ideological commonalities, and scholars have
identified and theorized the interconnections between them (Kretchmar, 2014; Mungal,
2016; Stitzlein & West, 2014). For example, Mungal (2016) describes an emerging
education structure—consisting of alternative teacher certification, charter schools, and
graduate degree programs tailored specifically for charter school teachers—that parallels
the traditional education structure in which teachers are prepared in university-based
certification programs and subsequently employed by non-charter public schools. Stitzlein
and West (2014) chronicle the ideological similarities between alternative graduate degree
programs and charter schools, noting that many charter school organizers have structured
new graduate programs of education to align with values espoused by and pedagogies
employed in “no-excuses” charter schools (in which students attend schools for longer

72
days, are held accountable to strict behavioral expectations, and engage in rigorous
preparation for standardized assessments).
Given the growing prevalence of charter schools nationwide, scholars have begun
to pursue research investigating how teachers perceive and navigate educational labor
markets in which varying levels of charter schools are present (Cannata, 2011; Carruthers,
2012; Gulosino et al., 2019; Jabbar et al., 2019). Results from these studies suggest that
teachers’ sector preferences are motivated by a range of factors, including ideological
match, job security, school location, and teachers’ age and experience. A subset of the
researchers investigating how teachers navigate the educational labor market have
considered teachers’ certification pathways in their analyses (Lefebvre & Thomas, 2017;
Maloney & McKenzie-Thompson, 2013). These results show that a higher percentage of
alternatively certified teachers work in charter schools than in non-charter public schools
and suggest that this difference may be attributable to the close relationships between
alternative certification programs and charter schools.
A separate realm of research has explored the factors influencing teacher mobility
between and assignment within schools (Chingos & West, 2011; Donaldson & Johnson,
2010; Feng, 2010; Loeb et al., 2012); however, most of this research has neither attended
to teachers’ preparation pathway nor considered school sector. Scholars researching charter
schools have highlighted the importance of investigating the internal conditions within
charter and non-charter public schools that may be responsible for sector differences in
student outcomes (Berends & Donaldson, 2016; Cannata & Penaloza, 2012; Preston et al.,
2012). Given the connections between charter schools and alternative certification
pathways, the effects of teacher preparation pathway within school sector are necessarily
important to consider when exploring the internal conditions within schools that may be
responsible for differential student outcomes. As such, it is critical to evaluate the factors

73
influencing teachers in charter and non-charter public schools as an additional way to
assess the degree to which the convergence of alternative preparation pathways and charter
schools either has or has not led to the innovation and efficiency anticipated by education
reformers.
The primary goal of this study is to identify factors that influence teacher
assignment and to explore the ways in which teacher assignment is mediated by teachers’
preparation pathway, school sector, and the interaction between the two. Specifically, this
paper addresses the following research questions:
1. What factors influence how secondary teachers are assigned to teach STEM
courses?
2. Do the factors influencing secondary teacher course assignment in schools vary by
sector?
3. Are factors influencing secondary teacher course assignment different for teachers
certified in alternative and traditional preparation programs?
4. Are any teacher preparation pathway differences in course-assignment mediated by
school sector?
To explore these research questions, this study analyzes statewide data available in
Texas at the student- and teacher- levels by building logistic and multinomial logistic
models to predict the likelihood of alternative and traditionally certified teachers being
assigned to different kinds of STEM courses in secondary charter and non-charter public
schools. There are two primary motivations for the focus on STEM disciplines. First,
students’ preparation in STEM disciplines (or the perceived lack thereof) is an oft cited
concern within influential governmental reports that have been used widely to criticize the
public education system, thereby bolstering support for market-based educational reforms
(Goals 2000, 1994; National Commission on Excellence in Education, 1983; U.S.

74
Department of Education, 2009). Thus, it is of interest to policymakers and researchers to
ascertain the degree to which the proliferation of charter schools and alternative teacher
certification have independently and jointly affected students’ preparation in STEM
disciplines. In other words, both charter schools and alternative teacher certification are
celebrated as reforms to improve upon the shortcomings of a “failing” education system;
are these reforms making any appreciable differences in preparing students to participate
in disciplines often portrayed as critically important to the economic and technological
well-being of the United States?
The second motivation for focusing on the STEM disciplines is because both
charter schools and alternative teacher certification are reforms aimed at serving
socioeconomically disadvantaged students belonging predominately to historically
marginalized ethnic groups (Gulosino & dEntremont, 2011; Logan & Burdick-Will, 2016;
Ludlow, 2013). This demographic of students is also underrepresented in STEM
disciplines—particularly the physical sciences—at the secondary and post-secondary
levels (National Center for Education Statistics, 2019). Given that charter schools and
alternative teacher certification target socioeconomically disadvantaged who are
underrepresented in the STEM disciplines, it is a matter of equity to investigate the degree
to which the growing influence of market-based reforms serves either to dismantle or
uphold the structures that have precluded equitable participation in STEM. Investigating
the factors influencing teacher assignment in charter and non-charter public schools is a
step toward that goal.
Finally, in developing the research focus of this study, it is important to
acknowledge the broad federal mandate of high-stakes accountability within which public
education systems currently operate. Both charter schools and non-charter public schools
are held accountable for student achievement as assessed through standardized exams.

75
Since high-stakes accountability measures are used so ubiquitously to evaluate institutions
of public education, it is important to consider how these pressures influence teachers’
assignment to courses in charter and non-charter public schools, with particular attention
to sector differences in schools’ responses to these pressures. To investigate this question,
logistic and multinomial logistic models that account for teachers’ value-added scores in
tested STEM subjects are constructed in order to assess teachers’ probability of continuing
to be assigned to the same STEM subject in a subsequent year and to identify prominent
assignment pathways into and out of tested STEM subjects in charter and non-charter
schools.
LITERATURE REVIEW
The literature review highlights two threads of research that I aim to bridge in this
study. The first line of research investigates factors impacting teacher dynamics, focusing
particularly upon the ways in which teachers are hired and assigned to courses in their
schools and upon the effects that lead to teacher turnover. Many of these studies have
focused on elementary and middle schools with little attention given to teacher dynamics
in secondary schools. In addition, this research has not explored whether or not there are
sector differences in how teachers are assigned to classes, nor has this research attended to
teachers’ preparation pathways.
The second thread of research investigates how teachers navigate labor markets in
which charter schools and non-charter public schools are both present. Some of these
studies consider teacher preparation pathway and explore the ideological similarities
between charter schools and alternative certification pathways. The bulk of this research
does not, however, explore how teachers are assigned to courses. Thus, I make the case
through this literature review that there is a need for research to investigate the factors

76
influencing teacher assignment and mobility in charter and non-charter schools with
particular attention given to the effects of teacher preparation pathway in each sector.
Moreover, given the large focus on teachers in elementary and middle schools in the extant
research literature, there is also a need for researchers to focus upon teachers at the
secondary level.
Factors Impacting Teacher Hiring, Assignment, and Mobility
One line of research investigating how teachers are assigned to teach courses has
focused on the ways by which teachers are matched to students. This research suggests that
teachers with higher qualifications are more likely to be matched with high-performing
students. Donaldson (2013) reports both that teacher assignment in schools is often
dominated by seniority and that senior teachers elect to teach classes consisting of high-
performing students. Player (2010) corroborates this finding, providing evidence
suggesting that favorable assignment for highly qualified and more experienced teachers
is one way in which principals compensate teachers who do well in their schools.
In a quantitative study analyzing data from fifth grade classrooms in North
Carolina, Clotfelter, Ladd, and Vigdor (2006) find that teacher sorting occurs both within
and between schools. Teachers with greater experience and from more prestigious
universities are more likely to teach at schools serving primarily advantaged student
populations while their less experienced colleagues are more likely to serve in
socioeconomically disadvantaged schools serving high proportions of students from ethnic
minority populations. Within schools, teachers with low licensure exam scores are assigned
to classes consisting of fewer white students, fewer students whose parents went to college,
and students who historically had performed poorly on standardized exams, whereas
Nationally Certified Board teachers are more often assigned to classes with higher

77
performing students. Notably, these patterns in teacher assignment are problematic because
disadvantaged students are disproportionately taught by underprepared, underperforming
novice teachers who are more likely to leave the profession (Donaldson & Johnson, 2010;
Feng, 2010).
There is evidence to suggest that mobility patterns of teachers may exacerbate these
inequities. In New York City, although first year teachers who were ineffective at
improving student outcomes on standardized exams had high rates of attrition among both
schools with high achieving student populations and schools with low achieving student
populations, second and third year teachers with demonstrated abilities to improve student
test scores were more likely to move to schools with higher student achievement while
ineffective teachers tended to stay in schools with lower student achievement (Boyd et al.,
2008).
Steele et al. (2015) also document differences between teachers serving
socioeconomically disadvantaged students and those serving more advantaged students.
They find that teachers serving disadvantaged students are less experienced, have lower
college GPA’s, and graduate from less prestigious institutions of higher education.
Moreover, these authors explore the factors that influence teacher sorting by using
teachers’ value-added scores to predict the likelihood of teacher turnover in elementary and
middle schools. Value-added scores for teachers are computed through statistical models
in which students’ scores on standardized exams are regressed on their test scores from the
prior year in that subject. From these models, coefficients for individual teachers are
computed, and these “value-added” coefficients are used to represent teachers’
demonstrated ability to either increase or decrease student achievement on standardized
exams.

78
In their study, Steele et al. (2015) find that teachers with low value-added scores
are more likely to work in schools with higher concentrations of students from
underrepresented ethnic minority groups, which is consistent with their finding that these
teachers are less qualified than teachers in more privileged settings. Despite differences in
teachers’ qualifications and teachers’ average value-added scores between schools serving
high and low privilege student populations, Steele et al. (2015) do not find evidence that
the mobility dynamics differ between these schools. The likelihood of teacher turnover in
schools with high concentrations of ethnic minority students is not mediated by teachers’
value-added score.
Given the ubiquity of standardized exams in the current educational era, teachers’
value-added scores have been used in an array of studies examining the dynamics
impacting teacher assignment and mobility in public schools. Analyzing data on
elementary school teachers in North Carolina, Ost and Schiman (2015) use teachers’ value-
added scores to predict the likelihood that elementary school teachers are reassigned to
teach different grades in subsequent years. Although they find some evidence that a lower
value-added score corresponds to an increased likelihood that a teacher is reassigned to a
different grade in a subsequent year, this effect is not statistically significant in all of their
models. Rather than individual teacher characteristics driving teacher reassignment,
school-level characteristics seem to be more influential drivers of teacher reassignment
(Ost & Schiman, 2015). In addition, teachers who are reassigned to teach different grade
levels are more likely to leave their schools. Thus, it is important that research continue to
investigate what factors lead to teachers’ reassignment and to evaluate whether
reassignment leads to turnover in additional contexts.
Chingos and West (2011) compute value-added scores for teachers teaching high-
stakes courses (in all subjects), defined as courses in which students are assessed on

79
standardized exams that are used to rate schools. Using the value-added scores they
compute as independent variables, these authors build models predicting the likelihood of
teachers transitioning out of high-stakes classrooms. Their results suggest that teachers
with high value-added scores are more likely to become principals, assistant principals,
and instructional leaders, whereas teachers with low value-added scores are more likely to
be moved from high-stakes classrooms to low-stakes classrooms. The evidence Chingos
and West provide exemplifies some of the ways in which the prevalence of high-stakes
standardized exams directly impacts teachers’ assignment.
Many studies using teachers’ value-added scores to explore hiring, assignment, and
mobility of public school teachers draw mainly upon data from elementary and middle
school students (Boyd et al., 2006, 2008; Chingos & West, 2011; Hanushek et al., 2016;
Hanushek & Rivkin, 2010; Loeb et al., 2012; Ost & Schiman, 2015; Steele et al., 2015).
This is due to the fact that individual schools’ adequate yearly progress, as mandated by
No Child Left Behind, is determined in large part by students’ performance on standardized
exams in grades 3 through 8. The readily available data for these grades make it easy to
compute value-added scores for elementary and middle school teachers. In high school
grades, however, standardized assessments are not taken with the same regularity, meaning
the factors influencing teacher assignment, hiring, and mobility in secondary schools have
not received the same amount of attention in the research literature. In addition,
standardized exams in science are not offered with the same frequency that English
language arts (ELA) and mathematics exams are, thereby making it difficult for researchers
to evaluate science teachers in the same manner as ELA and mathematics teachers. In their
study on the effects of value-added on teachers’ course assignments, Steele et al. (2015)
report that relative to ELA and mathematics teachers, there are larger disparities in the
value-added scores of science and social studies teachers between schools serving high and

80
low concentrations of underrepresented ethnic minority students, suggesting that pressure
from high-stakes accountabilities affects teacher assignment more in some subjects (ELA
and mathematics) than in others (science and social students).
There is evidence indicating that factors affecting teacher assignment practices at
the middle and high-school levels are also at play at the secondary level. In a prior study
evaluating the efficacy of alternatively and traditionally certified secondary STEM teachers
upon student learning in algebra I and biology, I, along with coauthors, found that a
teacher’s value-added score was statistically significantly related to the probability of that
teacher continuing to teach the same tested-STEM subject in the subsequent year (Marder
et al., 2020). In this study, estimates of the effects of teacher preparation pathway upon
student achievement gains in math and science became less significant over time, likely a
result of effective teachers continuing to teach tested STEM subjects with less effective
teachers moving away from these subjects. As my coauthors and I argue, this yields both
practical and methodological concerns (David & Marder, 2018). That teachers are
seemingly being assigned to classes and subjects such to maximize student achievement
on standardized exams necessitates researchers investigate what other factors influence the
likelihood of teachers being assigned to or reassigned from high-stakes STEM subjects. In
addition, it is important to consider how these factors affect how teachers are assigned to
classes more generally, not just in the subjects that are predominately used to hold schools
accountable for adequate yearly progress.
In addition to the practical considerations of teacher matching, these assignment
practices also yield methodological concerns for researchers seeking to evaluate teacher
efficacy using value-added modeling. Dieterle, Guarino, Reckase, and Wooldridge (2015)
present evidence to suggest that schools often group students according to prior
performance and non-randomly assign teachers to these classes, effects to which value-

81
added modeling is sensitive. Clotfelter et al. (2006) also report that biases due to teacher
and student matching exacerbate correlations between teacher qualifications and student
outcomes. That our estimates gradually decreased in magnitude and significance over time
is evidence of the effects of teacher assignment practices upon value-added modeling
(Marder et al., 2020). Better understanding the dynamics influencing teacher assignment is
not only important for researchers and policy makers to evaluate the degree to which
students have equitable access to high quality teachers, but it is also important in order to
consider how these dynamics affect researchers’ capacities to reliably evaluate educational
systems using observational data.
How Teachers Navigate the Educational Labor Market in an Era of School Choice
Recent research investigating how the growth of charter schools has influenced the
ways in which teachers navigate the educational job market have leveraged principles from
segmented labor market theory (Cannata, 2011; Gulosino et al., 2019; Jabbar et al., 2019).
As opposed to workers in a unified labor market, in which workers are able access to all
professional options, workers in a segmented labor market are limited to a subset of the
entire labor market because informal and institutional barriers limit their mobility between
divisions in the market. Within a segmented labor market, one subset of the market—the
primary market—has more favorable characteristics than the other—the secondary market.
For example, the primary market is associated with higher wages and job security, whereas
the secondary labor market is characterized by lower wages and less stability. These
distinctions align with characteristics of the educational labor market in which charter
schools and non-charter schools are both present. In these markets, teachers in non-charter
public schools typically have higher salaries and greater job stability, as opposed to charter
school teachers who are hired at-will and typically receive lower salaries. Therefore,

82
literature drawing from segmented labor market theory to analyze the educational job
markets with charter schools argues that professional options in the non-charter sector
constitute a primary market and professional options in the charter sector comprise the
secondary labor market.
Drawing upon both qualitative and quantitative data from prospective elementary
school teachers in Michigan, Cannata (2011) reports that the introduction of charter schools
to the educational labor market has resulted in the segmentation predicted by the segmented
labor market theory. Results indicated that prospective elementary school teachers tended
to prefer non-charter public schools in their job search because of unfamiliarity with the
charter school sector, the perceived ambiguity of the institutional status of charter schools
within the public education system, and a general desire for features of the primary segment
(e.g., higher wages and greater job security). Statistical models from this study provided
evidence that prospective elementary teachers were more likely to apply to charter schools
if they also applied to work at a private school, desired to work in an urban school, attended
a teacher preparation program that had authorized a charter school, or lived in areas with
charter schools present.
In another study, Gulosino et al. (2019) also find evidence that the introduction of
charter schools has resulted in segmentation of the labor market. Their models show that
newly hired teachers in secondary charter schools have higher rates of turnover than newly
hired teachers in non-charter public schools and that newly hired charter school teachers at
both elementary and secondary schools are more likely to leave teaching than non-charter
public school teachers. Gulosino et al. (2019) argue that these pervasive differences
between charter school teachers’ and non-charter school teachers’ rates of turnover and
propensities to leave the profession result from the differing organizational structure of
charter and non-charter public schools. Moreover, that these two markets have distinct

83
characteristics (e.g., charter schools have notably less stability than non-charter schools) is
consistent with the primary and secondary characteristics of subdivisions within a
segmented labor market. With respect to teacher preparation pathway, teachers from
traditional and alternative preparation programs had a similar likelihood of turnover in non-
charter public schools; however, traditionally prepared teachers working in charter schools
were more likely to be retained.
In an analysis of interview data from prospective and transitioning teachers (e.g.,
teachers new to the profession and experienced teachers searching for new positions),
Jabbar et al. (2019) similarly draw from segmented labor market theory to explore how
teachers navigate various educational labor markets in which there are varying
concentrations of charter schools. As opposed to prior work using segmented labor market
theory, these authors focused upon qualitative data to gain deeper insight into the personal
and institutional factors that influenced teachers’ decisions to pursue jobs in the primary
and secondary markets. In general, teachers preferred non-charter schools over charter
schools due to the greater job security and higher wages. However, some teachers
preferentially sought employment in charter schools because these schools aligned with
their personal ideological beliefs. The authors argue that these personal preferences, in
addition to structural policies, served as barriers that contribute to the segmentation of the
educational labor market.
The relationship between the alignment of teachers’ personal ideological beliefs
with charter school missions and teachers’ individual preferences for working in charter
schools is also noted elsewhere. Cannata and Penaloza (2012) characterize differences
between teachers working in charter and non-charter schools, noting that teachers’
agreement with the mission of the school, increased autonomy over their instruction, and
influence over school policies, among other factors, are possible reasons why teachers

84
decided to work in charter schools. Additionally, teachers working in non-charter public
schools more often chose those schools for job security, the positive reputation of the
school, and the proximity of the school to where they lived.
Given the influence of ideological match upon teachers’ preferences for
employment in segmented labor markets, it is important for researchers to consider what
role alternative teacher certification programs play in the segmentation of the educational
labor market. A number of scholars have described how market-based educational
reforms—namely alternative teacher certification and charter schools—are aligned in their
neoliberal ideologies (Kretchmar, 2014; Kretchmar et al., 2014; Lefebvre & Thomas, 2017;
Maloney & McKenzie-Thompson, 2013). Teach For America (TFA), which recruits high-
achieving college graduates, places them in alternative certification programs, and matches
TFA corps members with high-needs schools, has many inroads with the charter school
movement (Kretchmar, 2014; Kretchmar et al., 2014). In addition to sponsoring policies
that support the expansion of charter schools, TFA also instills in its corps members values
that are aligned with those of many charter schools. For example, Kretchmar (2014) argues
that TFA profoundly shapes its corps members’ beliefs about education in such a way that
they believe the charter school autonomy allows for better professional opportunities that
will ultimately translate to improved student outcomes.
Maloney and McKenzie-Thompson (2013) note that, despite wanting qualitatively
similar things from their teacher certification programs, teachers in charter and non-charter
public schools have drastically different ideas about conditions in the opposite sector. For
example, charter school teachers perceived they received greater support from their
schools, were not stifled by union regulations, and were able to work in an environment
that prioritized achievement to a greater degree than teachers in non-charter schools.
Teachers’ perceptions about working conditions in the opposite sector, as reported by

85
Maloney and McKenzie-Thompson (2013), align with the ideologies espoused by TFA and
TFA corps members (Kretchmar, 2014). Thus, while teachers may want similar things from
their certification programs, the programs themselves may play a key role in influencing
how teachers structure their job search with respect to sector.
While the segmented labor market theory provides a useful lens with which to
understand how teachers navigate the educational job market, there is other research
suggesting that alternative certification and charter schools form a parallel education
structure within the public education system. In New York City, for example, alternatively
certified teachers work in charter schools and then pursue graduate degrees in education
from programs aligned with charter schools (Mungal, 2016; Stitzlein & West, 2014). It is
plausible that the alignment of these neoliberal structures is responsible for divisions in the
educational labor market observed elsewhere, particularly considering that one consistent
reason why some teachers prefer charter schools to non-charter public schools is that their
ideological beliefs are aligned (Cannata, 2011; Jabbar et al., 2019). Charter schools and
alternative certification pathways are neoliberal reforms established in counterpoint to the
“traditional” public education system. Given ideological alignment between teachers from
alternative certification and charter schools, in addition to the structural differences
between these reforms and both traditional certification programs and non-charter public
schools, it is important to investigate whether the dynamics affecting teachers and the
division of labor in charter and non-charter public schools differ by teacher preparation
pathway. The intersecting ideological and practical nature of these reforms necessitate that
researchers better understand the ways in which these two reforms jointly impact teachers’
working conditions in schools.

86
DATA AND SAMPLE
The data analyzed in this study were made available through the Texas Education
Research Center (ERC), which houses and maintains student and teacher level data for all
public education institutions in Texas. The data available through the Texas ERC
compromises one of the largest public education management information systems
nationwide, with data from 1993 onward. Available data include student-level enrollment,
demographic, graduation, and accountability data from the Texas Education Agency
(TEA); teacher-level course-assignment and employment data from the TEA; teacher
certification data from the State Board of Educator Certification (SBEC); and enrollment
and performance data for all students enrolling in Texas institutes of higher education from
the Texas Higher Education Coordinating Board (THECB).
The specific data elements used in this study include student, demographic,
accountability, and STEM enrollment data; teacher course assignment, certification, and
demographic data; and campus and district level data with indicators for school type (e.g.,
charter or non-charter public), county, and region. The data analyzed come from the 2011-
2012 academic year to the 2017-2018 academic year, all years for which it is possible to
tie teachers to students in the Texas ERC. Figure 8 gives the number and proportion of
teachers in the sample by sector, certification pathway, and academic year. The average
demographic characteristics of students taught by alternatively and traditionally teachers
in charter and non-charter public schools are provided in Figure 9 and Figure 10.
As displayed in Figure 8, there are more alternatively certified secondary STEM
teachers than teachers from standard certification programs in both charter and non-charter
public schools, and the proportion of alternatively certified teachers in charter schools is
higher than the proportion of alternatively certified teachers in non-charter schools. In
addition, the number of alternatively certified teachers increased over the time period of

87
the study in both sectors, while the number of standard teachers in charter schools remained
constant and the number of standard teachers in non-charter schools decreased slightly.
Figure 8. Number (top panels) and proportion (bottom panels) of STEM teachers by school sector and certification pathway for all years analyzed in this study.
Figure 9 shows how the racial demographics of classes taught by alternatively and
traditionally certified teachers in charter and non-charter public schools differ. In non-

88
charter public schools, traditionally certified teachers teach higher percentages of students
who identify as Asian and White, while alternatively certified teachers teach classes with
higher percentages of Black and Latinx students. There are no clear differences in the racial
demographics of teachers in charter schools.
Figure 9. Average racial demographics of students in charter and non-charter school classrooms taught by alternatively and traditionally certified teachers.

89
Figure 10. Average demographic characteristics of students in charter and non-charter school classrooms taught by alternatively and traditionally (standard) certified teachers.
Figure 10 provides insight into other substantive differences in classes taught by
alternatively and traditionally certified teachers in charter and non-charter public schools.
Non-charter public alternatively certified teachers are more likely to teach economically

90
disadvantaged students and students designated as “Limited English Proficient,” but these
differences do not exist in charter schools. In addition, Figure 10 indicates that charter
schools serve lower percentages of students identified as gifted and higher percentages of
economically disadvantaged students.
Analyses are conducted at two levels, one that includes teachers who are assigned
to teach any secondary STEM subjects and another in which the data are subset to include
only teachers teaching high-stakes tested STEM subjects (algebra I and biology in Texas).
For both analytical levels, average student demographics are computed for each class
taught by a teacher and are included as covariates in the models predicting the likelihood
of teacher transfer and the likelihood of specific transition pathways. At the second analytic
level, in which teachers’ demonstrated (in)ability to improve student performance on
standardized exams is used to predict the likelihood of their course assignment trajectories,
student test scores on standardized exams in algebra 1 and biology are used to compute
value-added scores for each teacher. The specific ways by which this is accomplished are
discussed in the “Analytic Methods” section.
In any given year, teachers are likely to teach more than one subject, and it is also
presumable that the distribution of these subjects may change from year to year. Therefore,
when analyzing a teacher’s transition(s) to new courses, it was important to calculate the
proportion of that teacher’s instructional time that was assigned to a new course. To do so,
a teacher’s instructional time per class is weighted by one divided by the number of
individual classes for which that teacher was the instructor of record in a given year. These
class-level weights are then summed over by subject, so that it is possible to find the
proportion of a teacher’s instructional time dedicated to a particular STEM subject in a
given year. Transition weights are computed by first determining the total percentage of a
teacher’s instructional time that is dedicated to the same subject from one year to the next.

91
Then the remaining percentage of a teacher’s instructional time per subject is divided
evenly between any new subjects in the subsequent year.
As an example, consider a teacher responsible for 6 classes at a given school. In the
first year, assume this teacher is assigned to teach three sections of algebra 1 and three
sections of geometry. In the second year, this teacher is assigned to teach two sections each
of algebra 1, algebra 2, and pre-calculus. One-third of this teacher’s instructional time
remains the same from one year to the next (two sections of algebra 1). The instructional
time dedicated to the third section of algebra 1 and three sections of geometry in the first
year is then evenly divided between the two sections of algebra 2 and pre-calculus in the
subsequent year.
There are several kinds of charter schools in Texas: open-enrollment (which are
established by educational management organizations, non-profit organizations, and other
eligible entities), university-sponsored charter schools, and campus-program charter
schools, in which that school is established by a local school district. This study restricts
analysis to open-enrollment charter schools. Since charter schools do not operate in all
Texas counties, schools are only included in the present study if they are located in counties
in which at least one charter school and at least one non-charter school operate. In addition,
because this study is interested in how teachers are assigned to teach secondary STEM
courses, only the fraction of a teacher’s instructional time allocated for secondary STEM
courses is included in analyses (e.g., if a teacher is assigned to teach both 8th and 9th grade
STEM courses, only that teacher’s 9th grade STEM course assignment would be analyzed).
ANALYTIC METHODS
As mentioned previously, analyses are conducted at two levels, each discussed in
detail here. At the first analytic level, models are constructed to explore how teachers are

92
assigned to teach all secondary STEM subjects in addition to the likelihood that a teacher
continues to teach the same subject. The goal of the second analysis is to evaluate how
teacher effectiveness influences teacher assignment to STEM subjects. One proxy for
teacher effectiveness is their ability or inability to improve student scores on standardized
assessments. In high schools, standardized assessments in STEM are only administered for
algebra I and biology, both of which are typically taken in students’ 9th grade year. As
such, to evaluate the relationship between teacher effectiveness and course-assignment in
charter and non-charter schools, the second analytic level restricts the teacher sample to
teachers for which it is possible to compute value-added scores in algebra I and biology.
General Assignment to STEM Courses
The first model used to explore teacher assignment is a logistic regression
predicting the likelihood that a teacher is assigned to teach the same course at the same
campus in the subsequent year as a function of working in a charter school, coming from
an alternative certification pathway, their interaction, average classroom demographics,
and teacher characteristics. This model is specified by Equation (7):
𝑙𝑜𝑔 '𝑝!,-
1 − 𝑝!,-+ = 𝛽*𝐶!,-! + 𝛽+𝑃! + 𝛽*+𝐶!,-!𝑃! + 𝛽.𝑿𝒊,𝒕! + 𝛽-!𝑡9 + 𝐶𝑜𝑢𝑛𝑡𝑦!,",-! (7)
In Equation (7), pi,t is the probability that teacher i continues to teach the same
STEM course in year t, Ci is a binary variable indicating whether or not teacher i worked
in a charter school in the prior year t¢ (t¢ = t – 1), Pi is a binary variable indicating whether
or not teacher i was prepared in an alternate certification program, Xi, is a vector of
demographic variables giving the average demographic characteristics of teacher i’s
students in year t¢ in addition to that teacher’s demographics, t¢ is a fixed effects term for
prior year, and County is a fixed effects term for the county in which campus j is located.

93
Two variants of this model are run: one in which the sector, certification interaction term
is included and another in which the interaction term is excluded.
In addition to evaluating the probability that a teacher continues to teach the same
STEM subject in a subsequent year, a multinomial logistic regression model is constructed
to evaluate the probability of a teacher being assigned to teach different kinds of STEM
courses from one year to the next. STEM courses in Texas are categorized into the
following: advanced courses; high-stakes tested courses; non-advanced elective courses,
and exit from teaching (or, more specifically, exit from the data set—a teacher could have
moved out of state or gained employment in a private school). The probability of a teacher
i being assigned to teach course of type α relative to the reference category in year t is
estimated as a function of several predictor variables, including teaching in a charter
school, preparation pathway, their interaction, a teacher’s prior year course assignment,
and teacher and student demographic characteristics, as specified by Equation (8). This
model estimates how these covariates affect a teacher’s likelihood of transitioning to
different kinds of STEM courses.
𝑙𝑜𝑔 K𝑝!,-3
𝑝!,-456L = 𝛽*𝐶!,-! + 𝛽+𝑃! + 𝛽*+𝐶!,-!𝑃! + 𝛽.𝑿𝒊,𝒕! + 𝛽:𝐶𝑟𝑠!,-! + 𝛽-!𝑡9 + 𝐶𝑜𝑢𝑛𝑡𝑦!,",-! (8)
In Equation (8), the predictor variables are the same as those in Equation (7), except
for now a categorical variable indicating the type STEM course teacher i taught in year t¢
is also included (Crsi,t¢). By including this variable, it is possible to evaluate how the
probability of teaching a certain kind of STEM course in a subsequent year depends upon
the kind of STEM course to which a teacher was assigned in the prior year. As with the
logistic model, this model is run with the interaction effect included and excluded. In
addition, this model is run using two different subsets of the data: one with the full dataset

94
and another in which the data set is restricted to teachers who are not assigned to teach the
same course at the same campus in a subsequent year. In the latter case, a binary indicator
for whether or not a teacher stays at their campus from t¢ to t is included.
Teacher Value-Added and Course Assignment
At the second analytic level, models are constructed in order to evaluate how
teacher effectiveness affects the likelihood of that teacher being reassigned to teach the
same subject in a subsequent year and to investigate how a teacher’s effectiveness mediates
the likelihood of that teacher transitioning to another course. As such, value added scores
for algebra 1 and biology teachers are calculated using the hierarchical model specified by
Equation (9):
𝑆!,- = 𝛽#𝑆!,-! + 𝛽$𝑆!,-!$ + 𝛽;𝑆!,-!
; + 𝑇"[!] + 𝐶)[!] + 𝐶𝑙𝑠<=*[!]> +&𝜒?[!]?
+ 𝜖! (9)
Here, Si,t represents the end-of-course exam score for student i in year t, and Si,t’ is
a pretest score for student i in year t¢ (t¢ = t – 1) modeled to first, second, and third order.
Random effects coefficients are generated for teachers T, campuses C, and classes Cls.
Controls for student demographic characteristics, cg[i], are also included as flags indicating
membership (indexed by g) in the following groups: gifted education; special education;
race/ethnicity; economic disadvantage (determined by eligibility for free and reduced
lunch); and designation as limited English proficient (LEP). Individual teacher coefficients
generated in this model are used as teachers’ value-added scores. The value-added
coefficients for teachers are then included as additional predictor variables in the logistic
and multinomial logistic regression models specified by Equations (7) and (8). In addition
to teacher value-added coefficients, some variants also include campus-level value-added
coefficients as predictors to also include controls for campus quality.

95
At the second analytic level, all models are constructed both with and without a
certification and sector interaction term. As at the first analytic level, the multinomial
models with value-added predictors are analyzed using all teachers for whom it was
possible to compute a value-added score and sub-setting the data set to include only
teachers who do not teach the same course at the same campus in a subsequent year. In
addition, these models are used to analyze algebra 1 and biology teachers both separately
and jointly.
RESULTS
In this section, results are presented for each analytic level, with results from
models exploring teacher assignment to all STEM courses presented first and models
exploring how teacher effectiveness influences subsequent STEM course assignment
presented second.
Assignment to Secondary STEM Courses
Coefficients from the logistic regression model predicting the likelihood of a STEM
teacher continuing to teach the same STEM course at the same campus in a subsequent
year, as specified by Equation (7), are provided in Table 6. Model specifications in which
the certification/sector interaction are both included and excluded are provided. The
coefficients in Table 6 can be used to calculate the associated change in probability of a
teacher continuing to teach the same course at the same campus in a subsequent year given
the predictor variable (displayed in Figure 11).
Statistically significant effects for alternative certification and employment in a
charter school are obtained, suggesting that alternatively certified teachers are
approximately 10% less likely than traditionally certified STEM teachers to be assigned to

96
teach the same course at the same campus in a subsequent academic year. Employment in
a charter school is associated with a decrease of between 43% and 48% (when the
interaction is not included or is included, respectively) in the likelihood of a teacher being
assigned to teach the same STEM course at the same school in a subsequent year. The
certification/sector term is not statistically significant; however, including this term
increases the magnitude of the charter school coefficient.
Table 6. Coefficients from a logistic regression model predicting the probability of a teacher being assigned to teach the same STEM course at the same campus in a subsequent year.
Including Interaction Without Interaction Coefficients Est. S.E. Sig. Est. S.E. Sig. Intercept 0.77 0.20 *** 0.77 0.20 *** Alt. Cert. -0.11 0.03 *** -0.11 0.03 *** Charter -0.65 0.11 *** -0.57 0.06 *** Interaction 0.11 0.12 --- --- ---
Avg.
Cla
ssro
om
Dem
og.
Female 0.39 0.09 *** 0.39 0.09 *** Asian 0.51 0.17 ** 0.51 0.17 ** Black -0.68 0.11 *** -0.68 0.11 ***
Latinx -0.22 0.10 * -0.22 0.10 * Econ. Dis. -0.24 0.08 ** -0.24 0.08 **
Gifted 0.33 0.09 *** 0.34 0.09 *** LEP -0.89 0.15 *** -0.89 0.15 ***
SPED -0.67 0.06 *** -0.67 0.06 ***
Teac
her
Dem
og. Female -0.04 0.03 -0.04 0.03
Black -0.05 0.07 -0.05 0.07 Other Race -0.02 0.11 -0.02 0.11
Latinx -0.12 0.07 . -0.12 0.07 . White -0.02 0.06 -0.02 0.06
*** p < 0.001, ** p < 0.01, * p < 0.05, . p < 0.10 Interaction refers to the interaction between certification and sector.
In addition to statistically significant coefficients for alternative certification and
charter school employment, the demographic compositions of teachers’ classrooms are
also associated with statistically significant changes in the probability of teachers being
assigned to teach the same STEM subject at the same school in a subsequent year. Student
demographic variables represent the proportion of a teacher’s class characterized by that

97
demographic. Thus, coefficients give the associated probability of a teacher continuing to
teach the same STEM course at the same school if they taught an entire class (or set of
classes) characterized by the indicated demographic variable. For example, teaching a class
in which all students are economically disadvantaged is associated with a 21% decrease in
the likelihood of that teacher continuing to teach the same STEM subject at the same school
in a subsequent year.
Figure 11. Probability estimates from logistic regression model predicting the likelihood that a teacher continues to teach the same STEM course at the same campus from one year to the next given sector employment, certification, and classroom demographics.
Coefficients from this model indicate that teachers with classes consisting of higher
proportions of students identifying as Black or Latinx or who are identified as economically
disadvantaged, LEP, or SPED are associated with statistically significant decreased

98
probabilities of teaching the same STEM course at the same campus in a subsequent year.
By contrast, teachers with classes consisting of higher proportions of students identifying
as Asian or students classified as gifted are associated with increased probabilities of
teaching the same STEM course at the same school in subsequent years.
Table 7. Coefficients from a multinomial regression model predicting the probability of teachers being assigned to teach specific types of STEM courses in a subsequent year. These results include all teachers in the sample analyzed.
Adv. to Elective Tested to Elective Left to Elective Coefficients Est. S.E. Sig. Est. S.E. Sig. Est. S.E. Sig. Intercept -2.82 0.37 *** -3.53 0.46 *** -2.28 0.29 *** Alt. Cert. -0.18 0.05 *** -0.04 0.06 -0.04 0.04 Charter 0.10 0.11 0.34 0.12 ** 0.90 0.07 *** Adv. Course 3.83 0.05 *** 1.33 0.08 *** 1.47 0.05 *** Tested Course 1.75 0.30 *** 3.37 0.18 *** 1.68 0.21 ***
Avg.
Cla
ssro
om
Dem
og.
Female 0.53 0.18 ** -0.17 0.19 0.13 0.13 Asian 0.92 0.28 ** 0.03 0.45 -0.19 0.29 Black -0.02 0.21 0.60 0.22 ** 0.42 0.15 **
Latinx 0.17 0.19 0.24 0.21 0.14 0.14 Econ. Dis. -0.44 0.16 ** 0.30 0.17 . 0.26 0.12 *
Gifted 1.23 0.16 *** -0.42 0.27 0.33 0.17 . LEP -0.72 0.34 * 0.55 0.26 * 0.54 0.20 **
SPED -0.77 0.19 *** 0.64 0.11 *** 0.58 0.08 ***
Teac
her
Dem
og. Female 0.06 0.05 0.46 0.06 *** 0.15 0.04 ***
Black -0.34 0.14 * 0.23 0.16 0.02 0.10 Other Race -0.26 0.21 -0.11 0.26 -0.10 0.16
Latinx -0.25 0.12 * 0.35 0.15 * -0.15 0.10 White -0.14 0.11 0.00 0.14 0.02 0.09
*** p < 0.001, ** p < 0.01, * p < 0.05, . p < 0.10
Coefficients from the multinomial logistic regression model specified by Equation
(8) are provided in Table 7 and Table 8. Visualizations of the exponentiated coefficients
for these models are provided in Figure 12 and Figure 14. This regression model predicts
the likelihood of a teacher’s transition pathway between STEM courses (e.g., that a teacher
is assigned to teach an advanced STEM course, tested STEM course, or leave the
profession relative to being assigned to teach an elective STEM course) from one year to
the next. Coefficients in Table 7 and Figure 12 are obtained when the model is applied to

99
all secondary STEM teachers, and coefficients in Table 8 and Figure 14 are obtained when
the data are subset to include only teachers who do not teach the same course at the same
campus in the subsequent year. Sankey diagrams depicting course reassignment pathways
are provided for these two subsets in Figure 13 and Figure 15, respectively. Another variant
of the regression models included a certification/sector interaction term, but the interaction
term was not statistically significant and increased the magnitude of the coefficients for
charter schools. As such, results from the latter model variants are not reported.
Figure 12. Odds of all teachers being assigned to teach a certain STEM course given sector employment, certification, and prior year assignment.
A statistically significant coefficient for certification indicates that alternatively
certified teachers are 16% less likely than traditionally certified teachers to be assigned to
teach an advanced STEM course relative to an elective STEM course in a subsequent year.
Alternative certification is not associated with statistically significant differences in the
likelihood of that teacher being assigned to a tested STEM course or leaving the profession
in a subsequent year.

100
Figure 13. Sankey diagram illustrating how STEM teachers are reassigned to different courses in secondary schools. Color represents certification pathway and panels indicate sector employment.
Relative to teaching an elective STEM course in a subsequent year, teaching in
charter schools is associated with 40% and 9% increases in the likelihood of being assigned
to teach tested STEM courses or leaving the profession, respectively, in the subsequent

101
year. Teaching an advanced STEM course or a tested STEM course is associated with
statistically significant increases in the likelihood of teaching an advanced or tested STEM
course in the following year in addition to statistically significant increase in the likelihood
of leaving the profession. Coefficients are particularly large when the transition pathway
matches a teacher’s prior year assignment, likely indicating that teachers are often assigned
to teach the same STEM courses from one year to the next.
Table 8. Coefficients from a multinomial regression model predicting the probability of teachers being assigned to teach a specific type of STEM course in a subsequent year. These results are subset to teachers who were not assigned to teach the same STEM course at the same campus in a subsequent year.
Adv. to Elective Tested to Elective Left to Elective Coefficients Est. S.E. Sig. Est. S.E. Sig. Est. S.E. Sig. Intercept -1.32 0.49 ** -1.6 0.51 ** 1.33 0.61 * Alt. Cert. -0.23 0.06 *** -0.14 0.06 * -0.36 0.07 *** Charter 0.28 0.13 * 0.21 0.13 . 0.11 0.11 Adv. Course 0.44 0.07 *** -0.09 0.08 0.40 0.09 *** Tested Course -0.14 0.4 0.02 0.29 0.64 0.35 .
Same Campus 0.50 0.08 *** -0.11 0.07 -21.7 250
Avg.
Cla
ssro
om
Dem
og.
Female 0.30 0.21 0.06 0.19 0.41 0.21 . Asian -0.12 0.38 -0.08 0.46 0.25 0.50 Black 0.14 0.26 0.21 0.23 -0.49 0.24 *
Latinx 0.25 0.23 0.10 0.22 0.10 0.23 Econ. Dis. -0.40 0.19 * 0.23 0.18 -0.10 0.20
Gifted 0.99 0.21 *** -0.24 0.27 -0.02 0.28 LEP -0.50 0.39 0.01 0.29 0.07 0.35
SPED -1.23 0.21 *** 0.28 0.12 * 1.04 0.17 ***
Teac
her
Dem
og. Female 0.04 0.06 0.48 0.06 *** 0.10 0.07
Black -0.39 0.17 * 0.26 0.17 -0.13 0.18 Other Race -0.39 0.27 -0.15 0.28 -0.35 0.28
Latinx -0.30 0.15 * 0.25 0.16 -0.41 0.17 * White -0.20 0.14 -0.02 0.15 -0.11 0.16
*** p < 0.001, ** p < 0.01, * p < 0.05, . p < 0.10
Table 8 provides coefficients indicating how variables influence the likelihood of a
teacher transitioning to a different STEM course when that teacher is not assigned to teach
the same course at the same school in a subsequent academic year. When analyzing
teachers who do not teach the same STEM course at the same campus from one year to the

102
next, alternatively certified teachers are less likely than traditionally certified teachers to
be reassigned to advanced or tested STEM courses. In addition, this subset of alternatively
certified teachers is less likely to leave the profession than traditionally certified teachers.
Among this subset of teachers, employment in a charter school is associated with a 32%
increase in the likelihood of a teacher being assigned to teach an advanced STEM course
in the subsequent year. Teaching an advanced STEM course is associated with 55%
increase in the likelihood of a teacher teaching an advanced STEM course (either a different
subject or at a new school) in the subsequent year and a 49% increase in the likelihood of
that teacher leaving the profession. Staying at the same campus from one academic year to
the next is associated with a 65% increase in the likelihood of that teacher being assigned
to an advanced STEM course as opposed to an elective STEM course.
Figure 14. Odds that teachers who are reassigned to different courses are assigned to specific types of STEM courses given sector employment, certification pathway, and prior year STEM assignment.

103
Figure 15. Sankey diagram depicting how STEM teachers are reassigned when they do not teach the same STEM course from one year to the next. Color indicates certification pathway and panel indicates sector employment.
Teacher Effectiveness and STEM Course Assignment
At the second analytic level, models are constructed to evaluate how a teacher’s
demonstrated (in)ability to improve student test scores on high-stakes standardized
assessments in STEM subjects influences the likelihood of that teacher being assigned to

104
teach different STEM courses. This is accomplished by including value-added coefficients
computed by the hierarchical linear model given by Equation (9) as predictor variables in
the logistic regression and multinomial logistic regression models specified by Equations
(7) and (8). Models are constructed to analyze algebra 1 and biology teachers both
separately and jointly, and one variant of each model includes a campus-level value-added
coefficient as a predictor variable in addition to teacher-level value-added coefficients to
control for campus quality. Models control for the same demographic characteristics as
those constructed at the first analytic level; however, for ease of interpretation only
coefficients for certification, school sector, teacher and campus value-added (labeled
Teacher and Campus, respectively, in the coefficient tables), and prior year course type are
reported.
Table 9. Coefficients from logistic regression models predicting the likelihood of a teacher continuing to teach the same STEM subject at the same campus in a subsequent year as a function of that teacher’s value-added coefficient in the prior year. Variants are run for algebra 1 and biology teachers separately and jointly in addition to controlling for only teacher quality and controlling for both teacher and campus quality.
Teacher Only Teacher and Campus Coefficients Est. S.E. Sig. Est. S.E. Sig.
Alge
bra
1
Alt. Cert. -0.16 0.13 -0.15 0.13 Charter -0.15 0.19 -0.13 0.19 Teacher 0.38 0.17 * 0.34 0.18 . Campus --- --- --- 0.12 0.12
Biol
ogy Alt. Cert. -0.26 0.16 -0.26 0.16
Charter -0.43 0.21 * -0.44 0.21 * Teacher 0.1 0.23 0.11 0.25 Campus --- --- --- -0.03 0.18
Teste
d ST
EM Alt. Cert. -0.19 0.1 * -0.19 0.1 *
Charter -0.28 0.14 * -0.28 0.14 * Teacher 0.04 0.09 0.03 0.16 Campus --- --- --- 0.00 0.15 *** p < 0.001, ** p < 0.01, * p < 0.05, . p < 0.10
As with results reported earlier, exponentiating coefficients provided in Table 9
gives the associated change in the odds that a teacher will continue to teach the same STEM

105
subject at the same campus in a subsequent year for each predictor variable. Teachers’
value-added coefficients are the only statistically significant predictors of continued
likelihood of teaching the same STEM course in the algebra 1 model when the campus-
level value-added coefficient term is not included. This coefficient indicates that a standard
deviation increase in an algebra 1 teacher’s value added score is associated with a 46%
increase in the likelihood of that teacher continuing to teach the same STEM subject at the
same campus in the following year. Models including campus-level value-added
coefficients as predictor variables indicate that campus quality is not statistically
significantly related to the likelihood of teachers continuing to teach the same STEM
course at those campuses. Teaching in a charter school is associated with a decreased
likelihood of teaching the same course at the same campus in a subsequent year in the
models limited to biology teachers and including all teachers in tested STEM subjects,
although the latter result is likely driven by biology teachers. In the model that includes all
STEM teachers, alternative certification is associated with statistically significant
decreases in the likelihood that a teacher continues to teach the same STEM course at the
same campus in a subsequent year.
Multinomial regression models predicting the likelihood of teachers of tested
STEM subjects being assigned to different kinds of STEM courses in the subsequent
academic year as a function of their computed value-added scores are provided in Table
10. As with the logistic regression model, the multinomial regression models are
constructed for algebra 1 and biology teachers separately and jointly. In these models,
teachers’ prior year value-added scores are positively associated with the likelihood of
teachers being assigned to teach advanced and tested STEM subjects relative to the
likelihood of being assigned to teach an elective STEM course in the subsequent year.

106
However, this association is only statistically significant for the tested to elective STEM
course contrast in the model analyzing biology teachers.
Table 10. Results from multinomial models predicting the likelihood of being assigned to teach specific types of courses as a function of certification pathway, sector, prior year value-added, and prior year STEM course assignment.
Adv. to Elective Tested to Elective Left to Elective Coefficients Est. S.E. Sig. Est. S.E. Sig. Est. S.E. Sig.
Alge
bra
1 Alt. Cert. -0.11 0.25 -0.15 0.19 0.37 0.21 . Charter -0.05 0.37 -0.57 0.32 . 0.7 0.24 ** Teacher 0.2 0.31 0.22 0.25 -0.49 0.27 .
Adv. Course 3.47 0.26 *** 1.17 0.25 *** 1.05 0.25 *** Tested Course 1.86 1.66 2.32 0.94 * 0.2 1.52
Biol
ogy
Alt. Cert. 0.1 0.43 0.09 0.24 0.43 0.27 Charter -0.08 0.66 -0.15 0.33 0.77 0.3 ** Teacher 1.2 0.65 . 0.9 0.38 * 0.3 0.42
Adv. Course 5.22 0.46 *** 2.39 0.39 *** 2.19 0.39 *** Tested Course 2.95 0.94 ** 2.65 0.64 *** 1.15 0.82
Teste
d ST
EM
Alt. Cert. -0.06 0.21 -0.06 0.14 0.38 0.16 * Charter -0.13 0.32 -0.39 0.23 . 0.7 0.19 *** Teacher 0.09 0.19 0.1 0.13 -0.03 0.14
Adv. Course 4.03 0.22 *** 1.54 0.2 *** 1.44 0.21 *** Tested Course 2.53 0.76 *** 2.49 0.52 *** 0.94 0.7
*** p < 0.001, ** p < 0.01, * p < 0.05, . p < 0.10
As with results from the first analytic-level including all secondary STEM teachers,
the type of STEM course to which a teacher is assigned in a prior year is a statistically
significant predictor of the likelihood of the kind of STEM course to which that teacher is
assigned in the subsequent year. Teaching an advanced STEM course in a prior year is
associated with increased probabilities of being assigned to teach an advanced or tested
STEM course in the following year in addition to increased probabilities of leaving the
profession. This result holds for all models. In most models (all but the advanced to elective
contrast for algebra 1 teachers), being assigned to teach a tested STEM subject in a prior
year is associated with statistically significant increase in the likelihood of teaching
advanced and tested, as opposed to elective, STEM courses in the subsequent year.
Employment in a charter school, by contrast, is associated with statistically significant

107
increases in the likelihood of teachers leaving the profession as opposed to teaching an
elective STEM course in the subsequent year.
Table 11. Multinomial regression coefficients predicting the likelihood of teachers being assigned to teach certain STEM courses as a function of certification, sector, prior year teacher and campus value-added coefficients, and prior year STEM course assignment.
Adv. to Elective Tested to Elective Left to Elective Coefficients Est. S.E. Sig. Est. S.E. Sig. Est. S.E. Sig.
Alge
bra
1
Alt. Cert. -0.09 0.25 -0.14 0.19 0.36 0.21 . Charter -0.02 0.38 -0.57 0.32 . 0.68 0.25 ** Teacher 0.05 0.32 0.2 0.26 -0.43 0.28 Campus 0.36 0.23 0.04 0.19 -0.15 0.19
Adv. Course 3.49 0.26 *** 1.17 0.25 *** 1.05 0.25 *** Tested Course 1.98 1.66 2.32 0.94 * 0.18 1.52
Biol
ogy
Alt. Cert. 0.1 0.43 0.1 0.24 0.44 0.27 Charter -0.08 0.67 -0.1 0.33 0.78 0.3 ** Teacher 1.04 0.67 0.74 0.4 . 0.25 0.45 Campus 0.44 0.52 0.35 0.28 0.08 0.29
Adv. Course 5.19 0.46 *** 2.39 0.39 *** 2.19 0.39 *** Tested Course 2.95 0.94 ** 2.64 0.64 *** 1.16 0.82
Teste
d ST
EM Alt. Cert. -0.05 0.21 -0.06 0.14 0.38 0.16 *
Charter -0.12 0.32 -0.39 0.23 . 0.7 0.19 *** Teacher -0.25 0.33 0.09 0.23 -0.01 0.25 Campus 0.38 0.3 0.00 0.22 -0.02 0.23
Adv. Course 4.04 0.22 *** 1.54 0.2 *** 1.44 0.21 *** Tested Course 2.54 0.76 *** 2.49 0.52 *** 0.94 0.7
*** p < 0.001, ** p < 0.01, * p < 0.05, . p < 0.10
The multinomial logistic regression coefficients reported in Table 11 predict the
likelihood of teachers transitioning to certain kinds of STEM courses as a function of
certification, employment in a charter school, prior year course assignment category, and
both teacher and campus quality. As with coefficients reported for models including only
terms for teacher value-added in the prior year, results in Table 11 indicate that a teacher’s
value-added score is not a statistically significant predictor of the kind of course to which
that teacher is assigned in a subsequent year when other covariates are included. In
addition, there is no statistically significant relationship between campus value-added and

108
the probability of being assigned to teach a certain kind of STEM course in a subsequent
academic year.
Rather than teacher or campus quality, the type of STEM course to which a teacher
is assigned in a prior year is a statistically significant predictor of the type of course to
which that teacher is assigned in a subsequent year. Teaching an advanced STEM subject
is associated with increased probabilities of being assigned to teach advanced or tested
STEM courses in the subsequent year in addition to an increased likelihood of leaving the
teaching profession. Teaching a tested STEM subject is associated with an increased
likelihood of being assigned to teach advanced or tested STEM subjects in the subsequent
year (the exception is in the advanced to elective contrast for algebra 1 teachers). In all
models, employment in a charter school is associated with statistically significant increases
in the probability of leaving the profession rather than being assigned to teach an elective
STEM course in the subsequent year, and in the model including teachers from all tested
STEM subjects, alternative certification is also associated with an increased probability of
leaving the profession.
DISCUSSION
At the first analytic level in which teacher assignment to all STEM courses was
explored as a function of teacher certification and charter school employment, results
suggest that alternative certification and employment in a charter school are both associated
with higher probabilities of mobility, either reassignment to a new course, moving to a new
school, or leaving the profession entirely (Table 6). In addition, teachers in classes
comprised of higher percentages of students from ethnic minority populations that have
been historically underrepresented in STEM disciplines and with higher concentrations of
economically disadvantaged students are also associated with decreased likelihood of

109
continuing to teach the same STEM subject at the same school from one year to the next.
Taken together, these findings are of particular concern, because market-based reforms that
are disproportionately targeted towards serving ethnic minority and economically
disadvantaged populations may exacerbate low teacher retention among populations for
whom high teacher mobility is already a problem.
Multinomial regression models exploring teacher assignment in general and
exploring teacher assignment in cases when teachers are not assigned to teach the same
course at the same campus from one year to the next provide additional insight into how
market-based reforms influence STEM teachers’ course assignments. The multinomial
model exploring all STEM course assignment dynamics (Table 7) indicates that, compared
to traditionally (or standard) certified teachers, alternatively certified teachers have a lower
probability of being assigned to advanced STEM courses than they do of being assigned to
elective STEM courses. In addition, charter school teachers have higher probabilities both
of being assigned to teach tested STEM subjects and of leaving the profession than of being
assigned to teach elective STEM subjects. Thus, charter schools are associated with higher
teacher turnover, a finding that is consistent with other literature. Moreover, that charter
schools are associated with increased probabilities of being assigned to tested STEM
subjects instead of elective STEM subjects may be due to the fact that charter schools have
more limited course offerings (and offer fewer elective STEM courses in general) or that
the teachers being assigned to tested STEM subjects are replacing teachers who leave the
profession.
Other significant results from the multinomial model exploring all STEM course
assignment dynamics indicate prior year course assignment in advanced and tested STEM
subjects is associated with higher probability of being assigned to advanced or tested
STEM courses in the following year or of leaving the profession. This is an interesting

110
finding, as it suggests that the set of teachers assigned to teach advanced and tested STEM
subjects is different from the set assigned to teach elective STEM subjects. Compared to
elective STEM courses, advanced and tested courses have relatively higher stakes. It is not
unreasonable to assume that teachers perceived as being of higher quality would be
assigned to advanced or tested subjects by school leaders, while teachers perceived as being
inferior are relegated to elective courses where inefficacy is harder to detect. The
qualifications of teachers assigned to teach these different types of courses is an area for
additional research.
Results from the multinomial model exploring how teachers are reassigned when
they do not teach the same STEM course at the same campus from one year to the next
may provide a partial answer. For all contrasts, alternative certification is associated with
a statistically significant higher probability of being assigned to an elective STEM course
rather than being assigned to an advanced or tested STEM course or of leaving the
profession. Given this, it is presumable that certification pathway is one characteristic that
distinguishes the set of teachers assigned to either advanced or tested STEM courses from
the set assigned to elective courses. Another finding from this model indicates that prior
assignment to an advanced STEM course is associated with increased probability of being
assigned to a different advanced STEM course at the same school or to the same STEM
course at a different school in addition to an increased probability of leaving the profession
relative to elective courses. Existing literature suggests that more desirable courses, such
as advanced STEM subjects, are given to teachers with higher seniority. Therefore, it is
reasonable that the reason why prior assignment to an advanced STEM course is associated
with increased probability of leaving the profession is that these teachers are closer to
retirement.

111
A final important result from this model suggests that employment in a charter
school is associated with increased likelihood of being assigned to an advanced course for
teachers who do not teach the same course at the same campus from one year to the next.
In general, charter school teachers have higher mobility between courses, so additional
research into the reasons for which these teachers are more likely to move to different sets
of advanced courses from one year to the next warrants additional research.
At the second analytic level, in which teacher and campus quality (as determined
by value-added estimates) are used to predict course assignment for STEM teachers,
neither teacher nor campus quality is found to be a statistically significant predictor of a
teacher continuing to teach the same STEM course at the same campus from one year to
the next or of the probability that a teacher is assigned to a certain kind of STEM course
from one year to the next. This finding contradicts earlier findings that show teacher value
added increases the likelihood of a teacher being assigned to teach the same tested STEM
subject in the subsequent year (David & Marder, 2018; Marder et al., 2020). This
discrepancy is likely due to the fact that the data and models were constructed in slightly
different ways. First, the prior studies evaluated the likelihood of a teacher being reassigned
to high-stakes subjects given his or her students’ prior performance on standardized exams,
but this study did not account for the entirety of teachers’ teaching assignments. Second,
the models in the present study controlled for campus value-added and a teacher’s prior
teaching assignment, whereas the logistic regression models in the other studies did not.
Thus, the models described herein evaluated substantively different aspects of teacher
course
As my coauthors and I have argued previously (David & Marder, 2018; Marder et
al., 2020), evidence suggests that a teacher’s proven track record of either improving or not
improving student performance on standardized exams influences the likelihood of that

112
teacher continuing to teach tested subjects, a finding that certainly makes sense given the
high-stakes nature of standardized exams in an era of school accountability and that should
lead policy makers to consider the unintended consequences of high-stakes accountability
measures.
In the present study, teacher ability to improve student test scores—used as a proxy
for that teacher quality—is used to explore course assignment in the STEM disciplines
more generally. Specifically, a teacher’s value-added score is used to predict teacher
reassignment from all STEM courses that he or she teaches (not just the high-stakes courses
that can be used to compute a value-added score). In this case, a teacher’s prior year sector
employment, certification, and STEM course assignment have stronger relationships with
that teacher’s probability of being assigned to different kinds of STEM courses in the
subsequent year. The relationships between a teacher’s certification, sector employment,
and prior year course assignment discussed earlier in this section thus appear to persist,
even after controlling for teacher and campus quality.

113
Chapter 4: Estimating the Joint Causal Effect of Teacher Preparation Pathway and Charter Schools upon Student Outcomes in STEM
Disciplines
INTRODUCTION
Charter schools, alternative teacher preparation programs, and other market-based
education reforms have become staples of the current educational landscape in the United
States. National concern over the quality of the teacher workforce and the quality of the
public education system in the United States writ large—particularly in mathematics and
science—dates back to the Sputnik era when U.S. students’ poor performance in the STEM
(science, technology, engineering, and mathematics) disciplines was seen as a threat to the
country’s military and technological superiority (Lutz & Hutton, 1989; Rudolph, 2002).
Similar concerns over the quality of the United States public education system were echoed
in 1983’s A Nation at Risk, which portrayed the United States public education system as
the chief reason for a “rising tide of mediocrity” threatening United States’ global
economic competitiveness (National Commission on Excellence in Education, 1983). In
particular, A Nation at Risk highlighted both that United States students were
underprepared in STEM disciplines when compared to other nations and that educational
outcomes differed greatly by students’ ethnicity and socioeconomic status. Since A Nation
at Risk, several federal policy initiatives have cited these issues to justify financial
incentives for individual states to promote the expansion of charter schools and alternative
teacher preparation programs, under the assumption that these market-based reforms will
promote innovation within the public education system (America 2000, 1991; Recovery
Act, 2009; Goals 2000, 1994; No Child Left Behind, 2002).

114
Figure 16. Proportion of charter and non-charter schools in Texas by grade level served.
Charter schools and alternative teacher certifications have experienced rapid
growth in the United States (Hanushek et al., 2007; NAPCS, 2018; Suell & Piotrowski,
2007). Such growth is also evident in Texas, as displayed in Figure 16 and Figure 17, which
show the proportions of Texas charter and non-charter schools and the proportions of the
students enrolling in them by grade level, respectively. As charter schools and alternative

115
teacher preparation programs continue to expand, it is important to evaluate the effects of
these education reforms upon student outcomes with particular attention given toward
whether or not these reforms have alleviated the concerns they were purportedly designed
to address.
Figure 17. Proportion of Texas students in charter and non-charter schools by grade level.

116
A wealth of research literature has explored differences in student outcomes
between charter and non-charter public schools in addition to differences in student
outcomes between traditionally and alternatively certified teachers. There is little
consensus within this research as to whether or not charter schools and alternative teacher
preparation programs have improved student outcomes. Some research on the effects of
charter schools upon student test scores suggests their impact is contextual, varying
according to the student demographics served within schools and according to the
urbanicity of schools (M. A. Clark et al., 2015). For example, charter schools serving
socioeconomically disadvantaged students were found to increase student performance on
standardized exams, but this effect was not detected in charter schools serving more
advantaged students.
The environmental characteristics of effective and ineffective charter schools
identified by Clark et al. (2015) may be confounded with other school-specific variables,
such as the design, pedagogies, and curricula employed within certain charter schools.
Rather than environmental variables, research using data from Texas suggests that “no
excuses” charter schools—schools with longer school days, rigorous test-preparation, and
high behavioral standards—improve student test scores and college enrollment, but do not
improve labor market outcomes (Dobbie & Fryer, 2016). Moreover, such “no excuses”
charter schools more often serve socioeconomically disadvantaged and ethnic minority
students in urban settings.
Extant research comparing alternatively and traditionally certified teachers is
mixed. Some work suggests there are no statistically significant differences in teacher
quality or upon student outcome by teacher preparation pathway (Harris & Sass, 2011;
Suell & Piotrowski, 2007), and that differences in teacher effectiveness vary more within
preparation programs than between them (Kane et al., 2008). By contrast, in a study using

117
student performance on algebra 1 and biology standardized exams to evaluate alternatively
and traditionally certified STEM teachers in Texas, Marder et al. (2020) find that algebra
1 students in classes taught by traditionally certified teachers experienced higher increases
in their standardized exam scores than their peers in classes taught by alternatively certified
teachers. Although biology students in traditionally certified teachers’ classrooms
generally scored higher on standardized exams than peers in alternatively certified
teachers’ classrooms, these differences were not often statistically significant.
Most research evaluating the effects of market-based education reforms has
explored charter schools and teacher preparation pathways separately; however, some
scholars suggest that together these education reforms form an educational structure that is
“parallel” to the traditional public education system (Kretchmar et al., 2014; Mungal, 2016;
Stitzlein & West, 2014). In this “parallel” education structure, teachers certified through
alternative preparation programs are overrepresented in charter schools, in part due to
ideological similarities in their educational paradigms. Standard certified teachers, by
contrast, are more likely to teach in non-charter public schools than in charter schools.
Despite these findings, research has not systematically explored the effects of this
“parallel” system upon student outcomes, nor has research explored the degree to which
differences in the effects of teacher preparation program may depend upon the sector in
which these teachers are employed.
In addition to investigating teacher preparation and school sector separately, a
majority of the research on the effects of market-based reforms has not focused upon
student outcomes in STEM—disciplines that have been designated “high-needs” for a long
time—but rather upon student learning gains in mathematics and reading, the academic
subjects most commonly used to evaluate schools’ adequate yearly progress as mandated
under No Child Left Behind legislation (No Child Left Behind, 2002). Although

118
mathematics is one of the STEM disciplines, that it is the only routinely tested subjects
leads to concern over whether the other disciplines are given proper academic attention.
This work seeks to expand upon existing literature by exploring the degree to which the
intersection of charter schools and alternative teacher preparation pathways has affected
student learning outcomes and engagement within the STEM disciplines. Specifically, this
project draws upon student- and teacher-level administrative educational data from Texas
to address the following research question: Do the effects of teacher preparation pathway
(alternative or traditional certification) upon student outcomes in mathematics and science
differ by school sector (e.g., charter and non-charter public schools)?
I employ two causal methods to estimate the joint effect of teacher preparation
pathway and school sector upon student performance on standardized exams in STEM
subjects. The first analysis consists of a hybrid crossover and nonrandomized block
research design in which students switching sectors in their transition from 8th and 9th grade
are blocked by campus and county. For the second analysis, I build a Directed Acyclic
Graph (DAG) to articulate the causal mechanisms responsible for the joint effects of
teacher preparation pathway and school sector upon student performance. From this DAG,
I build a regression model to estimate the joint causal effect of school sector and teacher
preparation pathway upon student outcomes in STEM.
Research has shown that the variation within teacher certification pathways
(alternative and traditional certification) and school sector (charter or non-charter) is
greater than the variation between these market-based reforms and aspects of the
“traditional” education system. If, however, teachers from specific preparation programs
are recruited by schools that are ideologically similar to these preparation programs and
employ pedagogical methods and curricula that align with the pedagogies and curricula
taught within certain teacher preparation pathways, then it is presumable that teachers will

119
be more effective in these settings than teachers prepared in other programs. This work
seeks to identify whether or not such an effect upon student outcomes in STEM exists. In
addition, by constructing two causal models, this work seeks to compare different causal
methodologies, evaluating the benefits and limitations of each.
LITERATURE REVIEW
In the literature review, I first discuss existing research investigating the effects of
charter schools and teacher preparation pathways upon student outcomes. Following a
review of this research, I discuss various perspectives on causal inference using
observational data.
Research on the Effects of School Sector and Teacher Preparation Pathway
Substantial bodies of research have investigated the effects of charter and non-
charter public schools upon student outcomes in addition to the effects of alternative and
traditional teacher preparation pathways upon student outcomes. In general, these literature
bases have been distinct from one another. Recent qualitative research, however, has begun
to characterize commonalities between charter schools and alternative certification
programs, as both are neoliberal, market-based reforms seeking to promote innovation and
improvement in the public education system by introducing competition into the public
education sector. In particular, pedagogies espoused in highly selective alternative teacher
preparation programs, specifically Teach For America (TFA), align with the educational
models employed in “no excuses” charter schools, and many charter school networks have
been started by TFA alumni (Kretchmar et al., 2014; Lefebvre & Thomas, 2017; Stitzlein
& West, 2014). Given the nature of the existing literature exploring the independent effects
of school sector and teacher preparation pathway upon student outcomes, in addition to the

120
emerging literature base seeking to characterize the commonalities between these market-
based reforms, this literature review discusses results from quantitative studies seeking to
identify the causal effects of charter schools and alternative certification programs upon
student outcomes in addition to qualitative studies describing the ways in which these two
market-based reforms have become aligned with one another.
Literature exploring differences in student achievement between charter and non-
charter public schools suggests the impact of charter schools upon student outcomes (most
often as measured using standardized exam scores) is contextual (Gleason et al., 2010;
Zimmer et al., 2012). In a study looking at student achievement in charter and non-charter
schools across seven states, Zimmer et al. (2012) concluded there was little or no difference
by sector, as charter schools in some states tended to increase students’ test scores in math
and reading, while charter schools in other states decreased students’ standardized test
scores. In a different study, Gleason et al. (2010) took advantage of the lottery-based
admissions system at 33 charter middle schools across 13 states to compare student
outcomes. On average, Gleason et al. (2010) found no differences in student achievement
in math or reading between charter and non-charter public schools; however, differences
in student achievement were found when disaggregating schools by student populations.
Specifically, charter schools serving underperforming, low-income students yielded
positive student outcomes in mathematics, whereas charter schools serving high-
performing, high-income students yielded negative student outcomes in mathematics and
reading. In a separate article using data from the same study, Clark et al. (2015) describe
that charter schools in urban settings improve student mathematics scores while charter
schools in non-urban settings do not.
The contextual differences reported by Gleason et al. (2010) and Clark et al. (2015)
are more plausibly attributable to the design and mission of specific charter schools.

121
Dobbie and Fryer (2016) examined a variety of outcomes—student test score gains, college
enrollment, and early labor market outcomes—of charter school graduates from Texas.
Specifically, “no excuses” charter schools—schools with longer school days, rigorous test
preparation, and high behavioral standards—were found to increase student test score gains
and college enrollment but have little noticeable impact upon graduates’ future earnings.
Other charter schools, by contrast, were associated with decreases in student test scores,
college enrollment, and future earnings. Sass et al. (2016), however, provide contrasting
evidence from Florida that shows “no excuses” charter schools are associated with
increased earnings among graduates.
Additional evidence for the importance of a charter school’s educational model on
student achievement comes from Curto and Fryer (2014) who studied student math and
reading achievement at SEED, an urban, boarding, college-preparatory charter school in
Washington, D.C. When comparing students randomly selected for attendance through the
lottery-based admissions system to students not selected for attendance, Curto and Fryer
(2014) report students attending SEED increased their math and reading scores. While
SEED’s boarding component is a unique feature of this school, another plausible reason
for SEED’s effectiveness in improving math and reading scores may be its “no excuses”
educational paradigm (Curto & Fryer, 2014), an instructional and behavioral model that
scholars have argued is responsible for the success of “highly-effective” charter schools
elsewhere (Cheng et al., 2017; Dobbie & Fryer, 2011, 2013, 2015).
The effects of teacher preparation pathway on student outcomes are similarly
mixed. Suell and Piotrowski (2007) describe literature comparing alternatively and
traditionally certified teachers that concluded “there were no differences in teaching
behavior, student output, or perception of competence” by teacher preparation pathway. In
studying teacher training, teacher quality, and student outcomes, Harris and Sass (2011)

122
report that experience, particularly in the first five years of a teacher’s career, is associated
with increases in student achievement, but that teachers’ pre-service training and college
entrance exam scores are not related to student achievement. von Hippel et al. (2016)
attempt to rank teacher preparation programs using value-added modeling, but report that
the teacher preparation estimates are too noisy to effectively distinguish between teacher
preparation programs. In a separate work analyzing data from six states, von Hippel and
Bellows (2018) similarly show that it is difficult to detect the effects of different teacher
preparation programs and describe that most teacher preparation programs do not result in
statistically significant differences in student outcomes as measured by standardized test
scores. Counter evidence from Texas suggests that traditionally certified STEM teachers
are more effective than their alternatively certified colleagues at producing test score gains
on standardized assessments (Marder et al., 2020). This study found that students in
classrooms with traditionally certified teachers experienced statistically significantly
higher gains in mathematics than their peers in classrooms taught by alternatively certified
teachers. Although differences in biology generally favored students in classrooms with
traditionally prepared teachers, these differences were smaller and not statistically
significant.
While noisy value-added estimates make it difficult to rank the effectiveness of
individual teacher preparation programs, as von Hippel et al. (2016) show, the results put
forth by Marder et al. (2020) indicate there are meaningful differences between teacher
preparation pathways more generally. In addition, it is also important to consider other
notable differences between alternatively and traditionally certified teachers. As compared
to alternatively certified teachers, traditionally certified teachers are more likely to stay in
the teaching profession for longer periods of time (Darling-Hammond, 2000; Ludlow,
2013). Alternatively certified teachers, however, are more likely to serve in

123
socioeconomically impoverished settings and are more likely than traditionally certified
teachers to come from ethnic minority populations (Ludlow, 2013).
Taken together, existing research on charter schools and alternative teacher
preparation pathways indicate that it is often difficult to differentiate the effects of these
reforms from the effects of the traditional public system (consisting of traditional teacher
preparation pathways and non-charter public schools). Some scholars argue, however, that
the neoliberal ideals of market-based reforms have created a parallel system within public
education. Mungal (2016) describes that in New York City, TFA and the Relay Graduate
School prepare pre-service teachers for employment primarily in charter schools, whereas
teachers prepared in standard, university-based teacher preparation programs typically
teach in New York City Public Schools. Lefebvre and Thomas (2017) contend that
alternatively certified teachers recruited through TFA perceive that they perform better in
charter schools where the educational paradigm is concordant with their training in TFA,
which may explain why TFA and other alternatively certified teachers are more likely to
teach in charter schools than are teachers certified through standard preparation routes.
Stitzlein and West (2014) also provide evidence that suggests certain teacher preparation
programs—specifically Relay and Match—promote ideals and pedagogies that are aligned
with ideals and pedagogies used in charter schools. Research investigating how teachers
navigate labor markets has found evidence to suggest that while teachers generally prefer
working in non-charter public schools because these schools offer higher salaries and
greater stability, some teachers prefer working in charter schools because of ideological
similarities (Cannata, 2011; Jabbar et al., 2019).
Despite findings suggesting that there are no average effects on student outcomes
by school sector or by teacher preparation pathway, that scholarship suggests these reforms
have aligned to form new structures within public education necessitates that research

124
investigate the joint effects of charter school and teacher preparation pathway upon student
outcomes. Moreover, a great deal of the studies exploring the effects of charter schools and
teacher preparation pathways on student achievement use math and reading scores, but do
not research student outcomes specifically in STEM as a whole. Given that federal policies
have foregrounded the inadequate preparation of students in STEM in the United States
when justifying financial incentives for the expansion of market-based educational
reforms, it is important to evaluate whether or not the growth of market-based reforms with
the United States public education system have impacted student access to and engagement
in STEM disciplines.
Causal Analysis
Understanding the causal underpinnings of the natural and social worlds lies at the
heart of many research endeavors. The natural sciences—biology, chemistry, and
physics—have long established histories of using experimentation to better understand the
causal mechanisms responsible for biological and physical phenomena. Research in the
social sciences similarly aims to uncover the relationships between social agents to
elucidate the causal mechanisms underlying social phenomena. In education research and
social science research writ large, there has been ample (and lively!) debate surrounding
the nature of causality and the methods most appropriate for evaluating and identifying
cause-and-effect relationships (Campbell & Stanley, 1966; Deaton & Cartwright, 2018;
Pearl, 2018; Rubin, 1974).
Examining cause-and-effect has been identified as an important goal for researchers
and policy-makers in the current era of educational reform in which charter schools and
other market-based reforms have taken center stage. Specifically, the No Child Left Behind
Act, enacted into legislation in 2002, provided funding to educational entities, non-profit

125
organizations, and public-private partnerships with the goal of encouraging the
development of innovative educational strategies to help students achieve state learning
standards. To evaluate the efficacy of these projects, the No Child Left Behind Act
recommends “using rigorous methodological designs and techniques, including control
groups and random assignment, to the extent feasible, to produce reliable evidence of [the]
effectiveness” of the educational projects funded (No Child Left Behind, 2002, p. 1597).
In addition, 2009’s American Recovery and Reinvestment Act similarly provided funding
geared specifically for innovation and improvement with the stipulation:
That a portion of these funds…also be used for a rigorous national evaluation by the Institute of Education Sciences, utilizing randomized controlled methodology to the extend feasible, that assesses the impact of performance-based teacher and principal compensation systems supported by the funds provided in this Act on teacher and principal recruitment and retention in high-need schools and subjects. (Recovery Act, 2009, p. 182)
Not only has recent legislation been favorable to reform efforts that are designed to spur
innovation in the public education system, but the need to evaluate these programs in such
a way to better understand the causal results of these innovations is a key component
included within this legislation.
Understanding casual mechanisms in education is not limited to educational policy,
however. The advent of data-driven instruction (following the enactment of No Child Left
Behind which established high-stakes accountability measures for public schools) further
exemplifies the broad importance of causal relationships and causal understanding to
educational practice. Data-driven instruction is a practice in which teachers routinely
collect and analyze standardized-testing data on their students in order to alter and improve
their instruction (Kronholz, 2012).7 In data-driven instruction, data analysis is portrayed as
7 In discussing data-driven instruction, Kronholz (2012) describes the work of Achievement Network (ANet), a non-profit organization that partners with schools to administer mock standardized exams regularly throughout the academic year and then supports teachers in using this data to analyze and adjust

126
a necessary measure for teachers to evaluate the impacts of their instruction and adjust their
pedagogical decision-making and curricula to better support student learning. Campbell
and Stanley (1966) similarly describe the role of causality in educational practitioners’
decision making processes through the hypothetical example of Principal John Doe, faced
with a decision to purchase a the new version of a textbook or to use an old version. Rather
than employing an experimental design to find the best textbook, Principal Doe will likely
weigh the benefits and costs of both options in coming to a decision. Although Campbell
and Stanley (1966) use the example of Principal Doe to illustrate the ways in which the
evolution of knowledge within education has typically not followed a rigorous
experimental process, their example nevertheless illustrates that causal reasoning enters
education not only at the policy level, but also at the practitioner level.
Pearl (2009a) contends that although many research questions in the social sciences
are causal, social science researchers have not traditionally employed statistical methods
capable of accounting for the causal nature of their questions, and instead rely upon
statistical inference. Whereas statistical inference leverages properties of data distributions
in order to describe associations between variables of interest, addressing causal questions
necessitates that researchers have “some knowledge of the data-generating process” (Pearl,
2009a, p. 97). In conceptualizing and theorizing causality in the social sciences, researchers
their instruction. The school at which I taught physics and physical science prior to enrolling in graduate school, was an ANet school. Tests were administered three times throughout each academic year, and soon after each administration, an ANet team member would host an in-service training dedicated to analyzing the data and identifying areas in which students were underperforming. Students were then placed into “targeted-instruction” classes tailored specifically toward additional practice with the particular content that each student most often answered incorrectly on the practice exam. I cannot say that I was particularly fond of the experience, nor did I find it useful. Our analysis of data was not at all rigorous, and other than “targeted-instruction” classes, I did not see that analyzing data resulted in changes to teachers’ instructional practices. In addition, the only subjects tested during these ANet sessions were reading and mathematics, the standardized tests upon which public schools were evaluated. As such, the “data-driven” enterprise seemed mostly an opportunity for students to regularly practice taking standardized exams and for teachers to subsequently drill students on the content they most commonly missed on these exams.

127
have proposed different methods and adopted various philosophies. Prior to estimating the
joint causal effect of teacher preparation pathway and school sector upon student outcomes
in STEM, as I intend to do with this paper, it is important to consider the various
philosophical stances that have sustained different methodological traditions within the
causal inference literature.
In the sections that follow, I first provide an overview of the literature on causal
methods and causal inference in the social sciences. Then I evaluate the merits of these
philosophies in the context of the present research project and describe how I will use these
methods to address the research question articulated in the introductory section.
Formulations of Causal Inference
Campbell and Stanley (1966) published a guide for educational researchers
describing the merits and drawbacks of pre-experimental, experimental, and quasi-
experimental research designs. In their work, Campbell and Stanley clearly favor
experimental research designs over pre- and quasi-experimental designs, claiming that the
researcher has greater control over the manner in which data are collected, measured, and
analyzed. These authors organize their critique of sixteen research designs according to
eight criteria (history, maturation, testing, instrumentation, regression, mortality, selection,
and the intersection of these factors) to evaluate the internal validity of these research
designs and four criteria (the intersection of testing and the treatment, the intersection of
selection and the treatment, reactive arrangements, and the interference between multiple
treatments) to evaluate the external validity of these designs (Campbell & Stanley, 1966).
In true experimental designs, of which Campbell and Stanley (1966) describe three,
the effect of a treatment is measured after randomly assigning study participants to one of
two (or more, depending upon the specific research design) groups. In the most basic

128
experimental design, which includes only two groups, the “treatment” group receives an
experimental treatment and the “control” group does not. Differences in a measured
outcome between the treatment and control groups can then be causally attributed to the
experimental treatment. According to Campbell and Stanley (1966), experimental designs
are the best suited research designs for ensuring the internal validity of a study, meaning
that the effects detected are due to the treatment and not to other causes characteristic of
the treatment group. Randomly assigning study participants to treatment and control groups
serves as “the all-purpose procedure for achieving pretreatment equality of groups, within
known statistical limits” (Campbell & Stanley, 1966, p. 6). Experimental designs are
preferred on account of the purported equivalence between the groups created, whereas
quasi-experimental methods make “extant intact comparison groups of unassured
equivalence” (Campbell & Stanley, 1966, p. 13).
Deaton and Cartwright (2018) provide a general equation (given by Equation 10)
to calculate the effect of a treatment, Ti, on an outcome of interest, Yi, for individual i (p.
3):
𝑌! = 𝛽!𝑇! +&𝛾"𝑥!"
@
"(#
(10)
The difference in the outcome of interest between the treatment and control groups is given
by Equation 11 (Deaton & Cartwright, 2018, p. 4):
𝑌\- − 𝑌\A = �̅�- +&𝛾"-𝑥-!" − 𝑥A!"0@
"(#
(11)
To estimate the average treatment effect (ATE; the beta term in Equation 11), the second
term on the right-hand side (the sum of the covariates, xij for the treatment and control
groups) should be equal to zero, or at least close to zero.

129
Randomization within the experimental designs described by Campbell and Stanley
(1966) is theorized as one way minimize the differences in the xij variables between
treatment and control groups that may also cause the observed effect. The utility of
randomization in experimental design can be traced to work by Fisher (1935).
Randomization is put forth as a process by which individual characteristics that may also
affect the experimental outcome are distributed evenly among the treatment and control
groups so that the researcher can isolate the effect of the treatment. In the limit of many
experimental trials:
[T]he over-representation of the unbalanced causes will sometimes be in the treatments and sometimes in the controls. The imbalance will vary over replications of the trial, and although we cannot see this from our single trial, we should be able to capture its effects on our estimate of the ATE from an estimated standard error. (Deaton & Cartwright, 2018, p. 5)
From this estimated standard error, it is possible to find the associated significance;
however, Deaton and Cartwright (2018) caution that this does not necessarily yield a
correct estimate of the causal effect, a point which will be discussed in greater detail later.
Although Campbell and Stanley (1966) note that randomization of treatment and
control groups ensures the pretreatment equality of these groups, they also contend that
randomized experimental designs have limited external validity, meaning they cannot be
readily generalized to populations not included in the study. Nevertheless, Deaton and
Cartwright (2018) note, “The drive to export and generalize RCTs results is at the core of
the influential ‘what works’ movement across the medical and social sciences. At its most
ambitious, this aims for universal reach” (p. 11). In education, this mentality is evident in
legislation promoting market-based reform as a means for spurring innovation (Recovery
Act, 2009; No Child Left Behind, 2002), and calls to experimentally verify the efficacy of
social policy are evident as early as “Great Society” legislation (Campbell, 1969).

130
Given the over-reliance on RCTs in the social sciences, Deaton and Cartwright
(2018) question its universal applicability, expressing a number of concerns. While
randomization can prove useful, particularly when no prior information regarding the
causal relationship between variables being investigated is available, using prior
information and theory as a basis upon which to build causal analysis is generally superior
(Deaton & Cartwright, 2018; Pearl, 2009a, 2018; Rubin, 1974). In addition, Deaton and
Cartwright (2018) express other concerns over the use of RCTs to estimate causal effects.
Specifically, these authors argue that randomization does not ensure that the treatment and
control groups are truly independent of one another, nor does randomization absolutely
mitigate all group differences. There may be unobserved causes that are unevenly
distributed in the treatment and control groups that affect the estimate of the effect, as will
outliers in one or both groups. With respect to the efficacy of randomization, Deaton and
Cartwright (2018) “strongly contest the often-expressed idea that the ATE calculated from
an RCT is automatically reliable, that randomization automatically controls for
unobservables, or worst of all, that the calculated ATE is true” (p.10).
Given these concerns with randomization, Deaton and Cartwright (2018) illustrate
the fallibility of generalizing results from RCTs through the following example:
Bertrand Russell's chicken (Russell, 1912) provides an excellent example of the limitations to simple extrapolation from repeated successful replication. The bird infers, on repeated evidence, that when the farmer comes in the morning, he feeds her. The inference serves her well until Christmas morning, when he wrings her neck and serves her for dinner. Though this chicken did not base her inference on an RCT, had we constructed one for her, we would have obtained the same result that she did. Her problem was not her methodology, but rather that she did not understand the social and economic structure that gave rise to the causal relations that she observed. (p. 11)
Although RCTs and the experimental designs described by Campbell and Stanley
(1966) are one way to minimize the difference between the covariates of the treatment and

131
control groups in Equation 11, other methods are also available in cases when
randomization is not feasible. Moreover, in contrast to Campbell and Stanley (1966), who
advocated for experimental studies with randomized treatment and control groups as the
only means to evaluate educational interventions, Rubin (1974) argues, “Even if the
position that causal effects of treatments can only be well established from randomized
experiments is taken as applying only to the social sciences in which there are currently
few well-established causal relationships, its implication—to ignore existing observational
data—may be counter-productive” (p. 688). Toward this end, Rubin (1974, 2005) describes
a “counterfactual” approach to evaluating causality using observational data.
Rubin’s “counterfactual” causal framework contends that although an individual
was assigned to a specific group—either treatment or control—it is possible that individual
could have instead been assigned to the other group. In practice it is only possible to
measure one outcome for any given individual, Yi(T), for example, it is presumable that
another outcome for that individual, Yi(C), would have been measured had that individual
been assigned to the control rather than the treatment group. The counterfactual approach
leverages the fact that the difference in the means between two values is equal to the mean
of the difference between two values, and therefore Equation 11 is not necessarily limited
to use exclusively with RCTs (Deaton & Cartwright, 2018; Holland, 1998; Rubin, 1974,
2005; Winship & Morgan, 1999). Through Rubin’s formulation of causality, it is possible
to ascertain causality using observational (nonrandomized) data by finding the average
treatment value from the average control value, 𝑌\- − 𝑌\A, using data in which individuals
were not necessarily assigned to treatment randomly.
Although Rubin provides a framework with which to infer causality through
observational data, it is important to give attention to the manner in which observations are
assigned to the treatment and control groups so as to minimize bias (Winship & Morgan,

132
1999). One such method when inferring causality within observational data involves
matching treatment observations with controls. In matching, individuals in an
observational data set who received a given intervention or treatment of interest are paired
with another individual (or individuals) who did not receive that intervention (Deaton &
Cartwright, 2018; Rosenbaum & Rubin, 1983; Rubin, 1974). These individuals are paired
such that their xij variables are closely aligned, thereby minimizing the summation term in
Equation 11. A variety of methods exist for matching individual observations in
observational data, including propensity score matching in which individuals are paired
such that their average attributes are equal (Rosenbaum & Rubin, 1983) and the creation
of a synthetic control group which is constructed splicing and fusing attributes from a
number of different observational units to form a control unit that closely resembles the
treatment unit in all but receiving the treatment (Abadie et al., 2010)
In addition to the causal methods introduced thus far, Pearl (Bareinboim & Pearl,
2016; Pearl, 2009a, 2009b) has written extensively on the subject of causality using
observational data and has developed his own framework and formulation for causal
inference. Pearl (2009b) writes:
We view the task of causal discovery as an induction game that scientists play against Nature. Nature possesses stable causal mechanisms that, on a detailed level of descriptions, are deterministic functional relationships between variables, some of which are unobservable. These mechanisms are organized in the form of an acyclic structure, which the scientists attempts to identify from the available observations. (p. 43)
To uncover the causal rules of nature, Pearl’s formulation of causality employs structural
equation modeling (SEM) and Bayesian statistics (Pearl, 2009b, 2009a). Through the use
of a directed acyclic graph (DAG), in which the researcher draws arrows between variables
to illustrate the causal structure of the data being analyzed, the researcher is able to both
articulate a conception of causality to be tested and use the DAG to uncover the joint

133
probability function that mathematically articulates the causal effect of the social
phenomena being investigated.
Adopting a Causal Framework
As Pearl (2018) contends, “considering the practical difficulties of conducting an
ideal RCT, observational studies have a definite advantage: they interrogate populations at
their natural habitats, not in artificial environments choreographed by experimental
protocols.” Similar positions have also been taken among researchers investigating student
cognition in science. For example, Sherin (2000) argues for a “genetic” account of
students’ representational capacities over other psychological studies that seek to probe
students’ cognitive mechanisms within highly controlled environments. In framing an
investigation into students’ broader capacities, situated in authentic contexts, a different
view of students’ capabilities is gained, one that is not contrived to fit within the
“laboratory” setting, thereby isolating phenomena that are inextricably linked to the
contexts in which cognition occurs.
While there are certainly circumstances in which the highly controlled experimental
studies are beneficial, such as when little prior information about an intervention or
treatment is known, Pearl’s (2018) contention that there is value in analyzing observational
data that “interrogate populations at their natural habitats” is particularly apt for
investigating school choice. On the one hand, isolating the effect of an intervention through
the “counterfactual” model proposed by Rubin (1974, 2005) is instructive and fairly
intuitive: by controlling for all variables (either through randomization or matching), a
convincing argument can be made for the causal effect of a treatment variable upon an
outcome of interest. The counterfactual method, however, does not have the robustness of
Pearl’s formulation, in which the entire causal structure, including unknown variables, is

134
considered when determining the joint probability function governing causal interaction
(2009b, 2009a).
Although in theory, randomization guarantees the equivalence of the treatment and
control groups in the limit of infinite trials, Deaton and Cartwright (2018) caution that in
fewer trials, the estimate of the causal effect is subject to misinterpretation should the
treatment and control groups have unevenly distributed confounding variables or should
one of these groups have significant outliers in the measured effect. In addition, the use of
matching to ascertain a causal effect presumes that all relevant causal variables are known,
when in fact this is likely not the case in social sciences. As Rubin (1974) articulates,
comparatively few causal relationships are known in the social sciences and in education
research. Toward this end, Pearl’s (2009b, 2009a) formulation of causality is based upon
the premise that Nature has hidden the causal structure from the researcher as a probability
distribution. By perturbing the system, the researcher can infer the causal mechanisms
encoded in this joint probability distribution. This formulation allows for researchers to
infer causal relationships by investigating probabilistic structure in observational data sets.
In the present analysis, I adopt conceptions of causality that allow for cause-and-
effect to be ascertained from nonrandomized, observational data. The charter school
movement has been positioned as an educational reform that will induce innovation and
beget improvements in student outcomes, and legislation enacted that supports charter
schools and other market-based reforms encourages the use of RCTs to determine the
causal effects of these interventions. What ample research shows, including studies that
take advantage of natural experiments like the lottery system that determines charter school
admissions, however, is that charter school impacts are by no means universal (M. A. Clark
et al., 2015; Dobbie & Fryer, 2016; Gleason et al., 2010; Tuttle et al., 2012). Certain “no
excuses” schools are shown to increase student performance on standardized exams and in

135
college enrollment, but these findings neglect to consider the mechanisms within these
specific charter schools that are causally responsible for the observed outcomes. Moreover,
there are concerns that these “no excuses” charter schools are not engaging in culturally
relevant pedagogy, but instead infusing their educational programs with middle-class
values in such a way that neglects diverse students’ cultural traditions and ways of knowing
(McDermott & Nygreen, 2013). By adopting a causal framework in which it is possible to
evaluate the effects of interventions within observational data and by articulating a theory
that explains the causal mechanisms within the social system, it is possible to account for
a variety of factors that can be ignored when pursuing RCTs.
DATA AND SAMPLE
To estimate causal effects of charter schools and alternative certification upon
student outcomes, this study analyzed data from Texas. Data were made available by the
Texas Education Research Center (ERC), which collects and maintains student-, teacher-,
campus-, and district-level data for all public education institutions in Texas. In particular,
the Texas ERC data repository contains student-level demographic, attendance, mobility,
and performance data from the Texas Education Agency (TEA); teacher-level
demographic and certification data from the State Board for Educator Certification
(SBEC); school- and district-level administrative and accountability data from TEA; and
individual-level college admissions, enrollment, and performance data from the Texas
Higher Education Coordinating Board (THEBC). Through unique identifiers, students can
be matched to the schools and courses in which they were enrolled for a given year.
Similarly, teachers can be matched to the schools at which they were employed and the
specific courses they taught for a given year. Prior to the 2011-2012 school year, students
and teachers could be matched through the classes with which both were associated, but

136
matching was not reliable because term (e.g., spring or fall semester) data was not included.
Starting in the 2011-2012 school year, ERC data allowed for students and teachers to be
matched through mutual membership in a given course during a given term, which has
allowed for greater accuracy in teacher-student matching. Given that student-teacher
matching became possible in the 2011-2012 school year, data analyzed in this study draw
from the 2011-2012 to the 2018-2019 school years.
Although the population of Texas public school students, teachers, and
administrators are represented in the data maintained by the Texas ERC, this study uses a
smaller subset of this population. While the number of charter schools has grown
considerably in Texas since they first emerged in the mid-1990’s (see Figure 16 and Figure
17), an overwhelming majority of the schools across Texas are non-charter schools, and
charter schools are concentrated in comparatively few areas (e.g., Austin, Dallas, Houston,
San Antonio, the Rio Grande Valley, and El Paso, as shown in Figure 18). Each of these
geographical areas are either urban, populated with a large proportion of ethnic minority
and socioeconomically disadvantaged populations, or both. Since the goal of this study is
to estimate the joint causal effect of alternative certification and charter schools upon
student outcomes in STEM, it is important to limit the data set to regions in which students
and teachers have access to both charter schools and non-charter schools. The maps in
Figure 18 show the number of charter and non-charter schools in Texas and indicate which
Texas counties are included in the present study. To be included in the analysis, a county
must have had more than one charter school and more than one non-charter school in
operating during a given year.

137
Figure 18. Top left: Map of Texas counties included and non-included in this study. Top right and bottom: Maps showing charter and non-charter middle and high schools in Texas.
The average demographic characteristics of students in charter and non-charter
schools within each of the counties included in this study are provided in Figure 19 and
Figure 20. Figure 19 gives the average racial composition of students in charter and non-
charter schools by Texas county for all years included in the study, and Figure 20 gives the
corresponding plots for special student populations (e.g., economic disadvantage, SPED).

138
Figure 19. Average racial composition of students enrolled in charter and non-charter schools by Texas county for all years included in this study.

139
Figure 20. Average special population composition students enrolled in charter and non-charter schools by Texas county for all years included in the study.

140
As illustrated in Figure 19, the demographic composition by ethnicity of charter
and non-charter schools are, for the most part, comparable within the counties included in
this study. Notable differences between the ethnic characteristics of charter and non-charter
schools include the different percentages of white students attending charter and non-
charter schools in McLennan and Tarrant counties in addition to the different percentages
of Latinx students by sector in Bell, Harris, and Hays counties.
With respect to special populations served in Texas charter and non-charter schools,
Figure 20 indicates that charter schools are more likely than non-charter schools to serve
students labeled “at-risk” for dropping out of school and students eligible for free and
reduced lunch (FRL), particularly in Bell, Bexar, Comal, Hays and Webb counties. By
contrast, charter schools in Tarrant and Taylor counties are less likely than non-charter
schools to serve students labeled “at risk” or eligible for FRL. Finally, in Comal and Hays
counties, charter schools serve a higher percentage of special education (SPED) students
than non-charter schools. Aside from these differences, the compositions of students by
special population in charter and non-charter schools included in this study are relatively
comparable.
The percentage of teachers from alternative and traditional certification programs
in charter and non-charter schools and the ethnic and gender composition of charter and
non-charter public school teachers analyzed in this study by pathway are displayed in
Figure 21. Although both charter and non-charter schools have higher percentages of
teachers from alternative preparation programs, there is a higher percentage of traditionally
certified teachers in non-charter schools than in charter schools. There are more female
teachers in both charter and non-charter schools and the percentage of female teachers from
traditional certification programs is larger than the percentage from alternative
certification. As such, male STEM teachers are more likely to earn alternative certifications

141
than they are to earn standard certifications. With respect to ethnicity, most teachers in both
charter and non-charter schools identify as White. In addition, White and Latinx teachers
are more likely to attend standard teacher preparation programs, whereas Black teachers
are more likely to attend alternative programs.
Figure 21. Demographic characteristics of teachers included in the study by preparation pathway and sector.
In addition to limiting the data analyzed to Texas counties in which both charter
and non-charter schools operate, the student sample is limited to students with valid
“standard” test scores in both 8th and 9th grade. During the time period over which data was
analyzed for this study, several different versions of standardized exams in STEM subjects
were available for students, including linguistically modified versions and versions with

142
accommodations tailored specifically for students qualifying for special education services.
Since modified tests are substantively different from standard exams, comparing student
performance on the same version of the exam from one year to the next is important. As
such, in limiting analysis to students with only valid “standard” scores, it is not possible to
generalize the causal estimate of the joint effect of teacher preparation pathway and school
sector to other sub-populations, such as students qualifying for special education services
or students whose first language is not English.
In the ERC data set, teacher certification is represented in two ways: certification
type (such as standard, alternative, one-year, or emergency certification) and certification
program (such as standard, alternative, or post-baccalaureate). Moreover, THEBC data
include the organization from which each teacher was certified. While there is tremendous
heterogeneity in the types of teacher preparation programs, this work defines traditionally
certified teachers as those who earned a standard certificate (meaning they completed pre-
service teaching before entering the profession) and graduated from a standard, university-
based preparation program. Alternative teachers are those who do meet the definition of
traditional certification operationalized above (including teachers with a standard
certificate from an alternative program or teachers with an alternative certificate from a
standard program). In general, alternative teachers were issued probationary certificates
(meaning their first year in the classroom is occurring concurrently with their participation
in a teacher preparation program) from alternative, non-university based programs. Due to
the fact that this study is interested in comparing traditionally and alternatively certified
teachers, any teacher whose first certificate was neither standard nor alternative was
dropped from the data set.
The crossover design in this study compares students either transitioning from
charter schools or to charter schools between their 8th and 9th grade years. The average

143
demographic characteristics of transitioning students included in the present study for both
mathematics and science are provided in Table 12. This table gives results from matched-
pair t-tests determining whether or not demographic differences between students
transitioning from or to charter schools are statistically significant. As shown, there are
statistically significant differences in the percentages of Asian, Black, economically
disadvantaged, gifted, limited English proficient (LEP), Latinx, SPED, and white students
in these two groups.
Table 12. Paired-sample t-tests comparing average demographics of students transitioning from and to charter schools in the present study.
Mathematics Science From
Charter To
Charter t-Score Sig. From Charter
To Charter t-Score Sig.
% Asian 3.05 3.76 3.52 *** 3.38 4.13 3.62 *** % Black 15.30 18.16 6.94 *** 15.28 17.54 5.64 ***
% Econ. Dis. 74.10 67.15 -13.86 *** 73.53 65.81 -15.50 *** % Gifted 13.97 11.06 -8.20 *** 14.72 12.70 -5.53 ***
% LEP 18.49 15.63 -7.05 *** 17.70 15.12 -6.56 *** % Latinx 69.75 63.51 -12.07 *** 69.25 63.08 -12.07 ***
% Multiracial 1.06 1.10 0.31 1.10 1.17 0.57 % Native Amer. 0.29 0.30 0.08 0.33 0.26 -1.20
% Pacific Islander 0.05 0.08 1.07 0.07 0.07 0.09 % At Risk 45.87 45.64 -0.41 44.42 44.36 -0.11
% SPED 5.93 7.31 5.00 *** 5.22 6.90 6.42 *** Avg. Test Score -18.15 -17.36 0.64 10.58 9.32 -1.07
% White 10.48 13.09 7.30 *** 10.60 13.75 8.82 *** * denotes p < 0.05; ** denotes p <0.01; *** denotes p < 0.001
Despite statistical significance, these differences are typically ~6% or smaller, with
the notable exception that a smaller percentage of economically disadvantaged students
transitions to charter schools than the percentage of economically disadvantaged students
who transfer from charter schools. While demographic terms measuring the association of
student demographic characteristics and test score are included in the model (Equation 12,
discussed in the following section), that there are substantive differences between the
characteristics of students transferring from and to charter schools necessitates that results

144
from this model, especially causal inference, be interpreted with caution. Sector differences
in the types of students who transition into or out of charter schools from 8th to 9th grade
could result from recruiting and retention practices within charter schools (e.g., that charter
schools have reportedly targeted “higher achieving” students through strategic location and
marketing practices).
ANALYTIC METHODS
To estimate the joint causal effects of teacher preparation pathway and school
sector upon student outcomes in STEM disciplines, I employ two casual methods. The first
method is a hybrid crossover, nonrandomized block design, in which data available are
subset to include students switching between sector. These students are then compared
within blocks (schools and counties) to estimate the joint causal effect of teacher
preparation pathway and school sector upon performance in STEM disciplines. For the
second method, I create a DAG to articulate the underlying casual structure of the system
and proceed to use this DAG to develop a statistical model that can be used to estimate the
joint causal effect of teacher preparation pathway and school sector upon student outcomes
in STEM. In the discussion section, I evaluate the merits of these two methods.
Hybrid Crossover and Nonrandomized Block Design
Although the data is not randomized, the crossover and nonrandomized block
design seeks to estimate a causal effect by constructing a sample of comparable students
who have enrolled in both charter and non-charter public schools. Simply comparing
charter and non-charter students may produce biased estimates, as enrolling in a charter
school requires both that a charter school be available to a student and that a student’s
family elects to apply to a charter school. As such, it is likely that charter and non-charter

145
students are substantively different from one another. To control for these differences, this
research design compares students who switched between school sector during the
transition from 8th to 9th grade. Although this does not control for the possible reasons
why a student may switch from a non-charter to a charter school (or vice versa) at this
juncture, it does control for variables associated with enrolling in schools of choice—
namely that students had to apply to a charter school at some point in their educational
trajectory.
In addition to controlling for student differences, it is important to control for school
level environmental and demographic differences that vary by county in Texas. To control
for these differences, this method takes advantage of a nonrandomized block design by
including a fixed effect that accounts for the counties in which charter and non-charter
schools are situated in addition to fixed effects that control for students’ schools. In doing
so, charter and non-charter schools will be compared to other schools that are located in a
similar geographical setting, and students will be compared within their schools. The
counties highlighted in dark blue in the top left panel of Figure 18 are the blocks within
which charter and non-charter schools are compared.
Regression Model
To ascertain the joint effects of teacher preparation pathway and school sector upon
student outcomes in STEM disciplines using a crossover, nonrandomized block design, the
multi-level regression model specified by Equation (12) is constructed:
𝑌!,?,B,C,A = 𝛼! + 𝛼? + 𝛼B + 𝛽+𝑃! + 𝛽*𝐶! + 𝛽!'-𝑃!𝐶! + ∑𝛽.𝑋! + 𝛾C + 𝛾A + 𝜖!- (12)
In Equation (12), Yi,g,y,s,c is the math or science test score (which has been
standardized such that the mean score is 0 and the standard deviation is 1) for student i in

146
grade g, year y, school s, and county c. Alpha terms (ai, ag, and ay) are fixed effects
coefficients for students, grades (8th and 9th), and years (2012 – 2019) included in this
study. Pi is a binary variable indicating whether or not a student’s teacher was certified
through an alternative certification pathway, Ci is a binary variable indicating whether or
not a student attended a charter school, and PiCi is the interaction between pathway and
school sector. The beta coefficients for these terms (bP, bC, and bint) give the causal
estimates for the individual and joint effects of teacher preparation pathway and school
sector upon student learning gains in math and science, as measured by increase or decrease
in math and science exam scores. Xi are demographic characteristics for student i (including
ethnicity, socioeconomic status, and designation as special education (SPED), limited
English proficiency (LEP), and gifted), and the corresponding beta coefficients give the
estimated change in test score associated with these demographic characteristics. The
gamma terms in Equation (12) account for the nonrandomized block design of this
experiment. Due to the fact that this work seeks, in part, to estimate the causal effect of
charter schools, fixed effects coefficients for the schools included in this study would be
collinear with the charter school indicator, Ci. Therefore, gs is a school-level random effects
coefficient to control for school level characteristics. As schools are blocked within county,
gc are fixed effects for county. Including these fixed and random effects coefficients ensures
students are compared within schools and schools are compared within county.
While other studies examining the causal effect of charter schools upon student
outcomes take advantage of the randomized lottery admissions process in oversubscribed
charter schools, doing so is not possible in this work due to the fact that lottery results are
unavailable in the Texas ERC. Nevertheless, by employing a crossover design to identify
students to include in this study and accounting for the “blocks” by which teachers and
campuses are grouped (e.g., county in which each school is located), this method attempts

147
to ensure that adequate comparisons between students’ teachers and schools are conducted
in estimating a causal effect of teacher preparation pathway and school sector upon student
outcomes in STEM.
Directed Acyclic Graphs
Figure 22. Directed acyclic graph illustrating the casual mechanism by which teacher preparation pathway (TPP) and school sector (Sec) are hypothesized to affect student test scores in STEM subjects (St). Red indicates the outcome variable of interest, blue represents the causal effects being estimated, and grey nodes represent other covariates.
In a directed acyclic graph, nodes represent variables and arrows between nodes are
directed to indicate how the two variables are causally related. In Figure 22, a DAG is
provided that shows how school sector and teacher preparation pathway (in addition to a
number of other variables) are hypothesized to impact student performance on standardized
exams in STEM. Arrows pointing from one variable to another, indicate that the first
variable has a causal effect upon the second. For example, the DAG in Figure 22 indicates
that six variables affect a students’ test score in year t (St). These variables are that students’
school in year t (Scht), teacher in year t (Tcht), the joint effect of teacher preparation

148
pathway and school sector (Jnt), student level characteristics (Stu) that will be assumed to
be invariant across time, county level characteristics (Cnty), and the student’s score on the
standardized exam in the prior year (St-1).
The joint effect of teacher preparation pathway and school sector (Jnt) depends
causally upon school sector (Sec) and teacher preparation pathway (TPP), but these effects
are also mediated by individual schools and teachers. Given that teachers seek employment
in schools with ideological match, it is presumable that the joint effect of teacher
preparation pathway and school sector is manifests at the school and teacher level. Thus,
the DAG shows that school sector affects individual schools, teacher preparation pathways
affect teachers, and all four of these variables affect the joint effect of teacher preparation
pathway and school sector upon student performance in STEM disciplines.
In addition, it is important to consider the broader system in which teacher
preparation pathways and charter and non-charter schools operate. These educational
reforms often target certain student populations. The DAG in Figure 22 accounts this by
including a school demographics (SDem) variables, which affect teacher preparation
pathway (TPP), sector (Sec), and individual schools (Sch). Teacher preparation pathways
have mechanisms by which their graduates work in schools serving specific students from
specific demographic backgrounds. Similarly, in the era of school choice, schools are often
positioned such to work with students from specific demographic backgrounds. Individual
student demographic variables (Dem) are also included in the DAG. Causal inference
prohibits demographic variables from being causal variables (e.g., one’s race does not
cause one to have a higher or lower level intelligence) (Pearl, 2009b); however, I include
demographic variables in the DAG to account for the socially constructed nature of both
race and gender. Individual student demographics may causally influence how students are
assigned to teachers within a school, and their demographics may also affect where they

149
choose to go to school. Thus, student race and gender are not causal variables in and of
themselves, but this DAG indicates that these identities have causal relationships due to
the social structure of the educational system. Finally, geographic variables (captured here
as county, Cnty) affect teachers, schools, students, and student test scores. School systems
are parts of a broader community, and the county level variable is meant to account for the
community-level attributes that influence various factors of the school system, including
schools, teachers, students, and even student performance on standardized assessments.
Individual students (Stu) are also included in the DAG, as unobserved student level
characteristics affect their test performance (in both the current and prior year) in addition
to how they interact with a given teacher.
Statistical Models
Of main interest are the effects of preparation pathway, sector, and their interaction
(TPP, Sec, and Jnt) upon student test score (St). In order to obtain an unbiased estimate, it
is important to consider confounding variables—those that affect both treatment and
outcome in the experimental design and to block “back door” paths that cause spurious
correlations between the treatment and the outcome. Statistically, it is possible to condition
on confounding variables and other variables that block back door paths by including these
variables in a regression model. Provided the DAG accurately captures the underlying
causal mechanisms of the system, conditioning on these variables by including them in
regression models serves to reduce bias in the casual estimate of the effect of treatment on
the outcome. Adding additional covariates serves to make this estimate more precise.
Using the R package “ggdag,” the DAG provided in Figure 22 is adjusted to show
the minimally adjusted sets of variables on which it is necessary to condition (adjust) in
order to estimate the joint causal effect of teacher preparation pathway and school sector

150
upon student test scores in math and science. As can be seen, there are four distinct sets of
variables on which it is possible to condition in order to estimate the causal effect of
interest. Each of the decomposed DAGs are provided in Figure 23.
Figure 23. Minimally adjusted sets of the DAG provided in Figure 22.
By adjusting the DAG in Figure 22, giving those shown in Figure 23, it is possible
to develop a model that can be used to estimate the joint effect of teacher preparation

151
pathway and school sector upon student performance on standardized exam performance,
as in Equation (13):
𝑆!B =&𝛽C"𝑆!,BD#"
;
"(#
+𝛽@'-𝑃!𝐶! + 𝛽+𝑃! + 𝛽*𝐶! + ∑𝛽.𝑋! + ∑𝛽E𝑌" + ∑𝛾) + 𝜖! (13)
In this model, students’ scores in mathematics and science in year y are regressed
on their prior year scores (y – 1) to third order, individual and school-wide demographic
characteristics, and flags to indicate whether or not that student was enrolled in a charter
school and to indicate whether or not that student was taught by a teacher from an
alternative certification program. The interaction between teacher preparation pathway and
school sector is the main variable of interest. In addition to these covariates, gamma terms
(indexed by k) represent fixed effects for years y included in the study and random effects
for teacher t school s and county c, so that students are compared within teachers, teachers
are compared within schools, and schools are compared within counties.
Using a DAG to develop the model specified by Equation (13) makes it possible to
evaluate the joint causal effect of teacher preparation pathway and school sector with
greater generalizability. Rather than restricting this model to students switching between
sectors from their 8th to 9th grade years, all 9th grade students enrolled in a school that is
located in a county included are analyzed. Therefore, the causal estimate provided by this
model will have greater external validity than the estimate provided by the model specified
by Equation (12).
RESULTS
Results from both causal methodologies are presented in the following subsections.
First, estimates from the regression model for the hybrid crossover nonrandomized block
design are presented. In the next subsection, results from regression models specified to

152
condition on the variables indicated in the adjusted directed acyclic graphs from Figure 23
are presented.
Crossover Nonrandomized Block Results
Estimates from the multilevel regression model specified by Equation (12) are
provided in Table 13. The beta coefficients for teacher preparation pathway, charter school,
and their interaction together provide a causal estimate of joint effect teacher preparation
pathway and school sector upon student outcomes in math and science.
Table 13. Coefficients from regression model specified for the hybrid crossover, nonrandomized block research design in mathematics and science.
Crossover, Nonrandomized Block Design Mathematics Science
Coefficients Est S.E. Sig. Est. S.E. Sig. Intercept -0.42 0.46 -3.04 0.59 ***
Chart -0.15 0.03 *** -0.04 0.03 Alt. Cert. -0.03 0.01 *** 0.00 0.01
Chart, Alt. Cert. 0.02 0.01 0.01 0.01 Male 0.11 0.06 * 0.47 0.06 ***
Black 0.13 0.06 * 0.12 0.05 * Latinx -0.12 0.05 * -0.01 0.05
Multiracial 0.06 0.06 0.06 0.05 Nat. Am. -0.10 0.07 0.08 0.06 Pac. Isl. -0.40 0.13 ** 0.27 0.09 **
White -0.11 0.05 * 0.03 0.05 9th Grade -0.16 0.04 *** -0.38 0.09 *** Econ. Dis. 0.02 0.01 ** 0.02 0.01 ***
Gifted 0.02 0.01 . -0.03 0.01 * LEP 0.01 0.01 -0.01 0.01
SPED 0.01 0.02 -0.07 0.02 *** *** p < 0.001, ** p < 0.01, * p < 0.05, . p < 0.10
The coefficient for charter schools suggests that students with traditionally certified
teachers in charter schools experience a 0.15 standard deviation decrease on mathematics
exams and a 0.04 standard deviation decrease on science exams as compared to students
taught by traditionally certified teachers in non-charter schools. The coefficient for teacher
preparation indicates that alternatively certified teachers cause students’ test scores to

153
decrease by 0.03 standard deviations in mathematics relative to traditionally certified
teachers in non-charter schools, but there is no effect of alternative certification detected
in science. The effect of alternative certification upon student test scores is not independent
of employment in charter schools, as indicated by the interaction term. The interaction term
suggests that students taught by alternatively certified teachers in charter schools
experience a 0.16 and 0.03 standard deviation decrease on math and science tests,
respectively (these numbers are determined by summing the teacher preparation pathway,
charter school, and interaction term coefficients). The positive interaction term for both
mathematics and science suggests that alternatively certified teachers are more effective in
charter schools than they are in non-charter public schools.
The only statistically significant results detected are for the independent effects of
charter schools and alternative certification upon students’ math scores. The effects of these
reforms are not statistically significant in the model examining students’ performance on
standardized exams in science, and the interaction is not statistically significant in either
model. That the independent causal effects of charter schools and alternative certification
programs are negative in mathematics but undetected in science is consistent with other
causal studies investigating student performance in STEM disciplines in Texas (Marder et
al., 2020). The reason for this difference is unclear but warrants additional investigation.
While positive interaction between charter schools and alternative certification indicates
that alternatively certified teachers are more effective in charter schools than they are in
non-charter public schools, lack of statistical significance brings into question the
robustness and practical significance of this effect. While ideological similarity may attract
certain kinds of teachers to charter schools, it is not clear that this ideological match has
any positive effect upon student performance. At best, this effect may slightly mitigate the

154
independent negative effects of charter schools and alternative certification upon student
performance in STEM.
Regression and DAG Results
Table 14. Regression coefficients for the model specified from the directed acyclic graph adjustments given in Figure 23.
DAG, Campus Averages Mathematics Science
Coefficients Est. S.E. Sig. Est. S.E. Sig. Intercept -0.8 0.08 *** -0.31 0.07 ***
Chart 0.03 0.03 0.07 0.02 ** Alt. Cert. -0.02 0.01 *** 0.00 <0.01
Chart, Alt. Cert. -0.02 0.03 -0.02 0.02 Pre-Score 1 0.76 <0.01 *** 0.60 <0.01 *** Pre-Score 2 0.13 <0.01 *** 0.05 <0.01 *** Pre-Score 3 -0.07 <0.01 *** -0.02 <0.01 ***
Male -0.04 <0.01 *** -0.04 <0.01 *** Black -0.16 <0.01 *** -0.12 <0.01 ***
Latinx -0.15 <0.01 *** -0.12 <0.01 *** Multiracial -0.15 0.01 *** -0.09 0.01 ***
Nat. Am. -0.13 0.01 *** -0.09 0.01 *** Pac. Isl. -0.12 0.01 *** -0.13 0.01 ***
White -0.15 <0.01 *** -0.09 <0.01 *** Econ. Dis. -0.04 <0.01 *** -0.05 <0.01 ***
Gifted 0.15 <0.01 *** 0.16 <0.01 *** LEP -0.03 <0.01 *** -0.08 <0.01 ***
SPED -0.14 <0.01 *** -0.17 <0.01 *** *** p < 0.001, ** p < 0.01, * p < 0.05, . p < 0.10
Results from the regression model specified to condition on the minimally adjusted
sets of variables diagramed in Figure 23 are provided in Table 14 for both mathematics and
science. Estimates from these models paint a different picture than the estimates from the
model constructed for the crossover, nonrandomized block design. As opposed to
consistent negative effects of charter school attendance upon student performance on
student tests in math and science, this model suggests that charter schools are responsible
for increasing students’ scores by 0.03 standard deviations in mathematics and by 0.07
standard deviations in science, an effect that is statistically significant.

155
In mathematics, alternatively certified teachers are estimated to cause a 0.02
standard deviation decrease in students’ math scores in mathematics but have no effect
upon student test scores in science. In contrast to the models specified for the crossover,
nonrandomized design, the interaction between charter schools and alternatively certified
teachers is associated with decreases in students’ test scores in both mathematics and
science, suggesting that alternatively certified teachers in charter schools are less effective
than alternatively certified teachers in non-charter schools; however, these interaction
terms are not statistically significant.
Coefficients indicate that mathematics and science outcomes vary by student
demographic groups. Relative to Asian students, Black, Latinx, multi-racial, Native
American, and Pacific Islander students have lower scores. Students identified as SPED,
LEP, and economically disadvantage also have statistically significant decreases in test
scores for both mathematics and science, while students identified as gifted tend to have
statistically significant increased exam performance.
DISCUSSION
Results from the crossover, nonrandomized block design suggest that although
charter schools and alternatively certified teachers decrease students’ standardized exam
scores in mathematics and science, a positive interaction term between certification
pathway and school sector mitigates the negative effects of these two reforms. This gives
some credibility to the notion that ideological match between a teacher and school may
have a positive effect upon student performance; however, the importance of this effect is
minimal at best, considering that the interaction between school sector and certification
was not statistically significant. Thus, results from this model suggest that the notion of
ideological match between teacher and context does not manifest in any appreciable change

156
in student performance on standardized exams. Of greater concern, particularly in
mathematics, are the negative independent effects of charter schools and alternative
certification programs upon student achievement. This finding should give policy makers
pause when advocating for the continued expansion of charter schools, alternative
certification, and other market-based reforms. The lack of any statistically significant effect
of school sector or teacher preparation pathway in science, particularly in light of
mathematics results, using this research design is puzzling, but consistent with results
reported elsewhere (Marder et al., 2020). This is likely an artifact of how the models were
constructed, namely that the individual campus effects account for greater variation in test
performance.
Results from the regression model designed to condition on variables such to block
“back-door-paths” between the treatment (joint effect of charter school and alternative
certification) and the outcome of interest (student performance on science and mathematics
standardized exams) tell a much different story. Although the negative effect of alternative
certification is robust to both research designs, the effect of charter schools upon student
exam scores is positive in the DAG design, a finding which is statistically significant in
science.
Such discrepant findings necessitate consideration of which estimate should be
trusted. To do so, it is important to discuss the relative merits and drawbacks of each design.
In the crossover design, controlling for student-level factors that may confound the
treatment and the outcome is achieved by limiting analysis to students who switch between
sectors. This assumption may not be valid, as it is possible that students leaving charter
schools after 8th grade have different motivations for switching sector than students
choosing to enroll in charter schools after their 8th grade. Thus, there may be other
unobserved factors that serve to confound the treatment and outcome that were assumed to

157
have been removed when analyzing students who switch sector. Moreover, by inspecting
paired-sample t-tests in Table 12, it is evident there are substantive differences between the
sets of students switching sectors (either to or from charter schools) in their transition from
8th to 9th grade. That differences in the characteristics of students switching from and to
charter schools in the transition from 8th to 9th grade suggests that the causal inferences
from the results reported herein be interpreted with caution. There may be unobserved
confounding variables affecting the estimates obtained from the model specified by
Equation 12.
The results from the regression model specified to match the DAG provided in
Figure 22 are to be trusted if the DAG truly represents the causal mechanisms between the
variables included in the study. If the DAG does not accurately capture the true causal
underpinnings of the educational system analyzed, then the causal estimates are not
reliable. Although this DAG represents one theory about how variables are causally related
to one another, there is fairly little consensus as to the causal structure of social systems in
extant literature. Moreover, the assumptions about what demographic variables mean
substantively (e.g., that these variables capture the causal effects attributed to students’
demographic characteristics through the socially constructed nature of these demographics
and their interaction with a social system) could lead to bias in the statistical model
constructed. Should demographic variables substantively represent something else about a
student’s interaction with the school system, the DAG may have to be modified
accordingly.
The strength of using DAGs to articulate the underlying structure is that they do
not make any assumptions about the functional relationships between variables and that
they force researchers to articulate a causal theory about the system under investigation.
However, doing so is a tremendous challenge, as consensus about causal mechanisms in a

158
social system is not often achieved. Yet, if given a correct causal DAG, results from the
corresponding model can be more readily generalizable. At best, the crossover design can
be generalized to other students who switch sector from one year to the next, a far smaller
set. Moreover, caution is still warranted, as this design does not necessarily require the
articulation of a causal structure and may therefore not account for confounding variables
that serve to bias between the treatment and outcome.
It is worthwhile to note that this study, as are others, is limited in using test scores
to ascertain the differences between “traditional” elements of the public education and
those that have burgeoned in an era of market-based reforms. As Berends and Donaldson
(2016) argue, it is important for research on market-based reforms in education to
investigate the programmatic differences that impact student achievement differences by
sector. Rather than using only test scores as outcomes, research into student course-taking
patterns, college success, and other metrics can elucidate the effects of market-based
reforms in more substantive ways. While test score data is instructive in illustrating the
efficacy of different educational reform efforts, in this case charter schools and alternative
teacher certification pathways, research moving forward should investigate the ways in
which these reforms have affected student engagement in and access to STEM more
broadly.

159
Chapter 5: Conclusion
The broad goal of this dissertation project was to evaluate how the growth of
market-based reforms in within public education—specifically charter schools and
alternative teacher certification pathways—have impacted participation and engagement in
STEM, particularly among ethnic minority student populations that have been historically
underrepresented in STEM disciplines. Poor performance in STEM disciplines and
inequitable educational attainment are two often cited shortcomings critics attribute the
“traditional” public education system. Although charter schools and alternative
certification pathways were not created specifically to address these shortcomings, policy
documents and advocates of market-based education have offered these specific reforms
as means by which to achieve improved educational outcomes. Therefore, if improving
performance in the STEM disciplines and reforming the education system to lead to more
equitable educational outcomes among a socioeconomically diverse student populations
are priorities leading to calls for education reform, then it is pertinent to investigate the role
of market-based reforms in achieving these metrics.
In addition to evaluating market-based education reforms using metrics that have
been cited to garner national support for the expansion of these reforms, it is also important
for research to attend to the mechanisms that explain differential student outcomes by
teacher preparation pathway and school sector and to analyze STEM outcomes more
generally, looking beyond performance on standardized exams. Research that compares
student outcomes by sector and preparation pathway is of limited utility, as these results
cannot be used to inform policy makers of the best practices that are most likely to yield to
positive student outcomes. Similarly, research that uses only performance on standardized
exams to evaluate the efficacy of education reform fails to account for a breadth of
outcomes that are arguably more meaningful for students. Calls to attend to the mechanism

160
responsible for the effects of educational reforms and to a broader definition of “outcomes”
acknowledge the complexity and nuance of the public education system, whereas the
capacity of other studies to do so is limited.
If the success of education reforms is measured by their abilities to improve student
outcomes in STEM disciplines and to lead to equitable educational outcomes by across
diverse socioeconomic demographics, then charter schools and alternative teacher
certification programs leave much to be desired. While some prior evidence has shown
that, in certain contexts, charter schools improve student performance on standardized
exams and increase college enrollment (Davis & Heller, 2017; Dobbie & Fryer, 2015,
2016), results from the first study indicate that the breadth of these successes is fairly
minimal. While charter schools do increase student enrollment in post-secondary
institutions, charter schools do not appear to equip students with the tools they need to
succeed at post-secondary institutions nor do they increase the likelihood that students
pursue STEM disciplines. That charter schools, which tend to serve socioeconomically
disadvantaged student populations, increase college enrollment, but do not appreciably
increase post-secondary attainment is of concern, considering the high price tag of post-
secondary education. If students are in positions to acquire debt without realizing the
benefits of post-secondary education (namely a degree), this may serve exacerbate
economic disparities in the long term.
Often, charter schools aggressively target standardized exams and post-secondary
enrollment and cite success with these two metrics as evidence of their success in a more
general sense. Given the political and public scrutiny facing the public education system
writ large, all schools are incentivized to improve standardized test scores and college
enrollment rates (which are often reported publicly). With greater autonomy than district
schools, one plausible explanation that some charter schools are more effective at

161
improving test performance and college enrollment is that they have greater latitude with
which to target these outcomes specifically (e.g., such as additional instructional time that
can be used to give students more practice on standardized exams). That charter schools
do not affect more important outcomes (degree attainment or STEM degree) suggests that
their benefit is temporally limited. Moreover, results from earlier work exploring STEM
course taking patterns in charter and non-charter schools (David et al., 2020) suggest
charter schools have more limited course options. It is plausible that these educational
limitations may allow charter schools to be more effective at achieving immediate
outcomes (test score improvements and college enrollment) without appreciably improving
long-term student outcomes, which are arguably more important.
While charter schools and alternative teacher certification programs are distinct
education reforms with unique histories, I argue their concurrent expansion motivated over
similar concerns about the public education system render these reforms interdependent.
As descriptive results from Texas shows, alternatively certified teachers are
overrepresented in charter schools. Thus, it is important for education policy researchers
to jointly consider charter schools and alternative certification pathways. Extant literature
that has largely explored these reforms independently does not account for the ways in
which these reforms are ideologically and practically aligned.
The effects of alternative teacher certification programs in two of the three
studies—investigating course assignment and identifying a joint causal effect of charter
schools and alternative certification—suggest that alternatively certified teachers are less
effective than traditionally certified teachers in STEM. The negative effects of alternative
certification were robust to both causal models constructed in Chapter 4, and alternative
certification is associated with increased turnover and a higher likelihood of being assigned
to elective STEM courses, rather than to advanced or tested STEM courses. These trends

162
are concerning, particularly considering that elective STEM courses escape the scrutiny of
high-stakes accountability. While I do not argue that high-stakes accountability is a positive
aspect of the current public education system, that alternatively certified teachers are shown
to decrease student outcomes on standardized exams and also systematically transferred to
courses where these negative impacts cannot be detected may mask the true breadth of how
alternative certification impacts student performance.
Another finding that warrants concern is that both charter schools and alternative
certification are associated with higher mobility. Alternatively certified teachers and
teachers in charter schools are more likely to leave the profession or to transfer to new
courses and/or new schools. Teachers with more experience are often more effective, so it
is troubling that charter schools and alternative certification lead to higher turnover,
particularly when considering that alternative teachers are more likely to work in charter
schools. Rather than providing students with a better education, the joint impact of turnover
that alternative certification and charter school employment has upon students in the
“parallel” education system could serve to exacerbate already troubling achievement gaps
along socioeconomic lines.
While much of the existing research on charter schools and alternative certification
programs has pit these two reforms against their corresponding elements in the traditional
public education structure, I argue it is important to continue for researchers to attend to
the mechanisms by which differential outcomes between market-based institutions and
traditional institutions are achieved. By doing so, it may be possible to unearth structures
that may have greater influence upon student achievement than sector and certification
differences. For example, the effects of secondary STEM course-taking upon students’
post-secondary attainment is more robust than the effects of sector. Although there are
some significant interactions between these two variables, the effects of course-taking were

163
more robust to the models included in the first study. As such, differences between sector
may not be as important as different school practices. Moreover, in attending to
mechanisms within schools that may be related to differential student outcomes, other
insights become evident and may warrant policy attention, such as the increased mobility
in charter schools that is further exacerbated by high mobility among alternatively certified
teachers.
I do not think the results from the studies included in this dissertation point
conclusively to whether or not market-based reforms are better than the traditional
structure. However, it is clear that they have not been successful at improving educational
outcomes in areas that have been identified as priorities. Nevertheless, focusing only upon
sector differences often neglects consideration other systematic elements of the education
system that may more pervasively serve to uphold structures leading to equity. In the debate
over market-based reforms, it is particularly important to consider these elements in order
to achieve the goals for equity, STEM education, and equity within STEM education.

164
References Abadie, A., Diamond, A., & Hainmueller, J. (2010). Synthetic Control Methods for
Comparative Case Studies: Estimating the Effect of California’s Tobacco Control Program. Journal of the American Statistical Association, 105(490), 493–505.
Adelman, N. E., Michie, J., & Bogart, J. (1986). An Exploratory Study of Teacher Alternative Certification and Retraining Programs (p. 163) [Research/Technical]. Policy Studies Associates, Inc. https://eric.ed.gov/?id=ED277692
Adzima, K. A. (2017). College Readiness: Are California Charter School Students Better Prepared? Economic Affairs, 37(2), 182–196. https://doi.org/10.1111/ecaf.12229
America 2000: An Education Strategy. Sourcebook (Viewpoints ED 0S91-31; p. 82). (1991). Department of Education. https://eric.ed.gov/?id=ED327985
American Recovery and Reinvestment Act of 2009, Pub. L. No. 111- 5 [H. R. 1] (2009). Anderson, M. (2018, November 15). Charter Schools Program.
https://innovation.ed.gov/files/2015/03/CSP-DCL.pdf Angrist, J. D., Cohodes, S. R., Dynarski, S. M., Pathak, P. A., & Walters, C. R. (2016).
Stand and Deliver: Effects of Boston’s Charter High Schools on College Preparation, Entry, and Choice. Journal of Labor Economics, 34(2), 275–318. https://doi.org/10.1086/683665
Apple, M. W. (2007). Ideological Success, Educational Failure? On the Politics of No Child Left Behind. Journal of Teacher Education, 58(2), 108–116. https://doi.org/10.1177/0022487106297844
Banks, J. A. (1993). Multicultural Education: Historical Development, Dimensions, and Practice. Review of Research in Education, 19, 3–49. https://doi.org/10.2307/1167339
Bareinboim, E., & Pearl, J. (2016). Causal inference and the data-fusion problem. Proceedings of the National Academy of Sciences, 113(27), 7345–7352. https://doi.org/10.1073/pnas.1510507113
Begg, C. B., & Gray, R. (1984). Calculation of Polychotomous Logistic Regression Parameters Using Individualized Regressions. Biometrika, 71(1), 11–18. https://doi.org/10.2307/2336391
Berends, M., & Donaldson, K. (2016). Does the Organization of Instruction Differ in Charter Schools? Ability Grouping and Students’ Mathematics Gains. Teachers College Record, 118(11), 1–38.
Berends, M., Goldring, E., Stein, M., & Cravens, X. (2010). Instructional conditions in charter schools and students’ mathematics achievement gains. American Journal of Education, 116(3), 303–335.

165
Bierlein, L. A., & Mulholland, L. A. (1994). The promise of charter schools. Educational Leadership, 52, 34.
Borgatti, S. P., & Ofem, B. (2010). Overview: Social Network Analysis and Theory. In A. J. Daly & J. W. Little (Eds.), Social Network Theory and Educational Change. Harvard Education Press.
Boyd, D., Grossman, P., Lankford, H., Loeb, S., & Wyckoff, J. (2006). How Changes in Entry Requirements Alter the Teacher Workforce and Affect Student Achievement. Education Finance and Policy, 1(2), 176–216. https://doi.org/10.1162/edfp.2006.1.2.176
Boyd, D., Grossman, P., Lankford, H., Loeb, S., & Wyckoff, J. (2008). Who Leaves? Teacher Attrition and Student Achievement. NBER Working Paper Series, 14022. https://doi.org/10.3386/w14022
Budde, R. (1988). Education by Charter: Restructuring School Districts. Key to Long-Term Continuing Improvement in American Education. https://eric.ed.gov/?id=ED295298
Bush, G. (1991). America 2000. Congressional Digest, 70(12), 294. Campbell, D. T. (1969). Reforms as experiments. American Psychologist, 24(4), 409–429.
https://doi.org/10.1037/h0027982 Campbell, D. T., & Stanley, J. C. (1966). Experimental and quasi-experimental designs for
research. R. McNally. Cannata, M. (2011). Charter Schools and the Teacher Job Search. Journal of School
Choice, 5(1), 111–133. https://doi.org/10.1080/15582159.2011.548256 Cannata, M., & Penaloza, R. (2012). Who Are Charter School Teachers? Comparing
Teacher Characteristics, Job Choices, and Job Preferences. Education Policy Analysis Archives, 20(0). https://doi.org/10.14507/epaa.v20n29.2012
Carnegie Forum on Education and the Economy (Ed.). (1986). A nation prepared: Teachers for the 21st century. The Forum.
Carnevale, A. P., Cheah, B., & Hanson, A. R. (2015). The Economic Value of College Majors. Georgetown University Center on Education and the Workforce.
Carolan, B. (2014). Social Network Analysis and Education: Theory, Methods & Applications. SAGE Publications, Inc. https://doi.org/10.4135/9781452270104
Carruthers, C. K. (2012). New schools, new students, new teachers: Evaluating the effectiveness of charter schools. Economics of Education Review, 31(2), 280–292. https://doi.org/10.1016/j.econedurev.2011.06.001
Cheng, A., Hitt, C., Kisida, B., & Mills, J. N. (2017). “No Excuses” Charter Schools: A Meta-Analysis of the Experimental Evidence on Student Achievement. Journal of School Choice, 11(2), 209–238. https://doi.org/10.1080/15582159.2017.1286210

166
Chingos, M. M., & West, M. R. (2011). Promotion and reassignment in public school districts: How do schools respond to differences in teacher effectiveness? Economics of Education Review, 30(3), 419–433. https://doi.org/10.1016/j.econedurev.2010.12.011
Clark, C. (2000). Texas Charter Schools: New Choices for Texas Families. The Clearing House, 74(2), 64–69.
Clark, C. S. (2002). Charter Schools: Will they improve or hurt public education? CQ Researcher, 12(44), 1033–1056.
Clark, M. A., Gleason, P. M., Tuttle, C. C., & Silverberg, M. K. (2015). Do Charter Schools Improve Student Achievement? Educational Evaluation and Policy Analysis, 37(4), 419–436. https://doi.org/10.3102/0162373714558292
Clauset, A., Newman, M. E. J., & Moore, C. (2004). Finding community structure in very large networks. Physical Review E, 70(6). https://doi.org/10.1103/PhysRevE.70.066111
Clotfelter, C. T., Ladd, H. F., & Vigdor, J. L. (2006). Teacher-Student Matching and the Assessment of Teacher Effectiveness. The Journal of Human Resources, 41(4), 778–820.
Curto, V. E., & Fryer, R. G. (2014). The Potential of Urban Boarding Schools for the Poor: Evidence from SEED. Journal of Labor Economics, 32(1), 65–93. https://doi.org/10.1086/671798
Darling-Hammond, L. (2000). How Teacher Education Matters. Journal of Teacher Education, 51(3), 166–173. https://doi.org/10.1177/0022487100051003002
David, B. G. (2018). Examining “Choice”: Identifying STEM Course-Offerings and Course-Taking Patterns in Charter and Non-Charter Public Schools through Social Network Analysis and Community Detection [M.A.]. The University of Texas at Austin.
David, B. G., Marder, M., Marshall, J., & González-Howard, M. (2020). How do students experience choice? Exploring STEM course-offerings and course-taking patterns in Texas charter and non-charter public schools. Education Policy Analysis Archives, 28(0), 123. https://doi.org/10.14507/epaa.28.4484
David, B. G., & Marder, M. P. (2018, April). Teacher Assignment in Response to High-Stakes Testing. American Educational Research Association 2018 Annual Meeting, New York, NY.
Davis, M., & Heller, B. (2019). No Excuses Charter Schools and College Enrollment: New Evidence from a High School Network in Chicago. Education Finance and Policy. https://doi.org/10.1162/edfp_a_00244

167
Deaton, A., & Cartwright, N. (2018). Understanding and misunderstanding randomized controlled trials. Social Science & Medicine, 210, 2–21. https://doi.org/10.1016/j.socscimed.2017.12.005
Secretary’s Proposed Supplemental Priorities and Definitions for Discretionary Grant Programs, Department of Education, 82 FR 47484 47484 (2017).
Dieterle, S., Guarino, C. M., Reckase, M. D., & Wooldridge, J. M. (2015). How do Principals Assign Students to Teachers? Finding Evidence in Administrative Data and the Implications for Value Added. Journal of Policy Analysis and Management, 34(1), 32–58. https://doi.org/10.1002/pam.21781
Dobbie, W., & Fryer, R. G. (2011). Are High-Quality Schools Enough to Increase Achievement Among the Poor? Evidence from the Harlem Children’s Zone. American Economic Journal: Applied Economics, 3(3), 158–187.
Dobbie, W., & Fryer, R. G. (2013). Getting Beneath the Veil of Effective Schools: Evidence From New York City. American Economic Journal: Applied Economics, 5(4), 28–60.
Dobbie, W., & Fryer, R. G. (2015). The Medium-Term Impacts of High-Achieving Charter Schools. Journal of Political Economy, 123(5), 985–1037. https://doi.org/10.1086/682718
Dobbie, W., & Fryer, R. G. (2016). Charter Schools and Labor Market Outcomes (Working Paper No. 22502). National Bureau of Economic Research. http://www.nber.org/papers/w22502
Donaldson, M. L. (2013). Principals’ Approaches to Cultivating Teacher Effectiveness: Constraints and Opportunities in Hiring, Assigning, Evaluating, and Developing Teachers. Educational Administration Quarterly, 49(5), 838–882. https://doi.org/10.1177/0013161X13485961
Donaldson, M. L., & Johnson, S. M. (2010). The Price of Misassignment: The Role of Teaching Assignments in Teach For America Teachers’ Exit From Low-Income Schools and the Teaching Profession. Educational Evaluation and Policy Analysis, 32(2), 299–323. https://doi.org/10.3102/0162373710367680
Feng, L. (2010). Hire Today, Gone Tomorrow: New Teacher Classroom Assignments and Teacher Mobility. Education Finance and Policy, 5(3), 278–316. https://doi.org/10.1162/EDFP_a_00002
Fisher, R. A. (1935). The design of experiments. Oliver & Boyd. Fortunato, S. (2010). Community detection in graphs. Physics Reports, 486(3), 75–174.
https://doi.org/10.1016/j.physrep.2009.11.002 Fraser, J. W. (2007). Preparing America’s teachers: A history. Teachers College Press.

168
Friedman, M. (2002). Capitalism and Freedom: Fortieth Anniversary Edition. University of Chicago Press. http://ebookcentral.proquest.com/lib/utxa/detail.action?docID=432222
Gleason, P., Clark, M. A., Tuttle, C., & Dwoyer, E. (2010). The evaluation of charter school impacts. U.S. Dept. of Education, National Center for Education Evaluation and Regional Assistance, Institute of Education Sciences.
Glomm, G., Harris, D., & Lo, T.-F. (2005). Charter school location. Economics of Education Review, 24(4), 451–457. https://doi.org/10.1016/j.econedurev.2004.04.011
Goals 2000: Educate America Act, Pub. L. No. 103- 227 [H.R. 1804] (1994).
Guggenheim, D. (2010). Waiting for “Superman.” Paramount Home Entertainment. Gulosino, C., & dEntremont, C. (2011). Circles of influence: An analysis of charter school
location and racial patterns at varying geographic scales. Education Policy Analysis Archives, 19(0), 8. https://doi.org/10.14507/epaa.v19n8.2011
Gulosino, C., Ni, Y., & Rorrer, A. K. (2019). Newly Hired Teacher Mobility in Charter Schools and Traditional Public Schools: An Application of Segmented Labor Market Theory. American Journal of Education, 125(4), 547–592. https://doi.org/10.1086/704096
Gutiérrez, K. D., & Rogoff, B. (2003). Cultural Ways of Learning: Individual Traits or Repertoires of Practice. Educational Researcher, 32(5), 19–25.
Gwynne, J. A., & Moore, P. T. (2017). Chicago’s Charter High Schools: Organizational Features, Enrollment, School Transfers, and Student Performance. Research Report. University of Chicago Consortium on School Research. https://eric.ed.gov/?id=ED589677
Hanushek, E. A., Kain, J. F., Rivkin, S. G., & Branch, G. F. (2007). Charter school quality and parental decision making with school choice. Journal of Public Economics, 91(5), 823–848. https://doi.org/10.1016/j.jpubeco.2006.09.014
Hanushek, E. A., & Rivkin, S. (2010). Constrained Job Matching: Does Teacher Job Search Harm Disadvantaged Urban Schools? NBER Working Paper Series, 15816. https://doi.org/10.3386/w15816
Hanushek, E. A., Rivkin, S. G., & Schiman, J. C. (2016). Dynamic effects of teacher turnover on the quality of instruction. Economics of Education Review, 55, 132–148. https://doi.org/10.1016/j.econedurev.2016.08.004
Harris, D. N., & Sass, T. R. (2011). Teacher training, teacher quality and student achievement. Journal of Public Economics, 95(7), 798–812. https://doi.org/10.1016/j.jpubeco.2010.11.009

169
Heise, M. (1994). Goals 2000: Educate America Act: The Federalization and Legalization of Educational Policy. Cornell Law Faculty Publications. https://scholarship.law.cornell.edu/facpub/693
Holland, D. C. (1998). Identity and agency in cultural worlds. Harvard University Press. https//catalog.hathitrust.org/Record/004008127
Holmes Group (Ed.). (1986). Tomorrow’s teachers: A report of the Holmes Group. Holmes Group.
IDEA Results. (n.d.). IDEA Public Schools. Retrieved February 13, 2020, from https://ideapublicschools.org/our-approach/results/
Jabbar, H. (2015). “Every Kid Is Money”: Market-Like Competition and School Leader Strategies in New Orleans. Educational Evaluation and Policy Analysis, 37(4), 638–659. https://doi.org/10.3102/0162373715577447
Jabbar, H., Castro, A., & Germain, E. (2019). To Switch or Not to Switch? The Influence of School Choice and Labor Market Segmentation on Teachers’ Job Searches. Educational Evaluation and Policy Analysis, 41(3), 375–399. https://doi.org/10.3102/0162373719857689
Kane, T. J., Rockoff, J. E., & Staiger, D. O. (2008). What does certification tell us about teacher effectiveness? Evidence from New York City. Economics of Education Review, 27(6), 615–631. https://doi.org/10.1016/j.econedurev.2007.05.005
KIPP Results. (n.d.). KIPP Public Charter Schools. Retrieved February 13, 2020, from https://www.kipp.org/results/national/
Koerner, J. D. (1954, November). Can our teachers read and write? Harper’s Magazine. https://harpers.org/archive/1954/11/can-our-teachers-read-and-write/
Koerner, J. D. (1963). The miseducation of American teachers. Houghton Mifflin. Koller, K., & Welsch, D. M. (2017). Location decisions of charter schools: An examination
of Michigan. Education Economics, 25(2), 158–182. https://doi.org/10.1080/09645292.2016.1203866
Kretchmar, K. (2014). The Revolution Will Be Privatized: Teach for America and Charter Schools. Urban Review: Issues and Ideas in Public Education, 46(4), 632–653.
Kretchmar, K., Sondel, B., & Ferrare, J. J. (2014). Mapping the Terrain: Teach for America, Charter School Reform, and Corporate Sponsorship. Journal of Education Policy, 29(6), 742–759.
Kronholz, J. (2012). Teaching the teachers: Achievement Network offers support for data-driven instruction. Education Next, 12(3), 8.
Labaree, D. F. (1996). The Trouble with Ed Schools. The Journal of Educational Foundations, 10(3), 27–45.

170
Labaree, D. F. (1997). Public Goods, Private Goods: The American Struggle over Educational Goals. American Educational Research Journal, 34(1), 39–81. https://doi.org/10.2307/1163342
Labaree, D. F. (2004). The trouble with ed schools. Yale University Press. Lacireno-Paquet, N., Holyoke, T. T., Moser, M., & Henig, J. R. (2002). Creaming Versus
Cropping: Charter School Enrollment Practices in Response to Market Incentives. Educational Evaluation and Policy Analysis, 24(2), 145–158. https://doi.org/10.3102/01623737024002145
Lefebvre, E., & Thomas, M. A. (2017). ‘Shit shows’ or ‘like-minded schools’: Charter schools and the neoliberal logic of Teach For America. Journal of Education Policy, 32(3), 357–371. https://doi.org/10.1080/02680939.2017.1280184
Loeb, S., Kalogrides, D., & Béteille, T. (2012). Effective Schools: Teacher Hiring, Assignment, Development, and Retention. Education Finance and Policy, 7(3), 269–304. JSTOR.
Logan, J. R., & Burdick-Will, J. (2016). School Segregation, Charter Schools, and Access to Quality Education. Journal of Urban Affairs, 38(3), 323–343. https://doi.org/10.1111/juaf.12246
Lubienski, C. (2003). Innovation in Education Markets: Theory and Evidence on the Impact of Competition and Choice in Charter Schools. American Educational Research Journal, 40(2), 395–443. https://doi.org/10.3102/00028312040002395
Ludlow, C. (2013). Alternative Certification Pathways Filling a Gap? Education and Urban Society, 45(4), 440–458. https://doi.org/10.1177/0013124511413916
Lutz, F. W., & Hutton, J. B. (1989). Alternative Teacher Certification: Its Policy Implications for Classroom and Personnel Practice. Educational Evaluation and Policy Analysis, 11(3), 237–254. https://doi.org/10.2307/1163619
MacQueen, J. (1967). Some methods for classification and analysis of multivariate observations. Proceedings of the Fifth Berkeley Symposium on Mathematical Statistics and Probability, Volume 1: Statistics. https://projecteuclid.org/euclid.bsmsp/1200512992
Maloney, P., & McKenzie-Thompson, K. (2013). “I Want More”: Does a Divide between Charter and Public School Teachers Cause Different Desires for Certification Programs? Journal of the National Association for Alternative Certification, 8(2), 3–22.
Marder, M., David, B., & Hamrock, C. (2020). Math and science outcomes for students of teachers from standard and alternative pathways in Texas. Education Policy Analysis Archives, 28(27). https://doi.org/10.14507/epaa.28.4863

171
Martin, M., & Burke, D. (1990). What’s Best for Children in the Schools-of-Choice Movement? Educational Policy, 4(2), 73–91. https://doi.org/10.1177/0895904890004002003
Martinez, M. A., Vega, D., & Marquez, J. (2019). Latinx students’ experiences with college access and preparation at college preparatory charter schools. Journal of Latinos and Education, 18(1), 28–41. https://doi.org/10.1080/15348431.2017.1418353
McDermott, K. A., & Nygreen, K. (2013). Educational New Paternalism: Human Capital, Cultural Capital, and the Politics of Equal Opportunity. Peabody Journal of Education, 88(1), 84–97. https://doi.org/10.1080/0161956X.2013.752634
McMurrin, S. M. (1963). Introduction. In The miseducation of American teachers (pp. ix–xiv). Houghton Mifflin.
Metcalf, H. (2010). Stuck in the Pipeline: A Critical Review of STEM Workforce Literature. InterActions: UCLA Journal of Education and Information Studies, 6(2). http://escholarship.org/uc/item/6zf09176
Mungal, A. S. (2016). Teach for America, Relay Graduate School, and the Charter School Networks: The Making of a Parallel Education Structure. Education Policy Analysis Archives, 24(12–18), 1–26. https://doi.org/10.14507/epaa.24.2037
NAPCS. (2018). Charter School Data Dashboard. National Alliance of Public Charter Schools. http://dashboard.publiccharters.org/dashboard/schools/year/2014
Nasir, N. S., & Hand, V. M. (2006). Exploring Sociocultural Perspectives on Race, Culture, and Learning. Review of Educational Research, 76(4), 449–475.
National Center for Education Statistics. (2018). Digest of Education Statistics, 2016 (NCES 2017-094). U.S. Department of Education, Institute of Education Sciences. http://nces.ed.gov/programs/digest/d15/tables/dt15_322.30.asp
National Center for Education Statistics. (2019). Digest of Education Statistics, 2017 (NCES 2018-070). U.S. Department of Education, Institute of Education Sciences.
National Commission on Excellence in Education. (1983). A Nation at Risk: The Imperative for Educational Reform. The Elementary School Journal, 84(2), 113–130. https://doi.org/10.1086/461348
Newman, M. E. J. (2006). Modularity and Community Structure in Networks. Proceedings of the National Academy of Sciences of the United States of America, 103(23), 8577–8582.
Newman, M. E. J., & Girvan, M. (2004). Finding and evaluating community structure in networks. Physical Review E, 69(2). https://doi.org/10.1103/PhysRevE.69.026113
No Child Left Behind Act of 2001, Pub. L. No. 107- 110. [H.R. 1] (2002).

172
Ost, B., & Schiman, J. C. (2015). Grade-specific experience, grade reassignments, and teacher turnover. Economics of Education Review, 46, 112–126. https://doi.org/10.1016/j.econedurev.2015.03.004
Pearl, J. (2009a). Causal inference in statistics: An overview. Statistics Surveys, 3, 96–146. https://doi.org/10.1214/09-SS057
Pearl, J. (2009b). Causality: Models, reasoning, and inference (2nd ed). Cambridge University Press.
Pearl, J. (2018, March 10). Challenging the Hegemony of Randomized Controlled Trials: Comments on Deaton and Cartwright. Causal Analysis in Theory and Practice. http://causality.cs.ucla.edu/blog/index.php/2018/03/10/challenging-the-hegemony-of-randomized-controlled-trials-comments-on-deaton-and-cartwright/
Place, K., Gleason, P., National Center for Education Evaluation and Regional Assistance (ED), & Mathematica Policy Research, Inc. (2019). Do Charter Middle Schools Improve Students’ College Outcomes? Evaluation Brief. NCEE 2019-4005 (National Center for Education Evaluation and Regional Assistance. Available from: ED Pubs. P.O. Box 1398, Jessup, MD 20794-1398. Tel: 877-433-7827; Web site: http://ies.ed.gov/ncee/). National Center for Education Evaluation and Regional Assistance.
Player, D. (2010). Nonmonetary Compensation in the Public Teacher Labor Market. Education Finance and Policy, 5(1), 82–103. https://doi.org/10.1162/edfp.2009.5.1.5105
Preston, C., Goldring, E., Berends, M., & Cannata, M. (2012). School innovation in district context: Comparing traditional public schools and charter schools. Economics of Education Review, 31(2), 318–330. https://doi.org/10.1016/j.econedurev.2011.07.016
Rosenbaum, P. R., & Rubin, D. B. (1983). The Central Role of the Propensity Score in Observational Studies for Causal Effects. Biometrika, 70(1), 41–55. https://doi.org/10.2307/2335942
Rothwell, J. (2013). The Hidden STEM Economy. Brookings Institution. Rubin, D. B. (1974). Estimating causal effects of treatments in randomized and
nonrandomized studies. Journal of Educational Psychology, 66(5), 688–701. https://doi.org/10.1037/h0037350
Rubin, D. B. (2005). Causal Inference Using Potential Outcomes. Journal of the American Statistical Association, 100(469), 322–331. https://doi.org/10.1198/016214504000001880
Rudolph, J. L. (2002). Scientists in the Classroom: The Cold War Reconstruction of American Science Education (1st ed). Palgave.

173
Russell, B. (1912). The problems of philosophy (New and rev. ed). Williams and Norgate ; H. Holt.
Salzman, H. (2013). What Shortages? The Real Evidence About the STEM Workforce. Issues in Science & Technology, 29(4), 58–67.
Sass, T. R., Zimmer, R. W., Gill, B. P., & Booker, T. K. (2016). Charter High Schools’ Effects on Long-Term Attainment and Earnings. Journal of Policy Analysis and Management, 35(3), 683–706. https://doi.org/10.1002/pam.21913
Saultz, A., & Yaluma, C. (2017). Equal Access? Analyzing Charter Location Relative to Demographics in Ohio. Journal of School Choice, 11(3), 458–476. https://doi.org/10.1080/15582159.2017.1345239
Sedlak, M. (1989). Let Us Go and Buy a School Master. In D. R. Warren (Ed.), American teachers: Histories of a profession at work (pp. 257–290). Macmillan.
Sherin, B. L. (2000). How students invent representations of motion: A genetic account. The Journal of Mathematical Behavior, 19(4), 399–441. https://doi.org/10.1016/S0732-3123(01)00052-9
Shokraii, N. (1996, December). Free at last: Black America signs up for school choice. Policy Review; Washington, 80, 20–26.
Smith, F. L. (1996, June 1). Lessons from a nation at risk. Vital Speeches of the Day; Chicago, 62(16), 489.
Spees, L. P. 1. (2019). Evaluating Non-Cognitive Skills among Students Switching Into and Out of Charter Schools in North Carolina. Journal of School Choice, 13(2), 135–157. https://doi.org/10.1080/15582159.2018.1560856
Stallings, D. T. (2002). A Brief History of the U.S. Department of Education, 1979-2002. The Phi Delta Kappan, 83(9), 677–683.
Steele, J. L., Pepper, M. J., Springer, M. G., & Lockwood, J. R. (2015). The distribution and mobility of effective teachers: Evidence from a large, urban school district. Economics of Education Review, 48, 86–101. https://doi.org/10.1016/j.econedurev.2015.05.009
Stern, M. (2013). Bad Teacher: What Race to the Top Learned From the “race to the bottom.” Journal for Critical Education Policy Studies (JCEPS), 11(3), 194–229.
Stitzlein, S., & West, C. (2014). New Forms of Teacher Education: Connections to Charter Schools and Their Approaches. Democracy and Education, 22(2). https://democracyeducationjournal.org/home/vol22/iss2/2
Stoddard, C., & Corcoran, S. P. (2007). The political economy of school choice: Support for charter schools across states and school districts. Journal of Urban Economics, 62(1), 27–54. https://doi.org/10.1016/j.jue.2006.08.006

174
Suell, J. L., & Piotrowski, C. (2007). Alternative teacher education programs: A review of the literature and outcome studies. Journal of Instructional Psychology, 34(1), 54–58. Health Reference Center Academic.
Teitelbaum, M. S. (2003, Fall). Do we need more scientists? Public Interest; Washington, 153, 40–53.
Teitelbaum, M. S. (2014, March 19). The Myth of the Science and Engineering Shortage. The Atlantic. http://www.theatlantic.com/education/archive/2014/03/the-myth-of-the-science-and-engineering-shortage/284359/
Tuttle, C. C., Gleason, P., & Clark, M. A. (2012). Using lotteries to evaluate schools of choice: Evidence from a national study of charter schools. Economics of Education Review, 31(2), 237–253. https://doi.org/10.1016/j.econedurev.2011.07.002
U.S. Department of Education. (2009). Race to the Top Program: Executive Summary. von Hippel, P. T., & Bellows, L. (2018). How much does teacher quality vary across
teacher preparation programs? Reanalyses from six states. Economics of Education Review, 64, 298–312. https://doi.org/10.1016/j.econedurev.2018.01.005
von Hippel, P. T., Bellows, L., Osborne, C., Lincove, J. A., & Mills, N. (2016). Teacher quality differences between teacher preparation programs: How big? How reliable? Which programs are different? Economics of Education Review, 53, 31–45. https://doi.org/10.1016/j.econedurev.2016.05.002
Winship, C., & Morgan, S. L. (1999). The Estimation of Causal Effects from Observational Data. Annual Review of Sociology, 25, 659–706.
Worsnop, R. L. (1991). School Choice: Would it strengthen or weaken public education in America? CQ Researcher, 1(Generic), 253–276.
Zimmer, R., Gill, B., Booker, K., Lavertu, S., & Witte, J. (2012). Examining charter student achievement effects across seven states. Economics of Education Review, 31(2), 213–224. https://doi.org/10.1016/j.econedurev.2011.05.005