Coping Strategies in Livestock-dependent Households in East and Southern Africa: A Synthesis of Four...
16
Coping Strategies in Livestock-dependent Households in East and Southern Africa: A Synthesis of Four Case Studies Philip K. Thornton & Randall B. Boone & Kathleen A. Galvin & Shauna B. BurnSilver & Michael M. Waithaka & Joan Kuyiah & Stanley Karanja & Ernesto González-Estrada & Mario Herrero # Springer Science + Business Media, LLC 2007 Abstract Integrated assessment seeks to combine models of the ecological as well as the social system to allow different scenarios to be tested in terms of their likely impacts on ecological functioning and household well- being. We outline such work undertaken in four case studies in East and southern Africa: pastoralist communities in northern Tanzania, agro-pastoralists in southern Kenya, communal and commercial ranchers in South Africa, and mixed crop-livestock farmers in western Kenya. Results from these case studies are synthesised to test the hypothesis that households’ capacity to adapt in the face of increasing external stresses is governed by flexibility in livelihood options. The results support this hypothesis. There is considerable variation in how households in these places cope with external stresses. Options include intensi- fication, diversification, and increasing off-farm economic activities, and these depend on household objectives and attitudes as well as on access to natural resources, inputs and output markets. The results also indicate that generally it is the poorer households that can gain the most from implementing such options for coping and managing risk. Quantifying likely household and ecosystem impacts of different options is a crucial step in targeting appropriate technology, policy and adaptation interventions in the face of considerable system changes. We conclude with some research needs to improve integrated assessment tools that may allow us to represent more realistically the highly complex decision-making milieu of householders in sub- Saharan Africa who are dependent on ecosystem goods and services for a large part of their livelihoods. Key words Pastoralism . mixed systems . integrated assessment . livelihoods . Africa Introduction Human population in sub-Saharan Africa is likely to more than double to 1.5 billion by 2050 (FAO 2006). The consumption of animal products is projected to increase substantially to 2020, driven by population growth, higher incomes, increased urbanisation, and changing dietary preferences (Delgado et al. 1999). In much of sub-Saharan Africa, livestock are critically important to the diets and incomes of the rural poor (Thomas and Rangnekar 2004), but many livestock keepers are facing a highly volatile situation characterised by rapid change. Predicted increases Hum Ecol DOI 10.1007/s10745-007-9118-5 P. K. Thornton : J. Kuyiah : S. Karanja : E. González-Estrada : M. Herrero International Livestock Research Institute (ILRI), P.O. Box 30709, Nairobi 00100, Kenya P. K. Thornton (*) : M. Herrero School of Geosciences, University of Edinburgh, West Mains Road, Edinburgh EH9 3JG, Scotland e-mail: [email protected] R. B. Boone : K. A. Galvin : S. B. BurnSilver Natural Resource Ecology Laboratory, Colorado State University, Fort Collins, CO 80523, USA K. A. Galvin Department of Anthropology, Colorado State University, Fort Collins, CO 80523, USA M. M. Waithaka Eastern and Central Africa Programme for Agricultural Policy Analysis, P.O. Box 765, Entebbe, Uganda
-
Upload
wageningen-ur -
Category
Documents
-
view
0 -
download
0
Transcript of Coping Strategies in Livestock-dependent Households in East and Southern Africa: A Synthesis of Four...

Coping Strategies in Livestock-dependent Householdsin East and Southern Africa: A Synthesis of FourCase Studies
Philip K. Thornton & Randall B. Boone &
Kathleen A. Galvin & Shauna B. BurnSilver &
Michael M. Waithaka & Joan Kuyiah & Stanley Karanja &
Ernesto González-Estrada & Mario Herrero
# Springer Science + Business Media, LLC 2007
Abstract Integrated assessment seeks to combine modelsof the ecological as well as the social system to allowdifferent scenarios to be tested in terms of their likelyimpacts on ecological functioning and household well-being. We outline such work undertaken in four casestudies in East and southern Africa: pastoralist communitiesin northern Tanzania, agro-pastoralists in southern Kenya,communal and commercial ranchers in South Africa, andmixed crop-livestock farmers in western Kenya. Resultsfrom these case studies are synthesised to test thehypothesis that households’ capacity to adapt in the faceof increasing external stresses is governed by flexibility inlivelihood options. The results support this hypothesis.There is considerable variation in how households in these
places cope with external stresses. Options include intensi-fication, diversification, and increasing off-farm economicactivities, and these depend on household objectives andattitudes as well as on access to natural resources, inputsand output markets. The results also indicate that generallyit is the poorer households that can gain the most fromimplementing such options for coping and managing risk.Quantifying likely household and ecosystem impacts ofdifferent options is a crucial step in targeting appropriatetechnology, policy and adaptation interventions in the faceof considerable system changes. We conclude with someresearch needs to improve integrated assessment tools thatmay allow us to represent more realistically the highlycomplex decision-making milieu of householders in sub-Saharan Africa who are dependent on ecosystem goods andservices for a large part of their livelihoods.
Key words Pastoralism . mixed systems . integratedassessment . livelihoods . Africa
Introduction
Human population in sub-Saharan Africa is likely to morethan double to 1.5 billion by 2050 (FAO 2006). Theconsumption of animal products is projected to increasesubstantially to 2020, driven by population growth, higherincomes, increased urbanisation, and changing dietarypreferences (Delgado et al. 1999). In much of sub-SaharanAfrica, livestock are critically important to the diets andincomes of the rural poor (Thomas and Rangnekar 2004),but many livestock keepers are facing a highly volatilesituation characterised by rapid change. Predicted increases
Hum EcolDOI 10.1007/s10745-007-9118-5
P. K. Thornton : J. Kuyiah : S. Karanja :E. González-Estrada :M. HerreroInternational Livestock Research Institute (ILRI),P.O. Box 30709, Nairobi 00100, Kenya
P. K. Thornton (*) :M. HerreroSchool of Geosciences, University of Edinburgh,West Mains Road,Edinburgh EH9 3JG, Scotlande-mail: [email protected]
R. B. Boone :K. A. Galvin : S. B. BurnSilverNatural Resource Ecology Laboratory, Colorado State University,Fort Collins, CO 80523, USA
K. A. GalvinDepartment of Anthropology, Colorado State University,Fort Collins, CO 80523, USA
M. M. WaithakaEastern and Central Africa Programmefor Agricultural Policy Analysis,P.O. Box 765, Entebbe, Uganda
in demand for livestock products over the next few decadeswill undoubtedly lead to the intensification of agriculturalsystems in many places (Staal et al. 2001). At the sametime, many pastoral communities are faced with thechallenges of shifts in land tenure policy from communalto individual landholdings coupled with high in-migrationrates (Galaty 1994; Kristjanson et al. 2002). Expansion ofcultivation and diversification of land-use activities areplacing increasing burdens on the ecological, economic andsocial integrity of rangelands (Hobbs et al. 2007). Inaddition, the world’s climate is continuing to change at ratesunprecedented in recent human history (IPCC (Intergovern-mental Panel on Climate Change) 2001; Stainforth et al.2005). The impacts of climate change are likely to beconsiderable in tropical regions. Many countries in Africaare vulnerable to climate variability and change because ofgenerally low adaptive capacity, high rates of poverty, andlack of safety nets (Slingo et al. 2005; Thomas and Twyman2005). The impacts will reach far beyond the agriculturalsector with potentially enormous effects on human health,natural resources, food security, and social stability (Simmset al. 2004; Patz et al. 2005).
The challenges for development posed by populationgrowth, social change, and climate change are clearlyconsiderable. While broad-brush, broad-scale analysis oftrends is undoubtedly useful for understanding the widerimpacts, there is such heterogeneity in households that suchanalysis may miss key insights, particularly with regard totechnical or policy interventions that can help to alleviatepoverty. Understanding the nature and drivers of decision-making by householders whose livelihoods are dependentto a great extent on natural resources is one key requirementin the implementation of appropriate adaptation options forvulnerable communities.
Since the late 1990s, we have been carrying out a seriesof case studies involving integrated assessment in variousplaces. These have all involved a mix of fieldwork, surveywork, and modelling, to integrate ecosystem models withhousehold models in an effort to simulate possible futurechanges and impacts not just on ecosystem functioning butalso on household well-being. These assessments have been“integrated” to various degrees; while many key factors anditems have been omitted for various reasons, they havegenerally provided useful information, and have pointed theway towards (and underlined the need for) more compre-hensive assessments in the future, given time, skills andresources. These studies have also contributed someevidence that supports the notion of the non-linearity ofstrongly-coupled social-ecological systems and highlightsthe importance of thresholds in their dynamics (Folke et al.2002).
We pull together results from the case studies to test ageneral hypothesis about households making decisions
concerning different livelihood options as a means ofdealing with increasing risk and external stresses on thesystem. The risks considered relate particularly to climateand price variability, and the stresses relate particularly tohouseholds’ decreasing access to natural resources becauseof policies, fragmentation, and population growth. Thehypothesis is that a household’s capacity to adapt andrespond to increasing risks and stresses that negativelyaffect well-being is governed by the household’s flexibilityin choosing and modifying livelihood options (such asdiversification and intensification).
The following section outlines the four case studies: tworelate to pastoral and agro-pastoral systems in East Africa, oneto commercial and communal livestock keeping in aridsouthern Africa, and one to mixed systems in the highlands ofEast Africa. This is followed by a set of model results designedto address the above hypothesis. The paper concludes with asynthesis of lessons learnt and an outline of future researchneeds.
Methods
From the late 1990s onwards, we embarked on a series ofprojects whose general aim was to address some of thedifficult issues associated with tradeoffs between differentoptions and policies relating to natural resource manage-ment in the pastoral, agro-pastoral and mixed crop-livestock systems of East and southern Africa. The generalapproach taken in each case was a mixture of fieldwork andmodelling designed to provide tools for quantifying themajor processes and interactions involved between peopleand ecosystems in which they live. The fieldwork wasdesigned to parameterise and calibrate existing simulationmodels of the key biophysical processes in each ecosystem,such as plant growth responses to soil, weather, manage-ment and herbivore foraging, and population sizes of bothwild and domestic herbivores. The modelling work alsoincluded a component to develop and apply a socio-economics module that could be linked to the biophysicalmodels, so that different scenarios could be simulated andimpacts investigated: both biophysical (such as spatial-dynamic competition for forage) and socioeconomic (suchas household food security and cash flow). Thus each casestudy involved household surveys and data collectionaimed at providing information with which to build andcalibrate appropriate household models.
The modelling work was “integrated” in the sense thatwe combined detailed simulation models of biophysicalprocesses (plant and animal growth, for example) withhousehold models of economic and decision-makingprocesses (related to household diets and livestock manage-ment, for example). A key feature of this type of modelling
Hum Ecol

is the treatment of feedback loops between the biophysicaland socioeconomic models. If the household sells orslaughters an animal in time period t, for instance, thebiophysical simulation of the herd in time period t+1 willproceed on the basis of one less animal. This type ofintegrated modelling can also make use of qualitative rulesas well as quantitative information, allowing considerableflexibility in the model construction process. There is agrowing literature on the combining of separate butinteracting models of different processes, particularly inthe areas of global environmental change (e.g., Bouwmanet al. 2006) and regional land-use change (e.g., Olson et al.2007). The role of such modelling of coupled social-ecological systems at different scales is likely to increase inimportance in the future in response to the evolvingconcepts of resilience and its relationship to sustainabledevelopment (Walker et al. 2004).
In addition, each case study involved a key thirdcomponent: interaction with the farmers and pastoraliststhemselves, and sometimes other stakeholders. Given theoften different and sometimes competing goals of variousstakeholders, we set up a wide variety of scenarios thatwere subsequently tested, and the likely impacts on thevarious system components visualised and assessed by allstakeholders. In all the case studies, model results formedan important input to many discussions with stakeholders,helping to define other scenarios to investigate and toidentify options that were subsequently tested by farmersthemselves.
The case study locations were not chosen in anypurposive manner, but constitute some of the areas wherewe collectively have worked over the last few years. Whilethese sites cannot really be said to be representative in anyway, they do cover a wide range of agro-ecologies and abroad spectrum of market orientation. Brief descriptions ofeach follow, and some features are summarised in Table I.
Ngorongoro Conservation Area, Tanzania
Ngorongoro Conservation Area (NCA) is a multiple land-use site in Northern Tanzania, and forms part of the GreaterSerengeti Ecosystem. It encompasses highlands, forests,and grassy plains, and contains Ngorongoro Crater, famousfor its rich wildlife and spectacular scenery. NCA providesimportant wet-season grazing for large migratory herds ofwildebeest, gazelle, and zebra. The highland areas areimportant to rhinoceros, elephant, and buffalo. Until 1960,the Maasai had free access to the NCA and the Serengetiplains. By 1974 they had been evicted from both theSerengeti and Ngorongoro Crater. Households graze cattlein nonrestricted areas and farm small plots when they areallowed to (Kijazi et al. 1997). Most households earn lessthan $10 a month. The status of wildlife in NCA is mixed.
While the black rhinoceros is on the verge of extinction(Moehlman et al. 1997), for example, NCA supports largeand steady semi-migratory populations of wildebeest andother large herbivores.
Various changes have been underway in the NCA overthe last 30 years or so. One of these is population growth.From 1970 onwards, this has been of the order of 8% peryear overall (NCAA (Ngorongoro Conservation AreaAuthority), 1999), largely because of in-migration fromother areas. In 1998, there were some 48,000 Maasai livingin the NCA; in 2002, the number had risen to 60,000 (URT(United Republic of Tanzania) 2003). At the same time,there have been declines in economic welfare and chronicstates of under-nutrition for pastoral populations (Galvin1992; Homewood 1992). Many pastoralists in NCA believethat current and past policies have favoured wildlife to thedetriment of local people (Ole Parkipuny 1997). TheTanzanian government attempted to address some of theirconcerns by allowing limited cultivation in the area in1992. By 1995, 3 years after a ban on cultivation was lifted,85% of Maasai in NCAwere cultivating small plots of land.The declines in pastoralists’ well-being and in the numbersof some key wildlife species clearly present a hugechallenge in the search for a sustainable balance betweenfood security and natural resource conservation. In this casestudy, we examined the impacts of different levels ofcultivation on wildlife numbers and on household well-being indicators to provide information that could be usedby the NCA Authority, pastoral development groups, andlocal and regional wildlife conservation groups, in the questfor workable compromises between wildlife and livestocknumbers (and dynamics) and pastoralist well-being.
To do this, we calibrated the Savanna ecosystem modelfor NCA. Savanna is a spatially-explicit computer simula-tion model that predicts forage production and qualitybased upon spatial data layers and settings that describehow plant populations grow (Coughenour 1993). Popula-tions of livestock and wildlife are modelled, including theirgrowth, reproduction, and nutritional state (Ellis andCoughenour 1998). Boone and Coughenour (2000) de-scribe the model in some detail. For NCA, seven plantfunctional groups were simulated: palatable grasses, palat-able forbs, unpalatable herbs, palatable and unpalatableshrubs, evergreen forests, and deciduous woodlands.Eleven animal functional groups were simulated: migratorywildebeest, zebra, and grazing antelopes; resident popula-tions of zebras and grazing antelopes; browsing antelope,African buffalo and elephant, cattle, sheep, and goats.Details of the Savanna application for NCA and the dataused for its calibration are given in Boone et al. (2002;2006).
We linked a simple household model to Savanna calledPHEWS (Pastoral Household and Economic Welfare
Hum Ecol

Simulator) to simulate decision–making in Maasai house-holds. Three household types were defined based on levelof wealth, and the model tracks the flow of cash in and outof each on a monthly time-step. Dietary energy is alsotracked using rules that determine where food calories comefrom: whether they are produced by the household (e.g.,milk, meat and maize), bought (e.g., maize), or are a gift ortransfer from elsewhere (e.g., another household). In themodel, household objectives relate to food security andkeeping cattle as a capital and cultural asset. The primaryand secondary data sources used to calibrate PHEWS forNCA are given in Thornton et al. (2003), along with adetailed description of the model.
Kajiado, Kenya
Kajiado District, Kenya, represents a somewhat differentcase. The general issues are similar: there are highpopulation growth and in-migration rates, leading toexpansion of cultivation and growth in the number ofpermanent settlements, sedentarisation, and diversificationof land-use activities around wildlife conservation areas.This results in more human-wildlife conflicts, decliningecological, economic and social integrity of rangelandsbecause of fragmentation of landscapes, declining range-land productivity, truncated wildlife migratory corridors, anddeclining wildlife populations and diversity (Gichohi et al.1996; Ellis et al. 1999).
The situation differs from NCA in certain key respects,however. One is that the linkages between pastoralcommunities and the wider national economy are increas-ingly important for several reasons including proximity toNairobi. Another is the process of group ranch subdivision,involving the dissolution of group ranch titles and subdi-vision of rangelands into private parcels. This process
started in the 1970s for various reasons, including problemsassociated with group ranch management and concerns ofyounger members over long-term access to resources. Atthe same time the population is growing rapidly, because ofboth natural growth and dramatic increases in numbers ofimmigrant agriculturalists from 149,000 in 1979 to over306,000 in 1999 (GoK (Government of Kenya) 2001). Thelivestock population has remained relatively constant overthis period, and many Maasai households have thusdiversified their activities into cultivation, wage labour, orsmall business. Lastly, the Maasai of Kajiado live on landthat surrounds a conservation area but do not within aconservation area as do the Maasai of NCA. The study areais the southern part of Kajiado district. The landscape issemi-arid, with bush and grasslands, and swamps in thesouthern part that provide critical short-term grazing foranimals and water for pastoralists and also support irrigatedagriculture. Kajiado is characterized by variable rainfallwithin and between years, and droughts are frequent.Historically, the Maasai have coped with this variabilityby moving their livestock over very large areas of land.Over 50% of the population is living below the poverty line(GoK (Government of Kenya) 2003).
The objective of this case study was to provide informationto decision makers (both pastoralists themselves and nationalpolicy makers) regarding the potential advantages anddisadvantages associated with the further subdivision of groupranches. As for NCA, the goal was to assess managementoptions that balance the needs for wildlife conservation,human well-being and ecosystem sustainability. We againused the Savanna model coupled with PHEWS. Savanna wasparameterised for different plant and animal functional groups(see Boone et al. 2005), and PHEWS was essentiallyrewritten and calibrated to take account of the extended setof livelihood options available to pastoralists and agro-
Table I Some Characteristics of the Case Studies
Site System YearofStudy
Major Issue Investigated Household Model Ecosystem Model
NgorongoroConservationArea
Pastoralism 1999–2001
Impacts on households and onwildlife of increasing areas ofcultivation
Rule-based(Thornton et al.2003)
Savanna (Boone et al. 2002;2006)
Kajiado Agro-pastoralism
2001–2003
Impacts of group ranch subdivision Rule-based(Thornton et al.2006)
Savanna (Boone et al. 2005)
Vyrburg Commercialranching &Communallivestock keeping
2000–2002
Value of climate forecasts based onEl Niño—Southern Oscillationphases for adaptive management
Mathematical-programming-based(Thornton et al.,2004)
Savanna (Boone et al. 2004)
Vihiga Smallholder crop-livestock
2000–2004
Enterprise and management optionsfor severely land-constrainedhouseholds
Mathematical-programming-based(Herrero et al. 2007)
Input–output crop coefficients,and a livestock and herd model(Waithaka et al. 2006)
Hum Ecol

pastoralists, compared with NCA (see Thornton et al. 2006).As for NCA, household objectives revolve around foodsecurity issues and the importance of keeping cattle as acapital and cultural asset. In addition, households also seekto generate cash for their needs.
Northwest Province, Republic of South Africa
Droughts are frequent in the Northwest Province of SouthAfrica, typically occurring every 3–6 years (Boone et al.2004) with serious implications for crop yields andlivestock and wildlife populations. In the region, droughtappears to be strongly influenced by El Niño-SouthernOscillation events. The South African Weather Servicesproduce long-term seasonal climate forecasts for three andsix months ahead, and these could be used by both crop andlivestock farmers to adapt their management in response toanticipated wet or dry periods. There are various issues thataffect whether climate forecasts are used, including notonly their accuracy but whether appropriate institutionalstructures exist to manage forecast dissemination and use(O’Brien and Vogel 2003). Part of this has to involve someestimation of the added value that can be gained from theuse of seasonal forecasts for livestock management.
This case study sought to assess the usefulness offorecasts and determine farmer response to climaticvariation, and to model livestock production and economicdecision-making by farmers and assess the value of usingforecast information. The study area comprised the westernpart of Northwest Province, centred on the town ofVryburg. Annual rainfall in the area varies from 300 to500 mm, and is highly variable. The major land use isextensive livestock production, with a typical stocking rateof 7 ha per Tropical Livestock Unit (TLU). The study areacontains commercial area in which landowners producelivestock for market, and communal areas where livestockare raised on shared land (Department of Agriculture 1999).Hudson (2002) documented considerable differences be-tween commercial and communal production systems:commercial operations typically operated 4,100 ha of land,with 600 head of cattle and 50 sheep. The production goalsare to raise calves for market, and the reproductive capacityof the herd is thus of paramount importance. Accordingly,the age–sex composition of the herd is carefully controlled,and unproductive animals are culled. Communal livestockkeepers, on the other hand, typically own 50 cattle, 40sheep and 40 goats. Production goals are very different:cattle are maintained principally as a capital and culturalasset. Accordingly, communal livestock keepers maintainas large a herd as possible, and sell animals only ifabsolutely necessary. Goats are raised as a hedge againstdrought, and communal pasture resources are kept heavilyutilised and are in generally poor condition.
We again used the Savanna model. Boone et al. (2004)describe its adaptation and calibration. The study concen-trated on veld and livestock production and condition, andhow these may relate to changes in rainfall. Seven plantfunctional groups were used: highly, moderately and lowly-palatable grasses; annual grasses; acacia shrubs; camphorbush shrubs; and acacia trees. Five animal functionalgroups were set up: cattle, goats and sheep, representingthe livestock, and horses and donkeys. Wildlife are a minorcomponent of the herbivore community outside protectedareas, and were not included in the model. For theeconomic model, we constructed a mathematical program-ming (MP) model that could be interfaced with Savanna,and which takes account of the objectives and productiongoals of the household, the activities that the household canundertake, and the constraints faced by the household. Thehousehold model used here was very simple (although theframework is flexible enough to deal with considerablecomplexity), and essentially calculated gross margins inresponse to different stocking rates. Details can be found inThornton et al. (2004).
Mixed Crop-livestock Households in Vihiga,Western Kenya
Arable land in western Kenya is under considerablepressure from increasing human population. Rural house-holds depend on farming for at least part of their livelihood,and poverty rates are among the highest in Kenya. Land isoften depleted of nutrients, and for most farmers, access toinputs and markets is poor. The major objective of this casestudy was to help identify and develop viable technologyoptions for targeted production systems that would helpfarmers to weigh up, in an ex ante sense, the impacts ofdifferent options. The work was also designed to carry outcomparative analysis of different scenarios, the results ofwhich could help to inform policy questions (such as, howto promote sustainable land use in the face of ever-decliningfarm sizes) and issues related to enhancing the adoption oftechnologies that can bring about productivity increases andsustainable land use.
The study area was located in Vihiga district. Vihiga liesbetween 1,300 to 1,500 m above sea level and has well-drainedsoils that support various cash and food crops. The averagehousehold has 15 persons living on 0.89 ha of land, creating avery high dependence on agriculture (Central Bureau ofStatistics 2001). Farming is mainly low-external-input subsis-tence production, and most of the farm area is devoted tomaize and other food crops. Local Zebu cattle predominate inopen grazing systems. Tea is the main cash crop. Horticultureand intensive dairying are limited by poor access to largeurban and/or export markets and the nearest urban markets arenot large enough to stimulate production. Vihiga has a high
Hum Ecol

incidence of poverty: 60% of households live below thepoverty line (Central Bureau of Statistics 2003). Average totalincome is KSh 56 (currently about €0.70) per household perday, more than 65% of which is from wages and remittances(Waithaka et al. 2006).
Data were collected from participating households onland, labour, and crop-livestock enterprise characteristics.Biophysical production was modelled using various tools.A livestock model (RUMINANT, Herrero et al. 2002) wasused to simulate milk output in response to local diets(including maize stover and Napier grass), and maize cropyields were calibrated using the model CERES-Maize(Ritchie et al. 1998). For the socioeconomic model, anexisting MP household model (Herrero and Fawcett 2002)was adapted for Vihiga. Key characteristics of the modelincluded an objective function that maximizes the house-hold’s net cash income after satisfying household foodrequirements, subject to a set of constraints (e.g., size offarm and plots, number of animals, household labouravailable) and variables that describe farming activities(e.g., labour allocation by enterprise by month, and cropand livestock production costs) and a set of technicalcoefficients representing the variables’ productiveresponses, such as crop yields per hectare, milk yield perlactation, and input–output prices. Households were clus-tered according to market orientation, and over severalmonths various farmers interacted with the project team indrawing up specifications for “ideal farms” that were betterable to satisfy householders’ objectives than their currentactivities (Waithaka et al. 2006). Householders’ objectiveswere elicited and ranked. For the subsistence and semi-commercial clusters of farmers, objectives were ranked inthe following order: food security, generating cash to meetthe household’s food requirements, maintaining somemaize production and fuelwood trees for cultural reasons,and maintaining the fertility of the soil, if at all possible.
Results
In this section we present some results of modelling fromthe four case studies in the same graphical framework. Thisframework is shown in Fig. 1, and shows some aspect ofhousehold well-being on the y-axis, where “more” isgenerally seen as being “better.” Different livelihoodoptions are shown on the x-axis, and these may form acontinuous variable, such as increasing the size of ahousehold’s cultivated plot, or they may be a set of discreteoptions, such as growing a cash crop and seeking wageemployment, for example. Dixon and Gulliver (2001) listfive main ways in which livelihoods can be improved orchanged: intensification of existing production patterns;diversification of production and processing: expanding
farm or herd size; increasing off-farm income; and exitingfrom the agricultural sector. These are clearly overlappingcategories, and some specific system changes may span atleast two of these categories, but this is still a usefulclassification of the different strategies that households maypursue to improve well-being. In the framework of Fig. 1,all these strategies may apply in particular situations. It willnot always be the case that the household or decision-makerhas control over whether these livelihood options can beundertaken or not—there may well be political or resourceaccess issues that are beyond the control of the household.The lines in Fig. 1 show the impacts on the indicator ofhousehold well-being for different levels of the stressor onthe system. As the external stresses become more severe,there may be livelihood options that the household can putin place that can partially offset the impacts of the increasedstress, in terms of some aspect of household well-being.This is shown in the movement from point A to point B.Without this change in livelihood options, well-being willdecrease from point A to point C as a result of the increasedstress on the system. This is essentially the utilityframework of economic theory (see Raiffa (1968) forperhaps the classic exposition).
Figure 2 illustrates this graphical framework for a newset of model runs undertaken for the NCA case study. Thisshows graphs for the three household types: poor, medium,and rich (see Thornton et al. (2003) for details), theproportion of household calories produced within thehousehold over the 15 years of the simulation. “Home-produced” calories in the model are the those that come
Fig. 1 Quantifying how households can adapt to increasing systemstresses, represented by black lines: changes in livelihood options that canpreserve levels of well-being when the system is under stress (A–B),compared with erosion of well-being levels if livelihood options do not, orcannot, change (A–C).
Hum Ecol
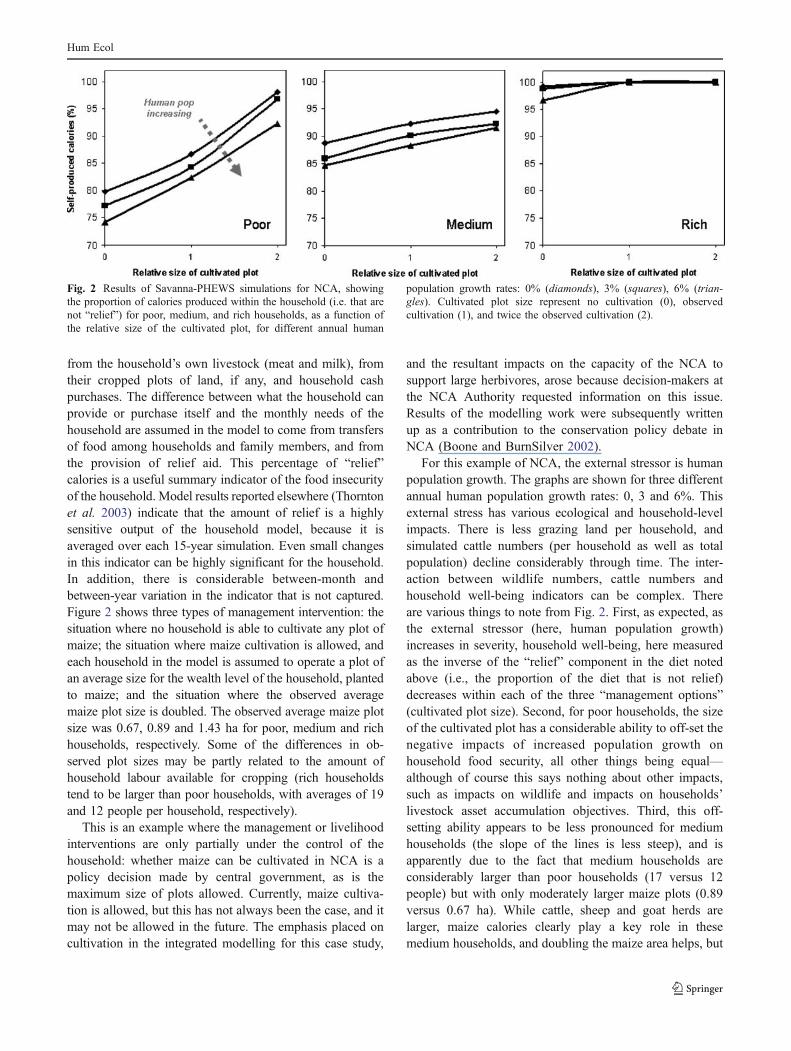
from the household’s own livestock (meat and milk), fromtheir cropped plots of land, if any, and household cashpurchases. The difference between what the household canprovide or purchase itself and the monthly needs of thehousehold are assumed in the model to come from transfersof food among households and family members, and fromthe provision of relief aid. This percentage of “relief”calories is a useful summary indicator of the food insecurityof the household. Model results reported elsewhere (Thorntonet al. 2003) indicate that the amount of relief is a highlysensitive output of the household model, because it isaveraged over each 15-year simulation. Even small changesin this indicator can be highly significant for the household.In addition, there is considerable between-month andbetween-year variation in the indicator that is not captured.Figure 2 shows three types of management intervention: thesituation where no household is able to cultivate any plot ofmaize; the situation where maize cultivation is allowed, andeach household in the model is assumed to operate a plot ofan average size for the wealth level of the household, plantedto maize; and the situation where the observed averagemaize plot size is doubled. The observed average maize plotsize was 0.67, 0.89 and 1.43 ha for poor, medium and richhouseholds, respectively. Some of the differences in ob-served plot sizes may be partly related to the amount ofhousehold labour available for cropping (rich householdstend to be larger than poor households, with averages of 19and 12 people per household, respectively).
This is an example where the management or livelihoodinterventions are only partially under the control of thehousehold: whether maize can be cultivated in NCA is apolicy decision made by central government, as is themaximum size of plots allowed. Currently, maize cultiva-tion is allowed, but this has not always been the case, and itmay not be allowed in the future. The emphasis placed oncultivation in the integrated modelling for this case study,
and the resultant impacts on the capacity of the NCA tosupport large herbivores, arose because decision-makers atthe NCA Authority requested information on this issue.Results of the modelling work were subsequently writtenup as a contribution to the conservation policy debate inNCA (Boone and BurnSilver 2002).
For this example of NCA, the external stressor is humanpopulation growth. The graphs are shown for three differentannual human population growth rates: 0, 3 and 6%. Thisexternal stress has various ecological and household-levelimpacts. There is less grazing land per household, andsimulated cattle numbers (per household as well as totalpopulation) decline considerably through time. The inter-action between wildlife numbers, cattle numbers andhousehold well-being indicators can be complex. Thereare various things to note from Fig. 2. First, as expected, asthe external stressor (here, human population growth)increases in severity, household well-being, here measuredas the inverse of the “relief” component in the diet notedabove (i.e., the proportion of the diet that is not relief)decreases within each of the three “management options”(cultivated plot size). Second, for poor households, the sizeof the cultivated plot has a considerable ability to off-set thenegative impacts of increased population growth onhousehold food security, all other things being equal—although of course this says nothing about other impacts,such as impacts on wildlife and impacts on households’livestock asset accumulation objectives. Third, this off-setting ability appears to be less pronounced for mediumhouseholds (the slope of the lines is less steep), and isapparently due to the fact that medium households areconsiderably larger than poor households (17 versus 12people) but with only moderately larger maize plots (0.89versus 0.67 ha). While cattle, sheep and goat herds arelarger, maize calories clearly play a key role in thesemedium households, and doubling the maize area helps, but
Fig. 2 Results of Savanna-PHEWS simulations for NCA, showingthe proportion of calories produced within the household (i.e. that arenot “relief”) for poor, medium, and rich households, as a function ofthe relative size of the cultivated plot, for different annual human
population growth rates: 0% (diamonds), 3% (squares), 6% (trian-gles). Cultivated plot size represent no cultivation (0), observedcultivation (1), and twice the observed cultivation (2).
Hum Ecol

not as much as it helps poorer households. Fourth, richhouseholds are not much affected in terms of food securityat these rates of population growth, even when cultivationis not done or not allowed.
Results from the second case study, Kajiado District inKenya, are shown in Fig. 3. The modelling work here wasoriginally undertaken to quantify some of the effects ofsubdivision and land fragmentation on household livestocknumbers and on food security. This focus on subdivisionand options for diversification arose because these issueswere consistently raised by stakeholders in communitymeetings in Kajiado in 2002. In Kajiado, livestock-to-humanratios have declined to levels that will no longer support purepastoralism, and so many Maasai have diversified intocultivation, wage labour, and small businesses. BurnSilver(2007) identified five basic household economic activities:livestock keeping, livestock trading or other small business,rainfed agriculture, irrigated agriculture in areas near theswamps, and rainfed agriculture on the slopes of Kilimanjaro.These five economic activities are combined in various waysto produce eight clusters of household type in the study area.PHEWS was modified to track cash flow and dietary caloriesin these household types, and the impacts of subdivision onhousehold indicators were simulated. As expected, subdivi-sion results in substantial reductions in livestock numbers,partially because households have to sell more animals togenerate the cash needed, with serious long-term conse-quences on herd sizes and food security. If subdivision doesoccur, the model indicates that livelihood strategies may
need to be modified to maintain current levels ofhousehold well-being.
For the results shown in Fig. 3, we compared householdwell-being in terms of self-produced calories for poorhouseholds in Imbirikani Group Ranch that are engaged inone, two or three economic activities, in the situation wherethe external stressor is the political and social drive tosubdivide the Group Ranch. The diamonds in Fig. 3 showthe proportion of calories produced within the householdfor different levels of household diversification undercurrent conditions (i.e., the Group Ranch is intact), andthe black square points show the situation if the GroupRanch is subdivided to areas of 196 km2 in the future. Asfor NCA, model results suggest that having more livelihoodoptions allows even poorer households to offset some of thenegative impacts of Group Ranch subdivision. The resultsof Boone et al. (2005) show that continued subdivision toareas smaller than 196 km2 leads to steady declines in thenumber of livestock that can be supported (up to 25% fewerwhen the Group Ranch is composed of 1 km2 parcelscompared with the intact Group Ranch), but that suchdeclines in the number of livestock that can be supported insubdivided areas can be partially offset also by participationof households in grazing associations that can help tomaintain open and flexible access to individually-heldparcels of land.
For the third case study, the stressor is increasingcoefficient of variation of annual rainfall, such as mayoccur as a result of changing rainfall amounts in the comingdecades (IPCC (Intergovernmental Panel on ClimateChange) 2001). Our original results indicated that commer-cial ranchers in Northwest Province could increase theirlong-term average annual incomes through utilizing fore-casts associated with El Niño—Southern Oscillation events,but at the cost of increased year-to-year variability in farmincome (Thornton et al. 2004). Here, we ran a supplemen-tary set of simulations to look at the impacts on income ofdifferent stocking regimes, in response to changing year-to-year rainfall variability. The focus on stocking rates arosein response to user needs expressed in meetings and farmerinterviews in 1999 and 2000. There are other options fordealing with drought in this environment, including thebuying-in of fodder for animals and/or moving animalssometimes long distances to areas where feed is available.However, the survey data of Hudson (2002) showed thatless than a quarter of commercial ranchers do either of thesethings, and that the vast majority react to drought throughstocking decisions.
Previous results for commercial farm V112 (Boone et al.2004; Thornton et al. 2004), 5,900 ha with 550 cattle and50 sheep, had indicated that the stocking rate that max-imises income, using historical weather data from 1971 to1995, is 650 animals (i.e., culling is carried out simply to
Fig. 3 Results of Savanna-PHEWS simulations for Kajiado, showingthe proportion of calories produced within the household (i.e. that arenot “relief”) for poor households engaged in different activities (Llivestock, B business, I irrigated agriculture), for Imbirikani GroupRanch that is intact (diamonds) and fragmented to 196 km2 (squares).
Hum Ecol

maintain herd numbers and preserve age–sex ratios). Wehad also determined that in an El Niño season, with anincreased probability of low rainfall, this could be used as atrigger to carry out heavy culling for that season, and thatthis would increase long-term income levels. The modelresults showed that culling 60% of the herd in yearsforecast to be El Niño seasons maximised farm income overthe long term. These benefits of using the forecasts, interms of increased annual income, come at the cost ofincreased variance in year-to-year farm income. Rancherswho need as steady an income stream as possible may notbe willing to take on the added risk of using the forecasts.
Results are shown in Fig. 4 of running the Savanna-household model simulations for farm V112 using severaldifferent stocking options: under-stocking at 550 animals;optimally stocking the ranch for annual income max-imisation at 650 animals; over-stocking the farm at 750animals; and destocking to 40% of herd numbers inresponse to a forecast of low rainfall for the current season.The indicator of household well-being is a compositemonetary value consisting of the average annual incomefor the ranch for the 24 years of the simulation and theaverage capital value of the herd remaining at the end ofeach season. This helps to preserve a balance betweenannual income and herd numbers for subsequent seasons.The simulations were done with different sets of rainfalldata: current conditions, where the CV of annual rainfallfrom the observed historical record is 30%; and then for
two runs for which the CV of rainfall was artificially (andmechanically) increased to 38 and 46%. As for NCA andKajiado, it can be seen that increases in the system stressor(here, rainfall CV) can be partially offset by makingchanges to the stocking rate, although CV changes abovethe current value have a considerable (and highly non-linear) impact on income levels. It is also interesting thatthe long-term optimal stocking rate in terms of annualincome is no longer optimal once the capital value of theherd remaining is included as well. However, there arelikely to be several downsides to over-stocking, includinggreatly increased year-to-year variability in income andgradual degrading of the grassland resource.
For the fourth case study, some general characteristics ofhouseholds in Vihiga District are outlined in Waithaka et al.(2006). We ran some supplementary simulations for atypical household with eight members on 1 ha of land.Household members keep cross-bred dairy animals (threecalves and four lactating animals) and a few goats. Majorincome sources are milk sales and off-farm income. Thecrops grown for home consumption are maize and beans.Fertilizer and hybrid seeds are expensive and used onlysparingly. Manure from the livestock is applied to bothcrops and pasture. Surplus production is sold to supplementthe family’s income. Land has been rented in for crops andpasture. The cattle are fed Napier grass, maize stover andconcentrates. While these systems are more diversifiedcompared with the other case studies, interviews withfarmers indicated that there was interest is assessing optionsthat involved introduction of a cash crop and increasing theintensity of certain enterprises (Waithaka et al. 2006).Accordingly, Fig. 5 shows the impacts on householdincome of three different management options: the baselinethat describes current observed conditions (eight plots onthe farm mostly in maize, beans and Napier grass),doubling the feeding of concentrates to the milking herd,and taking out half of the area planted to maize in thebaseline and growing a cash crop instead. Tea is oftenplanted, although farmers see it as uneconomic to introducetea to areas less than about 1 ha in total, so in the modelruns reported here, passion fruit is planted as the cash crop.Figure 5 shows the impacts on household income for thesethree management options as the farm size changes: from1 ha (black diamonds), reduced by 10% (black squares) andby 20% (black triangles).
As in the other case studies, the impacts of the externalstressors can be partially offset by engaging in moreintensive management (more concentrate use, or cash cropproduction). Even so, the household is still dependent onoff-farm income. It should be noted that the baseline runyields the equivalent of about KSh55 per person per day(about €0.70), and even the most intensive systemconsidered here yields less than double that.
Fig. 4 Results of Savanna-household model simulations for Vryburg,showing annual income and capital value of the herd for differentmanagement options (US, under-stocked at 550 animals; OP,optimally stocked for annual income maximisation at 650 animals;OS, over-stocked at 750 animals; FORC, destocking in response to aforecast of low rainfall) for varying coefficients of variation of annualrainfall (30%, diamonds (current); 38%, squares; 46%, triangles).
Hum Ecol

Discussion
For the four case studies considered, it appears thathouseholds can partially offset the impacts of externalstresses by increasing the size of cultivated plots (NCA,Kajiado), by diversification into other agricultural and non-agricultural activities (Kajiado), by using climate forecaststo make stocking decisions (NW Province), and throughintensification and/or diversification of agricultural produc-tion (Vihiga) Table II. The communal farmers are alsoincluded in Table II for comparison (although no modellingwork is reported for them here). For these communalfarmers, generally there are few options open to them foroffsetting the impacts of system stresses other thandeveloping further off-farm income sources. For thesehouseholders, as for the pastoral and agro-pastoral house-holds, livestock production is not primarily an economicactivity but a sociocultural one.
Although households in the case-study sites are able tooffset impacts of increasing stress to some degree, all thediversification and intensification options have some cost.As noted above, there may be aesthetic costs to tourism ofincreased cultivation in NCA, and in the other sites thereare negative impacts on natural resources: on wildlifenumbers in Kajiado, on long-term grassland productivityin both the commercial and communal sectors in NWProvince, and on soil fertility in Vihiga.
For the three subsistence and semi-subsistence casestudies (NCA, Kajiado and Vihiga), the results also showthat it is the poorer households who have the most to gainfrom implementing options that increase their ability tocope. In case of NCA (Fig. 2) the marginal increases indietary self-sufficiency for increasing size of cultivated plot
are much larger for poor households than for either mediumor rich households. Equivalent data for different householdwealth levels are not shown for the Kajiado example, butother results reported in Thornton et al. (2006) show thatthe marginal effects of enterprise diversification on dietaryself-sufficiency are again largest for poor households. Asimilar effect holds for Vihiga: for households that are moreland-poor, the marginal increase in profit when a cash cropis grown is much greater than for households that are lessland-poor (Fig. 5). These results lend some weight to theview that coping strategies and risk management optionsare very important in alleviating poverty for poorer house-holds, and suggest that targeting the poorer rather than thebetter-off households may lead to increased welfare gains inthese systems.
The analyses presented here underline the importance ofunderstanding different households’ objectives and atti-tudes. While all the case studies can be looked at within acommon analytical framework, no common householdmodel can be applied across all sites and all householdtypes, as the objectives associated with livestock manage-ment range from profit maximisation to the socioculturaland steadfastly noneconomic. The type of household modelbest suited to each case will often be different: MPtechniques are appropriate for income maximisation objec-tives, for example, but they are not well-suited to other,harder to quantify household objectives, for which rule-based models may be needed. So unless there are very goodreasons to assume that household types are similar indifferent places, integrated assessments have to be done ona case-by-case basis, supporting the view that “traditional”recommendation domains for targeting technology andpolicy interventions may be much smaller than hassometimes been thought. There is enormous heterogeneitybetween households, objectives and attitudes and access tonatural resources, for example. Acknowledging that re-search impacts often cannot be easily generalised acrosslarge areas has considerable implications for the way inwhich research for development might most effectively becarried out.
This research has also underlined the need for a dynamicframework capable of looking over at least the mediumterm to assess the ecological impacts of changes, togetherwith their major feedbacks to livelihood systems. There aremany lags and dampers in the system as a whole, but theseneed to be elucidated in any even partially-integratedassessment. The assessment framework has to allow thequantification of major trade-offs, so that decision makersand stakeholders can see the impacts of different actions ondifferent parties. The case studies have shown that there isoften competition between household objectives, bothwithin individual stakeholder groups, as in NW Province,where more income can be generated but at the expense of
Fig. 5 Results of Vihiga household model runs, showing the impacton household profits for the baseline set of activities and two moreintensive system changes: doubling the amount of concentrates fed todairy animals, and halving the area planted to maize and replacingwith a cash crop (passion fruit), for three farm sizes: 1 ha (blackdiamonds), 10% reduction (black squares) and 20% reduction (blacktriangles).
Hum Ecol

more variability in income, and between different groups,as in NCA and Kajiado, where beneficial impacts onhousehold well-being may be at the expense of impacts onwildlife numbers and tourism potential.
In addition, the case studies indicate quite clearly thatthere are thresholds in these systems above which it is veryunlikely that management options alone will be able tooffset increasing system stresses. The integrated assessmentframework is thus useful in identifying not only what isdesirable, in terms of possible impacts on different groupsof stakeholders, but also what is feasible. Given increasingsystem stress, the point may well be reached at whichnatural-resource-based livelihood options are simply nolonger feasible. In some of the case studies considered here,off-farm income is already a key element of livelihoodstrategies (and it is not easy to see how it could be otherwisein Vihiga, for instance, with eight family members and 1 haof land). As certain types of stress increase in the future,particularly those related to population pressure and climate,for example, households will keep trying to gain access tothe natural resources needed to sustain livelihoods. A keyuse of integrated assessment is in identifying situationswhere households are unlikely to be able to sustain currentlivelihood options based on exploitation of natural resources.In such cases, appropriate livelihood options may thendepend on increased opportunities for off-farm employment;exit from farming may be indicated; or radical rather thanincremental shifts in agricultural and/or livestock productiv-ity will be necessary. In all of these cases, there aresubstantial implications for policy making, as such optionsgo far beyond any one sectoral contribution but strike at theheart of what national governments have as policy aims interms of food security, self-sufficiency, and indeed the role ofagriculture in economic growth and development in general(Ellis 2004). Indeed, there are considerable opportunities forhelping to inform such policy debates by carrying out broadintegrated assessments that are more explicitly based onsome of the newer approaches to development, such as thosebased on integrated natural resources management (Sayerand Campbell 2001) and the adaptive resource managementand adaptive governance of resilience theory (Folke et al.2002; Walker et al. 2004).
Conclusions
Through a mixture of fieldwork and integrated assessmentmodelling, the case studies have shown that there areoptions related to the management of natural resources thatcan help households at least partially overcome the effectsof increasing stresses to the system caused by populationgrowth, changes in climate and weather variability, and
land fragmentation. There are costs involved, however, interms of impacts either on natural resources and otherstakeholder groups or on the variability of householdincome. Households can offset increased stresses throughthe management of natural resources only up to a point;with the tools employed in these assessments, it is notdifficult to set up and run scenarios that go well beyondthese thresholds, to the point where this offsetting is simplynot possible through internal manipulation of the system. Insubsistence and semi-subsistence systems, the marginalimpacts on well-being are greatest for the poorer house-holds, and study results thus strongly support the notionthat coping strategies and risk management options canhave substantial impacts on poverty alleviation.
The integrated assessments described in these casestudies have also provided some quantitative support forthe hypothesis that links households’ coping ability withflexibility in livelihood options. However, there are severallimitations that could be addressed in further work. Oneissue relates to whether it is possible to develop moregeneric types of model that are flexible enough to handlevery different situations. Currently, the models employedneed considerable amounts of data and time to specify andcalibrate them for a new situation. It may be difficult todevelop truly generic household models that are capable ofdealing with the range of situations and objectives shown inTable II. However, there may be methods that can bedeveloped to allow non-specialist users to set up and runappropriate models based on “libraries” of modules that canbe chosen to represent specific circumstances. The notionof modular models has found considerable utility in therealm of crop simulation (see, for example, the websites ofthe International Consortium for Agricultural SystemsApplications (ICASA), http://www.icasa.net/index.html,and the Agricultural Production System Simulator(APSIM), http://www.apsim.info/apsim/ default.asp).
A second area of further work is to expand the scope of themodels, particularly on the household side, so that thecomplexity of many households’ livelihood strategies can bemore adequately captured. There are many situations where ahousehold’s livelihood options are distributed widely both intime and space, and different types of household model maybe called for to deal adequately with such complexity. Third,all the household models described here are static, in the sensethat there is no movement from one type of household toanother. Households are in reality continually evolving fromone state to another, depending on life cycle, opportunities,etc., and more realistic household models need to be able totake these dynamics into account. Agent-based models mayoffer one way of doing this (Galvin et al. 2006).
Despite their limitations, integrated assessments have akey role to play in quantifying trade-offs, in identifying whatis both desirable and feasible in highly complex systems, and
Hum Ecol

Tab
leII
Com
parisonof
theFou
rCaseStudies
inRelationto
Hou
seho
ldObjectiv
es,Major
Sou
rces
ofRiskandStress,Respo
nseto
Stresses,Mod
elledIm
pactson
Hou
seho
ldIndicators,and
Trade-offs
Site
Basic
Livelihood
Strategies
Household
Objectiv
esSom
eMajor
Sources
ofRisk
andStress
How
Do
Households
Respond?
Impactson
Household
Objectiv
es
Trade-offs
NCA
Pastoralism
1Maxim
isehome-produced
calories
Declin
ing
livestock-
to-personratio
s
becauseof
human
populatio
n
increases
Cultiv
atesm
all
plotsof
maize
for
household
consum
ption
%“relief”
indiet
decreased
Poorerhouseholds
canpartially
offset
increasing
populatio
n
pressure
byincreasing
size
of
cultivatedplot,butthisis
ultim
atelylim
itedby
conservatio
n
status
(Fig.2)
2Maintaincattleas
acapital
andcultu
ralasset
Drought
Impactson
wild
lifenumbers
are
negligible
(Boone
etal.2006
),but
impactson
tourism
may
be
negativ
e
Kajiado
Pastoralism,
agro-
pastoralism
1Maintaincattleas
acapitaland
cultu
ralasset
Lim
itedaccess
to
grazinglands
(and
water)
becauseof
landscape
fragmentatio
n
Cultiv
ateirrigated
and/or
rainfed
crops,depending
onland
access
%“relief”
indiet
decreased
Poorerhouseholds
canpartially
offset
impactsof
subdivisionby
increasing
size
ofcultivatedplot
(Thorntonet
al.2006
)
2Maintainacertainproportio
n
ofhousehold-produced
calories
Drought
Engagein
trading
orotherbusiness
Household
incomeincreased
Poorerliv
estock-onlyhouseholds
canpartially
offset
impactsof
subdivisionthroughdiversification
(Fig.3)
3Generatecash
asneeded
Re-vitalisesocial
networks
andset
up/jo
ingrazing
associations
Impactson
wild
lifenumbers
may
benegativ
e
NW Province
Com
mercial
ranching
Com
munal
farm
ing
1Utility
maxim
isationby:
raisingcalves
formarket,
Controllin
gage–sex
compositio
nof
herd,Turning
over
calves
quickly,
Cullin
g
unproductiv
eanim
als
Clim
atic
variability
Adaptiveliv
estock
managem
ent
possible
(de-
stocking,feed
purchases,etc)
Meanincome
increased
Rancherscanpartially
offset
impactsof
increasedrainfall
variability
throughstocking
decisions(Fig.4 )
Price
variability
Varianceof
annual
income
increased
Impactson
variability
ofreturns
may
benegativ
e
Impactsof
long-term
over-stocking
ongrasslandmay
benegativ
e
1.Maintaincattleas
acapital
andcultu
ralasset
Clim
atic
variability
Increase
proportio
n
ofoff-farm
income
Household
incomeincreased
Com
munal
farm
ersaregenerally
unwillingto
sellanim
alseven
in
extrem
edroughts
2.Household
food
security
Existence
offew
water
points
incommunal
areas,severely
limiting
forage
utilisatio
n
Long-term
impactson
theveld
of
over-stockingarenegativ
e(Boone
etal.2004
)
Hum Ecol

Site
Basic
Livelihood
Strategies
Household
Objectiv
esSom
eMajor
Sources
ofRisk
andStress
How
Do
Households
Respond?
Impactson
Household
Objectiv
es
Trade-offs
Vihiga,
western
Kenya
Mixed
crop-
livestock
enterprises
1.Household
food
security
Yield
variability
Diversify
away
from
amaize-
basedsystem
,e.g.
bygrow
ingacash
crop
(tea,passion
fruit)
Meanincome
increasedfor
givenlevelsof
incomevariability
Can
partially
offset
land
size
decreasesby
intensificationor
diversification(Fig.5)
2.Generatecash
tomeet
household’sfood
requirem
ents
Decreasingland
size
dueto
inheritance
patternsand
populatio
n
increases
Intensifythe
system
by
increasing
useof
inputs
Decreaseincome
variability
fora
givenlevelof
return
by
increasing
off-
farm
income
Long-term
impactson
soilfertility
may
benegativ
ewith
insufficient
useof
inputs
3.Maintainsomemaize
productio
nandfuelwoodtrees
forcultu
ralreasons
Increase
proportio
n
ofoff-farm
income
4.Maintainsoilfertility,ifat
all
possible
Hum Ecol

ultimately, the limits within which agricultural research canreasonably be expected to contribute to improving andsustaining livelihoods in particular situations. Scholes andBiggs (2004) refer to sub-Saharan Africa as the food crisisepicentre of the world, and they conclude that global changewill only add burdens to those who are already poor andvulnerable. Given this, equipping policymakers and donorswith the tools and information needed to identify the “boundsof the possible” related to natural resource use, is likely to takeon considerable importance, in the fight to reduce thevulnerability and alleviate the poverty of the hundreds ofmillions of people in the continent who are currentlydependent on natural resources for their way of life.
Acknowledgements This is a greatly expanded version of apresentation made at the 6th Open Meeting of the Human Dimensionsof Global Environmental Change, 9–13 October 2005, University ofBonn, Germany. We gratefully acknowledge funding provided asfollows:• To M. Coughenour and others by the Global Livestock CollaborativeResearch Support Program, supported by the Office of Agricultureand Food Security, Global Bureau, United States Agency forInternational Development under Grant no. PCE-G-98-00036-00(Ngorongoro Conservation Area, Tanzania; Kajiado, Kenya).
• By the US National Science Foundation Biocomplexity program toN.T. Hobbs and others under grant 0119618 (Kajiado, Kenya).
• By NOAA’s Human Dimensions of Global Change Research(HDGCR) Program, grant number NA86GP0347, to K.A. Galvinand others (Northwest Province, RSA).
• By the Ecoregional Fund to Support Methodological Initiatives ofthe Government of The Netherlands, to P.K. Thornton and others(Vihiga, Kenya).
• By the US National Science Foundation, Decision Making UnderUncertainly, grant NSF SES-0345529, to K.A. Galvin and D. Ojima.We thank three anonymous reviewers for constructive comments onan earlier draft. The errors and omissions that remain are ourresponsibility.
References
Boone, R. B., and BurnSilver, S. (2002). Integrated assessment resultsto aid policy decisions in Ngorongoro Conservation Area,Tanzania. POLEYC (Policy Options for Livestock-Based Live-lihoods and Ecosystem Conservation) Project report, GlobalLivestock Collaborative Research Support Program, Universityof California, Davis, 79 pp. Online at http://www.nrel.colostate.edu/projects/imas/prods/finals/NCA_Final_Jun_02.pdf
Boone, R. B., and Coughenour, M. B. (2000). Integrated Managementand Assessment System: Balancing Food Security, Conservationand Ecosystem Integrity. Using Savanna and SavView inecosystem modelling. NREL, CSU, Fort Collins, CO.
Boone, R. B., Coughenour, M. B., Galvin, K. A., and Ellis, J. A.(2002). Addressing Management Questions for NgorongoroConservation Area, Tanzania, Using the Savanna ModellingSystem. African Journal of Ecology 40: 138–150.
Boone, R. B., Galvin, K. A., Coughenour, M. B., Hudson, J. W.,Weisberg, P. J., Vogel, C. H., and Ellis, J. E. (2004). EcosystemModeling Adds Value to a South African Climate Forecast.Climatic Change 64: 317–340.
Boone, R. B., BurnSilver, S. B., Thornton, P. K., Worden, J. S., andGalvin, K. A. (2005). Quantifying Declines in Livestock Due to
Land Subdivision in Kajiado District, Kenya. Rangeland Ecologyand Management 58: 523–532.
Boone, R. B., Galvin, K. A., Thornton, P. K., Swift, D. M., andCoughenour, M. B. (2006). Cultivation and conservation inNgorongoro Conservation Area, Tanzania. Human Ecology 34,doi 0.1007/s10745-006-9031-3.
Bouwman, A. F., Kram, T., and Klein Goldewijk, K. (eds) (2006).Integrated Modelling of Global Environmental Change. AnOverview of IMAGE 2.4. Netherlands Environmental AssessmentAgency (MNP), Bilthoven, The Netherlands. Online at http://www.mnp.nl/en /publications/2006/Integratedmodellingofglobalenvironmentalchange.AnoverviewofIMAGE2.4.html
BurnSilver, S. (2007). Critical Factors Affecting Maasai Pastoral-ism: The Amboseli Region, Kajiado District, Kenya. PhDthesis, Natural Resource Ecology Laboratory, Colorado StateUniversity.
Central Bureau of Statistics (2001). 1999 Population and housingcensus. Counting our people for development. Vol. I Populationdistribution by administrative areas and urban centres. CentralBureau of Statistics, Ministry of Finance and Planning, Nairobi,Kenya.
Central Bureau of Statistics (2003). Geographic dimensions of well-being in Kenya. Where are the poor? From districts to locations,Vol. 1 CBS, Ministry of Planning and National Development,Nairobi, Kenya.
Coughenour, M. B. (1993). Savanna—A Spatial Ecosystem Model.Model Description and User Guide. NREL, Colorado StateUniversity, Fort Collins, CO.
Delgado, C., Rosegrant, M., Steinfeld, H., Ehui, S., and Courbois, C.(1999). Livestock to 2020: the next food revolution. Food,Agriculture and the Environment Discussion Paper 28. IFPRI/FAO/ILRI, Washington, DC, USA.
Department of Agriculture (1999). Atlas Products of the North WestProvince. Technical Supportive Services GIS Section, Depart-ment of Agriculture, North West Province, Potchefstroom,Republic of South Africa.
Dixon, J., and Gulliver, A. (2001). Farming Systems and Poverty:Improving Farmers’ Livelihoods in a Changing World. FAO,Rome.
Ellis, F. (2004). Occupational diversification in developing countriesand the implications for agricultural policy. Programme ofAdvisory and Support Services to DFID (PASS) Project No.WB0207, online at http://passlivelihoods.org.uk/site_files%5Cfiles%5Creports %5Cproject_id_218%5COccupational%20Diversification%20Paper_WB0207.pdf
Ellis, J. E., and Coughenour, M. B. (1998). The Savanna integratedmodelling system: an integrated remote sensing, GIS andspatial simulation modelling approach. In Squires, V. R.,Sidahmed, A. E. (eds.), Drylands: Sustainable Use of RangeLands into the Twentyfirst Century (IFAD Series: TechnicalReport). pp. 97–106.
Ellis, J., Reid, R., Thornton, P., and Kruska, R. (1999). Populationgrowth and land-use change among pastoral people: Localprocesses and continental patterns. In E. David, F. David(eds), Proceedings of the VIth International Rangeland Con-gress, 19–23 July 1999. Townsville, Queensland, Australia,pp. 168–169.
FAO (2006). Food and Agriculture Organisation of the United NationsStatistical Databases. Online at http://apps.fao.org
Folke, C., Carpenter, S., Elmqvist, T., Gunderson, L., Holling, C.S.,Walker, B., Bengtsson, J., Berkes, F., Colding, J., Danell, K.,Falkenmark, M., Gordon, L., Kasperson, R., Kautsky, N., Kinzig,A., Levin, S., Mäler, K.-G., Moberg, F., Ohlsson, L., Olsson, P.,Ostrom, E., Reid, W., Rockström, J., Savenije, H., and Svedin, U.(2002). Resilience and sustainable development: building adap-tive capacity in a world of transformation. Scientific background
Hum Ecol

paper on resilience for the process of The World Summit onSustainable Development on behalf of The EnvironmentalAdvisory Council to the Swedish Government. Ministry of theEnvironment, Stockholm, Sweden. Online at http://www.sou.gov.se/mvb/pdf/resiliens.pdf
Galaty, J. G. (1994). Having Land in Common: The Subdivision of MaasaiGroup Ranches in Kenya. Nomadic Peoples 34/35: 109–122.
Galvin, K. A. (1992). Nutritional Ecology of Pastoralists in Dry TropicalAfrica. American Journal of Human Biology 4: 209–221.
Galvin, K. A., Thornton, P. K., de Pinho, J., Sutherland, J., andBoone, R. B. (2006). Integrated Modeling and its Potential forResolving Conflicts Between Conservation and People in theRangelands of East Africa. Human Ecology 34(2): 155–183.
Gichohi, H., Gakahu, C., and Mwangi, E. (1996). Savannahecosystems. In T. R. McClanahan, T. P. Young (eds), EastAfrican Ecosystems and Their Conservation, Oxford UniversityPress, Oxford, UK, pp. 243–270.
GoK (Government of Kenya), (2001). 1999 Population and HousingCensus. Volume 1. Counting our People for Development. Popula-tion Distribution by Administrative Areas and Urban Centres pp.446, Ministry of Finance and Planning, Nairobi, Kenya.
GoK (Government of Kenya), 2003. Geographic dimensions of well-being in Kenya. Volume 1: Where are the Poor? From Districts toLocations. Ministry of Planning and National Development.Central Bureau of Statistics.
Herrero, M., and Fawcett, R. H. (2002). A generic household modelfor assessing the impact of interventions in crop-livestocksystems. Proceedings of the 17th Symposium of the InternationalFarming Systems Association, Lake Buena Vista, Florida, p 106,17–20 November.
Herrero, M., Fawcett, R. H., and Jessop, N. S. (2002). Predictingintake and nutrient supply for tropical and temperate diets forruminants using a simple dynamic model of digestion. InternalReport. Institute of Ecology and Resource Management, Univer-sity of Edinburgh, Scotland. p 39.
Herrero, M., González-Estrada, E., Thornton, P. K., Quiros, C.,Waithaka, M. M., Ruiz, R., and Hoogenboom, G. (2007).IMPACT: Generic Household-level Databases and DiagnosticsTools for Integrated Crop-livestock Systems Analysis. Agricul-tural Systems 92: 240–265.
Hobbs, N. T., Reid, R. S., Galvin, K. A., and Ellis, J. E. (2007).Fragmentation of arid and semi-arid ecosystems: implications forpeople and animals. In K. A. Galvin, R. S. Reid, R. H. Behnke, andN. T. Hobbs (eds), Fragmentation in Semi-arid and Arid Land-scapes: Consequences for Human and Natural Systems. In press.
Homewood, K. M. (1992). Development and the Ecology of MaasaiPastoralist Food and Nutrition. Ecology of Food and Nutrition29: 61–80.
Hudson, J. W. (2002). Response to climate variability in the livestocksector in the North-West Province, South Africa. MA thesis,Colorado State University, Fort Collins, Colorado, USA.
IPCC (Intergovernmental Panel on Climate Change) (2001). ClimateChange 2001: The Scientific Basis. Cambridge University Press,Cambridge, UK.
Kijazi, A., Mkumbo, S., and Thompson, D. M. (1997). Human andlivestock population trends. In D. M. Thompson (Ed.), MultipleLand-use: The Experience of the Ngorongoro Conservation Area,Tanzania. IUCN, Gland, Switzerland, pp. 167–180.
Kristjanson, P., Radeny, M., Nkedyanye, D., Kruska, R., Reid, R.,Gichohi, H., Atieno, F., and Sanford, R. (2002). Valuingalternative land use options in the Kitengela wildlife dispersalarea of Kenya. ILRI Impact Assessment Series 10. InternationalLivestock Research Institute and African Conservation CentreReport. ILRI, Nairobi, Kenya. 61 pp.
Moehlman, P. D., Runyoro, V. A., and Hofer, H. (1997). Wildlifepopulation trends in the Ngorongoro Crater. In D.M. Thompson
(ed.), Multiple Land-use: The Experience of the NgorongoroConservation Area, Tanzania. IUCN, Gland, Switzerland, pp. 59–69.
NCAA (Ngorongoro Conservation Area Authority) (1999). 1998 aerialboma count, 1999 people and livestock census, and humanpopulation trend between 1954 and 1999 in the NCA. Researchand Planning Unit, NCAA, Ngorongoro Crater, Tanzania.
O’Brien, K., and Vogel, C. (2003). A future for forecasts? In K.O’Brien, C. Vogel (eds), Coping with Climate Variability: TheUse of Seasonal Climate Forecasts in Southern Africa. Ashgate,Aldershot, pp 197–211.
Ole Parkipuny, M. S. (1997). Pastoralism, conservation and develop-ment in the Greater Serengeti Region. In D. M. Thompson (ed),Multiple Land-Use: The Experience of the Ngorongoro Conser-vation Area, Tanzania, Gland, Switzerland and Cambridge, UK,IUCN, pp. 143–168.
Olson J. M., Alagarswamy G., Andresen J., Campbell D. J., Ge J.,Huebner M., Lofgren B., Lusch D. P., Moore N., Pijanowski B.C., Qi J., Thornton P. K., Torbick N. and Wang J. (2007).Integrating diverse methods to understand climate-land interac-tions in East Africa. GeoForum. In press.
Patz, J. A., Campbell-Lendrum, D., Holloway, T., and Foley, J. A.(2005). Impact of Regional Climate Change on Human Health.Nature 438: 310–317 (17 November).
Raiffa, H. (1968). Decision Analysis. Addison-Wesley, Reading, MA.Ritchie, J. T., Singh, U., Godwin, D. C., and Bowen, W. T. (1998).
Cereal growth, development and yield. In G. Y. Tsuji, G.Hoogenboom, P. K. Thornton (eds), Understanding Options forAgricultural Production, Kluwer, Dordrecht, pp 79–98.
Sayer, J. A., and Campbell, B. (2001). Research to integrateproductivity enhancement, environmental protection, and humandevelopment. Conservation Ecology 5(2): 32. [online] URL:http://www.consecol.org/vol5/iss2/art32
Scholes, R. J., and Biggs, R. (eds) (2004). Ecosystem Services inSouthern Africa: A Regional Assessment. Council for Scientificand Industrial Research, Pretoria, South Africa, 84 pp (acontribution to the Millennium Ecosystem Assessment). Onlineat http://www.millenniumassessment.org
Simms, A., Magrath, J., and Reid, H. (2004). Up in Smoke? ThreatsFrom, and Responses to, the Impact of Global Warming onHuman Development. IIED and NEF, London.
Slingo, J. M., Challinor, A. J., Hiskins, B. J., and Wheeler, T. R. (2005).Introduction: Food Crops in a Changing Climate. PhilosophicalTransactions of the Royal Society, Series B 360: 1983–1989.
Staal, S. J., Ehui, S., and Tanner, J. C. (2001). Livestock-environmentinteractions under intensifying production. In D. R. Lee, C. B.Barrett (eds.), Tradeoffs or Synergies? Agricultural Intensifica-tion, Economic Development and the Environment, CAB Inter-national, Wallingford, UK, 345–364.
Stainforth, D. A., Aina, T., Christensen, C., Collins, M., Faull, N.,Frame, D. J., Kettleborough, J. A., Knight, S., Martin, A.,Murphy, J. M., Piani, C., Sexton, D., Smith, L. A., Spicer, R. A.,Thorpe, A. J., and Allen, M. R. (2005). Uncertainty inPredictions of the Climate Response to Rising Levels ofGreenhouse Gases. Nature 433: 403–406.
Thomas, D., and Rangnekar, D. (2004). Responding to theincreasing global demand for animal products: implicationsfor the livelihoods of livestock producers in developingcountries. In: E. Owen, T. Smith, M. A. Steele, S. Anderson,A. J. Duncan, M. Herrero, J. D. Leaver, C. K. Reynolds, J. I.Richards, J. C. Ku-Vera (eds.), Responding to the LivestockRevolution: The Role of Globalisation and Implications forPoverty Alleviation. British Society of Animal Science Publica-tion 33, Nottingham University Press, 1–35.
Thomas, D. S. G., and Twyman, C. (2005). Equity and Justice inClimate Change Adaptation Amongst Natural-resource-dependentSocieties. Global Environmental Change 15: 115–124.
Hum Ecol

Thornton, P. K., Galvin, K. A., and Boone, R. B. (2003). An Agro-pastoral Household Model for the Rangelands of East Africa.Agricultural Systems 76: 601–622.
Thornton, P. K., Fawcett, R. H., Galvin, K. A., Boone, R. B., Hudson, J.W., and Vogel, C. H. (2004). Evaluating Management Options thatUse Climate Forecasts: Modelling Livestock Production Systems inthe Semi-arid Zone of South Africa. Climate Research 26: 33–42.
Thornton, P. K., Burnsilver, S. B., Boone, R. B., and Galvin, K. A.(2006). Modelling the Impacts of Group Ranch Subdivision onHouseholds in Kajiado, Kenya. Agricultural Systems 87: 331–356.
URT (United Republic of Tanzania) (2003). 2002 Population and HousingCensus General Report. Government Printers, Dar-es-Salaam,Tanzania.
Waithaka, M. M., Thornton, P. K., Shepherd, K. D., and Herrero, M.(2006). Bio-economic Evaluation of Farmers’ Perceptions of ViableFarms in Western Kenya. Agricultural Systems 90: 243–271.
Walker, B., Holling, C. S., Carpenter, S. R., and Kinzig, A. (2004).Resilience, Adaptability and Transformability in Social-ecologicalSystems. Ecology and Science 9 (2): 5. [online] URL: http://www.ecologyandsociety.org/vol9/iss2/art5
Hum Ecol