Control Center User Guide - Identity & Access Management
380
Control Center User Guide NetIQ ® AppManager ® October 2008
-
Upload
khangminh22 -
Category
Documents
-
view
2 -
download
0
Transcript of Control Center User Guide - Identity & Access Management

Control Center User Guide
NetIQ® AppManager®
October 2008

Legal Notice
NetIQ AppManager is covered by United States Patent No(s): 05829001, 05986653, 05999178, 06078324, 06397359, 06408335.
THIS DOCUMENT AND THE SOFTWARE DESCRIBED IN THIS DOCUMENT ARE FURNISHED UNDER AND ARE SUBJECT TO THE TERMS OF A LICENSE AGREEMENT OR A NON-DISCLOSURE AGREEMENT. EXCEPT AS EXPRESSLY SET FORTH IN SUCH LICENSE AGREEMENT OR NON-DISCLOSURE AGREEMENT, NETIQ CORPORATION PROVIDES THIS DOCUMENT AND THE SOFTWARE DESCRIBED IN THIS DOCUMENT "AS IS" WITHOUT WARRANTY OF ANY KIND, EITHER EXPRESS OR IMPLIED, INCLUDING, BUT NOT LIMITED TO, THE IMPLIED WARRANTIES OF MERCHANTABILITY OR FITNESS FOR A PARTICULAR PURPOSE. SOME STATES DO NOT ALLOW DISCLAIMERS OF EXPRESS OR IMPLIED WARRANTIES IN CERTAIN TRANSACTIONS; THEREFORE, THIS STATEMENT MAY NOT APPLY TO YOU.
This document and the software described in this document may not be lent, sold, or given away without the prior written permission of NetIQ Corporation, except as otherwise permitted by law. Except as expressly set forth in such license agreement or non-disclosure agreement, no part of this document or the software described in this document may be reproduced, stored in a retrieval system, or transmitted in any form or by any means, electronic, mechanical, or otherwise, without the prior written consent of NetIQ Corporation. Some companies, names, and data in this document are used for illustration purposes and may not represent real companies, individuals, or data.
This document could include technical inaccuracies or typographical errors. Changes are periodically made to the information herein. These changes may be incorporated in new editions of this document. NetIQ Corporation may make improvements in or changes to the software described in this document at any time.
© 2008 NetIQ Corporation, all rights reserved.
U.S. Government Restricted Rights: If the software and documentation are being acquired by or on behalf of the U.S. Government or by a U.S. Government prime contractor or subcontractor (at any tier), in accordance with 48 C.F.R. 227.7202-4 (for Department of Defense (DOD) acquisitions) and 48 C.F.R. 2.101 and 12.212 (for non-DOD acquisitions), the government’s rights in the software and documentation, including its rights to use, modify, reproduce, release, perform, display or disclose the software or documentation, will be subject in all respects to the commercial license rights and restrictions provided in the license agreement.
Check Point, FireWall-1, VPN-1, Provider-1, and SiteManager-1 are trademarks or registered trademarks of Check Point Software Technologies Ltd.
ActiveAgent, ActiveAnalytics, ActiveAudit, ActiveReporting, ADcheck, Aegis, AppAnalyzer, AppManager, the cube logo design, Change Administrator, Change Guardian, Compliance Suite, Directory and Resource Administrator, Directory Security Administrator, Domain Migration Administrator, Exchange Administrator, File Security Administrator, Group Policy Administrator, Group Policy Guardian, Group Policy Suite, IntelliPolicy, Knowing is Everything, Knowledge Scripts, Mission Critical Software for E-Business, MP3check, NetConnect, NetIQ, the NetIQ logo, the NetIQ Partner Network design, Patch Manager, PSAudit, PSDetect, PSPasswordManager, PSSecure, Risk and Compliance Center, Secure Configuration Manager, Security Administration Suite, Security Analyzer, Security Manager, Server Consolidator, VigilEnt, Vivinet, Vulnerability Manager, Work Smarter, and XMP are trademarks or registered trademarks of NetIQ Corporation or its subsidiaries in the United States and other jurisdictions. All other company and product names mentioned are used only for identification purposes and may be trademarks or registered trademarks of their respective companies.

Contents
About This Guide xix
Intended Audience . . . . . . . . . . . . . . . . . . . . . . . . . . . . xixConventions . . . . . . . . . . . . . . . . . . . . . . . . . . . . . . . . . xxUsing Help . . . . . . . . . . . . . . . . . . . . . . . . . . . . . . . . . . xxOther Information in the Library . . . . . . . . . . . . . . . . . . xxiAbout NetIQ Corporation . . . . . . . . . . . . . . . . . . . . . . . xxii
Contacting NetIQ Corporation . . . . . . . . . . . . . . . xxiii
Chapter 1 Introduction 1
What Is AppManager? . . . . . . . . . . . . . . . . . . . . . . . . . . 3What Is Unique about AppManager? . . . . . . . . . . . . . . . 4How Does AppManager Work? . . . . . . . . . . . . . . . . . . . 5
AppManager Architecture and Components . . . . . . 5Control Center Architecture and Components. . . . . 8Communication between AppManager Components 9
How Does Deployment Work? . . . . . . . . . . . . . . . . . . . 15Rule-based Deployment . . . . . . . . . . . . . . . . . . . . 15Approval-based Deployment Tasks. . . . . . . . . . . . 16Agent Deployment Architecture and Components. 16
What are AppManager Reports? . . . . . . . . . . . . . . . . . 18
iii

Chapter 2 Getting Started 21
Starting the Control Center Console . . . . . . . . . . . . . . . 21Getting Help for the Control Center Console . . . . . 23Accessing License Information. . . . . . . . . . . . . . . . 24
About the Control Center Console . . . . . . . . . . . . . . . . 24Working with Panes . . . . . . . . . . . . . . . . . . . . . . . . 25Working with Management Groups . . . . . . . . . . . . 26Deploying AppManager Agents . . . . . . . . . . . . . . . 27
Adding an AppManager Repository to Control Center . 27Before You Begin . . . . . . . . . . . . . . . . . . . . . . . . . . 28Adding an AppManager Repository . . . . . . . . . . . . 29
Changing the Authentication Method . . . . . . . . . . . . . . 34Changing the Primary AppManager Repository . . . . . . 35Removing an AppManager Repository from Control Center . . . . . . . . . . . . . . . . . . . . . . . . . . . . . . . . 36
Chapter 3 Configuring the Control Center Console 39
Customizing the Control Center Console Layout . . . . . 39Selecting a Management Group . . . . . . . . . . . . . . . . . . 40
Navigation Shortcuts . . . . . . . . . . . . . . . . . . . . . . . 40Renaming a Management Group or View . . . . . . . 41Saving View Settings . . . . . . . . . . . . . . . . . . . . . . . 41
Identifying the Computers to Monitor . . . . . . . . . . . . . . 41Adding a Computer to the Master View of a Repository 42
Deleting a Computer. . . . . . . . . . . . . . . . . . . . . . . . 45Deleting Resources . . . . . . . . . . . . . . . . . . . . . . . . 45
Viewing Detailed Information about Discovered Resources . . . . . . . . . . . . . . . . . . . . . . . . . . . . . . . . . . . 45
iv Control Center User Guide

Viewing AppManager System Information . . . . . . . . . . 46Working with the View Pane . . . . . . . . . . . . . . . . . . . . . 46
Refreshing the List . . . . . . . . . . . . . . . . . . . . . . . . . 46Resizing Column Width To Best Fit . . . . . . . . . . . . 46Rearranging Columns . . . . . . . . . . . . . . . . . . . . . . 46Locking Columns . . . . . . . . . . . . . . . . . . . . . . . . . . 47Expanding the List . . . . . . . . . . . . . . . . . . . . . . . . . 47Sorting the List . . . . . . . . . . . . . . . . . . . . . . . . . . . . 47Grouping the List . . . . . . . . . . . . . . . . . . . . . . . . . . 48Filtering the List . . . . . . . . . . . . . . . . . . . . . . . . . . . 49Wildcard Filters . . . . . . . . . . . . . . . . . . . . . . . . . . . 50Saving Your View Settings . . . . . . . . . . . . . . . . . . 50Exporting the List . . . . . . . . . . . . . . . . . . . . . . . . . . 50
Setting Preferences . . . . . . . . . . . . . . . . . . . . . . . . . . . 51Control Center Console Options . . . . . . . . . . . . . . 51Command Queue Service (CQS) Options. . . . . . . 54Deployment Options . . . . . . . . . . . . . . . . . . . . . . . 57General Options. . . . . . . . . . . . . . . . . . . . . . . . . . . 60
Viewing the Status of Control Center . . . . . . . . . . . . . . 61Getting Information about a Knowledge Script . . . . . . . 61Checking Communication with Managed Computers . . 62Monitoring the Status of Control Center . . . . . . . . . . . . 62
Monitoring Commands in the Queue Manager . . . 62Monitoring Connectivity to AppManager Repositories. . . . . . . . . . . . . . . . . . . . . . . . . . . . . . 63Monitoring the Status of Deployment Tasks . . . . . 64
Contents v

Using the Utilities Menu Extensions . . . . . . . . . . . . . . . 65AppManager Utilities . . . . . . . . . . . . . . . . . . . . . . . 65Windows Utilities . . . . . . . . . . . . . . . . . . . . . . . . . . 66
Viewing Audit Information . . . . . . . . . . . . . . . . . . . . . . . 67
Chapter 4 Managing a Group of Computers 69
About Management Groups . . . . . . . . . . . . . . . . . . . . . 69Creating a Management Group . . . . . . . . . . . . . . . . . . . 70Adding Members to a Management Group . . . . . . . . . . 72
Changing a Management Group Rule . . . . . . . . . . 74Removing a Member From a Management Group. 74
Creating a Rule to Select the Computers You Want to Manage . . . . . . . . . . . . . . . . . . . . . . . . . . . . . . . . . . . . . 75
Configuring a Rule . . . . . . . . . . . . . . . . . . . . . . . . . 78Working with Expression Templates . . . . . . . . . . . 81Working with Custom Property Information . . . . . . 81Working with Objects . . . . . . . . . . . . . . . . . . . . . . . 86
Configuring Permissions for a Management Group . . . 87Granting Permission to Access a Management Group . . . . . . . . . . . . . . . . . . . . . . . . . . . . . . . . . . . 87Removing Permission to Access a Management Group . . . . . . . . . . . . . . . . . . . . . . . . . . . . . . . . . . . 87
vi Control Center User Guide
Creating Standard Control Center Views . . . . . . . . . . . 88About the Management Group Summary View . . . 88Organizing Views into Folders . . . . . . . . . . . . . . . . 89Setting the Column Layout of a View. . . . . . . . . . . 90Setting the Default Filtering for a View . . . . . . . . . 91Setting the Default Grouping for a View . . . . . . . . 92Setting the Default Sorting Order for a View . . . . . 93Configuring the Server Information Pane . . . . . . . 94Refreshing a View . . . . . . . . . . . . . . . . . . . . . . . . . 96Deleting or Renaming a Management Group or View . . . . . . . . . . . . . . . . . . . . . . . . . . . . . . . . . . . . 96
What’s Next? . . . . . . . . . . . . . . . . . . . . . . . . . . . . . . . . 96
Chapter 5 Running Monitoring Jobs 97
About Knowledge Scripts and Jobs . . . . . . . . . . . . . . . 97Running Jobs to Pinpoint Problems. . . . . . . . . . . . 98Parent and Child Jobs . . . . . . . . . . . . . . . . . . . . . . 99Adding a Child Job to an Existing Parent . . . . . . 100Planning which Knowledge Scripts to Run . . . . . 100
Starting a New Job . . . . . . . . . . . . . . . . . . . . . . . . . . . 101Setting the Schedule . . . . . . . . . . . . . . . . . . . . . . . . . 102Setting the Values to Monitor . . . . . . . . . . . . . . . . . . . 105Setting Override Values . . . . . . . . . . . . . . . . . . . . . . . 107
Getting Started. . . . . . . . . . . . . . . . . . . . . . . . . . . 108Enabling an Override for a Parameter . . . . . . . . . 109Configuring an Override Value . . . . . . . . . . . . . . 110Viewing the Override Value for a Parameter . . . . 112Removing a Job Override . . . . . . . . . . . . . . . . . . 113
Contents vii

Specifying One or More Corrective Actions . . . . . . . . 116Understanding How Actions Work on Windows Computers . . . . . . . . . . . . . . . . . . . . . . . . . . . . . . 117Understanding How Actions Work on Unix Computers . . . . . . . . . . . . . . . . . . . . . . . . . . . . . . 118
Selecting Objects to Monitor . . . . . . . . . . . . . . . . . . . . 120Setting Advanced Job Properties . . . . . . . . . . . . . . . . 120
Filtering Temporary Event Conditions . . . . . . . . . 121Changing Event Collapsing Options for One Job . 123Automatically Closing an Event When the Event Condition No Longer Exists . . . . . . . . . . . . . . . . . 124Changing Data Collection Options for One Job . . 125
Customizing Knowledge Scripts . . . . . . . . . . . . . . . . . 128Changing Default Knowledge Script Properties . . 128Propagating a Knowledge Script to Ad Hoc Jobs. 130Replicating a Knowledge Script . . . . . . . . . . . . . . 131Copying a Knowledge Script . . . . . . . . . . . . . . . . 132Checking a Knowledge Script into the Repository 133
Checking and Changing Job Status . . . . . . . . . . . . . . 135Viewing Jobs in the Job View . . . . . . . . . . . . . . . . 136Viewing the Actual Script for a Running Job . . . . 136Changing the Sorting Order . . . . . . . . . . . . . . . . . 136Changing Job Status . . . . . . . . . . . . . . . . . . . . . . 136Stopping a Job . . . . . . . . . . . . . . . . . . . . . . . . . . . 137Restarting a Job . . . . . . . . . . . . . . . . . . . . . . . . . . 137Changing Properties of a Running Job. . . . . . . . . 138Viewing Job Comments . . . . . . . . . . . . . . . . . . . . 138Adding Comments to a Job . . . . . . . . . . . . . . . . . 139
viii Control Center User Guide

Initiating Maintenance on a Computer . . . . . . . . . . . . 140Grouping and Filtering Job Information . . . . . . . . . . . 141
Organizing Jobs into Groups . . . . . . . . . . . . . . . . 142Filtering the List of Jobs. . . . . . . . . . . . . . . . . . . . 142
Viewing Job Results . . . . . . . . . . . . . . . . . . . . . . . . . . 144View Jobs in the Job View . . . . . . . . . . . . . . . . . . 144View Results in the Server Information Pane . . . 144
Closing a Job . . . . . . . . . . . . . . . . . . . . . . . . . . . . . . . 144Deleting a Job . . . . . . . . . . . . . . . . . . . . . . . . . . . . . . 146
Chapter 6 Responding to Events 147
How Events Are Raised . . . . . . . . . . . . . . . . . . . . . . . 147Event Severity Levels . . . . . . . . . . . . . . . . . . . . . . . . . 148Viewing Events . . . . . . . . . . . . . . . . . . . . . . . . . . . . . . 149Grouping and Filtering Event Information . . . . . . . . . . 150
Organizing Events into Groups . . . . . . . . . . . . . . 150Filtering the List of Events . . . . . . . . . . . . . . . . . . 150Viewing Events . . . . . . . . . . . . . . . . . . . . . . . . . . 152Changing the Sorting Order. . . . . . . . . . . . . . . . . 153
Viewing Details about an Event . . . . . . . . . . . . . . . . . 153Viewing Event Actions . . . . . . . . . . . . . . . . . . . . . 154Viewing Event Comments . . . . . . . . . . . . . . . . . . 154
Adding Comments to an Event . . . . . . . . . . . . . . . . . . 155Grouping and Filtering Events . . . . . . . . . . . . . . . . . . 156
Organizing Events into Groups . . . . . . . . . . . . . . 157Filtering the List of Events . . . . . . . . . . . . . . . . . . 157
Contents ix
Changing the Status of an Event . . . . . . . . . . . . . . . . 158Acknowledging an Event . . . . . . . . . . . . . . . . . . . 159Closing an Event . . . . . . . . . . . . . . . . . . . . . . . . . 160Deleting an Event . . . . . . . . . . . . . . . . . . . . . . . . . 162
What Are Duplicate Events? . . . . . . . . . . . . . . . . . . . . 162Setting Global Event Collapsing Options . . . . . . . 165
How Events Are Automatically Closed When the Event Condition No Longer Exists . . . . . . . . . . . . . . . . . . . . . 166
Setting Global Options for Automatically Closing Events When the Event Condition No Longer Exists . . . . . . . . . . . . . . . . . . . . . . . . . 168
Chapter 7 Running Reports 169
Understanding AppManager Reporting . . . . . . . . . . . . 169About Application-specific Reports. . . . . . . . . . . . 170About Generic Reports . . . . . . . . . . . . . . . . . . . . . 171Understanding How Appmanager Reports Work . 171
Managing Data Collected for Reports . . . . . . . . . . . . . 174Running a Report . . . . . . . . . . . . . . . . . . . . . . . . . . . . 174
Starting a Report . . . . . . . . . . . . . . . . . . . . . . . . . 175Setting the Schedule . . . . . . . . . . . . . . . . . . . . . . 177Setting the Report Values. . . . . . . . . . . . . . . . . . . 178Selecting a Report Agent to Run the Report . . . . 180
Viewing and Printing a Report . . . . . . . . . . . . . . . . . . . 182
x Control Center User Guide

Performing Additional Tasks . . . . . . . . . . . . . . . . . . . 183Tips for Configuring Reports . . . . . . . . . . . . . . . . 183Configuring Where the Report Agent Generates Reports . . . . . . . . . . . . . . . . . . . . . . . . . . . . . . . . 184Reporting on Data Collected by a Copy of a Knowledge Script . . . . . . . . . . . . . . . . . . . . . . . . . 185Limiting Access to Reports . . . . . . . . . . . . . . . . . 186Maintaining the Size Of the Report Folder. . . . . . 189Configuring the Report Agent to Run Action_SMTPMailRpt. . . . . . . . . . . . . . . . . . . . . . 191Exporting Report Content . . . . . . . . . . . . . . . . . . 191Adding the Additional Block of Code . . . . . . . . . . 194
Chapter 8 Monitoring by Policy 197
About Policy-based Monitoring . . . . . . . . . . . . . . . . . . 197How Monitoring Policies Work . . . . . . . . . . . . . . . 198How Knowledge Script Groups Work . . . . . . . . . 200Viewing Policy-based Jobs in the Job View. . . . . 202
Creating a Knowledge Script Group . . . . . . . . . . . . . . 202Viewing Knowledge Script Groups in the Knowledge Script View. . . . . . . . . . . . . . . . . . . . . . . . . . . . . . 204Creating a Group of Monitoring Jobs. . . . . . . . . . 205Viewing Monitoring Jobs Started by a Knowledge Script Group. . . . . . . . . . . . . . . . . . . . . . . . . . . . . 206
Contents xi

Changing a Knowledge Script Group . . . . . . . . . . . . . 206Propagating a Knowledge Script Group Member to Ad Hoc Jobs. . . . . . . . . . . . . . . . . . . . . . . . . . . . . . . . 208Propagating Properties of a Knowledge Script to Knowledge Script Group Members. . . . . . . . . . . . 210Copying a Knowledge Script Group . . . . . . . . . . . 211Deleting a Knowledge Script Group . . . . . . . . . . . 212
Creating a Monitoring Policy . . . . . . . . . . . . . . . . . . . . 212Changing a Monitoring Policy . . . . . . . . . . . . . . . . . . . 214Stopping and Restarting Policy-based Jobs . . . . . . . . 215
Chapter 9 Using Service Map Views 217
Understanding Service Map Views . . . . . . . . . . . . . . . 217Working with Service Map Views . . . . . . . . . . . . . . . . 218
Displaying a Service Map View . . . . . . . . . . . . . . 219Understanding Event Indicators . . . . . . . . . . . . . . 220Managing Events . . . . . . . . . . . . . . . . . . . . . . . . . 221Managing Jobs . . . . . . . . . . . . . . . . . . . . . . . . . . . 221Viewing Detailed Information About Discovered Resources . . . . . . . . . . . . . . . . . . . . . . . . . . . . . . 222Managing Custom Properties . . . . . . . . . . . . . . . . 223
Designing a Service Map View . . . . . . . . . . . . . . . . . . 224Creating a Service Map View . . . . . . . . . . . . . . . . 225Adding an AppManager Object . . . . . . . . . . . . . . 228Embedding a View . . . . . . . . . . . . . . . . . . . . . . . . 229Editing Objects in a Service Map . . . . . . . . . . . . . 232Showing and Hiding the Grid . . . . . . . . . . . . . . . . 232Adding and Formatting Text . . . . . . . . . . . . . . . . . 233Connecting AppManager Objects. . . . . . . . . . . . . 234
xii Control Center User Guide
Drawing an Ellipse, Rectangle or Rounded Rectangle. . . . . . . . . . . . . . . . . . . . . . . . . . . . . . . 235Adding a Custom Node . . . . . . . . . . . . . . . . . . . . 237Adding a Background Image . . . . . . . . . . . . . . . . 238Checking a Service Map View Into and Out of the Database . . . . . . . . . . . . . . . . . . . . . . . . . . . . . . . 239Reverting to the Previous Version of a Service Map View . . . . . . . . . . . . . . . . . . . . . . . . . . . . . . . . . . . 240Exporting a Service Map View to an Image File . 240Viewing Revision History for a Service Map View 242
Using Security Settings . . . . . . . . . . . . . . . . . . . . . . . 243
Chapter 10 Deploying AppManager to Managed Clients 245
What Is Deployment? . . . . . . . . . . . . . . . . . . . . . . . . . 245How Does Agent Deployment Work? . . . . . . . . . . . . . 246
Deployment Rules . . . . . . . . . . . . . . . . . . . . . . . . 246Deployment Service and Deployment Server . . . 247Enabling Deployment Rules and Generating Deployment Tasks . . . . . . . . . . . . . . . . . . . . . . . . 248Deployment Web Service and Web Depot . . . . . 248Communication Flow Between the Remote Deployment Components . . . . . . . . . . . . . . . . . . 250
Deployment Overview . . . . . . . . . . . . . . . . . . . . . . . . 252Managing Installation Packages . . . . . . . . . . . . . . . . . 252
Viewing Installation Packages . . . . . . . . . . . . . . . 253Checking in Installation Packages . . . . . . . . . . . . 254
Contents xiii

Working with Deployment Rules . . . . . . . . . . . . . . . . . 255Creating a Rule. . . . . . . . . . . . . . . . . . . . . . . . . . . 255Configuring Installation Packages . . . . . . . . . . . . 256Specifying the Deployment Credentials . . . . . . . . 257Specifying the Managed Clients . . . . . . . . . . . . . . 258Specifying the Deployment Service . . . . . . . . . . . 261Specifying the Deployment Schedule. . . . . . . . . . 262Specifying Email Notification . . . . . . . . . . . . . . . . 263Viewing Summary Information for a Deployment Rule . . . . . . . . . . . . . . . . . . . . . . . . . . . . . . . . . . . 264Enabling and Disabling a Deployment Rule . . . . . 265Refreshing the List of Deployment Rules . . . . . . . 266Changing the Properties of a Deployment Rule . . 266Copying a Deployment Rule. . . . . . . . . . . . . . . . . 267Deleting a Deployment Rule. . . . . . . . . . . . . . . . . 267
Managing Deployment Tasks . . . . . . . . . . . . . . . . . . . 268Viewing Deployment Tasks . . . . . . . . . . . . . . . . . 268Approving a Deployment Task . . . . . . . . . . . . . . . 269Rejecting a Deployment Task. . . . . . . . . . . . . . . . 269Deleting a Deployment Task . . . . . . . . . . . . . . . . 270Viewing the Deployment Rule for a Deployment Task . . . . . . . . . . . . . . . . . . . . . . . . . . . . . . . . . . . 271Changing the Schedule for a Deployment Task . . 271Configuring the Installation Package for a Deployment Task . . . . . . . . . . . . . . . . . . . . . . . . . . . . . . . . . . . 272Changing the Credentials for a Task . . . . . . . . . . 273Re-activating a Deployment Task. . . . . . . . . . . . . 273Viewing the Properties of a Deployment Task . . . 274Refreshing the List of Deployment Tasks. . . . . . . 274
xiv Control Center User Guide

Viewing the Results . . . . . . . . . . . . . . . . . . . . . . . . . . 275Viewing Software Inventory . . . . . . . . . . . . . . . . . . . . 275Troubleshooting Deployment Tasks . . . . . . . . . . . . . . 275Deployment Preferences . . . . . . . . . . . . . . . . . . . . . . 278
Chapter 11 Using the Chart Console 279
What is the Chart Console? . . . . . . . . . . . . . . . . . . . . 279Collecting Data for Charts . . . . . . . . . . . . . . . . . . . . . 280
Data Points and Data Streams . . . . . . . . . . . . . . 281Displaying the Data in a Chart . . . . . . . . . . . . . . . 281
Starting the Chart Console . . . . . . . . . . . . . . . . . . . . . 282About the Chart Console . . . . . . . . . . . . . . . . . . . . . . 285
Working with Panes . . . . . . . . . . . . . . . . . . . . . . . 286Working with Chart Snapshots and Charts . . . . . 286
Organizing Charts into Groups . . . . . . . . . . . . . . . . . . 287Sharing Charts . . . . . . . . . . . . . . . . . . . . . . . . . . . . . . 288Creating a Chart . . . . . . . . . . . . . . . . . . . . . . . . . . . . . 288Changing How a Chart Appears . . . . . . . . . . . . . . . . . 291
Working with Chart Toolbars . . . . . . . . . . . . . . . . 291Rotating, Zooming, Panning and Scrolling . . . . . 293Displaying Charts Horizontally . . . . . . . . . . . . . . . 294Making Data Streams Transparent . . . . . . . . . . . 294Setting Thresholds for a Chart . . . . . . . . . . . . . . . 294Reordering Data Streams in a Chart . . . . . . . . . . 295Deleting a Data Stream from a Chart . . . . . . . . . 296Viewing a Specific Portion of a Chart . . . . . . . . . 296Getting Details on Graph Data Points . . . . . . . . . 297Using the Data Viewer . . . . . . . . . . . . . . . . . . . . . 297
Contents xv

Changing Chart Properties . . . . . . . . . . . . . . . . . . . . . 298General Tab . . . . . . . . . . . . . . . . . . . . . . . . . . . . . 298Color Tab . . . . . . . . . . . . . . . . . . . . . . . . . . . . . . . 299Data Streams Tab . . . . . . . . . . . . . . . . . . . . . . . . 301Range Tab . . . . . . . . . . . . . . . . . . . . . . . . . . . . . . 302
Exporting and Printing Data . . . . . . . . . . . . . . . . . . . . 302Selecting a Range of Data Points for Export . . . . 303Exporting a Chart to an XML-formatted Report . . 303Exporting a Chart to an HTML-formatted Report . 303Exporting Data to the Clipboard or a File . . . . . . . 304Exporting Images . . . . . . . . . . . . . . . . . . . . . . . . . 306Printing Exported Data . . . . . . . . . . . . . . . . . . . . . 307
Setting Preferences . . . . . . . . . . . . . . . . . . . . . . . . . . . 307
Chapter 12 Using the Operator Web Console 311
What is the AppManager Operator Web Console? . . . 312System Requirements . . . . . . . . . . . . . . . . . . . . . . . . . 314Starting the AppManager Operator Web Console . . . 314
Logging Off . . . . . . . . . . . . . . . . . . . . . . . . . . . . . . 316Getting Help in the AppManager Operator Web Console . . . . . . . . . . . . . . . . . . . . . . . . . . . . . . . . 316
Working with the Operator Web Console . . . . . . . . . . 317Viewing your Enterprise At-a-glance . . . . . . . . . . . . . . 318
Links on the Portal page. . . . . . . . . . . . . . . . . . . . 319Customizing Information Displayed on the Portal Page . . . . . . . . . . . . . . . . . . . . . . . . . . . . . . . . . . . 319Adding Repositories to the Portal Page . . . . . . . . 319Using QuickFind . . . . . . . . . . . . . . . . . . . . . . . . . . 319
xvi Control Center User Guide

Working with Computers . . . . . . . . . . . . . . . . . . . . . . 320Viewing a List of Computers . . . . . . . . . . . . . . . . 321Monitoring Problems . . . . . . . . . . . . . . . . . . . . . . 322Initiating Maintenance on a Computer . . . . . . . . . 322Connecting to a Repository . . . . . . . . . . . . . . . . . 324Selecting a View . . . . . . . . . . . . . . . . . . . . . . . . . 324Changing the Number of List Items that Are Displayed . . . . . . . . . . . . . . . . . . . . . . . . . . . . . . . 325Filtering List Items . . . . . . . . . . . . . . . . . . . . . . . . 325Using Wizards to Manage the List of Computers 327
Working with Jobs . . . . . . . . . . . . . . . . . . . . . . . . . . . 328Viewing Job Details . . . . . . . . . . . . . . . . . . . . . . . 329Stopping, Restarting, and Deleting Ad Hoc Jobs. 331Starting a New Job . . . . . . . . . . . . . . . . . . . . . . . 331Connecting to a Repository . . . . . . . . . . . . . . . . . 331Selecting a View . . . . . . . . . . . . . . . . . . . . . . . . . 332Changing the Number of List Items that Are Displayed . . . . . . . . . . . . . . . . . . . . . . . . . . . . . . . 332Filtering List Items . . . . . . . . . . . . . . . . . . . . . . . . 333
Working with Events . . . . . . . . . . . . . . . . . . . . . . . . . . 335Viewing Event Details . . . . . . . . . . . . . . . . . . . . . 337Acknowledging, Closing, and Deleting Events . . 338Connecting to a Repository . . . . . . . . . . . . . . . . . 339Selecting a View . . . . . . . . . . . . . . . . . . . . . . . . . 339Changing the Number of List Items that Are Displayed . . . . . . . . . . . . . . . . . . . . . . . . . . . . . . . 340Filtering List Items . . . . . . . . . . . . . . . . . . . . . . . . 340
Contents xvii
Working with Charts . . . . . . . . . . . . . . . . . . . . . . . . . . 342About the AppManager Chart Component . . . . . . 342Installing the AppManager Chart Component . . . 343
Working with Reports . . . . . . . . . . . . . . . . . . . . . . . . . 343Setting Preferences . . . . . . . . . . . . . . . . . . . . . . . . . . . 343
Chapter 13 Customizing Menu Extensions 347
Extending the Context Menus for Views . . . . . . . . . . . 347Example XML Format . . . . . . . . . . . . . . . . . . . . . . . . . 348Menu Extension XML Keywords . . . . . . . . . . . . . . . . . 349Cascading Menus within Menu Extensions . . . . . . . . . 349Event Field Parameters (Data-centric Parameters) . . 350Job Field Parameters (Data-centric Parameters) . . . . 350Knowledge Script View Parameters (Data-centric Parameters) . . . . . . . . . . . . . . . . . . . . . . . . . . . . . . . . 351Server View Parameters (Data-centric Parameters) . . 352Control Center Standard Parameters (Built-in Parameters) . . . . . . . . . . . . . . . . . . . . . . . . . 353Debugging Command-line Parameters . . . . . . . . . . . . 354More Examples . . . . . . . . . . . . . . . . . . . . . . . . . . . . . . 355A Useful Batch File When Running a Command Program . . . . . . . . . . . . . . . . . . . . . . . . . . . . . . . . . . . 356
xviii Control Center User Guide

About This Guide
The NetIQ AppManager product (AppManager) is a comprehensive solution for managing, diagnosing, and analyzing performance, availability, and server health for a broad spectrum of operating environments, applications, and server hardware.
AppManager provides system administrators with a central, easy-to-use console to view critical server and application resources across the enterprise. With AppManager, administrative staffs can monitor computer and application resources, check for potential problems, initiate responsive actions, automate routine tasks, and gather performance data for real-time and historical reporting and analysis.
Intended AudienceThis guide provides information for system and network administrators working with AppManager console programs, including the NetIQ AppManager Control Center Console, NetIQ AppManager Operator Web Console, and Chart Console.
For information about configuring and maintaining an AppManager site, see the Administrator Guide for AppManager.
xix

ConventionsThis guide uses consistent conventions to help you identify items throughout the documentation. The following table summarizes these conventions.
Using HelpAppManager provides task-based, reference, and context-sensitive Help.
To access task-based Help or search for Help topics, click Contents on the Help menu. To view context-sensitive Help within dialog boxes, click Help.
To get help on individual Knowledge Scripts, on the Values tab of the Knowledge Script Properties dialog box, click Help.
Convention Use
Bold • Window and menu items• Technical terms, when introduced
Italics • Book and installation kit titles• Variable names and values• Emphasized words
Fixed Font • File and folder names• Commands and code examples• Text you must type• Text (output) displayed in the command-line interface
xx Control Center User Guide

Other Information in the LibraryThe library provides the following information resources:
• Installation Guide for AppManager: Provides complete information about AppManager pre-installation requirements and step-by-step installation procedures for all AppManager components.
• Control Center User Guide for AppManager: Provides complete information about managing groups of computers, including running jobs, responding to events, creating reports, and working with the Control Center Console. A separate guide is available for the AppManager Operator Console.
• Administrator Guide for AppManager: Provides information about maintaining an AppManager management site, managing security, using scripts to handle AppManager tasks, and leveraging advanced configuration options.
• Upgrade and Migration Guide for AppManager: Provides complete information about how to upgrade from a previous version of AppManager.
• Management guides: Provide information about installing and monitoring specific applications with AppManager.
The AppManager library is available in Adobe Acrobat (PDF) format and is located in the \Documentation folder of the AppManager installation kit.
About This Guide xxi

NetIQ Online Support and Extended Support Web sites provide other resources:
• Downloads, including hotfixes, service packs, and product upgrades.
• Documentation, including white papers and the most current information about version support for the systems and applications monitored by AppManager.
Note You can access NetIQ Support without a password or registration. To access the Extended Support site, you must be a registered AppManager customer.
In addition to the AppManager documentation, you may want to consult the documentation for your Windows or UNIX operating system, or other application- or system-specific documentation for reference and conceptual information. This background information can help you get the most out of your AppManager installation.
About NetIQ CorporationNetIQ Corporation, an Attachmate business, is a leading provider of comprehensive systems and security management solutions that help enterprises maximize IT service delivery and efficiency. With more than 12,000 customers worldwide, NetIQ solutions yield measurable business value and results that dynamic organizations demand. Best-of-breed solutions from NetIQ Corporation help IT organizations deliver critical business services, mitigate operational risk, and document policy compliance. The company’s portfolio of award-winning management solutions includes IT Process Automation, Systems Management, Security Management, Configuration Control and Enterprise Administration. For more information, please visit www.netiq.com.
xxii Control Center User Guide

Contacting NetIQ Corporation
Please contact us with your questions and comments. We look forward to hearing from you.
Sales Email: [email protected]
Telephone: 1-713-418-5555 (United States) +353 (0) 91-782-677 (Europe, Middle East, and Africa)For other locations, see our Support Contact Information Web site at www.netiq.com/support
Support Web Site: www.netiq.com/support
About This Guide xxiii

xxiv Control Center User Guide

Chapter 1
Introduction
This chapter provides an overview of the functionality and architecture of AppManager.
AppManager delivers the productivity and visibility enterprises demand of their systems management solutions while providing the critical foundation needed for safely adopting and exploiting next-generation technologies, such as:● VMware ESX Server● Microsoft SharePoint and Exchange Server 2007● BlackBerry Enterprise Server● Oracle Grid Computing● Avaya, Cisco or Nortel IP Telephony (VoIP) solutions
AppManager is an efficient approach to systems management. The extensible, flexible nature of AppManager allows customers to achieve greater time to value than other competitive solutions.
Administrators configure monitoring functions called Knowledge Scripts that collect performance data and monitor for simple or complex events from a central console. For example, you can configure Knowledge Scripts to monitor a particular Microsoft Exchange Server resource, such as queue length, and monitor the response time to send and receive an e-mail message from the end-user perspective.
1
If an event condition is detected, the Knowledge Script raises an event and can take a corrective action such as restarting a service that has gone down or sending an e-mail notification. The result is a powerful and automated “closed-loop” solution that proactively detects and resolves problems across a broad spectrum of operating environments, applications, and server hardware.
AppManager delivers comprehensive systems management, including monitoring, reporting and analysis, and diagnostics and resolution. AppManager is designed to manage a variety of components, from physical hardware to server applications to end-user response time.
This chapter is presented as a series of frequently asked questions and answers. As you read this chapter, you can get acquainted with the business problems that AppManager solves, and the features and architecture of AppManager.
2 Control Center User Guide

What Is AppManager?AppManager is an integrated enterprise systems management solution that lets you effectively manage your applications and infrastructure within today’s tight resource constraints and growing workloads.
AppManager provides enterprises with the ability to:● Gain Greater Control over the IT Environment: AppManager
establishes control through features such as automated detection and deployment, policy exception management, secure delegation, and self-maintaining service maps. These features help establish a solid systems management foundation so that enterprises safely adopt and exploit next-generation technologies.
● Improve IT Management Productivity and Visibility: AppManager gives IT automation that adapts to dynamic business environments. End-to-end service visibility vastly reduces and pre-empts business service downtime and improves event impact assessment through visually represented service maps.
● Maximize Return on IT Investment: AppManager’s extensive out-of-the-box functionality, flexible integration with existing IT infrastructure, extensible platform, and easy customization ensure that enterprises benefit from maximum functionality with the shortest time to value.
Chapter 1 • Introduction 3

What Is Unique about AppManager?AppManager is the right choice for systems management because of the following reasons:● End-to-End visibility from a single pane of glass. With the
AppManager Control Center Console, you can take advantage of a visual representation of IT resources mapped to business applications or services, enabling you to prioritize problem response. By mapping services to elements, you can visually recognize all elements the service depends upon and understand how element failure impacts the service.
● The perfect balance between simplicity and flexibility. AppManager’s out-of-the-box knowledge provides rapid time-to-value and the level of customization that large, heterogeneous enterprises require.
● Self-maintaining service maps. Service maps built using rule-based management groups will automatically be updated as components enter or are withdrawn from the environment, ensuring operations is working with current information.
● Highly-granular secure delegation model. AppManager allows for the broadest access and interaction across your operations team through its highly-granular secure delegation model. Subject matter experts can access data the way they want and value is derived from AppManager at all levels of your organization.
● Adapt to your unique infrastructure. Extend AppManager to perform additional tasks without learning proprietary languages or technologies. AppManager’s use of industry-standard scripting languages, such as VBA and Perl, minimizes training costs by using the technologies with which your staff is most familiar.
4 Control Center User Guide

How Does AppManager Work?AppManager uses an advanced multi-tier architecture that scales along with the growth of your organization’s IT infrastructure.
AppManager Architecture and Components
The AppManager architecture provides the best combination of efficiency, scalability, and flexibility in distributing process load across multiple components and allows for efficient communication between components.
The AppManager architecture consists of the following components:● AppManager consoles: A collection of programs for managing
various aspects of your environment:● The Operator Console is where you do most of the work to
manage the systems on your network. The Operator Console allows you to check the status of jobs and events, create and view charts and reports, run Knowledge Scripts, and view details about the computers you are monitoring.
● The Operator Web Console allows you to check the status of jobs and events, create and view charts, run Knowledge Scripts, view details about the computers you are monitoring, and view reports from a Microsoft Windows server with Microsoft Internet Explorer.
● The Chart Console allows you to generate and view charts of AppManager repository data. The Chart Console is also available from the Operator Web Console.
● The Security Manager console allows you to manage security information for an AppManager repository.
Chapter 1 • Introduction 5

● AppManager agent: Windows services or a UNIX daemon that runs on a computer and receives requests from the management server to run or stop a Knowledge Script job. The agent communicates back to the management server, on an exception-basis, any relevant output from a Knowledge Script.For Windows computers, the agent consists of two Windows services, the NetIQ Client Resource Monitor and the NetIQ Client Communication Manager, a local repository database, and at least one managed object. A managed object enables the agent to monitor a particular application, for example, Microsoft SQL Server.
For UNIX and Linux computers, the agent consists of a single daemon, nqmagt, and the supporting files and directories that provide:
● Data persistence, which is equivalent to the local repository.● Access to system statistics, which is equivalent to managed
objects.● AppManager management server: A Windows service, NetIQ
AppManager Management Service, that manages event-driven communication between the AppManager repository, AppManager console programs such as the Operator Console, and agents.
● AppManager repository: A SQL Server database in which management data is stored. The Operator Console connects to the AppManager repository.
● AppManager Web management server: A set of Active Server Pages that communicate with one or more AppManager repositories. These pages make up the Operator Web Console.From a Microsoft Windows server with Microsoft Internet Explorer, the Operator Web Console allows you to check the status of jobs and events, create and view charts and reports, run Knowledge Scripts, and view details about the computers you are monitoring.
6 Control Center User Guide

The following figure provides a simplified view of the AppManager architecture:
Chapter 1 • Introduction 7

Control Center Architecture and Components
The AppManager Control Center architecture extends the AppManager architecture and consists of the following components:● Control Center Console: The Control Center Console connects
to the Control Center repository and allows you to run jobs on the systems and applications you manage across multiple AppManager repositories.
● Control Center repository: A SQL Server database for AppManager Control Center that contains:● Cache tables to store view information collected from each
AppManager repository managed by Control Center.● A Command Queue table to store queries that collect view
information based on the view criteria defined in the Control Center Console.
● Tables to store other information, such as user preferences specified during installation or from the Control Center Console, definitions of management groups, and security settings.
● Control Center Command Queue Service: A Windows service, NetIQ AppManager Control Center Command Queue Service, that polls the Command Queue table for queries to run on a repository. The Cache Manager, NQSyncQDB.exe, is a child process of the Command Queue Service that runs on each AppManager repository computer. The Cache Manager runs the Control Center queries on the AppManager repository to retrieve view information for a Control Center management group.
● Primary AppManager Repository: The primary AppManager repository stores the Knowledge Scripts and Knowledge Script Groups that you run from the Control Center Console. If Control Center manages more than one AppManager repository, when you create a job, Control Center automatically replicates the Knowledge Script in the primary AppManager repository to the other AppManager repositories.
8 Control Center User Guide
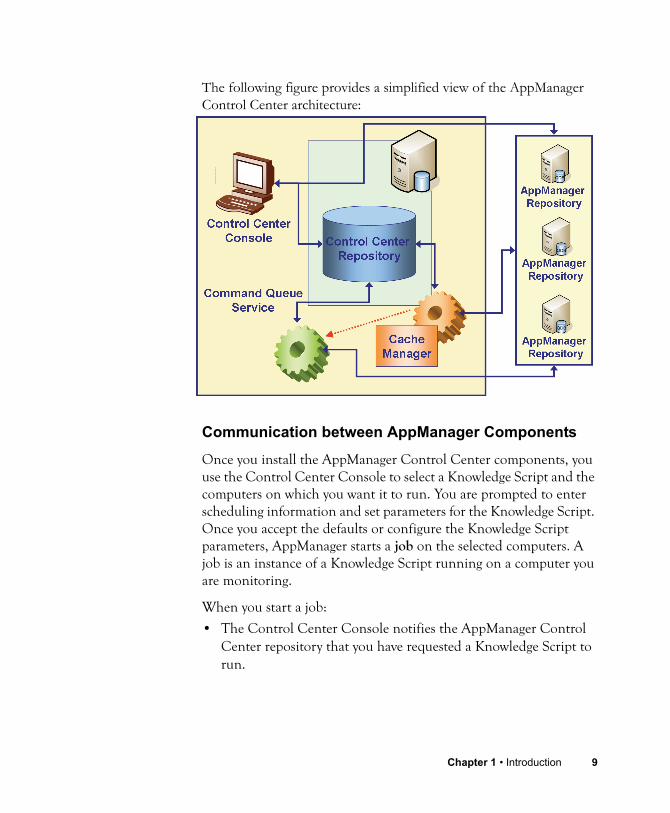
The following figure provides a simplified view of the AppManager Control Center architecture:
Communication between AppManager Components
Once you install the AppManager Control Center components, you use the Control Center Console to select a Knowledge Script and the computers on which you want it to run. You are prompted to enter scheduling information and set parameters for the Knowledge Script. Once you accept the defaults or configure the Knowledge Script parameters, AppManager starts a job on the selected computers. A job is an instance of a Knowledge Script running on a computer you are monitoring.
When you start a job:
• The Control Center Console notifies the AppManager Control Center repository that you have requested a Knowledge Script to run.
Chapter 1 • Introduction 9

• The AppManager Control Center Command Queue Service updates the appropriate AppManager repository with information about the job properties.
• The AppManager repository, with updated with job information, communicates with the management server.
• The AppManager management server then sends the Knowledge Script and properties you have set to the appropriate managed computers you want to monitor by contacting the AppManager agent.
• The AppManager agent runs the job on the managed computer and sends to the management server any performance or event information returned by the Knowledge Script job.
• The management server inserts information from the AppManager agent into the AppManager repository. That triggers an update on the Operator Console (for example, a real-time graph gets updated with new data).
• The AppManager Control Center repository collects the updated information from the AppManager repository. That triggers an update on the Control Center Console (for example, the status of a job changes from Pending Start to Running).
• The Web management server, using Active Server Pages, updates the Operator Web Console with information from the AppManager repository.
Starting a Job
Knowledge Scripts automate management and monitoring tasks. All you need to do is start them, view their output, and then stop and restart them when needed.
To start a Knowledge Script job in the Control Center Console, click the management group that contains the computers you want to monitor. In a Server or Knowledge Script view, you can create a job which is simply a particular instance of a Knowledge Script running on a computer you are managing.
10 Control Center User Guide

You can quickly customize the default properties of any Knowledge Script. For example, to change the thresholds and corrective actions defined for various events. You can also control the frequency with which a Knowledge Script performs its intended task.
Use the Control Center Console or the Operator Web Console to view job status and any output created by the jobs in the form of events and data collected.
What Happens on the Managed System?
When you start a job, you indicate the managed clients on which you want the job to run. A managed client is a computer or device monitored by AppManager. AppManager monitors the managed client by using an agent installed locally on the managed client or an another computer that acts as a proxy.
On Windows computers, the AppManager agent is composed of two Windows services: the NetIQ Client Resource Monitor (NETIQMC.EXE); and the NetIQ Client Communication Manager (NETIQCCM.EXE). On UNIX computers, the AppManager agent is composed of a single daemon, nqmagt.
On an exception-basis, the agent communicates back to the management server any relevant output from the Knowledge Script. (For network efficiency, the AppManager agent only communicates back to the management server when an event has occurred or data needs to be inserted into the repository database.)
AppManager agents handle the scheduling and housekeeping of Knowledge Scripts, and initiate corrective actions and communication with the management server. The collection of performance and event data is facilitated through the use of software probes called managed objects that “plug into” the AppManager agent.
Knowledge Scripts use managed objects to access counters, event logs, queries, Application APIs, and other sources to gather statistics metrics, and other properties of specific application elements. On
Chapter 1 • Introduction 11

Windows computers, managed objects are COM/OLE objects in the form of dynamic link libraries (.DLL files). On UNIX computers, managed objects are Perl modules, in the form of dynamic shared libraries.
Using these native sources of information, managed objects collect raw statistics and information, such as current CPU utilization or database lock activity, and pass that information to the Knowledge Script jobs. Knowledge Scripts then provide the rules for what to do with this raw information. The Knowledge Scripts run under the control of the AppManager agent. On managed Windows computers, the Knowledge Scripts invoke the managed objects through the standard COM/OLE interface. On managed UNIX computers, the Knowledge Scripts invoke the managed objects through the standard Perl module interface.
The following figure illustrates a simplified view of this relationship.
Knowledge Script job
AppManager agent
Managed object
Raw system statistics
Management server LAN, WAN, or Internet
Managed client computer
Exception-based communication
12 Control Center User Guide

How are the Management Server and Repository Used?
The management server is a Windows computer running the NetIQms service. The NetIQms service manages the event-driven communication between the repository and the managed clients.
The AppManager repository server is a central Microsoft SQL Server database that stores management data for a site.
The management server and repository can reside on the same physical computer or separate Windows servers to distribute the workload.
When you use the Operator Console to start a job, a record is inserted into the AppManager repository’s database. An update of this nature is interpreted as an instruction for the management server to communicate the Knowledge Script and its properties to the appropriate managed clients.
The management server also receives communication back from the managed clients in the form of performance and event information returned by the Knowledge Script jobs. The management server inserts this information into the AppManager repository, which in turn triggers an update to occur on the Operator Console and Operator Web Console (for example, a real-time graph gets updated with new data).
Communication between the management server and the managed clients is via Microsoft RPC. Communication between the Operator Console and the repository and between the repository and the management server is through ODBC.
How are the Command Queue Service and the Control Center Repository Used?
The Command Queue Service polls the command queue at regular intervals, looking for commands to be sent to the individual AppManager repositories.
Chapter 1 • Introduction 13

The Command Queue Service retrieves blocks of commands from the Command Queue. The Command Queue Service sends the commands to the AppManager repositories that serve the managed computers.
The AppManager Control Center repository server is a central Microsoft SQL Server database that stores view data (Event, Job, Server, Knowledge Script, and Service Map views) brought from one or more AppManager repositories, for individual management groups that appear in the Control Center Console. The Control Center repository contains:
• A Cache table to hold view data
• A Command Queue table that contains commands to be executed on any of the individual repositories (for example, to acknowledge an event or create a job)
• Various configuration tables that hold other information, such as definitions of management groups
The Cache Manager is a set of SQL tasks that poll for information from each AppManager repository based on the management group definition and include lists of servers, running jobs, and events.When you use the Control Center Console to start a job, a record is inserted into the AppManager Control Center repository’s database and the Command Queue Service communicates the Knowledge Script and its properties to the appropriate AppManager repositories. The job is then created in the AppManager repository and the management server sends the job to the managed client.
The Cache Manager retrieves the job status information from the individual AppManager repositories and puts the information into the Control Center repository.
Communication between the Control Center Console and the Control Center repository is through ODBC. Communication between the Control Center repository and the individual AppManager repositories is through DTC.
14 Control Center User Guide
How Does Deployment Work?The Control Center Console allows you to quickly and easily install deployment packages for the agent, module updates, and hotfixes to the remote Windows computers in your environment.
Tip An AppManager module is a downloadable package that provides updated module for an application. A module includes a managed object, Knowledge Scripts, and Help. For the most current information about module updates, see: http://www.netiq.com/support/am/extended/modules.asp.
Deployment provides:● Automated detection of new computers and applications● Automated remote installation of agents and modules● Rapid response to changing environments● Multiple, firewall-friendly deployment servers● Customized deployment schedules to meet corporate maintenance
windows
Rule-based Deployment
The Control Center Console provides an easy-to-use wizard to help you create deployment rules. A deployment rule allows you to select computers and install the agent and appropriate modules based upon a variety of criteria, including:● Organization units in Active Directory● Remote registry check● Management groups in the Control Center Console● IP address ranges● Operating system or applications installed
Chapter 1 • Introduction 15
Approval-based Deployment Tasks
When a target computer meets the conditions for a deployment rule, Control Center generates a deployment task. A deployment task delivers a specific deployment package to a particular computer at a scheduled time.
In the Control Center Console, you approve a deployment task before the deployment service can install the agent or module on the target computer.
Each deployment task includes the required credentials to run on the target computer.
To avoid monitoring interruptions during business hours, you can schedule deployment tasks to run outside business hours.
Agent Deployment Architecture and Components
The deployment service communicates with the Control Center repository to process deployment rules and deployment tasks. Deployment tasks run on the target computer using credentials provided in the deployment rule.
The computer where the deployment service is installed is the deployment server. If you have configured more than one deployment service, when you configure a deployment rule, you can choose the deployment service you want.
To deploy the agent to computers behind a firewall, configure a deployment service on a computer that is also behind the firewall.
16 Control Center User Guide

The deployment web service consists of two Web services that are installed on a Microsoft Internet Information Services (IIS) server. This server is called the web depot. The deployment web service:● Checks deployment packages into the web depot.● Distributes deployment packages to the deployment services. The
deployment web service uses Microsoft Background Intelligent Transfer Service (BITS) server extensions to distribute deployment packages to the deployment service.
● Receives software inventory information and application detection results from the agent and forwards this information to the Control Center repository.
● Provides a communication proxy for deployment services that are across a firewall.
Once you install the Control Center deployment components, you use the Control Center Console to configure a deployment rule.
At this time, you cannot deploy the agent to remote UNIX computers.
Chapter 1 • Introduction 17

What are AppManager Reports?Whether you need to report on service-level conformance, historical trends, or ad hoc performance results, AppManager delivers a powerful and flexible reporting infrastructure, including:• Performance-related reports to help you understand the
performance of your applications and systems.
• Trend analysis reports to help you plan for system or application upgrades.
• Service level agreement reports to quantify the availability of services and service response time.
• Event summary reports to provide an overview of the events being created by AppManager. Use this information to develop a plan of action.
• Configuration reports, to provide an overview of the system details being monitored and configuration details, such as event threshold settings.
AppManager reports use the same Knowledge Script-based mechanism that you use to run jobs that collect data and raise events.
An AppManager report queries data from a single AppManager repository. At this time you cannot report on data from more than one AppManager repository in the same report.
To report on AppManager data from more than one AppManager repository in the same report, use the NetIQ Analysis Center product (Analysis Center).
18 Control Center User Guide

Analysis Center enhances the reporting capabilities of the Service and Security Management solutions from NetIQ Corporation, helping IT organizations communicate service levels and security compliance. By offering quick time-to-value without sacrificing functionality or flexibility, Analysis Center rises above the level of individual metrics. The product provides vital information, such as overall system utilization, security incident interpretation, root-cause analysis and historical trending, and critical trends and conditions.
For more information about AppManager reports, see “Running Reports” on page 169. For more information about Analysis Center, see : http://www.netiq.com/products/nac/default.asp
AppManager reporting and Analysis Center are not featured in the product tour. Please discuss your AppManager reporting needs with your NetIQ Sales Representative or NetIQ Partner.
Chapter 1 • Introduction 19

20 Control Center User Guide

Chapter 2
Getting Started
This chapter provides an introduction to the NetIQ AppManager Control Center Console and suggests how to get started using AppManager in your organization.
Note After you have installed AppManager components on one or more computers, you use the Control Center Console to monitor your environment. For information about installing AppManager, and system requirements, see the Installation Guide for AppManager.
Starting the Control Center ConsoleAs a Control Center administrator, you can start the Control Center Console. To enable other users to access Control Center, configure Control Center Security. For information about configuring user access to Control Center, see the Administrator Guide for AppManager.
1 On a computer where you have installed the Control Center Console, click the Start button, then Programs > NetIQ > AppManager > AppManager Control Center.
2 At the AppManager Control Center Console Logon dialog box, log into the Control Center repository database. (When you start other AppManager programs, such as AppManager Chart Console, you will log into a particular AppManager repository
21

database.) If you are not sure what to enter in any field or have problems logging on, see your AppManager administrator.
3 Click Logon. Now that you are logged into the AppManager Control Center repository, the Control Center Console displays information dynamically.
For Do this
Server Type the name of the SQL server that manages the AppManager Control Center repository. When specifying a computer name, you can enter the Windows computer name or the IP address. At this time, only v4 IP addresses are supported. For example, to specify a named instance on SQL Server 2000, you can enter 10.1.10.43\INST1.
Repository Displays the name of the AppManager Control Center repository database, NQCCDB. The AppManager Control Center repository name is required to be NQCCDB.
Use Windows authentication
Select this option to specify that SQL Server uses the Windows user information to validate the user before access is granted. The AppManager Control Center console computer needs to be part of a Windows domain or workgroup. If the Use Windows authentication option is not selected, this option specifies that SQL Server uses the standard SQL Server security validation. This is the default when SQL Server is configured to use both SQL Server and Windows authentication. Add the login name to SQL Server before a user can log in. Login name - Type the user name of the SQL Server login account used to access the AppManager Control Center repository. The default SQL Server user is the administrative user, sa.Password - Type the password for the SQL Server login account. If using the sa user, the default password is Null.
22 Control Center User Guide

Notes• Running separate instances of the Control Center Console,
different users can access the same repository from the same console computer.
• Once you have logged into the Control Center Console, you can manage additional AppManager repositories. For more information, see “Adding an AppManager Repository” on page 29.
• Your AppManager environment should have the same version of the AppManager core components (repository, management server, console, and Web management server components) and AppManager Control Center core components (repository, command queue service, and console). If you are upgrading AppManager Control Center from an earlier version, be sure to upgrade you core AppManager and Control Center components to the current version as soon as possible. You cannot perform some AppManager tasks while your AppManager core components are still on an earlier version. For more information, see the AppManager Release Notes.
Getting Help for the Control Center Console
For Help when working in the Control Center Console, click Help > NetIQ AppManager Control Center Help or press the F1 key. Each of the property sheets and dialog boxes also contains a Help button, which you can click for detailed information about specific options.
Chapter 2 • Getting Started 23

Accessing License Information
From the Help menu, you can view license information stored in the AppManager repositories that are managed by Control Center.
To add or remove a license key, use the License Manager application to modify the AppManager repository you want. You cannot change license information from the Control Center Console.
About the Control Center ConsoleThe Control Center Console is where you do most of the work to manage the systems on your network. To give you the tools for viewing and managing your computer resources, the Control Center Console consists of the Navigation pane and the View pane. If you select an object in the Enterprise Layout view of the Navigation pane, the View pane displays the contents for that object. There are also tabs on the right side of the View pane to display information about system status, tasks you can perform, and Help.
24 Control Center User Guide

Working with Panes
Information about the systems you are managing is grouped in panes.
Note For more information about customizing the Control Center Console, see “Customizing the Control Center Console Layout” on page 39.
This pane Does this
Navigation • Enterprise Layout Shows a hierarchical list of management groups and views. Click to expand the list and select a management group or view.
• Administration Shows the Deployment packages, rules, and deployment tasks. Use the Deployment Rule Wizard to install the AppManager Windows agent on remote computers.
View pane grid Displays information based on your selection in the Enterprise Layout pane. If you select:• The top-most AppManager icon or a management group,
the View pane displays configuration information, and a summary about the management group. For more information about the summary view, see “About the Management Group Summary View” on page 88.
• A view, the View pane displays a grid that lists the objects in the view. Select an object from the grid to displays its details. For example, in a Server view, select a server from the grid to show the status of events, jobs, custom properties, and discovery details on that server.For information about Control Center views, see “Working with Management Groups” on page 26.
Tasks Displays related tasks for the selected object in the View pane. These tasks are similar to right-click menu items.
Status Displays the status of Control Center, including:• Queued Commands Displays the status of commands in
the Queue Manager.• Systems Status Displays the connection status of each
managed AppManager repository.• Deployment Status Displays the status of deployment
tasks.
Chapter 2 • Getting Started 25

Working with Management Groups
The Control Center Console uses management groups to manage the computers in your AppManager environment. A management group can be configured to include managed client computers from one or more AppManager repositories based on:
• AppManager repository views
• Groups of servers in an AppManager repository view
• Rules that can select computers based on their properties, such as the name of the computer or discovered resources
To manage the computers in a management group, the Control Center Console includes views. The standard views in a management group are:
• Server view Displays a list of servers in the management group. Select a server from the grid list to display server information and perform common tasks like responding to events, managing jobs and custom properties, and viewing discovery details.
• Job view Displays a list of jobs on the computers in the management group.
• Event view Displays a list of events in the management group. Use the grid to group events, for example, by computer, and respond to events.
• Knowledge Script view Displays a list of Knowledge Scripts. Use the grid to browse Knowledge Scripts and create groups of Knowledge Scripts.
• Summary view Displays a summary of the members of the management group, events, jobs, and servers information. For more information, see “About the Management Group Summary View” on page 88.
26 Control Center User Guide

You can also create service map views to manage events and view the overall health of a business process. For more information, see “Using Service Map Views” on page 217.
Note In the Control Center Console, groups of users are assigned permission sets, which include rights as to which management groups the user can see in the Control Center Console. If you don’t have access to a particular management group, check your status in the Control Center Console. For more information, see the Administrator Guide for AppManager or contact your AppManager system administrator.
Deploying AppManager Agents
The Control Center Console includes a rules-based deployment tool, the Deployment Rule Wizard, to install and update the AppManager agent on the Windows computers in your environment.
The Control Center Console provides an easy-to-use interface for configuring deployment rules, managing installation packages, and validating deployments before they are sent.At this time, you cannot use the Control Center Console to install the AppManager UNIX agent. However, there are Knowledge Scripts for installing and updating the UNIX agent.
Adding an AppManager Repository to Control CenterTo manage an AppManager repository with Control Center, use the Control Center Console to add the AppManager repository. Note that you cannot add an AppManager repository to more than one Control Center repository database.
After you add an AppManager repository, its managed client computers are automatically displayed in Control Center management groups that are configured to include All Repositories, such as the Master management group.
Chapter 2 • Getting Started 27

The primary AppManager repository is the AppManager repository that contains the Knowledge Scripts that you want to use when running AppManager jobs from Control Center. If you have more than one an AppManager repository, you can change the primary repository. For more information, see “Changing the Primary AppManager Repository” on page 35.
Before You Begin
Before you add an AppManager repository, make sure:
• If the repository is in a different domain than the Control Center Console user, both domains are trusted.
• Kerberos delegation is configured properly.
• Microsoft SQL Server DTC settings are configured properly.
For more information, see the Installation Guide for AppManager. If the repository computer is not configured properly, the Control Center Console adds the repository but does not allow you to manage the computers.
Configure Microsoft SQL Server and AppManager security to enable Control Center to communicate with the AppManager repository you want to add.
To configure Microsoft SQL Server and AppManager security:
1 In Microsoft SQL Enterprise Manager, add the Log On As account for the NetIQ AppManager Control Center Command Queue Service service to the list of database users on the AppManager repository. This account must be given db_owner permission.
2 Add the Windows user account for each Control Center user to the list of database users on the AppManager repository. Give each
28 Control Center User Guide

user the same permissions that are given to the user on the primary repository database.
3 In AppManager Security Manager, give the AppManager repository database user the same AppManager role that is given to the user on the primary AppManager repository.
4 You are now ready to add the AppManager repository database to Control Center. For more information, see “Adding an AppManager Repository” on page 29.
Adding an AppManager Repository
To manage more than one AppManager repository with Control Center, configure Control Center to use the same authentication method to communicate with all AppManager repositories.
The authentication method you choose depends on how the SQLServerAgent service is configured. For example, if the SQLServerAgent service on the Control Center repository computer runs as LocalSystem, and you add the repository using Windows Authentication, the Cache Manager cannot communicate with the repository.
To enable the user to Do this
• Create, copy, or delete Knowledge Scripts or Knowledge Script Groups
• Give the user db_owner permission on the AppManager repository.
• Perform all other tasks • Give the user public permission on the AppManager repository.
To enable the user to Do this
• Create, copy, or delete Knowledge Scripts or Knowledge Script Groups
• No AppManager role is required when the user has db_owner permission.
• Perform all other tasks • Add the AppManager repository user to the Read-only, Standard, or Administrator AppManager role.
Chapter 2 • Getting Started 29

When you add a repository earlier than the current version, the Control Center Command Queue Service runs a patch script to enable the AppManager repository to synchronize with the Control Center repository. The Control Center Command Queue Service displays the status of the patch in the Queue Manager.
Control Center does not upgrade the AppManager repository to the latest AppManager version. For information about upgrading the AppManager repository, see the AppManager Release Notes.
To add an AppManager repository:
1 Log on to the Control Center Console with a login account that is a member of the Administrators group.
2 On the File menu, click Manage Repositories.
3 In the Manage Repositories dialog box, click Add.
4 In the Add Repository dialog box, identify the repository server and the authentication method.
For Do this
Server Type the name of the SQL server that manages the AppManager repository. When specifying a computer name, specify the NETBIOS name. For example, to specify a named instance on SQL Server 2000, you can type TXAM01\INST1.
Database Type the name of the AppManager repository database. The default AppManager repository name is QDB.
30 Control Center User Guide
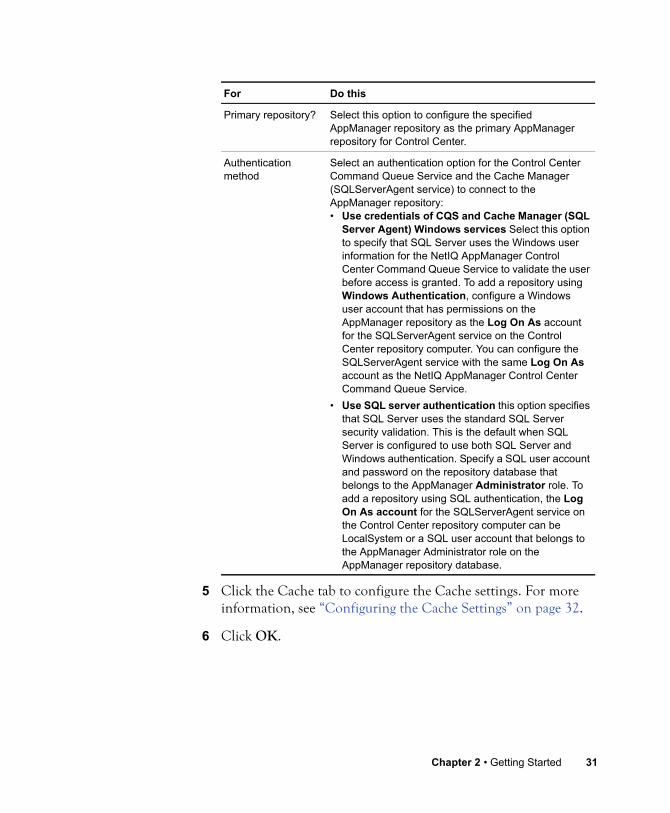
5 Click the Cache tab to configure the Cache settings. For more information, see “Configuring the Cache Settings” on page 32.
6 Click OK.
Primary repository? Select this option to configure the specified AppManager repository as the primary AppManager repository for Control Center.
Authentication method
Select an authentication option for the Control Center Command Queue Service and the Cache Manager (SQLServerAgent service) to connect to the AppManager repository:• Use credentials of CQS and Cache Manager (SQL
Server Agent) Windows services Select this option to specify that SQL Server uses the Windows user information for the NetIQ AppManager Control Center Command Queue Service to validate the user before access is granted. To add a repository using Windows Authentication, configure a Windows user account that has permissions on the AppManager repository as the Log On As account for the SQLServerAgent service on the Control Center repository computer. You can configure the SQLServerAgent service with the same Log On As account as the NetIQ AppManager Control Center Command Queue Service.
• Use SQL server authentication this option specifies that SQL Server uses the standard SQL Server security validation. This is the default when SQL Server is configured to use both SQL Server and Windows authentication. Specify a SQL user account and password on the repository database that belongs to the AppManager Administrator role. To add a repository using SQL authentication, the Log On As account for the SQLServerAgent service on the Control Center repository computer can be LocalSystem or a SQL user account that belongs to the AppManager Administrator role on the AppManager repository database.
For Do this
Chapter 2 • Getting Started 31

After you add an AppManager repository to Control Center, update existing management groups to include the new repository. By default, the new repository is added to the Master management group.
For more information, see Chapter 4, “Managing a Group of Computers.”
Configuring the Cache Settings
Cache settings determine how the Control Center Cache Manager synchronizes event and job information in each AppManager repository in the Control Center Console. The overall performance of the Control Center Console improves by reducing the amount of information that the Cache Manager must synchronize.
By default, the Control Center Cache Manager synchronizes:
• Open and acknowledged events
• All jobs except closed jobs
To change the cache settings for the repository:
1 Log on to the Control Center Console with a login account that is a member of the Administrators group.
2 On the File menu, click Manage Repositories.
3 In the Manage Repositories dialog box, click Add to add a new repository, or click Modify to modify the Cache settings of an existing repository.
4 Click the Cache tab.
32 Control Center User Guide

5 In the Synchronize Events group, select an option for caching event information:
6 In the Synchronize Jobs group, select an option for caching job information:
7 Select the Cache Events and Jobs after check box and specify a threshold date for viewing event and job information. The Control Center Console does not display event and job information that is older than specified date.
8 Click OK to apply your changes.
Option Description
All events Select this option to:• Synchronize all event information. • View open, acknowledged, and closed events.
Only open and acknowledged events
Select this option to synchronize only the open and acknowledged event information. By default, this option is selected.
No events Select this option if you do not want to view any event information.
Option Description
All jobs Select this option to:• Synchronize all job information.• View pending, running, stopped, closed, and error
jobs.
All jobs except those that are closed
Select this option to synchronize all pending, running, stopped, and error jobs. This option does not synchronize closed jobs. By default, this option is selected.
No jobs Select this option if you do not want to view any job information.
Chapter 2 • Getting Started 33

Changing the Authentication MethodYou must be a member of the Control Center Administrator group to change the authentication method that Control Center uses to access the AppManager repository.
You can change the authentication method for Control Center, for example, if you corporate security policy requires you to use Windows Authentication for all applications.
When changing the authentication method, keep in mind:
• If the SQLSERVERAGENT service on the Control Center repository computer is running as the LocalSystem account, use SQL Authentication to add the AppManager repository.
• If the SQLSERVERAGENT service on the Control Center repository computer is running as a domain user account, make sure that the user has privileges on each AppManager repository database.
When changing the authentication method, use the same authentication method for all AppManager repositories managed by Control Center.
Before you change the authentication method, make sure the Log On As account for the SQLServerAgent service is configured correctly. For example, if the SQLServerAgent service on the Control Center repository computer runs as the LocalSystem account, use SQL Authentication. If you add the repository using Windows Authentication, the Cache Manager cannot communicate with the repository:
• To use Windows Authentication, the Log On As account for the SQLServerAgent service on the Control Center repository computer must be configured as a Windows user account that has permissions on the AppManager repository database. The SQLServerAgent service can be configured with same Log On As
34 Control Center User Guide

account as the NetIQ AppManager Control Center Command Queue Service.
• To use SQL authentication, the Log On As account for the SQLServerAgent service on the Control Center repository computer can be LocalSystem or a SQL user account that has permissions on the AppManager repository database.
To change the authentication method:
1 Log on to the Control Center Console with a login account that is a member of the Administrators group.
2 On the File menu, click Manage Repositories.
3 In the Manage Repositories dialog box, select a repository and click Modify.
4 Configure the connection details between Control Center and the AppManager repository. For more information, see the Help.
5 Click OK.
Changing the Primary AppManager RepositoryYou must be a member of the Control Center Administrator group to change the primary repository for Control Center.
The primary AppManager repository is the AppManager repository that contains the Knowledge Scripts that you use when you run AppManager jobs from Control Center.
When you change the primary repository, it can take some time for Control Center to update the list of Knowledge Scripts in the Control Center repository to match the Knowledge Scripts in the primary repository.
You cannot start a new job, view the properties of a running job, or update a job when Control Center synchronizes the Knowledge Scripts in the primary repository.
Chapter 2 • Getting Started 35
To change the primary AppManager repository:
1 Log on to the Control Center Console with a login account that is a member of the Administrators group.
2 On the File menu, click Manage Repositories.
3 Click File > Manage Repositories.
4 In the Manage Repositories dialog box, click the Primary check box for the repository you want to designate as the primary repository.
5 Click OK.
Removing an AppManager Repository from Control Center
You must be a member of the Control Center Administrator group to remove an AppManager repository.
Before you remove the AppManager repository from Control Center, remove the repository from any management groups that still include the repository as a member. For more information, see “Removing a Member From a Management Group” on page 74.
If the repository you want to remove is the primary AppManager repository, you should designate a new primary management server before you remove the repository. For more information, see “Changing the Primary AppManager Repository” on page 35.
If you move an AppManager repository from one SQL Server computer to another, you do not need to remove the repository from the Control Center repository. Run the UpdateQDBConnection utility to update the new SQL Server computer details for the AppManager repository. For more information, see the Administrator Guide for AppManager.
36 Control Center User Guide

After you remove a repository from Control Center, the event and job information is removed from the Control Center repository and is no longer available in the Control Center Console.
Note The existing jobs, events, and data remain in the AppManager repository.
To remove a repository that Control Center manages:
1 Log on to the Control Center Console with a login account that is a member of the Administrators group.
2 On the File menu, click Manage Repositories.
3 In the Manage Repositories dialog box, click a repository and click Remove.
4 Click OK.
Chapter 2 • Getting Started 37

38 Control Center User Guide

Chapter 3
Configuring the Control Center Console
This chapter describes how you can configure the NetIQ AppManager Control Center Console to fit your needs.
Customizing the Control Center Console LayoutTo improve the performance of the Control Center Console, change the Control Center Console options to optimize the number of rows you want to view at one time. As a rule, you can improve the performance of the Control Center Console by reducing the number of rows are displayed. See “Setting Preferences” on page 51 for more information.
Showing, Hiding, And Resizing Panes
You can customize the Control Center Console layout to display only the panes you are interested in and change the size, shape, and location of those panes. For example, you can hide the Task pane to provide more room for the View pane.
To Do this
Show or hide a pane Select (to show) or deselect (to hide) View > Navigation Pane, Tasks Pane, and System Status Pane.
Move or resize each pane Use the mouse to drag pane borders in any direction.
Set the current location and size of all visible panes as the default
Select View > Save View Settings as Default.
39

Selecting a Management GroupThe Control Center Console consists of management groups that contain multiple views which affect the details you see in the View pane. For example, the Server view displays all of the managed client computers in the management group. By default, the Master management group is displayed. For more information, see “About the Control Center Console” on page 24.
In a management group, you can switch views by clicking the view you want to use. When you switch from one view to another, the View pane reflects information for the selected view.
Control Center permissions allow you to display only the management groups in which you are interested. For example, if you are the Exchange administrator, you may want to focus strictly on Exchange Servers using the Exchange management group.
You can select only one view within a management group at a time.
Navigation Shortcuts
There are navigation buttons just under the Control Center menu:
• Backward
• Forward
• Navigate Up One level
The Backward and Forward buttons enable you to move back and forth through the objects you have selected in the Navigation pane. The Navigate Up One level button enables you to move to the parent of the selected object.
Reset all visible panes to the default location and size
Select View > Revert to Default View Settings.
To Do this
40 Control Center User Guide

Renaming a Management Group or View
You can rename a management group or its views.
To rename a management group or view:
1 Right-click the management group or view and click Rename.
2 Type a new name and click OK.
Saving View Settings
To save view settings for future Control Center Console sessions:
Click View > Save View Settings as Default.
To revert any changes you have made to the view settings:
Click View > Revert to Default View Settings.
Identifying the Computers to MonitorTo manage the servers and workstations in your environment from the Control Center Console, you first need to identify the computers and the applications on them that need to be monitored. The process by which AppManager is made aware of the computers and applications you want to monitor is called discovery.
Discovery typically involves:
• Installing the AppManager agent on the server or workstation you want to manage.
• Adding the server or workstation to the Master view of an AppManager repository.
• Running one or more specialized Discovery Knowledge Scripts from a management group based on the Master view.
Chapter 3 • Configuring the Control Center Console 41

When you manage Windows computers, the Deployment Server performs all of these scenarios for you, if the management server and AppManager repository server are running and you have network access to them.
You can also run Discovery Knowledge Scripts at any time after you add servers and workstations to a view. Run Discovery Knowledge Scripts from a management group that is based on the Master view.
Adding a Computer to the Master View of a Repository
You can manually add computers from the Control Center Console to the master view of any AppManager repository that is connected to the Control Center repository.
To add computers to an AppManager repository:
1 Log on to the Control Center Console with an account that has permissions to modify a management group.
2 On the File menu click Add Computers to start the Add Computer wizard.
3 In the Add Computer wizard, select the repository and view where you want to add the computer and click Next.
4 Select an option to choose the type of computer you want to add and then type the names or IP addresses of the computers you want to add in the Computers field. You do not need to include
42 Control Center User Guide

leading backslashes [\\]. To add multiple computer names, separate each name by a comma.
5 Click Finish.
If you entered a valid server or workstation name that can be reached over the network, it is added to the AppManager
To Do this
Select a Computer type
Select an option to choose the type of computer you want to add:• Windows computers This option allows you to add
computers that run on supported Windows operating systems. This is the default.
• Unix computers This option allows you to add computers that run on supported UNIX operating systems.
Select Computers Type the names or IP addresses of the computers you want . At this time, only IPv4 addresses are supported.To add multiple computer names, separate each name by a comma.To add computers that are not accessible by NETBIOS name from the Control Center Console computer, type the name or IP address. If you attempt to add a computer that is not accessible from the Control Center Console computer, the Control Center Console does not automatically add the computer. If the computer you want to add is not accessible from the Control Center Console, the Add Computer Errors dialog box lists the inaccessible computers and manually add them.
Discover objects automatically
This option is available when you add a Windows or UNIX computer. Click:• Discover Windows objects automatically to discover
Windows resources. Selecting this option is the same as running the Discovery_NT Knowledge Script on the computer.
• Discover UNIX objects automatically to discover UNIX resources. Selecting this option is the same as running the Discovery_UNIX Knowledge Script on the computer.
Note You might want to run other discovery Knowledge Scripts on the computer after adding it to the management group.
Chapter 3 • Configuring the Control Center Console 43
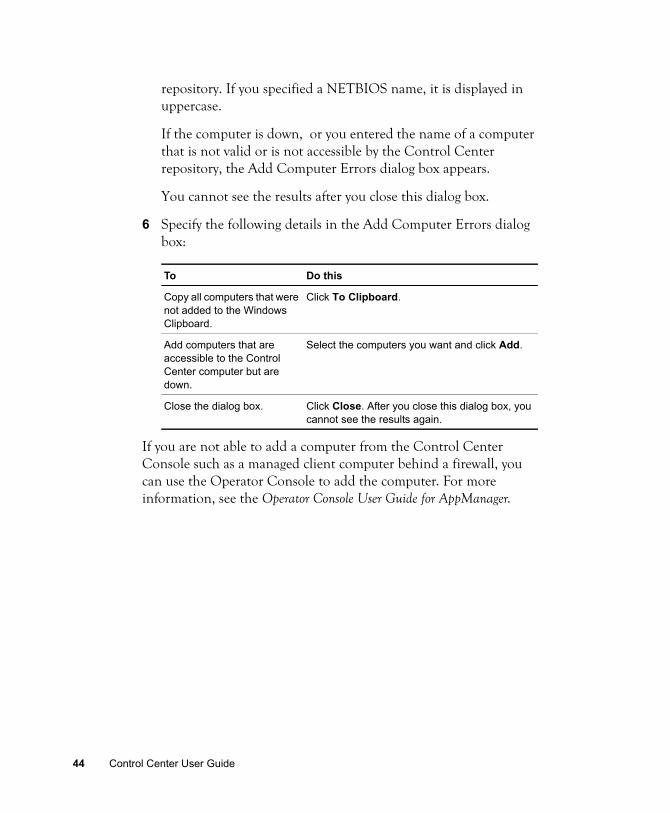
repository. If you specified a NETBIOS name, it is displayed in uppercase.
If the computer is down, or you entered the name of a computer that is not valid or is not accessible by the Control Center repository, the Add Computer Errors dialog box appears.
You cannot see the results after you close this dialog box.
6 Specify the following details in the Add Computer Errors dialog box:
If you are not able to add a computer from the Control Center Console such as a managed client computer behind a firewall, you can use the Operator Console to add the computer. For more information, see the Operator Console User Guide for AppManager.
To Do this
Copy all computers that were not added to the Windows Clipboard.
Click To Clipboard.
Add computers that are accessible to the Control Center computer but are down.
Select the computers you want and click Add.
Close the dialog box. Click Close. After you close this dialog box, you cannot see the results again.
44 Control Center User Guide

Deleting a Computer
You can delete a computer from a Server view. After you delete a computer from the database, the Control Center Console does not displays it. You cannot see the associated jobs, events, and data since they are also deleted from the Control Center repository.
To delete a computer:
1 In a Server view, select a computer. To delete all of the servers or workstations in a view, select the view.
2 In the Tasks pane, click Delete Servers.
3 Click Yes to confirm.
Deleting Resources
In the Operator Console, you can delete a resource folder (which includes all resources in the folder), for example, SMTP Sites, or a particular resource, for example, Default SMTP Virtual Server. You cannot delete a resource folder from the Control Center Console. For more information, see the Operator Console Help .
Viewing Detailed Information about Discovered Resources
In a Server view, use the Details tab of the Server Information pane to view discovery details for an AppManager agent.
To view discovery details for an AppManager agent:
1 In the Control Center Console, expand the Enterprise Layout pane to select a management group that contains the managed client computer.
2 In a Server view, click a server.
3 In the Details tab of the Server Information pane, expand the list of details to view discovery information about the agent.
Chapter 3 • Configuring the Control Center Console 45

Viewing AppManager System InformationIn a Server view, use the grid to view configuration details for a selected server.
The configuration details vary depending on the columns that are displayed in the grid. For information about changing the columns that are displayed, see “Rearranging Columns” on page 46 for more information.
Working with the View PaneIn the standard Control Center views (Knowledge Scripts, Jobs, Events, and Servers) the View pane consists of a grid that has several powerful features for manipulating its data. Many of these features can be accessed from the Column Heading Pop-up Menu, which pops up when you right-click in the column heading.
Refreshing the List
To refresh the contents of the View pane, click View > Refresh or press F5. For information about how the Control Center Console refreshes its display see “General Options” on page 52.
Resizing Column Width To Best Fit
To resize the column width to best fit the view, click View > Best Fit Columns. This command calculates the optimum column width and automatically adjust the width to those values.
Rearranging Columns
You can drag a column by its heading to the right or left to change the order of appearance of the columns.
You can also configure the default columns which appear in a view, and the column order, by clicking View > Grid Fields.
46 Control Center User Guide
Locking Columns
You can lock columns on either the left-hand or right-hand side of the grid. When a column is locked, you cannot drag it to a new position and it does not scroll horizontally.
If you have so many columns in your grid that scroll horizontally to see them, you can lock columns so that they do not scroll. For example, you might lock the computer name column so that it is always visible no matter how much you scroll.
Expanding the List
Click View > Expand All to expand the contents of the View pane. To collapse the contents of the View pane, click View > Collapse All.
Sorting the List
Clicking a column heading will grid-sort the column (and therefore the entire grid list) in ascending (descending) order. Clicking again will grid-sort the column by descending (ascending) order. The Sort Arrow in the column heading shows the order of the grid-sort.
If you grid-sort several columns in order, the last column sorted will control the overall grid-sort order, but the previous sort orders are preserved.
You can also properties-sort the columns in a dataset by opening the View Properties dialog box and selecting the Sorting tab. In this case you can declare a primary, secondary, and tertiary sort order.
Chapter 3 • Configuring the Control Center Console 47
Grouping the List
If the Show ‘group-by’ region at the top of the list box is checked in the Grouping tab of the View Properties dialog box, there will be a Grouping region at the top of the View pane grid. When you drag a column heading to this Grouping region, the dataset will be segmented by the values (categories) in the column. For example, if you group by Knowledge Script category in a Knowledge Script view, you see only the categories in the grid. To see an individual Knowledge Script in the General category, for example, expand the category by clicking the ‘+’ sign by the category name.
If grid-grouping is in effect and you right-click anywhere in the Grouping region, you open a pop-up menu.
This pop-up menu allows you to:
• Full Expand the grid-grouping (see all the computers listed).
• Full Collapse the grid-grouping (see only the grid-grouping categories. You can then expand/contract any category by clicking its +/- button).
• Clear Grouping - turn off the grid-grouping.
Grid-grouping data offers numerous opportunities for executing commands on a number of computers simultaneously. For example:
• In a Server view, you can create a new job simultaneously on all the computers in a grid-group. When you do this, the EnterprisejobID will be the same for all the jobs. This means you can later grid-group these jobs in a Job view by grid-grouping on the EnterprisejobID.
• In a Job view, you can execute the Start, Stop, Close, and Delete commands simultaneously on all the jobs in a grid-group.
• In an Event view, you can execute the Acknowledge, Close, and Delete commands simultaneously on all the events in a grid-group.
48 Control Center User Guide

Filtering the List
When you click the Filter button in the right-hand side of a column heading (the button with a small downward-pointing arrow on it), a drop-down list box opens that contains a list of all the data values that appear in the column.You have three options for grid-filtering:
1 You can select (All), which is the default, to View the entire dataset (all rows).
2 You can select a particular value, to View only the rows that contain that value in this particular column. For example, in a Job view, the Status column can contain RUNNING, PAUSED, or STOPPED. If you select RUNNING, all the rows that show jobs that have a different status will disappear and the View pane grid will show only running jobs.
3 You can select (Custom) to create a Custom grid-filter. In this case, a dialog box opens that allows you to choose two grid-filter conditions. For example, you could choose a Status column grid-filter that will show both PAUSED and STOPPED jobs.
When you have applied a grid-filter at a column heading, the arrow in the Filter button (in the right-hand side of the column heading) will turn blue, indicating that a filter is being used. There will also appear a Filter Status Bar at the bottom of the View pane grid that shows the grid-filters applied using the column heading Filter buttons.
To delete any grid-filter, click the Filter button in the column heading and select (All).
You can delete any grid-filter other than (Custom), by choosing Clear Filter from the menu that pops up when you right-click the column heading.
Chapter 3 • Configuring the Control Center Console 49

You can simultaneously clear all grid-filters, including Custom grid-filters, by clicking the X button at the left of the Filter Status Bar.
You can also properties-filter the dataset by opening the View Properties dialog box and selecting the Filters tab.
Wildcard Filters
If you want to use the asterisk (*) wildcard character, make sure the operator is set to Like or Not Like. At this time, asterisk (match any) is the only supported wildcard character.
Saving Your View Settings
You can save your view settings by clicking View > Save View Settings as Default.
To revert to the default view settings, click View > Revert to Default View Settings.
Exporting the List
You can export the contents of the list to a Microsoft Excel-compatible file:
• To export the currently selected contents, click View > Export Selections. If you select a grouped item, all items in the group are exported.
• To export the contents of the grid, click View > Export All.
50 Control Center User Guide

Setting PreferencesYou must be a member of the Control Center Administrator group to set Control Center preferences.
Preferences control certain aspects of how the Control Center Console operates.
To set AppManager repository preferences, use the AppManager Operator Console. For more information, see the Operator Console User Guide for AppManager.
Control Center Console Options
To configure the Control Center Console options, click Tools > Options. In the Options dialog box, click the Console tab to configure any of the following options:
• Events Options
• General Options
• Jobs Options
• Knowledge Base Options
• Servers Options
• Service Map View Options
Events Options
In the Event Options group, you can set the following:
Option Description
Prompt to acknowledge and close events
Disable the prompts (“Do you really want to....”) for acknowledging and closing events. This option is enabled by default.
Hide severity icon for events that are acknowledged or closed
Show or hide the severity icon for acknowledged and closed events. This option is enabled by default.
Use bold text for open events Use bold text for Open events. This option is disabled by default.
Chapter 3 • Configuring the Control Center Console 51

General Options
In the General Console Options group, you can specify the refresh rate for the active view and choose the color scheme for the Control Center Console.
You can change the default refresh rate for the active view, however, increasing the frequency with which the console refreshes the active view may not result in more frequent changes to the contents of the display. The Control Center Console maintains a local cache of event and job information from the Control Center repository. The cached event and job information is displayed in the management group. When you change the status of an event or job, for example, by starting a Stopped job, the Control Center Console updates the job status and the Queue Manager issues a command to start the job. Until the Queue Manager runs the command, the actual status of the event or job remains the same.
The Control Center Console displays the updated status when it refreshes the active view. By default, the Control Center Console refreshes the active view every 30 seconds.
In the Status for Systems group, you can choose to change the CQS or Cache manager icons in the Status pane when the CQS or Cache Manager has not given a response within a certain number of minutes. The defaults are such that the icons will be changed to Warning icons after 2 minutes without a response and to Severe icons after 5 minutes without a response.
Prompt when selecting more than N parent events
Set a threshold for prompting to display child events in a Split Parent/Child View when a large number of parents is selected. The default is 100 parent events.
Display child event on selection of more than one parent event
Display child events for more than one selected parent event. This option is disabled by default.
Option Description
52 Control Center User Guide
Jobs Options
In the Job Options group, you can disable the prompts (“Do you really want to....”) for starting, stopping, and closing jobs.
Knowledge Base Options
In the Knowledge Base Options group, you can link to a Knowledge Base server and enable it.
When you have done this, a Knowledge Base tab will appear in the Knowledge Script Properties dialog box for Knowledge Scripts and a Knowledge Base icon will appear in the Event Properties dialog box. Choosing the tab in the Knowledge Script Properties dialog box will present a Knowledge Base article about the Knowledge Script if one is available. Choosing the icon in the Event Properties dialog box will present a Knowledge Base article about the current event if one is available.
Servers Options
In the Performance Options group, an AppManager Control Center administrator can set a threshold for giving users the option of not loading data into the tab that is selected in the Server Information pane.
Some experimentation is required to set optimum thresholds. In general, the Details tab threshold will need to be lower than the others. The Custom Properties tab threshold may also need to be lower, depending on how many servers have been assigned custom properties.
If you select a number of servers, data is loaded into whichever tab is currently selected in the lower Server Information pane. With a large number of selected servers, loading the data can become time consuming. In Performance Options, an AppManager Control Center administrator can set a threshold for the number of selected servers that will present the user with a load/don’t load option.
Chapter 3 • Configuring the Control Center Console 53

As an example, suppose that an administrator sets the threshold for the Details tab at 25. When a user selects 25 or more servers and the Details tab is active, a warning message appears asking the user if they want to load data into the Details tab. If they click Yes, the data is loaded. If they click No, the data is not loaded but the selection of servers is preserved. This allows the user to perform the action for which they selected multiple servers, without the delay involved in loading data (which they do not need at this time) into the Details tab.
Service Map View Options
In the Service Map Views Options group, an AppManager Control Center administrator can set a default icon size for existing and new service maps.
If you change the default icon size, your changes are applied to existing service map views after you check them out and back into the Control Center repository.
When updating or creating a service map view, you can override the Control Center default icon size. For more information, see “Creating a Service Map View” on page 225.
Command Queue Service (CQS) Options
The CQS General options allow you to configure how the Command Queue Service communicates with the Control Center repository (and AppManager repositories), and specify the level of tracing information you want the Command Queue Service to log. To apply your changes, restart the NetIQ AppManager Command Queue Service.
Option Description
Database computer Displays the name of the AppManager Control Center database (NQCCDB).
Database name Displays the name of the AppManager Control Center database (NQCCDB) computer.
54 Control Center User Guide

Connection Timeout This value indicates the number of seconds a request for a connection waits when there are no connections available in the free pool and no new connections can be created, usually because the maximum value of connections in the particular connection pool has been reached. For example, if Connection Timeout is set to 300, and the maximum number of connections are all in use, the pool manager waits for 300 seconds for a physical connection to become available. If a physical connection is not available within this time, the pool manager initiates a ConnectionWaitTimeout exception. It usually does not make sense to retry the connection attempt; if a longer wait time is required you should increase the Connection Timeout setting value. If a ConnectionWaitTimeout exception is caught by the application, the administrator should review the expected connection pool usage of the application and tune the connection pool and database accordingly. The default is 0.When the Connection Timeout is set to 0, the pool manager waits as long as necessary until a connection becomes available. This happens when the application completes a transaction and returns a connection to the pool, or when the number of connections falls below the value of Maximum Connections, allowing a new physical connection to be created. If Maximum Connections is set to 0, which enables an infinite number of physical connections, then the Connection Timeout value is ignored.
Look for new commands every N seconds
Specifies the interval at which the Command Queue Service looks for new commands in the Control Center repository. The default is 30 seconds. If you set the interval to less than 30 seconds, you may impact the performance of the Command Queue Service and Microsoft SQL Server.You can specify an interval up to 9999 seconds.
Retry failed repository connections every N seconds
Specifies the interval at which the Command Queue Service retries a failed attempt to connect to the Control Center or AppManager repository. The default is 60 seconds. Reducing this interval will not necessarily improve the connection performance because a connection must first be available for a retry attempt to succeed.
Output path Displays the path on the Command Queue Service computer for the log files. The default path is: <InstallDir>:\Temp\NetIQ_Debug\CC_CQSTrace.
Option Description
Chapter 3 • Configuring the Control Center Console 55

Trace level Specifies the level of tracing information you want in the SyncQDBLog.txt and CQSLog.txt log files. Do not change the trace level unless instructed to do so by NetIQ Solutions Support. After NetIQ Solutions Support has diagnosed the log files, return the tracing level to its original value. Tracing levels: • Off to disable logging for non-Error events. • Error to log program exceptions to the Windows Event
Log and the Command Queue Service log file. All critical messages are always logged to the Windows Event Log.
• Warning to logs program recoverable errors to the Command Queue Service log file.
• Info to log program warnings and flow information to the Command Queue Service log file. This is the default.
• Verbose to log program debug and trace information such as variable values and thread state to the Command Queue Service log file.
Limit each log file size to N bytes
Specifies the maximum size, in bytes, for the SyncQDBLog.txt and CQSLog.txt log file. The default is 50,000 bytes. If the log file exceeds this threshold, a new log file is created. For information about changing the default value, see the Installation Guide for AppManager.
Number of logs Displays the maximum number of SyncQDBLog.txt and CQSLog.txt log files. The default is 100 log files.When the maximum number of log files have been created, the oldest log file is overwritten. For information about changing the default value, see the Installation Guide for AppManager.
Number of Sync commands
Enter a value between 1 and 60 to specify the number of threads that are available to manage communication between the Control Center database and its associated AppManager repositories. When specifying a value, NetIQ Corporation recommends configuring 3 threads for each AppManager repository managed by Control Center. For example, if you have 8 AppManager repositories (including the primary AppManager repository), set this parameter to 24. The default is 10.
Option Description
56 Control Center User Guide

Deployment Options
To configure the Deployment Server options, click Tools > Options. In the Options dialog box, click the Deployment folder to configure the following options:
• Schedule Options
• Confirmations Options
• Credentials Options
• Software Inventory Option
• Task Management Options
• General Options
Schedule Options
Specify how frequently the Deployment Server should re-run rules and search for new computers, and when deployment tasks should run. You can also set a default schedule for running deployment tasks.
Option Description
Detection Interval Specifies the frequency of rule execution for all active rules. Default is 5 minutes. Specify the detection interval in minutes, hours, or days.
Deployment Schedule Specifies when to deploy tasks. You can choose to deploy tasks only when they are approved by a deployment administrator or based upon a specified schedule. For information about configuring a deployment schedule, see the Help.
Chapter 3 • Configuring the Control Center Console 57

Confirmations Options
Specify whether to display a confirmation dialog box before deleting a package, rule, or deployment task.
Credentials Options
To run an installation package on a target computer, for example, to install the AppManager agent, provide a domain or local user account that is member of the Administrators group on the target computer.
When configuring a rule, you can use the Windows user account that is currently configured as the default for deployment, or provide different login information.
If you change the default deployment credentials, the change only applies when you create a new rule. Existing deployment tasks maintain their original deployment credentials.
Specify the default deployment credentials:
For Do this
User name Specify a domain or local user account that is member of the Administrators group on the target computer. If the same credentials can be used to connect to and deploy to most Windows computers, then this should be used.
Password Specify the password for the user account.
58 Control Center User Guide

Software Inventory Option
Specify options to manage software inventory information for the agents. You can specify the following parameters:
• The number of hours or days after which you want to remove the software inventory information for the agents.
• The number of hours or days after which you want the agents to report software inventory information.
Task Management Options
Specify options for managing deployment tasks, including:
• How long to display a deployment task in the Control Center Console
• How long to keep a deployment task in the Control Center database
Confirm password Confirm the specified password.
Domain Specify the Windows domain for the specified user name. If the target computer is in a workgroup, specify the workgroup name. Note: When you specify the Windows domain, Control Center displays the following message: “Domain name appears to be invalid or can not be resolved at this time” if it does not recognize the domain by its name. You can ignore this message and continue to specify the other options.
For Do this
Chapter 3 • Configuring the Control Center Console 59

General Options
Specify the deployment web server and email notification options:.
General Options
To configure the look and feel of the Control Center Console, click Tools > Options. In the Options dialog box, click the General folder and select Skin Selection.
On the right pane, specify the look and feel of the Control Center Console by selecting an option from the Active Skin list. The right pane displays a sample of the screen based on your selection.
Option Description
Web Server Specifies the name of the IIS server where the deployment web service is installed. This is also the web depot.
SMTP Server Specifies the name of the SMTP server to send email notifications for deployment tasks.
Recipient list Specifies the SMTP addresses you want to receive deployment notifications. You can override the specified recipients when you configure deployment rule.To add a recipient, type the SMTP address in the E-mail field and click Add.To remove a recipient, click a recipient in the list and click Remove.
Notification for new rules Select an option to specify when notifications should be sent for new rules:• Deployment succeeds• Deployment fails
60 Control Center User Guide

Viewing the Status of Control CenterThe Status pane shows:
• The status of the CQS and Cache Manager systems. If you double-click the status entry for either CQS or Cache Manager, you will open the associated Status dialog box. In the Cache Manager Status dialog box, for example, you can:
• Check the connectivity between the Cache Manager and each managed repository.
• Troubleshoot Cache Manager errors.
• Queued commands. Double-click a command to open the Command Details dialog box. In this dialog box, you can choose the Click here for Queue Manager link at the bottom to open the Queue Manager.
Getting Information about a Knowledge ScriptA short description of each Knowledge Script is displayed in the Knowledge Script view pane grid.
For detailed information about an individual Knowledge Script, double-click the script in the Knowledge Script view pane grid and then click Help on the Values tab in the Knowledge Script Properties dialog box.
In the Operator Console, you can view the development history of a Knowledge Script, including the version number and any comments recorded by the developer, by right-clicking the Knowledge Script in the Knowledge Script pane and then clicking Version History.
Chapter 3 • Configuring the Control Center Console 61

Checking Communication with Managed ComputersFrom time to time, the Agent column in the Server view may indicate that a managed computer is disconnected, which means the AppManager management server is unable to communicate with the computer. While in this state, you cannot run Knowledge Scripts against the computer. In the background, the management server periodically checks whether it can communicate with the computer. Once communication is reestablished, the status of the managed computer is restored to its normal Online state.
Monitoring the Status of Control CenterThe Systems Status pane displays status information about:
• Control Center Console commands in the Queue Manager.
• Connectivity from the Command Queue Service and the Cache Manager to the managed AppManager repositories.
• Deployment tasks.
To display the System Status pane, click View > System Status Pane.
Monitoring Commands in the Queue ManagerThe Queued Commands panels displays the commands that are waiting to run by the Command Queue Service, for example, to Acknowledge an event. The command Status can be one of the following:
• Permission Denied - user lacks proper security access.
• New - command is in queue, but not yet picked up by CQS.
• Pending - command has been picked up by CQS, waiting for execution.
• Success - command has executed successfully.
• Fail - command fails for a particular reason.
• Corrupt - data in the command is not decipherable by the CQS.
62 Control Center User Guide

• Aborted - user has requested cancellation, action is pending.
• Abort Completed - command was cancelled prior to execution.
To view details on command in the list, double-click the command you want.
To view details on all commands in queue, open the Queue Manager by clicking Tools > Queue Manager.
Monitoring Connectivity to AppManager Repositories
The Systems panel displays the connectivity status from the Command Queue Service and the Cache Manager to the managed AppManager repositories.
In each case, the Status may be OK, Warning, or Error.
Double-click an item in the Systems panel for more information:
Understanding Command Queue Service Status
The Status for the Command Queue Service can be:
• OK The Command Queue Service can connect to all AppManager repositories.
• Warning This means that Command Queue Service cannot connect to one or more (but not all) AppManager repositories. The Command Queue Service can also have a Warning state if it has not updated its health tables in the internally-set Warning interval of 2 minutes. See “General Options” on page 52 for more information.
• Error This means that all the repositories that the Command Queue Service is attached to are down, or some other significant problem has happened—such as the Command Queue Service has stopped responding. It can also indicate that the Command Queue Service has not updated its health tables in the internally-set Error interval of 5 minutes. See “General Options” on page 52 for more information.
Chapter 3 • Configuring the Control Center Console 63

Double-click the CQS item in the Systems panel for more information.
Understanding Cache Manager Status
The Status for the Cache Manager (SQL Server Agent) can be:
• OK There are no SQL errors, major or minor.
• Warning There are one or more SQL errors, but they are all minor (severity less than 16). The Cache Manager can also have a Warning state if it has not updated its health tables in the internally-set Warning interval of 2 minutes.
• Error There are one or more major SQL errors (severity greater than 15). This can mean, for example, that one or more of the repositories that the Cache Manager is connected to are down. It can also indicate that the Cache Manager has not updated its health tables in the internally-set Error interval of 5 minutes.
The most frequent Error state will appear when a major SQL error has occurred. For many of these errors, troubleshooting information is presented in the Cache Manager Status dialog box.
Double-click the Cache Manager item in the Systems panel for more information.
Monitoring the Status of Deployment Tasks
The Deployment panel displays any deployment task with a status of Waiting for Approval, Waiting for Schedule, Active, and Error. Double-click an entry in the Deployment panel to display the Deployment Summary view.
64 Control Center User Guide

Using the Utilities Menu ExtensionsThe Control Center Console provides right-click menu access to tools, some of which are not part of AppManager, that can be useful to perform related system management or diagnostic tasks:
• “AppManager Utilities” on page 65
• “Windows Utilities” on page 66
In addition, you can customize the AppManager Utilities menu. For more information, see Chapter 13, “Customizing Menu Extensions.”
AppManager Utilities
In a Server view or a Job view, right-click an item in the View pane to choose an item from the AppManager Utilities menu:
• Chart Console Starts the NetIQ Chart Console. The Chart Console allows you to generate and view charts of data streams generated by Knowledge Script jobs. For more information, see Chapter 11, “Using the Chart Console.”
• Diagnostic Console Starts the Diagnostic Console, if it is installed on the Control Center Console computer. The Diagnostic Console expands on the problem diagnosis features of AppManager by providing you with a collection of features that enable you to remotely investigate and diagnose problems occurring on Windows servers in your environment. This tool is not applicable when monitoring a UNIX computer.
The Diagnostic Console must be installed separately. The setup program is provided on the AppManager Suite installation kit in the \Diagnostic Console folder.
• List Jobs on Windows Agent Using NetIQCtrl Starts a command-line interface for checking the status of AppManager components. For more information, see the Administrator Guide for AppManager.
Chapter 3 • Configuring the Control Center Console 65

• Operator Console Starts the AppManager Operator Console, if it is installed on the Control Center Console computer. Do not use the AppManager Utilities menu to start more than one instance of the Operator Console. The Operator Console does not work properly when running more than instance on the same computer using the same login information.
The Operator Console allows you to manage computers on a single AppManager repository. For more information, see the Help.The Operator Console must be installed separately. The setup program is provided on the AppManager Suite installation kit in the \Setup folder.
Windows Utilities
In a Server view or a Job view, right-click an item in the View pane to choose an item from the Windows Utilities menu:
• Computer Management Starts the Windows Computer Management console. This tool is not applicable when monitoring a UNIX computer. For more information, see your Windows documentation.
• Event viewer Starts the Windows Event viewer. This tool is not applicable when monitoring a UNIX computer. For more information, see your Windows documentation.
• Explore and Explore C$ Opens Windows Explorer and opens Windows Explorer to the C: drive, respectively.
• Ping Machine Performs an ICMP Ping request on the computer you want.
66 Control Center User Guide

• Service Manager Opens the Windows Service Manager on the computer you want.
• Terminal Services Start a Terminal Service session on the remote computer you want.
• Trace Route Runs the Traceroute utility on the computer you want.
Viewing Audit InformationIf you have configured the AppManager repository preferences to collect audit information for jobs, events, and actions, you can view this information, and information about maintenance mode activity, from the Operator Console. Audit information about maintenance mode is automatically collected and can also be viewed from the Operator Console. You cannot view audit information from the Control Center Console.
For more information, see the Operator Console User Guide for AppManager.
Chapter 3 • Configuring the Control Center Console 67

68 Control Center User Guide

Chapter 4
Managing a Group of Computers
This chapter provides an overview of how to use management groups in the Control Center Console to manage a group of computers.
About Management GroupsControl Center uses management groups to manage a group of computers. A management group consists of at least one member that specifies the managed client computers that belong to a management group.
A management group member can be:
• A view in an AppManager repository, for example, the NT view.
• A server group within a view of an AppManager repository. Use the Operator Console to add a server group to a view. You cannot create server groups in the Control Center Console.
• A rule that describes the managed client computers you want, for example, Exchange Servers with more 2 GB of physical memory. For more information, see “Creating a Rule to Select the Computers You Want to Manage” on page 75.
The Control Center Console provides a default management group, Master, that displays all of computers managed by Control Center. A computer can appear in more than one management group.
69

After you install and discover an agent, Control Center automatically displays the agent in the Master management group. If you configure Control Center to manage more than one AppManager repository, the Master management group displays all the managed client computers in all the AppManager repositories.
Using Control Center’s group-based permissions, you can configure permissions on a management group.
You should configure additional management groups to select computers based on the resources you want to monitor. After you have identified the computers you want, you can configure a monitoring policy to automatically monitor those resources. For more information, see “Monitoring by Policy” on page 197.
Creating a Management GroupCreate a management group in the Enterprise Layout pane. Although you can organize management groups into a hierarchy, there is no hierarchical relationship between the management groups. Each management group operates independently and must be configured individually.
After you create a management group, you cannot move it to a different location.
70 User Guide

To create a management group:
1 Right-click the top-most AppManager icon in the Enterprise Layout pane, or an existing management group and click New > Management Group.
2 In the New Management Group Properties dialog box, enter properties for the management group. In many cases, you can simply use the default values. To make changes:
3 After you review or change the parameters, click OK to create the management group.
Note You can create a management group without specifying any members. However, Control Center creates the management group without any standard views.
Click this tab To
General Specify the name of the management group. This is required.
Members Specify the computers you want this management group to manage. For more information, see “Adding Members to a Management Group” on page 72.To automatically create standard views (which you will likely need), be sure to select the option when you create the management group. After you create a management group, add a view manually.
Policy Specify a monitoring policy for the management group. For more information, see Chapter 8, “Monitoring by Policy”.
Security Configure Control Center permissions to enable non-Administrator users to use the management group. For more information, see the Administrator Guide for AppManager.
Chapter 4 • Managing a Group of Computers 71
Adding Members to a Management GroupTo manage a group of computers, add one or more members to the management group. A member describes the computers you want to include in the management group.
You can configure the following types of members:
• Repository View Allows you to add one more views from an AppManager repository, for example, the NT and IIS views.
• Server Group Allows you to add an existing server group from an AppManager repository. If you have not created server groups in the Operator Console, this option is not applicable. Note that you cannot create server groups in the Control Center Console.
• Rule Allows you to create and add rules that describe the computers you want to add based on their discovered attributes, for example, number of processors or a custom property.
You can specify more than one member for a management group. If a computer is selected by any management member, it is included in the management group.
You can create management groups only up to nine levels within a single management group. When you create one management group within another management group extending up to nine levels, it is called a cascade of management groups.
Tip When adding members to a management group, it is a good idea to limit the number of members in the management group. If you add more than one member to a management group, make sure you do not select a computer more than once. If a computer is selected more than once and you run a policy-based job on that computer, duplicate policy-based jobs are created. For example, if you add the NT view and a management group rule that selects computers based on discovered NT resources, duplicate policy-based jobs are created on computers that are selected by both members.
72 User Guide
To add a member to a management group:
1 Display the Properties dialog box for the management group.
If the management group already exists, select the management group, right-click, and then click Properties.
2 In the Members tab, click Add.
3 In the Management Group Members dialog box, click a button to choose the type of member you want to add:
• Repository View. Click the repository you want from the list or choose All Repositories. If you choose All Repositories, Control Center displays resources from any additional AppManager repositories that it manages.
After you select a repository, select the views you want. To select multiple views, press Ctrl or Shift when you make your selections. Click OK after you select your views.
• Server Group. Click the repository you want from the list or choose All Repositories to display the corresponding list of server groups. Select the server groups you want and click OK. If you have not created server groups in the Operator Console, this option is not applicable.
Note You cannot create server groups and views in the Control Center Console.
• Rule Allows you to create and add rules that describe the computers you want to add based on their discovered attributes, for example, number of processors or a custom property. For more information, see “Creating a Rule to Select the Computers You Want to Manage” on page 75.
4 Click OK to add the member.
Note After you select a view or server view and add it to the management group, you can still see it in the list of views or server views but cannot add it to the same management group again.
Chapter 4 • Managing a Group of Computers 73

Changing a Management Group Rule
To change the computers selected by a management group rule, you need to modify the rule.
To modify a rule:
1 Display the Properties dialog box for the management group.
If the management group already exists, select the management group, right-click, and then click Properties.
2 In the Members tab, click the rule-based member and click Modify Rule.
3 In the Modify Rule dialog box, view details about the rule and to edit the rule. For more information, see the contextual help for the dialog box.
4 When you finish, click OK to save your changes to the rule.
5 Click OK. The management group automatically refreshes the list of computers in the Server view.
Removing a Member From a Management Group
If you no longer want to monitor a group of computers from a management group, you can remove the computers by removing the associated management group member.
When you remove a member from a management group, the associated computers do not appear in the management group. Existing jobs on those computers continue to run and can be viewed from other management groups that are configured to select the managed client computer.
74 User Guide

To remove a member from a management group:
1 Display the Properties dialog box for the management group.
2 If the management group already exists, select the management group, right-click, and then click Properties.
3 In the Members tab, click the member you want to remove.
4 Click Remove.
Note You can remove all the members from a management group even if there are monitoring policy jobs running on the members.
Creating a Rule to Select the Computers You Want to Manage
A rule-based management group provides a powerful and dynamic way to manage a group of servers by allowing you to automatically move servers between management groups as their status and discovered resources change. Rules can be configured to compare discovered resources, such as the amount of physical memory, and AppManager-related status, such as the highest event severity level.
By comparison, a management group based on an AppManager view is not as granular because once the application resources are discovered, the computer always appears in the Control Center management group.
Using the Rule Wizard in the Control Center Console, you can easily configure expressions to select the computers you want. The following types of expression templates are available:
• Application Selects computers with an application or an application component installed in them. For example, computers where IIS is not installed.
• Computer List Match Selects a list of computers that match a search string that you specify. For example, EXCHNewYork, EXCHLosAngeles, and EXCHSanJose.
Chapter 4 • Managing a Group of Computers 75

• Computer Name Wildcard Match Selects a list of computers that match a wildcard search string you specify. For example, EXCH*.
• AD Selects Active Directory domain controller computers. For example computers:
• Domain controllers that match a wildcard search string you specify.
• Domain controllers in domains with a specific domain mode.
• Domain controllers in domains that match a wildcard search string you specify.
• Domain controllers that have a specific role.
• Domain controllers in domains that have installed AppManager for Active Directory agent version 6.3.
• Domain controllers with a specific domain functional level.
• Domain controllers in a specific forest.
• Domain controllers in a specific site.
• AppManager Selects AppManager managed client computers. For example, computers:
• With Open or Severe events.
• With the AppManager report agent.
• Which are Proxy Event Servers.
• Where the agent has not recently communicated with the management server (grayed out).
• That are in maintenance mode.
• With jobs that have an Error status.
• With a specified threshold for number of running jobs.
• IP Address range Selects computers within a specific IP range that you specify. For example, you can select range of IP addresses and configure other criteria to select the computers you want.
76 User Guide
• Custom Properties Selects objects based on an existing custom property on a managed client computer. For more information, see “Working with Custom Property Information” on page 81.
• Hardware Selects computers with specific hardware. For example, computers with more than 2 processors.
• NT Selects Windows computers. For example, computers having the following versions of Windows installed:
• Windows 2000 or later
• Windows 2003 or later
• Object Selects computer with AppManager object information, for example, object name, object type, object details. For more information, see “Working with Objects” on page 86.
• SQL Selects SQL server computers. For example, SQL server computers having:
• A specific database
• A specific database size
• A specific detail and value
• No custom databases installed
• More than one custom databases installed
• A specifc SQL server version
Chapter 4 • Managing a Group of Computers 77

Configuring a Rule
The Rule Wizard provides an easy-to-use interface for adding and configuring expressions. You can find information about each expression template by hovering the mouse over an expression. Tooltip information helps you find the expression you need.
You can perform the following actions using the Rule Wizard:
• Add a rule. For more information, see “Adding a Rule” on page 78.
• Remove a rule. For more information, see “Removing a Rule” on page 80.
• Modify a rule. For more information, see “Modifying a Rule” on page 80.
• Delete a rule. For more information, see “Deleting a Rule” on page 80.
Adding a Rule
To add a rule to a management group:
1 Display the Properties dialog box for the management group.
2 If the management group already exists, select the management group, right-click, and then click Properties.
3 In the Members tab, click Add.
4 In the Management Group Members dialog box, click the Rule button to display existing rules.
5 Click Create.
In the Create a New Rule dialog box, the Rule Wizard lists the expressions in the rule and displays the expression templates.
6 In the Name field, type a name for the rule. Optionally, you can provide a description in the Description field.
78 User Guide

7 In the Expressions pane, click the any link to specify the operator for the expressions that you add to the rule. You can select from the following operators:
• All Select this operator for the computer to match all the expressions that you add to the rule. It indicates the AND condition.
• Any Select this operator for the computer to match any one of the expressions that you add to the rule. It indicates the OR condition.
• None Select this operator if you do not want the computer to match any of the expressions that you add to the rule.
8 In the list of expression templates, browse the list to find the expression you want. Mouse over an expression to see a tooltip description of what it does.
9 Select an expression template and click Add to Rule.
The expression is added to the rule.
10 In the Expressions pane, click the expression link to select from a list of options available for that expression. For example, if you add the Windows Version expression template under NT to your rule, then the Expressions pane displays the following expression: Windows Version 2000 or later
Click the 2000 or later link to select from a list of other options.You can add another expression or click OK to finish.
11 To add additional expressions as a group, click New and specify the operator for the expressions and repeat steps 7 through 10.
For complete information about how to configure expressions, see the Help.
Chapter 4 • Managing a Group of Computers 79

Removing a Rule
To remove a rule from a management group:
1 Display the Properties dialog box for the management group.
If the management group already exists, select the management group, right-click, and then click Properties.
2 In the Members tab, select an existing rule and click Remove.
Modifying a Rule
To change a rule:
1 Display the Properties dialog box for the management group.
2 If the management group already exists, select the management group, right-click, and click Properties.
3 In the Members tab, select the rule you want to modify and click Modify Rule.
4 In the Modify Rule dialog box, make your changes and click OK. Control Center automatically updates the management groups that use the rule.
Deleting a Rule
To delete a rule:
1 Click File > Manage Rules.
2 In the Management Rules dialog box, click the rule and click Delete.
3 Click OK.
Control Center automatically updates the management groups that use the rule. If a management group is using a rule, it will be removed from that management group and as a result, the members of the management group can change.
80 User Guide

Working with Expression Templates
You can copy the standard, out-of-the-box expression templates and customize the copied template. You cannot customize the standard, out-of-the-box expression templates.
To edit the expression templates, click File > Manage Rules. In the Management Group Members dialog box, you can edit and delete copies of the standard, out-of-the-box expression templates.
For complete information about how to configure expressions, see the Help.
Note When you copy or edit expression templates, do not click the delete icon next to the expression template because this action deletes the expression template.
Working with Custom Property Information
Using the Custom Properties tab in the Server view, you can manage custom property values for one or more selected computers. You can create a new property value or apply an existing custom property value to one or more computers.
Using custom property information, you can:
• Override the parameter value for a job. To do this, the job must be configured to use a custom property as an override. For more information, see “Setting Override Values” on page 107.
After you add the custom property value to the managed client computer, the original parameter value is not used. You can also change the override value by updating the custom property value.
Chapter 4 • Managing a Group of Computers 81

• Configure a rule-based management group to select computers based on custom property value information. Note that only managed client computers with version 7.0 (or later) of the AppManager agent can be included. If you have AppManager 6.0.2 (or earlier) agents, upgrade them to version 7.0 (or later) to include them in a rule-based management group that selects computers based on custom property information.
• Add one or more custom properties to a computer to provide custom information about that computer. For example, you can add a custom property to identify servers by Location, such as San Jose. A rule-based management group configured to select the custom property value are automatically displayed in the management group.
In AppManager 6.0.2 and earlier, a custom property can be used to create a dynamic view. You can still use the Operator Console to configure dynamic views based on custom property information, however, NetIQ Corporation recommends that you use the Control Center Console to configure rule-based management groups to leverage custom properties. Use the Control Center Console to manage custom property information. You cannot use the Operator Console to create or change custom properties.
When configuring custom properties for use with a rule-based management group, keep in mind that custom properties on a server may also be used to override a parameter job value for an ad hoc or policy-based job. For more information, see “Setting Override Values” on page 107.
82 User Guide

Adding a Custom Property
In order to configure a rule-based management group to select computers based on custom property information, first define the custom properties you want on each managed client computer. Use the Master management group or another management group that displays the computer you want to add the custom property.
To add a custom property to one or more computers:
1 In the Server view, select the computers where you want to add a customer property.
2 Click the Custom Properties tab, to view a list of custom properties for the selected computers.
If one of the computers does not have the custom property, the value is <<Property Is Not Common>>. If the computers have a different value for the custom property, the value is <<Values Differ>>.
3 To add a custom property to the selected computers, click New. In the New Custom Property dialog box, specify the custom property you want.
Chapter 4 • Managing a Group of Computers 83

For Do this
Name Select an existing custom property name from the list or type a new name. The name must be less than 40 characters.
Format Select a data type for the value of the custom property. When choosing a data type, you should consider how you can configure a Custom Property condition to select the value of the custom property. Available data types include:• Date You can configure a Custom Property condition to select a
date value that is BEFORE, AFTER, or AT (on) the specified date of the custom property value. This data type supports date format only (date/time is not supported).
• String You can configure a Custom Property condition to select string values that either match (using IS) or do not match (using IS NOT) the custom property value. You can configure a rule to look for strings using wildcard characters (* matches any characters or ? matches one character). If the AppManager repository resides on a SQL Server that is case-sensitive, string values are case-sensitive. This data type supports printable characters.
• Integer You can configure a Custom Property condition to select integer values that are EQUAL, NOT EQUAL, GREATER THAN, LESS THAN, NOT GREATER THAN, or NOT LESS THAN the custom property value. This data type supports integer values.
• Decimal You can configure a Custom Property condition to select approximate floating decimal values that are GREATER THAN, LESS THAN, NOT GREATER THAN, or NOT LESS THAN the custom property value. Since decimal values are approximate, NetIQ Corporation recommends using operators such as GREATER THAN or LESS THAN instead of EQUAL TO or NOT EQUAL TO.Note that the Control Center Console displays up to 6 decimal places; if you specify more than 6 decimal places, you can query for the specified value but the Control Center Console displays a value that is rounded up to the sixth decimal place.
Value Select a custom property value from the list or type a new value that corresponds to the data type you specified.
For a Date value, click the button to select a new date or type a date using the system date format of your Windows computer. You cannot specify a date that is earlier than 1/1/1970.Note See Windows Help for information about date formats on your local computer.
84 User Guide

4 Click OK.
In the Custom Properties tab, the list displays the updated properties for the selected server or servers.
Applying a Custom Property Value To More Than One Computer
You can apply an existing custom property value to more than one computer or update selected computers to specify a new custom property value.
To apply a custom property value:
1 In the Server view, select the computers you want from the list.
2 Click the Custom Properties tab, to view a list of custom properties for the selected computers.
If one of the computers does not have the custom property, the value is <<Property Is Not Common>>. If the computers have a different value for the custom property, the value is <<Values Differ>>.
3 Select the computers for which you want to apply the custom property, select the custom property you want, and click Edit.
4 In the Custom Property dialog box, configure the custom property and click OK to apply the custom property value to the selected computers.
Removing a Custom Property
You can remove a custom property from one or more selected computers. For example, you can remove a custom property to prevent a computer from appearing in a rule-based management group.
Note When you delete a custom property from a computer, any jobs that are running on the computer that use the custom property as an override value will be updated to use the default parameter value. For more information, see “Removing a Job Override” on page 113.
Chapter 4 • Managing a Group of Computers 85

To remove a custom property:
1 In the Server view, select the computers you want from the list.
2 Click the Custom Properties tab, to view the custom property information.
3 To remove a custom property from the selected computer or computers, select a property from the list and click Delete.
On the Custom Properties tab, the list of Custom properties displays the updated properties for the selected server or servers.
Working with Objects
You can include computers in a management group based on discovery information, for example:
• Object Name Selects any discovered objects that match the name you specify.
• Object Type Selects any discovered objects of the type you specify. Discovered object types appear as resource objects in the Details tab of the Server view, for example, a SQL Server or a CPU resource. The object types you can select to configure this condition correspond to the objects in the AppManager repository—you can configure this condition to select an object type that has not been discovered but no objects will be selected until after they are discovered.
• Object Detail Selects discovered objects based on the object detail of the object type you specify.
86 User Guide
Configuring Permissions for a Management GroupYou must be a member of the Control Center Administrator group to give one more user groups permission to access a management group. For information, see the Administrator Guide for AppManager.
Note that if management group has not been configured to explicitly give permission to a user group, only members of the Control Center Administrator group can access the management group.
Granting Permission to Access a Management Group
To give a user group permission to access a management group:
1 Right-click the management group in the Enterprise Layout tree and choose Properties.
2 In the Management Group Properties dialog box, click the Security tab and then click Add.
3 In the Context Properties dialog box, click the Group list to select the user group you want. The permission set that is configured for the user group appears in the Permission Set list.
4 Click OK. Repeat these steps to add another user group.
Removing Permission to Access a Management Group
To remove permission for a user group to access a management group:
1 Right-click the management group in the Enterprise Layout tree and choose Properties.
2 In the Management Group Properties dialog box, click the Security tab.
3 Click the user group you want to remove and then click Remove. Note that if no user groups are listed, only members of the Control Center Administrators group can access the management group.
Chapter 4 • Managing a Group of Computers 87

Creating Standard Control Center ViewsWhen you create a management group, you can create the standard views which include Events, Jobs, Knowledge Scripts, and Servers.
After you create a management group, you can create folders to organize additional Events, Jobs, Knowledge Scripts, and Server views.
In addition, you can create Service Map views to illustrate and manage the business processes in your environment. Service Map views are not standard views and must be created in an existing management group. For more information, see “Using Service Map Views” on page 217.
About the Management Group Summary View
When you click on a management group, the View pane displays a summary about the management group. You can see the following information:
• Member Information. Displays the count and the details of the members of the management group. You can see the following details under member information:
• Repository. Displays the AppManager repository instance name if you choose to add a particular repository view or server group. You can also choose repository views or server groups from more than one AppManager repository, in which case the column displays the value All repositories. If you choose to create a rule based management group, then the column displays the value All repositories.
• Member. Displays the name of the view, server group, or rule.
• Type. Displays the member type which is View, Server Group, or Rule.
88 User Guide

• Events, Jobs, and Server Information. Displays the exact count of events, jobs, and servers that are part of the management group.
• Event Information. Displays the count of open, acknowledged and closed events in that management group.
Organizing Views into Folders
After you create a management group, you can create folders to organize additional views under that management group. Note that after you create a view, you cannot move it to a different folder location.
Creating a Folder
To create a folder:
1 In the Enterprise Layout pane, right-click a management group and click New > Folder.
2 Right-click the folder and click Rename to specify the name for the folder.
Chapter 4 • Managing a Group of Computers 89

Creating a Standard View
To create a standard view:
1 In the Enterprise Layout pane, right-click a management group or folder and click New to select the type of view you want to create (Events, Jobs, Knowledge Scripts, or Servers).
2 In the View Properties dialog box, enter properties for the view. In many cases, you can use the default values. To make changes:
3 Click OK to apply your changes.
Setting the Column Layout of a View
You can change the columns that appear in the Job view and the order in which they appear.
To change the column layout of the Job view:
1 In the Enterprise Layout pane, right-click the Job view you want and click Properties.
2 In the Properties dialog box, click the Fields tab.
Click this tab To
General Specify the name of the view. This is required.
Fields Specify the default layout of the view, including the columns that are displayed and the order in which they are displayed. For more information, see “Setting the Column Layout of a View” on page 90.
Filters Specify the information you want to include in the view. For more information, see “Setting the Default Filtering for a View” on page 91.
Grouping Specify how to group the columns of information in the view and whether to allow the user to change the grouping in the actual view. For more information, see “Setting the Default Grouping for a View” on page 92.
Sorting Specify how to sort the columns of information in the view. For more information, see “Setting the Default Sorting Order for a View” on page 93.
90 User Guide
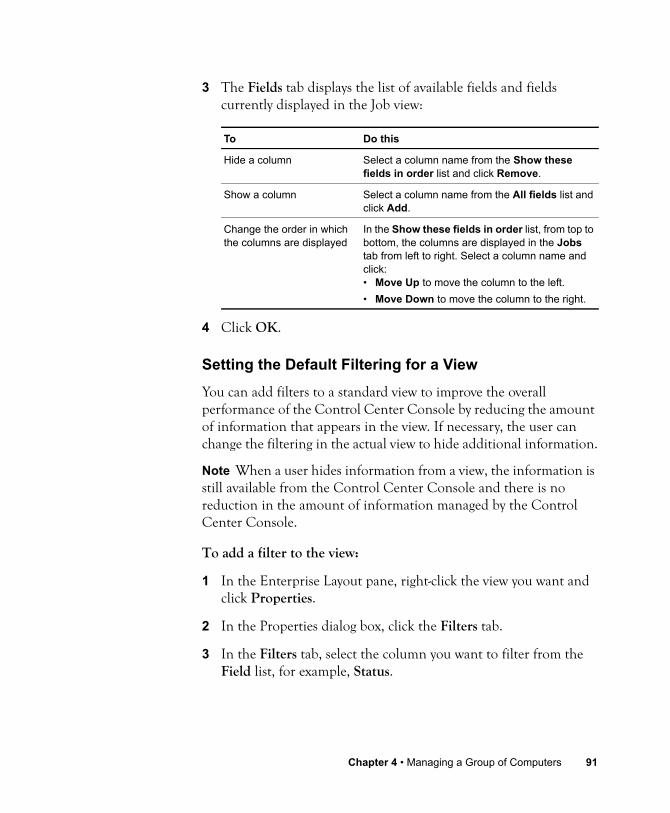
3 The Fields tab displays the list of available fields and fields currently displayed in the Job view:
4 Click OK.
Setting the Default Filtering for a View
You can add filters to a standard view to improve the overall performance of the Control Center Console by reducing the amount of information that appears in the view. If necessary, the user can change the filtering in the actual view to hide additional information.
Note When a user hides information from a view, the information is still available from the Control Center Console and there is no reduction in the amount of information managed by the Control Center Console.
To add a filter to the view:
1 In the Enterprise Layout pane, right-click the view you want and click Properties.
2 In the Properties dialog box, click the Filters tab.
3 In the Filters tab, select the column you want to filter from the Field list, for example, Status.
To Do this
Hide a column Select a column name from the Show these fields in order list and click Remove.
Show a column Select a column name from the All fields list and click Add.
Change the order in which the columns are displayed
In the Show these fields in order list, from top to bottom, the columns are displayed in the Jobs tab from left to right. Select a column name and click:• Move Up to move the column to the left.• Move Down to move the column to the right.
Chapter 4 • Managing a Group of Computers 91

4 In the Condition list, select an option from the list to specify a comparison operator, for example, Equal To.
5 In the Value list, select the value you want, for example, Error.
With this filter, only jobs that have an Error status are displayed.
6 Click Add Filter to add the filter to the view.
To remove a filter from the view:
1 In the Enterprise Layout pane, right-click the view you want and click Properties.
2 In the Properties dialog box, click the Filters tab.
3 In the Filters tab, select the filter you want to remove and click Remove Filter.
4 Click OK to apply your changes.
Setting the Default Grouping for a View
You can set the default grouping for a view and optionally, enable the user to change the grouping in the actual view.
Note If you navigate to a view and change the default grouping for the view when Control Center is fetching the data for the view, the new grouping order does not apply to the view.
92 User Guide

To set the grouping order for the view:
1 In the Enterprise Layout pane, right-click the view you want and click Properties.
2 In the Properties dialog box, click the Grouping tab.
3 Use the Group By lists to select the columns you want to sort by and configure the group order for each (Ascending or Descending).
4 To enable users to change the grouping in the actual view, select the Show ‘Group By’ region at the top of the list option. If you do not select this option, users cannot group information in the view by dragging a column to the Group By region.
5 Click OK to apply your changes.
Setting the Default Sorting Order for a View
You can set the default sort order for a view. If necessary, the user can change the sorting order in the actual view.
To set the sorting order for a view:
1 In the Enterprise Layout pane, right-click the view you want and click Properties.
2 In the Properties dialog box, click the Sorting tab.
3 Use the Sort By lists to select the columns you want to sort by and configure the sort order for each (Ascending or Descending).
4 Click OK to apply your changes.
Chapter 4 • Managing a Group of Computers 93

Configuring the Server Information Pane
In a Server view, the Server Information pane can be configured to enable the user to manage a list of servers, including:
• Events
• Jobs
• Discovery details
• Custom properties
You can configure the tabs that are displayed in the Server Information pane. In the Server Information pane, its tabbed interface can be configured like a standard Control Center view. For general information about configuring standard views, see:
• “Setting the Column Layout of a View” on page 90
• “Setting the Default Filtering for a View” on page 91
• “Setting the Default Grouping for a View” on page 92
• “Setting the Default Sorting Order for a View” on page 93
To configure the Server Information pane:
1 In the Enterprise Layout pane, right-click the Server view you want and click Properties.
2 In the Properties dialog box, click the Server Information tab.
94 User Guide

3 Select a check box to display the corresponding tab, and click Properties to configure the tab.
4 Click OK to apply your changes.
For Do this
Events Select the Show Events check box (to show) or deselect (to hide) the Events tab.In the Server Information pane, the Events tab functions like an Event view. To configure its properties, click Properties.In addition, you can configure the Events tab to either:• Show parent events• Show child events. This is the default. Note that this
option enables the user to group by Parent Job ID.• Show split parent/child events.The Show event message on separate row option enables you to view the event message in a separate row that is displayed directly under the event. This option is enabled by default.
Jobs Select the Show Jobs check box (to show) or deselect (to hide) the Jobs tab.In the Server Information pane, the Jobs tab functions like a Job view. To configure its properties, click Properties.
Details Select the Show Details check box (to show) or deselect (to hide) the Details tab.
Custom Properties
Select the Show Custom Properties check box (to show) or deselect (to hide) the Custom Properties tab. For more information, see “Working with Custom Property Information” on page 81.
Chapter 4 • Managing a Group of Computers 95

Refreshing a View
To refresh the contents of a view, press CTRL+F7 then press F5.
Deleting or Renaming a Management Group or View
To delete or rename a management group or view from the Control Center Console:
In the Enterprise Layout pane, click to expand the management group or the view you want.
• To delete the view or management group, right-click to select Delete.
• To rename the view or management group, right-click to select Rename.
What’s Next?After you configure a management group with the computers you want to manage, you should:
• Configure a monitoring policy for the management group. For more information, see Chapter 8, “Monitoring by Policy”.
• Give users to access the management group. For more information, see the Administrator Guide for AppManager.
• Decide to implement one or more Service Map views. For more information, see Chapter 9, “Using Service Map Views”.
96 User Guide

Chapter 5
Running Monitoring Jobs
This chapter provides an overview of working with jobs.
About Knowledge Scripts and JobsIn AppManager, all management and monitoring tasks are facilitated through the use of Knowledge Scripts, which are programs that run on managed clients (servers and workstations). Knowledge Scripts can collect data, monitor for specific events, and perform specific actions in response to events. Each script is designed to perform a certain task or set of tasks, and to work on specific types of resources. A job is an instance of a Knowledge Script in the primary Control Center repository that has been replicated to the AppManager repository which runs the job on managed client computers with a matching resource. That is, when you run a Knowledge Script you are creating a job.
Knowledge Scripts are organized into categories, which are loosely connected to management groups in the Control Center Console. For example, SQL Knowledge Scripts that check database statistics are available in management groups that include the SQL and Master views; General Knowledge Scripts can be applied to all Windows-
97
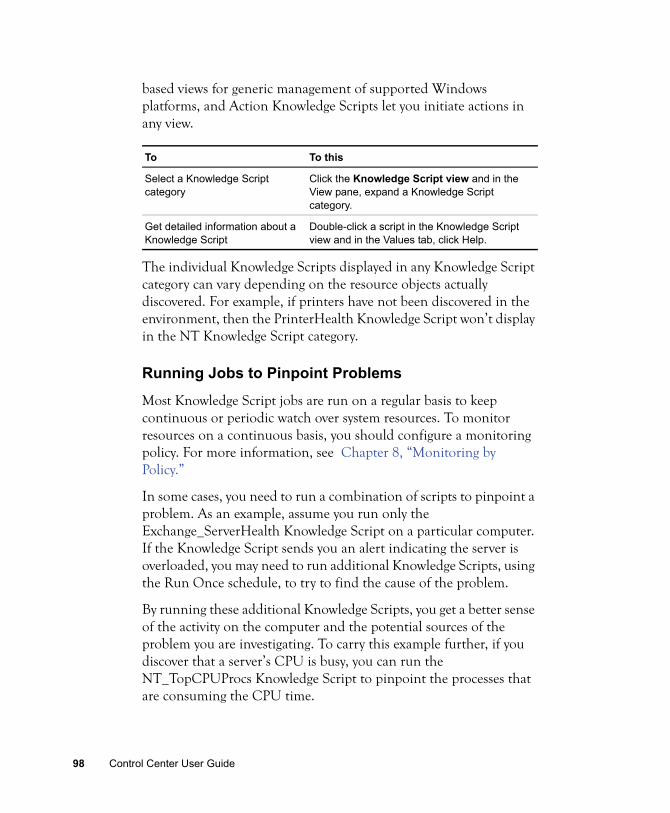
based views for generic management of supported Windows platforms, and Action Knowledge Scripts let you initiate actions in any view.
The individual Knowledge Scripts displayed in any Knowledge Script category can vary depending on the resource objects actually discovered. For example, if printers have not been discovered in the environment, then the PrinterHealth Knowledge Script won’t display in the NT Knowledge Script category.
Running Jobs to Pinpoint Problems
Most Knowledge Script jobs are run on a regular basis to keep continuous or periodic watch over system resources. To monitor resources on a continuous basis, you should configure a monitoring policy. For more information, see Chapter 8, “Monitoring by Policy.”
In some cases, you need to run a combination of scripts to pinpoint a problem. As an example, assume you run only the Exchange_ServerHealth Knowledge Script on a particular computer. If the Knowledge Script sends you an alert indicating the server is overloaded, you may need to run additional Knowledge Scripts, using the Run Once schedule, to try to find the cause of the problem.
By running these additional Knowledge Scripts, you get a better sense of the activity on the computer and the potential sources of the problem you are investigating. To carry this example further, if you discover that a server’s CPU is busy, you can run the NT_TopCPUProcs Knowledge Script to pinpoint the processes that are consuming the CPU time.
To To this
Select a Knowledge Script category
Click the Knowledge Script view and in the View pane, expand a Knowledge Script category.
Get detailed information about a Knowledge Script
Double-click a script in the Knowledge Script view and in the Values tab, click Help.
98 Control Center User Guide

Once you have identified the problem source, there are several things you can do to take appropriate action. For example, in this case you might:
• Spread out the CPU load so that the top CPU processes and users run at different times to reduce system load.
• Change the computer’s hardware configuration. In some cases, a computer may not have adequate or appropriate hardware for the tasks it runs. For example, there may be insufficient RAM or disk space. View the basic hardware information by examining the details on hardware resource objects.
When jobs that check general system health or a number of different resources report event conditions, investigate the event detail message and consider running additional, more specialized, jobs to find the real source of the problem and the best solution.
Parent and Child Jobs
When you create a Knowledge Script job, a parent job is created and a child job is created on each managed client computer. The number of child jobs created corresponds to the number of computers selected in the Objects tab of the job Properties dialog box. For example, if you run the Knowledge Script on one computer, one child job is created; if you run it on several computers, a child job is created for each one.
In the Control Center Console, you can group child jobs by Parent Job ID, but each child job must be updated individually to change its job properties such as monitoring values and schedule.
To monitor the overall health of your environment, you should configure a monitoring policy. One advantage of implementing a monitoring policy is that you can automatically configure changes to policy-based child jobs. For more information, see Chapter 8, “Monitoring by Policy.”
Chapter 5 • Running Monitoring Jobs 99

You cannot use the Control Center Console to modify the properties of a parent job. Note that you can use the AppManager Operator Console to modify an existing parent job and automatically apply those changes to all child jobs.
In the Job view, the View pane lists all child jobs for all parents. To view child jobs for a parent job, drag the Parent Job ID column to the Group By region. Child jobs are grouped by their parent job ID. Note that you cannot group child jobs by the parent job name.
Adding a Child Job to an Existing Parent
At this time, use the AppManager Operator Console to use an existing parent job to monitor additional resources.
Planning which Knowledge Scripts to Run
Each Knowledge Script runs on certain types of objects that correspond to the types of resource objects you see in the Details tab of the Server Information Pane. AppManager handles all of the appropriate type matching so you never have to worry about running the wrong type of Knowledge Script on a computer or resource.
In deciding which Knowledge Scripts to run, consider the critical resources in your environment, how servers and applications are distributed, potential system bottlenecks, and the breadth and depth of monitoring you want to do.
Unlike the Operator Console, Discovery Knowledge Scripts appear in any management group. However, ensure that you run Discovery Knowledge Scripts from a management group that is based on the Master view. You cannot run Discovery Knowledge Scripts in a management group that selects computers based on another AppManager view, such as the NT view, a server group, or a management group rule.
100 Control Center User Guide

Starting a New JobTo start a job:
1 In the Control Center Console, expand the Enterprise Layout pane to select a management group.
2 In the Server view, select a computer.
To select multiple computers, press Ctrl or Shift while making your selections.
3 In the Tasks pane, click Create a new job.
4 In the Knowledge Script Selection dialog box, select the Knowledge Script you want. If you are not sure which Knowledge Script you want, you can click a Knowledge Script to display a short description.
5 Click OK.
6 In the Properties dialog box, enter properties for the Knowledge Script. In many cases, you can simply use the default schedule and values. To make changes:
Click this tab To
Schedule Change the default schedule for running the job. For more information, see “Setting the Schedule” on page 102.
Values Adjust the threshold and other parameters for the job. For more information, see “Setting the Values to Monitor” on page 105 and “Setting Override Values” on page 107.
Actions Specify an action you want taken. For more information, see “Specifying One or More Corrective Actions” on page 116.
Chapter 5 • Running Monitoring Jobs 101

Any changes you make only affect this instance of the Knowledge Script job you are running. The default properties of the Knowledge Script are not affected.
Tip For more information about changing the default properties of a Knowledge Script, see “Changing Default Knowledge Script Properties” on page 128 or “Copying a Knowledge Script” on page 132.
7 After you finish reviewing or changing the parameters, click OK to start the jobs.
Setting the ScheduleAlthough all Knowledge Scripts have a default schedule, you can modify the schedule for any Knowledge Script job as needed. You can specify when the job should start, the interval (if any) at which the job should run, and when the job should stop. You can also schedule jobs to run on specific days and at set times, or to run only once.
To set the schedule for a job:
1 Display the Properties dialog box for the Knowledge Script job.
If the job is already running, double-click the job identifier in the Job view; or select the job, right-click, and then click Properties.
2 Click the Schedule tab.
Objects Modify the resource objects you want to run the job on. For more information, see “Selecting Objects to Monitor” on page 120.
Advanced Specify whether to filter temporary event conditions and whether to have duplicate events for this job collapsed into a single event or automatically acknowledged. Additionally, you can specify data collection options for this job. For more information, see “Setting Advanced Job Properties” on page 120.
Click this tab To
102 Control Center User Guide

Note The options for setting intervals, start and stop times, and daily frequency depend on the selected schedule.
3 Select a schedule type.
If you select Then
Run once Set a start time for the job to run once (see Step 4).
Regular intervals Set the interval (Every) — in hours, minutes, or seconds — and start and end times for the job (see Step 4).The interval controls how many times the job runs between the starting and ending time. For example, if you set a 10-minute interval with a start time of 10:00:00 PM and an end time of 10:59:00 PM, the job runs every 10 minutes — for a total of six times. (If the job takes more than 10 minutes to run, then it will run fewer times. For example, if the job takes 15 minutes to run, then it will run at 10:00:00 PM, 10:20:00 PM (the next scheduled interval), and 10:40:00 — for a total of three times.)
X number of times Set how often you want the job to run (Every) — in hours, minutes, or seconds. Set how many times you want the job to run (End after ___ Times).Then set a start time (see Step 4).
Daily schedule Set the daily interval (Every) you want the job to run. Then set start and end dates (see Step 4), and the frequency (see Step 5).
Weekly schedule Set the weekly interval (Every) and the days of the week you want the job to run. Then set start and end dates (see Step 4), and the frequency (see Step 5).
Chapter 5 • Running Monitoring Jobs 103

4 Set start and end date/times for the job. Available options depend on the schedule type you selected in Step 3.
5 Set the frequency for the job.
6 Click another tab to change its properties or click OK to start the job.
Note To prevent jobs from running on a Windows computer during scheduled maintenance periods, run the AMADMIN_SchedMaint Knowledge Script. On a UNIX agent,
Monthly schedule Set the monthly interval (Every) and the days of the month you want the job to run (On). Depending on the option you select in the On list, you can further refine your selection. For example, if you select a day of the week (such as Monday), you can further select the weeks in the month (such as The first Monday and The last Monday of the month). If you choose Selected Day, you can then select days in calendar format (such as 3 and 17, or L for the last day of the month). Then set start and end dates (see Step 4), and the daily frequency (see Step 5). Note For an AppManager job that is configured to run monthly on a particular weekend (such as first weekend, second weekend, etc.), a weekend constitutes a consecutive Saturday and Sunday that falls within the calendar month.
Asynchronous This option is selected for Knowledge Scripts that run asynchronously to monitor resources as changes occur.
For Select
Start (time or date) Now, or a date and time.
End (time or date) No end date, or a date and time.
To run the job Select
Once during the day Once and then set a start time.
At set intervals during the day Every. Then set the interval — in seconds, minutes, or hours — and a start and end time.
If you select Then
104 Control Center User Guide
use the AMAdminUNIX_SchedMaint Knowledge Script. For more information, double-click a Knowledge Script in the Knowledge Script view and click Help on the Values tab in the Properties dialog box.
Setting the Values to MonitorKnowledge Scripts have default threshold values or other parameters that control what they check and how they behave. The parameters associated with Knowledge Scripts varies, but typically includes:
• What the Knowledge Script does (for example, notifies you of event conditions, collects data for graphs and reports, or attempts to automatically restart services).
• The threshold values to watch for (for example, less than 10% free disk space or CPU utilization greater than 90%).
• The files, messages, and executables to monitor (for example, a list of processes that should be running, specific error messages in a log file, specific applications for which to monitor memory usage).
You can modify the parameter values, as needed.
In addition, you can add comments to an ad hoc job. Job comments enable you to organize and group ad hoc jobs and provide useful information about the ad hoc job to other console users. This option is not applicable for policy-based jobs or Knowledge Script Group-based jobs.
If you are creating an ad hoc job to monitor computers across AppManager repositories, you can configure different parameter values for each AppManager repository. However, policy-based jobs must be created with the same parameter values. Note that to resolve this issue, you can configure override values or configure different management groups for each repository.
Chapter 5 • Running Monitoring Jobs 105
To create an ad hoc job that runs on managed client computers in different repositories, the primary AppManager repository and each of the AppManager repositories must be running. You can create a policy-based job on managed client computers in different repositories when one of the non-primary repositories is not running. The policy-based jobs will be created when the repository is back online.
For more information, see Chapter 8, “Monitoring by Policy.”
To modify the parameter values:
1 Display the Properties dialog box for the Knowledge Script job.
If the job is already running, double-click the job identifier in the Jobs tab; or select the job, right-click, and then click Properties.
2 Click the Values tab.
3 To specify a comment for the job, enter a comment in the Comment field. This option is not applicable for policy-based jobs or Knowledge Script Group-based jobs. For more information, see “Viewing Job Comments” on page 138.
4 If you are monitoring more than one AppManager repository with Control Center, you can configure different parameter values for each AppManager repository by selecting the Adjust parameters separately for each repository option.
With this option selected, you can choose the repository you want and configure the parameter values for all computers managed by that repository. This option is not applicable for policy-based jobs or Knowledge Script Group-based jobs.
5 Click in the Value column to change threshold or monitoring parameter values. (Some fields have a Browse (...) button you can use to make selections.)
For specific information about the current Knowledge Script
106 Control Center User Guide

parameters, click Help in the dialog box.
6 Click another tab to change its properties or click OK to start the job.
Setting Override ValuesAs you gain experience in monitoring your environment, you may find that you want to use a custom property as an override value for a Values tab parameter rather than changing the parameter value for individual jobs.
Configuring overrides to a monitoring policy is particularly useful because initially you want to use the same parameter values for all policy-based jobs but over time, you may need to adjust monitoring thresholds for some computers in the policy.
You can configure an override for an ad hoc job, but this is not recommended because you can simply change the parameter value of an ad hoc job.
Note that you cannot use the AppManager Operator Console to view or configure override values for jobs. Use the Control Center Console to manage override values.
For more information, see the following topics :
• “Getting Started” on page 108
• “Enabling an Override for a Parameter” on page 109
• “Configuring an Override Value” on page 110
• “Viewing the Override Value for a Parameter” on page 112
• “Removing a Job Override” on page 113
Chapter 5 • Running Monitoring Jobs 107

Getting Started
To configure an override for a policy-based job:
1 Configure the Knowledge Script Group member to add a custom property as the override for the parameter value. The policy-based job will be configured to allow the user to assign a custom property value as the override value on each computer. The default parameter value will be used until you add a custom property value to one or more computers.
2 In the Server view, select the computers you want and in the Custom Properties tab of the Server Information pane, add a custom property value that corresponds to the custom property override. For more information, see “Working with Custom Property Information” on page 81.
For example, if you want to monitor total CPU usage, you can configure the NT_CPULoaded Knowledge Script with a default value for the Severity - Total system CPU parameter, and add a custom property, CPUEventOverride, as an override. When the policy-based job starts, the total CPU usage will be monitored using the default parameter value. If you notice that the total CPU usage on a particular server tends to exceed the threshold, add the CPUEventOverride custom property to the server and specify a custom property value that you want to use as the override value. If you have more than one server that is monitored by the same policy-based job, you can add the custom property value to multiple servers at the same time.
If you remove a custom property from a computer that is used as an override, any jobs on the computer that use the custom property are restarted to use the default parameter value.
108 Control Center User Guide

Enabling an Override for a Parameter
To override a parameter value on a policy-based job, specify a custom property override for a parameter without specifying an override value. After you enable the override on the Knowledge Script Group member, you can add a custom property to a computer to override the parameter value.
To enable an override for a parameter:
1 Display the Properties dialog box for the Knowledge Script Group member.
2 In the Values tab of the Properties dialog box, in the Override column, click the override selection (...) button on the value you want to override.
3 In the Select Override Value dialog box, select the custom property you want from the top of the list.
The list of available custom properties corresponds to custom properties with a matching data type. For example, if you want to override a parameter value that uses an integer, only custom properties with a data type of Integer are displayed.
4 Click New to create a new custom property that describes the parameter value you want to override.
5 Click Edit to change description of the selected custom property.
At this point, the custom property does not have a value and the default parameter value is used.
6 Click OK to close the Select Override Value dialog box.
7 In the Values tab of the Properties dialog box, the Override column is updated to indicate that a custom property override is configured. Note that this indicator does not specify whether an override value is configured.
To override the parameter value, add the custom property with an
Chapter 5 • Running Monitoring Jobs 109
override value to the managed client computer. For more information, see “Working with Custom Property Information” on page 81.
8 If you configure an Action for a Knowledge Script job, click the Action tab to configure exceptions for the Action Knowledge Script. In the Action tab, click the action you want and click Properties to configure the parameter values. In the Override column, click the override selection (...) button on the value you want to override.
Note The custom properties on the managed client computer are always used to configure the override value for an Action Knowledge Script. If you have configured an action to run on the management server, configure the custom property for the action on the managed client computer. Action Knowledge Scripts do not use custom property exceptions on the management server.
9 Click another tab to change its properties or click OK to start the job.
Configuring an Override Value
When you configure a Knowledge Script Group member, you can configure an override value for a parameter on a particular computer.
If you want to specify an override value for more than one computer, you may find it easier to simply enable a custom property override and let the user add the override custom property value to the servers. For more information, see “Enabling an Override for a Parameter” on page 109.
To specify an override value for a parameter:
1 Display the Properties dialog box for the Knowledge Script Group member.
2 In the Values tab of the Properties dialog box, in the Override column, click the override selection (...) button on the value you want to override.
110 Control Center User Guide

3 In the Select Override Value dialog box, select the custom property you want from the top of the list. The list of available custom properties corresponds to custom properties with a matching data type. For example, if you want to override a parameter value that uses an integer, only custom properties with a data type of Integer are displayed.
Or, click New to create a new custom property that describes the parameter value you want to override. After you create the custom property, select it from the list.
To change description of the selected custom property, click Edit.
4 To create an override value for the selected custom property, in the Selected Property Details, click New to add the override value you want.
5 In the Add Custom Property Value dialog box, select the repository where the server is managed, the server, and specify a value for the custom property.
6 When you finish, click OK. The custom property value is displayed in the Selected Property Details list.
7 Or, in the Selected Property Details list, select an existing value. You can click Edit to change the value of an existing custom property. If the selected custom property does not have a value, it is not displayed in the list.
The Jobs Where Custom Property Is Used As Override list displays a list of jobs that use the custom property.
8 Click OK to close the Select Override Value dialog box.
9 If you configured an Action for a Knowledge Script job, click the Action tab to configure exceptions for the Action Knowledge Script. In the Action tab, click the action you want and click Properties to configure the parameter values. In the Override column, click the override selection (...) button on the value you want to override.
Chapter 5 • Running Monitoring Jobs 111

Note The custom properties on the managed client computer are always used to configure the override value for an Action Knowledge Script. If you have configured an action to run on the management server, configure the custom property for the action on the managed client computer. Action Knowledge Scripts do not use custom property exceptions on the management server.
10 Click another tab to change its properties or click OK to start the job.
Any jobs that were updated to use a new override value are automatically updated with the override value.
Viewing the Override Value for a Parameter
In the Operator Console, the Values tab of the job Properties dialog box does not display override information.
In the Control Center Console, use the Values tab of the job Properties dialog box to view the override value for a parameter. Keep in mind:
• The Value column always displays the parameter value. If you have configured a custom property override, you also need to determine whether an override value is configured. If the override is enabled but does not have a value, the parameter value in the Values tab is used. If an override value is configured, the parameter value in the Values tab is not used.
• The Override column indicates whether an override parameter is configured. However, it does not display the actual override value. Keep in mind that you can configure an override parameter without an override value. In this case, the parameter value in the Values tab is used.
112 Control Center User Guide

To view the override value for a parameter:
1 In the Values tab of the job Properties dialog box, click the override selection (...) button.
2 In the Select Override Value dialog box, select the custom property that is configured as the override for the parameter. The custom property is not automatically selected.
3 In the Property Details list, find the computer to see its custom property value. Note that the list displays all computers that are configured with the custom property. If the computer is not in the list, you have not configured an override value for the custom property.
Tip To determine the actual value for a parameter, view the script logic of the job. For more information, see “Viewing the Actual Script for a Running Job” on page 136.
Removing a Job Override
You can remove a job override by:
• Removing the override in the monitoring policy. After you remove the override from the monitoring policy, the policy-based jobs will automatically use the default parameter value.
• Removing the custom property from the computers where you do not want to override the default parameter value. Note that if you restore the custom property to the computer, and the job is configured with a custom property override, the job automatically updates to use the custom property override value.
After you remove an override, the default parameter value is used.“Removing an Override from a Monitoring Policy” on page 114“Removing a Custom Property from a Computer” on page 114
Chapter 5 • Running Monitoring Jobs 113

Removing an Override from a Monitoring Policy
To update a monitoring policy to remove a custom property override, remove the custom property from the Knowledge Script Group member. After you update the Knowledge Script Group member, the corresponding policy-based jobs are updated to use the default parameter value, and the custom property value remains on the corresponding computers.
To remove an override from a monitoring policy:
1 Display the Properties dialog box for the Knowledge Script Group member.
2 Click the Values tab of the Properties dialog box.
3 In the Override column, right-click the override you want and click Remove. Note that the custom property value is not removed from the corresponding computers.
4 Click OK to save your changes. After you click OK, you cannot undo your change.
5 Click OK again to close the Properties dialog box.
The associated policy-based jobs are restarted with the default parameter value.
“Removing a Custom Property from a Computer” on page 114“Removing a Job Override” on page 113
Removing a Custom Property from a Computer
You can remove the parameter override for a particular job by removing the corresponding custom property from a computer. When removing a custom property from a computer, keep in mind that the custom property may be used by more than one job on the computer.
114 Control Center User Guide

To remove a custom property from a computer:
1 In the Server view, select the computer where you want to remove the custom property.
2 In the Custom Properties tab of the Server Information Pane, select the custom property and click Remove.
3 Any jobs on the computer that used the custom property as an override are automatically restarted to use the default parameter value.
Deleting the Custom Property From Selected Computers
If you are not sure which custom property you need to remove, or if you are not sure whether a custom property is used more than once on a computer, you can use the Select Override Value dialog box to determine where the custom property is used and delete the custom property from selected computers.
To delete a custom property:
1 Display the Properties dialog box for the Knowledge Script or Knowledge Script Group member.
2 In the Values tab of the Properties dialog box, in the Override column, click the override selection (...) button.
3 In the Select Override Value dialog box, select the custom property that is configured as the override for the parameter. The custom property is not automatically selected.
4 In the Property Details list, browse the list of computers to see where the custom property value is configured. Note that the list displays all computers that are configured with the custom property. If the computer is not in the list, you have not configured an override value for the custom property.
In the Jobs list, browse the list by job ID to see which jobs use the custom property.
Chapter 5 • Running Monitoring Jobs 115
5 In the Custom Properties Details list, select the custom property value on the appropriate computer and click Remove to remove the custom property from the computer.
6 Click OK. Click OK again to close the Properties dialog box.
The job is automatically restarted to use the default parameter value. Note that the custom property override is not removed from the job Properties dialog box. This allows you to override the default parameter value at a later time by adding the custom property value to the computer. If you do not want to enable the custom property override for the parameter, you should remove it. For more information, see “Removing an Override from a Monitoring Policy” on page 114.
Removing an Override from a Monitoring Policy.Removing a Job Override.
Specifying One or More Corrective ActionsAlmost all Knowledge Scripts can initiate responsive actions, such as sending e-mail, running an external program, or sending an SNMP trap. You define the conditions under which to perform the action and what action to take. For example, if you want to receive an e-mail when CPU utilization reaches 75% on a server, create a job that checks for a CPU threshold of 75% and specify an e-mail action.
Actions appear in the Actions category of the Knowledge Script view. Actions that can be run on a managed UNIX computer are prefixed with “UX”, for example Action_UXCommand. All other actions can be run on a managed Windows computer (including the management server or a proxy server). Note that some actions are application-specific, for example, the Action_IISPauseSite Knowledge Script must be run on an IIS server.
For discussion purposes, actions that can be run on a managed Windows computer are referred to as Windows actions and actions that can be run on a managed UNIX computer are referred to as UNIX actions.
116 Control Center User Guide

The Action Knowledge Scripts, such as Action_MAPIMail and Action_Messenger, have built-in severity filtering. Using the Severity Configuration parameters, you can now specify the range of severities you want the action to execute.
For more information about Action Knowledge Scripts, see the Help.
Understanding How Actions Work on Windows Computers
When monitoring a Windows computer, you can configure a job to initiate a different corrective action depending on when the event condition is detected. To do this, configure more than one Windows action and specify a different action schedule. Building upon the example in the previous section, when CPU utilization exceeds the threshold during business hours, an e-mail action runs; during non-business hours, a page action runs.
Use the AppManager Operator Console to configure the scheduled hours of operation for an action schedule. For more information, see the Operator Console User Guide for AppManager.
In addition, you can configure an action to run each time an event is raised, only when a duplicate event is created a specified number of times, or when the event condition no longer exists.
To configure a job to initiate a similar response depending on when the event condition is detected, make a copy of the action Knowledge Script and configure the job to run each action with the corresponding action schedule. For example, if CPU utilization exceeds the threshold during the week, an e-mail action (Action_MapiMail) sends an e-mail notification to the IT operator; if the threshold is exceeded on the weekend, an e-mail action (Action_MapiMailOnCallIT) sends an e-mail notification to the on-call IT operator.
Chapter 5 • Running Monitoring Jobs 117
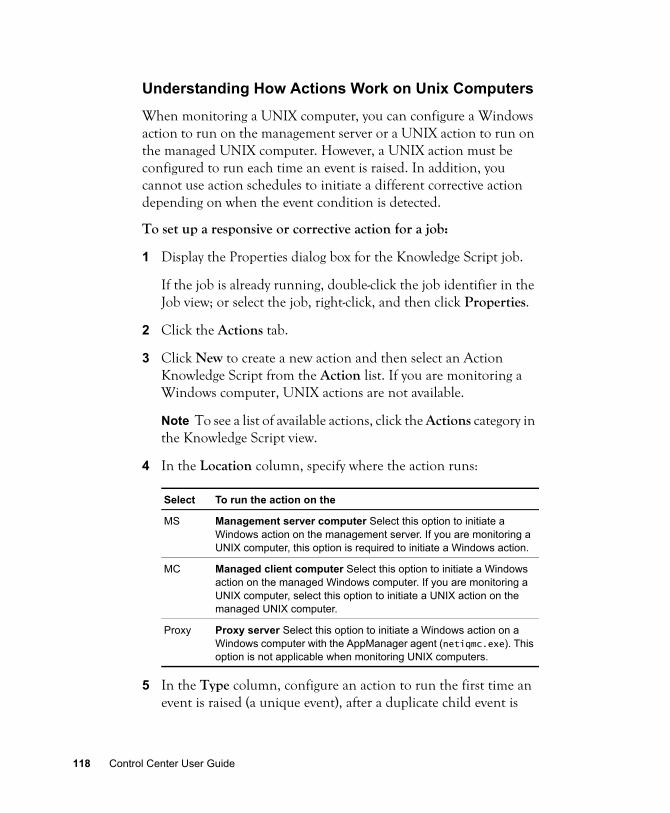
Understanding How Actions Work on Unix Computers
When monitoring a UNIX computer, you can configure a Windows action to run on the management server or a UNIX action to run on the managed UNIX computer. However, a UNIX action must be configured to run each time an event is raised. In addition, you cannot use action schedules to initiate a different corrective action depending on when the event condition is detected.
To set up a responsive or corrective action for a job:
1 Display the Properties dialog box for the Knowledge Script job.
If the job is already running, double-click the job identifier in the Job view; or select the job, right-click, and then click Properties.
2 Click the Actions tab.
3 Click New to create a new action and then select an Action Knowledge Script from the Action list. If you are monitoring a Windows computer, UNIX actions are not available.
Note To see a list of available actions, click the Actions category in the Knowledge Script view.
4 In the Location column, specify where the action runs:
5 In the Type column, configure an action to run the first time an event is raised (a unique event), after a duplicate child event is
Select To run the action on the
MS Management server computer Select this option to initiate a Windows action on the management server. If you are monitoring a UNIX computer, this option is required to initiate a Windows action.
MC Managed client computer Select this option to initiate a Windows action on the managed Windows computer. If you are monitoring a UNIX computer, select this option to initiate a UNIX action on the managed UNIX computer.
Proxy Proxy server Select this option to initiate a Windows action on a Windows computer with the AppManager agent (netiqmc.exe). This option is not applicable when monitoring UNIX computers.
118 Control Center User Guide

created a specified number of times, or when the event condition no longer exists. Note that a Unix action must be configured to run the first time an event is raised:
6 In the Schedule column, select an action schedule to specify the available hours during which the action can run. When monitoring UNIX computers, action schedules are not applicable.
For information about viewing and configuring the scheduled hours of operation for an action schedule, use the AppManager Operator Console to view the repository preferences. For more information, see the Operator Console User Guide for AppManager.
7 To set the properties for an Action Knowledge Script, select a Knowledge Script in the Action list and then click Properties.
Most actions require you to set some additional properties. For example, if you select an e-mail action, you need to specify an e-
Select To run an action
New event The first time an event is raised (a unique event). This is the default.Note A Unix action must be configured to run the first time an event is raised.
Repeat Event -n When the specified number of duplicate child events are created. The default value, 1, permits an action to be run each time a new duplicate child event is created. Specify the number of times that a new duplicate child event must be created in order to initiate an action. Note that if event collapsing is enabled, increments to the event count of a child event are not the same as a new duplicate child event. For example, if you have enabled event collapsing with the default interval of 20 minutes, when an event condition is first detected, a child event is created in the Events tab of the List pane. Subsequent events increment the event count until the 20 minute interval has passed. At this point, a new child event can be created.
Event Down When the event condition no longer exists. To use this option, check the box on the Advanced tab labeled Generate a new event when original event condition no longer exists.
Chapter 5 • Running Monitoring Jobs 119

mail recipient. For more information about Action Knowledge Scripts and their parameters, see the Help.
8 Click OK to close the Properties dialog box for the action Knowledge Script.
9 Click New to configure another action or click OK to start the job.
Selecting Objects to MonitorIf you run a Knowledge Script on an object that contains other objects (for example, a group that has multiple computers or a Disk folder that contains multiple disks on a single computer), the script runs by default on all the objects in the hierarchy that match the Knowledge Script type.
You can select the objects on which you want the job to run.
To select a subset of objects on which to run the Knowledge Script:
1 When you create the job, the Properties dialog box appears.
2 Click the Objects tab.
3 In the list of objects, de-select the objects you do not want the Knowledge Script to monitor. By default, all objects are selected.
4 Click another tab to edit its properties or click OK to start the job.
Setting Advanced Job PropertiesYou can specify advanced job properties to filter temporary event conditions. If an event is raised, you can configure the advanced job properties to collapse duplicate events or automatically close the event when the event condition no longer exists. Note that on UNIX computers, you cannot configure a job to automatically close the event.
There are additional options that you can use to configure data collection. For more information, see the following sections.
120 Control Center User Guide

Filtering Temporary Event Conditions
Specify criteria to filter temporary events by configuring the number of times that a duplicate event condition must be detected during a specified number of job iterations before an event is raised. An event condition is considered a duplicate when an event condition is detected on the same object name with the same event message, severity, and Job ID as a previous event condition.
For example, when the threshold for the number of duplicate event conditions is set to 3 and the number of job iterations is set to 5, if an event condition is detected each time the job runs, the first two event conditions are ignored and the third event condition raises an event and starts the time interval for event collapsing.
The next two event conditions that are detected during the interval are ignored—only two event conditions are detected during the interval, which falls below the threshold. The event condition count resets when the interval resets, after the fifth job iteration. In order to raise another event, a duplicate event condition must occur three times during the next five job iterations, and if event collapsing is enabled, the event must be generated within the time interval for event collapsing.
Ignored event conditions are not logged in the repository and do not increment the event count of the original child event. Actions associated with ignored event conditions are also suppressed.
To specify the number of times that an event condition must be detected during a specified number of job iterations to raise an event:
1 Display the Properties dialog box for the Knowledge Script job.
If the job is already running, double-click the job identifier in the Jobs tab; or select the job, right-click, and then click Properties.
2 Click the Advanced tab.
Chapter 5 • Running Monitoring Jobs 121

3 Enter criteria to specify a threshold for raising an event:
4 Click OK to start the job.
For Do this
Raise event if event condition occurs N times...
Enter a threshold for the number of times that a duplicate event must be detected during the specified job iterations before an event is raised. (The detected event conditions do not need to be consecutive.)
...within M iterations Enter the number of job iterations to specify the interval. The interval is reset after the given number of job iterations.The default for the number of duplicate events and job iterations are both 1, which means that duplicate events are not ignored and an event is raised each time an event condition is detected.
122 Control Center User Guide

Changing Event Collapsing Options for One Job
Sometimes a Knowledge Script job detects identical events. To suppress these duplicates and their specified actions, you can set event collapsing options. You can set these options globally, for all jobs, or for individual jobs. This section discusses how to set event collapsing options for each job you run.
Note For more information about duplicate events and global event collapsing options, see “What Are Duplicate Events?” on page 162.
To change the event collapsing options for a job:
1 Display the Properties dialog box for the Knowledge Script job.
If the job is already running, double-click the job identifier in the Jobs tab; or select the job, right-click, and then click Properties.
2 Click the Advanced tab.
3 Filter temporary event conditions by specifying the number of event conditions that must be detected during a specified number of job iterations. If an event condition is detected the specified number of times during the interval, an event is raised. For example, to configure a job to raise an event if the event condition is detected twice during an interval of five job iterations, set Raise an event if event condition occurs to 2 times within 5 job iterations.
See “Filtering Temporary Event Conditions” on page 121 for more information.
4 Select Collapse duplicate events into a single event.
Duplicate events are logged in the repository; however, actions associated with collapsed duplicate events, whether the actions are initiated on the managed client, management server, or proxy computer, are suppressed.
5 Set the Time interval for event collapsing.
Chapter 5 • Running Monitoring Jobs 123

The default time interval is 20 minutes.
Any duplicate events that were created within the time interval are collapsed into the original child event. The time interval can be measured from when the first event condition is detected or when the most recent event condition was detected.
6 Click OK to start the job.
Note Event collapsing options set on the Advanced tab in the Properties dialog box affect only the job you are about to run. To set global default event collapsing options for all Knowledge Scripts, use the Operator Console to set the AppManager repository preferences. For more information, see the Operator Console User Guide for AppManager.
Automatically Closing an Event When the Event Condition No Longer Exists
When you are monitoring a resource on a Windows computer that tends to raise events frequently, you can reduce the amount of time you spend managing these events by configuring the job to automatically close an event whenever the event condition no longer exists. This advanced option is not available when configuring a job to run on a UNIX computer.
The first time an event condition is encountered, a parent event and a child event are created; no additional events are raised as long as the event condition persists, and the event count for the child event does not increment. When the event condition no longer exists, a new event is created to indicate the change in the event condition and optionally, the original event is closed. This option can be set globally, for all jobs, or a particular job. This section discusses how to automatically close events for each job you run.
Note For more information about automatically closing events and global options, see “How Events Are Automatically Closed When the Event Condition No Longer Exists” on page 166.
124 Control Center User Guide

To automatically close events for each job you run:
1 Display the Properties dialog box for the Windows-based job.
2 If the job is already running, double-click the job identifier in the Jobs tab; or select the job, right-click, and then click Properties.
3 Click the Advanced tab.
4 Select Generate a new event when original event condition no longer exists. With this option selected, an event is raised when the event condition that initiated the original event no longer exists. Note that this option is not available when configuring a job to run on a UNIX computer.
With this option selected, you can specify the event severity when an event is raised in response to the change in the event condition. By default, the event severity is set to 20.
5 To close the original event when the event condition no longer exists, select Automatically close original event. Note that this option is not available when configuring a job to run on a UNIX computer.
6 Click OK to start the job.
Changing Data Collection Options for One Job
There are several data collection options that you can use to optimize how a Knowledge Script job collects data and specify whether data is flagged for upload to the NetIQ Analysis Center.
Note You do not need to flag AppManager data for upload to run report scripts and generate reports about AppManager data. For more information about uploading AppManager data to the Analysis Center, see the Analysis Center User Guide.
Chapter 5 • Running Monitoring Jobs 125
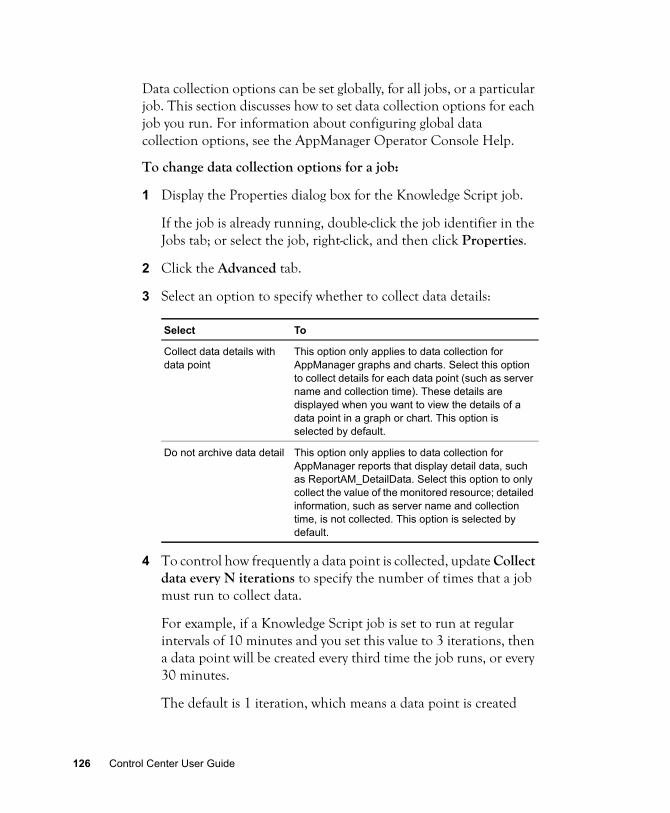
Data collection options can be set globally, for all jobs, or a particular job. This section discusses how to set data collection options for each job you run. For information about configuring global data collection options, see the AppManager Operator Console Help.
To change data collection options for a job:
1 Display the Properties dialog box for the Knowledge Script job.
If the job is already running, double-click the job identifier in the Jobs tab; or select the job, right-click, and then click Properties.
2 Click the Advanced tab.
3 Select an option to specify whether to collect data details:
4 To control how frequently a data point is collected, update Collect data every N iterations to specify the number of times that a job must run to collect data.
For example, if a Knowledge Script job is set to run at regular intervals of 10 minutes and you set this value to 3 iterations, then a data point will be created every third time the job runs, or every 30 minutes.
The default is 1 iteration, which means a data point is created
Select To
Collect data details with data point
This option only applies to data collection for AppManager graphs and charts. Select this option to collect details for each data point (such as server name and collection time). These details are displayed when you want to view the details of a data point in a graph or chart. This option is selected by default.
Do not archive data detail This option only applies to data collection for AppManager reports that display detail data, such as ReportAM_DetailData. Select this option to only collect the value of the monitored resource; detailed information, such as server name and collection time, is not collected. This option is selected by default.
126 Control Center User Guide

every time the job runs.
5 If you have configured the job to create a data point once during a specified interval, select Calculate average to create that data point as an average value of all data points measured during the interval. For example, if you configure the repository to collect a data point every 3rd time a job runs, and the data point for the first iteration is 2, the data point for the second iteration is 5, and the data point for the third iteration is 10, the data point is created on the third iteration and its value is 5.6666.
6 Select Start collecting data when an event is generated to begin collecting data when an event is raised. For example, if a Knowledge Script job is set to raise an event when CPU usage exceeds 70%, then the job will also start collecting data at that point.
Note The data header is always created when you start a job. If you select this option, the Graph Data tab of the Operator Console displays the data stream with the current number of data points, which may be zero (0) until an event occurs. The Control Center Console does not display graph data information.
7 If you have configured the job to begin collecting data when an event is raised, select Stop collecting data when the event condition no longer exists to stop collecting data when the event condition no longer exists. Following the previous example, the job will stop collecting data when CPU usage falls below 70%.
8 When you finish, click OK.
Chapter 5 • Running Monitoring Jobs 127

Customizing Knowledge ScriptsYou can change the default settings of a Knowledge Script or create a new Knowledge Script with the settings you want (see “Copying a Knowledge Script” on page 132).
Changes you make to schedule, monitoring values, actions, and advanced options can be propagated to running jobs. For more information, see the following sections for more information.
Changing Default Knowledge Script Properties
As you gain experience in monitoring your environment, you may find that you want to change the default properties for selected Knowledge Scripts rather than changing the parameter values for individual jobs.
Before changing the default threshold values or schedule for a Knowledge Script, you might want to:
• Run any Knowledge Scripts that collect data related to the threshold you want to change to determine a typical value for your environment.
• Run the Knowledge Script you want to change with the default values to evaluate whether you are seeing too many or too few events.
• Run one or more independent jobs with the values you want to use to test that the results are what you expect before changing the defaults.
Depending on your business needs, you may prefer to check the Knowledge Script out of the primary AppManager repository to make your changes. Checking out the Knowledge Script updates the version number of the Knowledge Script and updates its change history.
128 Control Center User Guide

To check the Knowledge Script out of the AppManager repository, right-click the Knowledge Script and click Check Out KS. To it back in, right-click the Knowledge Script and click Check In KS. For information about viewing version history, see “Getting Information about a Knowledge Script” on page 61.
After changing the default threshold values or schedule for a Knowledge Script, you should replicate the updated Knowledge Script to non-primary AppManager repositories managed by Control Center. See “Replicating a Knowledge Script” on page 131 for more information.
For information about propagating the Knowledge Script properties to existing jobs, see “Propagating a Knowledge Script to Ad Hoc Jobs” on page 130.
To change Knowledge Script properties:
1 In the Knowledge Script view, double-click the Knowledge Script you want to change.
2 In the Properties dialog box, click a tab and make your changes.
3 Click OK.
The changes are written to the primary AppManager repository. To apply the changes to other AppManager repositories managed by Control Center, replicate the Knowledge Script. For more information, see “Replicating a Knowledge Script” on page 131.
Chapter 5 • Running Monitoring Jobs 129

Propagating a Knowledge Script to Ad Hoc Jobs
You can update all ad hoc jobs or reports started by a particular Knowledge Script by propagating:
• The actual script logic.
• The Knowledge Script properties, including changes to schedule, monitoring values, override values, actions, and advanced options.
All corresponding jobs are stopped and restarted with the Knowledge Script properties. If you are managing more than one AppManager repository with Control Center, the propagation applies to all corresponding jobs across all AppManager repositories.
If you have configured an override value for a job parameter, the Knowledge Script propagation replaces the override value with the override value specified in the Knowledge Script, if one was specified. If an override value is not specified in the Knowledge Script, the default parameter value is propagated.
Before you propagate the Knowledge Script properties of a report, ensure that you have specified a value for all of the required parameters. For example, make sure you update a report script to include parameter values that are not displayed in the Values tab of the Knowledge Script Properties dialog box.
For information about propagating properties to monitoring jobs started by a Knowledge Script Group, see “Propagating a Knowledge Script Group Member to Ad Hoc Jobs” on page 208.
130 Control Center User Guide

To propagate a Knowledge Script to an Ad Hoc job:
1 In the Knowledge Script view, click the Knowledge Script you want and then click Properties Propagation > Ad Hoc Jobs.
2 In the Properties Propagation dialog box, select the components of the Knowledge Script that you want to propagate to associated ad hoc jobs:
3 When you finish, click OK.
Replicating a Knowledge Script
You can replicate a Knowledge Script from the primary AppManager repository, including its schedule, monitoring values, actions, and advanced options, to all of the AppManager repositories managed by Control Center.
Note that when you start a job, Control Center uses the Knowledge Script in the primary AppManager repository to create the job. However, the Knowledge Script itself is not automatically replicated.
Replicating a Knowledge Script from the primary AppManager repository to all of the repositories managed by Control Center enables:
• An Operator Console user to run the updated Knowledge Script on the corresponding repository.
• A Control Center administrator to maintain consistency between the Knowledge Scripts on the primary AppManager repository and the other AppManager repositories managed by Control Center. This consistency is particularly useful when you want to change the primary AppManager repository to another AppManager repository database.
Select To propagate
Script The logic of the Knowledge Script.
Properties The Knowledge Script properties, including schedule, monitoring values, actions, and advanced options.
Chapter 5 • Running Monitoring Jobs 131

At this time, manually replicate each Knowledge Script. You cannot automatically replicate all Knowledge Scripts.
To replicate a Knowledge Script:
1 In the Knowledge Script view, click the Knowledge Script you want to replicate and then click Replicate > Knowledge Script.
2 When you finish, click OK.
Copying a Knowledge Script
You can copy a Knowledge Script and then change its properties to create a new, customized Knowledge Script. The new Knowledge Script name cannot exceed 150 characters.
NetIQ Corporation recommends limiting the length of a Knowledge Script name to 145 characters or less. Limiting the length to 145 characters prevents AppManager from truncating the Knowledge Script job name when running the Knowledge Script from a monitoring policy, or as an ad hoc job started by a Knowledge Script Group. For more information, see “How Knowledge Script Groups Work” on page 200.
To copy a Knowledge Script:
1 In the Enterprise Layout Pane, click the appropriate Knowledge Script view.
2 Browse the list of Knowledge Scripts and select the Knowledge Script that you want to copy.
3 Right-click and then click Copy Knowledge Script.
132 Control Center User Guide

4 Enter a new name and description for the Knowledge Script. (By default, the phrase “CopyOf” has been appended to the Knowledge Script name to ensure that a new script is created.)
5 Click OK.
The new Knowledge Script is automatically checked into the primary AppManager repository.
6 In the Knowledge Script view, double-click the new Knowledge Script you just created.
7 In the Properties dialog box, make the changes you want in the Schedule, Values, Actions, or Advanced tabs.
8 Click OK to save the changes to the AppManager repository.
Note At this time, the Control Center Console does not allow you to view the version history of a Knowledge Script. However, when you copy a Knowledge Script, the version number of the Knowledge Script does not change and the history is lost. To change the version number and establish a version history, check the Knowledge Script out of the primary AppManager repository (by right-clicking the Knowledge Script to select Check Out KS) and then check it back in (by right-clicking the Knowledge Script to select Check In KS). For information about version history, see “Getting Information about a Knowledge Script” on page 61.
Checking a Knowledge Script into the Repository
To run a new or modified Knowledge Script, first check the Knowledge Script into the repository.
To Do this
Display the new Knowledge Script in the same category as the original script
Don’t change the prefix that appears before the underscore.
Create a new category for yourcustomized Knowledge Scripts
Type a new name before the underscore. For example, MySite_
Chapter 5 • Running Monitoring Jobs 133
NetIQ Corporation recommends limiting the length of a Knowledge Script name to 145 characters or less. Limiting the length to 145 characters prevents AppManager from truncating the Knowledge Script job name when running the Knowledge Script from a monitoring policy, or as an ad hoc job started by a Knowledge Script Group. For more information, see “How Knowledge Script Groups Work” on page 200 .
To check in a Knowledge Script into the AppManager repository:
1 In the Enterprise Layout Pane, click the appropriate Knowledge Script view.
2 Right-click and then click Check in KS.
3 Select the Knowledge Script you want, and click Open.
The new Knowledge Script is automatically checked into the primary AppManager repository.
To check a Knowledge Script out of the primary repository and copy it to your local computer, right-click the Knowledge Script you want from the Control Center Console and click Check Out KS.
134 Control Center User Guide

Checking and Changing Job StatusOnce a job is started, it typically goes through the following states in its life cycle:
This status Indicates
Pending A temporary state when a job is first started or when you temporarily stop and restart a job. If a job stays in this state for very long, it may indicate a network communication problem or that a managed computer has been shut down.Click the + (plus sign) next to a parent job to see additional status details on child jobs:
Start - The job is in the process of starting.
Stop - The job is in the process of stopping.
Running The job has been started, but may or may not be actively executing its monitoring functions.Click the + (plus sign) next to a parent job to see additional status details on child jobs:
Active - The job is currently running on the managed client, monitoring computer resources according to the schedule and parameters you have set. Any corrective actions you have defined for the job occur automatically when the event condition is met.
Scheduled - The job has not yet started executing its monitoring functions. Monitoring takes place according to the schedule you have set.
Inactive - The job is currently inactive due to scheduled maintenance. When the maintenance period is over, the job will resume running according to the schedule you have set. (To prevent jobs from running during scheduled maintenance periods, run the AMADMIN_SchedMaint Knowledge Script. For more information about this Knowledge Script, double-click it and then click Help on the Values tab in the Properties dialog box.
Stopped The job has run to completion or has been stopped manually.
Closed The job is no longer in use but is still available for historical purposes and can be re-opened in the future.
Error A job has run into a problem (for example, an error in the managed client's runtime configuration that prevented the job from running properly).
Chapter 5 • Running Monitoring Jobs 135

Viewing Jobs in the Job View
Click the Job view to get more details on all jobs, including the current status of each job, whether the job was started by a Knowledge Script Group or was started by a monitoring policy, where the job is running, the name of the Knowledge Script being run, and the time the job was submitted.
The Job view lists all child jobs. You can group by Parent Job ID by dragging the column header to the Group By field.
Viewing the Actual Script for a Running Job
To view the actual script that is running on a computer:
1 In the Job view, double-click a child job to view its job Properties dialog box.
2 Click the View KS button .
Changing the Sorting Order
You can click any of the headings in the Job view to sort all parent entries in that field or toggle the sorting order preference. For example, jobs in the Job view are normally sorted by job ID in ascending order. To sort the job list by Knowledge Script, click the Knowledge Script header. To reverse the sorting order from ascending to descending, click the Knowledge Script header again.
Changing Job Status
You can change the status of a particular job or all jobs running on an object in the Job view.
For a particular job, you can click the job traffic light icon in the Jobs tab in the List pane. Clicking a running job stops it; clicking a stopped job, restarts it. You can attempt to restart a job with an Error status, but if the job still encounters an error, the status will return to Error.
136 Control Center User Guide
To temporarily stop a particular job and restart it:
1 In the Job view, click the green traffic light icon to the left of the Running status for the job you want to stop.
The status (and icon) changes to Pending (yellow) and then to Stopped (red).
2 When you are ready to restart the job, click the red traffic light icon to the left of the Stopped status.
The status (and icon) changes to Pending (yellow) and then to Running (green).
Stopping a Job
To stop a job:
1 In the Job view, click the green traffic light icon to the left of the Running status for the job you want to stop.
The status (and icon) changes to Pending (yellow) and then to Stopped (red).
Restarting a Job
To restart a job:
1 In the Job view, click the red traffic light icon to the left of the Stopped status for the job you want to restart.
The status (and icon) changes to Pending (yellow) and then to Running (green).
Note You can attempt to restart jobs with an Error status; however, if the job still encounters an error, the status will return to Error.
Chapter 5 • Running Monitoring Jobs 137

Changing Properties of a Running Job
To change the properties of a job that is running:
1 In the Job view, in the Job or Status columns, double-click the job to open the Properties dialog box.
Note Clicking or double-clicking the traffic light icon changes the status of a Running job to Stopped; it doesn’t open the properties dialog box.
2 Change the properties you want in any tab of the dialog box (for example, modify the schedule, set a new threshold value, or modify the list of objects that the job monitors).
3 Click OK.
The job is temporarily changed to a pending state and then resumes running with the new properties.
Viewing Job Comments
Job comments are added by console operators and administrators and usually include information about the job, for example, information about why the monitoring values of the job were changed.
This information can be added to the properties of an ad hoc job. In the Control Center Console, you can group jobs by job comment information. Job comments are not applicable to policy-based jobs or jobs started by a Knowledge Script Group.
138 Control Center User Guide
To view a job comment:
• In the Values tab of the job Properties dialog box. The latest comment appears in the Comments field. To view all of the comments for the job, click the History button.
The Job Comment History dialog box displays the comment information for the job along with information about when the comment was made and who created the comment.
You can delete job comments from the Job Comment History dialog box by clicking the comment you want and clicking Delete.
• In the Comments column of the Job view. Note that this column is not displayed by default. For information displaying this column, see “Setting the Column Layout of a View” on page 90.
Adding Comments to a Job
Adding comments to a job allows you to record and share information with other console operators and administrators. You cannot add comments to a policy-based job.
When you add comments to a job, the job is automatically restarted. After the job is restarted, the comment information is displayed in the Comments field.
To add comments to a job:
1 In the Values tab of the job Properties dialog box, use the Comments field to enter the text (up to 256 characters) you want saved with the job. You can also specify an URL to create a hyperlink to a web site.
2 Click OK to apply your changes and close the dialog box.
After you click OK, the job is automatically restarted.
Chapter 5 • Running Monitoring Jobs 139

Initiating Maintenance on a ComputerIn many environments, you may need to perform unscheduled maintenance on a computer. For example, an organization may have an Apache Web server that must be shut down immediately. In this case, you can temporarily block all jobs, events, and data for a particular computer, including jobs that remotely monitor a computer, by placing the computer in machine maintenance mode.
If you intend to shut down a computer that is managed by AppManager, it is always a good idea to enable machine maintenance before you shut the computer down. In some cases, as the computer is shutting down, a monitoring job may error out because the resource that the job monitors is not available.
You must manually enable and disable machine maintenance on the computer. The only exception is when you enable maintenance on a computer and replace it with a clone. Because the clone does not have any information about its machine maintenance status, when the computer is brought online and communicates with the
Maintenance options
How it works
Machine maintenance
• Administrator manually enables and disables machine maintenance on a Windows or UNIX agent.
• Machine maintenance blocks all monitoring jobs for a computer, including jobs that remotely monitor the computer.
• Machine maintenance does not require the agent to be running to enable or disable maintenance mode.
• Machine maintenance does not block AMAdmin jobs, for example, the AMAdmin_DBHealth Knowledge Script.
Scheduled maintenance
• Schedule a maintenance period on a Windows agent using the AMAdmin_SchedMaint Knowledge Script. On a UNIX agent, use the AMAdminUNIX_SchedMaint Knowledge Script.
• Requires the agent to be running to configure, start, and stop maintenance for the specified period.
• Blocks a particular Knowledge Script category or all Knowledge Scripts monitoring the computer, including jobs that remotely monitor the computer.
140 Control Center User Guide

management server, after about 5 minutes, the management server will automatically disable machine maintenance on the computer. Alternatively, you can manually remove the machine maintenance from the clone computer.
To enable machine maintenance on a computer, in the Server view, right-click a computer and then click Set Maintenance Mode. The status of the Maintenance column changes to indicate the computer is In Maintenance.
To disable machine maintenance and resume all monitoring jobs, in the Maintenance column of the Server view, right-click to select a computer and then click Clear Maintenance Mode.
Note if a managed client computer is in maintenance mode, a deployment task configured to run on the computer will run at its scheduled time. Enabling maintenance mode on a managed client computer does not prevent the deployment task from running. However, updated discovery information for installation package will not appear in the Control Center Console until after you disable maintenance mode.
Grouping and Filtering Job InformationBy default, AppManager displays all of the jobs in your environment in list form, with each job as a separate entry. Although this provides complete information, as you add more jobs you may want to organize your jobs into groups, or filter the information displayed to make jobs easier to work with. For example, you may want to organize jobs by where they are running or when they were submitted, or limit the jobs displayed to those running on a specific computer or associated with a specific Knowledge Script.
Chapter 5 • Running Monitoring Jobs 141

Organizing Jobs into Groups
To organize jobs into groups:
1 In the Job view, drag the column you want to group by into the Group By field, for example, by Computer or Knowledge Script.
Once you make your selection, job information is folded into groups as specified.
2 To expand the detailed job information for any group, click the + (plus sign) to the left of the group.
Filtering the List of Jobs
You can select to show or hide jobs in the Job view based on columnar data. For example, you might want to hide Running jobs because you are mostly concerned about Stopped jobs. Later, if you want to view Running jobs, you can select to show them.
To filter the list of jobs:
1 In the Job view, click the Filter button on the column you want to filter. If you select an existing filter, the information in the Job view is immediately filtered based on the filter properties.
2 If you are creating a custom filter, the Custom Autofilter dialog box displays.
3 For Operator:
4 For First Criteria, enter the filtering criteria you want to use or click the Browse (...) button to see a list of possible values.
If you select Then
Submit Time Select an operator (for example, greater than > or less than <).
ComputerKnowledge ScriptUser
Leave the default operator (=).
142 Control Center User Guide

If you select Submit Time, use the format set in the Regional Settings Properties in the Windows Control Panel (the default format for English (United States) is mm/dd/yyyy h:mm:ss).
If you want to use the asterisk (*) wildcard character, make sure the operator is set to Like or Not Like. At this time, asterisk (match any) is the only supported wildcard character.
5 To add additional filtering criteria, select AND or OR from the Logical Operator list. Then select an operator and the second filtering criteria (click the Browse (...) button to see a list of possible values).
6 Click OK.
The Job view is filtered according to the criteria you have specified; the new filter is added to the List menu.
Note The possible values for both the first and second criteria are based on the filter option you select. For example, if you select Computer, the possible values for both criteria are Windows computer names. If you want to create a filter that combines filtering options – for example, a filter that displays the jobs on the computer Shasta (Computer) and submitted after a certain date (Submit Time) – use a combination of filters.
To disable filtering:
1 In the Job view, click the Filter button on the filtered column.
2 Select (All) to disable filtering.
Chapter 5 • Running Monitoring Jobs 143

Viewing Job ResultsJobs can generate information about:
• The actual job, such as status and Job ID
• Action, such as status and when the action was submitted
• Event, such as status and severity
• Data, for charts and reports
View Jobs in the Job View
To quickly see where jobs are running in your environment, view jobs in the Job view.
View Results in the Server Information Pane
Use the tabs in the Server Information pane to view results. Note that you cannot view graph data information from the Control Center Console.
The Server Information pane is only available from a Server view that is configured to display at least one of the following the tabs:
Closing a JobTo close a job:
Click this tab For information about the
Events Events generated by a Knowledge Script job. Double-click an event identifier to get more information about the event, to add comments, or view any detailed messages provided by the Knowledge Script job.
Jobs Status of jobs. Double-click a job identifier to get more information about the job and to add comments.
Custom Properties Custom properties information about the servers in your Control Center environment. For more information, see “Working with Custom Property Information” on page 81.
144 Control Center User Guide

1 In the Job view, select the job you want to close.
If the job is hidden, check to see if a filter is applied to column in the job list. If the Filter button is Blue, a filter is applied. Click the button and click ALL to remove the filter and show the hidden job.
To select multiple jobs, press Ctrl or Shift while making your selections.
2 Right-click your selection and click Close.
The job continues to be displayed in the Jobs tab, allowing you to access it for historical purposes. You can also re-open the job to use the same parameters at a later time (there’s no need to re-enter any information). If you restart the job, it has the same job ID number it originally had.
To close all jobs on an application server:
1 In the Server view, right-click a computer in the list and click Close Jobs.
All jobs on the server are closed.
Chapter 5 • Running Monitoring Jobs 145

Deleting a JobYou can delete pending, stopped, or closed jobs. When you delete a job, the job and its events and graph data is deleted from the AppManager repository.
Note You can configure each AppManager repository to maintain events and graph data, however, do so from the AppManager Operator Console. At this time, you cannot configure AppManager repository preferences from the Control Center Console. For more information, see the Operator Console User Guide for AppManager.
To delete a job:
1 In the Job view, select the job you want to delete.
If the job is hidden, check to see if a filter is applied to column in the job list. If the Filter button is Blue, a filter is applied. Click the button and click ALL to remove the filter and show the hidden job.
To select multiple jobs, press the Ctrl or Shift keys as you make your selections.
2 Right-click and then select Delete.
146 Control Center User Guide

Chapter 6
Responding to Events
This chapter provides an overview of how events are triggered by AppManager jobs and how to view and respond to them in the Control Center Console.
How Events Are RaisedWhen you create a Knowledge Script job, the parameters you set on the Values tab in the Properties dialog box indicate what you want the job to do. If you want the job to send an alert or notify you in some way when a particular condition exists, set the Event parameter to y (yes). As a Knowledge Script job runs, it checks whether the condition you have defined exists – for example, whether a threshold value has been exceeded or a particular process is down.
If a Knowledge Script detects a problem and the Event parameter is set to y, the job triggers an event, which is:
• Logged in the AppManager repository.
• (In most cases) displayed in the form of an event alert in an Event view of the Control Center Console.
In this state, the event is considered Open, requiring your attention.
147

Event Severity LevelsBecause some jobs check for serious problems that can severely impact your business while others simply provide informational feedback, events range in severity. The event indicators displayed in the Event view of the Control Center Console reflect at a glance the relative severity of the problem.
In AppManager, events are classified as follows:
You can change the severity levels to better reflect your system management policies.
Event severity levels are configured as an AppManager repository preference and at this time, cannot be configured from the Control Center Console. Use the AppManager Operator Console to configure AppManager repository preferences. For more information, see the Operator Console User Guide for AppManager.
Severity level Indicator What it means (typically)
SevereLevels 1 to 10(default)
Red There is a very serious problem that requires your attention (for example, a computer or service is down). The Severe event indicator flashes on the event entry in the Event view.
WarningLevels 11 to 20(default)
Yellow There is unexpected behavior or minor problems that may require your attention, but they are not affecting network up time or preventing users from doing their work (for example, a counter you want to monitor or an application you want to discover is not found on the selected computer).
Informational Levels 21 to 30(default)
Blue A task was successfully completed (for example, a service is successfully restarted or a discovery is completed).
DiagnosticLevels 31 to 40(default)
Magenta Diagnostic information is returned (for example, when debugging problems).
148 Control Center User Guide

Calculating Event Severity in the Server View
Control Center displays the most severe event in the View pane for the Server view under a management group.
You can configure the same server to be associated with two different management groups which are associated with two different views. For example, you can add a server group to a management group associated with SQL view and to another management group associated with NT view.
The severity of events in both the views could be different for the same server group. If you select the server view under the Master management group, the view pane displays the most severe event for the server across all views. However, if the server is a member of any of the other management groups, and you select the server under those management groups, the view pane displays the most severe event only for the selected view. For example, if there are no events for the management group associated with the SQL view, but there are severe events associated with the NT view for the same server, then the view pane against NT view displays the most severe event and the view pane against the SQL view displays the OK status.
You can view all the events and their severity in the Server Information pane.
Viewing EventsTo see a list of events generated by Knowledge Script jobs, click an Event view in a management group. If you are currently in the Master management group, the Event view lists all events.
You can also view events in a Servers or Service Map view, if it is configured to display the Events tab in the Server Information pane. When viewing events in a Servers or Service map view, the Server Information pane displays all event information for the selected object while the selected server or service map view object reflects the event status for the most severe Open event.
Chapter 6 • Responding to Events 149

Grouping and Filtering Event InformationBy default, Control Center displays all of the events in your environment in list form, with each event as a separate entry. Although this provides complete information, as you add more events you may want to organize your events into groups, or filter the information displayed to make events easier to work with. For example, you may want to organize events by Status or Severity Level.
Organizing Events into Groups
To group events, the Event view must be configured to enable the Group By field. For more information, see “Setting the Default Grouping for a View” on page 92.
1 In the Event view, drag the column you want to group by into the Group By field, for example, by Status or Severity.
Once you make your selection, event information is folded into groups as specified.
2 To expand the detailed event information for any group, click the + (plus sign) to the left of the group.
Filtering the List of Events
Filtering events removes events from the list but doesn’t delete the event information. For example, you might want show or hide events in the Event view based on their status so they don’t clutter up the list of events you are currently interested in.
150 Control Center User Guide
1 In the Event view, click the Filter button on the column you want to filter and select a filter.
If you select an existing filter, the information in the Events tab in the List pane is immediately filtered based on the filter properties.
2 If you are creating a new filter, the Custom Autofilter dialog box displays.
3 For Operator:
4 For First Criteria, enter the filtering criteria you want to use or click the Browse (...) button to see a list of possible values.
If you select Submit Time, use the format set in the Regional Settings Properties in the Windows Control Panel (the default format for English (United States) is mm/dd/yyyy h:mm:ss).
If you want to use the asterisk (*) wildcard character, make sure the operator is set to Like or Not Like. At this time, asterisk (match any) is the only supported wildcard character.
Select To do this
All Display all values.
Custom Create a custom filter.
Blank Display null severity values.
Non-Blank Display non-null severity values.
If you select Then
Submit Time Select an operator (for example, greater than > or less than <).
ComputerKnowledge ScriptUser
Leave the default operator (=).
Chapter 6 • Responding to Events 151

5 To add additional filtering criteria, select AND or OR from the Logical Operator list. Then select an operator and the second filtering criteria (click the Browse (...) button to see a list of possible values).
6 Click OK.
The Event view is filtered according to the criteria you have specified; the new filter is added to the List menu.
Note The possible values for both the first and second criteria are based on the filter option you select. For example, if you select Parent Severity, the possible values for both criteria are severity level numbers. If you want to create a filter that combines filtering options – for example, a filter that displays the events on the computer Shasta (Computer) with a severity less than five (Parent Severity) – use a combination of list filters.
Viewing Events
The Event view lists event information. The first event generated by a particular job creates a parent and child event entry. The parent event information is listed in the Parent Event pane at the top of the View pane.
Child event information is listed in the Child Event pane at the bottom of the View pane. Subsequent events from the same job are then listed under the same parent event, and an event count keeps track of how many event occurrences are generated. (The count for the parent entry is the sum of the counts for the child entries.)
To Do this
View child events for a parent event
Click a parent event in the Parent Event pane to displays its child event entries in the Child Event pane.
View all child events for more than one parent event
Press Ctrl or Shift while making your selections in the Parent Event pane to display their child event entries in the Child Event pane.
152 Control Center User Guide

Changing the Sorting Order
You can click any of the headings in the Event view to sort all event entries in that field or toggle the sorting order preference. For example, events in the Event view are normally sorted by when they last occurred and in ascending order. To sort the event list by severity, click the Severity header. To reverse the sorting order from ascending to descending, click the Severity header again.
Viewing Details about an EventThe Event Properties dialog box includes more information (such as when the event first occurred and the user running the job) than the summary information listed in the Child Events pane.
1 In the Event view, select the parent event you want from the Parent Events pane.
2 In the Child Events pane, double-click a child event entry; or right-click the event, and then click Properties.
3 In the Details tab of the Properties dialog box, acknowledge or close the event by selecting the appropriate check boxes. (Closing an event automatically acknowledges it. Once an event is closed, it can then be deleted.) Then click Apply.
4 Use the Up and Down buttons to browse through events as they appear in the Child Events pane; if the event is not displayed in the Child Events pane, you cannot view the event properties from here.
Depending on the Knowledge Script and the event, additional tabs may be included to display even more information.
For information about See page
Viewing event actions (Action tab) 154
Viewing event comments (Comments tab) 154
Adding comments to an event (Comments tab) 155
Chapter 6 • Responding to Events 153

Viewing Event Actions
When events are detected, Knowledge Scripts can initiate a variety of actions, such as sending a page or e-mail, running an external program, or sending an SNMP trap.
If you have defined an action for a Knowledge Script job and the action was performed, the Event Properties dialog box includes an Action tab, which tells you when the action was performed and its current status (for example, complete or in error).
1 In the Event view, select the parent event you want from the Parent Events pane.
2 In the Child Events pane, double-click a child event entry; or right-click the event, and then click Properties.
3 Click the Action tab.
4 Use the Up and Down buttons to browse through events as they appear in the Child Events pane; if the event is not displayed in the Child Events pane, you cannot view the event from here.
Viewing Event Comments
Event comments are added by console operators and administrators and usually include information about what caused the event or how it was resolved. An event comment can include a hypertext link, and you can click the link to jump to the corresponding URL.
Note If you have configured an AppManager Report Script to raise an event upon successful completion, the event comment can include a hyperlink to the actual report. For information about how to configure Report Script event comments to include a hyperlink to the actual report, see “Running Reports” on page 169.
154 Control Center User Guide

In the list of events in the Event view, you can quickly see if an event has a comment.
To view a comment:
1 In the Event view, select the parent event or child event you want and then click Properties.
2 Click the Comments tab.
3 Child event comments can be viewed, but not added or edited, from the parent event. In the Comments tab of the parent event, select the child entry from the Event list. Event entries with comments appear in the list and are identified by their Event number.
4 Use the Up and Down buttons to browse through events as they appear in the Child Events pane; if the event is not displayed in the Child Events pane, you cannot view the event from here.
Adding Comments to an EventAdding comments to an event allows you to record and share information with other console operators and administrators about what caused the event or how you resolved the problem.
Comments can be added to parent and child events, individually.
This indicator Means
There is no comment information for the event entry; or in the case of a parent event, for any of its child events.
There is comment information for this entry; or in the case of a parent event, for at least one child event.
Chapter 6 • Responding to Events 155

To add comments to an event:
1 In the Event view, select the parent event or child event you want and then click Properties.
2 Click the Comments tab.
3 Enter the text (up to 256 characters) you want saved with the event. You can also specify an URL to create a hyperlink to a web site.
4 Click Apply or click OK to apply your changes and close the dialog box.
When you add a comment to an event, the Comment indicator in the Events tab in the List pane changes. For more information, see “Viewing Event Comments” on page 154.
5 Use the Up and Down buttons to browse through events as they appear in the Child Events pane; if the event is not displayed in the Child Events pane, you cannot view the event from here.
Grouping and Filtering EventsBy default, the Control Center Console displays all events in list form, with the events associated with each job as a separate parent entry. In some cases, you may want to organize events into groups or filter the information displayed based on some criteria. For example, you may want to organize events by severity, or limit the events displayed to those found on a specific computer or associated with a specific Knowledge Script.
156 Control Center User Guide

Organizing Events into Groups
1 In the Event view, drag the column you want to group by into the Group By field, for example, by Severity or Status.
Once you make your selection, event information is folded into groups as specified.
2 To expand the detailed event information for any group, click the + (plus sign) to the left of the group.
Filtering the List of Events
You can select to show or hide events in the Event view based on columnar data. For example, you might want to hide Acknowledged events because you are mostly concerned about Open events. Later, if you want to view Acknowledged events, you can select to show them.
1 In the Event view, click the Filter button on the column you want to filter.
If you select an existing filter, the information in the Event view is immediately filtered based on the filter properties.
2 If you are creating a custom filter, the Custom Autofilter dialog box displays.
3 For Operator:
4 For First Criteria, enter the filtering criteria you want to use or click the Browse (...) button to see a list of possible values.
If you want to use the asterisk (*) wildcard character, make sure the
If you select Then
Parent Severity Select an operator (for example, greater than > or less than <).
ComputerKnowledge ScriptParent Message
Leave the default operator (=).
Chapter 6 • Responding to Events 157

operator is set to Like or Not Like. At this time, asterisk (match any) is the only supported wildcard character.
5 To add additional filtering criteria, select AND or OR from the Logical Operator list. Then select an operator and the second filtering criteria (click the Browse (...) button to see a list of possible values).
6 Click OK.
The Event view is filtered according the criteria you have specified; the new filter is added to the List menu.
Note The possible values for both the first and second criteria are based on the filter option you select. For example, if you select Parent Severity, the possible values for both criteria are severity level numbers. If you want to create a filter that combines filtering options – for example, a filter that displays the events on the computer Shasta (Computer) with a severity less than five (Parent Severity) – use a combination of filters.
To disable filtering:
1 In the Event view, click the Filter button on the filtered column.
2 Select (All) to disable filtering.
Changing the Status of an EventOnce a Knowledge Script detects a problem and generates an event, it is added to the Event view as an Open event.
To respond to an Open event and changes its status, you need to either acknowledge or close the event. How you use the Acknowledged or Closed status depends on your system management policies. In general, you can acknowledge an event to indicate you are aware of the problem or that the problem is being addressed; then close it when the problem has been resolved.
158 Control Center User Guide
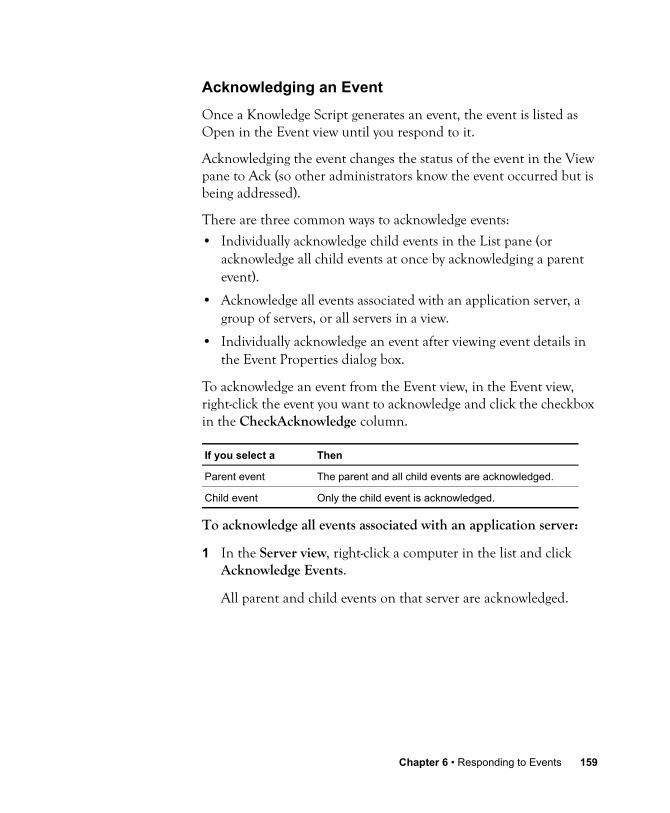
Acknowledging an Event
Once a Knowledge Script generates an event, the event is listed as Open in the Event view until you respond to it.
Acknowledging the event changes the status of the event in the View pane to Ack (so other administrators know the event occurred but is being addressed).
There are three common ways to acknowledge events:
• Individually acknowledge child events in the List pane (or acknowledge all child events at once by acknowledging a parent event).
• Acknowledge all events associated with an application server, a group of servers, or all servers in a view.
• Individually acknowledge an event after viewing event details in the Event Properties dialog box.
To acknowledge an event from the Event view, in the Event view, right-click the event you want to acknowledge and click the checkbox in the CheckAcknowledge column.
To acknowledge all events associated with an application server:
1 In the Server view, right-click a computer in the list and click Acknowledge Events.
All parent and child events on that server are acknowledged.
If you select a Then
Parent event The parent and all child events are acknowledged.
Child event Only the child event is acknowledged.
Chapter 6 • Responding to Events 159

To acknowledge an event from the Event Properties dialog box:
1 In the Event view, select the parent event or child event you want and then click Properties.
2 In the Event Properties dialog box, select Acknowledge.
3 Click Apply or OK.
Closing an Event
There are 3 common ways to close an event:
• Individually close child events in the List pane (or close all child events at once by closing a parent event).
• Close all events associated with an application server, a group of servers, or all servers in a view.
• Individually close an event after viewing event details in the Event Properties dialog box.
When you have resolved the problem that caused an event, you can then close the event. You don’t need to acknowledge an event before closing it. (However, to prevent accidental deletion of open or unresolved events, close an event before it can be deleted.)
Note To configure a job to automatically close an event when the event condition no longer exists, see “Automatically Closing an Event When the Event Condition No Longer Exists” on page 124.
160 Control Center User Guide

To close an event from the Event view, the event you want to close and then click the check box in the CheckClose column for the event you want to close.
To close all events associated with an application server:
1 In the Event view, drag the Computer column into the Group By field.
Once you make your selection, event information is folded into groups as specified.
2 Right-click a computer from the list and then click Close Events.
All parent and child events are closed.
To close an event from the Event Properties dialog box:
1 In the Event view, select the parent event or child event you want and then click Properties.
2 In the Event Properties dialog box, select Close.
3 Click Apply or OK.
If you select a Then
Parent event The parent and all child events are closed.
Child event Only the child event is closed.
Chapter 6 • Responding to Events 161

Deleting an Event
To delete Closed events:
1 In the Event view, select the event you want to delete.
To select multiple events, press the Ctrl or Shift keys as you make your selections.
2 Press the Delete key; or right-click and then click Delete Event.
Note When you select multiple events, you can delete, acknowledge, or close all of the events at once. If you attempt to delete multiple events, and there are still Open or Acknowledged events in your selection, those events are not deleted. To delete an Open or Acknowledged event, first close the event by clicking the CheckClose column in the list.
What Are Duplicate Events?The first event generated by a job creates both a parent entry and a child event entry. Subsequent events from the same job are listed as additional child event entries under the parent event, and an event count keeps track of how many child events are generated. (The count for the parent entry is the sum of the count for each child entry.)
A Knowledge Script job might detect unique events (for example, events with a different severity or message, as shown above), or identical events. An event is considered identical, or a duplicate, when a new Open child event with the same object name, event message, severity, and Job ID as a previous event occurs. Just like unique events, duplicate events are logged in the repository and, if event collapsing is not enabled, are listed as additional child event entries under the parent event. Actions, if specified, are initiated for each duplicate event.
162 Control Center User Guide

Although duplicate events are typically valid, it usually isn’t useful to receive multiple alerts caused by the same problem or condition. In addition, you probably do not want these identical events to initiate duplicate actions, such as repeated e-mail notification or messenger dialog boxes.
To filter temporary event conditions (not just collapse them), you can specify the number of duplicate event conditions that must be detected during a specified number of job iterations before an event is raised. This option is useful in reducing the number of trivial events reported to the management server. Filtered event conditions are not logged in the repository and do not increment the event count of the original child event. Actions associated with ignored events are also suppressed.
After an event is raised, subsequent duplicate events can then be collapsed into a single event. Instead of creating new child event entries, duplicate events are collapsed into the original child event and the child event count is increased. The duplicate events are logged in the repository; however, actions associated with collapsed duplicate events, whether the actions are initiated on the managed client or management server computer, are suppressed.
Duplicate events are collapsed within a specified time interval (the default is 20 minutes). The event collapsing time interval can be configured to begin:
• When the first event is raised. All duplicate events within the time interval (static period of time) will be collapsed into one event.
• Each time an event is generated (it is not a static period of time). For example, using the default time of 20 minutes, if a job generates duplicate events every five minutes, then the 20-minute interval is restarted every five minutes, which means it never effectively expires – unless you set an option to have events ignored.
Chapter 6 • Responding to Events 163

After the original child event is closed, or after the event collapsing time interval expires, a new child event is created and an action on the management server computer, if one is specified, is initiated when an event condition is detected.
Event collapsing options can be configured globally (so that they apply to all Windows-based Knowledge script jobs) and for individual Windows-based jobs. For more information about where to set the options for all jobs or an individual job, see the notes at the end of this section.
Here is an example of how event collapsing works when a job detects a problem and raises an event and continues to detect the same condition every 5 minutes for a total of 12 identical events.
Without event collapsing enabled, a parent entry and 12 child entries are listed. The count for each child entry is 1; the count for the parent entry is 12. All 12 events are logged in the repository and 12 instances of the specified action are initiated.
With event collapsing enabled but without ignoring events (using the default values of 20 minutes for Time interval for event collapsing and the event condition must occur 1 time during 1 iteration), the first event creates a parent entry and one child entry, and begins the 20-minute time interval. Because the duplicate events take place at five-minute intervals, the 20-minute event collapsing interval never expires (it restarts after each duplicate event). And, because the number of events and the number of job iterations is set to 1, duplicate events are not ignored; instead, each is collapsed into the initial child entry.
A parent entry and one child entry is listed; the count for each is 12. All 12 events are logged in the repository but only one instance of the specified action is initiated.
With event collapsing enabled and with events ignored (using 20 minutes for Time interval for event collapsing and the event condition must occur 5 times within 5 job iterations), the first four events are ignored. The fifth event generates a parent entry and one
164 Control Center User Guide

child entry, and begins the 20-minute time interval. The next four events (six through nine) take place during the 20-minute interval and are ignored. The next event (ten) generates a new child event and restarts the time interval and the job iteration interval. The eleventh and twelfth events are ignored.
A parent entry and two child entries are listed. The count for each child entry is 1; the count for the parent entry is 2. Only the two listed child events are logged in the repository and their actions initiated. The other events and actions are ignored.
Notes• You can configure a job to either collapse duplicate events or
automatically close events when the event condition no longer exists; you cannot do both. See “How Events Are Automatically Closed When the Event Condition No Longer Exists” on page 166 for more information.
• For information about changing event collapsing options for individual Windows-based jobs, see “Changing Event Collapsing Options for One Job” on page 123.
Setting Global Event Collapsing Options
At this time, use the Operator Console to configure AppManager repository preferences to set global, default event collapsing options for all Knowledge Script jobs. For more information, see the Operator Console Help.
Chapter 6 • Responding to Events 165
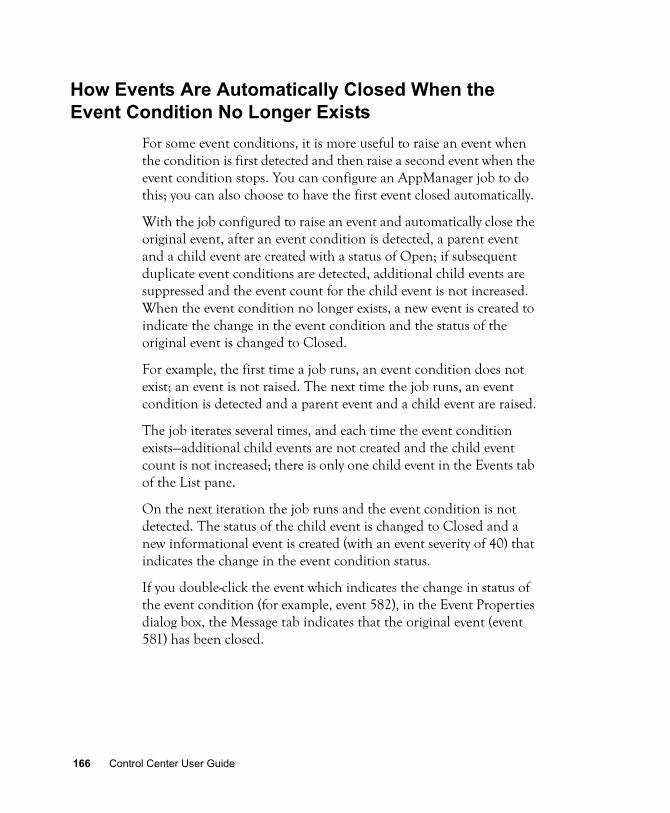
How Events Are Automatically Closed When the Event Condition No Longer Exists
For some event conditions, it is more useful to raise an event when the condition is first detected and then raise a second event when the event condition stops. You can configure an AppManager job to do this; you can also choose to have the first event closed automatically.
With the job configured to raise an event and automatically close the original event, after an event condition is detected, a parent event and a child event are created with a status of Open; if subsequent duplicate event conditions are detected, additional child events are suppressed and the event count for the child event is not increased. When the event condition no longer exists, a new event is created to indicate the change in the event condition and the status of the original event is changed to Closed.
For example, the first time a job runs, an event condition does not exist; an event is not raised. The next time the job runs, an event condition is detected and a parent event and a child event are raised.
The job iterates several times, and each time the event condition exists—additional child events are not created and the child event count is not increased; there is only one child event in the Events tab of the List pane.
On the next iteration the job runs and the event condition is not detected. The status of the child event is changed to Closed and a new informational event is created (with an event severity of 40) that indicates the change in the event condition status.
If you double-click the event which indicates the change in status of the event condition (for example, event 582), in the Event Properties dialog box, the Message tab indicates that the original event (event 581) has been closed.
166 Control Center User Guide

If the Knowledge Script job detects the event condition again, a new child event is created.
Notes• To automatically close an event when the original event condition
no longer exists, configure the job to raise an event with a specified event severity level each time the event condition is not detected. This event is for informational purposes only and its event severity should be set accordingly. To prevent the parent event from having an Open status when the original event is Closed, you can use the Operator Console to configure the AppManager repository preferences to automatically close all open events based on severity level. For more information, see the Operator Console User Guide for AppManager.
• You can configure a job to either automatically close events when the event condition no longer exists or collapse duplicate events; you cannot do both. For information about event collapsing, see “What Are Duplicate Events?” on page 162.
• To configure an individual job to automatically close an event when the event condition no longer exists, you can do so from the Advanced tab in the Knowledge Script Properties dialog box. For more information, see “Automatically Closing an Event When the Event Condition No Longer Exists” on page 124.
• Use the Operator Console to set global, default options for automatically closing an event when the event condition no longer exists. For more information, see “Setting Global Options for Automatically Closing Events When the Event Condition No Longer Exists” on page 168.
Chapter 6 • Responding to Events 167

Setting Global Options for Automatically Closing Events When the Event Condition No Longer Exists
At this time, use the AppManager Operator Console to set global options for all jobs. For more information, see the Operator Console Help.
168 Control Center User Guide

Chapter 7
Running Reports
This chapter describes how to use the standard reports provided with NetIQ AppManager.
Understanding AppManager ReportingAppManager reports include data in tabular and graphical format from an AppManager repository database. Examples of the types of AppManager reports include:
• Performance-related reports to help you understand the performance of your applications and systems.
• Trend analysis reports to help you plan for system or application upgrades.
• Service level agreement reports to quantify the availability of services and service response time.
• Event summary reports to provide an overview of the events being created by AppManager so that you can develop a plan of action.
• Configuration reports, to provide an overview of the system details being monitored and configuration details, such as event threshold settings.
AppManager reports use the same Knowledge Script-based mechanism that you use to run monitoring jobs that collect data and raise events.
169

An AppManager report queries data from a single AppManager repository. At this time you cannot report on data from more than one AppManager repository in the same report. To report on AppManager data from more than one AppManager repository in the same report, use AppManager Analysis Center. For more information, see the Analysis Center product documentation.
AppManager reports include application-specific reports and generic reports. For more information, see the following sections.
About Application-specific Reports
AppManager reports are included with some Knowledge Script categories to provide application-specific reporting. Application-specific reports are included with the corresponding application Knowledge Scripts and are prefixed by Report_. For example, in the Knowledge Script view of the Control Center Console, the Report_CPULoad report appears in the NT Knowledge Script category.
Application-specific reports only use data collected by a particular Knowledge Script. To extend the previous example, the Report_CPULoad Report Script only reports on data collected by the NT_CPULoaded Knowledge Script.
To determine the data source for a report, double-click the Report Script you want and in the Values tab of the Properties dialog box, click Help to display the Help.
Application-specific reports only include data from standard out-of-the-box Knowledge Scripts and do not include data from copies of Knowledge Scripts. For information about reporting on data collected by a copy of an AppManager Knowledge Script, see the “Reporting on Data Collected by a Copy of a Knowledge Script” on page 185.
170 Control Center User Guide

About Generic Reports
Generic reports are located in the ReportAM category of the Knowledge Script view.
Generic reports enable you report on a variety of areas, including:
• Performance information Includes reports on average hourly and daily values, most recent values, or values by computer or data stream.
• Job and event information Includes reports that list events by computer, monitored application, Knowledge Script, and event status and severity.
• Application information Includes reports on your AppManager installation and discovered applications on your managed computers.
• Hardware information Includes reports on some of the hardware components on your computers, provides an overview of network interfaces (including the manufacturer, IP address, and subnet mask), logical and physical disks (including used and free space), and printers (including port and driver information).
AppManager Control Center also includes best practice reports. These reports are recommended for all customers and are located in the StartPoint category. For complete information about the StartPoint and ReportAM AppManager reports, including information about the data source for a report, see the Help.
Understanding How Appmanager Reports Work
An AppManager report consists of a Report Script that runs on the AppManager report agent. The report agent is an extension of the AppManager agent and is responsible for:
• Querying an AppManager repository database
• Generating the HTML-based report
Chapter 7 • Running Reports 171

To run a report, the AppManager report agent must be:
• Installed and discovered. Note that the report agent is not automatically discovered during installation. Use the Discovery_ReportAgent Knowledge Script to discover the report agent.
• Configured to have an AppManager repository as a data source. By default, the AppManager report agent installation process configures a single AppManager repository as the data source for the report agent. After installation, you can configure the report agent to report on data in additional repositories, however, this is not recommended.
NetIQ Corporation recommends that you use a separate report agent for each repository data source, and install each report agent on a dedicated server. For more information, see the Installation Guide for AppManager. Here are some considerations:
• Although you can configure a report agent to have more than one data source, at this time, an AppManager report can only include data from a particular AppManager repository. An AppManager report cannot include data from more than one AppManager repository.
• Depending on the amount of information in each report and the number and frequency of reports you run, the report agent can consume significant system resources.
Discovering the Appmanager Report Agent
When installing the AppManager Windows agent, the AppManager setup program includes an option to install the report agent. The AppManager setup program does not automatically install the report agent.
172 Control Center User Guide

After you install the report agent, discover it by running the Discovery_ReportAgent Knowledge Script. If you have not discovered a report agent, the Knowledge Script view of the Control Center Console does not display the ReportAM category or application-specific Report Scripts.
For information about installing and discovering the AppManager report agent, see the Installation Guide for AppManager.
Rediscover the report agent to:
• Update the list of Knowledge Script categories upon which you want to report. For example, if you discover the report agent and then discover a new Knowledge Script category, such as IIS, rediscover the report agent to run IIS reports. See “Understanding How Appmanager Reports Work” on page 171 for more information.
• Update the repository data source for a report agent. At this time, it is not recommended that a report agent be configured with more than repository data source.
To view the details for an AppManager report agent:
1 In the Control Center Console, expand the Enterprise Layout pane to select a management group that contains the report agent computer.
2 In a Server view, click the report agent computer.
3 In the Details tab, expand the list of details to view report agent information.
In particular, the details include the AppManager repository with which the report agent communicates. If you are not sure which report agent you need, use the details to find the correct report agent.
4 Under Report Agent > AM Repositories, the repository data source is displayed with a list of available Knowledge Script categories on which you can report.
Chapter 7 • Running Reports 173
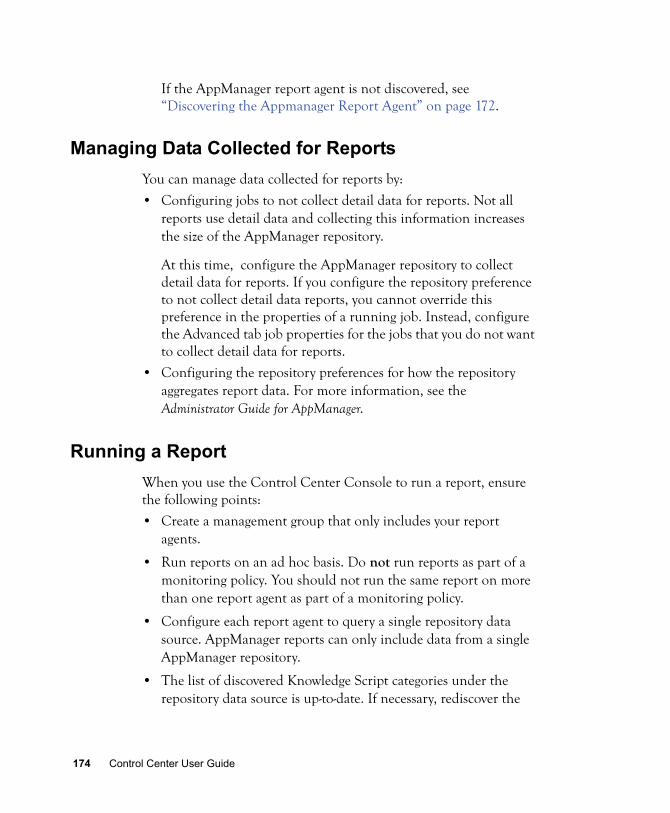
If the AppManager report agent is not discovered, see “Discovering the Appmanager Report Agent” on page 172.
Managing Data Collected for ReportsYou can manage data collected for reports by:
• Configuring jobs to not collect detail data for reports. Not all reports use detail data and collecting this information increases the size of the AppManager repository.
At this time, configure the AppManager repository to collect detail data for reports. If you configure the repository preference to not collect detail data reports, you cannot override this preference in the properties of a running job. Instead, configure the Advanced tab job properties for the jobs that you do not want to collect detail data for reports.
• Configuring the repository preferences for how the repository aggregates report data. For more information, see the Administrator Guide for AppManager.
Running a ReportWhen you use the Control Center Console to run a report, ensure the following points:
• Create a management group that only includes your report agents.
• Run reports on an ad hoc basis. Do not run reports as part of a monitoring policy. You should not run the same report on more than one report agent as part of a monitoring policy.
• Configure each report agent to query a single repository data source. AppManager reports can only include data from a single AppManager repository.
• The list of discovered Knowledge Script categories under the repository data source is up-to-date. If necessary, rediscover the
174 Control Center User Guide

report agent to update the list of Knowledge Script categories upon which you can report.
• The data you want to report on is in the AppManager repository. If you want to report on data collected by a new Knowledge Script job, make sure the job runs at least once and is configured to collect data. Not all Knowledge Scripts are configured by default to collect data.
• At a minimum, configure a report to identify the data streams and time frame you want. Most reports do not have a default configuration that will generate a report.
• If you have more than one report agent, configure the report to select the report agent with the correct repository data source. If you attempt to run a Report Script on more than one report agent, the report runs on the first selected report agent in the Objects tab of the job Properties dialog box.
• Run reports on the report agent from a management group that you have configured to select the Master view or the Report view. If you run a report from a management group that is not configured with the Master or Report view as one of its members, you cannot see the reports in the list of available Knowledge Scripts.
Starting a Report
Starting a report is similar to starting a Knowledge Script job. See “Starting a New Job” on page 101 for more information.
To start a report:
1 In the Control Center Console, expand the Enterprise Layout pane to select a management group that contains the report agent you want.
Make sure the report agent is configured to report on the repository database where you want to run the report. Use the Details tab of the Server Information Pane to verify the repository
Chapter 7 • Running Reports 175

with which the report agent communicates.
2 In the Knowledge Script view of the management group, click to expand the categories and browse reports.
3 To start a report, right-click a Report Script and click Create a new job.
4 In the Server Selection dialog box, select the report agent computer.
5 Click OK.
6 In the Properties dialog box, select a tab to configure its properties:
To Create Do this
An application-specific report Expand a Knowledge Script category and select a report from the list. Reports are prefixed with Report_.
A generic report Expand the ReportAM category and select a report from the list.
Click To
Schedule Configure the default schedule for running the report. See “Setting the Schedule” on page 177.
Values Configure the parameters of the report. For information about the report, including the data source for the report and information about the configuring the parameters in the Values tab, click Help to display the Help. In most cases, you cannot use the default values. See “Setting the Report Values” on page 178 for more information.
Actions Configure an action to run, for example, after the report completes successfully. You can use the Action_SMTPMailRpt Knowledge Script to email the first page of a report. The first page contains hyperlinks to the other pages in the report. To run this action, first configure the URL mapping parameter on the report agent. For information about the Action_SMTPMailRpt Knowledge Script, see the Help.
176 Control Center User Guide
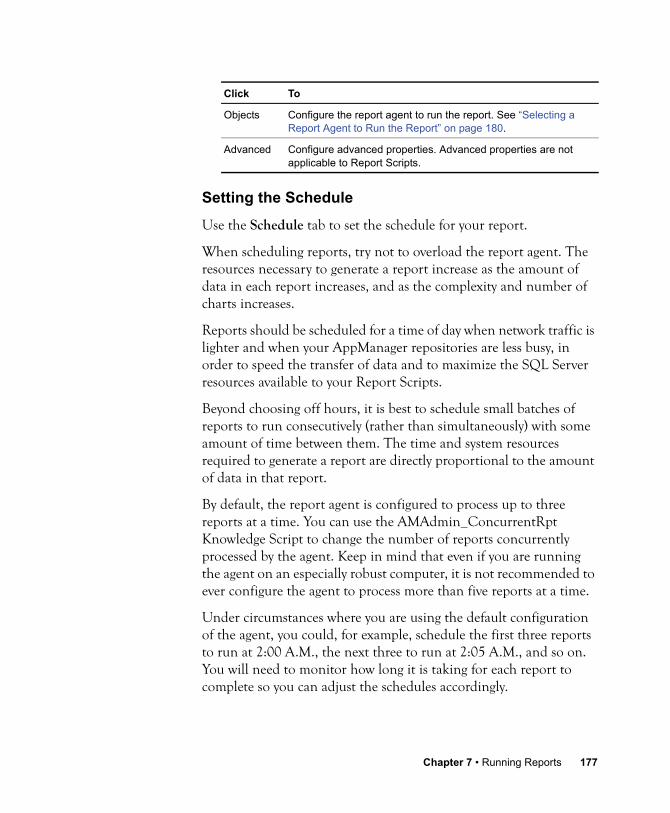
Setting the Schedule
Use the Schedule tab to set the schedule for your report.
When scheduling reports, try not to overload the report agent. The resources necessary to generate a report increase as the amount of data in each report increases, and as the complexity and number of charts increases.
Reports should be scheduled for a time of day when network traffic is lighter and when your AppManager repositories are less busy, in order to speed the transfer of data and to maximize the SQL Server resources available to your Report Scripts.
Beyond choosing off hours, it is best to schedule small batches of reports to run consecutively (rather than simultaneously) with some amount of time between them. The time and system resources required to generate a report are directly proportional to the amount of data in that report.
By default, the report agent is configured to process up to three reports at a time. You can use the AMAdmin_ConcurrentRpt Knowledge Script to change the number of reports concurrently processed by the agent. Keep in mind that even if you are running the agent on an especially robust computer, it is not recommended to ever configure the agent to process more than five reports at a time.
Under circumstances where you are using the default configuration of the agent, you could, for example, schedule the first three reports to run at 2:00 A.M., the next three to run at 2:05 A.M., and so on. You will need to monitor how long it is taking for each report to complete so you can adjust the schedules accordingly.
Objects Configure the report agent to run the report. See “Selecting a Report Agent to Run the Report” on page 180.
Advanced Configure advanced properties. Advanced properties are not applicable to Report Scripts.
Click To
Chapter 7 • Running Reports 177

To set the schedule for a report:
1 Display the Properties dialog box for the Report Script job.
If the report is already running, double-click the job identifier in the Jobs tab of the Server Information pane; or select the job, right-click, and then click Properties.
2 Click the Schedule tab and set the report schedule.
For information about the scheduling options, see “Setting the Schedule” on page 102 or click the Help button to display the Help.
3 Click another tab to change its properties or click OK to start the job.
Setting the Report Values
Reports have default parameters that control how they select and display data. Typically, configure the Values tab to specify the data source and time frame.
If you do not select a data source and configure a time frame, your report will raise an event indicating there was “No data for report.”
For reports that display data in graphical format, you may also need to select a chart type. For information about selecting a chart type, see the Report Script Help.
In general, you should plan to develop a strategy for organizing reports so they can be easily viewed in the Report Viewer and in the Operator Web Console. You can configure a report with properties that can be sorted, including Author, Component, Company, and Custom Fields. For more information, see “Tips for Configuring Reports” on page 183.
178 Control Center User Guide
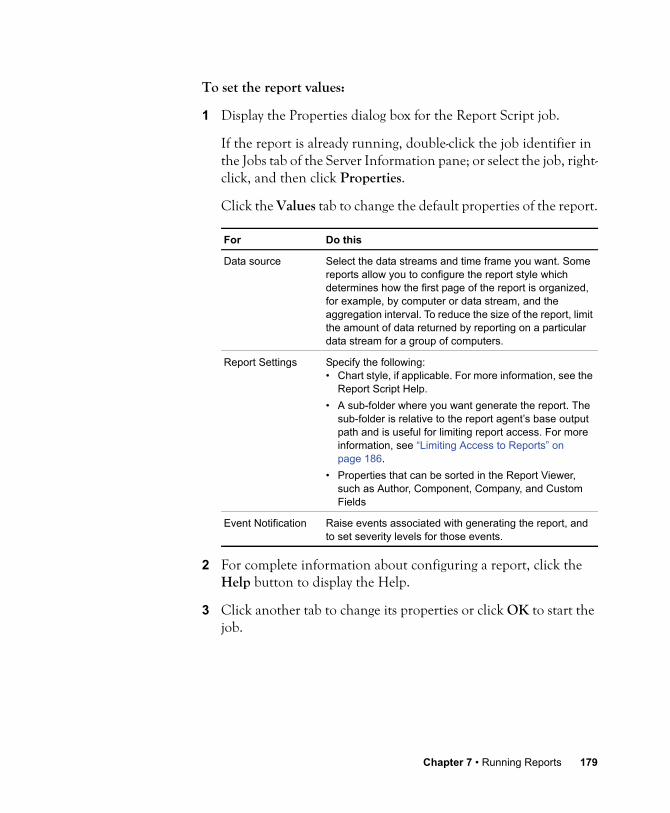
To set the report values:
1 Display the Properties dialog box for the Report Script job.
If the report is already running, double-click the job identifier in the Jobs tab of the Server Information pane; or select the job, right-click, and then click Properties.
Click the Values tab to change the default properties of the report.
2 For complete information about configuring a report, click the Help button to display the Help.
3 Click another tab to change its properties or click OK to start the job.
For Do this
Data source Select the data streams and time frame you want. Some reports allow you to configure the report style which determines how the first page of the report is organized, for example, by computer or data stream, and the aggregation interval. To reduce the size of the report, limit the amount of data returned by reporting on a particular data stream for a group of computers.
Report Settings Specify the following:• Chart style, if applicable. For more information, see the
Report Script Help.• A sub-folder where you want generate the report. The
sub-folder is relative to the report agent’s base output path and is useful for limiting report access. For more information, see “Limiting Access to Reports” on page 186.
• Properties that can be sorted in the Report Viewer, such as Author, Component, Company, and Custom Fields
Event Notification Raise events associated with generating the report, and to set severity levels for those events.
Chapter 7 • Running Reports 179

Selecting a Report Agent to Run the Report
When you run a Report Script, the Objects tab of the job Properties dialog box displays a list of available report agents and data sources.
• Make sure each report agent is configured to query a single repository data source. AppManager reports can only include data from a single AppManager repository.
• Make sure the list of discovered Knowledge Script categories under the repository data source is up-to-date. If necessary, rediscover the report agent to update the list of Knowledge Script categories upon which you can report. See “Discovering the Appmanager Report Agent” on page 172 for more information.
• Make sure that the data you want to report upon is in the AppManager repository. If you want to report on data collected by a new Knowledge Script job, make sure the job runs at least once and is configured to collect data. Not all Knowledge Scripts are configured by default to collect data.
• If you have more than one report agent, be sure to configure the report to select the report agent with the correct repository data source. If you attempt to run a Report Script on more than one report agent, the report runs on the first selected report agent in the Objects tab of the job Properties dialog box.
180 Control Center User Guide
To select the report agent to run the report:
1 Display the Properties dialog box for the Report Script job.
If the report is already running, double-click the job identifier in the Jobs tab of the Server Information pane; or select the job, right-click, and then click Properties.
2 In the Objects tab of the Properties dialog, select the repository data source on the report agent you want to run the report.
Note that the data source information for the report agent information is displayed using the following syntax:
AM Repositories:server:database:category
where:
• server is the name of the server that hosts the AppManager repository database
• database is the name of the AppManager repository database
Chapter 7 • Running Reports 181
• category is the name of the Knowledge Script category the report agent uses to query the repository
3 Click another tab to change its properties or click OK to start the job.
Viewing and Printing a ReportThe Report Viewer lets you organize, view and print reports. The Report Viewer is included with the AppManager web management server and can be accessed using Microsoft Internet Explorer.
The Report Viewer enables you to organize reports based on report properties, such as when the report was generated, and by information that is configured in each report, for example, the author of the report. For information about configuring reports with grouping information, see “Setting the Report Values” on page 178.
You do not need an AppManager user account to open the Report Viewer. For information about limiting access to reports, see “Limiting Access to Reports” on page 186.
To start the Report Viewer:
1 In Microsoft Internet Explorer, enter the URL of the AMReports virtual directory on the AppManager web management server computer. Use the following syntax:
http://server/AMReports
where:
• server is the name of the AppManager web management server.
• AMReports is the default name of the virtual directory on the AppManager web management server where the reports are located.
2 In the Report Viewer, the left pane displays the available reports. To view a report, click the report.
To sort the list of reports, select an option from the Grouping list.
182 Control Center User Guide

Performing Additional TasksAfter you run a few reports, you may find you need to perform additional tasks:
• “Tips for Configuring Reports” on page 183
• “Configuring Where the Report Agent Generates Reports” on page 184
• “Limiting Access to Reports” on page 186
• “Maintaining the Size Of the Report Folder” on page 189
• “Configuring the Report Agent to Run Action_SMTPMailRpt” on page 191
Tips for Configuring Reports
Before you decide on the final configuration of a report, experiment with some different configurations. Run the report with different parameter settings and study the results. Does it include all the data you want? Is there extraneous data? Are the charts readable? Is the result appropriate for the audience?
When you are preparing a report, keep in mind the following:
• Limit the scope of the report. Rather than creating one report for all the Exchange Servers in your enterprise, create separate reports by location or department. If you want to report on physical memory usage, select only that data stream, rather than using all data returned by the NT_MemUtil Knowledge Script. By limiting the scope, you reduce the time it takes to generate a report, reduce the report size, and make the report easy to understand.
• Use an appropriate time range. To prepare an ad hoc report, a specific time range is probably appropriate. To prepare a report to run on a regular basis, use a sliding time range. Be sure the time range coincides with the times during which data was collected.
Chapter 7 • Running Reports 183

• Use an appropriate aggregation interval to specify a maximum threshold value, in months, for keeping data points in the repository available for AppManager reports. When data values are aggregated, the original data points are no longer available for reports, thus reducing the size of the AppManager repository. For more information about aggregation intervals, see the Administrator Guide for AppManager.
• Be sure you can see all data streams in the chart. If an area or bar chart obscures some of the data streams, use a ribbon or line chart instead. If the rotation of the chart does not facilitate easily reading the data, use a different rotation. If there are too many data streams illustrated in a chart, use a different style for the report (by computer as opposed to all data streams on one page), or further limit the scope of the report.
Use the Chart Console to see the relative values of data streams before you configure the charts in your reports. Once you understand those relationships, you can better determine how to present data in a report. For example, if there is a great deal of disparity in value between data streams, a ribbon or line chart would be a better choice than an area or bar chart for letting you see all the data. For more information, see the Report Script Help.
Configuring Where the Report Agent Generates Reports
The default output path of the report agent is configured during installation to:<InstallDir>:\NetIQ\Common\Report
When the AppManager web management server is installed on the same computer as the report agent, this default enables you to view reports from the Operator Web Console.
If the AppManager report agent and the AppManager web management server are on different computers, configure the report agent output path to the virtual directory on the web management server computer.
184 Control Center User Guide

Use the AMAdmin_SetReportPaths Knowledge Script to configure the report agent computer to use a different output path. For more information, see the Help.
The report agent output path is used as a base path for generating reports. To limit access to reports, you can configure each report to generate into a sub-folder under the report agent base path and configure permissions on each sub-folder. See “Limiting Access to Reports” on page 186 for more information.
Reporting on Data Collected by a Copy of a Knowledge Script
Application-specific reports are hard-coded to generate reports based on data collected by a particular Knowledge Script. For example, the NT_Report_CPULoad Report Script only includes data collected by the NT_CpuLoaded Knowledge Script.
If you use the NT_Report_CPULoad Report Script to display data collected by a copy of the NT_CPULoaded Knowledge Script, for example, NT_MYCPULoaded, the Report Script raises an event to indicate “No data for report.”
To resolve this problem, you will need to:
• Create a copy of the Report Script
• Edit the Report Script to include data collected by the new Knowledge Script instead of the original, out-of-the-box Knowledge Script
To copy and check out a Report Script:
1 In the Control Center Console, right-click the report you want and click Copy KS.
2 In the Copy Knowledge Script dialog box, create a new name for the report.
3 Click OK.
Chapter 7 • Running Reports 185

4 Right-click the copy of the Knowledge Script and click Check Out KS.
5 In the Check Out Knowledge Script dialog box, select a folder location to save the Report Script.
6 Click Save. The Developer Console displays the editable script. You are now ready to edit the Report Script.
To edit the Report Script to use a different data source and check the script into the repository:
1 In the Developer Console, click View > Properties.
2 In the Properties dialog box, click Parameters.
3 In the Parameters tab, click PRM_KSList from the list of parameters and click Modify.
4 In the Modify Parameter dialog box, edit the Default Value field to specify the name of the Knowledge Script that the report will use to collect data.
5 Click Save.
6 Click OK to close the Script Properties dialog box.
7 Save your changes to local disk by clicking File > Save.
8 To check your changes into the AppManager repository, click Tools > Check In Knowledge Script.
Limiting Access to Reports
You can limit access to reports by:
• “Authenticating User Access to the Virtual Directory” on page 187
• “Configuring Folder Permissions” on page 188
186 Control Center User Guide

Authenticating User Access to the Virtual Directory
You can limit access to AppManager reports by defining the authentication methods necessary to access the AMReports virtual directory on the AppManager web management server.
To define authentication methods for the AMReports virtual directory on a Windows 2000 computer:
1 Click Start > Programs > Administrative Tools > Internet Services Manager.
2 Expand the server object (computer name).
3 Expand the Default Web Site object.
4 Right-click the virtual directory that contains the AppManager reports and click Properties. The default name of the virtual directory for AppManager reports is AMReports.
5 Click the Directory Security tab.
6 Under Anonymous access and authentication control, click Edit.
7 Select an authentication method (you may choose all methods):
8 Click OK.
9 Click OK.
Select To
Anonymous access Permit access to anyone
Basic authentication Prompt for a user name and password
Digest authentication for Windows domain servers
Prompt for a user name and password, but send a hash value rather than a password. Used with IIS 5.0.
Integrated Windows authentication
Authenticate a user based on the security token associated with the Windows account under which the Web browser is running
Chapter 7 • Running Reports 187

Configuring Folder Permissions
In addition to limiting report access to authenticated users, you can restrict report access by creating sub-folders in the Report folder, setting permissions for those folders based on the intended audience, and then generating reports to the appropriate folders.
For example, create a report sub-folder for account managers and a sub-folder for IT personnel, and set permissions on those folders that restrict access based on group membership.
When a user from one group connects to AMReports via the URL, only the reports available to that account are visible. See your Windows documentation for information about managing accounts and setting folder permissions.
Generating a Report to a Sub-folder
After you have configured report sub-folders with permissions, configure the output folder location for each report to specify the sub-folder you want.
To write reports to a specific folder:
1 Start a Report Script job.
2 Click the Values tab of the Properties dialog box.
3 In the Select output folder parameter, click Browse [...].
4 Select Specific name of folder.
188 Control Center User Guide

5 In the Folder field, enter the path to the output folder.
The Report Script name (for example, AvgValueByMin) is the default folder name for the report, and is added to the base output path of the report agent. If you want the report available only to IT personnel, include the IT folder in the name. For example, IT\AvgValueByMin.
IT\AvgValueByMin is appended to the base output path of the report agent, and the report is generated in that folder.
Maintaining the Size Of the Report Folder
The size of the Report folder depends upon number of reports you generate and how long you keep reports.
The size of a report increases as you include more:
• Data points
• Charts
A report can range from a few kilobytes to several megabytes.
You can monitor and maintain the size of the Report folder by deleting expired reports. For more information, see the following topics:
• “Collecting Information about the Report Folder Disk” on page 190
• “Reporting on the Used and Available Disk Space for Reports” on page 190
• “Deleting Expired Reports” on page 190
Chapter 7 • Running Reports 189

Collecting Information about the Report Folder Disk
The size of the Report folder can be monitored indirectly by monitoring the space on the disk where the Report folder is located.
Use the NT_LogicalDiskSpace Knowledge Script to monitor the disk and collect data about the percentage of space that is in use and the amount of space (in MB) that is available.
Reporting on the Used and Available Disk Space for Reports
After you have data about the available disk where the Report folder is located, you can then generate periodic reports about the available and used space on that disk.
For example, if your Report folder is on C:\Program Files\NetIQ\AppManager\Web\Report, the following data streams are collected:
• Ldsk: C:AVAIL MB
• Ldsk: C:USED %
You can then use a report such as ReportAM_AvgValueByDay to generate periodic reports about the values of those two data streams.
Deleting Expired Reports
The Output Settings for a report enables you to configure an expiration date. With an expiration date specified, you can run the AMAdmin_DeleteExpiredReports Knowledge Script to periodically scan the Report folder and delete expired reports. For more information about the AMAdmin_DeleteExpiredReports Knowledge Script, see the Help.
190 Control Center User Guide
Configuring the Report Agent to Run Action_SMTPMailRpt
The Action_SMTPMailRpt Knowledge Script enables you to email the first page of a report. To enable the recipient to access the links in the report, first configure the report agent with the URL of the report virtual directory on the AppManager web management server.
Use the AMAdmin_SetReportPaths Knowledge Script to configure the URL mapping parameter. This parameter specifies the URL of the report virtual directory on the AppManager web management server.
For more information about the Action_SMTPMailRpt Knowledge Script, see the Help.
Note that after you update the report agent with the URL information, if you configure a report to raise an event, the event message includes a hyperlink to the report.
Exporting Report Content
By modifying a Report Script, you can add the option to export the contents of a report to an XML file or to a TXT file in which the report data are represented in a comma-separated format.
Two modifications to the report script are necessary. You must:● Add four new parameters to the XML section of the script● Add code to the script
Note These modifications are possible only for Report Scripts that use NETIQREPORT.dll, referenced in the script as NETIQREPORT.ReportObject.
When you export the contents of a report, the XML or TXT file is output with the same name and to the same directory as the report.
This example uses the ReportAM_AvgValueByHr script. The modified script is renamed ReportAM_AvgValueByHrEXPORT.
Chapter 7 • Running Reports 191

This section discusses the following topics:• Adding the New Parameters
• Adding the Additional Block of Code
Adding the New Parameters
The four new parameters include a group folder, Export settings, and the following three parameters:• Select output type, which has the following options:
• Report (create standard report)
• Export (export content, do not create standard report)
• Both (create standard report and export content)
• Select export format, which has the following options:
• XML (exports to an XML file)
• CSV (exports to TXT file)
• Export file column delimiter, leave blank for TAB, which lets you enter the column delimiter you want to use for data. This parameter is valid only if you select CSV as the value for the previous parameter.
The following procedure assumes a familiarity with copying Knowledge Scripts, checking them in and out of the AppManager repository, and editing different portions of a script. For more information about copying scripts and checking them in and out of the repository, see the Operator Console User Guide for AppManager.
To add the new group of parameters in the appropriate place:
1 Make a copy of ReportAM_AvgValueByHr, rename it ReportAM_AvgValueByHrEXPORT, and check it out of the AppManager repository.
2 Use Notepad to open ReportAM_AvgValueByHrEXPORT.qml.
3 Scroll through the XML portion at the beginning of the script until you see the following parameter definition:
192 Control Center User Guide

<Param name="ReportSetting">
<Desc>Report settings</Desc>
<Type>String</Type>
<Size>128</Size>
<ReqInput>0</ReqInput>
<Folder>2</Folder>
<NoQuote>0</NoQuote>
</Param>
4 Enter the following parameter descriptions into the script so they immediately precede <Param name="ReportSetting">.- folder for export settings
<Param name="Export">
<Desc>Export settings</Desc>
<Type>String</Type>
<Size>10</Size>
<ReqInput>0</ReqInput>
<Folder>1</Folder>
<NoQuote>0</NoQuote>
</Param>
- to specify export, report, or both
<Param name="PRM_OUTPUT">
<Desc>Select output type</Desc>
<Delim>,</Delim>
<Type>String</Type>
<Size>10</Size>
<Value>Report</Value>
<ReqInput>0</ReqInput>
<I_Type>I_COMBOBOX("Report","Export","Both")</I_Type>
<Folder>0</Folder>
<NoQuote>0</NoQuote>
</Param>
- export type, i.e. XML or CSV
<Param name="PRM_EXPTYPE">
<Desc>Select export format</Desc>
<Delim>,</Delim>
<Type>String</Type>
<Size>10</Size>
<ReqInput>0</ReqInput>
Chapter 7 • Running Reports 193

<I_Type>I_COMBOBOX("XML","CSV")</I_Type>
<Parent>Export</Parent>
<Folder>0</Folder>
<NoQuote>0</NoQuote>
</Param>
- if CSV, column delimiter
<Param name="PRM_EXPDELIM">
<Desc>Export file column delimiter, leave blank for TAB</Desc>
<Type>String</Type>
<Size>1</Size>
<ReqInput>0</ReqInput>
<Parent>Export</Parent>
<Folder>0</Folder>
<NoQuote>0</NoQuote>
</Param>
5 Save the script, and keep it open in Notepad so you can make the necessary additions to the code.
Adding the Additional Block of Code
In order to implement the values for the parameters you have added to the script, you have to add code to wrap the call in the script that generates the report, and within that section you have to repeat the call that generates the script.
The call to generate the script can contain any of the following:● .MakeDrillDownReportV1● .MakeDrillDownReportV2● .MakeDrillDownReportV3● .MakeChart● .MakeTable● .MakeChartAndTable
To insert the additional code:
1 Scroll through the XML portion of the script to the Sub Main ( ) routine, and continue until you see the following block of code:With ReportObj
.CHILDSUBTITLE2 = subTitle2
194 Control Center User Guide

Select Case PRM_DISPLAYTYPE
Case "By computer"
.ChildColumnFormat(1,300) ="%.2f"
Case "By data stream"
.ColumnFormat(1,3) ="%.2f"
.ChildColumnFormat(1,300) ="%.2f"
Case "By computer and data stream"
.ColumnFormat(1,3) ="%.2f"
.ChildColumnFormat(1) ="%.2f"
Case "All data streams on one page"
.ColumnFormat(1,300) ="%.2f"
Case "By Knowledge Script"
.ColumnFormat(1,3) ="%.2f"
.ChildColumnFormat(1,300) ="%.2f"
End Select
If (PRM_DISPLAYTYPE <> "All data streams on one page") Then
.Filter = StatsFilterObj
bHasData = .MakeDrillDownReportV1
(DataSourceObj.RecordSet, IncludeType)
Else
StatsFilterObj.Recordset = DataSourceObj.Recordset
bHasData = .MakeChartAndTable
(StatsFilterObj.Recordset, IncludeType)
End If
End With
2 Insert the new code just after End Select (the new code and the repeated call to generate the report are in bold type):With ReportObj
.CHILDSUBTITLE2 = subTitle2
Select Case PRM_DISPLAYTYPE
Case "By computer"
.ChildColumnFormat(1,300) ="%.2f"
Case "By data stream"
.ColumnFormat(1,3) ="%.2f"
.ChildColumnFormat(1,300) ="%.2f"
Case "By computer and data stream"
.ColumnFormat(1,3) ="%.2f"
.ChildColumnFormat(1) ="%.2f"
Case "All data streams on one page"
Chapter 7 • Running Reports 195
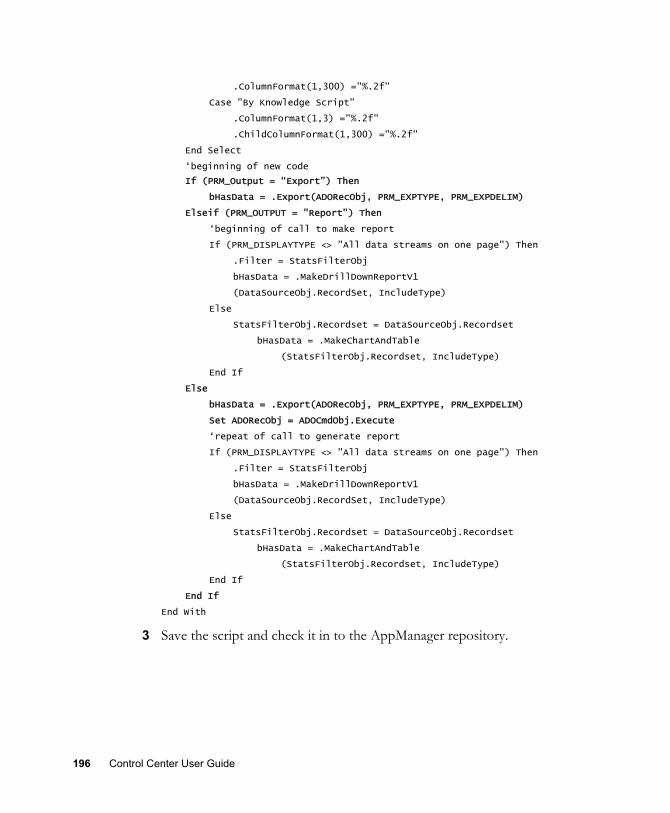
.ColumnFormat(1,300) ="%.2f"
Case "By Knowledge Script"
.ColumnFormat(1,3) ="%.2f"
.ChildColumnFormat(1,300) ="%.2f"
End Select
‘beginning of new code
If (PRM_Output = “Export”) Then
bHasData = .Export(ADORecObj, PRM_EXPTYPE, PRM_EXPDELIM)
Elseif (PRM_OUTPUT = "Report") Then
‘beginning of call to make report
If (PRM_DISPLAYTYPE <> "All data streams on one page") Then
.Filter = StatsFilterObj
bHasData = .MakeDrillDownReportV1
(DataSourceObj.RecordSet, IncludeType)
Else
StatsFilterObj.Recordset = DataSourceObj.Recordset
bHasData = .MakeChartAndTable
(StatsFilterObj.Recordset, IncludeType)
End If
Else
bHasData = .Export(ADORecObj, PRM_EXPTYPE, PRM_EXPDELIM)
Set ADORecObj = ADOCmdObj.Execute
‘repeat of call to generate report
If (PRM_DISPLAYTYPE <> "All data streams on one page") Then
.Filter = StatsFilterObj
bHasData = .MakeDrillDownReportV1
(DataSourceObj.RecordSet, IncludeType)
Else
StatsFilterObj.Recordset = DataSourceObj.Recordset
bHasData = .MakeChartAndTable
(StatsFilterObj.Recordset, IncludeType)
End If
End If
End With
3 Save the script and check it in to the AppManager repository.
196 Control Center User Guide

Chapter 8
Monitoring by Policy
This chapter provides an overview of how to use the Control Center Console to initiate policy-based monitoring.
About Policy-based MonitoringA monitoring policy uses a set of pre-configured Knowledge Scripts to automatically monitor resources as they appear in the Server view. A monitoring policy enables you to efficiently and consistently monitor all of the resources in your environment.
For example, you can create a monitoring policy to monitor physical disk resources for a particular group of computers. The monitoring policy monitors the discovered physical disk resources on each computer in the group using the same monitoring values. If the disk configuration for a managed computer changes (for example, adding a G: drive), the next time physical disk resources are discovered, the monitoring policy automatically monitors the G: drive. If you add a computer to the group, the monitoring policy automatically monitors the discovered physical disk configuration. If you remove a physical disk from the managed client and rediscover resources, the monitoring policy automatically stops monitoring the resource.
A monitoring policy is implemented through one or more Knowledge Script Groups. A Knowledge Script Group is a set of pre-configured Knowledge Scripts which you can run as part of a monitoring policy for a group or view, or as a set of monitoring jobs on a computer.
197

The advantage of using a Knowledge Script Group to monitor by policy is that matching resources are automatically monitored—a monitoring job started by Knowledge Script Group only monitors particular resources.
Additionally, a monitoring policy enforces the same monitoring values on all monitored resources. AppManager Control Center does allow you to change the monitoring values for a particular policy-based job. This is useful when a server experiences a temporary or acceptable event condition that is outside the threshold levels permitted by the monitoring policy.
If you have a computer that is consistently outside of the policy you have created, you can override the monitoring values on that computer. See “Setting Override Values” on page 107 for more information.
Alternatively, you can stop and restart a policy-based job. See “Stopping and Restarting Policy-based Jobs” on page 215 for more information.
You can monitor resources from the Master management group but NetIQ Corporation recommends that you do not implement a monitoring policy on the Master view. To remove a computer from a policy, either change the policy, reconfigure the management group to not include the computer, or delete the computer from the database.
How Monitoring Policies Work
To better understand how a monitoring policy works, keep in mind:
• A monitoring policy is implemented at the management group through one or more Knowledge Script Groups. A Knowledge Script Group is a pre-configured set of Knowledge Script Group members.
A Knowledge Script Group member is an instance of a Knowledge Script. For example, the NT_CPULoaded Knowledge Script can be a member of several Knowledge Script Groups, with
198 Control Center User Guide

the member in each Knowledge Script Group configured to use different monitoring values.
• A monitoring policy automatically creates policy-based jobs to monitor matching resources in the management group. A policy-based job is an instance of a Knowledge Script Group member in the primary Control Center repository that has been replicated to the AppManager repository which runs the job on managed client computers with a matching resource.
Unlike a monitoring job, the monitoring values of a policy-based job cannot be modified in the Control Center Console. To change the monitoring values of a policy-based job, update the parameter values of the Knowledge Script Group member.
• Properties propagation automatically publishes changes to the monitoring policy to corresponding policy-based jobs. For example, if you change the properties of a Knowledge Script Group that is part of a monitoring policy, the changes are automatically propagated to create, remove, or change policy-based jobs.
• If a policy-based job encounters an error while attempting to monitor a resource, the monitoring policy attempts to restart the job. Only monitoring jobs can be restarted; discovery- and AppManager agent-related jobs are not automatically restarted. If a policy-based job cannot be restarted automatically, or if the policy-based job is scheduled to Run Once, when the job status is Stopped, you can manually restart the job.
• You can configure exceptions to monitoring values in a policy-based job. This is useful when a server that is managed by policy raises unnecessary events. See “Setting Override Values” on page 107 for more information.
• Unlike ad hoc jobs, you cannot add comments to a policy-based job. For more information about job comments, see “Viewing Job Comments” on page 138.
Chapter 8 • Monitoring by Policy 199

• If you are configuring a monitoring policy for a group of computers that are managed by more than one AppManager repository, unlike ad hoc jobs, you cannot configure different parameter values for each AppManager repository. Note that to resolve this issue, you can configure override values or configure different management groups for each repository.
• NetIQ Corporation recommends that you implement a monitoring policy in the Control Center Console. If you implement a monitoring policy in the Operator Console, the policy is not visible from the Control Center Console. For example, if you use the Operator Console to configure a monitoring policy for the NT view, a management group with the NT view as a member does not display the monitoring policy.
Notes• A job that is not part of a monitoring policy is a monitoring job.
A monitoring job monitors a particular resource on a computer. Unlike policy-based jobs, manually propagate Knowledge Script properties to monitoring jobs. In addition, monitoring jobs do not automatically monitor resources that are discovered after the job starts.
• The SQL Server Agent service (SQLSERVERAGENT) must be running on the repository database server. If SQLSERVERAGENT is not running, monitoring policies will not work.
How Knowledge Script Groups Work
If a job is started by a Knowledge Script Group, AppManager prepends the Knowledge Script job name with the identifier of the Knowledge Script Group that started the job. This information does not appear in the Knowledge Script view of the Control Center Console but can be seen by viewing the job properties. For example, if you run acmeNT_MemoryUtilizationByApplication as part of a monitoring policy, the Knowledge Script job name that appears in the Jobs tab of the Operator Console is
200 Control Center User Guide

acmeNT_MemoryUtilizationByApplication. However, if you double-click the job to display its properties, the title bar of the job Properties dialog box displays the Knowledge Script job name with the Knowledge Script Group identifier, such as 1234:acmeNT_MemoryUtilizationByApplication.
Tip To avoid truncating the Knowledge Script job name when running a custom Knowledge Script as part of a monitoring policy or as an ad hoc job started by a Knowledge Script Group, NetIQ Corporation recommends that you limit the length of the Knowledge Script name to 145 characters. The maximum length for a Knowledge Script is 150 characters.
Reporting Considerations
Do not run reports as part of a monitoring policy. You should not run the same report on more than one report agent as part of a monitoring policy.
Charting Considerations
To select the data streams you want, the Add Data wizard of the Chart Console lists the corresponding Knowledge Script job names. For policy-based jobs and ad hoc jobs started by a Knowledge Script Group, the Knowledge Script Group identifier is prepended to the Knowledge Script job name.
Chapter 8 • Monitoring by Policy 201

Viewing Policy-based Jobs in the Job View
Policy-based jobs appear in the Job view.
The Job view does not display the Knowledge Script Group identifier for policy-based jobs or ad hoc jobs started by a Knowledge Script Group. See “How Knowledge Script Groups Work” on page 200 for more information.
The following sections discuss how to create monitoring policies and propagate refinements in your monitoring values.
Creating a Knowledge Script GroupCreate a Knowledge Script Group to configure a monitoring policy or to create a group of monitoring jobs on a particular resource. By default, a Knowledge Script Group appears in the KSG category of the Knowledge Script view.
In the Master management group, use the Knowledge Script view to browse the list of all Knowledge Scripts and to create a Knowledge Script Group. Depending on the discovered resources, the available Knowledge Script categories will vary. For example, if the management group does not include discovered SQL Server resources, the SQL Knowledge Scripts are not displayed.
Icon What it means
The job is part of a monitoring policy. To configure an exception to a parameter value, update the corresponding Knowledge Script Group member. See “Setting Override Values” on page 107 for more information.You can stop and start a particular policy-based job from the Job view—the Job properties for a policy-based job are enabled. See “Stopping and Restarting Policy-based Jobs” on page 215 for more information.
The ad hoc (monitoring) job was started by a Knowledge Script Group. You can modify its job properties from the Job view and stop or start the job.
202 Control Center User Guide

To create a Knowledge Script Group:
1 In the Knowledge Script view, right-click the grid and click Create a new KSG.
2 In the Properties for Knowledge Script Group dialog box, type a Knowledge Script Group name and description.
Note By default, the Knowledge Script Group name is prefixed with KSG_ which means the Knowledge Script Group appears in the KSG tab of the Knowledge Script pane. To create the Knowledge Script Group in another category, prefix the name of the Knowledge Script Group using Category_. For example, to create a Knowledge Script Group named NT Basics in the NT category, name the Knowledge Script Group NT_NT Basics.
3 Click an option to select the type of Knowledge Scripts you want to include:
4 In the left column, click to expand the list of Knowledge Script categories; select one or more Knowledge Scripts and then click Add.
The Knowledge Scripts appear in the Members of the Knowledge Script Group column.
Click To select Knowledge Scripts that
Regular KS Monitor discovered resources.
Discovery KS Discover resources.
Install KS Install or update AppManager agent software on a remote computer. This option allows you to install the AppManager 7.0 UNIX agent and the AppManager 6.0.2 (or earlier) Windows agent. To install the AppManager 7.0 Windows agent, use the agent deployment administrator. See “Deploying AppManager to Managed Clients” on page 245 for more information.
Chapter 8 • Monitoring by Policy 203

5 To configure the properties for a member of the Knowledge Script Group, click a Knowledge Script in the Member column and click Properties.
6 In the Properties dialog box, enter properties for the Knowledge Script Group member. In many cases, you can simply use the default schedule and values. To make changes:
Any changes you make only affect monitoring policies that use this Knowledge Script Group. The default properties of the Knowledge Script are not affected.
7 Click OK.
8 When you finish, click OK.
Viewing Knowledge Script Groups in the Knowledge Script View
By default, a Knowledge Script Group appears in the KSG category of the Knowledge Script view.
Click this tab To
Schedule Change the default schedule for running the job. See “Setting the Schedule” on page 102.
Values Adjust the threshold and other parameters for the job. See “Setting the Values to Monitor” on page 105 and “Setting Override Values” on page 107.
Actions Specify an action you want taken. See “Specifying One or More Corrective Actions” on page 116.
Advanced Specify whether to filter temporary event conditions and whether to have duplicate events for this job collapsed into a single event or automatically acknowledged. Additionally, you can specify data collection options for this job. See “Setting Advanced Job Properties” on page 120.
204 Control Center User Guide

Creating a Group of Monitoring Jobs
Use a Knowledge Script Group to create a group of monitoring jobs on a computer. The resulting jobs can be grouped together but must configured individually.
To group jobs created by a Knowledge Script Group, drag the Parent Job ID column into the Group By region. Note that if you are managing more than one AppManager repository, you may see duplicate entries in the Parent Job ID column. These entries are not actually duplicates; the Enterprise Job ID ensures each job has a unique ID.
An Enterprise Job ID is a unique identifier for a job in Control Center in the same way that a job ID is a unique identifier for a job in an AppManager repository.
To run a group of reports, run them outside of a monitoring policy. It is not recommended that you run a group of installation-related Knowledge Scripts.
To create a group of monitoring jobs, run a Knowledge Script Group in the Job view or the Server view. Note that you can run Discovery Knowledge Scripts in any management group, including a management group that is not based on the Master view.
1 In the Knowledge Script pane, browse the list to find the Knowledge Script Group you want.
2 Right-click the Knowledge Script Group and click Create a new job.
3 In the Server Selection dialog box, select servers you want to monitor and click OK.
4 To view or change the objects that are monitored by a Knowledge Script, click a member Knowledge Script in the list and click Objects.
Chapter 8 • Monitoring by Policy 205

5 In the Properties dialog box, a list of available objects is displayed. Expand the list objects to select (to monitor) or deselect (not monitor) an object.
6 Click OK to close the Properties dialog box.
7 In the Properties for Knowledge Script Group dialog box, click OK to start monitoring jobs on matching resources.
Note For information about configuring the AppManager repository preferences to set the number of times to restart a monitoring job with an Error status, see the Operator Console Help.
Viewing Monitoring Jobs Started by a Knowledge Script Group
This icon, which only appears in the Jobs tab of the List pane, means that the job is a monitoring job and was started by a Knowledge Script Group.
Changing a Knowledge Script GroupYou can update a Knowledge Script Group to add or remove Knowledge Script Group members and to change the job properties of an existing group member.
When you update the properties of a Knowledge Script Group member, any changes you make are automatically propagated to corresponding policy-based jobs. You must manually propagate changes to jobs that are not part of a monitoring policy.
If you add a member to a Knowledge Script Group, it may take up to one minute to propagate your changes to corresponding policy-based jobs.
206 Control Center User Guide

1 In the Knowledge Script view, browse the list to find the Knowledge Script Group you want and right-click to select Properties.
Note By default, a Knowledge Script Group appears in the KSG tab of the Knowledge Script pane.
2 In the Properties dialog box, you can add or remove Knowledge Script Group members:
3 In the Properties dialog box, select a Knowledge Script Group member and click Properties to update it monitoring values. In
To Do this
Remove a Knowledge Script Group member
Click a Knowledge Script in the Members list and click Remove. Or, click Remove All to remove all Knowledge Script Groups.When you close the dialog box, any associated policy-based jobs based on that member are stopped and deleted.
Add a Knowledge Script Group member
Click a Knowledge Script in the left-hand list and click Add. When you close the dialog box, any groups or views that use the Knowledge Script Group to monitor by policy automatically monitor corresponding resources with the new Knowledge Script.
Chapter 8 • Monitoring by Policy 207
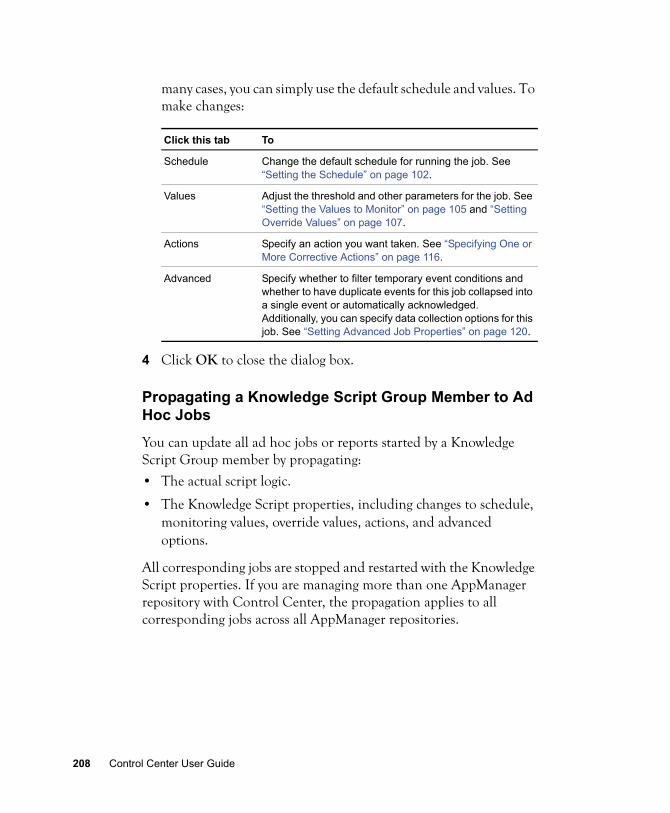
many cases, you can simply use the default schedule and values. To make changes:
4 Click OK to close the dialog box.
Propagating a Knowledge Script Group Member to Ad Hoc Jobs
You can update all ad hoc jobs or reports started by a Knowledge Script Group member by propagating:
• The actual script logic.
• The Knowledge Script properties, including changes to schedule, monitoring values, override values, actions, and advanced options.
All corresponding jobs are stopped and restarted with the Knowledge Script properties. If you are managing more than one AppManager repository with Control Center, the propagation applies to all corresponding jobs across all AppManager repositories.
Click this tab To
Schedule Change the default schedule for running the job. See “Setting the Schedule” on page 102.
Values Adjust the threshold and other parameters for the job. See “Setting the Values to Monitor” on page 105 and “Setting Override Values” on page 107.
Actions Specify an action you want taken. See “Specifying One or More Corrective Actions” on page 116.
Advanced Specify whether to filter temporary event conditions and whether to have duplicate events for this job collapsed into a single event or automatically acknowledged. Additionally, you can specify data collection options for this job. See “Setting Advanced Job Properties” on page 120.
208 Control Center User Guide

If you have configured an override value for a job parameter, the Knowledge Script propagation replaces the override value with the override value specified in the Knowledge Script, if one was specified. If an override value is not specified in the Knowledge Script, the default parameter value is propagated.
For information about propagating changes to a particular Knowledge Script to running jobs or reports, see “Propagating a Knowledge Script to Ad Hoc Jobs” on page 130.
1 In the Knowledge Script view, click the Knowledge Script Group you want and then click Properties Propagation > Ad Hoc Jobs.
2 In the Properties Propagation dialog box, the selected members are propagated. Deselect a member to prevent its properties from being propagated.
3 By default, the job properties (specified in the Schedule, Values, Actions, and Advanced tabs) and the script itself (specified in the KPS section of the Knowledge Script) are propagated. Deselect an option to specify how to propagate Knowledge Script properties for the selected members:
Note Select at least one option.
4 When you finish, click OK. Any monitoring jobs started by a Knowledge Script Group member are restarted with the job properties of the Knowledge Script Group member.
Select To propagate
Script The logic of the Knowledge Script.
Properties The changed monitoring values (including the schedule, actions, and Advanced properties).
Chapter 8 • Monitoring by Policy 209

Propagating Properties of a Knowledge Script to Knowledge Script Group Members
You can propagate the properties of a Knowledge Script or a report script, including changes to schedule, monitoring values, actions, and advanced options, to corresponding Knowledge Script Group members.
Warning If you propagate the properties of a Knowledge Script to a Knowledge Script Group, and that group is part of a monitoring policy, the corresponding policy-based jobs are automatically updated.
Before you propagate the Knowledge Script properties of a report, ensure that you have specified a value for all of the required parameters, including parameter values that are not displayed in the Values tab of the Knowledge Script Properties dialog box.
After you propagate Knowledge Script properties to Knowledge Script Group members, you can propagate the updated Knowledge Script Group members to monitoring jobs or reports started by the Knowledge Script Group. See “Propagating a Knowledge Script Group Member to Ad Hoc Jobs” on page 208 for more information.
Note For information about automatically propagating changes to policy-based jobs, see “Changing a Knowledge Script Group” on page 206.
1 In the Knowledge Script pane, click the Knowledge Script you want and then click Properties Propagation > Knowledge Script Group Members.
210 Control Center User Guide

2 In the Properties Propagation dialog box, select the components of the Knowledge Script that you want to propagate to associated monitoring jobs:
3 When you finish, click OK.
Copying a Knowledge Script Group
Copy a Knowledge Script Group to create a new Knowledge Script Group with a copy of each Knowledge Script Group member.
When you copy a Knowledge Script Group, a new Knowledge Script Group identifier is prepended to any Knowledge Script jobs created by the Knowledge Script Group. See “How Knowledge Script Groups Work” on page 200 for more information.
1 In the Knowledge Script view, browse the list to find the Knowledge Script Group you want.
2 Right-click the Knowledge Script Group you want to copy and then click Copy KS.
3 In the Copy Knowledge Script dialog box, enter the new name for the Knowledge Script Group.
Note To copy the Knowledge Script Group into a different category, change the prefix (category_) of the name. For example, to copy a Knowledge Script Group from the KSG category into a new category named KSG 2000, prefix the name with KSG 2000_.
4 When you finish, click OK.
Select To propagate
Script The logic of the Knowledge Script.
Properties The Knowledge Script properties, including schedule, monitoring values, actions, and advanced options.
Chapter 8 • Monitoring by Policy 211

Deleting a Knowledge Script Group
1 In the Knowledge Script view, browse the list to find the Knowledge Script Group you want.
2 Right-click the Knowledge Script Group you want to delete and click Delete.
Note You cannot delete a Knowledge Script Group that is configured to run as part of a monitoring policy. In this case, remove the Knowledge Script Group from any monitoring policies and then delete the Knowledge Script Group. For information about removing a Knowledge Script Group from a monitoring policy, see “Changing a Monitoring Policy” on page 214.
Creating a Monitoring PolicyYou can create a monitoring policy to automatically discover and monitor resources in a management group. Note that implementing a monitoring policy on a management group provides a powerful and flexible way to monitor the resources in your environment. See “Managing a Group of Computers” on page 69 for more information.
A monitoring policy is implemented with one or more Knowledge Script Groups. Before you can create monitoring policy, create a Knowledge Script Group that is configured properly. See “Creating a Knowledge Script Group” on page 202 for more information.
When you create a monitoring policy, all matching objects are automatically monitored. If necessary, you can stop and restart a policy-based job or configure override values for a particular parameter.
212 Control Center User Guide

You can configure a monitoring policy to automatically discover and monitor resources by adding separate Knowledge Script Groups to:
• Discover resources. The Knowledge Script Group members should be set to run on a scheduled basis.
• Monitor resources. As the discovered resources change, the monitoring policy automatically monitors the updated resources.
When you create a monitoring policy, it may take up to one minute for the policy-based jobs to start. If you subsequently add or remove computers, it may take up to one minute for policy-based jobs to start or stop.
This icon, which only appears when a policy-based job is displayed, means that the job is part of a monitoring policy.
Note You cannot use a monitoring policy to run reports; a Knowledge Script Group that was created with the Install KS option cannot be added to a monitoring policy. See “Creating a Knowledge Script Group” on page 202 for more information.
To create a monitoring policy:
1 In the Enterprise Layout pane, right-click the management group you want to monitor by policy and click Properties.
2 In the Monitoring Policy tab, click a Knowledge Script Group in the Available column and then click Add. To remove a monitoring policy, click a Knowledge Script Group in the Selected column and click Remove.
Note that from the Operator Console, you cannot remove a Knowledge Script Group that was added in the Control Center console. If you select a Knowledge Script Group that was added from the Control Center console, the Remove button is enabled but does not work.
Chapter 8 • Monitoring by Policy 213

3 You can configure the number of times that the monitoring policy should attempt to restart policy-based monitoring jobs:
Note If a policy-based job cannot be restarted automatically, or if the policy-based job is scheduled to Run Once, when the job status is Stopped, you can manually restart the job. See “Changing Job Status” on page 136 for more information.
4 When you click OK, the monitoring policy creates policy-based jobs to monitor matching resources.
Changing a Monitoring PolicyYou can change how a monitoring policy works by updating all jobs in the policy or by modifying a particular job.
To update all jobs in the monitoring policy, update the corresponding Knowledge Script Group members. You can change a monitoring policy by:
• Adding or removing Knowledge Script Groups.
• Changing the properties of existing members in a corresponding Knowledge Script Group.
For information about updating the Knowledge Script Group members, see “Changing a Knowledge Script Group” on page 206.
Click To
Always Restart a policy-based monitoring job until its job status changes to Running. Note Only monitoring jobs can be restarted by the monitoring policy. Discovery- and AppManager agent-related jobs are not restarted automatically by a monitoring policy.
Number Specify the number of retry attempts. If the specified number of retry attempts fails to restart the job, the job status remains Error.
214 Control Center User Guide

You can modify a particular policy-based job by:
• Temporarily stopping a policy-based job. For example, if a server in the management group is experiencing an unusually high number of events and you are aware of the problem, you can simply stop the job. See “Stopping a Job” on page 137 for more information.
• Overriding the monitoring values of the policy-based job on a particular server. See “Setting Override Values” on page 107 for more information.
Stopping and Restarting Policy-based JobsStopping and restarting a policy-based job is the same as stopping an ad hoc job. See “Stopping a Job” on page 137 and “Restarting a Job” on page 137 for more information.
Chapter 8 • Monitoring by Policy 215

216 Control Center User Guide
Chapter 9
Using Service Map Views
This chapter describes how you can use Service Map views to view and manage your resources.
Understanding Service Map ViewsA Service Map view represents the relationships between objects you monitor with AppManager and displays event conditions on an object that might disrupt a relationship. From a Service Map view, you can also:
• Manage events
• Manage jobs
• View details on discovered resources
• Manage custom properties
A Service Map view can visually represent the computing infrastructure that underlies a business process, such as the Web servers, database servers, and databases that customers use to make purchases. By creating a visual representation of the relationships between the components in your infrastructure, you can develop a more immediate understanding of how problems with one component are likely to affect the whole process. For example, if there are critical events on a database server, you might infer communication problems between the Web servers and databases, and hence problems with customers placing orders.
217

Service map views can represent:
• The computers, servers, databases, and network devices that allow customers to make purchases from a Web site
• The computers, servers, and mail stores that support e-mail
• The computers, servers, and databases that make up your customer relationship management system
• The domain controllers, sites, and domains of your Active Directory
The discovered AppManager objects in a Service Map view change color to indicate the most severe Open event condition associated with that object or one of its child objects. When you see an indication of a problem, you can perform additional tasks on that object, such as acknowledge the event or change the corresponding job properties.
A service map can also contain embedded views, including other Service Map views, Event views and Server views, which change color to indicate the most severe Open event conditions associated with that view. When you see an indication of a problem, you can open the embedded view or perform additional tasks on that view from the Service Map view, such as acknowledge the event or change the corresponding job properties.
Working with Service Map ViewsFor more information, see the following topics:
• Displaying a Service Map View
• Understanding Event Indicators
• Managing Events
• Managing Jobs
• Viewing Detailed Information About Discovered Resources
• Managing Custom Properties
218 Control Center User Guide

Displaying a Service Map View
To display a Service Map view, select the Service Map view you want from the Enterprise Layout pane of the Control Center console. The Service Map view is displayed in the Workspace.
The Service Map view consists of:
• Icons that represent AppManager objects
• Icons that represent an embedded view
• Drawing objects that help you understand the relationships in the Service Map view.
When looking at a Service Map view, the icon indicates the type of object. By default, each icon includes a label which can provide additional information:
• AppManager objects vary, depending upon the type of object. Note that the default naming convention helps you identify the object. See “Adding an AppManager Object” on page 228 for more information. Here are some examples:
• Embedded views can be labelled to use the original name of the view or a different name.
Object Icon
CPU
Memory
Type Icon
Service map view icon
Chapter 9 • Using Service Map Views 219
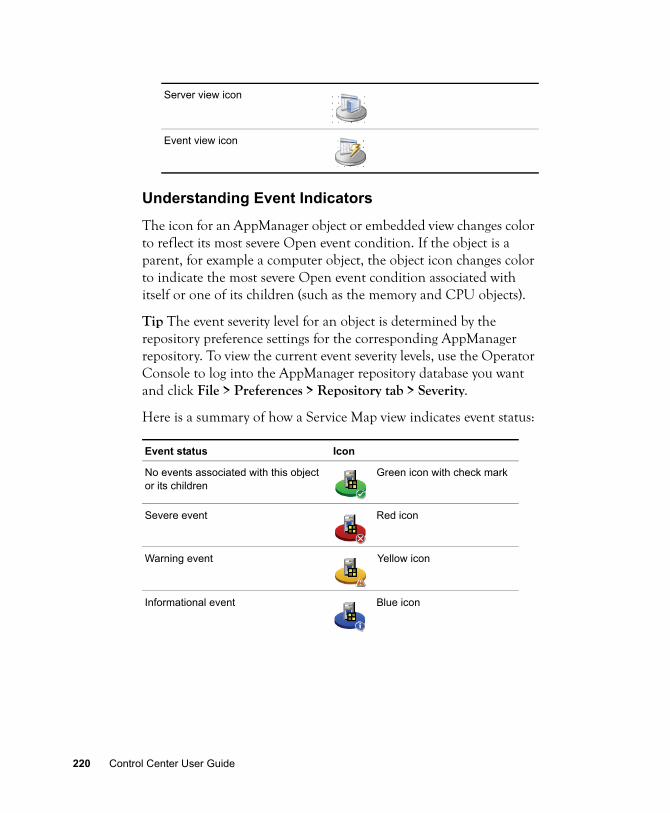
Understanding Event Indicators
The icon for an AppManager object or embedded view changes color to reflect its most severe Open event condition. If the object is a parent, for example a computer object, the object icon changes color to indicate the most severe Open event condition associated with itself or one of its children (such as the memory and CPU objects).
Tip The event severity level for an object is determined by the repository preference settings for the corresponding AppManager repository. To view the current event severity levels, use the Operator Console to log into the AppManager repository database you want and click File > Preferences > Repository tab > Severity.
Here is a summary of how a Service Map view indicates event status:
Server view icon
Event view icon
Event status Icon
No events associated with this object or its children
Green icon with check mark
Severe event Red icon
Warning event Yellow icon
Informational event Blue icon
220 Control Center User Guide

Managing Events
From a Service Map view, you can manage events for:
• A selected AppManager object. Select an object and associated events are displayed in the Events tab of the Server Information Pane.
• All objects in an embedded Service Map, Server, or Event view. Select the embedded view associated events are displayed in the Events tab of the Server Information Pane.
The Events tab of the Server Information Pane enables you to manage events as you normally would from a Server view. Alternatively, you can open an embedded view to manage events from the actual view. For information about managing events, see “Managing Events” on page 221.
To open an embedded view, double-click the embedded view icon or right-click the icon and click Open View.
Tip To navigate between views, use the Back and Forward buttons on the toolbar.
Managing Jobs
From a Service Map view, you can manage jobs for:
• A selected AppManager object. Select an object and associated jobs are displayed in the Jobs tab of the Server Information Pane.
• All objects in an embedded Service Map, or Server view. Select the embedded service map or Server view and associated jobs are displayed in the Jobs tab of the Server Information Pane. Note that you cannot manage jobs from an embedded Event view.
Diagnostic Event Magenta icon
An object or view has been deleted
Chapter 9 • Using Service Map Views 221

The Jobs tab of the Server Information Pane enables you to manage jobs from a Service Map view as you would from a Server view. Note that from a Service Map view, you cannot create new jobs. For information about managing jobs, see “Running Monitoring Jobs” on page 97.
To open an embedded view, double-click the embedded view icon or right-click the icon and click Open View.
To navigate between views, use the Back and Forward buttons on the toolbar.
Tip When the status of a job changes (such as when you change the properties of a running job), there is a slight delay in refreshing the job status in other views.
Viewing Detailed Information About Discovered Resources
From a Service Map view, you view discovery details for:
• A selected AppManager object. Select an object and associated discovery details are displayed in the Details tab of the Server Information Pane.
• All objects in an embedded Service Map or Server view. Select the embedded view and associated discovery details are displayed in the Details tab of the Server Information Pane. Note that you cannot view discovery details from an embedded Event view.
The Details tab of the Server Information Pane enables you to view discovery details from a Service Map view as you would from a Server view. Alternatively, you can open an embedded service map or Server view to display discovery details from the actual view. For information about managing events, see “Responding to Events” on page 147.
To open an embedded view, double-click the embedded view icon or right-click the icon and click Open View.
222 Control Center User Guide
Tip To navigate between views, use the Back and Forward buttons on the toolbar.
Managing Custom Properties
From a Service Map view, you manage custom properties for:
• A particular server. Select an object and associated custom properties are displayed in the Custom Properties tab of the Server Information Pane.
• All servers in an embedded Service Map or Server view. Select the embedded service map or Server view to display all associated custom properties information in the Custom Properties tab of the Server Information Pane. Note that you cannot manage custom properties from an embedded Event view.
The Custom Properties tab of the Server Information Pane enables you to manage custom properties from a Service Map view as you would from a Server view. Note that from a Service Map view, a new custom property is applied to all computers in the management group to which the Service Map view belongs. To create a custom property for a particular computer, do so from a Server view.
You can also open an embedded service map or Server view to manage custom properties from the actual view. For information about managing custom properties, see“Working with Custom Property Information” on page 81.
To open an embedded view, double-click the embedded view icon or right-click the icon and click Open View.
Tip To navigate between views, use the Back and Forward buttons on the toolbar.
Chapter 9 • Using Service Map Views 223

Designing a Service Map ViewService map views are stored in the Control Center database. Therefore, to design a service map, create a new service map or check out an existing service map from the Control Center repository.
For more information, see “Checking a Service Map View Into and Out of the Database” on page 239.
To begin using a new or updated service map, first check in the Service Map view into the Control Center repository.
• When you create a new service map or check out a service map from the Control Center repository, the Control Center Console provides a design interface for service maps:The Enterprise Layout pane enables you to select the Event views, Server views, and Service Map views you want to embed into the Service Map view. When embedding a view, you can embed views from another management group to provide the most flexible filtering mechanism and display on the objects you want in the corresponding view.
To embed a view, drag the view onto the Workspace pane.
• The Workspace pane enables you to edit the contents of a Service Map view. While a Service Map view is checked out, the Workspace banner indicates the Service Map view is in design mode and displays the name and description of the Service Map view.
• The Palette pane enables you to select from a list of servers the objects that you want to include in the service map:
• Servers list: The list of computers and servers that make up the management group, and the AppManager repositories from which those computers are referenced. Select a server to display its list of objects.
224 Control Center User Guide

• AppManager Objects list: All resource objects associated with the computer you select from the Servers list. The AppManager Objects list is the basis for most of the content in the Service Map views you create: you drag objects from this list to the Workspace.
• The Service Map view toolbar enables you to add rectangles, ellipses, rounded rectangles, text boxes, custom node objects, and links (lines or arrows) between objects.
Creating a Service Map View
Use the Control Center console to create and edit Service Map views. From the Enterprise Layout pane, you can create a new Service Map view or check out an existing Service Map view from the Control Center repository. Note that you can continue to use other Control Center views while a Service Map view is checked out.
You can create a new Service Map View and embed it in another Service Map View. Control Center allows you to embed the same Service Map View within another Service Map View multiple times.
To create a Service Map view:
1 Right-click a management group or folder where you want to create the Service Map view, then click New > Service Map View.
2 In the General tab, specify a name and description for the Service Map view:
For Do this
Name Specify the name you want to use for the Service Map view.
Description Specify a description of the Service Map view you want to include.
Checked out by Displays the account under which the Service Map view is being modified.
Chapter 9 • Using Service Map Views 225

3 In the Details tab, specify the tabs that you want to appear in the Server Information Pane of the service map:
4 In the Icon Size tab, select the icon size you want for the Service Map view.
5 Click OK.
To change the properties of a Service Map view:
1 In the Enterprise Layout pane, right-click the Service Map view you want and click Properties.
2 In the General tab of the Service Map View Properties dialog box, specify an updated name and description for the Service Map view:
For Do this
Show Events Display the Events tab in the Server Information Pane. From the Events tab, you can manage events for a selected object in the Service Map view. The Events tab of the Server Information Pane enables you to manage events as you would from an Event view.
Show Jobs Display the Jobs tab in the Server Information Pane. From the Jobs tab, you can managed jobs for a selected object in the Service Map view.The Jobs tab of the Server Information Pane enables you to manage jobs as you would from a Job view.
Show Details Display the Details tab in the Server Information Pane. From the Details tab, you can view discovery information for a selected object in the Service Map view.
Show Custom Properties
Display the Custom Properties tab in the Server Information Pane. From the Custom Properties tab, you can manage custom property information for a selected object in the Server Information Pane.
For Do this
Name Type the new name you want to use for the Service Map view.
226 Control Center User Guide

3 In the Details tab, select the information you want to include in the service map:
4 In the Icon Size tab, select the icon size you want for the Service Map view. If the Control Center option for the default icon size has changed, restore the icon size you want. For more information, see “Control Center Console Options” on page 51.
5 Click OK.
Description Type any description of the Service Map view you want to include.
Checked out by Displays the user who has checked out the Service Map view. You cannot check out a Service Map view while it is currently checked out.
For Do this
Show Events Display the Events tab in the Server Information Pane. From the Events tab, you can manage events for a selected object in the Service Map view.
Show Jobs Display the Jobs tab in the Server Information Pane. From the Jobs tab, you can managed jobs for a selected object in the Service Map view.
Show Details Display the Details tab in the Server Information Pane. From the Details tab, you can view discovery information for a selected object in the Service Map view.
Show Custom Properties Display the Custom Properties tab in the Server Information Pane. From the Custom Properties tab, you can manage custom property information for a selected object in the Server Information Pane.
For Do this
Chapter 9 • Using Service Map Views 227

Adding an AppManager Object
Add a discovered AppManager object to a Service Map view to enable the user to manage events, jobs, custom properties, and view discovery details for the object.
Note that if you want to represent an object that is not discovered, you can use a custom node. For more information, see “Adding a Custom Node” on page 237.
After you add AppManager objects to the Workspace, you can visually connect them to other AppManager objects and embedded views using lines and arrows. For more information, see “Connecting AppManager Objects” on page 234.
To add an AppManager object:
1 In the Palette pane, the Servers list contains all computers that belong to the management group where you created the Service Map view. Select a computer from the list to display its discovered objects.
Note If you create a management group with a snapshot view where you have de-selected certain objects in the Operator Console, the Palette pane displays all the objects pertaining to that view even if you have de-selected them in Operator Console.
2 In the AppManager Objects list, expand the list of objects and drag the object you want on the Workspace.
3 The object is displayed as a gray node and does not display event status information until after you check the Service Map view into the database.
Note that the default object name uses the format <computer>\<object>. For example, an IIS server installed on WebServer01 would have the default name WebServer01\IIS Server:WebServer01.
If you were to drag the memory object for the computer WebServer01, it would be named WebServer01\Memory.
228 Control Center User Guide

To change the Service Map view properties of an AppManager object:
1 With the Service Map view checked out, select the Select/Move tool and right-click an AppManager object from the Workspace and click Properties.
2 In the Object Properties dialog box, make your changes:
3 Click OK.
Embedding a View
You can embed a Service Map view, Server view, or Event view in a Service Map view. Embed a:
• Service Map view to provide “drill down” access to other Service Map views that provide more detailed information.
For example, to reduce the complexity of a Service Map view, you can create a top-level Service Map view with embedded Service Map views to provide additional details.
• Server view to manage a dynamic list of events, jobs, and custom properties, and view discovery details. Take advantage of the advanced filtering capabilities provided by rule-based management groups and embed a Server view from a different management group that filters only the objects that correspond to the Service Map view. As the rule-based management group filters
For Do this
Name Specify label text.
Description Specify description text.
Object Path Indicates the hierarchical relationship of the discovered object to the computer. This information is provided using the format computer_name\object_name. You cannot edit this field.
DataSource Indicates the AppManager repository where the object’s discovery information is maintained. This information is provided using the format computer_name.database_name. You cannot edit this field.
Chapter 9 • Using Service Map Views 229

matching objects, the embedded Server view reflects those changes.
For example, in a Service Map view that displays a business process that relies upon SQL Server databases named QDB, instead of adding each database object, embed a Server view that belongs to a rule-based management group which filters databases named QDB. If your business infrastructure adds or removes a QDB database, the embedded Server view automatically reflects that change.
• Event view to manage a dynamic list of events. Take advantage of the advanced filtering capabilities provided by rule-based management groups and embed an Event view from a different management group that filters only the objects that correspond to the Service Map view. As the rule-based management group filters matching objects, the embedded Event view reflects corresponding events.
For example, you can create a Service Map view that functions as a simple warning system for the availability of a Web site you are hosting. If the monitored Web site becomes unavailable, the related object will indicate an event condition.
To embed a Service Map view, Event view or Server view:
With the Service Map view checked out, drag the Event, Servers, or Service Map view you want from the Enterprise Layout pane onto the Workspace.
230 Control Center User Guide

An icon indicates the type of embedded view:
Note that you can embed Events, Servers, and Service Map views from any management group.
To configure the properties for an embedded view:
1 With the Service Map view checked out, right-click the icon for the embedded view, and click Properties.
2 In the Subview Properties dialog box, review the information and make your changes.
Type Icon
Service map view icon
Server view icon
Event view icon
For Do this
Sync name with original view
Select this option to make sure the text label for the embedded view icon always keeps the same name as the original view.
Name Specify a text label for the embedded view. If the Sync name with original view option is selected, you cannot edit the name.
Original View Name
Displays the name of the Control Center view within the Enterprise Layout pane. You cannot edit this field.
View Path Indicates the hierarchical location of the Control Center view within the Enterprise Layout pane. You cannot edit this field.
Description A description of the embedded view.
Set Font Click to specify standard font properties including font, style, size, effects (such as color), and language script. For more information, see the Help in the Font dialog box.
Chapter 9 • Using Service Map Views 231

3 Click OK.
Editing Objects in a Service Map
Use the Select/Move tool to select and edit an object in the Workspace. After you select an object, you can:
1 Edit the properties of the object by right-clicking to select Properties.
2 Move the object by dragging it with the mouse.
3 Copy the object to the Clipboard by clicking the Copy tool or right-clicking the object and clicking Copy.
Note that within the same management group, you can copy and paste AppManager objects between service maps.
4 Paste the object into the Workspace by clicking the Paste tool or right-clicking the Workspace and clicking Paste.
5 Delete the object by clicking the Cut tool or right-clicking the object and clicking Delete. Note that you can undo or redo an action by using the Undo and Redo tools on the toolbar. You should undo an action before you can redo it.
To select multiple objects, press Ctrl while making your selections or drag the cursor around the objects you want.
Showing and Hiding the Grid
Use the grid to help you align objects in the Workspace. With the grid displayed, when you move an object in the Workspace, the object is automatically aligned to the nearest grid point. By automatically aligning objects, also known as “snap to grid,” you can quickly and easily align objects.
By default, the Workspace is configured to display the grid.
To hide the grid, right-click the Workspace and deselect Grid.
232 Control Center User Guide

To show the grid, right-click the Workspace and select Grid.
Adding and Formatting Text
You can add text to a Service Map view. Note that most objects that appear in a Service Map view can be configured to display corresponding label text.
After you add text, you can configure the text properties to specify font size, color, and automatic line wrapping.
To add text:
1 Select the Text tool and click in the Workspace to create a text box.
2 Select the Select/Move tool and click inside text box to enter text.
To change and format text:
1 With the Service Map view checked out, select the Select/Move tool and right-click the text box and click Properties.
2 In the Text Properties dialog box, use the options to format the text:
For Do this
Text Specify the text to display.
Enable text wrapping Automatically wraps text to the next line using the specified width. This option is disabled by default.
Text wrap width Specifies the width to wrap text if the Enable text wrapping option is enabled.
Shadowed Adds a drop-shadow format to the specified text.
Chapter 9 • Using Service Map Views 233

Connecting AppManager Objects
Connect AppManager objects and embedded views to indicate relationships and direction. You can connect AppManager objects and embedded views using the Line , Arrow , or Double Arrow
link tools. Note that you cannot use the link tools to draw lines or to create links between shapes you have drawn (such as an ellipse, rectangle, or rounded rectangle).
After connecting objects, you can configure the link properties to:
• Add a label to the link
• Change the width and color of the link
• Change the link end style
• Use a curved line
To create a link:
1 Select the Line , Arrow , or Double Arrow link tool.
2 Click the objects you want to connect. The link is created using the default link properties. Select objects to create a link. You cannot use the link tools to draw a line.
Color Specifies the background color for the text area.
Set Font Click to specify standard font properties including font, style, size, effects (such as color), and language script. For more information, see the Help in the Font dialog box.
For Do this
234 Control Center User Guide

To configure the properties of a link:
1 With the Service Map view checked out, select the Select/Move tool and right-click the link to select Properties.
Tip When a link is selected, it appears bold.
2 In the Link Properties dialog box, make your changes:
3 Click OK.
Drawing an Ellipse, Rectangle or Rounded Rectangle
Use the ellipse, rectangle, and rounded rectangle tools to draw shapes.
To draw a shape:
1 With the Service Map view checked out, select the Ellipse , Rectangle , or Rounded Rectangle tool.
2 Drag the tool in the Workspace to create the shape.
3 To resize the shape, select the Select/Move tool and drag a handle.
For Do this
Link name Specify the text to display.
Color Select a color for the link.
Width Select the line width.
Link End Style Select the line end style (line, arrow, or double arrow).
Style Select a straight or curved line style.
Chapter 9 • Using Service Map Views 235

To resize an ellipse, rectangle, or rounded rectangle:
1 With the Service Map view checked out, select the Select/Move tool .
2 To resize the shape, click the object you want to display its handles, then drag a handle.
To configure the properties of an ellipse, rectangle, or rounded rectangle:
1 With the Service Map view checked out, select the Select/Move tool .
2 To configure the shape properties, right-click the shape and click Properties.
3 In the Shape properties dialog box, configure the properties:
4 Click OK.
For Do this
Color Select a fill color.
Line Width Select a line width for the border that goes around the shape.
Pattern Select a fill pattern.
Pattern Color Select a fill color for the fill pattern.
Transparency Drag the slide control to change the transparency of the shape.
236 Control Center User Guide

Adding a Custom Node
Use a custom node to represent an AppManager object that is not available from the Palette pane. This object can be used as a placeholder.
To add a custom node, select the Custom Node tool and click in the Workspace to add the custom node. The custom node is created with the Custom Node default label. After you add the custom node, edit its properties to change the label.
To change the custom node label:
1 With the Service Map view checked out, select the Select/Move tool .
2 Right-click a custom node in the Workspace and click Properties.
3 In the Custom Node Properties dialog box, make your changes.
4 Click OK.
For Do this
Name Add a text label to display under the custom node.
Description Add descriptive text. This text is not displayed in the Service Map view.
Set Font Click to specify standard font properties including font, style, size, effects (such as color), and language script. For more information, see the Help in the Font dialog box.
Chapter 9 • Using Service Map Views 237

Adding a Background Image
To enhance the relationships between objects, you can also add a background image, for example, to provide an underlying geographical map or floor plan.
A background image is anchored to the top-left corner of the map, and is displayed in its original dimensions. If you need to resize the image, use an image-manipulation program, and then reload it.
You can add a background image from a physical disk, the Windows Clipboard, or the Control Center Database. After you add a background image, it is stored in the Control Center database.
You can use images in the following formats:
• BMP
• EMF
• GIF
• JPG
• PNG
• TIFF
• WMF
Note If you want the Control Center Console to load the service map views faster, use the JPG or PNG formats for the backgroud image.
238 Control Center User Guide

To add or change a background image:
1 With the Service Map view checked out, click the button on the toolbar or right-click the Workspace and click Background Image.
2 In the Background Image Properties dialog box, select an option to load the image.
3 Click OK.
Checking a Service Map View Into and Out of the Database
To save your changes, check the Service Map view into the database. In the Enterprise Layout pane, right-click the Service Map view and click Check In.
When you check a Service Map view in, the AppManager objects change color to reflect event conditions. If you check in a Service Map view that references a large number of objects, some objects in the Service Map view may remain gray while information about their event conditions is retrieved from the database. Once that information is retrieved, the objects change color to reflect event conditions. During this time, the Service Map view is operable.
Tip You can also check in a Service Map view by selecting the Service Map view in the Enterprise Layout pane and clicking the Check In tool on the toolbar.
For Do this
Load from disk Click this option and click Browse to select the file from a physical disk and store it in the Control Center database.
Load from database
Click this option and click Browse to select the file from a list of files in the Control Center database.
Copy from Clipboard
Click this option and click Copy to select an item from the Windows Clipboard and store it in the Control Center database.
No image Click this option to not display a background image.
Chapter 9 • Using Service Map Views 239

To check a Service Map view out of the database, in the Enterprise Layout pane, right-click the Service Map view and click Check Out. In the Workspace, you can now edit the Service Map view.
Note that while a Service Map view is checked out, it cannot be checked out by another user. To determine who has checked out a Service Map view, display the Service Map view properties. For more information, see “Creating a Service Map View” on page 225.
After you check out a Service Map view, event status for the objects in the Service Map view is not displayed.
Tip You can also check out a Service Map view by selecting the Service Map view you want from the Enterprise Layout pane and clicking the Check Out tool on the toolbar.
Reverting to the Previous Version of a Service Map View
When you check in a Service Map view, the revision number of the Service Map view is updated.
While you have a Service Map view checked out, you can revert to the most recent revision number. For example, if you have made a number of changes that you do not want to implement, you can revert to the last revision of the Service Map view.
To revert to the last revision of a Service Map view, right-click the Service Map view in the Enterprise Layout pane, and then click Revert. The last revision of the Service Map view is displayed in read-only mode.
Exporting a Service Map View to an Image File
The ServiceMapImageExporter.exe command line program enables you to export a Service Map view to an image file. This program is located in:<install_dir>\NetIQ\AppManager\Control Center\bin
240 Control Center User Guide
This command line program is useful when you want to view the status of several Service Map views, for example, as part of an HTML slideshow. You can use Microsoft Task Scheduler to run the ServiceMapImageExporter.exe command line program and export all of your Service Map views.
Tip To configure Microsoft Task Scheduler to run more frequently than on a daily basis, configure the Advanced properties for the task. Alternatively, you can use the NTAdmin_RunDos Knowledge Script to run the ServiceMapImageExporter.exe command line program.
To run this utility from a Command Prompt, first change directories to: <install_dir>\NetIQ\AppManager\Control Center\bin.
Here are some examples for how to run this program:
• For Windows authentication:Servicemapimageexporter.exe /trust /S <server_name>
/V “AppManager\Master\New Service Map View 1”
• For SQL authentication:Servicemapimageexporter.exe /U <sql_user> /P
<password> /s <server_name> /V
“AppManager\Master\New Service Map View 1”
For different image formats:
• For PNG format:Servicemapimageexporter.exe /trust /s <server_name>
/V “AppManager\Master\New Service Map View 1” /I PNG
• For JPEG format:Servicemapimageexporter.exe /trust /s <server_name>
/V “AppManager\Master\New Service Map View 1” /I
JPEG
• For BMP format:Servicemapimageexporter.exe /trust /s <server_name>
/V “AppManager\Master\New Service Map View 1” /I BMP
Chapter 9 • Using Service Map Views 241

• For GIF format:Servicemapimageexporter.exe /trust /s <server_name>
/V “AppManager\Master\New Service Map View 1” /I GIF
• For TIFF format:Servicemapimageexporter.exe /trust /s <server_name>
/V “AppManager\Master\New Service Map View 1” /I
TIFF
information about how to configure the ServiceMapImageExporter.exe program is available from the command line by typing ServiceMapImageExporter.exe and pressing Enter.
Viewing Revision History for a Service Map View
The revision history helps you keep track of when and by whom changes have been made to a map.
To see the revision history for a map:
1 In the Enterprise Layout pane, expand a management group.
2 Right-click a Service Map view name and click Revision history.
242 Control Center User Guide

3 In the Revision History dialog box, information about the revision history is displayed.
4 Click OK to close the dialog box.
Using Security SettingsYou can grant permissions for Service Map views. Note that in a Service Map view, Event view and Server view permissions apply to embedded event and Server views. For example, if a user does not have permission to access Event views or Server views, the embedded event or Server view icon is displayed with a padlock and the Server Information Pane does not display the corresponding Events or Jobs tab.
To configure service map permissions:
1 In the Control Center console, click File > Manage Security.
2 In the Manage Security dialog box, click Permission Sets and click Add.
To modify an existing permission set, select the set you want and click Modify.
For Do this
Revision The number of times the map has been revised. Note that you can only revert to the most recent version of a Service Map view.
Date The date and time of a particular action against the Service Map view.
User The user who initiated the action against the Service Map view.
Action The action taken against the map (for example, Create, Check Out, Check In).
Chapter 9 • Using Service Map Views 243

3 In the Permission Set Properties dialog box, scroll down the list to service maps and select the permissions you want to grant:
• Allowed to create/modify a service map view, which allows a user to check a Service Map view in and out of the database, and modify Service Map views. If this permission is given, the Allowed to access a service map view permission is automatically given as well.
• Allowed to delete a service map view, which allows a user to delete a Service Map view.
• Allowed to access a service map view, which allows a user to view but not modify a Service Map view.
4 Click OK.
244 Control Center User Guide
Chapter 10
Deploying AppManager to Managed Clients
This chapter provides an overview of how to use the Control Center Console to deploy the AppManager agent and modules to the Windows managed clients in your environment.
For more information about installing the AppManager agent on Windows and UNIX managed clients, including installing the AppManager agent on a local computer and performing a silent installation of the AppManager agent, see the Installation Guide for AppManager.
What Is Deployment?The Control Center Console allows you to quickly and easily deploy the AppManager agent and modules to the remote Windows managed clients in your environment. Deployment provides:
• Automated detection of new managed clients and applications
• Automated deployment of agents and modules
• Rapid response to changing environments
• Multiple, firewall-friendly deployment servers
• Customized deployment schedules to meet corporate maintenance windows
To deploy agents or modules, approve the deployment tasks created by the deployment rule. For more information, see “Deployment Rules” on page 246. Each task includes the required credentials to run on the managed clients. Each AppManager agent provides the
245

details about applications installed on the managed client so that in the future you can easily deploy additional modules and updates to the managed clients.
Deploying an agent discovers and adds the managed client to the default Master management group. You can add managed clients to other management groups based on the resources you want to monitor.
You cannot use the Control Center Console to deploy the AppManager UNIX agent or UNIX modules. For information about installing the UNIX agent, see the AppManager for UNIX Servers Management Guide which is included with the AppManager UNIX agent installation kit.
How Does Agent Deployment Work?This section describes how you can use the Control Center Console to deploy agents on managed clients. Control Center needs the following to successfully deploy agents on a managed client:
• Deployment Rules
• Deployment Service and Deployment Server
• Deployment Web Service and Web Depot
Deployment Rules
Once you install the Control Center deployment components, you use the Control Center Console to configure a deployment rule.
A deployment rule consists of a list of managed clients and a set of installation packages you want to install. For your convenience, Control Center includes default rules to install some of the out-of-the-box installation packages, including the NetIQ AppManager Windows Agent. For more information, see “Managing Installation Packages” on page 252.
246 Control Center User Guide

The Control Center Console provides an easy-to-use wizard interface to help you create deployment rules. Deployment rules allow you to identify computers you want to monitor and install the module based upon a variety of criteria, including the following:
• Organization units in Active Directory
• Registry key
• Management groups in the Control Center Console
• IP address ranges
For more information about creating deployment rules, see “Creating a Rule” on page 255.
Deployment Service and Deployment Server
The deployment service communicates with the Control Center repository to process the deployment rules and tasks. Tasks run on the managed client using credentials provided in the deployment rule.
The computer where you install the deployment service is the deployment server. If you configure more than one deployment service to work with your Control Center repository, you can configure a deployment rule to deploy the agent or modules by using a certain deployment server.
Note Multiple deployment services allow for collocating with network segmented (firewall) AppManager agents in your environment.
For more information about specifying the deployment service, see “Specifying the Deployment Service” on page 261.
Chapter 10 • Deploying AppManager to Managed Clients 247

Enabling Deployment Rules and Generating Deployment Tasks
After you specify the deployment service and credentials to run the installation packages, you can enable a rule.
For more information, see “Enabling and Disabling a Deployment Rule” on page 265.
Once you enable a rule, the deployment service generates a deployment task for each installation package on each managed client. For example, if a rule has 5 managed clients and 3 packages to install, the deployment service generates a maximum of 15 deployment tasks. A deployment task is not generated if:
• An installation package is already installed on the managed client
• The managed client does not pass pre-deployment check for the installation package.
Deployment Web Service and Web Depot
The agent uses the deployment web service to communicate with the deployment server. The deployment web service consists of two web services that you install on a Microsoft Internet Information Services (IIS) server. The computer where you install the deployment web service and check in the installation packages is the web depot.
The deployment web service performs the following actions:
• Checks in installation packages to the web depot.
• Distributes installation packages to the deployment services. The deployment web service uses Microsoft Background Intelligent Transfer Service (BITS) server extensions to distribute installation packages to the deployment service.
• Receives software inventory information and application detection results from the AppManager agent and forwards this information to the Control Center repository.
248 Control Center User Guide

• Communicates with deployment services that are across a firewall.
The following figure illustrates a simplified view of this architecture:
For more information about AppManager ports, see the Installation Guide for AppManager.
Control Center Deployment Web Server (IIS Server)
Windows computers you want to monitor (inside firewall)
AppManager Control Center
Consoles
Control Center Deployment Service
Fire
wal
l
Control Center Proxy Deployment Service
Windows computers you want to monitor (outside firewall)
TCP Port 80
TCPPort 80and 443
SQL ODBCPort 1433
TCP Port 80
SQL ODBCPort 1433
SQL ODBCPort 1433*
*Web server only communicates with repository when acting as a proxy for deployment service.
TCP Port 139 and 135
Control Center repository
(SQL Server)
TCP Port 139 and 135
Chapter 10 • Deploying AppManager to Managed Clients 249

Communication Flow Between the Remote Deployment Components
When you approve a deployment task:
• The deployment service checks the Control Center repository and identifies the approved task.
• The deployment service retrieves the corresponding installation package from the web depot on the deployment web server and runs the installation package according to the configuration of the deployment rule on the managed client.
• The deployment service scans the list of managed clients. For default computer detection interval, this happens after you enable the rule. For non-default computer detetction interval, the interval must pass after you enable the rule, before the deployment service scans the list of computers. If a computer is found that matches the rule, a the deployment service generates a deployment task.The deployment task only runs if the task is scheduled to run at a particular time or if the task must be manually approved.
• The deployment service updates the task status to Active while the task is being processed and then Completed once the installation has completed.
• The managed client reports software inventory information back to deployment web service. For example, if you installed the AppManager agent, software inventory information would include the version of the agent.
• The deployment web service forwards the software inventory information from the AppManager agent to the Control Center repository.
• The Control Center Console updates its information from the Control Center repository.
250 Control Center User Guide

The following figure illustrates a simplified view of the communication flow:
Control Center Console
Agent on the managed computer communicates software inventory information to the deployment web server.
Updated information is reflected in the Control Center Console. The repository communicates with the Operator Console through ODBC.
The deployment service communicates with the repository through ODBC.
1
2
The deployment service runs the installation package from the deployment web server on the managed client.
3 4
The deployment web server communicates the information receivedfrom the agent to the repository.
5
Control Center repository
Control Center Deployment Service
6You configure a deployment rule and approve a deployment task. Control Center Console communicates with the repository through ODBC.
Managed client computers
Control Center Deployment Web Server
Chapter 10 • Deploying AppManager to Managed Clients 251

Deployment OverviewThis section describes an overview of tasks to deploy agents and modules on Windows managed clients.
To deploy agents and modules on managed clients:
1 Verify the default deployment credentials. For more information, see “Deployment Options” on page 57.
2 Check in an installation package. For more information, see “Managing Installation Packages” on page 252.
3 If you want Control Center to notify you when a deployment task completes, ensure you have configured an email address to send the email notifications. For more information, see “Configuring the Notification From Email Address” on page 263.
4 Create a deployment rule or modify an out-of-the-box deployment rule. For more information, see “Working with Deployment Rules” on page 255.
5 Approve the deployment task. For more information, see “Managing Deployment Tasks” on page 268.
6 View the results. For more information, see “Viewing the Results” on page 275.
Managing Installation PackagesAn installation package is an installation program that is run by the Control Center deployment service as part of a deployment task. You can perform the following tasks with Installation packages:
• Install, reinstall, or upgrade the AppManager agent.
• Install or upgrade a module.
To install the AppManager agent, you should select the NetIQ AppManager Agent package and the AppManager for Application packages that correspond to the applications you want the agent to
252 Control Center User Guide
monitor. For example, to install the AppManager agent and Microsoft SQL Server module, you would need the deployment package for the NetIQ AppManager Windows Agent and the AppManager for SQL Server packages.
Control Center creates a separate deployment task for each package.
Note The deployment tasks for a module are not created until after you install the AppManager agent and it appears in the Software Inventory list.
The installation package consists of an XML file that you might need to check in to Control Center. By default, all packages available with the current release of AppManager are checked in when you install Control Center. If you download a module released later than the AppManager release, check in the XML file included in the download package. For more information, see “Checking in Installation Packages” on page 254.
Viewing Installation Packages
In the Administration pane, click Packages to view a list of available packages.
To view the properties of a package, right-click the package you want and click Properties.
Column What it does
Package Name Displays the name of the installation package. The installation package for:• The AppManager agent is NetIQ AppManager Windows
Agent• A module is listed under AppManager for <application>
Chapter 10 • Deploying AppManager to Managed Clients 253

Checking in Installation Packages
If you download and want to deploy a module later than the version included with the AppManager installation kit, check in the installation package. Before you can check in an installation package, ensure that you have configured the Control Center Console with the name of the IIS Server where you have installed the deployment web service.
The name of the web depot computer is configured at the time installation. For more information about configuring the deployment web service, see “General Options” on page 60.
You cannot use a remote desktop connection to check in packages when the Control Center Console is on Windows 2000 because of a limitation with Background Intelligent Transfer Service (BITS). Terminal service logon is supported on Windows XP, Windows 2003, and Windows Vista. For more information about limitation, see the Microsoft Web Site.
To check in additional packages after installation:
1 Log on to the Control Center Console and navigate to the Administration pane.
2 Select Packages under the Deployment folder.
3 Click Check in Packages on the Tasks pane.
Package Version List the version of the installation package. Note that the version of installation package for each module varies by application.
Requires Configuration?
Indicates whether you need to provide additional information to install the package. For example, Microsoft SQL Server requires you to specify the type of authentication method to access Microsoft SQL Server. The Deployment Rule Wizard prompts you to configure the installation package if required.
Column What it does
254 Control Center User Guide

4 Navigate to the folder where you have saved the XML file for the module and select the file. For example, if you want to check in the updated Windows Agent package, you should select the following XML file : AM70-WindowsAgentUpdate-7.0.XXXXX.0.xml.
5 Click Open.
The Deployment Package Check in Status dialog box displays the status of the package check in.
Working with Deployment RulesConfigure a deployment rule to select the managed clients where you want to run one or more installation packages.
Creating a Rule
You can create a new rule or use one of the out-of-the-box deployment rules.
Control Center provides out-of-the-box rules for some installation packages, including the NetIQ AppManager Windows Agent. The default rules use the naming convention DefaultRule - application where application is the name of an application on a managed client. If there is no out-of-the-box deployment rule, create a deployment rule.
If you want to use an out-of-the-box rule, you can modify the properties of the rule. For more information about modifying a rule, see “Changing the Properties of a Deployment Rule” on page 266.
To create a rule:
1 Log on to the Control Center Console using an account that is a member of a user group with deployment permissions. For more information about permissions, see the Administrator Guide for AppManager.
2 In the Enterprise Layout pane, click Administration.
Chapter 10 • Deploying AppManager to Managed Clients 255

3 Click Rules.
4 In the Tasks pane, click Add Rule.
5 In the Deployment Rule Wizard, configure the rule. In some cases, you can use the default values. To make changes, click the links on the left pane of the wizard. For more information about the links, see the Help.
6 Click Finish.
7 If you want the rule to begin creating deployment tasks, ensure that the rule is enabled. For more information, see “Enabling and Disabling a Deployment Rule” on page 265.
Configuring Installation Packages
In the Deployment Rule Wizard, click Packages to configure the installation packages you want to install.
To configure installation packages:
1 In the Include column, click to select the packages you want.
2 If the AppManager agent is not already installed on the managed client, include the NetIQ AppManager Windows Agent installation package and the application-related installation packages.
3 If you want to uninstall certain packages from the managed client, select the packages you want to uninstall and then select the Uninstall all selected packages option.
4 If you want the installer to skip the pre-installation check for certain packages on the managed client, select the packages and then select Skip the pre-installation check for all selected packages option.
5 If the Requires Configuration column is set to Yes, configure the selected package. To configure the selected package, click the links in the Configuration Parameters list. The Configuration Wizard
256 Control Center User Guide

prompts you for the required configuration information. For more information about configuring the agent installation package, see the Installation Guide for AppManager.
Tip Before you install the AppManager agent, consider the permissions required to run Knowledge Scripts on the managed clients. For information about the permissions required to run a particular Knowledge Script, see the Help.
Specifying the Deployment Credentials
In the Deployment Rule Wizard, click Credentials to specify the user account you want to use to run the installation package on the managed client.
The credentials you provide to run the installation package are different than the credentials used by the AppManager agent to run particular Knowledge Scripts.
To run an installation package on a managed client, for example, to install the AppManager agent, provide a domain user account that is member of the Administrators group on the managed client. When configuring a rule, you can use the Windows user account that is currently configured as the default for deployment, or provide different login information.
Chapter 10 • Deploying AppManager to Managed Clients 257

Select an option to specify the deployment credentials you want to use:
• Use configured default authentication credentials. The Control Center Console can be configured to use a default authentication credential.
You can optionally configure default credentials for all deployment rules. Click the Configure options link to configure the default credentials. For more information, see “Credentials Options” on page 58.
• Use different authentication credentials. You can provide a different set of credentials for this rule in place of the default credentials.
If you specify invalid credentials, the Control Center Console does not raise a warning until after you enable the deployment rule. In the Deployment Rule view, the Status Details column displays information about any problems with the configuration of the rule.
Specifying the Managed Clients
In the Deployment Rule Wizard, click Target Computers to choose a selection method. After you choose a selection method, use the Inclusion Filters and Exclusion Filters tabs to configure filters to select the computers you want to include and exclude, respectively.
To generate a deployment task for a computer, the computer must match both the target selection method and the inclusion filter. If you specify an exclusion filter, the computer must not be selected by the exclusion filter.
Tip If the package you want the rule to install is already installed on the managed client, a deployment task is not generated.
258 Control Center User Guide

Select an option to choose a selection method:
• Agent. Selects AppManager 7.0 (or later) agents currently managed by Control Center. This option is useful for installing updates to the AppManager agent.
• Domain. Searches for computers in the Active Directory domain you specify. In the Domain Name field, type fully-qualified domain name or NETBIOS name of the domain you want.
• Specific Computers. Click Add to add a computer name. You can specify the names or IP addresses of the computers you want. At this time, only IPv4 addresses are supported.
You can change the computer name after you add it by selecting the computer name and clicking Edit. Or, click Remove to remove a computer from the list.
• Computers List File. Specify the path and name of a file on the deployment server that contains an XML description of the computers you want, for example:
<ScannedMachines>
<ScannedMachine Name="Machine1" Platform="Windows"/>
<ScannedMachine Name="Machine2" Platform="Windows"/>...
</ScannedMachines>
You can specify the names or IP addresses of the computers you want. At this time, only IPv4 addresses are supported.
• Management Groups. Click Add to add a Control Center management group. This option is useful when you want to install a package on the computers in a management group. Use this option to leverage the power and flexibility of rule-based management groups to select the computers you want. For more information, see “About Management Groups” on page 69.
To remove a management group from the list, select the management group and click Remove.
Chapter 10 • Deploying AppManager to Managed Clients 259

Specifying Inclusion Filters
In the Deployment Rule Wizard, use the Inclusion Filters tab to configure the criteria you want to use to further refine the list of managed clients you want to include.
To generate a deployment task for a computer, the computer must match both the target selection method and the inclusion filter. If you specify an exclusion filter, the computer must not be selected by the exclusion filter.
Select a criteria you want and click the link to configure each criteria:
• Domains. Include computers in a domain by selecting the domains you want from the list.
• IP Addresses. Include computers by typing the IP address of each computer you want. At this time, only IPv4 addresses are supported.
• IP Address Ranges. Include computers that fall within a range of IP addresses by specifying the starting and ending IP address. At this time, only IPv4 addresses are supported.
• Computer Names. Include computers by typing the name of each computer you want or by browsing the list of computers.
• Operating Systems. Include computers that run a supported version of the Microsoft Windows operating system.
• Organizational Units. Include computers that belong to one or more organization units in Active Directory by specifying the distinguished name of the organizational unit, for example:OU=Domain Controllers,DC=corporate,DC=local
• Regular Expressions. Include computers that match all specified regular expressions, for example, EXCHSERV0[1-5] only selects computers named EXCHSERV01, EXCHSERV02, and so on, up to EXCHSERV05.
260 Control Center User Guide

• Wildcard Expressions. Include computers that match one or more specified wildcard expressions. Supported expressions include ? (one character) and * (more than one character).
• Remote Registry Values. Include computers with one or more matching registry values. For more information, see the Help.
Specifying Exclusion Filters
To exclude a computer that matches the target selection method and the inclusion filter, specify an exclusion filter. If the computer is not selected by both the target selection method and the inclusion filter, you do not need to specify an exclusion filter.
Note To generate a deployment task for a computer, the computer must match both the target selection method and the inclusion filter, if one was specified. The deployment service does not generate a deployment task for a computer that matches the exclusion filter.
Specifying the Deployment Service
In the Deployment Rule Wizard, click Deployment Service to select the Deployment Server you want to use to deploy the task. For example, you might have a deployment service that is used to deploy installation packages to a particular corporate office. For information about installing the deployment service, see the Installation Guide for AppManager.
Chapter 10 • Deploying AppManager to Managed Clients 261
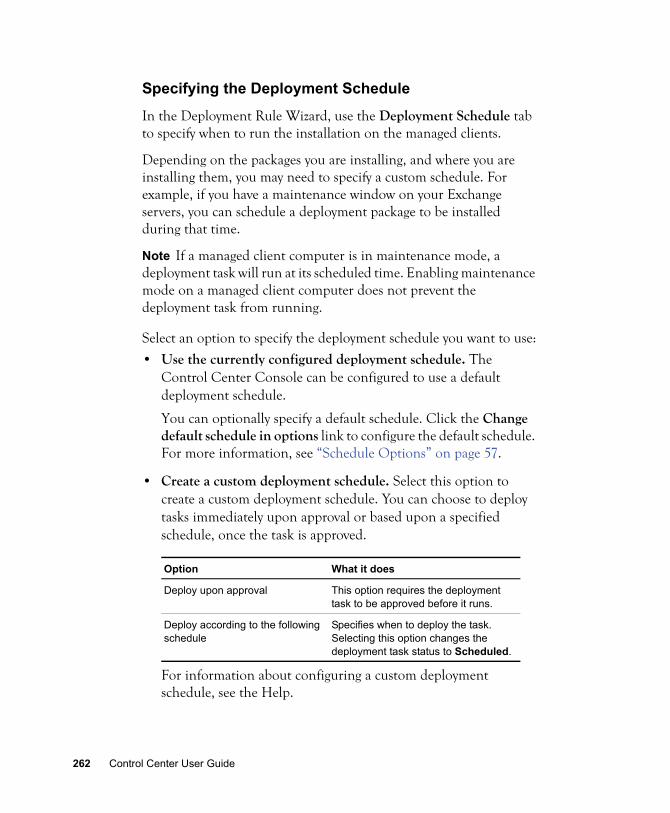
Specifying the Deployment Schedule
In the Deployment Rule Wizard, use the Deployment Schedule tab to specify when to run the installation on the managed clients.
Depending on the packages you are installing, and where you are installing them, you may need to specify a custom schedule. For example, if you have a maintenance window on your Exchange servers, you can schedule a deployment package to be installed during that time.
Note If a managed client computer is in maintenance mode, a deployment task will run at its scheduled time. Enabling maintenance mode on a managed client computer does not prevent the deployment task from running.
Select an option to specify the deployment schedule you want to use:
• Use the currently configured deployment schedule. The Control Center Console can be configured to use a default deployment schedule.
You can optionally specify a default schedule. Click the Change default schedule in options link to configure the default schedule. For more information, see “Schedule Options” on page 57.
• Create a custom deployment schedule. Select this option to create a custom deployment schedule. You can choose to deploy tasks immediately upon approval or based upon a specified schedule, once the task is approved.
For information about configuring a custom deployment schedule, see the Help.
Option What it does
Deploy upon approval This option requires the deployment task to be approved before it runs.
Deploy according to the following schedule
Specifies when to deploy the task. Selecting this option changes the deployment task status to Scheduled.
262 Control Center User Guide

Specifying Email Notification
In the Deployment Rule Wizard, use the Notification tab to specify who will be sent an email message about the status of a deployment task.
You can choose to send email notification to a list of recipients when a deployment task succeeds or fails.
You may need to notify a custom list of recipients depending on the packages you install, and where you install them.
Configuring the Notification From Email Address
Before you can configure receipients of email notifications, ensure you configure the Notification From email address that Control Center uses to send the email notifications. Otherwise spam blockers might block the email notifications.
To configure the Notification From email address:
1 Open the following file:
<Install_folder>\AppManager\ControlCenter\bin\DeploymentService.exe.config.
2 Specify an email address to use the NotificationEmailFromAddress entry to send the email notifications.
When the Deployment Service sends an email notification to the recipients, the email displays the value you specify in the DeploymentService.exe.config file as the From address.
3 Close and save your changes.
4 Restart the NetIQ AppManager Control Center Deployment Service for your changes to take effect.
Chapter 10 • Deploying AppManager to Managed Clients 263
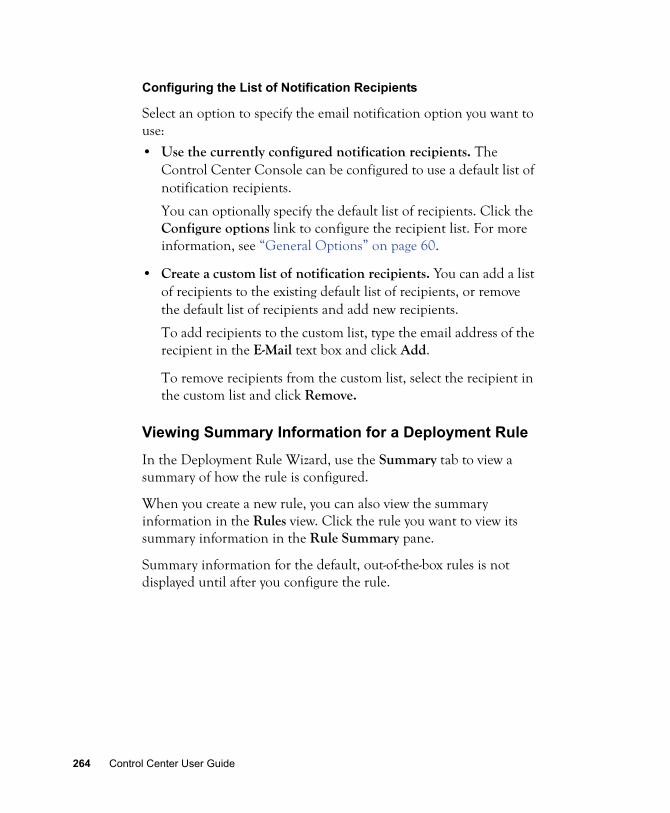
Configuring the List of Notification Recipients
Select an option to specify the email notification option you want to use:
• Use the currently configured notification recipients. The Control Center Console can be configured to use a default list of notification recipients.
You can optionally specify the default list of recipients. Click the Configure options link to configure the recipient list. For more information, see “General Options” on page 60.
• Create a custom list of notification recipients. You can add a list of recipients to the existing default list of recipients, or remove the default list of recipients and add new recipients.
To add recipients to the custom list, type the email address of the recipient in the E-Mail text box and click Add.
To remove recipients from the custom list, select the recipient in the custom list and click Remove.
Viewing Summary Information for a Deployment Rule
In the Deployment Rule Wizard, use the Summary tab to view a summary of how the rule is configured.
When you create a new rule, you can also view the summary information in the Rules view. Click the rule you want to view its summary information in the Rule Summary pane.
Summary information for the default, out-of-the-box rules is not displayed until after you configure the rule.
264 Control Center User Guide
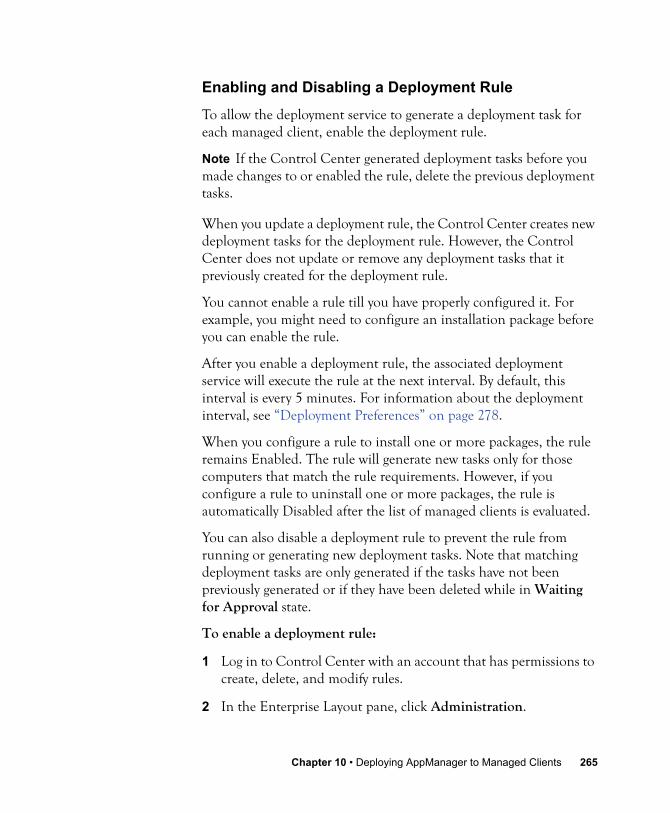
Enabling and Disabling a Deployment Rule
To allow the deployment service to generate a deployment task for each managed client, enable the deployment rule.
Note If the Control Center generated deployment tasks before you made changes to or enabled the rule, delete the previous deployment tasks.
When you update a deployment rule, the Control Center creates new deployment tasks for the deployment rule. However, the Control Center does not update or remove any deployment tasks that it previously created for the deployment rule.
You cannot enable a rule till you have properly configured it. For example, you might need to configure an installation package before you can enable the rule.
After you enable a deployment rule, the associated deployment service will execute the rule at the next interval. By default, this interval is every 5 minutes. For information about the deployment interval, see “Deployment Preferences” on page 278.
When you configure a rule to install one or more packages, the rule remains Enabled. The rule will generate new tasks only for those computers that match the rule requirements. However, if you configure a rule to uninstall one or more packages, the rule is automatically Disabled after the list of managed clients is evaluated.
You can also disable a deployment rule to prevent the rule from running or generating new deployment tasks. Note that matching deployment tasks are only generated if the tasks have not been previously generated or if they have been deleted while in Waiting for Approval state.
To enable a deployment rule:
1 Log in to Control Center with an account that has permissions to create, delete, and modify rules.
2 In the Enterprise Layout pane, click Administration.
Chapter 10 • Deploying AppManager to Managed Clients 265

3 Click Rules to display a list of rules.
4 Select the rule you want and in the Tasks pane, click Enable.
Refreshing the List of Deployment Rules
To view the rules that you create or modify you need to refresh the list of rules.
To refresh the list of rules, press CTRL+F7 then press F5.
Changing the Properties of a Deployment Rule
Before you update a rule, consider whether you need to change the rule. If the change applies:
• To a few managed clients, you can edit the deployment tasks for the computers. For more information, see “Configuring the Installation Package for a Deployment Task” on page 272.
• To most of the managed clients, update the rule. Delete existing deployment tasks created by the rule before new deployment tasks with the updated configuration are generated.
To change the properties of a rule:
1 Log in to Control Center with an account that has permissions to create, delete, and modify rules.
2 In the Enterprise Layout pane, click Administration.
3 Click Rules to display a list of rules.
4 In the Tasks pane, click Edit Rule to start the Deployment Rule Wizard and edit the selected rule. For more information about fields on a window, see the Help.
5 After you edit the rule, enable the rule. For more information, see “Enabling and Disabling a Deployment Rule” on page 265.
266 Control Center User Guide

Copying a Deployment Rule
As a convenience you can copy an existing rule and then modify it to meet your needs. After you copy a rule, its status is Disabled.
To copy a rule:
1 Log in to Control Center with an account that has permissions to create, delete, and modify rules.
2 In the Enterprise Layout pane, click Administration.
3 Click Rules to display a list of rules.
4 In the Tasks pane, click Copy Rule.
The name of the copied rule is prefixed with Copy of <rule name> where <rule name> is the original rule name.
Deleting a Deployment Rule
After you delete a rule, you cannot restore it. If you want to temporarily prevent the rule from generating deployment tasks, consider disabling it. For more information, see “Enabling and Disabling a Deployment Rule” on page 265. When you delete a rule, you are prompted to confirm you that want to delete the rule.
You can disable the confirmation to delete a rule by configuring the Control Center options. For more information, see “Confirmations Options” on page 58.
To delete a rule:
1 Log in to Control Center with an account that has permissions to create, delete, and modify rules.
2 In the Enterprise Layout pane, click Administration button
3 Click Rules to display a list of rules.
4 In the Tasks pane, click Delete Rule to delete the rule.
Chapter 10 • Deploying AppManager to Managed Clients 267

Managing Deployment TasksA deployment task indicates an installation package you want to install on a certain computer based on the criteria met in a deployment rule. When the a managed client meets the criteria for a deployment rule the deployment service generates a deployment task.
Before you can deploy a module to a managed client, the AppManager agent must be installed. For example, if you configure a rule to install the AppManager agent and module for Microsoft Internet Information Services (IIS), the deployment service does not generate the deployment task for IIS until after you deploy the AppManager agent on the managed client.
Tip If a package is already installed on the managed client, the deployment service does not generate a deployment task. For example, if you configure a rule to install the AppManager agent and module for Microsoft SQL Server, if the same version of the agent is already installed on the managed client, the deployment service only creates the deployment task to install AppManager for Microsoft SQL Server.
Viewing Deployment Tasks
To view a list of all deployment tasks, log in to the Control Center Console and navigate to the Administration pane. The Deployment Tasks view displays list of all deployment task. You can group by Computer to view all deployment tasks for a managed client.
You can configure how to display this information. For more information, see “Task Management Options” on page 59.
268 Control Center User Guide
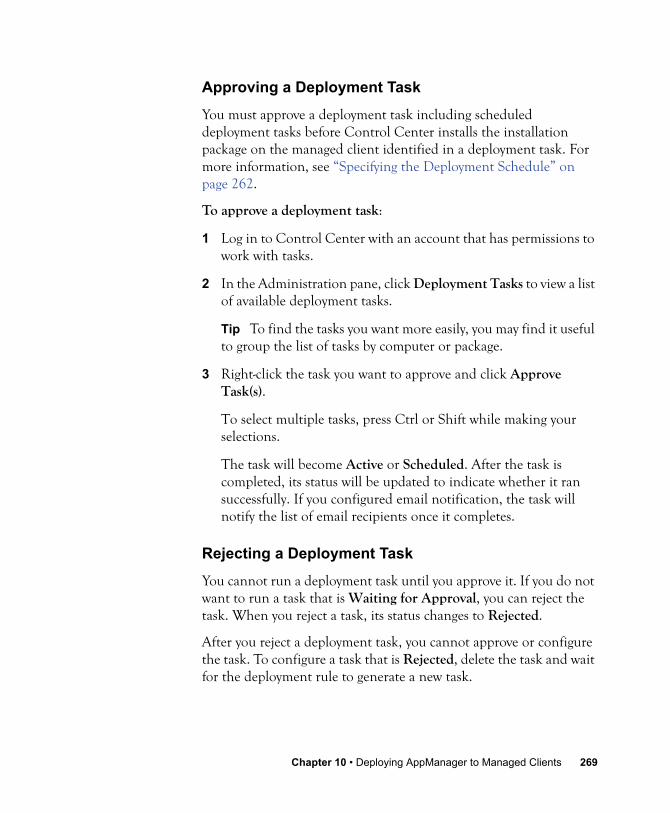
Approving a Deployment Task
You must approve a deployment task including scheduled deployment tasks before Control Center installs the installation package on the managed client identified in a deployment task. For more information, see “Specifying the Deployment Schedule” on page 262.
To approve a deployment task:
1 Log in to Control Center with an account that has permissions to work with tasks.
2 In the Administration pane, click Deployment Tasks to view a list of available deployment tasks.
Tip To find the tasks you want more easily, you may find it useful to group the list of tasks by computer or package.
3 Right-click the task you want to approve and click Approve Task(s).
To select multiple tasks, press Ctrl or Shift while making your selections.
The task will become Active or Scheduled. After the task is completed, its status will be updated to indicate whether it ran successfully. If you configured email notification, the task will notify the list of email recipients once it completes.
Rejecting a Deployment Task
You cannot run a deployment task until you approve it. If you do not want to run a task that is Waiting for Approval, you can reject the task. When you reject a task, its status changes to Rejected.
After you reject a deployment task, you cannot approve or configure the task. To configure a task that is Rejected, delete the task and wait for the deployment rule to generate a new task.
Chapter 10 • Deploying AppManager to Managed Clients 269

If you update the deployment rule that generated the deployment task, the deployment service does not generate a new task until you delete the Rejected task. For more information about deleting a task, see “Deleting a Deployment Task” on page 270.
To reject a deployment task:
1 In the Administration pane, click Deployment Tasks to view a list of available deployment tasks.
2 Right-click the task you want and click Reject Task(s).
Deleting a Deployment Task
You can delete a task to remove it from the list. If you delete a task that is Scheduled or Waiting for Approval, and the rule that generated the task is enabled, the deployment service automatically generates a new deployment task. You cannot delete an Active task.
You can configure Control Center Console to automatically delete Completed deployment tasks and to hide tasks that are older than a specified period. For more information, see “Task Management Options” on page 59.
When deleting a task, you are prompted to confirm that you want to delete the task. You can disable the confirmation to delete a task by configuring the Control Center options. For more information, see “Confirmations Options” on page 58.
To delete a deployment task:
1 Log in to Control Center with an account that has permissions to work with deployment tasks.
2 In the Administration pane, click Deployment Tasks to view a list of available deployment tasks.
270 Control Center User Guide

3 Click the task you want to delete.
To select multiple tasks, press Ctrl or Shift while making your selections. If the tasks in the list are grouped, for example, by Computer, first expand the group and then select the tasks. You cannot select the group to delete more than one task.
4 Click Delete Task(s)
Viewing the Deployment Rule for a Deployment Task
You might want to view the deployment rule for which the deployment service generates a deployment task that you want to run, or reject, or delete.
To view information about the rule that generated a deployment task:
1 Log in to Control Center with an account that has permissions to work with deployment tasks.
2 In the Administration pane, click Deployment Tasks to view a list of available deployment tasks.
3 Right-click the task you want and click View Rule.
Changing the Schedule for a Deployment Task
You might want to configure a different schedule for a deployment task after the deployment service generates the task.
To change the schedule for a deployment task:
1 Log in to Control Center with an account that has permissions to work with deployment tasks.
2 In the Administration pane, click Deployment Tasks to view a list of available deployment tasks.
3 Right-click the task you want and click Schedule Task.
Chapter 10 • Deploying AppManager to Managed Clients 271
4 In the Edit Task Schedule dialog box, update the schedule. For more information, see the Help.
5 Click OK.
Configuring the Installation Package for a Deployment Task
If the installation package for the deployment task requires configuration, you can configure the installation package either before or after you approve the task. For example, if you approve a task and it encounters a problem, you can configure the installation package and then re-activate the task. For more information, see “Re-activating a Deployment Task” on page 273.
You cannot configure tasks that are Running, Rejected, or Completed.
To configure a deployment task:
1 Log in to Control Center with an account that has permissions to work with deployment tasks.
2 In the Administration pane, click Deployment Tasks to view a list of available deployment tasks.
3 Right-click the task you want and click Configure. Note that only tasks that require configuration will be selectable for configuration. For more information, see the Help.
272 Control Center User Guide

Changing the Credentials for a Task
If a deployment task fails because of the credentials, you can change the credentials and re-activate the task. For more information, see “Re-activating a Deployment Task” on page 273.
To change the credentials for a deployment task:
1 Log in to Control Center with an account that has permissions to work with deployment tasks.
2 In the Administration pane, click Deployment Tasks to view a list of available deployment tasks.
3 Right-click the task you want and click Change Credentials.
4 In the Package Credentials dialog box, update the credentials. For more information, see the Help.
5 Click OK.
Re-activating a Deployment Task
If a deployment task encounters an error, after you update the task properties, you can re-activate the task to enable it to run on its specified schedule. For example, if the credentials for the deployment task are invalid, update the credentials for the task and then re-activate the task.
Chapter 10 • Deploying AppManager to Managed Clients 273

To re-activate a deployment task:
1 Log in to Control Center with an account that has permissions to work with deployment tasks.
2 In the Administration pane, click Deployment Tasks to view a list of available deployment tasks.
3 Right-click the deployment task you want and click Re-activate Task(s).
If you configured email notification, AppManager notifies the list of email recipients after the deployment task is completed.
Viewing the Properties of a Deployment Task
You can view the properties of a deployment task to check when it is scheduled to run or any other information about the task.
To view the properties of a deployment task:
1 Log in to Control Center with an account that has permissions to work with deployment tasks.
2 In the Administration pane, click Deployment Tasks to view a list of available deployment tasks.
3 Right-click the task you want and click Properties.
In the Deployment Task Properties dialog box, information about the task is displayed. For more information, see the Help.
Refreshing the List of Deployment Tasks
When you create, enable, and approve a deployment rule, the deployment service generates a deployment task. You might want to view the deployment task that the deployment service generates for which you must refresh the list of deployment tasks.
To refresh the list of tasks, press CTRL+F7 then press F5.
274 Control Center User Guide

Viewing the ResultsAfter the deployment task completes successfully, the Control Center Console automatically updates the results. If you:
• Installed the AppManager agent, Control Center automatically displays the managed client in the management groups with matching criteria. For more information, see “About Management Groups” on page 69.
• Installed module support, the Details tab of the Server view displays the discovered application resources. For more information, see “Viewing Detailed Information about Discovered Resources” on page 45.
Viewing Software InventoryThe Software Inventory list includes information about the packages that are installed, including a list of managed objects, or module support, and version information.
The list does not include information about AppManager 6.x (and earlier) agents.
To view software inventory information, in the Administration pane, click Deployment > Software Inventory.
Troubleshooting Deployment TasksThis section provides some tips for troubleshooting deployment tasks.
Managed Client Not Appearing in the Server View
When you install the AppManager agent, if the installation was successful but the managed client computer does not appear in the Server view of the Master management group, you may need to add
Chapter 10 • Deploying AppManager to Managed Clients 275

the computer and re-run Discovery. For more information, see “Adding a Computer to the Master View of a Repository” on page 42.
Deployment Tasks Not Being generated After Enabling a Deployment Rule• If you enable a rule but do not see the deployment tasks you
expect, it may be because of one of the following reasons:
• The corresponding tasks have already completed. Look for tasks in the Tasks view with a status of Completed.
• The installation package is already installed on the managed client. The deployment service does not generate a deployment task if the installation package is already installed on the managed client. For example, if you configure a rule to install the AppManager agent and module for Microsoft SQL Server, if the same version of the agent is already installed, the deployment service generates only the deployment task for Microsoft SQL Server. Check the Software Inventory list of installed AppManager components on the managed client.
• Review the Status Details column for the deployment rule. You may find an error, for example, invalid credentials are specified.
• No managed clients were selected. Review the rule to verify the managed clients are specified.
• When you finish configuring the deployment rule, the deployment service generates the deployment tasks, but the tasks are not deployed correctly because the managed client does not support the packages you want to install.
• You need to wait until the deployment task to install the agent is complete. The deployment service does not generate deployment tasks for the modules until the agent installation is complete.
• If the managed client does not have software inventory information for the AppManager agent, the AppManager agent cannot communicate with the deployment web server computer
276 Control Center User Guide

or you specified the wrong the deployment web server computer name when you configured the agent installation package.
Avoiding Recreating a Deployment Task After Deleting the Task
If you do not want a task to be recreated after you delete it, do one of the following actions:
• Disable the associated deployment rule that generates the deployment task.
• For those tasks you do not want to run associated with a deployment rule you do not want to disable, reject the task to change its status to Rejected.
Deployment Tasks Going Into Error State
Th following list is a list of possible reasons that the deployment tasks go into Error state:
• Review the status details for the task by right-clicking the task and clicking Properties. The Properties dialog box also includes information from the pre-installation check.
• Ensure the proper credentials are specified in the properties. The Deployment Rule Wizard does not validate the credentials you specify.
Generating New Deployment Tasks• To generate new deployment tasks after you update a rule, delete
existing deployment tasks. After you delete the existing tasks, the deployment service can generate new deployment tasks.
• If you uninstall the AppManager agent manually from the local computer recently, it can take up to 72 hours for the deployment service to create a new deployment task for the installation package. For more information about changing this interval, see “Deployment Preferences” on page 278.
Chapter 10 • Deploying AppManager to Managed Clients 277

• If you encounter the following error when installing the AppManager Windows agent, view the msierror.log file on the managed client to determine the errors: The Windows Installer encountered a fatal error, so the
installation could not complete.
Typically this error occurs when:
• The managed client does not have enough free disk space for Control Center to install the AppManager agent. The AppManager agent requires approximately 30 MB of free disk space.
• The specified installation path does not exist. If you specify an invalid installation path, Control Center installs the agent in the default location, C:\Program Files\NetIQ\AppManager.
The msierror.log file is typically located in %SystemRoot%\temp\WmiRel. To access this file on a remote computer, you must have Administrator privilege to \\MACHINENAME\ADMIN$\Temp\WmiRel\msierror.log.
Deployment PreferencesThe Control Center Console allows you to specify deployment options, for example, how frequently the deployment service re-runs rules to look for new managed clients. For more information, see “Deployment Options” on page 57.
278 Control Center User Guide

Chapter 11
Using the Chart Console
This chapter describes how to generate and view charts of AppManager data from multiple repositories using the NetIQ AppManager Chart Console. The following topics are covered:
• What is the Chart Console?
• Starting the Chart Console
• About the Chart Console
• Organizing Charts into Groups
• Sharing Charts
• Creating a Chart
• Changing How a Chart Appears
• Changing Chart Properties
• Exporting and Printing Data
• Setting Preferences
This chapter assumes you are familiar with how to collect AppManager data. For more information about collecting data, see “Collecting Data for Charts” on page 280.
What is the Chart Console?The AppManager Chart Console lets you generate and view charts of data streams generated by Knowledge Script jobs in a particular AppManager repository. You cannot create a chart with data from more than one AppManager repository.
279

The Chart Console can run as a standalone application or inside the Operator Web Console. For information about the Operator Web Console, see Chapter 12, “Using the Operator Web Console.”
The Chart Console provides additional functionality beyond what is available from the Graph pane in the Operator Console. You can:
• Orient your view of the data using real-time rotation, zoom, and pan.
• Re-order the data streams within a chart to improve readability.
• Customize the chart color scheme to suit your needs.
• Mix and match chart styles across different data streams in a chart. Proportional graphing between streams correctly displays different monitoring intervals.
• More easily see when a data stream breaches a high or low threshold by creating static threshold indicators.
• Re-use chart data in other applications by exporting chart data to an HTML report, the Windows Clipboard, or a text file.
• Use the Chart Console as a standalone application.
Permission to use the Chart Console is granted through the AppManager Security Manager.
Collecting Data for ChartsBefore you can create a chart, you first need to create a Knowledge Script job that collects the data you want charted. Most Knowledge Scripts can be used to collect data for charts and reports.
To create a job that collects data, click the Values tab of the Knowledge Script Properties dialog box, and select the Yes check box next to the Collect Data parameter (or set that parameter to y).
280 Control Center User Guide

Data Points and Data Streams
The specific numeric data collected in one run of a Knowledge Script job is considered a data point.
A series of these data points, collected as a Knowledge Script job runs at set intervals, is called a data stream. Each data stream is displayed in the AppManager Operator Console on the Graph Data tab in the List pane. Data streams are displayed only in the view to which they pertain, for example, data collected about components of SQL Server will not be visible in the NT or IIS view. At this time, the Control Center Console does not display data streams.
A single Knowledge Script job may create several data streams if it collects more than one kind of information. For example, the NT_CpuResource Knowledge Script collects four types of data points (User CPU, Number of processes, All threads, and Interrupts for all CPU), which appear as four separate data streams in the List pane of the Operator Console.
Displaying the Data in a Chart
Use the Chart Console to display the information collected. You can combine multiple data streams in the same chart or chart each data stream separately. There are no predefined rules restricting how you can combine data streams, so you can combine them in any way you find useful.
Each data stream generated by a Knowledge Script is stored in the AppManager repository so you can view data at a later date. A chart is really just a view of one or more data streams.
As the job runs, new data is constantly appended to the data stream. Each data stream has a maximum time period, in days, that data points are stored for graphing; and, periodically, data streams are truncated in the repository to keep them efficient while displaying the most recent information.
Chapter 11 • Using the Chart Console 281

The AppManager repository preferences let you set the default time period during which the data points in a data stream are available for display in the Chart Console, as well as the interval for deleting data points that exceed a specified time period. By default, the AppManager repository keeps 8 days’ worth of data for charts and graphs. To view more than the most recent 8 days of data, you should consider running an AppManager report before increasing the time period to keep data for charts and graphs. At this time, you cannot use the Control Center Console to configure AppManager repository preferences. For information about using the Operator Console to configure AppManager repository preferences, see the Operator Console Help.
If you change the repository preferences for the number of days that data points are available, the change affects new jobs only. Existing data streams must be updated to change the number of days to keep data points in the data stream, up to the maximum set for the repository. For information about configuring the number of days that points for a particular data stream can appear in a chart, see the Operator Console Help. At this time, you cannot configure data stream properties from the Control Center Console.
Starting the Chart ConsoleYou can start the Chart Console from the Control Center Console, from the Windows desktop or from the AppManager Web Operator Console.
To start the Chart Console from the Windows desktop:
1 Click the Start button, and then click Programs > NetIQ > AppManager > Chart Console.
2 At the NetIQ AppManager Chart Console Logon dialog box, log into the repository that contains the data you want to chart. If you
282 Control Center User Guide
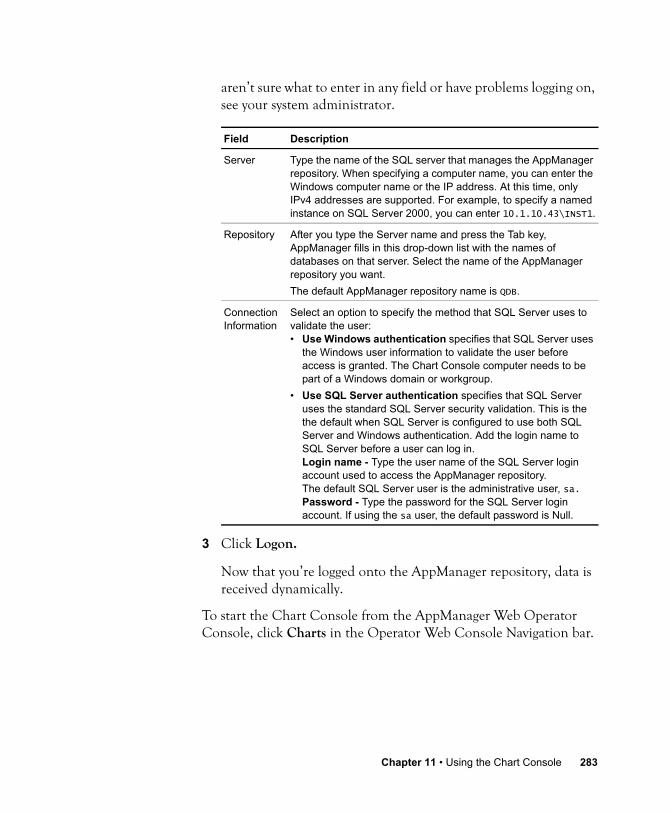
aren’t sure what to enter in any field or have problems logging on, see your system administrator.
3 Click Logon.
Now that you’re logged onto the AppManager repository, data is received dynamically.
To start the Chart Console from the AppManager Web Operator Console, click Charts in the Operator Web Console Navigation bar.
Field Description
Server Type the name of the SQL server that manages the AppManager repository. When specifying a computer name, you can enter the Windows computer name or the IP address. At this time, only IPv4 addresses are supported. For example, to specify a named instance on SQL Server 2000, you can enter 10.1.10.43\INST1.
Repository After you type the Server name and press the Tab key, AppManager fills in this drop-down list with the names of databases on that server. Select the name of the AppManager repository you want. The default AppManager repository name is QDB.
Connection Information
Select an option to specify the method that SQL Server uses to validate the user:• Use Windows authentication specifies that SQL Server uses
the Windows user information to validate the user before access is granted. The Chart Console computer needs to be part of a Windows domain or workgroup.
• Use SQL Server authentication specifies that SQL Server uses the standard SQL Server security validation. This is the the default when SQL Server is configured to use both SQL Server and Windows authentication. Add the login name to SQL Server before a user can log in. Login name - Type the user name of the SQL Server login account used to access the AppManager repository. The default SQL Server user is the administrative user, sa.Password - Type the password for the SQL Server login account. If using the sa user, the default password is Null.
Chapter 11 • Using the Chart Console 283

To view charts from the Operator Web Console, the NetIQ AppManager chart component must be installed by the user; when the user clicks Charts in the navigation bar, the Charts page provides instructions on how to install this component.
Using the Standard Toolbar
The standard toolbar contains buttons for quick access to frequently-used Chart Console commands.
Click To
Create a new chart or add a series to an existing chart.
Delete a selected chart from the Tree pane, or selected series from the Legend pane.
Create a new group to organize charts.
Zoom in on a chart.
Zoom out on a chart.
Reset your view of a chart to the default zoom.
Set the series style for the active chart as Area.
Set the series style for the active chart as Area Stacked.
Set the series style for the active chart as Bar.
Set the series style for the active chart as Bar Stacked.
Set the series style for the active chart as Cylinder.
Set the series style for the active chart as Cylinder Stacked.
Set the series style for the active chart as Line With Points.
Set the series style for the active chart as Ribbon.
284 Control Center User Guide

To show or hide the standard toolbar, click View > Toolbar to select (and show) or to deselect (and hide) the toolbar.
You can move the standard toolbar by dragging the move handle on a docked toolbar or dragging the title bar on a floating toolbar to another location. If you drag the toolbar to the edge of the program window or to a location beside another docked toolbar, it becomes a docked toolbar.
About the Chart ConsoleTo give you the tools to manage and view charts, the Chart Console is organized into two panes. The example below displays a list of charts in the Tree pane and a chart in the Chart pane.
Set the series style for the active chart as Pie.
Rotate your view of the chart in real time.
Reset your view of the chart to the default rotation.
Open the Chart Properties dialog box.
Refresh the chart snapshots or the series in the active chart.
Click To
Chapter 11 • Using the Chart Console 285

Working with Panes
Information about the charts you are managing is grouped in panes:
Working with Chart Snapshots and Charts
A chart snapshot provides an at-a-glance view of the most recent data points for a group of charts. Typically, chart snapshots include fewer data points than a chart.
A chart provides a complete view of the data and allows you to take advantage of the powerful presentation capabilities available in the Chart Console.
In the Tree pane, you can click a group of charts to display them as chart snapshots. In the example below, clicking the NT West group displays two chart snapshots:
To view a chart, you can click the chart you want in the Tree pane or click a chart snapshot.
At the top of each chart is the chart name. The X-axis shows the time the data was taken and the Y-axis shows the value of the data. Use the scroll bar across the bottom of the Chart pane to see data points over time.
Tip If you notice that a chart is missing one or more data points, you should determine if there are any AppManager events to indicate why data points are missing.
This pane Does this
Tree Displays a list of available charts in one or more groups. Use this pane to create charts and organize them into groups, view snapshots of all charts in a particular group, and view a particular chart.
Charts that appear in the Public group can be viewed and edited by console users that have been given this permission. See “Sharing Charts” on page 288 for more information.
Chart Provides an area for displaying chart snapshots or a particular chart.
286 Control Center User Guide

Organizing Charts into GroupsYou can organize the charts in the Chart Console into logical groups. For example, you may want to create a group for all charts related to West Coast computers or create separate groups for charts that serve the Engineering and Finance departments in your organization. You can also create groups within groups, giving you a great deal of flexibility in organizing your Tree pane and managing charts.
As a rule, you can improve the overall performance of the Chart Console by organizing charts into groups. The Chart Console performance can be improved by reducing the number of charts (and the number of data points) that are updated when the Chart Console refreshes. To improve the startup performance of the Chart Console, organize charts into groups so that the top-most level of the Tree pane does not include any charts.
Note You can also improve the overall performance of the Chart Console by configuring the Chart Console preferences to change the refresh interval and the number of data points to display in a chart snapshot and chart. For more information, see “Setting Preferences” on page 307.
To create a group:
1 In the Tree pane, select the group in which you want to create the new group.
2 Click Chart > Add Group.
3 Type a name for the new group.
4 Click OK.
To delete a group:
1 In the Tree pane, select a group.
2 Click Chart > Delete Group.
Chapter 11 • Using the Chart Console 287

3 In the Select Charts to Delete dialog box, select the chart or group of charts you want to delete.
4 Click OK.
Sharing ChartsTo share charts between console users, organize your charts under
the Public group. Charts that appear in the Public group can be viewed and edited by console users that have been given this permission.
If the Public group is not displayed in the Tree pane, check with your AppManager administrator to ensure you have permission to
view and edit charts in the Public group.
For information about defining functional rights, see the Administrator Guide for AppManager.
Creating a ChartUse the Add Data wizard to create new charts and add data streams to existing charts.
If you want to add data streams from a different AppManager repository, each repository must be registered (added) using the Operator Web Console. A list of registered repositories appears in the Add Data wizard.
For information about registering repositories using the
See
Operator Web Console “Adding Repositories to the Portal Page” on page 319
288 Control Center User Guide

To create a new chart:
1 In the Tree pane, select the group in which you want to create the new chart.
To share the chart with other console users, select the Public group. If the Public group is not displayed in the
Tree pane, check with your AppManager administrator to ensure you have permission to view and edit charts in the Public group.
2 Click Chart > Create Chart to start the Add Data wizard.
A snapshot of the new chart appears in the Chart pane.
To add data to an existing chart:
1 Open the chart to which you want to add data.
2 Click Chart > Add to Chart to start the Add Data wizard. The new data streams appear in the currently active chart.
Tip When selecting the data streams you want, select the corresponding Knowledge Script job name. For policy-based jobs and ad hoc jobs started by a Knowledge Script Group, the Knowledge Script Group identifier is prepended to the Knowledge Script job name. For more information, see “How Knowledge Script Groups Work” on page 200.
To delete a data stream from a chart:
1 Right-click a data stream in the Legend pane.
2 Click Delete.
Chapter 11 • Using the Chart Console 289

You have three additional options to start the Chart Console and Add Data Wizard from the Operator Console:
To Do this
Create a chart based on a specific computer
In the TreeView pane of the Operator Console, right-click a computer name and then click Create Chart by Selected Computer. The Add Data Wizard starts at the Data Headers page, listing all data headers available for that computer.
Create a chart based on a specific job
In the List pane of the Operator Console, right-click the job (parent or child) for which you want to create a chart and then click Create Chart by Selected Job. If you right-click on a parent job, the Add Data Wizard starts at the Child Jobs page, listing all child jobs running under that parent job. If you right-click on a child job, the Add Data Wizard starts at the Data Headers page, listing all data headers for that child job.
Create a chart based on a specific data stream
In the List pane of the Operator Console, right-click a data stream and then click Create Chart. The Add Data Wizard will start at the Title page.
290 Control Center User Guide

Changing How a Chart AppearsWhen you view a chart, the grid is set at a default rotation and zoom. By default, the most recent data points appear in the chart.
The following sections discuss how to view the chart data and customize the appearance of the chart.
Working with Chart Toolbars
When viewing a chart, toolbars are available inside the Chart pane to customize how the chart appears.
This toolbar Does this
Time frame Configures the range of chart data to display. Click to select the range you want from the list. Keep in mind, the default period to keep data in the repository available for charts and graphs is 8 days. For example, if there are 8 days of data available for charts, the same 8 days of data would be displayed with the default time frame, All, and This Month and This Year.To configure the chart properties to set the time range, the Time Frame toolbar must be set to All. For more information, see “Changing Chart Properties” on page 298.
Chapter 11 • Using the Chart Console 291

You can show or hide the toolbars by right-clicking a chart and deselecting (to hide) or selecting (to show) the following menu items:
• Show time frame
• Show aggregation
• Show legend
You can move the chart toolbars by dragging the move handle on a docked toolbar or dragging the title bar on a floating toolbar to another location. If you drag the toolbar to the edge of the program window or to a location beside another docked toolbar, it becomes a docked toolbar.
Aggregate Aggregates the chart data and provides an at-a-glance view of all the data points in the chart. Click to select the aggregation interval (by default, aggregation is disabled) you want from the list. To view all data points in the chart at the same time, click to select Fit data to window.Keep in mind, the default period to keep data in the repository available for charts and graphs is 8 days. For example, if there are 8 days of data available for charts, aggregating the data by week would display a single data point. At this time, use the Operator Console to change the AppManager repository preference to keep data for charts and graphs. For more information, see the Operator Console Help.
Legend Provides an easy way to manage the data streams in the chart, including:• Viewing a list of the data streams in the active chart.• Deleting a data stream from the active chart.• Reordering the data streams in a chart. To change the data
stream order, drag a data stream above or below another data stream in the list.
• Changing the properties for a particular data stream. To do this, right-click a data stream and click Properties.
• Viewing the most recent data point in a data stream. To do this, right-click a data stream and click Scroll To.
This toolbar Does this
292 Control Center User Guide
Rotating, Zooming, Panning and Scrolling
In charts that contain multiple data streams, it can be useful to reorient your view of the data in order to have a clearer picture of the relationship between the data streams.
To rotate the grid:
1 Click the Rotate button on the toolbar .
2 Move the mouse over the chart to rotate the view; click to stop the rotation.
Note You can return to the default rotation by clicking the Default Rotation button .
To zoom in and out on the grid:
1 Click the Zoom In button to increase the chart size .
When you click the Zoom In button, the chart size increases.
2 Click the Zoom Out button to reduce the chart size .
When you click the Zoom Out button, the chart size decreases.
Note You can return to the default zoom by clicking the Default Zoom button on the toolbar.
At all times while you are zoomed in, you can pan your view of the data. While you are zoomed in, the cursor changes to the Hand tool. Click and drag to pan across the chart.
Regardless of how you orient your view of the data, you can use the scroll arrows to view any portion of the timeline. The data streams scroll within the confines of the grid.
Chapter 11 • Using the Chart Console 293

Displaying Charts Horizontally
The horizontal chart mode allows you to format or modify a chart so that it appears horizontally (as opposed to vertically, which is the default mode). The horizontal chart mode can be applied to all chart styles except the Pie Chart style.
To display a chart horizontally, right-click a chart and select Horizontal. To return a chart to its vertical orientation, right-click a chart and deselect Horizontal.
Making Data Streams Transparent
If you have a chart with more than one data stream, you can view the data points in each stream at the same time by configuring the data stream to be partially transparent.
To set a single data stream as transparent, in the Legend pane, right-click a data stream name and click Transparent.
To set all data streams in the chart as transparent, right-click in the Chart pane and click Transparent.
Setting Thresholds for a Chart
You can set threshold values and colors for a chart. When you set a threshold, a semi-transparent, colored plane appears along the XZ plane of your chart. You can set thresholds at whatever values you like, providing a quick visual clue to whether data stream values are crossing thresholds. For example, if you are using the NT_MemUtil Knowledge Script to monitor physical and virtual memory use, you can set multiple thresholds to indicate a warning level and a critical level.
Thresholds can be applied to individual data streams or to the entire chart.
294 Control Center User Guide
To set thresholds for a chart:
1 Right-click in the Chart pane, then click Properties.
2 Click the Data Streams tab.
If you want to set a threshold for a particular data stream, select a data stream from the Stream list.
3 Under High Thresholds, click Add. In the Threshold dialog box, select an option to specify how the threshold is applied:
• This data stream only to apply the threshold to the selected data stream (the Z axis of the threshold indicator extends just beyond the Z axis of the data stream)
• Entire chart to apply the threshold to the entire chart (the Z axis of the threshold indicator extends across the entire chart)
4 Type a value for the threshold; select a color for the threshold indicator; and then select Threshold is active.
5 Click OK or repeat steps 4 through 9 to add another threshold.
Reordering Data Streams in a Chart
To improve your view of the data, reorder the data streams in a chart to move a data stream to the foreground or background.
To reorder the series in a chart, in the Legend pane, drag a data stream name from one position in the list to another.
The list of data streams is reordered, and the data streams in the Chart pane are shuffled to reflect the new order.
Chapter 11 • Using the Chart Console 295

Deleting a Data Stream from a Chart
It can be useful to delete a data stream from a chart to improve your view of the data.
To delete a data stream from a chart, in the Legend pane, right-click a data stream name and click Delete.
Viewing a Specific Portion of a Chart
To view data points collected during a specific time period, you can simply scroll through the data visible in the chart, or you can specify a range of data (by date and time) to be displayed in the chart.
To specify the range of data for the chart:
1 Right-click in the Chart pane and then click Properties.
2 Click the Range tab.
3 Select Specify start date.
4 Set a date and time for the beginning of your chart.
5 Select Specify end date.
6 Set a date and time for the end of your chart.
The data streams in the chart show only data collected between the dates and times you specified.
296 Control Center User Guide

Getting Details on Graph Data Points
To see the details of a specific data point, rest the cursor over that point.
A ScreenTip provides detail information, including:
• Computer name
• Type of data
• Value of the data point
• Time at which the data point was collected
• Additional details that vary with the type of data
You can also view data details by double-clicking a data point to open the Graph Data Details dialog box.
The Graph Data Details dialog box lists the same information about a data point that is listed in a ScreenTip for a data point, but has the added functionality of navigating between different points in a data stream using the Previous and Next buttons, and between different data streams in a chart using the Prev. Stream and Next Stream buttons. A arrow indicates which point is selected.
Using the Data Viewer
The Data Viewer uses a columnar format to list the values for each point in each data stream in a chart. Columns increment according to the data stream with the shortest interval. For example, if you chart two data streams, one with a five minute interval and one with a ten minute interval, both columns reflect the five minute interval. One column has a value in each cell, the other has a value in every other cell.
Each column head reflects the color of the corresponding data stream.
To start the Data Viewer, right-click in the Chart pane and click Data Viewer.
Chapter 11 • Using the Chart Console 297

Changing Chart PropertiesThe appearance of each chart can be configured by changing the chart properties. Use the options on the General, Colors, Data Streams, and Range tabs of the Chart Properties dialog box to change chart properties such as frame rate, graphical style and color scheme, threshold values and colors, and dates and times for which data is displayed.
To change chart properties, right-click a chart in the Chart pane and then click Properties. Use the following tabs to specify chart properties:
• General Tab
• Color Tab
• Data Streams Tab
• Range Tab
General Tab
Use this tab to change the properties of the selected chart.
Option Description
View • Perspective: Select to render the chart in perspective. The foremost data stream appears larger than the last one in the chart.
• Parallel: Select to render the chart in orthographic mode. All data streams in the chart have the same size relative to value.
Performance > Frame Rate: (CPU Usage)
Determines the amount of CPU devoted to interactive rendering (rotating, zooming, panning, scrolling). A low frame rate is less fluid, but uses less CPU. A high frame rate offers the best visual performance, but uses 100% of the CPU.
Vertical Maximum • Auto: Select to automatically set the maximum value of the Y axis of the grid to a value greater than the highest point rendered.
• Manual: Select to manually set a maximum value for the Y axis of the grid.
298 Control Center User Guide

Color Tab
Use this tab to change the properties of the selected chart.
Wireframe when rotating, zooming and panning
Select to render the chart in wireframe when rotating, zooming or panning. This option conserves CPU resources.
ScreenTips for data points Select to display a ScreenTip when you rest the cursor over a data point.
Data stream settings • Depth: Move the slider to adjust the depth of each data stream along the Z axis.
• Point Density: Move the slider to adjust the density of data points along the X axis.
Option Description
Scheme Choose a defined color scheme from the list.
Save As Click to save the currently-defined color scheme under a unique name.
Delete Click to delete the current color scheme.
Option Description
Chapter 11 • Using the Chart Console 299

Colors • Title: Select a color for the chart title as it appears in the Chart pane.
• Grid Lines: Select a color for the grid lines in the grid.• Grid Panels: Select a color for the sides and bottom
of the grid.• Time Scale: Select a color for the numbers in the time
line along the X axis.• Left Scale: Select a color for the numbers along the
left Y axis of the grid.• Right Scale: Select a color for the numbers along the
right Y axis of the grid.• Background: Select a background color for the Chart
pane.• Gradient: Select this option to create a gradient for
the background of the Chart pane. Select a color for the bottom of the gradient. The color you selected for Background serves as the top color in the gradient.
• Data Gap: Select this option to fill in missing points in a data stream rendered with the Area option. If a Managed Client stops submitting data for some period during a Knowledge Script job, the gap in points is filled in. Select a color for the area of missing points.
• Data Stream Colors: Click to open the Data Stream Colors dialog box. Use this dialog box to determine which color is applied to each data stream in a chart.
Solid Grid Select this option to render the grid as a solid object.
Show Left Values Select this option to display the values along the Y axis on the left side of the grid.
Show Right Values Select this option to display the values along the Y axis on the right side of the grid.
Option Description
300 Control Center User Guide
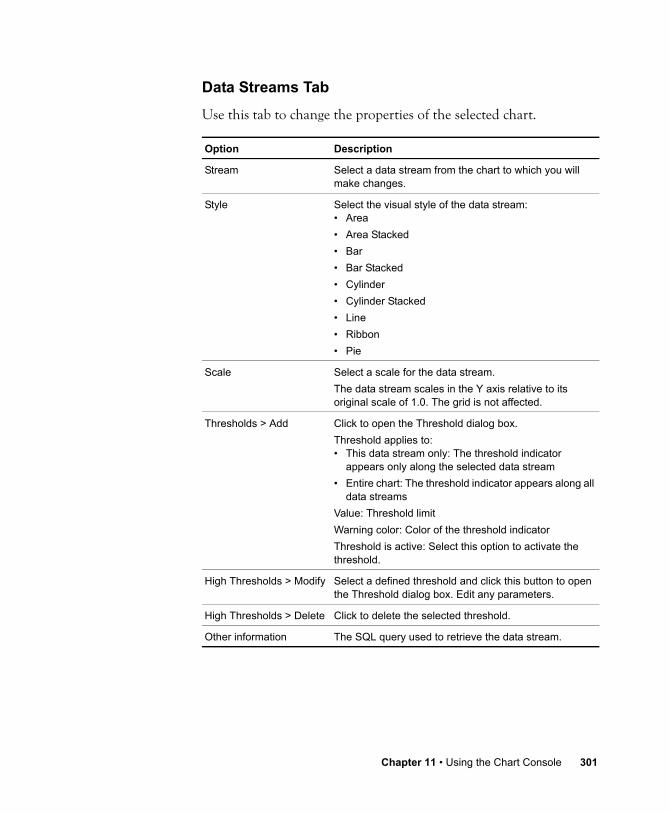
Data Streams Tab
Use this tab to change the properties of the selected chart.
Option Description
Stream Select a data stream from the chart to which you will make changes.
Style Select the visual style of the data stream:• Area• Area Stacked• Bar• Bar Stacked• Cylinder• Cylinder Stacked• Line• Ribbon• Pie
Scale Select a scale for the data stream.The data stream scales in the Y axis relative to its original scale of 1.0. The grid is not affected.
Thresholds > Add Click to open the Threshold dialog box.Threshold applies to:• This data stream only: The threshold indicator
appears only along the selected data stream• Entire chart: The threshold indicator appears along all
data streamsValue: Threshold limitWarning color: Color of the threshold indicator Threshold is active: Select this option to activate the threshold.
High Thresholds > Modify Select a defined threshold and click this button to open the Threshold dialog box. Edit any parameters.
High Thresholds > Delete Click to delete the selected threshold.
Other information The SQL query used to retrieve the data stream.
Chapter 11 • Using the Chart Console 301

Range Tab
Use this tab to change the properties of the selected chart.
If this tab is not displayed, click Cancel to close this dialog box and in the Chart pane, set the Time frame toolbar to All.
Exporting and Printing DataThe Chart Console exports:
• Chart image and data to an HTML- or XML-formatted report
• Chart data to the Windows Clipboard
• Chart data to a text file
• Chart image to the Windows Clipboard
• Chart image to a file
You can export chart data from a selected range of data or all data in a chart.
If you notice that a chart is missing one or more data points, you can export the chart data to a file to identify the missing data points. With this information, you can determine if there are any AppManager events to indicate why data points are missing. For more information, see “Exporting Data to the Clipboard or a File” on page 304.
Option Description
Specify start date Select this option to specify a date and time start limit for the selected data stream.
Specify end date Select this option to specify a date and time end limit for the selected data stream.
302 Control Center User Guide

Selecting a Range of Data Points for Export
Before you can export a range of data, select a range of data points in the chart you want.
To select a range of data points in a chart:
1 Scroll to the area of the chart you want to select.
2 Right-click in the Chart pane, and then click Select Data.
3 A transparent vertical bar is visible along the YZ plane of the grid. Move the mouse to position the vertical bar at the point where your selection begins.
4 Click and drag to highlight a series of data points.
With a range of data points selected, you can export the data. For more information, see the following sections.
Exporting a Chart to an XML-formatted Report
You can export a chart to an XML-formatted report. Using third-party tools, you can publish the XML-formatted report to your Web site.
To export a chart to an XML-formatted report:
1 In the Chart Console, right-click the chart you want and click Export > Report to XML.
2 Specify a location to save the XML file and click Save.
Exporting a Chart to an HTML-formatted Report
Using the HTML Report wizard, you can easily generate an HTML report that includes a snapshot of the most recent data in the chart (or selected portion of the chart) and the corresponding data from each data stream in that portion of the chart timeline.
The report contains as many snapshots and tables as necessary to display all of the exported data.
Chapter 11 • Using the Chart Console 303
You can make the report available to the AppManager Report Viewer or simply view the report by opening the HTML file with a Web browser.
To open the HTML Report Wizard:
1 Right-click in the Chart pane and click Export > Report to HTML.
2 The Wizard prompts you for the information required to generate the report.
3 The Wizard prompts you for a location to place generated files; the generated files are placed into a sub-folder that is named according to the title of the report. For example, if the report name is IIS_CpuHigh (BALQEROW06A12).htm, the report is saved into a folder named IIS_CpuHigh (BALQEROW06A12).
To make the report available to the AppManager Report Viewer, export to the output folder of the report agent. The default output folder is:
<install_dir>\netiq\appmanager\web\report
For more information, see “Configuring Where the Report Agent Generates Reports” on page 184.
Exporting Data to the Clipboard or a File
The Chart Console provides you the options of exporting data to the Windows Clipboard or to a text file. Data exported to the Windows Clipboard can be pasted into a text or spreadsheet program.
When exporting data to a text file, you can specify the data separator, such as comma separated, and the text file can be opened with any text editor.
304 Control Center User Guide

To export data to the Windows Clipboard:
1 In the Tree pane, click a chart and then in the Chart pane, right-click the chart and click Export > Data to Clipboard.
2 Make your selections to determine the range and format of the data you want to export.
3 Click OK.
To export graph data to a text file:
1 In the Tree pane, click a chart and then in the Chart pane, right-click the chart and click Export > Data to File.
2 Specify a location to save the file by entering a filename (including the absolute path) or click the Browse (...) button to specify a path and file.
For Select an option
Export range • All: Select to export all data in the chart.• Selection: Select to export a range of data you have
selected manually. For more information, see “Selecting a Range of Data Points for Export” on page 303.
Order by time • Ascending: Select to order the data by ascending time (earliest data first).
• Descending: Select to order the data by descending time (latest data first).
Include • Short details: Select to include short details for each data point.
Data separator • Tab: Select to use tab stops to separate columns of data.• Other: Select to specify a different column separator (for
example, comma or slash).
Chapter 11 • Using the Chart Console 305

3 Make your selections to determine the range and format of the data you want to export.
4 Click OK.
Exporting Images
The Chart Console provides options for exporting an image to the Windows Clipboard or to an image file. The image is exported as a .png (Portable Network Graphics) file. The exported image is a snapshot of the current view of your chart.
To export an image of a chart to the Windows Clipboard, right-click in the Chart pane, point to Export, then click Image to Clipboard.
You can now paste the image into any application that accepts a picture file.
For Select an option
Export range • All: Select to export all data in the chart.• Selection: Select to export a range of data you
have selected manually. For more information, see “Selecting a Range of Data Points for Export” on page 303.
Order by time • Ascending: Select to order the data by ascending time (earliest data first).
• Descending: Select to order the data by descending time (latest data first).
Include • Short details: Select to include short details for each data point.
Data separator • Tab: Select to use tab stops to separate columns of data.
• Other: Select to specify a different column separator (for example, comma or slash).
306 Control Center User Guide

To export a chart image to a .png file:
1 Right-click in the Chart pane, point to Export, then click Image to File.
2 Select a destination and type a name for the image.
3 Click Save.
Printing Exported Data
There are numerous ways to create a printed report from data you have exported by any of the methods described above.
You can export the data as an HTML report, then use the Print function of your Web browser. You can also print the data from a text editor, word processing program, or spreadsheet program.
Setting PreferencesPreferences control certain aspects of how the Chart Console operates. Chart Console preferences are not applicable when viewing charts in the Operator Web Console.
Chart Console preferences settings are saved to the repository that you are currently logged into and these changes only apply to the Chart Console user who changed the settings.
Chapter 11 • Using the Chart Console 307

To customize preferences for the Chart Console, click File > Preferences; then update the options in the Preferences dialog box.
Preference Description
Refresh Interval The refresh interval specifies how frequently the Chart Console updates the data points for each chart in the currently selected group.At each refresh interval, the Chart Console updates the data streams in the chart snapshots and the current chart (if you are viewing one) to include any data points collected since the previous refresh interval. The default refresh interval is once per minute.Notes • To improve the startup performance of the Chart Console,
organize charts into groups so that the top-most level of the Tree pane does not include any charts.
• To improve the overall performance of the Chart Console, reduce the number of data points that must be updated during a refresh interval by organizing charts into several groups.
Chart snapshots... Configure these options to specify how chart snapshots appear:• Image width This option specifies the width, in pixels, of the
chart snapshot image. The default is 280 pixels.• Image height This option specifies the height, in pixels, of
the chart snapshot image. The default is 190 pixels.• Fetch no more than N points This option specifies the
maximum number of data points that are returned for a chart snapshot. The default is 50 data points. If you specify 0, all points are returned.
Note Chart snapshots provide an at-a-glance view of the most recently collected data points. As a rule, you can improve the overall performance of the Chart Console by reducing the number of data points that are returned for chart snapshots.
308 Control Center User Guide

Charts Configure this option to specify the maximum number of data points that are returned for charts. The default is 2,000 data points. If you specify 0, all points are returned.Keep in mind, the default period that the repository keeps data for charts and graphs is 8 days. If a Knowledge Script is configured to collect data and runs every 10 minutes, the data stream would contain 1152 data points after 8 days.Note Charts display the most recently collected data points. As a rule, you can improve the overall performance of the Chart Console by configuring this setting to show the optimal number of data points you need.
Preference Description
Chapter 11 • Using the Chart Console 309

310 Control Center User Guide

Chapter 12
Using the Operator Web Console
This chapter describes how to use the NetIQ AppManager Operator Web Console to view and manage your computer resources from virtually any location using a Web browser. The following topics are covered:
• What is the AppManager Operator Web Console?
• System Requirements
• Starting the AppManager Operator Web Console
• Working with the Operator Web Console
• Viewing your Enterprise At-a-glance
• Working with Computers
• Working with Jobs
• Working with Events
• Working with Charts
• Working with Reports
• Setting Preferences
Note To use a Web browser as an Operator Web Console, install the AppManager Web management server component. For information about installing that component, see the Installation Guide for AppManager.
311
What is the AppManager Operator Web Console?The NetIQ AppManager Operator Web Console lets you monitor your AppManager environment from a Microsoft Windows server with Microsoft Internet Explorer. Use the Operator Web Console to:
• Check the status of jobs and events.
• View details about the computers you are monitoring and any problems found.
• Enable or disable machine maintenance mode.
• Start and stop Knowledge Script jobs.
• Create and view charts.
• View and print reports.
To change the properties of an existing Knowledge Script job, use the AppManager Operator Console.
The Operator Web Console provides a browser-based version of the major features available from the Operator Console and like the Operator Console, allows you manage servers from a particular AppManager repository. At this time, you cannot use the Operator Web Console with NetIQ AppManager Control Center. This chapter assumes you are already familiar with AppManager features and need to know how they are reflected in the Operator Web Console.
312 Control Center User Guide

The following illustration provides a simplified view of Web access to AppManager, with Active Server Pages installed on the Web management server named coconut and the AppManager repository residing on the computer named mango.
COCONUT(Web management server)
MANGO(AppManager repository and
management server)
Operator Web Console on Microsoft Windows
ASP pages
AppManager data
ASP pages with current information
Operator Consoles
OLEDB and ODBC
ODBC
Chapter 12 • Using the Operator Web Console 313

System RequirementsTo view AppManager information published by the AppManager Web management server, you need Microsoft Internet Explorer 6.0 (or later).
To view charts in Internet Explorer, the Operator Web Console computer must be configured with the following components:
Starting the AppManager Operator Web ConsoleWith the AppManager Web management server component installed, you can then use a Web browser as the Operator Web Console.
To start the Operator Web Console, log on to the AppManager repository with either a SQL Server or Windows user account that has permission to access the repository.
When you start the Operator Web Console, if you haven’t done so already, you are prompted to download and install the AppManager Version Checker program. This program verifies that the correct
Component What it does
MDAC 2.6 Microsoft Data Access Components (MDAC) 2.6 is a prerequisite to viewing charts in Internet Explorer. The setup program for MDAC 2.6 is included on the AppManager installation kit and can be found in the \Prerequisites\Microsoft MDAC folder. Or, download the latest version of MDAC from Microsoft’s web site.
AppManager version checker
Verifies that the correct version of the AppManager chart component is installed. The AppManager version checker must be installed to install the AppManager chart component. When you start the Operator Web Console, if you have not done so already, you are prompted to download and install the AppManager version checker.
AppManager chart component
Allows you to view charts. If the chart component is not installed (and you installed the version checker), when you click Charts in the navigation bar, the Charts page provides instructions on how to install the chart component.
314 Control Center User Guide

version of the AppManager chart component is installed. If you are planning to view charts in the Operator Web Console, install the AppManager Version Checker program.
For information about installing the AppManager chart component and viewing charts in the Operator Web Console, see “About the AppManager Chart Component” on page 342.
1 To start the Operator Web Console:
2 At the Login dialog box, type the names of the SQL Server and repository you want to logon to, and select either Use Windows authentication or Use SQL Server authentication.
• If you select Use Windows authentication, the account under which you are running your Windows session must have access to the AppManager repository.
• If you select Use SQL Server authentication, type the user name of the SQL Server login account used to access the AppManager repository and the password for that account.
Note If you are running SQL Server in Integrated security mode, you are prompted for a user name and password but that information is ignored by SQL Server.
3 Click Logon.
If you are prompted to install the AppManager version checker
From Do this
The Windows desktop Click the Start button, and then click Programs > NetIQ > AppManager > Operator Web Console.
A supported Web browser Go to the URLhttp://<web-server>/NetIQ
In most cases, the <web-server> portion of the URL is the name of your Web management server; it is followed by NetIQ, which is the default installation directory. For example, if the Web management server is installed on the server named coconut, open the URLhttp://coconut/NetIQ
Chapter 12 • Using the Operator Web Console 315

program, click Yes.
The Operator Web Console opens to the Computers page, with the contents of the Master view displayed.
Note If you don’t have access to a particular view, check the security profile of the role that you are assigned in Security Manager or contact your AppManager system administrator.
If you cannot log into the Operator Web Console, your IIS administrator might need to change the IIS Directory Security settings for the Web management server. For more information, see the Installation Guide for AppManager.
Logging Off
When you finish working with the Operator Web Console, you can:
• Click Logout in the Navigation bar.
In this case, you return to the Login page (from which you can connect to another AppManager repository).
• Close the Web browser.
If the Operator Web Console is inactive for a period of time (the default time-out period is one hour), you are automatically logged off to conserve system resources. The current page remains displayed, but when you try to work with the Operator Web Console again, the Logon page opens. To change the timeout period, see “Setting Preferences” on page 343.
Getting Help in the AppManager Operator Web Console
For context-sensitive Help for the Operator Web Console page you are currently viewing, click Help in the Navigation bar.
316 Control Center User Guide
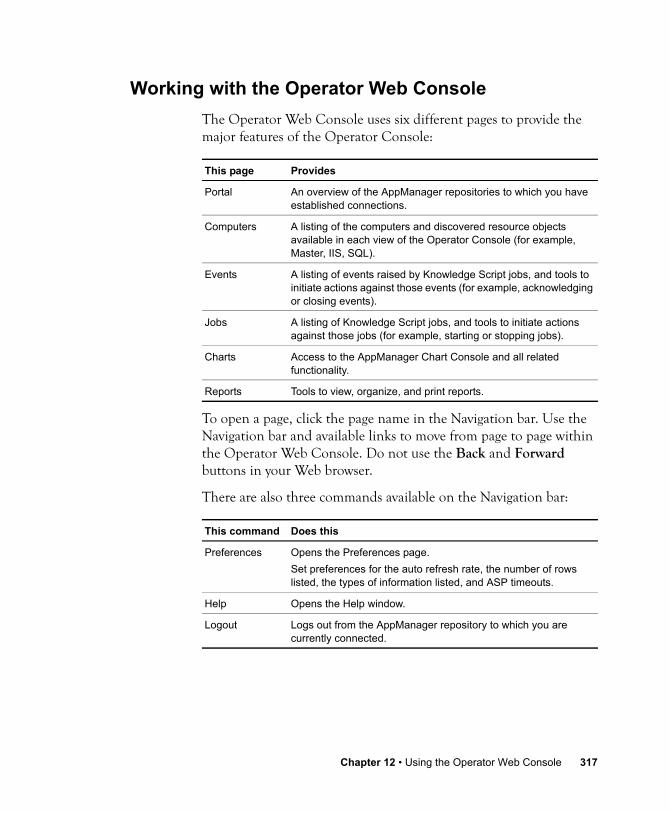
Working with the Operator Web ConsoleThe Operator Web Console uses six different pages to provide the major features of the Operator Console:
To open a page, click the page name in the Navigation bar. Use the Navigation bar and available links to move from page to page within the Operator Web Console. Do not use the Back and Forward buttons in your Web browser.
There are also three commands available on the Navigation bar:
This page Provides
Portal An overview of the AppManager repositories to which you have established connections.
Computers A listing of the computers and discovered resource objects available in each view of the Operator Console (for example, Master, IIS, SQL).
Events A listing of events raised by Knowledge Script jobs, and tools to initiate actions against those events (for example, acknowledging or closing events).
Jobs A listing of Knowledge Script jobs, and tools to initiate actions against those jobs (for example, starting or stopping jobs).
Charts Access to the AppManager Chart Console and all related functionality.
Reports Tools to view, organize, and print reports.
This command Does this
Preferences Opens the Preferences page.Set preferences for the auto refresh rate, the number of rows listed, the types of information listed, and ASP timeouts.
Help Opens the Help window.
Logout Logs out from the AppManager repository to which you are currently connected.
Chapter 12 • Using the Operator Web Console 317
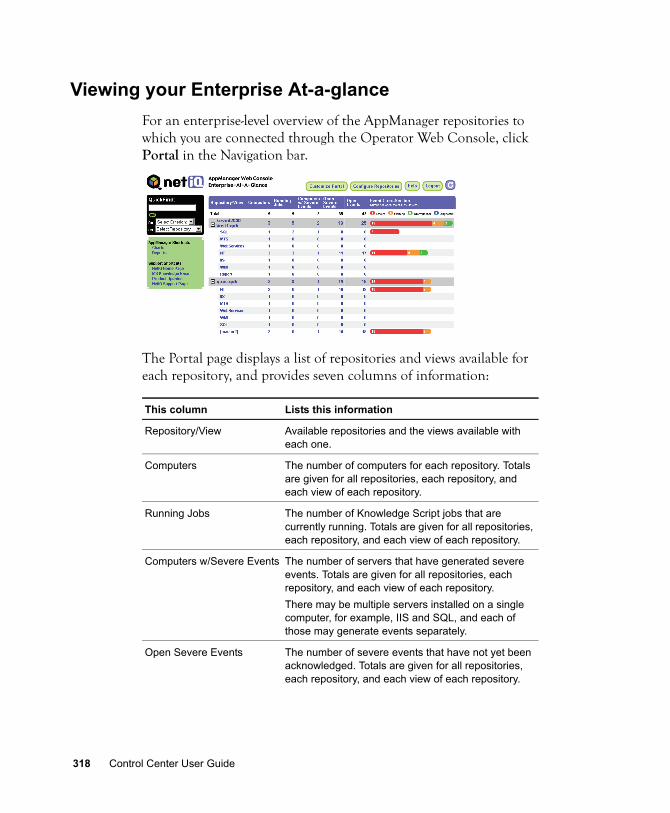
Viewing your Enterprise At-a-glanceFor an enterprise-level overview of the AppManager repositories to which you are connected through the Operator Web Console, click Portal in the Navigation bar.
The Portal page displays a list of repositories and views available for each repository, and provides seven columns of information:
This column Lists this information
Repository/View Available repositories and the views available with each one.
Computers The number of computers for each repository. Totals are given for all repositories, each repository, and each view of each repository.
Running Jobs The number of Knowledge Script jobs that are currently running. Totals are given for all repositories, each repository, and each view of each repository.
Computers w/Severe Events The number of servers that have generated severe events. Totals are given for all repositories, each repository, and each view of each repository.There may be multiple servers installed on a single computer, for example, IIS and SQL, and each of those may generate events separately.
Open Severe Events The number of severe events that have not yet been acknowledged. Totals are given for all repositories, each repository, and each view of each repository.
318 Control Center User Guide

Links on the Portal page
Each repository name, view name, and value (with the exception of the Total row) listed on the Portal page serves as a link. Click any link to open the appropriate page in the Operator Web Console. For example, if you click a repository name, the Computers page for that repository opens; if you click a value under the Running Jobs column, the associated Jobs page opens.
There is also a list of links to other AppManager components, and to support Web sites.
Customizing Information Displayed on the Portal Page
To customize how information is displayed on the Portal page, click Customize Portal to start the Customize Portal wizard.
Adding Repositories to the Portal Page
To add additional repositories to the Portal page, click Configure Repositories to start the Configure Repositories wizard.
Using QuickFind
QuickFind helps you find detailed information about a computer, event, or Knowledge Script job.
Open Events The number of events that have not yet been acknowledged. Totals are given for all repositories, each repository, and each view of each repository.
Event Cross-Section A graphical representation of the numbers of open events by severity level.
This column Lists this information
Chapter 12 • Using the Operator Web Console 319
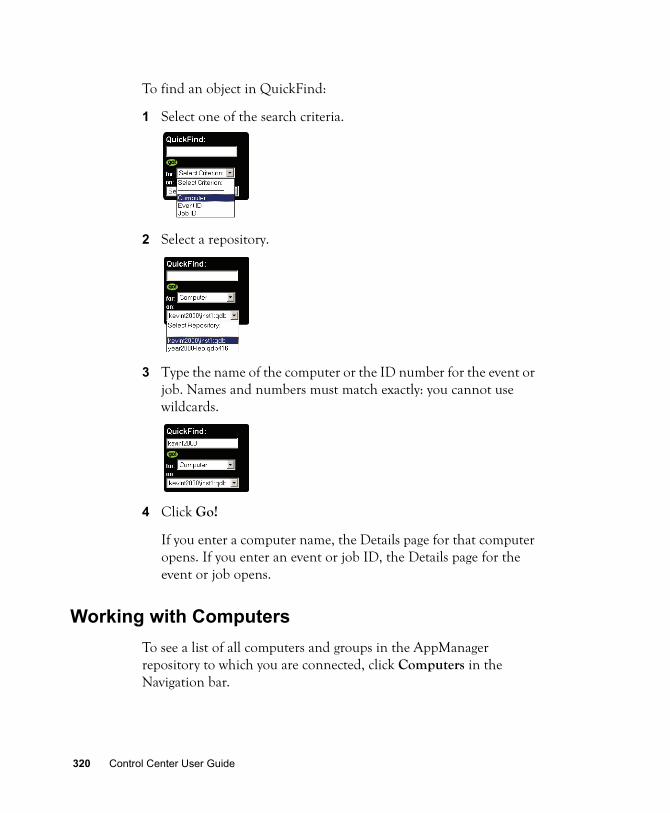
To find an object in QuickFind:
1 Select one of the search criteria.
2 Select a repository.
3 Type the name of the computer or the ID number for the event or job. Names and numbers must match exactly: you cannot use wildcards.
4 Click Go!
If you enter a computer name, the Details page for that computer opens. If you enter an event or job ID, the Details page for the event or job opens.
Working with ComputersTo see a list of all computers and groups in the AppManager repository to which you are connected, click Computers in the Navigation bar.
320 Control Center User Guide
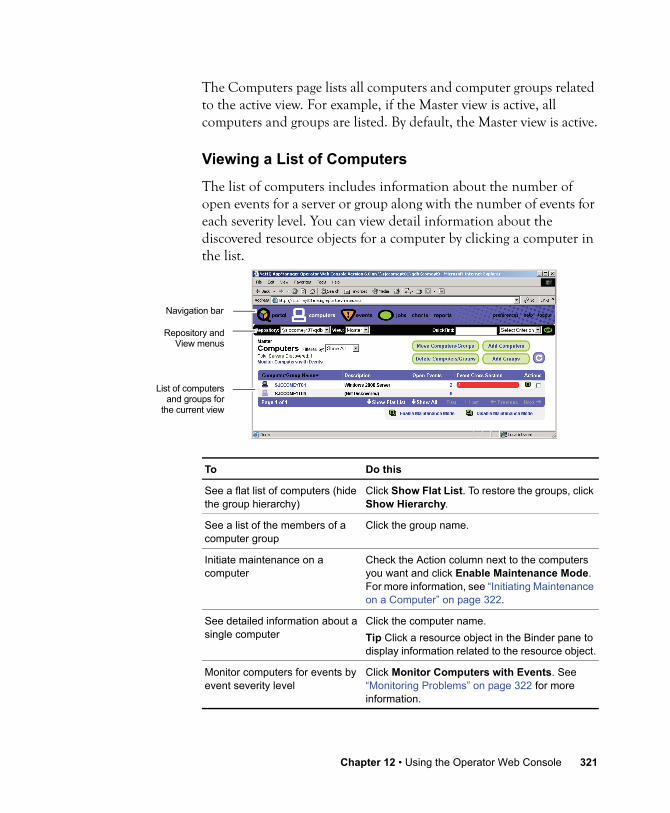
The Computers page lists all computers and computer groups related to the active view. For example, if the Master view is active, all computers and groups are listed. By default, the Master view is active.
Viewing a List of Computers
The list of computers includes information about the number of open events for a server or group along with the number of events for each severity level. You can view detail information about the discovered resource objects for a computer by clicking a computer in the list.
To Do this
See a flat list of computers (hide the group hierarchy)
Click Show Flat List. To restore the groups, click Show Hierarchy.
See a list of the members of a computer group
Click the group name.
Initiate maintenance on a computer
Check the Action column next to the computers you want and click Enable Maintenance Mode. For more information, see “Initiating Maintenance on a Computer” on page 322.
See detailed information about a single computer
Click the computer name.Tip Click a resource object in the Binder pane to display information related to the resource object.
Monitor computers for events by event severity level
Click Monitor Computers with Events. See “Monitoring Problems” on page 322 for more information.
List of computersand groups for
the current view
Navigation bar
Repository andView menus
Chapter 12 • Using the Operator Web Console 321

Monitoring Problems
To find a quick summary of where there are problems and the relative severity of those problems, in the Computers page of the Operator Web Console, click Monitor Computers with Events.
The Monitor Computers with Events list dynamically locates computers with open events and lists those computers according to the severity level of the event.
Initiating Maintenance on a Computer
In the Computers page, you can enable and disable machine maintenance for one or more selected computers. Machine maintenance temporarily block all jobs, events, and data for a particular computer, including jobs that remotely monitor a computer.
To Do this
Select which event severity levels to monitor
Select or clear the Show events check boxes. After you make changes, click Update to refresh the list.
See the events on a computer
Click the computer name. The Events page displays a list of events just for the selected computer. For more information about using the Events page, see “Working with Events” on page 335.
Return to the list of computers
Click Back to Computer List.
322 Control Center User Guide

If you intend to shut down a computer that is managed by AppManager, it is always a good idea to enable machine maintenance before you shut the computer down. In some cases, as the computer is shutting down, a monitoring job may error out because the resource that the job monitors is not available.
To enable machine maintenance on a computer:
1 In the Computers page, check the Action column next to the computers you want to put into maintenance mode.
2 Click Enable Maintenance Mode at the bottom of the list.
To take one or more computers out of maintenance mode use the same procedure but click Disable Maintenance Mode. All the checked computers must be in the same mode and you can only click the option to change to the other mode. Otherwise you get a message to correct the checked computers before retrying the action.
The following icons appear in the Action column when the associated action is available. At the bottom of the computer list, these actions apply to all the computers checked in the Action column.
Action Icon Action
Enable maintenance mode – This computer is not in maintenance mode. Check this box and click this icon here or at the bottom of the list to enable maintenance mode on this computer.
Disable maintenance mode – This computer is in maintenance mode. Check this box and click this icon here or at the bottom of the list to disable maintenance mode on this computer.
Chapter 12 • Using the Operator Web Console 323

Connecting to a Repository
The Repository menu allows you to connect to a different AppManager repository. You can choose from repositories to which you have already established connections, or you can initiate a connection to a new repository.
To reconnect to a repository:
1 Click the Selection arrow on the Repository menu.
2 Click the repository name.
To establish a connection to a new repository:
1 Click the Selection arrow on the Repository menu.
2 Click Configure.
3 Click Add.
4 Enter the logon information for the repository to which you want to connect, then click OK.
5 Click Close.
Selecting a View
The Computers page displays computer information for the selected view. To switch views, click the View menu to select the view you want.
When you switch from one view to another, the Computers page, as well as the Events and Jobs pages reflect information for the selected view. For example, by selecting the SQL view, only jobs, events, and computers associated with monitoring SQL Server are displayed. To return to a more complete view of your environment, click Master in the Navigation bar.
324 Control Center User Guide

Changing the Number of List Items that Are Displayed
By default, the Computers page lists only the first 10 items in any view. If a view contains more items than can be displayed in the current page based on the preference setting, you can view additional pages by clicking a link at the bottom of the page.
For information about changing the number of rows displayed in the Computers page, see “Setting Preferences” on page 343.
Filtering List Items
You can filter list items for the Computers page in order to only show computers that match the filter criteria. For example, the Computers list can be filtered to only show computers that have an open event with a Severe event severity level. Filtering does not apply to the Monitor Computers with Events list.
By default, the Filtered by menu provides two commands:
To apply a filter:
From the Filtered by menu, select the filter you want to apply to the list.
Click To
Show all View all list items in a single page.
First or Last Navigate to the first or last page.
Previous or Next Navigate to between pages.
This command Does this
Show All Removes all filtering from the list.
Edit Filters Opens the Edit Filters dialog box.
Chapter 12 • Using the Operator Web Console 325
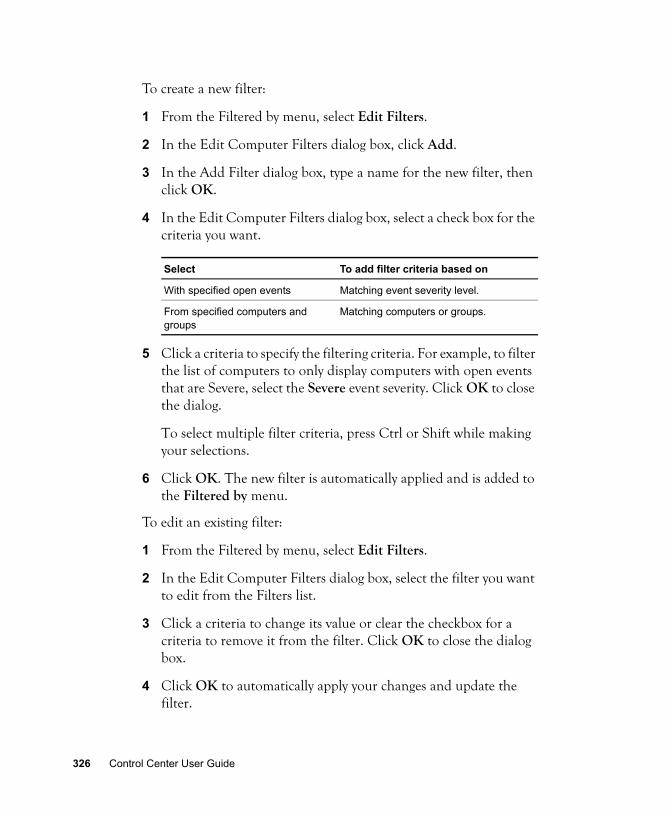
To create a new filter:
1 From the Filtered by menu, select Edit Filters.
2 In the Edit Computer Filters dialog box, click Add.
3 In the Add Filter dialog box, type a name for the new filter, then click OK.
4 In the Edit Computer Filters dialog box, select a check box for the criteria you want.
5 Click a criteria to specify the filtering criteria. For example, to filter the list of computers to only display computers with open events that are Severe, select the Severe event severity. Click OK to close the dialog.
To select multiple filter criteria, press Ctrl or Shift while making your selections.
6 Click OK. The new filter is automatically applied and is added to the Filtered by menu.
To edit an existing filter:
1 From the Filtered by menu, select Edit Filters.
2 In the Edit Computer Filters dialog box, select the filter you want to edit from the Filters list.
3 Click a criteria to change its value or clear the checkbox for a criteria to remove it from the filter. Click OK to close the dialog box.
4 Click OK to automatically apply your changes and update the filter.
Select To add filter criteria based on
With specified open events Matching event severity level.
From specified computers and groups
Matching computers or groups.
326 Control Center User Guide

To delete an existing filter:
1 From the Filtered by menu, select Edit Filters.
2 In the Edit Computer Filters dialog box, click Delete.
3 In the Delete Filter dialog box, select a filter from the Filters list and click OK to delete the filter.
4 Click OK to close the Edit Computer Filters dialog box.
Using Wizards to Manage the List of Computers
The Computers page provides four wizards that let you manage the list of computers:
This wizard Does this
Move Computers/Groups Lets you move computers and server groups to alternate levels of the TreeView.
Add Computers Lets you add computers to the TreeView.
Delete Computers/Groups Lets you delete computers and server groups from the TreeView.
Add Groups Lets you add server groups to the TreeView.
Chapter 12 • Using the Operator Web Console 327

Working with JobsTo view all Knowledge Script jobs related to the active view, click Jobs in the Navigation bar. For example, if the Master view is active, all Knowledge Script jobs are listed; if the SQL view is active, only SQL Knowledge Script jobs are listed.
The initial view of the Jobs page displays a list of parent jobs and provides eight columns of information:
This column Lists this information
Count The number of child jobs under each parent job.The first instance of a Knowledge Script job generates a parent job entry and one child job entry. Subsequent instances of the same job generate additional child job entries under the same parent job.Click the (+) sign or the number to display the list of child jobs for a parent job entry.
Status The status of the job:• Running: the job is currently running.• Stopped: the job is currently stopped.• Pending: the job is waiting to start, or is paused before stopping.• Error: the job has encountered an error.• Closed: the job is no longer in use. Closed jobs are available for
historical purposes, and can be reopened.
328 Control Center User Guide

Viewing Job Details
The first instance of a Knowledge Script job generates a parent job entry and one child job entry. Additional instances of the same job generate additional child entries under the same parent job (for example, if you run a single Knowledge Script job on a server group, there is one child job for each server in the group). The Count column includes a number indicating how many child jobs exist under each parent. The number and the + icon serve as links to the list of child jobs for that parent.
To view the details of a parent job entry, click the Job ID number.
Job ID The ID number of the parent job.Click the parent ID number to display a list of the child jobs and IDs.
Knowledge Script
The name of the Knowledge Script.
Submitted Date and time when the job was first started.
Stopped Date and time the job was stopped.Jobs that are running with a regular schedule display n/a as the stop time.
User The account name that was used to login to the AppManager repository for the session during which the job was started.
Actions Button to start or stop a monitoring job.Check box to select the job for inclusion in multiple actions.Note You cannot stop or start a particular policy-based job; the button is not displayed for a policy-based job.
This column Lists this information
The Count columndisplays the number
of child jobs.
Parent Job ID numbers.
Chapter 12 • Using the Operator Web Console 329
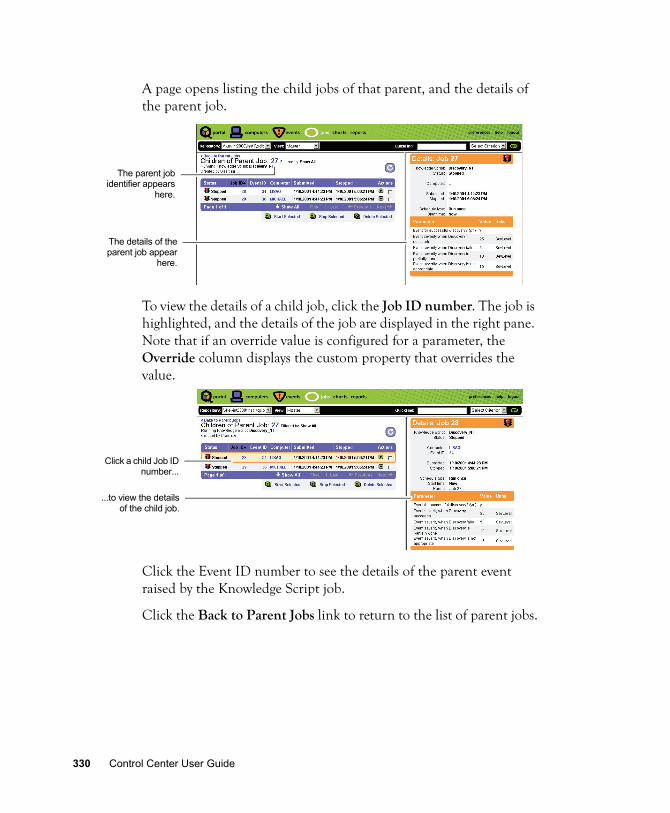
A page opens listing the child jobs of that parent, and the details of the parent job.
To view the details of a child job, click the Job ID number. The job is highlighted, and the details of the job are displayed in the right pane. Note that if an override value is configured for a parameter, the Override column displays the custom property that overrides the value.
Click the Event ID number to see the details of the parent event raised by the Knowledge Script job.
Click the Back to Parent Jobs link to return to the list of parent jobs.
The parent jobidentifier appears
here.
The details of theparent job appear
here.
Click a child Job IDnumber...
...to view the detailsof the child job.
330 Control Center User Guide

Stopping, Restarting, and Deleting Ad Hoc Jobs
The Jobs page allows you to stop, restart, and delete one or more ad hoc jobs. You cannot modify policy-based jobs from the Operator Web Console. Policy-based jobs are displayed with a dimmed checkbox in the Actions column.
To modify policy-based jobs, use the Control Center Console. For more information, see “Monitoring by Policy” on page 197.
To stop, restart, or delete an ad hoc job, check the Action column next to the jobs you want and click one of the commands at the bottom of the page.
Starting a New Job
To start a new job, click Create New Job. In the Create New Job wizard, follow the prompts.
Note You cannot start new AppManager report jobs from the Operator Web Console.
Connecting to a Repository
The Repository menu allows you to connect to a different AppManager repository. You can choose from repositories to which you have already established connections, or you can initiate a connection to a new repository.
To reconnect to a repository:
Click to start the particular job or...
...select the jobs you want...
...and then click a command.
Chapter 12 • Using the Operator Web Console 331

1 Click the Selection arrow on the Repository menu.
2 Click the repository name.
To establish a connection to a new repository:
1 Click the Selection arrow on the Repository menu.
2 Click Configure.
3 Click Add.
4 Enter the logon information for the repository to which you want to connect, then click OK.
5 Click Close.
Selecting a View
The Jobs page displays job information for the selected view. To switch views, click the View menu to select the view you want.
When you switch from one view to another, the Jobs page, as well as the Computers and Events pages reflect information for the selected view. For example, by selecting the SQL view, only jobs, events, and computers associated with monitoring SQL Server are displayed. To return to a more complete view of your environment, click Master in the Navigation bar.
Changing the Number of List Items that Are Displayed
By default, the Jobs page lists only the first 10 items in any view. If a view contains more items than can be displayed in the current page based on the preference setting, you can view additional pages by clicking a link at the bottom of the page.
Click To
Show all View all list items in a single page.
332 Control Center User Guide

For information about changing the number of rows displayed at one time, see “Setting Preferences” on page 343.
Filtering List Items
You can filter list items for the Jobs page in order to view specific subsets of the data available to this page. For example, the Job ID list can be filtered by job status.
By default, the Filtered by menu provides two commands:
To apply a filter:
From the Filtered by menu, select the filter you want to apply to the list.
To create a new filter:
1 From the Filtered by menu, select Edit Filters.
2 In the Edit Computer Filters dialog box, click Add.
3 In the Add Filter dialog box, type a name for the new filter, then click OK.
First or Last Navigate to the first or last page.
Previous or Next Navigate to between pages.
This command Does this
Show All Removes all filtering from the list.
Edit Filters Opens the Edit Filters dialog box.
Click To
Chapter 12 • Using the Operator Web Console 333

4 In the Edit Computer Filters dialog box, select one or more of the available filtering criteria (click either the checkbox or link for each criterion you want to apply).
5 For each criterion selected, a dialog box prompts you to select values. Select as many values as necessary.
For example, if you are filtering the list by open events, possible values for the open events criterion are:
• Severe
• Warning
• Informational
• Diagnostic
6 Click Finish to close the dialog box.
7 Click OK.
The new filter is added to the Filtered by menu.
To edit an existing filter:
1 From the Filtered by menu, select Edit Filters.
2 In the Edit Computer Filters dialog box, select the filter you want to edit.
3 Click a link in the criterion to change its value or deselect a criterion to remove it from the filter.
If you click a link to change a filter, a dialog box prompts you to select a new value. Deselect any value you want to remove and click Finish to close the dialog box.
Select To add filter criteria based on
Of specified state Matching job status (such as Running).
Running on specified computers Matching computers.
Running specified Knowledge Scripts Matching jobs.
334 Control Center User Guide
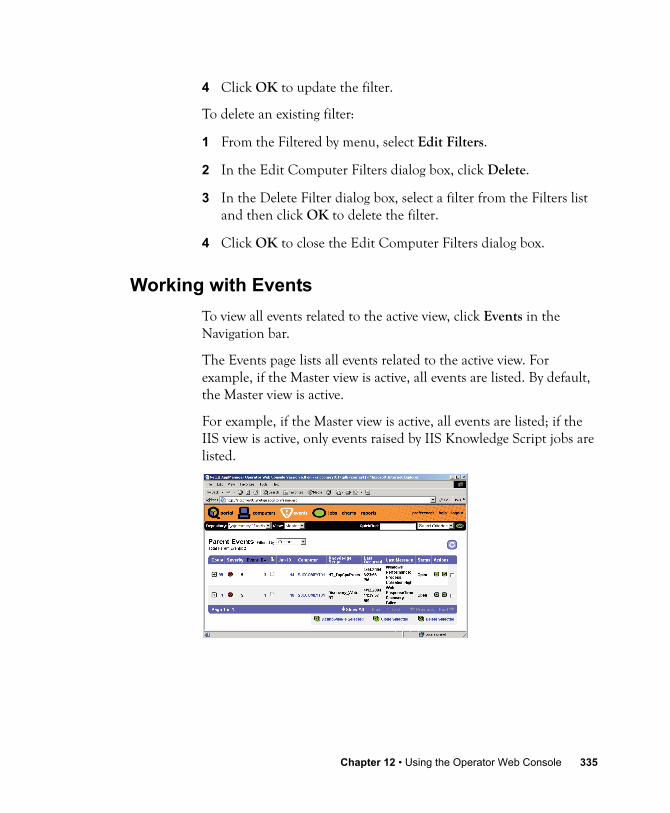
4 Click OK to update the filter.
To delete an existing filter:
1 From the Filtered by menu, select Edit Filters.
2 In the Edit Computer Filters dialog box, click Delete.
3 In the Delete Filter dialog box, select a filter from the Filters list and then click OK to delete the filter.
4 Click OK to close the Edit Computer Filters dialog box.
Working with EventsTo view all events related to the active view, click Events in the Navigation bar.
The Events page lists all events related to the active view. For example, if the Master view is active, all events are listed. By default, the Master view is active.
For example, if the Master view is active, all events are listed; if the IIS view is active, only events raised by IIS Knowledge Script jobs are listed.
Chapter 12 • Using the Operator Web Console 335

The initial view of the Events page displays a list of parent events and provides the following information:
This column Lists this information
Count The number of child events under each parent event.The first event raised by a Knowledge Script job generates a parent event entry and one child event entry. Subsequent events raised by the same job generate additional child event entries under the same parent event.Click the (+) sign or the number to display the list of child events for a parent event entry.
Severity The severity level of the events, including the graphical and numerical indicators.
Event ID The ID number of the parent event.Click the ID number to display a list of the child events.
Comments Whether a comment exists for the parent event and/or any of its children. The icon contains an exclamation mark (!) if a comment exists.Click the Comment icon to display a list of child events. Edit the Comments field as necessary.
Job ID The Job ID of the Knowledge Script job that raised the event.Click the Job ID number to display a list of child jobs, and the details of the parent job.
Computer The computer where the event was raised.Click the computer name to list detailed information about that computer.
Knowledge Script Knowledge Script that raised the event.
Last Occurred Most recent occurrence of the event.
Last Message Most recent message explaining why the event was raised.
Status The current state of the event. An event can have the following states:• Open: the event has been detected, and no one has
responded by acknowledging the event• Acknowledged: the event has been acknowledged• Closed: the event was acknowledged, and then closed
Actions Button to acknowledge or close the event.Check box to select the event for inclusion in multiple actions.
336 Control Center User Guide

Viewing Event Details
The first event raised by a Knowledge Script job generates a parent event entry and one child event entry. Subsequent child events increment the event count and appear under the parent event.
To expand the list of child events, click the + icon or the hyperlinked event count.
To view the details of an event entry, click a hyperlinked event identifier.
A new page lists the child events and the details of the parent event.
To view the details of a child event, click either the Event ID number or the Comment icon.
The Count columndisplays the number
of child events.
The highlighted icon indicates comment information is available for this event.
List of childevents Details of
parent event
Comments field
Chapter 12 • Using the Operator Web Console 337

The event is highlighted and its details appear in the right pane.
To add comments to an event:
1 In the Event Details pane, enter comments in the Comments field.
2 Click Update Comments.
Acknowledging, Closing, and Deleting Events
The Events page allows you to acknowledge, close, and delete one or more events.
To acknowledge, close, or delete an event, check the Action column next to the events you want and click one of the commands at the bottom of the page.
Highlightedevent Details of
child event
Click to close an event or...
...click to select the events you want...
...and then click a command.
...click to acknowledge an event or...
338 Control Center User Guide

Connecting to a Repository
The Repository menu allows you to connect to a different AppManager repository. You can choose from repositories to which you have already established connections, or you can initiate a connection to a new repository.
To reconnect to a repository:
1 Click the Selection arrow on the Repository menu.
2 Click the repository name.
To establish a connection to a new repository:
1 Click the Selection arrow on the Repository menu.
2 Click Configure.
3 Click Add.
4 Enter the logon information for the repository to which you want to connect, then click OK.
5 Click Close.
Selecting a View
The Events page displays event information for the selected view. To switch views, click the View menu to select the view you want.
When you switch from one view to another, the Events page, as well as the Computers and Jobs pages reflect information for the selected view. For example, by selecting the SQL view, only jobs, events, and computers associated with monitoring SQL Server are displayed. To return to a more complete view of your environment, click Master in the Navigation bar.
Chapter 12 • Using the Operator Web Console 339

Changing the Number of List Items that Are Displayed
By default, the Events page lists only the first 10 items in any view. If a view contains more items than can be displayed in the current page based on the preference setting, you can view additional pages by clicking a link at the bottom of the page.
For information about changing the number of list items displayed in the Events page, see “Setting Preferences” on page 343.
Filtering List Items
You can filter list items for the Events page in order to view specific subsets of the data available to this page. For example, the Event ID list can be filtered by event severity level.
By default, the Filtered by menu provides two commands:
To apply a filter, select the filter you want from the Filtered by menu.
To create a new filter:
1 From the Filtered by menu, select Edit Filters.
2 In the Edit Computer Filters dialog box, click Add.
3 In the Add Filter dialog box, type a name for the new filter and click OK.
Click To
Show all View all list items in a single page.
First or Last Navigate to the first or last page.
Previous or Next Navigate to between pages.
This command Does this
Show All Removes all filtering from the list.
Edit Filters Opens the Edit Filters dialog box.
340 Control Center User Guide

4 In the Edit Computer Filters dialog box, select one or more of the available filtering criteria (click either the checkbox or link for each criterion you want to apply).
5 For each criterion selected, a dialog box prompts you to select values. Select as many values as necessary.
For example, if you are filtering the list by open events, possible values for the open events criterion are:
• Severe
• Warning
• Informational
• Diagnostic
6 Click Finish to close the dialog box.
7 Click OK.
The new filter is added to the Filtered by menu.
To edit an existing filter:
1 From the Filtered by menu, select Edit Filters.
2 In the Edit Computer Filters dialog box, select the filter you want to edit.
3 Click a link in the criterion to change its value or deselect a criterion to remove it from the filter.
Select To add filter criteria based on
Of specified status Matching event status.
With specified severity Matching event severity levels.
From specified groups Matching server groups.
From specified computers Matching computers.
From specified Knowledge Scripts Matching jobs.
Occurring within the last specified period
Events that were raised during the specified time period.
Chapter 12 • Using the Operator Web Console 341

If you click a link to change a filter, a dialog box prompts you to select a new value. Deselect any value you want to remove and click Finish to close the dialog box.
4 Click OK to update the filter.
To delete an existing filter:
1 From the Filtered by menu, select Edit Filters.
2 In the Edit Computer Filters dialog box, click Delete.
3 In the Delete Filter dialog box, select a filter from the Filters list and then click OK to delete the filter.
4 Click OK to close the Edit Computer Filters dialog box.
Working with ChartsTo generate and view charts of data streams you have collected using Knowledge Script jobs, click Charts in the Navigation bar.
The Charts page loads an instance of the AppManager Chart Console. For information about using the Chart Console, see Chapter 11, “Using the Chart Console.”
About the AppManager Chart Component
To generate and view charts in the Operator Web Console, install the AppManager chart component.
When you click Charts in the Navigation bar, the AppManager Version Checker verifies that the required version of the AppManager chart component is installed and if necessary, redirects you to a download page with instructions to install the AppManager chart component.
342 Control Center User Guide

If the Chart Console is not displayed and you are not redirected to a download page, make sure you installed the AppManager Version Checker program when you started the Operator Web Console. For more information, see “Starting the AppManager Operator Web Console” on page 314.
Installing the AppManager Chart Component
When using the Operator Web Console in Microsoft Internet Explorer, install the AppManager chart component to view charts. If you click Charts in the Navigation bar and you are redirected to the download page, install the AppManager chart component by clicking the Chart Component hyperlink and when prompted by Internet Explorer, click Open. Once the chart component installation completes, click Charts in the Navigation bar to view charts.
Working with ReportsTo organize, view and print reports, click Reports in the Navigation bar. In the Report Viewer, the left pane displays the available reports. Click to view a report.
To sort the list of reports, select an option from the Grouping list. The Report Viewer enables you to organize reports based on report properties, such as when the report was generated, and by information that is configured in each report, for example, the author of the report. For information about configuring reports with grouping information, see “Setting the Report Values” on page 178.
Setting PreferencesYou can customize some aspects of the Operator Web Console to suit your needs and environment. Changes you make at the Preferences page are saved to the AppManager repository and are reflected each time you log on to the Operator Web Console.
Chapter 12 • Using the Operator Web Console 343

In the Computers, Events, Jobs, Charts, or Reports page, click Preferences in the Navigation bar.
For Do this
Portal preferences • Auto-refresh rate Set the interval (from every 30 seconds to every 20 minutes) for automatically updating the Portal page.The default rate is 1 minute.Select None if you want to minimize system load and communication between the Operator Web Console and the Web server. Click the Refresh button when you want updated information.
Computers preferences • Auto-refresh rate Set the interval (from every 30 seconds to every 20 minutes) for automatically updating the computer list.The default rate is 1 minute.Select None if you want to minimize system load and communication between the Operator Web Console and the Web server. Click the Refresh button when you want updated information.
• List size Select the number of computers you want displayed at one time.The default is 10.
Events preferences • Auto-refresh rate Select the interval (from every 30 seconds to every 20 minutes) for automatically updating the events list.The default rate is 1 minute.Select None if you want to minimize system load and communication between the Operator Web Console and the Web server. Click the Refresh button when you want updated information.
• List size Select the number of events you want displayed at one time.The default is 10.
344 Control Center User Guide

Preferences are saved in a user profile based on the user name and the repository you specified when you logged on to AppManager. If you have more than one AppManager repository, log on to each one to set preferences. You can then open the Operator Web Console using the saved settings from any computer, as long as you use the same logon name and repository.
Jobs preferences • Auto-refresh rate Select the interval (from every 30 seconds to every 20 minutes) for automatically updating the jobs list.The default rate is 1 minute.Select None if you want to minimize system load and communication between the Operator Web Console and the Web server. Click the Refresh button when you want updated information.
• List size Select the number of jobs you want displayed at one time.The default is 10.
ASP timeout preferences
• Script timeout Select the maximum amount of time a script can run before it is terminated.The default is 20 minutes.
• Connection timeout Select the amount of time to wait while attempting to establish a connection before the attempt is terminated.The default is 2 minutes.
• Command timeout Select the amount of time to wait while attempting to execute a command before the attempt is terminated.The default is 20 minutes.
• Session timeout Select the amount of time to keep a session active while there is no user interaction.The default is 1 hour.
General preferences • Starting page Select the page that is active when the Operator Web Console is started.The default is the Computers page.
For Do this
Chapter 12 • Using the Operator Web Console 345

346 Control Center User Guide

Chapter 13
Customizing Menu Extensions
This chapter provides an overview of how to extend the AppManager Utilities menu. You can update the AppManager Utilities menu to add extensible menus for:
• Job views
• Server views
• Event views
• Knowledge Script views
• Service Map views
Extending the Context Menus for ViewsTo extend a context menu, create an XML file that:
• Specifies applications to be launched and parameters to be passed to it.
• Utilizes a replaceable parameter mechanism.
• Supports two types of replaceable parameters:
• Data-centric parameters that map to the selected data in the view. Any column in the view for the current selected set of data can be passed to the command-line utility.
If the column is not displayed in the view, the parameter cannot access the corresponding data.
• System parameters, such as an installation path, in the format %%PARM%%.
• Supports cascading menus in the context menu, up to 2 levels.
347

• Supports multiple selections by use of a separator value.
• Is dropped in \bin directory.
• Is loaded each time the menu is displayed – no need to restart the Control Center Console because of changes.
• Supports multiple XML files - must follow the naming convention <filename>.Extensions.xml.
Example XML Format<?xml version="1.0" encoding="utf-8" ?><MenuExtensions><View TypeID="NQCCEVENTS"><Item Name="AppManager Utilities"><Item Name="Launch Distributed event Console" VisibleOnSingleSelectOnly="true" ><Program>%%_AMPATH%%\bin\NetIQDEC.exe</Program><Parameters></Parameters><Directory></Directory></Item><Item Name="Launch Operator Console"><Program>%%_AMPATH%%\bin\netiq.exe</Program><Parameters Separator="|">/SERVER=%%COMPUTER%% / LOGONNAME=%%_LOGONNAME%%</Parameters></Item><Item Name="Chart Console"><Program>%%_AMPATH%%\bin\AMChartCon.exe</Program><Parameters></Parameters></Item></Item><Item Name="Test" VisibleOnSingleSelectOnly="true"><Program>%%_AMPATH%%\bin\AMChartCon.exe</Program><Parameters>/Path=%%_DCPATH%% /SERVER=%%Computer%% %%_AMOCPATH%%</Parameters></Item> </View></MenuExtensions>
348 Control Center User Guide

Menu Extension XML Keywords• MenuExtensions
• View - An element that contains items (menu items)
• TypeID - This attribute specifies the View ID the contained items will be associated with. The type IDs are as follows:
• NQCCJOBS
• NQCCServers
• NQCCEVENTS
• Item - Represents an item that will appear in the menu.
• Name - an attribute that specifies the name of the item - which will appear as the menu text
• Program - specifies the program to be launched
• Parameters - specifies the parameters to be passed to the program
• Separator - specifies the separator character that will appear between multiple selections
• Directory - specifies the working directory the program will run in (optional)
Note Only the parameters supports handling multiple selected data.
Cascading Menus within Menu ExtensionsTo create a cascading menu, embed one item tag within another:<Item Name="Menu Name"><Item Name="Item 1"> ....</Item><Item Name="Item 2"> ....</Item></Item>
Chapter 13 • Customizing Menu Extensions 349

Event Field Parameters (Data-centric Parameters)• DataSourceName
• Computer
• Severity1
• Severity2
• Status
• ChildComment
• KPName
• LastOccurTime
• Occurrence
• eventMsg
• eventID
• ParenteventID
• jobID
• ModificationTime
• Severity
• CheckStatus
Job Field Parameters (Data-centric Parameters)• DataSourceName
• Computer
• KSName
• SubmitUserName
• jobID
• ParentjobID
• SubmitTime
• LastRunTime
350 Control Center User Guide

• StopTime
• EnterprisejobID
• VirtualjobIDStatus
• ModificationTime
• DropKPObjID
• VersID
• LangID
• SyncTime
• IconStatus
• IconPendingjobStatus
• IconGroupOrPolicy
• IconHasAction,StatusString
Knowledge Script View Parameters (Data-centric Parameters)
• CreateTime
• Name
• Comment
• IconID
• ParentVKSID
• Platform
• Status
• VirtualKSID
• ModificationTime
• VersID
• LangID
• CreateUserID
Chapter 13 • Customizing Menu Extensions 351
• Category
• PlatformText
Server View Parameters (Data-centric Parameters)• DataSourceName
• Computer
• eventSeverity
• ObjID
• TypeName
• TypeID
• Status
• ModificationTime
• jobCount
• Server
• Platform
• SyncTime
• VersIDLangID
• RootMachineObjID
• AgentStatus
• NT_MachineFolder:Product Type
• NT_MachineFolder:OS Version
• NT_MachineFolder:CSD
• NT_MachineFolder:Build Number
• NT_MachineFolder:Install Time,NT_MachineFolder:Current Type
• NT_MachineFolder:System Directory,NT_MachineFolder:NT Domain (role)
• SQLT_Server:ServerName
352 Control Center User Guide
• SQLT_Server:Version
• SQLT_Server:RootDir
• SQLT_Server:MasterDevPath
• SQLT_Server:ErrorLog,SQLT_Server:LoginSecurity
• SQLT_Server:NTeventLogging,SQLT_Server:InCluster
Note There can be many more parameters than are listed here. To discover their correct names, use the _LISTSCHEMA parameter and then go to the debug window.
Control Center Standard Parameters (Built-in Parameters)
• _AMPATH - the path where AM is currently installed.
• _DCPATH - the path where Diagnostic Console is currently installed.
• _MACHINENAME - environment variable.
• _OSVERSION - environment variable.
• _USERDOMAINNAME - environment variable.
• _USERNAME- returns the current logged in NT user - this is not always the same as the user who logs on to the Control Center Console.
• _CURRENTDIRECTORY - environment variable.
• _SYSTEMDIR - environment variable.
• _PERSONALDIR - environment variable.
• _PROGRAMSDIR - environment variable.
• _COMMANDPROGRAMDIR - environment variable.
• _REPOSITORYSERVER - parses the repository column in the current list View and returns the name of the server (e.g. beltaftb01). If multiple selections are specified this function will only be based on the first selected row.
Chapter 13 • Customizing Menu Extensions 353
• _REPOSITORYNAME - parses the repository column in the current list View and returns the name of the repository (e.g. QDB). If multiple selections are specified this function will only be based on the first selected row.
• _REGLOOKUP(hive, subkey, value) - looks up any registry entry and returns its value as a string, for example: %%_REGLOOKUP("HKEY_LOCAL_MACHINE", "SOFTWARE\NetIQ\AppManager\4.0","InstallPath")%%
• _ENVLOOKUP(envVarName) - looks up any environment variable on the console machine, for example: %%_ENVLOOKUP("Path")%%
• _LISTSCHEMA - Lists all column names for the current View type that may be used as a data-centric parameter. This method is useful for determining the real names of the columns.
• _LOGONNAME -The name of the user currently logged into the CC console.
• _LOGONPASSWORD - The password the user logged in to the Control Center Console with.
• _LOGONMODE - The authentication mode of the current Control Center Console user - NT or SQL (0=WinNT, 1=SQL).
• _LOGONSERVER - The server where the Control Center repository database exists.
Debugging Command-line ParametersThe final command-line to be executed can be examined in the Appmanager Control Center 6.5 debug window (accessible via CTRL+F8). To enable this functionality you will need to enable a higher level of detail in the diagnostic window.
The NQConsole.EXE.Config file enables the diagnostic window to display more detailed diagnostic messages. Following is an example of this file - it should be placed in the bin directory.<?xml version="1.0" encoding="utf-8" ?>
354 Control Center User Guide

<configuration><configSections></configSections><appSettings><add key="TRACELEVEL" value="INFO" /></appSettings></configuration>
Note Do not leave this file in place in production environments because it could negatively affect performance.
More Examples<?xml version="1.0" encoding="utf-8" ?><MenuExtensions><View TypeID="NQCCServers"><Item Name="AppManager Utilities" VisibleOnSingleSelectOnly="true"> <Item Name="Chart Console" VisibleOnSingleSelectOnly="true" ><Program>%%_AMPATH%%\bin\amchartcon.exe</Program><Parameters> /SERVER=%%_REPOSITORYSERVER%% / R=%%_REPOSITORYNAME%% %%_AMOCPATH%%</Parameters></Item><Item Name="Diagnostic Console" VisibleOnSingleSelectOnly="true" ><Program>%%_DCPATH%%\bin\rtdc.exe</Program><Parameters> SERVER=%%_REPOSITORYSERVER%% dbname=%%_REPOSITORYNAME%%</Parameters></Item><Item Name="List jobs on Agent via NetIQCtrl"><Program>passthrough.cmd</Program><Parameters>"%%_AMPATH%%\bin\netiqctrl.exe" job %%COMPUTER%% netiqmc</Parameters></Item><Item Name="Operator Console" VisibleOnSingleSelectOnly="true" ><Program>%%_AMPATH%%\bin\netiq.exe</Program><Parameters> /S=%%_REPOSITORYSERVER%% / DB=%%_REPOSITORYNAME%% </Parameters></Item></Item><Item Name="Windows Utilities" VisibleOnSingleSelectOnly="true" ><Item Name="Computer Management" VisibleOnSingleSelectOnly="true" ><Program>compmgmt.msc</Program><Parameters> /computer=%%COMPUTER%%</Parameters></Item><Item Name="Event Viewer" VisibleOnSingleSelectOnly= "true" ><Program>eventvwr.msc</Program><Parameters>/computer=%%COMPUTER%%</Parameters></Item><Item Name="Explore" VisibleOnSingleSelectOnly="true" ><Program>explorer.exe</Program><Parameters> \\%%COMPUTER%%</Parameters></Item>
Chapter 13 • Customizing Menu Extensions 355

<Item Name="Explore C$" VisibleOnSingleSelectOnly="true" ><Program>explorer.exe</Program><Parameters> \\%%COMPUTER%%\C$</Parameters></Item> <Item Name="Ping Machine" VisibleOnSingleSelectOnly= "true" ><Program>passthrough.cmd</Program><Parameters>ping %%COMPUTER%%</Parameters></Item><Item Name="Service Manager" VisibleOnSingleSelectOnly="true" ><Program>services.msc</Program><Parameters> /computer=%%COMPUTER%%</Parameters></Item><Item Name="Terminal Services" VisibleOnSingleSelectOnly="true" ><Program>mstsc</Program><Parameters>/v:%%COMPUTER%%</Parameters></Item><Item Name="Trace Route" VisibleOnSingleSelectOnly= "true" ><Program>passthrough.cmd</Program><Parameters>tracert %%COMPUTER%%</Parameters></Item></Item></View></MenuExtensions>
A Useful Batch File When Running a Command Program
If you want to see the output of a command program, use this snippet to create a batch file that pauses the program automatically:@echo off%1 %2 %3 %4 %5 %6 %7 %8 %9Pause
356 Control Center User Guide