An empirical analysis of transport infrastructure investment and economic growth in Nigeria

i
FUTY JOURNAL OF THE
ENVIRONMENT
Published by
School of Environmental Sciences Modibbo Adama University of Technology
Yola – Nigeria

ii
EDITORIAL TEAM EDITORIAL BOARD
Editor–in–Chief: - Prof. Felix Aromo Ilesanmi Editors - Prof. Abel A. Adebayo
- Prof. A.L. Tukur - Prof. M. Galtima - Prof. T. O. Idowu - Dr. M.A. Husain
Editor/Secretary - Dr. A.M. Mubi EDITORIAL ADVISERS
Prof. H.C. Mba
Department of Urban & Regional
Planning, University of Nigeria,
Enugu Campus
Prof. N.J. Bello
University of Agriculture
Abeokuta.
Prof. K. Ajibola
Dept. of Architecture
Obafemi Awolowo University Ile - Ife.
Prof. M.M. Daura
Dept. of Geography
University of Maiduguri
Prof. O.O. Ayeni
Dept. of Surveying & Geo-informatics
University of Lagos.
Prof. M.N. Ono
Dept. of Surveying & Geo-informatics
Nnamdi Azikinwe University
Akwa.
Prof. R.A.O. Sule
University of Calabar
Calabar.
Prof. O.O. Ogunsote
Dept. of Architecture
Federal University of Technology,
Akure.
Prof. T.C. Davies
Moi University, Eldoret,
Kenya.
Prof. A. Adetoro
Lagos State University
Lagos.
Prof. S. F. Akande
Ajayi Crowther University
Oyo.
Prof. D.A. Muazu
Federal University of Technology
Minna.
Cover Designed by Uchenna Emmanuel Kanu, Dept. of Industrial Design, F.U.T. Yola.
Volume 8, Number 1, June 2014.
Is. 52:7

iii
TABLE OF CONTENTS Title Page i
Editorial Team ii
Table of Contents iii
List of Contributors iv
Editorial v
Notes to Contributors vi
Subscription viii
Cooling Effect of some Materials in Clay Composite Bricks for Tropical Region
- Aderemi Babatunde Alabi, Olayinka A. Babalola, Levi Ikechukwu Nwankwo and
Saminu Olatunji.
1
Modal Choice for Journey to Work in Ilorin, Nigeria
- Adekunle J. Aderamo and Ganiyu K. Abolarin.
8
Delineation of Built-up Areas Liable to Flood in Yola, Adamawa State, Nigeria
Using Remote Sensing and Geographical Information System Technologies
- Isa, Muhammad Zumo and Musa A.A.
20
An Evaluation of Transport and Logistic System Options for Cement Distribution in
Nigeria
- Sumaila AbdulGaniyu Femi
31
Growing Season Rainfall Trends and Drought Intensities in the Sudano-Sahelian
Region of Nigeria
- Godwin O. Atedhor
41
Using SRTM and GDEM2 Data for Assessing Vulnerability to Coastal Flooding due
to Sea Level Rise in Lagos: A Comparative Study
- Aleem, K.F. and Aina Y.A.
53
Analysis of Land Use/Land Cover of Girei, Yola North and South Local
Government Areas of Adamawa State, Nigeria Using Satellite Imagery
- Babalola S.O.; Musa A.A., Adegboyega S.A., Abubakar T. and Ezeomedo I.C.
65
Contextualising Sustainable Infrastructure Development in Nigeria.
- Olanipekun A.O., Aje I.O. and Awodele O.A.
80
Groundwater Quality Assessment for Domestic Uses in the Micro-
Geomorphological Units of Lagos, Nigeria
- Ayeni A.O. and Soneye A.S.O.
93
Geospatial Analysis of Crime Zones in Kaduna Metropolis, Northern Nigeria
- Azua S. and Isioye O.A.
107

iv
LIST OF CONTRIBUTORS Aderemi Babatunde Alabi, Department of Physics, University of Ilorin, Ilorin, Nigeria
Olayinka A. Babalola, Department of Physics, University of Ilorin, Ilorin, Nigeria
Levi Ikechukwu Nwankwo Department of Physics, University of Ilorin, Ilorin, Nigeria
Saminu Olatunji. Department of Physics, University of Ilorin, Ilorin, Nigeria
Adekunle J. Aderamo Department of Geography and Environmental Management,
University of Ilorin, Ilorin, Nigeria
Ganiyu K. Abolarin. Department of Geography and Environmental Management,
University of Ilorin, Ilorin, Nigeria
Isa, Muhammad Zumo Department of Surveying and Geoinformatics, Federal
Polytechnic Damaturu, Yobe State, Nigeria
Musa A.A. Department of Surveying and Geoinformatics, Modibbo
Adama University of Technology, Yola, Nigeria
Sumaila AbdulGaniyu Femi Micromab and Linage Logistics Services, Abuja, Nigeria
Godwin O. Atedhor Department of Geography and Regional Planning,
University of Benin, Benin City, Nigeria
Aleem, K.F. Surveying and Geoinformatics Programme, Abubakar Tafawa
Balewa University, Bauchi, Nigeria.
Aina Y.A. Department of Geomatics Engineering Technology, Yanbu
Industrial College, Yanbu, Saudi Arabia
Babalola S.O. Department of Surveying and Geoinformatics, Federal
University of Technology, Akure, Nigeria
Adegboyega S.A. Department of Remote Sensing and Geographical Information
System, Federal University of Technology, Akure, Nigeria
Abubakar T. Department of Surveying and Geoinformatics, Modibbo
Adama University of Technology, Yola, Nigeria
Ezeomedo I.C. Physical Planning Unit, Anambra State University, Uli,
Nigeria
Olanipekun A.O., Department of Quantity Surveying, Federal University of
Technology, Akure, Nigeria
Aje I.O. Department of Quantity Surveying, Federal University of
Technology, Akure, Nigeria
Awodele O.A. Department of Quantity Surveying, Federal University of
Technology, Akure, Nigeria
Ayeni A.O. Department of Geography, University of Lagos, Lagos,
Nigeria
Soneye A.S.O. Department of Quantity Surveying, Federal University of
Technology, Akure, Nigeria
Azua S. Department of Geomatics, Ahmadu Bello University, Zaria,
Nigeria
Isioye O.A. Department of Geomatics, Ahmadu Bello University, Zaria,
Nigeria

v
EDITORIAL
elcome once again to FUTY Journal of the Environment, a
publication of the School of Environmental Sciences, Modibbo Adama
University of Technology (previously Federal University of
Technology) Yola – Nigeria. This is Volume Eight Number One and we are
pleased keeping the flag flying by sustaining the vision of the School to maintain
a forum for academic discourse.
We in the School of Environmental Sciences, Modibbo Adama University of
Technology Yola hold the view that environmental ignorance can be very
grievous and lack of information on the environment is a serious negligence and
dis-service from environmentalists. We have therefore come to see it as a major
responsibility on our part to continue to provide the much-needed forum for
current discourse on the environment, thus the journal project.
In this issue, we present to you articles in the areas of Cooling effect of some
materials in clay composite bricks for Tropical Region; Modal choice for journey
to work in Ilorin, Nigeria; Delineation of built-up areas liable to flood in Yola,
Adamawa State, Nigeria using remote sensing and Geographical Information
System technologies; An evaluation of transport and logistics system options for
cement distribution in Nigeria; Growing season rainfall trends and drought
intensities in the Sudano-Sahelian Region of Nigeria; Using SRTM and GDEM2
data for assessing vulnerability to coastal flooding due to sea level rise in Lagos:
A comparative study; Analysis of land use/land cover of Girei, Yola North and
South Local Government Areas of Adamawa State, Nigeria using satellite
imagery; contextualising sustainable infrastructure development in Nigeria;
Groundwater quality assessment for domestic uses in the micro-
geomorphological units of Lagos, Nigeria; and Geospatial analysis of crime
zones in Kaduna Metropolis, Northern Nigeria. Each article presents a clear area
of discourse on a contemporary and interesting environmental issue.
The editorial team welcomes articles as prescribed in our call for papers for
subsequent editions of the journal. Once again, welcome to our FUTY Journal of
the Environment.
Prof. Felix Aromo Ilesanmi
Editor-in-Chief
W
vi
NOTES TO CONTRIBUTORS
Prospective authors are to submit three copies of their articles following the structure below:
Title: A brief and short title followed by the name(s) of author(s) and addresses. Author for correspondences should be asterisked.
Abstract: There should be an informative abstract describing the work done, the methods employed, the major findings and implications. The abstract should not exceed 250 words.
Introduction: This should contain a clear background of the subject matter and the study objectives.
Methodology: The materials used and the methods employed in the work should be stated in a very precise term.
Results and Discussions: Here the authors are expected to demonstrated ability to utilise data and synthesize ideas and results in a form of discussion to reveal their findings.
Conclusions and Recommendations: A brief summary of the major findings or conclusions drawn from the study should be given. In addition, the policy implications and/or recommendations from the findings should be stated.
References: References should follow the Harvard Style (i.e. Surname of the author and year of publication). Where there are two authors, both surnames should be used, but where there are three or more authors, the surname of the first may be used followed by et. al. However, the names of all authors must be used in the reference list.
Reference list shall contain the list of all the authors cited in an alphabetical order.
For Books: Surname, Initials, Year, Book Title, Place, Publishers, Pages e.g.
Ayoade, J.O. (1988). Tropical Hydrology and Water Resources. London: Macmillan. 245pp.
For Articles in Journals: Surname, Initials, Year, Title of the article, Journal where it is published, Vol. (No.) and Pages e.g.
Galtima, M. (2002). Estimating disaggregate trip generation and attraction in Maiduguri Metropolis. Annals of Borno. Vol. 17&18, pp.86-100.
For edited Books: Surname, Initials, Year, Article Title, In Surname(s) & List of the Editors (ed/eds), Book title, Place & Publishers e.g.
Sahabo, A.A. (1999). Traditional Industries. In Adebayo, A.A. and Tukur, A.L. (eds) Adamawa State in Maps. Yola, Paraclete Publishers pp.52-54.
The Journal also accepts review papers and short communications.
Refereeing: All papers submitted for publication will be refereed by two or more experts in area appropriate to the subject matter of the paper.

vii
Preparation and Submission of Manuscripts: Please include a processing fee of N2,000.00 with three hard copies.
Arrangement of Papers: Papers should be arranged as follows:
a. Title, author(s), affiliation(s) and full address(es).
b. 200-word abstract outlining the purpose, scope and conclusions of the paper. The abstract should also explain why the paper is important, particularly to those who may not necessarily be in that field.
c. The text, suitably divided into appropriate sections/headings.
d. Acknowledgements (if any)
e. References
f. Tables and figures or illustrations (each on a separate sheet containing no text).
Units Symbols and Abbreviations: Only the SI units as defined by the ISO Standard would be accepted. If you use any symbol or unit that may not be generally recognised, please put an explanatory note in the margin the first time it is used. Abbreviations should be written in full at first mention.
Tables: Tables should be numbered consecutively throughout the paper (with Arabic numerals) referring to them in the text as Table 1, Table 2, etc., with a caption at the top of each table. Avoid the use of vertical rules. Tables should not duplicate results presented in graphs.
Illustrations: Illustrations in the form of maps, diagrams and graphs/charts should be drawn on transparent sheets not larger than A4-size sheets with margins as for the text. They should also be sequentially numbered and given brief titles which should be written below the illustrations.
Final Submission: Final submissions are to be returned to the Editor-in-Chief and should include the paper assessed, the revised version of the paper as amended, an electronic version of the final accepted paper on-line to Journal e-mail address and page charge of eight thousand naira (N8,000.00) only. All payments should be made either in cash or directly to the Journal bank account with the following information:
Account Name: Journal of the Environment Account Number: 2010020837 Bank: First Bank Plc, Yola Market Branch
All correspondence to: The Editor-in-Chief FUTY Journal of the Environment School of Environmental Sciences Modibbo Adama University of Technology P.M.B. 2076 Yola, Adamawa State, Nigeria.
e-mail: [email protected] Tel: 08032788922 or 08026916506

viii
SUBSCRIPTION SCHEDULE
Subscription Schedule Rate (One Issue) N600
NAME…………………………………………………………………………………..
FULL POSTAL ADDRESS…………………………………….………………………
…………………………………………………………………………………………..
I hereby subscribe to the FUTY Journal of the Environment for …………… copies
starting with ………..………… issues of 20……… to………… issues of 20………..
Signature/Date ………………………………………………………………………
All payments should be made either in cash or directly to the Journal bank account with the following information:
Account Name: Journal of the Environment Account Number: 2010020837 Bank: First Bank Plc, Yola Market Branch
All correspondence to:
The Editor-in-Chief FUTY Journal of the Environment School of Environmental Sciences Modibbo Adama University of Technology P.M.B. 2076 Yola, Adamawa State, Nigeria. e-mail: [email protected] Tel: 08032788922 or 08026916506

FUTY Journal of the Environment Vol.8 No. 1, June 2014 1
Cooling Effect of Some Materials in Clay Composite Bricks for Tropical Region
Aderemi Babatunde Alabia *, Olayinka A. Babalolab, Levi Ikechukwu Nwankwo c, Saminu
Olatunjid a, b, c, d , * Department of Physics, University of Ilorin, Ilorin, Nigeria.
Corresponding Author: Aderemi Babatunde Alabia*,
e-mail: [email protected], GSM No. 2348078221339
Abstracts Thermal resistive effect of embedded materials in composite bricks resulting in cooling have
beeninvestigated. Different particulate materials and continuous aligned polyethylene fibers
were usedas supposed thermal resistors in preparing the bricks for houses in tropical region.
The face change in temperature {Outside temperature(T1) – Inner Temperature (T2)} across the
brick insulated with particulate wood dust, paper, PVC, palm kernel, glass and no-material are
27.9, 27.5, 19.0, 24.0, 25.5 and 26.6 °C respectively after 90 minutes and 26.2, 26.3, 17.9, 22.9 ,
22.8 and 24 °C respectively after 120 minutes. It is observed that ΔT°C after 90 and 120 minutes
are higher for wood dust and paper than brick with no-material but lower for PVC, palm kernel
and glass. A high face change in temperature indicates a drop in temperature T2, resulting in
cooling effect if used in building bricks. The same cooling effect was observed when continuous
and aligned polyethylene fibers were used to make fiber – clay composite bricks. A side of each
sample was subjected to heat of about 70°C and heat transferred measured at the other side as
done for particulate embedded bricks. Change in temperature ΔT°C was found to increase with
increasing quantity of polyethylene fibers embedded in the samples 34.2°C (0%), 35.4°C (0.5%),
35.5°C (1%), 35.7°C (1.5%), 36.6°C (2%) and 37.4°C (2.5%), these show that heat transfer
decreases due to decrease in T2 with quantity of fiber. The result shows that the effect is
continuous and tends to equilibrium and the change in temperature becomes steady with time.
Introduction
The clay brick is one of the oldest and most enduring building materials in the world. Clay bricks
have a long history dating as far back as 3000BC, and today they continue to offer a durable and
classically timeless appeal to either traditional or contemporary architecture. With the popularity
of using organic materials in the architecture and interior design, clay brick is experiencing a
resurging popularity. Currently, exposed brickwork is a major trend in modern interiors. In the
move towards loft apartments and business units, it is often the material of choice – for its
industrial-type feel, as well as its durability and its great insulating qualities. A home that is
warm in winter and cool in summer – clay bricks are well noted for their remarkable thermal
insulation properties (Desi, 2011). (http://www.property24.com/articles/clay-bricks-offer-many-
benefits/13301).
Composite bricks are materials composed of two different materials bonded together in such a
way that one serve as the matrix surrounding the reinforcing material. The materials were
combined together but remains uniquely identifiable in the mixture. This is not the same as
making an alloy by mixing two distinct materials together, where the individual component
became indistinguishable. Clay building products have a very long lifetime, require little or no
maintenance and help minimise heating and cooling costs; they therefore provide optimal
economic performance. As a result of these benefits, buildings made from clay building products
have a very positive CO2 balance over their lifetime. Last but not least, they are flexible in use
and provide excellent living conditions and indoor climate due to their porous structure, their
mass and high resistance to fire and moisture.

FUTY Journal of the Environment Vol.8 No. 1, June 2014 2
Heating and cooling costs incurred over the lifespan of a residential building are significant. This
is not only due to monetary considerations but also to the need to reduce CO2 emissions from
residential heating systems - seen by EU-member states as important constituents in meeting
their Kyoto targets (TBE, 2005). Clay bricks are inert and are not prone to off-gassing of volatile
materials. Clay brickwork and its constituents are non-toxic. Clay blocks are unique in offering
high thermal insulation with equally high heat retention properties. This natural air conditioner
ensures a relatively constant indoor temperature as well as protection from the heat in summer.
No other building material is capable of the same. Worldwide it has already been studied the
possibility of improving block wall insulation by increasing porosity of bulk material or by
addition of different ceilings into block voids. Heavy clay blocks are one of the most frequently
used basic materials for construction in Serbia as well as worldwide, so concerning the
increasing tendency to reduce costs production and installation, and at the same time to achieve
better insulating properties, it is necessary to come to new solutions, which would then be
presented to the producers. Existing solutions to this problem are different systems of walls as
well as layers addition like sandwich panels, polystyrene, thermal insulation mortars, etc., but it
significantly increases the cost of objects construction (Arsenovic et al., 2010).
The inside door temperature of building is affected by the three modes of heat transfer:
convection, conduction and radiation. The major portion of heat is transmitted into the building
by conduction mode through the walls in addition to heat losses by air leakage. The composite
walls involve several layers of different materials with different thermal conductivities.
Thermal conductivity of bricks containing different weight percentages of insulating materials
are experimentally determined and compared with thermal conductivity of the bricks which do
not contain any insulating materials. The most effective material among the tested insulating
materials in reducing thermal conductivity is found to be glass wool and natural cork, followed
by wood dust and polystyrene 330, then polyethylene 952 and polyethylene 218. The least
effective insulating materials in reducing the thermal conductivity of the building bricks are
polycarbonate and rock wool (Othman, 2010) .
Porotherm Thermo Brick has borrowed the principle of thermal insulation from nature, to
become a unique walling material - one that keeps the interiors cool in summer and warm in
winter! Clay bricks have been imperative, healthy and efficient construction material for time
immemorial. Wienerberger, the world‘s No.1 in clay building material with 232 plants in 27
countries, actively seeks to bring sustainable, environmental & energy efficient building
materials. Against this backdrop, Wienerberger India has developed India‘s first thermal
insulated brick -Porotherm Thermo Brick www.wienerberger.in/wall/porotherm-thermo-brick..
POROTHERM THERMO BRICK has been packed with special insulating material to achieve
lowest ‗U‘ value of 0.6 W/m²K thus reducing transfer of heat from external environment to the
interior of the building. Unlike walls built with traditional bricks, use of Porotherm Thermo
Brick results in interiors being cool in summer and warm in winter, when compared to the
external temperatures. Consequently this results in savings in energy costs, by reducing artificial
cooling and heating.

FUTY Journal of the Environment Vol.8 No. 1, June 2014 3
Thermal Insulation
Clay brick is traditionally the best building material and Porotherm Thermo Brick is a highly
improved version of clay bricks. Specially formulated insulating material gives Porotherm
Thermo Brick a ‗U‘ Value** of 0.6 W/m²K compared to 1.8 W/m²K for a solid clay brick and
2.0 W/m²K for a solid concrete block. Which means superior thermal insulation that greatly
improves the efficiency of buildings with regards to the use of energy, thereby contributing to the
indoor comfort of the building www.wienerberger.in/wall/porotherm-thermo-brick.
Thermal insulation of bricks with different materials has a challenge especially in regions where
temperature go down to about 10°C and below to freezing stage. In tropic region of the world
where atmospheric temperature ranges between 22 and 35 °C, clay bricks can be thermally
insulated. In other regions of the world, unfortunately, the addition of insulation will change the
thermal and moisture balance of any wall assembly and, in some cases, can initiate moisture
problems such as freeze-thaw damage (Straube and Schumacher 2007) in masonry units by
decreasing the drying capacity while simultaneously reducing the temperature of the inner
wythes . The very real increased risk of freeze-thaw damage has caused many designers and
owners to avoid the addition of interior insulation. This is a major loss of energy saving potential
and often renders a building less comfortable and usable than it would be if insulated (Mensinga
et. al., 2010). Therefore, when planning a retrofit strategy, an engineer or architect can pursue a
strategy in which the predicted in-service moisture load will be less than the critical degree of
saturation of the material. Older load-bearing clay brick masonry buildings are common
throughout North America and are considered good candidates for renovation and conversion:
they are often in desirable urban location, have strong structures, are often aesthetically pleasing
with architectural significance, and have useful window areas and floor plans. Given the current
and expected future energy costs and demands for carbon emission reductions, insulation
retrofits are a highly desirable as part of any modern retrofit of this type of building stock
(Mensinga et. al., 2010).
The tropical city needs an appropriate concept of heat balance of thermal environment. Buildings
with heavyweight material in this area absorb and trap heat and make the environment hotter.
Based on the building material and orientation analysis, the tropical areas need an appropriate
wall panel for east west wall of buildings. The concept consists of several points, such as; 1. The
eastwest wall material should be low in heat capacity and high in thermal insulation. Low heat
capacity wall panel allows a little amount of heat absorption, while high thermal insulation
allows a little amount of heat transferred through the material. 2. The east-west wall material
should have good direct reflection or screening solar radiation to reduce direct heat gain
(Wonorahardjo et. al., 2008).
In addition, The vast natural land depletion is contributed by agricultural land cultivation and
agrobased industry‘s expansion too, to support the survival needs of the human race. The
production and manufacturing processes inadvertently generate large quantities of natural
wastes, such as fibres, pulps and grains, which are disposed of in landfill and open burning.
Besides, the accumulation of unmanaged or improperly managed wastes has raised significant
environmental and sustainable concerns. An on-going effort to counter this vicious cycle is by
interception: to recycle and incorporate these natural wastes in the construction industry,
especially in the manufacturing of building materials. A particularly potential area for the reuse

FUTY Journal of the Environment Vol.8 No. 1, June 2014 4
of these wastes is brick-making. Adding natural fibres in clay bricks has been reported to
improve the compressive strength and flexibility. Apart from that, the baking of composite bricks
with natural fibres and grains leaves a porous structure which consequently enhances thermal
and acoustic insulation of the finished
products (Chee-Ming, 2011).
In this study, we have used several materials as supposed insulating materials such as processed
glass, paper, poly vinyl chloride (pvc), palm kernel shell, wood dust in their particulate forms.
Polyetheyne fibers in their continuous forms and different percentages by volume of fiber 0, 0.5,
1, 1.5, 2 and 2.5 % were also used. These were embedded in layers to produce insulated bricks.
Insulating capacities of the materials were investigated and the insulating effect by the materials
were estimated and compared. The research is channeled towards saving energy in house
cooling, promoting a clean environment and usage of cheaper and reliable materials for building.
Materials and Experimental Techniques
Materials
The main material used in this work is clay used in manufacturing the ordinary bricks for
building houses. Clay are aluminum silicates, being composed of allumia (Al203) and silica
(SiO2) that contain chemically bound water. They have a broad range of physical characteristics,
chemical compositions and structures. The insulating materials used for the alternate-layers
particulate insulated composite bricks are glass, paper, polyvinyl chloride (PVC), palm kernel
shell, wood dust in particle forms. The second set of composite bricks were made using
polyethylene polymer continuous fibers arranged also in alternating layers in the clay to form
composite bricks. The insulating materials were chosen because of their ease of handling and
supposed low thermal conductivity. Other equipments used are the rectangular shaped flat heater,
a variac, a thermometer and furnace.
Experimental Techniques
Clay processed
The first step is called Mining or Winning the clay. After digging the ground to extract the clay,
it was matched to powder and was sieved to remove the stones and get soft fine clay free from
stones. The second step is the Preparation of the clay. The clay was poured in a bowl, a little
amount of water was added to it to serve as a binder to obtain the proper consistency for
molding. The clay used was a red clay extracted and tested by adding a little water to know the
plasticity, after confirming this, it was sieved to get a soft fine texture.
Insulating Materials Processed.
The wood dust was obtained from the wood log, sieved to remove the dirt and make it neater.
The glass was crushed in a mortal, sieved to make it to be in a powdered form. The paper was
soaked overnight, smashed, sun dried and later ground to get the smallest particles. The palm
kernel shell was picked, washed to remove dirt, dried and was later grinded to make the
powdered form. The PVC was cut from the PVC pipe, the pipe was crushed and the powder
remaining was packed. The third step is moulding. After the clay has been prepared into lump,
then we now roll and it is been dash forcefully into the mode. A mode is the wooden box 9.1 cm
x 6.9 cm x 4.3 cm, that gives the bricks its shape. The clay was then pressed into the mode with
hand. The excess clay was scraped to make it flat. After that 60cm3 of the clay would be remove

FUTY Journal of the Environment Vol.8 No. 1, June 2014 5
and will be replaced by the insulator, that is 60cm3 of (glass, paper, wood dust, PVC, and palm
kernel shell) would be added to the make the insulated bricks. Then we now pour back the
remaining clay and we remould it in the box by laminating it with a nylon that the mould will not
stick to the box and we force the lump of clay and insulators into the box layer by layer in the
order of clay-insulator-clay–insulator-clay. And the insulated brick was moulded. The moulded
bricks is been compressed for two days in the box to give it a nice shape and to drain the water.
The bricks were removed from the box after two days and were left to dry at a room temperature
for about seven day to facilitate uniform drying and top preventing warping. After about two
week the bricks were hard and ready to be fired in the furnace. We simply heat the insulated
bricks by placing them in the furnace for one hour at a temperature of 300 °C at long run the
brick became harder and the colour changed to brown.
Measurement of Heat Transfer
The measurement of conductivity of heat through the materials is carried out and described
under a phenomenon of heat transfer in materials which is quite possible due to temperature
changes existing in the material. These was carried out with the use of the heater, by placing the
heater on one side recording the temperature at that point of the heater as outside temperature
(T1) and also recording the temperature from the other side of the bricks inner temperature (T2),
the change in temperature (ΔT) could be measured by the difference between the temperature T1
and T2 which serves as a proof for the conductivity heat in the bricks the temperature is measured
using a digital thermometer in which it measures even the smallest change in temperature, and
was lagged to prevent heat loss during the experiment. The heater used was kept at a maximum
temperature of about 680c.the voltage required is regulated with the use of a variable transformer
voltage regulator (variac) for the heater which reduced the voltage to 40 volts.
Results and Analysis
The Change in Temperature ΔT = (T1 – T2) °C with time is shown in Figure 1 for particulate
insulated composite bricks. The temperature of the first face T1 is about 68°C and the
temperature on the opposite side of the brick is T2. It is observed that the change in temperature
ΔT decreases as T2 increases with time. This is true for all particulate composite bricks and even
the reference clay-only brick. However, the rate of change in face temperature with time differ
from one insulating material to the other. Considering the rate of change after 90 and 120
minutes, it is seen that the change in face temperature ΔT for wood dust, paper, clay only, PVC,
palm kernel and glass are 27.9, 27.5, 26.6, 19.0, 24.0 and 25.5 °C respectively and 26.2, 26.3, 24,
17.9, 22.9 and 22.8 respectively. It is seen that the face change in temperature after 90 and 120
minutes are higher for wood dust and paper than that of clay only but lower for PVC, palm
kernel and glass. A high face change in temperature (ΔT) indicates a drop in temperature T2.
Comparing the ΔT values for only clay brick with that of insulated ones therefore shows that
wood dust and paper insulators will cause a cooling effect if used in building bricks. This is
because the T2 after 90 and 120 minutes for wood dust and paper are lower compared with T2 for
clay only. It implies that using particulate wood dust and paper will give cooling effect if used as
thermal insulating materials for bricks in tropical region. Figure 3 represents the change in
temperature (°C) with time (Secs.) for fiber-clay composite bricks, with 0, 0.5, 1, 1.5, 2 and 2.5
% of fiber by volume. It is observed that temperature difference ΔT, decreases with time for all
the samples but the rate of change in temperature varies with the percentage of fiber in each
sample. The rate of change in temperature increases with fiber content in the bricks. The change

FUTY Journal of the Environment Vol.8 No. 1, June 2014 6
in temperature after 1200 seconds are 34.2 (0% Fiber), 35.4 (0.5% Fiber), 35.5 (1% Fiber), 35.7
(1.5%Fiber), 36.6 (2% Fiber) and 37.2 (2.5% Fiber). This shows that, there is increase in change
in temperature with increase in the percentage fiber content as shown in figure 4. It is an
ndication that the temperature on the opposite side of the composite brick is reducing with
increase in percentage fiber content resulting in cooling effect.
Conclusion
Different particulate materials such as glass, paper, polyvinyl chloride (PVC), palm kernel shell,
wood dust and continuous aligned polyethylene fibers were used as supposed thermal resistors in
developing the insulated bricks for houses in tropical region. The face change in temperature
{Outside temperature (T1) – Inner Temperature (T2)} across the brick insulated with particulate
materials after 90 and 120 minutes are higher for wood dust and paper than that with no-material
but lower for PVC, palm kernel and glass. A higher face change in temperature than that of no
insulating material bricks indicates a cooling effect. It has a benefiting economic advantage in
conserving energy used for cooling. The same cooling effect was observed when continuous and
aligned polyethylene fibers were used to make fiber – clay composite bricks. Change in
temperature ΔT°C was found to increase with increasing quantity of polyethylene fibers
embedded in the samples. This shows that thermal conductivity decreases due to decrease in T2
with quantity of fiber. The use of clay also provides a material with features needed to achieve a
clean environment and it is a reliable materials in terms of fire resistant, durable and cheap.
References Arsenovic M., Lalic Z. and Radojevic Z. (2010). Clay Brick Walls Thermal Properties.
International Journal of Modern Manufacturing Technologies. Vol. II, No. 1, pp. 15-18.
Chee-Ming C. (2011). Effect of Natural Fibre Inclusion in Clay Bricks: Physico-Mechanical
Properties. International Journal of Civil and Enviromental Engineering. Vol. 3, No. 1, pp.
51-57.
Indian Green Building Council. Stay Cool with the Fruits of Technology and Save Energy.
Wienerberger Building Value: POROTHERM Thermo Brick Ultimate in Energy
Efficiency. www.wienerberger.in/wall/porotherm-therrmo-brick.
Inglis C. and Downton P. Material in Use: Clay Brick. Energy Smart Housing Manual, Victorian
Government Cho61. Pp. 166-168.
Kidger P. Nothing Compares to Clay Brick in a Wall: Lightweight Walled Alternate Building
Systems No Match to Double Skin Clay Construction.
Mensinga P., Straube J. and Schumacher C. (2010). Assessing the Freeze-Thaw Resistance of
Clay Brick for Interior Insulation Retrofit Projects.
Othman A.M. (2010). Experimental Investigations of the Effect of some Insulating Materials on
the Compressive Strength, Water Absorption and Thermal Conductivity of Building
Bricks. Jordan Journal of Mechanical and Industrial Engineering. Vol. 4, No. 4, pp. 443-
450.

FUTY Journal of the Environment Vol.8 No. 1, June 2014 7
Ties and Bricks of Europe (2005). The Clay Life Cycle. Stay with Clay: Building in Use.
www.staywithclay.com/default-en.asp.
Wonorahardjo S., Edward B., Olivia D. and Tedja S. (2008). Wall Panel and Material for
Tropical Area Case Study: The City of Bandung, Indonesia. Paper Number: 3897834.

FUTY Journal of the Environment Vol.8 No. 1, June 2014 8
MODAL CHOICE FOR JOURNEY TO WORK IN ILORIN, NIGERIA
Adekunle J. Aderamo and Ganiyu K. Abolarin
Department of Geography and Environmental Management
University of Ilorin, P.M.B. 1515, Ilorin, Nigeria
Corresponding Author E-mail: [email protected]
Abstract
The study examined the modal choice for the journey to work in Ilorin, Kwara State, Nigeria
with a view to discern the pattern. Journey to work when unidirectional leads to a high
congestion problem. This creates a great concern for urban transport planners. Most of the
movements made in cities are dominated by journey to and from work leading to congestion
problems in the two peak periods of morning and evening. Thus a study of modal choice of the
people for journeys to work places is necessary in order to proffer workable solution to urban
transport problems. The study used data collected from the traditional wards in the city through
the administration of 640 questionnaires in a home interview survey using systematic sampling
procedure. The study found that the journey to work in Ilorin were distributed between taxi cabs
(37.5%); private cars (30.2%); motorcycles (13.6%) while trekking, public bus services and staff
buses provided 18.7%.. Multiple regression method was then used to determine the pattern of
journey to work in Ilorin. The results showed that the form of transport and the time taken for
journey to work are significant variables in the explanation of journey to work pattern in Ilorin.
The study recommended that in order to ease the transportation problem of the inhabitants of
Ilorin, intra-urban mass transit services should be provided.
Key words: Transport Modes, Mass Transit, Modal Choice, Private Transport, Public
Transport
Introduction The mode-choice decision implies which type of transport to use to make a trip. The choice of a
particular mode of travel in urban areas is neither a static nor a random process. It is influenced
either singly or collectively by many factors such as speed, journey length, comfort,
convenience, cost, and reliability of alternative mode, the availability of specific travel modes,
town size, age, composition and the socio-economic status of the persons making the journey
(Hanson, 1980).
Journey to work constitutes one of the most common movement patterns in cities. It involves
large number of people, it requires very expensive transport facilities (roads, public transport, car
parks) and it poses some difficult problems to the urban transport planners (See Tolley and
Turton, 1995). Most of all the movements made in cities are dominated by journey to and from
work leading to congestion problems in the two peak periods of morning and evening. An
important issue that is often raised in the study of journey to work is what mode is preferably
used by most employees. Mode choices available in cities exert a very strong influence upon
journey to work. Choice has to be made by employees in terms of transport modes, either private
or public to be used before undertaking the journey to work. Different choices made by workers
regarding transport modes are greatly influenced by some non-transport factors such as income
status, occupational status, sex, age, car ownership, accessibility to public transport and distance
among others.

FUTY Journal of the Environment Vol.8 No. 1, June 2014 9
The contribution of modal choice to the economic development of any urbanized area cannot be
underestimated. Transport provision is seen as a major factor in economic development. Areas
with limited modal choices tend to be among the least developed. Indeed, the developed world
possesses a wide range of modes that can provide services to meet the needs of society and the
economy.
A major problem in developing countries is the concentration of employment in the city centres.
In cases where employment is spatially spread, the road network is poorly designed and planned
in such a way that nearly all movements pass through the city centre to reach work locations.
Thus, journeys to work are often unidirectional or centripetal leading to traffic congestion.
Another related issue is the inefficiency and inadequacy of transport modes which results in
overdependence on roads for all intra-urban movements dominated by journey to work. Also, the
urban poor, who form the greatest number of employees, depend on the same mode of transport
for their journey to work. In cases where jobs are located in the peripheral areas of the city,
which are far distant from the inner core where the majority of the urban poor are forced to live
due to their low income status, they are often faced with mobility and accessibility problem.
The technological advancement in the twenty-first century has brought drastic changes to
transport. In the process of searching for appropriate urban transport planning procedure, details
of modal choice for the journeys made to workplaces, form a significant component in
transportation studies. In addition, consideration has to be given to transport modes in tackling
environmental externalities linked to transportation. Thus a study on modal choice of the people
for their journeys to workplaces is necessary in order to determine any inadequacy or dearth in
terms of modes available and to proffer workable solution that will promote rapid economic
development.
Mode-Choice in Urban Transportation Mode in transport can be defined as the physical way a movement is performed. Transport
modes posses key operational and commercial advantages and properties. They can also
complement each other in terms of costs, speed, reliability, frequency, safety, and comfort with
cost standing out as the most important consideration in the choice of mode (Rodrigue et al,
2006). The selection of a specific transport mode for a particular trip purpose depends upon a
range of factors including the range of modes available, their relative cost, safety factors and
convenience (Hoyle and Knowles, 1998). The journey to work is one of the most commonly
experienced forms of everyday travel, encompassing almost all transport modes, and making a
substantial contribution to urban traffic congestion (Cervero et al., 2003; Kingham et al., 2001).
Also, Salter (1974) opined that trips may be by differing methods or mode of travels and that the
determination of the choice of travel mode is known as modal split.
There is a strong relationship between the purpose of a trip, its frequency, timing, length,
characteristics of participants and the choice of mode to use. Also, access to particular modes is
frequently limited by income (Tolley and Turton, 1995) and the most suitable mode for one trip
may not necessarily be the best for the other. In particular, journey to work is one of the most
common personal movement patterns and has been studied in detail (See Atubi et al., 2004;
Atubi, 2008; De Palma et al., 2000; Blumenberg et al, 2003; Suthanaya, 2011; McKibbin, 2011).
It involves large number of people, requires substantial investment in transport facilities and

FUTY Journal of the Environment Vol.8 No. 1, June 2014 10
presents some of the most intractable problems to the urban transport planner. In many urban
centres, up to 20 percent of all trips are to and from work and these are primarily responsible for
the congestion in the two daily peak travel periods (Tolley and Turton, 1995).
Schaeffer and Sclar (1975) have devised a three-fold trip classification based upon journey
purpose and to a lesser extent, their frequency. These are extrinsic trips, intrinsic trips and
transport generated trips. Extrinsic trips are those made to fulfill a definite objective such as
journeys from home or another origin to the workplace, retail centres or a restaurant or club.
Walking, cycling or motoring trips carried out in connection with recreational or leisure activities
where no real purpose can be identified are described as intrinsic trips. Transport generated trips
comprise of such trips as car journeys to filling stations and repair garages and train and bus trips
to depots during off-peak periods in conurbations.
Hurst (1974) also proposed a three-fold division of trips which he defined as ‗movement space‘
based upon the type and length of trip. Most trips made within a ‗core area‘ such as a major
conurbation where travel to work accounts for a large proportion of all journeys fall into this
category. For example in the UK, 45 percent of all journeys are less than 4km in length and 80%
of all trips of less than 1.6km are made on foot in highly urbanized states. The second category
called ‗median area‘ encompasses less frequently performed journeys including business and
social trips and the third category called ‗extensive area‘ is defined as the total spatial extent
within which people travel and interact.
Comparison has also been made between private transportation and public transportation in
urban transport studies. Private transportation is using one‘s own vehicle like car, motorcycle or
bicycle and even walking. Public transportation on the other hand is passenger transportation
services usually local in scope available to any person who pays a prescribed fare. It operates on
established schedules along designated routes or lines with specific stops and is designed to
move relatively large number of people at one time. Public transport includes modes such as
tramways, buses, trains, subways and ferryboats and its efficiency is based upon transporting
large numbers of people and achievement of economies of scale. Public transport has a major
role to play in most motorized societies as it serves the purpose of collective transportation and
accessible mobility over specific areas.
Many scholars from both developed and developing countries have worked on the modal choice
for journeys to work. Atubi (2008) used gravity model to determine the relationship or
interaction between residential areas in Warri, Nigeria. He found that as transport cost increases
the number of trips with respect to residential areas decreased. De Palma and Rochat (2000)
investigated the mode choice for trips in the city of Geneva using nested logic approach. They
focused on the joint nature of the decision of how many cars to own in the household and the
precision to use the car for the trip to work. Their findings suggest that travel time and travel cost
play a key role in mode split choice between car and transit. McKibbin (2011) used regression
method to determine the influence of the built environment on mode choice in Sydney. The study
revealed that the built environment variables that influenced mode-share to the greatest extent
were destination, accessibility, density, land use diversity and distance to transit.
In the work of Abane (1993), carried out in Accra Ghana, it has been found that formal sector
employees on slightly higher incomes are more demanding of public transport services but that,

FUTY Journal of the Environment Vol.8 No. 1, June 2014 11
overall, modal choice was determined more by personal factors such as age, sex and income than
by characteristics of the transport. Studies in the Philippines and Indonesia demonstrate a
positive relationship between expenditure on transport and household income (Ocamps, 1982).
Studies in Indian cities by Maunder et al (1981) also revealed a similar income-related modal
split with variations dependent largely on the extent to which public transport was available.
Materials and Methods The data used for this study comprised of the number of people using the different modes to
work in the study area, the number of sampled households owning cars and the number who are
non-car owning, determination of the factors affecting modal choice; socio-economic
characteristics of the sampled households; characteristics of the transportation system used in the
study area. These were obtained through both primary and secondary sources in the 20 wards of
Ilorin City.
The wards in the study area as shown on fig. 1.0 are Adewole, Baboko, Balogun Ajikobi,
Balogun Alanamu, Balogun Fulani, Balogun Gambari, Magaji Ogidi, Magaji Oloje, Magaji Are,
Magaji Badari, Magaji Geri, Magaji Ibogun, Magaji Ojuekun, Magaji Okaka, Magaji Zarumi,
Oke-Ogun, Sabon-gari 1, Sabon-gari 2, Uban Dawaki, Zango.
The data used were sourced from the conventional home interview survey. The residential land
use were used as the basis of questionnaire administration. A sample of 1 in 30 dwellings were
selected using the systematic sampling procedure. The sampling was done on dwellings along
main streets. A total of 640 respondents from all the 20 wards of the city were interviewed
during the socio-economic survey.
Source: Kwara State Ministry of Lands and Housing, Ilorin, 2009

FUTY Journal of the Environment Vol.8 No. 1, June 2014 12
The data collected were analysed and presented using bar charts, pie-charts, tables and cross
tabulation. The multiple regression method was also used to analyse factors used for determining
tripmaking patterns. The variables used are INCOME, CAR OWNERSHIP, TRANSPORT
FORM, TIME TAKEN FOR JOURNEY TO WORK, SEX, EDUCATIONAL
QUALIFICATION, MODE OF TRAVEL. The study employed the use of the SPSS (Statistical
Package for the Social Sciences) with the Microsoft Excel 2007.
Results and Discussion
Socio-economic Characteristics of Urban Commuters The pattern of socio-economic characteristics of commuters in Ilorin is as shown on Table 1.0.
This covers the monthly income, educational status and occupational status of commuters.
Table 1.0: Socio-Economic Characteristics of Urban Commuters in Ilorin
Number of Respondents Percentages of Total
Monthly Income
Less than N10,000
N10,000 - N30,000
N31,000 - N50,000
N51,000 - N70,000
Above N70,000
91
331
102
45
70
14.2
51.9
16.0
7.0
10.9
Total 640 100.00
Educational Status
No Formal Education
Primary Education
Secondary Education
Tertiary Education
17
35
239
349
2.7
5.5
37.3
54.5
Total 640 100.00
Occupational Status
Civil Servants
Trading
Transport and Communication
Army Force/Security Officer
Agriculture
Self-Employed/Private
Establishment
Artisan
198
223
30
20
08
119
42
39.9
34.8
4.7
3.1
1.3
18.6
6.6
Total 640 100.00
Source: Authors‟ Field survey.
With respect to monthly income, 91 respondents representing 14.2% of the total earn less than
N10, 000.00 while 331 respondents representing 51.9% earn between N10, 000.00 and N30,
000.00. The analysis shows that 102 respondents representing 16.0% earn between N31, 000.00
– 50,000.00 while 45 respondents representing 7.0% earn between N51, 000.00 – N70, 000.00.
The number of respondents earning above N70, 000.00 stands at 70 represent 10.9% of total
respondents.
The educational status of respondents showed that 17 respondents constituting 2.7% have no
formal education while 35 respondents representing 5.5% have primary education. Also, 239
respondents representing 37.3% have secondary education while 349 respondents constituting

FUTY Journal of the Environment Vol.8 No. 1, June 2014 13
54.5% have tertiary education. The distributional pattern of occupational status of respondents
shows that 198 respondents representing 30.9% are civil servants while 223 respondents
constituting 34.8% are traders. The pattern shows that 30 respondents representing 4.7% engage
in transport and communication while 20 respondents constituting 3.1% are members of the
Armed forces and security personnel. Only 8 respondents representing 1.3% are into agriculture
and 119 respondents representing 18.6% are self employed and in private business. The number
of artisans in the occupational pattern stands at 42 respondents representing 6.6 %.
Modal Choice for Journey to Work The modes considered for journey to work in Ilorin are taxis, private cars, buses, motorcycles,
trekking, and car sharing and staff bus. Table 2.0 shows the pattern of distribution of modal
choice for journey to work in the city. The pattern shows that taxi-cabs dominate modal choice
of journey to work in Ilorin constituting 37.5%. Respondents who take taxi-cabs as modal choice
pointed to safety as the main reason for their decision. Private cars occupy second position as
modal choice to work amounting to 30.2%. High income earners and some of the middle income
residents take private cars to work. Convenience and comfortability are the reasons suggested for
their choice.
The next to private cars is the usage of commercial motorcycle as a means of modal choice to
work trips accounting for 13.6% of the total trips. Facts collected depict that some respondents
used motorcycles for the reason of fastness mostly in areas of high traffic and where competition
for road space is high. In addition, most of the respondents who take motorcycles as their modal
choice do so due to flexibility in the fares charged by commercial motorcycles, unlike
commercial taxi or buses whose routes are fixed and uniform fares are charged.
Another common modal choice to work is trekking or walking which constitutes 12.8%. Poor-
income residents take walking as the mode for journeys to work. Proximity to their residences,
low income level is the reasons put forward by various respondents for making this choice. Bus
commuters constitute 3.6% of the modal choice. This percentage is quite small in contrast to
other cities. This is so because buses are not many in the city and at the same time they are not
geographically distributed.

FUTY Journal of the Environment Vol.8 No. 1, June 2014 14
Table 2.0: Modal Choice of Respondents to their Workplaces S/N Wards Taxi Private
Car
Bus Trekking Motorcycle Car
Sharing
Staff
Bus
Total
1 Adewole 10 16 - 01 03 02 - 32
2 Oke ogun 14 09 - 03 10 02 - 38
3 Sabongari 2 15 18 - 02 03 - - 38
4 Balogun Fulani 13 06 - 14 06 - - 39
5 Oloje 09 07 05 05 04 - - 30
6 Gambari 12 09 03 06 03 - - 33
7 Sarumi 12 08 - 02 03 01 - 26
8 Ajikobi 08 06 03 03 05 01 - 26
9 Oju ekun 12 06 - 02 05 - - 25
10 Mogaji Okaka 12 09 03 03 06 - 01 34
11 Ubandawaki 10 07 - 06 07 - - 30
12 Sabongari 1 09 14 01 05 04 - - 33
13 Mogaji Ibagun 15 11 02 06 05 - 01 40
14 Ogidi 12 14 - 04 - 02 - 32
15 Baboko 17 03 02 02 01 01 - 26
16 Zango 15 11 - 04 05 - - 35
17 Mogaji Ngeri 12 09 - 03 02 01 - 27
18 Badari 08 12 01 02 06 - - 29
19 Mogaji Are 18 11 02 06 02 03 - 42
20 Alanamu 07 07 01 03 07 - - 25
Total 240 193 23 82 87 13 02 640
Percentage 37.5% 30.2% 3.6% 12.8% 13.6% 2.0% 0.3% 100%
Source: Authors‟ Field survey
Source: Authors‘ field survey
Car sharing and staff bus commuters account for only 2.0% and 3.0% respectively. This implies
that these two modal choices are not highly prominent in Ilorin. Figure 2 shows the pattern of the
modal choice of journey to work in Ilorin.
Car Ownership
Legend
Fig. 2.0: Modal Choice of Respondents
37%
30%
4%
13%
14%
2%
Taxi
Private
Bus
Trekking
Motorcycle
Car Sharing

FUTY Journal of the Environment Vol.8 No. 1, June 2014 15
The assessment of respondents with respect to car ownership was considered under three
categories. Table 3.0 shows the distribution. The first group comprise of respondents with no
cars. This carried the largest number of 396 respondents constituting 61.9%. Also, 177
respondents amounting to 27.6% have one car while 67 respondents constituting 10.5% have two
or more cars. The pattern shows that majority of the respondents depend on public transportation
or walking for their means of conveyance for journey to work.
Table 3.0: Car Ownership
S/N Car Ownership Number of Respondents Percentage of Total
1 No Car/Van 396 61.9
2 One Car/Van 177 27.6
3 Two or more Cars/Vans 67 10.5
Total 640 100.00
Source: Authors‘ Field survey
Total Trip making per day per household The marginal percentage of trips made per day per household is shown on Table 4.0. This has
been divided broadly into two categories. The first category who make fairly frequent trips fall
within a marginal percentage of 4.10 – 5.00%. This group of trips were generated by respondents
from Balogun Gambari, Sabongari 1, Sabongari 2; Balogun Fulani; Oloje; Sarumi; Ajikobi; Oju-
ekun; Magaji Ibagun; Ogidi; Baboko; Zango; Mogaji Ngeri. The second group is respondents
classed as making frequent trips of between 5.10 – 6.10 marginal percentage and cover Adewole,
Oke-ogun; Mogaji Okaka; Ubandawaki; Badari; Mogaji Are; Alanamu. The pattern shows that
on the average the marginal percentage share of trips made per household in all the wards range
between 4.10–6.10.

FUTY Journal of the Environment Vol.8 No. 1, June 2014 16
Table 4.0: Total Trip making per Household in a day
Source: Authors‘ Field survey
Modelling Journey to Work in Ilorin
In order to determine the pattern of journey to work in Ilorin, multiple regression method was
used. The model used takes the form
Y = f(X1, X2, X3, X4, X5, X6, X7)
where Y represents the number of trips made in the wards and
X1 = Income of trip makers
X2 = car ownership
X3 = form of transportation
X4 = Time taken for journey to work
X5 = Sex of trip makers
X6 = Educational qualification of trip makers
X7 = Mode of travel used by trip makers
The model was operationalised in the form.
Y = a + b1X1 + b2X2 + b3X3 + b4X4 + b5X5 + b6X6 + b7X7 + e
where Y represents the dependent variable (number of trip made)
X1 – X7 represent the independent variables specified above
b1 – b7 represent the regression coefficients while e is the error term
This approach is similar to that used by Ogunsanya (1987) to examine the factors which
contribute to high cost of food stuffs in urban centres in Kwara State. The technique is capable of
isolating the most important variables that contribute to the problem of investigation.
Surrogate measures were used to measure the independent variables (See Aderamo, 2003).
People employed as a percentage of unemployed people was used to determine Income (INC).
S/N Wards Marginal Percentage
1 Adewole 5.60
2 Oke ogun 5.20
3 Sabongari 2 4.80
4 Balogun Fulani 4.70
5 Oloje 4.60
6 Gambari 4.10
7 Sarumi 5.00
8 Ajikobi 4.70
9 Oju ekun 4.80
10 Mogaji Okaka 6.00
11 Ubandawaki 5.30
12 Sabongari 1 4.10
13 Mogaji Ibagun 5.00
14 Ogidi 5.00
15 Baboko 4.50
16 Zango 4.90
17 Mogaji Ngeri 4.70
18 Badari 6.10
19 Mogaji Are 5.30
20 Alanamu 5.70
Total 100.00
FUTY Journal of the Environment Vol.8 No. 1, June 2014 17
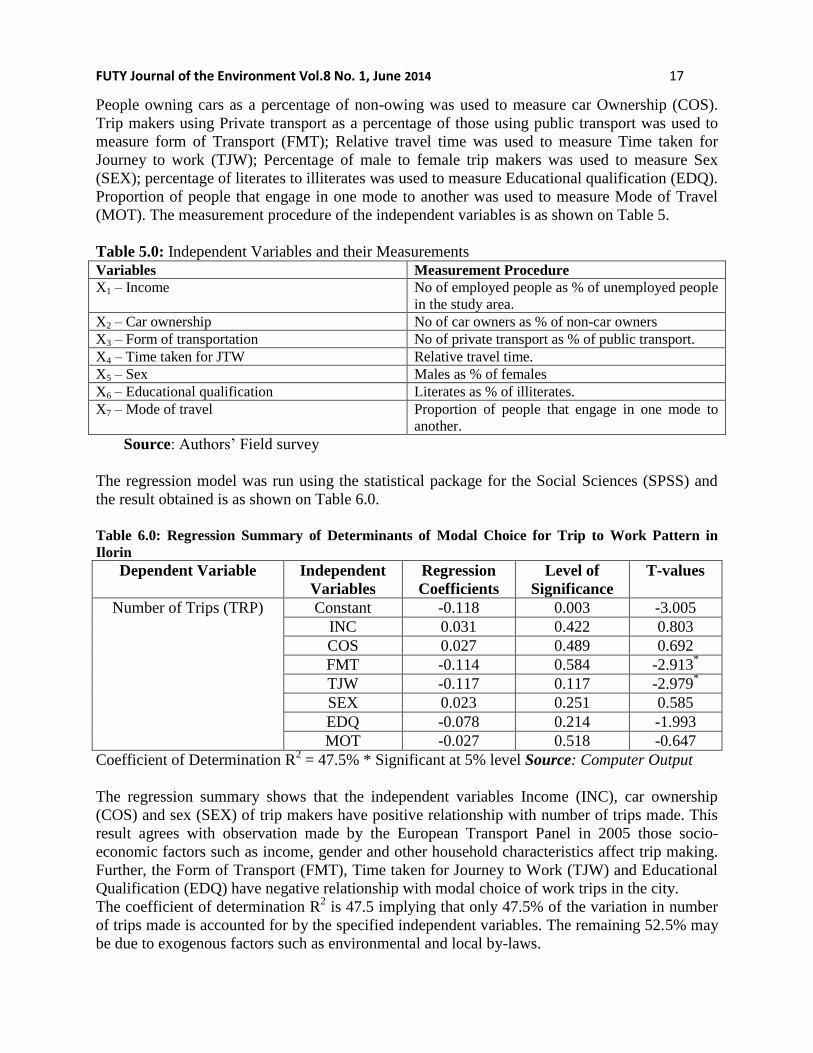
People owning cars as a percentage of non-owing was used to measure car Ownership (COS).
Trip makers using Private transport as a percentage of those using public transport was used to
measure form of Transport (FMT); Relative travel time was used to measure Time taken for
Journey to work (TJW); Percentage of male to female trip makers was used to measure Sex
(SEX); percentage of literates to illiterates was used to measure Educational qualification (EDQ).
Proportion of people that engage in one mode to another was used to measure Mode of Travel
(MOT). The measurement procedure of the independent variables is as shown on Table 5.
Table 5.0: Independent Variables and their Measurements
Variables Measurement Procedure
X1 – Income No of employed people as % of unemployed people
in the study area.
X2 – Car ownership No of car owners as % of non-car owners
X3 – Form of transportation No of private transport as % of public transport.
X4 – Time taken for JTW Relative travel time.
X5 – Sex Males as % of females
X6 – Educational qualification Literates as % of illiterates.
X7 – Mode of travel Proportion of people that engage in one mode to
another.
Source: Authors‘ Field survey
The regression model was run using the statistical package for the Social Sciences (SPSS) and
the result obtained is as shown on Table 6.0.
Table 6.0: Regression Summary of Determinants of Modal Choice for Trip to Work Pattern in
Ilorin
Dependent Variable Independent
Variables
Regression
Coefficients
Level of
Significance
T-values
Number of Trips (TRP) Constant -0.118 0.003 -3.005
INC 0.031 0.422 0.803
COS 0.027 0.489 0.692
FMT -0.114 0.584 -2.913*
TJW -0.117 0.117 -2.979*
SEX 0.023 0.251 0.585
EDQ -0.078 0.214 -1.993
MOT -0.027 0.518 -0.647
Coefficient of Determination R2 = 47.5% * Significant at 5% level Source: Computer Output
The regression summary shows that the independent variables Income (INC), car ownership
(COS) and sex (SEX) of trip makers have positive relationship with number of trips made. This
result agrees with observation made by the European Transport Panel in 2005 those socio-
economic factors such as income, gender and other household characteristics affect trip making.
Further, the Form of Transport (FMT), Time taken for Journey to Work (TJW) and Educational
Qualification (EDQ) have negative relationship with modal choice of work trips in the city.
The coefficient of determination R2 is 47.5 implying that only 47.5% of the variation in number
of trips made is accounted for by the specified independent variables. The remaining 52.5% may
be due to exogenous factors such as environmental and local by-laws.

FUTY Journal of the Environment Vol.8 No. 1, June 2014 18
The results also show that only two independent variables namely Form of Transport (FMT) and
Time taken for Journey to work are significant at 5.0% level of significance. The model obtained
for describing Journey to Work Patterns in Ilorin is
TRP = -0.118 + 0.031INC + 0.027COS – 0.114 FMT – 0.117 TJW + 0.023 SEX – 0.078 EDQ
– 0.027 MOT
Conclusion Journey to work dominates most of the movements made in cities. This trip type if not well
planned for in cities is capable of breeding congestion problems.
Modal choice for journey to work is also important and is usually determined by some socio-
economic variables such as income of trip makers, car ownership, form of transport available,
sex and educational qualifications of trip makers. These variables were considered in the study of
modal choice for journey to work in Ilorin and it was found that the form of transport and time
taken for journey to work are significant factors in determining the pattern of journey to work in
Ilorin.
The study found that journeys to work in Ilorin are shared between taxi cabs, private cars,
motorcycles, trekking, public bus services and staff buses. While public transport is
predominantly patronized by low and middle-income earners, the high income earners use
private cars for their journey to work.
In order to alleviate the transportation problem of residents in the city of Ilorin, the study
recommends that government should provide intra-urban mass transit services in the city and
improve the provision of transport infrastructures.
References Abane, A. (1993). Modal choice for the Journey to Work Among Formal Sector Employees in
Accra, Ghana, Journal of Transport Geography 1(4); 219-224.
Aderamo, A.J. (2003). Changing Structure of Intra-Urban Road Network in Ilorin, Nigeria (1963
– 1999). Ilorin Journal of Business and Social Sciences, 8(1 & 2): 65 – 76.
Atubi, A.O. (2008). Journey to Work Pattern in the Niger Delta: An Empirical Analysis of Warri
and Environs, Journal of Research in National Development, 6 (2): 1-7.
Atubi, A.O; Onokala, P.C. (2004). The Accessibility of Centres to the Road Networks: The Case
of Lagos Island, Lagos, Nigeria, International Journal of Ecology and Environmental
Dynamics, 2: 140-151.
Blumenberg, E.M.; Walter, C. (2003). The Long Journey to Work: A Federal Transportation
Policy Working Families, Bookings Institute Series on Transportation Reform, July 2003:1-
9.

FUTY Journal of the Environment Vol.8 No. 1, June 2014 19
Cervero, R; Tsai, Y. (2003). San Francisco City Carshare: Second-Year Travel Demand and Car
Ownership Impacts, Journal of the Transportation Research Board, 1887 (2004): 117-127.
De Palma, A; Rochat, D. (2000). Mode Choices for Trips to Work in General: An Empirical
Analysis, Journal of Transport Geography, 8:43-51.
Hanson, S. (1980). The Importance of the Multi-purpose Journey to Work in Urban Travel
Behaviour. Transportation, 9 (3): 229-248.
Hoyle, B; Knowles, R. (1998). Modern Transport Geography. New York: John Wiley & Sons.
Kingham, S.J; Dickson, S; Copsey, C. (2001). Travelling to Work: Will People Move Out of
their Car? Transport Policy, 8:151-160.
Maunder, D.A.C; Fouracre, P.R; Pathak, M.G; Rao, C.H. (1981). Characteristics of Public
Transport in Indian Cities. Crowthorne: Transport and Road Research Laboratory Report
No. 706.
McKibbin, M. (2011). The Influence of the Built Environment on Mode Choice: Evidence from
the Journey to Work in Sydney, Australasian Transport Research Forum, 2011, Proceedings
28 – 30 September, 2011, Adelaide, Australia.
Ocampo, R.B. (1982). Low cost vehicles in Asia. Ottawa: International Development Research
Centre.
Palaciono, T.B; Comtois, C; Slack, B.S. (2005). The Geography of Transport Systems.
Routledge, London and New York.
Rodrigue, J.P; Comstois, C; Slack, B.S. (2006). The Geography of Transport Systems.
Routledge, London and New York.
Schaeffer, K.H; Sclar, K. (1975). Access for All: Transportation and Urban Growth. Penguin,
Harmondsworth.
Suthanaya, P.A. (2011). Analysis of Journey to Work Travel Behaviour by Car and Bus in the
Sydney Metropolitan Region, Civil Engineering Dimension, 13(1): 21-28.
Tolley, R.S; Torton, B.J. (1995). Transport Systems, Policy and Planning: A Geographical
Approach. New York: Longman Group Ltd. Harlow England, John Wiley & Sons.

FUTY Journal of the Environment Vol.8 No. 1, June 2014 20
Delineation of Built-up Areas Liable to Flood in Yola, Adamawa State, Nigeria
Using Remote Sensing and Geographic Information System Technologies
1Isa, Muhammad Zumo and
2Musa A. A.
1 Dept of Surveying & Geoinformatics, Federal Polytechnic Damaturu, Yobe State, Nigeria
2 Dept of Surveying & Geoinformatics, Modibbo Adama University of Tech Yola Adamawa St. Nigeria
1GSM: 08066011217
2GSM:08036127598
Abstract This study used the techniques of Remote Sensing and Geographic Information System (GIS) to
identify the built up areas within Jimeta/Yola town that are liable to flood. Ikonos image and a
topographic map covering the study area were used. Built up area was extracted from the image
while an elevation model was created from the topographical map. The built up area was
overlaid on the elevation model. Those within the flood plain are liable to flood while those
outside the floodplain are not liable to flood. The result shows that Jambutu area in Jimeta has
the highest risk of flooding; the flooded area covers 12.296 hectares. In Yola, most portion of
Damare area is a flood vulnerable area. It covers an area of 1.759 hectares. The total area likely
to get flooded in Jimeta/Yola town is 15.636 hectares.
Keywords: Built-up area, Flood, Floodplain, Georeference, River Benue, Yola-Jimeta
1.0 Introduction Flooding is one of the numerous natural disasters that affect lives and properties. Over the past
decades, the pattern of floods across all continents has been changing, becoming more frequent,
intense and unpredictable for local communities, particularly as issues of development and
poverty have led more people to live in areas vulnerable to flooding (Dabara, 2012). The Fourth
Assessment Report of the Intergovernmental Panel on Climate Change IPCC (2007) predicts that
‗heavy precipitation events, which are very likely to increase in frequency, will augment flood
risk‘. Observation has shown that, with an increasingly urbanizing world flood disasters are
reportedly increasing in urban areas, and particularly negatively impacting on poor people and
urban development in general (Alam et al., 2008). The lives and livelihoods of many poor people
are hardest hit by floods. In the past, flood had not only left several people homeless but had
destroyed properties and disrupted business activities. Floods ravaging communities also
threaten to expose residents to cholera, diarrhea, malaria, skin infections and other water-borne
diseases causing epidemic (Etuonovbe, 2011).
The magnitude of flood disaster is not determined by water alone but also by the pattern of
vulnerability in which people live. Dabara (2012); Henderson (2004) and Temi (2009); asserted
that the level of risk and vulnerability in urban areas of developing countries is attributable to
socio-economic stress, aging and inadequate physical infrastructure. Nigerian urban areas are
typical examples of this high level of risk and vulnerability (Olorunfemi, 2008). Many risk
problems sit at the interface of the natural and social environment, such as flooding, which
occurs as the result of the inadequate provision and maintenance of drainage systems, the
location of people on marginal sites, and the physical characteristics of an area Olorunfemi
(2008); Cliff et al. (2009), Hualou (2011); Bariweni et al., (2012).

FUTY Journal of the Environment Vol.8 No. 1, June 2014 21
Urbanization exacerbates the damages cause by flooding by restricting where flood or storm
waters can go. Large parts of the ground with roofs, roads and pavements are covered,
obstructing sections of natural channels and building drains that ensure that water moves to
rivers faster than it did under natural conditions. In an urbanizing environment, the infiltration
capacity is reduced by the replacement of ground cover with impervious urban surfaces
(Odemerho, 1988; Ojigi et al., 2013).
The floodplains of the River Benue in Yola and Jimeta and adjoining areas of Dasin-Hausa,
Fufore, Ngwalam and Numan where the flood-plains have been abused due to haphazard
physical developments, illegal erection of buildings and other structures and the unhealthy habit
of dumping refuse and other solid wastes in the usually open drainage channel systems, are some
of the highly vulnerable areas to flood waters in Adamawa State. While, flood hazard is natural,
human influence in the urban modification and alteration in the urban space can exacerbate the
problem. The disastrous consequences are dependent on the degree of human activities and
occupancy in vulnerable areas (Musa, 2010; Oludare et al., 2012). Jimeta-Yola is a typical
example of such settlements experiencing floods. The incidence of flooding in this city has been
closely linked to its close proximity to River Benue. Given the high spatial concentration of
people and values within the floodplains in cities, even small scale floods may lead to
considerable damages. Recent statistics clearly indicate that economic damages caused by urban
floods are rising (Ojigi et al., 2013).
Information on flood event, flood wave characteristics are desirous since and floodplain
topography is dynamic as well historic flood may not be representative for present conditions
Panayotis (2008). Assessing the impacts of and vulnerability to climate change and flood and
subsequently working out adaptation needs requires good quality information. This information
includes climate data, such as temperature, rainfall and the frequency of extreme events, and
non-climatic data, such as the current situation on the ground for different sectors including
water resources, agriculture and food security, human health, terrestrial ecosystems and
biodiversity, (Kolawole et al, 2011). In many instance, the patterns of urban form and buildings
in Nigeria do not take current and future hazards into account, resulting in increased scales and
levels of risk from floods.
The use of Remote Sensing and GIS techniques for identifying flood prone areas is now
becoming the norm rather than the exception. (Eric, 1999; Kulapramote, 2011) developed an
interactive process that takes advantage of Arc‘s GRID, ARCEDIT and ARCPLOT modules,
integrated with watershed and river modeling software, to develop flood –prone area maps. Lear,
stressed that, wide spread availability of digital elevation data and GIS software permit the
automation of the time-consuming tasks associated with flood-prone area delineation using
approximate methods. This paper therefore focuses on mapping the built-up areas within
Jimeta/Yola town that are liable to as well as vulnerable to flooding. Such maps, it is believed
would show the total land area liable to flooding so as to provide baseline information for
mitigation measures and land use planning and activities to be considered.

FUTY Journal of the Environment Vol.8 No. 1, June 2014 22
2.0 Materials and Methods
2.1 Equipment/Materials Used i. Pentium III computer (1.79GHz, 512MB of RAM)
ii. Ashtech 12XL (Handheld) Global Positioning System receiver (GPS).
iii. HP A3 scanner.
iv. HP A3 plotter
v. Yashica Digital camera.
vi. ArcGIS 9.2 Software ArcView license
vii. IKONOS image of 6m resolution downloaded on 15th
September, 2012.
2.2 Data The data used can be grouped into two types - primary data and secondary data. The primary
data includes Ground Control Points (GCPs) and Social surveys i.e. interviews of some of the
inhabitants within the floodplain. The secondary data on the other hand includes remotely sensed
images of part of Jimeta/Yola town and topographical map sheets No. 196 N.E. showing Numan
NE, 196 S.E showing Numan NS, 198N.W showing Girei NW and 198 SW showing Girei SW.
2.3 Data Quality
To ensure data quality in this study, the spatial data acquired from the field was compared with
the data obtained from the georeferenced image. Rectangular coordinates of these points were
acquired from the GPS. The coordinates acquired using the GPS was compared with the
coordinates of the same points in the Image. It was found that there was no significance
difference between the two.
2.4 Data Preparation
2.4.1 Map Registration or Georeferencing: Registration of both the topographical map and
the image was performed before digitizing. Rectangular coordinates of the acquired GPS points
were used. The software used, required the registration of a minimum of five points on each
image. Table 4.1 shows the controls points used for the georeferencing.
2.4.2 Creation of Relevant Feature Data Classes Two types of data were created for this project. Graphics inform of maps/plans and their related
attributes in form of tables. Both data were created in Arc GIS environment. Creation of feature
classes was done using Arc catalog software. New Personal Geodatabase was created and given
a name flood. From Personal Geodatabase, two datasets were created with names built up area
and topo. Projected coordinate system was selected as UTM WGW1984 Zone 33N. Vertical
controls system was Africa, Lagos 1955.
From the feature datasets, feature data classes were created. Topographical dataset has river and
elevation model as their data class. Built up area has buildings and structures as their data
classes.
2.5 Identifying the Built up Areas within Jimeta/Yola and Environs The already georeferenced image was displayed in the ArcGIS environment. From the
georeferenced image, built up areas were identified through their tone, texture, location, pattern,
size and various shapes. The data classes from datasets were overlaid on the image. River and

FUTY Journal of the Environment Vol.8 No. 1, June 2014 23
main roads that was already digitized from the topographical map was added on the image to see
if they fall exactly on the river and main road within the image. This serves as a positioning
check See figure 3.7A below.
Figure 3.7A: digitized georeference downloaded Ikonos image of the study area
Yellow are built up areas, red are structures and blue is the river Benue.
The areas identified and digitized from the image were overlaid to form a map known as detail
map of the study area. See figure 4.1

FUTY Journal of the Environment Vol.8 No. 1, June 2014 24
Figure 4.1: Detail map of the study area (Ikonos image downloaded
on 15th
September, 2012)
2.6 Identifying Those Areas That Are Vulnerable To Flood Flood vulnerable areas were obtained by first creating an elevation model of the area and then
overlaying it with the built up area already obtained.
2.6.1 Creation of an Elevation Model: The elevation model of the study area was created from contour lines in the topographical map.
The contour lines were digitized, interpolated and classified into polygons. See figure 4.2.

FUTY Journal of the Environment Vol.8 No. 1, June 2014 25
09° 15’ 00’
Legend
<VALUE>
400-550
550 - 700
700 - 850
850 - 1,000
1,000 - 1,150
1,150 - 1,300
1,300 - 1,450
1,450 - 1,600
1,600 - 1,750
Figure 4.2: Digital Elevation Model (DEM) of the Study Area
2.7 Spatial Analysis From the elevation model, the lowest areas were selected as a flood vulnerable area. Built up
areas and structures were overlaid on the lowland area to know which area lie in the flood plain
and which area lies outside the flood plain.
Intersection of the elevation model and the built up areas, gives the built up area that lies within
the flood plain. It was indicated in red. See figure 4.3
12° 27’ 00’’
12° 27’ 30’’
Value (m)
122-168
168-213
213-259
259-305
305-351
351-396
396-442
442-488
488-533
Legend
09o 14′ 00″
09o 15′ 00″

FUTY Journal of the Environment Vol.8 No. 1, June 2014 26
Legend
main roads
river
Flooded Areas
Unflooded Areas
lowland
structures
TopoToR_cont3
<VALUE>
400 - 550
550 - 600
700 - 850
850 - 1,000
1,000 - 1,150
1,150 - 1,300
1,300 - 1,450
1,450 - 1,600
1,600 - 1,750
Figure 4.3: Flood mitigation map of Jimeta/Yola, Nigeria
3.0 Results Both the topographical map sheets and the remotely sensed image covering Jimeta/Yola were
georeferenced using the ground control in table 4.1
Table 4.1: Ground control points
S/N EASTINGS NORTHINGS DESCRIPTION
1 220576m 1023171m Bajabure junction
2 220325m 1022811m Mubi round about
3 219967m 1022647m Airport junction
4 220428m 1022314m Karewa junction
5 220925m 1021919m Fufure junction
6 221433m 1021580m Rumde Doma junction
7 219477m 1023382m Damare Primary School
In this study, the Root Mean Square Error obtained for the georeferencing of the topographical
map was 0.26807meters.
Figure 4.2 is the georeferenced topographical map of the study area with the control points and
the RMS error.
Value (m)
122-168
168-213
213-259
259-305
305-351
351-396
396-442
442-488
488-533
River

FUTY Journal of the Environment Vol.8 No. 1, June 2014 27
A topographical map was produced. Built up areas, roads, river and contour lines were shown as
depicted in figure 4.1. The final map produced shows those affected areas in red while the
unaffected areas in yellow. All features in red are areas likely to get flooded. From the result of
this study, the total area liable to flood was 1418892.695sqm. The area covers a shape length of
10664.202meters. A final flood mitigation map of the study area is as depicted in figure 4.3.
4. 0 Discussion
4.1 Map Registration This is a technique of matching the position of points in the image acquired against their
corresponding positions on the ground using ground control points. Most of the GCP used to
georeference the image are road junctions and center of roundabout. Generally, geodetic points
(trig points, pillars) were not seen and located in the image. That was why features such as road
junctions were used as control points.
How accurate such matching is, would be determined by a statistical approach. The Root Mean
Square (RMS) error of 0.26807 meters for the topographical map and 0.320 meters for the image
represents the difference between the original control points acquired with the Global Positioning
System (GPS) and the new control point locations calculated by the transformation process. The
transformation scale indicates how much the map and image being digitized was scaled to match
the real-world coordinates.
4.2 Built up areas liable to flooding Jimeta/Yola town lies on an elevation of range 400m to 700m above the mean sea level (MSL).
400m to 550m elevation occupies an area of 141.889 hectares and was considered as a flood
plain. Elevations between 1000m to 1,700 are the hilly area. Most of the hills are located at the
North-Eastern part of the study area. The hilly area are close the neighbouring settlement called
Girei. Elevations from 550m to 700m above the MSL are areas that are not within the flood
plain. It is the most suitable areas for settlements. It occupies an area of 243.201 hectares of the
study area. Most of these areas built up areas. 700m to 1000m are averagely elevated areas and
can also hardly experience flooding.
From the results, Jambutu has the largest built up area that is likely to get flooded. Jambutu lies
in the north-eastern part of the study area. The flooded area in Jambutu has an area of averagely
12.296hectares. The area is fast growing towards the flood plain. Other areas identified to get
flooded are Wuro dole and Hayingada in Jimeta. The two areas have an area of 1.062hectares.
In Yola, areas likely to get flooded are less compared to Jimeta. Damare is the most affected area
that was likely to get flooded. It has a built up area of averagely 1.759hectares. Damare area is
also fast expanding towards the Benue River. Yolde pati in the north-west of Yola was also
identified as a flood risk area. It covers an area of 5119.51msqr.
4.3 Total Built Up Area Lost To Flooding From the result obtained, Jimeta has the largest built up area to be lost to flooding. It covers
13.358 hectares. The most flooded area is Jambutu. In yola town, the flooded area is Damare and

FUTY Journal of the Environment Vol.8 No. 1, June 2014 28
Yolde pati. The two has a total area of 2.278 hectares. The combine total built up area to be lost
to flooding in the study area is 15.636 hectares.
4.4 Flood Mitigation Mapping The most effective way of reducing the risk of losing lives and property is through the
production of flood mitigation maps. Most countries in the developed world have maps which
show areas prone to flooding. In this study a flood mitigation map was produced which show
areas at risk in Jimeta/Yola town and environs. The red areas are the flood prone areas, while the
yellow shows the areas that are not prone to floods.
5.1 Conclusion and Recommendation Topographical maps of study area were used to create digital elevation model of the area. Low
lying areas were later extracted from the elevation model created. The features obtained from the
image were overlaid on the low land area in order to see which of those built up areas falls
within the low land area and outside the lowland area.
The final information obtained is flood mitigation map of Jimeta/Yola, map showing built up
areas that are liable to flood and those areas that are outside the flood plain. Total area of land
that was vulnerable to flood as the time of this study was 142Hectares with a total perimeter of
10664.202meters. The built up area to be lost to flooding is 15.636 hectares.
Once again the integration of remote sensing with GIS has proved to be a very reliable and
effective means of delineating flood prone areas. With dwindling resources made available for
hazard identification and mitigation in the third world, the GIS has proved to be an excellent
means of integrating the numerous freely available environmental data into reliable accurate
information. This translates into a reduction in the overall cost of producing needed information
without the unnecessary drudgery and time wastage associated with manual approaches
Base on the results from the analysis the study proffered the following recommendations.
i. Adamawa state government should relocate all the occupants of Jambutu and Wuro Dole in
Jimeta to wuro Jabbe or Karewa extension. The state government should equally relocate the
inhabitants of Damare and Yolde Pati in Yola to Karewa extension or any suitable area with
low risk to flood.
ii. The government should continue monitoring all developments within Jimeta/Yola town. This
will reduce the rate of spread of residential buildings within the flood plain. A typical area
that needed monitoring urgently is Jambutu in Jimeta and Damare areas in Yola.
iii. The map produced as a result of this study should be utilized in the decision making for
developments in the town. The map will be useful more especially in the design and
construction of roads and drainages.
iv. The flood prone areas should be used strictly for agricultural purposes and other
hydrographic activities.
v. There is the need for the government to continue updating this flood mitigation map at every
five years in order to see if there are significant changes in the nature of the river and flood
areas.

FUTY Journal of the Environment Vol.8 No. 1, June 2014 29
REFERENCES
Alam, K., Herson, M., O_Donnel, I. (2008) Flood Disasters: Learning from Previous Relief and
Recovery Operations Provention Consortium and ALNAP
Bariweni P.A., Tawari C.C. and Abowei J.F.N. (2012) Some Environmental Effects of Flooding
in the Niger Delta Region of Nigeria International Journal of Fisheries and Aquatic Sciences
1(1): 35-46 ISSN: 2049-8411; e-ISSN: 2049-842X
Cliff R. H., Aaron R. P., and Gregory B. N. (2009) Floodplain Geomorphic Processes and
Environmental Impacts of Human Alteration along Coastal Plain Rivers, USA Wetlands,
Vol. 29, No. 2, pp. 413–429
Dabara I. D. (2012) Analysis of the Relationships of Urbanization Dynamics and Incidences of
Urban Flood Disaster in Gombe Metropolis, Nigeria. Journal of Sustainable Development
in Africa Volume 14, No.2 ISSN: 1520-5509 Clarion University of Pennsylvania, Clarion,
Pennsylvania
Eric, T. (1999): Flood plain mapping and terrain modeling using HEC-RAS and A
review GIS Journal Publication for Center for research in water resources,
California, USA www.infoplease.com/ce6/sci downloaded on 5th
July 2011.
Etuonovbe A. K. (2011) The Devastating Effect of Flooding in Nigeria. FIG Working Week
Bridging the Gap between Cultures Marrakech, Morocco, 18-22 May 2011
Henderson, L.J. (2004) ―Emergency and Disaster: Pervasive Risk and Public Bureaucracy in
Developing Nations‖ Public Organization Review: A Global Journal Vol. 4 pp 103-119
Hualou, L (2011). Disaster Prevention and Management: A Geographical Perspective. Disaster
Advances 4(1) January 2011
IPCC (Intergovernmental Panel on Climate Change) (2007) Climate Change Impacts, Adaptation
and Vulnerability, Contribution of Working Group II to the Fourth Assessment Report of the
Intergovernmental Panel on Climate Change Assessment Report, Summary for
Policymakers. Available at http://www.ipcc.ch/pdf/assessment- report/ar4/wg2/ar4-wg2-
spm.pdf.
Kolawole O.M, Olayemi A.B, Ajayi K.T. (2011) Managing Flood In Nigerian Cities: Risk
Analysis and Adaptation Options – Ilorin City As A Case Study. Scholars Research Library
Archives of Applied Science Research, 2011, 3 (1):17-24 ISSN 0975-508X CODEN (USA)
AASRC9
Kulapramate, P. (2010): Application of Remote Sensing and GIS Techniques for flood
vulnerability planning in Munshiganj district of Bangledesh
www.gisapplications.com downloaded on 5th
july 2011

FUTY Journal of the Environment Vol.8 No. 1, June 2014 30
Musa, A. A. (2011): Finding a lasting solution to the Loko flood diserster – A GIS
Approach. Lagos Journal of Geographic Information System Vol. 1 No.1 Geography
Dept. University of Lagos
Odemerho, F.O. (1988). Benin City: A Case Study of Urban Flood Problems. In: Sada, P.O. and
Odemerho F.O. (eds). Environmental Issues and Management in Nigerian Development,
Evans Brothers, Ibadan
Odihi J. O. (1996) Urban Droughts and Floods in Maiduguri: Twin Hazards of a Variable
Climate. Berichte des Sonderforschungsbereichs 268, Band 8, Frankfurt a.M. 1996: 303-
319)
Ojigi, M. L., Abdulkadir, F. I. and Aderoju, M. O. (2013) Geospatial Mapping and Analysis of
the 2012 Flood Disaster in Central Parts of Nigeria. 8th National GIS Symposium.
Dammam. Saudi Arabia. April 15-17, 2013
Olorunfemi, F.B (2010) ―Climate Change and Flood Risk in the Informal Settlements of Cape
Town: Understanding Vulnerability and Adaptation Options‖ Final Technical Report of The
African Climate Change Fellowship Programme, Submitted to Global Change SysTems for
Analysis, Research and Training (START), Washington DC, USA
Oludare H. A., Bashir O. O., and Olusegun H. A. (2012) Building Capabilities for Flood Disaster
and Hazard Preparedness and Risk Reduction in Nigeria: Need For Spatial Planning and
Land Management Journal of Sustainable Development in Africa Volume 14, No.1 ISSN:
1520-5509 Clarion University of Pennsylvania, Clarion, Pennsylvania
Panayotis P., Andreas K., Barbara S., José A. J. and Paul S. (2008) Integrated Flood Risk
Analysis and Management Methodologies: Review of Flood Hazard Mapping Report
Number T03-07-01Revision Number 4_3_P01 www.floodsite.net
Temi E. O. (2009) Strategies for Mitigation of Flood Risk in the Niger Delta, Nigeria. J. Appl.
Sci. Environ. Manage. Vol. 13(2) 17- 22

FUTY Journal of the Environment Vol.8 No. 1, June 2014 31
An Evaluation of Transport and Logistics System
Options for Cement Distribution in Nigeria
Sumaila AbdulGaniyu Femi
Micromab and Linkage Logistics Services, Abuja
E-mail: [email protected]
Abstract
This study examines the logistics of moving cement brands to market centres in Nigeria. The
major objective is to evaluate transport and logistics system options used by cement companies
in Nigeria, as a basis for recommending an effective option that would optimize cement haulage
and distribution system in the country. Information obtained from the Logistics Units of three
selected companies provided the basis for the evaluation. The study observes that while West
African Portland Cement (WAPCO) depends solely on undiluted and total outsourcing of its
transport system, Ashaka Cement Company relies on partly out-sourcing and free-for-all system.
Obajana Cement Company on the other hand practices a mixture of company- own vehicles and
outsourcing. On the basis of the strengths and weaknesses of these options, the study concludes
that total outsourcing by contracting out to professional haulage firms is the best option and
therefore recommends its adoption by cement companies and other haulage industries in
Nigeria.
Introduction
The demand for cement in Nigeria has been increasing progressively due to steady improvement
in economic activities across the country. The construction industry has been boosted thereby
expanding the market for cement products. A major response to the increased demandis the
establishment of cement factories in different parts of the country. Presently, there are six (6)
factory sites in Nigeria located at Sokoto, Ashaka, .Gboko, Obajana, Ewekoro/ Shagamu and
Ibese. Despite the establishment of these factories, there still exists serious imbalance between
domestic supply and demand resulting in not only astronomical increase in the price of cement,
but also the dire need to supplement local production through importation. The importation of
Bua brand with a supply base in Port Harcourt is in response to this need.
Cement product is inherently bulky in nature and this has serious implication for the cost of
transportation. The cost of moving cement products to market centres constitutes a substantial
proportion of the overall production cost which ultimately affects the market price (Sumaila
2004). Transport cost therefore, limits the distribution of cement products within competitive
price areas. Thus,, each cement factory in the country has its own market area. As examples,
Portland cement in Shagamu and now Dangote Cement factory at Ibese serve all the south-
western states such as Lagos, Ogun, Ondo, Osun, Ekiti, Edo and Kwara. Dangote factories at
Obajana and Gboko have the North Central states of Kogi, Benue, Niger, Plateau, Nassarawa and
the FCT as their main market areas. In the case of Sokoto cement, it serves the Northwestern
states covering Sokoto, Zamfara, Katsina, Kebbi, and Kaduna states. Ashaka cement on the
other hand, serves mainly the Northaastern part of the country, covering Taraba, Borno, Kano,
Adamawa, Plateau, Nasarawa, Gombe, Yobe, Kaduna and Bauchi states.
But despite these known and defined catchment areas for the various factories, there are in
virtually all states of the country cases of market overlaps. It becomes axiomatic therefore that
the market share of any cement factory in these areas of market overlaps would depend on the

FUTY Journal of the Environment Vol.8 No. 1, June 2014 32
ability of the factory to make its products available at the right time, at the right place, and at a
competitive (right) price. This therefore underscores the importance of effective and efficient
transport and logistics system in the distribution of cement to market centres. Defects in the
logistics system could lead to frequent stock out situation, too long delivery times, and service
inefficiencies which in the short term, would lead to certain loss of sales/patronage and in the
long-term may result in a definite loss of market share. It is against this background that this
paper provides an evaluation of the transport and logistics system options used by cement
companies in Nigeria. The major objective is to recommend an effective system option that
optimizes cement distribution and holds the promise for its effective haulage system in the
country.
Transport and Logistics System Options
Generally, cement production depends on transportation. This is because; both raw materials and
finished products are naturally bulky. Limestone and Gypsium which are the major raw materials
for cement production are very bulky and moving them over a long distance incurs high
transportation cost. This is why most cement factories are usually located close to the sources of
raw materials in order to minimize operation cost (Ojekunle 2004). In the same vein, the finished
product (i.e. cement) is also relatively bulky such that cost of distributing it is also significant.
Thus to reduce operation cost, cement factories must of necessity minimize the cost of
transportation. This can successfully be achieved through optimization of transport and logistics
services. That is why all over the world, the provision of efficient and effective transport and
logistics services has today become a core and integral part of the production process (Emmett
2005).
Indeed the importance of an optimal distribution logistics as a means of making and improving
corporate profitability has never been greater than in this era of inflation, rapid technological
change, globalization, competitive market and recession. These have combined to produce an
environment in which the options for corporate strategy are much constrained. Yet at the same
time, for many organizations, these same conditions have provided a major opportunity for
growth i.e. specifically, improvement in performance through revised approach to the
distribution strategy (Ndikom, 2008). In every production process the cost of distribution is
steadily growing and thus accounts for an increasing proportion of gross national product in most
developed economies.
All these, imply, therefore, that special attention must be paid to transport and logistics in order
to achieve corporate goals and objectives. It is for this reason that optimizing transport and
logistics should be a major concern to organizations especially those in the distribution business
(Hugos, 2011) .According to him, such efforts are necessary to improve:
Overall operational efficiency of a company
Eliminate bottlenecks in the distribution chain
Reduce overall operation cost
Improve customer services
Increase profit margin
Generally, the following options exist for improving transport and logistics of cement
distribution (Sumaila et al, 2004).

FUTY Journal of the Environment Vol.8 No. 1, June 2014 33
Option A: Company to Own and Run Its Fleet of Trucks to All Sales Outlets
In this option the company will establish a transportation unit which will be charged with the
responsibility of running the transportation system required for the distribution of its product.
The company provides the trucks, employs the drivers, establishes a maintenance workshop and
fuels for the vehicles.
A major attraction of this approach is the fact that the company can control the movement of its
product and ensure on-time delivery to market outlets. It can impose sanctions on erring drivers,
transport supervisors and managers. Additionally, the company will be able to avoid the risk of
dependence on professional hauliers who may have the need to satisfy the demand of several
customers. This owner operated transportation system is particularly relevant for small
companies with localized or restricted market, and in situations where an integrated market
system (e.g. where the driver doubles as the sales executive) is desired.
It has been shown that in adopting this strategy, many own operators are not providing
themselves with the most efficient service option as their fleets are usually underutilized. It also
requires high capital outlay with long-term return on investment, and would involve restructuring
of the company‘s operation (Wood, 1981).
Option B: Own and Run Fleet to Major Outlets and Contracting Out Minor Outlets
This option is similar to the first option except for the addition of contracting out the
transportation system to the minor outlets, an approach similar to that adopted by Nigerian
Bottling Company. Contracting of course allows a company to concentrate on its core business
and make larger investments in the core business leaving transportation to the experts. The third
party operator is fully responsible for the provision, maintenance and operation of the fleet. A
contractual agreement is signed on fees payable.
Option C: Engaging Professional Hauliers
This option represents a situation where the company contracts out the carriage of its products
completely to professional hauliers. As explained in the professional hauliers‘ involvement under
option B, contracting out the transportation will enable the company to concentrate on its core
business and make larger investment in the core business leaving transportation, which is a non-
core activity to professionals. Engaging such professionals also allows the company to:
Deploy its capital to the best advantage of the company
Invest in the areas of its core business which has the greatest profit potentials for the
company
Take the advantage of the expertise of other professionals, and thereby ensure efficiency.
Avoid the breakdown, uncertainties and associated problems entailed in transportation
business, as these can be diversionary to company‘s main business (Ogunsanya, 1982).
Besides these, adopting this will allow the company to have more time and resources to plan for
the expansion of its existing market, maintaining product quality and aiming at being strong to
face competition from other cement manufacturing companies

FUTY Journal of the Environment Vol.8 No. 1, June 2014 34
Contracting out may not be only for cost-cutting. The strength of the strategy rests on the fact
that the haulage firm is doing with unpolluted commitment what it is best at doing and in the
process, can contribute to the company‘s objective of eliminating delays, product diversions,
reducing turn round time and optimizing customer satisfaction.
There are four possible derivatives of this option and they are described as follows:
Direct Outsourcing
In the direct outsourcing, the company invites, screens, and registers potential haulage
companies. No agreements are signed between company and hauliers. Hauliers queue at
designated parks and are invited on a service and pay basis, to deliver its product to any assigned
destination. A major problem with this option is the total lack of commitment by the haulier, who
may be available or unavailable depending on the external market demand for its service. The
company could suffer business set-backs from the unreliability of the services that can be
provided by this option (Sumaila, 2004).
Route Concessioning
In route concessioning, haulage firms are engaged to ply specific routes. Route concessioning
could be with competition when two or more haulage firms are engaged to render service on a
specific route; or monopolistic when only one haulage firm is engaged to service such a route.
This concession approach could take a variety of forms. For example, a haulage firm may sign
an agreement to provide an uninterrupted service to the company, carrying an agreed minimum
volume of cement to a specific destination over an agreed period of time. The concessionaire
provides the trucks, maintains and operates the trucks and gets paid by the company in two ways.
The first is a fixed lump sum which will take care of possible periods of depression in business
and/or backhaul problems. The second is a variable fee based on the quantity transported.
In this option, it is expected that the commitment of the haulage firm will be total, and the
company does not need to bother about transportation. Although this option may entail greater
expenditure on transportation than the others, the problems of delays, diversions, damage to
cargoes and the headaches caused to company and its customers by an unreliable transport can
be avoided. Such extra expenditure will be justified by the resultant reliable and on- time
guaranteed transport which this option entails (Ogunsanya, 1982).
Distributor Service
Another option relates to the distributor providing its own truck. This option will depend on the
distribution option adopted by the company. If the self-collect system exists then the distributor
can be asked to provide his own truck from the company plant to his warehouse. If it is the
delivery system the company will need to engage professional haulage firms to service the major
sales outlets represented by the company depots while allowing distributors either in part or in
full the transportation of the product purchased from the company.
However, the company may reimburse the distributor on the basis of the ton-kilometre hauled. A
major problem with this approach is the uncertainty of business. Distributors may divert fleet to a
more rewarding venture if cement business is low. This may create a clog in the company‘s
factory warehouse.

FUTY Journal of the Environment Vol.8 No. 1, June 2014 35
Open Market Sourcing
This entails the company and the buyers of its products sourcing for transport on a need and pay
basis. In this system, no transporter is registered with the company. So neither company nor
transporter has any commitment to each other. Transporter bargains with company or product
buyer on freight rates which may be variable. The unreliability of this option in the transportation
of a company product that enjoys a stable production does not recommend it to any company. It
is perhaps only relevant in the ―sand supply‖ industry, which enjoys this option (Sumaila, 2004).
Methodology
This study relied on information from three major cement companies in Nigeria. The selected
companies are currently the most popular in the country. Given their establishment dates and
years of continuous production, it was envisaged that they would have evolved stable systems of
transporting their products to the markets. The companies are West African Portland Cement
Shagamu, one of the oldest factories in the country; Obajana Cement Factory, the oldest in the
Dangote Group; and Ashaka Cement Gombe regarded as the ‗Star of the North‘ We visited the
operational Headquarters of the companies in May, 2012, looked into their documents and
interacted with the Heads of the Logistics Units. The following information was sought for:
i. Department in charge of transport and logistics
ii. Logistics system in use
iii. Number of transporters engaged
iv. Service Agreement
v. Vehicle types, and capacities
vi. Haulage rates and payment system
vii. Monitoring and control systems
viii. Quality control in terms of vehicle standards and driver training and testing
ix. Modal mix
x. Dispatch and scheduling procedures and loading/unloading systems
xi. Logistics challenges.
An inspection of sample vehicles was carried out. The objective was to ascertain their standards
and operational conditions. Drivers of the vehicles and their assistants were informally
interviewed on travel challenges, and back-haul issues. The Dispatch offices were also visited
where information relating to scheduling and loading techniques, lead time, and dispatch policies
were obtained. The details of the transport and haulage systems of the companies were
summarized and the findings are discussed in the next section.
Evaluation of the Options
The characterization of the transport and logistics systems of the study companies provides a
basis for the evaluation of the options adopted by them. Table 4.1 presents a summary of these
characteristics, while detailed description of each company is presented in what follows.

FUTY Journal of the Environment Vol.8 No. 1, June 2014 36
Table 4.1 Summary of transport and logistics system characteristics
Variables Dangote NAPCO Ashaka
Department Responsible Logistics department Supply chain Sales and marketing
Logistic System Company own Vehicle
and Outsourcing
Outsourcing Mixed outsourcing
Vehicle Types and
Capacity
DAF and Man Dissel
(40 tons)
IVECO (40 tons) DAF, IVECO and
ManDissel (30t0ns)
No. of Transporters Not Specified
8 No 8 No
Haulage Rate Policy Negotiated based on
Current ratesin the
country
Same as dangote Per Ton Per Km
Monitoring System GPS
GPS GPRS
Driver Training and
Testing
Runs a driver Academy
Driver Viability test Technical Examination
Modal Mix Road and Rail
Road and Rail Road and Rail
Dispatch Schedule FIFO FIFO FIFO
Source: Field work, May 2012
Dangote Cement Company Obajana
0ut of the total of 23 million tons of cement produced in Nigeria today, Dangote Group through
its three factories at Obajana, Gboko andIbese provides slightly above 60% of this volume. But
we found that the group maintains a uniform policy in the transportation of its product. The
company runs a mixture of company-own vehicles and use of private transporters depending on
the distribution system. For ‗self-collect‘ system which allows the customer to arrange for the
transportation of his product, private hauliers are used. Surprisingly a few of the customers use
their private haulage vehicles, thereby making it a free-for-all system. Vehicles of different
types, sizes, and quality have free access to the company premises with minimal pre-entry
quality standard checks. Haulage rates are negotiated depending on distance.
On the other hand, the company has its ovn fairly large fleet operated and maintained by the
company. The vehicles are used for customers adopting the ―delivered system‖. Payment is made
for both the cement and the transportation which enables the consignment to be delivered direct
to customers‘ warehouses. Haulage rates are published in official documents of the company
which encompass both the cost of loading at the factory and the backhaul compensation i.e.
returns empty truck.
Through the vehicles used by the company are majorly DAF and Man Dissel, but they are
uniquely of the 40 ton capacity. The company runs a Driver Academy which trains the drivers
not only for the company but also for the haulage companies in the country.

FUTY Journal of the Environment Vol.8 No. 1, June 2014 37
The Dangote option is clearly a mixture of company own vehicles and out-sourcing. This makes
it vulnerable to a number of challenges and problems. Running company-own fleet poses
considerable challenges on its own not to talk of when combined with an unregulated and loose
outsourcing system. The demonstrable limitations and operational difficulties of such systems
have been detailed earlier in section 2.2.
West African Portland Cement Company (WAPCO) Shagamu
WAPCO-Lafarge Company produces about 15% of current cement volume in Nigeria. The
Logistics unit is under the reporting arrangement of Supply Chain Department. The company
relies completely on third party arrangement for the transportation of its product. Both individual
and corporate haulers are used. The company has in place a third party truck specification
standards which it uses for technical evaluation of all vehicles both private and corporate.
Contracted Vehicle Inspection Officers (VIO) are used for this purpose.
For private transporters, a minimum of ten(10) trucks are required for engagement. About eight
(8) private transporters are currently engaged. The company guarantees these haulers in the
Banks while payment for services rendered are also done through such banks. Corporate
organizations on the other hand require a minimum of fifty (50)trucks for operation. Today
known transport companies such as Chisco and ABC are engaged by the company.
For drivers of all vehicles, their relevant documents are checked. They must also tender medical
report from accredited hospitals, while they also undergo defensive training before
commencement of service. All these constitute the driver viability test which has a one-year
validity period.
Product diversion has been totally eliminated as vehicles are monitored through the GPS tracking
system. In addition the delivery invoice is produced in triplicates. One is left in the office while
two copies are given to the driver which must be signed by the customer on delivery of his
product and a copy returned to the office by driver as proof of delivery and must also be attached
to the payment voucher before the transporter is paid.
Freight charges are determined based on survey of freight charges in the country and vehicle turn
around-time. Vehicle trips are cumulated for one month and payment made through the banks of
the transporters.
The foregoing description of the transport and logistics system shows that West African
Portland Cement Company depends solely on undiluted and total outsourcing of transport
services using 3rd
Party haulers. This has the advantage of efficient and effective delivery service
as the entire operation is based on a contractual service agreement. Constant evaluation of the
performance of the companies can be made, shortcomings identified and improvements made.
Ashaka Cement Company Gombe
Currently, the Sales and Marketing Department overseas despatch, transportation, and other
logistics activities of the company. For self-collect method, though the customer caters for the
transportation of his product, the company carries out pre-entry technical checks on the vehicles
used. This is to ascertain that the vehicles meet minimum operational standards. One major gap
in the exercise is that little attention is paid to the drivers of the vehicles who we observe do not
show up at the factory during loading process but are represented by agents/their assistants

FUTY Journal of the Environment Vol.8 No. 1, June 2014 38
For the delivered method, the company as a policy depends on total outsourcing of transport
service using 3rd
party (3PL) haulers who use mainly DAF, IVECO and MANDIESEL vehicle
types. Today, the Company has Eight(8) approved Road Transport companies for its operation.
The conditions of engagement include among others provision of Ten million naira (N10
million) guarantee and a minimum of fifteen (15) trucks while the service agreement is for a
contract period of one year. Presently customization of the vehicles is done using Ashakacem
logos only. Haulage rate structure is based on per ton per kilometre while payment is cumulated
for one month for each vehicle. Rail transport is also used based on demand while rate is also
calculated in the same way. Table 4.2. presents the delivery rate of cement to the various sales
areas.
Table 4.2: Haulage Rates
DEPOT
DISTANCE,
KM
NGN/T/KM NGN/T NGN/TRUCK
GOMBE 140 14.0 1,967 59,000
BAJOGA 15 66.7 1,000 30,000
D'TURU 235 11.3 2,667 80,000
BAUCHI 251 10.6 2,667 80,000
AZARE 262 10.2 2,667 80,000
YOLA 505 7.6 3,833 115,000
DUTSE 351 9.5 3,333 100,000
MAI'GURI 357 9.8 3,500 105,000
JOS 380 9.2 3,500 105,000
MUBI 403 9.5 3,833 115,000
KANO 420 9.1 3,833 115,000
JALINGO 436 8.8 3,833 115,000
KATSINA 588 7.7 4,500 135,000
ZARIA 625 6.9 4,333 130,000
KADUNA 695 6.7 4,667 140,000
ABUJA 750 6.7 5,000 150,000
12.8 3,446 103,375
Source: Logistics Unit, Ashaka Cem, 2012
For both distribution methods, vehicle loading relies on a queuing system on the basis of first
come first serve, all under the supervision and control of security men who issue a tally number
to every vehicle on arrival. Vehicles are called into the factory in a batch of three as there are
three mechanical loading points, which simultaneously load each vehicle in 25 minutes. On the
average, it takes between 2-3 days for a vehicle to get loaded in the company. Vehicles then
move to the scheduling point where they are weighed and consequently allocated routes. The
problem is that the decision to dispatch the product to a customer or depot appears not to be
based on any particular order or schedule.

FUTY Journal of the Environment Vol.8 No. 1, June 2014 39
Up till 2007, lead time was about 6 days to the depots but today it is only 3 days in the country.
On paper, all deliveries are to the depots but operationally customers are informed and the
vehicles consequently get re-routed to customers‘ warehouses. Monitoring is now done using
GPRS which has succeeded in eliminating product diversion completely.
Drivers of the registered haulage companies are made to undergo both medical examination and
operational briefings. Driver‘s manual prepared by the logistics unit is given to each driver
which specifies the work instruction and code of conduct including safety and security tips.
It can therefore be concluded that Ashaka Cement Company can also be said to depend solely on
outsourcing, but it has its own variant. While contracted professional transporters are used for
delivered distribution system, the self-collect system on the other hand relies on loose and free-
for-all transport system. As noted earlier in this paper, this system is confronted by a number of
weaknesses which include the following.
1) Poor control of number, size, and quality of vehicles used.
2) It allows the entry of all sorts of individuals-drivers, agents, motor assistants into the
premises of the company. This situation no doubt constitutes major security threat to the
company.
3) It provides veritable opportunity for product diversion as monitoring and tracking of the
vehicles are difficult.
4) The above can lead to ―javelin sales‖ thereby creating artificial scarcity of the product in the
sales areas as they could be taken to where margins are high.
5) Most importantly there is no loyalty as the transporters and their drivers have no moral or
service attachment and commitment to the company.
6) Such sharp practices as underweight of the product and burstages are associated with such
unregulated transportation system.
7) Finally, the integrity and public image of the company can be undermined and threatened
through this system.
Thus, this system can rubbish the direct delivery system no matter its level of perfection with
negative repercussions on the effectiveness and efficiency of the overall product delivery system
of the company.
Conclusion and Recommendations
We have shown in this paper the imperative of a robust transport and logistics system option for
timely delivery of cement in the country. We also indicated that conventionally two main
principles are involved in the choice of product haulage. The first relates to a situation where the
company owns and operates its own haulage fleet, while the seconds represents where the
company contracts out the carriage of its products to professional hauliers. Against these two
known options and their variants, we described and evaluated the systems currently in use by
Dangote Cement Company, West African Portland Cement (WAPCO) and Ashaka Cement
Company Gombe.
The evaluation reveals that while WAPCO depends solely on an undiluted out- sourcing of its
haulage system. Ashaka operates a rather untidy combination of partly free-for-all and partly
contractual engagement of professional haulers which makes the delivery system rather
unhealthy. Dangote on the other hand operates essentially company own fleet mixed with

FUTY Journal of the Environment Vol.8 No. 1, June 2014 40
uncontrolled outsourcing. The demonstrable limitations and operational problems of this
combination have been derailed and thus do not hold any promise for efficient service delivery.
It is therefore recommended that total outsourcing by contracting out the haulage system is the
best option as it enables companies to concentrate on their core businesses and permit larger
investments in its enterprise leaving distribution and transportation to the experts. It would
convey on the company other internal and external benefits which include
I. The desire to employ capital to the best advantage of the company and therefore, investment
should be in the areas which produce the greatest profit for the business.
II. The need to take advantage of the expertise and competence of other professionals.
Additionally, the third party approach to product haulage would also enable companies to aspire
to achieve just-in-time service practice. This strategy makes sure that supplies reach where they
are needed promptly using appropriate mode and means for carriage. This is because reliability
and performance of haulage are of utmost importance in this strategy. Once these are achieved,
companies would enjoy the benefits of an improved distribution system which would engender
the retention and expansion of their existing markets and thus strengthen their competitive
advantage.
References
Emmett, S; (2005): Supply Chain in 90 Minutes Management Books, Forge House, Limes Road,
Gloucestershire, UK. Pp 64-66
Hugos, M. H; (2011): Essentials of Supply Chain Management (3rd
Edition), John Wiley and
Sons. Pp75-80
Ndikom, O.B.C; (2008); Elements of Transport Management, Bunmico Publishers, Nigeria pp
415-440
Ogunsanya, A.A; (1982); ―Spartial Pattern of Urban Freight Transport in Lagos Metropolis‖
Transportation Research, Vol 16, no 4,pp289-300.
Ojekunle, J.A; (2004) ―Urban Freight Transport‖ in Perspectives on Urban Transportation in
Nigeria, Published by Nigerian Institute of Transport Technology (NITT) Zaria , chap 12,
pp 224-241
Sumaila, A.G; (2004); ―Optimizing Transport and Logistics in Ashaka Cement Company
―Consulting Project by Nigerian Institute of Transport Technology (NITT) Zaria, Final
Report.
Samaila et al; (2008); ―Urban Goods Movement Research, Canadian Experience in the
Seventies‖, Transportation Planning and Technology, Vol 7, pp121-133

FUTY Journal of the Environment Vol.8 No. 1, June 2014 41
Growing Season Rainfall Trends and Drought Intensities in
the Sudano-Sahelian Region of Nigeria
Godwin O. Atedhor
Department of Geography & Regional Planning,
University of Benin, Benin City, Edo State
Corresponding Author: E-mail: [email protected], Tel.: +2348136446117
Abstract The paper examined rainfall trends and drought intensities during the growing season (June-
September) in the Sudano-Sahelian region of Nigeria using rainfall data for Sokoto, Katsina,
Kano, Potiskum, Nguru, Maiduguri (1951-2010) and Gusau (1953-2010). Linear trend lines and
second order polynomial were used to examine the trends of rainfall at the synoptic weather
stations. The growing season drought intensities were computed as percentage deviation from
the mean rainfall. The results reveal downward trends of growing season rainfall in all the
synoptic weather stations investigated in the study with the exception of Kano which showed
positive. The drought intensities were mainly slight, moderate and severe and largely depict
spatial and temporal variations. In view of the pivotal role of the Sudano-Sahelian region as the
main source of the nation‟s cereal and animal protein, it is recommended that the establishment
of irrigation projects should be intensified and agricultural activities in the region should be
aligned with prevailing climatic trends in order to realize the country‟s quest for food security.
Key Words: Rainfall, trends, drought intensities, Sudano-Sahelian
Introduction
The onset and cessation of rainfall dictate the length of the growing season and amount
determine the type of crops that are cultivated in different eco-climatic zones of Nigeria. Despite
the pivotal role of rainfall to agriculture, studies have revealed declining rainfall trends coupled
with increasing temperature trends especially in the savanna belts (Adebayo, 1999; Olaniran,
2002; Odjugo, 2010a; Umar, 2012a; Atedhor and Odjugo, 2012).
According to Farmer and Wigley cited in Illiya and Sakwah (2006), drought is an uninterrupted
period (year, rainy season, month or less) of dry weather when rainfall is significantly lower than
the average. Drought has also been defined as a climatic anomaly calculated by the deviation of
actual rainfall from the amount necessary for normal operation of an established economy of an
area (Oladipo, 1991). The reliance of agriculture on rainfall in Nigeria makes it highly
susceptible to drought. The availability and distribution of crop-moisture during the growing
season is significant to the healthy growth and yield of crops. Therefore, it is the distribution of
rainfall during the growing season that is critical to the growth and yield of crops and not
unevenly distributed rainfall. However, despite the relevance of the distribution of rainfall during
the growing season, previous studies tend to draw inference on agriculture based on rainfall
trends and drought intensities on annual bases (Ayoade, 1988; Ati et al., 2010; Umar, 2012b;
Atedhor and Odjugo, 2012) while the monthly and the growing season drought indices have
received less attention thus making the scheduling of agricultural activities especially planting
and irrigation difficult.
It has been asserted that climate change will intensify the occurrence of extreme weather events
(IPCC, 2001; O‘Hare, 2002; Odjugo and Ikhuoria, 2003). The Sudano-Sahelian region is most

FUTY Journal of the Environment Vol.8 No. 1, June 2014 42
characterized by erratic rainfall in Nigeria. The region also falls within the areas projected to
experience intense drought incidence due to climate change (IPCC, 2001).
Agriculture remains the main source of livelihood in the Sudano-Sahelian region of Nigeria. The
region is important to the entire country as the key source of cereals and animal protein. Despite
the agricultural significance of the Sudano-Sahelian region as a fulcrum to Nigeria‘s quest for
food security, it essentially dependent on rainfall, farm practices remain subsistence and not
aligned to changing climatic trends. This paper therefore examines rainfall trends during the
growing season and drought intensities on during the growing season in the Sudano-Sahelian
region of Nigeria.
The Study Area
The Sudano-Sahelian region of Nigeria (Figure 1) extends from the northern limits of the country
to the northern boundary of the Northern Guinea Savanna. It traverses Sokoto, Zamfara, Kano,
Katsina, Jigawa, Yobe and Borno States.
Figure 1: The Sudano-Sahelian Region of Nigeria and the
Meteorological Stations for the Study
The Sudano-Sahelian region of Nigeria is dominated by the Sokoto Plains to the north-western
areas and the Chad Plains to the north-eastern parts. The Sokoto Plains are flat rolling plains on
sedimentary rocks with isolated low, flat-topped hills while the Chad Plains in the north-east are
more extensive with Basement Complex and mostly made up of recent deposits of sands and
clay and a general elevation of less than 500 m (Ologe, 2002). According to Ologe, the Chad
Plain slopes gently towards Lake Chad and much of the area are covered by ancient sand dunes
formed at a time when the climate was drier than it is in present day. The Sudano-Sahelian

FUTY Journal of the Environment Vol.8 No. 1, June 2014 43
region of Nigeria is drained by many rivers which suffer seasonal alterations in their volume and
flow. Notable among these rivers are River Sokoto which extends from Sokoto State to Niger
State in the northwestern part of Nigeria and Rivers Hadejia, Jam‘aare, and Komadugu-Gana
which drain into Lake Chad in the northeastern parts of the country.
The weather pattern, especially rainfall, in the Sudano-Sahelian region of Nigeria is determined
by the movement of the Inter-Tropical Discontinuity (ITD). Associated with the ITD are two air
masses, one over the Sahara (Tropical Continental Air Mass, cT) and the other over the Atlantic
Ocean (Tropical Maritime Air Mass, mT). The Semi-arid belt of Nigeria exhibits a definite wet
season and a marked dry season. It is in this area that rainfall is very variable and unpredictable.
Both the onset and cessation of the rains are very irregular in the area and the lengths of the
cropping seasons considerably and adversely affected (Ojo, 1991). Rainfall in the semi-arid belt
of Nigeria varies from 500mm in the northern extreme to 800 mm in its boundary with the
Northern Guinea Savanna (Oduyemi and Ogunkoya, 2006). The growing season lasts from June-
September (Odekunle, 2004). Rainfall in the Semi-arid belt of Nigeria is with a single peak.
Mean air temperature varies from 29o to 30
oC in the Sudano-Sahelian region of Nigeria.
Vegetation in the Sudano-Sahelian region of Nigeria varies from short grasses and small, often
thorny trees with small leaves in the extreme north particularly in the limited area west of Lake
Chad to sparsely-wooded area around its boundary with the Guinea Savanna.
The rapid increase in the demand for raw materials both locally and abroad and the increasing
demand for food by rising population coupled with crop failure due to droughts, have
encouraged the development of river basin projects (Oguntoyinbo, 1978). Notable among the
irrigation projects are Sokoto Rima Project, Gongola River Project, Hadejia Project and Lake
Chad Basin Project. Most of these irrigation projects are located in river valleys which contain
broad alluvial flat land which are subject to seasonal flooding. The flood plains or fadamas are,
therefore, cultivated intensively by local farmers who rely on natural irrigation flood waters at
the beginning and end of the rainy season (Oguntoyinbo, 1978; Goes, 2001). According to
Oguntoyinbo, crop failures are associated with this farming practice due to the occurrence of
flash floods which drown or sweep crops away. The wetlands are also important for fishing,
groundwater recharge, dry-season grazing and are ecologically rich (Goes, 2001).
Materials and Methods
Monthly rainfall data covering the growing season (June-September) for Sokoto, Kano, Katsina,
Potiskum, Nguru, Maiduguri from 1951-2010 and Gusau from 1953-2010 were collected from
the archives of the Nigerian Meteorological Agency, Lagos. Linear trend lines and second order
polynomial were used to examine the trends of the rainfall during the growing season for each
synoptic weather station. The drought intensities during the growing season for each of the
selected synoptic weather stations were computed as percentage deviation from the mean
growing season (June-September) and classified according to Ayoade (1988 and 2008) as follow:
Drought type Percent deviation from the mean
Slight drought 11-25
Moderate drought 26-45
Severe drought 46-60
Disastrous drought more than 60

FUTY Journal of the Environment Vol.8 No. 1, June 2014 44
Results and Discussion
Rainfall Trends at Sokoto
Figure 2 reveals the rainfall trends in Sokoto during the growing season (June-September). The
During the growing season, the 1952-1964 period was relatively wetter while relatively low
rainfall characterized the periods 1965-1975 and 1979-1987 with the period 1988-2010 revealing
recovering trend from dryness although intermixed with some years of below average rainfall.
This sign of recovery from dryness to wetness is confirmed by the second order polynomial trend
line which clearly depict unfolding of a wet episode in Sokoto. While the highest rainfall during
the growing season (1951-2010) occurred in 1965 (938.8 mm), the lowest rainfall was recorded
in 1987 (299.2 mm). It is remarkable to note the unprecedented rainfall (894.7 mm) in 2010
during the growing season during 1966-2010. Overall, the linear trend line reveals that Sokoto
witnessed a downward rainfall trend during the 1951-2010 periods.
Rainfall Trends at Gusau
Like Sokoto, the linear rainfall trend during the growing season in Gusau (1953-2010) reveals a
downward trend. However, unlike Sokoto, rainfall during the growing season in Gusau reveals
near consistent downward trends from 1954-1991 (Figure 3). Apart from the 1992-1994 period,
rainfall amount during the growing season did not reveal clear partitions of wet and dry periods.
During the period under consideration, the highest rainfall during the growing season was
recorded in 1994 (1301.4 mm) while the lowest was recorded in 1972 (495.7 mm). The second
order polynomial indicates recovery from the downward rainfall trend in Gusau.

FUTY Journal of the Environment Vol.8 No. 1, June 2014 45
Rainfall Trends at Katsina
The rainfall trend in Katsina during the growing season (1951-2010) is somewhat similar to that
of Sokoto although the the linear trend line reveals a sharper decreasing trend in the former
(Figure 4). The declining rainfall trend nothwithstanding, the second order polynomial reveals
recovery from dryness to wetness in Katsina. The periods 1954-1965 and 2000-2006 were
relatively wetter while the periods 1966-1978 and 1981-1999 were marked with relatively low
rainfall. Overall, the highest rainfall during the growing season (1951-2010) was recorded in
1964 (912.8 mm) while driest was witnessed in 1966 (217.2 mm).
Rainfall Trends at Kano
Unlike Sokoto, Gusau and Katsina, the linear rainfall trend during the growing season in Kano
reveals upward movement during the 1951-2010 period (Figure 5). However, Katsina witnessed
slight rainfall decline from 1970 to mid 1980s following by recovering trend. This recovery trend
is supported by the second order polynomial trend line which reveals upward movement. Thus,
although rainfall decreased from 1761.9mm in 1998 to 1159.3mm in 2006, the period 1998-2006
appeared to be relatively wetter during the period under consideration (1951-2010). The highest
rainfall was recorded in 1998 (1761.9 mm) while the lowest was witnessed in 1987 (354.9 mm).

FUTY Journal of the Environment Vol.8 No. 1, June 2014 46
Rainfall Trends at Potiskum
The linear trend line indicates that rainfall in Potiskum during the growing season witnessed a
downward trend during the 1951-2010 periods. However, the second order polynomial trend line
indicates slight upward movement which suggests unfolding of a wet episode. Figure 6 reveals
that the 1954-1968 period was wetter while the 1969-1989 period was characterized by low
rainfall during the growing season. Overall, the highest rainfall during the growing season was
recorded in 1990 (1393.5mm) while the lowest was recorded in 1984 (235.9 mm).
Rainfall Trends at Nguru
The linear trend line indicates that in Nguru, rainfall for the growing season during the 1951-
2010 period witnessed downward trend (Figure 7). The 1951-1965 period was characterized by
relatively wet episode while the period 1980-1993 is marked by relative dryness with the period
1994-2010 staggering between wet and dry. However, the second order polynomial trend line
suggests recovery from the downward rainfall trend. Overall, the highest rainfall was recorded in
1990 (1393.5 mm) while the lowest rainfall was recorded in 1984 (235.9 mm).

FUTY Journal of the Environment Vol.8 No. 1, June 2014 47
Rainfall Trends at Maiduguri
The linear trend line reveals that rainfall during the growing season in Maiduguri witnessed a
downward trend during the 1951-2010 period (Figure 8). With an initial downward trend of
rainfall, the second order polynomial trend line reveals recovery. Rainfall for the growing season
shows marked deviations low amount during 1964, 1971-73, 1981-85, 1990-91 and 1993-94.
The period 1995-2010 however show a recovery trend.
Drought Intensities at the Sudano-Sahelian Region of Nigeria
Table 1 reveals the intensities of drought during the growing season in the Sudano-Sahelian belt
of Nigeria during the period under consideration. The highest incidences of slight drought
occurred in Sokoto, Kano and Nguru while the lowest were witnessed in Maiduguri. Moderate
droughts were most prevalent in Maiduguri but least experienced in Gusau. While there was no
incidence of severe drought in Gusau, it was most prevalent in Katsina and Nguru but least
experienced Sokoto. The only incidence of disastrous drought during the 1951-2010 period was
witnessed in Katsina. The intensities of drought during the growing season shows spatial and
temporal variations in the Sudano-Sahelian belt of Nigeria, with the exception of few cases such
Katsina and Nguru which witnessed severe droughts during 1990 and 1991. This underscores the
role of local factors in the incidence and intensity of drought.

FUTY Journal of the Environment Vol.8 No. 1, June 2014 48
Year Drought Intensity
Index (Sokoto)
Classification
(Sokoto)
Drought Intensity
Index (Gusau)
Classification
(Gusau)
Drought Intensity
Index (Katsina)
Classification
(Katsina)
Drought Intensity
Index (Kano)
Classification
(Kano)
Drought Intensity
Index (Potiskum)
Classification
(Potiskum)
Drought Intensity
Index (Nguru)
Classification
(Nguru)
Drought Intensity
Index (Maiduguri)
Classification
(Maiduguri)
1951 - - ND ND - - - - - - - 12.4
1952 - - ND ND - - - - - - - - - -
1953 - - - - - - 17 Slight 49.7 Severe - - - -
1954 - - - - - - - - - - - - - -
1955 - - - - - - - - 19.6 Slight - - - -
1956 - - - - - - - - - - - - - -
1957 - - - - - - - - - - - - - -
1958 - - - - - - - - - - - - - -
1959 11.1 Slight - - - - - - 14 Slight - - - -
1960 - - - - - - 12.3 Slight - - - - - -
1961 - - - - - - - - - - - - - -
1962 - - - - - - - - - - - - - -
1963 - - - - - - 17.5 Slight - - - - - -
1964 - - - - - - - - - - - - 22.5 Slight
1965 - - - - - - 18.4 Slight - - - - - -
1966 - - - - - - - - - - - - - -
1967 - - - - 31 Moderate 44.8 Moderate 12.7 Slight - - - -
1968 40.1 Moderate - - 22.2 Slight - - - - - - - -
1969 - - - - - - - - - - 15.5 Slight - -
1970 - - - - 21.2 Slight 21.1 Slight 21.2 Slight - - - -
1971 25.1 Moderate - - 21.9 Slight 38.2 Moderate 15.7 Slight - - 47.5 Severe
1972 29.2 Moderate 38.4 Moderate 19.7 Slight 47 Severe - - 45.9 Severe 41 Moderate
1973 35.7 Moderate 11.8 Slight - - 22.4 Slight - - 40.3 Moderate 25.6 Moderate
1974 27.7 Moderate - - 15.2 Slight 17.3 Slight - - - - - -
1975 22.1 Slight - - 11 Slight 44 Moderate 32.5 Moderate - - - -
1976 - - 26.2 Moderate - - - - - - 20.3 Slight - -
1977 - - 11.7 Slight 13.7 Slight - - - - - - - -
1978 - - - - - - 15.4 Slight - - - - - -
1979 - - - - - - - - 42.1 Moderate - - - -
1980 19.9 Slight 11.3 Slight - - 34 Moderate 31.3 Moderate 25.4 Moderate - -
1981 20.8 Slight 16.7 Slight 14.9 Slight 30 Moderate - - - - 34.2 Moderate
1982 - - 29 Moderate 25.2 Moderate 39.8 Moderate - - - - 40.2 Moderate
1983 - - - - 34.8 Moderate 47.7 Severe - - 46.9 Severe 54.5 Severe
1984 26.5 Moderate 27.1 Moderate 32.5 Moderate 23.2 Slight 55.1 Severe 31.9 Slight 44.1 Moderate
1985 33.2 Moderate - - - - 14.6 Slight 14.9 Slight 11 Slight 32.6 Moderate
1986 24.4 Slight - - 30.3 Moderate 54.3 Severe 43.2 Moderate 43.1 Moderate - -
1987 49.9 Severe 20 Slight 19.3 Slight - - 13.2 Slight 41.4 Moderate 40.6 Moderate
1988 - - - - - - 18.6 Slight - - 25.9 Slight - -
1989 - - - - - - 34 Moderate 36.3 Moderate 21 Slight - -
1990 - - 20.4 Slight 52.4 Severe 12.6 Slight - - 50.3 Severe 27.3 Moderate
1991 - - 12.1 Slight 45.4 Severe - - - - 51.8 Severe 29.2 Moderate
1992 14.5 Slight - - 53 Severe - - 48.1 Severe 31.5 Moderate - -
1993 - - - - 20.2 Slight - - - - 22.4 Slight 24.4 Slight
1994 - - - - 36.2 Moderate 16.3 Slight - - 25.6 Moderate
1995 18.4 Slight 19.9 Slight 60.4 Disastrous - - - - 28.8 Moderate - -
1996 - - - - 29.2 Moderate - - - - - - - -
1997 19 Slight 16.2 Slight 25.4 Moderate - - - - - - 15.9 Slight
1998 - - - - 47.4 Severe - - - - - - - -
1999 - - - - - - - - - - - - - -
2000 - - - - - - - - - - 22.6 Slight - -
2001 - - 20.2 Slight - - - - - - - - - -
2002 - - 19.1 Slight - - - - 21 Slight 13.1 Slight 16.8 Slight
2003 - - - - - - - - - - 22.8 Slight - -
2004 17.5 Slight - - - - - - 27.6 Moderate - - - -
2005 12.1 Slight - - - - - - - - - - - -
2006 - - - - - - - - 30.3 Moderate - - 14.1 Slight
2007 - - 30.1 Moderate - - - - - - - - - -
2008 21.1 Slight - - 42.4 Moderate - - - - 23.9 Slight - -
2009 23.5 Slight - - - - - - - - 20.8 Slight 13.2 Slight
2010 - - - - - - - - - - - - - -
Table 1: Growing Season (June-September) Drought Intensities in the Sudano-Sahelian Region of Nigeria
ND = No data

FUTY Journal of the Environment Vol.8 No. 1, June 2014 49
Discussion
The rainfall amount during the growing season (June-September) in the Sudano-Sahelian
region of Nigeria exhibits negative trends during the 1951-2010 periods with exception of
Kano. The downward trends of annual rainfall revealed in the synoptic weather stations
investigated in this study particularly since the 1960s corroborate earlier studies (Boko et al.,
2007; Odjugo, 2010a and 2010b; Odekunle, 2010; Umar, 2012a). The downward trends of
rainfall during the growing season have contributed to the seasonal and long-term
fluctuations of the volume of water in rivers and the recession of Lake Chad. The scramble
for the fertile and pastures-rich floodplains for fadama farming and livestock grazing with
accessible water have therefore induced conflicts in the region (Fasona and Omojola, 2005)
which have led to loss of lives and properties as well as displacement of people.
The study reveals that droughts of varying magnitudes occurred across the Sudano-Sahelian
region of Nigeria between the 1951-2010 period. The occurrence of droughts of various
intensities in the study area therefore agrees with previous studies (Ayoade, 1988; Olaniran,
2002; Gworgwor, 2006; Ati et al, 2010; Atedhor and Odjugo, 2012; Umar, 2012b). Drought
has therefore, been reported as one of the major drawbacks of crop production in the semi-
arid belt of Nigeria (Ati et al., 2010). Furthermore, the dry spells which account for the high
frequency of disastrous droughts in the month of June which coincides with the onset of the
growing season could delay the commencement of planting due moisture inadequacy
especially with the prevalence of rainfed agriculture and poorly developed irrigation schemes
in the region. The shrinking growing season and below average rainfall account for the shift
in crop production from late to early maturing crops in the sahelian region (Odjugo, 2010b).
It is therefore imperative that resources should be galvanized to harness the irrigation
potentials of the region for enhanced and sustainable agricultural productivity. Apart from the
agricultural impacts of the decreasing rainfall trends as well as the frequent incidence of
droughts in the Sudano-Sahelian region of Nigeria, the region has also been under the threat
of desertification (Odjugo and Ikhuoria, 2003; Henah, 2012). Some of the consequences of
desertification as revealed by previous studies are loss of arable land, outmigration farmer to
more favourable environments (Evans and Mohieldeen, 2003), increasing conflicts (Fasona et
al, 2005) and increasing incidence of migratory pests attacks (Omiunu, 1985; Ishaya and
Abaje, 2008).
Conclusion and Recommendations
This paper examined rainfall trends and drought intensities during the growing season in the
Sudano-Sahelian region of Nigeria. The results reveal negative trends of monthly and
growing season rainfall in all the synoptic weather stations investigated in the study with the
exception of Kano which showed positive trend. The drought incidences were predominantly
of slight and moderate intensities. The drought intensities largely reveal spatial and temporal
variations which underscore the role of local factors in the occurrence and intensities of
droughts. In view of the pivotal role of the Sudano-Sahelian region as the main source of the
nation‘s cereal and animal protein, it is recommended that the provision of irrigation should
be intensified and agricultural activities in the region should be aligned with prevailing
climatic trends in order to realize the country‘s quest for food security.

FUTY Journal of the Environment Vol.8 No. 1, June 2014 50
References
Adebayo, W. O. (1999) Spatio-temporal Dynamics of Temperature and Rainfal Fluctuations
in Nigeria, Unpublished Ph. D. Dissertation, Department of Geography, University of
Ibadan, Ibadan.
Atedhor, G.O. and Odjugo, P.A.O. (2012) Rainfall Dynamics and Drought Intensities in
North- Western Nigeria, Benin Journal of Social Sciences, Vol. 20 (1):116-127.
Ati, O. F., Iguisi, E.O. and Mohammed, S.O. (2010) Effects of El Nino/Southern Oscilalation
(ENSO) on rainfall characteristics in Katsina, Nigeria, Journal of Agricultural Research,
and Vol. 5 (23): 3273-3278.
Ayoade, J.O. (1988) On Drought and Desertification in Nigeria. In Sada, P.O. and Odemerho,
F.O. (eds.) Environmental Issues and Management in Nigerian Development, Ibadan
Evans and Brothers Limited: 271-290.
Ayoade, J.O. (2008) Techniques in Climatology, Sirling-Horden, Ibadan
Boko, M., I. Niang, A. Nyong, C. Vogel, A. Githeko, M. Medany, B. Osman-Elasha, R. Tabo
and P. Yanda (2007) Africa. Climate Change 2007: Impacts, Adaptation and
Vulnerability. Contribution of Working Group II to the Fourth Assessment Report of the
Intergovernmental Panel on Climate Change, M.L. Parry, O.F. Canziani, J.P. Palutikof,
P.J. van der Linden and C.E. Hanson, Eds., Cambridge University Press, Cambridge UK,
433-467.
Evans, M. and Mohieldeen, Y. (2002) Environmental Change and Livelihood Strategies: The
Case of Lake Chad, Geography, Vol. 87(1): 3-13.
Fasona, M.J. and Omojola, A.S. (2005) Climate Change, Human Security and Communal
Clashes in Nigeria, A Paper Presented at the International Workshop on Human Security
and Climate Change, Held on 21–23 June 2005, Holmen Fjord Hotel, Asker.
Goes, B.J.M. (2001) Effects of Damming the Hadejia River in Semi-arid Northern Nigeria –
Lessons Learnt for Future Management, Proceeding of Symposium on Regional
Management of Water Resources, Held in July 2001, Netherlands.
Gwogwor, N.A. (2006) Mitigating the Effects of Changing Rainfall Patterns on Striga
Hermonthica (Del.) Benth. Infestation in Cereal Crops in the Sudan Savanna Zone of
Nigeria. In Adejuwon, J.O. and Ogunkoya, O.O. (eds.) Climate Change and Food
Security in Nigeria, Obafemi Awolowo University Press, Ile-Ife: 248-260
Henah, P. J. (2012) Climate Change and Desertification in North-Eastern Nigeria and Yobe
State, Unpublished M.Sc. Project Submitted to the Department of Geography and
Regional Planning, University of Benin, Benin City.
Illiya, M.A. and Sakwah, H.H. (2006) Farmers‘ Coping Strategies with Drought in Sokoto,
Northwestern Nigeria. In Adejuwon, J.O. and Ogunkoya, O.O. (eds.) Climate Change
and Food Security in Nigeria, Obafemi Awolowo University Press, Ile-Ife: 238-247.

FUTY Journal of the Environment Vol.8 No. 1, June 2014 51
IPCC (2001) Climate Change 2001: Impacts, Adaptations and Vulnerability, Contribution of
Working Group II to the Third Assessment Report, Cambridge
Ishaya, S. and Abaje, I.B. (2008) Indigenous People‘s Perception on Climate Change and
Adaptation Strategies in Jema‘s Local Government Area of Kaduna State, Nigeria,
Journal of Geography and Regional Planning, Vol. 1(8): 138-143.
Odekunle, T.O. (2004) Rainfall and Length of the Growing Season in Nigeria, International
Journal of Climatology, Vol. 24: 467-479.
Odekunle, T.O. (2010) Trends in the Extreme Daily Rainfall Amount and the frequency of
Rainy Days in Sokoto, Sudano-Sahelian Ecological Zone of Nigeria, Ife Research
Publications in Geography, Vol. 9 (1): 1-14
Odjugo, P.A.O. (2010a) Regional Evidences of Climate Change in Nigeria, Journal of
Geography and Regional Planning, Vol. 3(6): 142-150.
Odjugo, P.A.O. (2010b) Adaptation to Climate Change in the Agricultural Sector in the
Semi-arid Region of Nigeria, A Paper Presented at the 2nd International Conference:
Climate, Sustainability and Development in Semi-arid Regions, Held 16 – 20th August ,
2010, Fortaleza - Ceará, Brazil.
Odjugo, P.A.O. and Ikhuoria, I.A. (2003) Impact of Climate Change and Anthropogenic
Factors on Desertification in the Semi-Arid Region of Nigeria, Global Journal of
Environmental Sciences, Vol. 2(2): 118-126.
Oduyemi, Y.A. and Ogunkoya, O.O. (2006) Climate Variability and Crop Yield in the
Guinea Savanna. In Adejuwon, J.O. and Ogunkoya, O.O. (eds.) Climate Change and
Food Security in Nigeria, Obafemi Awolowo Press, Ile-Ife: 169-180.
Oguntoyinbo, J.S. (1978) Climate. In Oguntoyinbo, J.S., Ariola, O.O. and Filani, M. (eds.) A
Geography of Nigerian Development, Hienemann, Ibadan: 45-70.
O‘Hare, G. (2002) Global Warming and the Temple of Sustainable Development,
Geography, and Vol. 87 (3): 234-246.
Ojo, O. (1991) Overcoming Hunger: The Challenges in Meteorological Hazards and
Agricultural Development. In Oguntoyinbo, J.S., Omotosho, J.B. and Ekuwem, E.E.
(eds.) Meteorological Hazards and Development, Kola Okanlawon Publisher, Lagos: 22-
36.
Olaniran, O.J. (2002) Rainfall Anomalies: The Contemporary Understanding, 55th
Inaugural
Lecture Series, University of Ilorin, Ilorin, Nigeria.
Oladipo, E.O. (1991) On the Spatial Coherence of Drought in Northern Nigeria: Some
Meteorological Implication. In Oguntoyinbo, J.S., Omotosho, J.B. and Ekuwem, E.E.
(eds.) Meteorological Hazards and Development, Kola Okanlawon Publisher, Lagos:
151-157.

FUTY Journal of the Environment Vol.8 No. 1, June 2014 52
Ologe, K.O. (2002) Nigeria: Relief and Hydrography. In Okafor, S.I., Osaghae, E.,
Ikporukpo, C., Abumere, S. (eds.) Africa Atlasses: Nigeria, Les Editions J.A., Paris.
Omiunu, F.G.I. (1985) Effects of Drought on Food Production in Nigeria, Malaysian Journal
of Tropical Geography, Vol. 11: 54-62.
Umar, A.T. (2012a) Spatio-Temporal Pattern of Rainfall Anomalies and its Implications for
Crop Production in Nigeria. In Odjugo, P.A.O., Asikhia, M.O. and Ikelegbe, O.O. (eds.)
Climate Change and Variability: Saving Our Tomorrow Today, Proceedings of the 2012
Annual Conference of Nigerian Meteorological Society, 68-72.
Umar, A.T. (2012b) Climatic Change in Nigeria: Evidence from Meteorological Parameters.
In Iliya M.A. and Dankani, I.M. (eds.) Climate Change and Sustainable Development in
Nigeria, Crown F. Publishers, Ibadan.

FUTY Journal of the Environment Vol.8 No. 1, June 2014 53
USING SRTM AND GDEM2 DATA FOR ASSESSING
VULNERABILITY TO COASTAL FLOODING DUE TO SEA LEVEL
RISE IN LAGOS:A COMPARATIVE STUDY
K. F.Aleem1* and Y. A. Aina
2
1Surveying and Geoinformatics Programme, Abubakar Tafawa Balewa University, Bauchi, Nigeria 2Department of Geomatics Engineering Technology, Yanbu Industrial College, Yanbu, Saudi
Arabia
E-Mails: [email protected]
* Corresponding Author: e-mail: [email protected]
Abstract
Climate change and its associated sea level rise is one of the recent challenging global issues
especially in coastal areas, where a large percentage of the world population resides. Sea-
level rise (SLR) is expected to increase coastal inundation and erosion. This may disrupt the
physical and human processes including economic systems and social structures in coastal
regions, which are densely populated. Digital Elevation Model (DEM) especially Shuttle
Radar Topography Mission (SRTM) is a common source of elevation data for assessing the
risk of flooding due to sea level rise. Recently, a new Advanced Space borne Thermal
Emission and Reflection Radiometer(ASTER) Global DEM Version 2 (GDEM2) has been
released to the public. This paper compares the flood risk estimations of SRTM and GDEM2.
It examines different scenarios of sea level rise and its consequences on flooding in Mainland
Lagos. It uses high resolution remote sensing data within Geographic Information System
(GIS) environment to visualize the scenarios. The result shows that Lagos Mainland is
vulnerable to sea level rise and SRTM (RMSE = 1.98) gives better flood risk estimations than
GDEM2 (RMSE = 10.09).
Keywords: geospatial techniques; sea level rise, coastal flooding, SRTM, ASTER GDEM2
and flood risk estimations.
1. Introduction
Global warming and climate change and the associated sea level rise have great impact on the
coastal regions which are densely populated and home of most economic activities in the
world. About 10% of the world‘s population lives in the coastal region where the elevation is
less than 10 metres above sea level (McGranahan et al., 2007). Sea level rise could cause
coastal flooding and other environmental problems. This would disrupt the physical, cultural
and socio-economic systems in the region. It therefore poses one of the major environmental
challenges and major concerns of today. This made the United Nation General Assembly
adopt the Intergovernmental Panel on Climate Change (IPCC) under the United Nations
Environmental Programme (UNEP) and the World Meteorological Organization (WMO) as
the leading international body for the assessment of climate change and its attendant sea level
rise. Various countries also set up national action plans on climate change and collaborate
with the IPCC. Nigeria, for example, has acknowledged the impacts of climate change,
through sea level rise along its coast line, increasing desertification in the north of the
country, exacerbated erosion in the east and general land degradation throughout the country.
One of the challenges of climate change and sea level rise is the coastal erosion and
inundation. Coastal erosion is wearing away of the coast by waves or other agents, which

FUTY Journal of the Environment Vol.8 No. 1, June 2014 54
shape the coast, because the power of wave has a significant influence on the coast. Such
influence is aided by sea level rise. This will definitely affect the socio-economic activities of
the coastal and densely populated region of the world. The causes of sea level rise may be
attributed to the following factors: the increase in water volume that results mainly from
thermal expansion of the ocean, melting of mountain glaciers, an accelerated discharge of
glacial ice from the ice sheets to the ocean, contributions from thawing of permafrost,
sediment deposition, and the continuing adjustment of the ice sheets. Also, geological uplift
or subsidence processes occurring in ocean basins and on continents can also influence long-
term local sea level changes, and can exacerbate sea level rise impacts in many areas.
In order to study the impacts of climate change and SLR on societies, different climate
modeling groups have developed scenarios of SLR given expected rise in temperature. These
scenarios are modeled using geospatial data such as Digital Elevation Models like Shuttle
Radar Topography Mission (SRTM), ASTER - Advanced Space borne Thermal Emission
and Reflection Radiometer and the recently released ASTER Global Digital Elevation Model
Version 2 (GDEM2). These terrain analyses are very important in depicting the areas that
could be affected by predicted SLR. In this work, five different scenarios (1m, 2m, 3m and
5m) were used in the study area (Lagos Mainland) to assess the impact of predicted sea level
rise and compare two different DEM data (SRTM and GDEM2) in a GIS environment.
2. Analysis of the Impacts of SLR Scenarios: The Role of Geospatial Techniques
The Intergovernmental Panel on Climate Change has considered different parameters for
climate change simulations based on scenarios. The parameters such as; combinations of
demographic change, social and economic development, and broad technological
developments have been used to model the key issues in the simulation. The simulations have
been carried out by the climate modeling groups as their major contribution to the IPCC
Third Assessment Report. The different scenarios adopted by IPCC are known as IS92. The
IS92 scenarios include IS92a, IS92b IS92c IS92d, IS92e and IS92f (Rekacewicz and
UNEP/GRID, 2005).
The impacts of sea level rise scenarios can be predicted or projected for a particular location.
For example, Warrick et al. (1996) made projections of thermal expansion and of loss of
mass from glaciers and ice-sheets for the 21st century for the IS92 scenarios using two
alternative simple climate models. Several other authors have based their prediction on these
scenarios. Onyenechere (2010) madea vulnerability analysis based on climate change and an
accelerated sea level rise (ASLR) of 1.0m. The study equally showed the projections of other
parameters in the vulnerability analysis. Results of the analysis indicate that more than
13million people are presently at risk and may be relocated due to climatic variations and sea
level changes. With the projected climate change and sea level rise of about 0.5m, the number
of people that may be relocated assuming there is no development would increase to more
than 27 million. With further physical and infrastructural development, the number will be
about 53 million people, if the sea level should rise by about 1.0m with the projected climate
change.
The Special Report on Emissions Scenarios (SRES) considered the global average sea level
change from 1990 to 2100 (IPCC, 2001).Globally averaged sea level is projected to rise
between 0.09 to 0.88m by the year 2100 (FME, 2003).The global average sea level rise
projected from 1990 to 2100 for the SRES scenarios accounted for various parameters. The
parameters like thermal expansion and land ice changes were calculated using a simple

FUTY Journal of the Environment Vol.8 No. 1, June 2014 55
climate model calibrated separately for each of seven AOGCMs, and contributions from
changes in permafrost, the effect of sediment deposition and the long-term adjustment of the
ice sheets to past climate change were added. Each of the six lines appearing in the key,in the
report, is the average of AOGCMs for one of the six illustrative scenarios (IPCC, 2012).
Other factors considered the contributions from thawing of permafrost, sediment deposition,
and the continuing adjustment of the ice sheets to climate changes. The choice of scenario is
not the principal consideration; the main point is that the AOGCMs all follow the same
scenario, so the range of results reflects the systematic uncertainty inherent in the modeling
of sea level changes. IPCC provides good explanation for all the regions and scenarios
(IPCC, 2012). The use of these scenarios is better enhanced with the use of geospatial data
and techniques.
Geospatial techniques are integrated approaches of gathering, storing, processing, sorting,
managing and delivering geographical related information. Geospatial methods usually
adopted in sea level rise impact modeling utilise Digital Elevation Models (DEM) for
elevation data. In the past, ground surveying methods such as traversing and leveling were
used to obtain elevation data for DEM. But it requires rigorous field work and time and
cannot be used for time-critical projects over very large areas. Existing topographic maps
have also been used for deriving DEM data. Aina (1996) used topographic maps to analyze
the impacts of sea level rise based on the contours and spot heights. The accuracy of data
from topographical maps depends on the accuracy of the source data and topographic maps
are relatively difficult to access compared to DEM data (SRTM and ASTER GDEM). Isioye
and Jobi (2011) assessed the accuracy of DEM data derived from topographical maps,
Google Earth, SRTM and Total Station instruments. They noted that the accuracy of data
from Total Station is the best followed by topographical map data, then Google Earth data
and SRTMin their study area (Zaria, Kaduna state of Nigeria).In a recent study, El-Ashmawy
(2014) compared the DEM data derived from analytical aerial photogrammetry, GPS
observations, total station and terrestrial laser scanning. The study concluded that total station
and laser scanning are the most accurate (RMSE of 10 cm and 12 cm) followed by GPS
(RMSE of 23 cm) and photogrammetry (RMSE of 42 cm).
Satellite and aerial DEM data such as SRTM, LiDAR and ASTER are being increasingly
adopted by researchers to analyse the impacts of predicted sea level rise to their accessibility
and coverage. They are used in carrying out national, regional and global studies in which
traditional data collection techniques might not be effective. LiDAR data are more accurate
than SRTM and ASTER as shown by Schumann et al. (2008) and Van de Sande et al. (2012).
However, the cost of acquiring LiDAR data is higher than that of SRTM or ASTER which
are freely available on the internet.
SRTM has been successfully used for assessing the impacts of flooding due to sea level rise
(Li et al, 2009) but with some drawbacks such as missing data (‗voids‘) and low spatial
resolution (90m). In recent times, the ASTER (Advanced Space borne Thermal Emission and
Reflection Radiometer) GDEM data is gaining attention from researchers due to its resolution
(30m) which is higher than SRTM‘s resolution. High resolution data such as ASTER GDEM
are desirable for local SLR modeling. The ASTER imaging instrument is flying on the Terra
satellite - a satellite launched in December 1999 as part of National Aeronautic and Space
Administration - NASA's Earth Observing System - EOS. ASTER is a cooperative effort
between NASA, Japan's Ministry of Economy, Trade and Industry (METI) and Japan's
EarthRemoteSensingDataAnalysisCenter(JPL, 2012). ASTER is being used to obtain
detailed maps of land surface temperature, reflectance and elevation.

FUTY Journal of the Environment Vol.8 No. 1, June 2014 56
Studies such as Van de Sande et al. (2012) have found that ASTER GDEM data is less
accurate (vertical accuracy) than SRTM in modeling risks and vulnerability associated with
SLR. Thus, SRTM despite its lower spatial resolution is still preferable to ASTER GDEM.
Forkuorand Maathuis (2012), in a study of two regions in Ghana, concluded that the RMSE
of SRTM data is lower than the RMSE of ASTER GDEM1 data in those regions. Thus,
SRTM data has a higher accuracy than ASTER GDEM1 data (Forkuor and Maathuis, 2012).
In October 2011, a new version of ASTER Global Digital Elevation Model (GDEM2) was
made available to the public. The new data set is noted to have improved accuracy over
GDEM1 but ―the data would still have to be assessed and edited on a case-by-case basis
before use in specific applications‖ (Tachikawa, 2011).
The use of Geographic Information System (GIS) as a tool in the process of data
identification and analysis cannot be over-emphasized. GISis used for various analyses
including modeling of flood risks due to climate change and sea level rise. In the studies by
Li et al. (2009) and Van de Sandeet al. (2012), GIS was adopted to model the impacts of
different scenarios of sea level rise on global and local communities. This paper contributes
to the research on the sensitivity of flood risk assessment to DEM by comparing two DEM
models and evaluating the accuracy of GDEM2 in an area that is prone to cloud cover
(Lagos).
3. Methodology
Study area
Lagos state lies approximately between longitudes 2042' and 3
042' east of the Greenwich
Meridian and latitudes 6022' and 6
052' north of the Equator. The state is bounded in the south
by the Atlantic Ocean, Benin Republic in the east and Ogun State in the north and west. The
study area is located in Lagos Mainland and is bounded in the west by Lagos Lagoon another
important water body in the area (Figure1). This area is vulnerable to sea level rise because of
the presence of large water bodies (Atlantic Ocean and Lagos Lagoon), its low-lying nature
and flooding as a result of heavy rain.
Materials and methods
SRTM data (global land cover facility) and ASTER GDEM2 (METI and NASA) data of 90m
and 30m resolutions respectively were downloaded from the internet
(http://www.landcover.org/ and http://gdem.ersdac.jspacesystems.or.jp/). IPCC adopted
scenarios of sea level rise were searchedfrom the literature. The surge of 1 in 200years was
also considered in assessing the vulnerability to flooding due to sea level rise. The same
approach was adopted by Van de Sande et al. (2012). Thus, the scenarios of 1m, 2m, 3m and
5m were adopted in this work. ArcGIS 9.2 software was used to analyse the data. The
hardware components used have sufficient facility to cater for the exercise. A number of GIS
analyses were performed on the geo-referenced image of both SRTM and GDEM2. Different
heights corresponding to the different adopted scenarios (1m, 2m, 3m, 4m and 5m) were
extracted (using ArcGIS Spatial Analyst Tools) from the images to compute the areas that
would be affected by inundation. The statistics (mean, standard deviation and standard error)
of the SRTM and GDEM2 images were also computed. Efforts were made to retain the
original values of the DEM images by just extracting the heights without further
interpolations or using nearest neighbour method whenever interpolation could not be
avoided.

FUTY Journal of the Environment Vol.8 No. 1, June 2014 57
Figure 1. Study Area
In order to ascertain the suitabilityof these data for estimating vulnerability to coastal
inundation in the study area, two different analyses were carried out. In the first analysis,
SRTM was selected as base of the comparison because Tachikawa et al. (2011) affirmed that
GDEM2 data is generally comparable to SRTM while Van de Sande et al. (2012) asserted
that SRTM is more suitable than GDEM1. In the second analysis, about 25 orthometric
height data points (Table 1) were used as base of comparison to compute the root mean
square error (RMSE) of SRTM and GDEM data.
4. Results and Discussion
According to the study by Van de Sande (2011), the study area will not be inundated by3.1m
storm surge using GDEM1 while the area will be affected by flooding as indicated with the
use of SRTM data. The results of the ASTER GDEM2 are shown in Figure 2. The height
values of 140m above the sea level in areas covered by Lagos lagoon differed fromexpected
values. It shows that the ASTER GDEM2data does not represent the Lagos lagoon very well
as there are high values in the Lagos Lagoon area which is very unlikely for a water body
because water will always find its level. Lagos Lagoon is expected to have height value close
to mean sea level, since EGM96 is adopted for ASTER GDEM2.Therefore, extremely high
values such as 140m to 536m which occurred in the study as shown in Figure 2are indications
of the deviation from expected values. The black colour in the southern part of the study as
shown in Figure 2 is an indication of the deviation from expected values. These couldbe
considered as the areas with artifacts "pits and "bumps" in the GDEM2 data as noted by
Tachikawa et al. (2011).

FUTY Journal of the Environment Vol.8 No. 1, June 2014 58
As indicated above, the adopted sea level rise scenarios were 1m, 2m 3m and 5m. The
different scenarios for GDEM2 of coastal inundation are shown in Figure 3 and different
scenarios of coastal inundation based on SRTM are as shown in Figure 4. Since both images
have different spatial resolutions, the area of each of the pixels was calculated to be 8100sq.m
for SRTM and 900 sq.m GDEM2. The number of pixels for each of the scenarios was
calculated as shown in Table 2. Total surface area covered by each of the two methods under
study was computed for each of the scenarios as shown in Table 2. The areas that might
likely be inundated due to sea level rise using SRTM are larger than the areas computed using
GDEM2 for all the scenarios. The largest difference was obtained at the scenario of 5m.
Table 3 shows the statistics for GDEM2 and SRTM images. The standard deviation and
standard errors of GDEM2, 14.172 and 0.26 respectively, are larger than the corresponding
values from SRTM.
The figures, tables and analysis below show that SRTM DEM data are more suitable than
GDEM2 data in the study area. The outrageous values (over 140m) in GDEM2 data were
considered as outliers in the statistics since they were more than 3 standard deviations and
therefore removed from the values used in the statistical table above. The RMSE of 22.79
was obtained for GDEM2, when SRTM was assumed to be the standard data. The RMSE is
too high compared to RMSE of 4.01 and 8.68 for SRTM and GDEM2 respectively obtained
by using orthomeric as benchmark in the validation carried out by Tachikawa et al. (2011).
The RMSE obtained by using orthomeric data as the reference data was 1.98 for SRTM data
and 10.09 for ASTER GDEM2 data (still higher than the RMSE computed by Tachikawa et
al. (2011)). The artifactsand errors of the GDEM2 data might have resulted from cloud
contamination because the area is prone to heavy cloud being a tropical rainforest area.
Figure 2. GDEM2 values for the study area

FUTY Journal of the Environment Vol.8 No. 1, June 2014 59
Figure 3. Different scenarios of coastal inundation based on GDEM2 data

FUTY Journal of the Environment Vol.8 No. 1, June 2014 60
Figure 4. Different scenarios of coastal inundation based on SRTM data

FUTY Journal of the Environment Vol.8 No. 1, June 2014 61
Table 1. Heights of control points (Orthometric, GDEM2 and SRTM)
POINT LATITUDE LONGITUDE ORTHOMETRIC SRTM GDEM2
1 6.517765 3.402264 0.00 0 0
2 6.517490 3.402327 1.82 0 0
3 6.518575 3.401920 1.64 0 0
4 6.518696 3.399188 7.53 8 37
5 6.518642 3.393875 7.41 9 22
6 6.518929 3.392505 5.84 8 27
7 6.519092 3.391300 5.58 7 25
8 6.518737 3.391432 5.75 8 24
9 6.517145 3.391709 3.52 5 14
10 6.515366 3.391728 3.40 6 31
11 6.515062 3.391663 3.25 6 32
12 6.514972 3.391644 3.23 6 31
13 6.511630 3.389092 3.81 3 14
14 6.511631 3.389093 3.45 3 14
15 6.512873 3.389560 5.08 6 12
16 6.518270 3.389619 6.63 9 3
17 6.518446 3.389824 5.86 9 4
18 6.519157 3.391290 4.98 7 25
19 6.513006 3.392199 2.94 6 15
20 6.513297 3.393490 4.63 4 11
21 6.513756 3.395709 5.35 7 8
22 6.513867 3.395922 7.02 7 5
23 6.516708 3.397546 7.41 10 8
24 6.516707 3.397552 7.52 10 8
25 6.532325 3.399299 2.53 0 0

FUTY Journal of the Environment Vol.8 No. 1, June 2014 62
Table2.Areas covered by each scenario for GDEM2 and SRTM
Scenario Number of Pixels Area Covered by the scenarios
SRTM GDEM2 SRTM (m2) GDEM2 (m
2)
1m 148 746 1198800 671400
2m 286 774 2316600 696600
3m 472 803 3823200 722700
5m 831 952 6731100 856800
Table 3. Statistics for the sampled elevationsof both GDEM2 and SRTM
Statistics GDEM2 SRTM
Number of points 2970 2970
Minimum 0 0
Maximum 61 12
Mean 20.472 3.711
Standard Deviation 14.172 2.938
Standard Error 0.260 0.053
RMSE (using orthometric
height data as reference)
(25 data points)
10.09 1.98
6. Conclusion and Recommendations
The study has compared the use of STRM and ASTER GDEM2 to analyse the impact of sea
level rise in Lagos Mainland. The IPCC scenario of sea level rise for 1m, 2m, 3m and 5m
were used for the analyses. The study indicates that SRTM DEM data shows better accuracy
than GDEM2 in depicting areas prone to inundation due to sea level rise in Lagos Mainland.
The impact of sea level rise should be studied and assessed using geospatial techniques and
data such as SRTM, which gave a fairly better result. Though other data sources such as
LiDAR and ground surveying that are more accurate than SRTM are available, the
accessibility of the SRTM and GDEM2 to the public will still be an important factor in
adopting these data.
Lagos state government has acquired LiDAR data of Lagos and it is recommended that this
data be used in analyzing different scenarios of climate change. The data was available online
(http://gis.lagosstate.gov.ng/LAGIS/WebPages/Map/MapViewer.aspx)for acquisition by
researchers for a short period of time and the website has gone offline since then. It would be
better if the data can be made available to researchers to stimulate better research on sea level
rise.
Acknowledgements
The authors wish to acknowledge the assistance of Global Land Cover Facility for providing
the SRTM data and the National Aeronautic and Space Administration (NASA) and Japan's
Ministry of Economy, Trade and Industry (METI) for providing the ASTER GDEM2 data.

FUTY Journal of the Environment Vol.8 No. 1, June 2014 63
REFERENCES
Aina, Y. A. (1996).Consequences of climate change and sea Level rise on Lagos state: A case
study of Lagos Mainland LGA.B.Sc. Project submitted to Department of Geography and
Planning, University of Lagos.
El-Ashmawy, K. L. A. (2014). A comparison between analytical aerial photogrammetry,
laser scanning,total station and global positioning system surveys for generation of
digital terrain model, Geocarto International, DOI:10.1080/10106049.2014.883438.
Federal Ministry of Environment - FME (2003).Nigeria‘s First National Communication
under the United Nations Framework Convention on Climatic Change
(UNFCCC).FederalRepublic of Nigeria,Abuja.
Forkuor, G. and B. Maathuis (2012). Comparison of SRTM and ASTER Derived Digital
Elevation Models over Two Regions in Ghana - Implications for Hydrological and
Environmental Modeling. In: Studies on Environmental and Applied Geomorphology,
Piacentini, T. (ed.), ISBN: 978-953-51-0361-5, InTech, Available from:
http://www.intechopen.com/books/studies-on-environmental-and-
appliedgeomorphology/comparison-of-srtm-and-aster-derived-digital-elevation-models-
over-two-regions-in-ghana
Intergovernmental Panel on Climate Change - IPCC (2001).Working Group I: The Scientific
Basis.http://www.ipcc.ch/ipccreports/tar/wg1/fig11-12.htmAccessed 21 March 2012.
Intergovernmental Panel on Climate Change – IPCC (2012).Special Report on Managing the
Risks of Extreme Events and Disasters to Advance Climate Change
Adaptation.http://www.ipcc.ch/index.htm Accessed 21 March 2012.
Isioye, O. A. and N. P. Jobi (2011). An assessment of digital elevation models (DEMs) from
different spatial data sources.FIG Working Week 2011.Bridging the Gap between
Cultures. Marrakech, Morocco, 18-22 May 2011
Jet Propulsion Laboratory (JPL) - California Institute of Technology(2012).Latest featured
image from ASTER.http://asterweb.jpl.nasa.gov/ Accessed 21 March 2012.
Li, X., R. J. Rowley, J. C. Kostelnick, D. Braaten, J. Meisel, and K. Hulbutta (2009). GIS
Analysis of Global Impacts from Sea Level Rise.Photogrammetric Engineering &
Remote Sensing, 75(7), pp. 807–818
McGranahan, G., D. Balkand B. Anderson(2007).The Rising Tide: Assessing the Risks of
Climate Change and Human Settlements in Low Elevation Coastal Zones. Environment
& Urbanization, 19 (1), pp. 17-37
Onyenechere, E. C. (2010). Climate Change and Spatial Planning Concerns in
Nigeria:Remedial Measures for More Effective Response. Journal of Human Ecology,
32 (3), pp. 137-148
Rekacewicz, P. and UNEP/GRID-Arendal(2005).Scenarios of sea level rise, now –
2100.http://www.grida.no/graphicslib/detail/scenarios-of-sea-level-rise-now-2100_6de6
Accessed 21 March 2012.
Schumann, G., P. Matgen, M. E. J. Cutler, A. Black, L. Hoffmann, and L. Pfister (2008).
Comparison of remotely sensed water stages from LiDAR, topographic contours and
SRTM. ISPRS Journal of Photogrammetry and Remote Sensing, 63(3), pp. 283-296

FUTY Journal of the Environment Vol.8 No. 1, June 2014 64
Tachikawa, T., M. Kaku, A. Iwasaki, D. Gesch, M. Oimoen, Z. Zhang, J. Danielson, T.
Krieger, B. Curtis, J. Haase, M. Abrams, R. Crippen and C. Carabajal (2011).ASTER
Global Digital Elevation Model Version 2 – Summary of Validation
Results.http://www.ersdac.or.jp/GDEM/ver2Validation/Summary_GDEM2_validation_r
eport_final.pdf, Accessed 21 March 2012.
Van de Sande, B.C. (2011). Sensitivity of Coastal Flood Risk Assessments to Digital
Elevation Models; Case Study Lagos State, Nigeria.Poster presented at CoastGIS
Conference, Ostend, Belgium, 5-8 September 2011
Van de Sande, B., J. Lansen, and C. Hoyng(2012). Sensitivity of Coastal Flood Risk
Assessments to Digital Elevation Models. Water, 4(3), pp. 568-579
Warrick, R.A., C. Le Provost, M.F. Meier, J. Oerlemans, P.L.Woodworth (1996). Changes in
Sea Level. In: Climate Change 1995: The Science of Climate Change, Houghton,
J.T.,Meira Filho,L.G., Callander, B.A.,Harris,N.,Klattenberg, A.and Maskell K
(eds.).Cambridge University Press, pp. 359-405

FUTY Journal of the Environment Vol.8 No. 1, June 2014 65
Analysis of Land Use/Land Cover of Girei, Yola North
and South Local Government Areas of Adamawa State,
Nigeria Using Satellite Imagery
1Babalola, S.O.,
2Musa, A. A.
3Adegboyega, S. A.,
4Abubakar, T. and
5Ezeomedo, I. C.
1Department of Surveying and Geoinformatis, Federal University of Technology, Akure,
Nigeria 2&4
Department of Surveying and Geoinformatics, Modibbo Adama University of
Technology, Yola, Nigeria 3Department of Remote Sensing and Geographic Information System, Federal University of
Technology, Akure, Nigeria 5Physical Planning Unit, Anambra State University, Uli, Nigeria
Abstract
This research demonstrated the use of satellite imagery in detecting changes in land use/ land
cover on the fringes of urban areas. Satellite data of the same geographical area, recorded
over a decade, were used to identify changes in the pattern of land use/land cover. The study
used multi date satellite imageries namely, Landsat MSS 1978 and SPOT5 2007. The images
were separately classified and then compared using ILWIS 3.3 and Erdas Imagine 9.3
Versions. The land use/land cover statistics results obtained from the two classifications
process showed that built-up areas, sand, water bodies, and open/barren land were found to
have been increasing at alarming rate while agricultural land and scrubs were encroached
upon by other land use/land cover types. The study showed that land use/land cover change
was better captured and monitored through the use of satellite imagery that served as a
means of efficiently updating digital databases as shown in the research.
Key Words: Remote sensing, GIS, Urban-rural interaction, Planning, Land use, Satellite
imagery, Change detection.
Introduction
The history and development of land is as old as man himself.Land is defined based on the
number of natural characteristics, which includes climate, soil topography, hydrology and
geology. Land may also be define as any portion of the earth‘s surface which is capable of
ownership as property, including anything natural or human made which is annexed to it.
Land is immobile, finite and essential to human exercise (Amer et al.1999).Man always
wants to develop this land to make it habitable, conducive, and comfortable for living and
man wants this development to be quick, easy and accurate. In order to achieve this, man has
adopted and employed different methods surveying inclusive, which provides basis for
sustainable development.
Land use/cover is driven by human activities and they also create changes that have impact
on humans (Agarwal et al. 2002). In this regards, there is need to update land database
continuously, to meet the rapid changes in the environment caused by urbanization and
industrialization. To achieve this, Geographic Information System (GIS) as a computerized
technique provides the capability for land use/cover mapping with improved accuracy, which
can be done repeatedly, that is, continuously at regular time intervals. Toju and Okoduwa
(2000) reported how they use GIS to map flood risk zones in Benin city, Nigeria. The

FUTY Journal of the Environment Vol.8 No. 1, June 2014 66
resultant map was a raster map showing variation in soil strength across the study area. While
Carmelo et al (2014) used a combination of remote sensing data and mapping information
from different sources to create the land cover map. USGS (2012) carried out analysis of
potential future land cover change in the United States, where they used an approach of
scenario construction and spatially explicit land cover modeling.
Nowadays, most of the world populations live in city and metropolis. However, it is often the
case that settlements grow irregularly under the pressure of masses coming to cities and these
do not develop according to well-defined plans. Hence, it‘s necessary to monitor urban areas
with frequent update. Land use in urban areas continuously change over time and geographic
location. This poses a serious challenge to the urban planners who need to monitor the change
and update the land use/land cover databases to reflect current use. An urban environment
can be characterized by two main classes namely, built-up areas (developed) which comprise
of industrial, residential, commercial, parking areas, roads etc and non-built up areas
(reserved) e.g. gardens, spots field, green areas, urban agriculture, etc. therefore, town
planning departments attempt to incorporates these design plans (building and land use etc)
depicting the type and extent of the permitted use of land and the corresponding constraints,
where by any change is expected to conform to these plans. However, it is not uncommon to
unveil that these plans particularly in developing countries like Nigeria are not adhered to due
to problems associated with poverty, immigration, overpopulation, ignorance, lack of
government participation in active planning/monitoring of any environmental changes, either
positive or negative which also implies that the necessary infrastructure is not implemented.
Spatial distribution of land use/land cover information and its changes is desirable for any
planning, management and monitoring Programmes at local, regional and national levels
(Adeniyi and Omojola 1999).This information not only provides a better understanding of
land utilization aspects but also play a vital role in the formulation of policies and programs
required for development of future and making provisions for it, and also for ensuring
sustainable development. It is necessary to monitor the ongoing changes in land use/ land
cover pattern over a period, this requires the present and past land use information of the area
and pattern of changes with respect to urban settlements and other local resources (Musa,
2000).Again, for these to be possible, Geospatial data are required, which are acquired from
many sources such as existing databases and records, digitized and scanned maps. Global
Positioning System (GPS), field sampling of attributes, remote sensing and aerial
photography. Remote sensing (RS) makes use of satellite images to extract useful
information. A unique attribute of satellite images is sure advantage of large coverage and
consistent revisit, since the satellite is in the orbit and at high altitude, enough to cover large
ground tracks. For instance, Nigerian Sat. 1, an earth-observation micro-satellite fully owned
by Nigeria has an important role in geo-spatial data acquisition because it will focus on
Nigeria to provide abundant and up-to-date satellite images.
Study Area
The study covers two local governments namely Yola North and South in Adamawa state,
Nigeria. The area comprises of important towns like Jimeta, Yola and Girei. Yola
metropolis is the heart and capital city of Adamawa state; other towns continuously growing
in size and population also surround it. The cities have high density of buildings and have not
earlier been developed according to periodic urban plans; thus, resulting in clusters of
buildings with different sizes and shapes. The agricultural fields surround the cities and it is
relatively flat in eastern and some northern part. This metropolis, with increasing institutional
development (2 universities, colleges and various government departments); this together

FUTY Journal of the Environment Vol.8 No. 1, June 2014 67
with good road network provided by the Jimeta Bridge connects peoples from the northern
part of the state with southern part. This created additional urban expansion pressure with
Santuraki province (Song, Gombi, Hong, Mubi, Maiha, Michika, and Madagali L.G.A).
Industrial and residential areas with high population density are located in the northern part
called Jimeta and spreading in the Lamido‘s city called Yola. (I.e. residential areas, both
densely and sparsely built-up are located at the southern edge of the city). The general urban
areas were built on a relatively flat surface, even though some hills with reasonable slopes are
present in the city center. The local government areas are located within: Girei: Lat.9015
/N,
Long.12025
/, Jimeta: Lat.9
06
/N, Long.12
027
/ and Yola Lat.9
014
/, Long.12
027
/.
Shel
leng
Guy
uk
Lamurde
NumanDemsa
Tongo
Ganye
Jada
May
o B
elw
a
Fufore
.Yola South
.Gerei
Mubi South
Borno State
Gombe State
Tar
aba
St a
te
CA
ME
RO
ON
R
EP
UB
LL
IC
0 1 01 0 2 0 3 0 K m
S o u r c e : A d a m a w a S t a t e i n m a p s
International
Boundary
L.G.A.
Boundary
State Boundary
N
M A P O F A D A M A W A S T A T E S H O W I N G S T U D Y A R E A
Hong
Gombi
Song
Michika
Madagali
Maiha
Mubi North
.Yola
North
Study Area

FUTY Journal of the Environment Vol.8 No. 1, June 2014 68
Materials and Methods
Data:The study utilized Landsat MSS1978and SPOT5 2007.The details of the satellite
imageries used are shown in Table 1 below:
S/N Data
Type
Source Spatial
Resolution
Acquisition
Date
1 Landsat
MSS
http: glcf.umiacs.umd.edu accessed on
June 18, 2009
60m x 72m 1978
2 SPOT5 Department of Geography, O.AU. Ile-
Ife.
5m x 5m 2007
Equipment: Handheld GPS (Garmin 76) was used to generate the coordinates of some
selected ground control points in the study area which were used to georeferenced the
acquired images.
Hardware: The hardware employed for the research was Laptop ProBook 4530s
Software:The study used GIS technologies such as ILWIS 3.3and Erdas Imagine 9.3 version.
ILWIS 3.3 was used to import the satellite imageries to the Erdas Imagine for further
processing. Erdas Imagine 9.3 was utilized for the development of land use/land cover classes
and subsequently for change detection analysis of the study area. Microsoft word was used
basically for the presentation of the research.
Data Presentation and Pre-Processing
Both the images were loaded, imported and displayed in the ERDAS Imagine environment.
The images were processed using digital image processing techniques such as image
enhancement and filtering to improve the pictorial quality of the images. Subset operation
was performed on the images to create the Area of Interest (AOI). Image to image
registration was carried out since SPOT5 had been georeferenced and subsequently, Landsat
MSS 1978 and SPOT5 2007 were resampled to cater for differences in their spatial
resolutions using polynomial transformation and bicubic resampling method.Principal
component analysis (PCA) was carried out on LANDSAT MSS for effective image
classification. This is because LANDSAT MSS has four bands and the human eye is only
limited to three bands. There was therefore the need to reduce the 4 bands to 3 components so
that the colour composite that will follow will make use of all the information in the four
bands. PCA was however not carried out for SPOT5, since the image has basically only 3
bands.
Image Classification
The process of sorting pixels into a finite number of individual classes, or categories of data,
based on their data file values may be described as multispectral classification. This involves
the training of computer to recognize patterns in the remotely sensed image. A supervised
method was utilized simply because it permits selection of pixels that represent patterns or
land use features that is recognizable or identifiable with the use of other sources such as
ground truth data and topographical maps. Knowledge of the data, and of the classes desired,
is required before classification. For this study, more than twelve training areas were selected.
This training area represents the classes for each of the six land use/land cover types used for
the classification of the entire images. The six classes of land use/land cover types selected
for the classification are Built-up areas (BUA), Agricultural lands (AL), Sand (SD), Water
Bodies (WB), Scrubs (SS) and Open/barren land (OBL). Having trained the computer, the
system thereafter used a special program to determine the numerical signatures for each

FUTY Journal of the Environment Vol.8 No. 1, June 2014 69
training class. Each pixel in the image was therefore compared to these signatures and labeled
as the class it most closely resembled digitally. Signatures in ERDAS IMAGINE can be
parametric or non-parametric. A non-parametric signature is not based on statistics, but on
discrete objects (polygons or rectangles) in a feature space image. These feature space objects
are used to define the boundaries for the classes. A non-parametric classifier uses a set of
non-parametric signatures to assign pixels to a class based on their location either inside or
outside the area in the feature space image. Supervised training was used to generate non-
parametric signatures. ERDAS IMAGINE enables you to generate statistics for a non-
parametric signature. This function allows a feature space object to be used to create a
parametric signature from the image being classified. However, since a parametric classifier
requires a normal distribution of data, the only feature space object for which this would be
mathematically valid would be an ellipse. When both parametric and nonparametric
signatures are used to classify an image, one is more able to analyze and visualize the class
definitions than either type of signature provides independently. Thus, both parametric and
non-parametric signatures were used for the classification of the images in this study. The
classification algorithm used was Maximum Likelihood. Here, the probability of a given
pixel belonging to a given cluster is computed, this forms the basis for accepting it as
belonging to that cluster or rejecting it. So, the technique is based on probability theory in
performing its task.
Ground truthing is necessary to confirm spatial information from remotely sensed imageries
and to facilitate accurate interpretation of the satellite imageries and update data available on
spots of perceived significance to the general interpretation and understanding of the
imageries. To this end, confusion matrix operation was performed to identify the nature of the
classification errors (errors of omission or exclusion; errors of commission or inclusion), as
well as their quantities.Finallythe Output stage displays the view as training set error matrix.
Selecting the error matrix option launches a classification error with sample areas of known
class to evaluate the accuracy of the current class raster. The class of each sample area cell is
compared to the class assigned to the corresponding cell in the class. Having obtained the
land use/land cover auto-classification result and the error matrix which is also one of the
statistical operations to determine the acceptability of result, the classification Dendrogram
was selected and the process of estimating or computing the areal extent was done.
Change Detection
From the review of the literature, it is obvious that there are six types of change detection
techniques namely image differencing, vegetation index differencing, selective principal
component analysis, direct multi-date classification, post-classification analysis and
combination image enhancement/post-classification analysis. The most obvious method of
change detection is a comparative analysis of spectral classifications for times t1 and t2
produced independently (Singh, 1989). Inthis context it should be noticed that the change
map of two images will only begenerally as accurate as the product of the accuracies of each
individual classification(Stow et al. 1980). Accuracy of relevant class changes depends on
spectral separabilityof classes involved. In the present study, Landsat MSS 1978and SPOT5
2007 data wereindependently classified using the maximum likelihood classifier. The
classified images were cross-tabulated using cross tabulation technique of Erdas Imagine to
generate the required data for change detection analysis of the study area between 1978 and
2007.

FUTY Journal of the Environment Vol.8 No. 1, June 2014 70
Results and Discussion
Error (Confusion) Matrix
Each row in the matrix represents an output class and each column represents ground truth
data. The value in each matrix cell is the number of pixels (raster cells) with the
corresponding combination of output class and ground truth class. For each cell on the
leading diagonal of the matrix, the output class equals the input class, so that the values in
these cells give the number of correctly classified pixels for each class. The values in the off-
diagonal matrix cells represent incorrectly classified pixels. The overall accuracy values are
calculated by dividing the total number of correctly classified raster cells [the sum of the
leading diagonal values] by the total number of cells in the ground truth raster, and
expressing the result as a percentage. For instance, Table 1 shows the producer‘s accuracy for
the image classification of Landsat MSS 1978 into six classes of land use/land cover types:
Built-up Areas (BUA) = 99.7%
Agriculture (AL) = 94.9%
Sand (SD) = 88.9%
Water Bodies (WB) = 74.1%
Scrubs (SS) = 96.2%
Open/Barren land (OBL) = 97.6%
Also the user‘s accuracy as shown in the same table indicates the probability that a pixel
classified into a given category are the true representation of that category on the ground: -
Built-up Areas (BUA) = 90.8%
Agriculture (AL) = 99.0%
Sand (SD) = 90.6%
Water Bodies (WB) = 90.1%
Scrubs (SS) = 95.1%
Open/Barren land (OBL) = 96.8%
Overall Accuracy = TD (Sum of Major Diagonal) divided by TR (Row Totals) =
45919/47574 = 96.5%. This indicates that error is considered to be consistent with limits of
the available technology.
Table 1: Error Matrix for Landsat MSS 1978
Classification Ground Truth
Built-
up
Areas
Agricultu
re
Sand Water
Bodie
s
Scrub
s
Open/Barre
n land
TR Accurac
y
Built-up Areas 6934 0 19 0 0 0 6953 99.7%
Agriculture 110 5725 98 09 68 24 6034 94.9%
Sand 273 0 3314 19 96 24 3726 88.9%
Water Bodies 09 16 76 729 83 71 984 74.1%
Scrubs 73 43 70 28 1068
6
205 1110
5
96.2%
Open/Barren
land
240 0 82 24 104 18322 1877
2
97.6%
TC 7639 5784 3659 809 1123
7
18931 4757
4
Reliability 90.8
%
99.0% 90.6
%
90.1
%
95.1
%
96.8%

FUTY Journal of the Environment Vol.8 No. 1, June 2014 71
Where TC = Column; TD = Sum of Major Diagonal; TR = Row Totals; Average Accuracy=
91.9% ; Average Reliability = 93.7% ; Overall Accuracy = TD/TR (45919/47574 x100 )=
96.5%. Error was considered to be consistent with limits of the available technology.
Table 2: Error Matrix for SPOT5 2007
Classification Ground Truth
Built-
up
Areas
Agricultu
re
Sand Water
Bodie
s
Scrub
s
Open/Barr
en land
TR Accurac
y
Built-up Areas 9182 73 79 0 853 0 1018
7
90.1%
Agriculture 51 8482 96 60 44 358 9091 93.3%
Sand 956 0 5683 42 939 82 7702 73.8%
Water Bodies 0 399 21 7261 367 20 8068 90.0%
Scrubs 285 1753 105 117 1181
0
52 1412
2
83.6%
Open/Barren
land
09 0 22 73 522 21954 2258
0
97.2%
TC 10483 10707 6006 7553 1453
5
22466 7175
0
Reliability 87.6% 79.2% 94.6% 96.1
%
81.3
%
97.7%
Where TC = Column; TD = Sum of Major Diagonal; TR = Row Totals; Average Accuracy=
88.0% ; Average Reliability = 89.4% ; Overall Accuracy = TD/TR (64372/71750 x100 )=
89.7% . Error was considered to be consistent with limits of the available technology.
Similarly, Table 2 shows the producer‘s accuracy of the training set data for the six classes of
land use/land cover types used for the image classification of the study area in 2007:
Built up Areas (BUA) =90.1 %
Agricultural land (AL) = 93.3 %
Sand (SD) = 73.8 %
Water Bodies (WB)= 90.0 %
Scrubs (SS) = 83.6 %
Open/Barren Lands (OBL) = 97.2 %
The user‘s accuracy for the training set which indicates the probability that a pixel classified
into a given category are the true representation of that category on the ground as shown from
the table above are: -
Built up Areas BUA) = 87.6 %
Agricultural land (AL) = 79.2 %
Sand (SD) = 94.6 %
Water Bodies (WB) = 96.1 %
Scrubs (SS) = 81.3 %
Open/Barren Lands (OBL) = 97.7 %
Overall Accuracy = TD (Sum of Major Diagonal) divided by TR (Row Totals) =
64372/71750 X 100 = 89.7%. This indicates that error is considered to be consistent with
limits of the available technology.

FUTY Journal of the Environment Vol.8 No. 1, June 2014 72
Table 3: Land Use/Cover Classification Statistics over the Study Area, Year 1978.
Vegetation Class Area Extent (Km2)
Proportion of Total Area
(%)
Built-up area 6.06 3.4
Agriculture 41.04 22.9
Sand 3.23 1.8
Water Bodies 21.45 12.0
Scrubs 43.37 24.2
Open/Barren Land 63.85 35.7
Total 179 100
Source: Author’s Image Analysis, 2011
Figure 2: Land use/Land covers Areal Extent in 1978
Table 4: Land Use/Cover Classification Statistics over the Study Area, Year 2007.
Classifications Area Extent (Km2) Proportion of Total Area
(%)
Built-up area 19.5 10.9
Agriculture 14.5 8.1
Sand 10.6 5.9
Water Bodies 30.6 17.1
Scrubs 21.6 12.1
Open/Barren Land 82.2 45.9
Total 179 100
Source: Author’s Image Analysis, 2011

FUTY Journal of the Environment Vol.8 No. 1, June 2014 73
Figure 3: Land use/Land covers Areal Extent in 2007
Remote sensing methods have been widely applied in mapping land surface features in urban
areas with the availability of multispectral images in digital form and the advances in digital
processing and analysis; remote sensing has become a new perspective for the land use
change detection. This project indicates that land use change detection from satellite imagery
is a useful planning tool in provision of services, utilities and infrastructure. Urbanization has
an important influence on the spatial distribution of land use. The result is that land is
becoming a scarce and valuable commodity, especially in cities, effective land use is
therefore necessary for the optimal functioning of administrative economic and social
activities of communities. Again, it is worth knowing that urban structures are dynamic and
spatial morphology, population structure and activity patterns are in a constant process of
change and growth. As cities grow its land use pattern also changes. This change is more
dynamic in urban/ rural fringe. Thus, the result of the land use/land cover change detection as
was analyzed in this chapter using statistical means shows that there was a both positive and
negative change:
Built-Up Areas: From Tables 3 and 4, the built-up areas that formerly occupied a proportion
of 3.4% (6.06Km2) in 1978 and increased to 10.9% (19.5Km
2) in 2007. This indicates that
within 29 years urban expansion has encroached on other land use/land cover types by
221.78% (13.44Km2). This further suggests that urban expansion in the study area has been
taken place at an average rate of 0.46Km2 per annum (see Table 5). This is a clear indication
of increase in population and infrastructure development in the metropolis, regardless of use
or pattern. This was clearly illustrated in Figures 2, 3, 4&5)
Agricultural Lands: Agricultural lands receded from 22.9% (41.04Km2) as at 1978 to
8.1%(14.5Km2) in 2007. This is an indication of decline in agricultural land use by 64.67%
(26.54Km2) at 2.23% per annum. This may be attributed to rapid urbanization process
comprising physical expansions of residential, commercial and services, industrial
complexes, transportation and communications/utilities taken place within the period of the
study.

FUTY Journal of the Environment Vol.8 No. 1, June 2014 74
Sand (sandy areas):The sand land cover type increased from 1.8% (3.23Km2) in 1978 to
5.9% (10.6Km2) by 2007. This land cover type has been increasing at 7.87% (0.25Km
2) per
annum. Within the period of the study, it increased by 228.17% (7.37Km2). This is may be
attributed to the prevailing effect of desertification and climate change that promotes
downward shift in the boundary of Sahel savanna.
Water Bodies: These include rivers, streams and lakes. The proportion of the study area
under water bodies recorded an upward increase from 12.0% (21.45Km2) in 1978 to 17.1%
(30.6Km2) by 2007. The total area covered by water bodies increased by 42.66% (9.15Km
2)
within the period of 29 years at 1.47% (0.32Km2) per annum. This may be explained on
account of increasing precipitation that occurs in the area characterized by scanty vegetal
cover and also the area is drained by R. Benue that occasionally overflows its banks.
Scrubs: This includes savannah, grassland, mixed forestland and plantations. The result
shows that scrubs occupy a good proportion of 24.2% (43.37Km2) of the total area and hence
the second largest after open/barren land in the year 1978 but was reduced to 12.1%
(21.6Km2) in the year 2007. This implies that area covered by scrubs recede by 50.2%
(21.77Km2) at the rate of 1.73% (0.75Km
2) per annum.
Open/Barren Land: This class includes rocky out crops, hilly lands, barren lands and open
surface mining area. This class recorded apositive change over the year under study. Bare
surface proportion was 35.7% (63.85Km2) in 1978 but increased to 45.9% (82.2Km
2) in 2007
(Figures4&5). The area occupied by open/barren land remained the most extensive land
use/land cover type that increased in areal extent to the tune of 28.74% (18.35Km2) within
the period of the study at 0.99% (0.63Km2) per annum. This can be attributed to human
activities, which includes, over –grazing indiscriminate bush burning, fire wood (fuel)
extraction which are some of the characteristics of savannah regions of Nigeria where study
areas is located. Another factor that is responsible is the short rainy seasons that are normally
experience in these areas. Hence, from the overall results the areas liable to expansion are
enormous particularly in the southwest and south-south of the metropolis. These areas will
expand at expenses of the agricultural, scrubs, and open space that are remaining.
Table 5: Land Use/Land Cover Change between 1978 and 2007.
Land Use Class Change between 1978 and 2007 Average rate of
Change
Km2 % Km
2/yr %
Built-up area +13.44 +221.78 +0.46 +7.65
Agriculture -26.54 -64.67 -0.92 -2.23
Sand +7.37 +228.17 +0.25 +7.87
Water Bodies +9.15 +42.66 +0.32 +1.47
Scrubs -21.77 -50.20 -0.75 -1.73
Open/Barren Land +18.35 +28.74 +0.63 +0.99
Source: Author’s Image Analysis, 2011

FUTY Journal of the Environment Vol.8 No. 1, June 2014 75
Figure 4:Land Use/Land Cover Map of the Study Area in 1978
Figure 5: Land Use/Land Cover Map of the Study Area in 2007

FUTY Journal of the Environment Vol.8 No. 1, June 2014 76
Table 6: Proportions of land use/land cover units gained and/or lost between 1978 and
2007
Land
use/Land
cover units
Proportion
of LULC in
1978 and
unchanged
in 2007
Proportion
of LULC in
1978 lost to
other
LULC types
by 2007
Proportion
of LULC in
1978 gained
from other
LULC types
by 2007
LULC in
2007
(unchanged
+ gained)
Difference of
LULC
gained-lost
(1978-2007)
Km2 % Km
2 % Km
2 % Km
2 % Km
2 %
Built-up
Areas
5.66 5.8 0.4 0.5 13.84 17.1 19.5 10.9 +13.44 +16.6
Agriculture 13.05 13.3 27.99 34.5 1.45 1.8 14.5 8.1 -26.54 -32.7
Sand 1.97 2.0 1.26 1.6 8.63 10.6 10.6 5.9 +7.37 +9.0
Water
Bodies
12.72 13.0 8.73 10.8 17.88 22.0 30.6 17.1 +9.15 +11.2
Scrubs 18.74 19.2 24.63 30.4 2.86 3.5 21.6 12.1 -21.77 -26.9
Open/Barren
Land
45.74 46.7 18.11 22.3 36.46 45.0 82.2 45.9 +18.35 22.7
Total 97.88 100 81.12 100 81.12 100 179 100 ……. …..
Changes in Land use/Land cover between 1978 and 2007
Tables 6 and 7 revealed the pattern of changes in the land use/land cover of the study area
between 1978 and 2007. Open/barren land, water bodies and built-up areas had continued to
encroach on other land use/land cover types. For example, open/barren land constituted
22.3% (18.11Km2) of the total lost in form of conversionto other land use/land cover types,
mostly to water bodies and built-up areas within the study period, but gained 45.0% of the
total modification from other land use/land cover types in which scrubs and agricultural lands
were more affected. In the same perspective, built-up areas lost 0.5% (0.4Km2) but gained
17.1% (13.84Km2) in the same period.In case of agricultural land use, the area lost to other
land use/land cover typeswas 34.5% (27.99Km2) in 1978 and gained 8.1% of the total area
occupied by others, giving a net decline of 32.7% (26.54Km2) in area between 1978 and
2007 (see table 6). Scrubs also recorded a net decrease of 26.9% (21.77Km2) within the study
period. It is however significant to observe that Open/barren Land, built-up areas, water
bodies and sand have exhibited upward increase in size by 22.7%, 16.6%, 11.2% and 9.0%
(see figure 6) within the study period. This suggests that the area is seriously being affected
by the southward shift in the boundary of Sahel savanna initiated by desertification effects
and physical expansion of the settlements like Yola, Jimeta and Gieri occasioned by the
prevailing rapid urbanization process in the study area.

FUTY Journal of the Environment Vol.8 No. 1, June 2014 77
Table 7: Change Detection Analysis of the Study Area between 1978 and 2007 Land use/Land cover (LULC)
LULC 2007
1978 Built-up
Areas
Agriculture Sand Water
Bodies
Scrubs Open/Barren
land Total
1978
Built-up
Areas
5.66 0 0 0.4 0 0 6.06
94% 0 0 6% 0 0 100
Agricultur
e
7.67 13.05 3.12 5.08 2.54 9.58 41.04
18.69% 31.8% 7.6% 12.4% 6.2% 23.3% 100
Sand 0.32 0 1.97 0.8 0 0.14 3.23
9.9% 0 61% 24.8% 0 4.3% 100
Water
Bodies
0 0.3 1.6 12.72 2.3 4.53 21.45
0 1.4% 7.5% 59.3% 10.7% 21.1% 100
Scrubs 0.72 4.62 2.41 0.12 18.74 16.76 43.37
1.7% 10.7% 5.6% 0.28% 43.2% 38.6% 100
Open/Barr
en land
5.13 0 1.5 11.48 0 45.74 63.85
8.0% 0 2.3% 18.0% 0 71.6% 100
Total
2007
19.5 14.5 10.6 30.6 21.6 82.2 179
Source: Author’s Image Analysis 2011
Figure 6: Change Detection Map of the Study area between 1978 and 2007

FUTY Journal of the Environment Vol.8 No. 1, June 2014 78
Conclusion
Remote sensing nowadays has become a modern tool for mapping of land use/land cover for
micro, meso, and macro level planning. Remote sensing systems have the capability for
respective coverage, which is required for change detection studies. For ensuring planned
development and monitoring the land utilization pattern, preparation of land use/land cover
map is necessary. The present study demonstrates the usefulness of satellite data for the
preparation of accurate and up-to-date land use/land cover maps depicting existing land
classes for analyzing their change pattern for Yola metropolis by utilizing digital image
processing techniques. Furthermore, the developed spatial databases, map can serve as an
efficient technical vehicle for spatial analysis and spatial modeling functions gain insights
into development problems, e.g. to evaluate development impacts in the past, and to enhance
regional development strategies through facilitating various scenarios. It is expected to be
useful for formulating meaningful plans and policies so as to achieve a balanced and
sustainable development in any region.
Recommendations
1. The Federal Government should try in their plan to launch more satellite. This is to enable
a more constant planning and monitoring of the entire environment for a rewarding
sustainable development.
2. This research work can also upgrade and update researchers by incorporating the basic
ingredients of land use in form of physio-graphic data e.g. topographic, administrative,
land-use, industrial locations as well as transportation and socio – economic indicators.
3. Planning Agencies should constantly monitor our various land uses through change
detecting data/information so that, sustainable development plans/procedure are followed.
4. With the establishment of new ministry of environment, this ministry both at federal and
state level should encourage the mapping of various land uses, and detection of land use
change; so as to avoid any development that may be dangerous to our environment
References
Adeniyi, P.O. and Omojola, A. (1999): Land use and land cover change Evaluation in
Sokoto-Rima Basin of North-west Nigeria Based on and Environment (AARSE).
Geography Department, University of Lagos archival remote sensing and GIS
Techniques. Adeniyi P.O. (ed.) Geo-information Technology Application for Resource
and Environmental management in Africa. African Association of Remote Sensing,
Lagos Nigeria. PP 143-172.
Agarwal, C., Green, G. M., Grove, J. M., Evans,T. P. and Scweck, C. M. (2002):A
review and Assessment of Land Use change Model: Dynamics of Space, Time and
Human choice. US Department of Agriculture, Forest Service, Northeastern Research
Station, General Technical Report NE 297.
Amer, E., Mohammed, Q. and Ron D. (1999): The impact of public policy on
Environmental Quality and Health: The Case of land Use Management and Planning.
Carmelo, P., Carlos, C., Maria, G. G., Jean-Francis, M. C. and Marcos A. (2014):
Analysis of Land use and Land Cover Changes and Evaluation of Natural Generation
and Potential Restoration Areas in the Mexican Huasteca Region.
Musa, A. A. (2000): A GIS approach to the study of land degradation: A casestudy of
Adamawa State. Nigeria Journal of Cartography and GIS, volume 1, No. 1pp 7-26,
Journal of the Nigerian cartographic association (NCA).
Singh, A. (1989): Digital change detection data. An International Journal of Remote Sensing.
Toju F.B and Okoduwa, A. (2000) Application of Gis in flood risk mapping: A case

FUTY Journal of the Environment Vol.8 No. 1, June 2014 79
study of Benin City, Nigeria Journal of Cartographic Association (NCA)
Stow, D. A., Tinney, L. R., and Estes, J. E., (1980): Deriving land use/ land cover change
statistics from Landsat: a study of prime agriculture land. Proceedings of the 14th
International Symposium on Remote Sensing of Environment, Vol. 2 (Environmental
Institute of Michigan), San Jose , Costa Rica, 30 April, 1980, pp. 1227 - 1237.
Toju F.B and Okoduwa, A. (2000): Application of GIS in flood risk mapping: A case study
of Benin City. Nigeria Journal of Cartographic Association (N.C.A).
United States Geological Surveys (USGS) Facts Sheet 2012-3091 (2012): Land use Land
cover Scenario Construction and Spatially Explicit land Cover Modeling

FUTY Journal of the Environment Vol.8 No. 1, June 2014 80
Contextualising Sustainable Infrastructure Development in
Nigeria
1Olanipekun A.O.,
2Aje, I.O. and;
3Awodele, O.A.
1,2,3Department of Quantity Surveying, Federal University of Technology, Akure.
Email of Corresponding Author: [email protected]
Abstract
The clamour for sustainability in all spheres of development is more in the developed
economies but the responsibility is no less for the developing economies. Efforts targeted at
sustaining infrastructural development in Nigeria are deficient in context and formalisation.
This paper therefore contributes to the efforts at formalising and contextualising sustainable
infrastructural development in Nigeria. The paper relied on literature review for textual data
in support of sustainable infrastructural development. The findings reveal the state of
infrastructure development and approaches that are strategic to the development of
sustainable infrastructure in Nigeria. The suggested approaches grinded on global best
practice and made to reflect the peculiarity of the contemporary Nigerian environment. The
paper advocates for a more committed government effort and an inclusive civil society
participation in sustainable infrastructure development in Nigeria.
Keywords: Sustainability, Infrastructure, Development, Construction Industry, Nigeria
Introduction
Sustainable infrastructural development is embedded within the conceptual framework of
sustainable development. According to Odedairo, Oke and Oyalowo (2011), the paradigm
sustainable development has its origins in the environmental movement and has acquired
significance across all facets of human life from social, to economic and political aspects.
Indeed, the last few years have witnessed its acceptance as a challenge to global development
expected to be met by national governments. According to Brundtland (1983), humanity has
the ability to make development sustainable; to ensure that it meets the needs of the present
without compromising the ability of future generations to meet their own needs. Furthermore,
the concept of sustainable development does imply limits but requires meeting the basic
needs of all and extending to all the opportunity to fulfill their aspirations for a better life.
Boswell and Walker (2004) further reiterate on sustainable development that it means
achieving four objectives at the same time: effective protection of the environment; prudent
use of natural resources; social progress which recognises the needs of everyone; and
maintenance of high and stable levels of economic growth and employment. Shah (1999)
describes the concept of sustainable development as perhaps one of the most significant gifts
of the 20th century to human kind in search of peace, harmony and well-being. As a robust
concept, sustainable development is footed on three tripods (economic development,
environmental protection and social justice) (Odedairo et al., 2011; Perdana and Perera,
2009; Abidin, 2009). This paper emphasizes on sustainable infrastructural development.
Infrastructure is normally viewed as the physical assets that are defined as fundamental
facilities and systems serving a country, city, or an area e.g. transportation and
communication systems, power plants, and schools (Na and Raksakulthai, 2006; Brixiova,
2011). There are also the non-physical aspects of infrastructure including management. There
are two types of infrastructure, ―Hard and Soft" infrastructure (Oyedele, 2012). Hard refers to

FUTY Journal of the Environment Vol.8 No. 1, June 2014 81
the large physical networks necessary for the functioning of a modern industrial nation,
whereas soft infrastructure refers to all the institutions which are required to maintain the
economic, health cultural and social standards of a country, such as the financial system, the
education system, the health system, the governance system, and judiciary system, as well as
security (Kumar, 2005).
For a physical or a social phenomenon to be sustainable, it means it must have the capacity to
endure a particular state for a period of time. Therefore, Sustainable infrastructure can be
defined as infrastructure in harmony with the continuation of economic and environmental
sustainability (Na and Raksakulthai, 2006). Sustainability could mean to endure, or upheld
and/or support. The term sustainability is not completely a meaningful term on its own. The
meaning of sustainability enlarges when used with another term such development. Lawal
and Oluwatoyin (2011) argued that the term development is a victim of definitional pluralism
but however concur that development means improvement in material well-being of all
citizens. A more encompassing definition is provided by Business Dictionary (2013).
Development was described as the systematic use of scientific and technical knowledge to
meet specific objectives or requirements. Development also encompasses the economic and
social transformation that is based on complex, cultural and environmental factors and their
interaction. Seemingly, infrastructural development involves all activities, efforts and
tendencies towards the provision of basic infrastructure in a society (Adenikinju, 2005). The
amalgamation of sustainability, infrastructure and development will then mean the provision
of infrastructure as an impetus of developmental strives in a way that will endure the test of
time; technological and environmental advancement. In clearer terms, developing
infrastructure that is sustainable means improving the processes and mechanisms in building
infrastructure, in a way that it not only meets the present needs of the people but also reduces
the impacts it would provide in the future. Further, it looks at the aspects of how we build,
what we build, and whether we should build the infrastructure at all. Sustainable
infrastructure could be seen as designing and maintaining buildings, structures, and other
facilities with an eye towards resource conservation over the life of the infrastructure (Aje,
2013).
This planet (earth) is the only place where people live and has to be developed to meet their
needs and maintained for future generation (Soegiarso, et al (2007). Infrastructure provision
is seemingly a way to the development of the planet. Akinwale (2010) corroborates this
assertion stating that the development of a society depends on the availability of
infrastructure for homes and industries. However, with basic infrastructures and services in
acute short supply in developing economies (Odedairo et al., 2011), questions arise that: Has
there not been tendencies towards infrastructural development overtime? Has there not been
infrastructural development overtime? Why is it that the few provided infrastructure has not
been able to endure the test of time and demand? The answers to these questions lie in
sustainable infrastructural development, which will be exposited in this paper. A major and
integral part of sustainable development is efficient provision of environmentally sound
infrastructure (Panayotou, 1997). It is thus reasonable to view sustainable infrastructural
development from the context of sustainable development. Shah (1999) thus posited that
sustainable development is a development that is much more than material progress. It links
micro to macro, present with future, human to nature, and material to spiritual; it values
natural resources as social capital; points out limits to growth, the finite nature of the globe‘s
resources, and it emphasizes its judicious and responsible use and equitable sharing; it puts
ecological balance and environmental vulnerability in perspective and emphasizes the link

FUTY Journal of the Environment Vol.8 No. 1, June 2014 82
with human activity. Further, sustainable development puts economic growth in the
framework of lasting human happiness. The pursuance and subsequent realization of
sustainable infrastructural development is more desirable than ever especially in developing
economies like Nigeria. In light of this, Na and Raksakulthai (2006) advocate for the
implementation of strategic changes in the provision of infrastructure; since majority of
existing infrastructure has great impact on the environment (Ahn, et al 2010), while some of
these facilities are not sustainable.
Concepts of Sustainable Infrastructure
1. Green growth
Green Growth is an approach to pursuing the economic growth necessary for pressure on the
environment‘s limited carrying capacity, by improving the eco-efficiency of the society as a
whole (Na and Raksakulthai, 2006). The international financing organisations (World Bank,
IMF) have reported Nigeria to be growing macro-economically in the last few years.
However, this pace of economic growth is placing increasing pressure on the ecological
carrying capacity of the nation. More worrying is the limited focus of the Nigerian
government to sustainable development. Now the challenge for nation is how to progress its
economic growth and poverty reduction, while ensuring environmental sustainability. A shift
towards environmentally sustainable economic growth or ―Green Growth‖ would be
necessary to continue economic growth while maintaining environmental sustainability.
2. Eco-efficiency
Eco-efficiency is achieved by the delivery of competitively priced goods and services that
satisfy human needs and bring quality of life, while progressively reducing ecological
impacts and resource intensity throughout the life cycle to a level at least in line with the
earth‘s estimated carrying capacity (World Business Council on Sustainable Development,
2013). It is often expressed as the creation of more value with fewer resources and less
impact, or doing more with less. Many developing countries are now undergoing a process of
designing their infrastructure and laying the foundation for their consumption and production
patterns and, it is the optimum moment for these countries to apply and integrate eco-
efficiency into their infrastructure development, consumption patterns, and production
patterns (Na and Raksakulthai, 2006).
3. Infrastructure
Infrastructure is normally viewed as the physical assets that are defined as fundamental
facilities and systems serving country, city, or area, as transportation and communication
systems, power plants, and schools (Na and Raksakulthai, 2006; Oyedele, 2012).
Infrastructure as a concept of sustainable development advocates the provision of necessary
infrastructure as a means of sustaining developmental strives. The development of
infrastructure is one of the main drivers of growth in an economy (Adenikinju, 2005).
Infrastructure systems such as water supply and sanitation, solid waste and wastewater,
power, and transport form the backbone of the economy (Familoni, 2000) as they provide
social as well as economic benefits to the people.
4. Sustainable infrastructural development
It is admissible that infrastructure could achieve economic and/or social development.
Familoni (2000) corroborated this and stated that socio-economic development can be

FUTY Journal of the Environment Vol.8 No. 1, June 2014 83
facilitated and accelerated by the presence of social and economic infrastructures. However,
the environmental aspects should not be compromised for the sake of the first two objectives.
In order to achieve sustainability, decision makers must inculcate policies on infrastructure
development that would conform to environmental protection policies. The infrastructure
policies must enable increase in the efficiency of resource use to obtain more from less and
reduce waste. This is the advocacy of sustainable infrastructure development, a concept of
sustainable development.
State of Infrastructure Development in Nigeria
The role of infrastructure in contributing to economic development is an essential one. Good
quality infrastructure is necessary to avoid bottlenecks and service disruptions and to support
a range of important activities in the economy (Na and Raksakulthai, 2006). Akinwale (2010)
used Brett Frischmann‘s „Economic Theory of Infrastructure and Commons Management‟ of
2005 to describe infrastructure. The theory argues that ‗certain important resources should
equitably be used for the benefits of all members of a society‟. Unfortunately, the Nigerian
infrastructure is meager and efforts to improve them have not yielded the desired results
(Akinwale, 2010). This implies that the Nigerian infrastructure situation sharply contrasts the
„Economic Theory of Infrastructure and Commons Management‟ of 2005. This infrastructure
situation in Nigeria becomes more worrying due to the increased demand and limited
resources. Oyedele (2012) expressed this fear that demand for infrastructural development is
higher and resources used in provision of infrastructure are limited. The provision of
infrastructure in most developing countries is the responsibility of the government
(Adenikinju, 2005). Nigeria, with a very good share of Military government, has the era
characterized by economic boom and only succeeded in widening the gap in infrastructure
demand and provision. The current situation now is that most infrastructures are now decayed
and needed repair or replacement (Oyedele, 2012).
Adenikinju (2005) in a study analysed the cost of power infrastructure inadequacy to the
business sector of the Nigerian economy and a strong outcome of the study was that the poor
state of electricity supply in Nigeria has imposed significant costs on the business sector of
the Nigerian economy. The bulk of these costs were in the form of acquisition of very
expensive backup power. Suffice to say that these power backups in form of petroleum and
diesel driven generators that emits carbon (IV) oxide (CO2) causing the blackage of human
lungs when inhaled and also contributes to the depletion of the ozone layer. Oyedele (2012)
equates the infrastructure development of Nigeria with other developing economies but a
critical analysis conducted by Akinwale (2010) reveals that Nigeria rates lower than countries
like South Africa and even some low income countries in areas of power, road and
telecommunication, water, health and disposal infrastructures. A critique analysis of
Nigeria‘s infrastructure cutting across physical infrastructure (power, transport, oil and gas)
and social infrastructure (health, education, water and sanitation) was conducted by Olaseni
and Alade (2012) and summarised as follows:
1. Power: The current power generation in the country is about 4000MW. Nigeria‘s
electricity consumption per capita is 111 kWh, which is one of the lowest in Sub-Saharan
Africa (SSA). The total average per capita annual consumption in SSA is around 155
kWh (Bazilian et al., 2012). Before the attainment of the current power generation,
Akhalumeh and Izien (2013) observed that only 40 per cent of Nigerians, mainly in urban
centers have access to electricity. The installed available generation capacity was
5200MW, and in its epileptic performance, out of this 5200MW only 3700MW are

FUTY Journal of the Environment Vol.8 No. 1, June 2014 84
actually generated as at 2009, this has moved up to about 4000MW. Currently, power
generation and distribution have been improved in the past year but the expected level has
not been attained.
2. Transport: Nigeria has a total road length of 193,200 kilometers, comprising 34,123 km
Federal roads, 30,500 km State roads, and 129,577 km Local Government roads.
However, Akinwale (2010) quickly draws out attention to a Central Bank of Nigeria
document of 2003 that out of the total road length in Nigeria, only 19% have been paved.
While it is admissible that there would have been improvement since 2003, it must also
be noted that the expected level of road network had not been achieved in Nigeria. With
the inadequacy of the road network, the railway that is supposed to be an alternative
means of transport accounts for less than 1% of land transport in the country. This leads
to over-dependence on the inadequate road transport; with 98% of goods still being
transported by road.
3. Oil and gas: Oil is a major income earner for Nigeria and currently account for about
75% of her annual revenue. However, due to limited gas distribution infrastructure,
Nigeria today flares about 2.6 billion cubic feet of gas per day (bcf/d), representing 12.5%
of all globally flared gas, which is 68% of the associated gas produced or 51% of the total
gas production. This undoubtedly constitutes much, not to mention the effect of the gas
flaring on the environment. Domestic gas demand is about 400 million cubic feet a day
(MMcf/d), which is very low compared to the size of Nigeria‘s population and its gas
resources. The limited domestic gas demand can be attributed to the dearth of
infrastructure that requires such gas for powering and operation.
4. Education infrastructure: Oyeyinka (2011) presented a cursory outlook of Nigeria‘s
educational condition as a means of justifying the level of education infrastructure.
Nigeria‘s net primary and gross secondary enrolment rates are among the 10 worst in the
world, while gross tertiary enrolment is low, placing Nigeria 83rd in the Legatum
Prosperity Index (LPI). Only 60% of children of primary school age are enrolled in
education with a clear under representation of girls in both primary and secondary
education. Also, there are 46 pupils for every one primary school teacher placing Nigeria
among the 10 lowest countries in the world. The Nigerian workforce has, on average, less
than a year of secondary education, and several months of tertiary education, placing the
country 97th and 85th on the LPI respectively. These are reflections of the poor state of
education infrastructure in the country.
5. Health infrastructure: In 2007 when the population of the country was a little above 140
million, there were 13,703 public primary health care centres in the country. Also, there
were 845 and 59 public secondary and tertiary health care facilities respectively and there
were only three hospital beds for every 10,000 people. Indeed, only 45.9% have access to
medical facilities in the country in 2006, all information was obtained from the National
Bureau of Statistics in 2008 (Olaseni and Alade, 2012).
6. Water and Sanitation infrastructure: Evidences points to the gross inadequacy of
water and sanitation infrastructure in the country. A study of the provision of improved
drinking water, households connected with water and improved access to sanitation in
Nigeria compared to other nations in the league of 60 top economies shows that Nigeria
ranks among the lowest. In addition to Nigeria‘s gross inadequacies, another pointer was

FUTY Journal of the Environment Vol.8 No. 1, June 2014 85
the decline from 39% to 36% in access to improved sanitation in urban areas between
1990 and 2008.
According to Okelola and Salami (2012), Nigeria‘s infrastructure challenges comes with
another dimension where, many years of underinvestment and poor maintenance have left the
nation with a significant infrastructure deficit that is holding back her development and
economic growth. Furthermore and in 2008, the Federal government of Nigeria disclosed that
Nigeria requires about $100 Billion (N11.70trillion) to address only four infrastructure areas
considered critical:
1. Power-US$18–20Billion;
2. Rail -US$10Billion;
3. Roads - US$14billion; and
4. Oil and Gas -US$60Billion.
In addition, Lagos State alone according to her government needs: - US$2billion for
expansion and modernization of its water supply network in the next 20years; and US$715m
for road networks‘ in the next 5years amongst many others. The limited infrastructure on
ground failed to meet international quality requirements in a manner of sustainability.
Infrastructures are developed in Nigeria without recourse for carbon emission standard set by
international organizations like International Standard Organisation. Tests like Air Capture
Analysis (TCA) are not done on completed projects to ensure that they emit as little
greenhouse gases (GHGs) as possible. Domestic residences hardly favour co-habitation with
other animals and plants in a manner of bio-diversification. Unarguably, infrastructure
development in Nigeria presents a pathetic posture. Okelola and Salami (2012) attribute
Nigeria‘s infrastructure challenge to years of under investment and poor maintenance culture.
While the two factors listed here cannot be undermined, it goes without saying that both
factors are fully embedded in sustainable infrastructure development. Sustainable
infrastructure development as a concept of development goes to the extent of questioning the
essence of a development. Na and Raksakulthai (2006) reiterate that sustainable
infrastructural development asks why a development should be carried out.
For a Nation that is worth $23.48 billion in revenue in 2013 (CIA World Fact Book, 2013);
and with the declining international assistance, the question is: How will these infrastructure
needs and challenges be confronted? Without mincing words, answers lie in sustainable
infrastructural development. The argument here is that there‘s less need to dwell on the
mistakes of the past and move into the future. The future of infrastructure development in
Nigeria comes with prospects. Further questions will then be: How prepared is the Nation to
prevent the future generation from reeling in the pains resulting from shortage of
infrastructure that is being experiencing today? Shaw, et al (2012) outlined what should
constitute the approaches or means to sustaining infrastructural development. They include
consideration for economic and environmental factors, the positive and negative impact the
infrastructure assets and their attending activities will have on the community and the entire
society. This paper has thus outlined the approaches to sustaining infrastructural development
in similar manner.
Research Methodology
This paper adopts a qualitative research approach. Yin (2009) reiterates that qualitative
research focuses on contemporary events. This paper aims to contextualize approaches to

FUTY Journal of the Environment Vol.8 No. 1, June 2014 86
sustaining infrastructure development; a phenomenon that is still evolving in Nigeria.
Therefore, the paper was grounded in extensive literature review on global best practices in
sustaining infrastructure development. The findings were interpreted to in light of the
experiences of the authors in the Nigerian infrastructure development. The interpretation of
the synergy of both literature review and authors‘ experience was contextualised to reflect the
peculiarity of the Nigerian environment. The approach used in this paper was similar to
Adelakun (2009) who sought to develop an understanding of the need for emerging
economies like Nigeria to make use of strategic alliances by carrying out extensive literature
review to gather data upon which recommendations were made.
Approaches to Sustaining Infrastructural Development in Nigeria
Sustainable development has evolved as a paradigm to balance the developmental needs of
man and to ensure that economic development is achieved without compromise to the
environment and with due respect to delicate social balance (Lordos, et al, 2011). The
clamour for sustainability in all spheres of development is more in the developed economies.
However, this responsibility is no less important for developing countries including Nigeria,
given a number of factors, such as: rapid urbanization, decaying infrastructures, heavy
regulation, little growth in productivity with chronic budget deficits, a preoccupation with
meeting the needs of the present by all means, with resulting environmental degradation and
exploitation (Odedairo et al., 2011). Infrastructure has a significant impact on sustainability,
and promoting environmentally sustainable and eco-efficient infrastructure are important
goals that must be pursued not only in developing economies, but globally. Insights from the
existing level of infrastructure development in Nigeria and global practices inform the
following proposed means of ensuring sustainable infrastructure development in Nigeria.
1. Institutionalisation
Fadare (2010) reiterate that legal and institutional policy framework is a response to
environmental problem in Nigeria. Institutionalisation refers to setting up of capacities in
form of public parastatals backed by appropriate laws to oversee the tendencies towards
sustainable development and by extension; sustainable infrastructural development
(Boxenbaum, 2010). These institutions should establish clear plans and rules for service
provision, regulate and monitor service quality, coordinate infrastructure project development
and deliver services efficiently and equitably. Within this mandate, these institutions must be
managed professionally, open to public scrutiny, and accountable to their customers. These
institutions should be strengthened to provide sustainable infrastructure through economic,
financial, legal, and institutional reforms as well as adopting eco-efficient practices in
management and provision. The scope of such institutions should incorporate both growth
and sustainability over the long-term in order to achieve eco-efficient infrastructure and green
growth. This will require a system approach to identify the relationships between various
system elements and to integrate them with the goal of sustainability. In Nigeria, the Federal
and States Ministry of Environment have been saddled with most responsibility towards
sustainable development. Though the awareness of sustainable development is not lacking in
these government parastatals, much has not been achieved in areas of setting up of Nigerian-
friendly policy towards sustainable development, creating a national awareness,
establishment of foot soldiers in form of decentralized institutions saddled with the
responsibility of enforcing relevant policies nationally and coming up with assessment basis
for sustainable development in Nigeria. Considering the largeness of the Nigerian
environment, such responsibility should have been better if reposed on local authorities. In

FUTY Journal of the Environment Vol.8 No. 1, June 2014 87
the developed countries, the national government is just to provide the policy direction on
sustainable development while the actualization becomes the responsibility of the municipals.
Autonomy should be accorded the local governments in Nigeria which will allow for
concentrated efforts on issues such as sustainable development.
2. Private sector participation
According to Odedairo et al. (2011), a major development theory advocates for neo-
liberalism, which is epitomized by government pulling out from direct provision in favour of
private sector driven participation, as the panacea to underdevelopment in Africa, Asia, Latin
America and the Caribbean. The situation now is such that; the provision of infrastructure in
most developing countries is the responsibility of the government. This is because of the
characteristics of infrastructure investment. First, infrastructure supply is characterized by
high set-up cost. Its lumpiness and indivisibility precludes the private sector from investment.
Second, its indirect way of pay-off, coupled with its long gestation period, makes it generally
unattractive to private investors (Adenikinju, 2005). However, the Nigerian government is
encouraged to continually pursue the avenue of private sector participation in infrastructure
development. It is noteworthy to point out that in the past year; concerted efforts have been
noticed on the part of the Nigerian governments (States and Federal) in allowing for the
private sector expertise in power projects across the country. This is very encouraging as the
private sector becomes the driving force or the engine of development and growth of the
power sector while the government‘s role is reduced to that of a catalyst responsible for the
creation of an enabling environment. This way, government can concentrate on other areas of
the economy and the private sector is left to give total attention to the concerned area of
infrastructure development. This approach is nothing but a means to sustaining power
infrastructure development in Nigeria.
Privatization and commercialization strategy is a latter-day form of the classical laissez –
faire policy or strategy of development. The concept embraces deregulation of the economy
so as to encourage private initiative and boost productivity and efficiency. From a global
perspective, this is a strategy of development through a more efficient pattern of resource
allocation by a free interplay of market forces. Deregulation encourages competition and in
this way, a greater quantum of economic and social overhead capital or infrastructures will be
built up in a more efficient and in a competitive market environment. This is the strategy of
the new millennium as governments try to shed their economically inefficient and
unproductive overloads to generate more revenue from the sale of the state owned enterprises
(SOEs). This would enable the governments of developing economies like Nigeria to reduce
their public expenditures, generate more revenue and balance their budgets. The disposal of
the economic infrastructures and parastatals would enable the government to focus more
attention to and fund more adequately the social parastatals and infrastructures that create
substantial external economies through the provision of public goods such as health,
education, sanitation and portable water (Familoni, 2000).
3. International Community Participation
The international community can also contribute to sustainable infrastructure by supporting
the implementation of best practices in infrastructure management as well as promoting
sustainable development initiatives. Since 1983, sustainable development has been a global
agenda. It is one of the few areas where the global community voices in unity. Though the
damage done to the global environmental landscape varies, there‘s the recognition that the

FUTY Journal of the Environment Vol.8 No. 1, June 2014 88
fight against the depletion of a common abode is a joint one. There‘s also the recognition that
the resources needed to confront this challenge depends on the proportionate level of
development of each nation. For the developing economies, rather than pursue the cause of
sustainable development, the limited resources is better expended on more pressing issues. In
this case, sustainable development is seen not as of primary concern, which is gross mistake.
Thoughts and acts along this line is only a matter of time that it will come biting harder and,
with graver consequences. However, the need for the international community participation
in ensuring sustainable development and sustainable infrastructural development cannot be
overemphasized. Apart from the fact that sustainable development is a subject of utmost
interest in the international community, a lot of breakthroughs in form of research and
development have been made, as well as the required resources that will definitely benefit the
sustainability tendencies of the developing economies. Government of the developing nations
including Nigeria must thus show commitment to development that is sustainable in all areas
including infrastructure. The enabling environment where the international community can
operate is thus advocated to ensure a successful working relationship with the government.
4. Public Sector Commitment
The nucleus of sustainable development globally is the government. Most of the other
approaches towards sustainable infrastructural development are either wholly or partially
dependent on the government. Government plays a dominant role in level of sustainability
that will be inculcated in her developmental strives. For sustainable infrastructure
development, the public sector must strengthen the provision of sustainable infrastructure
through economic, financial, legal, and institutional reforms as well as adopting eco-efficient
practices in management and provision. In similar manner, Na and Raksakulthai (2006) stress
that governments can stimulate progress in infrastructure sustainability by enacting
legislative, financial, and technical measures to create the right incentives for innovation and
changes in performance. In Nigeria and as stated earlier, it is important that the autonomy of
the local government be granted. This way, the responsibility of ensuring sustainable
development can be reposed on the local governments; as done globally. This will drastically
take the responsibility away from both the Federal and States governments. With the
responsibility of sustainability practices reposed on the local governments, the efforts can
then concerted and concentrated. With respect to infrastructural development, the local
authorities should be accorded with the responsibility of granting permits to clients and their
contractors to ensure conformity to guiding policies. The local authority will also carry-out
the assessment of completed infrastructure using standardised rating systems. An example is
the Georgia City of Atlanta‘s office of sustainability in the United States where the Mayor
oversees all activities that have to do with sustainable development. Another dimension to the
public approach to sustainable infrastructure development is social inclusion and coverage. It
is unarguably that an infrastructure cannot be tagged sustainable until if it does not meet any
requirement nor cover areas that are normally excluded from developmental strives e.g.
migrants‘ zone, lower castes, slums and ghettos. This is the more reason why the local
authorities‘ participation in sustainable development is important. It is a government closer to
the people and thus will be able to ensure that infrastructure provided does not only meet
people‘s requirement but covers the all areas.
5. Stakeholder Participation (Civil Societies and Construction Professionals)
The intertwining roles of various stakeholders such as construction professionals and civil
societies are essential in the development and management of sustainable infrastructure

FUTY Journal of the Environment Vol.8 No. 1, June 2014 89
(Steurer, et al, 2005). In the contemporary times, stakeholder participation is an important
consideration in most social phenomenon such sustainable infrastructural development.
Stakeholders help define service requirements and the prioritization of infrastructure projects
that will deliver these services. It is thus the best for any government to consult with diverse
groups of residents, business leaders, local government leaders, civic organizations, and
technical experts. Participation contributes to better-conceived projects and facilitates
resolution of the inevitable conflicts that arise in every complex infrastructure project.
Infrastructural presents a management aspect. Na and Raksakulthai (2006) stress that non-
physical aspects of infrastructure, including management, play major roles in the
sustainability goal and that; this guiding principle, if internalized among various stakeholders,
could lead to achieving environmental sustainability while still maintaining productivity in
their activities. It is therefore confident to say that if infrastructure must be sustainable; all
construction professionals have a role to play. Civil society and non-Governmental
organisations (NGOs) also play an important role in the accountability of infrastructure
institutions through consumer participation or through participation in monitoring and
evaluation. An example is the Republic of Korea, where the civil societies are at the forefront
of sustainable development practices such as advocacy, providing alternative but sustainable
solutions to the government in areas of construction as well as the development of sustainable
development index. The government is also encouraged to embrace civil society participation
in sustainable development and by extension; sustainable infrastructural development.
Conclusion
Developing economies not only confront daunting sustainable development challenges, but
also have significant opportunities abounding from the concept. The period since the
beginning of this new millennium has been one of strong economic performance for some
developing economies including Nigeria. If economic growth can be sustained, progressed
and the benefits widely shared, developing economies can accelerate social progress,
including relieving the burden of poverty, hunger and disease on much of its population. The
development of Nigeria has the potential to follow a more sustainable path than has been the
case in many other parts of the world, where development often resulted in severe
environmental problems before governments and other actors began to get to grips with
pollution and resource degradation. The pursuit of a more sustainable course will by no
means be easy. It will call for innovative thinking and practice among all concerned.
Infrastructure development is an important consideration in sustainable development. The
argument will always be to ensure that infrastructure development is carried out in a
sustainable manner. This is rather important because the role of infrastructure in contributing
to economic development is an essential one. Good quality infrastructure is necessary to
avoid bottlenecks and service disruptions and to support a range of important activities in the
economy. It must also be recognised that the economic role and significance of infrastructure
should not be accorded precedence over the other dimensions of sustainable development—
the social, cultural, and environmental aspects. Impacts of infrastructure on these aspects of
well-being are equally important, and the positive contribution that well-conceived
infrastructure can make to improve other dimensions of sustainability is also vital. The
intertwining roles of various stakeholders such as the government, international
organizations, NGOs, civil society groups, and the private sector are essential in the
development and management of sustainable infrastructure. The Nigerian government is
encouraged to show more commitment to sustainable development than ever. The role of the
government is indispensable and more importantly, other approaches of sustainable

FUTY Journal of the Environment Vol.8 No. 1, June 2014 90
development depends on the level of commitment shown by government. Other actors like
the international organisation, civil societies and the private sector are implored not to give
up on their efforts towards an infrastructure development that can be called real and
sustainable.
References
Abidin, N.Z. (2011). Sustainable Construction in Malaysia-Developers‘ Awareness. World
Academy of Science, Engineering and Technology, 41, 807-814.
Adelakun, A. (2009). Enhancing Nigerian competitiveness in the global economy through
strategic alliances. Economics and Management, 14, 649-554.
Adenikinju, A. (2005). Analysis of the cost of infrastructure failures in a developing
economy: The case of the electricity sector in Nigeria. African Economic Research
Consortium Research Paper 148, Nairobi, Kenya.
Ahn, C., Lee, S., Pena-Mora, F. & Abourizk, S. (2010). Towards Environmentally
Sustainable Construction Process. Sustainability, 2, 354-370.
Aje, I.O. (2013). Sustainable Infrastructure Development in Developing Economies: A Case
Study of Nigeria. A Lead paper presented at the seminar organised by the Nigerian
Institute of Quantity Surveyors, Edo State Chapter, held on the 20th
of June in Benin.
Akhalumeh, P.B. & Izien, O.F. (2013), The Place of Physical Infrastructure in realizing
Nigeria‘s Vision 20: 2020. International Journal of Management and Sustainability, 2
(7), 127-137.
Akinwale, A.A. (2010). The Menace of Inadequate Infrastructure in Nigeria. African Journal
of Science, Technology, Innovation and Development, 2 (3), 207-228.
Bazilian, M. et al. (2012), Energy access scenarios to 2030 for the Power Sector in sub-
Saharan Africa. Utilities Policy, 20, 1-16.
Boxenbaum, E. (2010), Innovation in Sustainable Construction: Eco-Cities and Social
Housing in France and Denmark. Retrieved on 12 October 2013 from
http://halshs.archives-
ouvertes.fr/docs/00/74/33/93/PDF/Sustainable_construction_FR_DK_vers2.pdf
Brixiova, Z., Matambatsere, E., Ambert, C. and Etienne, D. (2011), Closing Africa‘s
Infrastructure Gap: Innovative Financing and Risks. Africa Economic Brief, 2 (1), 1-8.
Business Dictionary.com (2013). Sustainability. Retrieved on the 5th
of June from
http://dictionary.reference.com/browse/sustainability
Fadare, S.O. (2010). Man, Environment and Technological Interface. A lead paper presented
at the 1st international conference of the School of Environmental Technology,
Federal University of Technology, Akure, Nigeria held at the SET Premises on 27th
of
October.
Familoni, k. A. (2000). The Role of Economic and Social Infrastructure in Economic
Development: A Global View. Retrieved on 10th
of June from

FUTY Journal of the Environment Vol.8 No. 1, June 2014 91
http://www.cenbank.org/OUT/PUBLICATIONS/REPORTS/occasionalpapers/RD/20
04/Jos-02-2.pdf
Kumar, D. (2005). Infrastructure in India. ICFAI Journal of Infrastructure. Available at
http://129.3.20.41/eps/urb/papers/0506/0506002.pdf. Accessed on March 4, 2012.
Lawal, T. and Oluwatoyin, A. (2011). National Development in Nigeria: Issues, Challenges
and Prospects. Journal of Public Administration and Policy Research, 3 (9), 237-241.
Lordos, A., Sonan, S. and Solar, A. (2011). Navigating the Paradigm Shift: Challenges and
opportunities for the two communities of Cyprus, in the search for sustainable
patterns of economic and social development. A report by the Cyprus 2015 initiative.
Retrieved on 26th
of July, 2013 from http://www.undp-
act.org/data/articles/cyprus2015%20sustainable%20development%20in%20cyprus%2
0en.pdf
Na, J.K. & Raksakulthai, V. (2006). Sustainable Infrastructure in Asia. Overview and
Proceedings at the Seoul Initiative Policy Forum on Sustainable Infrastructure Seoul,
Republic of Korea, 6-8 September.
Odedairo, B.O., Oke, M.O. and Oyalowo, B.A. (2007). Achieving Sustainable Infrastructural
Development in Developing Nations: Project Management Education to the Rescue.
Management Science and Engineering, 5 (4), 7-15.
Olaseni, M. and Alade, W. (2012). Vision 20:2020 and the Challenges of Infrastructural
Development in Nigeria. Journal of Sustainable Development, 5 (2), 63-76.
Okelola, O.G. and Salami, A.W. (2012). A Pragmatic Approach to the Nigeria‘s Engineering
Infrastructure Dilemma. Epistemics in Science, Engineering and Technology, 2 (1),
55-61.
Oxford Dictionary (2013). Sustainable. Retrieved on the 5th
of June from
http://oxforddictionaries.com/definition/english/sustainable
Oyedele, O.A. (2012). The Challenges of Infrastructure Development in Democratic
Governance. A paper presented at the FIG Working Week with theme ‗Knowing to
manage the territory, protect the environment, evaluate the cultural heritage‘ held in
Rome, Italy, 6th
-10th
of May.
Panayotou, T. (1997). The Role of the Private Sector in Sustainable Infrastructure
Development. Yale F & ES Bulletin 101.
Perera, R. and Permana, A.S. (2009). Review of Current Practices and Criteria used to
Integrate Environmental and Social aspects into Urban Infrastructure Development
Processes in Cities in Asia and the Pacific. Retrieved on the 26th
of July, 2013 from
http://www.eclac.org/dmaah/noticias/paginas/0/35720/review-ap.pdf
Shah, K. (1999). Agenda 21 for Sustainable Construction in Developing Countries: The Indian
Case.

FUTY Journal of the Environment Vol.8 No. 1, June 2014 92
Shaw, Gavin, Kumar, Arun, and Hood, David (2012) Introducing Sustainability Assessment to
Civil Infrastructure Projects & Assets. New Building Materials & Construction World
Magazine, 17 (12), 164-168.
Soegiarso, R., Gondokusumo, O. and Raditya, D.S. (2007), Global Trend in Sustainable
Construction. Prosiding Seminar Nasional “Sustainability dalam Bidang Material,
Rekayasa dan Konstruksi Beton”, KK Rekayasa Struktur FTSL ITB, Bandung, 1-19.
Steurer, R., Langer, M.E., Konrad, A. and Martinuzzi, A. (2005), Corporations, Stakeholders
and Sustainable Development I: A Theoretical Exploration of Business–Society
Relations. Journal of Business Ethics, 61, 263–281.
Wikipedia (2013). Sustainability. Retrieved on 5th
of June from
https://en.wikipedia.org/wiki/Sustainability.
World Business Council for Sustainable Development (2013), Retrieved on 2 January 2014
from http://www.wbcsd.org/home.aspx
Yin, R.K. (2009). Case Study Research: Design and Methods. California; Sage publications

FUTY Journal of the Environment Vol.8 No. 1, June 2014 93
Groundwater Quality Assessment for Domestic Uses in the Micro-
Geomorphological Units of Lagos, Nigeria
Ayeni, A. O. and A. S. O. Soneye 1Department of Geography, University of Lagos, Lagos – Nigeria
[email protected], [email protected]
08053620311
Abstract
This study focused on physic-chemical and trace metals concentrations in hand dug wells
across four micro geomorphological units of Lagos Nigeria. Water samples were collected
from 12 selected wells used for domestic purposes in the metropolis between November 2009
and March 2010. Four (4) parameters – pH, EC, DO and salinity were determined with
portable pH/conductivity meters, handheld M90 Mettler Toledo AG DO meter and handheld
Omega salinity meter respectively. The remaining seven (7) parameters - total dissolved
solids (TDS), total hardness (TH), chloride (Cl-), nitrate (NO3
-), iron (Fe), manganese (Mn)
and zinc (Zn) were determined using atomic spectrophotometer, gravimetric, chlorometric
and titrimetric methods. The results reveal that pH levels ranged between 5.2 and 8.2 with
mean of 6.4±0.90, EC between 34.0 and 340.0mg/l with mean of 177±121mg/l, DO between
1.7 and 4.0mg/l with mean of 2.6±0.7mg/l, TDS between 5 and 241mg/l with mean of
88.1±95mg/l, TH between 6.3 and 109mg/l with mean of 39.7±27.2mg/l, salinity between
17.0 and 497.0mg/l with mean of 111±168mg/l, Cl-
between 3.5 and 55mg/l with mean of
20±19.9 mg/l, NO3- between 7.7 and 62.0mg/l with mean of 26.1±19.6mg/l, Fe between 0.02
and 1.5mg/l with mean of 0.2±0.41mg/l, Mn between 0.02 and 0.2mg/l with mean of
0.1±0.05mg/l, and, Zn between 0.0 and 0.3mg/l with mean of 0.1±0.08mg/l. EC, TDS, TH,
salinity, Cl- and Zn concentrations in all sampled wells fall within the WHO recommended
limits. NO3- and Fe concentrations ranged above WHO limits in some cases. The results
suggest that the variation in concentrations could be attributed to the surrounding
geomorphological units except heavy metals which are traced to leachates around landfill
areas. Nevertheless, the results of concentration of the analyzed parameters, heavy metals in
particular do not follow a significantly identified trend across the geomorphological units
Key words: Groundwater, physic-chemical, trace metals, geomorphic units, Lagos
Introduction
Water is fundamental to life. About 60 per cent of human body is water (Fasunwon et al.,
2010). Of significance in the uses of water are industrial, domestic and agricultural activities.
Ground water is widely distributed and most common use in terms of spatial access, storage
and management (Alexander, 2008). It accounts for about 90% of the world freshwater
resources and constitutes about 80% of safe drinking water in urban and rural areas of
Nigeria. It is obtained from boreholes and shallow hand-dug wells (Adekunle et al., 2007;
Yerima et al., 2008; Adebo and Adetoyinbo, 2009). In most African countries, groundwater
is the most suitable for public water supply source and not easily exposed to contaminant
compared to surface water (Alexander, 2008 and Fasunwon et al., 2010). Groundwater is of
excellent natural quality and usually free from pathogens, colouration and turbidity (Jain et
al., 1995). Hence, it can be consumed directly without treatment.
Constituents of groundwater-bearing rocks influence the physic-chemical properties of the
water. They are compounded by seepages of uncontrolled solid wastes and sewages,

FUTY Journal of the Environment Vol.8 No. 1, June 2014 94
agricultural wastes, urban runoffs and liquid discharges and therefore unsafe for domestic
purposes if not treated (Isiorho and Oginni, 2008; Dada, 2009; Fasunwon et al., 2010; Ayeni, et al., 2011). To Amadi et al. (1989) and Yerima et al. (2008), the impacts are more in
rural areas. Yet, groundwater still remains the only source of water supply especially in low
income neighborhoods where the socio-economic characteristic do not favour pipe borne
water sources.
The focus of the study is assessment of the physic-chemical characteristics of groundwater
for domestic purposes across the geomorphological units of Lagos. The concentration levels
of pH, Electric conductivity (EC), Dissolved Oxygen (DO), Total Dissolved Solids (TDS),
Total Hardness (TH), Salinity, Chloride (Cl-),
Nitrate (NO3
-), Iron (Fe), Manganese (Mn) and
Zinc (Zn) are focused upon.
Exposure to high levels of these constituents in drinking water particularly, when they are
outside permissible limit(s) is one of the most environmental issues that endanger human
health. It can be disastrous where large populations consume the contaminated water without
adequate treatment (Adekunle et al., 2007).
The Study Area
Lagos is in a sedimentary coastal plain around the Gulf of Guinea (Fig. 1). The vegetation
naturally is dominated by mixed swamps of wetland fresh water and mangroves. The rainfall
pattern is double maxima. It ranges between 1400mm and 1800mm and last between March
and November. The temperature is in excess of 300C all year round. The geological
information reveals that Lagos lies solely within the extensive Dahomey basin which extends
almost from Accra to Lagos. The basin thickness increases from north to south (down dip)
and from east to west. The littoral and lagoon deposit of recent sediment underlies the area.
The coastal belt varies from about 8km near the Republic of Benin border to 24 km towards
the eastern end of the Lagos Lagoon (Adegoke, 1969, Agagu, 1985; Nton, 2001; Alabi et al.,
2010; Fasunwon et al., 2010; Ayeni and Adedayo, 2012). The area is underlain by clay,
unconsolidated sands and mud with coarse unsorted sand clay lenses and occasional pebble
beds of the alluvial deposit (Nton, 2001; Alabi et al., 2010). The area is further divided into
various geomorphological units including coastal plain sand (Alfisols), Deltaic basins, tidal
flats and most recent mixed alluvium-coastal plain sand. Open waterbodies of lagoons and
creeks covers about 22% of the 3,577km2 of the state of Lagos in Nigeria. Fasona et al (2005)
noted that the metropolis covers about 37% of the land area of the state. Officially, the State
has a population of about 9.2million (NBS, 2007) out of a national estimate of 120million.
Based on UN survey and the State Regional Master Plan, however the state is estimated to
have about 17 million inhabitants. The metropolitan area accommodates over 85% of the
population.

FUTY Journal of the Environment Vol.8 No. 1, June 2014 95
Materials and Methods
Groundwater samples were collected from 12 randomly selected hand-dug wells between
November 2009 and March 2010 across the geomorphological units of the metropolis (Fig.
2).
Details of the wells are presented in Table 1 along with their coordinates which were
determined using a hand-held Global Positioning System (GPS). Primarily, the levels of
usage for domestic purposes were the main consideration in the choice of the sampled wells.
For each location four parameters - Acidity (pH), Electrical conductivity (EC), Dissolved
oxygen (DO) and salinity were measured in-situ. The values pH and EC were determined
with portable pH/conductivity meters while DO and salinity were measured with handheld
Fig. 1: Geomorphological units of Lagos (Modified after Billman, 1976 and NGSA 2006)
Fig. 2: The Sampling points across the geomorphological units

FUTY Journal of the Environment Vol.8 No. 1, June 2014 96
M90 Mettler Toledo AG DO meter and handheld Omega salinity meter respectively. Using
APHA (1998) standard methods of water collection and analysis, two (2) litres of water from
each location were collected in clean bottles, labeled and transported to laboratory for
analysis of total dissolved solids (TDS), total hardness (TH), salinity, chloride (Cl-), nitrate
(NO3-), iron (Fe), manganese (Mn) and zinc (Zn) (Table 1). The analyses were carried out
using atomic absorption spectrophotometer, gravimetric, choromrtric and titrimetric methods
(Table 1). The results were compared with World Health Organization (WHO 1993 & 2006)
drinking water standard.
Table 1: APHA (1998) methods & procedures for laboratory analysis of water quality S/n Parameters Methods & Procedures
1 TDS Gravimetry (Analytical balance and Oven): A 100cm3 of the filtrate was
evaporated in an ignited and weighed petridish using a hot plate. The
sample was kept under the boiling point range while heating. The dish was
re-weighed after drying and the weight of the residue was calculated.
2 TH EDTA titration: A 100cm3 of water sample was measured into a 250ml
conical flask and 2.0ml buffer solution was added and mixed. Eight drops of
Erichrome black T indicator was introduced followed by titration with 0.01
EDTA solutions. At the end solution changes from wine red to pure blue.
3 Cl- Titration using Mercury Nitrate method: A 100ml of water sample was
measured into a 250ml conical flask. 1ml bromophenol blue indicator was
added followed by titration with 0.014 mercuric nitrate solutions.
4 NO3- Chlorometric method using phenol disulphuric acid: 25ml of water sample
was measured into 250ml beaker and 4ml of 0.25m NaOH, 12.5ml of
reduction mixture were added and shaken vigorously and allowed to stand
for 45minutes. 6ml of 0.1MHCL, 1m EDTA, disulphuric acid were added
and mixed thoroughly, then allowed to stand for 5 minutes. On treatment
with 1ml of sodioum acetate, it was allowed to stand for 10 minutes. The
concentration was read on spectrometer at 520nm (Model: Spectronic
20D+)
5 Fe, Mn and Zn Atomic Absorption Spectrophotometer (AAS): 100ml of thoroughly well
mixed water sample was pour into a beaker and 5ml concentrated nitric acid
was added. The sample is accurately weighed and then dissolved, often
using strong acids. The resulting solution is sprayed into the flame of the
instrument and atomised. Light of a suitable wavelength for a particular
element is shone through the flame, and some of this light is absorbed by
the atoms of the sample. The amount of light absorbed is proportional to the
concentration of the element in the solution
Results and Discussions
Acidity (pH): pH values range from 5.2 to 8.2 with mean value of 6.4±0.90. The pH values of
Ikotun (5.5), Ikeja (5.7), Ipaja (6.1), Imota (5.8), Apapa (5.2) and Makoko (6.3) wells fall
below the range of 6.5 to 9 WHO limits (Table 2 & Fig 3). The mean concentration of pH is
lowest in the coastal plain sand (Alfisols) and highest in the recent alluvium. The values are
5.7±0.4 and 6.8±0.6 respectively. The lowest value is at Apapa (5.2). Compared to the WHO
limits the pH values in the Coastal plain sand (Alfisols) and deltaic basin/tidal flat are slightly
acidic. The acidic nature of the well water can be attributed to existing waste dump sites in
the area. Nonetheless, the pH values, which give the indication of acidity and alkalinity, show
that the wells are safe for domestic uses.

FUTY Journal of the Environment Vol.8 No. 1, June 2014 97
Note: CPS = Coastal Plain Sands, CPS (Alfisols) = Coastal Plain Sands (Alfisols), DB/TF = Deltaic Basins and Tidal Flats, RA = Recent Alluvium,
ND = Not Determined
Table 2:Physic-chemical Parameters of groundwater quality data from the study area
S/n Geology Sampling location
Lat
itude
Longit
ude
pH
EC
(µ
s/cm
)
DO
(m
g/l
)
TD
S (
mg/l
)
TH
(m
g/l
)
Sal
init
y (
mg/l
)
Cl-
(m
g/l
)
NO
3- (
mg/l
)
Fe
(mg/l
)
Mn (
mg/l
)
Zn
(m
g/l
)
1 CPS (Alfisols) Ikotun 6° 33′
3.6″
3° 17′
27.6″ 5.3 107.0 2.7 51.0 109.0 19 15.4 19.7 0.15 0.14 0.27
2 ‖ Ikeja 6° 36′
36.0″
3° 21′
3.6″ 5.7 133.0 2.5 211.0 12.0 21 15.0 15.0 0.10 ND 0.00
3 ‖ Ipaja 6° 27′
3.6″
3° 21′
28.8″ 6.1 245.0 3.0 13.0 38.0 17 55.0 58.0 0.03 ND 0.00
Unit mean
5.7±0.4 161.7±73 2.7±0.3 91.7±105 53.0±50.2 19.0±2.0 28.5±23 30.9±23.6 0.1±0.06 0.14± 0.1±0.16
4 CPS Ikorodu 6° 37′
19.2″
3° 31′
12.0″ 7.1 251.0 3.1 198.0 38.0 27 7.0 9.0 0.09 0.09 0.04
5 ‖ Imota 6° 38′
31.2″
3° 37′
15.6″ 6.9 336.0 4.0 211.0 6.3 31 3.5 20.0 0.14 0.16 0.08
6 ‖ Magbon 6° 39′
54.0″
3° 32′
2.4″ 5.8 287.0 2.1 5.0 38.0 54 3.5 48.1 0.12 0.07 0.05
Unit mean
6.6±0.7 291.3±42 3.1±1.0 138±115 27.4±18.3 37.3±15 4.7±2.0 25.7±20.2 0.1±0.03 0.1±0.05 0.1±0.02
7 DB/TF Aja 6° 28′
12.0″
3° 34′
12.0″ 6.8 38.0 1.9 34.0 40.0 412 5.5 7.7 0.17 0.02 0.02
8 ‖ Apapa 6° 36′
39.6″
3° 16′
1.2″ 5.2 56.0 3.2 19.0 42.0 494 8.7 7.9 1.50 0.10 0.01
9 ‖ Itire 6° 30′
43.2″
3° 20′
20.4″ 8.2 37.0 3.4 28.0 31.0 17 55.0 62.0 0.12 0.08 0.02
Unit mean 6.7±1.5 43.7±11 2.8±0.8 27.0±7.6 37.7±5.9 308±255 23.1±28 25.9±31.3 0.6±0.8 0.1±0.04 0.1±0.01
10 RA Olushosun 6° 35′
27.6″
3° 22′
8.4″ 6.5 259.0 1.7 41.0 67.0 19 12.5 16.2 0.05 0.19 0.17
11 ‖ Oshodi 6° 33′
39.6″
3° 21′
0.0″ 7.5 340.0 1.8 241.0 15.0 28 9.2 15.2 0.02 ND 0.00
12 ‖ Makoko 6° 30′ 3.6″ 3° 23′
24.0″ 6.3 34.0 1.8 5.0 40.0 191 45.0 34.0 0.20 0.06 0.00
Unit mean
6.8±0.6 211±159 1.8±0.1 96±127.1 40.7±26.0 79.3±97 22±19.8 21.8±10.6 0.1±0.10 0.1±0.09 0.1±0.10
WHO limits 6.5 - 9 1500 - 500 500 1000 250 10 0.3 0.05 3
Min 5.2 34.0 1.7 5.0 6.3 17.0 3.5 7.7 0.02 0.02 0.00
Max 8.2 340.0 4.0 241.0 109.0 494.0 55.0 62.0 1.5 0.19 0.27
Overall Mean 6.4±0.90 177±121 2.6±0.75 88.1±95 39.7±27.2 111±168 20±19.9 26.1±19.6 0.2±0.41 0.1±0.05 0.1±0.08

FUTY Journal of the Environment Vol.8 No. 1, June 2014 98
Electrical Conductivity (EC): The values of EC across all the geomorphological units ranged
between 34.0 and 340.0mg/l with mean value of 177±1.21mg/l. In the Recent Alluvia Unit,
Makoko has the lowest EC value of 34.0µs/cm followed by Itire (37.0µs/cm) and Aja
(38.0µs/cm) in Deltaic Basin/Tidal Flat unit (Table 2 & Fig. 4). The highest value of
340.0µs/cm also falls within the Recent Alluvia Unit, followed by Imota (336.0µs/cm) and
Magbon (287.0µs/cm). On the average, coastal plain sand unit has the highest mean value of
291.3±42µs/cm, followed by recent alluvium with mean value of 221±159µs/cm and coastal
plain sand (Alfisols) with mean value of 161.7±73µs/cm while deltaic basin/tidal flat unit has
the least mean value of 43.7±11µs/cm. Compared to the WHO limits the concentrations in all
sampling points were below the permissible limit (Table 2). In this study, it was discovered
that the EC values of all sampled wells were generally low compared to WHO regulatory
limits of (1500µs/cm) and may likely be due to contents of soluble minerals of the
geomorphic units.
Dissolved Oxygen (DO): DO values across all the geomorphological units ranged between
1.7 and 4.0mg/l with mean value of 2.6±0.75mg/l. The wells in the recent alluvia
geomorphological unit have the lowest concentration of DO with mean of 1.8±0.1mg/l. Imota
well in the coastal plain sand unit has a highest value of 4.0mg/l (Table 2 & Fig. 5). The wells
Fig. 3: pH Concentrations (in mg/l)
Fig. 4: Electrical Conductivity Concentrations (in mg/l)

FUTY Journal of the Environment Vol.8 No. 1, June 2014 99
in coastal plain sand unit have highest mean of 3.1±1.0mg/l. Generally, the DO levels of all
sampled wells are quite low with mean of 2.6±0.75mg/l compared to the DO levels in
moving water e.g. stream, tap water. The low levels in sampled wells may due to poor
atmospheric re-aeration, low water temperature and photosynthetic activities in the wells
Total Dissolved Solid (TDS): TDS values across all the geomorphological units ranged
between 5.0 and 241.0mg/l with mean value of 88.1±95mg/l. TDS indicate the amount of
chemical substances dissolved in the water. The TDS values of all sampled wells in the area
were below 500mg/l WHO limits for drinking water (Table 2 & Fig. 6). The mean
concentration of TDS is highest in coastal plains sand with 138.0±115mg/l. Oshodi well in
the unit has the highest value of 241mg/l. Deltaic basin/Tidal flat has a lowest mean
concentration of 27.0±7.55mg/l. Makoko and Magbon wells of Alfisols and Recent Aluvium,
respectively have the lowest of 5.0mg/l each. Some treatments such as addition of coagulants
may be required to make these waters suitable for domestic purposes.
Total Hardness (TH): The values of TH across all the geomorphological units ranged
between 6.3 and 109.0mg/l with mean value of 39.7±27.2mg/l. TH levels are generally low
compare to WHO limits of 500mg/l (Table 2 & Fig.7). The highest concentration of
109.0mg/l is detected around Ikotun in the coastal plains sand (Alfisols) unit, it is followed
by Olushosun with 67.0mg/l. The two (2) sites are close to landfill sites at Siluos and Ojota,
respectively. The lowest value of 6.3mg/l is in Imota in coastal plains sand. On the average,
Fig. 5: Dissolved Oxygen Concentrations (in mg/l)
Fig. 6: Total Dissolved Solid Concentrations (in mg/l)

FUTY Journal of the Environment Vol.8 No. 1, June 2014 100
coastal plains sand (Alfisols) unit has the highest value of 53.0±50.21mg/l while coastal
plains sand unit has the lowest mean value of 27.4±18.3mg/l.
Salinity: Salinity values ranged between 17 and 494mg/l with mean value of 111±168mg/l.
The salinity concentrations in all samples fall below the WHO regulatory limits of 1000mg/l
(Table 2 & Fig. 8). This is highest in the wells (Apapa and Aja) closest to the Atlantic Ocean
and Lagos Lagoon. Apapa and Aja wells have 494mg/l and 412mg/l, all in the delta
basin/tidal flat unit. Wells in delta basin/tidal flat unit have a value of 308±255mg/l while
coastal plains sand (Alfisols) has lowest value of 19.0±2.0mg/l (Fig. 8). The result implies
that the sampled wells are not saline.
Chloride (Cl-): The values of Cl
- across all the geomorphological units ranged between 3.5
and 55.0mg/l with mean value of 20±19.9mg/l, therefore, all selected wells fall below WHO
recommended limits of 250mg/l (Table 2 & Fig.9). Ipaja and Itire wells in coastal plains sand
(Alfisols) and delta basin/tidal flat units respectively have a maximum of 55mg/l. The coastal
plain sand (Alfisols) has the highest mean value of 28.5±22.97mg/l. Coastal plain sand has
the lowest mean value of 4.7±2.01mg/l. Magbon and Imota wells have the lowest value with
just 3.5mg/l each.
Fig. 8: Salinity Concentrations (in mg/l)
Fig. 7: Total Hardness Concentrations (in mg/l)

FUTY Journal of the Environment Vol.8 No. 1, June 2014 101
Nitrate (NO-3): The values of NO
-3 across all the geomorphological units ranged between 7.7
and 62.0mg/l with mean value of 26.1±19.6mg/l. The wells at delta basin/tidal flat and Ipaja
in coastal plains sand (Alfisols) have highest concentration of nitrates. Their values are
62.0mg/l and 58.0mg/l respectively. Recent alluvium unit has the least mean value of
21.8±10.6mg/l while coastal plains sand (Alfisols) unit has the highest mean value of
30.9±23.6mg/l (Table 2 & Fig. 10). Nonetheless, the three (3) wells vis-a-vis Ikorodu in
coastal plains sand unit, Aja and Apapa in delta basin/tidal flat unit have the lowest values of
9.0mg/l, 7.5mg/l and 7.9mg/l respectively fall below WHO recommended limits of 10mg/l.
The major sources of high nitrates in drinking water are runoff from urban and agricultural,
septic tanks seepage, sewage, and erosion of natural deposits. The use of water from nine (9)
wells (Ikotun, Ikeja, Ipaja, Imota, Magbon, Itire, Olusosun, Oshodi and Makoko) associated
with high nitrate concentration could pose serious health problems if not treated. Nitrate
concentrations above the recommended limits are dangerous to pregnant women and pose a
serious health threat to infants less than 3 months of age because of their ability to cause
Methaemoglobinaemia or ―Blue Baby Syndrome‖ in which the blood loses its ability to carry
sufficient oxygen (Alberta Health Services 2011).
Fig. 9: Cl
- Concentrations (in mg/l)
Fig. 10: NO3 Concentrations (in mg/l)

FUTY Journal of the Environment Vol.8 No. 1, June 2014 102
Iron (Fe): The values of Fe across all the geomorphological units ranged between 0.02 and
1.5mg/l with overall mean value of 0.2±0.41mg/l. The values of all the sampled wells are
below WHO regulatory limits of 0.3mg/l except Apapa well (Table 2 & fig.11). Apapa well
in delta basin/tidal flat unit has the highest value of 1.5mg/l. All the other wells have values
below 0.2mg/l. Coastal plain sand (Alfisols) and recent alluvium have the lowest average
values of 0.10mg/l while delta basin/tidal flat unit has the highest mean value of 0.6±0.8mg/l.
Iron is not hazardous to health, it is essential for good health. Iron helps transport oxygen in
the blood. Nonetheless, it problem gives a metallic taste to water, and can affect foods and
beverages – for example turning coffee, tea black.
Manganese (Mn): The values of Mn across all geomorphological units ranged between 0.2
and 0.19mg/l with mean value of 0.1±0.05mg/l. Mn concentrations varied across the four
geomorphological units (Table 2 & Fig. 12).Three (3) of the wells (Ikeja, Ipaja and Oshodi)
have no trace of Mn concentration. The values of Mn from 8 wells (Ikotun, Ikorodun, Imota,
Magbon, Apapa, Itire, Oluhosun and Makoko) were above the WHO recommended limits of
0.05mg/l. Mn concentration is highest in Olushosun (Recent alluvium unit) with a value of
0.19mg/l. Next are Imota (Coastal plain sand) with value of 0.16mg/l and Ikotun (Alfisols)
with value of 0.14mg/l. Mn exists in well water as a naturally occurring groundwater mineral,
but may also be present due to underground pollution sources.
Fig. 11: Iron Concentrations (in mg/l)
Fig. 12: Mn Concentrations (in mg/l)

FUTY Journal of the Environment Vol.8 No. 1, June 2014 103
Zn: The values of Zn across all geomorphological units ranged between 0.001 and 0.27mg/l
with mean value of 0.1±0.08mg/l. The mean concentration of Zn in coastal plains sand,
coastal plains sand (Alfisols), delta basin/tidal flat and recent alluvium are 0.1±0.16mg/l,
0.1±0.02mg/l, 0.1±0.01mg/l and 0.1±0.01mg/l respectively with least value of 0.0mg/l
observed at delta basin/tidal flat (Table 1 and Fig 13). Compared to WHO limits of 3.0mg/l,
the Zn concentration in all layouts are generally below the limits.
The findings revealed that the values of all parameters evaluated significantly varied and do
not follow identified pattern across all geomorphic units. As examples, in Oshodi and
Makoko the minimum and maximum values of EC are within same Recent Alluvia unit. A
similar observation is made for TDS in Oshodi and Makoko wells of the unit with 241.0mg/l
and 5.0mg/l; NO3-
in Itire and Aja wells of Deltaic basin/tidal flat unit with 62.0mg/l and
7.7mg/l; Zn in Ikotun and Ikeja wells (Alfisols unit) with 0.27mg/l and 0.0mg/l; as well as
Mn in Olushosun and Oshodi (Recent Alluvia) with 0.19mg/l and 0.0mg/l. In addition, most
parameters as revealed in table 2 are within the WHO limits except for
pH at Ikotun (Alfisols unit) and Apapa (Deltaic basin/tidal flat unit)
NO3- at Ikotun, Ikeja and Ipaja (Alfisols unit), Imota and Magbon (Coastal plain sand
unit), Itire (Deltaic basin/tidal flat unit), Olushosun, Oshodi and Makoko (Recent
Aluvium unit),
Fe at Apapa (Deltaic basin/tidal flat unit) and
Mn at Ikotun (Alfisols unit), Ikorodu, Imota and Magbon (Coastal plain sand unit),
Apapa and Itire (Deltaic basin/tidal flat unit) and, Olushosun and Makoko (Recent
Aluvium unit).
Fig. 13: Zinc Concentrations (in mg/l)

FUTY Journal of the Environment Vol.8 No. 1, June 2014 104
Conclusion
The quality assessment of water from selected wells across geomorphological units of Lagos
Nigeria revealed that the concentration levels do not follow a significantly identified trend.
The variants in levels of concentration may be as a result of different soil types, agriculture
and industrial waste / waste water, leachate from various landfill / dumpsites and different
human activities across the geomorphological units. The implication is that none of the
groundwater of different unit should be consumed without treatment.
The result therefore suggests that almost all the wells of alfisols, coastal plain sand and recent
alluvium units need serious treatment before drinking. In order of significance Ikotun,
Magbon, Apapa and Olushosun wells require more parameters to be treated - NO3-, Mn, pH
and salinity are outside WHO limits mostly in that order. The solution therefore calls for
feasible alternatives and efforts through public pipe borne water (stand pipes) and deep
boreholes along streets. In addition, since water contamination after collection, transportation
and storage processes are recognized as important issue of public health, the water from
Lagos geomorphological units‘ wells should be subjected to treatment such as boiling or
treatment before drinking. Also public education / awareness on safe drinking water and
implementation of regulations by regulatory standards (National and international) will go a
long way to reduce the implication of unsafe water sources and the associated water borne
diseases.
References
Adebo B. A. and A. A. Adetoyinbo (2009): Assessment of Groundwater Quality in
Unconsolidated Sedimentary Coastal Aquifer in Lagos State Nigeria, Scientific
Research and Essay, 4(4), 314 - 319
Adegoke, O. S. (1969): Ecocene stratigraphy of southern Nigeria. Bill Geol Men No. 60.
Adekunle, I. M., M. T. Adetunji, A. M. Gbadebo and O. B. Banjoko (2007): Assessment of
Groundwater Quality in a typical rural settlement in Southwestern Nigeria, Int. j.
Environ. Res. Public Health, 4(4), 307 - 318
Agagu, O. K. (1985): A geological guide to bituminous sediments in South Western Nigeria.
Department of Geology, University of Ibadan, pp: 2-16.
Alabi A. A., R. Bello, A.S Ogungbe And H.O Oyerinde (2010): Determination of Ground
Water Potential in Lagos State University, Ojo; using Geoelectric methods
(Vertical Electrical Sounding And Horizontal Profiling) Report And Opinion 2(5):68-
75
Alberta Health Services (2011): Interpretation of Chemical Analysis of Drinking Water
Recommended Levels. www.albertahealthservices.ca
Alexander, P (2008): Evaluation of ground water quality of Mubi town in Adamawa State,
Nigeria African Journal of Biotechnology, 7 (11): 1712-1715
Amadi, P. A., C. O. Ofoegbu and T. Morrison (1989): Hydro-geochemical assessment of
groundwater quality in parts of the Niger delta, Nigeria, Environmental Geology, 14
(3):195 – 202

FUTY Journal of the Environment Vol.8 No. 1, June 2014 105
APHA (1998): ―Standard Methods for the Examination of Water and Wastewater‖,
American Public Health Association, 20th
Edition, Washington DC Pg 4 - 144
Ayeni, A. O., I. I. Balogun and A. S. O. Soneye (2011): Seasonal Assessment of Physico-
chemical Concentration of Polluted Urban River: A Case of Ala River in
Southwestern, Nigeria, Res. J. Environ. Sciences, 5(1): 21-33
Ayeni, A. O. and V. T. Adedayo (2012): Soil Textural Mapping: A Pathway for Sustaining
Urban Agriculture in Metropolitan Lagos, Nigeria, Environtropica, 8:31-40
Billman, H. G. (1976): Offshore stratigraphy and paleontology of the Dahomey embayment.
7th Africa Micropaleontology Paleontology, Ile-Ife, pp: 21-4
Dada, C. A. (2009): Towards a successful packaged water regulation in Nigeria, Scientific
Research and Essay 4 (9):921-928,
Fasona, M, A. Omojola, S. Odunuga, O. Tejuoso and N. Amogu (2005): An appraisal of
sustainable water management solutions for large cities in developing countries through
GIS: the case of Lagos, Nigeria Sustainable Water Management Solutions for Large
Cities (Proceedings of symposium S2 held during the Seventh IAHS Scientific
Assembly at Foz do Iguaçu, Brazil, April 2005). IAHS Publ. 293: 49 - 57
Fasunwon, O. O., A. O. Ayeni and A. O. Lawal (2010): A Comparative Study of
Borehole Water Quality from sedimentary Terrain and Basement Complex in
Southwestern, Nigeria, Research Journal of Environmental Sciences, 4 (3): 327-335
Isiorho, S. A. and F. A. Oginni, (2008): Waste disposal and ‗Pure Water‘ quality issues
from Lagos State, Nigeria. The Proceedings of Ground Water Protection Council.
25th Silver Anniv. Annual Forum: „Buried Treasure‟ Sept. 20-24, 2008--Cincinnati,
Ohio,USA.http://www.gwpc.org/meetings/forum/2008//Papers/Isiorho/Solomon.do
c07/01/2011
Jain, C. K. et al (1995). Ground Water Quality Monitoring And Evaluation in and around
Kakinada, Andhra Pradesh, Technical Report, CS (AR) 172, National Institute of
Hydrology, Roorkee, 1994-1995.
NBS (2007): ―Federal Republic of Nigeria Official Gazette‖, No. 24, Vol. 94 2007
(National and State Provisional Totals 2006 Census), National Bureau of Statistics
(NBS) Publication
NGSA (2006): Geological and Mineral Resource Map of Lagos State of Nigeria, Nigerian
Geological Survey Agency (NGSA) http://www.nipc.gov.ng/statemaps.html)
Nton, M. E. (2001): Sedimentological and geochemical studies of rock units in the eastern
Yerima F. A. K., M. M. Daura and B. A. Gambo (2008): Assessment of Groundwater
Quality in Bama Town, Nigeria, J. Sustainable Dev. In Agric. & Environ, 3(2): 128 -
137
WHO (1993): ―Guidelines for Drinking-Water Quality”, Volume 1, Recommendations 2nd
edition, World Health Organization (WHO), Geneva

FUTY Journal of the Environment Vol.8 No. 1, June 2014 106
WHO (2006): ―Guidelines for Drinking-Water Quality‖, Volume 1, Recommendations 1st
Addendum to 3rd
edition, World Health Organization (WHO), Geneva (Electronic
version). http://www.who.int/water_sanitation_health/dwq/gdwq3rev/en/index.ht ml
10/11/2007

FUTY Journal of the Environment Vol.8 No. 1, June 2014 107
GEOSPATIAL ANALYSIS OF CRIME ZONES IN KADUNA METROPOLIS,
NORTHERN NIGERIA
Azua, S., and O. A. Isioye
Department of Geomatics
Ahmadu Bello University, Zaria
E-mail:[email protected]
Abstract
In recent years, the rate of crime in Nigeria is causing a widespread concern. There is need
for effective monitoring and control of crime to enhance the security of lives and properties.
This paper seeks to use Geographic Information System (GIS) to identify, map and analyze
the distribution of crime scenarios in Kaduna metropolis. Data about crime incidences
between 2006 and 2008 was obtained from the State Criminal Investigation Department,
Police Headquarters, Kaduna. These data alongside with the digital map of Kaduna
metropolis were used in ArcGIS environment and analysis carried out to identify crime zones
in the study area.The result shows that Sabon Tasha has the highest rate of crime with 13
percent of the total reported cases of crime in the area under review, while Unguwar Sanusi
has the lowest rate of crime with 2 percent of the total reported cases of crime in the study
area. It was therefore recommended that more Police Stations be established in Sabon
Tasha,Banawa, Kabala Doki, Ungwan Rimi and Kabala West tointensifythe effort of the
patrol team in fighting crime in the affected areas.
Keywords: Geospatial Analysis, Crime Zones, Geographic Information System (GIS) and ArcGIS
9.2.
Introduction and Background
Crime may be defined as any violation of law, an omission of a duty commanded, or the
commission of an act prohibited by law and punishable by the state (Tudela 2004 and
Chaudhari, 2005). The rate of crime in Nigeria today is causing sleepless night to many
Nigerians. There are various cases of crime ranging from arm robbery to kidnapping. The
traditional and old system of intelligence and criminal record maintenance has failed to live
up to the requirements of the existing crime scenario (Mubashir, 2010). Manual processes
neither provide accurate, reliable and comprehensive data round the clock nor does it help in
trend prediction and decision support. It also results in lower productivity and ineffective
utilization of manpower. Inadequate modern technology and insufficient manpower have
prevented the Nigerian security agents from tackling the issue of crime in Nigeria effectively.
There is therefore need to device a new way of crime record, monitoring, and management to
abate the occurrence of crime in Kaduna metropolis and of course, Nigeria as whole.
The solution to this ever-increasing problem lies in the effective use of Information
Technology. According to Chaudhari (2005) successful crime prevention strategies require a
larger scale analysis to identify possible intervention points. Intervention strategies must be
crime and situation specific.
Geographic Information System (GIS) has been identified to be a convenient tool for this
study. It has great potential in criminological research because of its three key functions;
database management, spatial analysis and visualization (Alexander and Xiang, 1994).GIS
uses geospatial data and computer-generated maps as an interface for integrating and
accessing massive amounts of location-based information (Johnson, 2000). It is the
comprehensive idea to provide the information required to the administrative staff to analyze

FUTY Journal of the Environment Vol.8 No. 1, June 2014 108
and make a quick decision by providing the end user with descriptive information allowing
the enforcement agencies to identify areas that are crime prone and the rate of crime in the
affected areas. Crime mapping will enable police understand how to make decisions and how
to deploy patrol teams to the affected zones.
Crime analysis is defined as a set of systematic, analytical processes directed at providing
timely and pertinent information relative to crime patterns and trend correlations to assist the
operational and administrative personnel in planning the deployment of resources for the
prevention and suppression of criminal activities, aiding the investigative process, and
increasing apprehensions and the clearance of cases(Chaudhri, 2005). Crime Analysis
through GIS is today becoming more necessary in Nigeria as the rates of crimes are very
much on the rise, in order to make better informed decisions and to present crime information
in geographic context. GIS can be used as a very useful tool to display and apply spatial
analysis to data, which reside in large databases to yield a strong visual appreciation of the
patterns of crimes.
Crime mapping and assessment has become very important in our society in view of the fact
that it is committed daily with more perfection. The methods used for mapping and assessing
crime are many, depending on the use to which the map will be put and the source of data.
Hyatt (1999) used Geographic Information System (GIS) to generate catchment zones similar
to police precincts around public housing developments in three cities. The address-matched
locations of all reported crimes cases were then overlaid to count crimes and calculate crime
rates within these zones, producing data to answer criminological questions.
Alexander and Xiang (1994) used GIS to the identify crime patterns in the Charlotte, North
Carolina, urban area. With GIS capabilities, the time series and spatial patterns of murder
were accurately identified and effectively presented.
Chaudhari (2005) employed the use of GIS to monitor crime, analyze the volume of crime,
violent crime, and organized crime, as a potential analytical tool for tactical investigative
forecasting. In his paper emphasis was placed on organized crime within a small locality of
Pune, India.
Chainey and Dando (2006)used crime data for a period before a fixed date (that has already
passed) to generate hotspot maps, and test their accuracy for predicting where crimes will
occur next. Hotspot mapping accuracy is compared in relation to crime type, the retrospective
time period of data used, and the time period after the production of the hotspot map.
Therefore, the research compares which crime types produce the most reliable hotspot maps
for predicting where crime happens next. The results indicate that crime hotspot mapping
accuracy differs significantly across different crime types and in relation to the volume of
data used, and how relevant the maps continue to be in accurately identifying crime problem
areas.
Currently, GIS is not being used for crime control and management in kaduna. This may be
due to the lack of awareness of the benefits offered by GIS in crime control and management
in the country.
The aim of this study is therefore, to map Crime incidences and to assess the spatial
distribution of crime in Kaduna metropolis that would assist in crime control.This will
provide firsthand information to enforcement agents to take adequate and effective steps to

FUTY Journal of the Environment Vol.8 No. 1, June 2014 109
reduce and prevent crime, to reduce suffering of victims, to punish the guilty, and to direct
our limited resources where they can do most good.
Kaduna State is located on the southern end of the High Plains of northern Nigeria, bounded
by parallels 9°03'N and 11°32'N, and extends from the upper River Mariga on 6°05'E to
8°48'E on the foot slopes of the scarp of Jos Plateau.
The state capital covers an area of about 25km by 10km with a population estimate of about
1.7mililon (National Population Commission, 2006). Kaduna metropolis comprises of
Kaduna North, Kaduna South and part of Igabi Local Government Area.
Methodology
Data about crime incidences between 2006 and 2008 were obtained at the Police
Headquarters, (State CID). This data showed the nature of crime, dates and places of
occurrence, number of suspects and the locations where crimes frequently occurred (see
Table 1 for nature of crimes and appendix I for details). Also acquired from Police
Headquarters was all the divisional headquarters of police including their areas of
jurisdiction. A total of fourteen Police divisional headquarters were acquired on which the
crime locations are based (See Table 2). To carry out proper analysis of the trend of crime
occurrence in the area under study, there was a need to edit the data to remove any possible
error. The data was also examined to identify and map areas of crime concentration using
Hand-held GPS. The zoning was done using the list of areas covered by each Police
divisional Headquarters as guide. As a result, the study area was divided into 14 different
zones as shown in Table 3 and Figure 1.
A street guide map of the study area was acquired to serve as a base map and was imported
into ArcGIS9.2 environment. The demarcations of the zones were done in the ArcMap
environment by digitizing a vector file into polygon features using copy of the street guide
map of the study area as background.

FUTY Journal of the Environment Vol.8 No. 1, June 2014 110
Table 1: Nature of crimesidentified in the study area
S/N NATURE OF CRIME
1 Culpable homicide
2 Armed robbery
3 Theft & other stealing
4 Theft of vehicle
5 Vandalizingpublic properties
6 Bank fraud
7 Rape
8 House breaking &theft
9 Receiving stolen properties
10 Fire incidences
11 Assault
12 Unlawful possession of fire arms
13 Terrorism
Table 2: Police post and their Locations FID SHAPE X Y DIVISION_H
0 Polygon 329442.70 1161110.05 Kabala Doki
1 Polygon 332147.30 1155190.17 Sabon Tasha
2 Polygon 329282.94 1163021.97 Gabasawa
3 Polygon 326931.74 1158624.19 Kakuri
4 Polygon 329659.38 1168589.36 Kawo
5 Polygon 327998.69 1161580.14 Sabon Gari
6 Polygon 328991.37 1157516.22 Barnawa
7 Polygon 327117.10 1162350.46 Tudun Wada
8 Polygon 326578.64 1167285.94 Kurmi Mashi
9 Polygon 323798.20 1161519.07 Kabala West
10 Polygon 332495.61 1167568.9 Malali
11 Polygon 325746.95 1163782.90 Unguwan Sanusi
12 Polygon 332145.66 1164086.79 Unguwan Rimi
13 Polygon 320341.37 1165461.22 Rigasa
From the 14 crime zones obtained in the study area, 2 major crime zones were determined
based on the number of crimes that occurred in each area. If the total crimes occurrence in an
area is less than/equal to 125, the area is classified as a low crime zone. However, if the total
crime occurrence is more than 125 times, the area is classified as a high crime zone. The total
number of crime cases recorded within the study period of 2006-2008 is 1,749.

FUTY Journal of the Environment Vol.8 No. 1, June 2014 111
Table 3: Areas contained in each Zone S/N ZONES AREAS
1. BARNAWA Narayi, Barnawa town, Station roundabout, Down quarter, Railway.
2. GABASAWA Luggard hall, Marafa, Bidda road, Yakubu Gawan way, Old wolf road,
Nursing home, Sokoto road, Durba hotel, NEPA roundabout, Ali Akilu road.
3. KABALA WEST Kudandan, Unguwar Mallam Ma‘azu,Kabala west.
4. KABALA DOKI Kabala Doki, Costin, Gamji gate, Swimming pool road by police college.
5. KAKURI Industrial area, Market, Nasarraw,DIC, Peagout junction, Textile by brewery,
Atilari
6. KAWO Unguwar Dosa, CSOA, Unguwar Kanawa, Unguwar Shanu, Unguwar Sarki,
Abakwa, New Barrack, Unguwar Gwari, Rafin Guza, Unguwar Kaji, Mando
park, Afaka village, Hayin Banki.
7. KURMIN MASHI Panteka(new), Nnamdi Azikiwe way, Express way
8. MALALI Badarawa, Kwaru, Raba road, Technical School, FGC Malali, New Isa Kaita
road, New Dawaki road.
9. RIGASA Hayin Taroro, Eskolaye, Bakin Ruwa.
10. SABON GARI Constitution road, ABS Stadium, Katsina road by Ahmadu Bello way, Lagos
Street roundabout, Abubakar Gumi (central), Lokoja by Maiduguri road,
Oriokpata, NEPA roundabout, Luggard hall roundabout.
11. SABON TASHA Unguwar Sunday, Television, Unguwar Boro, NNPC Quarters, Unguwar
Maisamari, Kakau, Tollgate.
12. TUDUN WADA Fire Service, Zango, Baccama road, Tudun Nupawa, Polythenic, Tudun wada
cinema area, Kwana Lami.
13. UNGUWAR RIMI G.R.A, Hayin Danbushiya (new Kaduna city), Unguwar Rimi.
14. UNGUWAR SANUSI Badikko, 44 Barack area, Unguwar Sanusi, Kasuwar Bacci.
Figure 1: The Study area showing Zones
Database Design
A database system is a large computerized collection of structured data whose overall goal is
to store information and allow users to retrieve and update information on demand. Database
design constitutes one of the core tasks in developing any GIS application. It involves the
process by which the real world entities and their interrelationships are analyzed and modeled
in such a way that maximum benefits are derived while using the minimum quantity of data
(Kufoniyi, 1998). The database design consists of two main phases namely: The Design
phase and the Implementation phase. The design phase consists of the conceptual, logical and
the physical.

FUTY Journal of the Environment Vol.8 No. 1, June 2014 112
Conceptual Design
Conceptual data model is the representation of human perception of reality. It considers the
relevant entities and their interrelationship with other entities as well as their characteristics
and attributes which support the process and the application for which the database is
designed. In spatial data model we have a choice of three types of conceptual models of
which one may be adopted. These schemes are;Tesselation, Vector and Object oriented. This
paper however made use of the vector data model.
After organizing the data into zones, four layers; Police Station, Streets, Crime and Zones
were identified together with their attributes as shown in the entity relationship diagram (see
Figure 1). An entity relationship diagram (ER) is a graphical representation of the logical
relationships of entities (or objects) in order to create a database. In line with vector model
representation, Police stations and crime incidences were taken as point features, streets taken
as linear features and zones were taken as polygon feature.
Logical Design
The logical design is concerned with the transformation of the conceptual model to a
particular kind of database Management System (DBMS) for which the system will be
implemented. The design was made to reflect how the data is going to be recorded in the
computer system. In this study, the relational data model was adopted. This involves
arranging data into series of tables called relation. Each table represent an entity in which all
the attributes associated with it are recorded.
The logical design for this study is as shown below:
Police Station:PS_ID, Location, No. of Crimes, No. of Staff, Str_ID
Streets:Str_ID, Street name, Zn_ID, Cr_ID
Crime:Crime_ID, name, location, date, No. of occurrence, gender of suspect, PS_ID
Zone:Zone_ID, name, location, area covered represents the primary keys of Police Station,
Streets, Crime and zones respectively, PS_ID.
Physical Design
This involves mapping into the inbuilt data types of the selected logical model being used to
implement the conceptual data model. A physical database model shows all table structures,
including column name, column data type, column constraints, primary key, foreign key, and
relationships between tables(See Table 1 to Table 4 below).
Table1: Police Station
ATRRIBUTES DATA_TYPE FIELD_ LENGTH/SIZE
PS_ID Number Long_Integer
Location Text 30
No._of_crimes Number Long_Integer
No._0f_Staff Numbre Long_Integer
Table2: Streets
ATRRIBUTES DATA_TYPE FIELD_ LENGTH/SIZE
Str_ID Number Long_Integer
Str_name Text 25

FUTY Journal of the Environment Vol.8 No. 1, June 2014 113
1 m
1m
1
111
1 m
Figure1: Entity Relationship Diagram
Table3: Crimes
ATRRIBUTES DATA_TYPE FIELD_ LENGTH/SIZE
Cr_ID Number Long_Integer
Name Text 25
Location Text 25
Date Number Long_Integer
No._of_occurences Number Long_Integer
Gender_of_suspect Text 10
Table 4: Zones
ATRRIBUTES DATA_TYPE FIELD_ LENGTH/SIZE
Zn_ID Number Long_Integer
Name Text 25
Location Text 25
Area_Covered Number Long_Integer
Results and Discussion
GIS is different from other information system because of its ability to perform spatial
analysis. In this study, the following analyses were performed: Spatial Search (database
extraction), Classification and Hotspot Analysis and Proximity Analysis using ArcGIS 9.3
software.
Police Station
Zones Streets
Crime Records
Located
in
Occurs
in
Within
Leads to
Crime_ID
Name
Location
Date
No of occurrence
Gender of suspect
No of crimes
Police_ID
Location
Zone_ID
Crime_ID
Street_ID
Name
No of staff
Location
Name
Areas covered

FUTY Journal of the Environment Vol.8 No. 1, June 2014 114
Spatial Search
Spatial search operations are used to extract certain attributes in the neighbourhood, which
must be logically defined.This operation enables the user to retrieve data from the database to
obtain information that will be needed to support decision making. The following queries
were carried out from the database developed to demonstrate the usability of the data. The
results obtained from the queries and analyses are shown in Figure 2 and 3 below:
(i) Low crime zone in Kaduna metropolis
Syntax: “Total_Crime <= 125
Figure 2: Low crime zone in Kaduna metropolis
(ii) High crime zones in Kaduna metropolis
Syntax: Total_Crime > 125
Figure 3: High Crime zones in Kaduna metropolis

FUTY Journal of the Environment Vol.8 No. 1, June 2014 115
The result of Figure 2 shows the zones, high-lighted with blue as the low crime zones. These
zones have crime cases less than/equal to125 times and include Kabala West, Tudun Wada,
Gabasawa, Malali, Unguwar Rimi and Unguwar Sanusi Sabon.
Figure 3 shows the zones, highlighted with blue, as high crime zones, having number of
occurrence more than 125 times. These zones include Kawo, Sabon Gari, Barnawa, Kabala
Doki, Kakuri, Rigasa, Kurmin Mashi and Sabon Tasha. This therefore means that more effort
is needed by security agents to reduce crime in these areas.
3.2 Crime Classification
The data obtained from Police Stations was studied to identifyand map crime hot spotsas
shown in Figure 4 below.
Figure 4: Crime Hot Spot in Kaduna Metropolis
A detailed result is shown in Table 2 below in which the different areas are categorized into
low and high crime zones. It also gives the total number of crime cases committed in each
locality.

FUTY Journal of the Environment Vol.8 No. 1, June 2014 116
Table 2: Zones with high and low crimes.
S/N Zones No of Crime
Cases (NCC)
Percentage
crime
Difference
(NCS-AVC)
Remarks
1. Barnawa 142 8% 17 High
2. Gabasawa 105 6% -20 Low
3. Kabala West 52 3% -73 Low
4. Kabala Doki 152 9% 27 High
5. Kakuri 153 8% 28 High
6. Kawo 171 10% 46 High
7. Kurmin Mashi 129 7% 4 High
8. Malali 86 5% -39 Low
9. Rigasa 134 8% 9 High
10 Sabon Gari 165 9% 40 High
11. Sabon Tasha 222 13% 97 High
12. Tudun Wada 79 5% -46 Low
13. Unguwar Rimi 124 7% -1 Low
14. Unguwar Sanusi 35 2% -90 Low
Table 2 shows that, Sabon Tasha and Kawo have the highest crime cases of 222 and 171
respectively, which represent 13% and 10% respectively, of the total crime cases in the area.
This may be as a result of the high population in these areas. This means that more effort is
needed by law enforcement agents to fight crime in these areas. On the other hand, Unguwar
Sanusi and Kabala West have the lowest crime cases of 35 and 52 respectively, which
represent 2% and 3% respectively of the total crime.
3.3 Proximity Analysis using Buffers
Figure 5 below shows the distribution of Police Divisions (Police Stations) in Kaduna
metropolis. Buffers were created at 2km around the Police Stations to access the proximity of
the Police station to the crime areas. It was observed that the location of the Policestations is
concentrated at the heart of the city and far apart, leaving most of the crime areas at the
mercy of the hoodlums. Hence, Sabon Tasha which has the highest crime incidences has only
one police station and is located more than 2km away from the crime hot spot. Other crime
hot spot located in Kawo, Rigasa and Barnawa are also located at a distance more than 2km
away from Police Stations. This implies that the criminalactivities can take place in this area
without fear of intervention by security agents. It was also observed that Kabala Doki has no
police station placed near to their areas. This will limit the effort of the officers in fighting
crime most especially during emergency situation. Successful crime reduction in this area
requires the location of at least a Police station to combat crime in this area. This will enable
the Police officers to respond promptly to crime especially during emergency calls.

FUTY Journal of the Environment Vol.8 No. 1, June 2014 117
Figure 5: Police Stations buffered at 2km
Furthermore, Table 3 below shows the number of crimes that occurred in each month of the
period of study starting from 2006 to 2008. The data in Table 3 are used to plot the
incidences of crime in the study area as shown in Figure 5 below.

FUTY Journal of the Environment Vol.8 No. 1, June 2014 118
Table 3: Number of crimes in the period under review
2006 2007 2008
Month No. of crimes No. of crimes No. of crimes
January 37 34 38
February 62 43 36
March 38 44 27
April 43 30 81
May 129 34 36
June 69 39 41
July 50 29 91
August 49 18 71
September 40 41 18
October 27 46 44
November 20 72 85
December 135 38 146
Figure 5: Number of crime occurrence per month
In Figure 5, it was observed that year 2006 experienced high crime occurrence in the month
of May and December with 129 and 135 cases respectively while October and November
recorded the lowest cases of crime with 27 and 20 cases respectively. In 2007, the numbers of
crime occurrences were minimal compared with 2006 and 2008. However, November shows
a total of 72 cases as the highest in that year while the month of August recorded the least
number of crime cases in that year with a total 18 occurrences. In year 2008, crime cases
were recorded highest in April, July November and December with 81, 91, 44 and 146 cases
respectively.
With the high crime cases shown in December of 2006 and 2008 respectively, one may be
tempted to say that this is due to the Christmas and Sallah celebrations that took place in
December. However, security agencies should increase surveillance during December to
monitor the activities of hoodlums in the area and also to ensure safety of lives and properties
of all Nigerians in the area.

FUTY Journal of the Environment Vol.8 No. 1, June 2014 119
Conclusions
The introduction and the use of GIS in Police and public agencies, facilitates the information,
knowledge and result management in crime prevention. The findings of this study showed
that using GIS is a much more compatible means of crime pattern analysis than the old
method because of its geographic referencing capabilities. The three basic categories of GIS
functions (database management, spatial analysis and visualization) in a single computer-
based system created an environment much more conducive to the location analysis of crime
patterns than current method of keeping criminal records in files.
With the support and encouragement from all relevant authorities, GIS can be used to map
and analyze crime occurrences with a view to determine factors leading to such crimes and
how they can be effectively managed. Police and other law enforcement agents could produce
maps showing the crime scene and their police posts or stations, by performing simple
analysis using GIS. This will assist the Police in locating more stations and deploying its men
to control crime.
Crime monitoring and control is very important in our society because development in any
community depends to a large extent on its state of security. Today the rate of crime in
Nigeria has been on the increase and these crimes are being carried out with more perfection
and sophistication.
It is therefore, recommended that the use of GIS for crime mapping should be introduced in
Kaduna State to enhance crime monitoring and control in the study area. In addition,
government should provide fund to purchase all the necessary equipment and software
needed for the smooth running and operation of GIS and for the training of personnel that
will handle the GIS equipment. This will go a long way in fighting crime in the area.
It is also recommended that the research should be extended to a period of at least five years
so that more data will be collected to help assess the pattern of the activities of the criminals
in the area. This will give law enforcement agents an understanding of the activities of
hoodlums and to device a means of controlling them.
References
Alexander1 M. and Xiang
2, W., (1994). Crime Pattern Analysis Using GIS,
1Department of
Criminal Justice, 2Department of Geography and Earth Science, University of North
Carolina at Charlotte, NC 28223. Retrieved from
http:/libraries.maine.edu/spatial/gisweb/spadb/gis-lis/gislis-c.htm. Accessed on 22nd
September,
2010)
Chainey, S. and Dando, J., (2006), The Utility of Hotspot Mapping for Predicting where
Crime will Happen Next, Fourth UK National Crime Mapping Conference, London.
Retrieved from www.google.com. Accessed on 22nd
September, 2010
Chaudhari, P. S., (2005). A Perspective Approach in Crime Monitoring Using GIS.
Symbiosis Institute of Geoinformatics ‗Symbiosis Bhavan‘ 1065, Gokhle Cross Road,
Model Colony Pune, Maharashtra-411016. Retrieved from www.google.com, Accessed
on 15th
September, 2010.
Hyatt, R. A., (1999). Measuring Crime in the Vicinity of Public Housing with GIS. ESRI
User Conference. Retrieved from http:/www.rti.org. Accessed on 22nd
September, 2010

FUTY Journal of the Environment Vol.8 No. 1, June 2014 120
Johnson, C.P., (2000). Crime Mapping and Analysis Using GIS. Geomatics Group, C-DAC,
Pune University Campus, Pune 411007. Retrieved from www.cdacindia.com. Accessed
on 8th
August, 2010.
Kufoniyi (1998): GIS, A paper delivered at a public lecture organized by Oyo State branch of
NIS at Ibadan pp. 1-12
Mubashir M., (2010). Assessing Crime Zones in Kaduna Metropolis Using GIS. An
Undergraduate project submitted to the Department of Geomatics Engineering, Ahmadu
Bello University, Zaria.
NPC, (2006). National Population Commission Report.
Tudela, P., (2004).Trends in Crime Mapping: The Challenges and Perspectives of Integrating
Crime Mapping in Local Safety and Governance Policies. Retrieved from
http://www.crime-prevention-intl.org/io_view.php?io_id=107&io_page_id=406.
Accessed on 15 September, 2010.

FUTY Journal of the Environment Vol.8 No. 1, June 2014 121
Appendix I: Abstract of Crime Records of Kaduna Metropolis (2006-2008)
S/N Nature of Crime No Of
Crimes
No of
Suspects
Gender of
Suspects
Coordinates Location
E N
Location of Crimes Date Of
Crimes
1 Armed Robbery 5 12 M 332238.58, 1164346.98 Post Office Road,
Unguwar Rimi
Jan-08
2 Theft &Other Stealing 6 8 M 331096.74, 1156474.80 Sabon Tasha Jan-08
3 Theft Of Vehicle 11 6 M 331356.13, 1168653.27 Malali Jan-08
4 Vanderlization(PHCN) 4 6 M 328562.66, 1159397.32 Aliyu Makama Road,
Barnawa
Jan-08
5 Bank Fraud 1 1 M 327919.53, 1165094.59 Bank Road, Tudun
Wada
Jan-08
6 Vanderlization(PHCN) 2 8 M 326016.70, 1156947.76 Samaru Road, Kakuri Feb-08
7 Unlawful Possession 5 5 M 331628.86, 1156717.44 Sabon Tasha Feb-08
8 Armed Robbery 2 10 M 331900.14, 1156170.07 Sabon Tasha Mar-08
9 Armed Robbery 2 5 M 331630.36, 1169957.99 Kagarko Road, Kawo Apr-08
10 Armed Robbery 2 4 M 331900.14, 1156170.07 Sabon Tasha Apr-08
11 Culpable Homicide 3 8 M 330223.25, 1159012.23 Kawo June-08
12 Culpable Homicide 2 5 M 329451.11, 1167821.43 Kurmin Mashi Jun-08
13 Armed Robbery 2 5 M 330646.25, 1169795.60 Kawo Jun-08
14 Theft & Other Stealing 5 7 M 327001.37, 1162802.88 Sabon Gari Jun-08
15 Theft & Other Stealing 3 0 M 330646.25, 1169795.60 Kawo Jun-08
16 Armed Robbery 1 5 F 330145.40, 1158198.23 Barnawa Jul-08
17 Armed Robbery 3 9 M 325925.56, 1158149.29 Kakuri Jul-08
18 Theft &Other Stealing 3 1 M 330396.11, 1158036.78 Barnawa Jul-08
19 Theft &Other Stealing 4 3 M 327373.83, 1162994.01 Tudun Wada Jul-08
20 Theft & other stealing 5 2 M 325925.56, 1158149.29 Kakuri Oct-07
21 Theft & other stealing 1 1 M 329021.09, 1167840.96 Kurmi Mashi Oct-07
22 Theft & other stealing 2 7 M 328438.37, 1163210.99 Gabasawa Oct-07
23 Unlawful Possession 3 3M 327687.58, 1162997.69 Unguwar Sanusi Oct-07
24 Rape 3 6 M 327373.83, 1162994.01 Tudun Wada Oct-07
25 Armed Robbery 3 5 M 330309.34, 1158443.01 Barnawa Oct-07
26 Armed Robbery 3 8 M 330442.90, 1156486.02 Post Office Rd, Sabon
Tasha
Oct-07
27 Armed Robbery 3 9 M 326093.31 1157871.49 Baban Dodo Rd,
Kakuri
Oct-07
28 Theft & other stealing 3 1 M 330309.34, 1158443.01 Barnawa Oct-07
29 Theft & other stealing 4 3 M 326820.88, 1163054.24 Tudun Wada Oct-07
30 Armed Robbery 2 3 M 327373.83, 1162994.01 Tudun Wada Nov-07
31 Armed Robbery 1 1 M 325925.56, 1158149.29 Kakuri Nov-07
32 Theft & Other Stealings 6 5 M 331900.14, 1156170.07 Sabon Tasha Nov-07
33 Theft & Other Stealings 10 6 M 331882.81, 1169603.19 Kawo Nov-07
34 Theft & Other Stealings 10 11 M 329034.11, 1167859.43 Kurmin Mashi Nov-07
35 Armed Robbery 2 11 M 333756.11, 1158044.21 Barnawa Dec-07
36 Armed Robbery 1 3 M 325925.56, 1158149.29 Kakuri Dec-07
37 Theft & Other Stealings 4 5 M 331900.14, 1156170.07 Sabon Tasha Dec-07
38 Theft & Other Stealings 4 4 M 323790.56, 1166075.09 Rigasa Dec-07
39 Receiving stolen property 6 8 M M 330646.25, 1169795.60 Kawo Feb-06
40 Receiving stolen property 2 5 M 330396.11, 1158036.78 Barnawa Feb-06
41 Armed Robbery 1 1 M 328438.37, 1163210.99 Gabasawa Feb-06

FUTY Journal of the Environment Vol.8 No. 1, June 2014 122
42 Culpable homicide 3 4 M 330149.77, 1155866.14 Kagarko Close, Sabon
Tasha
Apr-06
43 House breaking and theft 12 15 M 331342.01, 1168508.10 Malali Apr-06
44 Rape 6 8 M 327771.69, 1162221.64 Unguwan Rimi June-06
45 Store Breaking & Theft 4 6 327376.21, 1162425.97 Sabon Gari Sept-06
46 Theft & other stealing 8 8 M 323790.56, 1166075.09 Rigasa Sept-06
47 House Breaking Theft 2 3 F 325539.26, 1157382.93 Samaru Road, Kakuri Dec-06
48 House Breaking Theft 2 6 F 331882.81, 1169603.19 Kudan Road, Kawo Dec-06
49 Armed Robbery 1 3 F 325925.56, 1158149.29 Kakuri Dec-06
50 Theft & Other Stealing 3 4 F 331981.01, 1156145.20 Sabon Tasha Dec-06
51 Theft Of Vehicle 3 3 M 327687.58, 1162997.69 Unguwar Sanusi Dec-06
52 Store Breaking & Theft 4 6 F 327376.21, 1162425.97 Sabon Gari Dec-06
53 House Breaking & Theft 3 6 M 327001.37, 1162802.88 Sabon Gari Dec-06
Copyright © 2022 FDOKUMEN