Contents - Naturalis Repository
43
-
Upload
khangminh22 -
Category
Documents
-
view
2 -
download
0
Transcript of Contents - Naturalis Repository


5th European Gemmological Symposium 15-16 June 2013 NEL & GGN Leiden, The Netherlands
3 Contents
Contents 3
The Organisers 4 Programme 6 Speakers Maggie Campbell Pedersen, Emmanuel Fritsch, Tobias Häger 7 Thomas Hainschwang and Ulrich Henn Stefanos Karampelas, Benjamin Rondeau and Kenneth Scarratt Presentations Overview of pearl testing; classic methods and new developments 10 Colour and Colour Modification of Non-transparent Quartz 14 Useful Gemmological Data Sets from Deposit Specific Samples 17 Natural Green Diamonds 21 Element analytical and UV-Vis-NIR study of natural untreated 24 spinels from Vietnam in comparison to synthetics The ordinary and extraordinary shapes of diamond crystals 28 Gemmology and geology of precious opal deposits; 31
comparison of Australian versus Ethiopian deposits
Amber: Real, Fake and Coloured 36
Special contribution Rare Earth Elements in mint green grossular garnet from 39 Merelani, Tanzania, Exhibit 42 Sponsors 43
Editor: Hanco Zwaan Contributing editors: Marjolein van Rooy-Roeloffzen, Terrence Bevoort-Alwicher Photo Editing: Jan Paul Bevoort Lay Out and pre press: Terrence Bevoort-Alwicher, Jan Paul Bevoort

5th European Gemmological Symposium 15-16 June 2013 NEL & GGN Leiden, The Netherlands
4 Organisers
Nederlands Edelsteen Laboratorium/Netherlands Gemmological Laboratory The Netherlands Gemmological Laboratory is part of Naturalis Biodiversity Center (formerly the National Museum of Natural History) and has a long standing tradition in offering identification and grading services to Jewellers, Auction houses, dealers, and the general public. Although the laboratory was officially established in 1957, activities already started way before World War II. In view of the difficulties in describing and identifying gemstones and pearls correctly, the laboratory is frequently asked for advice. Reports are issued on diamonds, coloured gemstones and pearls. The laboratory is independent and not involved in trading. An objective description and scientifically sound opinion can be given on the quality and, where possible, provenance of any gem material that is offered for examination. The reports issued are internationally recognised and do not include valuation.
In addition to standard gemmological equipment, the laboratory houses more advanced technology, like Ultraviolet-Visible-Near infrared (UV-VIS-NIR), Fourier Transform Infrared (FTIR) and Raman (micro)spectrometers, to measure various spectra, energy dispersive X-Ray fluorescence (micro-EDXRF) for non-destructive chemical analysis. Additionally, X-Ray diffraction, radiography and micro-computer tomography (µCT) techniques are used, mainly for pearl testing. Other activities include research on the origin of gemstones, public lectures and various courses and seminars designed for jewellers and other professionals, also in cooperation with the ‘Vakschool’ (the school for Gold- and Silversmiths and Jewellers) in Schoonhoven. There is a strong link between the laboratory, the museum collections, research, and public activities. The historical collections (for instance the gems donated by King William I) provide invaluable reference material for natural gemstones.
More information: http://science.naturalis.nl/nel (in Dutch) or http://science.naturalis.nl/zwaan
Peridot, aquamarine and sapphire, part of the gem collection donated by King William I. Natural gemstones in this collection provide invaluable reference material for the Netherlands Gemmological Laboratory.
Hanco Zwaan -
Head of the Laboratory
5th European Gemmological Symposium 15-16 June 2013 NEL & GGN Leiden, The Netherlands
5 Organisation
Gemmologisch Gilde Nederland/Dutch Gemmological Guild
The Dutch Gemmological Guild (Gemmologisch Gilde Nederland) was founded in 1994, by and for gemmologists and anyone with interest in gemstones. Goal: the advancing and promoting of knowledge and appreciation of gemstones and gemstone-jewellery. The GGN is an independent non-profit organization completely run by volunteers. The organization comprises of about 120 members including gemmologists, gemstone dealers, retailers and appraisers. The Guild (Gilde) already organized thirteen one-day symposia with renowned scientists from different European institutes/laboratories and three half day events with speakers presenting their lectures in Dutch. Throughout the year several workshops are organized. Some of them to exchange knowledge among ourselves and for other evenings speakers are invited. The Gemmologisch Gilde Nederland publish a quarterly magazine ‘Holland Gem’.
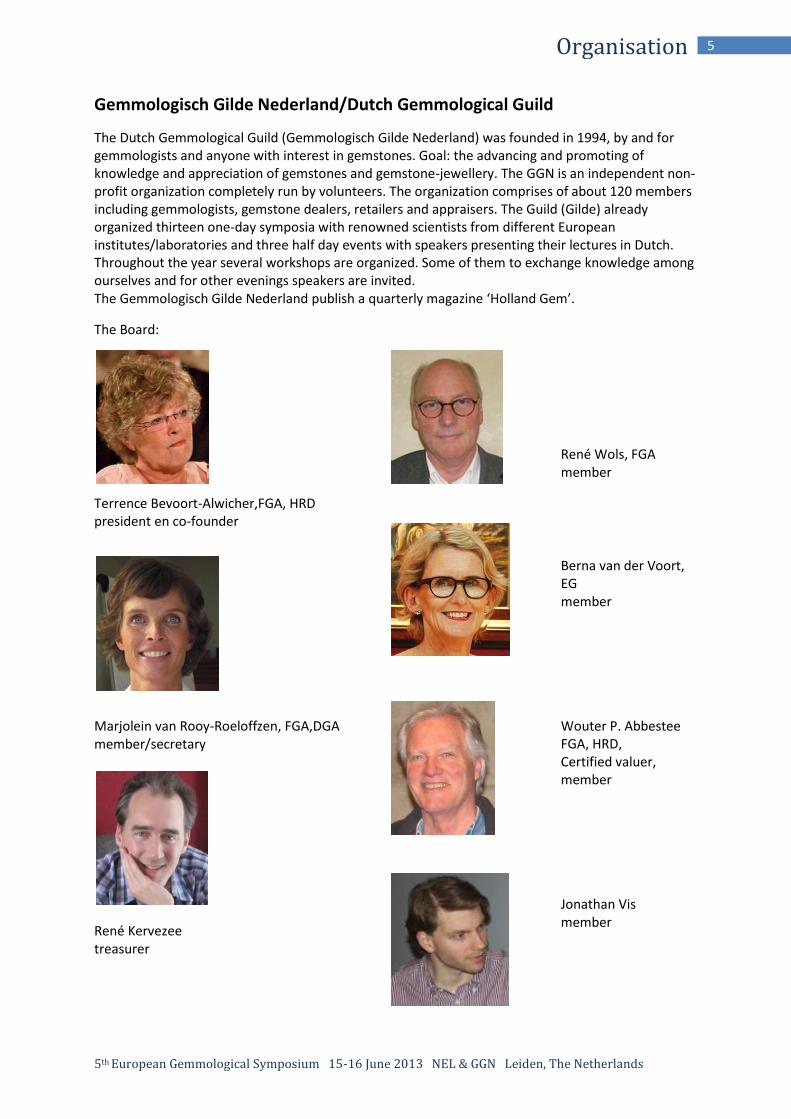
The Board:
Terrence Bevoort-Alwicher,FGA, HRD president en co-founder
Marjolein van Rooy-Roeloffzen, FGA,DGA member/secretary
René Kervezee treasurer
René Wols, FGA member
Berna van der Voort, EG EG member
Wouter P. Abbestee FGA, HRD, Certified valuer, member
Jonathan Vis member

5th European Gemmological Symposium 15-16 June 2013 NEL & GGN Leiden, The Netherlands
6 Programma Sunday 16 June 2013
10:00 Registration and coffee 10:45 Welcome and Introduction 10:50 Overview of Pearl testing: classic methods and new developments
Stefanos Karampelas (Switzerland)
11:25 Colour and Colour Modification of Non-transparent Quartz Ulrich Henn (Germany)
12:00 Useful Gemmological Data Sets from Deposit Specific Samples
Kenneth Scarratt (Thailand)
12:35 Lunch 13.35 Welcome back 13.40 Natural Green Diamonds
Thomas Hainschwang (Liechtenstein)
14.15 Element analytical and UV-Vis-NIR study of natural untreated spinels
from Vietnam in comparison to synthetics
Tobias Häger
14.50 Ordinary and Extraordinary Shapes of Diamond Crystals Emmanuel Fritsch (France)
15.25 Tea and coffee 15.55 Gemmology and Geology of Opal deposits
Australian and Ethiopian deposits compared Benjamin Rondeau (France)
16.30 Amber: Real, Fake and Coloured
Maggie Campbell Pedersen (United Kingdom) 17.00 Drinks 17.50 Close

5th European Gemmological Symposium 15-16 June 2013 NEL & GGN Leiden, The Netherlands
7 Speakers
Maggie Campbell
Pedersen
Emmanuel Fritsch
Tobias Häger
Maggie Campbell Pedersen is a Fellow of the Gemmological Association of Great Britain and an Associate of the British Institute of Professional Photography. For several years she has combined her qualifications and also her interest in animal conservation, to specialise in organic gem materials – those of plant or animal origin. ‘Organics’ have the added fascination of having been used world-wide, and of pre-dating the use of inorganic gems by many thousands of years. Maggie’s work includes photography, identifications, teaching, writing, and constant research into the various aspects of the subject. She is the author of Gem and Ornamental Materials of Organic Origin – a book devoted to the subject of organics, and editor of ‘Organic Gems’ – an online reference source and information centre similarly devoted entirely to this subject.
Dr. Emmanuel Fritsch, is a professor of physics at the university of Nantes in western France. He holds a geological engineering degree from the ENSG, Nancy, Eastern France, and a Ph.D. from the Sorbonne in Paris. He worked for nearly ten years at the Gemological Institute of America (GIA) in the USA, last as manager of GIA Research from 1992 to 1995. His research is currently conducted at the Institut des Matériaux Jean Rouxel (IMN-CNRS) in Nantes. Dr. Fritsch's interests range from advanced techniques applied to gemmology, to color in gems (especially diamonds), treated and synthetic gems, opals and pearls. He has authored over 280 articles and more than a dozen book chapters.
Dr. Tobias Häger studied mineralogy and obtained his Ph.D. at the University of Mainz, Germany. Since 1990 he works at the institute for geosciences in Mainz with a focus on gemstone research. He gives lectures at the University of Mainz and at the University of Applied Sciences in Idar-Oberstein. His main interests are gemstone enhancement and advanced instrumentation to identify treatments & synthetics. He is author of numerous articles and co-author of the Book Gemstone determination. Since 2013 Dr. Häger is managing the centre for gemstone research at the University of Mainz and its branch the 'Institute for Gemstone Research, Idar-Oberstein'.

5th European Gemmological Symposium 15-16 June 2013 NEL & GGN Leiden, The Netherlands
8 Speakers
Thomas Hainschwang
Ulrich Henn
Thomas Hainschwang is managing director and researcher at the Liechtenstein branch of GGTL Laboratories in Balzers/Liechtenstein. He founded the GEMLAB (Liechtenstein) Laboratory in 1996 and worked from 2005 to 2007 as research Gemmologist for the GIA (Gemological Institute of America) - at the time in Geneva - with main responsibility in coloured diamond research and analysis. From 2007 to 2013 he was working for GEMLAB (Liechtenstein) as the managing director of the lab. Mr. Hainschwang has developed and built several analytical research instruments in the past five years, including a 5 laser research grade photoluminescence/Raman system, and continues enhancing the capabilities of the analytical instruments at the laboratory with his inventions. The two high-tech laboratories GEMLAB (Liechtenstein) and GemTechLab merged in March 2011 to form GGTL Laboratories. Mr. Hainschwang is a multidisciplinary gemologist with specialization in diamond research and analysis. He has published many articles on various gem-related topics and has presented these topics in conferences around the world. Besides his role in the laboratory, Mr. Hainschwang is currently in the final phase of his PhD on type Ib diamonds at the University of Nantes, France.
Born 3 December 1957 in Idar-Oberstein, Germany. Study of Mineralogy and Gemmology at the Institute for Gemstone Research of the University of Mainz, Germany; Master of Science and PhD in Mineralogy. Managing director of the German Gemmological Association and Head of the German Gemmological Training Center, Member of the board of the German Foundation for Gemstone Research (DSEF). Delegate of the International Gemmological Conference (IGC)Delegate of the Federation of European Education in Gemmology (FEEG) (2000-2005 vice-chairman and chairman of the examination committee; 2006-2011 chairman). Author of gemmological books and various articles in international gemmological and mineralogical journals as well as trade magazines.

5th European Gemmological Symposium 15-16 June 2013 NEL & GGN Leiden, The Netherlands
9 Speakers
Stefanos Karampelas
Benjamin Rondeau
Kenneth Scarratt
Dr. Stefanos Karampelas is research scientist at Gübelin Gemological Laboratory in Lucerne, Switzerland. He has studied Geology and Mineralogy at the Aristotle University of Thessaloniki in Greece, working on garnets and tourmalines during his diploma. He then relocated to the University of Nantes in France to complete his masters in Geosciences, where he focused on the differentiation of natural from synthetic amethyst. He did a PhD on material physics studies studying pearls and its treatments in collaboration with the two aforementioned universities. He obtained also an advanced gemological diploma (DUG) from the University of Nantes on diamonds’ infrared spectroscopy. His research interests include advanced non-destructive techniques applied to gem materials. He has published numerous articles in scientific journals and he is frequently delivering lectures to scientific conferences and gemological meetings.
Dr. Benjamin Rondeau is assistant professor in geology and gemology at the University of Nantes, France. He holds a PhD in mineralogy and gemology from the French National Museum of Natural History. His current research focuses on the geology of gem deposits including for example opal, diamond and emerald. His other interests reside in the characterization of gem materials from new localities, development of spectroscopic techniques, new treatments and synthetics and crystal growth in nature. He is involved in the DUG teaching program, a Laboratory Gemology university diploma.
Kenneth Scarratt is Managing Director of GIA South East Asia and Director of the GIA Laboratory in Bangkok. Previously he was Laboratory Director of the AGTA Gemological Testing Center in New York City, Director of AIGS in Bangkok, and of GAGTL in London. He has published papers extensively in The Journal of Gemmology (UK), Gems and Gemology (USA) and many other journals.
He has delivered lectures to gemologists and traders in many countries including Australia, Bahrain, Brazil, Canada, China, Colombia, Dubai, England, France, Germany, Hong Kong, India, Israel, Italy, Japan, Philippines, Singapore, Thailand, Sri Lanka, and the USA. In addition to his work with diamond, ruby and sapphire, he has studied and visited pearl producing farms in several countries, including Australia, China, Philippines, Japan, Thailand, and Vietnam.

5th European Gemmological Symposium 15-16 June 2013 NEL & GGN Leiden, The Netherlands
10 Presentations
Overview of pearl testing; classic methods and new developments
Stefanos Karampelas
Gübelin Gem Lab
Maihofstrasse 102, 6006, Lucerne, Switzerland [email protected]
Nowadays, pearl testing can be separated into two major categories: pearl identification and cultured pearl grading. The major issue of pearl identification is to find whether the sample is natural or cultured; other issues are also important such as whether the sample is coming from a mollusk protected by international laws (e.g., CITES). On the other hand, cultured pearl grading includes the 'five S’s'; i.e., shape, size (includes the size of the samples as well as their nacre thickness -if the cultured pearls are with bead-), shade (includes body as well as secondary colors), shine (luster) and surface (for more information about the grading system see http://www.gubelingemlab.ch/PDF/GGL_Pearlbooklet_en.pdf). Issues such as whether the sample comes from a freshwater or saltwater mollusk, whether its color is natural or treated etc., are common in both categories (pearl identification and cultured pearl grading). A series of methods is important for pearl testing and is used in addition to basic gemological tools, such as a microscope and UV lamps: X-ray imaging (film and/or digital radiograph as well as sometimes X-ray computed tomography), with the capacity to observe luminescence under the X-rays (either by using a camera or by looking with the unaided eye through an X-ray absorbing, transparent glass), EDXRF for chemical analysis as well as UV-Vis-NIR and Raman (with capacity to acquire photoluminescence spectra) spectrometers. For cultured pearl grading, mastersets with different grades are also used. Gemological microscopes are useful to separate nacreous from non-nacreous samples and from imitation, as well as to determine whether the sample's surface was worked, polished etc. (Scarratt, 2011). The structures of non-nacreous samples observed under the microscope can sometimes give valuable tales about the host mollusk (Figure 1).
Figure 1: Structure due to the arrangement of calcitic prisms in natural
"scallop" pearl; i.e., natural pearl found within a bivalve from Pectinidae
family. Width of image: 1mm.

5th European Gemmological Symposium 15-16 June 2013 NEL & GGN Leiden, The Netherlands
11 Presentations
Additionally, drilled treated-color (natural and cultured) pearls can be identified by microscope if the samples are treated after drilling, as color concentrations are observed around the drill holes (Elen, 2001 & 2002). Luminescence reaction under ultraviolet lamps also helps to identify some treated-color samples (see again Elen, 2001 & 2002). Valuable clues for the identification of the host mollusk of some nacreous natural and cultured pearls are given by luminescence. For instance, most colored cultured pearls from Pteria sterna bivalve fluoresce red under long-wave UV light (Kiefert et al., 2004).
Separation of natural from cultured (nacreous) pearls, as well as nacre thickness measurement for cultured pearl grading, is based exclusively on (film or digital) radiography (see also some examples by Sturman, 2009). Different kinds of cultured pearls can be identified with this method: for instance, cultured pearls with bead, cultured pearls without bead, 'mabé cultured pearls', etc. (see Figure 2 for some examples). Sometimes, color-treated samples can be identified with this method. X-rays should however be used with care on cultured and natural pearls, as a high dose of radiation could affect their color (Scarratt, 2011). The last twenty years, cultivation methods have improved. As a result, in most cases radiographs in different directions are needed to identify the sample. Nowadays, using digital radiography is easier and quicker than film radiography in the past; even a series of radiographs around 360o using a digital sensor can be acquired within a short time (Hainschwang, 2011). Sometimes for pearl identification micro-computed tomography is needed (Figure 3; see Karampelas et al., 2010 for more examples). Systematic studies on natural and cultured pearls from known mollusks have shown that the host mollusk of the sample is playing an important role with regard to the internal structures of the sample.
Luminescence under X-rays is useful to identify the growth environment of natural and cultured pearls, i.e., freshwater versus saltwater; freshwater samples are reacting whereas saltwater samples remain inert (Hänni et al., 2005). However, some natural color freshwater samples remain inert under X-rays, on the other hand saltwater samples can show faint luminescence. Their growth environment can be further identified by the content of SrO and MnO measured with EDXRF (Gütmannsbauer & Hänni; 1994). It has been found that the SrO/MnO ratio is above 12 for saltwater samples and below 12 for freshwater samples (Karampelas & Kiefert, 2012). EDXRF can be also used for the identification of color treatments with inorganic dyes as well as the detection of coatings (Elen, 2001; Scarratt, 2011).
Figure 2: Digital X-radiographs of three cultured
pearls. Top left, round drilled saltwater cultured
pearl with bead (12.85-12.90 mm), nacre thickness
of about 2.3 mm; top right, button-shape undrilled
saltwater cultured pearl with bead (12.60-
12.65x11.35 mm), nacre thickness 2.1 to 2.7 mm.
Both samples are from the Pinctada maxima
mollusk. At the bottom, pear-shape partly-drilled
freshwater cultured pearl (8.45-8.55x9.00 mm),
without a bead, from Hyriopsis cumingi mollusk; a
dark line related to the tissue transplantation is
observed near the center of the sample.

5th European Gemmological Symposium 15-16 June 2013 NEL & GGN Leiden, The Netherlands
12 Presentations
For some nacreous samples, Raman spectroscopy can give valuable clues on their origin of color. For instance, natural-color freshwater cultured pearls from Hyriopsis sp. present bands due to polyenic pigments (parrodienes) whereas the equivalent treated-color presents different Raman bands depending of the treatment method used (see Fritsch et al., 2012 for some examples). Raman spectroscopy can also be used to identify if the non-nacreous pearls are aragonitic or calcitic; all gem quality nacreous pearls (natural and cultured) consist of aragonite. The combination of the Raman bands due to pigments and calcium carbonate (aragonite or calcite) can help to identify the host mollusk. For example, until today, natural-color 'scallop pearls' (i.e., found in a bivalve of the Pectinidae family) are the only gem quality pearls made of calcite and colored by parrrodienes, whereas natural-color "pen pearls" (i.e. found in a bivalve of Pinnidae family) are the only gem quality pearls made of calcite and colored by carotenoids (see Fritsch et al., 2012 and references therein). In most gemological laboratories, the Raman spectrometer is also used to acquire photoluminescence (PL) spectra. Meanwhile, on biogenic gems, PL spectroscopy should be acquired with precaution as high intensity lasers could damage the samples (Fritsch et al., 2012). PL spectra can give valuable clues on the pearl-producing mollusk. For instance, cultured pearls from Pteria sterna present pronounced bands on the orange-red part of the electromagnetic spectrum, at around 620, 650 and 680 nm; probably due to a kind of porphyrin (Kiefert et al., 2004). These bands are either absent or less intense in comparison to the cultured samples from other bivalves. Moreover, PL spectroscopy can help identify treated-color (natural and cultured) pearls as they present different spectra compared to their natural-color counterparts (Figure 4). Luminescence imaging can also give valuable information in pearl testing; such as identification of coatings, color-treatments etc. (Scarratt, 2011).
Diffuse reflectance UV-Vis-NIR spectroscopy is used for the identification of color treatments, as the pigments naturally present in the samples are giving different spectra compared to artificial pigments (Elen, 2001 & 2002 for some examples). Other treatments
Figure 3: Two micro-computed tomography images of a drop-shape partly-drilled natural pearl from
Pteria sp. bivalve; the three-dimensional model is shown, with on the left part of the model cut to see
internal structures using special software and on the right a two-dimensional slice of the same three-
dimensional model. Concentric growth structures (dark lines) are observed on both images and a
series of cracks/dried fissures (also dark) are observed on the right image.

5th European Gemmological Symposium 15-16 June 2013 NEL & GGN Leiden, The Netherlands
13 Presentations
used to improve the appearance (e.g. luster enhancement, bleaching) can be also identified by observing diffuse reflectance UV-Vis-NIR spectra (Scarratt, 2011).
Additionally, absorption at 700 nm, was observed in solely, but not all, samples from the Pinctada margaritifera bivalve (see Karampelas & Kiefert, 2012 and references therein).
Pearl testing keeps on improving: more issues recently appeared, such as identification of natural pearls from CITES protected species (e.g. found in Strombus sp.) as well as beads made from shells of mollusks protected by CITES (e.g., Tridacna sp.), new treatments, and new cultivation techniques. Experiments with new methods in combination with those previously mentioned are ongoing in order to shed further light.
References S. Elen (2001). Spectral reflectance and fluorescence characteristics of natural-color and heat-treated “golden” South Sea cultured pearls. Gems & Gemology, Vol. 37, No. 2, pp. 114-123. S. Elen (2002) .Update on the identification of treated “golden” South Sea cultured pearls. Gems & Gemology, Vol. 38, No. 2, pp. 156-159. E. Fritsch, B. Rondeau, T. Hainschwang, S. Karampelas, (2012). Raman spectroscopy applied to gemmology, in Applications of Raman Spectroscopy to Earth Sciences and Cultural Heritage (edited by J. Dubessy, F. Rull and M.-C. Caumon), European Mineralogical Union and Mineralogical Society of Great Britain & Ireland, Vol. 12, pp. 453-488. W. Gütmannsbauer, H.A. Hänni (1994). Structural and chemical investigations on shell and pearls of nacre forming salt- and freshwater bivalve mollusks. Journal of Gemmology, Vol. 24, No. 4, pp. 241-252. T. Hainschwang (2011).Three-dimensional X-ray radiography- A new technique or gemstone and pearl testing. InColor, Spring 2011, pp. 30-34. H.A. Hänni, L. Kiefert, P. Giese (2005). X-ray luminescence, a valuable test in pearl identification. Journal of Gemmology, Vol. 29, No. 5-6, pp. 325-329. S. Karampelas, J. Michel, M. Zheng-Cui, J.-O. Schwarz, F. Enzmann, E. Fritsch, L. Leu, M. S. Krzemnicki (2010). X-ray Computed Micro-Tomography Applied to Pearls: Methodology, Advantages, and Limitations. Gems & Gemology, Vol. 46, No. 2, pp. 122-127. S. Karampelas, L. Kiefert (2012). Gemstones and minerals, into Analytical Archaeometry: Selected Topics (edited by H.G.M. Edwards and P. Vandenabeele), Royal Society of Chemistry publishing, pp. 291-317. L. Kiefert, D.M. Moreno, E. Arizmendi, H.A. Hänni, S. Elen (2004). Cultured pearls from the Gulf of California, Mexico. Gems & Gemology, Vol. 40, No. 1, pp. 26-39. K. Scarratt (2011). Pearl identification - A practitioner's perspective. Gems & Gemology, Vol. 47, No. 2, pp. 117-119. N. Sturman (2009). The microradiographic structures on non-bead cultured pearls. GIA Thailand, Bangkok, November 21, www.giathai.net/pdf/The_Microradiographic_structures_in_NBCP.pdf [date accessed: Mar. 1, 2013].
Figure 4: Photoluminescence spectra of a natural-color light
gray (bottom spectrum) and a similar treated- color
freshwater cultured pearl (Hyriospis sp.). The natural-color
sample present a broad band centered at the red part of the
spectrum (about 680 nm) whereas the treated-color present
two bands to the yellow (at about 580 nm) and red (at about
650 nm) part. The spectra are acquired using a Raman
spectrometer with a 514 nm laser. The sharp bands from 520
to 550 nm are due to the Raman effect; the natural-color
sample presents numerous sharp, but less intense, additional
Raman bands as well as overtones due to parrodienes. Both
spectra are adjusted to the main Raman band of aragonite
and shifted for clarity.

5th European Gemmological Symposium 15-16 June 2013 NEL & GGN Leiden, The Netherlands
14 Presentations
Colour and Colour Modification of Non-transparent Quartz
Ulrich Henn
German Gemmological Association Idar Oberstein, Germany
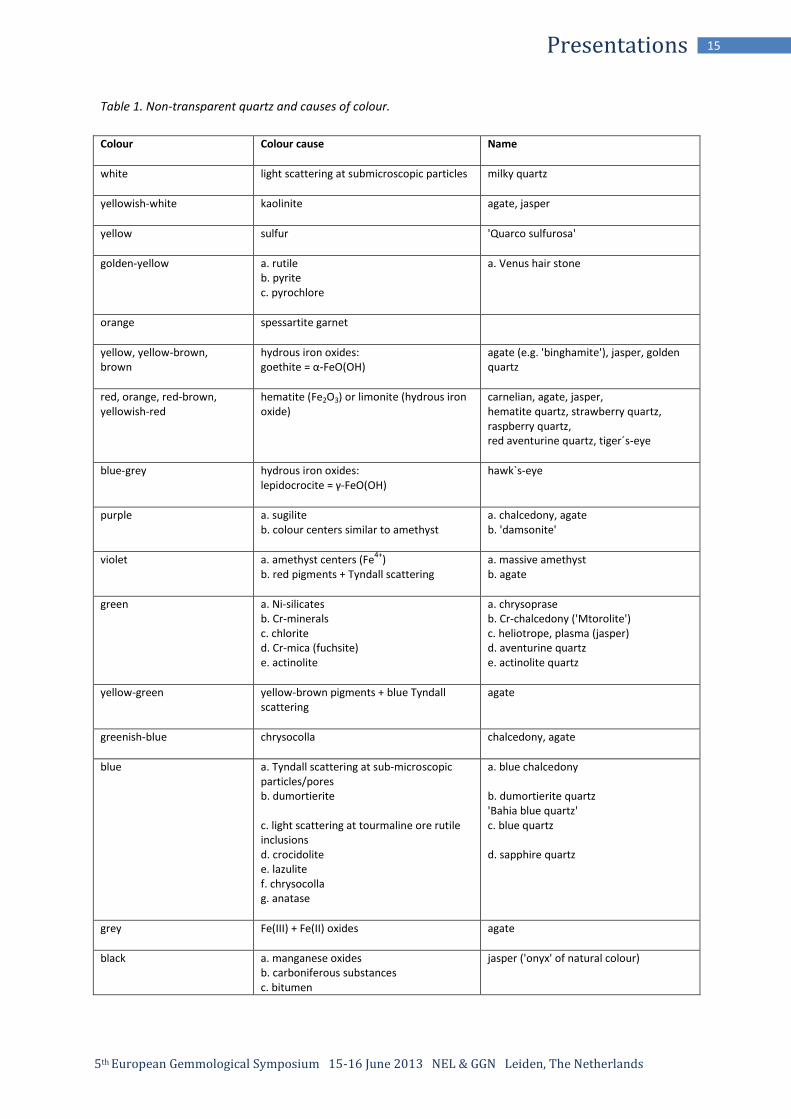
Quartz represents a surprising variety among gemstones in terms of its macro-crystalline specimens, its micro- to crypto-crystalline structures, and particularly its wide range of colours. General causes of the varieties of quartz colours can be divided into three groups: 1. colour centers 2. optical effects 3. inclusions. In transparent macro-crystalline quartz colour is most commonly due to colour centers. In non-transparent quartz colours are generally caused by inclusions and in a few cases by optical effects, especially light scattering. Non-transparent quartz species belong to massive macro-crystalline quartz or micro- to crypto-crystalline quartz aggregates. Light scattering is responsible for the diffuse appearance of milky quartz and the grey to blue colour of chalcedony. The so-called ‘Tyndall scattering’ is caused by tiny fluid inclusions and particles, respectively. However, colour in non-transparent quartz is mainly due to inclusions of foreign mineral substances (Figure 1-4). The distribution of such inclusions varies from coarse to thinly dispersed. Table 1 summarizes the main colours and their causes of non-transparent quartz and the related variety and trade names, respectively.
Fig. 1. Red chalcedony coloured by hematite inclusions (Magnification 40x).
Fig. 2. Aventurine quartz: the green colour is caused by fuchsite inclusions (Magnification 30x).
5th European Gemmological Symposium 15-16 June 2013 NEL & GGN Leiden, The Netherlands
15 Presentations
Table 1. Non-transparent quartz and causes of colour.
Colour Colour cause Name
white light scattering at submicroscopic particles milky quartz
yellowish-white kaolinite agate, jasper
yellow sulfur 'Quarco sulfurosa'
golden-yellow a. rutile b. pyrite c. pyrochlore
a. Venus hair stone
orange spessartite garnet
yellow, yellow-brown, brown
hydrous iron oxides: goethite = α-FeO(OH)
agate (e.g. 'binghamite'), jasper, golden quartz
red, orange, red-brown, yellowish-red
hematite (Fe2O3) or limonite (hydrous iron oxide)
carnelian, agate, jasper, hematite quartz, strawberry quartz, raspberry quartz, red aventurine quartz, tiger´s-eye
blue-grey hydrous iron oxides: lepidocrocite = γ-FeO(OH)
hawk`s-eye
purple a. sugilite b. colour centers similar to amethyst
a. chalcedony, agate b. 'damsonite'
violet a. amethyst centers (Fe4+
) b. red pigments + Tyndall scattering
a. massive amethyst b. agate
green a. Ni-silicates b. Cr-minerals c. chlorite d. Cr-mica (fuchsite) e. actinolite
a. chrysoprase b. Cr-chalcedony ('Mtorolite') c. heliotrope, plasma (jasper) d. aventurine quartz e. actinolite quartz
yellow-green yellow-brown pigments + blue Tyndall scattering
agate
greenish-blue chrysocolla chalcedony, agate
blue a. Tyndall scattering at sub-microscopic particles/pores b. dumortierite c. light scattering at tourmaline ore rutile inclusions d. crocidolite e. lazulite f. chrysocolla g. anatase
a. blue chalcedony b. dumortierite quartz 'Bahia blue quartz' c. blue quartz d. sapphire quartz
grey Fe(III) + Fe(II) oxides
agate
black a. manganese oxides b. carboniferous substances c. bitumen
jasper ('onyx' of natural colour)

5th European Gemmological Symposium 15-16 June 2013 NEL & GGN Leiden, The Netherlands
16 Presentations
A second important section of colours in non-transparent quartz covers artificial processes like staining. Agate and jasper of porous constitution are commercially used for dying until today. Especially porous grey Brazilian agate is used for various staining techniques to produce blue, red, yellow and green colours as well as black ('onyx'). Jasper with high porosity due to weathering, was used to produce a dark blue colour similar to lapis lazuli by staining. Today historic staining techniques are still used, like the sugar-acid process to produce a black colour or mineral pigments like iron oxide, copper carbonate, or traditional chromium, cobalt or nickel salts. Current processes mainly used in Brazil employ organic colorants. References
Fritsch,E. & Rossman, G.R., 1988. An update on color in gems. Part 3.- Gems & Gemology 24, 81-102. Lenz, G., 1999. Die Entstehung der Farbe in Achaten.- Aufschluss 50, 343-348. Rykart, R., 1989. Quarz-Monographie.- Thun, Ott Verlag.
Fig. 3. Blue quartz coloured by lazulite inclusions (Magnification 40x).
Fig. 4. Black jasper ('onyx' of natural colour) coloured by dendritic carboniferous substances (Magnification 50x).

5th European Gemmological Symposium 15-16 June 2013 NEL & GGN Leiden, The Netherlands
17 Presentations
Useful Gemmological Data Sets from Deposit Specific Samples
Kenneth Scarratt
Gemological Institute of America [email protected]
Key words sample integrity, trace element chemistry, origin determination, ruby, sapphire, emerald, pearl. The determination of geographic origin for coloured stones plays an increasingly important role in gemstone commerce. The skill sets and knowledge that develops from research into meeting this industry need also enhances the abilities of gemmologists to truly understand the materials being examined. Through this, data may be provided that better stand the tests of time. However, the reliability of any data collected is dependant not only on the application of proper analytical standards but, very importantly, also on sample integrity – the history of the sample has to be detailed and accurate. For the most part gemmology has traditionally relied upon ‘gifted’ or ‘loaned’ specimens for research which is a practice that has its place in the evolution of this multi-disciplined science and indeed has served as bedrock for further advancement. Certainly given the limited financial resources of gem laboratories little could have been achieved in the past were it not for the generosity of traders, enthusiasts and museums, in making these loans. As gemmology advances though a new breed of gemmologist is fast evolving – the field gemologist – and it has become important to embrace this change and compliment it with internal checks and balances within a scrupulously controlled collection environment that brings together totally reliable stone libraries from which researchers may select specimens and collect data with the available state of the art instrumentation, and more importantly return to exactly the same specimens in the coming decades as techniques improve or change. It is from embracing this concept that the research teams from the various GIA locations have been able to observe and record many useful data sets some of which might be considered out of the main stream in teams of origin or treatment determinations. This abstract outlines just a few of the interesting observations within the presentation. Prior to the discovery that Beryllium was being used to artificially colour or lighten corundum via a diffusion process this element played little to no role in the understanding of this gem material and yet today its presence within a ruby or sapphire can be vital in determining that a treatment has or has not taken place (providing that we can determine a natural or artificial presence) or points towards a particular geographic origin. Gemmological laboratories have become increasingly reliant on trace element data in origin determination, particularly with ruby. However, ruby from Tajikistan is proven to have an identical trace element composition to rubies from Burma and when these are treated by flux assisted heating processes the challenges in separating the two locations can be significant. Examples of this situation are presented.

5th European Gemmological Symposium 15-16 June 2013 NEL & GGN Leiden, The Netherlands
18 Presentations
Some of the inclusion scenes present in rubies from the abundant deposits in Mozambique may be similar to those seen in rubies from Burma, a problem that is exacerbated when the former material is heated at low temperatures to bring the apparent colour closer to those from Mogok. Here trace element chemistry is an important factor in any testing scenario. A spectacular example of how errors can be made if trace element chemistry is not recorded is given. For many decades it was thought that some blue sapphires from Burma (several types of blue sapphire being available from this location) were relatively unique in their appearance, colour and inclusion scenes, until similar material from Madagascar came to market over the last decade, and now material from two new Sri Lankan deposits is further clouding this area of origin determination. Specimens from both Kataragama and Elahera are close matches with Burmese blue sapphires. Further, a few interesting rubies from Elahera have been collected that are similar to Burmese (Mogok) material. Interesting example data sets are presented that help in the understanding of this situation. Rubies and sapphires from Didi, Madagascar, also have characteristics similar to those normal for material from other locations, but one of the most intriguing observations and yet to be fully resolved is the extraordinary high ppm (over 1000) of Ti present in some specimens. Still in Madagascar, it was discovered that some blue sapphires, particularly from Ilakaka contain beryllium naturally, however the association of Be with ‘clouds’ inside these stones and the correlation with Ta and Nb also within the clouds has allowed for a distinction to be made between naturally occurring Be and that which may have been diffused in artificially – to alter colour appearances. The presence of Be in these clouds within sapphires from Ilakaka also functions as an indicator of origin for these stones. Another blue sapphire that contains Be is the zoned deep blue sapphires from Afghanistan that contain a profusion of elongated zircon as well as tourmaline inclusions similar to those seen in some Kashmir blue sapphire – the presence of Be setting them apart. Example data sets showing these concerns are presented. Emeralds from Zambia (Kafubu area and also the reported deposit at Muscashi), Afghanistan (Panjsher) and China (Davdar) all may contain three-phase inclusions that are similar in appearance to those that often appear in emeralds from Colombia (Muzo, Chivor, La Pita, Coscuez, Penas Blancas). Nevertheless, much educational material still indicates that three-phase inclusions in emerald are indicative of Colombian origin only. Within the laboratory several different population plotting scenarios involving Cs, Li, Ga, Fe and K, alongside UV/visible and IR spectra allow for an origin to be determined between emeralds containing these multiphase inclusions. A great challenge for the modern laboratory gemmologist is evaluating, and corroborating the ‘numbers’ produced by various instruments. One standard method that ensures that the numbers produced by LA-ICP-MS or EDXRF are within the ‘ball park’ of reality is to compare the numbers from one instrument with the other, at least the detectable numbers. This can give some degree of comfort.

5th European Gemmological Symposium 15-16 June 2013 NEL & GGN Leiden, The Netherlands
19 Presentations
Another method is by calculating the anticipated colour appearance from the absorption spectrum, providing one has the relevant absorption cross-section and trace element concentrations in ppma for the particular material. A few examples showing how this impacts confidence in results are given.
Sample integrity is vitally important in all gemmological research including that involving natural and cultured pearls. Whatever the difficulties in establishing a high degree of reliability there is nothing more satisfying than presenting results that have well established baselines. For pearl, this involves the same strict controls and record-keeping that used for gemstones; however, one also needs to record the exact positions of the pearls within the sacs in the molluscs at the time of recovery, keeping both the pearls and the shells in safe storage to ensure that on-going research is not tarnished. A very brief insight into some of the definitive structures recorded for both natural and cultured pearls concludes this presentation.
Figure 1: Zircon inclusions in a sapphire from Afghanistan.

5th European Gemmological Symposium 15-16 June 2013 NEL & GGN Leiden, The Netherlands
20 Presentations
Figure 2: Flux healed fractures in a heated ruby from Tajikistan.
Figure 4:Rubies collected from Elahera Sri Lanka have a similar inclusion scene to that of rubies from Burma (Mogok). 32x magnification, fibre glass illumination.
Figure 3: Three-phase inclusions in an emerald from Afghanistan.
Figure 5: A natural mantle pearl (left in mantle still within the natural sac), a bead cultured pearl (centre) and a non-bead cultured pearl (to the right of the bead cultured pearl) within a single P. maxima shell.

5th European Gemmological Symposium 15-16 June 2013 NEL & GGN Leiden, The Netherlands
21 Presentations
Natural green diamonds
Thomas Hainschwang a, George Bosshart† b, Franck Notari c,
Walter Balmer d, Vera Hammer e
a GGTL Laboratories, Gnetsch 42, Balzers, Liechtenstein. [email protected]
b Mythenstrasse 20, Horgen, Switzerland
c GGTL Laboratories, 4bis route des Jeunes, Geneva, Switzerland
d Balmer Laird, Bern, Switzerland
e NHM Vienna, Burgring 7, Vienna, Austria
Facetted green diamonds of natural colour are amongst the most valuable gemstones on this planet, directly after red and blue diamonds. With the exception of some chameleon diamonds that may be practically green, diamonds of green tint generally owe their colour to irradiation related defects, either through irradiation alone or through irradiation plus annealing and/or post-growth plastic deformation plus annealing. The most common defects responsible for the green colour are GR1 (ZPL 741.2 nm) and H3 (ZPL 503.2 nm). Of these, GR1 alone causes a blue colour via a true absorption process, but in the presence of extended vacancy defects that generally occur in irradiated diamonds, the combination of GR1 and continuum absorption from the extended vacancy defects results in green coloration. H3 does not cause green colour via absorption but via its strong emission ranging from 503.2 nm (ZPL) all the way to 700 nm (vibronic sidebands); the ensemble of this broad band emission results in a yellowish green photoluminescence (PL). Natural post-growth irradiation arises most likely from radioactive fluids. By far most green diamonds have only a surface coloration induced by alpha particles, which have very low penetration depth in diamond. Such surface coloured green diamonds are not particularly rare and the only way to keep them green after faceting is by keeping as many green stains on the girdle or pavilion as possible and avoiding that the stains turn brown by the heat on the wheel. This is only feasible via very slow cutting in order to keep the stone below approx. 300°C. The green colour of such stones is only caused by reflections from the stains on the girdle. In contrast to such 'green skin diamonds' green diamonds with true body colour are extremely rare; they are thought to be coloured by natural gamma radiation, a type of radiation that is very inefficient in the coloration of diamond: samples irradiated for several years in a Co60 gamma irradiation source by the authors did not develop any visible green colour and GR1 was just detectable by PL spectroscopy. In comparison it takes only a few hours to produce strong green colour in diamond via electron or neutron irradiation.

5th European Gemmological Symposium 15-16 June 2013 NEL & GGN Leiden, The Netherlands
22 Presentations
The problem with GR1 related green colour in diamond is that it can easily be reproduced artificially via electron or neutron irradiation and that H3 related green colour can be reproduced in any type Ia diamond with A aggregates via irradiation and annealing at relatively low temperature (600 – 800°C), or by HPHT treatment of brown type I diamonds. Of these treated diamonds the ones causing the biggest headache since now about 70 years are the ones coloured by radiation only: while early particle accelerators produced only surface coloration, the use of accelerated electrons permitted diamonds to be coloured much more deeply and finally with neutrons that were commercially available via nuclear reactors from the 1950’s diamonds could be easily coloured evenly throughout their volume. Prior (1905) to the invention of particle accelerators and reactors the only way to irradiate a diamond was via radioactive salts, usually radium salts; such treated diamonds turned radioactive, and that is what they still are today, hence they are easily recognized using e.g. a Geiger-Müller counter. Now the unsolved problem is distinguishing all naturally irradiated from laboratory irradiated diamonds. While there are many laboratory reports out there for “natural colour” green diamonds, their reliability is generally low, since there is simply not enough evidence that support a scientific conclusion that a diamond is of natural GR1 related colour. It must be mentioned that with exception of irradiation-related colour distribution not a single criterion for the identification of natural green diamond has ever been published in a scientific journal. Even following the cutting process from the rough to the cut gem is in no way sufficient since first of all a rough can be easily treated and treating a diamond in between each manufacturing step is also possible.
Figure 1. A historical Indian green diamond of 1.28 ct from the NHM Vienna, dated 1806. Photo T. Hainschwang.

5th European Gemmological Symposium 15-16 June 2013 NEL & GGN Leiden, The Netherlands
23 Presentations
In consequence, the only green diamonds in existence that have unambiguously natural green coloration are those that have been kept in museums without interruption and that date prior to at least 1930, keeping in mind Radium treatments that were performed much earlier. This situation leads to strange developments such as witnessed by fancy color diamond dealers that went many times with the same stone to the lab of their choice in order to get a 'natural fancy color diamond' report. While scientifically indefensible, financially speaking this type of persistence is very rewarding, as a green diamond declared as 'undeterminable' is worth up to 200 times less than the same stone with mention 'natural fancy color'. In order to resolve this unbearable situation, the final goal of this study is to define unambiguous parameters and criteria necessary to determine whether a stone is of natural or of treated colour (if possible) and to demonstrate under what circumstances the origin of colour cannot be determined. This presentation gives an insight into the latest research performed on historical green diamonds and on treated diamonds by the authors, in order to continue the green diamond research that was started by George Bosshart in the 1980’s. This work, which was started in 2010 together with George, is the continuation of George’s lifework, since he sadly passed away in early 2012.
5th European Gemmological Symposium 15-16 June 2013 NEL & GGN Leiden, The Netherlands
20 Presentations
Element analytical and UV-Vis-NIR study of natural untreated spinels from Vietnam in comparison to synthetics
Häger, T.1, Hauzenberger, C.2, Lehmann, C.,1 Zimmer, D.1, Nguyen Ngoc Khoi 3,5, Duong Anh Tuan4,5, Le Thi-Thu Huong2 & Hofmeister, W.1
1 Centre of Gemstone Research, Johannes Gutenberg-University Mainz, 55099 Mainz, Germany
[email protected] 2 Institute for Earth Sciences, Karl-Franzens-University Graz, A8010, Graz, Austria
3 Faculty of Geology, Hanoi University of Science, Vietnam National University, Hanoi, Vietnam 4 Institute of Material Sciences, Vietnam Academy of Sciences & Technology, Hanoi, Vietnam
5 DOJI Gold & Gems Group, Hanoi, Vietnam
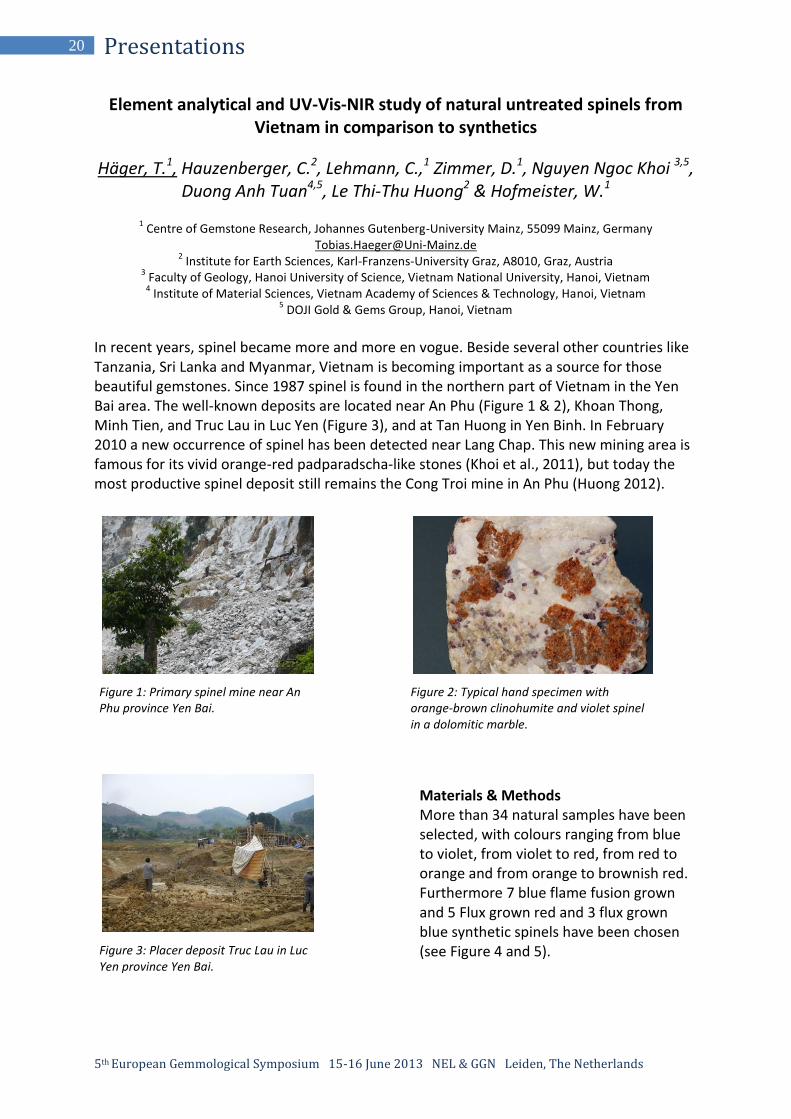
In recent years, spinel became more and more en vogue. Beside several other countries like Tanzania, Sri Lanka and Myanmar, Vietnam is becoming important as a source for those beautiful gemstones. Since 1987 spinel is found in the northern part of Vietnam in the Yen Bai area. The well-known deposits are located near An Phu (Figure 1 & 2), Khoan Thong, Minh Tien, and Truc Lau in Luc Yen (Figure 3), and at Tan Huong in Yen Binh. In February 2010 a new occurrence of spinel has been detected near Lang Chap. This new mining area is famous for its vivid orange-red padparadscha-like stones (Khoi et al., 2011), but today the most productive spinel deposit still remains the Cong Troi mine in An Phu (Huong 2012).
Materials & Methods More than 34 natural samples have been selected, with colours ranging from blue to violet, from violet to red, from red to orange and from orange to brownish red. Furthermore 7 blue flame fusion grown and 5 Flux grown red and 3 flux grown blue synthetic spinels have been chosen (see Figure 4 and 5).
Figure 1: Primary spinel mine near An Phu province Yen Bai.
Figure 2: Typical hand specimen with orange-brown clinohumite and violet spinel in a dolomitic marble.
Figure 3: Placer deposit Truc Lau in Luc Yen province Yen Bai.

5th European Gemmological Symposium 15-16 June 2013 NEL & GGN Leiden, The Netherlands
25 Presentations
The flux grown synthetics have been selected because of their inverse spinel amount (Magnesium is on the Aluminium Position in the crystal structure and vice versa) and the flame fusion grown spinels, because of its defect spinel content (in defect spinels the Mg to Al ratio is not 1:2. Aluminium exceeds the 1:2 ratio and the additional charge is compensated by Magnesium vacancies). For spectroscopic investigations plane parallel plates have been produced. For major and minor elements the Electron Probe Micro Analysis (EPMA) has been selected and for minor and trace elements the Laser Ablation-Inductive Coupled Plasma-Mass Spectroscopy (LA-ICP-MS). Aluminium, determined with EPMA, was used as internal standard, and NIST612 as standard glass for drift correction and NIST 610 and BCR as unknown samples. The UV-Vis-NIR spectra were recorded with a Zeiss AxioImager A2m microscope. Attached were two spectrometers from the company J&M (Germany). The first diode array spectrometer (TIDAS S-CCD) is working from 200-980 nm (50000-10204 cm-1) with a spectral resolution of 0.75 nm and the second (TIDAS S900 with an InGaAs-detector) is working from 900-1600 nm (11111-6250cm-1) with a resolution of 2.8 nm. Each spectrum was recorded with 20 scans. Results – red spinel Unfortunately no natural sample with just one cause of colour has been found in the sample set. To eliminate the influence of the V and Fe in red spinels a sample (sp1d) with the highest Cr/V ratio (48) and a sample (sp2c) with a lower Cr/V ratio (13,5) was chosen. Luckily these two samples contained a similar V/Fe-ratio, but unfortunately different V content. To solve this problem and to be able to compare the spectra of both samples, the following formula AVanadium_calc=(AVanadium_meas*cVanadium_calc*tcalc)/(cVanadium_meas*tmeas) was deduced from the Bouguer-Lambert-Beer-Law (A=absorbance, c=the amount of the element and t=sample thickness). Due to the fact, that the absorption coefficient was used (absorbance divided by the sample thickness), the sp2c spectrum (AVanadium_meas) was just multiplied by the factor 0.73 (cVanadium_calc/cVanadium_meas). The resulting spectrum displays the same V and a quiet similar Fe-content in comparison to sp1d. This calculated spectrum was subtracted from spectrum sp1d. The difference shows a 'pure' Chromium spectrum (Figure 6).
Figure 4: A part of the flame fusion grown synthetic spinels (oval) of different shades of blue, 1 red flux grown and 3 blue flux grown synthetic spinels.
Figure 5: A part of the analyzed natural, untreated samples from Vietnam.

5th European Gemmological Symposium 15-16 June 2013 NEL & GGN Leiden, The Netherlands
26 Presentations
The Peak maximum at 391 nm occurs in all spectra at the same position (see Table 2). The shoulder around 410 nm differs slightly for the V3+ spectrum and all three differ in the Peak around 540nm. Only natural Cr3+ containing samples do show a shoulder around 307 nm. The shoulder around 307 nm, the Peak maximum around 540 nm and the Peak ratio of the maxima around 391 and 540 nm are therefore a useful tool to differentiate between natural and synthetic flux grown samples and to differentiate between Cr3+ and V3+. In accordance with Reed (1971), the shoulder doesn’t occur in flame fusion grown synthetic stoichiometric Cr3+ doped spinels. This study seems to indicate that with increasing inverse spinel content the shoulder at 307 nm disappears. Vanadium in small amounts is leading to an orange red, but with increasing Vanadium content the colour turns to brownish red. Typical samples can be seen in Figure 5 in the third row from above, the first, second and third spinel from the left side. sample V Cr Fe Calc. Cr3+ 307 391 412 536
Sp1d 240.97 11723.96 3074.35 Calc. V3+ - 391 408 539
Sp2c 331.59 4501.55 3624.20 Flux Cr3+ - 391 413 547
Sp3b 1893.82 1603.33 1049.58
Sp1b 242.60 8090.46 3679.41
500 750 1000 1250 1500
0
5
10
15
20
25
20000 13333 10000 8000 6667
wavenumber (cm-1)
ab
so
rptio
n c
oe
ffic
ien
t (c
m-1)
wavelength (nm)
sp1d
sp2c
sp1c-sp2c*0,73
Syn. Flux with Cr3+
Fe2+
tetra.
transitions of Cr3+
octa.
500 750 1000 1250 1500
0
5
10
15
20000 13333 10000 8000 6667
Fe2+
tetra.-transitions
wavenumber (cm-1)
ab
so
rptio
n c
oe
ffic
ien
t (c
m-1)
wavelength (nm)
sp3b
sp1b
sp3b-sp1b*0.2
V3+
-transitions
Figure 6: Spinel sp1d shows a spectrum dominated by Cr
3+. Sp2c has a similar V/Fe ratio as sp1d. To
eliminate the V- and Fe-content out of the spectra sp2c was multiplied by the factor 0.73 and afterwards subtracted from sp1c. The difference displays the 'pure' Cr
3+-Spectrum. Additionally a Cr
3+ containing
Flux grown sample is shown.
Figure 7: Sample 3b has the highest V/Cr-ratio and a similar Cr/Fe ratio as sample sp1b. To eliminate the Chromium content in the spectrum sp1b was multiplied by 0.2 and afterwards subtracted from spectrum sp3b. The resulting difference shows a 'pure' V
3+ in spinel.
Table 1: V, Cr, Fe content of sample sp1d, sp2c, sp3b and sp1b. All values in ppm by weight.
Table 2: Peak maxima in nm determined out of calc. Cr
3+, calc. V
3+ and the Flux grown synthetic Cr
3+
containing sample in Fig. 5.

5th European Gemmological Symposium 15-16 June 2013 NEL & GGN Leiden, The Netherlands
27 Presentations
Results – blue spinel Spectrum 'natural Fe blue spinel' in Figure 8 displays only Fe2+ transitions in tetrahedral and octahedral sites (assignments Dickson & Smith 1976). Spectrum 'Co-Flame fusion' shows a pure Co2+ diagram without any calculation (because of its low Fe content, see Table 3), while in spectrum 'natural Co-spinel' and in the synth. Flux grown spinel the Fe content has been eliminated in the same way as described previously for V. All resulting Cobalt spectra are quite identical. Just the peak intensity ratio of the peak at 580 nm / 594 nm shoulder seems to be different.
Table 3: Fe content (EPMA ppm by weight FeO) and Co content (LA-ICP-MS ppm by weight Co) of the samples in Figure 5.
Sample no. FeO Co Blue Flux 1 2280 643 3090 396 Flame fusion b.d 517 nat. Fe blue 39260 18 nat. Co blue 15160 81 sp7b 29180 24 Table 4: Approximated peak maxima (nm) of the respective cations: Co
2+ in spinel:
550, 580, shoulder 594, 624, shoulder 635 Fe2+ in tetra. site: 371, 386, 458, 475 shoulder, 515 shoulder, 555, 574 shoulder, 632, 661 Fe2+ in octahedral site: 930
In Figure 5, in the upper first row, spinel 1, 2 and 3 from the left side, are coloured predominantly by Fe2+, while Spinel 4, 5 and 6 are predominantly coloured by Co and the rest of the first row again by Fe2+. References Dickson, B. L. & Smith, G. (1976): Low-temperature optical absorption and Mössbauer spectra of staurolite and spinel. Canadian Mineralogist Vol. 14, 206-215. Huong, L. T.-T., Häger, T., Hofmeister, W., Hauzenberger, C. Schwarz, D., Long, P.V., Wehrmeister, W. Khoi, N.N. & Nhung, N. T. (2012): gemstones from Vietnam: An update. Gems & Gemology (in Press). Khoi N.N., Sutthirat C., Tuan D.A., Nam N.V., Thuyet N.T.M., Nhung N.T. (2011) Ruby and sapphire from the Tan Huong–Truc Lau area, Yen Bai Province, northern Vietnam. G&G, Vol. 47, No. 3, pp. 182–195. Reed, J. S. (1971): Optical absorption spectra of Cr
3+ in MgO * Al2O3 – 3.5 Al2O3 spinels. J. of the American
Ceramic Society Vol. 54, 202-204.
400 600 800 1000 1200
0
2
4
6
8
10
12
14
25000 16667 12500 10000 9090
Fe2+
tetra.
Fe2+
tetra.
Fe2+
tetra.
Fe2+
tetra.
wavenumber (cm-1)
ab
so
rptio
n c
oe
ffic
ien
t (c
m-1)
wavelength (nm)
nat. Fe blue spinel
Co-Flame fusion
nat. Co-spinel - Fe spinel
Calc Co-Flux
Fe2+
octa.
Co2+
Figure 8: Spectra of a natural blue spinel with Fe, flame fusion grown synthetic with Co, Flux grown syn. Co spinel corrected by the Fe content and nat. Co bearing spinel corrected by the Fe content.

5th European Gemmological Symposium 15-16 June 2013 NEL & GGN Leiden, The Netherlands
28 Presentations
The ordinary and extraordinary shapes of diamond crystals
Emmanuel Fritsch1, Benjamin Rondeau2, Ichiro Sunagawa † 3, Moreton Moore4, Aurélien Delaunay5
1Institut des Matériaux Jean Rouxel (IMN) and
University of Nantes, Nantes, France [email protected]
2University of Nantes, Nantes, France
3Tokyo, Japan
4Royal Holloway University of London, Egham, Surrey, United Kingdom
5LFG, Paris, France
Diamond morphology is of great interest to geologists, physicists, diamantaires and jeweler-gemmologists. Not only does it relate to how a stone can be faceted, it also provides information on the growth history of the crystal. Additionally, the recent apparition of gem synthetic diamonds on the world’s market has brought extra attention to this topic, as one category of criteria to separate natural from synthetic diamonds is based on crystal growth morphology. Simple observations of the outside shape of crystals have been complemented by X-ray or luminescence topographs, which show the successive growth episodes and their morphology. Such studies have revealed three different growth morphologies for natural diamonds containing gem portions: octahedral, cuboid and fibrous: Octahedral growth is found in both natural and synthetic diamonds, and is the most common growth morphology of natural diamonds. However, perfect octahedra are rare in nature. They grew in a solution by a spiral growth mechanism around a screw dislocation under very low supersaturation. In section, they show approximate square growth features (figure 1).
Fibrous growth forms opaque fibrous aggregates. The growth orientation of the fibers is the (111) direction, so it could be considered as a special variety of octahedral growth. It is due to a large supersaturation of carbon and/or the presence of numerous inclusions. It is only rarely gem quality. However, it can overgrow gem diamonds to form 'coated crystals' or 'speculative rough' so some apparently fibrous crystals are a source of gem diamonds.
Cuboid growth is not growth along cubes faces, but along a more or less undulating surface of mean orientation corresponding to a cube face (hence the name; figure 2). Cuboid growth is found in natural diamonds only, and its genesis is not well understood.

5th European Gemmological Symposium 15-16 June 2013 NEL & GGN Leiden, The Netherlands
29 Presentations
Figure 1: Typical DiamondView image of regular octahedral growth in gem diamond;
Photo LFG.
Figure 2: Scanning electron micrograph of a typical cuboid diamond from Central African
Republic.
5th European Gemmological Symposium 15-16 June 2013 NEL & GGN Leiden, The Netherlands
30 Presentations
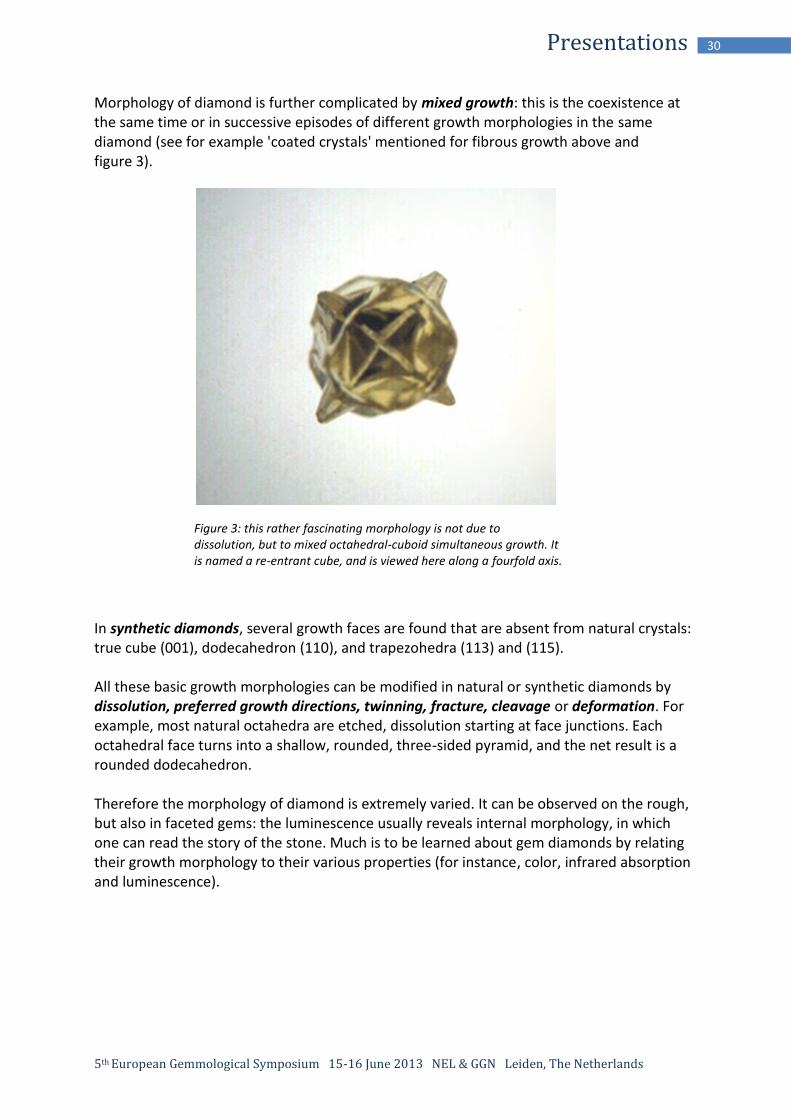
Morphology of diamond is further complicated by mixed growth: this is the coexistence at the same time or in successive episodes of different growth morphologies in the same diamond (see for example 'coated crystals' mentioned for fibrous growth above and figure 3).
In synthetic diamonds, several growth faces are found that are absent from natural crystals: true cube (001), dodecahedron (110), and trapezohedra (113) and (115). All these basic growth morphologies can be modified in natural or synthetic diamonds by dissolution, preferred growth directions, twinning, fracture, cleavage or deformation. For example, most natural octahedra are etched, dissolution starting at face junctions. Each octahedral face turns into a shallow, rounded, three-sided pyramid, and the net result is a rounded dodecahedron. Therefore the morphology of diamond is extremely varied. It can be observed on the rough, but also in faceted gems: the luminescence usually reveals internal morphology, in which one can read the story of the stone. Much is to be learned about gem diamonds by relating their growth morphology to their various properties (for instance, color, infrared absorption and luminescence).
Figure 3: this rather fascinating morphology is not due to dissolution, but to mixed octahedral-cuboid simultaneous growth. It is named a re-entrant cube, and is viewed here along a fourfold axis.
5th European Gemmological Symposium 15-16 June 2013 NEL & GGN Leiden, The Netherlands
31 Presentations
Gemmology and geology of precious opal deposits; comparison of Australian versus Ethiopian deposits
Benjamin Rondeau1, Francesco Mazzero2, Dereje Ayalew3, Boris Chauviré1, Yves
Bodeur1, Emmanuel Fritsch4, Jean-Pierre Gauthier5, Bénédicte Cenki-Tok6
1 University of Nantes, Laboratoire de Planétologie et Géodynamique, UMR-CNRS 6112,
2 rue de la Houssinière, BP92208, 44322 Nantes Cedex 3, France. [email protected]
2 Opalinda, 53 rue Lafayette, 75002 Paris.
3 Department of Earth Sciences, Addis Ababa University, Ethiopia.
4 University of Nantes, Institut des Matériaux Jean Rouxel, UMR-CNRS 6502,
2 rue de la Houssinière, BP32229, 44322 Nantes cedex 3, France. 5 Centre de Recherches Gemmologiques, 2 rue de la Houssinière, 44322 Nantes Cedex 3, France.
6 Géosciences, University of Montpellier 2, UMR5243, 34095 Montpellier Cedex 5, France
Precious opal is a rare gemstone found in few deposits worldwide. One of the historically most important deposits is the Great Artesian Basin in Australia, that contains hundreds of opal mines over a very large area. Australia over-dominated the precious opal production during the whole 20th century. Ethiopia is now becoming a major opal producer since the discovery of the Wegel Tena deposit in 2008 (Rondeau et al., 2010). During this symposium, we investigate and compare the geology of these two major opal deposits and compare their gemmological properties. The Wegel Tena deposit, Ethiopia The opal deposit in the Wegel Tena area consists of a single but discontinuous layer of opal-bearing rock (Rondeau et al., 2010; 2012). It occurs in a 3000m. thick sequence of volcano-sedimentary rocks: these are alternating basalt and rhyolitic ignimbrite layers (ignimbrites are sedimentary-like layers of volcanic ashes deposited over large areas). These volcanics are 30 million years old (Oligocene period). The opal-bearing layer is a remarkably weathered ignimbrite. As a consequence of the weathering, the (by far) dominant mineral of the opal matrix is montmorillonite, a clay of the smectite family. Microscopic observation reveals that opal is a weathering product of both volcanic glass and some feldspar. These two sources of silica are also revealed by trace-elements analysis: some opals show a geochemical signature of glass weathering, with low strontium (Sr) and high uranium (U) content, some others show the signature of potassic feldspar weathering, with high Sr and low U content. As these two sources are not mixed in opal, this means that the underground water did not flow at all from weathering to opal precipitation. We also observe in many Ethiopian opals vegetal fossils that consist of minute tubes (figure 1). Their structure corresponds to rootlets, that means, underground components of the plants. Some roots are very finely preserved and show internal, rounded cells and

5th European Gemmological Symposium 15-16 June 2013 NEL & GGN Leiden, The Netherlands
32 Presentations
external, quadrangular cells (figure 2). The presence of roots in the opal means that opal formed a few meters below the surface. Indeed, the weathered opal-bearing horizon is overlain by a conglomerate (paleo-surface), itself overlain by un-weathered ignimbrite that corresponds to the volcanic ashes that deposited just after the opal formation (figure 3).
Figure 1: Opals from Wegel Tena often contain roots fossils easily seen under the optical microscope. Left: width of image = 5 mm. Photos B. Rondeau.
Figure 2: SEM images of a root fossil. The cells are nicely preserved: quadrangular cells outside, rounded cells
inside. Left: secondary electrons. Right: backscattered electrons.

5th European Gemmological Symposium 15-16 June 2013 NEL & GGN Leiden, The Netherlands
33 Presentations
The Great Artesian Basin deposits, Australia Opal in Australia is mined in numerous deposits widespread in the Cretaceous sediments of the Great Artesian Basin. Several models have been proposed to explain Australian opal formation. These models share a common basis: opal formed through the alteration of sediments into kaolinite. They differ on the process invoked for alteration and opal precipitation: deep weathering of silicates during the Tertiary (Senior, 1975; Senior et al., 1977); Syn-tectonic precipitation of opal in veins and fractures (Pecover, 1996); Opal formation through biogenic weathering conducted by microbial activity during sedimentation (Behr et al., 2000; Watkins et al., 2011). These models have been consolidated into a regional weathering model by Rey (2011) in which opal formed by weathering during the exhumation of the sedimentary rocks in the Late Cretaceous period. The sediments have a volcano-sedimentary origin, somewhat similar to the Ethiopian sediments, although the Australian sediments have been re-worked into epicontinental or marine sedimentary rocks (Rey, 2011). Opal layers are commonly associated to paleo-channels that act as a guide for opal mineralization (figure 4). Australian Opal is most often found more than ten meters below the Tertiary silcrete, which means that it formed deeper than Ethiopian opal.
Figure 3: the opals at the Wegel Tena deposit are concentrated in a single, specific level of weathered ignimbrite, a few meters below a paleo-surface marked by the presence of a conglomerate. Photo B. Rondeau.
5th European Gemmological Symposium 15-16 June 2013 NEL & GGN Leiden, The Netherlands
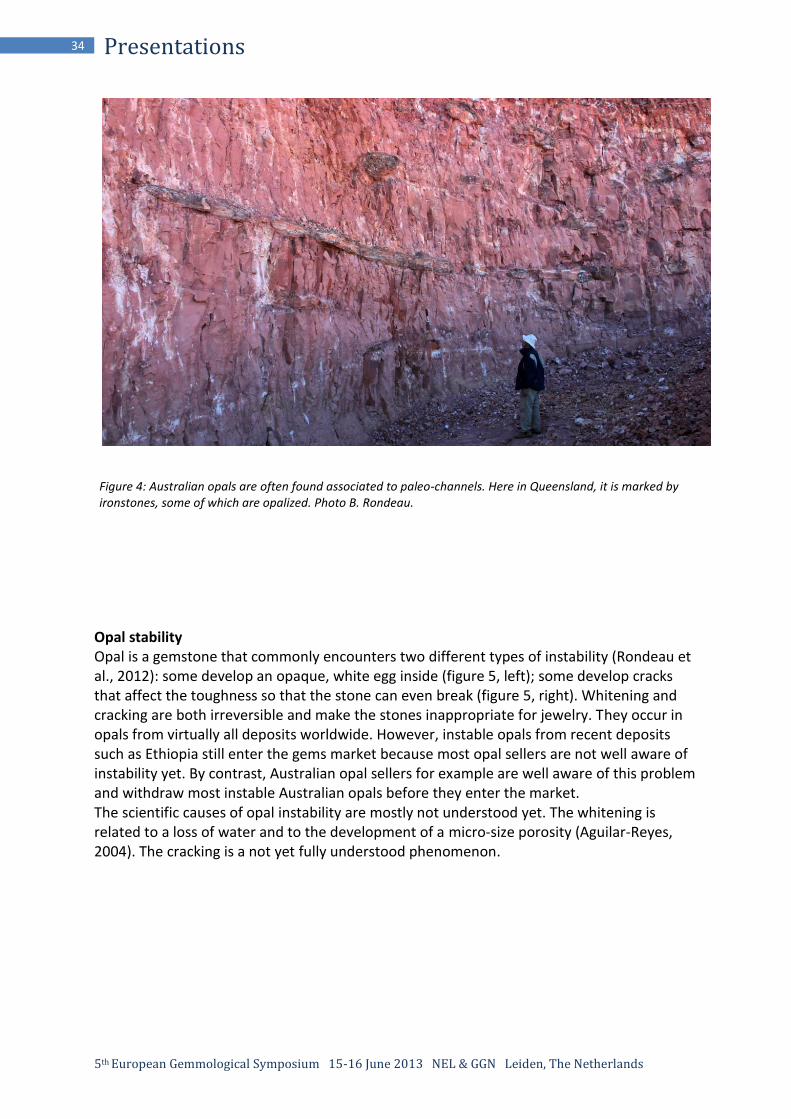
34 Presentations
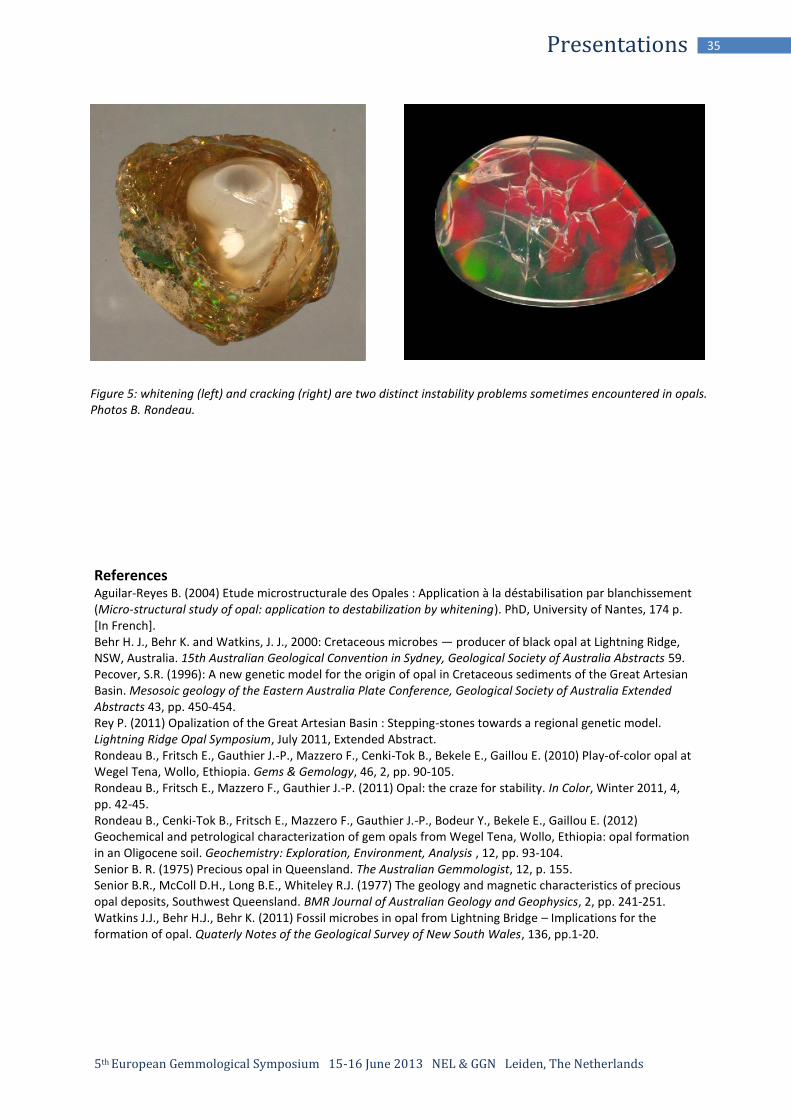
Opal stability Opal is a gemstone that commonly encounters two different types of instability (Rondeau et al., 2012): some develop an opaque, white egg inside (figure 5, left); some develop cracks that affect the toughness so that the stone can even break (figure 5, right). Whitening and cracking are both irreversible and make the stones inappropriate for jewelry. They occur in opals from virtually all deposits worldwide. However, instable opals from recent deposits such as Ethiopia still enter the gems market because most opal sellers are not well aware of instability yet. By contrast, Australian opal sellers for example are well aware of this problem and withdraw most instable Australian opals before they enter the market. The scientific causes of opal instability are mostly not understood yet. The whitening is related to a loss of water and to the development of a micro-size porosity (Aguilar-Reyes, 2004). The cracking is a not yet fully understood phenomenon.
Figure 4: Australian opals are often found associated to paleo-channels. Here in Queensland, it is marked by ironstones, some of which are opalized. Photo B. Rondeau.
5th European Gemmological Symposium 15-16 June 2013 NEL & GGN Leiden, The Netherlands
35 Presentations
References Aguilar-Reyes B. (2004) Etude microstructurale des Opales : Application à la déstabilisation par blanchissement (Micro-structural study of opal: application to destabilization by whitening). PhD, University of Nantes, 174 p. [In French]. Behr H. J., Behr K. and Watkins, J. J., 2000: Cretaceous microbes — producer of black opal at Lightning Ridge, NSW, Australia. 15th Australian Geological Convention in Sydney, Geological Society of Australia Abstracts 59. Pecover, S.R. (1996): A new genetic model for the origin of opal in Cretaceous sediments of the Great Artesian Basin. Mesosoic geology of the Eastern Australia Plate Conference, Geological Society of Australia Extended Abstracts 43, pp. 450-454. Rey P. (2011) Opalization of the Great Artesian Basin : Stepping-stones towards a regional genetic model. Lightning Ridge Opal Symposium, July 2011, Extended Abstract. Rondeau B., Fritsch E., Gauthier J.-P., Mazzero F., Cenki-Tok B., Bekele E., Gaillou E. (2010) Play-of-color opal at Wegel Tena, Wollo, Ethiopia. Gems & Gemology, 46, 2, pp. 90-105. Rondeau B., Fritsch E., Mazzero F., Gauthier J.-P. (2011) Opal: the craze for stability. In Color, Winter 2011, 4, pp. 42-45. Rondeau B., Cenki-Tok B., Fritsch E., Mazzero F., Gauthier J.-P., Bodeur Y., Bekele E., Gaillou E. (2012) Geochemical and petrological characterization of gem opals from Wegel Tena, Wollo, Ethiopia: opal formation in an Oligocene soil. Geochemistry: Exploration, Environment, Analysis , 12, pp. 93-104. Senior B. R. (1975) Precious opal in Queensland. The Australian Gemmologist, 12, p. 155. Senior B.R., McColl D.H., Long B.E., Whiteley R.J. (1977) The geology and magnetic characteristics of precious opal deposits, Southwest Queensland. BMR Journal of Australian Geology and Geophysics, 2, pp. 241-251. Watkins J.J., Behr H.J., Behr K. (2011) Fossil microbes in opal from Lightning Bridge – Implications for the formation of opal. Quaterly Notes of the Geological Survey of New South Wales, 136, pp.1-20.
Figure 5: whitening (left) and cracking (right) are two distinct instability problems sometimes encountered in opals. Photos B. Rondeau.

5th European Gemmological Symposium 15-16 June 2013 NEL & GGN Leiden, The Netherlands
36 Presentations
Amber: Real, Fake and Coloured
Maggie Campbell Pedersen, FGA, ABIPP
Editor, ‘Organic Gems’ United Kingdom
Our concept of amber is constantly being challenged, and our knowledge of the subject must continuously be updated. New sources of amber are discovered from time to time. One example, the Australian amber, challenges our idea that amber with a red body colour (that is, not just a red surface as the result of oxidation), occurs only in the amber from Myanmar and known as ‘Burmite’. Samples of Australian amber can also have a very distinct red or pink colour which permeates the whole piece.
Another challenge is terminology. When is a resin ‘amber’, and when is it ‘copal’? We know that the distinctions can be blurred and that the process of changing from copal to amber is a continuum, but none-the-less we tend to presume that very old resins must be amber. Therefore the discovery of the Ethiopian ‘amber’ should make us reconsider. It is reckoned to be over 90 million years old, but is so soft that it melts when polished. A resin with such a low melting point is surely not what we, as gemmologists, could call amber. It must still be copal. Yet because of its age it is always referred to as ’amber’.
The copal versus amber terminology has lately been further blurred by the autoclave treatments which can be now given to copal. They mature the resin artificially so that it passes the elementary tests we use to distinguish between the two (i.e. melting point, and reaction to solvents). This material has to be tested in a laboratory -- for example using FTIR -- to determine its true nature, and even then results can be inconclusive.
Red and pink amber samples from Australia

5th European Gemmological Symposium 15-16 June 2013 NEL & GGN Leiden, The Netherlands
37 Presentations
For a few years we have seen green resin on the market. It is usually marketed as amber, but a huge percentage of it is very young copal which has been autoclave-treated to harden it and turn it green. Yet some true ambers, e.g. Baltic amber, can also be turned green by the same treatment. Therefore – even if we may wish to protect the unwary public -- we cannot insist on calling all the green material ‘copal’. And indeed, if it has now been matured, albeit artificially, is it in fact no longer copal?
Treated Colombian copal Treated Colombian copal
FTIR comparing autoclave treated green Colombian copal, untreated Colombian copal, Baltic amber and autoclave treated’green’ Baltic amber. Courtesy of Bear Williams, Stone Group Laboratories.
5th European Gemmological Symposium 15-16 June 2013 NEL & GGN Leiden, The Netherlands
38 Presentations
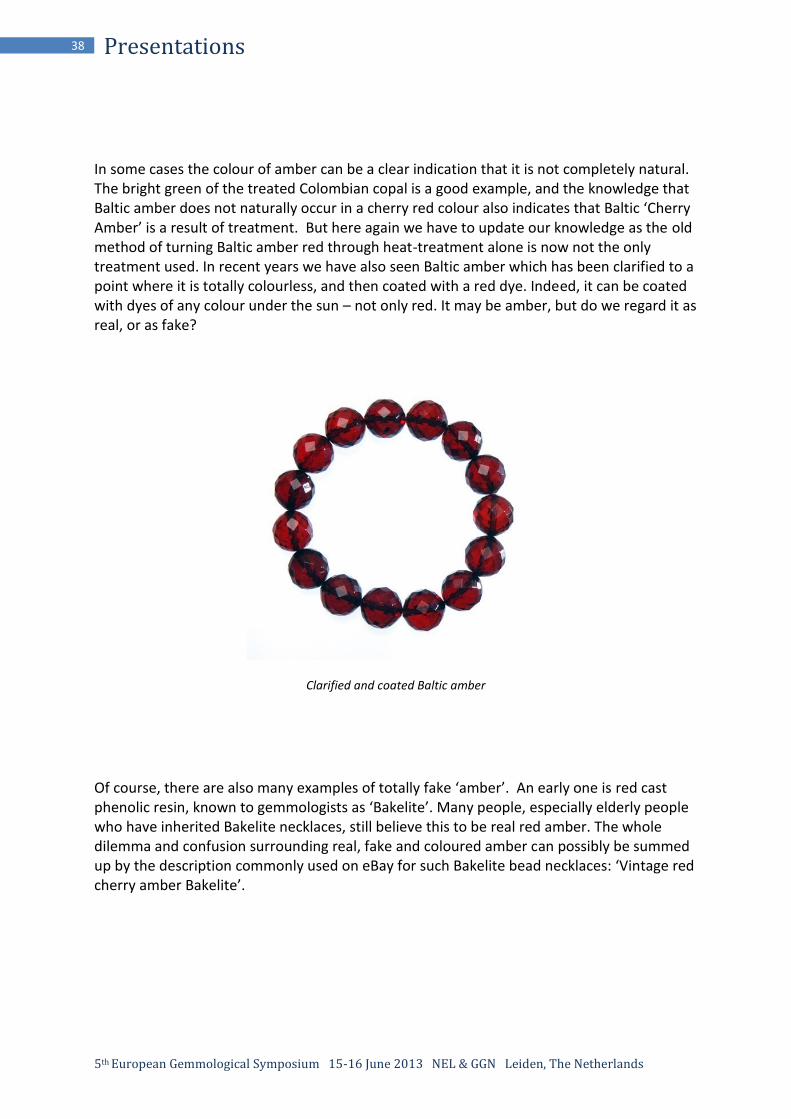
In some cases the colour of amber can be a clear indication that it is not completely natural. The bright green of the treated Colombian copal is a good example, and the knowledge that Baltic amber does not naturally occur in a cherry red colour also indicates that Baltic ‘Cherry Amber’ is a result of treatment. But here again we have to update our knowledge as the old method of turning Baltic amber red through heat-treatment alone is now not the only treatment used. In recent years we have also seen Baltic amber which has been clarified to a point where it is totally colourless, and then coated with a red dye. Indeed, it can be coated with dyes of any colour under the sun – not only red. It may be amber, but do we regard it as real, or as fake?
Clarified and coated Baltic amber
Of course, there are also many examples of totally fake ‘amber’. An early one is red cast phenolic resin, known to gemmologists as ‘Bakelite’. Many people, especially elderly people who have inherited Bakelite necklaces, still believe this to be real red amber. The whole dilemma and confusion surrounding real, fake and coloured amber can possibly be summed up by the description commonly used on eBay for such Bakelite bead necklaces: ‘Vintage red cherry amber Bakelite’.

5th European Gemmological Symposium 15-16 June 2013 NEL & GGN Leiden, The Netherlands
39 Special contribution
Rare Earth Elements in mint green grossular garnet from Merelani, Tanzania
Henry A. Hänni
GemExpert, Basel, Switzerland, [email protected]; [email protected]
Key words Tsavolite, Tsavorite, REE, PL peaks. Introduction From 1975 on green grossular, Tsavolite, was found in Northern Tanzania and Tsavo National Park, Kenya (Bank et al., 1970; Bridges, 1974; Bank, 1975; Figure 1). The main colour-giving element was found to be vanadium (V) that is exceeding the chromium (Cr) concentration by far, if there is Cr at all. The source of V is related to organic-rich meta-sediments. These former bituminous beds were transformed into graphite, and the V found the way into the growing grossular crystals. The main reason to write this contribution, however, is a spectral particularity that became evident when the Raman spectra were created to assemble a data collection for the Gem Ram (Hänni & Hunziker, 2011). Comparing usual garnet spectra with spectra taken from Tanzanian grossulars showed significant differences at higher Raman shifts (1000-2400 cm-1). My colleague Dr. Michael Krzemnicki drew my attention to this fact and I felt responsible to find an explanation. Similar peaks produced by a laser excitation are found in rare earths (REEs) doped synthetic crystals with garnet structure, such as GGG (Gallium Gadolinium Garnet), or YAG (Yttrium Aluminium Garnet). Those peaks are photoluminescence (PL) features, caused by the dopant of REE. It was therefore of interest to find the reason for the high wave number peaks in East African grossulars. Similar peaks appear in apatites, e.g. from Durango (Mexico) and their contents of REE is well known by gemmologists as they produce the obvious absorption in the yellow part of the absorption spectrum (Rønsbo, 1989).
Fig. 1. A mint green Tsavolite (V-grossular) crystal from
Merelani area (N-Tanzania), seen at Idealgem (Chantaburi,
Thailand). N-Tanzania is the source of all grossulars treated
in this paper. Photo © H.A.Hänni.
5th European Gemmological Symposium 15-16 June 2013 NEL & GGN Leiden, The Netherlands
40 Special contribution
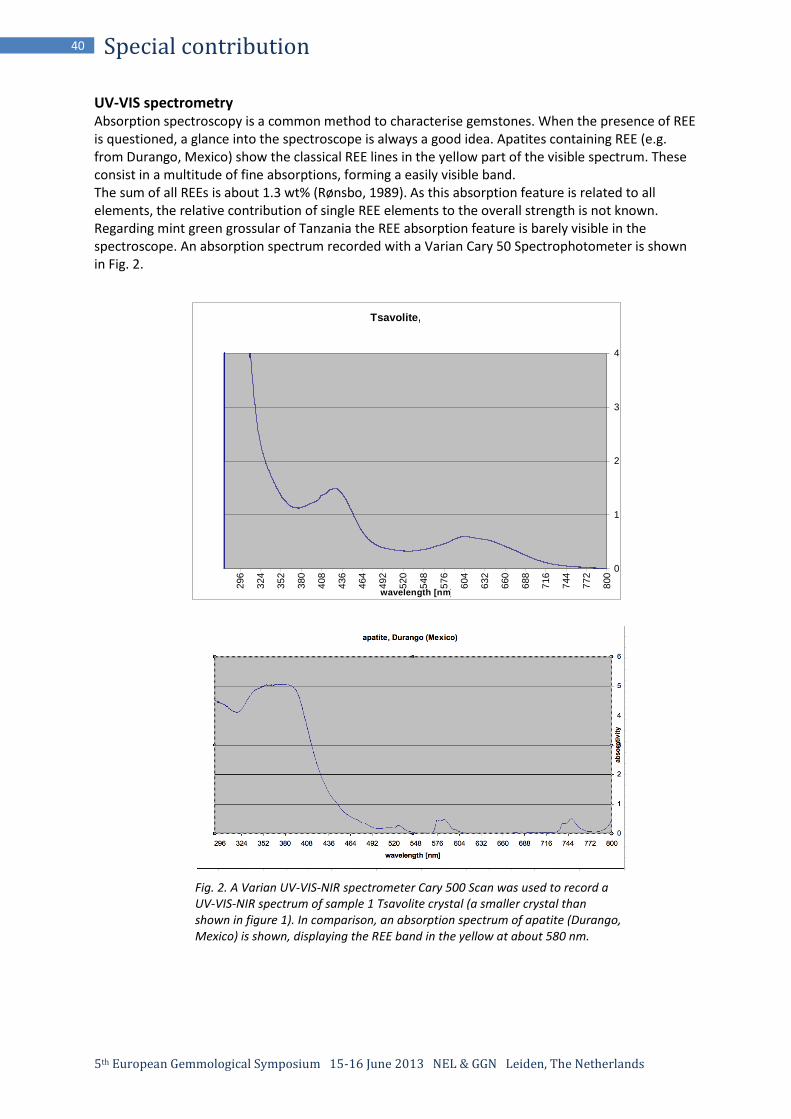
UV-VIS spectrometry Absorption spectroscopy is a common method to characterise gemstones. When the presence of REE is questioned, a glance into the spectroscope is always a good idea. Apatites containing REE (e.g. from Durango, Mexico) show the classical REE lines in the yellow part of the visible spectrum. These consist in a multitude of fine absorptions, forming a easily visible band. The sum of all REEs is about 1.3 wt% (Rønsbo, 1989). As this absorption feature is related to all elements, the relative contribution of single REE elements to the overall strength is not known. Regarding mint green grossular of Tanzania the REE absorption feature is barely visible in the spectroscope. An absorption spectrum recorded with a Varian Cary 50 Spectrophotometer is shown in Fig. 2.
Tsavolite, 4
07
602
422
0
1
2
3
4
800
772
744
716
688
660
632
604
576
548
520
492
464
436
408
380
352
324
296
wavelength [nm]
ab
so
rpti
vit
y
Fig. 2. A Varian UV-VIS-NIR spectrometer Cary 500 Scan was used to record a UV-VIS-NIR spectrum of sample 1 Tsavolite crystal (a smaller crystal than shown in figure 1). In comparison, an absorption spectrum of apatite (Durango, Mexico) is shown, displaying the REE band in the yellow at about 580 nm.
5th European Gemmological Symposium 15-16 June 2013 NEL & GGN Leiden, The Netherlands
41 Special contribution
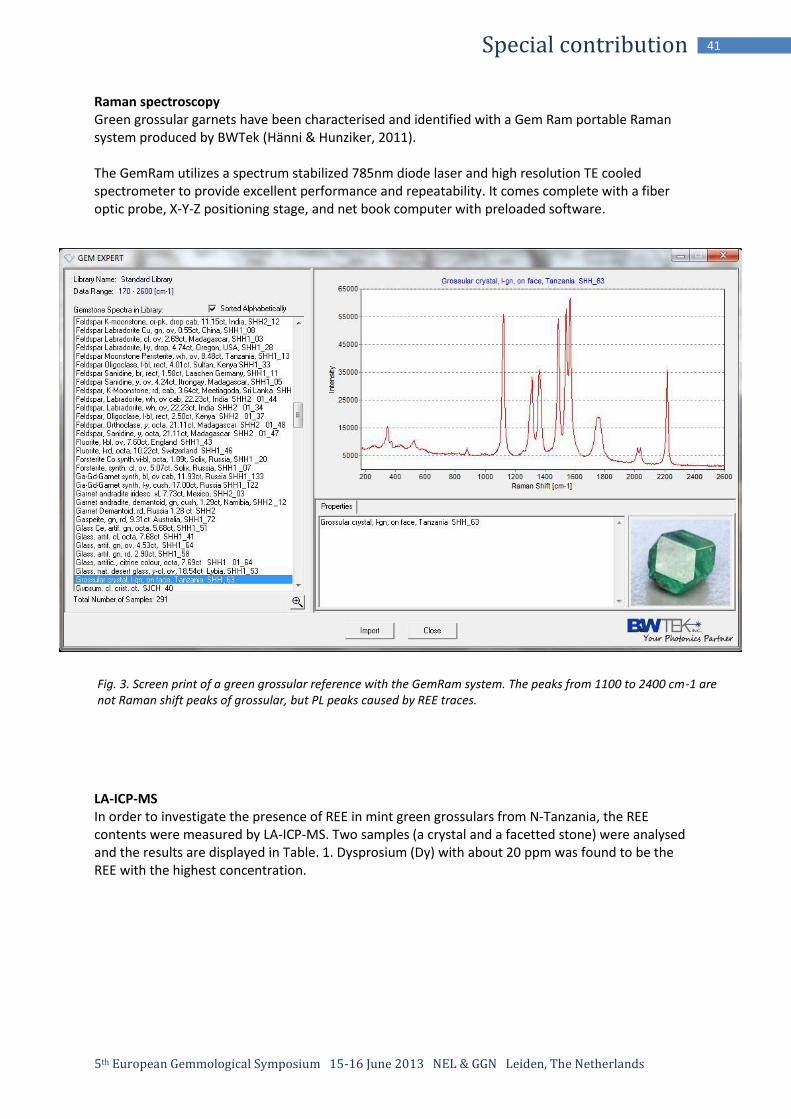
Raman spectroscopy Green grossular garnets have been characterised and identified with a Gem Ram portable Raman system produced by BWTek (Hänni & Hunziker, 2011). The GemRam utilizes a spectrum stabilized 785nm diode laser and high resolution TE cooled spectrometer to provide excellent performance and repeatability. It comes complete with a fiber optic probe, X-Y-Z positioning stage, and net book computer with preloaded software.
LA-ICP-MS In order to investigate the presence of REE in mint green grossulars from N-Tanzania, the REE contents were measured by LA-ICP-MS. Two samples (a crystal and a facetted stone) were analysed and the results are displayed in Table. 1. Dysprosium (Dy) with about 20 ppm was found to be the REE with the highest concentration.
Fig. 3. Screen print of a green grossular reference with the GemRam system. The peaks from 1100 to 2400 cm-1 are not Raman shift peaks of grossular, but PL peaks caused by REE traces.

5th European Gemmological Symposium 15-16 June 2013 NEL & GGN Leiden, The Netherlands
42 Special contribution
Table 1. REE contents in mint green grossulars from N-Tanzania, measured by LA-ICP-MS.
Conclusions V-Grossular from Merelani (Tanzania) shows distinct PL peaks when excited with a 785 nm laser. These features are seen with the presence of REE, Dy with around 20 ppm being the highest in presence. It is common to find REE in Ca-rich minerals, as for instance in apatite [Ca5(PO4)3(F,Cl,OH)]. But not all Ca-garnets, U-Gr-Andites, show PL peaks: in grossulars from Mali, Andradites from Russia, Namibia and grossulars from Mexico the PL feature is not seen. Tanzanites from Merelani, however, are displaying similar PL features. Further in-depth studies may show if the REE content is the true reason for the PL peaks seen with the analysed Tanzanian gemstones. Acknowledgements Thanks go to Werner Spaltenstein for his year-long support with information and stone samples from East Africa. Dr. S.M. Krzemnicki (SSEF, Basel) was the driving force to produce this paper. Dr. Alexey Ulianov ([email protected]), University of Lausanne, Switzerland is acknowledged for his analytical work measuring the two samples by LA-ICP-MS.
References Bank, H., Berdesinski, W. & Ottemann, J. (1970). Durchsichtiger smaragdgrüner Grossular aus Tansania. Zeitschrift der Deutschen Gemmologischen Gesellschaft, 19, 4-7. Bank, H. (1975): Grüne chrom- und vanadiumhaltige Granate (Grossulare) aus Kenya: Tsavolith - Möglichkeit einer neuen Benennung? Zeitschrift der Deutschen Gemmologischen Gesellschaft, 24, 13-15. Bridges,C.R. (1974): Green Grossular Garnets ("Tsavorites") in East Africa. Gems & Gemology 14, No. 10, 290-295. Hänni, H.A. & J.C. Hunziker (2011) A portable Raman system for gemstone identification: The GemExpert Raman probe. In Abstract Proceedings, International Gemmological Conference IGC, 2011 Switzerland, www.igc2011.org/abstract-proceedings, 167-168. Kane, R.E., Kampf, A.R. & Krupp, H. (1990): Well-formed tsavorite gem crystals from Tanzania, Gems & Gemology, 26, No. 2, p. 142-148. Rønsbo, Jørn G. (1989) Coupled substitution involving REEs and Na in Si apatites in alkaline rocks from the Ilimaussaq intrusion, South Greenland, and the petrological implications. American Mineralogist, 74, 896-901.

5th European Gemmological Symposium 15-16 June 2013 NEL & GGN Leiden, The Netherlands
43 Exhibit
HRD Awards CREATIVITY IN DIAMOND JEWELLERY DESIGN
Highlights of the HRD Awards 2011 'You and Me' collection on show The HRD Awards were established in 1984. This initiative, introduced to stimulate creativity and innovation in the contemporary diamond jewel, developed into one of the major diamond jewellery bi-annual contests in the world. The contest formula is challenging and ambitious. The confrontation of 'diamond', the symbol par excellence of traditional values, with avant-garde ideas and contemporary jewellery design, should lead to innovative and creative jewels.
Throughout the years, the HRD Awards have become the ideal stepping stone for many talented jewellery designers. This initiative is an important step towards the further development of the jewellery sector, next to Antwerps’ leading role as the World Diamond Centre.
HRD AWARDS 2013 “TROMPE L’OEIL” - Nothing is what it seems For the 15th edition of the HRD Awards, 31 laureates have been selected out of 1500 entries. In cooperation with both Antwerp and international diamond companies, these designs will be transformed into unique diamond jewellery pieces: the HRD Awards Collection 2013. On July 18 2013 the winners will be announced. HRD Antwerp | Hoveniersstraat 22 |BE 2018 Antwerpen | http://hrdawards.com/home/
Winner 2011: Jiang Zhe (China)
PORCUPINE THEORY (brooch)
Even prickly porcupines wish to find warmth in
each other. They will find a suitable distance to
reduce the pain to a minimum in their encounters.
In life, humans will encounter similar
circumstances.
A certain distance between ‘You and Me’ provides
people a safe haven.
.
Jiang Zhe