Contents lists available at ScienceDirect
7
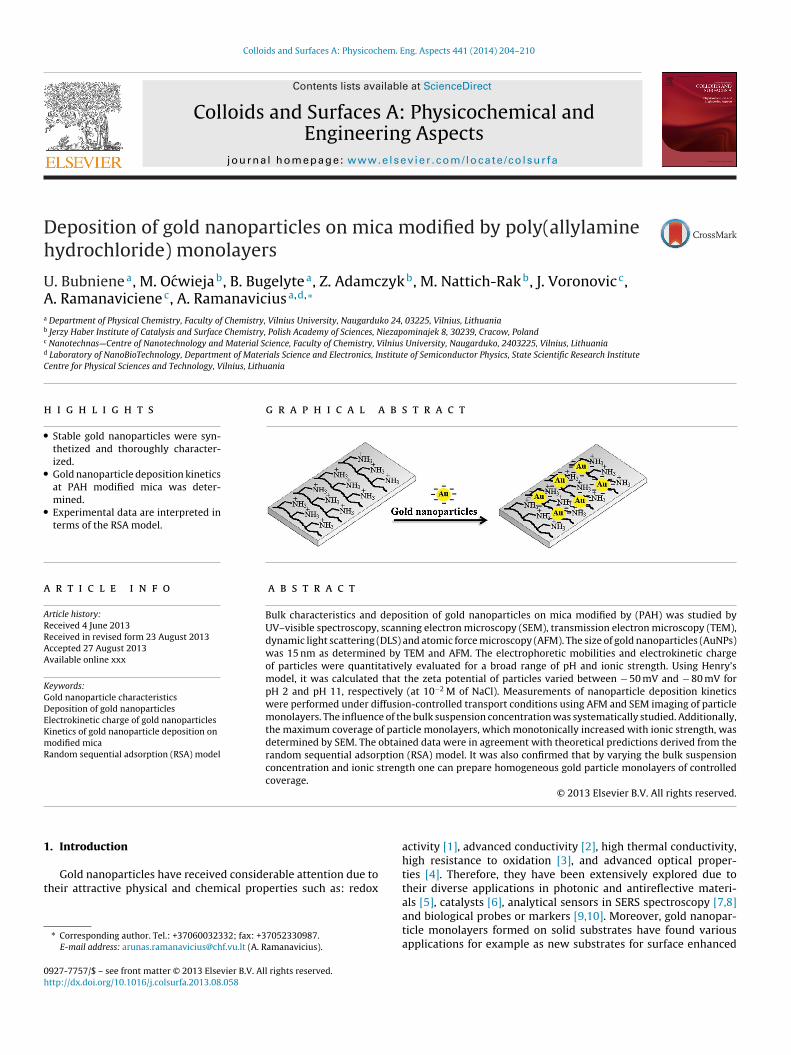
Colloids and Surfaces A: Physicochem. Eng. Aspects 441 (2014) 204–210 Contents lists available at ScienceDirect Colloids and Surfaces A: Physicochemical and Engineering Aspects jo ur nal ho me p ag e: www.elsevier.com/locate/colsurfa Deposition of gold nanoparticles on mica modified by poly(allylamine hydrochloride) monolayers U. Bubniene a , M. O´ cwieja b , B. Bugelyte a , Z. Adamczyk b , M. Nattich-Rak b , J. Voronovic c , A. Ramanaviciene c , A. Ramanavicius a,d,∗ a Department of Physical Chemistry, Faculty of Chemistry, Vilnius University, Naugarduko 24, 03225, Vilnius, Lithuania b Jerzy Haber Institute of Catalysis and Surface Chemistry, Polish Academy of Sciences, Niezapominajek 8, 30239, Cracow, Poland c Nanotechnas—Centre of Nanotechnology and Material Science, Faculty of Chemistry, Vilnius University, Naugarduko, 2403225, Vilnius, Lithuania d Laboratory of NanoBioTechnology, Department of Materials Science and Electronics, Institute of Semiconductor Physics, State Scientific Research Institute Centre for Physical Sciences and Technology, Vilnius, Lithuania h i g h l i g h t s • Stable gold nanoparticles were syn- thetized and thoroughly character- ized. • Gold nanoparticle deposition kinetics at PAH modified mica was deter- mined. • Experimental data are interpreted in terms of the RSA model. g r a p h i c a l a b s t r a c t a r t i c l e i n f o Article history: Received 4 June 2013 Received in revised form 23 August 2013 Accepted 27 August 2013 Available online xxx Keywords: Gold nanoparticle characteristics Deposition of gold nanoparticles Electrokinetic charge of gold nanoparticles Kinetics of gold nanoparticle deposition on modified mica Random sequential adsorption (RSA) model a b s t r a c t Bulk characteristics and deposition of gold nanoparticles on mica modified by (PAH) was studied by UV–visible spectroscopy, scanning electron microscopy (SEM), transmission electron microscopy (TEM), dynamic light scattering (DLS) and atomic force microscopy (AFM). The size of gold nanoparticles (AuNPs) was 15 nm as determined by TEM and AFM. The electrophoretic mobilities and electrokinetic charge of particles were quantitatively evaluated for a broad range of pH and ionic strength. Using Henry’s model, it was calculated that the zeta potential of particles varied between − 50 mV and − 80 mV for pH 2 and pH 11, respectively (at 10 −2 M of NaCl). Measurements of nanoparticle deposition kinetics were performed under diffusion-controlled transport conditions using AFM and SEM imaging of particle monolayers. The influence of the bulk suspension concentration was systematically studied. Additionally, the maximum coverage of particle monolayers, which monotonically increased with ionic strength, was determined by SEM. The obtained data were in agreement with theoretical predictions derived from the random sequential adsorption (RSA) model. It was also confirmed that by varying the bulk suspension concentration and ionic strength one can prepare homogeneous gold particle monolayers of controlled coverage. © 2013 Elsevier B.V. All rights reserved. 1. Introduction Gold nanoparticles have received considerable attention due to their attractive physical and chemical properties such as: redox ∗ Corresponding author. Tel.: +37060032332; fax: +37052330987. E-mail address: [email protected] (A. Ramanavicius). activity [1], advanced conductivity [2], high thermal conductivity, high resistance to oxidation [3], and advanced optical proper- ties [4]. Therefore, they have been extensively explored due to their diverse applications in photonic and antireflective materi- als [5], catalysts [6], analytical sensors in SERS spectroscopy [7,8] and biological probes or markers [9,10]. Moreover, gold nanopar- ticle monolayers formed on solid substrates have found various applications for example as new substrates for surface enhanced 0927-7757/$ – see front matter © 2013 Elsevier B.V. All rights reserved. http://dx.doi.org/10.1016/j.colsurfa.2013.08.058
Transcript of Contents lists available at ScienceDirect
Dh
UAa
b
c
d
C
h
•
•
•
a
ARRAA
KGDEKmR
1
t
0h
Colloids and Surfaces A: Physicochem. Eng. Aspects 441 (2014) 204– 210
Contents lists available at ScienceDirect
Colloids and Surfaces A: Physicochemical andEngineering Aspects
jo ur nal ho me p ag e: www.elsev ier .com/ locate /co lsur fa
eposition of gold nanoparticles on mica modified by poly(allylamineydrochloride) monolayers
. Bubnienea, M. Ocwiejab, B. Bugelytea, Z. Adamczykb, M. Nattich-Rakb, J. Voronovicc,
. Ramanavicienec, A. Ramanaviciusa,d,∗
Department of Physical Chemistry, Faculty of Chemistry, Vilnius University, Naugarduko 24, 03225, Vilnius, LithuaniaJerzy Haber Institute of Catalysis and Surface Chemistry, Polish Academy of Sciences, Niezapominajek 8, 30239, Cracow, PolandNanotechnas—Centre of Nanotechnology and Material Science, Faculty of Chemistry, Vilnius University, Naugarduko, 2403225, Vilnius, LithuaniaLaboratory of NanoBioTechnology, Department of Materials Science and Electronics, Institute of Semiconductor Physics, State Scientific Research Instituteentre for Physical Sciences and Technology, Vilnius, Lithuania
i g h l i g h t s
Stable gold nanoparticles were syn-thetized and thoroughly character-ized.Gold nanoparticle deposition kineticsat PAH modified mica was deter-mined.Experimental data are interpreted interms of the RSA model.
g r a p h i c a l a b s t r a c t
r t i c l e i n f o
rticle history:eceived 4 June 2013eceived in revised form 23 August 2013ccepted 27 August 2013vailable online xxx
eywords:old nanoparticle characteristicseposition of gold nanoparticles
a b s t r a c t
Bulk characteristics and deposition of gold nanoparticles on mica modified by (PAH) was studied byUV–visible spectroscopy, scanning electron microscopy (SEM), transmission electron microscopy (TEM),dynamic light scattering (DLS) and atomic force microscopy (AFM). The size of gold nanoparticles (AuNPs)was 15 nm as determined by TEM and AFM. The electrophoretic mobilities and electrokinetic chargeof particles were quantitatively evaluated for a broad range of pH and ionic strength. Using Henry’smodel, it was calculated that the zeta potential of particles varied between − 50 mV and − 80 mV forpH 2 and pH 11, respectively (at 10−2 M of NaCl). Measurements of nanoparticle deposition kineticswere performed under diffusion-controlled transport conditions using AFM and SEM imaging of particle
lectrokinetic charge of gold nanoparticlesinetics of gold nanoparticle deposition onodified mica
andom sequential adsorption (RSA) model
monolayers. The influence of the bulk suspension concentration was systematically studied. Additionally,the maximum coverage of particle monolayers, which monotonically increased with ionic strength, wasdetermined by SEM. The obtained data were in agreement with theoretical predictions derived from therandom sequential adsorption (RSA) model. It was also confirmed that by varying the bulk suspensionconcentration and ionic strength one can prepare homogeneous gold particle monolayers of controlledcoverage.
. Introduction
Gold nanoparticles have received considerable attention due toheir attractive physical and chemical properties such as: redox
∗ Corresponding author. Tel.: +37060032332; fax: +37052330987.E-mail address: [email protected] (A. Ramanavicius).
927-7757/$ – see front matter © 2013 Elsevier B.V. All rights reserved.ttp://dx.doi.org/10.1016/j.colsurfa.2013.08.058
© 2013 Elsevier B.V. All rights reserved.
activity [1], advanced conductivity [2], high thermal conductivity,high resistance to oxidation [3], and advanced optical proper-ties [4]. Therefore, they have been extensively explored due totheir diverse applications in photonic and antireflective materi-
als [5], catalysts [6], analytical sensors in SERS spectroscopy [7,8]and biological probes or markers [9,10]. Moreover, gold nanopar-ticle monolayers formed on solid substrates have found variousapplications for example as new substrates for surface enhanced
Physic
si[mooips
twacoewwsam(
ffinRaae
nidstrtsd
a[ocuiiipadoaewiwdrcarttp
U. Bubniene et al. / Colloids and Surfaces A:
pectroscopy [11]. These thin films are usually produced via phys-cal and chemical methods such as: sputtering [12], evaporation13], chemical vapor deposition (CVD) [14] and self-assembly of
etal colloids [15]. Increasing attention is paid to preparationf gold mono- and multi-layers using simple and reliable meth-ds [16]. Many works concerning the issue have been devoted tonvestigations of citrate-stabilized gold nanoparticle deposition onositively charged monolayers of polyelectrolytes, dendrimers andilanes [17–25].
Grabar et al. [20] described a method suitable for the forma-ion of gold nanoparticle based monolayers on quartz or glassafers functionalized by alkoxysilanes using nanoparticles of aver-
ge diameter of 18 nm. The authors obtained maximum 15% surfaceoverage by nanoparticles, but they do not provide any informationn particle transport conditions and the physicochemical param-ters of the deposition procedure. The only parameter mentionedas that the adsorption time reached up to 24 h. Similar resultsere reported by the same authors [26] but the investigations were
upplemented by the application of new techniques, which are suit-ble for the characterization of monolayers, including atomic forceicroscopy (AFM), field emission scanning electron microscopy
FE-SEM) and near-field scanning optical microscopy (NSOM).Brust and coworkers [27] developed an interesting strategy
or self-assembly of gold nanoparticles on glass substrate modi-ed by 3-(mercaptopropyl)-trimethoxysilane. The process of goldanoparticle deposition from suspension was carried out for 3 h.epeating deposition of gold nanoparticles and selected thiols theuthors obtained gold multilayers, which were applied in opticsnd electronics. However, no quantitative information on the cov-rage was reported in this work.
Only very few papers were devoted to kinetic aspects of goldanoparticle deposition on solid substrates. One of the first reports
n this field was the work of Shmitt and coworkers [24], whoescribed the kinetics of 15 nm diameter gold nanoparticle depo-ition on poly(allylamine hydrochloride) (PAH)-modified mica. Inhis work, it was proved that the kinetics of particle adsorption iseasonably well-described as a diffusion-limited process. Howeverhe maximum nanoparticle coverage obtained using various solidubstrates (glass, quartz, mica) and anchoring layers (PAH, PEI, EDA)id not exceeded 15%.
Systematic studies of the deposition of gold nanoparticles on solid surface were also carried out by Kooij and co-workers18,21–23]. The authors investigated the influence of ionic strengthn the deposition kinetics of citrate-stabilized gold nanoparti-les, of 13 nm diameter. The coverage of particles was determinedsing AFM and calculated from the reflectometric signal apply-
ng ‘thin island film theory’. It was proved that with increasingonic strength the coverage by nanoparticles increased. The exper-mentally observed effect was in accordance with the theoreticalredictions. On the basis of the Derjaguin, Landau, Verweynd Overbeek (DLVO) theory the average inter-particle distanceecreases with increasing ionic strength, leading to an increasef the overall coverage. One can, therefore, conclude that despite
few exceptions [18,21–24] no results were reported in the lit-rature concerning adsorption kinetics of gold nanoparticles inell-defined systems interpreted in terms of appropriate theoret-
cal approaches. Considering this deficiency, the goal of our paperas to evaluate quantitatively the kinetics of gold nanoparticleeposition from suspensions of varying electrophoretic mobilityegulated by changes in ionic strength. PAH modified mica was aonvenient substrate to use because of its molecular smoothnessnd homogeneity of charge distribution whose magnitude can be
egulated within broad limits by pH, ionic strength and polyelec-rolyte adsorption. Bulk pieces of mica can be easily cleaved intohin sheets; it eliminates the necessity of mica surface cleaningrior to the experiments. After assembling two mica sheets into aochem. Eng. Aspects 441 (2014) 204– 210 205
channel cell, one can also characterize its electrokinetic chargeunder wet conditions by using streaming potential measurements[28].
2. Experimental
2.1. Materials
All chemicals were of analytical grade and were used with-out further purification. The solutions were prepared in ultrapurewater. The trisodium citrate dihydrate (ACS) P.A. was purchasedfrom POCH S.A., (Gliwice, Poland). The hydrogen tetrachloroaurate,sodium chloride, sodium hydroxide and hydrochloric acid werecommercial products of Sigma Aldrich.
The poly(allylamine hydrochloride) (PAH), a cationic polyelec-trolyte, was used for mica surface modifications. PAH, having anaverage molecular weight of 70 000 Da, was purchased from Poly-sciences, Inc. (Warrington, US). Natural ruby mica sheets weresupplied by Continental Trade Ltd., (Warszava, Poland). Mica sheetswere freshly cleaved and used without any pre-treatment.
Ultrapure water, used throughout this investigation, wasobtained using the Milli-Q Elix&Simplicity 185 purification systemfrom Millipore SA (Molsheim, France).
2.2. Colloidal gold preparation
The standard method, described by Turkevich et al. in 1951and refined by Frens in the 1970s [29,30] was used to pro-duce size-defined spherical gold nanoparticles through chemicalreduction. The colloidal gold suspension was prepared by stan-dard citrate reduction procedure [23] with some modifications.Typically, 100 mL of 1 mM hydrogen tetrachloroaurate (HAuCl4)aqueous solution was heated up to 88 ◦C. Afterward, 10 mL of38.8 mM sodium citrate was quickly added, while stirring vigor-ously at 300 rpm, resulting a in colour change of the originallyyellow solution to burgundy red (colour change indicates the pres-ence of colloidal gold nanoparticles). The mixing rate effect onnanoparticle size is an important factor in the reduction pro-cess while size distribution is also affected by mixing rate [31].The mixture was kept at 88 ◦C for a defined time (normally15 min) while stirring continuously and hereafter cooled to roomtemperature.
The reaction mixtures were purified of excess ions using a stirredmembrane filtration cell (Millipore, model 8400) with a regener-ated cellulose membrane (Millipore, NMWL: 100 kDa). The washingprocedure was repeated until the conductivity of the supernatantsolution stabilized at ca. 15–20 �S cm−1.
2.3. Substrates and nanoparticle deposition
The procedure for gold nanoparticle deposition on PAH modi-fied mica sheets was analogous to that described in paper [32]. Asaturated PAH monolayer on mica was deposited under diffusion-controlled transport conditions. In order to perform this freshlycleaved mica sheets were placed into the PAH solution, having aconcentration of 5 mg L−1, I = 10−2 M NaCl and pH 4, for 15 min.Afterward, mica sheets, covered by the polyelectrolyte monolayer,were rinsed with water and after this were immersed in the goldsuspension. The progress of PAH adsorption was monitored in situby the streaming potential measurements performed according topreviously described methodology [33,34].
The sheets were used for the deposition of gold nanoparticles
under diffusion-controlled transport conditions from suspensionscontaining various AuNPs concentrations (5, 10, 20, 50 mg L−1) inthe bulk at pH 6 and ionic strengths varying between 10−4 and3 × 10−2 M. The deposition time was varied between wide limits in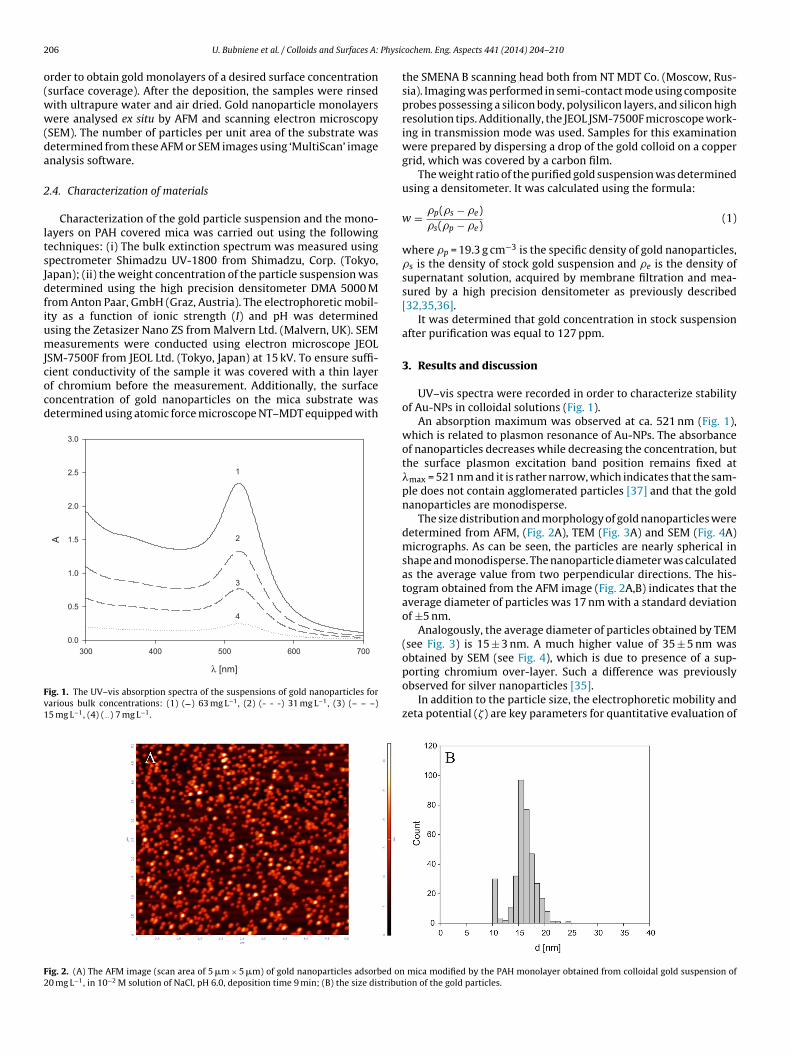
2 Physic
o(ww(da
2
ltsJdfiumJcocd
Fv1
F2
06 U. Bubniene et al. / Colloids and Surfaces A:
rder to obtain gold monolayers of a desired surface concentrationsurface coverage). After the deposition, the samples were rinsedith ultrapure water and air dried. Gold nanoparticle monolayersere analysed ex situ by AFM and scanning electron microscopy
SEM). The number of particles per unit area of the substrate wasetermined from these AFM or SEM images using ‘MultiScan’ imagenalysis software.
.4. Characterization of materials
Characterization of the gold particle suspension and the mono-ayers on PAH covered mica was carried out using the followingechniques: (i) The bulk extinction spectrum was measured usingpectrometer Shimadzu UV-1800 from Shimadzu, Corp. (Tokyo,apan); (ii) the weight concentration of the particle suspension wasetermined using the high precision densitometer DMA 5000 Mrom Anton Paar, GmbH (Graz, Austria). The electrophoretic mobil-ty as a function of ionic strength (I) and pH was determinedsing the Zetasizer Nano ZS from Malvern Ltd. (Malvern, UK). SEMeasurements were conducted using electron microscope JEOL
SM-7500F from JEOL Ltd. (Tokyo, Japan) at 15 kV. To ensure suffi-
ient conductivity of the sample it was covered with a thin layerf chromium before the measurement. Additionally, the surfaceoncentration of gold nanoparticles on the mica substrate wasetermined using atomic force microscope NT–MDT equipped withig. 1. The UV–vis absorption spectra of the suspensions of gold nanoparticles forarious bulk concentrations: (1) ( ) 63 mg L−1, (2) (- - -) 31 mg L−1, (3) (– – –)5 mg L−1, (4) (···) 7 mg L−1.
ig. 2. (A) The AFM image (scan area of 5 �m × 5 �m) of gold nanoparticles adsorbed on0 mg L−1, in 10−2 M solution of NaCl, pH 6.0, deposition time 9 min; (B) the size distribut
ochem. Eng. Aspects 441 (2014) 204– 210
the SMENA B scanning head both from NT MDT Co. (Moscow, Rus-sia). Imaging was performed in semi-contact mode using compositeprobes possessing a silicon body, polysilicon layers, and silicon highresolution tips. Additionally, the JEOL JSM-7500F microscope work-ing in transmission mode was used. Samples for this examinationwere prepared by dispersing a drop of the gold colloid on a coppergrid, which was covered by a carbon film.
The weight ratio of the purified gold suspension was determinedusing a densitometer. It was calculated using the formula:
w = �p(�s − �e)�s(�p − �e)
(1)
where �p = 19.3 g cm−3 is the specific density of gold nanoparticles,�s is the density of stock gold suspension and �e is the density ofsupernatant solution, acquired by membrane filtration and mea-sured by a high precision densitometer as previously described[32,35,36].
It was determined that gold concentration in stock suspensionafter purification was equal to 127 ppm.
3. Results and discussion
UV–vis spectra were recorded in order to characterize stabilityof Au-NPs in colloidal solutions (Fig. 1).
An absorption maximum was observed at ca. 521 nm (Fig. 1),which is related to plasmon resonance of Au-NPs. The absorbanceof nanoparticles decreases while decreasing the concentration, butthe surface plasmon excitation band position remains fixed at�max = 521 nm and it is rather narrow, which indicates that the sam-ple does not contain agglomerated particles [37] and that the goldnanoparticles are monodisperse.
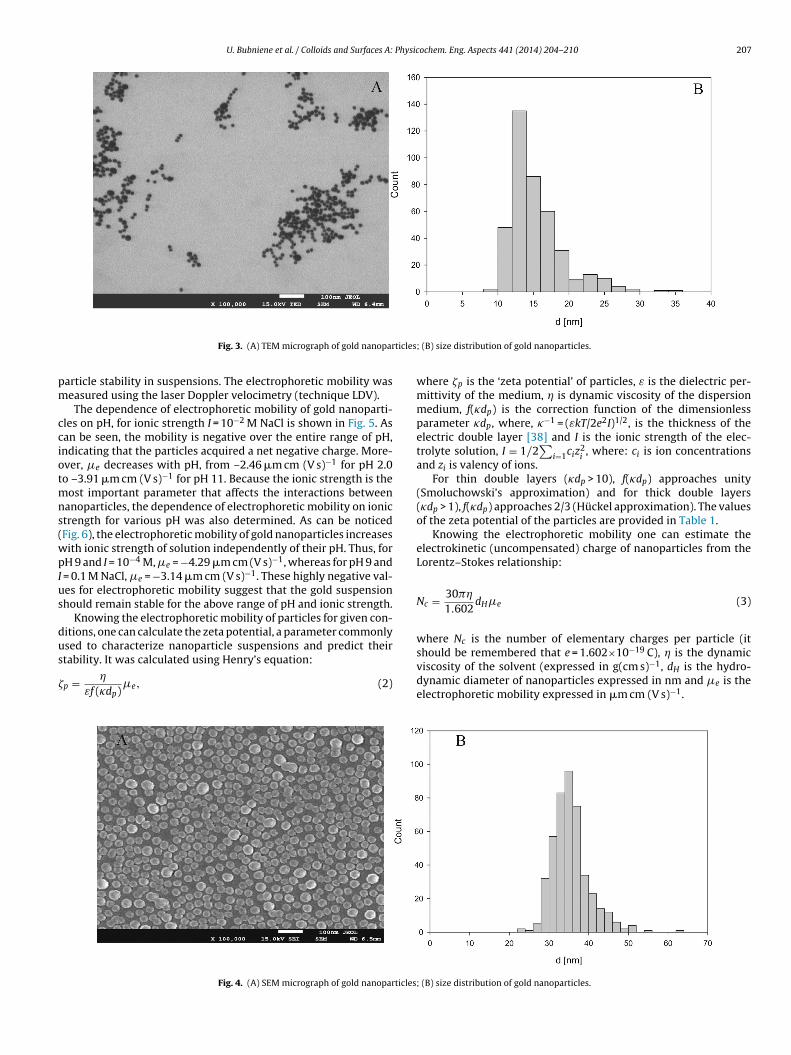
The size distribution and morphology of gold nanoparticles weredetermined from AFM, (Fig. 2A), TEM (Fig. 3A) and SEM (Fig. 4A)micrographs. As can be seen, the particles are nearly spherical inshape and monodisperse. The nanoparticle diameter was calculatedas the average value from two perpendicular directions. The his-togram obtained from the AFM image (Fig. 2A,B) indicates that theaverage diameter of particles was 17 nm with a standard deviationof ±5 nm.
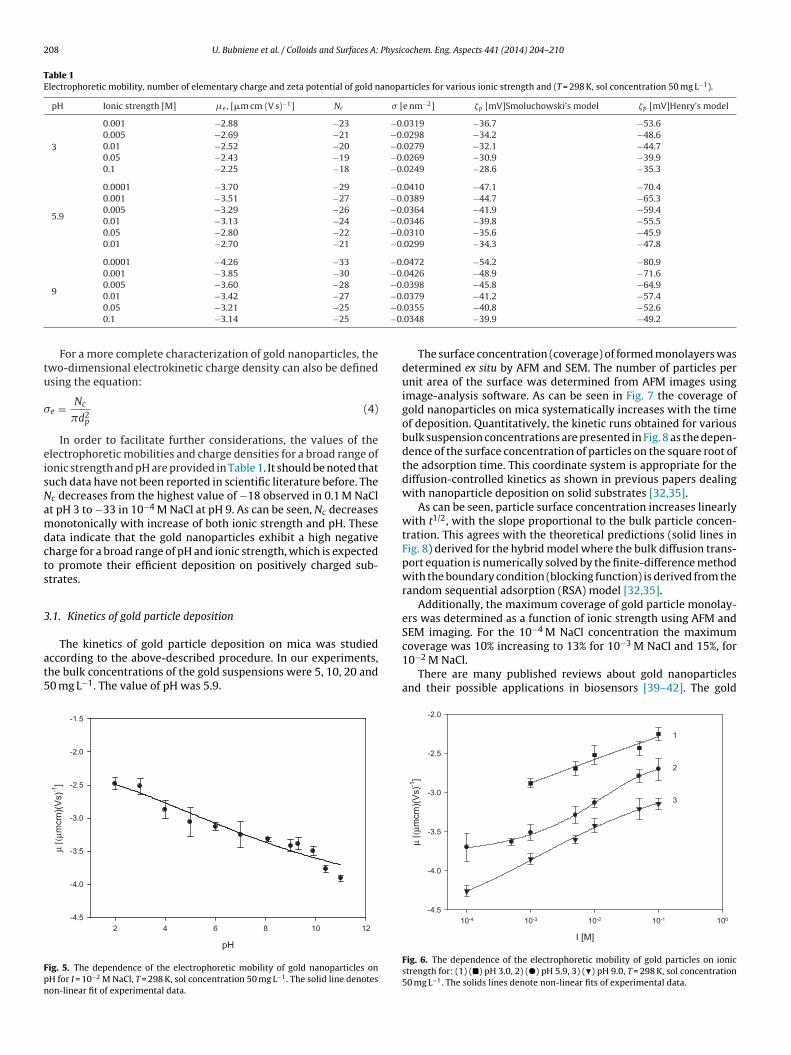
Analogously, the average diameter of particles obtained by TEM(see Fig. 3) is 15 ± 3 nm. A much higher value of 35 ± 5 nm wasobtained by SEM (see Fig. 4), which is due to presence of a sup-
porting chromium over-layer. Such a difference was previouslyobserved for silver nanoparticles [35].In addition to the particle size, the electrophoretic mobility andzeta potential (�) are key parameters for quantitative evaluation of
mica modified by the PAH monolayer obtained from colloidal gold suspension ofion of the gold particles.
U. Bubniene et al. / Colloids and Surfaces A: Physicochem. Eng. Aspects 441 (2014) 204– 210 207
ticles
pm
cciotmns(wpIus
dus
�
Fig. 3. (A) TEM micrograph of gold nanopar
article stability in suspensions. The electrophoretic mobility waseasured using the laser Doppler velocimetry (technique LDV).The dependence of electrophoretic mobility of gold nanoparti-
les on pH, for ionic strength I = 10−2 M NaCl is shown in Fig. 5. Asan be seen, the mobility is negative over the entire range of pH,ndicating that the particles acquired a net negative charge. More-ver, �e decreases with pH, from –2.46 �m cm (V s)−1 for pH 2.0o –3.91 �m cm (V s)−1 for pH 11. Because the ionic strength is the
ost important parameter that affects the interactions betweenanoparticles, the dependence of electrophoretic mobility on ionictrength for various pH was also determined. As can be noticedFig. 6), the electrophoretic mobility of gold nanoparticles increasesith ionic strength of solution independently of their pH. Thus, forH 9 and I = 10−4 M, �e = −4.29 �m cm (V s)−1, whereas for pH 9 and
= 0.1 M NaCl, �e = −3.14 �m cm (V s)−1. These highly negative val-es for electrophoretic mobility suggest that the gold suspensionhould remain stable for the above range of pH and ionic strength.
Knowing the electrophoretic mobility of particles for given con-itions, one can calculate the zeta potential, a parameter commonly
sed to characterize nanoparticle suspensions and predict theirtability. It was calculated using Henry’s equation:p = �
εf (�dp)�e, (2)
Fig. 4. (A) SEM micrograph of gold nanoparticles
; (B) size distribution of gold nanoparticles.
where �p is the ‘zeta potential’ of particles, ε is the dielectric per-mittivity of the medium, � is dynamic viscosity of the dispersionmedium, f(�dp) is the correction function of the dimensionlessparameter �dp, where, �−1 = (εkT/2e2I)1/2, is the thickness of theelectric double layer [38] and I is the ionic strength of the elec-trolyte solution, I = 1/2
∑i=1ciz
2i, where: ci is ion concentrations
and zi is valency of ions.For thin double layers (�dp > 10), f(�dp) approaches unity
(Smoluchowski’s approximation) and for thick double layers(�dp > 1), f(�dp) approaches 2/3 (Hückel approximation). The valuesof the zeta potential of the particles are provided in Table 1.
Knowing the electrophoretic mobility one can estimate theelectrokinetic (uncompensated) charge of nanoparticles from theLorentz–Stokes relationship:
Nc = 30�
1.602dH�e (3)
where Nc is the number of elementary charges per particle (it
should be remembered that e = 1.602×10⁻¹⁹ C), � is the dynamicviscosity of the solvent (expressed in g(cm s)−1, dH is the hydro-dynamic diameter of nanoparticles expressed in nm and �e is theelectrophoretic mobility expressed in �m cm (V s)−1.; (B) size distribution of gold nanoparticles.
208 U. Bubniene et al. / Colloids and Surfaces A: Physicochem. Eng. Aspects 441 (2014) 204– 210
Table 1Electrophoretic mobility, number of elementary charge and zeta potential of gold nanoparticles for various ionic strength and (T = 298 K, sol concentration 50 mg L−1).
pH Ionic strength [M] �e , [�m cm (V s)−1] Nc [e nm−2] �p [mV]Smoluchowski’s model �p [mV]Henry’s model
3
0.001 −2.88 −23 −0.0319 −36.7 −53.60.005 −2.69 −21 −0.0298 −34.2 −48.60.01 −2.52 −20 −0.0279 −32.1 −44.70.05 −2.43 −19 −0.0269 −30.9 −39.90.1 −2.25 −18 −0.0249 −28.6 −35.3
5.9
0.0001 −3.70 −29 −0.0410 −47.1 −70.40.001 −3.51 −27 −0.0389 −44.7 −65.30.005 −3.29 −26 −0.0364 −41.9 −59.40.01 −3.13 −24 −0.0346 −39.8 −55.50.05 −2.80 −22 −0.0310 −35.6 −45.90.01 −2.70 −21 −0.0299 −34.3 −47.8
9
0.0001 −4.26 −33 −0.0472 −54.2 −80.90.001 −3.85 −30 −0.0426 −48.9 −71.60.005 −3.60 −28 −0.0398 −45.8 −64.9
−0−0−0
tu
eisNamdcts
3
at5
Fpn
0.01 −3.42 −27
0.05 −3.21 −25
0.1 −3.14 −25
For a more complete characterization of gold nanoparticles, thewo-dimensional electrokinetic charge density can also be definedsing the equation:
e = Nc
d2p
(4)
In order to facilitate further considerations, the values of thelectrophoretic mobilities and charge densities for a broad range ofonic strength and pH are provided in Table 1. It should be noted thatuch data have not been reported in scientific literature before. Thec decreases from the highest value of −18 observed in 0.1 M NaClt pH 3 to −33 in 10−4 M NaCl at pH 9. As can be seen, Nc decreasesonotonically with increase of both ionic strength and pH. These
ata indicate that the gold nanoparticles exhibit a high negativeharge for a broad range of pH and ionic strength, which is expectedo promote their efficient deposition on positively charged sub-trates.
.1. Kinetics of gold particle deposition
The kinetics of gold particle deposition on mica was studiedccording to the above-described procedure. In our experiments,he bulk concentrations of the gold suspensions were 5, 10, 20 and0 mg L−1. The value of pH was 5.9.
ig. 5. The dependence of the electrophoretic mobility of gold nanoparticles onH for I = 10−2 M NaCl, T = 298 K, sol concentration 50 mg L−1. The solid line denoteson-linear fit of experimental data.
.0379 −41.2 −57.4
.0355 −40.8 −52.6
.0348 −39.9 −49.2
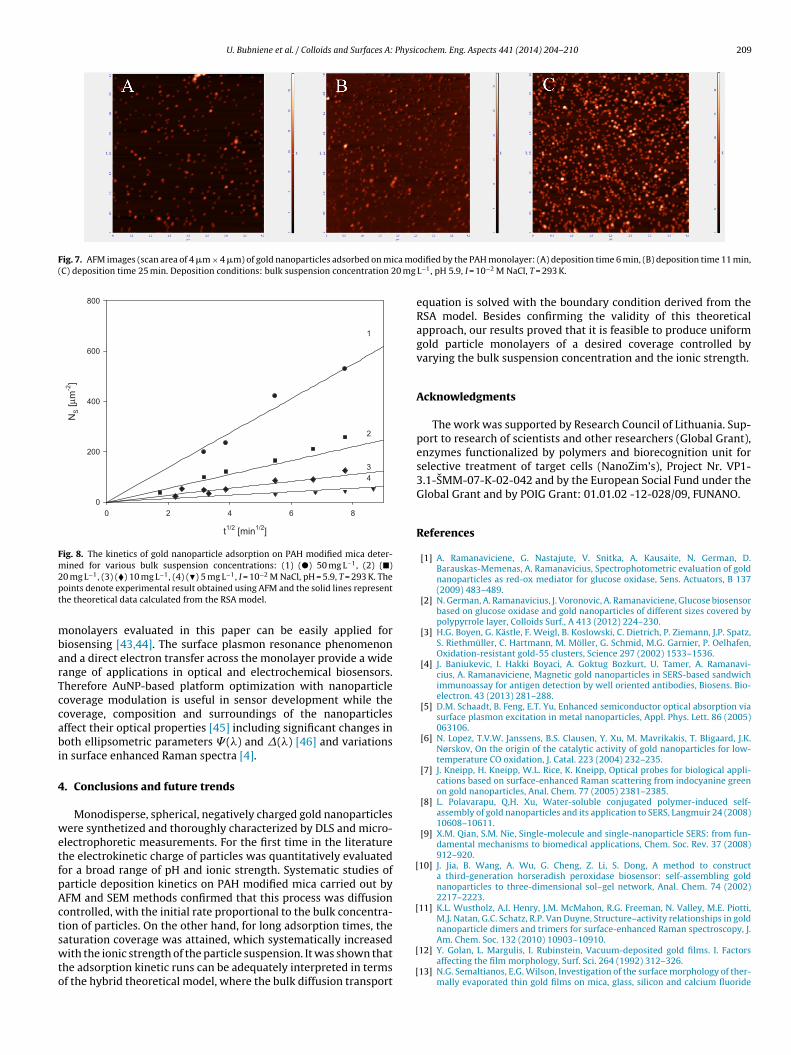
The surface concentration (coverage) of formed monolayers wasdetermined ex situ by AFM and SEM. The number of particles perunit area of the surface was determined from AFM images usingimage-analysis software. As can be seen in Fig. 7 the coverage ofgold nanoparticles on mica systematically increases with the timeof deposition. Quantitatively, the kinetic runs obtained for variousbulk suspension concentrations are presented in Fig. 8 as the depen-dence of the surface concentration of particles on the square root ofthe adsorption time. This coordinate system is appropriate for thediffusion-controlled kinetics as shown in previous papers dealingwith nanoparticle deposition on solid substrates [32,35].
As can be seen, particle surface concentration increases linearlywith t1/2, with the slope proportional to the bulk particle concen-tration. This agrees with the theoretical predictions (solid lines inFig. 8) derived for the hybrid model where the bulk diffusion trans-port equation is numerically solved by the finite-difference methodwith the boundary condition (blocking function) is derived from therandom sequential adsorption (RSA) model [32,35].
Additionally, the maximum coverage of gold particle monolay-ers was determined as a function of ionic strength using AFM andSEM imaging. For the 10−4 M NaCl concentration the maximum
−3
coverage was 10% increasing to 13% for 10 M NaCl and 15%, for10−2 M NaCl.There are many published reviews about gold nanoparticlesand their possible applications in biosensors [39–42]. The gold
Fig. 6. The dependence of the electrophoretic mobility of gold particles on ionicstrength for: (1) (�) pH 3.0, 2) (�) pH 5.9, 3) (�) pH 9.0, T = 298 K, sol concentration50 mg L−1. The solids lines denote non-linear fits of experimental data.
U. Bubniene et al. / Colloids and Surfaces A: Physicochem. Eng. Aspects 441 (2014) 204– 210 209
Fig. 7. AFM images (scan area of 4 �m × 4 �m) of gold nanoparticles adsorbed on mica mo(C) deposition time 25 min. Deposition conditions: bulk suspension concentration 20 mg
Fig. 8. The kinetics of gold nanoparticle adsorption on PAH modified mica deter-mined for various bulk suspension concentrations: (1) (�) 50 mg L−1, (2) (�)2pt
mbarTccabi
4
wetfpActswto
[
[
0 mg L−1, (3) (�) 10 mg L−1, (4) (�) 5 mg L−1, I = 10−2 M NaCl, pH = 5.9, T = 293 K. Theoints denote experimental result obtained using AFM and the solid lines representhe theoretical data calculated from the RSA model.
onolayers evaluated in this paper can be easily applied foriosensing [43,44]. The surface plasmon resonance phenomenonnd a direct electron transfer across the monolayer provide a wideange of applications in optical and electrochemical biosensors.herefore AuNP-based platform optimization with nanoparticleoverage modulation is useful in sensor development while theoverage, composition and surroundings of the nanoparticlesffect their optical properties [45] including significant changes inoth ellipsometric parameters � (�) and �(�) [46] and variations
n surface enhanced Raman spectra [4].
. Conclusions and future trends
Monodisperse, spherical, negatively charged gold nanoparticlesere synthetized and thoroughly characterized by DLS and micro-
lectrophoretic measurements. For the first time in the literaturehe electrokinetic charge of particles was quantitatively evaluatedor a broad range of pH and ionic strength. Systematic studies ofarticle deposition kinetics on PAH modified mica carried out byFM and SEM methods confirmed that this process was diffusionontrolled, with the initial rate proportional to the bulk concentra-ion of particles. On the other hand, for long adsorption times, the
aturation coverage was attained, which systematically increasedith the ionic strength of the particle suspension. It was shown thathe adsorption kinetic runs can be adequately interpreted in termsf the hybrid theoretical model, where the bulk diffusion transport
[
[
dified by the PAH monolayer: (A) deposition time 6 min, (B) deposition time 11 min,L−1, pH 5.9, I = 10−2 M NaCl, T = 293 K.
equation is solved with the boundary condition derived from theRSA model. Besides confirming the validity of this theoreticalapproach, our results proved that it is feasible to produce uniformgold particle monolayers of a desired coverage controlled byvarying the bulk suspension concentration and the ionic strength.
Acknowledgments
The work was supported by Research Council of Lithuania. Sup-port to research of scientists and other researchers (Global Grant),enzymes functionalized by polymers and biorecognition unit forselective treatment of target cells (NanoZim’s), Project Nr. VP1-3.1-SMM-07-K-02-042 and by the European Social Fund under theGlobal Grant and by POIG Grant: 01.01.02 -12-028/09, FUNANO.
References
[1] A. Ramanaviciene, G. Nastajute, V. Snitka, A. Kausaite, N. German, D.Barauskas-Memenas, A. Ramanavicius, Spectrophotometric evaluation of goldnanoparticles as red-ox mediator for glucose oxidase, Sens. Actuators, B 137(2009) 483–489.
[2] N. German, A. Ramanavicius, J. Voronovic, A. Ramanaviciene, Glucose biosensorbased on glucose oxidase and gold nanoparticles of different sizes covered bypolypyrrole layer, Colloids Surf., A 413 (2012) 224–230.
[3] H.G. Boyen, G. Kästle, F. Weigl, B. Koslowski, C. Dietrich, P. Ziemann, J.P. Spatz,S. Riethmüller, C. Hartmann, M. Möller, G. Schmid, M.G. Garnier, P. Oelhafen,Oxidation-resistant gold-55 clusters, Science 297 (2002) 1533–1536.
[4] J. Baniukevic, I. Hakki Boyaci, A. Goktug Bozkurt, U. Tamer, A. Ramanavi-cius, A. Ramanaviciene, Magnetic gold nanoparticles in SERS-based sandwichimmunoassay for antigen detection by well oriented antibodies, Biosens. Bio-electron. 43 (2013) 281–288.
[5] D.M. Schaadt, B. Feng, E.T. Yu, Enhanced semiconductor optical absorption viasurface plasmon excitation in metal nanoparticles, Appl. Phys. Lett. 86 (2005)063106.
[6] N. Lopez, T.V.W. Janssens, B.S. Clausen, Y. Xu, M. Mavrikakis, T. Bligaard, J.K.Nørskov, On the origin of the catalytic activity of gold nanoparticles for low-temperature CO oxidation, J. Catal. 223 (2004) 232–235.
[7] J. Kneipp, H. Kneipp, W.L. Rice, K. Kneipp, Optical probes for biological appli-cations based on surface-enhanced Raman scattering from indocyanine greenon gold nanoparticles, Anal. Chem. 77 (2005) 2381–2385.
[8] L. Polavarapu, Q.H. Xu, Water-soluble conjugated polymer-induced self-assembly of gold nanoparticles and its application to SERS, Langmuir 24 (2008)10608–10611.
[9] X.M. Qian, S.M. Nie, Single-molecule and single-nanoparticle SERS: from fun-damental mechanisms to biomedical applications, Chem. Soc. Rev. 37 (2008)912–920.
10] J. Jia, B. Wang, A. Wu, G. Cheng, Z. Li, S. Dong, A method to constructa third-generation horseradish peroxidase biosensor: self-assembling goldnanoparticles to three-dimensional sol–gel network, Anal. Chem. 74 (2002)2217–2223.
11] K.L. Wustholz, A.I. Henry, J.M. McMahon, R.G. Freeman, N. Valley, M.E. Piotti,M.J. Natan, G.C. Schatz, R.P. Van Duyne, Structure–activity relationships in goldnanoparticle dimers and trimers for surface-enhanced Raman spectroscopy, J.
Am. Chem. Soc. 132 (2010) 10903–10910.12] Y. Golan, L. Margulis, I. Rubinstein, Vacuum-deposited gold films. I. Factorsaffecting the film morphology, Surf. Sci. 264 (1992) 312–326.
13] N.G. Semaltianos, E.G. Wilson, Investigation of the surface morphology of ther-mally evaporated thin gold films on mica, glass, silicon and calcium fluoride
2 Physic
[
[
[
[
[
[
[
[
[
[
[
[
[
[
[
[
[
[
[
[
[
[
[
[
[
[
[
[
[
[
[
[
10 U. Bubniene et al. / Colloids and Surfaces A:
substrates by scanning tunneling microscopy, Thin solid films 366 (2000)111–116.
14] M. Okumura, S. Nakamura, S. Tsubota, T. Nakamura, M. Azuma, M. Haruta,Chemical vapor deposition of gold on Al2O3, SiO2, TiO2 for the oxidation ofCO and H2, Catal. Lett. 51 (1998) 53–58.
15] M.J. Hostetler, R.W. Murray, Colloids and self-assembled monolayers, Curr.Opin. Colloid Interface Sci. 2 (1997) 42–50.
16] K. Aslan, J.R. Lakowicz, C.D. Geddes, Rapid deposition of triangular silvernanoplates on planar surfaces; application to metal-enhanced fluorescence,J. Phys. Chem., B 109 (2005) 6247–6251.
17] K. Kim, H. Ryoo, Y.M. Lee, K.S. Shin, Adsorption characteristics of Au nanopar-ticles onto poly(4-vinylpyridine) surface revealed by QCM, AFM, UV/vis, andRaman scattering spectroscopy, J Colloid. Interf. Sci. 342 (2010) 479–484.
18] E.S. Kooij, E.A.M. Brouwer, H. Wormeester, B. Poelsema, Ionic strength medi-ated self-organization of gold nanocrystals: an AFM study, Langmuir 18 (2002)7677–7682.
19] S. Meltzer, R. Resch, B.E. Koel, M.E. Thompson, A. Madhukar, A.A.G. Requicha, P.Will, Fabrication of nanostructures by hydroxylamine seeding of gold nanopar-ticle templates, Langmuir 17 (2001) 1713–1718.
20] K.C. Grabar, R.G. Freeman, M.B. Hommer, M.J. Natan, Preparation and charac-terization of Au colloid monolayers, Anal. Chem. 67 (1995) 735–743.
21] E.A.M. Brouwer, E.S. Kooij, M. Hakbijl, H. Wormeester, B. Poelsema, Depositionkinetics of nanocolloidal gold particles, Colloids Surf., A 267 (2005) 133–138.
22] E.A.M. Brouwer, E.S. Kooij, H. Wormeester, B. Poelsema, Ionic strength depen-dent kinetics of nanocolloidal gold deposition, Langmuir 19 (2003) 8102–8108.
23] E.S. Kooij, E.A.M. Brouwer, H. Wormeester, B. Poelsema, Formation and opti-cal characterisation of colloidal gold monolayers, Colloids Surf., A 222 (2003)103–111.
24] J. Schmitt, P. Mächtle, D. Eck, H. Möhwald, C.A. Helm, Preparation and opticalproperties of colloidal gold monolayers, Langmuir 15 (1999) 3256–3266.
25] G. Bar, S. Rubin, R.W. Cutts, T.N. Taylor, T.A. Zawodzinski, Dendrimer-modifiedsilicon oxide surfaces as platforms for the deposition of gold and silver colloidmonolayers: preparation method, characterization, and correlation betweenmicrostructure and optical properties, Langmuir 12 (1996) 1172–1179.
26] K.C. Grabar, K.R. Brown, Ch.D. Keating, S.J. Stranick, S.L. Tang, M.J. Natan,Nanoscale characterization of gold colloid monolayers: a comparison of fourtechniques, Anal. Chem. 69 (1997) 471–477.
27] M. Brust, D. Bethell, C.J. Kiely, D.J. Schiffrin, Self-assembled gold nanoparti-cle thin films with nonmetallic optical and electronic properties, Langmuir 14(1998) 5425–5429.
28] Z. Adamczyk, M. Zaucha, M. Zembala, Zeta potential of mica covered by colloidparticles: a streaming potential study, Langmuir 26 (2010) 9368–9377.
29] J. Kimling, M. Maier, B. Okenve, V. Kotaidis, H. Ballot, A. Plech, Turkevichmethod for gold nanoparticle synthesis revisited, J. Phys. Chem. B 110 (2006)15700–15707.
[
ochem. Eng. Aspects 441 (2014) 204– 210
30] G. Frens, Controlled nucleation for the regulation of the particle size inmonodisperse gold suspensions, Nat. Phys. Sci. 241 (1973) 20–22.
31] F.A. Amir Tabrizi, H. Ayhan, Gold nanoparticle synthesis and characterisation,Hacet. J. Biol. Chem. 3 (2009) 217–226.
32] M. Ocwieja, Z. Adamczyk, K. Kubiak, Tuning properties of silver particle mono-layers via controlled adsorption–desorption processes, J. Colloid. Interface Sci.376 (2012) 1–11.
33] Z. Adamczyk, M. Zembala, A. Michna, Polyelectrolyte adsorption layers studiedby streaming potential and particle deposition, J. Colloid. Interface Sci. 303(2006) 353–364.
34] M. Morga, Z. Adamczyk, Monolayers of cationic polyelectrolytes onmica—electrokinetic studies, J. Colloid. Interface Sci. 407 (2013) 196–204.
35] M. Ocwieja, Z. Adamczyk, M. Morga, A. Michna, High density silver nanoparticlemonolayers produced by colloid self-assembly on polyelectrolyte supportinglayers, J. Colloid. Interface Sci. 364 (2011) 39–48.
36] Z. Adamczyk, B. Jachimska, M. Kolasinska, Structure of colloid silica deter-mined by viscosity measurements, J. Colloid. Interface Sci. 273 (2004)668–674.
37] J.M. Zook, V. Rastogi, R.I. MacCuspie, A.M. Keene, J. Fagan, Measuring agglom-erate size distribution and dependence of localized surface plasmon resonanceabsorbance on gold nanoparticle agglomerate size using analytical ultracen-trifugation, ACS Nano 5 (2011) 8070–8079.
38] J.D. Clogston, A.K. Patri, Zeta Potential Measurement, Humana Press, New York,2011, pp. 63–70.
39] M. Mascini, S. Tombelli, Biosensors for biomarkers in medical diagnostics,Biomarkers 13 (2008) 637–657.
40] L.A. Dykman, N.G. Khlebtsov, Gold nanoparticles in biology and medicine:recent advances and prospects, Acta naturae 3 (2011) 34–55.
41] C. Jianrong, M. Yuqing, H. Nongyue, W. Xiaohua, L. Sijiao, Nanotechnology andbiosensors, Biotechnol. Adv. 22 (2004) 505–518.
42] Y. Li, H. Schluesener, S. Xu, Gold nanoparticle-based biosensors, Gold Bull. 43(2010) 29–41.
43] P.E. Chow, Gold nanoparticles: properties, characterization and fabrication, in:Nanotechnology Science and Technology, Nova Science Publishers Inc., NewYork, 2011, pp. 1–343.
44] L.K. Chau, H.T. Chang, From Bioimaging to Biosensors: Noble Metal Nanopar-ticles in Biodetection, Pan Stanford Publishing Pte. Ltd., Singapore, 2013, pp.1–322.
45] Y. Yin, Y. Lu, B. Gates, Y. Xia, Template-assisted self-assembly: a practicalroute to complex aggregates of monodispersed colloids with well-defined sizes,
shapes, and structures, J. Am. Chem. Soc. 123 (2001) 8718–8729.46] Z. Balevicius, R. Drevinskas, M. Dapkus, G.J. Babonas, A. Ramanaviciene, A.Ramanavicius, Total internal reflection ellipsometry of metal-organic com-pound structures modified with gold nanoparticles, Thin Solid Films 519 (2011)2959–2962.