Contemporary Educational Psychology - Kent State University
11
Contents lists available at ScienceDirect Contemporary Educational Psychology journal homepage: www.elsevier.com/locate/cedpsych Number lines, but not area models, support children’s accuracy and conceptual models of fraction division Pooja G. Sidney a, ⁎ , Clarissa A. Thompson b , Ferdinand D. Rivera c a Department of Psychology, University of Kentucky, United States b Department of Psychological Sciences, Kent State University, United States c Department of Mathematics and Statistics, San Jose State University, United States ARTICLE INFO Keywords: Fractions Diagrams Problem solving Mathematics cognition Number lines ABSTRACT The Common Core State Standards in Mathematics recommends that children should use visual models to re- present fraction operations, such as fraction division. However, there is little experimental research on which visual models are the most effective for helping children to accurately solve and conceptualize these operations. In the current study, 123 fifth and sixth grade students solved fraction division problems in one of four visual model conditions: number lines, circular area models, rectangular area models, or no visual model at all. Children who solved the problems accompanied by a number line were more accurate and showed evidence of consistently producing sound conceptual models across the majority of problems than did children who com- pleted problems with either area model or no visual model at all. These findings are particularly striking given that children have experienced partitioning area models into equal shares as early as first grade, thus circles and rectangles were likely familiar to children. The number line advantage may stem from the fact that they afford the ability to represent both operand magnitudes in relation to one another and relative to a common endpoint. Future work should investigate the optimal order that instructors should introduce various visual models to promote children’s representational fluency across number lines and area models. 1. Introduction Reasoning about fraction operations is a critical aspect in the de- velopment of children’s deep understanding of mathematics. The National Mathematics Advisory Panel (NMAP, 2008) considers under- standing fractions to be foundational for algebra (p. xviii). Empirically, children’s understanding of fractions predicts later mathematics achievement and success in algebra (e.g., Bailey, Hoard, Nugent, & Geary, 2012; Siegler et al., 2012). However, despite the importance of children’s understanding of fraction operations, this facet of early and middle mathematics is notoriously difficult for children (e.g., Mack, 1990, 1995, 2001; Siegler, Thompson, & Schneider, 2011) and adults (e.g., Ball, 1990; Luo, Lo, & Leu, 2011; Ma, 1999). Even though fraction learning begins early in first grade, many students continue to struggle to accurately represent and perform fraction operations (Lortie- Forgues, Tian, & Siegler, 2015; Sidney & Alibali, 2015, 2017; Siegler & Pyke, 2013; Siegler et al., 2011). One common way of supporting children’s understanding of chal- lenging fraction concepts is by using visual models, and other external representations, during instruction and problem-solving activities. Reflecting this common practice, the IES Practice Guide for Developing Effective Fraction Instruction for Kindergarten through 8th Grade (Siegler, Carpenter, Fennell, Geary, Lewis, Okamoto, & Wray, 2010) directly recommends that instructors use visual models to engage stu- dents in sense-making activities and to ground their understanding of fraction concepts and procedures. According to the Common Core Standards Writing Team (2013), fractions should be first introduced with visual models in first and second grade under the Geometry strand (e.g., partitioning circles and rectangles into two, three, and four equal shares; 1.G.A.3; 2.G.A.3). The number line is introduced in third grade, when students use partitioning to place fractions on the line. Fourth and fifth graders should learn about multiplication (4.NF.B.4, 5.NF.B.4, 5.NF.B.5, 5.NF.B.6) and division (5.NF.B.3, 5.NF.B.7) with fractions with reference to visual models. Many research-based and empirically- tested effective fraction interventions, such as the Rational Number Project Curriculum (Cramer, Behr, Post, & Lesh, 1997; Cramer, Post, & del Mas, 2002) and several others (e.g., Fazio, Kennedy, & Siegler, 2016; Fuchs et al., 2013; Kellman et al., 2008; Moss & Case, 1999; Rau, Aleven, Rummel, & Pardos, 2014), include visual models as key com- ponents. As this body of research and practice recommendations https://doi.org/10.1016/j.cedpsych.2019.03.011 ⁎ Corresponding author at: Department of Psychology, University of Kentucky, 012E Kastle Hall, Lexington, KY 40506, United States. E-mail address: [email protected] (P.G. Sidney). Contemporary Educational Psychology 58 (2019) 288–298 Available online 26 March 2019 0361-476X/ © 2019 Elsevier Inc. All rights reserved. T
-
Upload
khangminh22 -
Category
Documents
-
view
5 -
download
0
Transcript of Contemporary Educational Psychology - Kent State University
Contents lists available at ScienceDirect
Contemporary Educational Psychology
journal homepage: www.elsevier.com/locate/cedpsych
Number lines, but not area models, support children’s accuracy andconceptual models of fraction division
Pooja G. Sidneya,⁎, Clarissa A. Thompsonb, Ferdinand D. Riverac
a Department of Psychology, University of Kentucky, United StatesbDepartment of Psychological Sciences, Kent State University, United Statesc Department of Mathematics and Statistics, San Jose State University, United States
A R T I C L E I N F O
Keywords:FractionsDiagramsProblem solvingMathematics cognitionNumber lines
A B S T R A C T
The Common Core State Standards in Mathematics recommends that children should use visual models to re-present fraction operations, such as fraction division. However, there is little experimental research on whichvisual models are the most effective for helping children to accurately solve and conceptualize these operations.In the current study, 123 fifth and sixth grade students solved fraction division problems in one of four visualmodel conditions: number lines, circular area models, rectangular area models, or no visual model at all.Children who solved the problems accompanied by a number line were more accurate and showed evidence ofconsistently producing sound conceptual models across the majority of problems than did children who com-pleted problems with either area model or no visual model at all. These findings are particularly striking giventhat children have experienced partitioning area models into equal shares as early as first grade, thus circles andrectangles were likely familiar to children. The number line advantage may stem from the fact that they affordthe ability to represent both operand magnitudes in relation to one another and relative to a common endpoint.Future work should investigate the optimal order that instructors should introduce various visual models topromote children’s representational fluency across number lines and area models.
1. Introduction
Reasoning about fraction operations is a critical aspect in the de-velopment of children’s deep understanding of mathematics. TheNational Mathematics Advisory Panel (NMAP, 2008) considers under-standing fractions to be foundational for algebra (p. xviii). Empirically,children’s understanding of fractions predicts later mathematicsachievement and success in algebra (e.g., Bailey, Hoard, Nugent, &Geary, 2012; Siegler et al., 2012). However, despite the importance ofchildren’s understanding of fraction operations, this facet of early andmiddle mathematics is notoriously difficult for children (e.g., Mack,1990, 1995, 2001; Siegler, Thompson, & Schneider, 2011) and adults(e.g., Ball, 1990; Luo, Lo, & Leu, 2011; Ma, 1999). Even though fractionlearning begins early in first grade, many students continue to struggleto accurately represent and perform fraction operations (Lortie-Forgues, Tian, & Siegler, 2015; Sidney & Alibali, 2015, 2017; Siegler &Pyke, 2013; Siegler et al., 2011).
One common way of supporting children’s understanding of chal-lenging fraction concepts is by using visual models, and other externalrepresentations, during instruction and problem-solving activities.
Reflecting this common practice, the IES Practice Guide for DevelopingEffective Fraction Instruction for Kindergarten through 8th Grade(Siegler, Carpenter, Fennell, Geary, Lewis, Okamoto, & Wray, 2010)directly recommends that instructors use visual models to engage stu-dents in sense-making activities and to ground their understanding offraction concepts and procedures. According to the Common CoreStandards Writing Team (2013), fractions should be first introducedwith visual models in first and second grade under the Geometry strand(e.g., partitioning circles and rectangles into two, three, and four equalshares; 1.G.A.3; 2.G.A.3). The number line is introduced in third grade,when students use partitioning to place fractions on the line. Fourth andfifth graders should learn about multiplication (4.NF.B.4, 5.NF.B.4,5.NF.B.5, 5.NF.B.6) and division (5.NF.B.3, 5.NF.B.7) with fractionswith reference to visual models. Many research-based and empirically-tested effective fraction interventions, such as the Rational NumberProject Curriculum (Cramer, Behr, Post, & Lesh, 1997; Cramer, Post, &del Mas, 2002) and several others (e.g., Fazio, Kennedy, & Siegler,2016; Fuchs et al., 2013; Kellman et al., 2008; Moss & Case, 1999; Rau,Aleven, Rummel, & Pardos, 2014), include visual models as key com-ponents. As this body of research and practice recommendations
https://doi.org/10.1016/j.cedpsych.2019.03.011
⁎ Corresponding author at: Department of Psychology, University of Kentucky, 012E Kastle Hall, Lexington, KY 40506, United States.E-mail address: [email protected] (P.G. Sidney).
Contemporary Educational Psychology 58 (2019) 288–298
Available online 26 March 20190361-476X/ © 2019 Elsevier Inc. All rights reserved.
T
demonstrates, there is a great deal of variability in how and which vi-sual models are used, with some interventions (e.g., Rau et al., 2014)including multiple types of visual models, raising the question ofwhether some types of visual models support children’s fraction rea-soning better than others.
1.1. Visual models for fractions
In this study, we examine two types of visual models for re-presenting fraction concepts: area models and linear models. Areamodels are visual models that represent fractions as parts of wholeshapes such as circles or rectangles. Typically, whole shapes are parti-tioned into equal parts, and fraction denominators are represented bythe total number of equal parts in each whole shape and fraction nu-merators are represented by the total number of shaded parts. Areamodels are quite common; recent empirical studies conducted on chil-dren’s and adults’ reasoning with complex elementary fraction multi-plication and division tasks demonstrate a preponderance of areamodels during instruction (e.g., Baek et al., 2017; Speiser & Walter,2015; Webel & DeLeeuw, 2016). These types of models are thought toemphasize students’ part-whole conceptions of fractions (e.g., Kieren,1976; Wu, 2011), and can successfully support children’s visual re-presentation of fractions and understanding the role of common de-nominators in fraction addition and subtraction (Cramer, Wyberg, &Leavitt, 2008).
Despite their common use, there are many possible limitations ofusing area models to reason about fraction concepts (e.g., CommonCore Standards Writing Team, 2013; Kieren, 1976; Moss & Case, 1999;National Research Council, 2005; Parker & Baldridge, 2004; Wu, 2011).First, given the discrete nature of area models, especially circular areamodels in which whole units are represented discontinuously by in-dividual shapes, they may prevent children’s conceptualization offractions as a measurement. As we discuss in a later section, this may beparticularly detrimental for using area models to visually representcertain fraction arithmetic concepts. Second, when representing com-plex relationships on an area model from a measurement standpoint,fractions and, say, their products refer to different units (i.e., lengthsand areas), and, consequently, it is difficult to ascribe meaning to ex-pressions such as × +
12
14
23 . Third, given their discrete nature, area
models may pose challenges for representing fractions greater than 1, asthese representations would necessarily span multiple, and in the caseof circular area models, disconnected, shapes. Fourth, area models maybe less effective because their part-whole nature may disrupt children’sability to represent two operands on the same visual diagram (e.g.,representing 2/3 on circles that have already been partitioned intosixths). Finally, they may be less likely to afford representing eachoperand in relation to 0 as a common anchor point, preventing childrenfrom directly comparing relative magnitudes of operands.
In contrast to area models, linear models, such as the number line,are thought to highlight a measurement model of fractions (Kieren,1976; Moss & Case, 1999) and readily allow children to reason aboutthe magnitude of fractions relative to other rational numbers (Siegleret al., 2011). In particular, fraction multiplication from a measurementperspective provides a more appropriate definition of multiplication (asscaling) that applies to all rational numbers, overcoming conceptuallimitations associated with area models (e.g., repeated addition). Fur-thermore, number line models support awareness of units, which iscentral to the development of deep understanding of fraction opera-tions. Students learn that adding and subtracting fractions involvinglike and unlike denominators require the same initial process of con-structing common units, and that multiplying and dividing fractionsgenerate compound units. Siegler et al. (2011) have argued thatnumber line models are a critically important tool for reasoning aboutfractions, and more generally, all rational numbers. Indeed, in studies ofchildren’s whole number magnitude reasoning, children are better ableto reason about whole number arithmetic when addend magnitudes
were represented on number lines (e.g., Booth & Siegler, 2008). Simi-larly, learning about fractions using number lines can result in betterunderstanding of the relative magnitude of fractions (e.g., Fazio et al.,2016) and children who can place fractions on number lines with betterprecision are also more likely to have better fraction arithmetic skills(Siegler & Pyke, 2013; Siegler et al., 2011). Given this empirical evi-dence suggesting that number lines can be an effective external visualrepresentation for reasoning about and understanding fraction magni-tudes, and relative magnitudes of fractions, the IES Practice Guidespecifically recommends using number line models as a central re-presentational tool.
1.2. Comparing visual models
Despite these theoretical arguments, research, and recommenda-tions pointing towards the utility of number lines as an effective visualmodel for understanding fractions, and the many potential pitfalls ofarea models, recent studies with elementary students remain incon-clusive about the most optimal visual model for learning fraction con-cepts (Cramer & Wyburg, 2009; Wilkerson et al., 2015). Few studieshave directly compared the relative benefits and limitations of usingthese two types of visual models during learning or problem solving.Here, we argue that area models and linear models, specifically numberline models, likely do have differential effects on children’s fractionreasoning due to different affordances of these representations.
Children’s behavior is inherently variable (Siegler, 1996). Problemswith different features often afford different strategies; for example,empirical research clearly demonstrates that specific features of frac-tion tasks contribute to intraindividual variability in students’ ap-proaches (e.g., Alibali & Sidney, 2015; Fazio, DeWolf, & Siegler, 2016;Schneider & Siegler, 2010). Visual models can highlight different as-pects of complex conceptual relationships (see Rau & Matthews, 2017for a discussion, Ainsworth, 2006), and even minor perceptual differ-ences in visual models for fractions may elicit slightly different ways ofreasoning, and approaches to problem solving, that are more or lessaccurate. For example, in one study of young children’s proportionalreasoning, Boyer, Levine, and Huttenlocher (2008) compared children’sability to match proportions across visual representations in whichproportions were represented with two differently-colored continuousareas or partitioned areas. When visual representations of mixturesincluded discrete partitions, these visuals elicited counting-based stra-tegies, disrupting children’s ability to match based on overall propor-tion. Thus, this relatively minor perceptual difference, including par-titions or not, shaped children’s strategies for reasoning in this task.
Two recent experimental studies (Hamdan & Gunderson, 2017;Kaminski, 2018) have compared children’s learning about fractionmagnitudes and fraction addition using circular area models, linearmodels (e.g., number lines), or no model at all. In line with what severalresearchers have proposed (e.g., Moss & Case, 1999; Siegler et al.,2011), Hamdan and Gunderson observed a number line advantage.Students who were trained to use a number line to represent fractionmagnitudes were more successful on a later, symbol-only fractioncomparison task than students who were trained to use circular areamodels. In contrast, across two experiments, Kaminski (2018) found noadvantage of visual models for understanding fraction addition incomparison to instruction without visual models, and even observedsome detrimental effects of using number lines for learning fractionaddition.
Across this limited evidence, it remains unclear whether numberlines better support children’s understanding of fractions, and fractionarithmetic, and under what conditions. Furthermore, as demonstratedby Kaminski (2018) findings, although external visual models can helplearners to generate internal, mental models of complex relationships(e.g., Butcher, 2006) and support accurate problem solving (e.g.,Cooper, Sidney, & Alibali, 2018; Larkin & Simon, 1987) in comparisonto text alone with no visual model, including diagrams in practice and
P.G. Sidney, et al. Contemporary Educational Psychology 58 (2019) 288–298
289
instruction does not always lead to increased learning (e.g., Kaminski &Sloutsky, 2013; Bergey, Cromley, Kirchgessner, & Newcombe, 2015).Finally, because the studies conducted by Hamdan and Gunderson(2017) and Kaminski (2018) have focused primarily on fraction mag-nitudes and simple, common denominator fraction addition, little isknown about how visual representations support, or fail to support,children’s effective reasoning about other arithmetic operations.
1.3. Fraction division
In the current study, we focus on fraction division given children’s(Sidney & Alibali, 2015, 2017) and even adults’ (Ma, 1999; Sidney,Hattikudur, & Alibali, 2015) relatively poor performance on commonmeasures of conceptual understanding of fraction division. Within ra-tional number arithmetic, division is arguably the most difficult to re-present and the least well understood arithmetic operation (see Ball,1990; Dixon, Deets, & Bangert, 2001; Ma, 1999; Sidney, Chan, &Alibali, 2013; Siegler et al., 2011). Thus, we targeted fraction divisionwith an aim to elicit sound conceptual models of the most challengingfraction concept covered in elementary school mathematics.
Two common conceptual models for reasoning about division arequotitive models of division and partitive models of division. When re-presenting a quotitive model of division, children must reason about themagnitude of the first operand (i.e., the dividend), the magnitude of thesecond operand (i.e., the divisor), and the quotient as an indicator ofthe relative size of the divisor to the dividend (i.e., how many timesdoes the divisor “fit” into the dividend). In a partitive model of division,children also need to represent the magnitude of the first operand (i.e.,the dividend), but represent the magnitude of the second operand (i.e.,the divisor) as a number of equal groups or segments and the quotientas the magnitude of each group or segment. Although children use bothpartitive and quotitive models to reason about whole number division(Sidney et al., 2013), children tend to rely on quotitive models of di-vision when reasoning about fraction division (Fischbein, Deri, Nello, &Marino, 1985).
Given the nature of quotitive models of division, we expected thatnumber lines would better elicit sound conceptual models of fractiondivision than area models. First, quotitive models of division, alsocalled measurement models of division (e.g., Cramer, Monson, Whitney,Leavitt, & Wyberg, 2010), rely on the conceptualization of fractions as ameasurement, which number lines are thought to highlight (e.g., Moss& Case, 1999). Second, not only do linear models, such as number lines,appear to effectively support children’s reasoning about individualfraction magnitudes (e.g., Moss & Case, 1999; Siegler et al., 2011; Fazioet al., 2016), which is a fundamental first step towards constructing aconceptually-sound visual model of division, we also expected that theywould also afford reasoning about the relative magnitudes of operands.A number line allows students to represent more than one numericalmagnitude, or operand, on a single, common scale (e.g., both 4 and 1/5from the fraction division problem 4÷1/5 can be represented relativeto 0 on a single number line that ranges from 0 on the left to 6 on theright), with 0 as a common anchor point. This may better allow learnersto directly perceive and compare the relative magnitudes of the divi-dend and the divisor, which may afford more accurate reasoning aboutthe quotient as well.
1.4. Current study
The primary goal of the current study was to examine whether thenature of visual models shape children’s ability to reason about theconceptual relationships between dividend, divisor, and quotient infraction division. Furthermore, given the mixed evidence for the utilityof visual models for learning about fraction arithmetic (Kaminski,2018), we examined whether visual models do provide support forchildren’s emerging fraction division understanding in contrast to rea-soning without visual models. Thus, in the current study, we
investigated whether asking children to solve fraction division pro-blems using a number line, an area model, or no visual model at allresulted in more conceptually-sound, and successful approaches toreasoning about fraction division. To capture their conceptual under-standing and interpretation of the relationship between dividend, di-visor, and quotient, we inspected whether children’s written work onresearcher-provided visual models reflected conceptually-sound modelsof division. To capture children’s problem-solving success, we measuredchildren’s generation of a correct quotient, regardless of the child’ssolution method. Critically, we observed children’s approaches tofraction division understanding near the beginning of their business-as-usual fraction division instruction, before learning about complexfraction division (i.e., division with a proper fraction or mixed number).This allowed us to observe the differential effects of visual models onchildren’s emerging ideas about fraction division, rather than roteknowledge of procedures, such as invert-and-multiply.
1.5. Hypotheses
We hypothesized that asking children to use visual models to reasonabout fraction division would be beneficial for their problem solvingand reasoning. First and foremost, we expected a number line advantage,such that children who solved problems with a number line would havehigher accuracy rates, and be more likely to generate conceptualmodels of division, than children in any other experimental condition(H1a). Among the remaining children, we expected a visual modeladvantage such that those who solved problems with an area modelwould have greater success than those who solved problems with novisual model (H1b). Finally, we planned to compare children’s accuracyin each area model condition, rectangular area and circular area, toexamine whether the more linear, continuous rectangular model wouldsupport accuracy in comparison to discrete circles (H1c).
Furthermore, we hypothesized that the number line advantage wasdue in part to differences in how number lines and circles afford re-presenting the given operands (H2). We expected that some children,particularly those provided with circles and rectangles, might choose torepresent each operand on different parts of the diagram (i.e., on dif-ferent circles), which might disrupt their ability to reason about therelative magnitudes of the two operands. In contrast, we expected thatchildren would be less likely to represent magnitudes on two separate,non-overlapping segments of the number line diagrams, given that theyafford representing each magnitude relative to the same, commonendpoint (i.e., starting at 0).
Additionally, we explored our data in two ways. First, we exploredwhether children’s confidence and perceptions of difficulty differedacross visual models. Although we expected number lines to affordsound conceptual reasoning about fraction division, we expected thatchildren might be more familiar with area models, and thus moreconfident in their performance, since students in the US are introducedto dividing area models into equal fractional shares as early as firstgrade (Confrey, Maloney, Nguyen, Mojica, & Myers, 2009). Givenprevious research (Wall, Thompson, Dunlosky, & Merriman, 2016) thatshowed children were more accurate and confident when estimatingthe magnitudes of numbers within smaller, more familiar numericalranges than when estimating numbers within larger, less familiar nu-merical ranges, we sought to explore the possibility that children maybe more confident, and report less difficulty, with more familiar areamodels. Second, we explored whether the diagrams used during thefocal problem-solving task affected children’s reasoning on two othertypes of tasks designed to assess conceptual knowledge of fraction di-vision: story generation and story problem-solving.
P.G. Sidney, et al. Contemporary Educational Psychology 58 (2019) 288–298
290
2. Method
2.1. Power analysis
To determine our necessary sample size, we ran an a priori poweranalysis based on our initial plan of using ANCOVA to examine theeffect of experimental visual model condition on children’s perfor-mance during the focal task. Based on prior work examining the role ofdiagrams in learning (e.g., Beitzel & Staley, 2015; Butcher, 2006;Moreno, Ozogul, & Reisslein, 2011), we anticipated that differences invisual model condition would explain about 6% of unique variance inperformance, ηp2= 0.06, over and above our covariates. Using the pwrpackage (Champely, 2015) in R, we determined that a sample size of120 participants was necessary for 80% power to detect an effect of thissize for a 1 df test in a model that included fixed effects of condition andthree covariates (grade, gender, and problem order).
2.2. Participants
Participants were 123 children in late Spring of 5th grade or Fall of6th grade (M age= 11.6y, SD=1.4y; 45.6% girls; 75.0% White) fromone public intermediate school in the midwestern United States. Statestandards for mathematics education are aligned with the CCSSM, withfraction division first introduced in 5th grade. A small proportion ofchildren at this school qualify for the free and reduced-price lunchprogram (18.30%). We obtained mathematics achievement data fromthe Spring before study enrollment for 113 participants, missing datawas primarily from children who had not completed a standardizedassessment the prior Spring due to transferring into the district.
2.3. Tasks
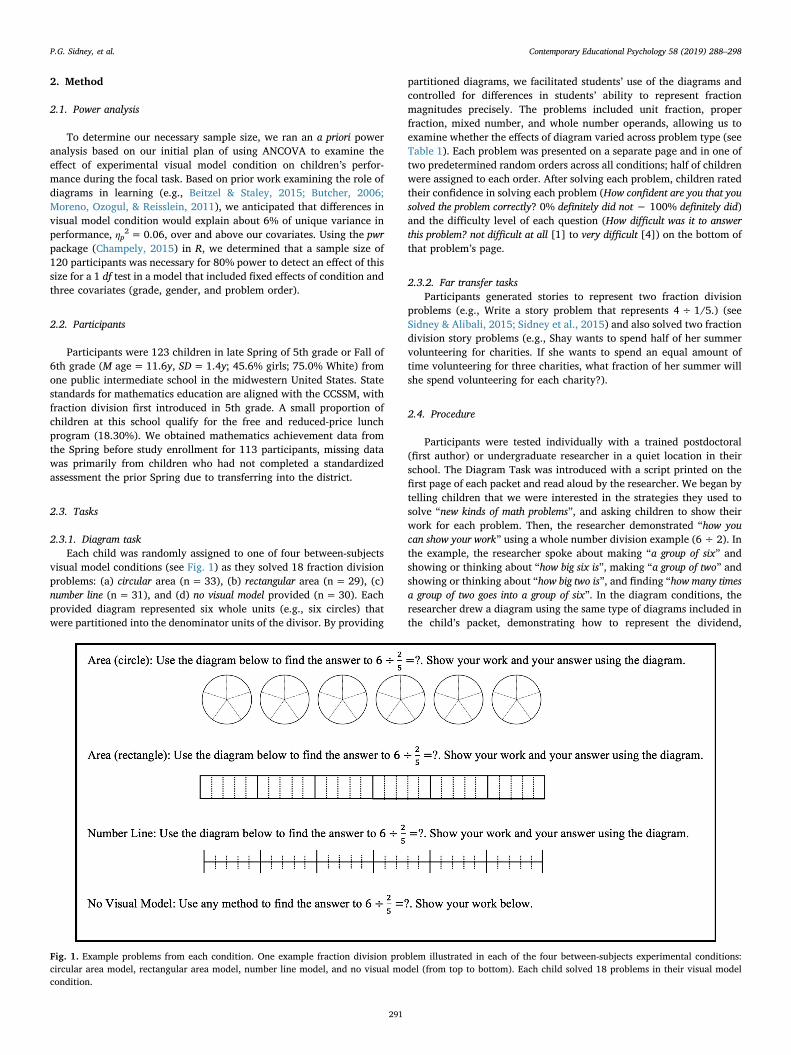
2.3.1. Diagram taskEach child was randomly assigned to one of four between-subjects
visual model conditions (see Fig. 1) as they solved 18 fraction divisionproblems: (a) circular area (n=33), (b) rectangular area (n=29), (c)number line (n= 31), and (d) no visual model provided (n=30). Eachprovided diagram represented six whole units (e.g., six circles) thatwere partitioned into the denominator units of the divisor. By providing
partitioned diagrams, we facilitated students’ use of the diagrams andcontrolled for differences in students’ ability to represent fractionmagnitudes precisely. The problems included unit fraction, properfraction, mixed number, and whole number operands, allowing us toexamine whether the effects of diagram varied across problem type (seeTable 1). Each problem was presented on a separate page and in one oftwo predetermined random orders across all conditions; half of childrenwere assigned to each order. After solving each problem, children ratedtheir confidence in solving each problem (How confident are you that yousolved the problem correctly? 0% definitely did not − 100% definitely did)and the difficulty level of each question (How difficult was it to answerthis problem? not difficult at all [1] to very difficult [4]) on the bottom ofthat problem’s page.
2.3.2. Far transfer tasksParticipants generated stories to represent two fraction division
problems (e.g., Write a story problem that represents 4÷ 1/5.) (seeSidney & Alibali, 2015; Sidney et al., 2015) and also solved two fractiondivision story problems (e.g., Shay wants to spend half of her summervolunteering for charities. If she wants to spend an equal amount oftime volunteering for three charities, what fraction of her summer willshe spend volunteering for each charity?).
2.4. Procedure
Participants were tested individually with a trained postdoctoral(first author) or undergraduate researcher in a quiet location in theirschool. The Diagram Task was introduced with a script printed on thefirst page of each packet and read aloud by the researcher. We began bytelling children that we were interested in the strategies they used tosolve “new kinds of math problems”, and asking children to show theirwork for each problem. Then, the researcher demonstrated “how youcan show your work” using a whole number division example (6÷2). Inthe example, the researcher spoke about making “a group of six” andshowing or thinking about “how big six is”, making “a group of two” andshowing or thinking about “how big two is”, and finding “how many timesa group of two goes into a group of six”. In the diagram conditions, theresearcher drew a diagram using the same type of diagrams included inthe child’s packet, demonstrating how to represent the dividend,
Fig. 1. Example problems from each condition. One example fraction division problem illustrated in each of the four between-subjects experimental conditions:circular area model, rectangular area model, number line model, and no visual model (from top to bottom). Each child solved 18 problems in their visual modelcondition.
P.G. Sidney, et al. Contemporary Educational Psychology 58 (2019) 288–298
291
divisor, and quotient on the given diagram. In the no diagram condition,the experimenter simply wrote the numerals ‘6’ and ‘2’. Apart frominstructions to “show” (diagram conditions) or “think about” (no dia-gram condition) the magnitude of the numbers, the verbal descriptionof the example and the number of times the researcher paused to drawor write were identical in all conditions.
We chose to model a whole number division problem for childrengiven previous research (Sidney & Alibali, 2017) suggesting that chil-dren are more likely to successfully model fraction division im-mediately after modeling whole number division. We chose to modelquotitive division given that children reason with both quotitive andpartitive models when demonstrating whole number division (e.g.Sidney & Alibali, 2013), but they appear to favor quotitive divisionwhen reasoning about division by a fraction (e.g., Fischbein et al., 1985;Sidney & Alibali, 2017) and find quotitive division problems easier tointerpret and model than partitive division problems (English &Halford, 1995; Watanabe, Lo, & Son, 2017; Zambat, 2015). Participantscompleted all problems without feedback from the experimenter.
2.5. Coding children’s work
We coded for children’s accuracy and conceptual models on eachproblem. Accuracy was defined as whether or not the child wrote thecorrect answer to each problem somewhere on its page. All completedproblems were double-coded by two independent coders with highagreement (agreement on 97.0% of trials). Disagreements often oc-curred when children’s handwriting was poor, or when they generatedboth a correct and incorrect answer on their page. All disagreementswere flagged and resolved through discussion until 100% agreementwas reached.
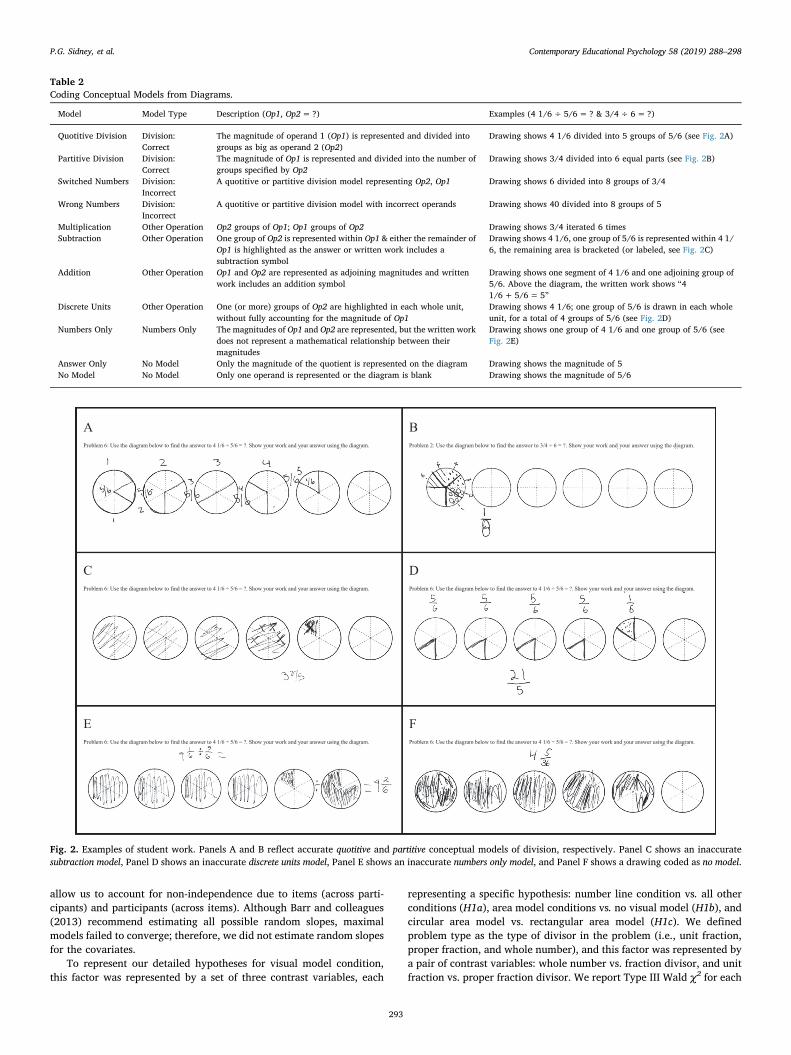
Furthermore, to examine the nature of the visual models that chil-dren generated in their drawings, two coders coded children’s finalwritten work on each problem. Our coding scheme was adapted fromone used in prior work (Sidney & Alibali, 2017; Sidney, 2016) and wasaimed at categorizing children’s overt strategies on fraction divisionproblems. First, we coded whether children accurately represented themagnitude of each operand. Then, we coded the nature of the re-lationship between the operands (see Table 2). For example, somechildren represented a division relationship, while others representedother operations such as subtraction or addition, and still others drewincomplete diagrams, for example, diagrams that only included re-presentations of each operand but did not represent the relationshipbetween operands. Critically, children’s work on each problem wascategorized as reflecting quotitive division, partitive division, or neither(see Fig. 2 for examples of student work). “Quotitive division” wascoded when children fully partitioned the dividend into segments as
large as the divisor (see Fig. 2, Panel A). “Partitive division” was codedwhen children divided the dividend equally into a number of segmentsspecified by the divisor (see Fig. 2, Panel B). All other models wereclassified as “other” (see Fig. 2, Panels C–F). Agreement for divisionmodel coding was also high (94.4% agreement). All disagreements wereflagged and resolved through discussion until 100% agreement wasreached.
Finally, to examine whether number line models and circular areamodels afford different types of spatial relationships when representingtwo operands on the same diagram, we coded whether or not the op-erands were represented on separate, non-overlapping parts of thediagram (see Fig. 2, Panel E for an example). For example, many chil-dren used different circles to represent the magnitudes of the dividendand the divisor. Some children even drew additional circles to do so.Two independent coders double-coded half of the data, and agreementwas high (99.7%). To analyze this data, we distinguished betweenchildren who never represented operands separately and children whodid so on at least one trial.
3. Results
3.1. Random assignment
Children’s achievement scores did not differ across conditions, F(3,109)= 1.16, p= .33, and the distribution of boys and girls did notdiffer across conditions, χ2(3, N=123)=0.60, indicating successfulrandom assignment to experimental condition.
3.2. Analytic overview
When conducting our power analysis, we had planned to useANCOVA to examine our data. However, we revised our planned ana-lysis to account for the non-independence due to item (see Barr, Levy,Scheepers, & Tily, 2013) and to account for variability in problem type.We used two logistic mixed effect regression models to test our primaryhypotheses about children’s accuracy and conceptual models on thediagram task using the lme4 package (Bates, Maechler, Bolker, &Walker, 2015) in R. Each model estimated fixed effects of visual modelcondition, problem type, problem order, grade, and gender, the by-participant and by-item random intercepts, the by-participant randomslope of divisor type, and the by-item random slope of condition.1 Byincluding both by-participant and by-item random effects, these models
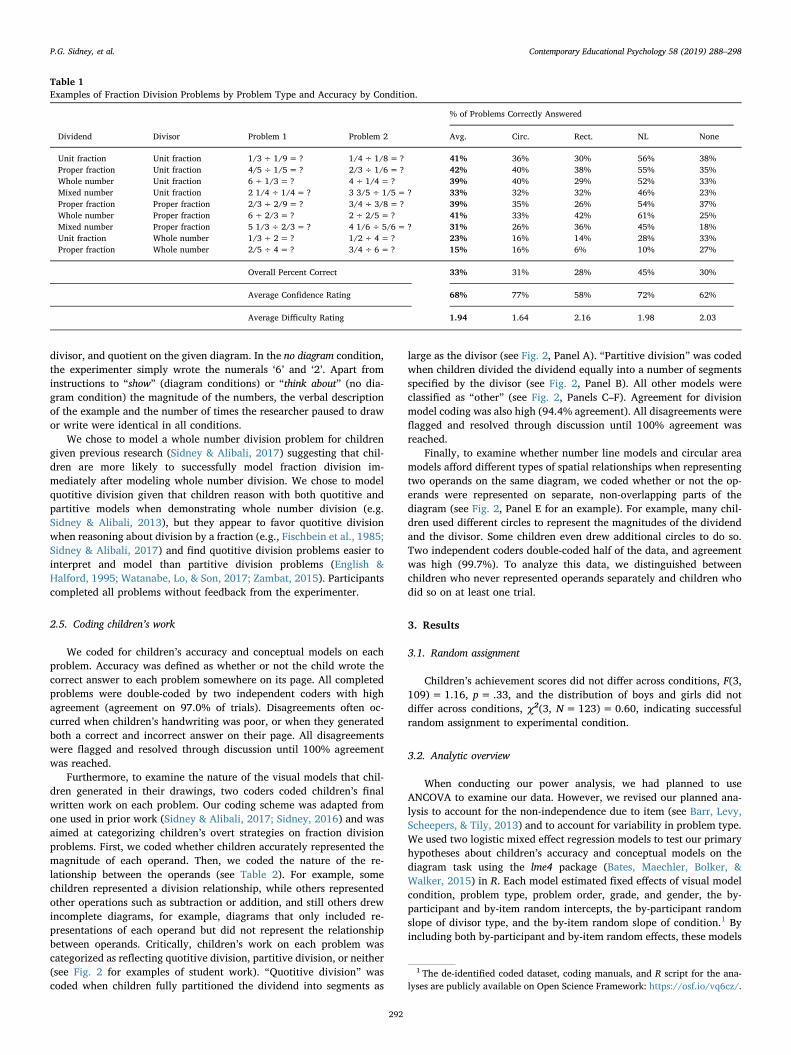
Table 1Examples of Fraction Division Problems by Problem Type and Accuracy by Condition.
% of Problems Correctly Answered
Dividend Divisor Problem 1 Problem 2 Avg. Circ. Rect. NL None
Unit fraction Unit fraction 1/3÷ 1/9= ? 1/4÷1/8= ? 41% 36% 30% 56% 38%Proper fraction Unit fraction 4/5÷ 1/5= ? 2/3÷1/6= ? 42% 40% 38% 55% 35%Whole number Unit fraction 6÷ 1/3= ? 4÷1/4= ? 39% 40% 29% 52% 33%Mixed number Unit fraction 2 1/4÷ 1/4= ? 3 3/5÷1/5= ? 33% 32% 32% 46% 23%Proper fraction Proper fraction 2/3÷ 2/9= ? 3/4÷3/8= ? 39% 35% 26% 54% 37%Whole number Proper fraction 6÷ 2/3= ? 2÷2/5= ? 41% 33% 42% 61% 25%Mixed number Proper fraction 5 1/3÷ 2/3= ? 4 1/6÷5/6= ? 31% 26% 36% 45% 18%Unit fraction Whole number 1/3÷ 2=? 1/2÷4= ? 23% 16% 14% 28% 33%Proper fraction Whole number 2/5÷ 4=? 3/4÷6= ? 15% 16% 6% 10% 27%
Overall Percent Correct 33% 31% 28% 45% 30%
Average Confidence Rating 68% 77% 58% 72% 62%
Average Difficulty Rating 1.94 1.64 2.16 1.98 2.03
1 The de-identified coded dataset, coding manuals, and R script for the ana-lyses are publicly available on Open Science Framework: https://osf.io/vq6cz/.
P.G. Sidney, et al. Contemporary Educational Psychology 58 (2019) 288–298
292
allow us to account for non-independence due to items (across parti-cipants) and participants (across items). Although Barr and colleagues(2013) recommend estimating all possible random slopes, maximalmodels failed to converge; therefore, we did not estimate random slopesfor the covariates.
To represent our detailed hypotheses for visual model condition,this factor was represented by a set of three contrast variables, each
representing a specific hypothesis: number line condition vs. all otherconditions (H1a), area model conditions vs. no visual model (H1b), andcircular area model vs. rectangular area model (H1c). We definedproblem type as the type of divisor in the problem (i.e., unit fraction,proper fraction, and whole number), and this factor was represented bya pair of contrast variables: whole number vs. fraction divisor, and unitfraction vs. proper fraction divisor. We report Type III Wald χ2 for each
Table 2Coding Conceptual Models from Diagrams.
Model Model Type Description (Op1, Op2=?) Examples (4 1/6÷5/6= ? & 3/4÷6=?)
Quotitive Division Division:Correct
The magnitude of operand 1 (Op1) is represented and divided intogroups as big as operand 2 (Op2)
Drawing shows 4 1/6 divided into 5 groups of 5/6 (see Fig. 2A)
Partitive Division Division:Correct
The magnitude of Op1 is represented and divided into the number ofgroups specified by Op2
Drawing shows 3/4 divided into 6 equal parts (see Fig. 2B)
Switched Numbers Division:Incorrect
A quotitive or partitive division model representing Op2, Op1 Drawing shows 6 divided into 8 groups of 3/4
Wrong Numbers Division:Incorrect
A quotitive or partitive division model with incorrect operands Drawing shows 40 divided into 8 groups of 5
Multiplication Other Operation Op2 groups of Op1; Op1 groups of Op2 Drawing shows 3/4 iterated 6 timesSubtraction Other Operation One group of Op2 is represented within Op1 & either the remainder of
Op1 is highlighted as the answer or written work includes asubtraction symbol
Drawing shows 4 1/6, one group of 5/6 is represented within 4 1/6, the remaining area is bracketed (or labeled, see Fig. 2C)
Addition Other Operation Op1 and Op2 are represented as adjoining magnitudes and writtenwork includes an addition symbol
Drawing shows one segment of 4 1/6 and one adjoining group of5/6. Above the diagram, the written work shows “41/6+ 5/6=5”
Discrete Units Other Operation One (or more) groups of Op2 are highlighted in each whole unit,without fully accounting for the magnitude of Op1
Drawing shows 4 1/6; one group of 5/6 is drawn in each wholeunit, for a total of 4 groups of 5/6 (see Fig. 2D)
Numbers Only Numbers Only The magnitudes of Op1 and Op2 are represented, but the written workdoes not represent a mathematical relationship between theirmagnitudes
Drawing shows one group of 4 1/6 and one group of 5/6 (seeFig. 2E)
Answer Only No Model Only the magnitude of the quotient is represented on the diagram Drawing shows the magnitude of 5No Model No Model Only one operand is represented or the diagram is blank Drawing shows the magnitude of 5/6
A Problem 6: Use the diagram below to find the answer to 4 1/6 ÷ 5/6 = ?. Show your work and your answer using the diagram.
B Problem 2: Use the diagram below to find the answer to 3/4 ÷ 6 = ?. Show your work and your answer using the diagram.
CProblem 6: Use the diagram below to find the answer to 4 1/6 ÷ 5/6 = ?. Show your work and your answer using the diagram.
DProblem 6: Use the diagram below to find the answer to 4 1/6 ÷ 5/6 = ?. Show your work and your answer using the diagram.
EProblem 6: Use the diagram below to find the answer to 4 1/6 ÷ 5/6 = ?. Show your work and your answer using the diagram.
F Problem 6: Use the diagram below to find the answer to 4 1/6 ÷ 5/6 = ?. Show your work and your answer using the diagram.
Fig. 2. Examples of student work. Panels A and B reflect accurate quotitive and partitive conceptual models of division, respectively. Panel C shows an inaccuratesubtraction model, Panel D shows an inaccurate discrete units model, Panel E shows an inaccurate numbers only model, and Panel F shows a drawing coded as no model.
P.G. Sidney, et al. Contemporary Educational Psychology 58 (2019) 288–298
293

parameter, and the change in Akaike’s Information Criteria (ΔAIC) foreach model, as compared to the null model for each outcome.
3.3. Accuracy
As hypothesized (H1a), children in the number line condition weremore likely to accurately solve each fraction division problem thanchildren in any other experimental condition, OR=3.28, χ2(1)= 5.06,p= .02. Children who solved problems in the number line conditiongenerated correct answers on about 45% of problems, on average,whereas children who solved problems in the other conditions gener-ated correct answers on around 30% of problems (see Table 1).Somewhat unexpectedly (H1b), children who solved problems withcircular area models or rectangular area models were no more likely tobe accurate on each problem than children who solved problemswithout visual models, OR=1.61, χ2(1)= 0.71, p= .40. Finally (H1c),children who solved problems with rectangular area models were nomore likely to be accurate than children who solved problems withcircular area models. OR=0.64, χ2(1)= 0.53, p= .47.
Furthermore, children’s likelihood of accuracy differed across pro-blem type, such that children were more accurate on problems withfraction divisors than whole number divisors, OR=17.59,χ2(1)= 10.80, p < .01. Children were equally accurate on problemswith unit fraction divisors and proper fraction divisors, OR=1.48,χ2(1)= 1.68, p= .19. On average, children only solved 19% of wholenumber divisor problems correctly, as compared to about 44% offraction divisor problems (see Table 1). There was no significant effectof problem order, χ2(1)= 1.46, p= .23, or gender, χ2(1)= 1.00,p= .32. Overall, sixth graders were more likely to be accurate than fifthgraders, OR=4.64, χ2(1)= 12.31, p < .01. Model AIC was reducedrelative to the null model, ΔAIC=−195.00.
3.4. Conceptual models
We analyzed the likelihood of generating a sound conceptual modelof division, either quotitive or partitive, among children in the visualmodel conditions. Children in the no visual model condition were notprovided with a visual model nor instructed to show their work on adiagram. There were almost no instances of spontaneously drawingconceptually sound models of division in the no visual model condition(3% of all trials), thus these children were excluded from the conceptualmodel analysis altogether.
In line with our focal hypothesis (H1a), and observed patterns ofaccuracy, children who were provided with number line models whenreasoning about fraction division were considerably more likely togenerate a conceptually-sound model of division on any given problemthan children in either area model conditions, OR=4.64, χ2(1)= 7.71,p < .01. Children in the number line condition generated divisionmodels on 52% of trials, whereas children in the rectangular areacondition generated division models on 35% of trials and those whowere given circular area models generated division models on only 22%of trials. The likelihood of generating a conceptual model of divisionwas no different in each area model condition, OR=1.88,χ2(1)= 0.46, p= .50.
In line with accuracy rates, children were more likely to generateconceptual models on fraction divisor problems than whole numberdivisor problems, OR=29.39, χ2(1)= 7.64, p < .01, but equallylikely on unit and proper fraction problems, OR=1.04, χ2(1)= 0.01,p= .91. Problem order, χ2(1)= 0.93, p= .34, and child gender,χ2(1)= 1.15, p= .22, did not predict generating conceptual models;however, sixth graders were more likely to generate conceptual modelsof division, χ2(1)= 6.18, p= .01. Model AIC was reduced relative tothe null model, ΔAIC=−222.00.
To provide some insight on the number of children who may haveexperienced a number line advantage, we also examined the percentageof children in each condition who consistently generated sound
conceptual models on a majority of trials. The majority (71%) of chil-dren who demonstrated their work on a number line consistently drewaccurate models of either quotitive or partitive division. In contrast,many fewer did so in the circular (21%) or rectangular (34%) condi-tions. A logistic regression analysis revealed the odds of consistentlygenerating a division model among children in the number line con-dition were nearly 10 times greater, OR=9.83, χ2(1)= 16.01,p < .01, than among children in the circular condition, and over fivetimes greater, OR=5.30, χ2(1)= 8.60, p < .01, than those in therectangular condition, controlling for problem order, p= .96, gender,p= .04, and grade, p= .02. Model AIC was reduced relative to the nullmodel, ΔAIC=−16.18.
3.5. Representing magnitudes
As expected, number lines supported children’s generation of con-ceptually-sound models of fraction division. Thus, we further tested ourhypothesis that the number line advantage may be due in part to dif-ferences in how children represent the relative magnitudes of eachoperand on the provided diagram. We examined the number of childrenin each visual model condition who ever represented the operands se-parately, rather than overlapping on the same whole unit, and found asignificant effect of condition, χ2(2, N=93)=23.16, p < .01. Nochild in the number line condition drew operands on separate segmentsof the number line; when children represented both operands, theyalways represented them relative to the same, common endpoint. Incontrast, about one-half (15/33) of the children in the circular areacondition represented the operands on separate circles on at least onetrial, and about one-third (9/29) of the children in the rectangular areacondition represented the operands on separate rectangles at least once.
Given these patterns, we also explored whether children’s rates ofrepresenting operands separately were related to their rates of gen-erating conceptually sound models of division, among children in thearea model conditions using a general linear model. Indeed, childrenwho represented operands separately on a greater proportion of trialsgenerated fewer conceptual models of fraction division, b=−0.02, t(56)=−3.04, p < .01, controlling for area model condition, p= .58,order, p= .65, gender, p= .20, and grade, p= .02; total R2=0.31.
3.6. Confidence and difficulty ratings
Next, we examined children’s confidence ratings, which rangedfrom 0 (definitely did not [solve correctly]) to 100 (definitely did),M=65.49, SD=23.15, and difficulty ratings, which ranged from 1(not difficult at all) to 4 (very difficult), M=1.94, SD=0.80. Confidenceand difficulty ratings were analyzed using linear mixed effects modelssimilar in structure to those used for accuracy and conceptual models,but with visual model condition represented by a different set of con-trast variables. Because we observed that children in the circular areacondition had, on average, slightly higher ratings of confidence andlower ratings of difficulty than the other children (see Table 1), ourcontrast codes represent pairwise comparisons between the circulararea condition and each remaining condition. We report the Type IIIWald F tests using the Kenward-Roger approximation as implementedby car (Fox & Weisberg, 2011).
In contrast to patterns of accuracy, there was no significant effect ofvisual model condition on children’s confidence ratings, F(3,120.17)= 2.49, p= .06, and no effects of problem order, p= .62 orgender, p= .80. In line with patterns of accuracy, there was a sig-nificant effect of divisor type, F(2, 32.67)= 5.94, p < .01, such thatchildren were more confident on problems with a fraction divisor thanthose with a whole number divisor, F(1, 47.52)= 11.75, p < .01. Also,children in 6th grade were more confident than those in 5th grade, F(1,123.97)= 4.08, p < .05. There were no differences in children’s rat-ings of difficulty across visual model condition, F(3, 20.32)= 2.88,p= .06, and no effects of divisor type, p= .24, problem order, p= .73,
P.G. Sidney, et al. Contemporary Educational Psychology 58 (2019) 288–298
294
grade, p= .07, or gender, p= .71.
3.7. Far transfer tasks
Finally, we explored children’s performance on four far transfertasks, two story generation tasks and two story problem solving tasks,to examine whether visual model condition during earlier problem-solving had any lasting effects on children’s performance on other tasksdesigned to assess conceptual understanding of fraction division. Toanalyze these data, we fit separate logistic regression models regressingaccuracy on visual model condition, grade, and gender. Children’sperformance on each item did not vary by condition,0.55 < χ2(3) < 6.56, 0.09 < ps < 0.93, 94 < Ns < 104, sug-gesting that the effects of visual models on children’s conceptual un-derstanding of fraction division were constrained to problems withwhich those visual models were presented. In other words, childrenwho solved problems with number lines, who were likely to displayconceptual understanding of fraction division in their drawings usingnumber lines, were no more likely to generate conceptually-sound so-lutions to far transfer items when diagrams were no longer present.Furthermore, we noted that although several students drew diagrams tohelp support their story problem-solving (n= 30), only seven childrendrew number line diagrams.
4. Discussion
4.1. Summary of findings
As expected, children who were asked to demonstrate their rea-soning on number lines when solving fraction division problems weremore accurate problem-to-problem than were children asked to usearea models or no visual model at all. However, somewhat un-expectedly, we did not observe any advantages of using area models toshow work during fraction division problem solving. Instead, problem-to-problem accuracy was similar across the two area model conditions(i.e., circular and rectangular), and no higher than for those childrenwho solved fraction division problems without a visual model. Further,this pattern of results, revealing a number line advantage, was alsoapparent for children’s likelihood of producing a sound conceptualmodel of fraction division. Strikingly, over twice as many children whosolved problems with number lines consistently drew sound conceptualmodels of division across different types of problems than in the othervisual model conditions. Sixth graders were more accurate, confident,and likely to produce sound conceptual models of fraction division thanwere fifth graders.
4.2. Visual models for fractions
Overall, our findings suggest that visual models, such as diagrams,can support children’s thinking about the conceptual structure of divi-sion, however, not all visual models are equally effective at supportingconceptual understanding. Number lines, as compared to area modelsor no visual models at all, elicited conceptually accurate strategiesacross a range of problem types and consistently across the majority ofproblems. Our qualitative analysis of children’s diagrams suggests thatone reason that the number line may have afforded an advantage overthe area models is that children were more likely to accurately re-present the magnitude of each operand relative to the same commonendpoint, as opposed to representing the operands on separate circles orrectangles.
One potential limitation of this finding is that the visual models weprovided were pre-segmented into divisor units to take some of thedrawing demands off of the children so that they could more effectivelyshow their fraction division understanding. This pre-segmentation mayhave led participants to rate the circle problems as less difficult thanthey would have rated unsegmented circles given that research in
mathematics education (Myers, Confrey, Nguyen, & Mojica, 2009) hasshown that children find it particularly difficult to partition circles.Future research could investigate the impact of asking students toconstruct units on empty or unsegmented number lines or unpartitionedwhole shapes on fraction division problem solving.
All the children in our sample viewed a whole number divisionexample, using a visual model consistent with their condition assign-ment, prior to completing the fraction division diagram problem-sol-ving task. Prior research has demonstrated that children in 5th and 6thgrade are often more successful at modeling fraction division im-mediately after modeling whole number division (Sidney & Alibali,2015, 2017). Because we reminded children of quotitive division withwhole numbers, our findings may provide evidence that children whoreasoned with number line diagrams were more likely to transfer ap-propriate ways of reasoning about division from the whole numberexample to the fraction division problems.
Although children often have an underdeveloped conceptual un-derstanding of fraction division (e.g., Mack, 2001; Sidney & Alibali,2017), many children in our sample, and particularly those who rea-soned with a number line, generated conceptual models of fractiondivision that mirrored our whole number example: they represented themagnitude of the first operand, then represented the magnitude of thesecond operand, and finally drew as many groups or segments as big asthe second operand that “fit” in the first operand. This evidence oftransfer may be one promising sign of integration across whole numbersand fraction concepts (see Siegler et al., 2011). Future work could moreclosely examine whether the type of example problem (quotitive vs.partitive; whole number vs. fraction division vs. other fraction opera-tion; whole number vs. fraction divisor) differentially impacts problem-solving performance, and whether analogical transfer underlies thenumber line advantage in the current study.
4.3. Limitations
Here, we have demonstrated that there is a number line advantagefor fraction division problem solving. However, the current study leavesopen the question of whether number lines also uniquely afford benefitswhen students learn about fraction division in the lab and in realclassrooms. Although this study does suggest that number lines maysupport children’s emerging fraction division conceptualizations, it re-mains an open question as to which order the visual models should beintroduced (e.g., number lines first then area models next) duringclassroom instruction to optimize student learning. For example, ourstudy does not rule out the possibility that area models may havelearning benefits, perhaps when included along with number lines.
Furthermore, we focused on fraction division, given its difficulty,limiting the findings’ generalizability to children’s learning of otherfraction operations. For example, our findings stand in contrast toKaminski (2018) study of 3rd grade children’s use of visual modelswhen learning about fraction addition, in which there was no numberline advantage and some evidence of a number line disadvantage. Onepossible reason for these contrasting findings may be related to differ-ences in the ages of the participants. Area models may be more familiarthan number lines among third graders given that they are introducedearlier in Common Core-aligned curricula (as early as 1st grade underthe Geometry strand 1.G.A.3), though age alone seems unlikely to ex-plain this difference given the number line advantage among similarlyaged children learning fraction magnitudes (Hamdan & Gunderson,2017). Another possibility is that differences may arise from differencesin how the number line was used in these studies. Number lines may bemost advantageous when used to highlight numerical magnitude as adistance from zero, as we have done in our example problem in thecurrent study.
A third possibility is that visual models afford different approachesto reasoning and representing the conceptual structure of arithmeticoperations, and addition and division benefit from different
P.G. Sidney, et al. Contemporary Educational Psychology 58 (2019) 288–298
295
affordances. In quotitive division, the ability to compare the relativemagnitudes of each operand is a key component to representing thedivision relationship, and our qualitative analysis suggests that numberlines afford representing the operands in ways that allow this com-parison process to take place. Comparing the relative size of two op-erands may be helpful for subtraction as well, but may not be as helpfulfor addition and multiplication. For example, if a child conceptualizesfraction multiplication as a scaling operation (e.g., 5×¼ as finding amagnitude that is ¼ the size of 5), area models may better support thisconceptualization. Thus, we view this work as only a first step towardsunderstanding the affordances of various visual models for supportingkey ways of conceptualizing fraction arithmetic. Because the con-ceptual models themselves are varied across operations, we expect thatthe effects of visual models may also vary across arithmetic operations.If this is the case, it would also raise new questions about the optimaltimes to introduce each visual model to children across the entire spanof fraction instruction.
Finally, based on prior work linking confidence and familiarity inmath (Fitzsimmons, Thompson, & Sidney, in preparation; Wall et al.,2016), we sought to explore whether children’s supposed familiaritywith area models might lead them to feel more confident when solvingproblems with area models and to report less difficulty while using areamodels. Although children’s confidence ratings for the circular areacondition were nominally higher than the other conditions, we foundno reliable differences in confidence and difficulty across visual modelcondition. We also do not have specific information about the famil-iarity of these visual models within this sample, limiting our ability tointerpret the confidence and difficulty findings. For a full picture of howfamiliarity with each type of visual model may impact children’s per-ceived confidence, difficulty, and performance, it may be necessary toassess the frequency with which children encounter these models acrossmany years during elementary instruction, as the nature of children’sexperiences with visual models may change over time. For example,although circular area models are introduced in partitioning tasks veryearly in elementary school, rectangular area models are recommended(National Governors Association Center for Best Practices & Council ofChief State School Officers, 2010) and often used to represent multi-plication concepts (Shin & Lee, 2018; Tsankova & Pjanic, 2009; Webel& DeLeeuw, 2016; Wu, 2011). Despite this limitation, it is still notablethat children’s confidence and difficulty ratings did not reflect the clearpatterns of successful conceptual reasoning.
4.4. Educational implications and future directions
Both the IES Practice Guide for Fractions (Siegler et al., 2010) andCCSSM recommend the use of visual models to represent fraction op-erations, yet it was unclear whether number lines and area modelswould offer the same benefits to accuracy and conceptual under-standing of fraction division. Even though we found a number lineadvantage in the current study, we are not recommending that teachersshould avoid the use of area models in their classrooms when teachingchildren to reason about fraction division. First, as previously men-tioned, additional research is needed to examine children’s learningfrom direct instruction that includes visual models with different fea-tures. Second, representational fluency (Rau & Matthews, 2017) usingmultiple types of visual models that highlight complementary aspects offraction concepts, is important, and there may be an optimal combi-nation of visual models during instruction.
Future research is needed to investigate the types of classroomlessons that most effectively convey a deep and multi-faced conceptualunderstanding of fraction division that would support a transition toflexible symbol-only problem solving for advanced mathematics topics.This is especially true given that we did not see a lasting effect of visualmodel condition on far transfer problems (e.g., story generation) thatdid not include a researcher-generated visual model, suggesting thatsubstantive learning may not have occurred during the problem-solving
activity. It is unclear whether providing children with an explicit re-minder (e.g., Gick & Holyoak, 1980) to draw a diagram to support theirstories would have improved the likelihood of transfer, or whethersimply asking children to solve more fraction division problems, pos-sibly over the course of several sessions and with feedback, would havebetter prepared them to spontaneously transfer to new, conceptually-similar problems.
Another educational implication involved students’ perceptions ofproblem difficulty and their confidence in solving the problems cor-rectly. Children assigned to the circular area condition rated the frac-tion division problems as nominally less difficult than did children inthe other visual model conditions. Also, children in the circular areacondition were more confident that they had correctly solved the pro-blems than were children in the other conditions. Though these meandifferences were not significantly different, looking across our findingson accuracy, conceptual models, and difficulty, number lines may be“worth” their perceived difficulty, whereas circles may be unhelpfuldespite students’ apparent comfort with them. In other words, ourfindings suggest that teachers should not be reluctant to use numberlines even if their students appear to find them difficult. Further in-vestigation is necessary to determine whether children’s perceivedcomfort and familiarity with various visual models moderates theireffectiveness. If so, it may be important to introduce more effectivevisual models, such as number lines, along with earlier fraction con-cepts to provide adequate time for familiarity with these representa-tions to develop.
Finally, we believe these findings have important implications forpre-service and in-service teacher education. Generating conceptualmodels for fraction division is challenging for both children (Sidney &Alibali, 2015, 2017) and adults (Ball, 1990; Ma, 1999). Although thenumber line is a promising representation for supporting children’sreasoning about the relative magnitude of two quantities, prior researchon pre-service teachers’ fraction reasoning demonstrates their dis-comfort and difficulty using linear models for representing fractionoperations (e.g., Luo et al., 2011). For teachers to effectively in-corporate number line activities into fraction division instruction, theymust be proficient with these representations themselves. Thus, addi-tional research is needed to more closely examine teacher and pre-service teacher learning with and about number line models for fractionoperations.
4.5. Conclusions
The current study adds to a growing body of evidence that numberlines facilitate children’s accurate understanding of fraction magnitudesand their conceptual understanding of the relationships between frac-tion magnitudes as they solve fraction operation problems. Our resultscan inform the implementation of the CCSSM that recommends the useof visual models for representing fraction operations. Future workshould investigate ways to promote children’s use of visual models tohelp them reason about fraction division problems even when diagramsare not provided in given problems.
Acknowledgments
This work was supported by a Farris Family Fellowship (Kent StateUniversity) awarded to the second author. The authors thank CarlyNelson, Holly Donofrio, Jessica Kotik, and Rachel Hall for their assis-tance in collecting, entering, and coding the data.
References
Ainsworth, S. (2006). DeFT: A conceptual framework for considering learning withmultiple representations. Learning and Instruction, 16(3), 183–198.
Alibali, M. W., & Sidney, P. G. (2015). The role of intraindividual variability in learning inchildhood and adolescence. In M. Diehl, K. Hooker, & M. Sliwinski (Eds.). Handbook
P.G. Sidney, et al. Contemporary Educational Psychology 58 (2019) 288–298
296
of intraindividual variability across the lifespan (pp. 84–102). New York, NY: Taylor andFrancis.
Baek, J. M., Wickstrom, M. H., Tobias, J. M., Miller, A. L., Safak, E., Wessman-Enzinger,N., & Kirwan, J. V. (2017). Preservice teachers’ pictorial strategies for a multistepmultiplicative fraction problem. The Journal of Mathematical Behavior, 45, 1–14.
Bailey, D. H., Hoard, M. K., Nugent, L., & Geary, D. C. (2012). Competence with fractionspredicts gains in mathematics achievement. Journal of Experimental Child Psychology,113(3), 447–455.
Ball, D. L. (1990). Prospective elementary and secondary teachers' understandings ofdivision. Journal for Research in Mathematics Education, 21(2), 132–144.
Barr, D. J., Levy, R., Scheepers, C., & Tily, H. J. (2013). Random effects structure forconfirmatory hypothesis testing: Keep it maximal. Journal of Memory and Language,68(3), 255–278.
Bates, D., Maechler, M., Bolker, B., & Walker, S. (2015). Fitting linear mixed-effectsmodels using lme4. Journal of Statistical Software, 67(1), 1–48.
Beitzel, B. D., & Staley, R. K. (2015). The efficacy of using diagrams when solvingprobability word problems in college. The Journal of Experimental Education, 83,130–145.
Bergey, B. W., Cromley, J. G., Kirchgessner, M. L., & Newcombe, N. S. (2015). Usingdiagrams versus text for spaced restudy: Effects on learning in 10th grade biologyclasses. British Journal of Educational Psychology, 85(1), 59–74.
Booth, J., & Siegler, R. S. (2008). Numerical magnitude representations influence ar-ithmetic learning. Child Development, 79(4), 1016–1031.
Boyer, T. W., Levine, S. C., & Huttenlocher, J. (2008). Development of proportionalreasoning: Where young children go wrong. Developmental Psychology, 44,1478–1490.
Butcher, K. R. (2006). Learning from text with diagrams: Promoting mental model de-velopment and inference generation. Journal of Educational Psychology, 98(1),182–197.
Champely, S. (2015). pwr: Basic Functions for Power Analysis. R package version 1.1-3.< https://CRAN.R-project.org/package=pwr> .
Common Core Standards Writing Team (2013). Progressions for the common core statestandards in mathematics: Fractions. Tucson, AZ: Institute for Mathematics andEducation, University of Arizona.
Confrey, J., Maloney, A. P., Nguyen, K. H., Mojica, G., & Myers, M. (2009).Equipartitioning/splitting as a foundation of rational number reasoning usinglearning trajectories. In M. Tzekaki, M. Kaldrimidou, & H. Sakonidis (Vol. Eds.),Proceedings of the 33rd conference of the international group for the psychology ofmathematics education. Thessaloniki, Greece: Vol. 2, (pp. 345–352).
Cooper, J. L., Sidney, P. G., & Alibali, M. W. (2018). Who benefits from diagrams andillustrations in math problems? Ability and attitudes matter. Applied CognitivePsychology, 32(1), 24–38.
Cramer, K., Behr, M., Post, T., & Lesh, R. (1997). Rational Number Project: Fraction Lessonsfor the Middle Grades – Level 1. Dubuque, IA: Kendall/Hunt Publishing Co.
Cramer, K. A., Monson, D., Whitney, S., Leavitt, S., & Wyberg, T. (2010). Dividing frac-tions and problem solving. Mathematics Teaching in the Middle School, 15, 338–346.
Cramer, K. A., Post, T. R., & del Mas, R. C. (2002). Initial fraction learning by fourth- andfifth-grade students: A comparison of the effects of using commercial curricula withthe effects of using the rational number project curriculum. Journal for Research inMathematics Education, 33(2), 111–144.
Cramer, K. A., Wyberg, T., & Leavitt, S. (2008). The role of representations in fractionaddition and subtraction. Mathematics Teaching in the Middle School, 13, 490–496.
Cramer, K., & Wyburg, T. (2009). Efficacy of different concrete models for teaching thepart-whole construct for fractions. Mathematical Thinking and Learning: AnInternational Journal, 11(4), 226–257.
Dixon, J. A., Deets, J. K., & Bangert, A. (2001). The representation of the arithmeticoperations include functional relationships. Memory & Cognition, 29, 462–477.
English, L., & Halford, G. (1995). Mathematics education: Models and processes. New York:Routledge.
Fazio, L. K., DeWolf, M., & Siegler, R. S. (2016). Strategy use and strategy choice infraction magnitude comparison. Journal of Experimental Psychology: Learning, Memory,and Cognition, 42(1), 1–16.
Fazio, L. K., Kennedy, C., & Siegler, R. S. (2016). Improving children's knowledge offraction magnitudes. PLOS One.
Fischbein, E., Deri, M., Nello, M. S., & Marino, M. S. (1985). The role of implicit models insolving verbal problems in multiplication and division. Journal for Research inMathematics Education, 16(1), 3–17.
Fitzsimmons, C. J., Thompson, C. A., & Sidney, P. G. (2019). Confident or familiar? Therole of familiarity ratings in adults' confidence judgments when estimating fractionmagnitudes (in preparation).
Fox, J., & Weisberg, S. (2011). An R companion to applied regressionURL(2nd ed.).Thousand Oaks CA: Sage. http://socserv.socsci.mcmaster.ca/jfox/Books/Companion.
Fuchs, L. S., Schumacher, R. F., Long, J., Namkung, J., Hamlett, C. L., Cirino, P. T., ...Changas, P. (2013). Improving at-risk learners’ understanding of fractions. Journal ofEducational Psychology, 105(3), 683–700.
Gick, M. L., & Holyoak, K. J. (1980). Analogical problem solving. Cognitive Psychology, 12,306–355.
Hamdan, N., & Gunderson, E. A. (2017). The number line is a critical spatial-numericalrepresentation: Evidence from a fraction intervention. Developmental Psychology,53(3), 587–596.
Kaminski, J. A. (2018). Effects of representation on discrimination and recognition offractions. In C. Kalish, M. Rua, J. Zhu, & T. Rogers (Eds.). Proceedings of the 40thannual conference of the cognitive science society. Austin, TX: Cognitive Science Society.
Kaminski, J. A., & Sloutsky, V. M. (2013). Extraneous perceptual information can inter-fere with children’s acquisition of mathematical knowledge. Journal of EducationalPsychology, 105, 351–363.
Kellman, P. J., Massey, C. M., Roth, Z., Burke, T., Zucker, J., Saw, A., ... Wise, J. (2008).Perceptual learning and the technology of expertise: Studies in fraction learning andalgebra. Learning Technologies and Cognition: Special issue of Pragmatics & Cognition,16(2), 356–405.
Kieren, T. E. (1976). On the mathematical, cognitive, and instructional foundations ofrational numbers. In R. Lesh (Ed.). Number and Measurement: Papers from a ResearchWorkshop (pp. 101–144). Columbus, OH: ERIC/SMEAC.
Larkin, J. H., & Simon, H. (1987). Why a diagram is (sometimes) worth ten thousandwords. Cognitive Science, 11(1), 65–100.
Lortie-Forgues, H., Tian, J., & Siegler, R. S. (2015). Why is learning fraction and decimalarithmetic so difficult? Developmental Review, 38, 201–221.
Luo, F., Lo, J.-J., & Leu, Y.-C. (2011). Fundamental fraction knowledge of preserviceelementary teachers: A cross-national study in the United States and Taiwan. SchoolScience and Mathematics, 111(4), 164–177.
Ma, L. (1999). Knowing and teaching elementary mathematics: Teachers’ understanding offundamental mathematics in China and the United States. Mahwah, NJ: LawrenceErlbaum Associates.
Mack, N. K. (1990). Learning fractions with understanding: Building on informalknowledge. Journal for Research in Mathematics Education, 21(1), 16–32.
Mack, N. K. (1995). Confounding whole-number and fraction concepts when building oninformal knowledge. Journal for Research in Mathematics Education, 26(5), 422–441.
Mack, N. K. (2001). Building on informal knowledge through instruction in a complexcontent domain: Partitioning, units, and understanding multiplication of fractions.Journal for Research in Mathematics Education, 32, 267–295.
Moreno, R., Ozogul, G., & Reisslein, M. (2011). Teaching with concrete and abstract vi-sual representations: Effects on students’ problem solving, problem representations,and learning perceptions. Journal of Educational Psychology, 103(1), 32–47.
Moss, J., & Case, R. (1999). Developing children's understanding of the rational numbers:A new model and an experimental curriculum. Journal for Research in MathematicsEducation, 30, 127–147.
Myers, M., Confrey, J., Nguyen, K., & Mojica, G. (2009). Equipartitioning a continuouswhole among three people: Attempts to create fair shares. In S. L. Swars, D. W.Stinson, & S. Lemons-Smith (Eds.). Proceedings of the 31st annual meeting of the NorthAmerican Chapter of the international group for the psychology of mathematics education.Atlanta, GA: Georgia State University.
National Governors Association Center for Best Practices & Council of Chief State SchoolOfficers (2010). Common Core State Standards in Mathematics. Washington, DC:Author.
National Research Council (2005). How students learn: Mathematics in the classroom.Washington, DC: The National Academic Press.
NMAP (2008). Foundations for success: The final report of the National Mathematics AdvisoryPanel. Washington, DC: U.S. Department of Education.
Parker, T., & Baldridge, S. (2004). Elementary mathematics for teachers. Okemos, MI:Sefton-Ash Publishing.
Rau, M. A., Aleven, V., Rummel, N., & Pardos, Z. (2014). How should intelligent tutoringsystems sequence multiple graphical representations of fractions? A multi-methodsstudy. International Journal of Artificial Intelligence in Education, 24(2), 125–161.https://doi.org/10.1007/s40593-013-0011-7.
Rau, M., & Matthews, P. G. (2017). How to make ‘more’ better? Principles for effectiveuse of multiple representations to enhance students’ learning about fractions. ZDM,49(4), 531–544.
Schneider, M., & Siegler, R. S. (2010). Representations of the magnitudes of fractions.Journal of Experimental Psychology: Human Perception and Performance, 36(5),1227–1238.
Shin, J., & Lee, S. J. (2018). The alignment of student fraction learning with textbooks inKorea and the United States. Journal of Mathematical Behavior, 51(1), 129–149.
Sidney, P. G., & Alibali, M. W. (2013). Children's and adults' models of whole numberdivision: Consistency or variability? In M. V. Martinez, & A. C. Superfine (Eds.).Proceedings of the 35th annual meeting of the North American Chapter of the InternationalGroup for the Psychology of Mathematics Education. Chicago, IL: University of Illinois atChicago.
Sidney, P. G., & Alibali, M. W. (2015). Making connections in math: Activating a priorknowledge analogue matters for learning. Journal of Cognition and Development,16(1), 160–185.
Sidney, P. G., & Alibali, M. W. (2017). Creating a context for learning: Activating chil-dren’s whole number knowledge prepares them to understand fraction division.Journal of Numerical Cognition, 3(1), 31–57.
Sidney, P. G., Chan, Y. -C., & Alibali, M. W. (2013). Developing operation sense:Children’s and adults’ arithmetic with countable and uncountable amounts. Posterpresented at the biennial meeting of the Society for Research in Child Development,Seattle, WA.
Sidney, P. G., Hattikudur, S., & Alibali, M. W. (2015). How do contrasting cases and self-explanation promote learning? Evidence from fraction division. Learning andInstruction, 40, 29–38.
Sidney, P. G. (2016). Does new learning provide new perspectives on familiar concepts?Exploring the role of analogical instruction in conceptual change in arithmetic(Doctoral dissertation).
Siegler, R. S. (1996). Emerging minds: The process of change in children's thinking. New York:Oxford University Press.
Siegler, R. S., Duncan, G. J., Davis-Kean, P. E., Duckworth, K., Claessens, A., Engel, M., ...Chen, M. (2012). Early predictors of high school mathematics achievement.Psychological Science, 23, 691–697.
Siegler, R., Carpenter, T., Fennell, F., Geary, D., Lewis, J., Okamoto, Y., … & Wray, J.(2010). Developing effective fractions instruction for kindergarten through 8th grade:A practice guide (NCEE #2010-4039). Washington, DC: National Center forEducation Evaluation and Regional Assistance, Institute of Education Sciences, U.S.
P.G. Sidney, et al. Contemporary Educational Psychology 58 (2019) 288–298
297

Department of Education. Retrieved from whatworks.ed.gov/publications/practice-guides.
Siegler, R. S., & Pyke, A. A. (2013). Developmental and individual differences in under-standing fractions. Developmental Psychology, 49, 1994–2004.
Siegler, R. S., Thompson, C. A., & Schneider, M. (2011). An integrated theory of wholenumber and fractions development. Cognitive Psychology, 62(4), 273–296.
Speiser, B., & Walter, C. (2015). Making sense of fraction quotients, one cup at a time. TheJournal of Mathematical Behavior, 38, 1–8.
Tsankova, J., & Pjanic, K. (2009). The area model of multiplication of fractions.Mathematics Teaching in the Middle School, 15(5), 281–285.
Wall, J. L., Thompson, C. A., Dunlosky, J., & Merriman, W. E. (2016). Children can ac-curately monitor and control their number-line estimation performance.Developmental Psychology, 52(10), 1493–1502.
Watanabe, T., Lo, J.-J., & Son, J.-W. (2017). Intended treatment of fractions and fraction
operations in mathematics curricula from Japan, Korea, and Taiwan. In J.-W. Son, T.Watanabe, & J.-J. Lo (Eds.). What matters? Research trends in international comparativestudies in mathematics education (pp. 33–62). New York: Springer.
Webel, C., & DeLeeuw, W. W. (2016). Meaning for fraction multiplication: Thematicanalysis of mathematical talk in three fifth grade classes. The Journal of MathematicalBehavior, 41, 123–140.
Wilkerson, T. L., Cooper, S., Gupta, D., Montgomery, M., Mechell, S., Aterbury, K., ...Sharp, P. T. (2015). An investigation of fraction models in early elementary grades: Amixed-methods approach. Journal of Research in Childhood Education, 29, 1–25.
Wu, H. H. (2011). Understanding elementary school mathematics. Washington, DC:Mathematical Association of America.
Zambat, I. O. (2015). An alternative route to teaching fraction division: Abstraction ofcommon denominator algorithm. International Electronic Journal of ElementaryEducation, 7(3), 399–422.
P.G. Sidney, et al. Contemporary Educational Psychology 58 (2019) 288–298
298