CONSUMER ONLINE BUYING PATTERNS – A SOUTH AFRICAN PERSPECTIVE
87
CONSUMER ONLINE BUYING PATTERNS – A SOUTH AFRICAN PERSPECTIVE By Pragalathan D. Pillay Student Number 208516454 A dissertation submitted in partial fulfillment of the requirements for the degree of Masters in Business Administration In the Graduate School of Business In the Faculty of Management Studies At the University of KwaZulu-Natal Supervisor: Professor Anesh Maniraj Singh December 2010
Transcript of CONSUMER ONLINE BUYING PATTERNS – A SOUTH AFRICAN PERSPECTIVE

i
CONSUMER ONLINE BUYING PATTERNS – A SOUTH
AFRICAN PERSPECTIVE
By
Pragalathan D. Pillay
Student Number 208516454
A dissertation submitted in partial fulfillment of the requirements for the degree of
Masters in Business Administration
In the Graduate School of Business
In the Faculty of Management Studies
At the University of KwaZulu-Natal
Supervisor: Professor Anesh Maniraj Singh
December 2010

i i
University of KwaZulu-Natal
Faculty of Management Studies
Graduate School of Business

i i i
DECLARATION
I P r a g a l a t h a n D e v a k r i s h n a P i l l a y d e c l a r e t h a t :( i ) T h e r e s e a r c h r e p o r t e d i n t h i s d i s s e r t a t i o n / t h e s i s , e x c e p t w h e r e o t h e r w i s e i n d i c a t e d , i sm y o r i g i n a l r e s e a r c h .( i i ) T h i s d i s s e r t a t i o n / t h e s i s h a s n o t b e e n s u b m i t t e d f o r a n y d e g r e e o r e x a m i n a t i o n a t a n yo t h e r u n i v e r s i t y .( i i i ) T h i s d i s s e r t a t i o n / t h e s i s d o e s n o t c o n t a i n o t h e r p e r s o n s ’ d a t a , p i c t u r e s , g r a p h s o ro t h e r i n f o r m a t i o n , u n l e s s s p e c i f i c a l l y a c k n o w l e d g e d a s b e i n g s o u r c e d f r o m o t h e rp e r s o n s .( i v ) T h i s d i s s e r t a t i o n / t h e s i s d o e s n o t c o n t a i n o t h e r p e r s o n s ’ w r i t i n g , u n l e s s s p e c i f i c a l l ya c k n o w l e d g e d a s b e i n g s o u r c e d f r o m o t h e r r e s e a r c h e r s . W h e r e o t h e r w r i t t e n s o u r c e sh a v e b e e n q u o t e d , t h e n :a )
t h e i r w o r d s h a v e b e e n r e - w r i t t e n b u t t h e g e n e r a l i n f o r m a t i o na t t r i b u t e d t o t h e m h a s b e e n r e f e r e n c e d :b )
w h e r e t h e i r e x a c t w o r d s h a v e b e e n u s e d , t h e i r w r i t i n g h a s b e e n p l a c e di n s i d e q u o t a t i o n m a r k s , a n d r e f e r e n c e d .( v )
T h i s d i s s e r t a t i o n / t h e s i s d o e s n o t c o n t a i n t e x t , g r a p h i c s o r t a b l e s c o p i e d a n d p a s t e df r o m t h e I n t e r n e t , u n l e s s s p e c i f i c a l l y a c k n o w l e d g e d , a n d t h e s o u r c e b e i n g d e t a i l e d i nt h e d i s s e r t a t i o n / t h e s i s a n d i n t h e R e f e r e n c e s s e c t i o n s .S i g n a t u r e :

i v
ACKNOWLEDGEMENTS
The completion of this document would not have been possible without the
assistance of some special individuals in my life. It is not only this dissertation that
they had an influence in, but also from the time I was accepted to be on the MBA
program.
• Firstly, I would like to thank Shri Mataji Nirmala Devi, my spiritual Mother,
for the gift of Self Realisation, for transforming me from the inside out, for
making me more subtle, for allowing me to know the truth, and for providing
me with the strength and wisdom to complete this degree.
• To Kasturi, my wife, and children Karisni and Mayine, thank you for
shuffling around my work and study schedules and for allowing me the time
and space to achieve this degree. Thank you also for the encouragement
and the understanding.
• To Professor Anesh Maniraj Singh, a big thank you for the encouragement,
guidance, and support for the duration of my study, for being so humble,
approachable, and for being a friend to all the students of the GSB UKZN.
• To my fellow students and group members, thank you for an entertaining
three years. The assignments, tests, and exams became much easier
because of our bond and our ambition of a common goal.
• To my employer, Business Connexion, thank you for being so lenient with
my study requirements and for allowing me the use of company resources.

v
ABSTRACT
This study examines the extent to which South African consumers have embraced
online shopping as a retail channel, and factors that may prevent additional
consumers from adopting an online shopping behaviour. An excellent comparison
was reached by utilizing research data from other sources e.g. Master Card and
Nielsen as to how South Africans fared with their overseas counterparts when it
came to online buying.
A sample of 440 possible respondents were chosen from the La Lucia Ridge
Office Park business district as they fitted the profile of consumers who were
aware of purchasing via the internet medium, and who had access to the internet.
Data was collected using a web based questionnaire that provided built-in
statistical and correlation tools.
Statistical analysis revealed that more males (77%) made online purchases than
females (61%). Most South Africans’ (29%) would make an online purchase after
viewing a newspaper, catalogue, or handout advert and the majority of South
African consumers bought from local and international online retailers (53%).
Security (28%) was the primary reason for those not purchasing items online.
Potential customers (75% of those who are currently not shopping online) wanted
guaranteed online buying safety, and there was a strong indication (24%) that they
needed to trust the online vendor.
E-retailers and web developers have a huge responsibility to ensure their online
purchasing portals are created with a strong security focus in mind and security
should not be an afterthought. With the correct advertising and as internet usage
increases, online buying has huge potential to grow amongst South Africans.
In addition to creating secure web sites, recommendations were made for e-
retailers to increase their efforts in valuing the customer, improving service levels,
online web sites to be informative and be more user friendly, the possibility of
greater utilization of the social media channel, and for online consumers to use
their credit and debit cards in a responsible manner.

v i
TABLE OF CONTENTS
CONSUMER ONLINE BUYING PATTERNS – A SOUTH AFRICAN PERSPECTIVE ................. I
ACKNOWLEDGEMENTS ............................................................................................................ IV
ABSTRACT ................................................................................................................................... V
TABLE OF CONTENTS ............................................................................................................... VI
LIST OF FIGURES ....................................................................................................................... IX
LIST OF TABLES .......................................................................................................................... X
CHAPTER ONE ............................................................................................................................. 1I N T R O D U C T I O N … … … … … … … … … … … … … … … … … … … … … … … … … … … … … … … … … … … … … … … … … … … … 11 . 2 M o t i v a t i o n f o r t h e S t u d y . . . . . . . . . . . . . . . . . . . . . . . . . . . . . . . . . . . . . . . . . . . . . . . . . . . . . . . . . . . . . . . . . . . . . . . . . . . . . . . . . . . . . . . . . . . . . . . . . . . . . . . . . . . . . . . 21 . 3 F o c u s o f t h e S t u d y . . . . . . . . . . . . . . . . . . . . . . . . . . . . . . . . . . . . . . . . . . . . . . . . . . . . . . . . . . . . . . . . . . . . . . . . . . . . . . . . . . . . . . . . . . . . . . . . . . . . . . . . . . . . . . . . . . . . . . . . . 31 . 4 P r o b l e m S t a t e m e n t . . . . . . . . . . . . . . . . . . . . . . . . . . . . . . . . . . . . . . . . . . . . . . . . . . . . . . . . . . . . . . . . . . . . . . . . . . . . . . . . . . . . . . . . . . . . . . . . . . . . . . . . . . . . . . . . . . . . . . . 31 . 5 R e s e a r c h Q u e s t i o n s . . . . . . . . . . . . . . . . . . . . . . . . . . . . . . . . . . . . . . . . . . . . . . . . . . . . . . . . . . . . . . . . . . . . . . . . . . . . . . . . . . . . . . . . . . . . . . . . . . . . . . . . . . . . . . . . . . . . . . . 41 . 6 O b j e c t i v e s o f t h e S t u d y . . . . . . . . . . . . . . . . . . . . . . . . . . . . . . . . . . . . . . . . . . . . . . . . . . . . . . . . . . . . . . . . . . . . . . . . . . . . . . . . . . . . . . . . . . . . . . . . . . . . . . . . . . . . . . . . . 51 . 7 L i m i t a t i o n s o f t h e S t u d y . . . . . . . . . . . . . . . . . . . . . . . . . . . . . . . . . . . . . . . . . . . . . . . . . . . . . . . . . . . . . . . . . . . . . . . . . . . . . . . . . . . . . . . . . . . . . . . . . . . . . . . . . . . . . . . . 51 . 8 S u m m a r y . . . . . . . . . . . . . . . . . . . . . . . . . . . . . . . . . . . . . . . . . . . . . . . . . . . . . . . . . . . . . . . . . . . . . . . . . . . . . . . . . . . . . . . . . . . . . . . . . . . . . . . . . . . . . . . . . . . . . . . . . . . . . . . . . . . . . . . 62 . 2 T e c h n o l o g y R e q u i r e d f o r O n l i n e S h o p p i n g . . . . . . . . . . . . . . . . . . . . . . . . . . . . . . . . . . . . . . . . . . . . . . . . . . . . . . . . . . . . . . . . . . . . . . . . . . . . . . . . . . . . 82 . 3 O n l i n e B u y i n g P a t t e r n s . . . . . . . . . . . . . . . . . . . . . . . . . . . . . . . . . . . . . . . . . . . . . . . . . . . . . . . . . . . . . . . . . . . . . . . . . . . . . . . . . . . . . . . . . . . . . . . . . . . . . . . . . . . . . . . 1 02 . 4 R e t a i l C h a n n e l A l t e r n a t i v e s . . . . . . . . . . . . . . . . . . . . . . . . . . . . . . . . . . . . . . . . . . . . . . . . . . . . . . . . . . . . . . . . . . . . . . . . . . . . . . . . . . . . . . . . . . . . . . . . . . . . . . . . . 1 12 . 5 O n l i n e S a l e s . . . . . . . . . . . . . . . . . . . . . . . . . . . . . . . . . . . . . . . . . . . . . . . . . . . . . . . . . . . . . . . . . . . . . . . . . . . . . . . . . . . . . . . . . . . . . . . . . . . . . . . . . . . . . . . . . . . . . . . . . . . . . . . . . 1 22 . 6 S o u t h A f r i c a n O n l i n e T r e n d s . . . . . . . . . . . . . . . . . . . . . . . . . . . . . . . . . . . . . . . . . . . . . . . . . . . . . . . . . . . . . . . . . . . . . . . . . . . . . . . . . . . . . . . . . . . . . . . . . . . . . . . 1 32 . 7 A l t e r n a t e P a y m e n t M e t h o d s . . . . . . . . . . . . . . . . . . . . . . . . . . . . . . . . . . . . . . . . . . . . . . . . . . . . . . . . . . . . . . . . . . . . . . . . . . . . . . . . . . . . . . . . . . . . . . . . . . . . . . . 1 52 . 7 . 1 e B u c k s . . . . . . . . . . . . . . . . . . . . . . . . . . . . . . . . . . . . . . . . . . . . . . . . . . . . . . . . . . . . . . . . . . . . . . . . . . . . . . . . . . . . . . . . . . . . . . . . . . . . . . . . . . . . . . . . . . . . . . . . . . . . . . . . . . . . . . . . . 1 52 . 7 . 2 U k a s h . . . . . . . . . . . . . . . . . . . . . . . . . . . . . . . . . . . . . . . . . . . . . . . . . . . . . . . . . . . . . . . . . . . . . . . . . . . . . . . . . . . . . . . . . . . . . . . . . . . . . . . . . . . . . . . . . . . . . . . . . . . . . . . . . . . . . . . . . . 1 62 . 8 O n l i n e S h o p p e r s C o n c e r n s . . . . . . . . . . . . . . . . . . . . . . . . . . . . . . . . . . . . . . . . . . . . . . . . . . . . . . . . . . . . . . . . . . . . . . . . . . . . . . . . . . . . . . . . . . . . . . . . . . . . . . . . . . 1 72 . 8 . 1 S e c u r i t y . . . . . . . . . . . . . . . . . . . . . . . . . . . . . . . . . . . . . . . . . . . . . . . . . . . . . . . . . . . . . . . . . . . . . . . . . . . . . . . . . . . . . . . . . . . . . . . . . . . . . . . . . . . . . . . . . . . . . . . . . . . . . . . . . . . . . . . 1 72 . 8 . 2 V i r u s e s . . . . . . . . . . . . . . . . . . . . . . . . . . . . . . . . . . . . . . . . . . . . . . . . . . . . . . . . . . . . . . . . . . . . . . . . . . . . . . . . . . . . . . . . . . . . . . . . . . . . . . . . . . . . . . . . . . . . . . . . . . . . . . . . . . . . . . . . . 1 72 . 8 . 3 T r u s t . . . . . . . . . . . . . . . . . . . . . . . . . . . . . . . . . . . . . . . . . . . . . . . . . . . . . . . . . . . . . . . . . . . . . . . . . . . . . . . . . . . . . . . . . . . . . . . . . . . . . . . . . . . . . . . . . . . . . . . . . . . . . . . . . . . . . . . . . . . . 1 92 . 8 . 4 P r i v a c y . . . . . . . . . . . . . . . . . . . . . . . . . . . . . . . . . . . . . . . . . . . . . . . . . . . . . . . . . . . . . . . . . . . . . . . . . . . . . . . . . . . . . . . . . . . . . . . . . . . . . . . . . . . . . . . . . . . . . . . . . . . . . . . . . . . . . . . . 2 02 . 8 . 5 R e p u t a t i o n . . . . . . . . . . . . . . . . . . . . . . . . . . . . . . . . . . . . . . . . . . . . . . . . . . . . . . . . . . . . . . . . . . . . . . . . . . . . . . . . . . . . . . . . . . . . . . . . . . . . . . . . . . . . . . . . . . . . . . . . . . . . . . . . . . 2 02 . 9 M e c h a n i s m s f o r C o m p a r i n g O n l i n e P r i c e s . . . . . . . . . . . . . . . . . . . . . . . . . . . . . . . . . . . . . . . . . . . . . . . . . . . . . . . . . . . . . . . . . . . . . . . . . . . . . . . . . . 2 02 . 1 0 O n l i n e S h o p p e r s E x p e c t a t i o n s o f O n l i n e E - R e t a i l e r s . . . . . . . . . . . . . . . . . . . . . . . . . . . . . . . . . . . . . . . . . . . . . . . . . . . . . . . . . . . . . . . . . . . 2 12 . 1 1 F a c t o r s F a v o u r i n g G r o w t h O f O n l i n e S h o p p i n g . . . . . . . . . . . . . . . . . . . . . . . . . . . . . . . . . . . . . . . . . . . . . . . . . . . . . . . . . . . . . . . . . . . . . . . . . . 2 22 . 1 1 . 1 C h a n g i n g L i f e s t y l e s . . . . . . . . . . . . . . . . . . . . . . . . . . . . . . . . . . . . . . . . . . . . . . . . . . . . . . . . . . . . . . . . . . . . . . . . . . . . . . . . . . . . . . . . . . . . . . . . . . . . . . . . . . . . . . . . . . . . . 2 22 . 1 1 . 2 U s e o f V i r t u a l A s s i s t a n t s . . . . . . . . . . . . . . . . . . . . . . . . . . . . . . . . . . . . . . . . . . . . . . . . . . . . . . . . . . . . . . . . . . . . . . . . . . . . . . . . . . . . . . . . . . . . . . . . . . . . . . . . . . . . . 2 22 . 1 1 . 3 W e b S i t e D e s i g n . . . . . . . . . . . . . . . . . . . . . . . . . . . . . . . . . . . . . . . . . . . . . . . . . . . . . . . . . . . . . . . . . . . . . . . . . . . . . . . . . . . . . . . . . . . . . . . . . . . . . . . . . . . . . . . . . . . . . . . . . . 2 32 . 1 1 . 4 F a s t e r I n t e r n e t A c c e s s . . . . . . . . . . . . . . . . . . . . . . . . . . . . . . . . . . . . . . . . . . . . . . . . . . . . . . . . . . . . . . . . . . . . . . . . . . . . . . . . . . . . . . . . . . . . . . . . . . . . . . . . . . . . . . . . . 2 32 . 1 1 . 5 S o c i a l M e d i a . . . . . . . . . . . . . . . . . . . . . . . . . . . . . . . . . . . . . . . . . . . . . . . . . . . . . . . . . . . . . . . . . . . . . . . . . . . . . . . . . . . . . . . . . . . . . . . . . . . . . . . . . . . . . . . . . . . . . . . . . . . . . . . . 2 42 . 1 1 . 6 I m p r o v e m e n t s t o I n f r a s t r u c t u r e t h a t P r o m o t e T e c h n o l o g y . . . . . . . . . . . . . . . . . . . . . . . . . . . . . . . . . . . . . . . . . . . . . . . . . . . . . . . . 2 42 . 1 2 S u m m a r y . . . . . . . . . . . . . . . . . . . . . . . . . . . . . . . . . . . . . . . . . . . . . . . . . . . . . . . . . . . . . . . . . . . . . . . . . . . . . . . . . . . . . . . . . . . . . . . . . . . . . . . . . . . . . . . . . . . . . . . . . . . . . . . . . . . . . 2 5CHAPTER THREE ...................................................................................................................... 27

v i i
R e s e a r c h M e t h o d o l o g y . . . . . . . . . . . . . . . . . . . . . . . . . . . . . . . . . . . . . . . . . . . . . . . . . . . . . . . . . . . . . . . . . . . . . . . . . . . . . . . . . . . . . . . . . . . . . . . . . . . . . . . . . . . . 2 73 . 1 I n t r o d u c t i o n . . . . . . . . . . . . . . . . . . . . . . . . . . . . . . . . . . . . . . . . . . . . . . . . . . . . . . . . . . . . . . . . . . . . . . . . . . . . . . . . . . . . . . . . . . . . . . . . . . . . . . . . . . . . . . . . . . . . . . . . . . . . . . . . 2 73 . 2 A i m a n d O b j e c t i v e o f t h e S t u d y . . . . . . . . . . . . . . . . . . . . . . . . . . . . . . . . . . . . . . . . . . . . . . . . . . . . . . . . . . . . . . . . . . . . . . . . . . . . . . . . . . . . . . . . . . . . . . . . . . . 2 73 . 3 D a t a C o l l e c t i o n S t r a t e g i e s . . . . . . . . . . . . . . . . . . . . . . . . . . . . . . . . . . . . . . . . . . . . . . . . . . . . . . . . . . . . . . . . . . . . . . . . . . . . . . . . . . . . . . . . . . . . . . . . . . . . . . . . . . 2 83 . 4 R e s e a r c h D e s i g n a n d M e t h o d s . . . . . . . . . . . . . . . . . . . . . . . . . . . . . . . . . . . . . . . . . . . . . . . . . . . . . . . . . . . . . . . . . . . . . . . . . . . . . . . . . . . . . . . . . . . . . . . . . . . . 3 03 . 4 . 1 D e s c r i p t i o n a n d P u r p o s e . . . . . . . . . . . . . . . . . . . . . . . . . . . . . . . . . . . . . . . . . . . . . . . . . . . . . . . . . . . . . . . . . . . . . . . . . . . . . . . . . . . . . . . . . . . . . . . . . . . . . . . . . . . . . 3 03 . 4 . 1 . 1 C o n s t r u c t i o n o f t h e I n s t r u m e n t . . . . . . . . . . . . . . . . . . . . . . . . . . . . . . . . . . . . . . . . . . . . . . . . . . . . . . . . . . . . . . . . . . . . . . . . . . . . . . . . . . . . . . . . . . . . . . . . . . . 3 03 . 4 . 1 . 2 R e c r u i t m e n t o f S t u d y P a r t i c i p a n t s . . . . . . . . . . . . . . . . . . . . . . . . . . . . . . . . . . . . . . . . . . . . . . . . . . . . . . . . . . . . . . . . . . . . . . . . . . . . . . . . . . . . . . . . . . . . . . 3 13 . 4 . 2 P r e t e s t i n g a n d V a l i d a t i o n . . . . . . . . . . . . . . . . . . . . . . . . . . . . . . . . . . . . . . . . . . . . . . . . . . . . . . . . . . . . . . . . . . . . . . . . . . . . . . . . . . . . . . . . . . . . . . . . . . . . . . . . . . . 3 13 . 4 . 2 . 1 P r e t e s t i n g . . . . . . . . . . . . . . . . . . . . . . . . . . . . . . . . . . . . . . . . . . . . . . . . . . . . . . . . . . . . . . . . . . . . . . . . . . . . . . . . . . . . . . . . . . . . . . . . . . . . . . . . . . . . . . . . . . . . . . . . . . . . . . . . . . . . 3 13 . 4 . 2 . 2 V a l i d a t i o n . . . . . . . . . . . . . . . . . . . . . . . . . . . . . . . . . . . . . . . . . . . . . . . . . . . . . . . . . . . . . . . . . . . . . . . . . . . . . . . . . . . . . . . . . . . . . . . . . . . . . . . . . . . . . . . . . . . . . . . . . . . . . . . . . . . . 3 2M e a s u r e m e n t V a l i d i t y . . . . . . . . . . . . . . . . . . . . . . . . . . . . . . . . . . . . . . . . . . . . . . . . . . . . . . . . . . . . . . . . . . . . . . . . . . . . . . . . . . . . . . . . . . . . . . . . . . . . . . . . . . . . . . . . . . . . . . . . . . . . . 3 2I n t e r n a l V a l i d i t y . . . . . . . . . . . . . . . . . . . . . . . . . . . . . . . . . . . . . . . . . . . . . . . . . . . . . . . . . . . . . . . . . . . . . . . . . . . . . . . . . . . . . . . . . . . . . . . . . . . . . . . . . . . . . . . . . . . . . . . . . . . . . . . . . . . . . . . 3 2E x t e r n a l V a l i d i t y . . . . . . . . . . . . . . . . . . . . . . . . . . . . . . . . . . . . . . . . . . . . . . . . . . . . . . . . . . . . . . . . . . . . . . . . . . . . . . . . . . . . . . . . . . . . . . . . . . . . . . . . . . . . . . . . . . . . . . . . . . . . . . . . . . . . . . 3 2E c o l o g i c a l V a l i d i t y . . . . . . . . . . . . . . . . . . . . . . . . . . . . . . . . . . . . . . . . . . . . . . . . . . . . . . . . . . . . . . . . . . . . . . . . . . . . . . . . . . . . . . . . . . . . . . . . . . . . . . . . . . . . . . . . . . . . . . . . . . . . . . . . . . . 3 33 . 4 . 3 A d m i n i s t r a t i o n o f t h e Q u e s t i o n n a i r e . . . . . . . . . . . . . . . . . . . . . . . . . . . . . . . . . . . . . . . . . . . . . . . . . . . . . . . . . . . . . . . . . . . . . . . . . . . . . . . . . . . . . . . . . . 3 33 . 5 A n a l y s i s o f t h e D a t a . . . . . . . . . . . . . . . . . . . . . . . . . . . . . . . . . . . . . . . . . . . . . . . . . . . . . . . . . . . . . . . . . . . . . . . . . . . . . . . . . . . . . . . . . . . . . . . . . . . . . . . . . . . . . . . . . . . . 3 33 . 6 S u m m a r y . . . . . . . . . . . . . . . . . . . . . . . . . . . . . . . . . . . . . . . . . . . . . . . . . . . . . . . . . . . . . . . . . . . . . . . . . . . . . . . . . . . . . . . . . . . . . . . . . . . . . . . . . . . . . . . . . . . . . . . . . . . . . . . . . . . . . 3 4CHAPTER FOUR ........................................................................................................................ 35P r e s e n t a t i o n o f R e s u l t s . . . . . . . . . . . . . . . . . . . . . . . . . . . . . . . . . . . . . . . . . . . . . . . . . . . . . . . . . . . . . . . . . . . . . . . . . . . . . . . . . . . . . . . . . . . . . . . . . . . . . . . . . . . . 3 54 . 1 I n t r o d u c t i o n . . . . . . . . . . . . . . . . . . . . . . . . . . . . . . . . . . . . . . . . . . . . . . . . . . . . . . . . . . . . . . . . . . . . . . . . . . . . . . . . . . . . . . . . . . . . . . . . . . . . . . . . . . . . . . . . . . . . . . . . . . . . . . . . 3 54 . 2 A n a l y s i s o f R e s u l t s . . . . . . . . . . . . . . . . . . . . . . . . . . . . . . . . . . . . . . . . . . . . . . . . . . . . . . . . . . . . . . . . . . . . . . . . . . . . . . . . . . . . . . . . . . . . . . . . . . . . . . . . . . . . . . . . . . . . . . . 3 54 . 2 . 1 A g e o f R e s p o n d e n t s . . . . . . . . . . . . . . . . . . . . . . . . . . . . . . . . . . . . . . . . . . . . . . . . . . . . . . . . . . . . . . . . . . . . . . . . . . . . . . . . . . . . . . . . . . . . . . . . . . . . . . . . . . . . . . . . . . . . 3 54 . 2 . 2 R a c i a l C o m p o s i t i o n . . . . . . . . . . . . . . . . . . . . . . . . . . . . . . . . . . . . . . . . . . . . . . . . . . . . . . . . . . . . . . . . . . . . . . . . . . . . . . . . . . . . . . . . . . . . . . . . . . . . . . . . . . . . . . . . . . . . . 3 64 . 2 . 3 G e n d e r . . . . . . . . . . . . . . . . . . . . . . . . . . . . . . . . . . . . . . . . . . . . . . . . . . . . . . . . . . . . . . . . . . . . . . . . . . . . . . . . . . . . . . . . . . . . . . . . . . . . . . . . . . . . . . . . . . . . . . . . . . . . . . . . . . . . . . . . 3 74 . 2 . 4 T h e N u m b e r o f O n l i n e S h o p p e r s . . . . . . . . . . . . . . . . . . . . . . . . . . . . . . . . . . . . . . . . . . . . . . . . . . . . . . . . . . . . . . . . . . . . . . . . . . . . . . . . . . . . . . . . . . . . . . . . . 3 84 . 2 . 5 R e a s o n s f o r n o t S h o p p i n g O n l i n e . . . . . . . . . . . . . . . . . . . . . . . . . . . . . . . . . . . . . . . . . . . . . . . . . . . . . . . . . . . . . . . . . . . . . . . . . . . . . . . . . . . . . . . . . . . . . . . . 3 84 . 2 . 6 W h y a n d H o w O f t e n d o P e o p l e S h o p O n l i n e ? . . . . . . . . . . . . . . . . . . . . . . . . . . . . . . . . . . . . . . . . . . . . . . . . . . . . . . . . . . . . . . . . . . . . . . . . . . . . . 3 94 . 2 . 7 W h a t i s P u r c h a s e d f r o m W h e r e a n d W h e n ? . . . . . . . . . . . . . . . . . . . . . . . . . . . . . . . . . . . . . . . . . . . . . . . . . . . . . . . . . . . . . . . . . . . . . . . . . . . . . . . 4 04 . 2 . 8 W h a t d o O n l i n e B u y e r s L o o k f o r i n a n O n l i n e R e t a i l e r s W e b S i t e a n d H o w M u c h o n A v e r a g e i sS p e n t ? … … … … … … … … … … … … … … … … … … … … … … … … … … … … … … … … … … … … … … … … … … … … … … … … … … … … … … . . 4 14 . 2 . 9 T h e F u t u r e o f O n l i n e S h o p p i n g . . . . . . . . . . . . . . . . . . . . . . . . . . . . . . . . . . . . . . . . . . . . . . . . . . . . . . . . . . . . . . . . . . . . . . . . . . . . . . . . . . . . . . . . . . . . . . . . . . . . 4 24 . 3 I n f e r e n t i a l S t a t i s t i c s . . . . . . . . . . . . . . . . . . . . . . . . . . . . . . . . . . . . . . . . . . . . . . . . . . . . . . . . . . . . . . . . . . . . . . . . . . . . . . . . . . . . . . . . . . . . . . . . . . . . . . . . . . . . . . . . . . . . 4 24 . 3 . 1 C r o s s T a b u l a t i o n s . . . . . . . . . . . . . . . . . . . . . . . . . . . . . . . . . . . . . . . . . . . . . . . . . . . . . . . . . . . . . . . . . . . . . . . . . . . . . . . . . . . . . . . . . . . . . . . . . . . . . . . . . . . . . . . . . . . . . . . . 4 24 . 3 . 1 . 1 C r o s s t a b u l a t i o n b e t w e e n A g e a n d S h o p p i n g O n l i n e p a r a m e t e r s . . . . . . . . . . . . . . . . . . . . . . . . . . . . . . . . . . . . . . . . . . . . . . 4 34 . 4 C o r r e l a t i o n A n a l y s i s . . . . . . . . . . . . . . . . . . . . . . . . . . . . . . . . . . . . . . . . . . . . . . . . . . . . . . . . . . . . . . . . . . . . . . . . . . . . . . . . . . . . . . . . . . . . . . . . . . . . . . . . . . . . . . . . . . . . 4 54 . 4 . 1 P e a r s o n ’ s r . . . . . . . . . . . . . . . . . . . . . . . . . . . . . . . . . . . . . . . . . . . . . . . . . . . . . . . . . . . . . . . . . . . . . . . . . . . . . . . . . . . . . . . . . . . . . . . . . . . . . . . . . . . . . . . . . . . . . . . . . . . . . . . . . . 4 64 . 4 . 2 S p e a r m a n ’ s r h o . . . . . . . . . . . . . . . . . . . . . . . . . . . . . . . . . . . . . . . . . . . . . . . . . . . . . . . . . . . . . . . . . . . . . . . . . . . . . . . . . . . . . . . . . . . . . . . . . . . . . . . . . . . . . . . . . . . . . . . . . . . 4 64 . 5 S u m m a r y . . . . . . . . . . . . . . . . . . . . . . . . . . . . . . . . . . . . . . . . . . . . . . . . . . . . . . . . . . . . . . . . . . . . . . . . . . . . . . . . . . . . . . . . . . . . . . . . . . . . . . . . . . . . . . . . . . . . . . . . . . . . . . . . . . . . . 4 8CHAPTER FIVE ……………………………………………………………………………………….49I n t e r p r e t a t i o n o f R e s u l t s . . . . . . . . . . . . . . . . . . . . . . . . . . . . . . . . . . . . . . . . . . . . . . . . . . . . . . . . . . . . . . . . . . . . . . . . . . . . . . . . . . . . . . . . . . . . . . . . . . . . . . . . . . 4 95 . 1 I n t r o d u c t i o n . . . . . . . . . . . . . . . . . . . . . . . . . . . . . . . . . . . . . . . . . . . . . . . . . . . . . . . . . . . . . . . . . . . . . . . . . . . . . . . . . . . . . . . . . . . . . . . . . . . . . . . . . . . . . . . . . . . . . . . . . . . . . . . . 4 95 . 2 G e n d e r a n d E d u c a t i o n a s d e t e r m i n a n t s f o r O n l i n e S h o p p i n g . . . . . . . . . . . . . . . . . . . . . . . . . . . . . . . . . . . . . . . . . . . . . . . . . . . . . 4 95 . 3 R e a s o n s f o r S h o p p i n g O n l i n e . . . . . . . . . . . . . . . . . . . . . . . . . . . . . . . . . . . . . . . . . . . . . . . . . . . . . . . . . . . . . . . . . . . . . . . . . . . . . . . . . . . . . . . . . . . . . . . . . . . . . . 5 05 . 4 R e a s o n s f o r n o t S h o p p i n g O n l i n e . . . . . . . . . . . . . . . . . . . . . . . . . . . . . . . . . . . . . . . . . . . . . . . . . . . . . . . . . . . . . . . . . . . . . . . . . . . . . . . . . . . . . . . . . . . . . . . . 5 2

v i i i
5 . 5 P r o m o t i n g O n l i n e S h o p p i n g b y u s i n g N e w A g e M e d i a . . . . . . . . . . . . . . . . . . . . . . . . . . . . . . . . . . . . . . . . . . . . . . . . . . . . . . . . . . . . . . . 5 35 . 5 . 1 T h e N u m b e r o f O n l i n e S h o p p e r s . . . . . . . . . . . . . . . . . . . . . . . . . . . . . . . . . . . . . . . . . . . . . . . . . . . . . . . . . . . . . . . . . . . . . . . . . . . . . . . . . . . . . . . . . . . . . . . . . 5 35 . 5 . 2 W h a t i s P u r c h a s e d O n l i n e . . . . . . . . . . . . . . . . . . . . . . . . . . . . . . . . . . . . . . . . . . . . . . . . . . . . . . . . . . . . . . . . . . . . . . . . . . . . . . . . . . . . . . . . . . . . . . . . . . . . . . . . . . . 5 45 . 5 . 3 W h e r e a n d W h e n i s O n l i n e S h o p p i n g D o n e . . . . . . . . . . . . . . . . . . . . . . . . . . . . . . . . . . . . . . . . . . . . . . . . . . . . . . . . . . . . . . . . . . . . . . . . . . . . . . . . 5 55 . 6 F a c t o r s A s s i s t i n g t h e G r o w t h o f O n l i n e S h o p p i n g . . . . . . . . . . . . . . . . . . . . . . . . . . . . . . . . . . . . . . . . . . . . . . . . . . . . . . . . . . . . . . . . . . . . . . . 5 65 . 7 C o n c l u s i o n . . . . . . . . . . . . . . . . . . . . . . . . . . . . . . . . . . . . . . . . . . . . . . . . . . . . . . . . . . . . . . . . . . . . . . . . . . . . . . . . . . . . . . . . . . . . . . . . . . . . . . . . . . . . . . . . . . . . . . . . . . . . . . . . . . . 5 8CHAPTER SIX ............................................................................................................................. 59R e c o m m e n d a t i o n s a n d C o n c l u s i o n . . . . . . . . . . . . . . . . . . . . . . . . . . . . . . . . . . . . . . . . . . . . . . . . . . . . . . . . . . . . . . . . . . . . . . . . . . . . . . . . . . . . . . . . . . 5 96 . 1 I n t r o d u c t i o n . . . . . . . . . . . . . . . . . . . . . . . . . . . . . . . . . . . . . . . . . . . . . . . . . . . . . . . . . . . . . . . . . . . . . . . . . . . . . . . . . . . . . . . . . . . . . . . . . . . . . . . . . . . . . . . . . . . . . . . . . . . . . . . . 5 96 . 2 H a v e t h e p r o b l e m s b e e n s o l v e d ? . . . . . . . . . . . . . . . . . . . . . . . . . . . . . . . . . . . . . . . . . . . . . . . . . . . . . . . . . . . . . . . . . . . . . . . . . . . . . . . . . . . . . . . . . . . . . . . . 5 96 . 3 R e c o m m e n d a t i o n s . . . . . . . . . . . . . . . . . . . . . . . . . . . . . . . . . . . . . . . . . . . . . . . . . . . . . . . . . . . . . . . . . . . . . . . . . . . . . . . . . . . . . . . . . . . . . . . . . . . . . . . . . . . . . . . . . . . . . . 6 06 . 3 . 1 S i t e D e s i g n . . . . . . . . . . . . . . . . . . . . . . . . . . . . . . . . . . . . . . . . . . . . . . . . . . . . . . . . . . . . . . . . . . . . . . . . . . . . . . . . . . . . . . . . . . . . . . . . . . . . . . . . . . . . . . . . . . . . . . . . . . . . . . . . . . 6 06 . 3 . 2 V a l u i n g t h e C u s t o m e r . . . . . . . . . . . . . . . . . . . . . . . . . . . . . . . . . . . . . . . . . . . . . . . . . . . . . . . . . . . . . . . . . . . . . . . . . . . . . . . . . . . . . . . . . . . . . . . . . . . . . . . . . . . . . . . . . 6 06 . 3 . 3 S e c u r i t y F i x u p s . . . . . . . . . . . . . . . . . . . . . . . . . . . . . . . . . . . . . . . . . . . . . . . . . . . . . . . . . . . . . . . . . . . . . . . . . . . . . . . . . . . . . . . . . . . . . . . . . . . . . . . . . . . . . . . . . . . . . . . . . . . . 6 16 . 3 . 4 E a s e o f U s e . . . . . . . . . . . . . . . . . . . . . . . . . . . . . . . . . . . . . . . . . . . . . . . . . . . . . . . . . . . . . . . . . . . . . . . . . . . . . . . . . . . . . . . . . . . . . . . . . . . . . . . . . . . . . . . . . . . . . . . . . . . . . . . . . . 6 26 . 3 . 5 C r e d i t C a r d a n d D e b i t C a r d U s a g e . . . . . . . . . . . . . . . . . . . . . . . . . . . . . . . . . . . . . . . . . . . . . . . . . . . . . . . . . . . . . . . . . . . . . . . . . . . . . . . . . . . . . . . . . . . . . . 6 26 . 3 . 6 S o c i a l M e d i a . . . . . . . . . . . . . . . . . . . . . . . . . . . . . . . . . . . . . . . . . . . . . . . . . . . . . . . . . . . . . . . . . . . . . . . . . . . . . . . . . . . . . . . . . . . . . . . . . . . . . . . . . . . . . . . . . . . . . . . . . . . . . . . . 6 27 . A b i l i t y t o A d d r e s s t h e O b j e c t i v e s o f t h i s S t u d y . . . . . . . . . . . . . . . . . . . . . . . . . . . . . . . . . . . . . . . . . . . . . . . . . . . . . . . . . . . . . . . . . . . . . . . . . . . . 6 38 . L i m i t a t i o n s o f t h e S t u d y . . . . . . . . . . . . . . . . . . . . . . . . . . . . . . . . . . . . . . . . . . . . . . . . . . . . . . . . . . . . . . . . . . . . . . . . . . . . . . . . . . . . . . . . . . . . . . . . . . . . . . . . . . . . . . 6 39 . R e c o m m e n d a t i o n o f P o s s i b l e F u t u r e S t u d i e s . . . . . . . . . . . . . . . . . . . . . . . . . . . . . . . . . . . . . . . . . . . . . . . . . . . . . . . . . . . . . . . . . . . . . . . . . . . . . . 6 41 0 . I m p l i c a t i o n o f t h i s R e s e a r c h . . . . . . . . . . . . . . . . . . . . . . . . . . . . . . . . . . . . . . . . . . . . . . . . . . . . . . . . . . . . . . . . . . . . . . . . . . . . . . . . . . . . . . . . . . . . . . . . . . . . . . . . 6 41 1 . C o n c l u s i o n . . . . . . . . . . . . . . . . . . . . . . . . . . . . . . . . . . . . . . . . . . . . . . . . . . . . . . . . . . . . . . . . . . . . . . . . . . . . . . . . . . . . . . . . . . . . . . . . . . . . . . . . . . . . . . . . . . . . . . . . . . . . . . . . . . . 6 5REFERENCES ............................................................................................................................ 66
APPENDIX 1 ............................................................................................................................... 72E T H I C A L A P P R O V A L . . . . . . . . . . . . . . . . . . . . . . . . . . . . . . . . . . . . . . . . . . . . . . . . . . . . . . . . . . . . . . . . . . . . . . . . . . . . . . . . . . . . . . . . . . . . . . . . . . . . . . . . . . . . . . . . . 7 2APPENDIX 2 ............................................................................................................................... 73Q U E S T I O N N A I R E . . . . . . . . . . . . . . . . . . . . . . . . . . . . . . . . . . . . . . . . . . . . . . . . . . . . . . . . . . . . . . . . . . . . . . . . . . . . . . . . . . . . . . . . . . . . . . . . . . . . . . . . . . . . . . . . . . . . . . 7 3

i x
LIST OF FIGURES
Figure 2.1 Consumer decision process before making an online purchase …….10
Figure 4.1 Age distribution of online buyers ........................................................36
Figure 4.2 Racial composition of online buyers ...................................................37
Figure 4.3 Reasons why people do not buy online ..............................................38
Figure 4.4 Reasons why people buy online .........................................................39
Figure 4.5 What are people buying online? ..........................................................40
Figure 4.6 Factors promoting online purchasing ..................................................41
Figure 4.7 Factors fuelling growth of online purchasing .......................................42

x
LIST OF TABLES
Table 2.1: Most popular items purchased via the Internet Globally ……….……...13
Table 4.1 Gender and Online Shopping Cross Tabulation Analysis .....................37
Table 4.2: Age and Online Shopping Cross Tabulation Analysis .........................43
Table 4.3: Breakdown between Age and the Various Items that are Purchased
Online ...................................................................................................................44
Table 4.4: Gender and Items purchased online ...................................................44
Table 4.5: lists the reasons why both genders prefer not to shop online .............45
Table 4.6: Correlation Analysis between race and shopping online .....................46
Table 4.7: Correlation Analysis between age and shopping online ......................47
Table 4.8: Correlation Analysis between race and shopping online .....................47
Table 4.9: Correlation Analysis between gender and shopping online in the future
...............................................................................................................................48

1
CHAPTER ONE
INTRODUCTION
1.1 Introduction
The world has progressively changed in the last century, and the invention of the
World Wide Web in 1989 has made the way we accomplish things change in leaps
and bounds. There have been huge strides in the development of software
applications that make the lives of ordinary people less difficult.
The Internet has rapidly become an important communication channel for
research, entertainment, collaboration, and purchase of products and services
over the past years Dijk, Minocha & Laing (2007); Richard, Chebat, Yang &
Putrevu (2009). Even though the Internet is being utilized by millions across the
world to read their e-mails, watch videos, communicate with each other, and play
games, there is also a serious side to the Internet and that is business. According
to Richard et al (2009 pp:1) ‘the Internet is becoming an important facet of
communication strategy due to its ability to deliver information, entertainment, and
e-shopping’ and touches human beings lifestyles on virtually all aspects due to ‘its
ease of use, wide access, and wealth of information’.
Consumers have been exposed and are knowledgeable with the centuries old
tradition of physically going into a store to make the necessary purchases,
however; there exists the possibility of never having to leave ones home to make
certain purchases. Depending on the design of the supply chain, “some
organizations have moved from a brick-and-mortar format to a clicks-and-mortar
format” (Singh 2004 pp: 187). Due to the invention of the Internet it is very possible
to open a retail business and not have a physical presence i.e. selling goods
online only.
In fact e-commerce web sites have introduced an entirely new way of purchasing
that offers the consumer time saving, convenience, item comparison options, and
selection from a wide range of products. The Internet has created a new retail

2
channel and everything from clothing, food, travel, accommodation, books, and
computers are available at the click of a mouse (Huarng & Christopher 2003).
1.2 Motivation for the Study
The study benefits individuals who make online purchases, those contemplating
whether safety is a concern to shop online, and those who just want to know what
online buying is all about. E-retailers will benefit because through this study,
insight is gained of how online shoppers think and what online shoppers are
looking for, before committing to an online purchase. Web developers who want to
improve their skills when creating web sites that are appealing to the eye and at
the same time using technology best practices to maintain user privacy, store
confidential data, and prevent unlawful access of this data will also benefit from
this study.
Entering confidential user information into an e-retailers web site is easy, but if
web developers did not think about security when building a web site, consumers
and e-retailers are at huge financial risk should these web servers be
compromised. If confidential user information e.g. credit card details are unlawfully
taken from an online web server’s database, the new owner of this information can
make un-authorised purchases or even sell this information to other less desirable
individuals. Experts in the field of building secure web sites share their best
practice knowledge which is discussed later on in this dissertation.
If e-retailers come to understand how the mind of online buyers work, e-retailers
will be able to create an online experience that will work in their favour by
capturing larger market share volumes and retaining these customers. Online
customers have specific needs and if these are known and are able to be
provided, a win-win situation is created.
Just as there are online consumers who are not aware of any security dangers
when using the internet, there may be others who are overly cautious, preventing
themselves from accomplishing tasks in new and easier ways. Online consumers
cautious behaviour may have been developed through rumours, not having access
to correct information, and ideas which may be incorrectly conceived. This

3
dissertation will list and discuss the dangers of using the internet and measures to
have in place to ensure a safe and enjoyable browsing experience.
1.3 Focus of the Study
The focus of this study is to understand the online buying habits of South African
consumers through carefully chosen objectives and matching questions. Once
respondents have answered the survey their responses will be compared to other
published works on ‘online buying’ to gauge any similarities or differences. A few
of these published works include: a proposed model of online consumer
behaviour: assessing the role of gender; adoption and usage of online shopping:
an empirical analysis of the characteristics of ‘‘buyers’’ ‘‘browsers’’ and ‘‘non-
internet shoppers’’; the effectiveness of Internet marketing: a management and
consumer perspective; comparing internet and mobile phone usage: digital divides
of usage, adoption, and dropouts; and exploring the impact of online privacy
disclosures on consumer trust. South Africa is a country that is aspiring to reach
out in terms of technology and it will be interesting to know just how South Africans
fare with the rest of the world in terms of online purchases, type of goods
purchased, concerns of online shoppers, and average amounts spent on online
purchases. Whilst this study looks at the ‘culture’ of online shopping in South
Africa, the reasons why people are not shopping via the online retail channel is
also researched and possible reasons are discussed later on in this study.
1.4 Problem Statement
With the development of the World Wide Web in 1989 there have been huge
strides in development of software applications that makes the lives of ordinary
people simpler. Consumers have been exposed and are knowledgeable with the
centuries old tradition of physically going into a store to make the necessary
purchases. The internet and previously mentioned applications, including the wider
availability of broadband access have made access to the internet easier and also
now removed the need of going to a store. Research suggests that, for some
people, e-shopping could be a time-saving strategy, and leisure-oriented for
others. This research investigates the type of online browsing experience that will

4
lead to online buying; attitudes, beliefs, and behaviour differences of consumers
that use online channels for their purchases and consumers that do not.
1.5 Research Questions
The research questions that the study will attempt to answer include:
• reasons why people shop online and factors that attract them to the online
shopping retail channel
• to determine why some people may be cautious about making online
purchases
• when, how often, from where, and approximate amounts are spent on
online purchases
Both Surveysystem.com and Research-advisors.com recommended for a
population of 250 000 – 300 000 000, the survey sample size should be 384. This
suited the requirements of the population size for La Lucia as the population size
was within the defined limits. The online survey contained 14 questions. These
questions were in the form of radio boxes, selection lists, text boxes, and check
boxes. Forty of the authors friends were used to complete the questionnaire and
they in turn provided the author with 10 of their friends e-mail addresses who also
completed the questionnaire, giving a total of 440 possible respondents.
The home page of the questionnaire on Question Pro, was the informed consent
document, which stated the nature of the intended research, what the objectives
were, that completing the online questionnaire is on a voluntary basis, that they
could withdraw from completing the questionnaire at any time, that there was no
monetary gain, that confidentiality and anonymity is assured, and if the respondent
had any questions or concerns who they may contact. The respondent could only
start answering questions when he / she agreed to the above mentioned nature of
the research.
E-mails were sent in April and May 2010 to 440 people who worked in La Lucia
Ridge Office Park. The mail directed respondents to an online questionnaire that
took two minutes to complete. This questionnaire contained open and closed

5
questions and ranking scales. The online survey web site allowed the researcher
to design simple web pages with questions and respondents answers were
collected and stored. The questionnaire asked for information to determine
demographical data and also to understand decision processes that the online
consumer go through before committing to an online purchase. The predominant
reason for using an online web survey was because respondents’ data could be
collected centrally. Furthermore, there were built in correlation and statistical tools
which were useful for analysing data.
1.6 Objectives of the Study
The objectives were researched through 14 questions and these objectives
included:
• determining what consumers look for before purchasing from a website
• to determine the factors that promote or inhibit the practice of online
purchasing
• to determine the items that online consumers buy, where, when, and how
often
This survey also attempted to find the reasons why some consumers steered
away from online purchases and whether these reasons were serious concerns or
if they were un-founded and old thinking. Research from other online buying
institutions i.e. World Wide Worx, Master Card, Nielsen Global Online Survey,
Accenture, and other leading researchers in this field, which are available, will be
compared with results obtained from this survey for similarities and differences.
1.7 Limitations of the Study
There are four limitations to this study. Firstly, data obtained may not be a true
reflection of all South Africans online buying habits. The reasons include: people
surveyed from La Lucia Ridge Office Park, were employed by corporates, who
earned higher salaries, and have access to the internet. The limitation of
probability sampling (simple random sampling) therefore, is that the results of the
survey cannot be generalised to the population of South Africa i.e. a

6
heterogeneous study incorporating respondents from other areas and industries
instead of a homogenous study would provide a superior sample. There are many
communities in South Africa who live in poverty and may have never heard of the
Internet, let alone online buying. Secondly, although data indicates what items are
purchased online, there is no definite indication of what items are purchased
locally or internationally. Thirdly, to prevent the respondent from feeling
uncomfortable with the questionnaire; the level of education was not requested. As
a result, no comparison could be accomplished between education and levels of
online buying. Lastly, research informs the reader that an upsurge in Internet
access is through improved technology or more competitive pricing. The
questionnaire did not ask whether easier access to the Internet would positively
increase the chances of purchasing via the Internet medium.
1.8 Summary
With advancements in technology and the invention of the internet human beings
are accomplishing tasks in ways that are different from our forefathers. Society
has become more reliant on technology and computers to perform dangerous,
mundane, and repetitive tasks.
E-retailers were once upon a time the traditional brick-and-mortar retailers. As
applications on the internet improved, retailers decided to attempt selling their
products online. An entirely new shopping channel was created as the internet and
supporting technologies grew in use and popularity. Research shows that the
numbers of online shoppers are growing in most parts of the world (875 million
shoppers …2008).
The structure for the rest of this study is as follows: Chapter 2 uses literature from
journal articles, books, newspapers, and other research to provide a greater
understanding of the topic being discussed. Chapter three discusses the research
methodology instrument that was implemented for this study. Chapter 4 presents
results of data obtained from respondents that completed the online survey in the
form of descriptive and inferential statistics. Chapter five provides a discussion of

7
the research findings from the previous chapter by contrasting the findings with
research from previous research and readings, both locally and internationally.
Chapter six is the final chapter and discusses whether user data in accordance to
the pre-defined objectives were received, lists recommendations and provides a
conclusion.

8
CHAPTER TWO
Literature Review: An Overview of Consumer Online Buying Patterns
2.1 Introduction
The Internet has evolved to become a strategic communication medium for
gathering of data, entertainment, collaboration, and buying and selling of products
and services over the past years (Dijk, Minocha & Laing 2007; Richard, Chebat,
Yang & Putrevu 2009). The Internet is being utilized by millions across the world
for social purposes, but there is also a serious side to the Internet and that is
business.
Although consumers have been going for centuries to stores to make the
necessary purchases; with the invention of the Internet, it is now possible to never
leave ones home to make certain purchases. Depending on the design of the
supply chain, “some organizations have moved from a bricks-and-mortar format to
a clicks-and-mortar format” Singh (2004 pp: 187).
The Internet has created a new retail channel and everything from clothing, food,
travel, accommodation, books, and computers are available at the click of a
mouse (Huarng & Christopher 2003).
This chapter will address the following: technology required for online shopping,
online buying patterns, concerns of those who do and do not shop online, and the
future of online shopping in South Africa.
2.2 Technology Required for Online Shopping
O’Cass & Fenech (2003), termed an online users ability to successfully execute
the use of the Internet as ‘Internet self-efficacy’. Since the Internet is a complex
web of routers and communication links, the Internet is often referred to as a
‘cloud’. According to Lian & Lin (2008), buyers and sellers conduct business via a
virtual environment allowing for high anonymity. This anonymity creates security
concerns that don’t exist when going physically to a store. Understanding

9
consumer online buying patterns in South Africa is important to gauge how South
African buying behaviour compares with developed countries, and whether similar
trends is experienced in South Africa. Internet services and applications are found
in most places of work, in homes, latest cell phones, and Internet cafes.
Broadband technologies such as ADSL and 3G are commonly adopted
technologies for fast home and business Internet access (Goldstuck 2010). Fixed
line broadband Internet access has increased by 50% from 2008 to 2009 and
wireless broadband Internet access has also increased three times as fast as fixed
line broadband in South Africa (Goldstuck 2010). A study by World Wide Worx in
2010 revealed that the number of South African Internet users passed the five
million mark for the first time, representing 10% Internet penetration for South
Africa (Goldstuck 2010).
Reasons cited for the increase of South African Internet users includes:
• granting Electronic Communications Network Service licenses to more than
four hundred organizations, enabling the Internet service provider industry
in South Africa to be opened up creating more competition
• small and medium enterprises (SMEs) upgrading to ADSL which resulted
in more than half a million people gaining access to the Internet, who did
not previously have access
• South African employers embracing the concept of remote connectivity and
allowing their workers the freedom of being connected to business
applications whilst not physically at work. This is achieved by issuing 3G
cards, laptops, and cell phones to employees who need to be connected
while not being at the office, allowing them to still be productive,
responsive, and creative. The result is that wireless broadband grew by
88% in 2009
• New fibre-optic networks laid in cities and the new SeaCom cable are
making corporates re-align their thinking on infrastructure to take
advantage of bigger, faster, and more flexible capacity (Goldstuck 2010).

1 0
2.3 Online Buying Patterns
To maximize market share, e-retailers must ‘understand the behaviour of the
different types of Internet shoppers in order to address the shoppers specific
needs, expectations, and more importantly their concerns’ (Soopramanien 2007,
pp.73). Some of these needs and expectations may include web experience (site
design and functionality), security, privacy, and trust of the online vendor.
An analytical framework (Figure 2.1) developed by Engel et al cited in Chau et al
(2007), identifies five distinct phases that general consumers utilize as a decision
process before committing to an online purchase.
Figure 2.1 Consumer Decision Process before making an Online Purchase
Adapted from: Engel et al cited in Chau et al (2007)
Before committing to making an online purchase, an online user will run through:
need recognition, information search, alternative evaluation, steps to make the
purchase, and post-purchase evaluation and if the results are positive an online
purchase is made. Some of these stages occur offline such as need recognition,
alternate evaluation and post purchase evaluation, in some instances even the
purchase occurs offline (Singh 2001).

1 1
2.4 Retail Channel Alternatives
Traditional retail stores are being challenged by numerous alternate retail service
channels, which include the Internet, direct mail, interactive telephone systems,
and interactive television (Dijk et al 2007). The advantages of using the web as a
retail channel include time savings, convenience, and customer empowerment
(Dijk et al 2007). According to Dijk et al (2007), the perceived transaction cost is
what drives consumers’ channel choice. If consumers think that by purchasing
online they will benefit in terms of time, money, convenience, and lesser effort,
then they will make a switch. Ruyter et al cited in Dijk et al (2007) added customer
empowerment to this list which means customers will switch channels if they feel
they are being empowered.
According to Schoenbachler & Gordon (2002), retailers need to refine their
methods of attracting and retaining customers. This could be achieved by
changing from a channel-focused to a customer relation management approach.
These authors also advised businesses to identify and respond to factors that
enticed consumers to use a particular channel, and not to attempt to persuade
customers to use competing channels.
In Western countries, research has confirmed a direct relation between the
increase in the amount of information gathered and shopping (Richard 2009).
Furthermore, the Internet is emerging as a prominent channel when searching for
information, because of its wide access, and ease of use (Richard 2009).
Research conducted by (Dijk, et al, 2007: 13), revealed that many participants
used the Internet for ‘broad information searches and triangulation of cheap deals’
and often used other channels to make the final purchase.
One of the industry success stories of using the Internet as a retail channel is the
travel industry which is ideally suited to provide a wide range of comparable
information and efficient access to online users. Whilst certain components of this
industry were slow to see the benefits of utilizing the Internet as a channel, the
travel industry is one of the online success stories, playing a key role in the
arrangements and experience of today’s travelers’ (Nielsen Global Online Survey
1 2
2008). A possible reason for lower Internet prices is costs such as rent, salaries,
water and electricity, are either much lower or eliminated for an online retailer, so
the possibility of offering discounts to online buyers is much greater when
compared to a physical store.
As of 2007 there were 1014 online retail web sites but twelve sites which
accounted for more than three quarters of online retail sales in South Africa
dominated the online retail environment. Some of these sites include: M-Web
ShopZone, eBucks, Digital Mall, Pick ‘n Pay Home Shopping, Woolworths,
Kalahari.net, Exclusive Books, Musica, Cybercellar, Digital Planet, Ascot Direct
and NetFlorist (Goldstuck 2007). Newer dominance in online retailing websites
include: Inthebag and Streetcar.com (Goldstuck 2010).
2.5 Online Sales
In an effort to increase sales, key players in the online retail market widen their
product ranges to achieve sales targets. Retail outlets that utilize Internet sales
channels e.g. Kalahari.net, experienced year-on-year growth of 20-25% in 2009.
Goldstuck (2009), said people like to put the blame on the post office for the
reason why online buying will not work in South Africa. The problem in South
Africa is that we do not have a tradition and infrastructure for a low cost, quick
delivery service (Goldstuck 2009).
NetFlorist upgraded its technology and bandwidth just before Valentines Day
2008. There was a relatively low advertising budget compared to previous years,
yet sales on Valentines Day 2008 were reported to be 30% higher than in 2007.
Some credit to this success was the growing penetration of the Internet into
everyday life. Valentines Day 2008 saw NetFlorist receiving up to four orders per
minute and were forced to triple the size of their call centre (Mwanza 2008).
The Online Retail in South Africa Research (2007) estimated online sales to reach
R929 million, up from R688 million the previous year. Although these figures are
high, they exclude the sale of online air tickets which accounted for R2,3 billion in
2006 and is the major growth driver of online retail sales (Mwanza 2007).

1 3
At the end of February 2010, online sales slowed to the worst recorded annual
growth in the past ten years history, with sales just 5% up on January 2009 (UK:
January growth …2010). Possible reasons may include higher product prices, high
debt levels and the world recession that had just ended after a firm 18 month grip.
Higher product prices have a negative impact on real disposable incomes which
limits growth in spending. Ironically, multi-channel retailers held off on heavy
discounting, instead of solely online retailers that bore the brunt of poor sales.
Other sectors in e-retailing however, reported higher growth figures, some up to
46% up from last year, leading the reader to come to the conclusion that online
sales results are sector specific. The sectors in this instance were fashion items.
Despite the concern of slow online sales, solid growth was expected in the e-retail
industry with the market expected to grow by 12% (UK: January growth …2010).
Statistics South Africa (2010), released a report which said retail sales increased
by 3,2% year-on-year, but provided no data on online sales figures (de Vries
2010).
2.6 South African Online Trends
South African online spending has not caught up with developed Western
countries and even some emerging economies due to access constraints, which
according to Singh (2001) includes: high cost of connectivity, slow access speeds,
and caps on the amount of data that can be downloaded. Internet access is
relatively expensive and there has to be a real need before consumers invest in
this technology at home.
In 2006, research conducted by Nielsen Company revealed approximately 10% of
the world’s population had shopped online. Two years later, this figure had
increased by approximately 40% with the highest percentage of online shoppers
found in South Korea where 99% of those with Internet access had shopped
online, followed by the United Kingdom (97%), Germany (97%), Japan (97%),
United States (94%), and South Africa (73%) (875 million shoppers …2008).
In 2008, the Nielsen Global Online Survey revealed that more than 85%
of the world’s online users had used the Internet to make a purchase and that

1 4
more than half of all Internet users had made at least one purchase in every month
of 2007. In South Africa, just under a third of all respondents made purchases
using the Internet at some time in 2007 (875 million shoppers …2008).
MWeb announced that they will be the first Internet service provider in South
Africa to cut the costs of uncapped Internet by more than 40 percent lower than
their competitors in 2010 (Serrao 2010). This means MWeb users can download
as much data as possible, whenever they want to, without having to look at their
cap limit and worrying about paying additional costs. According to Jansen cited in
Serrao (2010), South Africa has fallen behind other African countries in terms of
Internet penetration in recent years. Holgate cited in Serrao (2010) says that
cheaper Internet service offerings, translates to the possibility of more small
businesses having an online presence because of affordability. Goldstruck (2010)
was quoted as saying ‘cheap, unlimited broadband marked a shift in the South
African Internet industry’ and that ‘accessible technology builds the economy’. The
Nielsen Global Online Survey (2008), revealed the most popular items purchased
globally over the Internet were:
Table 2.1: Most popular items purchased via the Internet Globally
Books (includes e-books) 41%
Clothing / accessories/ shoes 36%
Videos / DVDs / games 24%
Airline tickets 24%
Electronic equipment 23%
Whilst books were the most popular item purchased via the Internet globally,
videos, DVDs, and games were the most popular online South African purchases.
Although clothing was the second highest Internet purchase globally, this
accounted for only 10% of South Africans online purchases, however, 51% of
South African respondents utilized the Internet to purchase airline tickets (Nielsen
Global Online Survey 2008).

1 5
Credit cards were used by 60% of respondents in the Nielsen Survey (2008) to
pay for online purchases, whilst 25% opted to pay via PayPal. There were 82% of
South Africans on the other hand who preferred using their credit cards to make
online payments. Paypal was only introduced in South Africa at the beginning of
2010, which may explain why South Africans have not used this service en mass
(Transaction fees for … 2010). There were 53% of international credit card online
payments made using Visa, whereas 51% of South Africans paid using
Mastercard and 42% of South Africans paid via Visa (Nielsen Global Online
Survey 2008).
Research conducted by Jacobs and de Klerk (2007), reveals consumers in the
USA have a tradition of ordering clothing items through the mail, which was easily
converted into an online product category. South Africans on the other hand have
a history of purchasing books and CDs’ via mail ordering systems, and these were
successfully converted into online sales e.g. Kalahari.net.
A MasterCard survey in 2009 found that 80% of South Africa’s Internet users were
shopping online with the majority (58%) buying items like CDs’ and DVDs’. This
trend hasn’t changed much since 2001 where it was found that CDs’ and DVDs’
were the main items purchased online (Singh 2001). Three quarters of South
Africans with Internet access made at least one online purchase in the first half of
2009 with 50% saying online shopping is one of the reasons for using the Internet
(West 2009). From June 2008 to June 2009 there were 4,6 million Internet users
and this figure was expected to expand by 2014 as was the pattern in the fifteen
years prior to 2008 (West 2009).
2.7 Alternate Payment Methods
2.7.1 eBucks
People without credit cards could not make Internet purchases, as all Internet
purchase payments were originally made by credit card. Seeing an opportunity,
alternate means of paying for Internet purchases were devised and one such
method of paying for Internet purchases is by eBucks. eBucks was developed by
the FirstRand group and boasts more than a million members, ‘it is the leading

1 6
rewards programme in the land’ (Apteker & Drennan 2008). There are four ways to
use eBucks i.e. :
• eBucks Shop – there are thousands of products on offer in the eBucks shop
• eBucks Travel – eBucks can be used to pay for accommodation, flights,
and car hire
• eBucks Card – an eBucks card can be swiped at eBucks card partners
(together with a 4-digit PIN), to pay with ones eBucks
• Shopping Online – eBucks can be used to purchase goods online from any
one of a number of eBucks Internet partners
Partners of eBucks include: Kulula.com, Kalahari.net, Vottle, NetFlorist, Want It
All, Avis, Engen, Incredible Connection, Spec Savers, Look and Listen, Makro
and many others. eBucks is safer than using a credit card as eBucks
transactions are secured, similar to online banking, preventing copying of credit
card numbers. There are two ways how one can earn eBucks:
• by purchasing goods and services from eBucks partners or
• by buying them
eBucks never expire, so once earned, they are as good as cash (Apteker &
Drennan 2008).
2.7.2 Ukash
Just as eBucks prevents online fraud, another method of making Internet
purchases is through Ukash vouchers. There are 275 000 global locations where
cash can be converted for Ukash vouchers and it will soon be possible to obtain
these vouchers by online bank transfer. These vouchers can then be utilized to
purchase goods from any of the thousands of Ukash friendly websites.
Ukash has been authorized by the South African Reserve Bank to operate in this
country and is also regulated by the Financial Services Authority in the UK. For
people who do not have a credit card or other alternate online payment options,
yet still desire to shop online, Ukash and eBucks must surely be two attractive
alternate methods that addresses this shortcoming. Use of Ukash and eBucks also

1 7
prevents copying of credit card numbers and online fraud (Apteker & Drennan
2009).
2.8 Online Shoppers Concerns
2.8.1 Security
Findings of the study conducted by Soopramanien & Robertson (2007), indicate a
major inhibiting factor of Internet shopping adoption is online consumers’
perception of security risk. This perception is more evident if the online purchase is
relatively expensive (Lian & Lin 2008). The concern for security is warranted as
the web is accessible by anyone and from anywhere. If the design of a website
does not offer security, hackers could infiltrate the vendor server and harvest
credit card information. Ranganathan & Ganapathy (2002), identified security as
one of the most important factors to be considered when designing a web site.
Confirming this statement was Wolfinbager & Gilly (2003), they measured online
retailer service quality by four factors, and one of them was security of the web
server. A study by Singh (2001), also confirmed security as a major concern
expressed by online users, he found that consumers were afraid to use their credit
cards online and they feared non delivery of items purchased.
2.8.2 Viruses
As per Microsoft, a virus is defined as a small software program that spreads from
one computer to another computer which interferes with normal computer
operation. The reasons why viruses are not good for computers are listed below:
• A computer virus may corrupt or data files on a computer
• Propagates itself by using an e-mail program to spread the virus to other
computers
• Deletes everything on the hard disk
• Hampers normal computer operations due to slowness
(Computer viruses description …2010)
1 8
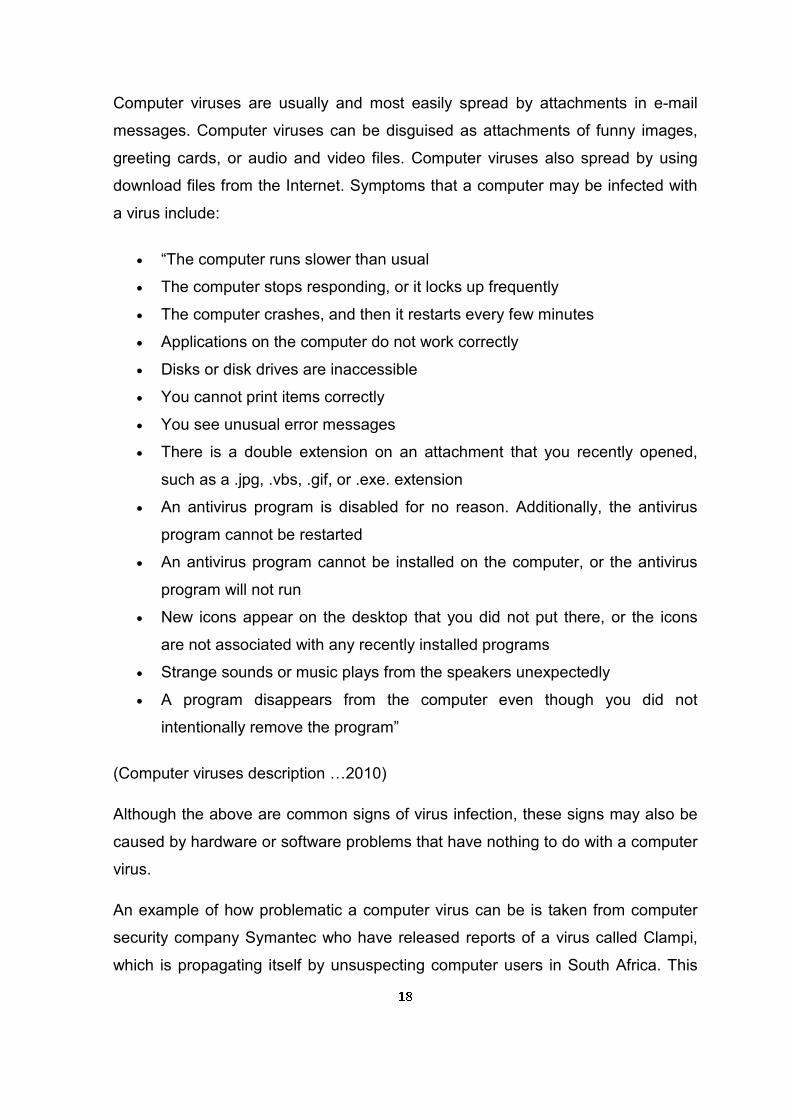
Computer viruses are usually and most easily spread by attachments in e-mail
messages. Computer viruses can be disguised as attachments of funny images,
greeting cards, or audio and video files. Computer viruses also spread by using
download files from the Internet. Symptoms that a computer may be infected with
a virus include:
• “The computer runs slower than usual
• The computer stops responding, or it locks up frequently
• The computer crashes, and then it restarts every few minutes
• Applications on the computer do not work correctly
• Disks or disk drives are inaccessible
• You cannot print items correctly
• You see unusual error messages
• There is a double extension on an attachment that you recently opened,
such as a .jpg, .vbs, .gif, or .exe. extension
• An antivirus program is disabled for no reason. Additionally, the antivirus
program cannot be restarted
• An antivirus program cannot be installed on the computer, or the antivirus
program will not run
• New icons appear on the desktop that you did not put there, or the icons
are not associated with any recently installed programs
• Strange sounds or music plays from the speakers unexpectedly
• A program disappears from the computer even though you did not
intentionally remove the program”
(Computer viruses description …2010)
Although the above are common signs of virus infection, these signs may also be
caused by hardware or software problems that have nothing to do with a computer
virus.
An example of how problematic a computer virus can be is taken from computer
security company Symantec who have released reports of a virus called Clampi,
which is propagating itself by unsuspecting computer users in South Africa. This

1 9
virus is especially dangerous because it was written to sit unnoticed on a user’s
computer, until that user logged onto bank, credit card or other financial websites.
The virus captures log-in and password information and transmits this data to a
server run by the attackers. The recommendation was for users to have latest
antivirus software patches on their computers to prevent being a victim of Clampi
(Online banking virus …2009).
Besides Clampi, there are hundreds perhaps thousands of other viruses around.
Many were written for specific purposes, but the viruses that were written with
intentions similar to Clampi are of particular concern. Methods of how to deal with
these treats are discussed in the recommendations chapter.
2.8.3 Trust
An improvement in security measures has contributed to the increase in the level
of trust shown by the online consumer. Other factors that increase levels of trust
include:
• providing detailed product information, assurances, policies, and
guarantees (Chau et al 2007)
• use of e-seals (Kimery & McCord 2002) and (Kovar et al 2000)
• use of digital certificates (Chau et al 2007)
• use of third party endorsements and approvals i.e. Verisign, Truste,
WebTrust, and Trusted Site Seal (Constantinides 2004)
Some consumers who were ‘security conscious’ felt if web sites were not secure
and private in terms of their privacy and personal information, such information
could become generally available, which could result in them being targeted for
receiving junk mail and spam over the internet (Jacobs & de Klerk 2007).
According to Constantinides (2004), online marketers should identify factors
hindering trust among potential online customers. Factors influencing online trust
include: transaction security, customer data abuse, customer data safety,
uncertainty reducing elements, guarantees, and return policies (Constantinides
2004).

2 0
2.8.4 Privacy
Together with providing security, online retailers need to protect their online
customers’ privacy. Privacy disclosures on websites have a direct bearing on
shoppers trust of a website (Pan & Zinkhan 2006). Wolfinbager & Gilly (2003),
found that customers perceptions of an online retailers service quality was strongly
influenced by their privacy concerns. Hsu (2006), concurred that privacy concerns
varied due to personal differences which included educational background,
culture, and demographic background. Lian & Lin (2008) concluded that as
personal privacy concerns increased, attitudes towards online purchasing were
negatively affected. According to Jacobs & de Klerk (2007), online consumers
were concerned about the privacy of their personal information and giving
personal information over the Internet. South Africa’s high crime rate was one of
the leading reasons provided by some respondents highlighting the importance for
online security. There is most definitely a great need for e-retailers to implement
risk-reduction strategies which will persuade South African consumers to utilize
the online retail channel (Jacobs & de Klerk 2007).
2.8.5 Reputation
According to Parker (2010), the reputation of an online store is also crucial to its
success, since the online buyer never sees the e-retail store staff, and cannot tell
whether an online retailer will keep their promise in terms of warranties,
guarantees, and returns and even delivery (Singh 2001). In research conducted by
Constantinides (2004), 46,1% of respondents revealed that a web site’s design
was the most important factor to promote credibility, followed by information
structure (28,5%), and information focus (25,1%).
2.9 Mechanisms for Comparing Online Prices
A method of comparing prices is to use the web sites www.jump.co.za and
www.pricecheck.co.za. These web sites provide a list of leading retailers that stock
a product from which an interested online shopper could compare prices. Besides
the price comparison advantage, online shoppers could also check for different
model versions of the product e.g. a television. These web sites are neutral

2 1
because they have nothing to gain by persuading a customer to buy from a
specific retailer and they also provide a rating system so potential customers can
read whether the retailer is considered trustworthy and has a good reputation
(Apteker & Drennan 2008).
As per de Vries (2009), online shoppers are increasingly looking towards the
internet to compare prices before buying products in-store. A means of knowing
how reputable an online retailer or any organization for that matter, is to perform a
search on the Internet. A worthwhile exercise will be for a potential buyer to know
as much information about the e-retailer as possible, before handing over hard
earned money, especially if business with the e-retailer was never conducted in
the past. Any search engine e.g. Google or Altavista could be used and the text
‘better business bureau + company name’ will display some very interesting data
about the company which will be useful as a determining factor of whether to
continue doing business with that entity (Purchasing on the …2010).
The worst experience for any consumer is to make a purchase in a hurry only to
find that the item purchased could be bought at a lower price in another shop.
Even if the item is returned for a refund, the consumer is not refunded for lost time
and energy. All consumers must research their purchases carefully to prevent
such an occurrence (Online shopping South …2005).
2.10 Online Shoppers Expectations of Online E-Retailers
MasterCard (2009), consumers identified the following as key expectations of
online retailers: 85% wanted secure payment facilities, 62% wanted value for
money, and 61% said a websites reputation was important. MasterCard’s statistics
confirm that security is the greatest expectation of online shoppers.

2 2
2.11 Factors Favouring Growth Of Online Shopping
2.11.1 Changing Lifestyles
Time constraints, price, quality, emotional wellbeing, and socio demographic
factors are the driving forces to making an online purchase (Bosnjak et al 2007).
Lian & Lin (2007) identified high product involvement as a determinant towards
consumer characteristics that positively influence online shopping acceptance.
Online buying is very convenient in today’s fast paced world. Shopping online
allows the user to shop from the comfort of work or home environment and get the
items delivered at a convenient time which allows the user to use his time for other
tasks which have a higher priority. In addition to easily comparing prices, online
shopping web sites offer early notification about sales at stores and from online
merchants. As an incentive to lure shoppers to make use of online shopping
facilities, many e-retailers offer online buyers free delivery (Online shopping South
…2005). In a Visa survey conducted in 2009, 78% of consumers in the UK said
they intended to shop online at the end of the year, and 73% of respondents said
online shopping was cheaper (Mochiko 2009). This translates to an increasing
number of shoppers who are looking to the Internet to make their purchases.
2.11.2 Use of Virtual Assistants
According to Chau et al (2007), customers may rely on 3rd party ratings, consumer
feedback forums, and product ratings to safeguard their online purchases. This
may be true especially for those new to online purchasing and if online buyers are
not familiar with a particular website. Just as there are sales assistants when
making physical visits to retail outlets, Jones et al (2008) suggest that having
online sales agents, aptly named ‘avatars’, increases consumers levels of
satisfaction with the online retailer, which results in a “knock-on” effect with
improved attitudes towards the product, and ultimately improves the consumer’s
intention to purchase. Senecal et al cited in Bosnjak et al (2007), however
disagreed, saying that although product recommendations ‘make the decision
making process more complex’, this has no bearing on online buying behaviours.

2 3
2.11.3 Web Site Design
There are factors that either promote or inhibit online buying. ‘Web atmospherics’,
is a term used to describe the functional characteristics of a websites environment
e.g. structure, effectiveness, informativeness, and entertainment to induce a
positive response (Childers et al 2001). Research showed that the easier a
website is to use, the easier the information will be to process (Richard et al 2009).
According to Elliot et al (2005) efficient websites create positive feelings towards
websites. Luna et al cited in Richard et al (2009) however, said the opposite; a
more positive attitude towards a website was seen when the website offered
optimal challenge relative to possessed skill. Richard et al (2009) found that
women preferred more challenging web sites than men.
2.11.4 Faster Internet Access
According to Farag et al (2007) those who are well versed in Internet browsing and
those with a faster Internet connection are more inclined to increase online
shopping. This translates to people living or working in urban areas, who have
access to the Internet making more online purchases than those further away from
the city that have inferior Internet access. Even though there are currently many
online shoppers, and research shows the potential for online shoppers increasing,
online shoppers have admitted that 76% of their shopping was still done the old
fashioned way i.e. by physically visiting retail outlets (Consumers keen to …2009).
Goldstuck (2007) made two predictions: with increases in the rollout of broadband
in South Africa, more online users will make online purchases, and only when
online users have gained experience for a period of around six years will they be
comfortable with making purchases on the internet.
In the past dialup was a problem in that users were pressured for time and cost
and therefore could not spend much time browsing. With broadband
implementation and usage, users are able to browse at their leisure, conduct more
product research, and then make informed decisions. As of July 2009, there were
700 000 South African dialup users that still had to migrate to broadband

2 4
technologies (Dingle 2009). The second prediction: initially users have to become
familiar with the Internet and to determine how to fit the Internet into their world.
2.11.5 Social Media
According to the Nielsen Global Online Survey (2009), social media such as
Facebook and Twitter have become powerful tools that influence what people buy
online. Nearly three in four people worldwide who use the internet have visited a
social network or blog. Online product reviews are the third most trusted source of
information coming after recommendations from friends and family when deciding
whether to purchase a product. Social media is big, is growing very quickly, and in
un-predictable ways everywhere in the world (Facebook, Twitter powerful …2010).
Social media is here to stay and advice is for this media to be taken seriously by
the broader business community (Facebook, Twitter powerful …2010). Businesses
cannot sit on the sidelines and observe the social media phenomenon, they need
to embrace it and make themselves part of the action (Facebook, Twitter powerful
…2010)
Young people’s purchasing decisions however are still more influenced by
traditional media such as television, rather than new media according to the latest
research by the Bureau of Market Research at Unisa (Mochiko 2010).
2.11.6 Improvements to Infrastructure that Promote Technology
As stated earlier, South Africa is experiencing growth in terms of improvements to
infrastructure which will promote acceptance and adoption of internet
technologies. Some of the reasons for this growth are: granting of network service
licenses allowing companies to operate as internet service providers, companies
upgrading to adsl, more employers giving employees the choice of working
remotely, and new fibre-optic networks laid in urban areas by various third parties
which is leading to robust competitive online business.
Growth is expected to surge over the next five years to reach nine million users
who will be online, boosted by the installation of undersea cables like Seacom

2 5
(Mochiko 2009). This growth in the number of internet users means that the
number of online buyers will grow exponentially.
2.12 Summary
As the age of the internet progresses, software applications have reached a point
where goods could be viewed on an e-retailers web site and payments made via
credit or debit cards. The majority of South African online users access the internet
by means of fixed line broadband or wireless broadband technologies. Due to
competitive prices for access to the internet, rollout of next generation
technologies, and users embracing remote connectivity the number of internet
users in South Africa passed the five million mark in 2010.
A diagram was used to list the steps that an online buyer goes through to commit
to a purchase. While a few retail channels exist, the reason driving the choice of a
channel is the perceived transaction cost. Whilst the internet provides an easy
avenue to view products, gain product information, and compare prices the
ultimate purchase may not be committed through the medium of the internet.
One third of respondents of an internet survey in 2007 confirmed they had made
online purchases, which is a huge improvement, since most South Africans when
surveyed in 2001, found it costly and uncomfortable to access the internet. DVDs’,
videos, and games were the most popular South African purchases. Credit cards
payments were the choice of payment for online purchases both internationally
and locally.
The areas of concern for consumers that made online purchases included
security, viruses, trust, privacy, and reputation of the e-retailer. There are websites
that cater for online shoppers to compare prices and to hear testimonies of
experiences of other shoppers at a particular e-retailer.
Online shoppers have specific expectations of e-retailers; however, there are
factors which indicate that the future of online shopping in South Africa will
continue growing.

2 6
The literature used to gather data for this chapter gave an excellent review of
internet buying, of international trends and how South Africa compared. Well
known research e.g. Mastercard, Nielsen Global Online Survey, and World Wide
Worx were consulted, which provided a solid foundation to compare the results of
those surveys and the survey for this research. The next step is to prepare the
research instrument, which will be used to obtain respondents data for this survey.
The next chapter will look at data collection strategies, research design and
methods, how to recruit respondents, pretesting and validation of the data, and
analysis of the data.

2 7
CHAPTER THREE
Research Methodology
3.1 Introduction
To be a progressive country or entity, the responsible persons need to map the
road ahead; but in order to do so, they need to understand the challenges already
faced when earlier technologies, products, or services were implemented and
became accessible to the general population. This understanding can be achieved
through a process of research which is a series of well thought out and carefully
executed activities that enables one to know how an entity’s challenges can be
solved. Research is therefore the process of enquiry, investigation, examination,
and experimentation (Cooper and Schindler 2006).
This chapter discusses the research methodology implemented to understand the
depth and prevalence of online buying in South Africa and is discussed under the
headings of aim and objective, data collection strategies, research design and
methods, and analysis of the data.
According to Bryman and Bell (2007), the biggest mistake is for quantitative
researchers not to know at an early stage how their data will be analysed. The two
reasons put forward as to why researchers need to know how their data is to be
analysed are: appropriate techniques have to be matched to the variables that
were created through the research instrument and the size and nature of the
sample are likely to create challenges to the techniques deployed (Bryman and
Bell.2007).
3.2 Aim and Objective of the Study
With gains in technology from the 20th century, man is living a life that cannot be
compared with previous generations, especially with the introduction of the internet
in 1989, how man accomplishes things has changed drastically. The Internet has
rapidly become an important communication channel for research, entertainment,
collaboration, and purchase of products and services (Dijk, Minocha & Laing 2007;
Richard, Chebat, Yang & Putrevu 2009).

2 8
The aim of this study is to understand online buying behaviour in South Africa and
the extent to which South Africans’ embrace online purchasing.
Online shopping has taken off in leaps and bounds in mostly first world countries
and comparisons between South Africa and these countries are made.
The objectives of this study are:
1. To determine what consumers look for prior to purchasing from a website
2. To determine the factors which promote / inhibit online purchasing
3. To determine what consumers buy online, where and how often
These objectives were chosen as they contribute towards the research question,
are clear and concise, and ensure the data collection instrument is designed
appropriately.
3.3 Data Collection Strategies
The data collection strategy for this study was put together by considering the data
sources, data instrument, and measurement questions that appeared on the
survey; which provided valid and reliable data. The literature review was
completed by using secondary data which comprised of journals, books, internet
sources, and news paper articles. This secondary data provided a theoretical
background for a study on internet buying in South Africa.
For purposes of this research, primary data was collected by using an online web
survey. Four hundred and forty people were sent e-mails which introduced the
researcher, stated the purpose of the research, and thanked them for participating.
The said mail also contained a link, which directed the user to the online survey.
Of the four hundred and forty people who participated in the survey, forty were co-
workers of the author, and they in turn provided ten of their friends or family e-mail
addresses. According to Cooper and Schindler (2003), the strength of a survey as
a primary data collection is its versatility, since information can be gathered by
questioning others.
2 9
The sample size is important for any survey as this is a representation of the entire
population. To interview every individual who works in La Lucia Ridge Office
Estate will be almost impossible; so a sample representing the population is
required. For this reason, there are two sample possibilities that the researcher
can choose from:
• Probability sampling – this is a sample where random selection is employed
so that each individual in the population has a known chance of being
selected. When a selection of the population is used, the general
assumption is that a representative sample emerges from this process.
Probability sampling also keeps sampling error to a minimum.
• Non-probability sampling – using this technique ensures a non-random
selection method. This translates to some individuals of a population having
a better chance of being selected for a survey (Bryman and Bell 2007).
Based on the above sampling descriptive, probability sampling will be used for this
research. Probability sampling was selected since it represents an ideal sample of
the population and also because sampling errors are kept to a minimum. The four
types of probability sampling include: simple random sample, systematic sample,
stratified random sampling, and multi-stage cluster sampling.
Simple random sample was chosen as there is no opportunity for human bias, the
selection of whom to interview is entirely mechanical, the process is not dependant
on the respondent’s availability, the process of selection is accomplished without
the respondent’s knowledge (Bryman and Bell 2007).
According to The Research Advisors (2006) and The Survey System (2007), for a
population size of 250 000, at a confidence level of 95%, and a margin of error of
5%, a sample size of 384 is required.

3 0
3.4 Research Design and Methods
3.4.1 Description and Purpose
With vast development of offices at La Lucia Ridge Office Park, this represented
an ideal urban metropolitan area within South Africa. The scope of this research
was therefore conducted with respondents who worked in this office park.
A promising factor was that there were at least four IT services companies and
one internet service provider operating from within the said office park, so there
was a greater possibility that many tenants in this office park had links to the
internet. Having access to the internet from work was important for this research
as previous literature indicates most internet browsing is accomplished during
office hours.
3.4.1.1 Construction of the Instrument
Since the survey was web based, careful consideration had to be taken that the
respondent could complete the questionnaire without any assistance.
Questions were asked in English and they took the form of radio boxes, selection
lists, text boxes, and check boxes. The types of questions asked included: “why do
you shop online?”, “how often do you buy online?”, “I usually make the following
online purchases”, and “I usually make an online purchase after”. The respondents
used a continue button at the end of the questionnaire which when clicked,
updated the web sites data collection for the questionnaire. Because respondents’
data could be collected centrally it was the predominant reason for using an online
web survey. Furthermore, there was a built in cross tabulation tool which was
useful for analysing data.
The first few questions dealt with demographics which was important for later
analysis and included questions such as age, race, and gender. The next few
questions elicited from the respondents whether any online purchasing was made,
from where, and the average amounts bought for. Additional questions asked the
respondent what prevented him / her from making online purchases and the
reasons why he / she will commit to online buying in the future.

3 1
3.4.1.2 Recruitment of Study Participants
Forty working colleagues of the author were used as the initial respondents. The
forty were asked to recommend ten of their friends or family members to
participate in this survey. The only requirement was that the recommended people
also worked at La Lucia Ridge Office Park. The four hundred people who were
recommended were unknown to the author.
Although only 384 respondents were required, all ten working colleagues were
requested to provide e-mail addresses of forty of their friends or family working in
La Lucia Ridge Office Park to keep the referrals as simple as possible.
3.4.2 Pretesting and Validation
3.4.2.1 Pretesting
According to Bryman and Bell (2007), good practice for self-completion
questionnaires is to conduct pilot studies before the questionnaire is administered.
Piloting assists in ensuring that the research instrument as a whole functions well.
Especially for self-completion questionnaires, since there is no interviewer
available to clear up any confusion, piloting the questionnaire is particularly crucial
(Bryman and Bell 2007).
Careful consideration was given to ensure the questionnaire did not deviate from
the specified objectives. The questionnaire was pretested by 7 MBA students of
the University of Kwazulu Natal who were also at dissertation stage of their studies
to ensure:
• respondent answered all questions
• Questions were phrased to promote accurate responses
• Questions were not biased, derogatory, or made the respondent feel ‘un-
comfortable’
• Wording of questions did not lead the respondent
• The questions answered the study objectives
• Respondents could complete the questionnaire without assistance

3 2
The questionnaire was captured on Question Pro. Once questions were loaded
into Question Pro, a few trial runs were simulated of how the online questionnaire
behaved. Data collection was also tested to ensure analysis could be
accomplished after all respondents had completed the questionnaire.
3.4.2.2 Validation
According to Bryman and Bell (2007: p.41), validity is the most important criterion
of research, and “is concerned with the integrity of the conclusions that are
generated from a piece of research”. Validation has to do with whether or not a
measure of a concept really measures the concept. Measurement validity is
sometimes also commonly referred to as construct validity. Validity comes in the
categories of: measurement validity, internal validity, external validity, and
ecological validity.
Measurement Validity
This category is predominantly for quantitative research in the quest for social
scientific concepts. Measurement validity is related to reliability, so if measuring a
concept produces fluctuating results, the result is not valid (Bryman and Bell
2007).
Internal Validity
Internal validity checks whether the conclusion reached between two or more
variables is true e.g. if X causes Y, we need to be sure that only X is responsible
for this variation in Y and not any other external factors or in other words, how
confident are we that the independent variable really is at least responsible for the
change in the dependent variable (Bryman and Bell 2007).
External Validity
This issue addresses the question whether results of one study can be
generalized beyond the research context. Quantitative researchers go to great
3 3
lengths to ensure their research generates representative samples (Bryman and
Bell 2007).
Ecological Validity
Ecological validity is concerned with whether or not social scientific findings whose
instruments capture daily life conditions, opinions, values and attitudes are
applicable to people’s everyday, natural social settings. Business research
sometimes produces findings that may be technically valid but have little to do with
what happens in peoples everyday lives (Bryman and Bell 2007).
A means of checking validity will be to compare this survey’s completed results
with other well known research. Any similarities between other research data and
this research will mean that the measurement instrument was constructed
correctly. This also means that the random sample of respondents chosen for this
survey, provided responses that closely resembled those of other surveys.
External validity, as previously mentioned, will yield a positive result i.e. this survey
can be generalized beyond the context of this research.
3.4.3 Administration of the Questionnaire
E-mails were sent to the 440 people who worked in La Lucia Ridge Office Park.
The mail directed respondents to an online questionnaire hosted on Question Pro
that took less than five minutes to complete. This questionnaire contained fourteen
open and closed questions and ranking scales. The online survey web site allowed
the researcher to design simple web pages with questions and respondents
answers were collected and stored by this web site for data analysis.
3.5 Analysis of the Data
The proposed data analysis is designed to deliver on the primary objectives of the
research, which is to understand the extent of online purchasing in South Africa,
factors leading up to the decision to make or not to make the online purchase, and
what online consumers purchased, where, and how often.

3 4
Using cross tabulations, analysis of the data will be presented in the form of
graphs and frequency tables which will include a short description. Further to cross
tabulations and frequency tables, correlation analysis will also be deployed on
collected data. Correlation analysis is used to find if any relationships exist
between two variables.
3.6 Summary
This chapter discussed the research methods that will be used to obtain data.
Careful consideration was taken for the research instrument to incorporate the aim
and the objectives of this study so as to obtain relevant and reliable data. The
questionnaire was pre-tested for accuracy and to ensure none of the questions
were offensive, biased, derogatory, or led the respondent. Since the questionnaire
was online, the author had to ensure all respondents’ could answer all questions
without any assistance.
Data analysis will be presented in the next chapter in the form of frequency tables,
graphs, cross-tabulations, and correlations. The rich quality of data obtained from
the questionnaire will enable the author to report on these results with much
confidence.

3 5
CHAPTER FOUR
Presentation of Results
4.1 Introduction
The previous chapter provided an overview of the research proposal and the
methodology used to complete the research. This chapter reports on the results
obtained from the survey and uses both descriptive and inferential statistics, to
analyse the data.
Results are initially presented in the form of frequencies and graphs which were
provided by Question Pro’s data analysis tool. Further to this, Question Pro’s built-
in analytical application i.e. cross tabulation was used to analyse the data to
determine the relationships between variables. Data was exported for use with the
statistical package for the social sciences (SPSS) program to generate more
detailed reports.
4.2 Analysis of Results
As previously stated, the questionnaire was e-mailed to 440 respondents of which
339 successfully completed questionnaires were received, representing a 77.05%
success rate. Univariate (analysis of one variable at a time) and bivariate (an
analysis of two variables at a time to check whether or not the two variables are
related) techniques will be employed to provide feedback on the survey results
(Bryman and Bell 2007). Frequencies are presented by means of tables, graphs
(bar and pie) with a discussion around the diagram.
4.2.1 Age of Respondents
Figure 4.1 provides an age group dispersion of respondents who answered the
questionnaire.

Figure 4.1 Age distribution of online buyers
The age group with the highest return rate was in the age group 35
respondents, the second largest group (27%) was in the
followed by 45-54 (24%), 18
4.2.2 Racial Composition
The racial composition, as shown in F
(46%) were Indian, followed by Coloured (22%), and Whites and Black
(16%).
0%
5%
10%
15%
20%
25%
30%
35%
18-24 25
3 6
Age distribution of online buyers
The age group with the highest return rate was in the age group 35
respondents, the second largest group (27%) was in the age group of 25
54 (24%), 18-24 (10%), and 55 and older (8%).
Racial Composition
as shown in Figure 4.2 of online buyers,
(46%) were Indian, followed by Coloured (22%), and Whites and Black
25-34 35-44 45-54 55>
The age group with the highest return rate was in the age group 35-44 (31%) of
age group of 25-34,
shows under half
(46%) were Indian, followed by Coloured (22%), and Whites and Blacks both
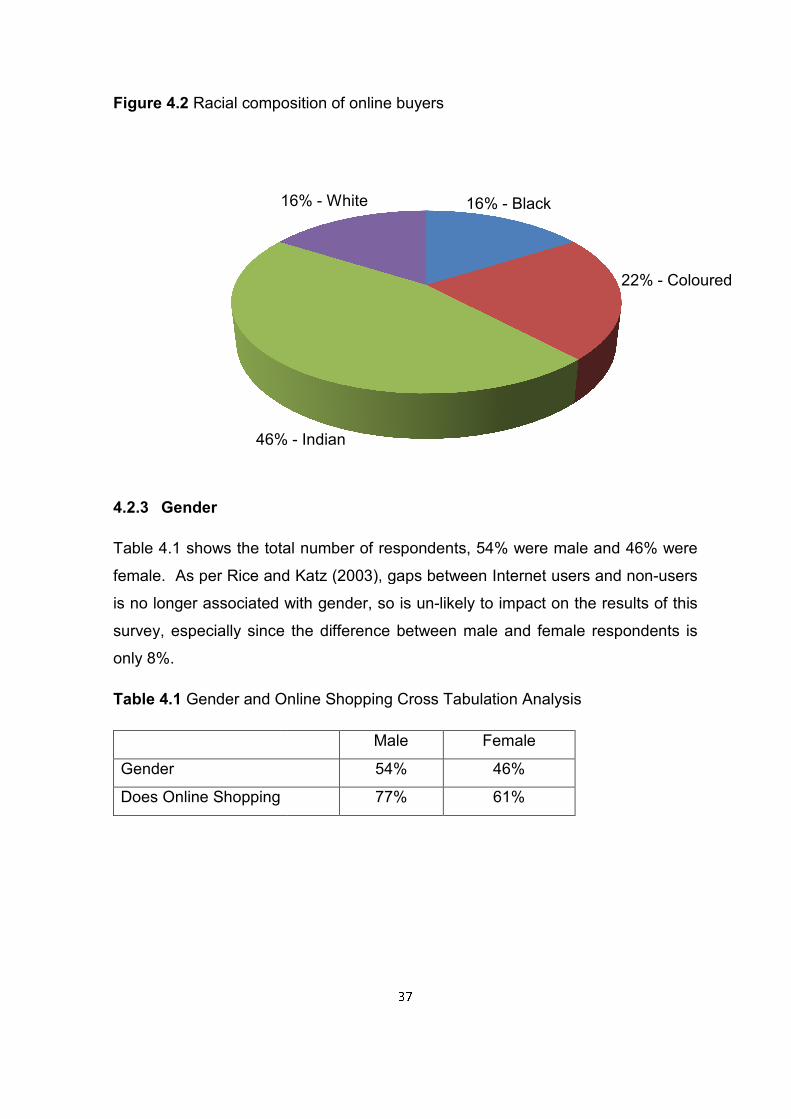
Figure 4.2 Racial composition of online buyers
4.2.3 Gender
Table 4.1 shows the total number of respondents, 54% were male and 46% were
female. As per Rice and Katz (2003), gaps between Internet users and non
is no longer associated with gender, so is un
survey, especially since the difference between male and female respondents is
only 8%.
Table 4.1 Gender and Online Shopping Cross Tabulation Analysis
Gender
Does Online Shopping
46%
16%
3 7
Racial composition of online buyers
1 shows the total number of respondents, 54% were male and 46% were
female. As per Rice and Katz (2003), gaps between Internet users and non
sociated with gender, so is un-likely to impact on the results of this
survey, especially since the difference between male and female respondents is
Gender and Online Shopping Cross Tabulation Analysis
Male Female
54% 46%
77% 61%
16% - Black
46% - Indian
16% - White
1 shows the total number of respondents, 54% were male and 46% were
female. As per Rice and Katz (2003), gaps between Internet users and non-users
likely to impact on the results of this
survey, especially since the difference between male and female respondents is
Gender and Online Shopping Cross Tabulation Analysis
22% - Coloured

4.2.4 The Number of Online Shoppers
Seventy seven percent (77%) of male respondents and 61% of female
respondents confirmed shopping online. Based on these results, the typical online
buyer was an Indian male between the age group 35
Singh, (2001) found the typical
group 25-34.
4.2.5 Reasons for not Shopping Online
The reasons for not shopping online are depicted in Figure 4
(28%) of respondents were afraid of hackers, 24% did not trust online retailer
and 16% preferred seeing and touching what they were buying as depicted by
figure 4.4.
Figure 4.3 Reasons why people do not buy online
16% - no credit card
10% - Want instant delivery
16% seeing and
3 8
The Number of Online Shoppers
Seventy seven percent (77%) of male respondents and 61% of female
respondents confirmed shopping online. Based on these results, the typical online
buyer was an Indian male between the age group 35-44. Research conducted by
Singh, (2001) found the typical internet user to be Indian, male, and in the age
Reasons for not Shopping Online
The reasons for not shopping online are depicted in Figure 4
(28%) of respondents were afraid of hackers, 24% did not trust online retailer
and 16% preferred seeing and touching what they were buying as depicted by
Reasons why people do not buy online
6% - no access to
internet24%
trusting online
28% - Afraid of hackers
16% - Prefer seeing and touching product
Seventy seven percent (77%) of male respondents and 61% of female
respondents confirmed shopping online. Based on these results, the typical online
44. Research conducted by
internet user to be Indian, male, and in the age
The reasons for not shopping online are depicted in Figure 4.3. Twenty eight
(28%) of respondents were afraid of hackers, 24% did not trust online retailers,
and 16% preferred seeing and touching what they were buying as depicted by
24% - Not trusting online
sellers

4.2.6 Why and How Often do People Shop Online?
Figure 4.4 provides a graph with all the reasons of why people purchase online.
The main reasons for people wanting to buy online were: convenience (22%),
followed by saving time (20%), and easier than physically going to the store (20%).
These three reasons are ver
modern times.
Figure 4.4 Reasons why people buy online
The frequency of internet purchases varied from 32% of respondents saying they
made online purchases every six months, to 28% opting to m
purchases every three months. However, 27% of the respondents said they did
not make any internet purchases.
0%
5%
10%
15%
20%
25%
3 9
Why and How Often do People Shop Online?
provides a graph with all the reasons of why people purchase online.
The main reasons for people wanting to buy online were: convenience (22%),
followed by saving time (20%), and easier than physically going to the store (20%).
These three reasons are very similar indicating that time is a critical factor in these
Reasons why people buy online
The frequency of internet purchases varied from 32% of respondents saying they
made online purchases every six months, to 28% opting to m
purchases every three months. However, 27% of the respondents said they did
not make any internet purchases.
provides a graph with all the reasons of why people purchase online.
The main reasons for people wanting to buy online were: convenience (22%),
followed by saving time (20%), and easier than physically going to the store (20%).
y similar indicating that time is a critical factor in these
The frequency of internet purchases varied from 32% of respondents saying they
made online purchases every six months, to 28% opting to make internet
purchases every three months. However, 27% of the respondents said they did

4.2.7 What is Purchased from Where and When?
Of the respondents who made online purchases, 26% purchased entertainment,
18% clothes, 16% travel, 14% accommodation, 14% books, and 12% food (Figure
4.5).
On examination of where online purchases were more popular, 40% bought
locally, 6% only made inter
from both local and international retailers.
There were 29% of respondents who said their online shopping is usually done
after seeing an advert from a newspaper, catalogue, or handout, 27% said their
purchases are made after referral from a trusted source, 24% made a purchase
after watching a television
Figure 4.5 What are people buying online?
0%
Food
Books
Travel
Clothes
Entertainment
Accomodation
4 0
What is Purchased from Where and When?
Of the respondents who made online purchases, 26% purchased entertainment,
18% clothes, 16% travel, 14% accommodation, 14% books, and 12% food (Figure
On examination of where online purchases were more popular, 40% bought
locally, 6% only made international purchases, and 53% made online purchases
from both local and international retailers.
There were 29% of respondents who said their online shopping is usually done
after seeing an advert from a newspaper, catalogue, or handout, 27% said their
chases are made after referral from a trusted source, 24% made a purchase
after watching a television advert, and 20% after viewing an online advert.
What are people buying online?
5% 10% 15% 20%
12%
14%
16%
18%
14%
Of the respondents who made online purchases, 26% purchased entertainment,
18% clothes, 16% travel, 14% accommodation, 14% books, and 12% food (Figure
On examination of where online purchases were more popular, 40% bought
national purchases, and 53% made online purchases
There were 29% of respondents who said their online shopping is usually done
after seeing an advert from a newspaper, catalogue, or handout, 27% said their
chases are made after referral from a trusted source, 24% made a purchase
and 20% after viewing an online advert.
25% 30%
26%

4.2.8 What do Online Buyers
How Much on Average is Spent
As previously stated, consumers are very security conscious. Factors that
increase levels of online buying are shown in Figure
of respondents stated secure payment was the most important
making an online purchase. Following secure payment, the next most important
concern was reliable service delivery (18%), guarantees and warrantees (18%),
clear instructions for online purchases (17%), a simple returns process (16%), and
reputable brands (12%).
Figure 4.6 Factors promoting online purchasing
In the spending category, 29% of respondents who shopped online spent on
average R501-R1000, tying in with MasterCard’s 2009 online survey. Twenty six
percent (26%) spent R1
R2000, and greater than R2000, a
Secure payment
Reputable brand
Simple returns process
Reliable delivery
Guarantees and warranties
Clear instructions
4 1
Online Buyers Look for in an Online Retailers W
Average is Spent?
As previously stated, consumers are very security conscious. Factors that
increase levels of online buying are shown in Figure 4.6. Nineteen percent (19%)
of respondents stated secure payment was the most important
making an online purchase. Following secure payment, the next most important
concern was reliable service delivery (18%), guarantees and warrantees (18%),
clear instructions for online purchases (17%), a simple returns process (16%), and
Factors promoting online purchasing
In the spending category, 29% of respondents who shopped online spent on
R1000, tying in with MasterCard’s 2009 online survey. Twenty six
percent (26%) spent R1-R500. The spending categories: R1001
R2000, and greater than R2000, all had 15% of respondents choosing them.
0% 5% 10% 15%
Secure payment
Reputable brand
Simple returns process
Reliable delivery
Guarantees and warranties
Clear instructions
12%
Online Retailers Web Site and
As previously stated, consumers are very security conscious. Factors that
. Nineteen percent (19%)
of respondents stated secure payment was the most important concern when
making an online purchase. Following secure payment, the next most important
concern was reliable service delivery (18%), guarantees and warrantees (18%),
clear instructions for online purchases (17%), a simple returns process (16%), and
In the spending category, 29% of respondents who shopped online spent on
R1000, tying in with MasterCard’s 2009 online survey. Twenty six
R500. The spending categories: R1001-R1500, R1501-
ll had 15% of respondents choosing them.
15% 20%
19%
16%
18%
18%
17%

4.2.9 The Future of Online Shopping
Even though 31% of respondents did not shop online, 75% of these non
buyers indicated that they would consider shopping online in the near future.
Figure 4.7 lists the reasons that are contributing to the growth of online shopping.
When asked the reason why they would shop online, convenience (32%) topped
the list followed by wider choice of suppliers (24%), lower prices (22%), and
products not available locally (22%). The
purchase and save time will therefore increase the number of online shoppers.
Figure 4.7 Factors fuelling growth of online purchasing
4.3 Inferential Statistics
4.3.1 Cross Tabulations
Cross tabulations may also be referred to as a two
statistical technique that establishes an interdependent relationship between two
tables of values, which does not extend to
between the values (Business definition for …1999).
0%
5%
10%
15%
20%
25%
30%
35%
Convenience
4 2
The Future of Online Shopping
Even though 31% of respondents did not shop online, 75% of these non
buyers indicated that they would consider shopping online in the near future.
asons that are contributing to the growth of online shopping.
When asked the reason why they would shop online, convenience (32%) topped
the list followed by wider choice of suppliers (24%), lower prices (22%), and
products not available locally (22%). The need for an easier mechanism to
purchase and save time will therefore increase the number of online shoppers.
Factors fuelling growth of online purchasing
Inferential Statistics
Cross Tabulations
Cross tabulations may also be referred to as a two-way tabulation and is a
statistical technique that establishes an interdependent relationship between two
, which does not extend to identifying a causal relationship
siness definition for …1999).
Convenience Wider choice of suppliers
Lower prices Foreign stocked product
Even though 31% of respondents did not shop online, 75% of these non-online
buyers indicated that they would consider shopping online in the near future.
asons that are contributing to the growth of online shopping.
When asked the reason why they would shop online, convenience (32%) topped
the list followed by wider choice of suppliers (24%), lower prices (22%), and
need for an easier mechanism to
purchase and save time will therefore increase the number of online shoppers.
way tabulation and is a
statistical technique that establishes an interdependent relationship between two
a causal relationship
Foreign stocked product

4 3
4.3.1.1 Cross tabulation between Age and Shopping Online parameters
Table 4.2 depicts the various age groups of respondents’ and the percentages that
shop online. The age groups 18 – 24 and 25 – 34 yielded 61% and 68%
respectively of the respondents that shopped online, whilst the age group 35 – 44
produced 79% of respondents confirming they shopped online. The possible
reasons for the age group 35 – 44 producing the largest number of respondents
that shopped online could include that these shoppers are confident of how the
internet works, are busy juggling family and career lives, and shop online due to
convenience and saving time. The age group that produced the lowest number of
online shoppers was 55 and over (48%).
Table 4.2: Age and Online Shopping Cross Tabulation Analysis
Age Group Do You Shop Online? Total
Yes No
18 – 24 61% 39% 100%
25 – 34 68% 32% 100%
35 – 44 79% 21% 100%
45 – 54 65% 35% 100%
55 and over 48% 52% 100%
4.3.1.2 Cross tabulation between Age and What Items are Purchased
Online Parameters
Table 4.3 provides a detailed breakdown of what is purchased according to age
groups. Whilst the age group 18 – 24 was the highest online purchaser of clothes
(23%), the age group 25 – 34 made most of their online purchases in the
entertainment category. The age group 55 and over booked their travel tickets
online (20%). The 18 – 24 age bracket purchased the most books online at 21%.

4 4
Table 4.3: Breakdown between Age and the Various Items that are Purchased
Online.
Age Food Books Travel Clothes Entertainment Board Other Total
18 – 24 9% 21% 13% 23% 19% 11% 4% 100%
25 – 34 9% 9% 16% 18% 30% 14% 4% 100%
35 – 44 12% 14% 14% 17% 27% 15% 1% 100%
45 – 54 14% 14% 13% 18% 26% 13% 2% 100%
55 & > 3% 20% 20% 11% 20% 20% 6% 100%
4.3.1.3 Cross tabulation between Gender and Items that are Purchased
Online
In an attempt to better understand the buying patterns of online shoppers, Table
4.4 provides a breakdown of what items are purchased by gender. More females
(12%) than males (9%) purchased food online. Books were almost evenly
distributed i.e. males at 13% and females at 14%. Travel was evenly split at 15%.
Females purchased more clothing apparel online at 19% compared to males at
17%. Males purchased more entertainment (28%) and accommodation (15%) than
females at 24% and 12% respectively.
Table 4.4: Gender and Items purchased online.
Items Purchased Online Gender
Male Female
Food 9% 12%
Books 13% 14%
Travel 15% 15%
Clothes 17% 19%
Entertainment 28% 24%
Accommodation 15% 12%

4 5
Respondents listed other items which included: computer software, online exams,
electronic devices, jewellery, health and beauty products, and cell phone
accessories.
4.3.1.4 Cross tabulation between Gender and Reasons for Not
Shopping Online
Hackers and trust were two factors that produced the highest response for not
wanting to shop online (Table 4.5). Not owning a credit card was evenly poised at
16%. Wanting instant delivery and having no access to the internet both produced
the lowest statistics. There were 14% of males and 18% of females who wanted
to see and feel the item before purchasing.
Table 4.5: lists the reasons why both genders prefer not to shop online.
Reasons for not purchasing online Gender
Male Female
Trust 27% 22%
Hackers 31% 26%
No credit card 16% 16%
Require instant delivery 3% 14%
No access to the internet 8% 4%
Prefers touching the product before buying 14% 18%
4.4 Correlation Analysis
Examining the statistical significance of a correlation coefficient which was
calculated on a randomly selected sample, provides insight whether there is a
likelihood that the coefficient will be found in the population from which the sample
was taken (Bryman and Bell 2007). The two factors that determine whether a
correlation coefficient is statistically significant or not are the size of the computed
coefficient and the size of the sample (Bryman and Bell 2007).
The two types of correlation analysis are Pearson’s r and Spearman’s rho.

4 6
4.4.1 Pearson’s r
This is a method for examining relationships between interval / ratio variables. The
coefficient value lies between zero and one, where zero equates to no relationship
between the variables and one represents a perfect relationship. The closer the
coefficient is to one the stronger the relationship, and the closer to zero means the
weaker the relationship. The coefficient could be either positive or negative
representing the direction of the relationship (Bryman and Bell 2007).
4.4.2 Spearman’s rho
Spearman’s rho is designed for the use of pairs of variables, but can also be used
with one ordinal variable and the other parameters are intervals / ratios. This form
of correlation analysis is exactly like Pearson’s r in that the computed value of rho
will be either positive or negative and will vary between zero and one. If the
requirement is to calculate the correlation between an ordinal and an interval /
ratio variable, Pearson’s r cannot be used because both variables must be at the
interval / ratio level of measurement. To overcome this limitation Spearman’s rho
is used, hence, for purposes of this study Spearman’s rho will be utilized (Bryman
and Bell 2007).
Table 4.6 depicts the relationship between race and online shopping. As
discussed previously, a negative or positive value represents the direction of the
relationship, hence, in this example the negative correlation coefficient of -.064
means race does not have any bearing on whether online shopping is supported
or not.
Table 4.6: Correlation Analysis between race and shopping online.
Race Do you shop online?
Race C o r r e l a t i o nC o e f f i c i e n t 1 . 0 0 0 - . 0 6 4
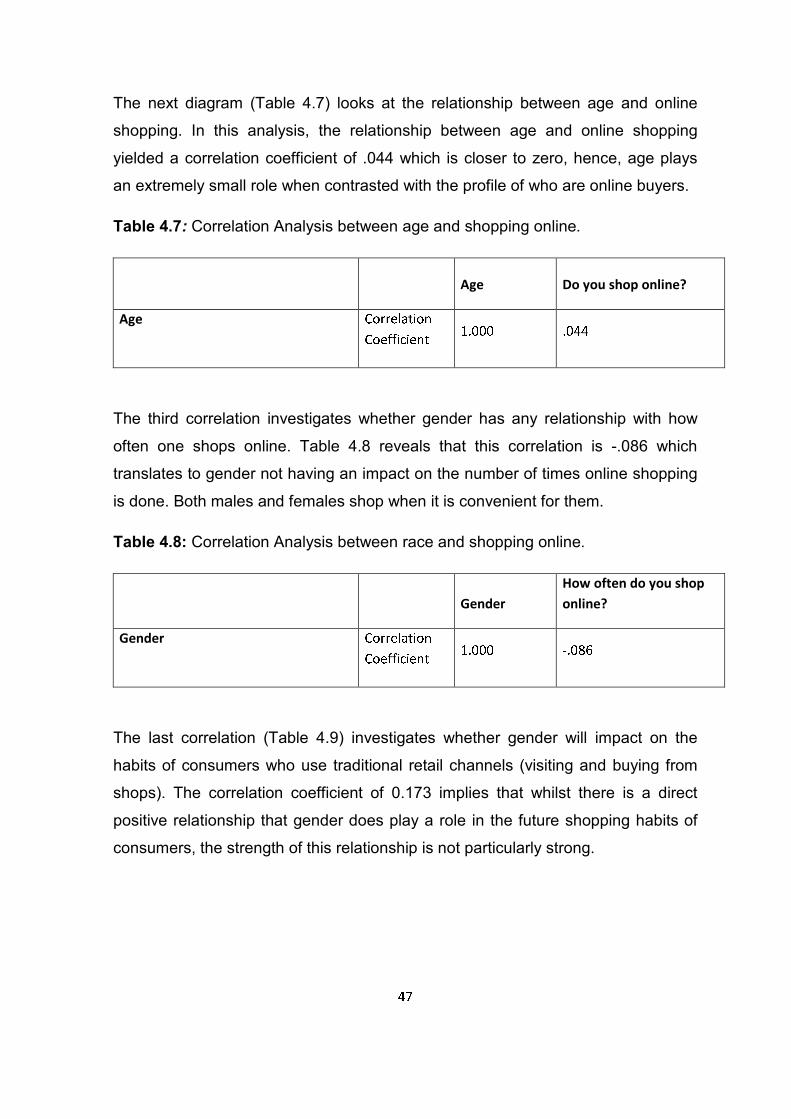
4 7
The next diagram (Table 4.7) looks at the relationship between age and online
shopping. In this analysis, the relationship between age and online shopping
yielded a correlation coefficient of .044 which is closer to zero, hence, age plays
an extremely small role when contrasted with the profile of who are online buyers.
Table 4.7: Correlation Analysis between age and shopping online.
Age Do you shop online?
Age C o r r e l a t i o nC o e f f i c i e n t 1 . 0 0 0 . 0 4 4
The third correlation investigates whether gender has any relationship with how
often one shops online. Table 4.8 reveals that this correlation is -.086 which
translates to gender not having an impact on the number of times online shopping
is done. Both males and females shop when it is convenient for them.
Table 4.8: Correlation Analysis between race and shopping online.
Gender
How often do you shop
online?
Gender C o r r e l a t i o nC o e f f i c i e n t 1 . 0 0 0 - . 0 8 6
The last correlation (Table 4.9) investigates whether gender will impact on the
habits of consumers who use traditional retail channels (visiting and buying from
shops). The correlation coefficient of 0.173 implies that whilst there is a direct
positive relationship that gender does play a role in the future shopping habits of
consumers, the strength of this relationship is not particularly strong.
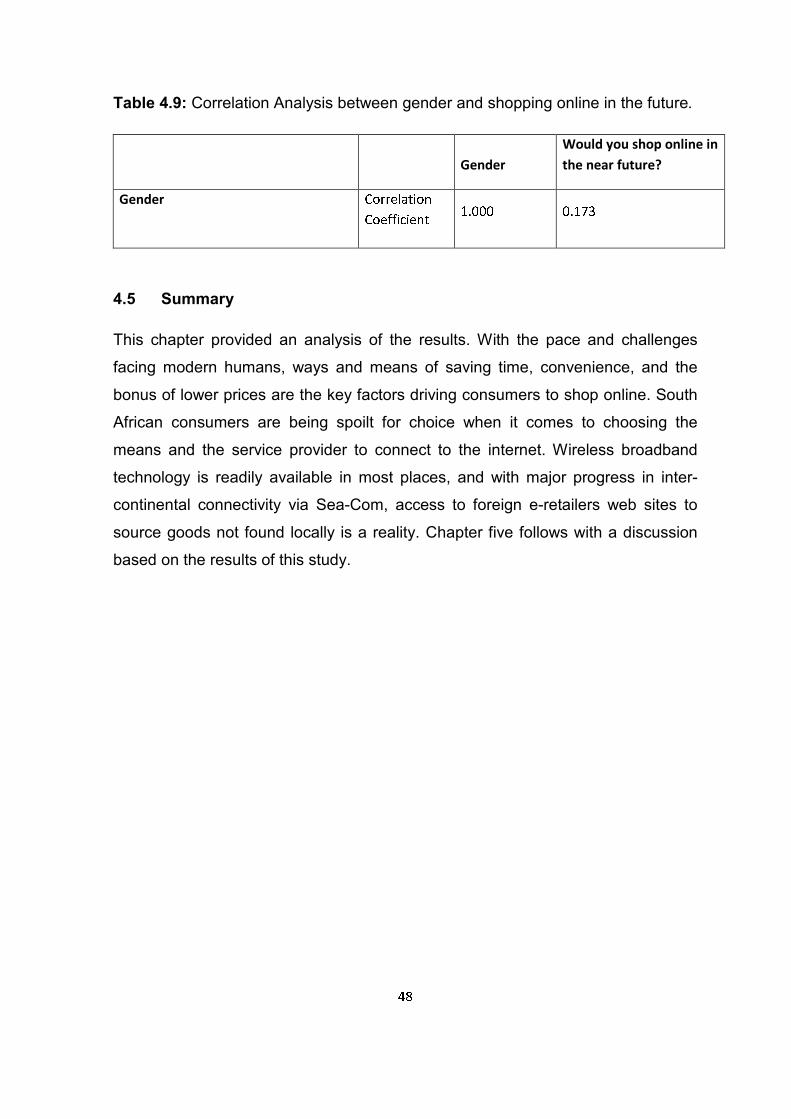
4 8
Table 4.9: Correlation Analysis between gender and shopping online in the future.
Gender
Would you shop online in
the near future?
Gender C o r r e l a t i o nC o e f f i c i e n t 1 . 0 0 0 0 . 1 7 3
4.5 Summary
This chapter provided an analysis of the results. With the pace and challenges
facing modern humans, ways and means of saving time, convenience, and the
bonus of lower prices are the key factors driving consumers to shop online. South
African consumers are being spoilt for choice when it comes to choosing the
means and the service provider to connect to the internet. Wireless broadband
technology is readily available in most places, and with major progress in inter-
continental connectivity via Sea-Com, access to foreign e-retailers web sites to
source goods not found locally is a reality. Chapter five follows with a discussion
based on the results of this study.
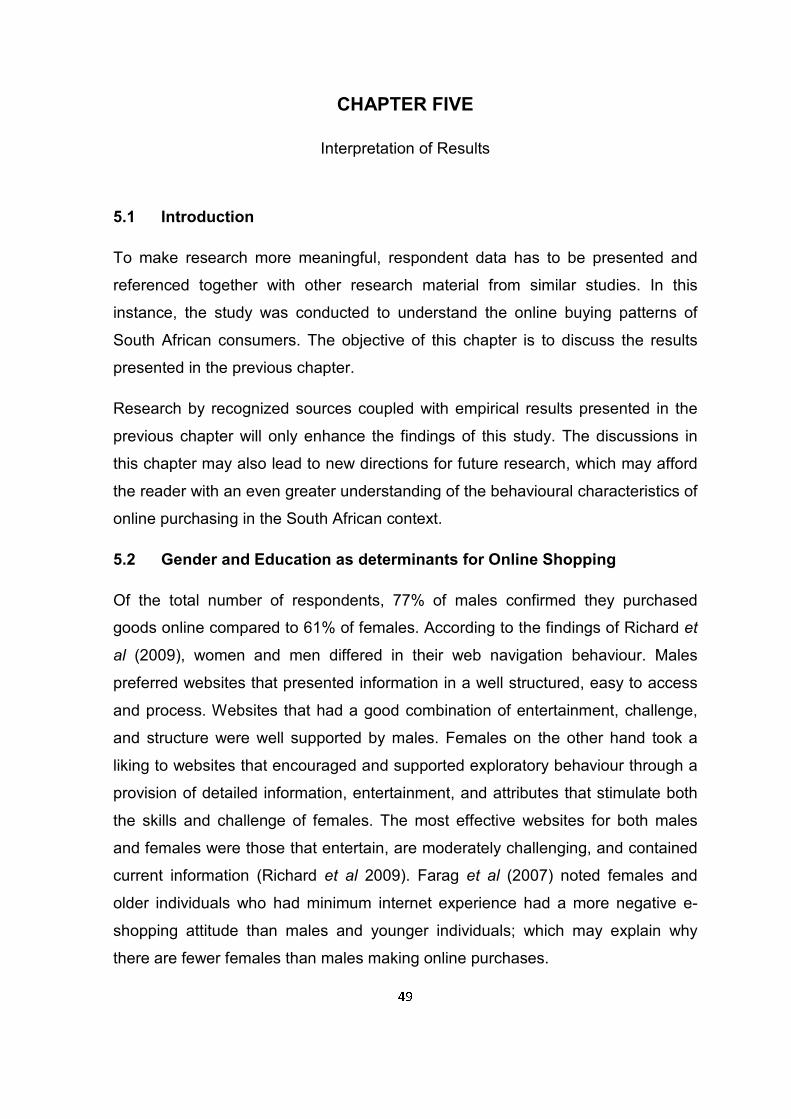
4 9
CHAPTER FIVE
Interpretation of Results
5.1 Introduction
To make research more meaningful, respondent data has to be presented and
referenced together with other research material from similar studies. In this
instance, the study was conducted to understand the online buying patterns of
South African consumers. The objective of this chapter is to discuss the results
presented in the previous chapter.
Research by recognized sources coupled with empirical results presented in the
previous chapter will only enhance the findings of this study. The discussions in
this chapter may also lead to new directions for future research, which may afford
the reader with an even greater understanding of the behavioural characteristics of
online purchasing in the South African context.
5.2 Gender and Education as determinants for Online Shopping
Of the total number of respondents, 77% of males confirmed they purchased
goods online compared to 61% of females. According to the findings of Richard et
al (2009), women and men differed in their web navigation behaviour. Males
preferred websites that presented information in a well structured, easy to access
and process. Websites that had a good combination of entertainment, challenge,
and structure were well supported by males. Females on the other hand took a
liking to websites that encouraged and supported exploratory behaviour through a
provision of detailed information, entertainment, and attributes that stimulate both
the skills and challenge of females. The most effective websites for both males
and females were those that entertain, are moderately challenging, and contained
current information (Richard et al 2009). Farag et al (2007) noted females and
older individuals who had minimum internet experience had a more negative e-
shopping attitude than males and younger individuals; which may explain why
there are fewer females than males making online purchases.

5 0
According to Farag et al (2007), there was a relation in that people who are more
highly educated have more internet experience than the less well educated. The
conclusion was that people who earned a higher income made more online
purchases. Farag et al (2007) also found that credit card owners had more internet
experience and a more positive e-shopping attitude than people who did not own a
credit card.
5.3 Reasons for Shopping Online
According to Mochiko (2009), South African consumers that shopped online did so
because of convenience and more competitive prices. These two reasons are
expected to boost sales of online retailers as people become more time starved.
Since time management is a crucial element in our lives, shopping from the
comfort of our homes appears to be beneficial to the modern human. One does
not even have to dress up, contend with crowds, and spend money on fuel for the
car for an item that may not be stocked in a store. With all the hustle and bustle in
the life of a 21st century person, something that could save time is construed
positively. Online stores provide information in great detail about goods that are
not always found on the packaging (Comparing online to …2010). A total of 73%
of respondents in a Visa survey said online shopping was cheaper and a similar
trend was emerging in South Africa, with many consumers citing similar reasons
for shopping online (Mochiko 2009). This was evident when 22% of respondents in
this research said convenience was the main motive for them shopping online,
followed by saving time (20%), and easier than physically going to the store (20%).
One of the many advantages of online purchasing is that consumers can easily
track one’s own order which does become very convenient (Kucuk and
Krishnamurthy 2007). Due to e-retailers dealing with local and international
consumers they are more likely to carry hard to find items that does not have a
large market share. With a low overhead advantage, even slow moving items
create no real problems (Comparing online to …2010). By selling online,
companies can reduce costs and offer their products to a wider international
market (Parker 2010). Possible reasons for the need to shop online include: South
Africans are looking to save more as they have just emerged from the global

5 1
recession and face high rates of un-employment. In fact 88% of South African
online shoppers stated that their shopping was planned in advance with some
research going into the planned purchase. There was virtually no impulse buying
(Consumers keen to …2009). Goods are priced more competitively on e-retailers
web sites than at traditional retailer outlets because the e-retailer has a very low
overhead, since there is no need to pay for retail display space and storage costs
are non-existent or negligible. Delivery of the product is often direct from the
factory, further reducing warehousing costs and eliminating the expense of
multiple shipments to various distributors which allows these savings to be passed
directly to the consumer. A brick and mortar store has unavoidable overheads.
Examples of these expenses include: lighting, air conditioning, water, wages,
maintenance, movement of stock, and warehousing. If shoplifting occurs this too
increases costs to the retailer. The advantage for retailers is that they can
purchase in bulk which leads to paying lower prices for goods and these savings
can be passed onto their customers (Comparing online to …2010). This is also
echoed by Kucuk and Krishnamurthy (2007) where manufacturers focus more on
consumers than on middlemen, which means passing on a higher level of profit
onto consumers than to retailers by introducing better deals to consumers.
Whilst we are some pace behind first world countries like the United Kingdom and
United States of America in terms of internet buying, more and more South
Africans are getting onto the internet and as they do so, they are finding out there
are better deals to be found when shopping online (Mochiko 2009). As America
continues to emerge from the global recession, consumers are becoming less
loyal to retailers that they traditionally supported and are making fewer trips to
these retailers. One in five Americans has decided that online shopping will be
their primary mode of shopping and 39% of all online shoppers were turning to
mobile, online, and social media and utilizing user reviews to help them make their
purchases (American consumers will …2009). The Accenture Report 2009
supported the above findings by saying 74% of their respondents were looking for
a more convenient service and 66% wanted better customer service (Youth won’t
tolerate …2010). Kucuk and Krishnamurthy (2007), informs the reader that using
5 2
the internet allows the consumer to simultaneously access comparable products
and services with low costs of searching and switching, which empowers the
consumer in that he has more options and also the ability to easily compare
prices.
5.4 Reasons for not Shopping Online
When respondents of this survey were asked the reasons for not purchasing
goods online, 28% were afraid of hackers, 24% did not trust online retailers, 16%
had no credit card and 16% wanted to hold and see the item before making the
purchase. This finding complimented the MasterCard survey of 2009, when 85%
of respondents said security and reputation were more important than value for
money (Consumers keen to …2009). Fraudsters have created devious means of
scamming online customers, warranting the need for a secure payment facility.
Hackers could also be interpreted as exposure to viruses, worms, trojans, and
phishing attacks. A clever method of stealing on the internet is by phishing attacks.
How this works is that websites are created to look identical to major shopping
sites like eBay or Amazon. Once an unsuspecting individual clicks on a link and
enters confidential details, the owners of these fake sites harvest personal
credentials, then logs into the real web site, commits identity theft, and purchases
goods. The affected person may only realize at the end of the month when looking
through credit card statements that he had been scammed (Shopping online risks
…2010). In a survey conducted by MasterCard 61% of respondents said a
websites reputation was extremely important (Consumers keen to …2009). This is
the possible reason why trust of online retailers was lacking i.e. online consumers
do not know how to differentiate an authentic web site from a fake.
According to Kim and Gupta (2009), perceived risk has a greater impact on value
than price for potential online customers and for repeat customers perceived price
has a greater impact on value than risk. This could be interpreted as potential
customers perceive greater risk and uncertainty in carrying out transactions while
repeat customers perceive greater certainty in completing a purchase with the
online vendor. Lian and Lin (2008), informs the reader that some consumers who
purchase online may be more comfortable with purchases that do not outlay a
5 3
substantial amount of money example books, and only consumers who perceive
the web as a secure environment will spend large amounts of money online.
Although it is true that product prices are lower if purchased online, some
consumers avoid online shopping for fear that their credit card details may be put
at risk (Parker 2010). According to Elliot and Speck (2005), less than 5% of e-
customers purchased during a visit, only 1% of customers are repeat customers,
and most of those who place something in a e-shopping basket eventually
abandon it. Two thirds of e-shoppers confirmed that they will not purchase from a
poorly designed web site. Comparing the previous reasons for not purchasing
online, respondents’ data for this study confirmed 24% of online buyers did not
trust e-retailers and 28% of online buyers were afraid of hackers. A disadvantage
of purchasing from online stores is that should an item have to be returned, it is up
to the consumer to pay for the packaging and shipping of the item (Shopping
online risks …2010). Some customers may want the purchased items
immediately, in case they wanted to wear it directly. The time taken to receive an
item purchased online or exchange a wrong purchase could also take a lot of time
preventing customers from buying goods online (Jacobs & de Klerk 2007).
According to Jacobs & de Klerk (2007), online consumers avoid risks or mistakes
by purchasing brands that they are comfortable with (size, fit, and quality), instead
of purchasing new and un-familiar brands.
5.5 Promoting Online Shopping by using New Age Media
The following section will discuss why online shoppers shop from certain stores,
when they shop, the amounts spent, and what is purchased.
5.5.1 The Number of Online Shoppers
The results of this survey revealed 77% of male respondents and 61% of female
respondents confirmed shopping online. Facebook, Twitter and other blogging
sites have become powerful tools which influence the online buying decisions of
consumers (Facebook, Twitter powerful …2010). Facebook, Wikipedia, YouTube,
Twitter, and NetLog were identified as being the biggest social media websites.
These online social sites are attracting a massive following of subscribers and as

5 4
more consumers make use of these websites the influence that can be wielded on
online consumers is enormous (Facebook, Twitter powerful …2010). Just how
many people actually use the social media sites was identified by a Nielsen report
in 2010 that said three in four people worldwide who made use of the internet have
visited a social networking or blog, and are spending approximately six hours a
month on them. The same Nielsen report went further on to say that online product
reviews were the third most trusted source of information; after recommendations
from friends and family, when deciding whether to purchase a product (Facebook,
Twitter powerful …2010). According to Nielsen Online Japan “social media is
having a larger and larger influence on purchasing decisions” (Facebook, Twitter
powerful …2010). This contradicted with the Bureau of Market Research at Unisa
who conducted research in 2009 on 2292 high school pupils in South Africa, and
results from the research revealed that traditional media, such as television,
catalogues, and magazines have a stronger influence on the purchasing decisions
than new media, such as cell phones and the internet (Mochiko 2010). A
MasterCard survey in 2009 found that 80% of South Africa’s internet users
shopped online (Mochiko 2009).
5.5.2 What is Purchased Online
According to Goldstuck (2004), the most commonly purchased items are
groceries, apparel, and books. The single fastest growing retail category by
number of items purchased from various sites is flowers and gifts, followed by
apparel and then food, beverages, and groceries. As per the survey undertaken
for this study; 26% of respondents purchased entertainment, 18% clothes, 16%
travel, 14% accommodation, 14% books, and 12% food which closely matches the
list of Goldstuck (2004). According to a MasterCard survey conducted in late 2009,
the most popular items purchased online included music CDs’, DVDs’, airline
tickets, and books (Mochiko 2009). The reason for these types of products being
product leaders in the online buying category, is because one does not require
personal inspection and most, if not all features, can be outlined in the product
description catalogue (Analysis of consumer …2010). According to Lian and Lin
(2008), books are one example of a low outlay, frequently purchased, and a

5 5
tangible product. This could be interpreted as a product that a consumer will look
at purchasing online and reflect on the purchase and experience which may or
may not lead him to purchase additional goods or services online. It appears that
those who travelled almost always had a requirement to book accommodation at
their destination. The entertainment purchases match that of findings of Singh
(2001) and a 2009 MasterCard online shopping survey. Amazon.com and
Khalahari.net were two of the more popular online sites from which to purchase
books, accounting for 14% of online sales. Online retailers in most instances
include costs associated with postage and packaging, which enable online buyers
to be completely aware of what the total purchase amounts to. This fact, coupled
with fast courier services, promotes online purchases, whether it be local or
overseas.
5.5.3 Where and When is Online Shopping Done
The dominant online retailers in 2004 were Pick ‘n’ Pay Home Shopping,
Kalahari.net, Woolworths, Inthebag, Netflorist, Cybercellar, Streetcar.com, MWEB
ShopZone, Digital Mall, The Shopping Matrix and StopQ.com (The need for
…2004). In 2007 the e-retailers that attracted most of online sales in South Africa
included: M-Web ShopZone, eBucks, Digital Mall, Pick ‘n Pay Home Shopping,
Woolworths, Kalahari.net, Exclusive Books, Musica, Cybercellar, Digital Planet,
Ascot Direct and NetFlorist (Goldstuck (2007). Newer dominance in online retailing
websites include: Inthebag and Streetcar.com (Goldstuck 2010).
According to The Goldstuck Report: Online Retail in South Africa 2004; only 20%
of online retail sales were recorded in the November / December period. This
means that e-retailers cannot count on the bumper festive period to boost revenue
if sales were poor in the previous ten months. People who purchased goods online
did not concentrate only at the end of the year to make these purchases;
purchases are made throughout the year. Goldstuck (2004) sums up the need for
e-retailers: “with costs of online retail high and margins tight, they have to be on
their toes around the clock as well as around the year.” Respondents in this survey
stated that most of their online shopping (29%) is usually done after seeing an
advert from a newspaper, catalogue, or handout, followed by 27% of respondents

5 6
saying their purchases are made after referral from a trusted source, 24% of online
shoppers made a purchase after watching a television advert, and 20% after
viewing an online advert.
5.6 Factors Assisting the Growth of Online Shopping
Of all the respondents who were currently not shopping online, 75% indicated they
will consider shopping via the online channel. It was also highlighted that as our
lives become more disjointed and cluttered, consumers turn to the unrivalled
convenience of the internet to research and purchase goods (875 million shoppers
…2008). NetFlorist’s 30% increase in sales year on year in 2008 could only be
attributed to the growing penetration of the internet in more South Africans lives
(Mwanza 2010). The increase in revenue was achieved even though NetFlorist’s
advertising budget was less than that in 2007. According to Goldstuck (2010)
businesses across Africa are expecting an upsurge in internet access, technology,
and reduced costs as a result of the new undersea cables. The expectations are
so vast that the term internet revolution is mentioned. As per the Telecoms Trends
in Africa 2010 report, more than 90% of business decision makers across Africa
are expecting prices to drop and competition to increase considerably. The survey
was completed by using 1100 internet-using small, medium and large businesses
across 20 African countries. The survey revealed that most African countries still
remain heavily reliant on slow or expensive forms of connectivity, such as dial-up
and satellite; however, they are beginning the move to broadband.
ADSL is becoming the standard medium to connect to the internet, with more than
40% of businesses in these 20 countries using them. The limitation was satellite
connectivity which was seen as a very expensive means to connect to the internet.
According to Goldstuck (2010) more than one in five respondents said they were
using satellite technology, which means even though there is an expectation for
better and cheaper connectivity, infrastructure is a limitation. The advantages of
having a fast internet connection in relation to online purchasing was researched
by Farag et al (2007); where it emerged that people with fast web access
searched online more frequently. In addition, fast internet connectivity makes the
user to think positively about e-shopping, leading to a total positive effect on online

5 7
buying which results in more frequent online shopping (Farag et al 2007). Kolko
(2009) informs us that broadband adoption increases the usage of the internet
overall. Besides a noticeable increase in music downloads, online purchasing
volumes also increase.
Perhaps the most interesting fact of the Telecoms Trends in Africa 2010 report, is
that the level of internet subscribers and usage increases wherever new undersea
cables have been landed and fibre optic networks that have linked these undersea
networks to urban centers. Perhaps two other factors that contribute positively to
online purchasing are the increasing numbers of personal computers and mobile
phones with internet browsing capabilities. At the beginning of 2006 it was
estimated that the number of personal computers in South Africa would reach the
5,3 million mark by the end of the year (Laschinger 2006). The use of mobile
internet services has literally exploded in South Africa with less than half of mobile
users who are able to browse the internet making use of this service. There are
60% of mobile cell phone users who have the capability of browsing the internet
from their phones but only 21% actually use this service. Facebook and Mixit are
the two most popular online services being used from cell phones (Goldstuck
2010). In chapter 2 another study by Goldstuck (2007) revealed that online
purchases take place after users become more confident with the internet.
Additional factors that will fuel the acquisition of additional personal computers and
mobile phones with internet browsing capabilities include: continued strong
economic growth, the emergence of the black middle class, improved education
levels, including computer literacy, the evolution of the distribution channel,
improved affordability of PCs, both as a result of cheaper product and new
financing options, convergence of voice and data, technology improvements, and
demand for more server / storage capability to meet higher levels of corporate
governance requirements (Laschinger 2006).
Farag et al (2007) also indicated that since most home shopping is accomplished
at home, consumers are adversely affected due to time pressures when using
slow outdated technologies to connect to the internet. Besides the slowness
experienced when using older modem solutions, it is also a costly exercise. As

5 8
more home users move from modem to ADSL technologies, they will experience
faster online times, overcoming any time pressures which can only lead to more
online purchases (Farag et al 2007).
Data obtained from respondents’ for this study showed convenience (32%), wider
choice of suppliers (24%), lower prices (22%), and products not available locally
(22%) were factors accelerating the growth of purchasing via the internet channel.
The questionnaire did not ask whether more competitive Internet access prices
would positively increase opportunities of purchasing via the online channel.
5.7 Conclusion
This chapter discussed the empirical results of the study in conjunction with
pertinent previous research and other appropriate studies and surveys on online
purchasing. It was determined that designs of websites can attract more males,
more females, or both males and females. Internet experience and education also
contributes to the attitude of consumers when it came to internet purchasing.
Chapter 5 listed several key factors that either favoured online buying or was
against online buying. From user data obtained, the habits of online buyers could
be categorised into what were the preferred items purchased online, where and
when online shopping was done, and factors which promoted online shopping.
The findings of the study will be utilized to formulate justifiable recommendations
for further research. This will be discussed in Chapter 6.

5 9
CHAPTER SIX
Recommendations and Conclusion
6.1 Introduction
This chapter suggests recommendations based on the previous chapters
discussions. In addition, this chapter will determine whether results obtained from
user data were sufficient to address the objectives of this study, identify limitations
in the results, and recommend possible future studies around the topic of this
research.
6.2 Have the problems been solved?
To report with confidence on whether the problems were solved, one has to
contrast the objectives listed at the beginning of the study with the data obtained
from respondents utilized for this study. The objectives of this study included:
1. determining what consumers look for prior to purchasing from a website
2. to determine the factors that promote or limit the practice of online
purchasing
3. to determine the items that online consumers purchase, where, when, and
how often
To determine whether objectives were met, the most common respondents’ data
which was presented in chapter 4, was utilised.
Before making up their minds to purchase from a certain online retailer,
consumers look at the website for certain criteria. These criteria include: a secure
payment facility, reliable delivery, and guarantees and warrantees.
Convenience, time saving, and easier than going to the store were the reasons
wanting to commit to shopping via the internet. Respondents stated the reasons
for not wanting to shop online included being afraid of hackers, not trusting online
retailers, and wanting to hold and see the product.
6 0
Items that were purchased online included entertainment, clothes, and travel.
Respondents made purchases from both local and international e-retailer web
sites. Purchases were made after seeing an advert from a newspaper, catalogue,
or handout, after referral from a trusted source, or after watching a television
advert. The frequency of purchases varied from three to six months.
Based on the evidence listed above, results for all objectives were received, and
there were no objectives with limited or no data preventing reporting thereof.
6.3 Recommendations
6.3.1 Site Design
Respondents have indicated that before deciding to make online purchases, they
want to trust the online retailer, want guarantees, reliable service delivery, and
clear instructions on their online purchase; therefore, a recommendation is for
online retailers to display this information on their websites. Online retailers need
to ensure homework is done on choosing a logistics company if this is an
outsourced function, since a poor delivery experience generates a negative
relationship between customer and online retailer.
Websites should also cater for secure and varying payment methods such as
smart cards and e-cash, provide money back and replacement guarantees.
Deliveries must also be made on time. Firms must respond quickly to consumer
complaints and suggestions and understand changing consumer characteristics.
6.3.2 Valuing the Customer
According to de Vries (2009), e-retailers need to show their consumers that they
value them, and this can be achieved by offering daily and weekly deals.
Additional examples of how to spice up an online customers experience is by
offering free delivery, offer various payment options, guaranteed delivery times on
premium products, possible door to door delivery, and even a free gift wrapping
service (de Vries 2009). This can be sweetened even further by allowing the
customer an additional discount for purchases totalling a certain amount or if the
combined total of all purchases over time reaches a certain amount. New and

6 1
ingenious ways must be sought to attract and keep the customer e.g. a discount
for introducing a new online shopper.
The number of consumers who switched retailers in 2009 due to poor customer
service totalled 69%, which means, e-retailers have to ensure their clienteles’
needs are fulfilled (Youth won’t tolerate …2010).
According to the Nielsen Global Online Survey (2008), 60% of online shoppers
said they will make repeat purchases from shopping sites they are familiar with.
This means, for online retailers to capture new online shoppers as they make their
first purchases on the internet, positive shopping experiences must be created to
capture these customers’ loyalty and money. Respondents’ of this survey said
their biggest fears prohibiting them from shopping online were online hackers
(28%), and not trusting online sellers (24%). E-retailers must do more to create
more positive shopping experiences.
6.3.3 Security Fixups
According to Lian and Lin (2008), positive perceptions of web security changes
consumers attitudes about online purchasing. Methods of overcoming security
concerns and increasing levels of trust places a responsibility on online retailers to
use digital certificates (e.g. Verisign), use of secure encryption-supported
exchanges based on Secure socket Layer (SSL) and Secure HTTP protocols
(HTTPS), and joining privacy seal programs (e.g. Truste) (Chau et al 2007).
Parker (2010) states that secure web sites use web page addresses prefixed with
https:// which appears only when confidential data such as credit card details are
being submitted. Https is secure in that the customers Internet browser and the
retailer’s web site use an SSL certificate which allows the browser to verify that the
site it is communicating with is authentic. SSL certification is powerful in that the
web sites and their owners are traceable and the certification must be renewed
annually by only one of a handful of trusted certificate vendors (Parker 2010).
Other recommendations are that consumers should never click on hyperlinks (urls)
contained within spam (unsolicited) e-mail. Hyperlinks contained in e-mails may

6 2
not translate to the actual web site url when clicked on. As previously stated,
secure web site addresses always start with https:// especially when the time
comes to enter payment details. When a purchase has been made the completed
invoice appears on the computer screen; this is valuable and should be saved
onto the hard drive or printed and stored safely in case of discrepancies’ (Internet
basics purchasing …2010).
6.3.4 Ease of Use
Online buyers indicated convenience as being the biggest motivating reason for
wanting to shop via the online channel; so it is recommended that retailers need to
go out of their way to ensure that customer experiences when shopping online is
enjoyable. Everything that the customer needs to know must be provided e.g.
expiry dates, delivery times, postage and packaging costs, availability of stock,
how to exchange items, guarantees and warrantees, and any additional costs
6.3.5 Credit Card and Debit Card Usage
Extremely useful advice is to use credit cards rather than debit cards to pay for
internet purchases. The reason for this is paying by credit card utilizes the banks
money and money from the purchaser’s bank account is not utilised (Internet
basics purchasing …2010). This is helpful in that should a dispute arise, the
money belongs to the bank and the consumer’s money is not affected. However, if
a debit card is used, banks will assist in a dispute, but the money for the purchase
had already been taken directly out of the buyers account, and this money will not
be available until the dispute is settled, which could take days, weeks, or even
months (Internet basics purchasing …2010).
6.3.6 Social Media
As mentioned in chapter 2, social media is already extremely popular and
consumers are using to these sources as a means of making up their minds to
making purchases. Online reviews are the third most trusted source of information
after recommendations from friends and family when deciding whether to

6 3
purchase a product. E-retailers and consumers must therefore take cognizance of
this medium and harness its power to suit their requirements.
The importance of the internet has implications for individuals, society, and our
country as a whole, hence, the South African government and major private
companies should form alliances to make access to the internet possible for the
masses.
7. Ability to Address the Objectives of this Study
Objectives of this study included determining how often were online purchases
made, factors promoting or restricting online purchasing, what consumers look for
before purchasing from a website, items that consumers purchased online, and
where these items were purchased from.
Since the questionnaire was built around the objectives, rich user data was
received. In addition to reporting on user data, additional research material from
journals, books, newspapers, and the internet was referenced to validate whether
the reported trends of South African online consumers matched those previously
researched. Foreign trends of online consumers were also matched to those of
South African online consumers.
8. Limitations of the Study
Four limitations of this study were highlighted. The current study was conducted
only at the La Lucia Office Parks. The workers were white collar employees
representing a homogenous population and sample. A more detailed research
approach would include institutions from different industries thereby making the
sample heterogeneous. This study did not take into account employees who
worked from home and people who used the internet only from home. Another
limitation was that the questionnaire did not ask for the respondent’s level of
education, so a cross tabulation between education and online purchasing could
not be completed. This fact became evident since other research stipulated that
the more educated an individual is the greater the chances of this individual
making purchases via the internet. To facilitate a comparative analysis across
6 4
South Africa, this questionnaire should not be limited to a section of Kwazulu Natal
but conducted countrywide. Thirdly, respondents indicated that items are
purchased from local and foreign stores but exactly which items are purchased
from where are unknown. Lastly, information gained from journal articles stated
more consumers are using the Internet because of favourable rates and improved
technology. The questionnaire sent out to respondents’ did not ask the question
whether they will use the Internet as a purchasing channel should access to the
Internet become easier.
9. Recommendation of Possible Future Studies
Future studies on online purchasing in South Africa could look at an individual’s
earning in comparison to whether online purchasing is accomplished. Social
trends are another grey area when researching online purchasing. There may be
people who are making purchases online to be socially accepted and want to
appear to be hip. Another study could include the power of advertising and to
understand whether the consumer had a real requirement to make an online
purchase or whether they were lured by imaginative advertising. Similarly, the
power of social media recommendations that lead to online purchasing could be
investigated.
10. Implication of this Research
This research study has looked at the power of the internet and how it has
changed the means by which to acquire an item or service by means of
purchasing this online. The stake holders included online consumers, online
retailers, and web designers. An effort was made to provide a view from both
online purchaser and online retailer. This study has provided a detailed report on
the online buying habits of internet browsers. Furthermore, using the objectives of
the study, the reader can obtain information on what is purchased online, when is
purchasing accomplished, how much is purchased, information on local and
foreign purchases, what factors online buyers look for in a website before making
a purchase, and factors for and against online shopping. This research also
documented in great detail the current best practices for web site security and

6 5
design. Consumers who were unaware that safety measures are a possibility
when it came to online shopping will now know what to look out for when doing
their shopping online.
11. Conclusion
Using information from journals, books, and the internet, recommendations to the
challenges facing both online buyers and online retailers were provided. There
were several objectives of this study which provided a thorough understanding of
online buyers. Utilizing data received from an online questionnaire, information on
these objectives were received. Results obtained with the aid of descriptive and
probability sampling techniques clearly identified the reasons why some
consumers use the internet as a shopping channel, whereas others are hesitant.
Online retailers can use information from this research to ensure secure web
designs are implemented and best practices are followed to ensure a safe and
pleasant online buying experience. The findings and supporting academic
literature of this study prove that South African online consumer and e-retailer
trends are not far behind, if not, on par with first world countries. Literature has
indicated that online buying is huge in first world countries, and with people
becoming more starved of time, the trend is that consumers will turn to the internet
for convenience and time saving. In addition, there is the advantage of items being
offered at reduced prices when purchased via the Internet. The Internet appears to
be the future, so rather be wise and be an early adopter, and experience the
savings earlier rather than later.

6 6
REFERENCES
875 million shoppers online. 2008. [Online]. Available WWW: www.fin24.com/Business/875-million-shoppers-online-20080215. (Accessed 9 July 2010). Analysis of consumer behaviour online. [Online]. Available WWW:
http://analogik.com/article_analysis_of_consumer_behaviour_online.asp.
(Accessed 11 September 2010).
Business definition for: cross tabulation. 1999. [Online]. Available WWW:
http://www.allbusiness.com/glossaries/cross-tabulation/4960330-1.html. (
Accessed 26 August 2010).
Consumers keen to shop online - Business Report, 2009. [Online]. Available WWW: www.busrep.co.za/index.php?fSectionId=561&fArticleId=5012727. (Accessed 31 March 2010). Business Report, 2010. Facebook, Twitter powerful business tools. [Online] Available WWW: www.busrep.co.za/index.php?fSectionId=552&fArticleId=5535934. (Accessed: 15 July 2010). Business Report, 2008. Online retailers let you shop until your computer drops. [Online] Available WWW: www.busrep.co.za/index.php?fSectionId=553&fArticleId=4476178. (Accessed: 31 March 2010). Business Report, 2008. Shopping online has got a whole lot easier with eBucks. [Online] Available WWW: www.busrep.co.za/index.php?fSectionId=553&fArticleId=4559725. (Accessed: 31 March 2010). Business Report, 2009. Online stores expect broad ranges to boost sales. [Online] Available WWW: http://www.busrep.co.za/index.php?fSectionId=561&fArticleId=5296241. (Accessed: 22 June 2010). Changing Minds, 2010. Convenience sampling. [Online] Available WWW: http://changingminds.org/explanations/research/sampling/convenience_sampling.htm (Accessed: 26 July 2010). Comparing online to “Brick and Mortar” Shopping. [Online]. Available WWW: http://www.buzzle.com/articles/comparing-online-to-brick-and-mortar-

6 7
shopping.html. (Accessed 06 October 2010)
de Vries, F. 2010. Retail sales stats show consumers slowly reviving. [Online]. Available WWW: www.busrep.co.za/index.php?fArticleId=5518673. (Accessed 7 July 2010). eBucks, 2010. The reward of choice. [Online] Available WWW: https://www.ebucks.com/web/cms/eBucks/earnandspendpartners/partners/. (Accessed 23 June 2010). Fin 24, 2008. 875 million shoppers online. [Online] Available WWW: www.fin24.com/articles/default/display_article.aspx?ArticleId=1518-1786_2271612. (Accessed 30 March 2010). Fin 24, 2009. Online banking virus hits SA. [Online] Available WWW: www.fin24.com/articles/default/display_article.aspx?ArticleId=2554092. (Accessed 31 March 2010). Goldstuck, A. 2010. Africa expects internet revolution. 2010. [Online]. Available WWW: http://www.worldwideworx.com/2010/09/15/africa-expects/. (Accessed 23 September 2010). Goldstuck, A. 2010. Broadband Speeding Ahead. [Online] Available WWW: http://www.worldwideworx.com/2010/03/17/broadband-speeding-ahead/. (Accessed 30 March 2010). Goldstuck, A. 2010. Mobile Internet booms in SA. [Online] Available WWW: http://www.worldwideworx.com/2010/05/27/mobile-internet-booms-in-sa/. (Accessed 26 September 2010). Goldstuck, A. 2004. The need for speed in online retail. [Online]. Available WWW: http://www.worldwideworx.com/2004/06/24/the-need-for-speed-in-online-retail/. (Accessed 26 September 2010). Internet Basics: Purchasing on the internet. [Online] Available WWW: http://www.webhero.org/Surfing/purchasing.asp. (Accessed 26 June 2010) Laschinger, K. 2006. PC user base in SA reaches 5 million. [Online] Available WWW: http://www.worldwideworx.com/2006/06/13/pc-user-base-in-sa-reaches-5-million/. (Accessed 26 September 2010). Mail and Guardian, 2010. SA April retail sales up. [Online] Available WWW: http://www.mg.co.za/article/2010-06-17-sa-april-retail-sales-up. (Accessed 27 June 2010). Microsoft Support, 2010. Computer viruses: description, prevention, and recovery.
6 8
[Online] Available WWW: http://support.microsoft.com/kb/129972. (Accessed 22 August 2010). Mochiko, T. 2009. Business Report, 2010. Research shows SA teens still influenced by traditional media. [Online] Available WWW: www.busrep.co.za/index.php?fSectionId=561&fArticleId=5358929. (Accessed 22 June 2010). Mochiko, T. 2009. Business Report, 2009. Shopping online is gaining traction. [Online] Available WWW: www.busrep.co.za/index.php?fSectionId=561&fArticleId=5295201. (Accessed 31 July 2010). Mwanza, C. 2008. NetFlorist scores on Valentines. [Online]. Available WWW: www.fin24.com/Companies/NetFlorist-scores-on-Valentines-20080221?pageNo=1. (Accessed 2 July 2010). Mwanza, C. 2007. Stung by the web shopping bug. [Online]. Available WWW: www.fin24.com/Companies/Stung-by-the-web-shopping-bug-20071001. (Accessed 3 July 2010). PayPal, 2010. Transaction fees for cross-border payments – South Africa. [Online] Available WWW: https://www.paypal.com/za/cgi-bin/webscr?cmd=_display-xborder-fees-outside&countries. (Accessed 25 June 2010). Shopping online risks. [Online]. Available WWW: http://www.buzzle.com/articles/shopping-online-risks.html. (Accessed 06 October 2010). The Research Advisors, 2006. Sample Size Table. [Online] Available WWW: http://www.research-advisors.com/tools/SampleSize.htm. (Accessed 27 July 2010). The Retailer. UK: January growth in online sales slowest in a decade. [Online] Available WWW: http://www.theretailer.co.za/news/9-latest/1611-uk-january-growth-in-online-sales-slowest-in-a-decade. (Accessed 01 July 2010). The Survey System, 2007. Sample Size Calculator. [Online] Available WWW: http://www.surveysystem.com/sscalc.htm?ConLevBut=1&box=5&popbox=300000&ssbox=. (Accessed 27 July 2010). UK: January growth in online sales slowest in a decade. 2010. [Online]. Available WWW: www.theretailer.co.za/news/9-latest/1611-uk-january-growth-in-online-sales-slowest-in-a-decade. (Accessed 5 July 2010). Youth won’t tolerate bad service. 2010. [Online]. Available WWW: http://www.fin24.com/articles/default/display_article.aspx?ArticleId=1518-2386-

6 9
2432_2571226. (Accessed 10 April 2010). Bosnjak, M., Galesic, M., Tuten, T. 2007. Personality determinants of online shopping: Explaining online purchase intentions using a hierarchical approach. Journal of Business Research, Vol. 60, pp 597 – 605. ELSEVIER. Bryman, A., Bell, E. 2007. Business Research Methods, 2nd ed. Oxford, New York. Chau, P. Y. K., Hu, P. J. H., Lee, B. L. P., Au, A. K. K. 2007. Examining customers’ trust in online vendors and their dropout decisions: An empirical study. Electronic Commerce Research and Applications, Vol. 6, pp 171 – 182. ELSEVIER. Chen, Y., Shang, R., Kao, C. 2009. The effects of information overload on consumers’ subjective state towards buying decision in the internet shopping environment. Electronic Commerce Research and Applications, Vol. 8, pp 48 – 58. ELSEVIER. Childers, T. L., Carr, C.L., Peck, J., Carson, S. 2001. Hedonic and utilitarian motivations for online retail shopping behaviour. Journal of Retailing, Vol. 77, No. 4, pp 511 – 535. ELSEVIER Science Inc. Constantinides, E. 2004. Influencing the online consumer’s behavior: the web experience. Internet Research, Vol. 13, No. 2, pp 111 – 126. Emerald Insight. Cooper, D.R. and Schindler, P.S. 2003. Business Research Methods, 8th ed. New York, McGraw – Hill. Cooper, D.R. and Schindler, P.S., 2006. Business Research Methods, 9th ed. New York, McGraw – Hill. Dijk, G., Minocha, S., Laing, A. 2007. Consumers, channels and communication: Online and offline communication in service consumption. Interacting with Computers, Vol. 19, pp 7 – 19. ELSEVIER. Elliott, M. T., Speck, P. S. 2005. Factors that affect attitude toward a retail website. Journal of Marketing Theory and Practice, Vol. 13, No. 1, pp 40 - 51 Farag, S., Schwanen, T., Dijst, M., Faber, J. 2007. Shopping online and/or in-store? A structural equation model of the relationships between e-shopping and in-store shopping. Transportation Research Part A, Vol. 41, pp 125 – 141. ELSEVIER.
Hsu, C. 2006. Privacy concerns, privacy practices and web site categories. Online Information Review, Vol. 30, No. 5, pp 569 – 586. EMERALD Insight.

7 0
Huarng, A. S., Christopher, D. 2003. Planning an effective internet retail store. Marketing Intelligence & Planning, ISSN 0263-4503, pp 230 – 238. EMERALD Insight. Jacobs, B., de Klerk, H. 2007. Understanding female consumers’ risks perception for apparel purchasing on the internet. Journal of Family Ecology and Consumer Sciences, ISSN 0378-5254. Vol. 35, pp 47 – 58. Jones, M. Y., Spence, M. T., Vallaster, C. 2008. Creating emotions via B2C websites. Business Horizons, Vol. 51, pp 419 – 428. ELSEVIER. Kim, H., Gupta, S. 2009. A comparison of purchase decision calculus between potential and repeat customers of an online store. Decision Support Systems, Vol. 47, pp 477 – 487. Elsevier. Kimery, K. M., McCord, M. 2002. Journal of Information Technology Theory and Applications, Vol. 4, No. 2, pp 63 – 82. Kolko, J. 2009. How broadband changes online and offline behaviors. Information Economics and Policy. Elsevier. Kovar, S. E., Burke, K. G., Kovar, B. R. 2000. Consumer Responses to the CPA WEBTRUST Assurance. Journal of Information Systems, Vol. 14, No. 1, pp 17 – 35. American Accounting Association. Kucuk, S., Krishnamurthy, S. 2007. An analysis of consumer power on the internet. Technovation, Vol. 27, pp 47 – 56. ScienceDirect. Lian, J. W., Lin, T. M. 2008. Effects of consumer characteristics on their acceptance of online shopping: Comparisons among different product types. Computers in Human Behavior, Vol. 24, pp 48 – 65. ELSEVIER. O’Cass, A., Fenech, T. 2003. Web retailing adoption: exploring the nature of internet users Web retailing behaviour. Journal of Retailing and Consumer Services, Vol. 10, No. 10, pp 81 – 94. ELSEVIER Science Ltd. Pan, Y., Zinkhan, G. M. 2006. Exploring the impact of online privacy disclosures on consumer trust. Journal of Retailing, Vol. 10, pp 331 – 338. Parker, A, 2010. The ins and outs of online shopping. Mercury, 23 March 2010, pp 8. Independent Newspapers, Durban. Ranganathan, C., Ganapathy, S. 2002. Key dimensions of business-to-consumer web sites. Information & Management, Vol. 10, pp 457 – 465. ELSEVIER. Rice, C. E., Katz, J. E. 2003. Comparing internet and mobile phone usage: digital divides of usage, adoption, and dropouts. Journal of Telecommunications, Vol. 27, pp 597 – 623. ELSEVIER.
7 1
Richard, M. O., Chebat, J. C., Yang, Z., Putrevu, S. 2009. A proposed model of online consumer behavior: Assessing the role of gender. Journal of Business Research, Vol. 06862, pp 1 – 9. ELSEVIER. Schoenbachler, D. D., Gordon, G. L. 2002. Multi-channel shopping: understanding what drives channel choice. Journal of Consumer Marketing, Vol. 19, No. 1, pp 42 – 53. EMERALD Group Publishing Limited. Serrao, A. 2010. Unlimited internet: R219 MWEB cuts costs by 40 percent. Daily News, 18 March, pp 1. Independent Newspapers, Durban. Singh, A. M. 2001. The effectiveness of Internet marketing: a management and consumer perspective. Unpublished doctoral thesis, University of Durban-Westville, Durban. Singh, A.M. 2004. Trends in Internet Banking in South Africa. Aslib Proceedings: New Information Perspectives. Vol. 56, No. 3. pp 187 - 196. Emerald Group Publishing Limited. Soopramanien, D. G. R., Robertson, A. 2007. Adoption and usage of online shopping: An empirical analysis of the characteristics of ‘‘buyers’’ ‘‘browsers’’ and ‘‘non-internet shoppers’’. Journal of Retailing and Consumer Services, Vol. 14, pp 73 – 82. ELSEVIER. Wolfinbarger, M., Gilly, M. C. 2003. eTailQ: dimensionalizing, measuring and predicting etail quality. Journal of Retailing, Vol. 3, pp 183 – 198. ELSEVIER.

7 2
APPENDIX 1
ETHICAL APPROVAL

7 3
APPENDIX 2
QUESTIONNAIRE
UNIVERSITY OF KWAZULU-NATAL
Graduate School of Business
Westville Campus
Dear Respondent, Proposed Qualification Research Project Researcher: Mr. P.D. Pillay (031-560 6318) Supervisor: Prof A.M. Singh (031-260 7061) Research Office: Ms P Ximba (031-260 3587) I, Pragalathan D. Pillay am an MBA student, at the School, of the University of
Kwazulu Natal. You are invited to participate in a research project entitled:
Consumer Online Buying Patterns – A South African Perspective. The aim of this
study is to: understand what consumers look for before purchasing from a website,
factors promoting / inhibiting online purchasing, and what do online consumers
buy, where, and how often.
Through your participation I hope to understand: the prevalence of online shopping, the reason(s) why consumers choose / don’t choose to shop online, and to determine what online shoppers purchase, how often online purchases are made, and the value of their online shopping. The results are intended to contribute to and benefit retailers who have an online presence, in that they are aware of the criteria that are important to online purchasers, and the said retailers could gear their web sites to meet these requirements. This research could also benefit consumers who may have the incorrect perceptions of online purchasing to experience a new way of shopping. Your participation in this project is voluntary. You may refuse to participate or withdraw from the project at any time with no negative consequence. There will be no monetary gain from participating in this survey/focus group. Confidentiality and

7 4
anonymity of records identifying you as a participant will be maintained by the Graduate School of Business, UKZN. If you have any questions or concerns about completing the questionnaire or about participating in this study, you may contact me or my supervisor at the numbers listed above. The survey should take you about 5 minutes to complete. I hope you will take the time to complete this survey. If you agree to the above and want to proceed to the questionnaire, please select the I AGREE tab, alternatively to opt out of the questionnaire, please select the I DISAGREE tab
I AGREE I DISAGREE
Sincerely
P.D. PILLAY
I n v e s t i g a t o r ’ s s i g n a t u r e _ _ _ _ _ _ _ _ _ _ _ _ _ _ _ _ _ _ _ _ _ _ _ _ _ _ _ _ _ _ _ _ _ _ _ _ D a t e _ _ _ _ _ _ _ _ _ _ _ _ _ _ _ _ _

7 5
1. Age group:
18-24 25-34 35-44 45-54 55 and over
2. Race:
Black Coloured Indian White
3. Gender:
Male Female
4. Do you shop online?:
Yes No
If you have answered yes to the previous question, please answer the following:
5. Why do you shop online (choose all that apply):
Lower prices
It is convenient
It saves me time
I enjoy a wider variety of products
Some products can only be purchased online
It is easier than physically going to the stores
Other: ________________________________
6. How often do you buy online?:
Never Every week Every month Every 3 months Every 6 months

7 6
7. I usually make the following online purchases (choose all that apply):
Food Accommodation Travel Clothes Books Entertainment Other
8. I usually shop online from the following vendor websites:
Local only
International only
Both local and international
9. I usually do online purchases to the amount of:
R1-R500 R501-R1000 R1001-R1500 R1501-R2000 R2001 - >
10. I look for the following from a website when making online purchases (choose all that apply):
Reputable brand
Secure payment
Reliable delivery service
Simple returns process
Guarantees and Warranties
Clear instructions for purchasing online
Other
11. If you do not shop online, please state the reasons why this is so (choose all that apply):
I don’t have access to the Internet
I don’t trust online sellers
I am afraid of hackers
I don’t have a credit card
I want instant delivery
I like to see and touch what I am buying
Other

7 7
12. Would you shop online in the near future?:
Yes No
13. If yes why (choose all that apply):
Lower prices
Convenience
Wider choice of suppliers
Products not available locally
Other
14. I usually make an online purchase (choose all that apply):
After referral
from a trusted
source
After watching a
T.V. advert
After seeing a
newspaper, catalogue,
handout or advert
Based on online
advertising
Other
Thank you for taking the time to complete the questionnaire.