consumer credits and the efficiency of
160
CONSUMER CREDITS AND THE EFFICIENCY OF MONETARY POLICY IN TURKEY A THESIS SUBMITTED TO THE INSTITUTE OF SOCIAL SCIENCES OF YILDIRIM BEYAZIT UNIVERSITY BY KORAY GÖKSAL IN PARTIAL FULFILLMENT OF THE REQUIREMENTS FOR THE DEGREE OF DOCTOR OF PHILOSOPHY IN THE DEPARTMENT OF ECONOMICS APRIL 2016
-
Upload
khangminh22 -
Category
Documents
-
view
1 -
download
0
Transcript of consumer credits and the efficiency of

CONSUMER CREDITS AND THE EFFICIENCY OF
MONETARY POLICY IN TURKEY
A THESIS SUBMITTED TO
THE INSTITUTE OF SOCIAL SCIENCES
OF
YILDIRIM BEYAZIT UNIVERSITY
BY
KORAY GÖKSAL
IN PARTIAL FULFILLMENT OF THE REQUIREMENTS FOR
THE DEGREE OF DOCTOR OF PHILOSOPHY
IN
THE DEPARTMENT OF ECONOMICS
APRIL 2016


I hereby declare that all information in this thesis has been obtained and presented in
accordance with academic rules and ethical conduct. I also declare that, as required
by these rules and conduct, I have fully cited and referenced all material and results
that are not original to this work; otherwise I accept all legal responsibility.
Name, Last Name: Koray GÖKSAL
Signature:

iv
ABSTRACT
CONSUMER CREDITS AND THE EFFICIENCY OF MONETARY POLICY IN
TURKEY
GÖKSAL, Koray
Ph.D., Department of Economics
Supervisor: Prof. Dr. Fuat OĞUZ
April 2016, 146 pages
The main aim of this study is to understand how the growth of consumer credit has
changed the effect of monetary policy on household consumption in Turkey. For this
purpose, the hypothesis that the growth of consumer credit has weakened the ability of
monetary policy to affect household consumption behavior has been examined with a
variety of empirical evidence. Firstly, the argument that the consumer credit to smooth
consumption makes monetary policy less effective in Turkey has been tested. The
empirical results showed that after the growth in consumer credit volume, consumption
behaves consistently with the permanent income hypothesis. Household behavior is less
sensitive to short-run changes in monetary policy because they can access credit more
easily and smooth their consumption. Secondly, the argument that households are less
liquidity constrained with credit cards and so, monetary policies have no effect on
consumption behavior in Turkey has been tested. According to traditional view of banking
credit channel; consumers using credit card are in a liquidity constraint so, they more
sensitive to the interest rates and also to the monetary shocks. However, the empirical
results shows the opposite of the traditional view. Consumers are not only in a liquidity
constraint but also they use credit cards as an instrument to stabilize monetary policy
shocks.
Keywords: Consumer credits, Credit cards, Consumption smoothing, Permanent Income

v
ÖZET
TÜRKİYE'DE TÜKETİCİ KREDİLERİ VE PARA POLİTİKASININ ETKİNLİĞİ
GÖKSAL, Koray
Doktora, İktisat Bölümü
Tez Yöneticisi: Prof. Dr. Fuat OĞUZ
Nisan 2016, 146 sayfa
Bu çalışmanın temel amacı; Türkiye'de tüketici kredilerindeki büyümenin, para
politikasının hanehalkı tüketimi üzerindeki etkisini nasıl değiştirdiğini anlamaktır. Bu
amaç doğrultusunda; tüketici kredilerindeki büyümenin bir sonucu olarak para
politikasının hanehalkı tüketici davranışlarını etkileme kabiliyetinin azaldığı hipotezi
çeşitli ampirik kanıtlar eşliğinde incelenmiştir. İlk olarak, Türkiye'de tüketici kredilerinin
tüketim düzleştirmesi yoluyla para politikasının etkinliğini azalttığı iddiası test edilmiştir.
Ampirik sonuçlara göre; tüketici kredilerindeki büyüme sonrası tüketim davranışı sürekli
gelir hipoteziyle tutarlılık göstermektedir. Hanehalkları kredilere eskisine göre çok daha
kolay ulaşabildiği ve tüketim düzleştirmesi yaptıkları için para politikasındaki kısa dönemli
değişimlere çok daha az duyarlıdırlar. İkinci olarak, Türkiye'de kredi kartı kullanan
hanehalklarının daha az likidite kısıtı içinde oldukları ve dolayısıyla para politikasının
tüketici davranışları üzerinde bir etkisi olmadığı iddiası test edilmiştir. Banka kredi
kanalının geleneksel görüşüne göre; tüketici kredisi kullanan tüketiciler likidite kısıtı
içinde olup faiz oranlarına ve parasal şoklara karşı çok daha duyarlıdırlar. Buna karşın
ampirik sonuçlar geleneksel görüşün tam tersini ortaya koymaktadır. Kredi kartı kullanan
tüketiciler likidite kısıtı içinde olmadıkları gibi, kredi kartlarını para politikası şoklarına
karşı bir dengeleme aracı olarak kullanmaktadırlar.
Anahtar kelimeler: Tüketici kredileri, Kredi kartları, Tüketim düzleştirmesi, Sürekli gelir

vi
To My Family...

vii
ACKNOWLEDGMENTS
I would like to thank Prof. Dr. Fuat Oğuz as my supervisor and mentor for the support,
guidance, sense of humor and friendship which remain to this day invaluable.
I also would like to thank my committee, Assoc. Prof. M. Murat Arslan, Assoc. Prof. K. Ali
Akkemik, Asst. Prof. F. Cemil Özbuğday, Asst. Prof. Ö. Hakan Aydoğmuş for all of their
support and insights to my study.
I would also like to thank my family. To my father, mother and sister Pınar, for all the
support they have shown over my lifetime. To my grandparents, aunts and cousins, Ahmet
Can and Kayra, I want to include you in my thanks for the support and kindness you have
given me.
Most of all I would like to thank my wife who have provided endless love and support
throughout this PhD. I dedicate this thesis to my wife Nevin for her great encouragement,
belief and patience.
Finally, I would like to thank my daughter, Derin, who joined me on this adventure in the
last stages. I could not write this thesis without your inspiration.
This thesis is as much yours as it is mine.

viii
TABLE OF CONTENTS
ABSTRACT ......................................................................................................................... iv
ÖZET ..................................................................................................................................... v
ACKNOWLEDGMENTS ................................................................................................... vii
TABLE OF CONTENTS ................................................................................................... viii
LIST OF TABLES ............................................................................................................... xi
LIST OF FIGURES ............................................................................................................. xii
LIST OF ABBREVIATIONS ............................................................................................ xiv
1. INTRODUCTION ........................................................................................................... 1
2. MONETARY POLICY AND MONETARY TRANSMISSION MECHANISMS ..... 11
2.1. Introduction ....................................................................................................... 11
2.2. Monetary Transmission Mechanism ................................................................. 12
2.3. Keynesian and Monetarist Views ...................................................................... 13
2.3.1. The Keynesian View .................................................................................. 13
2.3.2. Monetarist View ........................................................................................ 14
2.4. The Channels of Monetary Transmission Mechanism ...................................... 15
2.4.1. Interest Rate Channel ................................................................................. 15
2.4.2. Exchange Rate Channel ............................................................................. 17
2.4.2.1. Transmission of Exchange Rate on Net Exports ................................... 19
2.4.2.2. Transmission of Exchange Rate on Balance Sheet ............................... 19
2.4.3. Stock Channel ............................................................................................ 20
2.4.3.1. Stock Prices Channel ............................................................................. 20
2.4.3.2. Wealth Channel ..................................................................................... 21
2.4.4. Credit Channel ........................................................................................... 22
2.4.4.1. Bank Credit Channel ............................................................................. 23
2.4.4.1.1. Dependency to Banks ..................................................................... 25
2.4.4.1.2. Changes in Monetary Policy........................................................... 26
2.4.4.2. Balance Channel .................................................................................... 26

ix
2.4.4.2.1. Cash Flow Channel ......................................................................... 28
2.4.4.2.2. Unexpected Price Level Channel ................................................... 29
2.4.4.2.3. Household Balance Effects Channel .............................................. 29
2.4.5. Expectation Channel .................................................................................. 30
2.5. Indicators of Monetary Transmission Mechanism ............................................ 32
2.5.1. Direct Interventions ................................................................................... 32
2.5.2. Price Elasticity ........................................................................................... 33
2.5.3. Competition in Financial System ............................................................... 33
2.5.4. Structure of Banking System ..................................................................... 34
2.5.5. Exchange Rate Regime .............................................................................. 35
2.5.6. Financial Position of Debtors .................................................................... 35
3. MONETARY TRANSMISSION MECHANISM: CREDIT CHANNEL .................... 37
3.1. Introduction ....................................................................................................... 37
3.2. Asymmetric Information Problem .................................................................... 37
3.2.1. Adverse Selection ...................................................................................... 40
3.2.2. Moral Hazard ............................................................................................. 41
3.3. Credit Rationing ................................................................................................ 42
3.4. Credit Crunch .................................................................................................... 44
4. CONSUMER CREDITS ............................................................................................... 46
4.1. Introduction ....................................................................................................... 46
4.2. Description of Consumer Credit ....................................................................... 46
4.3. Historical Development of Consumer Credit .................................................... 47
4.4. Types of Consumer Credit ................................................................................ 48
4.5. Consumer Credits in Turkey ............................................................................. 48
4.6. Development of Consumer Credits in Turkey .................................................. 49
4.7. Sub Items of Consumer Credits in Turkey ........................................................ 51
4.7.1. Housing Credits ......................................................................................... 51
4.7.2. Auto Credits ............................................................................................... 53
4.7.3. Personal Credits and Other Credits ............................................................ 55
4.7.4. Personal Credit Cards ................................................................................ 57
4.8. Expansion in Consumer Credits in Turkey ....................................................... 60
4.9. Consumer Credits and Banks in Turkey ........................................................... 65
5. CONSUMPTION SMOOTHING AND THE CONSUMER BEHAVIOR .................. 78

x
5.1. Introduction ....................................................................................................... 78
5.2. The Permanent Income Hypothesis................................................................... 79
5.2.1. Description of Permanent Income Hypothesis ......................................... 79
5.2.2. Hall's Euler Equation Test ......................................................................... 81
5.2.3. Liquidity Constraints ................................................................................. 83
5.3. Econometric Methodology ................................................................................ 87
5.4. Findings ............................................................................................................. 88
5.5. Comments.......................................................................................................... 92
5.6. Identifying Structural Break .............................................................................. 92
5.7. Conclusion ......................................................................................................... 96
6. CREDIT CARDS AND LIQUIDITY CONSTRAINTS ............................................... 98
6.1. Introduction ....................................................................................................... 98
6.2. Econometric Methodology ................................................................................ 99
6.3. Credit Card Liquidity ...................................................................................... 100
6.4. Estimating The Impulse Response Functions ................................................. 101
6.4.1. VAR Model .............................................................................................. 101
6.4.2. Unit Root Test .......................................................................................... 102
6.4.3. Cointegration Test .................................................................................... 105
6.4.4. Granger Causality .................................................................................... 107
6.4.5. The Geweke Test ..................................................................................... 108
6.4.6. The Impulse Response Functions ............................................................ 110
6.4.6.1. Response of Credit Card to a Contractionary Monetary Policy .......... 111
6.4.6.2. Response of Credit Card to an Expansionary Monetary Policy .......... 113
6.4.6.3. Response of Consumption to the Monetary Policy ............................. 115
6.5. Conclusion ....................................................................................................... 117
7. CONCLUSION ........................................................................................................... 118
REFERENCES .................................................................................................................. 121
APPENDIX A - TURKISH SUMMARY ......................................................................... 128
APPENDIX B: CURRICULUM VITAE .......................................................................... 145

xi
LIST OF TABLES
Table 1. Annual Growth Rate as per Credit Types (%) ...................................................... 64
Table 2. Annual Growth Rate as per Credit Types corrected as per PPI (%) ..................... 64
Table 3. Bank Concentration in Consumer Credits ............................................................. 67
Table 4. Consumer Credits Except Housing in the World (billion €) ................................. 69
Table 5. Bank Concentration in Housing Credits ................................................................ 71
Table 6. Housing Credits in the World (billion €) ............................................................... 73
Table 7. Bank Concentration in Credit Cards ..................................................................... 75
Table 8. Credit Card Transaction Volumes in the World (billion €) ................................... 77
Table 9. Estimation of Consumption from 1995 to 2006 .................................................... 89
Table 10. Estimation of Consumption from 1995 to 2014 .................................................. 89
Table 11.Estimation of Consumption from 2006 to 2014 ................................................... 90
Table 12. Estimation of Consumption from 1995 to 2004 (Using Credit Cards) ............... 90
Table 13. Estimation of Consumption from 1995 to 2014 (Using Credit Cards) ............... 91
Table 14. Estimation of Consumption from 2004 to 2014 (Using Credit Cards) ............... 91
Table 15. Empirical Results of the HLT Test ...................................................................... 96
Table 16. Estimated Parameters of the HLT Test ............................................................... 96
Table 17. ADF Unit Root Test Results.............................................................................. 104
Table 18. PP Unit Root Test Results ................................................................................. 105
Table 19. Cointegraion Test Results ................................................................................. 106
Table 20. Granger Causality Test Results ......................................................................... 107
Table 21. Geweke Frequency Decomposition for CCB and IR ........................................ 109
Table 22. Geweke Frequency Decomposition for CCL and IR ........................................ 110

xii
LIST OF FIGURES
Figure 1. Consumer Credits and Personal Credit Cards (million TRY) .............................. 50
Figure 2. Share of Consumer Credits Among Total Credits (%) ........................................ 51
Figure 3. Development of Housing Credits within Years (million TRY) ........................... 52
Figure 4. Share of Housing Credits Among Consumer Credits (%) ................................... 53
Figure 5. Development of Auto Credits within Years (million TRY)................................. 54
Figure 6. Share of Auto Credits Among Consumer Credits (%) ......................................... 55
Figure 7. Development of Personal and Other Credits within Years (million TRY) .......... 56
Figure 8. Share of Personal and Other Credits Among Consumer Credits (%) .................. 57
Figure 9. Development of Personal Credit Cards within Years (million TRY) .................. 59
Figure 10. Share of Personal Credit Card Among Consumer Credits (%) .......................... 60
Figure 11. Ratio of Total Credits to GDP (%) ..................................................................... 61
Figure 12. Ratio of Consumer Credit, Housing Credit and SME Credit to GDP (%) ......... 61
Figure 13. Expansion Periods of Total Credits (%) ............................................................ 62
Figure 14. Expansion Periods of Consumer Credits (%) .................................................... 62
Figure 15. Ratio of Transaction Volume of Credit Cards to GDP (%) ............................... 63
Figure 16. Expansion Periods of Transaction Volume of Credit Cards (%) ....................... 63
Figure 17. Credit Rate Coefficient for Total Credits (nominal and US dollar) ................... 65
Figure 18. Credit Rate Coefficient for Total and Consumer Credits (nominal) .................. 65
Figure 19. Concentration as per Scale in Consumer Credits ............................................... 68
Figure 20. Concentration as per Function in Consumer Credits ......................................... 68
Figure 21. Concentration as per Scale in Housing Credits .................................................. 72
Figure 22. Concentration as per Function in Housing Credits ............................................ 72
Figure 23. Concentration as per Scale in Credit Cards........................................................ 76
Figure 24. Concentration as per Function in Credit Cards .................................................. 76
Figure 25. Impulse Response of Credit Card Balances to a Contractionary ..................... 112
Figure 26. Impulse Response of Credit Card Liquidity to a Contractionary ..................... 113
Figure 27. Impulse Response of Credit Card Balances to an Expansionary ..................... 114

xiii
Figure 28. Impulse Response of Credit Card Liquidity to an Expansionary ..................... 114
Figure 29. Impulse Response of Consumption to a Contractionary Monetary Policy ...... 116
Figure 30. Impulse Response of Consumption to an Expansionary Monetary Policy ...... 116

xiv
LIST OF ABBREVIATIONS
ADF Augmented Dickey-Fuller
BIS The Bank for International Settlements
BRSA Banking Regulation and Supervision Agency
CBRT Central Bank of the Republic of Turkey
CCB Credit Card Balance
CCL Credit Card Liquidity
CPSS The Committee on Payment and Settlement Systems
EU European Union
GDP Gross Domestic Product
HLT Harvey-Leybourne-Taylor
ICC Interbank Card Center
PP Phillips-Perron
PPI Producer Price Index
PRC People's Republic of China
SME Small and Medium Sized Enterprises
USA United States of America
VAR Vector Autoregression

1
CHAPTER 1
INTRODUCTION
The main aim of this dissertation is to understand how the growth of consumer credit has
changed the effect of monetary policy on household consumption in Turkey. I show with a
variety of empirical evidence that the growth of consumer credit has weakened the ability
of monetary policy to affect household consumption behavior.
In fact, ability of monetary policy to affect household consumption is described in the
"household balance effects channel" in literature. Household balance effects channel is one
of the varieties of the monetary transmission mechanisms. Monetary transmission
mechanisms explain how monetary policy affect national product via what kinds of
variables. For a successful application, policy makers need to know how monetary policy
affect economy by following which transmission channel. Therefore, monetary
transmission mechanisms may be a good starting point for this dissertation. In chapter 2,
monetary transmission mechanisms have been introduced in general terms and phases gone
through in 2008 after global finance crisis and banking crisis in Turkey in 2001
encountered by monetary transmission mechanisms have been researched.
In literature, transmission mechanisms of monetary policy has been classified in various
types. While some of those are talking about portfolio arrangements, wealth effects and
credit, others have classified those differently as quantity theory channel. Taylor (2000)
has classified different theories of monetary transmission mechanisms’ into two main
categories; interest rate and exchange rate channels as monetary view and credit channel as
an alternative to monetary view. However, in Chapter 2, channels of monetary
transmission mechanism listed as interest rate channel, exchange rate channel, stock
channel, credit channel and expectations channel. It is not possible to separate channels of

2
monetary transmission channel from each other clearly. The channels affect and complete
each other in general.
Interest rate channel is the best known mechanism in the monetary transmission literature.
A change that monetary authority will do in short term interest rates affect investment
approach of companies and durable consumption products of household expenses by
affecting direct capital use cost. In the literature of monetary policy, this interaction
process is stated with interest rate channel of monetary transmission concept.
However, increasing of externality of economies and using of flexible exchange rate
systems commonly have increased the importance of exchange rate channel in monetary
transmission mechanism recently. Exchange rate channel states the change in real
production from the effect of monetary policy on exchange rates because of reflecting net
export (Horvath and Maino, 2006). Strength of exchange rate channel depends on
sensibility of exchange rate to monetary shocks and openness level of economy. As
openness level of country is high so exchange rate channel is effective in monetary
transmission mechanism. There are two main transmissions of exchange rate on theoretical
process. These are the transmission of exchange rate on net exports and the transmission of
exchange rate on balance sheet.
Monetarists put emphasis on other relative asset or stock prices and economic effects of
real wealth about monetary transmission in general. In literature, this effect is defined as
stock prices channel. Accordingly, there are two channels involving stock prices in
monetary transmission mechanism. These are stock prices channel and wealth effect. In the
process of asset prices, the effect of monetary policy on investments is defined with q
theory of Tobin and the effect on consumption is defined with life cycle theory of
Modigliani.
Some economists supposed that monetary transmission mechanism which explains
changes in monetary policy affect economic activities by changes in money supply,
interest rates or asset prices is insufficient (Bernanke and Gertler, 1995). As a result of this,
Bernanke (1983) has stated that finance corporations have effect on economy and roles of
banks in transmission mechanism has been attracted attention. This approach is defined as
the credit channel of monetary transmission channel in the literature.

3
Credit channel approach focuses on lack of information, operation costs and credit sizes.
Credit channel emphasis on the effects of lack of knowledge between fund supply and
demand providers on transmission mechanism. Market failure is explained by adverse
selection and asymmetric knowledge concepts in this approach. Rise in operability of
credit channel after 2011 crisis in Turkish economy has been observed. In the past, because
of high budget deficits and real interest rates, banking sector imposed restriction and it did
not give long term credit and reasonable interest rate to especially small and middle scale
businesses. However, structural reforms after crisis, banks returned financial mediation
activities instead of finance of government expenses because of the reasons which are low
interest rates in developed countries, the increasing liquidity and fall of real interest rate.
Therefore, total demand and inflation which banks have used depending on changes in
policy interest rates begins to be affected.
It has been claimed that credit channel of monetary transmission mechanism includes two
mechanisms which define analysis of relationship between changes in monetary policy and
the growth of external sources premium (Fountas and Papagapitos, 2001). In other words
monetary policy has an effect on real economic activities in two ways. First of all, the
credit channel which affects bank credit supply given to dependent companies; second,
balance channel which lead to change in real production by affecting balances of debtors.
One of the variety in the credit channel of monetary transmission mechanisms is the
household balance effects channel. Examining and providing evidences about the
functioning of this channel is the subject of this dissertation. Although most of the credit
channel literature is focused on expenses by companies, this channel takes consumption
expenses made by households and especially durable consumption goods into
consideration.
The decline in bank credits resulted from monetary contraction leads to a fall in durable
goods bought by consumer who cannot apply other credit resources. Similarly, increases in
interest rates lead balance of household to deteriorate. Another way to see how balance
channel affect consumers is to take liquidity effect on durable consumption goods and
household expenses into consideration. Balance channel in approach of liquidity effect
works via the effects of consumers on expense request rather than lending request of
lenders. Because of asymmetric information regarding credit qualities, these are durable
consumption goods and the assets which are not household liquid (Mishkin, 1996).
4
The last channel of monetary transmission mechanisms discussed in Chapter 2 is the
expectation channel. According to expectation channel, all variables whose have
periodical results and determined rewardingly have been affected from expectations of
economic units against shocks that may happen in the future. In this case expectation
channel can be considered as periodical type of interest rate channel, asset price channel
and credit channel. In case of that it has been announced monetary power embarked on
monetary application which is not supported by in current period, market expectation will
be adapted, the change taken place as result of financial markets lead to change in
production and inflation at the end.
Monetary transmission mechanism channels affect various variables in different speeds
and densities. For this reason, when researching effect of monetary policies on real sector,
the giving answers of that the effects of transmission channels are same or not in all
economies or which features of economies determine transmission mechanism channel
function and relative importance (Loayza and Hebbel, 2002). The components that
determine efficiencies of monetary transmission mechanisms is the last part of Chapter 2.
In Chapter 3, credit channel will be investigated in more detail which is one of the
transmission mechanisms discussed in the Chapter 2. First of all, asymmetric information
subject is handled because of its role in the monetary transmission mechanism of credit
channel, determinant problems which appears depending upon asymmetric information of
credit market. Adverse selection and moral hazard as two different kind of asymmetric
information is also discussed in Chapter 3. Credit rationing and credit crunch topics will be
in this Chapter because of the close relationship with the credit channel.
Asymmetric information concept is a case of economic units interact with each other that
one side have more information than the other side. In the case of the information has
become asymmetric, the side which has more information have the edge over unfairly. For
instance, when buyer doesn’t know about the quality of the product as much as the seller, it
refers an asymmetric information between the parties.
Asymmetric information in credit markets results from that borrower who demand fun
mostly has more information than potential debt provides about investment that fund will
be provided and it may appear before performing an operation (ex-ante asymmetric
information) and after performing an operation (ex-post asymmetric information). Before

5
credit provided, asymmetric information appears when credit institution could not
distinguish between borrowers have high and low risk in the case of ability of repayment
of credit. (Claus and Smith, 1999). In credit markets, before performing a procedure when
asymmetric information comes into question causes an adverse selection problem, after
performing a procedure it causes a moral hazard problem.
Adverse selection appears only when too risky borrowers remain in credit market due to
rise of interest rate. Return that lender corporations expect primarily depend on the
possibility of repayment of credit. Therefore, for banks and other lender corporations it is
highly important determine among credit demanders who have high probability of
repayment. It is quite difficult for bank to distinguish good quality borrowers among credit
demanders and to be able to do this several screening tool usage is needed. The observed
problems in the American mortgage market have the most distinct features of the adverse
selection problems.
Moral hazard in credit markets comes out before signing credit contract between the ones
who offer credit and demand credit, symmetric information has transformed into
asymmetric information because borrowers did not use credits within the compass of
condition stated in the agreement and this situation could not have been observed by
creditors.
Asymmetric information problem leads to credit rationing behavior of banks. Credit
rationing is defined that the party who demand credit supply in credit market does not give
credit as much as demanding, gives less or would not like to give credit as much as
requested, and as credit rationing in credit market (Homa and Jaffee, 1971). Credit
rationing, is to decrease excessive demand if excessive credit demand is in question in
credit markets to provide profit maximization of credit demanders in order to keep interest
rates of credit in specific level by creating shrink in credit amounts (Jaffee and Russell,
1976).
The last topic of Chapter 3 is the credit crunch. Credit crunch is defined as a great
regression in credit supply. When experiencing credit crunch, the relationship between
credits and interest rate changes. Credit crunch emerged in two different ways. First of all
is the decreasing of credit supply on determined interest rates. Second is allocating credit.

6
In Chapter 4, the development of consumer credits in Turkey as per years and their current
state will be presented. The results obtained will provide a foundation for the analyses to
be performed in the following chapters.
Consumer credits may be specified as a type of credit that the real persons may use in
order meet all their necessities beyond commercial purpose. Consumer credits may get
different names as being re-arranged -by the institutions making credit available- in
accordance with the requirements of the individual or as per the intended use. The most
widespread ones are housing credits, auto credits and personal credits. Besides these, the
credits used for financing of education, marriage or any other requirement.
The decrease in interest rates and the financial stability environment in economy that
occurred in Turkey following the crisis of 2000-2001 had caused the increase of consumer
credits that had been made available along with the effect of positive atmosphere in global
markets. The increase of consumption and spending tendency of household had also
supported the development in subject, and the share of consumer credits among total
credits had showed an increase.
The housing credits had reached to about 114 billion TRY by the end of 2014. The share of
housing credits among consumer credits is at the level of about 40 percent. The auto credits
had been 6 billion TRY in 2014. The share of auto credits among consumer credits is only
2 percent in 2014. The personal and other credits had increased to 147 billion TRY in
2014. The personal credits and other credits is the credit type having the highest share
among consumer credits and it is about 55 percent in 2014.
Chapter 4 also provide information about credit cards in Turkey. Even if consumer credits
actually seems as a type of consumer credits, the credit cards are showing features different
from consumer credits either by their usage volume or by the options they provide. In
Turkey, either the number of credit cards or the usage volumes of credit cards are showing
a continuous increase by years. The numeral dimension it had reached is taking the
personal credit cards to a significant position in the banking and credit system of Turkey.
As per the data of ICC, the number of credit cards had significantly increased in years and
it has reached about 57 million units in 2014. The amount of personal credit card
transaction had increased to 72 billion TRY in 2014. Personal credit card transaction is
forming 30 percent of the total consumer credits in 2014.

7
Another topic discussed in Chapter 4 is the evidences of consumer credit expansion in
Turkey. The ratio of consumer credit volume to national income is being deemed as an
indicator of consumer credit expansion. The ratio of consumer credits to GDP in 2014 is
about 14 percent. The ratio of credit card transaction volume to GDP also shows increase
in years in Turkey. While the ratio of transaction volume of credit cards to GDP was about
22 percent in 2009, that rate had been 27 percent in 2014. BRSA (2012) in order to
measure whether the credit volume is following a course except the expected trend, had
performed an analysis. According to this analysis, BRSA has found no significant credit
expansion occurs in total credits. In spite of this, it is being seen that consumer credits had
significantly expanded in years 2002, 2006 and 2011. Similarly, a significant expansion is
being observed in credit card transaction volumes in years 2004 and 2012.
We can more clearly assess the increase observed in consumer credits by comparing it with
the increase in commercial credits. While the annual real increase in commercial credits
had been 17.1%, that rate had been 26.6% in consumer credits between 2009 and 2014.
The growth rate in consumer credits had been realized higher than the growth rate in
commercial credits in many of the years in the same period.
In Chapter 5, the hypothesis that consumer credit to smooth consumption makes monetary
policy less effective in Turkey will be examined. According to the hypothesis, after the
growth in consumer credit volume, consumption behaves consistently with the permanent
income hypothesis.
Hypothesis in this Chapter will be tested by Ludvigson’s (1999) model over the years 1995
through 2014 for total credits and for credit cards. For subsample, between years 2006 and
2014, total consumer credit cannot forecast the consumption growth. Likewise, for
subsample, between years 2004 and 2014, credit cards cannot forecast the consumption
growth too. In this Chapter results of structural break tests for consumer credit will also be
reported. The methods of Harvey, Leybourne and Taylor (2006) has been used for the
structural break. The test indicates that structural breaks occurred in 2006 for total
consumer credits and in 2004 for credit cards.
According to the permanent income hypothesis, consumption depends only on permanent
income. Consumers distribute their consumption based on the marginal rate of substitution
between consumption today and consumption tomorrow. Consumers will only adjust its

8
consumption based on how the current income affects the permanent income. If the
consumer expects the high income today will be matched by a low income tomorrow, then
consumption today will not change. Conversely, if the rise in income today represents a
new permanent level of income, then consumption will increase.
The contribution of Hall (1978) in this Chapter was to formalize the stochastic implications
of the permanent income hypothesis. If consumers maximize expected future utility, the
conditional expectation of marginal utility is only a function of the current level of
consumption. Marginal utility follows a random walk, which implies that consumption
does as well. The optimizing consumer uses all available information each period about
current and future earnings to determine the current level of consumption. If the consumer
fails to adjust consumption immediately, then the adjustment will take place later, implying
the consumer is responding to old news. This runs counter to the assumption that the
consumers react immediately to an expected change in income (Carroll, 2001).
The results in Chapter 5 are consistent with hypothesis, where the growth in consumer
credit is associated with a decline in the lending channel of the monetary policy
transmission mechanism. When households have an easier time obtaining credit they can
smooth consumption during recessions, periods of financial distress, or during periods of
contractionary monetary policy. In other words, consumer behavior is able to come closer
to the conception of the permanent income hypothesis. As Hall (1978) argues, aggregate
demand policy that only has an effect on transitory income will have little to no effect on
consumption when households are able to borrow in anticipation of the change in income.
The results here suggest consumers are able to do this more in line with Hall’s expectation.
Factors such as liquidity constraints (liquidity constraints are defined as a quantity
constrain and reveals when a borrower does not receive a certain amount of credit) are less
important in Turkey. In this view, households can access credit more easily and smooth
consumption. So, household behavior is less sensitive to short-run changes in monetary
policy than in previous years.
The main aim of Chapter 6 to show that households are less liquidity constrained with
credit cards and so, monetary policies have no effect on consumption behavior in Turkey
from 2002 through 2014 by using the unused portion of credit card lines data. According
to traditional view of banking credit channel, consumers using credit card are more
sensitive to the interest rates and also to the monetary shocks. However, the empirical

9
results in this chapter show the opposite of the traditional view. Consumers are not only in
a liquidity constraint but also they use credit cards as a shield to offset monetary policy
shocks. According to the findings in this chapter we can say that, monetary policies which
purposes to slow the credit card borrowing has a minor effect on consumption behavior.
In recent studies, credit cards can sign the liquidity constrained borrowers. However; the
empirical study in this chapter shows that the increasing interest rate has no effect on
accessing credits for households. So, the policies of the central bank are not constrained the
borrowers to obtain credits. In the sample period between 2002 and 2014, credit card usage
has increased and this situation has made the households more liquid and conducted them
to consumption smoothing. If we look at this idea from the perspective of monetary policy;
if Central Bank apply a contractionary monetary policy, credit card liquidity increases
consistent with consumption smoothing. However, if Central Bank apply an expansionary
monetary policy, credit card borrowing will also increase.
In Chapter 6, the impulse response functions of credit card balances and credit card
liquidity to a change in monetary policy have been also estimated. The response of the
credit liquidity to both contractionary and expansionary policy has been tested. We aim to
test the two hypotheses by estimating the impulse response functions of credit card
balances and credit card liquidity.
First; credit card borrowing households are more sensitive to a change in monetary policy
and so, the monetary policy of the Central Bank in Turkey is more efficient for at least on
consumers. This hypothesis strongly defends by Bernanke and Gilchrist (1995) and
Bernanke, Gertler and Gilchrist (1996). According to them, after the contractionary policy
of Central Bank, the accessing to credit cards and also consumption spending decreases.
So, the contractionary policy of the Central Bank spreads to the overall economy by the
transmission mechanism of balance sheet as discussed in Chapter 1.
Second; credit card borrowing households are less sensitive to a change in monetary policy
and so, monetary policy of Central Bank in Turkey is less efficient for at least on
consumers. According to this hypothesis, credit cards provide consumers liquidity. After
the contractionary policy of Central Bank, consumers can access credit card liquidity easily
and credit card borrowing increases. So, consumption will not decline, after the
contractionary policy of Central Bank.

10
The impulse response functions are calculated from a five variable system. As a typical
approach for calculating impulse response functions from this system, a vector
autoregression (VAR) model has been used. Unit root, Cointegration, Granger causality
and Geweke decomposition tests have also presented in this Chapter.
The impulse response functions provide new evidence about the effects of monetary
policy. Contractionary monetary policy appears to be delayed by the increase in credit card
borrowing and credit card liquidity, while expansionary monetary policy has a stimulative
effect on credit card markets. However, the latter does not appear to translate into a
stimulative effect for consumption.
The impulse response functions for credit card balances and credit card liquidity in
response to a contractionary policy shock suggest that the propagation of monetary policy
through household balances sheets is inhibited by the use of credit cards. Credit card
borrowing provides a means to keep consumption constant in a contractionary policy
environment. However, the response of credit card liquidity indicates that credit card
markets provide households with liquidity even when economic conditions might
otherwise be worsening. Hence, these factors make the transmission mechanism less
effective. Finally, Chapter 7 wraps up with concluding remarks.

11
CHAPTER 2
MONETARY POLICY AND MONETARY
TRANSMISSION MECHANISMS
2.1. Introduction
Economics policies basically consist of total of fiscal and monetary policies. Fiscal policy
states formalizing revenue collection and spending methods to make employment and
development of governments. Monetary states decisions that made central banks to reach
aims like price stability and financial stability by using various materials.
Before 1970s, monetary policy that uses other policies as supporting components to reach
sustainable growth and full employment aims has reached a structure which its main aim is
to provide price stability after high inflation process that began with oil shock experienced
in 1970s. In addition, it has emerged as a requirement that to what extent and how affect
economy in this term via policies applied by central policies to provide their aims. In this
context, in order to identify how it affect economic activity and inflation and determine
active political tool, studies that reveal process of monetary transmission mechanism
beginning from 1980s has accelerated.
In classical meaning, monetary transmission mechanism that shows that to affect total
demand of monetary variables, with output gap and inflation to what extent and with which
channels, has transformed into more comprehensive structure involving different influence
areas like expectation and exchange rate channel, credit growth based on traditional
interest rates. However, so many factors like financial systems structure and deepness, the
role of public on economy, index of openness of economies make monetary transmission
mechanism vary from country to country and changes that occurred in economic structure

12
globally and locally lead also monetary transmission mechanism become different. (CBRT,
2013).
In this section, monetary transmission mechanisms have been introduced in general terms
and phases gone through in 2008 after global finance crisis and banking crisis in Turkey in
2001 encountered by monetary transmission mechanisms have been researched.
2.2. Monetary Transmission Mechanism
Monetary transmission mechanisms explain how monetary policy affect national product
via what kinds of variables. For a successful application, policy makers need to know how
monetary policy affect economy by following which transmission channel.
According to Hubbard (1994), new developments in financial markets and liberalization
studies incapacitated available monetary transmission mechanism, it had been required to
consider the effect of monetary policies on economy in different angles. Especially after
financial liberalization, the increase of relationship between finance and real sector led
traditional transmission mechanisms to explain economical circuit insufficiently.
For this reason, credit channel involving asymmetric information flow and financial
intermediary has claimed. Therefore, economists who are supporter of traditional view
defined as monetary view have supported that the effect of monetary policy on real
economy has been provided via the change by monetary policy in capital cost, the ones
who claim that the function of credit is more on real economy have said that this effect was
made by financial intermediaries.
In literature, influence channel of monetary policy has been classified in various types.
While some of those are talking about portfolio arrangements, wealth effects and credit
presence, others have classified those differently as amount theory channel (directly
mechanism), interest rate effect and expectations. Another classification consists of
traditional interest rates channels, other active prices channel and credit channel. Taylor
(2000) has classified different theories of monetary transmission mechanisms’ into two
main categories; two credit view that consists of interest rate and exchange rate channels as
monetary view and credit view an alternative to monetary view.

13
2.3. Keynesian and Monetarist Views
Before go analyzing the channels of monetary transmission mechanism, we need to state
two main views related to working mechanism of monetary transmission mechanism in
literature.
2.3.1. The Keynesian View
With economic crisis stated as Great Depression in 1930s, the view which the effect of
fiscal policies on economic activity in economic view is more effective that monetary
policies have gained importance. This approach developed under the leadership of John
Maynard Keynes has been approved by policy makers and has succeeded to prevent
inflation and unemployment issues until 1970s. According to Keynesian view, the most
important tool of monetary policy is interest rates. Monetary policy applications will be
effective on demand if it affects interest rates (CBRT, 2013).
Keynes, who attaches great importance to the substitution relationship between monetary
and the other financial actives, in other words though that the alternative of money is
financial actives has claimed that expanded money warned active intakes if money stock is
increased and decreased interests, when interests decline, preferences develop in direction
of money attitude. Thus, the change in money amount affect actives kept in portfolio, for
this reason the Money kept changes. On the other hand, the relationship between
consumption and investment expenditures do not seem stronger.
According to Keynes, the success of monetary policy depends on the interest rate
flexibility and interest rate of investment demand is high. In the contrary case, that interest
flexibility of monetary demand is high and interest flexibility of investment is low will
limit the effect of monetary policy on real sector.
Substitution effect in portfolio choosing model of Keynes attaches importance to “Money-
interest rate investment” relationship. Keynes has defended that interest rate will show
awareness to the change Money supply except “liquidity trap” location and this will affect
investments. In addition to this, he has claimed that interest flexibility of investments is
low, in other words marginal efficiency of investments is quite vertical and he suggested

14
that the sensitivity of investments to interest can only be against long term interest rates
that do not much more change.
2.3.2. Monetarist View
A group of economists most notably Milton Friedman called monetarists in the 1960s have
claimed that it is insufficient to explain effects of monetary policy on total demand with
only the relationship between interest rates and investment expenditures and monetary
policy affects total demand with so many channels except interest rates of monetary policy.
In addition to this, unlike the Keynesian view, they have suggested that there is a weak
relationship between nominal interest rates and investments expenditures, borrowing and
investments decisions have been made by reviewing real interest rates instead of nominal
(CBRT, 2013).
In the monetarist approach, money is considered different from other financial actives and
it has been specified that it is more important. In this regard, it has been claimed that
financial intermediaries which create Money are more important that other intermediary
establishments. This privilege of Money is related to real balance effect even relative price
change and adaptation processes resulted from these changes. According to this process, if
it is as a matter of increase in the money supply, it has been predicted that money stock
will increase in proportion to other local and foreign asset stock and its marginal benefit
will change in proportion to these other assets, bank reserves will reevaluate their
approaches to equalize benefits of other assets; and it has been stated that it will include
those changes to vary so many relative prices (Meltzer, 1995).
At the end of a change in money supply, in this approach which there will be significant
changes in relative prices in addition to interest rates, it can also change as a result of
monetary policy applies in other type of expenditures except investments. Wealth and
substitution effects created with withdrawing monetary policy from balance affect demand
composition, portfolio composition and amount and composition of production. In short,
unlike views about process of transmission mechanism of Keynesians, even if money
supply changes do not affect finance sector via interest rate, have an effect on real sector
via relative price changes, in other words it has been emphasized that there is a direct
relationship between money supply and income (Cargill, 1990).

15
2.4. The Channels of Monetary Transmission Mechanism
In this section, the subjects which consist of the channels of monetary transmission
mechanism listed as interest rate channel, exchange rate channel, stock channel, credit
channel and expectations channel will be examined. It is not possible to separate channels
of monetary transmission channel from each other clearly, it has been approved that the
channels affect and complete each other in general.
2.4.1. Interest Rate Channel
A change that monetary authority will do in short term interest rates affect investment
approach of companies and durable consumption products of household expenses by
affecting direct capital use cost. In the literature of monetary policy, this interaction
process is stated with interest channel of monetary transmission concept. Interest channel
is affecting total demand process or interest rates which is the change in monetary policy
decisions. Interest channel defines an effect of a change in interest rate (Horngren, 1995).
In interest channel based on Keynesian view, relationship between monetary policy and
real economy is established on interest rate. Money authorities control directly official
interest rates. Thus, it determines interest rates of monetary markets. Changes in Money
supply lead real interest rates to change. In case central bank extend money supply,
economic departments use additional available money in bill exchange. Depending on this,
on hand bill exchange increases, on the other hand interest rates decrease.
A monetary policy involving extending low real interest rates affects total expenditure in
different ways. Lower interest rates mean lower capital cost for significant investment
decisions in particular. In addition, consumption expenditures increase because lower
interest rates support current consumption instead of next consumption. This situation is
called substitution effect. Substitution effect predicts that decrease in real interest rates lead
to decrease in savings and increase in consumption expenditures because of monetary
policy change. In the same way, interest rates affect disposable income via interest
incomes and payments. The direction and growth of income effect depend on net active
position of companies and household.

16
Income effect changes according to position of consumers. If consumers are in the debtor
positions, the decline in interest rates lead to increase cash flow and increase consumption
expenditures. On the contrary, if consumers are in the debtor position, decline in interest
rates decreases wealth of consumers. In case central bank follow an expansionary
monetary policy, real interest rate which is the cost of capital decreases. At the end of this,
making new investment decisions by companies lead total demand in other words real
output to increase. Increasing of interests has influence not only on companies but also
individuals on investment and consumption expenditures. With decreasing of applicable
net income, high interest rates lead investments to be less attractive and decrease
profitability of companies. Decrease in investment and consumption expenditures lead to
restriction in production amount (Mishkin, 2001).
For processing of interest channel, monetary base of central should be controlled, there
must be sticky prices, and short term interest rates must change long term interest rates.
That’s to say, if interest rate decreased under expansionary monetary policy application,
there must be an invisible increase in expenditures. The change in short term interest rate
forms the beginning point of interest rate channel. So transmission with interest rate
channel begins with the change in short term interest rate and this change lead to reflect on
middle and long term interest rate via supply and demand mechanisms in financial
markets.
The change in short term interest rate made by monetary authorities under the prediction of
prices rigidity affect long term real interest rate. An expansionary money policy applied
under new prices rigidity prediction decreases short term real interest rates. The decline in
short term real interest rate leads to long term real interest rate under expectation theories.
Consequently, this situation causes potential real effects in economy.
Central Bank has affected nominal interest rates and because prices cannot have adapted to
new balance simultaneously, real interest rates have changed. In other words, there is a
prediction which is price rigidity against monetary shocks. There are studies that ascribe
the decisions related to price arrangements as inflation rate significantly. When compared
to more stable economies, it has been claimed that prices and salaries in countries with
high inflation are regulated faster and inflation expectations have significant role to
determine prices. Some economists have claimed that interest rate is insufficient to explain
effects of monetary policies on expenditures.

17
According to economist who defend interest rate channel, the change in money supply
affects economy, but there is no significant reason of sources of this change in money
supply so active side of bank balances have been ignored. In this case, because interest rate
channel is only interested in passive dimension of bank balances, it is not interested in the
change taken place in credits after change in bank reserves. If there is decrease in credit
amount of banks, it is considered to provide from alternative finance sources. For this
reason, it is predicted that there is no special place of bank credits in economy and
substitution among finance sources is complete (Kashyap et al., 1994).
In the scope of aiming inflation after 2011 banking crisis, as a reaction to that CBRT give
up the aims of inflation, it enabled to change interest rates and manage the expectations of
inflation. In this scope, inflation and real interest rates have been decreased at reasonable
level, bond between real interest rates and expenditures decisions have been gotten strong
by beginning to decide depending on the changes in interest rates of economic
departments. Output gap of these interest rates of policy change has elevated its
effectiveness on inflation, it has increased sensibility inflation dynamics to policy interest
rate by empowering efficiency of interest rate in the scope of traditional transmission
mechanism.
In the period which Turkey economy experienced depolarization, the control of CBRT had
decreased on monetary growths and the effect of interest rate had decreased because the
decisions of production and pricing depend on exchange rate. In addition to this,
empowering of banking sector in successful disinflation process experienced after 2011
crisis, that composition of public debt stock reached healthier structure and increasing trust
of Turkish lira had decreased depolarization significantly, thus effectiveness of interest rate
had increased. On the other hand, there is an influence of becoming transition from short
term interest rate to long term evident as well (CBRT, 2013).
2.4.2. Exchange Rate Channel
Exchange rate channel states the change in real production from the effect of monetary
policy on exchange rates because of reflecting net export (Horvarth and Maino, 2006).
Central banks try to protect the value of domestic currency because of so many reasons.
Especially changes in exchange rates in economy with negligible deficits have also a great
effect on inflation.

18
Depressionist process leads to an increase in inflation as a result of high importation and
increased exportation need. Consequently, government and policy makers follow exchange
rates more and this created pressure that central bank apply different policies (Mishkin
(2001). Channel volume of exchange rate depends on sensibility of exchange rate to
monetary shocks, openness level of economy and exchange rates of net exports. Exchange
rate channel can process in openness economy that flexible exchange rate regime has
dominated. As openness level of country is high so exchange rate channel is effective in
monetary transmission mechanism.
Increasing of externality of economies and using of flexible exchange rate system
commonly have increase importance exchange rate in monetary transmission mechanism.
In so many emerging countries, because bono, share and real estate markets have not
developed sufficiently, exchange rate appeared as a most important asset affected from
monetary markets. The effect of this channel has been seen especially in export trade, price
flexibility, in the environments that provide input supply for this export industries
indirectly. For this reason, a different effect is expected on industries which are sensible to
foreign competition.
In the period after 2001 in Turkish economy, significant changes had been observed in
function of exchange rate within scope of traditional transmission mechanism. As in the
other emerging economies, exchange rate movements lead to destabilizing effect with the
reasons like depolarization, imbalance between income and expense of government,
banking processing unhealthy and financial fragility with finance sector before 2001 in
Turkey. That unsuccessful stability programs applied after economic crisis experienced in
the past depend on fixed exchange rate regime leads powerful indexing behavior in
addition to inflation expectations of exchange rates expectations to be principal indicator.
In this period which floating rate regime has not been applied, exchange rate transitivity
has actualized in high levels not only as growth and but also speed. In the period which
floating rate regime has continued to apply and inflation aiming regime begins to apply, it
has been identified that exchange rates have been taken into consideration less more while
making pricing of economic departments and the transition effect from exchange rates to
prices has decreased in terms of both growth and duration.
In the scope of traditional monetary transmission mechanism, it has been thought that local
appreciation of currency leads economy to limit via the effect on foreign trade. In addition

19
to this, in Turkey economy, in the periods which Turkish lira gained value, economy had
entered into development process, recession had been experienced in situation which
Turkish lira lost value. In the periods, high capital inflows have been experienced,
appreciation of Turkish lira currency increases net value of companies who have debits in
foreign currency and separate this debit for investments and production. In addition,
because of high weights of import inputs in production process, companies can produce
same goods with lower prices in these periods, on the other hand the increase in purchase
power cerates the increasing effect on home demand. All these factors lead economic
activity to accelerate depending on increase in Turkish lira.
There are two main transmissions of exchange rate on theoretical process. These are the
transmission of exchange rate on net exports and the transmission of exchange rate on
balance sheet.
2.4.2.1. Transmission of Exchange Rate on Net Exports
Exchange rate channel consist of interest rate effect under flexible exchange rate and
complete capital mobility as well. In other words, there is a close relationship between
exchange rate and interest rate (Mishkin, 2001). Because expansionary money policy
application leads local interest rate to decrease, it affect exchange rates and deposits stated
in domestic currency become less charming than deposits stated in foreign currency. The
increasing of demand against foreign asset lead domestic currency to decrease. The
domestic monetary depreciation makes the goods produced in domestic cheaper than
foreign goods. The effect of this is positive on export and the net increasing export lead
output to increase.
2.4.2.2. Transmission of Exchange Rate on Balance Sheet
The other important effect of waves of exchange rate on total demand actualize with
affecting balances of companies which are financial or not. The other significant effect of
waves in exchange rate on total demand is taken place with affecting debts of the
companies which are financial foreign currency or not, as seen in so many rising market
economies. If the debts of household and companies consist of foreign money, an
expansionary monetary policy that will lead to loss in value of national currency will
increase debt obligation.

20
If foreign money asset is not created against currency of debits, because the value of assets
do not increase as domestic type of currency, a fall in net value of company will be seen
and the deterioration seen in balance will lead to a fall in credits by increasing “adverse
selection and moral hazard” problems.
The shrink in credits will decrease investments and thus economic activity will shrink
(Kamin et al., 1998). The effect of exchange rate to balances is defined via bank balances
in addition to company balances. That household and companies could not pay their debts
because of rise in exchange rate, makes banks collect debts difficult and deteriorate
balances structures of banks. Therefore, lending capacity of banks will fall and
investments, total expenses and income level will decrease because of liquid squeeze.
2.4.3. Stock Channel
Monetarists put emphasis on other relative asset prices and economic effects of real wealth
about monetary transmission in general. Accordingly, there are two channels involving
asset prices in monetary transmission mechanism. These are stock prices channel and
wealth effect. In the process of asset prices, the effect of monetary policy on investments is
defined with q theory of Tobin and the effect on consumption is defined with life cycle
theory of Modigliani.
2.4.3.1. Stock Prices Channel
q theory of Tobin is a mechanism which creates effect on value of assets via monetary
policy. q is defined the department of market values of companies to capital cost. The rise
of this value states that market values of companies are high according to spare capital. In
this case, the companies can determine high value on equipment cost and fixture which
will buy with income by exporting. Therefore, because companies will buy more
investment goods with less stock, investment expenses will increase.
When it is assumed that Central Bank applied an expansionary monetary policy, the
increasing money supply lead consumption to increase. There are stock expenses in the
increasing consumption expenses. In addition, the decreasing of interest rate because of the
increasing money supply will decrease demand for deposits, it makes stocks more valuable
against deposits. Therefore, the increasing of stocks of individual and increasing of stock

21
against deposits makes increase demand for stocks. Stocks will increase because of the
increasing demand. The rise in stock prices lead companies increase in value. In this case,
it can be considered that financial wealth of companies has increased.
Companies whose wealth increased, the consumptions of them increase. The increasing
consumption invigorates economy and increases production. Consequently, it can be said
that expansionary monetary policy has increased production by creating positive effect real
economy via financial asset channel (Mishkin, 2001).
2.4.3.2. Wealth Channel
An alternative channel of monetary transmission mechanisms includes the change in
consumption expenses as a result of that share prices affect wealth level. Modigliani in his
“lifecycle model” in 1975, stated that consumer will change consumption expenses
depending on lifecycle income. So human capital has shown as components that affect real
capital and financial wealth consumption. A great amount of financial wealth is the shares
stock market. The rise in stock market activities increases financial wealth value and
lifecycle income of consumers. Lifecycle income rise lead expenses of investments to
increase within scope of accelerating consumption expenses by elevating in economy.
q theory and wealth effect of Tobin can be adapted to assets like house and real properties
except stock. For example, because rise in housing prices increase prices of these assets in
proportion to replacement cost, q value for residence will increase and leads to an increase
in housing production. Similarly, housing and real properties are a part of wealth, the rises
in the prices of these assets will increase value of wealth and so increases consumption
expenses. In this case, a monetary expansion that lead to housing and real property prices
will also lead to a rise in total demand via q theory of Tobin and wealth effect (Mishkin,
1996).
Pigou and real balance effect have an effect on total expenses. Pigou effect is the effect on
consumption expenses that taken place in real wealth as result of fall in prices; in case of
that prices and fees are flexible, it claims that it can be provided full employment in
economy. Accordingly, in case general level decreased with decreasing of monetary fees in
economy, real value of savings made previously will increase and for this reason
22
individuals will increase their demand to consumption goods which their fees fall by
disposing less.
2.4.4. Credit Channel
Monetary transmission mechanism that explains changes in monetary policy affect
economic activities with what ways, while it was like that changes in money supply and
interest rates affected amounts of investments and consumption, excessive mobility in
economy makes this view insufficient by economists (Bernanke and Gertler, 1995). As a
result of this, Bernanke (1983) has stated that finance corporations have effect on economy
and roles of banks in transmission mechanism has been attracted attention.
Credit channel approach focuses on lack of information, operation costs and credit sizes.
Market distortions gained importance with meeting expenses decisions with internal and
external resource finance. Credit view emphasis on the effects of lack of knowledge
between fund supply and demand providers on transmission mechanism. Market
distortions explained with adverse selection and asymmetric concepts add a special role to
financial intermediary in general, in the process of reaching information and evaluating
information in private sector; it enables monetary power independently of monetary
growths like interest and credit to affect total demand in order to change credit-security
portfolio composition of bank balances with these changes.
Rise in operability of credit channel after 2011 crisis in Turkish economy has been
observed. In the past, because of high budget deficits and real interest rates, banking sector
imposed restriction and it did not give long term credit and reasonable interest rate to
especially small and middle scale businesses. In this period, banking did mainly function
as intermediary mission to finance expenses of governments. Structural reforms after
crisis, banks returned financial mediation activities instead of finance of government
expenses because of the reasons which are low interest rates in developed countries, the
increasing liquidity and fall of real interest rate. Therefore, total demand and inflation
which banks have used depending on changes in policy interest rates begins to be affected
(CBRT, 2013).
It has been claimed that credit channel of monetary transmission mechanism includes two
mechanisms which define analysis of relationship between changes in monetary policy and

23
the growth of external sources premium (Fountas ve Papagapitos, 2001). In other words
monetary policy has an effect on real economic activities in two ways. First of all, the
credit channel which affects bank credit supply given to dependent companies; second,
balance channel which lead to change in real production by affecting balances of debtors.
2.4.4.1. Bank Credit Channel
Banks have special roles not only basic mediation role between the ones who need fund
and fund surplus and also the effect on the policy decisions of central banks and expenses
decisions of households (Dale and Haldane, 1993) .If bank credits and deposits have same
features likewise other borrowing and saving instruments, there would be no income
difference between those instruments. In such world that there are replacements of all
instruments, banks will play a passive role and monetary transmission would function
completely independent of behaviors of banks.
However, in real world, other debiting and saving instruments cannot replace banks credits
and deposits. This situation is because banks decreased asymmetric information problem in
credit market. Asymmetric information problem between borrower and lender makes block
credit market function effectively like so many markets. In this environment banks play a
special role to function effectively by decreasing these kinds of specializations regarding
observing and evaluation.
If a company would like to become indebted by exporting bono, before investors buy
bonds of these companies, they will want to be informed regarding reliability of company
and profitability of investments. If borrower company is big and known, the information
who lender would like to know is either accessible by public or need very low cost.
However, same situation is valid for households and small companies. It is difficult to
assess credibility and provide information about borrowers and leads significant cost.
Therefore, debiting interest rate which borrowers have to endure will increase.
However, that banks are specialized corporations regarding observation and evaluating
makes costs of these information decrease significantly. Therefore, banks credits for
households and bank credits can be gained more convenient conditions than alternative
debiting resources (Dale and Haldane, 1993).

24
For bank credit channel work effectively, finance bonds of companies and bank credits
should not been full replacement goods. Under these circumstances, in case of decrease in
bank credit supply, it will not be possible to meet needs by exporting finance bono at the
same conditions with finance credits.
Another condition for the efficiency is to affect policies applied by central bank. In case
central bank decreases money supply, it should not have been possible to react the change
in reserves by using other finance types. According to another condition, it should not have
been possible of full price arrangements that removed effect of changes of monetary
policy.
As long as conditions above are provided, expansionary monetary policies increase bank
deposits, reserves and credit supply of banks. The increasing of credit supply makes
companies increase their investments by using more credits and consequently lead
investment and consumption expenses to increase. As a result, total production rate of
economy increase (Mishkin, 1996).
On the other hand, as result of contractionary monetary policies, fall of credit amounts of
banks lead to credit rationing phenomenon. Credit rationing is some of the ones who apply
credit applications to take credit, not to find credit in case even if others approve to give
high interest rate (Stiglitz ve Weiss, 1981)
The reason of this situation is like that; when credit interest rates rise, because it carries
less risks, it will make investments for the projects that which incomes are lower, secure
borrowers will give up to take credit. The borrowers who make investments to less risky
projects continue credit demands, even they approve to pay higher interest rates to get
credit. That the possibility of repayment of credits given to risky projects is high makes
more profitable comparing decreasing credit supply with increasing interest rate (Walsh,
1998).
Credit rationings affect small borrowers because information cost about themselves are
high in particular. The conducted researches have revealed that how external finance cost
which monetary contractionary has been experienced for small companies has increased. In
the economies which nonbank finance opportunities are especially limited, credit rationing
effect works by empowering traditional interest effect of monetary rate (Kamin et al.,
1998).
25
On the other hand, that banks cannot change their asset compositions or this type of change
is very high cost may lead to competitive pressure decreasing effect in market of bank
credit. In case monetary policy is limited, because banks create high cost, they may not
replace bank credits with bills even if it has more income. In such environment, because
credit market is isolated and sticky bank credit rates can be discussed. In this situation bank
credit channel work in the decreasing effect of monetary policy to real economy (Dale and
Haldane, 1993). The researchers conducted oriented to process of bank credit channel
concentrate on two subjects in general. First of all, that some borrowers are dependent on
banks and the effect of change in the request of giving credit of banks on investments and
expenses behaviors of these borrowers. Second is that, the change monetary policy affect
bank credits directly or not (Morris and Sellon, 1995).
2.4.4.1.1. Dependency to Banks
The view that some borrowers are dependent on banks in terms of finance emerge from
asymmetric information models that works to explain credit market problems. In general,
opportunities of borrowing of small and large companies are different. Finance
opportunities of large companies are very expansionary in terms of capital markets and
monetary markets. Borrowing opportunities of small companies from capital markets are
very less. Because other costs taken place in case of information activity regarding small
companies and go bankrupt, it is very high in terms of lender.
That information and credit observation opportunities of banks are higher that other
intermediary corporations enable debt to small companies with low interest rates.
Therefore, small companies depend on bank credits. In addition, there is no full
replacement of bank credits. Because households cannot get fund directly from monetary
market and is dependent on banks for foreign finance. This situation, in case of decreasing
of credit supply, it empowers possible damage to small and household (Morris and Sellon,
1995). The finding gained from empiric studies of Gertler and Gilchrist (1995) have
supported this idea. On the other hand, Oliner and Rudebusch (1996) has precipitated that
the dependency to companies has increased by developing and increasing credit
opportunities and capital markets, the importance of bank credit channel has lost over time
and the effects on real economy has decreased.

26
2.4.4.1.2. Changes in Monetary Policy
Some of studies conducted to evaluate the effects of monetary policies on bank credits
have researched how affect portfolios banks, some of them focused on change in interest
rates and credit durations. In the study of Romer and Romer (1993), it has been shown that
decrease in bank credit volume as a result of monetary shrink has shown inconsistency
with the decrease seen real economic activity, the results which shrink in monetary policy
have decreased bank credit supplies and slow economic activity could not be gained.
Gertler and Gilchist (1995) has identified that because small companies could not find the
required resources for their stock and business capitals, they stopped production activities
immediately, large companies continued production by meeting these needs with internal
resources and they concluded that this situation has slowed monetary shrink on production
and extended effect duration. Kasyap and Stein (2000), as a result of monetary policy
applications, credit behaviors of bank change, bank deposits decrease at the end of
contractionary monetary policies of small banks whose balance is less liquid and for this
reason they had to decrease their credits significantly.
On the other hand, in studies conducted regarding durations of bank credits and interest
rates, credit rationing or credit supporting results have not emerged (Morris and Sellon,
1995). In credit markets, another development which changes effects of monetary policy is
the proliferation of credit commitment. This situation can increase affecting process of
economic via bank credit channel of monetary policy changes.
2.4.4.2. Balance Channel
Balance channel resulted from asymmetric information problem in credit markets is based
on financial situation of foreign finance premium of borrower. That value of liquid asset of
companies and that high value of other assets accepted warrant means that adverse
selection probability decrease and in case of actualizing this probability, it means that loss
of debtor is limited.
In this situation, it has been expected that the one who want to be indebted finds credit
more easily and the foreign finance premium is lower. In addition, that equity capitals
determined by company owners are low lead to have tendency to make investments for less

27
risky projects and increase moral problems. Finding credit for the company which wants to
be indebted in this case will be difficult and it has been stated that foreign finance premium
is higher.
Increases and decreases in foreign finance premium make expand and impoverish the
effects of changes of monetary policy on economy by affecting investments and expenses
decisions of companies (Mishkin, 1996). Exposure in balance of borrowers has two effects
on the brink of direct and indirect. The directing effect of contractionary monetary policies
that weakens balances of borrowers is like that. So many companies finance stocks and
work capitals into more short term debt. The increasing of interest rates weakens cash flow
and financial situations by increasing interest costs of these companies.
In addition, increasing of interest rates makes assets prices and warrants values of
companies decrease and thus leads foreign finance premium to increase. On the other hand,
contractionary monetary policies affect cash situations and assets values of companies
indirectly. For example, contractionary monetary policies decreasing sales of companies by
increasing expenses of their customers. The companies which their earning decreases
cannot be adapted to fix and semi fixed costs in short term. This situation leads
profitability of companies, net values and credibility to fall (Bernanke and Gertler, 1995)
According to Bernanke and Gertler (1995) effect of changes to companies vary from the
growth of this company as well. Unexpected decline in cash flows lead balances of small
and middle companies to weaken, deteriorate financial indicators, fall values of assets that
will show as warrant and not to show sufficient warrant for the needed credits. This
situation affects credit opportunities and interests rates of companies directly. On the other
hand, in case there is unexpected weak in cash flow of companies whose borrowing
resources much more and which are open to public, they use their own fund or increase
short term debiting.
Although they have face with higher interest rates and low income, at least they can
continue employment level. Therefore, a negative shock affect credit opportunities and
conditions (like interest rates) of small companies more that large companies. The other
effect of balance channel will be on general prices of monetary policies. That debt
contracts of companies are generally made fixed nominal interest leads real responsibilities

28
of companies to decrease and real values of assets to be fixed by increasing general level
prices of expansionary monetary policies.
Therefore, net real values of company have increased. This situation makes companies
increase float a credit ability by decreasing adverse selection and moral threat problems, it
leads to increase in investment expenses and total production. While balance effect has
focused on expense decisions of companies much more, Bernanke and Gertler (1995) have
claimed that balance effect is effective in terms of household and durable consumption
expenses. As a matter of fact, the increasing of interest rates via contractionary monetary
policies will lead household and durable consumer goods expenses to decrease by affecting
cash flows of households except companies negatively (Mishkin, 1996). In addition, bank
balances channel can also affect via cash flow channel and unexpected price level channel.
Therefore, balance channel can be examined under three topics which are cash flow
channel, unexpected price level channel and household balance channel:
2.4.4.2.1. Cash Flow Channel
Hard monetary policy can decrease net cash flow and insured values indirectly. If we think
a company that makes production for consumers in low-income group, if contractionary
monetary policy decreases expenses on these customers, company profits decrease because
various fixed and fixed-like costs of company cannot be arranged in shorter. The rises that
emerged obliterates net value and credibility of company over time (Bernanke and Gertler,
1995).
Expansionary monetary policy affects cash flow of companies positively by decreasing
interest rates. This situation provided recovery in balances of companies and blocked
asymmetric information problems to appear. In this context, credit volume has increased
and investments or national income has increased.
The important component in this transmission mechanism is that the interests that affect
cash flow of companies is nominal interest rates. Therefore, this interest rate mechanism is
different from traditional interest rate channel that shows effect of real interest rate on
investments. In addition, in this transmission channel, short term interest rates have a
significant role. Because the interest payments which are effective on cash flow of

29
company are interest rates paid for short term not interest rates paid for long term credits
(Mishkin, 1996).
2.4.4.2.2. Unexpected Price Level Channel
Another mechanism of balance channel is “unexpected price level channel” that shows the
effect of monetary policy on general prices level. Debt payments are fixed with contracts
nominally. The unexpected rises in prices general level decrease responsibilities of
company at the same period. However, real value of assets of company may not fall.
Expansionary monetary policy leads to unexpected rise in prices general level. Therefore,
decreasing of adverse selection and moral threat issues increase real net value. As a result,
an increase takes place in investments expenses and output (Mishkin, 1996)).
2.4.4.2.3. Household Balance Effects Channel
Although credit most of channel literature is focused on expenses by companies, credit
channel view takes consumption expenses made for home expenses and especially durable
consumption goods into consideration equally.
The decline in bank credits resulted from monetary shrink leads to a fall in durable goods
bought by consumer who cannot apply other credit resources and household take.
Similarly, increases in interest rates lead balance of household to deteriorate. Another way
to see how balance channel affect consumers is to take liquidity effect on durable
consumption goods and household expenses into consideration. Balance channel in
approach of liquidity effect works via the effects of consumers on expense request rather
than lending request of lenders. Because of asymmetric information regarding credit
qualities, these are durable consumption goods and the assets which are not household
liquid (Mishkin, 1996).
If consumers need to monetize these goods at the end of possible bad shock, because these
assets will be sold below real value, they may face a great loss. On the contrary, if
consumers had kept their financial assets, they could sell their financial assets on the value
on market and increase cash amounts. Therefore, if consumers expect to find themselves in
a financial trouble quite likely, while they keep durable consumption goods which are not
liquid and households in less amount, they will keep liquid financial assets more.
30
Balance of consumer has a significant effect in the prediction which household experience
trouble in financial crisis period. Specifically, if it has a great amount of financial assets in
proportion to debts of consumers, the prediction of financial trouble probability will be
low. In this case, consumers approached willingly in purchase of consumption goods and
household. When share prices increase, while the value of financial assets rises, durable
consumption goods expenses increase. Because consumers take more security position and
experiencing financial trouble decrease (Mishkin, 1996).
The increased monetary supply at the end of expansionary monetary policy increase share
prices. The increasing of financial assets makes consumers to take more security positions.
At the end of this, durable consumption expenses increase. That durable consumption
goods and household are illiquid assets is the basic reason that monetary shrink that
decreases cash flow for consumers and increases interests reveal decrease in durable
consumption goods and household expenses. The declines that decrease requests of having
household and durable consumption of consumption have increase possible financial
congestion. For this reason, because consumers have decreased durable consumption goods
and household expenses, total demand falls (Mishkin, 1996).
2.4.5. Expectation Channel
According to expectation channel, all variables whose have inter-periodical results and
determined rewardingly have been affected from expectations of economic units against
shocks that may happen in the future and how monetary power react these shocks.
In this case expectation channel can be considered as inter-periodical type of interest
channel, asset price channel and credit channel. In case of that it has been announced
monetary power embarked on monetary application which is not supported by in current
period, market expectation will be adapted, the change taken place as result of financial
markets lead to change in production and inflation at the end.
The requested effect of policies stated that will be carried on in the future will be depend
on monetary power security (Loayza ve Hebbel, 2002). Monetary policy change affect
expectations related to future of economy and the trust to economy. The change in
perceptions of economic agents directed at future, affect fees, employment level, sale and
profit margins as well. However, it is difficult to predict effect dimension.

31
Increasing of interest rates can be envisioned that monetary power considered growth in
economy more than expected. This situation can create significant recovery in reliability
and expectations of economic growth oriented to future. On the other hand, the rise in
interest rates can be envisioned as a signal to slow economic growth for the purpose of
reach the inflation target of monetary power. In this case, there may be a decrease in
expectations and reliability oriented-future of economy.
The effect of monetary activities depends on predicting or not by financial markets.
Unexpected changes of monetary policy will relative strong effect. The control of
monetary powers on monetary conditions depend on affecting financial especially inflation
expectations ability. The changes in credibility can change final real and nominal effects of
monetary policy. On the other hand, the uncertainties about payments of debts agreements
are very important reason. For example, as a result of contractionary monetary policy, the
increasing uncertainty in recession makes good and harm credit risks distinguish from each
other. For this reason, the increasing uncertainty renders information in financial markets
more asymmetric and significant rises will take place in adverse selection and moral issues.
This situation prevents credits and thus leads to a fall in economic activities.
In the economy which uncertainty exists, asymmetric information problem consolidated
and moral threat and moral risk issues which restrict economic activities and credit volume
become evident (De Bondt, 1998). The increasing uncertainty including financial system
makes fund providers choose between investments opportunities and measure credit risk.
While fund providers were trying to exceed asymmetric information distribution, the
increasing of uncertainty leads saving amount that will direct at investment and to slow
economic activity.
There are so many reasons that increase uncertainty. Those consist of failure of financial
corporation in financial sector or Non-Sector Corporation, economic respond like
recession, politic instabilities experienced in emerging countries and uncertainty regarding
situation of government policies in the future (Mishkin, 1998).
Inflation target applied after 2001 in Turkish economy have a great importance that
monetary policy can manage expectations via both politic tools and communication.
Reliability of aims announced previously presents a reference value to economic units.
Chronic and high inflation experience in the past and applied unsuccessful stability

32
programs damages reliability of aims in the period and restricted efficiency of monetary
policies. In addition to this, that expectation is sensitive to developments lead to another
barrier for monetary policy. However, with implicit inflation targeting, beginning to
understand by public opinion increased processing of expectation channel.
2.5. Indicators of Monetary Transmission Mechanism
Monetary transmission mechanism channels affect various variables in different speeds
and densities. For this reason, when researching effect of monetary policies on real sector,
the giving answers of that the effects of transmission channels are same or not in all
economies or which features of economies determine transmission mechanism channel
function and relative importance (Loayza and Hebbel, 2002).
According to Kamin et al. (1998), two factors are important when evaluating that how
much monetary policy affect real economy to what extent. First of all, the effects of tools
controlled by directly central banks like short term and legal refunds on credit and deposits
interests, asset prices and exchange rates variables. This is determined by structure of
financial system as a relationship.
The second factor is the relationship between the situations of companies and household
and expenses decisions. Because, liquidity situations of households are indicator for
change in market prices to total demand effect. The components that determine efficiencies
of monetary transmission mechanisms as follows:
2.5.1. Direct Interventions
Direct interventions of governments to financial markets have actualize by controlling
interest rates or creating limits for financial market prices, putting limits for bank credits
and providing credit opportunities to selected regions. With financial liberation process,
direct controls of governments on credits lost its importance, application like open market
to manipulate monetary policy in undirected tools gained importance. Therefore,
application areas which the variables of credit ceilings in 1980s and reserves ratio is active
gave its place to open market operations mainly (Kamin et al., 1998).
33
2.5.2. Price Elasticity
In an economy, a monetary shock shows its effect in all nominal monetary and credit sizes
such as assets prices, exchange rates, factor and goods prices evenly and at the same time.
Total demand increases, but total supply does not change. Under these circumstances, the
effect of all transmission channels to prices will be similar. Therefore, it is not significant
to determine relative importance of different transmission channel in this type of economy
(Loayza and Hebbel, 2002).
However, prices in real world are sometimes determined by government and private sector
in state of monopoly, this situation leads price rigidity to take place. Therefore, in real
world which prices rigidities exist, relative importance, speed and density of different
transmission channels have changed and the effect on real economy differentiates.
2.5.3. Competition in Financial System
The important thing in monetary transmission process is sensibility to changes in short
term interest rates affected by central banks directly rate that affects the decisions of
borrower and saver. The structure of financial system affects this sensibility rate directly.
The structure of financial system is shaped by many factors which are the presence of
alternative finance resource, deepness of finance markets, and competition in banking
sector and efficiency of legal system. That credit and deposit interest rates reacted to
changes in monetary market interest rates fast and strongly, makes efficiency level of
monetary policy to real economy increase by accelerating transmission process.
The main indicator of credit and deposits interest rates in sensibility level is competition
level in banking sector. That there are so many banks in banking sectors and they are in
competitive area provides changes in funding costs to affect credit and deposits faster. On
the contrary, that there are less banks in the market may lead oligopolistic pricing to take
place. This situation leads the sensitivity of credit and deposits interest rates to monetary
policy interest rates changes to be slow and asymmetric.
In addition to this, that share of public banks or banks-supported public which their profit
motive is low in banking sector have decreased this sensitivity. The presence of alternative
nonbank fund resources and over the counter markets, accessibility of households and

34
companies to these resources affect the sensibility of credit and profits interest to changes
of monetary policy changes. The presence of domestic capital markets empowers the
transmission of monetary policy shocks. Advanced and competitive capital markets are
usually more sensitive and reacts changes of monetary policy faster. Therefore, advanced
capital markets are a factor which increases sensibility of banks to monetary policies
(Kamin et al., 1998).
Financial system structure determines which transmission channel is active. That financial
consists of a couple banks which have monopoly power leads interest rate channel to be
weak, that financial asset variety is low will lead asset prices channel not to function. In
addition to this, credit channel is active in thin financial markets which there are moral and
adverse selection problems. In addition, in the economies which is not advanced
financially, because international trade and capital movements are under control of
government, exchange rate channel is also not effective. However, when financial system
develops, deeps and becomes varied, interest rate and exchange rate channels will work
more effectively (Loayza and Hebbel, 2002).
In the country whose financial system is advanced and their alternative credit opportunities
are a lot, credit channel of transmission mechanism is less effective. Therefore, the effect
of monetary policy changes in these countries to production and inflation via credit
channel are expected limited. In the countries which banking system is weak and
dependency of companies to banks is high, credit channel is stronger. Because in this type
of countries, decreasing of deposits as a result of monetary policy reduces balances of
banks whose sources are limited except deposits and lead to fall in credit supplies. That
companies cannot find alternative source to capital markets affect expenditures and
investments significantly.
2.5.4. Structure of Banking System
The financial situation of banking system is a significant factor that determines bank
credits supply and cost. Risk-weighted capital efficiency ratio button may lead to limit
credit supplies by increasing credit interest of banks and slowing credit conditions.
Therefore, if financial situation of banks is weak in periods that monetary policy has been
restricted, credit supply will decrease such an extent. In case of that capital efficiency rate
of bank is high, even if in case of experiencing declines in asset costs, capital efficiency

35
will be provided and this situation will not lead to restriction in credit supply because of
concerns to provide capital efficiency rate (Kamin et al., 1998).
2.5.5. Exchange Rate Regime
Theoretically, in case of that there is no capital controls, it has been determined according
to replacement rate between exchange rate regime and local-foreign financial assets. The
effect of monetary policy actualizes in two ways on floating rate regime applied
economies. At first, monetary transmission works with traditional bank rate and liquidity
effect because money supply is exteriorly controlled by central bank.
Second one, monetary policy affects the total demand and prices through exchange rate. In
this interaction, elevation of replacement between local and foreign resources causes high
reaction of exchange rate on the change of interest and greater effect of monetary policy on
the real sector (Kamin et al., 1998). In the fixed exchange rate regime, in circumstances of
local and foreign resources replacements, monetary policy changes is balanced with capital
movements and monetary conditions do not change. In circumstances of low elevation
between local and foreign resources, money power can change domestic interest rate
independently of foreign interest rates (Kamin et al., 1998).
2.5.6. Financial Position of Debtors
The effect of monetary policy on households and borrowing and expenditure behaviors of
companies takes shape according to their financial conditions. Households and companies
which some of them have strong and some of have weak financial position, reduces foresee
ability of the effect of monetary policy (Kamin et al., 1998).
The impact of monetary policy on total demand is less when economies that have
underdeveloped financial intermediation and that household and firms generally financed
their investment and expenditure with domestic funding. After economies getting
developed, the increase in resources provided by financial intermediaries’ causes to finance
larger proportion of investment and expenditures by bank credits and the increase of
sensitivity of total demand to monetary policy changes. Likewise, economies that have
underdeveloped financial intermediation, savings of households and firms generally is
collected in the banking system, investment rate to personal assets is very low.
36
In this economies, the effects of monetary policies are very low via prices of resources.
When financial markets develop, it has been expected that asset portfolio variety of
companies and households and sensibility to monetary policies increases. The structure of
sector which companies are in is determinant in exposure level of investment and
expenditures of these companies from monetary policy. That finance need is very high and
there is no finance resource except banks leads construction sector to be sensitive to
interest rates. For the same reason, the sectors which need high stable capital investment or
business capital are dependent on bank credits and it is very sensitive to bank interest rate
changes (Kamin et al., 1998).

37
CHAPTER 3
MONETARY TRANSMISSION MECHANISM:
CREDIT CHANNEL
3.1. Introduction
In this Chapter credit channel will be investigated in more detail which is one of the
transmission mechanisms discussed in the previous part. First of all, asymmetric
information subject is handled because of its role in the monetary transmission mechanism
of credit channel, determinant problems which appears depending upon asymmetric
information of credit market. Adverse selection and moral hazard as two different kind of
asymmetric information will be discussed in this part. Credit rationing and credit crunch
topics will be in this part because of the close interest to the credit channel.
3.2. Asymmetric Information Problem
Asymmetric information concept is a case of economic units interact with each other that
one side have more information than the other side. In the case of the information has
become asymmetric, the side which has more information have the edge over unfairly. For
instance, when buyer doesn’t know about the quality of the product as much as the seller, it
refers an asymmetric information between the parties.
Funds are allocated to the most productive areas in a financial system in the valid
conditions of perfect competitions. But in real life financial system has more complicated
and different process in perfect competition conditions. For instance, in real life
participants in the financial market don’t have full information in the perfect competition
market but they have asymmetric information. Asymmetric information and its related
problems has a great impact on the process of financial markets. In practice, all the
38
measures that are recommended is intended to solve asymmetric information problem in
markets.
However, it is impossible to remove this problem totally. Asymmetric information and
related problems which originates from lack of information between parties’ contract, have
influence to process of financial market. Financial markets are obliged to care of these kind
of information problems in addition to basic financial intermediation. Information
problems that affect as a whole complicated structure of financial system and its function,
both form financial corporations and contract and generate significant macro results
through transmission channel of monetary policy to economy.
As a result, that the party that has gained more information at the end of asymmetric
information between economic units facing with economic activities has performed a set of
behaviors in favor of just in favor or against opposite part, block operation to make
effectively.
Asymmetric information that show up in the markets cause troubles in the process of
markets in subject by leading to two basic problems as expressed adverse selection and
moral hazard. Adverse selection is an asymmetric problem that shows up before having a
contraction between two parties and it originates from hidden information. Hidden
information is a thing that one of the parties’ side know about itself or quality of product
that sells and so the other side want to learn but cannot. Moral hazard is an asymmetric
information problem that occurs after parties have contracted and originates from hidden
information. In case hidden problem is an activity in economic activity that cannot be
observed by the other.
The most known ones of studies which are premise about the view that it leads to troubles
in markets which asymmetric information has taken place and for this reason these markets
cannot be stabilized or resources distribution cannot be done effectively even if it is stable
belongs to Arrow (1963, 1968) and Akerlof (1970). Arrow in his study described moral
hazard problem shows up as an asymmetric information originated. Moral threat emerges
when one party of two parties engaged in activity that will affect both parties at the ends of
one party dependent on each other but this part cannot balance those activities.

39
In credit markets, asymmetric problems occur due to corporations apply for credit supply
and individuals apply for credit or due to lack of information between corporations.
Individuals generally apply for credit to ensure financing to their investment project when
they demand for consumption purposed credit. It is highly important for corporations apply
for credit supply to supply credit to borrowers in the process of repayment credit that they
are not going to be in trouble. To be able to make right choice depending upon obtaining
correctly and completely confirmation of some information about properties of borrowers.
In that point, it is obvious that borrowers have information superiority because ones who
apply for credit have exact and correct information about themselves. But for both sides
apply for credit there exist both honest and dishonest borrowers.
This circumstance blocks transfer of information symmetrically between market
participants. Because there are unreliable borrowers in the market and in order to get
credit, because positive qualifications are more important, those borrowers treat honestly
and openly about their own qualifications and specifications of their projects against the
corporation which credit demand is requested by them. In this circumstances, occurrence
of asymmetric information between borrower and lender causes various problems and
unwanted situations for the market.
Asymmetric information in credit market results from that borrower who demand fun
mostly has more information than potential debt provides about investment that fund will
be provided and it may appear before performing an operation (ex-ante asymmetric
information) and after performing an operation (ex-post asymmetric information). Before
credit provided, asymmetric information appears when credit institution could not
distinguish between borrowers have high and low risk in the case of ability of repayment
of credit. (Claus and Smith, 1999).
Money lender corporations, before the credit rationing try to obtain information about
qualitative-quantitative traits of credit demanders toward their presentation of financial
reports. However, due to these reports don’t always give an exact information about
borrower it is not easy to make definite judgment about borrower. Asymmetric information
that appear after credit supply has stated that lender use credit or not within the compass of
projects that funds provided, actualize or not project, provide recycle or not and so the
situation which net income obtained from project could not be observed after credit
contract is made.

40
Lender only has knowledge about situations that have determinant effect on repayment of
credits when maturity has expired. In credit markets, before performing a procedure when
asymmetric information comes into question causes an adverse selection problem, after
performing a procedure it causes a moral hazard problem.
3.2.1. Adverse Selection
Adverse selection, appears only when too risky borrowers remain in credit market due to
rise of interest rate. Return that lender corporations expect primarily depend on the
possibility of repayment of credit. Therefore, for banks and the other lender corporations it
is highly important determine among credit demanders who have high probability of
repayment. It is quite difficult for bank to distinguish good quality borrowers among credit
demanders and to be able to do this several screening tool usage is needed.
The screening tool of interest rate may be used for person or corporation are willing to pay
for the credit they apply. Borrowers consider low probability of repayment of credit they
take are willing to high interest rate for credits. In that case, ones will be high risk carrying
borrowers even they are willing to pay high interest rates for repayment of credits. Thus,
when rate of interest rises, the number of risky borrowers will increase in the average and
causes profit erosion of banks. (Stiglitz and Weis, 1981).
Under the assumption there are two types of borrowers with high and low risk, if lenders
be able to distinguish what kind of borrowers are applying for credit, they will be able to
obligate borrowers from interest rate carrying their risk proportionally and be able obtain
returns from total credit supply they expect. (Walsh, 2003).
However, lenders obligate the both types of borrowers on a single interest rate reflects an
average risk because they are unable to distinguish between borrowers. Credibility with
same interest rate of borrowers whose dangerousness is different from each other in credit
market as in second hand car market makes the borrowers who risky and their repayment
opportunity is low exclude the borrowers who are riskless and their repayments are high
and occur adverse selection.
The observed problems in the American mortgage market have the most distinct features
of the adverse selection problems. First, people are given housing credit who have low
payment capacity and were asked to indicate their incomes to apply for credit but was not
41
asked to prove it. As a result of this, financial institutions which are suffering from
repayment of credits go through a crisis and mortgage funds meet a loss in the market have
been followed each other. Then, financial institutions haves lost confidence in each other
and reduce the credit supply. All these, have led to an increase in the number of people
who want low quality credits and to make adverse selections in the market.
3.2.2. Moral Hazard
Moral hazard in credit markets comes out before signing credit contract between the ones
who offer credit and demand credit, symmetric information has transformed into
asymmetric information because borrowers did not use credits within the compass of
condition stated in the agreement and this situation could not have been observed by
creditors (Kutlar and Sarikaya, 2003). Because creditor states the situation that borrowers
of activities cannot be observed, moral hazard issue called hidden action, when examining
in terms of lender, the borrower who use credit by engaging immoral activities has
increased the risk of non-credit repayment significant and so endangers the income
expected from credit of lender (Müslümov and Aras, 2004).
The borrower who gets credit can use in the investments that its income and risk are
specific known by borrower, especially in the periods which interest rates are high, he/she
can use in investments that failure risk is high to increase its earning. As a result of that
risk undertaken by lender and borrower is different about investment which credits has
been transferred, that borrowers have directed investments which their risk and income are
high in order to maximize their own profits leads to moral hazard.
Because borrower will gain higher income at the end of that investment is successful, it
will be one-sided profitable, in the con, because this investment will be financed via debt,
whole debt or significant part of it will be undertaken by lender. As a result, the loss of
lender in this case will generally be like non-repayment (Kutlar and Sarıkaya, 2003).
The reason which forced debtor to use the credit in the situation which lender would not
like to be used is that the responsibility against Lender Corporation is specific and income
varies from type of investment. If investment resulted in successful situation, the income
which borrower will get is the rest part left on principal and interest and shows increase
depending on rise in income from investment.

42
Profit of creditor is the credit interest determined independently of success of investment
previously. For this reason, when expected profit of borrower is the increasing function of
the risk carried by investment. Therefore, when borrower is disposed to take risk, creditor
is disposed to manipulate the credits of him to riskless investments. However, because of
presence of moral risk, creditor will not know where the funds of him transferred and
he/she will try to overcome making conditions of credit heavy and/or request addition
mortgages.
Banks have borrower sign credit contract to handle with moral hazard issue. Credit
contracts laid a burden on debtors and encourage them to make efforts in order to provide
credit payments under proper conditions. Banks must control use of credit to guarantee
debtor to pay when due within the compass of purpose. If banks could not control use of
credit under condition after credit contract are made, moral issue emerges. Because debtors
may turn toward risky investments to maximize their earning. When investment project is
failed, banks will undertake costs (loss) that will take place partially or completely. Even if
banks get guarantee for credit in case of failure of project, meet a loss. As a result, to
prevent moral hazard issue, they applied to credit rationing.
3.3. Credit Rationing
It is defined that the party who demand credit supply in credit market does not give credit
as much as demanding, gives less or would not like to give credit as much as requested,
and as credit rationing in credit market. Credit rationing, is to decrease excessive demand if
excessive credit demand is in question in credit markets to provide profit maximization of
credit demanders in order to keep interest rates of credit in specific level by creating shrink
in credit amounts (Jaffee and Russell, 1976).
If demand exceeds supply, then price (interest rate) will rise. Until balance is provided at
the same interest rate, supply will increase or demand will decrease. If price (interest)
function as sliding demand and supply in market, allocation will not be. But there is credit
rationing in market and balance is the allocating balance (Stiglitz and Weiss, 1981).
According to Russell (1976), a set of factors that makes credit market different increase
interest and allocation has taken place because of asymmetric information. The reasons of
when applying allocation in adverse selection is that credit portfolio become risky and the

43
reason for applying allocation in moral hazards is that investors make a thought which can
increase incentives in applying risky projects.
If it is based on asymmetric information in credit markets, making adverse selection need
to apply high interest rates for credit demanders. The corporation which give credit will
start to be selective to decrease risks of credit portfolios in order to limit increased credit
demand, will begin to decrease credits to increase warrants and a set of regulations. When
credit rationing is applied by banks, the purpose of banks can gain low risk project owners
via a set of arrangements or by changing interest rates and due date. However, allocation is
not made via price way in general but amount.
Credit rationing is being a measure applied by banks to remove negative effect on profit
rates of adverse selection. According to Hodgman (1960), the reason that credit rationing is
made to non-price components is that there are rigid interests rates based on oligopolistic
structure in credit market.
Warrants is obligatory agreement provision to repay credit and charge credit risk to
borrower partial. Warrants can also be used to distinguish debtors as allocation tool.
However, even if increased warrant amounts increased profit of banks by making
borrowers prefer less risker project, it cannot remove credit rationing completely (Bester,
1985). According to Stiglitz and Weiss (1981), even if credit borrowers have to show more
warrants, they can apply to risky projects. Therefore, according to Stiglitz and Weiss
(1992), the increased warrant obligation can decrease incomes of banks that demand credit
Even if credit rationing is not effective mechanism to solve information problem, it is a
phenomenon that limits the risk undertaken by lender. The models mentioned in literature
regarding information to credit rationing had been models which are Jaffee Russell models
in 1976 and Stiglitz Weiss models in 1981. When there is asymmetric information is in
question in credit market, Joseph Stiglitz and Andrew Weiss discussed how bank
treatments are in 1981 in the conducted study.

44
3.4. Credit Crunch
Credit crunch is defined as a great regression in credit supply. When experiencing credit
crunch, the relationship between credits and interest rate changes. Credit crunch emerged
in two different ways. First of all is the decreasing of credit supply on determined interest
rates. Second is allocating credit.
In second situation, credit availability has restricted. Because of low relationship between
credit availability and interest rate, non-price credit rationing has been used. However, it is
valid in the process of credit rationing. In credit crunch process which interest rates are not
on the basis of credit rationing mechanism, credit rationing has been accepted as a reason
of crunch. In other words, credit crunch can be defined via credit rationing. Bernanke
(1983) have defined that credit crunch curve shifted to left when the qualification of secure
real interest rate and potential borrower are stable. This situation defines expansionary rate
decrease in credit supply.
Credit crunch is poor period that obtaining credit cannot be presented in proper conditions
and created creditable fund for investments projects of credibility of credit demanders. In
addition, regulatory pressures, excessive reactions and decreases in active values of banks
lead to credit crunch.
According to Owens and Schreft (1995), credit crunch is the constant rise of non-price
credit rationing. This rise symbolized credit decrease taken place independently of risk
profile of borrowers. According to Kliesen and Tatom (1992), credit crunch is that growth
in bank credits especially commercial credits slowed and regressed substantially. In some
international studies, it has been stated that credit can be available before and after
recession (Clair and Tucker, 1993; Kliesen and Tatom, 1992; Owens and Schreft, 1995).
But, studies have been attributed to recession period. According to Bernanke et al. (1991),
main reason of recession is credit crunch.
Creditability of borrowers in recession periods lower than normal recession period. For this
reason, banks treat unwillingly to give credit and regress credit supply substantially. As a
result, economic recessions have been experienced. On the basis of these explanations, it
must be checked which situation is envisioned as credit crunch by markets. Because
markets can consider any period as crunch. In particular, credit recession and credit crunch

45
periods has confused. Credit recession defines general decrease in credit growth because of
demand or supply (or both). The change in credit demand can result from conjectural
(change in economic activities) or structural (tax law etc.) reasons. Central banks affect
expectations of lenders and borrowers via monetary policy. Therefore, it can manipulate
credit supply and demand (Lamberte, 1999; Ding et al., 1998).
In credit crunch, there is no fund that will be taken on interest in black in excessive credit
demand term. In addition, banks are unwilling to give credit in this its term. Because of
direct borrowing fun flow has decreased and central bank forces banks to limit credit
supply. Unwillingness of banks to supply credit prevents balance sheet drain. In addition,
banks stop debtors reevaluate average credit quality. For those reasons, credit crunch is
generally considered as supply phenomenon (Clair and Tucker, 1993).
On the other hand, Bernanke et al. (1991) ascribe the decrease in credit supply as both
supply and demand factors. In other words, deteriorating balance sheets of debtors in crisis
periods decreases credibility. Because of the fact that, credit demands decreased. In
addition to this, because of credit losses, owner’s equities of banks have limited and this
lead banks to limit their credit supplies.

46
CHAPTER 4
CONSUMER CREDITS
4.1. Introduction
Consumer credits are a type of credit being made available by credit societies such as
banking sector and financing companies. While the banks are directly financing production
conventionally through investment credits or operating credits, the consumer credits are
financing the consumption expenditures of the individuals.
In history, it had been observed that the indebtedness of household increases very much in
some periods as per the liquidity condition in business cycle and economy. In the period
of 1983 – 1989, the total liabilities of household had significantly surpassed the total
income (Canner et al., 1995). Some researchers specify that the household uses credits by
different motives. In this context, Zhu and Meeks (1994) specify that the household having
an income below average uses personal credits for solving their budget problems beyond
increasing their purchasing power. In this respect, it may be specified that the consumer
credits are ones being used for the financing of expenditures devoted to consumption.
Along with being like that, personal expenditures such as purchase of lodging and auto that
are being supported by credits are being assessed within the scope of consumption.
4.2. Description of Consumer Credit
One of the economic decisions that the individuals make is what will be purchased and
how it will be financed. When the individuals dream of a new automobile or a spacious
house, they decide to borrow if they don’t have money in hand (Kirchler et al., 2008). This
borrowing may be procured from financial institutions as well as from other individuals.
These borrowings, that the individuals procure from credit societies in order to finance
their consumption demands, are being specified as consumer credits.
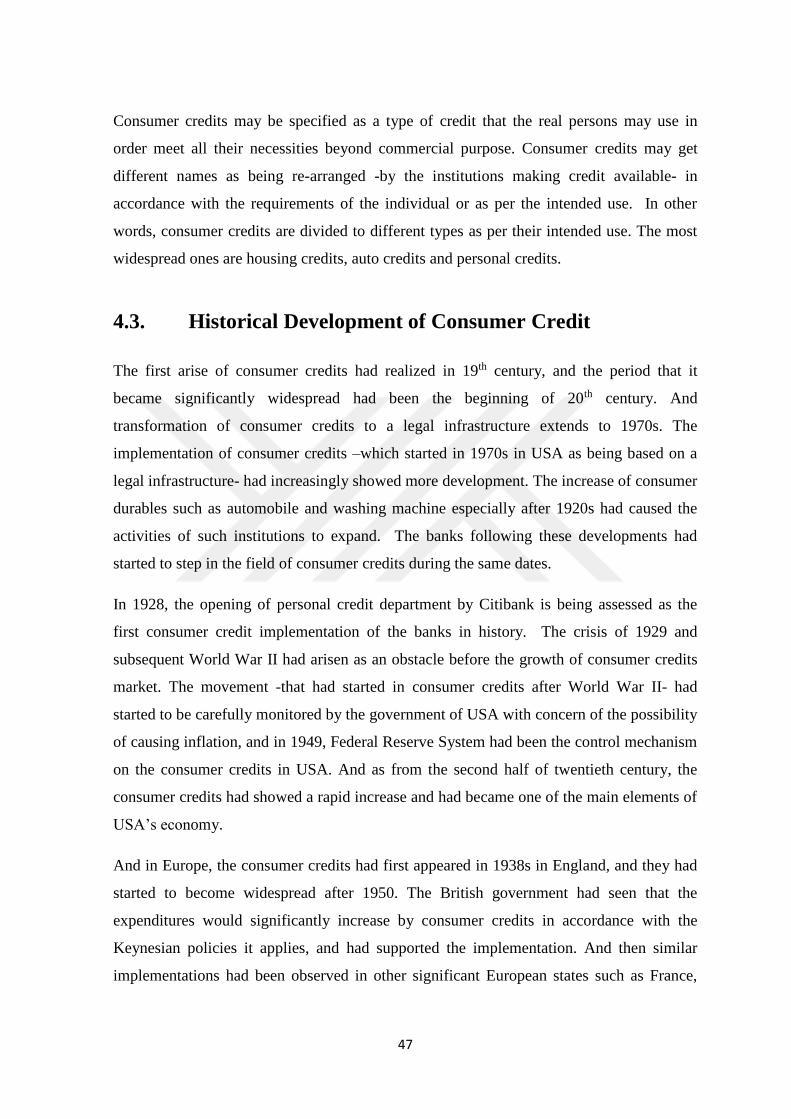
47
Consumer credits may be specified as a type of credit that the real persons may use in
order meet all their necessities beyond commercial purpose. Consumer credits may get
different names as being re-arranged -by the institutions making credit available- in
accordance with the requirements of the individual or as per the intended use. In other
words, consumer credits are divided to different types as per their intended use. The most
widespread ones are housing credits, auto credits and personal credits.
4.3. Historical Development of Consumer Credit
The first arise of consumer credits had realized in 19th century, and the period that it
became significantly widespread had been the beginning of 20th century. And
transformation of consumer credits to a legal infrastructure extends to 1970s. The
implementation of consumer credits –which started in 1970s in USA as being based on a
legal infrastructure- had increasingly showed more development. The increase of consumer
durables such as automobile and washing machine especially after 1920s had caused the
activities of such institutions to expand. The banks following these developments had
started to step in the field of consumer credits during the same dates.
In 1928, the opening of personal credit department by Citibank is being assessed as the
first consumer credit implementation of the banks in history. The crisis of 1929 and
subsequent World War II had arisen as an obstacle before the growth of consumer credits
market. The movement -that had started in consumer credits after World War II- had
started to be carefully monitored by the government of USA with concern of the possibility
of causing inflation, and in 1949, Federal Reserve System had been the control mechanism
on the consumer credits in USA. And as from the second half of twentieth century, the
consumer credits had showed a rapid increase and had became one of the main elements of
USA’s economy.
And in Europe, the consumer credits had first appeared in 1938s in England, and they had
started to become widespread after 1950. The British government had seen that the
expenditures would significantly increase by consumer credits in accordance with the
Keynesian policies it applies, and had supported the implementation. And then similar
implementations had been observed in other significant European states such as France,

48
West Germany and Italy. The consumer credits are still constituting a significant part of
the financing policies of European Union (EU) (Arslan and Karan, 2009).
The consumer credits may be defined as credits allocated by financing institutions in order
to meet the consumption requirements of consumers. The consumer credits are a type of
financing being used in funding the consumption expenditures of household.
4.4. Types of Consumer Credit
The consumer credits are basically divided to three groups. The credits being made
available in order to meet the financing requirement of housing are being specified as
housing credits. And mortgage credits which started to be implemented in Turkey by the
mids of 2000 are included within the scope of housing credits. Mortgage credits had
especially developed very much and commonly being used in USA. It had been better
observed along with its implementation in Turkey that -despite not having a significant
difference in between the housing credits and mortgage credits in respect of service
provided to the consumer- the most significant specification of mortgage system is
securitization of credits and dealing with them in secondary markets. And this is a
condition that facilitates the financial institutions providing credit to find new funds. The
recent global finance crisis experience -which had showed up in mortgage markets in
USA- had shown that the control of risk is hard in mortgage system especially due to
securitization of credits.
And the type of credit being made available in case of financing requirements in first and
second hand auto purchases is known as auto credit. Besides these, the credits used for
financing of education, marriage or any other requirement are being specified as personal
credits.
4.5. Consumer Credits in Turkey
The decrease in interest rates and the financial stability environment in economy that
occurred in Turkey following the crisis of 2000-2001 had caused the increase of consumer
credits that had been made available along with the effect of positive atmosphere in global
markets. The increase of consumption and spending tendency of household had also

49
supported the development in subject, and the share of consumer credits among total
credits had showed an increase.
In this part of the study, the development of consumer credits in Turkey as per years and
their current state will be presented. Within this scope, the consumer credits will be
examined by subtypes as being housing credits, personal credits, auto credits, other credits
and personal credit cards. The results obtained will provide a foundation for the analyses to
be performed in the following sections.
4.6. Development of Consumer Credits in Turkey
The consumer credits had first been made available in Turkey in 1989. High deposit
moneys accumulated in banks along with freeing interest rates on deposit in 1980s,
requirement for product diversification incited by decreasing profit margins by the
increasing competition conditions in banking and policy of banks to distribute the risk and
spread it to base may be listed among the factors that had directed the banks to consumer
credit.
The banks, along with competition, had deemed the personal financing field –which had
been previously financed by sellers through instruments such as notes- as an opportunity.
Thus, the banking sector having very low customer population had directed to consumer
credits whose development potential was high. Moreover, as the investment demands of
the enterprises had decreased along with the increase of uncertainty and as the credits to be
made available to companies opening to public had remained in hand along with the
development of capital markets, the banks had directed their funds to consumer credits.
And the high interest policy applied had directed the large enterprises to their own equities,
and the consumers not having interest bargaining power had become more attractive for
the banks instead of small enterprises with high risk.
On the other hand, as majority of the deposit money resources of banks arise from personal
deposit money, the consumer credits had functioned as stabilizer in between the deposit
money resource and the section using the funds. The lower amount of consumer credits
compared to commercial credits is decreasing the risk of consumer credits, it is affecting
the demand less in periods of recession, and it is facilitating conformity to changing

50
conditions. In respect of credit evaluation, the consumer credits are requiring less technical
qualification, and their encashing is being easier (Arslan and Karan, 2009).
And in Turkey, decrease of cash purchase opportunity of goods and services along with the
real decline of personal income under inflationary environment prior to crisis of 2001,
stable growth that occurred in 2000s, increase of the value of assets that had been
collateralized against credits, optimist atmosphere in economy (Başcı, 2006) and decreases
in savings had been factors of increase of demand for consumer credits. When the change
encountered by consumer credits and personal credit cards in between 2002-2014 is
considered, it more clearly being observed that the consumer credits had showed an
increase.
Figure 1. Consumer Credits and Personal Credit Cards (million TRY)
Source: CBRT
As per the Figure 1, while the consumer credits were at the level of 35 million TRY in
1993, that figure had increased to 28 billion TRY in 2005, and to 268 billion TRY in 2014.
And while the amounts of personal credit cards were at the level of 5 million TRY in 1993,
it had increased to 17 billion TRY in 2005, and to 72 billion TRY in 2014. On the other
hand, significant increase had occurred in the number of credit card after year 2002.
As per the data of Interbank Card Center (ICC), the number of credit cards, being about 47
million units by the beginning of 2011, had increased to about 57 million units by the end
of 2014. The rapid increase in consumer credits had caused the share of such credits
among the total credits of banks to increase.
0
50,000
100,000
150,000
200,000
250,000
300,000
350,000
1993 1995 1997 1999 2001 2003 2005 2007 2009 2011 2013
Consumer Credits Personal credit cards Total
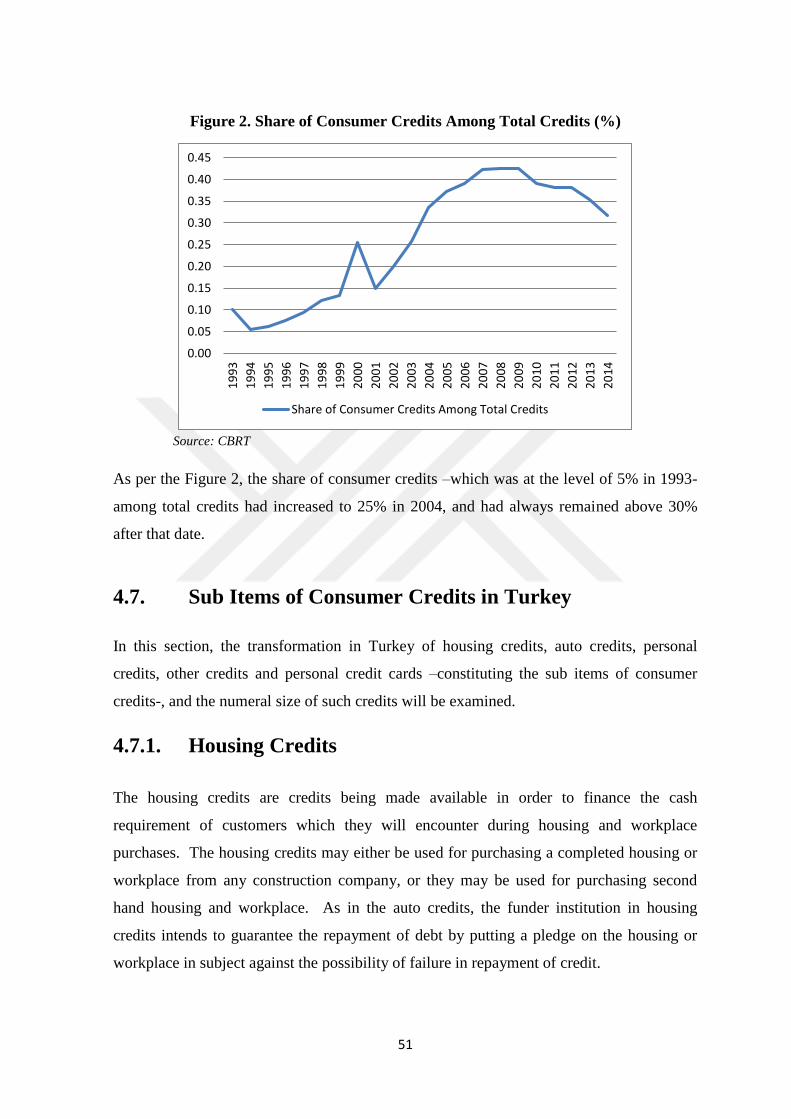
51
Figure 2. Share of Consumer Credits Among Total Credits (%)
Source: CBRT
As per the Figure 2, the share of consumer credits –which was at the level of 5% in 1993-
among total credits had increased to 25% in 2004, and had always remained above 30%
after that date.
4.7. Sub Items of Consumer Credits in Turkey
In this section, the transformation in Turkey of housing credits, auto credits, personal
credits, other credits and personal credit cards –constituting the sub items of consumer
credits-, and the numeral size of such credits will be examined.
4.7.1. Housing Credits
The housing credits are credits being made available in order to finance the cash
requirement of customers which they will encounter during housing and workplace
purchases. The housing credits may either be used for purchasing a completed housing or
workplace from any construction company, or they may be used for purchasing second
hand housing and workplace. As in the auto credits, the funder institution in housing
credits intends to guarantee the repayment of debt by putting a pledge on the housing or
workplace in subject against the possibility of failure in repayment of credit.
0.00
0.05
0.10
0.15
0.20
0.25
0.30
0.35
0.40
0.45
19
93
19
94
19
95
19
96
19
97
19
98
19
99
20
00
20
01
20
02
20
03
20
04
20
05
20
06
20
07
20
08
20
09
20
10
20
11
20
12
20
13
20
14
Share of Consumer Credits Among Total Credits
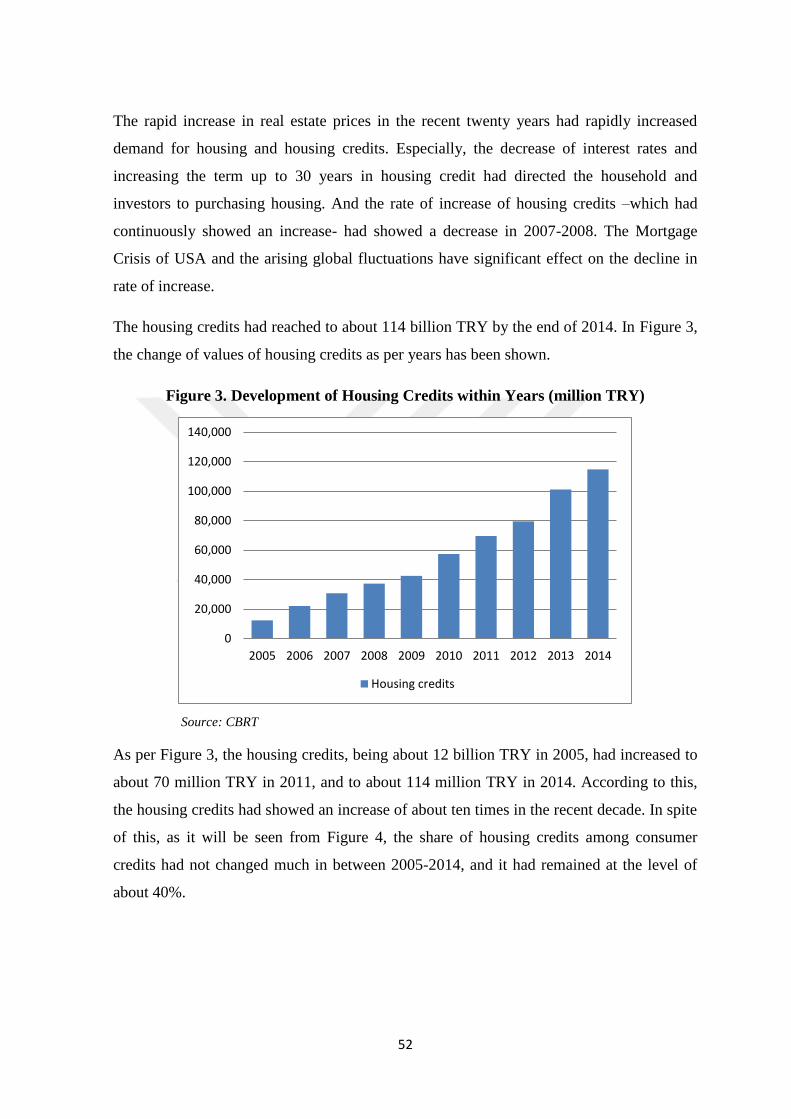
52
The rapid increase in real estate prices in the recent twenty years had rapidly increased
demand for housing and housing credits. Especially, the decrease of interest rates and
increasing the term up to 30 years in housing credit had directed the household and
investors to purchasing housing. And the rate of increase of housing credits –which had
continuously showed an increase- had showed a decrease in 2007-2008. The Mortgage
Crisis of USA and the arising global fluctuations have significant effect on the decline in
rate of increase.
The housing credits had reached to about 114 billion TRY by the end of 2014. In Figure 3,
the change of values of housing credits as per years has been shown.
Figure 3. Development of Housing Credits within Years (million TRY)
Source: CBRT
As per Figure 3, the housing credits, being about 12 billion TRY in 2005, had increased to
about 70 million TRY in 2011, and to about 114 million TRY in 2014. According to this,
the housing credits had showed an increase of about ten times in the recent decade. In spite
of this, as it will be seen from Figure 4, the share of housing credits among consumer
credits had not changed much in between 2005-2014, and it had remained at the level of
about 40%.
0
20,000
40,000
60,000
80,000
100,000
120,000
140,000
2005 2006 2007 2008 2009 2010 2011 2012 2013 2014
Housing credits

53
Figure 4. Share of Housing Credits Among Consumer Credits (%)
Source: CBRT
4.7.2. Auto Credits
The auto credits are credits being made available in order to finance the cash requirements
of the customers that they will encounter during their purchases of automobile, motorcycle,
cruiser, yacht, plane, caravan etc transportation autos. It is required to submit a document
regarding for the purchase of which transportation auto the credit will be used. Likewise,
auto pledge is a very significant issue in auto credits. The funder institution intends to
guarantee the repayment of debt by putting a pledge on the transportation auto in subject
against the possibility of failure in repayment of credit.
The decrease that occurred in bank interest rates after the crisis of 2000-2001, and increase
of credit supply by the banks had increased the credit demands of household. In the
increase in subject, the will of the household to actualize their suspended consumption
demands also has a significant share. The development of auto credits in between 2005-
2014 is being shown in Figure 5.
0.38
0.40
0.42
0.44
0.46
0.48
0.50
2005 2006 2007 2008 2009 2010 2011 2012 2013 2014
Share of Housing Credits Among Consumer Credits

54
Figure 5. Development of Auto Credits within Years (million TRY)
Source: CBRT
As seen from Figure 5, the auto credits -being about 6.128 million TRY in 2005- had been
6.925 million TRY in 2011, and 6.225 million TRY in 2014. In the period in between
2005-2014, the auto credits had followed a fluctuating course by the effect of global crises,
and they had not showed a change in recent decade in respect of amount. Thus, the
increase in auto credits had fell far behind the increase in other consumer credits.
While consumer credits had continuously increased in between 2005-2014, the share of
auto credits among consumer credits had showed a decline. As per Figure 6, this rate -
being at the level of 22% in 2005- had declined to 4% in 2011 and 2% in 2014. In the
decline in subject, the orientation of consumers to credits with lower interest rate has
significant share.
0
1,000
2,000
3,000
4,000
5,000
6,000
7,000
8,000
9,000
2005 2006 2007 2008 2009 2010 2011 2012 2013 2014
Auto Credits

55
Figure 6. Share of Auto Credits Among Consumer Credits (%)
Source: CBRT
When the term structure in auto credits is considered, it is being seen that a significant part
of the individual auto credits is middle and long termed, and a very small part of it is short
termed by 2014. On the other hand, the credits being made available are being allocated
with fixed rate. And thus, the sensitivity of auto credits to changes in interest rates is low.
4.7.3. Personal Credits and Other Credits
The personal credits are credits being made available in order to finance the cash
requirement of customers which they will encounter during goods and services purchases.
It is not required to prove for what the credit will be used by submitting a document. The
statement of the customer is sufficient on this issue. The payment of such credits is made
to the customer himself in cash or on account. These credits may be made available with
the purpose of financing all kinds of requirements of the consumers. But with the purpose
of enabling ease in marketing, some of them are named as vacation credit, education credit
etc. These credits are mostly credits being made available for durable goods, semi durable
goods, marriage, education and health, and the credits in subject had showed an increase in
years.
In fact, the personal credits –being 9.624 million TRY in 2005- had increased to 38.547
million TRY in 2008, to 85.709 million TRY in 2011, and to 147.651 million TRY in
0.00
0.05
0.10
0.15
0.20
0.25
2005 2006 2007 2008 2009 2010 2011 2012 2013 2014
Share of Auto Credits Among Consumer Credits

56
2014. The values that personal credits and other credits got in between 2005-2014 are
being shown in Figure 7.
Figure 7. Development of Personal and Other Credits within Years (million TRY)
Source: CBRT
The trend of increase in personal credits had increased the share of personal credits and
other credits among total credits. The personal credits and other credits is the credit type
having the highest share among consumer credits, and the share of credit type in subject
among total consumer credits is being shown in the following graph for years 2005-2014.
As per Figure 8, this rate -being at the level of 34% in 2005- had increased to 53% in 2011,
and to 55% in 2014.
0
20,000
40,000
60,000
80,000
100,000
120,000
140,000
160,000
2005 2006 2007 2008 2009 2010 2011 2012 2013 2014
Personal and Other Credits

57
Figure 8. Share of Personal and Other Credits Among Consumer Credits (%)
Source: CBRT
4.7.4. Personal Credit Cards
Even if consumer credits are generally being provided through personal customer
representation provided by the banks, credit cards are also being used in the use of credits
with low amount such as education and personal requirements compared to housing credits
and auto credits. Even if it actually seems as a type of consumer credits, the credit cards
are showing features different from consumer credits either by their usage volume or by
the options they provide.
Credit card is a card with predetermined limit provided by banks or financial institutions –
as maintaining the ownership- to their customers in order to be used for purchase of goods
and services within the country and abroad at contracted workplaces and for cash
withdrawal from cash payment units or automatic payment machines (Yılmaz, 2000). The
card holder is availing the credit card in two ways by meeting the short term cash credit
requirement as well as being freed of using cash in payments of goods and services. The
credit card intends to decrease the use of cash and cheque in expenditures (Durukan et al.,
2010).
In Turkey, credit card had first been issued with the name “Diners Club” in 1968. And then
American Express had got into the market. In 1975, Mastercard, Eurocard and Access
cards –as affiliated to Interbank group- had been launched to the market. And in 1981,
0.30
0.35
0.40
0.45
0.50
0.55
0.60
2005 2006 2007 2008 2009 2010 2011 2012 2013 2014
Share of Personal and Other Credits Among Consumer Credits

58
Visa credit card had started to be used in our country. In 1987, for the first time in Turkey,
the credit card named Pamukbank Prestige Card had formed its own credit system by
undertaking all the financing. And as from the beginning of 1990s, the cards issued by
large credit card institutions in the world had started to be commonly used in recent years,
and had replaced cash payments and other payment forms in our country as in the whole
world (Durukan et al., 2005).
Before entering into force of Bank and Credit Cards Law with no 5464, the relations
among institution issuing the card, member workplace and card holder had generally been
carried out as per the provisions of Code of Obligations, Law Regarding the Protection of
Consumers with no 4077, “Communiqué of Professional Classification Recommendation
Regarding Credit Card Implementations” of 08.03.1990 with no 924 and “Communiqué
Regarding Principles and Conditions that the Banks are Liable for in the Implementation of
Consumer Credit” of 09.25.196 with no 998 which were issued by the Banks Association
of Turkey (Kaya, 2009).
The development process of credit cards in Turkey is showing parallelism with European
countries. But in west, first the implementation of consumer credit had started, and then
credit card had been issued in order to ensure easy provision and use of consumer credits.
And in Turkey, against the development in the west, first the credit cards had started to be
used, and then consumer credit service (private banking) had started to be provided. There
is no credit card which has license in Turkey and which can also be used in other countries.
In Turkey, the banks are putting on the market the credit cards having validity in the world
and using systems of institutions whose licenses are in other countries (Kaya, 2005).
The credit cards had first been taken under the scope of Law with no 4822 regarding
making amendment in Law Regarding Protection of Consumer with no 4077, and Law
with no 4077. The regulatory provisions regarding credit cards had been subjected to
article 10/a added to Law with no 4077, sub-paragraphs (a) (b) (h) and (ı) of second
paragraph of article 10 by referral of the aforementioned article, and provisions of article
10 except paragraph 4. In article 10/A of Law with no 4077, the credits that turn to cash
credit as the result of purchase of goods or service by credit card, or credits used by
withdrawing cash by credit card had also been subjected to the provisions of article 10 of
Law. In other words, in the referred law, the credit card contract had been subjected to the

59
provisions of consumer credit contract. Thus, there is no credit relationship in the
implementation of credit card (Kaya, 2009).
In Turkey, either the number of credit cards or the usage volumes of credit cards are
showing a continuous increase by years. The numeral dimension it had reached is taking
the personal credit cards to a significant position in the banking and credit system of
Turkey.
As per the data of ICC, the numbers of credit cards had significantly increased in years,
and the number of credit cards –being about 20 million units by the end of 2003- had
increased to 37 million units in 2007, to 51 million units in 2011, and to about 57 million
units in 2014. And when the amounts of personal credit cards are considered, it is being
observed that numeral size is continuously showing an increase in parallel to the increase
in the number of cards. The change in subject is being shown in Figure 9 for years 2005-
2014.
Figure 9. Development of Personal Credit Cards within Years (million TRY)
Source: CBRT
As seen from Figure 9, the amounts of personal credit cards had continuously increased in
between 2005-2014. Number of personal credit cards –being 17.055 million TRY in 2005-
had increased to 54.374 million TRY in 2011, and to 72.699 million TRY in 2014. Thus,
the amounts of personal credit cards had showed an increase of about four time in between
2005-2014. While an increase had occurred in personal credit cards, the share of personal
0
10,000
20,000
30,000
40,000
50,000
60,000
70,000
80,000
90,000
2005 2006 2007 2008 2009 2010 2011 2012 2013 2014
Personal Credit Cards
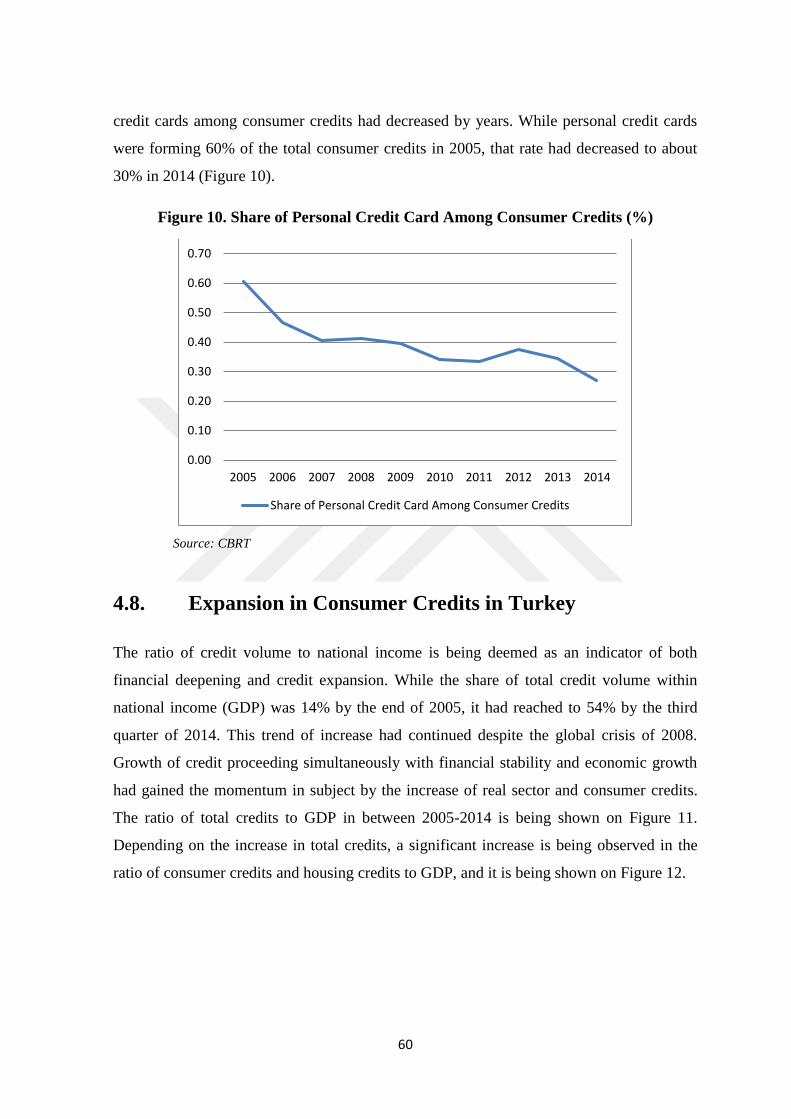
60
credit cards among consumer credits had decreased by years. While personal credit cards
were forming 60% of the total consumer credits in 2005, that rate had decreased to about
30% in 2014 (Figure 10).
Figure 10. Share of Personal Credit Card Among Consumer Credits (%)
Source: CBRT
4.8. Expansion in Consumer Credits in Turkey
The ratio of credit volume to national income is being deemed as an indicator of both
financial deepening and credit expansion. While the share of total credit volume within
national income (GDP) was 14% by the end of 2005, it had reached to 54% by the third
quarter of 2014. This trend of increase had continued despite the global crisis of 2008.
Growth of credit proceeding simultaneously with financial stability and economic growth
had gained the momentum in subject by the increase of real sector and consumer credits.
The ratio of total credits to GDP in between 2005-2014 is being shown on Figure 11.
Depending on the increase in total credits, a significant increase is being observed in the
ratio of consumer credits and housing credits to GDP, and it is being shown on Figure 12.
0.00
0.10
0.20
0.30
0.40
0.50
0.60
0.70
2005 2006 2007 2008 2009 2010 2011 2012 2013 2014
Share of Personal Credit Card Among Consumer Credits

61
Figure 11. Ratio of Total Credits to GDP (%)
Source: BRSA
Figure 12. Ratio of Consumer Credit, Housing Credit and SME Credit to GDP (%)
Source: BRSA
BRSA (2014), in order to measure whether the credit volume is following a course except
the expected trend, had performed an analysis in which the disintegration of credit/GDP
ratio from the trend value and the growth of the ratio in subject is assessed together by total
credit volume and credit types. Within this frame, excessive growth of credits had been
defined as divergence of credit/GDP by 1.5 standard deviation from the trend value, and as
increase of that ratio by more than 10%. It is being deemed that credit expansion occurs
when these two conditions take place together. Within this scope, in the examination
2005 2006 2007 2008 2009 2010 2011 2012 2013 2014
2005 2006 2007 2008 2009 2010 2011 2012 2013 2014

62
performed by using total credits, operating credits, consumer credits, housing credits,
credit cards and SME credits, indicators of significant expansion exist in consumer credits
and credit cards. In Figure 13, the dark blue lines are showing the credit/GDP ratio of the
relevant item, light blue lines are showing the trend of relevant ratio, and red dots are
showing the credit expansion periods conforming the description. As per Figure 13, it is
being observed that no significant credit expansion occurs in total credits. In spite of this,
as per Figure 14 it is being seen that consumer credits had significantly expanded in 2002,
2006 and 2011.
Figure 13. Expansion Periods of Total Credits (%)
Source: BRSA
Figure 14. Expansion Periods of Consumer Credits (%)

63
Besides the net transaction volume made by personal credit cards, the ratio of transaction
volume to GDP also shows increase in years in Turkey. As per Figure 15, while the ratio of
transaction volume of credit cards to GDP was about 22% in 2009, that rate had been 27%
in 2014.
Figure 15. Ratio of Transaction Volume of Credit Cards to GDP (%)
Source: ICC
As per the expansion analysis of credit cards again performed by BRSA (2012) and seen in
Figure 16, a significant expansion is being observed in credit card transaction volumes in
years 2004 and 2012.
Figure 16. Expansion Periods of Transaction Volume of Credit Cards (%)
Source: BRSA

64
We can more clearly assess the increase observed in consumer credits after the crisis of
2001 by comparing it with the increase in commercial credits. While the annual real
increase in commercial credits had been 17.1% in the period in subject, that rate had been
26.6% in consumer credits. As per Table 1, the growth rate in consumer credits had been
realized higher than the growth rate in commercial credits in many of the years. The same
condition is also valid for credits corrected as per PPI shown in Table 2.
Table 1. Annual Growth Rate as per Credit Types (%)
2009 2010 2011 2012 2013 2014
Total 8 34 28 16 31 30
Personal 14 30 29 20 26 19
-Credit cards 13 17 26 31 23 12
-Housing 16 34 22 15 28 22
-Automobile -16 22 26 9 6 -1
-Other 17 39 37 17 29 24
Commercial 5 36 28 14 34 36 Source: BRSA
Table 2. Annual Growth Rate as per Credit Types corrected as per PPI (%)
2009 2010 2011 2012 2013 2014
Total 2 23 13 13 23 16
Personal 7 20 13 17 18 6
-Credit cards 6 8 11 28 15 0
-Housing 10 24 8 13 20 9
-Automobile -20 12 12 6 -1 -12
-Other 10 28 20 14 21 10
Commercial -1 25 13 12 25 19 Source: BRSA
An additional approach based on credit (K) rate coefficient had also been used by BRSA
(2012) as complementary to the above analysis. The coefficient in subject is being defined
as the ratio of growth rate of credits to growth rate of national income (Y). In other words,
the coefficient of rate is =[(ΔK/K)/(ΔY/Y)]. The calculations of this ratio as per nominal,
real and real effective exchange rate are being presented in Figure 17 and Figure 18. As per
Figure 18, the increase rate of consumer credits in recent years is following a higher course
compared to increase rate of national income.
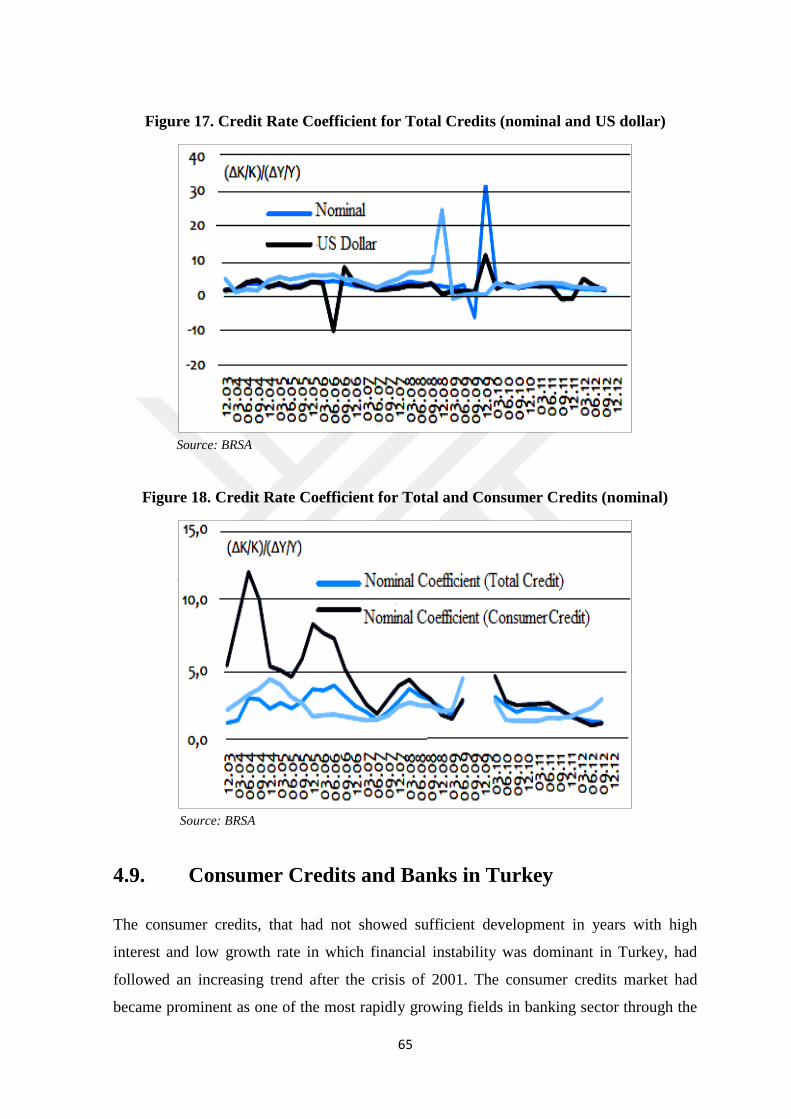
65
Figure 17. Credit Rate Coefficient for Total Credits (nominal and US dollar)
Source: BRSA
Figure 18. Credit Rate Coefficient for Total and Consumer Credits (nominal)
Source: BRSA
4.9. Consumer Credits and Banks in Turkey
The consumer credits, that had not showed sufficient development in years with high
interest and low growth rate in which financial instability was dominant in Turkey, had
followed an increasing trend after the crisis of 2001. The consumer credits market had
became prominent as one of the most rapidly growing fields in banking sector through the

66
decrease of public borrowing requirements, increase and predictability of income per
person, and decrease of borrowing costs of household.
As per Table 3, it is being observed that the consumer credit market have higher
concentration compared to total credits and commercial credits. In other words, it is being
observed that the top 10 banks of Turkey are making consumer credits available with a
higher ratio compared to other banks. In spite of this, it is being observed that the share of
small scaled banks within total consumer credits is low compared to other credit types.
As per Figure 19, the share of large scaled banks within consumer credit market is 75%,
and the share of small scaled banks is 2%. It is being observed that the share of small
scaled banks within total consumer credits is low compared to other credit types.
As per Figure 20, the dominance of deposit banks is continuing also in the consumer
credits. 96.3% of the consumer credits had been made available by deposit banks in 2011.
And the share of participation banks is lower compared to total credits and commercial
credits with a level of 3.3%.
In Table 4, the consumer credits being made available in Turkey in fields except housing
had been compared with the consumer credits being made available in banking sectors of
other countries in fields except housing. As per the table, USA is ranking first in the order
of size, and Canada and Germany are following it. By 2009, the average of 27 EU member
states in other personal credits market is 68 billion Euros, and it is about 32 billion Euro in
Turkey.

67
Table 3. Bank Concentration in Consumer Credits
Consumer Credits (%) 2000 2001 2002 2003 2004 2005 2006 2007 2008 2009 2010 2011
Top 5 Banks 49,0 57,0 59,6 68,3 66,7 63,1 60,6 59,6 58,9 58,1 59,4 59,5
Top 10 Banks 72,5 80,5 86,9 91,2 91,7 86,8 87,0 87,2 87,3 88,0 89,0 89,6
Distribution as per Scale
Large Scaled 51,5 63,7 65,3 71,6 71,8 69,2 70,5 71,3 72,4 72,7 75,0 75,7
Medium Scaled 30,5 26,8 32,1 27,3 26,7 25,5 24,2 24,4 23,8 24,3 22,2 22,1
Small Scaled 18,0 9,6 2,6 1,1 1,4 5,2 5,4 4,3 3,8 3,0 2,9 2,1
Total 100,0 100,0 100,0 100,0 100,0 100,0 100,0 100,0 100,0 100,0 100,0 100,0
Functional Distribution
Deposit Banks 98,6 100,0 100,0 100,0 99,9 96,6 96,5 97,1 97,5 97,0 96,9 96,3
Development and
Investment 1,4 0,0 0,0 0,0 0,1 0,0 0,1 0,3 0,3 0,3 0,3 0,5
Participation Banks 0,0 0,0 0,0 0,0 0,0 3,3 3,3 2,6 2,2 2,7 2,9 3,3
Total 100,0 100,0 100,0 100,0 100,0 100,0 100,0 100,0 100,0 100,0 100,0 100,0 Source: BRSA

68
Figure 19. Concentration as per Scale in Consumer Credits
Source: BRSA
Figure 20. Concentration as per Function in Consumer Credits
Source: BRSA

69
Table 4. Consumer Credits Except Housing in the World (billion €)
Source: BRSA (*) The data of Turkey is the sum of credit cards, auto credits, personal credits and other
credits (excluding housing credit).
Billion € 2003 2004 2005 2006 2007 2008 2009 Ratio to 2009
GDP (%)
USA 1.344 1.343 1.668 1.500 1.526 1.547 1.305 13,3
Canada 388 288 383 390 333 545 633 68,3
Germany 494 488 479 464 454 452 453 19,6
France 200 207 216 222 233 235 237 12,9
Spain 133 147 173 203 223 231 220 21,7
Italy 156 166 175 187 199 205 215 14,7
England 241 266 261 275 260 197 203 13,4
S. Korea v.y. v.y. v.y. v.y. v.y. 162 183 31,7
Russia v.y. v.y. v.y. v.y. v.y. v.y. 157 18,4
Australia v.y. v.y. 89 93 113 118 130 20,3
S. Africa v.y. v.y. v.y. v.y. v.y. v.y. 129 65,1
Sweden 54 57 62 70 74 69 76 27
Austria 29 46 56 54 56 57 56 21,2
Poland 14 20 24 29 40 45 51 17,1
Netherlands 43 46 48 52 47 48 46 8,4
Denmark 28 30 34 39 47 48 45 20,9
Ireland 17 20 25 29 32 33 33 20,9
Turkey* 7 13 21 25 37 37 32 7,5
Greece 14 19 23 28 30 31 30 13,1
Portugal 19 20 21 24 27 28 28 17,3
Finland 17 19 21 23 24 26 27 16,3
Hungary 3 5 6 8 11 14 27 30,2
Belgium 24 25 27 28 28 29 25 7,6
Romania v.y. 3 5 9 16 19 18 16,1
Argentina 5 6 9 10 11 13 13 6,1
Luxemburg 15 14 14 14 13 12 13 35,8
Czech Rep. 3 4 5 6 8 10 11 8,3
S. Cyprus GC v.y. v.y. 8 9 9 11 10 57,5
Bulgaria v.y. 2 3 3 4 5 6 17,7
Slovakia 0 1 2 2 3 4 4 6,6
Slovenia v.y. 3 3 3 4 4 4 11,9
Latvia 0 1 1 2 2 2 2 11
Lithuania v.y. 1 1 2 2 3 2 7,7
Estonia 0 0 1 1 1 1 1 7,5
Malta 1 v.y. 1 1 1 1 1 18
EU27 1.506 1.607 1.690 1.784 1.850 1.821 1.834 16,1

70
Economic growth performance, increase of income of household, high requirement for
quality housing, supply of housing being diversified and increasing by mass housing
project and other special projects, relevant regulations and decrease in real interest rates
had enabled the housing credit market to be one of the most rapidly growing banking
activities in recent years. As per Table 5, it is being observed that housing credits market is
a market that is concentrated at low level in respect of banks.
When the Figure 21 is examined as per scales, it is being observed that the small scaled
banks have a trend of decrease in housing credits market, and about 97% of the total
housing credits are being made available by large and medium scaled banks. In the housing
credit market –where intense competition exists-, large scaled banks are increasing their
shares in years.
When the Figure 22 is examined in functional aspect, the participation banks are
continuing with growth trend and the deposit banks are leading by 93%. The share of
participation banks -being 5.5% in 2010- had increased to 6.7% in 2011. And the rate in
subject is close to zero for the development and investment banks.
In Table 6, the housing credits in Turkey had been compared with the housing credits in
the banking sectors of other countries. As it will be seen from the Table, the negative
effects of the global crisis of 2008 had caused loosening of growth in housing credits in the
whole world. While USA had ranked first in housing credits, England and Germany had
followed it. Average housing credits volume in EU-27 is about 188 billion Euros in 2009.
And the housing credits of Turkey by 2009 are about 28 billion Euros. While housing
credits had a very small share in Turkish banking sector in the past year, it had been
reached to 11% of the total credits by 2009 along with strong growth. The rate in subject is
below 27% being the average of EU-27.

71
Table 5. Bank Concentration in Housing Credits
Source: BRSA
Housing Credits (%) 2002 2003 2004 2005 2006 2007 2008 2009 2010 2011
Top 5 Banks 59,9 11,3 63,9 59,7 56,6 56,5 55,8 54,1 54,3 54,8
Top 10 Banks 88,2 27,4 91,9 85,8 86,5 85,2 84,5 84,8 86,3 86,8
Distribution as per Scale
Large Scaled 44,7 57,0 60,6 64,4 66,9 66,1 66,8 66,9 69,3 70,7
Medium Scaled 50,1 40,3 36,6 28,7 25,9 26,6 27,5 28,8 26,8 26,9
Small Scaled 5,2 2,7 2,8 6,9 7,2 7,3 5,7 4,3 4,0 2,3
Total 100,0 100,0 100,0 100,0 100,0 100,0 100,0 100,0 100,0 100,0
Functional Distribution
Deposit Banks 100,0 100,0 100,0 95,2 94,4 95,0 95,5 94,8 94,5 93,3
Development and
Investment 0,0 0,0 0,0 0,0 0,0 0,2 0,3 0,2 0,1 0,0
Participation Banks 0,0 0,0 0,0 4,8 5,6 4,8 4,2 5,0 5,5 6,7
Total 100,0 100,0 100,0 100,0 100,0 100,0 100,0 100,0 100,0 100,0

72
Figure 21. Concentration as per Scale in Housing Credits
Source: BRSA
Figure 22. Concentration as per Function in Housing Credits
Source: BRSA

73
Table 6. Housing Credits in the World (billion €)
Billion € 2003 2004 2005 2006 2007 2008 2009 Ratio to 2009
GDP (%)
USA 2.264 2.479 3.161 3.188 2.997 3.127 3.007 30,7
England 908 975 1.065 11.530 1.100 787 992 65,7
Germany 937 950 961 976 968 960 962 41,6
France 385 432 495 570 643 691 716 38,9
Spain 278 336 448 547 627 658 657 64,8
Australia v.y. v.y. 320 349 404 391 560 87,3
Netherlands 302 332 369 383 393 376 378 68,7
Canada 117 261 337 315 429 329 372 40,1
Italy 154 185 217 244 266 264 280 19,1
Denmark 154 169 194 216 237 253 267 124,2
Switzerland v.y. v.y. v.y. v.y. v.y. 220 256 75,1
Sweden 84 98 107 126 134 128 152 53,9
S. Africa v.y. v.y. v.y. v.y. v.y. 144 143 72,1
S. Korea v.y. v.y. v.y. v.y. v.y. 125 142 24,6
Portugal 67 71 80 92 101 105 111 68,7
Ireland 55 74 95 111 124 115 110 69,7
Belgium 72 80 95 107 114 86 79 24,2
Austria 40 48 54 61 65 71 73 27,6
Finland 36 42 49 55 62 68 72 43,6
Greece 26 33 43 52 63 65 68 29,7
Poland 8 9 13 21 33 47 53 17,8
Turkey 0 1 8 13 19 18 21 4,9
Russia v.y. v.y. v.y. v.y. v.y. 29 27 3,1
Czech Rep. 5 7 10 14 19 23 26 19,7
Luxemburg 8 9 11 12 15 16 17 46,8
Hungary 6 8 9 11 12 15 15 16,8
S. Cyprus GC v.y. v.y. 4 6 7 9 10 57,5
Slovakia 1 2 3 5 6 9 9 14,8
Latvia 1 1 3 5 7 7 7 38,5
Estonia 1 2 3 4 6 6 6 45,3
Lithuania 1 1 2 3 5 6 6 23,2
Romania v.y. 0 1 2 4 5 6 5,4
Bulgaria v.y. 1 1 2 3 4 4 11,8
Slovenia 1 1 1 2 3 3 4 11,9
Malta 1 1 2 2 2 2 2 36,1
Argentina 2 1 1 1 2 2 2 0,9
S. Arabia 1 1 2 1 1 1 2 0,6
EU27 3.531 3.865 4.326 4.774 5.006 4.781 5.084 44,7 Source: BRSA

74
The credit cards market, that constitutes 8% of total credits and 25% of personal credits by
2011, is continuing to be the most significant field for banking sector. It is being observed
that the concentration in the market in subject is higher than other credit items. When the
Table 7 is considered, the shares of the top 5 and top 10 banks are 71% and 93%
respectively. When compared with other credit items, it is being observed that the shares in
subject are high for credit cards.
In credit cards market, the credit risk -incurred by the banks due to not collecting the cost
of product and any assurance within the credit process- being higher when compared with
credit items is causing the consumers to get service by higher costs from this market. In
addition, the credit card market has a significant place among channels of access to
customers by the banks due to magnitude of customer number. This condition is increasing
the competition in the market in subject. Thus, it may be expected for the concentration in
the market in subject to decrease.
When considered as per scale groups in Figure 23, it is being observed that the decrease
trend in recent years in the market share of large scaled banks –in favor of the medium
scaled banks- had ended. The share of large and medium scaled banks in the total credit
card market is at the level of 98%. As per Figure 24, the dominance of deposit banks is
continuing in the structure of credit card market at functional dimension. And then follows
the participation banks.
In Table 8, the transaction volume of credit cards in Turkey had been compared with the
transaction volume of credit cards in other countries. As per the Table, it is being seen that
USA ranks first with a share of 39.1% regarding transaction volume of credit cards by
2010. While China and England are following USA, the share of Turkey in that period had
realized at the level of 1.6% as in the previous year.

75
Table 7. Bank Concentration in Credit Cards
Credit Card (%) 2000 2001 2002 2003 2004 2005 2006 2007 2008 2009 2010 2011
Top 5 Banks 63,0 66,6 71,5 75,0 75,6 77,6 80,7 78,5 77,3 72,5 70,8 71,1
Top 10 Banks 83,6 87,6 90,2 91,8 93,7 93,6 94,8 93,2 92,6 92,5 92,7 93,3
Distribution as per Scale
Large Scaled 69,8 79,3 75,1 76,8 76,4 77,0 78,6 74,1 72,7 72,5 70,8 71,1
Medium Scaled 16,6 14,0 21,8 21,2 22,2 20,0 19,4 24,1 24,2 25,2 27,3 27,1
Small Scaled 13,6 6,7 3,1 2,0 1,4 3,0 2,0 1,9 3,1 2,3 1,9 1,9
Total 100,0 100,0 100,0 100,0 100,0 100,0 100,0 100,0 100,0 100,0 100,0 100,0
Functional Distribution
Deposit Banks 100,0 100,0 100,0 100,0 100,0 98,8 98,6 98,4 98,1 98,1 98,1 98,0
Participation Banks 0,0 0,0 0,0 0,0 0,0 1,2 1,4 1,6 1,9 1,9 1,9 2,0
Total 100 100 100 100 100 100 100 100 100 100 100 100
Source: BRSA

76
Figure 23. Concentration as per Scale in Credit Cards
Source: BRSA
Figure 24. Concentration as per Function in Credit Cards
Source: BRSA

77
Table 8. Credit Card Transaction Volumes in the World (billion €)
Billion $ 2006 2007 2008 2009 2010
USA 2.968,70 3.287,80 3.490,60 3.385,90 3.695,80
P.R.C. 241,6 406,3 576,9 1.004,90 1.540,60
England 631,9 758,6 748 657,8 702,7
France 354,8 425 485,5 472,3 480,5
Canada 336,8 392,2 432,8 403 468
S. Korea 305 362,2 357,6 329,9 401,2
Australia 191,3 237,6 268,7 269,7 336,8
Brazil 100,6 140 181,5 193,7 285,2
India 76,1 123,2 161,4 195 264,1
Germany 204,7 196,3 221,2 216,8 224
Italy 150,1 176,4 170,8 163,3 158,7
Turkey 70,1 100,2 131 121,7 148
S. Arabia 82,7 92,8 114,8 124,7 144,1
Netherlands 93,7 110,2 127,5 121,9 123,7
Sweden 73,7 90,7 105,2 93 109,8
Switzerland 55,9 63,3 74,5 75,5 81,9
Belgium 56,4 66,7 77 76,1 77,7
Russia 14,7 25,6 46,9 39,7 61,8
R.of S. Africa 43,4 55,7 281 228
Mexico 34,6 42 47,8 43,1 53
Singapore 20,9 26,7 32,6 33,3 40,7
Japan 305,7 335,8 417,7 4.109 3.933
Total 6.370,00 7.459,70 8.270,10 8.064,70 9.453,80 Source: BIS CPSS
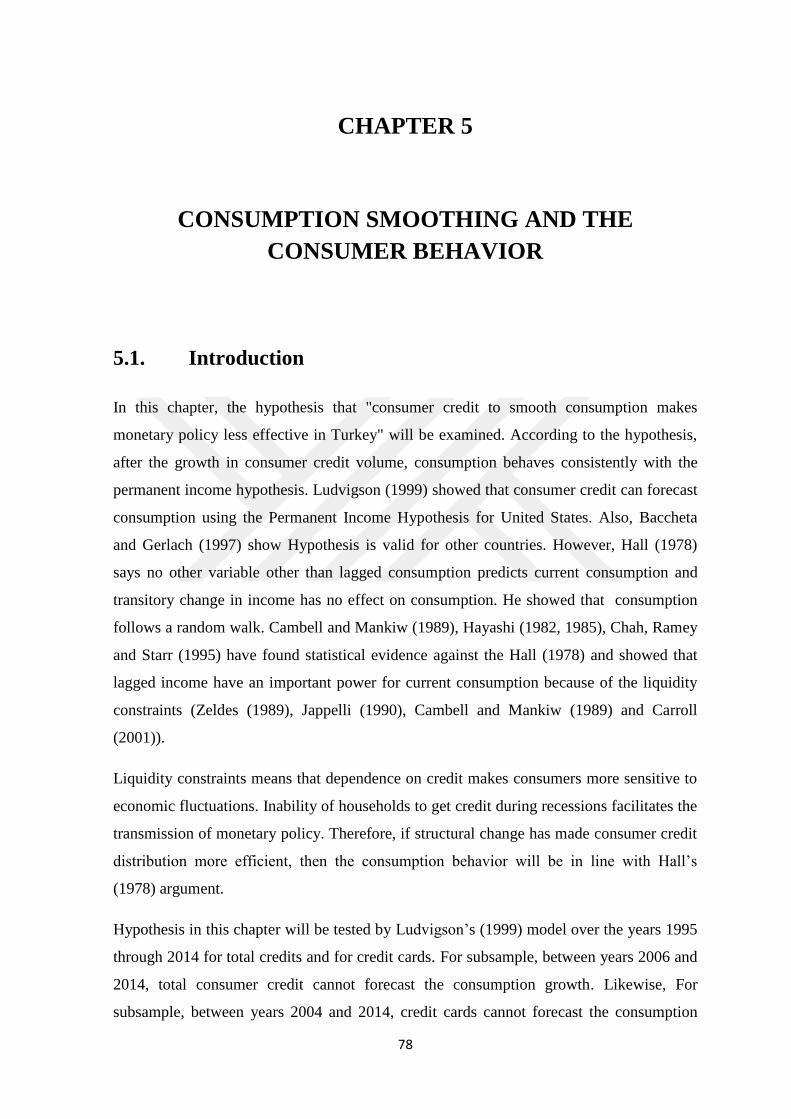
78
CHAPTER 5
CONSUMPTION SMOOTHING AND THE
CONSUMER BEHAVIOR
5.1. Introduction
In this chapter, the hypothesis that "consumer credit to smooth consumption makes
monetary policy less effective in Turkey" will be examined. According to the hypothesis,
after the growth in consumer credit volume, consumption behaves consistently with the
permanent income hypothesis. Ludvigson (1999) showed that consumer credit can forecast
consumption using the Permanent Income Hypothesis for United States. Also, Baccheta
and Gerlach (1997) show Hypothesis is valid for other countries. However, Hall (1978)
says no other variable other than lagged consumption predicts current consumption and
transitory change in income has no effect on consumption. He showed that consumption
follows a random walk. Cambell and Mankiw (1989), Hayashi (1982, 1985), Chah, Ramey
and Starr (1995) have found statistical evidence against the Hall (1978) and showed that
lagged income have an important power for current consumption because of the liquidity
constraints (Zeldes (1989), Jappelli (1990), Cambell and Mankiw (1989) and Carroll
(2001)).
Liquidity constraints means that dependence on credit makes consumers more sensitive to
economic fluctuations. Inability of households to get credit during recessions facilitates the
transmission of monetary policy. Therefore, if structural change has made consumer credit
distribution more efficient, then the consumption behavior will be in line with Hall’s
(1978) argument.
Hypothesis in this chapter will be tested by Ludvigson’s (1999) model over the years 1995
through 2014 for total credits and for credit cards. For subsample, between years 2006 and
2014, total consumer credit cannot forecast the consumption growth. Likewise, For
subsample, between years 2004 and 2014, credit cards cannot forecast the consumption

79
growth. In this section results of structural break tests for consumer credit will also be
reported. The methods of Harvey, Leybourne and Taylor (2006) has been used for the
structural break. Test indicate that structural breaks occurred in 2006 for total consumer
credits and in 2004 for credit cards.
5.2. The Permanent Income Hypothesis
Hall (1978) showed marginal utility and consumption follows a random walk. The amount
of consumption today represents predictable changes in income. Only past consumption
can predict the behavior of consumption. Short-run income changes cannot affect
consumption. Consumption can be changed by the policies affect permanent income.
However; Flavin (1981,1985), Hayashi (1982,1985), Cambell and Mankiw (1989),
Bacchetta and Gerlach (1997), Ludvigson (1999) show that past income and consumer
credit can predict consumption behavior. According to these studies, consumption behaves
in a different way from the permanent income hypothesis.
5.2.1. Description of Permanent Income Hypothesis
According to permanent income hypothesis, consumption depends only on permanent
income. Consumers distribute their consumption based on the marginal rate of substitution
between consumption today and consumption tomorrow. Consumers will only adjust its
consumption based on how the current income affects the permanent income. If the
consumer expects the high income today will be matched by a low income tomorrow, then
consumption today will not change. Conversely, if the rise in income today represents a
new permanent level of income, then consumption will increase.
Permanent income is determined by attributes, education, and occupation of the
households (Friedman (1957)). On the other hand, transitory income consists of cyclical
changes in income. If income is above what the household recognize to be normal,
consumption will then depend on two factors:
1) Consumption will increase to the degree that the increase in realized income is a change
in permanent income,

80
2) Consumption will increase by the proportion that the household typically consumes out
of permanent income.
If the consumers knows current prices, interest rates, and its future income then the above
two factors are all that matter for consumption. Friedman (1957) states that, "Let us
consider first the behavior of a consumer unit under conditions of complete certainty. It
knows for certain, we suppose, that it will receive a definite sum in each of a definite
number of time periods; it knows the prices that will prevail for consumer goods in each
period and the rate of interest at which it can borrow or lend. Under these conditions there
are only two motives for spending on consumption less or more than it receives in any time
period. The first is to "straighten out" the stream of expenditures by appropriate timing of
borrowing and lending, the unit can keep its expenditures relatively stable even though its
receipts vary widely from time period to time period. The second is to earn interest on
loans, if the interest rate is positive, or to receive payment for borrowing, if the interest rate
is negative. How it will behave under the influence of these motives depends, of course, on
its tastes." However, Friedman (1957) states the views above under the assumption of
consumers who have perfect information about their future income. If there is an
uncertainty about future income, some effects will be revealed on consumption behavior.
Uncertainty provides a reason why a household may fail to smooth consumption. Friedman
(1957) recognized that a household cannot know with certainty its future income. The
estimate of permanent income, therefore, will be based on the household’s expectation
over some short horizon. Friedman chooses a horizon of three years over which households
make an estimate of permanent income. As a result households may not be able to smooth
consumption (Mayer, 1972).
For example, one implication of uncertainty is borrowing constraints. Uncertainty about
future income makes it difficult for the household to borrow against future income (Carrol,
2001, Mayer,1972). If a household receives news that permanent income will increase in
the future, consumption should increase before the income is received. However, if the
household cannot borrow, consumption cannot increase. Consumption will increase only
when the household receives the income the next period.

81
5.2.2. Hall's Euler Equation Test
The contribution of Hall (1978)’s chapter was to formalize the stochastic implications of
the permanent income hypothesis. If consumers maximize expected future utility, the
conditional expectation of marginal utility is only a function of the current level of
consumption. Marginal utility follows a random walk, which implies that consumption
does as well (assuming that marginal utility is a linear function of consumption). The
optimizing consumer uses all available information each period about current and future
earnings to determine the current level of consumption. If the consumer fails to adjust
consumption immediately, then the adjustment will take place later, implying the consumer
is responding to old news. This runs counter to the assumption that the consumer react
immediately to an expected change in income (Carroll, 2001). All available information
important is realized in the current level of consumption.
If consumption behaves contrary to the predictions of the permanent income hypothesis
this does not necessarily disconfirm the hypothesis (Hall, 1978). If the lag structure of
income growth— say, six lags of income growth— is a reasonable measure of permanent
income then finding significant coefficients on lagged income is not necessarily
inconsistent with the Life Cycle-Permanent Income hypothesis. Though Hall (1978) finds
weak evidence that recent income levels and lagged stock prices predict current
consumption, he reasons that this m ay be explained by consumption taking time to adjust
to changes in perm anent income. If stock prices are correlated with changes in perm anent
income, then the predictive power of the stock price is picking this up. Overall, Hall
concludes that there is little reason to doubt the validity of the permanent income
hypothesis.
Hall concludes with a suggestion for policy makers, "With respect to the analysis of
stabilization policy, the findings of this chapter go no further than supporting the view that
policy affects consumption only as much as it affects perm anent income. In the analysis of
policies that are known to leave permanent income unchanged, consumption may be
treated as exogenous. Further, only new information about taxes and other policy
instruments can affect perm anent income. Beyond these general propositions, the policy
analyst must answer the difficult question of the effect of a given policy on permanent
income in order to predict its effect on consumption. Regression of current consumption on

82
current and past values of income are of no value whatsoever in answering this question (p.
986)."
However, research following Hall (1978) show that fluctuations in current income may
affect consumption and consumption is very precision to current income. For example, the
permanent income hypothesis can be expressed by the equation (1),
∆𝐶𝑡 = 휀𝑡 (1)
where current consumption is the optimal forecast of consumption in the next period and
휀𝑡 is the forecast error. If the residuals, 휀𝑡, shows some predictable behavior over time, then
the equation is misspecified. Moreover, Flavin (1981) and Hayashi (1982) show that
consumption displays “excess sensitivity” to current income. When they regressed
consumption growth on income, they have seen that lagged consumption is not the only
forecaster of current consumption.
Hall and Mishkin (1982) test this possibility using panel data and find that a portion of
consumers show excess sensitivity to current income. This is true for about 20 percent of
consumers. However, the authors argue this fraction is not enough to overturn Hall’s
(1978) original implications for policy—that unless aggregate demand policy affects
permanent income, then policy is unlikely to affect aggregate consumption in the short-run.
Cambell and Mankiw (1989) argue that a portion of consumers follow a “rule-of-thumb”
while the remaining portion abide by the permanent income hypothesis. However, for
Cambell and Mankiw (1989), the portion not abiding by the hypothesis is much higher
than indicated by Hall and Mankiw (1982), where a rule of thumb applies to approximately
half of all consumers. The rule-of-thumb consumer is “extremely reluctant to substitute
consumption intertemporally in response to interest rate changes” (Cambell and Mankiw
(1989, pl85).
Similar to Cambell and Mankiw (1989) other studies have sought specific reasons for the
failure of the permanent income hypothesis, emphasizing the importance of borrowing
constraints in explaining the empirical evidence against the permanent income hypothesis.
Though Hall (1978) does not fail to recognize that borrowing constraints or some other
market frictions may prevent consumers from maximizing intertemporal utility, as he
reiterates in Hall and Mankiw (1982). However, his conclusion is that these factors are not
83
consequential enough to impugn the permanent income hypothesis. That statement,
however, has not slowed further research.
5.2.3. Liquidity Constraints
The possibility that liquidity constraints explain part of the failure of the permanent income
hypothesis has inspired two related types of studies. The first estimates the significance of
consumer credit as a predictor of consumption— that consumption is excessively sensitive
to credit growth— much as previous papers emphasized the significance of income in
predicting consumption. Ludvigson (1999) undertakes this task with data on the United
States, while Bacchetta and Gerlach (1997) do so with international data. Both studies find
a significant role for consumer credit in predicting consumption behavior. The second type
of study, motivated by the failure of the permanent income hypothesis, focuses more on
estimating the presence of liquidity constraints. Such papers include Chah, Ramey and
Starr (1995), Shea (1995), Gross and Souleles (2002), Zinman (2003), as well as earlier
papers by Flavin (1985), Hayashi (1985), and Zeldes (1989).
Ludvigson (1999) shows that consumer credit growth is a significant predictor of
consumption growth, independent of income growth. She finds that “forecastable, or ex
ante, consumer credit growth has a significant influence on consumption that is
independent of the variation in predictable income growth "(1999, p434). That
consumption in the current period responds to a known change in consumer credit
indicates that consumers are unable to smooth consumption. She estimates consumption
growth where the null hypothesis is that consumption growth should only be explained
other variables. Ludvigson finds that predictable credit growth is a significant determinant
of consumption growth, independent of income growth. She notes, “the tests . . . show that
consumption grow this correlated with not just predictable income growth (as has been
extensively documented), but also with predictable consumer credit growth. T he result is
striking because is does not represent a simple contemporaneous correlation between credit
and spending” (Ludvigson (1999, p.442).
Ludvigson (1999) motivates the empirical result with a model in which a consumer
maximizes lifetime utility subject to a time-varying borrowing constraint. The borrowing
constraint is modeled to vary over time where the upper limit is stochastic and dependent
on current income of the individual, as well as on general economic conditions.

84
In the model, when lifetime resources of are sufficiently low, a household spends all of
current income and borrows up to a current credit limit after accounting for interest and
principle owed on current debt holdings. In this situation, spending is completely
determined by the time-varying credit constraint. However, when resources are high,
spending is not determined by the credit limit as consumers can borrow and repay debt to
smooth consumption. An important implication of the model is that even when
unconstrained, households still respond to a change in their credit limit, since lifetime
resources are a function of the borrowing ceiling or limit.
The effect on consumption from a change in the credit constraint comes from two
channels. One, the credit constraint affects consumption through its affect on current
resources. Two, the credit constraint also affects consumption through general economic
conditions, where an economy-wide shock can change the constraint independent of
income. So, “even when consumers are unconstrained, today’s economic condition affects
current consumption because it affects the likelihood of being constrained tomorrow ”
(Ludvigson, 1999, p.440).
Bacchetta and Gerlach (1997) examine data for five countries (the US, Japan, Canada,
Britain, and France) testing for the “excess sensitivity” of consumption to consumer credit
and mortgage credit. The bulk of their evidence is in support of Ludvigson (1999), that
consumer credit is a significant predictor of consumption. The authors confirm this is the
case for the United States and show this is also the case for the other countries. In most
countries, consumer credit dominates income as predictor of consumption.
Motivated by the type of policy concerns commented on by Hall (1978), Bacchetta and
Gerlach (1997) note that, “In central bank circles, in contrast, it is frequently taken for
granted that the behavior of consumption is critically influenced by the availability and
cost of credit, and that consumption plays an important role in the transmission mechanism
” (p.208). In a final rejoinder to Hall (1978) Bacchetta and Gerlach (1997) conclude, “Our
results lead us to believe that this view (Hall’s) is incorrect, and that monetary policy could
exert powerful effects on consumption by affecting credit” (p. 235).
Consistent with the message of these two papers are studies that document the existence of
liquidity constraints. Both Flavin (1981, 1985) and Hayashi (1982, 1985) test specifically

85
for the liquidity constraints. The former argues that the presence of liquidity constraints
helps explain the excess sensitivity of consumption to current income, while the latter
focuses on the cross-sectional differences between households and finds evidence
suggestive of the presence of borrowing constraints on a portion of the sample.
Specifically, the constrained household consumes less than desired.
Chah, Ramey and Starr (1995) offer a similar conclusion, documenting that that the
forward looking-rational consumer espoused by Hall (1978) is limited in its ability to
smooth consumption, saying “Consumers are forward looking, but the horizon over which
they can smooth consumption is limited by capital market imperfections. The excess
sensitivity of consumption to predictable changes in income is attributable to liquidity
constraint” (1995, p285). The empirical evidence is supported by narrative evidence as
well. Jappelli (1990) finds that approximately 20 percent of families in the 1982 Survey of
Consumer Finances are “liquidity-constrained”.
Though empirically evident, the existence of liquidity constraints may only be of marginal
significance for the behavior of consumption. Hayashi (1985) qualifies his finding by
noting decline in consumption he documents is small. Also, Zeldes (1989) finds that
liquidity constraints are most important for younger households, which may not affect
aggregate consumption to a significant degree (which is tangentially consistent with
Jappelli (1990), who concludes that current income, wealth and age are the most important
determinants of the probability that consumer is denied a loan).
However, others disagree. Cox and Jappelli (1993) argue that even if the “effect of
liquidity constraints on consumption is small . . . the effect on household balance sheets
could conceivably be much larger. Credit constraints could affect leveraged purchases of
durables and housing" (p.l98). Cox and Jappelli (1993) conclude that constrained
households would increase debt by 75 percent given they became unconstrained. Also,
Mayfield (1989) shows that constrained households consume fewer durable goods relative
to nondurable goods than do unconstrained agents.
Some dissent entirely from the emphasis on liquidity constraints. Runkle (1990) offers an
alternative view that liquidity constraints cannot explain the excess sensitivity of
consumption and, in fact, his evidence is supportive of the perm anent income hypothesis
contrary to the evidence so far discussed. Shea (1995) also offers counter evidence to the

86
liquidity constraint school of thought, finding explanation for the excess sensitivity of
consumption in “loss-aversion” behavior of consumers rather than borrowing constraints or
even myopic behavior (see also Altonji and Siow (1987) for additional support of the
permanent income hypothesis). A recent chapter by Zinman (2003) uses credit cards to
assess the relevance of liquidity constraints in the time period considered in the above
studies. Zinman’s (2003) conclusion is more tempered than the outright dissidents,
presenting evidence that is supportive of the existence of liquidity constraints but not
conclusive.
Updating the debate, Gross and Souleles (2002) provide evidence that households may still
be liquidity-constrained. Using panel data on credit card data for the years 1995 to 1998
they conclude based on the response of individual credit card accounts that households still
appear to be liquidity-constrained. That is, the card holder is unable to borrow at desired
levels, so when the limit of the credit card is increased they quickly respond by running up
the balance. Their findings have economic implications as well, as about 20 percent
aggregate consumption is done with credit cards and about two thirds of households in the
United States have at least one credit card, while over half of the households are paying
interest on the balance (Gross and Souleles, 2002). In recent studies, Brady (2006, 2011)
uses a wide data from 1953 to 2004 and he finds that consumers are not in a liquidity
constrained manner.
Overall, the research on the behavior of consumption following Hall’s (1978) formulation
provides something of a mixed bag. On the one hand, Hall (1978)’s formulation is
arguably consistent with the data if one considers that households are slowly adjusting to
changes in permanent income, thus explaining any apparent excess sensitivity of
consumption. Others, however, reject the permanent income hypothesis, at least for a
portion of consumers. This implies that policies that influence income only temporarily
may yet have an effect on consumption, a la the motivations for Ludvigson (1999) and
Bachetta and Gerlach (1997). However, despite the findings of those researchers, the
possible policy implications may already be moot. The section that follows considers
whether the conclusions of Ludvigson (1999), Bachetta and Gerlach (1997) and Brady
(2006, 2011) still hold.

87
5.3. Econometric Methodology
This section follows the empirical strategy of Ludvigson (1999) by estimating a
consumption growth equation of the form (2),
∆𝑐𝑡 = 𝛼 + 𝛽𝐸𝑡−1∆𝑦𝑡 + 𝛾𝐸𝑡−1∆𝑟𝑡 + 𝛿𝐸𝑡−1∆𝑑𝑡 + 𝑒𝑡
(2)
The variables in the equation represents the followings;
c = consumption
y = income,
r = real interest rate,
d = credit growth,
E = expectations operator
et = error term
All data in the equation is quarterly. Real disposable income for income variable has been
used. Consumption expenditures represents the sum of nondurable consumption
expenditures and consumption service expenditures. For the interest rate, average of the
three month treasury bills has been used. Total consumer credit are used for d.
We will test whether total consumption can be explained by consumer credits in Turkey
between 1995 and 2014. If liquidity constraints have been relaxed, then the data is more
likely to be consistent with the permanent income hypothesis, and predictable consumer
credit growth should not be a significant explanator of consumption growth.
We estimate separately for two sample divisions. The first sample estimates from 1995 to
2006 and the second sample estimates from 2006 to 2014 for total credits. In chapter four,
as figure 14 displayed that there is a significant expansion in total consumer credits in
2006. For the credit card data, the first sample estimates from 1995 to 2004 and the second
sample estimates from 2004 to 2014. In chapter four, as figure 16 displayed that there is a
significant expansion in consumer credits in 2004.

88
5.4. Findings
Equation (2) is estimated using two-stage least squares, with the period t-3 lags and beyond
of the variables used as instruments. This strategy is followed for a number of reasons.
First, since consumption and income are jointly determined, ordinary least squares is
inappropriate and instrumental variable estimation is necessary. For Ludvigon’s (1999)
equation, since the period t-1 expected values of income growth and the other variables are
not observable, it is necessary to find variables to use in their place. The period t variables
are inappropriate instruments since under the null that the permanent income hypothesis is
true these variables are correlated with the error term Second, due to serial correlation
associated with time averaged quarterly data, the actual t-1 values of the regressors are also
inappropriate. Therefore, the instrument list includes the t-3 through t-4 lags of
consumption growth, income growth, credit growth credit, and the interest rate . All
variables are in expressed in logarithms except for the interest rate, which is in percent.
Tables 9-14 below display the results for equation above. Each table reports the estimated
coefficients, F test and robust standard errors in parentheses. In first three tables, total
credit growth has been used as an explanatory variable. In the last three tables, credit card
growth has been used as an explanatory variable. In each table, column one contains only
income growth as a regressor; column two adds the real interest rate; and column three
adds total credit growth or credit card growth.
For the table 9, in column one expected income growth is a significant predictor of
consumption growth at the one percent level in each model. While in column two, the real
interest rate is not a significant predictor of consumption growth. Column three reveals that
expected credit growth is a significant predictor of consumption growth at the one percent
level. Including credit growth lowers the coefficient estimate on income growth from 0.95
in column one to 0.79 in column three.

89
Table 9. Estimation of Consumption from 1995 to 2006
(Using Total Consumer Credits)
Constant 0.231***
(8.17)
0.232***
(8.16)
0.086***
(3.19)
Real Disposable
Income
0.954***
(54.80)
0.914***
(2.92)
0.794***
(3.68)
Real Interest
Rate -
-0.001
(-1.02)
-0.005
(-1.05)
Total Consumer
Credits - -
0.165***
(7.18)
𝑅2 0.266 0.267 0.376
F 13.650 8.989 747.556 Note: Robust standard errors in parentheses. *, ** and *** represent significance at 10%, 5% and 1%,
respectively.
Table 10 shows that extending the sample through 2014 changes the significance of credit
growth as a predictor. Income growth is still a significant predictor of consumption growth.
Predictable credit growth is significant at ten percent level.
Table 10. Estimation of Consumption from 1995 to 2014
(Using Total Consumer Credits)
Constant 0.259***
(8.24)
0.005*
(1.91)
0.005*
(1.77)
Real Disposable
Income
0.181***
(3.23)
1.701***
(3.06)
1.691***
(3.14)
Real Interest
Rate -
-0.004
(-0.79)
0.002
(0.78)
Total Consumer
Credits - -
0.005*
(1.91)
𝑅2 0.944 0.995 0.997
F 0.322 3297.5 4309.9 Note: Robust standard errors in parentheses. *, ** and *** represent significance at 10%, 5% and 1%,
respectively.
Table 11 is very different from the 1995-2006 sample. Firstly, expected income growth is
not a significant predictor of consumption growth for each model. This is consistent with
the permanent income hypothesis, where expected income growth should not be a
significant predictor of consumption growth. Secondly, The estimate for expected credit
growth is not statistically significant and so, this is consistent with the consumption
smoothing behavior of consumers.

90
Table 11.Estimation of Consumption from 2006 to 2014
(Using Total Consumer Credits)
Constant 0.047***
(4.30)
0.002
(0.08)
0.005
(0.21)
Real Disposable
Income
0.028
(-0.56)
0.020
(0.44)
0.336
(0.33)
Real Interest
Rate -
-0.004
(-0.74)
0.002
(0.78)
Total Consumer
Credits - -
0.020
(0.44)
𝑅2 0.994 0.996 0.995
F 4309.9 8595.585 11412.05 Note: Robust standard errors in parentheses. *, ** and *** represent significance at 10%, 5% and 1%,
respectively.
Estimation of consumption using credit card gives similar results. For table 12, in column
one expected income growth is a significant predictor of consumption growth at the one
percent level in model one, at the five percent level in model two and at the ten percent
level in model three. While in column two, the real interest rate is not a significant
predictor of consumption growth. Column three reveals that expected credit card growth is
a significant predictor of consumption growth at the five percent level. Including credit
growth lowers the coefficient estimate on income growth from 0.72 in column one to 0.075
in column three.
Table 12. Estimation of Consumption from 1995 to 2004 (Using Credit Cards)
Constant 0,131
(0,02)***
0,094
(0,02)***
0,068
(0,03)**
Real Disposable
Income
0,722
(0,06)***
0,053
(0,02)**
0,075
(0,04)*
Real Interest
Rate -
-0,505
(0,43)
-0,434
(0,69)
Credit
Cards - -
0,820
(0,35)**
𝑅2 0.221 0.293 0.298
F 21.650 10.989 43.941 Note: Robust standard errors in parentheses. *, ** and *** represent significance at 10%, 5% and 1%,
respectively.
Table 13 shows that extending the sample through 2014 changes the significance of credit
card growth as a predictor. Income growth is still a significant predictor of consumption
growth. However credit card growth is not a significant predictor of consumption.

91
Table 13. Estimation of Consumption from 1995 to 2014 (Using Credit Cards)
Constant 0,110
(0,025)***
0,106
(0,021)***
0,095
(0,016)***
Real Disposable
Income
0,073
(0,029)**
0,067
(0,023)***
0,055
(0,023)**
Real Interest
Rate -
-0,103
(0,114)
-0,042
(0,177)
Credit
Cards - -
0,023
(0,015)
𝑅2 0.911 0.944 0.998
F 0.157 5691.5 7425.9 Note: Robust standard errors in parentheses. *, ** and *** represent significance at 10%, 5% and 1%,
respectively.
Table 14 is very different from the 1995-2004 credit card sample. Firstly, expected income
growth is a significant predictor of consumption growth for the first model only. However,
it is not a significant predictor of consumption growth for the second and third models.
This is consistent with the permanent income hypothesis, where expected income growth
should not be a significant predictor of consumption growth. Secondly, The estimate for
expected credit card growth is not statistically significant and so, this is consistent with the
consumption smoothing behavior of consumers.
Table 14. Estimation of Consumption from 2004 to 2014 (Using Credit Cards)
Constant 0,048
(0,034)
0,058
(0,030)*
0,057
(0,028)*
Real Disposable
Income
0,121
(0,062)*
0,023
(0,015)
0,048
(0,034)
Real Interest
Rate -
-0,154
(0,105)
-0,114
(0,098)
Credit
Cards - -
-0,434
(0,696)
𝑅2 0.990 0.993 0.996
F 7721.95 9965.441 15619.11 Note: Robust standard errors in parentheses. *, ** and *** represent significance at 10%, 5% and 1%,
respectively.

92
5.5. Comments
As a result, For the 2006 to 2014 sample, neither expected credit growth nor income
growth are statistically significant predictors of consumption growth. These results are
consistent with the conception of the permanent income hypothesis, where neither variable
should help predict the behavior of consumption. This result is also true when the credit
card growth considered for the 2004 to 2014 sample. However, the invalidity of permanent
income hypothesis can only be argued in pre-2006 sample for total consumer credit growth
and pre-2004 sample for credit card growth. So, the case for rejecting the permanent
income hypothesis is weaker than when using data for earlier decades. While statistical
rejection of the permanent income hypothesis has been motivated by the existence of
liquidity constraints.
Moreover, these results are consistent with hypothesis, where the growth in consumer
credit is associated with a decline in the lending channel of the monetary policy
transmission mechanism. When households have an easier time obtaining credit they can
smooth consumption during recessions, periods of financial distress, or during periods of
contractionary monetary policy. In other words, consumer behavior is able to come closer
to the conception of the permanent income hypothesis. As Hall (1978) argues, aggregate
demand policy that only has an effect on transitory income will have little to no effect on
consumption when households are able to borrow in anticipation of the change in income.
The results here suggest consumers are able to do this more in line with Hall’s expectation.
5.6. Identifying Structural Break
In the previous econometric model, we accepted that there is a structural break in 2006 for
total consumer credits and in 2004 for credit cards. However, we do not provide an
evidence about these structural break points. In this part, we will consider a question: Is
there a break in the trends of consumer credits and credit cards and if there is a break,
when is it occur?
Let 𝑝𝑡 denote the natural logarithm of the quarterly consumer credit (or credit card) at time
t. We consider the following model which allows for a change in the slope of the data.

93
𝑝𝑡 = 𝜇 + 𝜃𝑡 + 𝛾𝐷𝑇𝑡 + 𝑢𝑡 𝑡 = 1,2, … , 𝑇 (3)
where,
𝐷𝑇𝑡 = {𝑡 − 𝑇𝑏 𝑖𝑓 𝑡 > 𝑇𝑏
0 𝑖𝑓 𝑡 ≤ 𝑇𝑏
and 𝑇𝑏 is the break date, 𝜇 is the intercept, 𝜃 is the average consumer credit volume before
the break, and 𝛾 is the change in the average consumer credit volume after the break. The
error process {𝑢𝑡} satisfies:
𝑢𝑡 = 𝛼𝑢𝑡−1 + 휀𝑡 𝑡 = 2,3, … , 𝑇 𝑢1 = 휀1
휀𝑡 = 𝑑(𝐿)𝑒𝑡 𝑑(𝐿) = ∑ 𝑑𝑖
∞
𝑖=0
𝐿𝑖 ∑ 𝑖
∞
𝑖=0
|𝑑𝑖| < 0 𝑑(1)2 > 0
(4)
where 𝑒𝑡 is is a martingale difference sequence with 𝐸(𝑒𝑡|𝑒𝑡−1, 𝑒𝑡−2, … ) = 0,
𝐸(𝑒𝑡2|𝑒𝑡−1, 𝑒𝑡−2, … ) = 1, 𝑠𝑢𝑝𝑡𝐸(𝑒𝑡
4) < ∞ and L is the lag operator. The error process {𝑢𝑡}
is stationary, I(0), if |𝛼| < 1, while it is non stationary, I(1), if 𝛼 = 1.
Any change in the consumer credit volume requires that 𝛾 is non-zero. Our interest focuses
on testing the null hypothesis of no structural break, 𝐻0: 𝛾 = 0, versus the alternative that
breaks are present, 𝐻𝐴: 𝛾 ≠ 0. To test the hypothesis about 𝛾, we use new structural break
tests proposed by Harvey, Leybourne and Taylor (2006) (HLT) which are based on OLS
estimates and are robust to strong serial correlation and a unit root in the errors.
Additionally, no prior knowledge about whether the errors are I(0) or I(1) is required. This
is substantially useful in empirical applications.
The HLT statistic is formed as the weighted average of t-statistics appropriate for I(0) and
I(1) errors. When the true break date 𝑇𝑏 is known and the 𝑢𝑡 is I(0) with ∝= 0 in equation
(2), then the standard t-statistic, denoted by 𝑡0(𝑇𝑏), can be used to test the null hypothesis
𝐻0: 𝛾 = 0 in (1). On the other hand, if the 𝑢𝑡 is I(1), then the optimal t-statistic should be
based on the first differences of the data. First differencing equation (3) yields equation (4),
which is the equation for consumer credits.

94
∆𝑝𝑡 = 𝜃 + 𝛾𝐷𝑈𝑡 + ∆𝑢𝑡 𝑡 = 2,3, … , 𝑇 (5)
where,
𝐷𝑈𝑡 = {1 𝑖𝑓 𝑡 > 𝑇𝑏
0 𝑖𝑓 𝑡 ≤ 𝑇𝑏
and the optimal t-statistic, denoted by 𝑡1(𝑇𝑏), tests the null hypothesis 𝐻0: 𝛾 = 0 in (5).
When it is not known whether the errors are I(0) or I(1), it is not clear whether to work
with the levels or the first differences in the data. The HLT statistic is based on the
weighted average of the t-statistics from the regression in levels and the regression in first
differences. The weight function 𝛿( ), which is given by
𝛿(𝑆0(𝑇𝑏), 𝑆1(𝑇𝑏)) = 𝑒𝑥𝑝 [−{500𝑆0(𝑇𝑏)𝑆1(𝑇𝑏)} 2] (6)
converges to unity when 𝑢𝑡 is I(0) and to zero when 𝑢𝑡 is I(1). The 𝑆0(𝑇𝑏) and 𝑆1(𝑇𝑏) are
the stationary test statistics of Kwiatkowski et al. (1992) calculated from the OLS residuals
of equations (3) and (5), respectively. For a given possible break date, 𝑇𝑏, the HLT statistic
is defined as
𝑡𝛿 = {𝛿(𝑆0(𝑇𝑏), 𝑆1(𝑇𝑏)) × |𝑡0(𝑇𝑏)|} + {[1 − 𝛿(𝑆0(𝑇𝑏), 𝑆1(𝑇𝑏))] × |𝑡1(𝑇𝑏)|} (7)
where |𝑡0(𝑇𝑏)| and |𝑡1(𝑇𝑏)| are the absolute values of the t-statistics associated with testing
the null hypothesis 𝐻0: 𝛾 = 0 in equations (1) and (3) respectively, with the implicit non
parametric long run variance constructed using the Barlett kernel with bandwidth 𝑀 =
[4(𝑇 ÷ 100)1/4]. The 𝑡𝛿 statistic will collapse to 𝑡0(𝑇𝑏) when 𝑢𝑡 is I(0), and to |𝑡1(𝑇𝑏)|
when 𝑢𝑡 is I(1). The asymptotic distribution of the 𝑡𝛿 statistic is standard normal.
For an unknown break date, HLT follow Andrew's (1993) approach and take the maximal
value of the t-statistics from equations (3) and (5),
𝑡0∗ = sup𝑇𝑏∈𝜔∗ |𝑡0(𝑇𝑏)|
𝑡1∗ = sup𝑇𝑏∈𝜔∗ |𝑡1(𝑇𝑏)|
(8)
calculated over the set of all possible breakpoints, 𝜔∗ = {𝑇∗, 𝑇∗ + 1, … , 𝑇 − 𝑇∗} where
𝑇∗ = (0.1)𝑇. Therefore, breakpoints near the end of the sample are not considered, a
technique known as trimming. The breakpoint estimators of 𝑇𝑏 are those associated with
95
the largest t-statistics and are given by �̂�𝑏 = 𝑎𝑟𝑔𝑠𝑢𝑝𝑇𝑏∈𝜔∗|𝑡0(𝑇𝑏)| and �̂�𝑏 =
𝑎𝑟𝑔𝑠𝑢𝑝𝑇𝑏∈𝜔∗|𝑡1(𝑇𝑏)| . For an unknown break date, the HLT statistic is defined as;
𝑡𝛿 = {𝛿(𝑆0(�̂�𝑏), 𝑆1(�̂�𝑏)) × 𝑡0∗} + 𝜑{[1 − 𝛿(𝑆0(�̂�𝑏), 𝑆1(�̂�𝑏))] × 𝑡1
∗} (9)
where 𝜑 is a constant chosen such that for a given significance level, the critical value of
the test is the same irrespective of whether 𝑢𝑡 is I(0) or I(1). In contrast to the known
breakpoint case, the asymptotic distribution of 𝑡𝛿 , with 𝑇𝑏 unknown, is nonstandard and
the critical values with the associated constants are reported in HLT.
The estimated break date is obtained by taking the weighted average of the breakpoint
estimates �̂�𝑏 and �̃�𝑏, i.e.
𝛿(𝑆0(�̂�𝑏), 𝑆1(�̂�𝑏)) × �̂�𝑏 + [1 − 𝛿(𝑆0(�̂�𝑏), 𝑆1(�̂�𝑏))] × �̂�𝑏} (10)
We use both known and unknown trend break date models for both total consumer credits
and credit cards. The former considers 2006 for total consumer credits and 2004 for credit
cards as a possible break dates because as will be remembered in chapter four, BRSA
reports accept the 2006 and 2004 as break dates for total consumer credits and credit cards
respectively. However, we have no idea about the quarters.
The empirical results are presented in Table 15 for both known and unknown break dates.
The results provide substantial evidence that total consumer credit growth rate changed in
2006 Q1 and credit card growth rate changed in 2004 Q1 in Turkey. The t-statistic rejects
the null hypothesis of no break for total consumer credits and credit cards at the 1 percent
level for known break date. However; according to unknown break date, the t-statistic
rejects the null hypothesis of no break for total consumer credits and credit cards at the 10
and 5 percent levels respectively. So, 2006 Q1 and 2004 Q1 dates are selected for total
consumer credits and credit cards respectively because of the high significance levels in
the econometric model.

96
Table 15. Empirical Results of the HLT Test
Known Break Date
𝑡𝛿(𝑇𝑏 = 2006 𝑄1)
Unknown Break Date
𝑡𝛿 𝑇𝑏
Total Consumer
Credit 2.812*** 2.247* 2003 Q3
Known Break Date
𝑡𝛿(𝑇𝑏 = 2004 𝑄1)
Unknown Break Date
𝑡𝛿 𝑇𝑏
Credit
Card 5.012*** 2.821** 2004 Q4
Note: The test statistics with***, **, * reject the null of no break at the 1, 5 and 10 percent level,
respectively.
Using the estimated break dates, the OLS estimates of 𝜃 and 𝛾 are reported in Table 16 for
total consumer credits and credit cards. The results show that both of them experienced a
positive change in the slope, implying higher growth rates in consumer credits.
Additionally, the results in Table can be used to show that the annual total consumer credit
growth rate was 25 percent before 2006 Q1 and it increased to 34 percent after 2006 Q1.
Similarly, the annual credit card growth rate was 20 percent before 2004 Q1 and it
increased to 27 percent after 2004 Q1. ((1.01856)12 − 1 = 0.25, (1.01856 +
0.00651)12 − 1 = 0.34, (1.01532)12 − 1 = 0.20, (1.01532 + 0.00532)12 − 1 = 0.27)
Table 16. Estimated Parameters of the HLT Test
𝑇𝑏
𝜇
𝜃
𝛾
Total Consumer
Credit 2006 Q1 10.63012 0.01856 0.00651
Credit
Card 2004 Q1 10.45117 0.01532 0.00532
Note: 𝑇𝑏 is the break date, 𝜇 is the intercept, 𝜃 is the average monthly inflation rate before the break, and 𝛾
is the change in the average monthly inflation rate after the break.
5.7. Conclusion
This chapter has provided evidence that the behavior of consumption accords with the
predictions of the permanent income hypothesis. This was shown to be the case once data
between 1995-2014 is appended to the debt-augmented consumption equation of
Ludvigson (1999). While Ludvigson (1999) and previous studies emphasized the empirical
failure of the permanent income hypothesis, the results of this chapter are consistent with

97
the interpretation that factors such as liquidity constraints—that once helped explained the
empirical deviation from the theory— are less important. In this view, households can
access credit more easily and smooth consumption. So, household behavior is less sensitive
to short-run changes in monetary policy than in previous decades.
Of course, this is not last word on the matter. While Ludvigson (1999) and Bacchetta and
Gerlach (1997) emphasize the importance of the consumer credit in predicting consumer
behavior. Their results are based on data from the early 1990s and before for USA..
However, Gross and Souleles (2002) provide a more up dated study of liquidity constraints
and the implications for the permanent income hypothesis. Using panel data on credit card
accounts over 1995 to 1998, they argue the data is consistent with the interpretation that
households use credit cards because they are liquidity-constrained in credit markets. Their
study implies that the short-run behavior of consumer credit and liquidity constraints are
still important in explaining the behavior of consumption, and this, as argued by Bacchetta
and Gerlach (1997), has important implications for aggregate demand policy.
Therefore, if Gross and Souleles (2002) results are indicative of the continued importance
of borrowing constraints, sounding the death knell on monetary policy’s ability to affect
aggregate consumption may be premature. In this view, the rising levels of consumer debt
associated with credit cards make household balance sheets more sensitive to rising interest
rates, and households will reduce consumption more in response to contractionary
monetary policy than they would have before.

98
CHAPTER 6
CREDIT CARDS AND LIQUIDITY CONSTRAINTS
6.1. Introduction
Rising interest rates can put the households in a liquidity-constrained manner. However,
this can be an idea stucked in the past, Gross and Souleles (2002) says that liquidity
constraints are still important because the large part of the consumer credits consist the
credit cards. So, households using credit cards are sensitive to increases in the interest
rates. When the central bank increases interest rates, the households using credit cards
decrease their consumption much more. Actually, the share of the credit cards in total
consumer credits is approximately is 30 percent in Turkey. So, the households in Turkey
can be still in a liquidity constrained situation (see Figure 10).
According to an another idea, households using credit card can smooth their consumption.
Because the credit card borrowing has increased too much since 2002 in Turkey and all the
consumers and the liquidity constrained households can reach the credit cards easily now.
So, the consumption smoothing can be a strong argument for the households nowadays if
we compared to twenty years ago. Despite high interest rates, credit cards allow for
borrowing with low transaction costs, circum venting liquidity constraints (Brito and
Hartley, 1995). So, the change in interest rates may not be an effect on households.
In recent studies, credit cards can sign the liquidity constrained borrowers. However; the
empirical study in this chapter shows that the increasing interest rate has no effect on
accessing credits for households. So, the policies of the central bank are not constrained the
borrowers to obtain credits. In the sample period between 2002 and 2014, credit card usage
has increased and this situation has made the households more liquid and conducted them
to consumption smoothing. If we look at this idea from the perspective of monetary policy;
if Central Bank apply a contractionary monetary policy, credit card liquidity increases

99
consistent with consumption smoothing. However, if Central Bank apply an expansionary
monetary policy, credit card borrowing will also increase.
In this chapter, the impulse response functions of credit card balances and credit card
liquidity to a change in monetary policy have been estimated. The response of the credit
liquidity to both contractionary and expansionary policy has been tested. The quarterly
data of commercial banks between 2002 and 2014 has been used. The data has been
obtained from the BRSA statistics. The unused portion of credit card lines has been used as
the credit card liquidity.
The main aim of this chapter to show that households are less liquidity constrained with
credit cards and so, monetary policies have no effect on consumption behavior in Turkey
from 2002 through 2014 by using the unused portion of credit card lines data. According
to traditional view of banking credit channel, consumers using credit card are more
sensitive to the interest rates and also to the monetary shocks. However, the empirical
results in this chapter shows the opposite of the traditional view. Consumers are not only in
a liquidity constraint but also they use credit cards as a shield to offset monetary policy
shocks. According to the findings in this chapter we can say that, monetary policies which
purposes to slow the credit card borrowing has a minor effect on consumption behavior.
Liquidity constraints are defined as a quantity constrain and reveals when a borrower does
not receive a certain amount of credit. According to Zeldes (1989), low-income consumers
are more affected than high-income consumers from the liquidity constraints. Jappelli
(1990) says that the liguidity constraint is significant for the consumers with low living
conditions. There are some other studies which argues liquidity constraints is valid for at
least a portion of consumers such as Mayfield (1988); Cox and Jappelli (1993), Jappelli,
Pischke and Souleles (1998).
6.2. Econometric Methodology
We aim to test the two hypothesis by calculating the impulse response functions of credit
card balances and credit card liquidity. First; credit card borrowing households are more
sensitive to a change in monetary policy and so, monetary policy of Central Bank in
Turkey is more efficient for at least on consumers. This hypothesis strongly defends by

100
Bernanke and Gilchrist (1995) and Bernanke, Gertler and Gilchrist (1996). According to
them, after the contractionary policy of Central Bank, the accessing to credit cards and also
consumption spending decreases. So, the contractionary policy of the Central Bank spreads
to the overall economy by the transmission mechanism of balance sheet as discussed in
Chapter one. Second; credit card borrowing households are less sensitive to a change in
monetary policy and so, monetary policy of Central Bank in Turkey is less efficient for at
least on consumers. According to this hypothesis, credit cards provide consumers liquidity.
After the contractionary policy of Central Bank, consumers can access credit card liquidity
easily and credit card borrowing increases. So, consumption will not decline, after the
contractionary policy of Central Bank. The second hypothesis strongly defends by Brady
(2006, 2011) for USA.
The impulse response functions of credit card balances and credit card liquidity to a change
in monetary policy have been estimated. The response of the credit liquidity to both
contractionary and expansionary policy shocks has been tested. The quarterly data of
commercial banks between 2002 and 2014 has been used. The data has been obtained from
the BRSA statistics. Data set includes the balances on credit card borrowing and the
portion of credit card lines that used. So, we can find the unused portion of credit card lines
easily from data. The unused portion of credit card lines has been used as the credit card
liquidity.
6.3. Credit Card Liquidity
In this study, credit card liquidity is defined as the unused portion of credit card lines.
Unused portion of credit card lines can be used whenever he wants by the credit card
holder. The unused portion of the credit card line is not fixed. It can be change if
consumer request a higher limit from bank or bank increases the limit. If Central Bank
enforces a contractionary monetary policy, then credit cards offer liquidity immediately
(Brady, 2011). To test this hypothesis, we will measure the response of credit card liquidity
to monetary policy by using impulse response functions.

101
6.4. Estimating The Impulse Response Functions
The impulse response functions are calculated from a five variable system of consumption
(C), disposable income (DI), credit card liquidity (CCL), credit card balance (CCB) and
interest rate (IR). A typical approach to calculating impulse response functions from this
system is to estimate the variables in a vector autoregression (VAR). All variables are
quarterly. Real disposable income for disposable income variable has been used.
Consumption expenditures represents the sum of nondurable consumption expenditures
and consumption service expenditures. For the interest rate, average of the three month
treasury bills has been used.
6.4.1. VAR Model
The traditional use of time-series analysis was to forecast the time path of a variable.
Uncovering the dynamic path of a series improves forecasts since the predictable
components of the series can be extrapolated into the future. The growing interest in
economic dynamics has given new emphasis to time-series econometrics with a developed
methodology to decompose a series into a trend, seasonal, cyclical, and an irregular
component.
Univariate models are particularly useful for forecasting since they enable the prediction of
a series based solely on its own current and past realizations. Techniques such as
"intervention analysis" and "transfer function analysis" generalize the univariate
methodology by allowing the time path of the "dependent" variable to be influenced by the
time path of an "independent" or "exogenous" variable. If it is known that there is no
feedback, intervention and transform function analysis can be very effective tools for
forecasting and hypothesis testing. However, in practice it is not always known if the time
path of a series designated to be the "independent" variable has been unaffected by the time
path of the so-called "dependent" variable. In this case an alternative, nonstructural
approach to modeling the relationship between several variables is required.
The Vector Autoregression (VAR) arose, as an alternative to a style of macroeconomic
modeling that seemed not to produce useful forecasts in a period of rapid economic
change. VAR is commonly used for forecasting systems of interrelated time series and for
analyzing the dynamic impact of random disturbances on the system of variables. The

102
VAR approach sidesteps the need for structural modeling by modeling every endogenous
variable in the system as a function of the lagged values of all the endogenous variables in
the system. The most basic form of a VAR treats all variables symmetrically without
making reference to the issue of dependence versus independence.
The mathematical form of a VAR is:
𝑌𝑡 = 𝐴1𝑌𝑡−1 + ⋯ 𝐴𝑃𝑌𝑡−𝑝 + 𝐵𝑋𝑡 + 𝑒𝑡 (11)
Where Y, is a K vector of endogenous variables, 𝑋𝑡 is a d vector of exogenous variables,
𝐴1 … 𝐴𝑃 and B are matrices of coefficients to be estimated, and e, is a vector of
innovations that may be contemporaneously correlated with each other but are uncorrelated
with their own lagged values and uncorrelated with all of the right-hand side variables.
A VAR model is thought to provide a straightforward method of producing forecasts that
do not constrain how their variables affect one another. Unquestionably, a VAR will be
over parameterized in that many of these coefficient estimates can be properly excluded
from the model. However, the goal is to find the important interrelationships among the
variables. Improperly imposing zero restrictions may waste important information.
Moreover, the regressors are likely to be highly collinear, so that t tests on individual
coefficients may not be reliable guides for paring down the model. In practice, the size of a
VAR model is limited by the fact that each variable including lags appears in each
equation yet estimation requires sufficient degrees of freedom. The result is that the
number of variables and the lag lengths must be restricted.
To set up and to use a VAR, firstly the data transforms to such a form that a VAR can be
fitted to it. And secondly, value of lag length and dimension of 𝑌𝑡 and 𝑋𝑡 chooses
compatible with the size of data set available.
6.4.2. Unit Root Test
A popular test of stationarity is known as the Unit Root Test. To illustrate the use, the
following is considered:
𝑌𝑡 = 𝑌𝑡−1 + 𝑒𝑡 (12)

103
where 𝑒𝑡 is the stochastic error term that follows the classical assumptions, namely it has
zero mean, constant variance 𝜎2, and is non-autocorrelated. Such an error term is also
known as a white noise error term. The process is to take this first-order, or AR(l) and
regress the value of Y at time t on its value at time t-1. Now if the coefficient of is 𝑌𝑡−1in
fact equal to 1 there is a unit root problem, i.e. a nonstationarity situation. Therefore, if the
regression,
𝑌𝑡 = 𝑝𝑌𝑡−1 + 𝑒𝑡 (13)
is carried out and the result is that p = 1, then the stochastic variable Y, has a unit root. In
time series econometrics, a time series that has a unit root is known as a random walk time
series, indicating the variance of Y, increases steadily with time and goes on to infinity. If
the absolute value o f p is greater than one, the series if explosive. 𝑌𝑡 is a stationary series
if -1 < p < 1. Therefore, the hypothesis of a stationary series can be evaluated by testing
whether the absolute value of p is strictly less than one.
In its simplest form, the regression for equation above is estimated and the estimated p
coefficient is divided by its standard error to compute the Augmented Dickey-Fuller (ADF)
T statistic. If the computed absolute value of the T statistic exceeds the ADF absolute
critical T values, then the hypothesis that the given time series is stationary is accepted. If,
on the other hand, it is less than the critical value, the time series is nonstationary.
A major limitation of the ADF test is that it rests on the assumption that the error terms are
independently and identically distributed. This assumption does not hold in many cases
(see Akoena, 1996). The Phillips-Perron (PP) test relaxes the ADF assumptions of
independence and homogeneity by allowing the error term to be weakly dependent and
heterogeneously distributed. Thus, it has an advantage of being robust to a wide variety of
combinations of serial correlation and time-dependent heteroskedasticity. Furthermore, as
argued in Chiarini (1998), the results based on the ADF are likely to be questionable. The
reason being that for the ADF, the "appropriate lag-length" is unknown and a
"comprehensive simulation study has not been done on the significant levels" - if one
includes too many lags, the consequence will be a reduction in the power of the test, while
including too few lags may seriously distort the test. This problem is compounded by the
fact that different lag-lengths can often produce different results concerning the presence of

104
a unit root in the series. The outcome of the PP test concerning the presence of a unit root
is independent of the lag-length used. This is because the PP test modifies the test statistic
of Dickey-Fuller non-parametrically to account for the autocorrelation present in the DF
equation.
With these explanations, the first step in estimating the model was to determine the
existence of stationarity in the data sets. The ADF and PP tests was conducted on data. The
stationarity test was satisfied for a model with trend. The data was transformed into log
levels. The results from the tests are displayed in table.
According to ADF unit root test results in Table 17; CCB, CCL, consumption, disposable
income and interest rate variables are not stationary in the level. However, they became
stationary when the first difference of the variables taken. So, integration degree is I(1).
Table 17. ADF Unit Root Test Results
Variables ADF T Statistics
(Level)
ADF T Statistics
(1st Difference)
W/out Trend With Trend W/out Trend With Trend
CCB -0.812(2) -2.214(3)** -10.564(2)*** -10.566(3)***
CCL -0.121(4) -0.451(3) -8.117(3)*** -8.474(4)***
C -1.332(4) -0.698(4) -3.126(3) -7.112(4)***
DI -2.921 (2) -1.320(1) -5.085(2)*** -8.754(1)***
IR -1.542(4) -1.542(3) -11.986(8)*** -14.848(10)***
Critical
Value
1% -3.985 -2.552 -3.952 -2.586
5% -3.432 -1.923 -3.411 -1.893
10% -3.128 -1.594 -3.132 -1.621
Note: The values in parentheses indicate the lag length according to Modified Akaike's Information
Criterion. Maximum lag length is 12. *** significant at 1% level, ** significant at 5% level, * significant at
10% level.
To support the ADF tests, PP test was also conducted on data. The result from the PP test
are displayed in Table 18. Likewise, CCB, CCL, consumption, disposable income and
interest rate variables are not stationary in the level according to PP test. However, they
became stationary when the first difference of the variables taken. So, integration degree is
I(1).
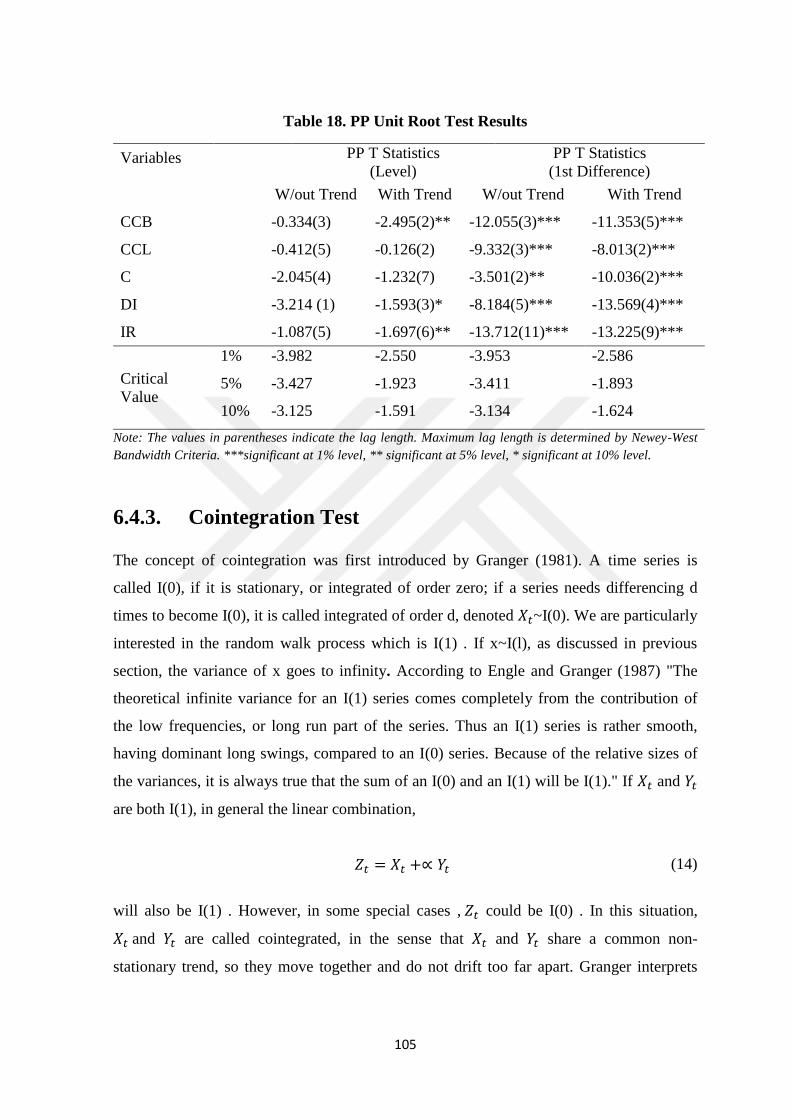
105
Table 18. PP Unit Root Test Results
Variables PP T Statistics
(Level)
PP T Statistics
(1st Difference)
W/out Trend With Trend W/out Trend With Trend
CCB -0.334(3) -2.495(2)** -12.055(3)*** -11.353(5)***
CCL -0.412(5) -0.126(2) -9.332(3)*** -8.013(2)***
C -2.045(4) -1.232(7) -3.501(2)** -10.036(2)***
DI -3.214 (1) -1.593(3)* -8.184(5)*** -13.569(4)***
IR -1.087(5) -1.697(6)** -13.712(11)*** -13.225(9)***
Critical
Value
1% -3.982 -2.550 -3.953 -2.586
5% -3.427 -1.923 -3.411 -1.893
10% -3.125 -1.591 -3.134 -1.624
Note: The values in parentheses indicate the lag length. Maximum lag length is determined by Newey-West
Bandwidth Criteria. ***significant at 1% level, ** significant at 5% level, * significant at 10% level.
6.4.3. Cointegration Test
The concept of cointegration was first introduced by Granger (1981). A time series is
called I(0), if it is stationary, or integrated of order zero; if a series needs differencing d
times to become I(0), it is called integrated of order d, denoted 𝑋𝑡~I(0). We are particularly
interested in the random walk process which is I(1) . If x~I(l), as discussed in previous
section, the variance of x goes to infinity. According to Engle and Granger (1987) "The
theoretical infinite variance for an I(1) series comes completely from the contribution of
the low frequencies, or long run part of the series. Thus an I(1) series is rather smooth,
having dominant long swings, compared to an I(0) series. Because of the relative sizes of
the variances, it is always true that the sum of an I(0) and an I(1) will be I(1)." If 𝑋𝑡 and 𝑌𝑡
are both I(1), in general the linear combination,
𝑍𝑡 = 𝑋𝑡 +∝ 𝑌𝑡 (14)
will also be I(1) . However, in some special cases , 𝑍𝑡 could be I(0) . In this situation,
𝑋𝑡 and 𝑌𝑡 are called cointegrated, in the sense that 𝑋𝑡 and 𝑌𝑡 share a common non-
stationary trend, so they move together and do not drift too far apart. Granger interprets

106
this as long run equilibrium, 𝑍𝑡 being the stationary deviations from the equilibrium (called
equilibrium errors), and the constant ∝ is called cointegrating parameter.
The concept of cointegration is very important for a VAR specification, since as Engle and
Granger (1987) show, if the variables of a vector x are cointegrated, the appropriate model
is an error correction model, rather than a VAR in first differences. Thus before specifying
a VAR model, we need to test for cointegration.
Engle and Yoo (1987) suggest to use the following test procedures and provide the critical
values for cointegration test. The test consists of two steps. The first step fits the regression
𝑌𝑡 = 𝑎0 + 𝑎1𝑋𝑡 + 𝑍𝑡 (15)
where 𝑍𝑡 is the residual or the equilibrium error. At the second step, we use the Dickey-
Fuller test and the Augmented DF test to see if the estimated 𝑍𝑡 is a unit root process. If 𝑍𝑡
has a unit root, we cannot say that 𝑋𝑡 and 𝑌𝑡 are cointegrated. Table 19 reports the
cointegration test results. Almost all pair of variables can pass the augmented tests. The
equation for the cointegration is;
(1 − 𝐿)𝑢𝑡 = 𝜌𝑢𝑡−1 + ∑ 𝛿(1 − 𝐿)𝑢𝑡−𝑖
𝜌
𝑖=1
(16)
The null in t-tests is 𝜌 =0. If the null cannot be rejected, then variables being tested are not
cointegreted. Critical values are from Engle and Yoo (1987).
Table 19. Cointegraion Test Results
Variables p DF(t) p ADF(t)
IR and CCB 0 -2.81** 4 -3.04*
IR and CCL 0 -1.85*** 4 -2.62**
IR and C 0 -3.03* 4 -3.05*
DI and C 0 -2.42** 4 -2.75**
DI and CCB 0 -1.12*** 4 -1.33***
DI and CCL 0 -3.01* 4 -2.54**
C and CCB 0 -3.73* 4 -1.86***
C and CCL 0 -1.96*** 4 -1.21***
Note: ***significant at 1% level, ** significant at 5% level, * significant at 10% level.

107
6.4.4. Granger Causality
The first stage of the analysis is to estimate the unconstrained VAR. VAR models are used
to test for causality in the sense of Granger (1969). According to Stokes (1991), a series
𝑋1𝑡 is said to Granger cause a series 𝑋2𝑡 if, and only if, a model that predicts 𝑋2𝑡 as a
function of only its past has a greater sum of squares of the error term than a model that
predicts 𝑋2𝑡 as a function of its own past and the past of𝑋1𝑡. We estimate the reduced form
VAR equation by equation in an OLS regression of the form;
𝑋𝑡 = ∑ 𝛼1𝑖𝐼𝑅𝑡−𝑖
4
1
+ ∑ 𝛼2𝑖𝐶𝑡−𝑖 ∑ 𝛼3𝑖𝐷𝐼𝑡−𝑖
4
1
4
1
∑ 𝛼4𝑖𝐶𝐶𝐵𝑡−𝑖 + ∑ 𝛼5𝑖𝐶𝐶𝐿𝑡−𝑖
4
1
+ 휀𝑡
4
1
(17)
where 𝑋𝑡 𝑖𝑠 𝐼𝑅𝑡 or 𝐶𝑡 or 𝐷𝐼𝑡 or 𝐶𝐶𝐵𝑡 or 𝐶𝐶𝐿𝑡. In order to test for Granger Causality we use
an F statistic to see if 𝛼1𝑖, 𝛼2𝑖 , 𝛼3𝑖 𝛼4𝑖 and 𝛼5𝑖 for i=l...q, are jointly significantly different
from zero.
Cooley and LeRoy (1985) give a explanation about what we can learn from a Granger-
causality test. They say: "Strict exogeneity does indeed imply Granger non-causality, so
that failure of a Granger or Sims test is evidence against strict exogeneity... But the
converse is not true: acceptance of Granger noncausality does not imply (although it is
consistent with) strict exogeneity..."
Table 20 reports the results of Granger causality tests. According to Table, IR Granger
causes C, CCB and CCL. CCB end CLL Granger causes C. DI Granger causes CCB and
CLL.
Table 20. Granger Causality Test Results
X 𝐻0: 𝛼1𝑖 = 0 𝛼2𝑖 = 0 𝛼3𝑖 = 0 𝛼4𝑖 = 0 𝛼5𝑖 = 0
IR - 0.33 (0.96) 0.03 (1.42) 0.04 (1.65) 5.42 ( 0.81)
C 1.56 (0.23) - 2.36(0.07) 4.60(0.03) 3.90 (0.08)
DI 0.44 (0.83) 0.61 (0.93) - 0.03 (1.27) 0.50(0.74)
CCB 2.06 (0.11) 1.42 (0.12) 2.93(0.03) - 1.53 (0.02)
CCL 2.28(0.08) 1.57 (0.23) 1.08 (0.39) 2.75(0.04) -
Note: F-ratio for null hypothesis. Significance level in brackets. A significant F-ratio is the evidence of
Granger-causality.

108
6.4.5. The Geweke Test
Since this study is particularly interested in the causality relationship between credit cards
(balance and liquidity) and IR, I also use the Geweke test, or the method of Frequency
Decomposition of a VAR model, to analyze the relationship of credit cards and IR.
Geweke (1982) shows that the linear dependence of 𝑋𝑡 and 𝑌𝑡, 𝐹𝑥,𝑦 is the sum of linear
feedback from X to Y, 𝐹𝑥→𝑦, linear feedback from Y to X, 𝐹𝑦→𝑥. These measures can be
further decomposed into the frequency domain to provide additional insight into the
dynamic structure implicit in the VAR model because we might define "short run" to mean
high frequency and "long run" to mean low frequency (Stokes, 1991).
Table 21 reports the results of the Geweke frequency decomposition, which come from a
regression of CCB on IR with six lags, where variables are in first differences. The first
block of the tables reports the overall result, the second and third blocks decompose the
feedback from IR to CCB and from CCB to IR in the frequency domain. In the table, the
"Estimate" columns report the estimate from the raw data, the "Adjusted Estimate"
columns report the estimate from a bootstrap with 100 replications. Here the idea is to
"draw samples of data having asymptotic distribution equal to the original data and
calculate the frequency measures." (Stokes, 1991) The "25%" and "75%" columns report
25% and 75% confidence intervals for these measures, also from the bootstrap with 100
replications.
As shown in Table 21, adjusted causality measures show that the effect of IR on CCB is
24.6%, and the effect of CCB on IR is only 0.9%. That means that the causality is running
from IR to CCB. This is consistent with the economic theory and the granger causality test
results. The decompositions of these measures in the frequency domain show that most the
effect of IR on CCB peaks at period 9. This finding is interesting, it is consistent with the
finding from the impulse response functions discussed below.

109
Table 21. Geweke Frequency Decomposition for CCB and IR
Estimate Adjusted
Estimate 25.0% 75.0%
F(IR to CCB) 0.172 (18.2%) 0.188 (24.6%) 0.157 0.301
F(CCB to IR) 0.007 (0.8%) 0.001 (0.9%) 0.001 0.001
F(IR to CCB)
Period Estimate Adjusted
Estimate 25.0% 75.0%
1 0.177 (16.4%) 0.323 (27.3%) 0.121 0.502
2 0.197 (18.0%) 0.380 (40.1%) 0.133 0.542
3 0.215 (19.4%) 0.431 (44.3%) 0.184 0.614
4 0.011 (0.3%) 0.000 (0.0%) 0.000 0.000
5 0.065 (6.3%) 0.031 (8.1%) 0.021 0.078
6 0.197 (18.1%) 0.235 (29.2%) 0.118 0.324
7 0.146 (14.6%) 0.152 (18.4%) 0.052 0.205
8 0.216 (20.5%) 0.221 (25.9%) 0.136 0.304
9 0.362 (32.1%) 0.522 (52.3%) 0.302 0.725
10 0.036 ( 3.6%) 0.031 (5.2%) 0.015 0.033
11 0.017 (1.5%) 0.010 (1.0%) 0.000 0.003
F(CCB to IR)
Period Estimate Adjusted
Estimate 25.0% 75.0%
1 0.002 (2%) 0.001 (0%) 0.000 0.001
2 0.003 (2%) 0.001 (0%) 0.000 0.001
3 0.003 (4%) 0.000 (0%) 0.000 0.001
4 0.001 (0%) 0.000 (0%) 0.000 0.000
5 0.002 (1%) 0.000 (0%) 0.001 0.000
6 0.007 (0%) 0.001 (1%) 0.001 0.001
7 0.014 (0%) 0.002 (3%) 0.001 0.002
8 0.014 (0%) 0.002 (2%) 0.001 0.004
9 0.012 (0%) 0.002 (2%) 0.001 0.002
10 0.012 (0%) 0.001 (1%) 0.001 0.002
11 0.010 (0%) 0.001 (1%) 0.000 0.002 Note: 100 replications
As shown in Table 22, adjusted causality measures show that the effect of IR on CCL is
19.5%, and the effect of CCB on IR is only 1.9%. That means that the causality is running
from IR to CCL. This is consistent with the economic theory and the granger causality test
results. The decompositions of these measures in the frequency domain show that most the
effect of IR on CCL peaks at period 9.

110
Table 22. Geweke Frequency Decomposition for CCL and IR
Estimate Adjusted
Estimate 25.0% 75.0%
F(IR to CCL) 0.142 (16.1%) 0.163 (19.5%) 0.071 0.233
F(CCL to IR) 0.08 (1,7%) 0.02 (1.9%) 0.000 0.002
F(IR to CCL)
Period Estimate Adjusted
Estimate 25.0% 75.0%
1 0.042 (4.3%) 0.051 (5.2%) 0.004 0.068
2 0.063 (5.7%) 0.078 (6.6%) 0.022 0.094
3 0.095 (8.5%) 0.103 (10.0%) 0.045 0.156
4 0.297 (30.2%) 0.315 (35.9%) 0.158 0.402
5 0.152 (23.1%) 0.165 (28.1%) 0.064 0.248
6 0.256 (29.9%) 0.342 (35.5%) 0.096 0.521
7 0.179 (20.6%) 0.199 (25.0%) 0.121 0.308
8 0.166 (24.1%) 0.185 (26.4%) 0.085 0.256
9 0.278 (31.1%) 0.320 (35.1%) 0.178 0.453
10 0.022 (5.4%) 0.028 (6.9%) 0.010 0.045
11 0.012 (1.2%) 0.015 (1.3%) 0.001 0.012
Period Estimate Adjusted
Estimate 25.0% 75.0%
F(CCL to IR)
1 0.002 (4%) 0.000 (1%) 0.000 0.000
2 0.002 (4%) 0.000 (1%) 0.000 0.000
3 0.002 (5%) 0.000 (1%) 0.000 0.001
4 0.001 (1%) 0.000 (0%) 0.000 0.000
5 0.001 (3%) 0.000 (0%) 0.000 0.000
6 0.005 (0%) 0.003 (2%) 0.000 0.002
7 0.012 (0%) 0.006 (5%) 0.001 0.005
8 0.015 (0%) 0.007 (4%) 0.001 0.006
9 0.012 (0%) 0.006 (4%) 0.001 0.005
10 0.012 (2%) 0.006 (3%) 0.000 0.005
11 0.006 (0%) 0.003 (2%) 0.000 0.002 Note: 100 replications
6.4.6. The Impulse Response Functions
To use vector autoregressions for policy analysis, it should be understood that policy
involves the addition of a known innovation shock to the model. A VAR model is driven
by shocks and the intention is to trace out the reaction of the system to a random shock.
Since the individual coefficients in the estimated models are often difficult to interpret the
technique is to estimate the so-called impulse response function. An impulse response
function traces out the effect of a one standard deviation shock to one of the innovations on

111
current and future values of the endogenous variables. A shock to the i-th variable directly
affects the i-th variable, and is also transmitted to all of the endogenous variables through
the dynamic structure of the VAR. In a simple bivariate system:
𝑌𝑡 = 𝑎11𝑌𝑡−1 + 𝑎12𝑍𝑡−1 + 𝑒𝑌𝑡
𝑌𝑡 = 𝑎21𝑌𝑡−1 + 𝑎22𝑍𝑡−1 + 𝑒𝑍𝑡 (18)
A change in 𝑒𝑌𝑡, will immediately change the value of current Y. It will also change all
future values of Y and Z since lagged Y appears in both equations. The structure of the
system incommercials feedback since 𝑌𝑡 and 𝑍𝑡 are allowed to affect each other. If the
innovations, 𝑒𝑌𝑡, and 𝑒𝑍𝑡, are uncorrelated, interpretation of the impulse response is
straightforward. 𝑒𝑌𝑡 is the innovation for Y and Z. The innovations are, however, usually
correlated so they have a common component, which cannot be associated with a specific
variable. A somewhat arbitrary but common method of dealing with this issue is to
attribute all of the effect of any common component to the variable that comes first in the
VAR system.
This method is known as an "unrestricted" VAR, and any ordering of the variables can be
used. To limit the ordering, the direction of causation between variables in the system can
be established based on causality tests. In this "structured" VAR, following the causality
tests the variables in the system are ordered so that an error term in any equation will only
affect error terms below it in the ranking. In general, each equation of the VAR system will
include the current values of the dependent variable from each previous equation in the
ordering, along with lagged values of all variables and current innovations in the dependent
variable.
6.4.6.1. Response of Credit Card to a Contractionary Monetary
Policy
Figure 25 shows the response of credit card balances to the contractionary monetary shock.
After the shock balances increase two percent and stay positive for three quarters and then,
stay negative for five quarters. The first response for three quarters is not compatible with
the traditional view about liquidity constraints which defended by Bernanke and Blinder
(1992), Gertler and Gilchrist (1994), Ludvigson (1998). According to these studies; after
an contractionary monetary policy, consumer credits decline immediately. However; in this

112
case, credit card balances increase with the contractionary shock, and then only decline
after three quarters. Briefly; one two three quarters, consumers or banks increases their
credit card balances, then from three to two quarters, consumers use credit cards to offset
contractionary monetary policy.
Figure 25. Impulse Response of Credit Card Balances to a Contractionary
Monetary Policy
Note: The impulse response function is statistically significant at the five percent level.
Figure 26 shows the response of credit card liquidity to the contractionary monetary shock.
After the shock balances increase two percent and stay positive for nine quarters and then,
stay negative for three quarters. If we compare the figures the initial increase in credit card
balances is matched by an increase in liquidity. Even after balances decline, liquidity stays
positive for a long time. Consumer using credit cards remain liquid after the contractionary
policy shock.

113
Figure 26. Impulse Response of Credit Card Liquidity to a Contractionary
Monetary Policy
Note: The impulse response function is statistically significant at the five percent level.
The figures above show that both credit card balances and credit card liquidity increase
after a contractionary monetary policy. This is a contrasting situation to the traditional
view of credit channel. Because, when in the contractionary policy environment
households increase credit card borrowing. They prefer to do so through higher limits or by
obtaining more cards. So, initially credit card balances increase and then credit card
liquidity remain positive for a long time.
6.4.6.2. Response of Credit Card to an Expansionary Monetary
Policy
Figure 27 shows the response of credit card balances and credit card liquidity to the
expansionary monetary shock. After the shock balances decrease one percent and stay
negative for six quarters and then, turns to positive. Similarly, After the shock credit card
liquidity decrease 0.5 percent and stay negative for seven quarters and then, turns to
positive.
According to traditional view of credit channel, expansionary monetary policy makes
credit conditions become more favorable to borrowers, and so credit card borrowing
increases. However the impulse response functions show that this is not the case. After an

114
expansionary monetary policy, households may prefer to take the advantage of decreasing
interest rates. So, households may choose to substitute away from high interest credit card
debt and into consumer credits such as housing credits.
Figure 27. Impulse Response of Credit Card Balances to an Expansionary
Monetary Policy
Note: The impulse response function is statistically significant at the five percent level.
Figure 28. Impulse Response of Credit Card Liquidity to an Expansionary
Monetary Policy
Note: The impulse response function is statistically significant at the five percent level.

115
6.4.6.3. Response of Consumption to the Monetary Policy
Figure 29 and 30 show the impulse response functions of consumption to a contractionary
and expansionary policy shock, respectively. The impulse response functions in both
figures are more tempered relative to those calculated for the credit card balances and
liquidity. After a contractionary policy shock, initially there is no response for four
quarters. After that, consumption decreases 0.2 percent by the six quarter. This response of
consumption is consistent with the other studies examining the effects of contractionary
monetary policies on consumption. However, in this case the response of consumption to a
contractionary monetary policy is more strict. So, we can say that consumption behavior of
households are less sensitive to a contractionary monetary policy. If we look at the Figure
29; after a contractionary monetary policy credit card balances and credit card liquidity
increases. That increase makes less sensitive households to a contractionary monetary
policy.
If we look at the Figure 30; after a expansionary policy shock, initially there is no response
for three quarters. After that, consumption decreases 0.2 percent by the five quarter. This
response of consumption is consistent with the other studies examining the effects of
expansionary monetary policies on consumption. However, in this case the response of
consumption to a expansionary monetary policy is more strict too. So, we can say that
consumption behavior of households are less sensitive to an expansionary monetary policy.
The decrease in credit card balance and liquidity reduces the effect of expansionary
monetary policy on consumer behavior.

116
Figure 29. Impulse Response of Consumption to a Contractionary Monetary Policy
Note: The impulse response function is statistically significant at the five percent level.
Figure 30. Impulse Response of Consumption to an Expansionary Monetary Policy
Note: The impulse response function is statistically significant at the five percent level.

117
6.5. Conclusion
The impulse response functions provide a new evidence about the effects of monetary
policy. Contractionary monetary policy appears to be delayed by the increase in credit card
borrowing and credit card liquidity, while expansionary monetary policy has a stimulative
effect on credit card markets. However, the latter does not appear to translate into a
stimulative effect for consumption.
The impulse response functions for credit card balances and credit card liquidity in
response to a contractionary policy shock suggest that the propagation of monetary policy
through household balances sheets is inhibited by the use of credit cards. Credit card
borrowing provides a means to keep consumption constant in a contractionary policy
environment. However, the response of credit card liquidity indicates that credit card
markets provide households with liquidity even when economic conditions might
otherwise be worsening. Hence, these factors make the transmission mechanism less
effective.
Households are less liquidity-constrained than before the proliferation of credit cards. The
response of credit card liquidity in response to contractionary monetary policy is consistent
with that interpretation. Also, the impulse response functions of credit card balances and
liquidity calculated for an expansionary shock are consistent with that interpretation. Credit
card borrowing increases following an expansionary monetary policy shock. This indicates
that credit cards are not simply used as a marginal source of credit when they are
constrained in accessing other sources. Instead, the credit card data documented here is
consistent with more liquid credit markets, meaning liquidity constraints are less important
for households and are less important in the propagation of monetary policy.

118
CHAPTER 7
CONCLUSION
In this dissertation, I have tried to determine how the growth of consumer credit has
changed the effect of monetary policy on household consumption in Turkey. I show with a
variety of empirical evidence that the growth of consumer credit has weakened the ability
of monetary policy to affect household consumption behavior. The growth of consumer
credit makes it more difficult for monetary policy to affect aggregate demand.
In fact, ability of monetary policy to affect household consumption is described in the
"household balance effects channel" in literature. Household balance effects channel is one
of the varieties of the monetary transmission mechanisms. Examining and providing
evidences about the functioning of this channel is the subject of this dissertation. Although
most of the literature is focused on expenses by companies, this channel takes consumption
expenses made by households and especially durable consumption goods into
consideration. According to the hypothesis in this dissertation, the growth of consumer
credit deactivates the household balance effects channel.
Consumer credits may be specified as a type of credit that the real persons may use in
order meet all their necessities beyond commercial purpose. The decrease in interest rates
and the financial stability environment in economy that occurred in Turkey following the
crisis of 2000-2001 had caused the increase of consumer credits that had been made
available along with the effect of positive atmosphere in global markets. The increase of
consumption and spending tendency of household had also supported the development in
subject, and the consumer credits have showed an increase in Turkey.
In this dissertation, firstly, the consumer credits have been examined by subtypes as being
housing credits, personal credits, auto credits, other credits and personal credit cards. The
housing credits had reached to about 114 billion TRY by the end of 2014. The share of
housing credits among consumer credits is at the level of about 40 percent. The auto credits
119
had been 6 billion TRY in 2014. The share of auto credits among consumer credits is only
2 percent in 2014. The personal and other credits had increased to 147 billion TRY in
2014. The personal credits and other credits is the credit type having the highest share
among consumer credits and it is about 55 percent in 2014. The number of credit cards had
significantly increased in years and it has reached about 57 million units in 2014. The
amount of personal credit card transaction had increased to 72 billion TRY in 2014.
Personal credit card transaction is forming 30 percent of the total consumer credits in 2014.
These results obtained have provided a foundation for the empirical analysis.
Secondly, I proved that consumer credit to smooth consumption makes monetary policy
less effective in Turkey. So, after the growth in consumer credit volume, consumption
behaves consistently with the permanent income hypothesis. Permanent income hypothesis
argues that consumption depends only on permanent income.
According to the model results, for the 2006 to 2014 sample, neither expected credit
growth nor income growth are statistically significant predictors of consumption growth.
These results are consistent with the conception of the permanent income hypothesis,
where neither variable should help predict the behavior of consumption. This result is also
true when the credit card growth considered for the 2004 to 2014 sample. However, the
invalidity of permanent income hypothesis can only be argued in pre-2006 sample for total
consumer credit growth and pre-2004 sample for credit card growth. So, the case for
rejecting the permanent income hypothesis is weaker than when using data for earlier
decades.
The results are consistent with hypothesis, where the growth in consumer credit is
associated with a decline in the channel of the monetary policy transmission mechanism.
When households have an easier time obtaining credit they can smooth consumption
during periods of contractionary monetary policy. In other words, consumer behavior is
able to come closer to the conception of the permanent income hypothesis.
Thirdly, I proved that households are less liquidity constrained with credit cards and so,
monetary policies have no effect on consumption behavior in Turkey from 2002 through
2014. The impulse response functions of credit card balances and credit card liquidity to a
change in monetary policy have been also estimated. The response of the credit liquidity to
both contractionary and expansionary policy has been tested and proved that

120
contractionary monetary policy appears to be delayed by the increase in credit card
borrowing and credit card liquidity, while expansionary monetary policy has a stimulative
effect on credit card markets.
The impulse response functions for credit card balances and credit card liquidity in
response to a contractionary policy shock suggest that the propagation of monetary policy
through household balances sheets is inhibited by the use of credit cards. Credit card
borrowing provides a means to keep consumption constant in a contractionary policy
environment. However, the response of credit card liquidity indicates that credit card
markets provide households with liquidity even when economic conditions might
otherwise be worsening. Hence, these factors make the transmission mechanism less
effective.
Today, in Turkey as in other countries, consumer credits and credit cards are more widely
and readily available for almost all consumers. This situation allows households the ability
to escape credit market constraints and smooth their consumption behavior. So, the Central
Bank's power on effecting consumers behavior is very restricted and this fact should be
considered by Central Banks while evaluating it's policies.

121
REFERENCES
Akerlof, G.A. (1970). The Market for Lemons: Quality Uncertainty and the Market
Mechanism. Quarterly Journal of Economics, 84, 488–500.
Altonji, J., and Siow, A. (1987). Testing the Response of Consumption to Income with
Noisy Panel Data. Quarterly Journal of Economics, 102, 293-328.
Arrow, K. J. (1963). Uncertainty and the welfare economics of medical care. American
Economic Review, 53, 941-973.
Arrow, K. J. (1968). The economics of moral hazard: further comment. American
Economic Review, 58, 537-539.
Arslan, O. and Karan, M. B. (2009). Credit Risks and Internationalization of Smes. Journal
of Business Economics and Management, 10 (4), 361-368.
Bacchetta, P. and Gerlach S. (1997). Consumption and Credit Constraints: International
Evidence. Journal o f Monetary Economics, 40, 207-238
Başçı, E. (2006). Credit growth in Turkey: drivers and challenges. BIS Papers, 28, 363-
375.
Bernanke, B. S. (1983). Non-Monetary Effects of the Financial Crisis in the Propagation of
the Great Depression. American Economic Review, 73, 257-276.
Bernanke, B. S., Lown, C. S. and Friedman, B. M (1991). The Credit Crunch. Brookings
Papers on Economic Activity, 2, 205-247.
Bernanke, B. S. and Blinder, A.S. (1992). Federal Funds Rate and Channels of Monetary
Transmission. American Economic Review, 82(4), 901-921.
Bernanke, B. S. and Gertler, M. (1995). Inside the Black Box: The Credit Channel of
Monetary Policy Transmission. Journal of Economic Perspectives, 9(4), 27-48.

122
Bernanke, B. S., Gertler, M. and Gilchrist, S. (1996). The Financial Accelerator and the
Flight to Quality. Review of Economics and Statistics, 78 (1), 1–15.
Bester, H. (1985). The level of investment in credit markets with imperfect information.
Journal of Institutional and Theoretical Economics, 141, 503-515.
Brady, R. R (2006). Credit Cards and Monetary Policy: Are Households still liquidity-
constrained? United States Naval Academy Department of Economics Departmental
Working Papers, 12.
Brady, R. R (2011). Consumer credit, liquidity, and the transmission mechanism of
monetary policy. Economic Inquiry, 49 (1), 246 - 263.
Brito, D. L. and Hartley, P.R. (1995). Consumer Rationality and Credit Cards. The Journal
of Political Economy, 103, 400-433.
BRSA (2012), Banking Activity Report, 28, Ankara.
Cambell, J. Y. and Mankiw, N. G. (1989). “Consumption, Income and Interest Rates:
Reinterpreting the Time Series Evidence, NBER Macroeconomics Annual 1989, National
Bureau of Economic Research, 216-245.
Canner, G., Kennickell A. B.,and Luckett C. A. (1995). Household Sector Borrowing and
the Burden of Debt. Federal Reserve Bulletin, 81, 323- 338.
Cargill, T. F. (1990). Changing money: Financial innovation in developed countries,
Journal of Comparative Economics, 14(1), 138-139.
Carroll, C. D. (2001). A Theory of the Consumption Function, With and Without Liquidity
Constraints. Journal o f Economic Perspectives, 15(3).
CBRT (2013), Moneyand Exchange Rate Policy Report, Ankara.
Chah, E. Y., Ramey, V. A. and Starr, R. M. (1995). Liquidity Constraints and
Intertemporal Consumer Optimization: Theory and Evidence from Durable Goods. Journal
of Money Credit and Banking, 27, 272-87.
Clair, R. T. and Tucker, P. (1993). Six Causes of the Credit Crunch. Federal Reserve Bank
of Dallas Economic Review, 3, 1 -19.

123
Claus, I. and Smith C. (1999), Financial intermediation and the monetary transmission
mechanism. Reserve Bank of New Zealand Bulletin, 62(4), 4-16.
Cox, D. and Jappelli, T. (1993). The Effect of Borrowing Constraints on Consumer
Liabilities. Journal of Money, Credit and Banking. 25, 2, 197-213.
Dale, S. and Haldane A. G. (1993). A Simple Model of Money, Credit and Aggregate
Demand, Bank of England Working Paper, 7.
De Bondt, G.J. (1998). Credit and asymmetric effects of monetary policy in six EU
countries: an overview, DNB Staff Reports, 23, De Nederlandsche Bank.
Ding, W., Domaç, I. and Ferri, G. (1998). Is There a Credit Crunch in East Asia. World
Bank Policy Research Working Paper, Washington D.C.: World Bank.
Durukan, T., Elibol, H., ve Özhavzalı, M. (2005). "Kredi Kartlarındaki Taksit
Uygulamasının Tüketicinin Harcama Alışkanlıkları Üzerindeki Etkisini Ölçmeye Yönelik
Bir Araştırma (Kırıkkale İli Örneği)", Selçuk Üniversitesi Sosyal Bilimler Enstitüsü
Dergisi, 13, 143-153.
Flavin, M. (1981). The Adjustment of Consumption to Changing Expectations About
Future Income. The Journal of Political Economy, 89, 5, 974-1009.
Flavin, M. (1985). Excess Sensitivity of Consumption to Current Income: Liquidity
Constraints or Myopia? Canadian Journal of Economics, Econometrics, 18, 117-136.
Fountas, S. and Papagapitos, A. (2001). The monetary transmission mechanism: evidence
and implications for European Monetary Union. Economics Letters, 70, 397-404.
Friedman, M. (1957). A Theory of the Consumption Function. Princeton: Princeton
University Press.
Gertler, M. and Gilchrest, S. (1994). The Role of Credit Market Imperfections in the
Monetary Transmission Mechanism: Arguments and Evidence. Scandinavian Journal of
Economics, 95(1), 43-64
Gertler, M. and Gilchrest, S. (1995). Monetary Policy, Business Cycles, and the Behavior
of Small Manufacturing Firms. Quarterly Journal o f Economics, 109(2), 309-340.
124
Gross, D. B. and Souleles, N. S. (2002). Do Liquidity Constraints and Interest Rates
Matter for Consumer Behavior? Evidence from Credit Card Data. Quarterly Journal of
Economics, 117, 1, 149-185.
Hall, R. (1978). Stochastic Implications of the Life Cycle-Perm anent Income Hypothesis:
Theory and Evidence. The Journal o f Political Economy, 86, 971-987.
Hall, R. and Mishkin, F.S. (1982), The Sensitivity of Consumption to Transitory Income:
Estimates from Panel Data on Households. Econometrica, 50, 2, 461-482.
Harvey, D. I., Leybourne, S. J. and Taylor M.R. (2006). Modified Tests for a Change in
Persistence. Journal of Econometrics, 134, 441-469.
Hayashi, F. (1982). The Permanent Income Hypothesis: Estimation and Testing by
Instrumental Variables. The Journal o f Political Economy, 90, 5, 895-916.
Hayashi, F. (1985). The Effect of Liquidity Constraints on Consumption: A Cross-
Sectional Analysis. Quarterly Journal o f Economics, 100 (1), 183-206.
Hodgman, D. R. (1960). Credit Risk and Credit Rationing. The Quarterly Journal of
Economics, 74 (2), 258-278.
Horngren, L. (1995), Monetary Policy in Theory and Practice, Quarterly Review, 3 (1), 12
Horvath B. and Maino R. (2006). Monetary Transmission Mechanisms in Belarus. IMF
working papers, 6, 246.
Homa, K. and Jaffee, D. (1971). The Supply of Money and Common Stock Prices, Journal
of Finance, 79, 243.
Hubbard, R. G. (1994). Investment Under Uncertainty: Keeping One's Options Open.
Journal of Economic Literature, 32(4), 1816-31.
Jaffee D. and Russell T. (1976). Imperfect information, uncertainty, and credit rationing.
Quarterly Journal Of Economics, 90 (4), 651-666.
Jappelli, T. (1990). W ho is Credit Constrained in the U.S. Economy?. The Quarterly
Journal o f Economics, 105, (1), 219-234.

125
Jappelli, T., Steffen, P.J. and Souleles, N. S. (1998). Testing for Liquidity Constraints in
Euler Equations with Complementary Data Sources. The Review o f Economics and
Statistics. 80 (2), 251-262.
Kamin, S., Turner P. and Van’t dack J. (1998). The Transmission Mechanism of Monetary
Policy in Emerging Market Economies: An Overview. BIS Policy Papers, 3, 5-64.
Kashyap, A. K., Stein, J. C. and Wilcox, D.W. (1994). Monetary Policy and Credit
Conditions: Evidence from the Composition of External Finance. The American Economic
Review, 83 (1), 78-98.
Kashyap, A. K. and Stein, J. C. (2000). What do a million observations on banks say about
the transmission of monetary policy?. American Economic Review, 60 (3), 407‐428.
Kaya, F. (2009). Kredi Kartları 5464 Sayılı Banka ve Kredi Kartları Kanunu İlaveli,
İstanbul: Beta Yayıncılık.
Kirchler, E., Hoelzl, E. and Wahl, I. (2008). Enforced versus voluntary tax compliance:
The “slippery slope” framework. Journal of Economic Psychology, 29(2), 210-225.
Kliesen, K. L., Tatom, A. J. (1992). The recent credit crunch: the neglected dimensions,
Federal Reserve. Bank Review, 5, 18-36.
Kutlar A., Sarıkaya, M.. (2003). Asimetrik Enformasyon ve Marjinal Maliyet Fiyatlama
Modeli Çerçevesinde Türkiye’de Kredi Tayınlaması ve Faiz Oranlarının Tahmini.
Cumhuriyet Üniversitesi İİBF Dergisi, 4(1), 1 -18.
Lamberte, M. B. (1999). A Second Look at Credit Crunch. Philippine Institute for
Development Studies Discussion Paper Series, 9-23, 1-23.
Loayza, N. and Hebbel, K. S. (2002). Monetary Policy Functions and Transmission
Mechanisms: An Overview. Monetary Policy: Rules and Transmission Mechanisms.
Central Bank of Chile, Santiago.
Ludvigson, S. (1998). The Channel of Monetary Transmission to Demand: Evidence from
the Market for Automobile Credit. Journal o f Money, Credit and Banking, 30(3), 365-383.
Ludvigson, S. (1999). Consumption and Credit: A Model of Time-Varying Liquidity
Constraints. The Review o f Economics and Statistics, 81 (3), 434-447.

126
Mayer, T. (1972). Permanent Income, Wealth and Consumption: A Critique of the
Permanent Income Theory, the Life-Cycle Hypothesis, and related theories. Berkeley:
University of California Press.
Mayfield, J.E. (1989). Borrowing Constraints under secured loan contracts. Boston
College, Working paper, 189.
Meltzer, A. H., (1995). Monetary Credit (and other) Transmission Processes: A Monetarist
Perspective. Journal of Economic Perspectives, 9, 49-72.
Mishkin, F. S. (1996). Understanding Financial Crises: A Developing Country Perspective,
in Michael Bruno and Boris Pleskovic eds., Annual World Bank Conference on
Development Economics, World Bank, Washington D.C, 29-62.
Mishkin, F. (1998). The Dangers of Exchange-Rate Pegging in Emerging Market
Countries. International Finance, 1, 81-101.
Mishkin, F. S. (2001). "The Transmission Mechanism and the Role of Asset Prices in
Monetary Policy, in Aspects of the Transmission Mechanism of Monetary Policy, Focus
on Austria, Vienna: Osterreichische Nationalbank 58-71.
Morris, C.S. and Sellon G.H. (1995). Bank lending and monetary policy: Evidence on a
credit channel. Federal Reserve Bank of Kansas City Economic Review, 80(2), 59-75.
Müslümov, A. ve Aras G. (2002). Sermaye Piyasası Gelişmesi ve Ekonomik Büyüme
Arasında Nedensellik İlişkisi: OECD Ülkeleri Örneği. İktisat İşletme ve Finans, 17(198),
90-100.
Oliner, S. and Rudebusch, G. D. (1996). Is There a Broad Credit Channel For Monetary
Policy?. Federal Reserve Bank of San Francisco Economic Review, 1, 1-13.
Owens, R. E., and Schreft, S. L. (1995). Identifying Credit Crunches. Contemporary
Economic Policy, 13, 63–76.
Romer, C. D. and Romer D. H. (1993). Credit Channel or Credit Actions? An
Interpretation of the Postwar Transmission Mechanism. In Changing Capital Markets:
Implications for Monetary Policy, Federal Reserve Bank of Kansas City, 71-116.

127
Runkle, D. E. (1990). Liquidity Constraints and the Permanent Income Hypothesis. Journal
of Monetary Economics, 27, 73-98.
Shea, J. (1995). Myopia, Liquidity Constraints, and Aggregate Consumption: A Simple
Test. Journal of Money, Credit and Banking, 27 (3) 798-805.
Stiglitz J. E. and Weiss, A. (1981). Credit Rationing in Markets with Imperfect
Information. American Economic Review, 71 (3), 393-410.
Stiglitz J. E. and Weiss, A. (1992). Asymmetric Information in Credit Markets and Its
Implications for Macroeconomics. Oxford Economic Papers, 44 (4), 694-724.
Taylor, J. B. (2000). The Monetary Transmission Mechanism and the Evaluation of
Monetary Policy Rules. Working Papers Central Bank of Chile.
Walsh, C.E. (1998). Monetary Theory and Policy. 1st Edition New York: Massachusetts
Institute of Technology (MIT) Press.
Walsh, Carl E. (2003). Monetary Theory and Policy. 2nd Edition. Massachusetts Institute
of Technology (MIT) Press.
Yılmaz, E. (2000) Türkiye’de Kredi Kartı Uygulaması ve Ekonomik Etkileri, İstanbul:
Türkmen Kitabevi.
Zeldes, S. P. (1989). Consumption and Liquidity Constraints: An Empirical Investigation.
The Journal o f Political Economy, 97 (2), 305-346.
Zhu, L. Y. and Meeks, C. B. (1994). Effects of low-income families' ability and
willingness to use consumer credit on subsequent outstanding credit balances. The Journal
of Consumer Affairs, 28(2), 403-422.
Zinman, J. (2003). The Impact of Liquidity on Household Balance Sheets: Micro
Responses to a Credit Card Supply Shock, Working Paper, Federal Reserve Bank of New
York.

128
APPENDIX A - TURKISH SUMMARY
Bu çalışmanın temel amacı; Türkiye'de tüketici kredilerindeki büyümenin, para
politikasının hanehalkı tüketimi üzerindeki etkisini nasıl değiştirdiğini anlamaktır. Bu
amaç doğrultusunda; tüketici kredilerindeki büyümenin bir sonucu olarak para
politikasının hanehalkı tüketici davranışlarını etkileme kabiliyetinin azaldığı hipotezi
çeşitli ampirik kanıtlar eşliğinde incelenmiştir.
Para politikasının hanehalkı tüketici davranışlarını etkileme kabiliyeti literatürde genellikle
hanehalkı bilanço etkisi kanalı olarak ifade edilmektedir. Hanehalkı bilanço etkisi kanalı,
parasal aktarım mekanizması kanallarının bir çeşididir. Parasal aktarım mekanizmaları,
para politikasının milli hasılayı hangi değişkenler aracığıyla ve nasıl etkilediğini açıklar.
Başarılı bir uygulama için politika yapıcılarının, para politikasının hangi aktarım
kanallarını takip ederek ekonomiyi etkilediğini bilmeleri gerekmektedir. Dolayısıyla bu
çalışmaya parasal aktarım mekanizmaları incelenerek başlanmıştır. Çalışmada parasal
aktarım mekanizmaları genel hatlarıyla tanıtılmış ve parasal aktarım mekanizmalarının
2001 yılında Türkiye'de yaşanan bankacılık krizi ve 2008 yılındaki küresel finans krizi
sonrası geçirdiği aşamalar incelenmiştir.
Literatürde, para politikasının etki kanalları çeşitli şekillerde sınıflandırılmaktadır. Bazıları
portföy ayarlamaları, servet etkileri ve kredi varlığı etkilerinden bahsederken, bazıları
miktar teorisi kanalı, faiz oranı etkileri ve bekleyişler gibi farklı bir sınıflandırma
yapmaktadır. Bir başka sınıflandırma ise, geleneksel faiz oranları kanalları, diğer aktif
fiyatları kanalı ve kredi kanalı şeklindedir (Aslan, 2009). Taylor (2000) ise çalışmasında,
parasal aktarım mekanizmasının farklı teorilerini iki ana kategori içerisinde
sınıflandırmıştır; faiz oranı ve döviz kuru kanallarından oluşan, para görüşü ve para
görüşüne alternatif olarak ise kredi görüşü. Bu çalışmada ise parasal aktarım
mekanizmaları; faiz kanalı, hisse senedi kanalı, kredi kanalı ve beklentiler kanalı olarak
sınıflandırılmıştır. Buna karşın, parasal aktarım mekanizması kanallarını kesin çizgilerle
birbirinden ayırmak mümkün olmamakta, kanalların birbirini etkilediği veya tamamladığı
genel olarak kabul edilmektedir.
129
Literatürde en yaygın bilinen aktarım mekanizması faiz kanalıdır. Parasal otoritenin kısa
vadeli faiz oranlarında yapacağı bir değişiklik, doğrudan sermaye kullanım maliyetini
etkileyerek firmaların yatırım davranışını ve hane halkının dayanıklı tüketim malları
harcamalarını etkiler. Para politikası literatüründe, söz konusu etkileşim süreci, parasal
aktarımın faiz kanalı kavramı ile ifade edilir. Faiz kanalı, para politikası kararlarındaki bir
değişikliğin faiz oranları ve dolayısıyla toplam talebi etkileme sürecidir.
Türkiye ekonomisinin yüksek dolarizasyon yaşadığı dönemde, TCMB’nin parasal
büyüklükler üzerindeki kontrolü azalmış, üretim ve fiyatlama kararlarının döviz kuruna
bağlı olması nedeniyle faiz kanalının etkisi zayıflamıştır. Bununla birlikte 2001 krizi
sonrası yaşanan başarılı dezenflasyon sürecinde bankacılık sektörünün güçlenmesi, kamu
borç stoku kompozisyonun daha sağlıklı bir yapıya kavuşması ve Türk lirasına duyulan
güvenin artması dolarizasyonu büyük ölçüde azaltmış, böylelikle faiz kanalının etkililiği
artmıştır. (TCMB, 2013).
Faiz kanalının bilinen yaygınlığına karşın; ekonomilerin artan ölçüde dışa açılması ve
esnek döviz kuru sisteminin de yaygın olarak kullanılmaya başlanması, parasal aktarım
mekanizmasında döviz kurunun önemini arttırmıştır. Döviz kuru kanalı, para politikasının
döviz kurları üzerinde yarattığı etkinin net ihracata yansıması sonucu reel üretimde
meydana gelen değişimi ifade etmektedir. Birçok gelişmekte olan ülkede bono, hisse
senedi ve gayrimenkul piyasaları tam olarak gelişmediği için, döviz kuru, para
politikalarından etkilenen en önemli varlık fiyatı olarak karşımıza çıkmaktadır. Bu kanalın
etkisi öncelikle ihracat sanayinde, özellikle fiyat esnekliği yüksek piyasalarda; dolaylı
olarak da bu ihracat sanayilerine girdi arzını sağlayan kesimler üzerinde görülmektedir. Bu
nedenle, sadece yerli rekabete konu olan sanayiler karşısında dış rekabete duyarlı olan
sanayiler üzerinde farklı bir etkinin ortaya çıkması beklenir.
Döviz kuru kanalının şiddeti döviz kurunun parasal şoklara duyarlılığına, ekonominin dışa
açıklık derecesine ve net ihracatın döviz kuru değişimlerine duyarlılığına bağlıdır. Döviz
kuru kanalı, esnek döviz kuru rejiminin hüküm sürdüğü dışa açık bir ekonomide işleyebilir.
Ülkenin dışa açıklık derecesi ne kadar yüksek ise parasal aktarım mekanizmasında döviz
kuru kanalı o ölçüde etkin olmaktadır.
Türkiye ekonomisinde 2001 yılı sonrası dönemde geleneksel aktarım mekanizması
çerçevesinde döviz kuru kanalının işlerliğinde de önemli değişimler gözlemlenmiştir.

130
Diğer gelişmekte olan ekonomilerde olduğu gibi Türkiye’de de 2001 yılı öncesinde
dolarizasyon, hükümetin gelir ve giderleri arasındaki dengesizlik, sağlıksız işleyen
bankacılık ve finans sektörü ile finansal kırılganlık gibi nedenlerle döviz kuru hareketleri
istikrarı bozucu etki yaratmıştır. Geçmişte yaşanan ekonomik krizlerin ardından uygulanan
başarısız istikrar programlarının temel olarak sabit kur rejimine dayanması, güçlü
endeksleme davranışının yanı sıra döviz kurlarının enflasyon beklentilerinin temel
belirleyicisi olmasına neden olmuştur. Dalgalı kur rejiminin uygulanmadığı bu dönemde,
döviz kuru geçişkenliği yalnızca büyüklük olarak değil hız olarak da oldukça yüksek
seviyelerde gerçekleşmiştir. Dalgalı kur rejiminin uygulanmaya devam edildiği ve
enflasyon hedeflemesi rejiminin uygulanmaya başlandığı dönemde, ekonomik birimlerin
fiyatlama yaparken döviz kurlarını daha az dikkate almaya başladıkları ve kurlardan
fiyatlara geçiş etkisinin hem büyüklük hem de süre bakımından azaldığı saptanmıştır.
Monetaristler ise parasal aktarım konusunda genelde diğer nispi varlık fiyatları ve reel
servetin ekonomik etkileri üzerinde de durmaktadır. Buna göre, parasal aktarma
mekanizmasında varlık fiyatlarını içeren iki kanal bulunmaktadır. Bunlar, hisse senetleri
fiyatları kanalı ile servet etkisi kanalıdır. Varlık fiyatları kanalının işleyişinde; para
politikasının yatırımlar üzerindeki etkisi Tobin’in q teorisiyle, tüketim üzerindeki etkisi ise
Modigliani’nin yaşam döngüsü hipoteziyle açıklanmaktadır.
Tobin’in q teoremi, para politikası aracılığı ile varlıkların değeri üzerinde etki yaratan bir
mekanizmadır. q, firmaların piyasa değerlerinin sermaye maliyetine bölümü olarak
tanımlanmaktadır. Bu değerin yüksek çıkması firmaların piyasa değerlerinin yedek
sermaye maliyetine göre yüksek olduğunu ifade eder. Bu durumda firmalar hisse senedi
ihraç ederek elde ettikleri gelirle satın alacakları demirbaş ve donanım maliyetlerinin
üzerinde yüksek fiyat belirleyebilirler. Böylece firmalar daha az hisse senedi ihracı ile daha
fazla yatırım malları satın alacağından yatırım harcamaları artacaktır.
Modigliani ise 1975’de ortaya koyduğu yaşam döngüsü hipotezinde tüketicilerin tüketim
harcamalarını hayat boyu gelire bağlı olarak değiştireceğini ifade etmiştir. Yani beşeri
sermaye, reel sermaye ve finansal servet tüketimi etkileyen unsurlar olarak gösterilmiştir.
Finansal servetin büyük bir bölümü borsadaki yatırımlardır. Borsa faaliyetlerindeki artış
finansal servetin değerini ve tüketicilerin hayat boyu gelirini arttırmaktadır. Hayat boyu
gelir artışı da ekonomide tüketim harcamalarını yükselterek hızlandıran prensibi
kapsamında, yatırım harcamalarının artmasına neden olmaktadır.

131
Para politikasındaki değişimlerin ekonomik faaliyetleri hangi yollar ile etkilediğini
açıklayan parasal aktarım mekanizması, önceleri sadece para arzı ve faiz oranlarındaki
değişmelerin yatırım ve tüketim miktarlarını etkilediği şeklinde iken ekonomideki aşırı
dalgalanmalar bu görüşü kimi ekonomistlerce yetersiz kılmıştır (Bernanke ve Gertler,
1995). Bunun sonucu olarak Bernanke (1983) finans kuruluşlarının ekonomi üzerinde reel
etkileri olabileceği görüşünü ortaya koymuş ve devamında banka kredilerinin aktarım
mekanizmasındaki rolü de önemli ölçüde dikkat çekmeye başlamıştır. Bu yaklaşım aktarım
mekanizmaları literatüründe kredi kanalı olarak tanımlanmaktadır.
Kredi kanalı yaklaşımı; bilgi eksiklikleri, işlem maliyetleri gibi piyasa aksaklıkları ve kredi
büyüklükleri üzerinde durmaktadır. Kredi yaklaşımında, fon arz ve talep edenler arasındaki
bilgi aksaklıklarının aktarım mekanizması üzerindeki etkilerine vurgu yapılmaktadır. Ters
seçim ve asimetrik bilgi kavramlarıyla açıklanan piyasa aksaklıkları kredi piyasasında
genelde finansal aracılara, özelde ise bankalara, bilgiye ulaşma ve bilgiyi değerlendirme
sürecinde özel bir rol yüklerken, para otoritesine de faiz ve kredi gibi parasal
büyüklüklerden bağımsız olarak ve bu değişkenlerle beraber banka bilançolarının kredi-
menkul kıymet portföy bileşimini değiştirmek suretiyle toplam talebi etkileme imkânı
vermektedir.
Türkiye ekonomisinde 2001 krizi sonrasında kredi kanalının işlerliğinde de artış
gözlemlenmiştir. Geçmişte, yüksek bütçe açıkları ve reel faiz oranları nedeniyle bankacılık
sektörü kredi kısıtlamasına gitmekte, özellikle küçük ve orta ölçekli işletmelere makul faiz
oranları ile uzun dönemli kredi vermemekteydi. Bu dönemde, bankacılık sektörü esas
olarak hükümet harcamalarının finanse edilmesi için aracılık görevi görmekteydi. Kriz
sonrasında yapısal reformlar, kamu harcamalarının kontrol altına alınarak sürdürülebilir
büyümenin desteklenmesi, gelişmiş ülkelerdeki düşük faiz oranları nedenleriyle yükselen
piyasa ekonomilerindeki likidite artışı ve reel faiz oranlarının düşmesi ile bankalar
hükümet harcamalarının finansmanı yerine finansal aracılık faaliyetlerine geri
dönmüşlerdir. Böylelikle, politika faiz oranlarındaki değişimlere bağlı olarak bankaların
kullandırdıkları kredi miktarı ile toplam talep ve enflasyon etkilenmeye başlamıştır
(TCMB, 2013).
Parasal aktarım mekanizmasının kredi kanalının, para politikasındaki değişimler ile dış
kaynak priminin büyüklüğü arasındaki ilişkinin analizini ifade eden iki mekanizmayı
içerdiği (Fountas ve Papagapitos, 2001); bir diğer deyişle para politikasının reel ekonomik

132
aktiviteler üzerinde iki açıdan etkili olduğu öne sürülmektedir. Birincisi, para politikasının
bankaya bağımlı firmalara verilen banka kredi arzını etkilediği kanal olan banka kredileri
kanalı; ikincisi ise, para politikasının borçlananların bilançosunu etkileyerek reel üretimde
değişime sebep olduğu bilanço kanalıdır.
Banka kredileri kanalına göre; genişletici para politikaları, banka mevduatlarını ve
rezervlerini, dolayısıyla bankaların kredi arzını artırır. Kredi arzının artması firmaların
daha çok kredi kullanarak yatırımlarını artırmalarına, dolayısıyla toplam yatırım ve hatta
tüketim harcamalarının artmasına sebep olur. Sonuçta, ekonominin toplam üretim seviyesi
yükselir (Mishkin, 1996). Banka kredi kanalının işleyişine yönelik yapılan araştırmalar
genelde iki konu üzerinde yoğunlaşmaktadır. Birincisi, bazı borçlanıcıların bankalara
bağımlı olmaları ve bankaların kredi verme isteklerindeki değişmenin bu borçlanıcıların
yatırım ve harcama davranışlarındaki etkileridir. İkincisi ise, para politikası değişmelerinin,
banka kredilerini doğrudan etkileyip etkilememesidir (Morris, 1995).
Kredi piyasalarındaki asimetrik bilgi probleminden kaynaklanan bilanço kanalı ise, dış
finans priminin borçlanıcının finansal durumuna bağlı olması temeline dayanır. Dış finans
primindeki artış ve azalışlar da firmaların yatırım ve harcama kararlarını etkileyerek para
politikası değişmelerinin ekonomiye etkisini genişletir (Mishkin, 1996).
Bernanke ve Gertler (1995)’e göre, para politikası değişmelerinin firmalara etkisi,
firmaların büyüklüğüne göre de değişmektedir. Nakit akışlarındaki beklenmedik bir azalma
küçük ve orta ölçekli firmaların bilançolarının zayıflamasına, finansal göstergelerinin
bozulmasına, teminat olarak göstereceği varlıkların değerlerinin düşmesine ve ihtiyaç
duyduğu krediler için yeterli teminat gösterememelerine yol açar. Bu durum, firmaların
kredi imkanlarını ve ödeyecekleri faiz oranını doğrudan etkiler. Diğer yandan, borçlanma
kaynakları daha fazla olan büyük ve halka açık firmalar, nakit akışlarında beklenmedik bir
zayıflama halinde, ya kendi bünyelerindeki iç fonları kullanır ya da kısa dönem
borçlanmalarını artırırlar. Bilanço kanalı; nakit akım kanalı, beklenmeyen fiyat düzeyi
kanalı ve hanehalkı bilanço kanalı olarak üç ayrı başlık altında incelenebilir:
Nakit akım kanalına göre; sıkı para politikası, net nakit akışını ve teminat değerlerini
dolaylı olarak azaltabilmektedir. Alt gelir grubundaki tüketiciler için üretim yapan bir
imalat firması düşünürsek, daraltıcı para politikası bu müşteriler üzerinden harcamaları
azaltırsa, şirketin çeşitli sabit ve sabit benzeri maliyetleri kısa dönemde ayarlanamadığı

133
için şirket gelirleri azalmaktadır. Ortaya çıkan finansal açıktaki artışlar, zamanla firmanın
net değerini ve kredibilitesini aşındırmaktadır (Bernanke ve Gertler, 1995). Uygulanan
genişletici para politikası ise, faiz oranlarını düşürerek firmaların nakit akışını olumlu
yönde etkilemektedir. Bu durum firmaların bilançolarında iyileşme sağlarken, asimetrik
bilgi problemlerinin ortaya çıkışını engellemektedir. Bu bağlamda kredi hacmi artmakta,
yatırımlar ve dolayısıyla milli gelir yükselmektedir.
Bilanço kanalının bir diğer mekanizması, para politikasının fiyatlar genel seviyesi
üzerindeki etkisini gösteren beklenmeyen fiyat düzeyi kanalıdır. Genişletici para politikası,
fiyatlar genel seviyesinde beklenmeyen bir artışa yol açmaktadır. Böylece ters seçim ve
ahlaki tehlike sorunlarının azalması firmanın reel net değerini yükseltmektedir. Sonuç
olarak yatırım harcamaları ve toplam hasıla da artış meydana gelmektedir (Mishkin, 1996).
Bernanke ve Gertler (1995), bilanço etkisinin hanehalklarının konut ve dayanıklı tüketim
harcamaları yönünden de etkili olduğunu iddia etmişlerdir. Hanehalkı bilanço kanalı olarak
da isimlendirilen bu mekanizmaya göre; daraltıcı para politikaları etkisiyle faiz oranlarının
yükselmesi, firmalardan başka hanehalklarının da nakit akımlarını olumsuz yönde
etkileyerek, konut ve dayanıklı tüketim malı harcamalarının azalmasına sebep olacaktır.
Nitekim bu çalışma da asıl olarak hanehalkı bilanço kanalı ile ilgili olup, uygulanan para
politikalarının hanehalkları tüketim davranışları üzerindeki etkinliğini konu almaktadır.
Çalışmada tartışma konusu yapılan son parasal aktarım mekanizması ise beklentiler
kanalıdır. Beklentiler kanalına göre; tüm ekonomik değişkenler, iktisadi birimlerin
ekonomide gelecekte var olabilecek şoklara karşı beklentilerinden ve para otoritesinin bu
şoklara nasıl tepki vereceğinden etkilenmektedir. Bu durumda beklentiler kanalı; faiz oranı
kanalı, varlık fiyatı kanalı ve kredi kanalının dönemler arası bir biçimi olarak da
tanımlanabilir. Para otoritesinin gelecek dönem için, cari dönemdeki uygulamalarınca
desteklenmeyen bir para politikası uygulamasına girişeceğinin duyurulması durumunda,
piyasa beklentileri uyarlanacak, finansal piyasalarda ortaya çıkan değişim ise neticede
üretim ve enflasyonda değişime yol açacaktır.
Türkiye ekonomisinde 2001 yılı sonrası uygulanan enflasyon hedeflemesi rejiminin
başarısı açısından, para politikasının hem politika araçları hem de iletişim yoluyla
beklentileri yönetebilmesi büyük önem taşımaktadır. Önceden duyurulan hedeflerin
güvenilirliği, ekonomik birimlere kararlarında referans alabilecekleri bir değer

134
sunmaktadır. Geçmişteki kronik ve yüksek enflasyon tecrübesi ve uygulanan başarısız
istikrar programları rejimin ilk uygulamaya konulduğu dönemde hedeflerin güvenilirliğine
büyük zarar vermiş ve para politikasının etkinliğini kısıtlamıştır. Bunun yanı sıra
beklentilerin maliye politikasındaki gelişmelere oldukça duyarlı olması para politikasının
önündeki diğer bir engel olmuştur. Ancak 2002 yılında örtük enflasyon hedeflemesi
uygulaması ile politika kararlarının kamuoyu tarafından anlaşılmaya başlanması,
beklentiler kanalının işlerliğini artırmıştır.
Yukarıda kısaca açıklanan parasal aktarım mekanizması kanalları, farklı değişkenleri farklı
hızlarda ve yoğunluklarda etkilerler. Bu sebeple, para politikalarının reel sektöre etkileri
araştırılırken, aktarım kanallarının etkilerinin tüm ekonomilerde aynı olup olmadığı veya
ekonomilerin hangi özelliklerinin aktarım mekanizması kanallarının çalışmasını ve göreli
önemini belirlediği önemlidir. Literatürde doğrudan devlet müdahaleleri, fiyat esneklikleri,
mali sistemdeki rekabet derecesi, bankacılık sisteminin yapısı, uygulanan sermaye ve kur
rejimi ve borçlananların mali yapısı parasal aktarım mekanizması kanallarının bir
ekonomideki göreli önemini açıklamakta kullanılmaktadır.
Yukarıda temel düzeyde açıklanan kredi kanalı tezin konusuyla ilgili yakın ilişkisinden
dolayı daha ayrıntılı analize de tabi tutulmuştur. Bu kapsamda kredi kanalının parasal
aktarım mekanizması içindeki rolünün, kredi piyasasında asimetrik bilgiye bağlı olarak
ortaya çıkan problemlerin belirleyicisi olması nedeni ile asimetrik bilgi konusu ele
alınmıştır. Ters seçim ve ahlaki tehlike olmak üzere iki farklı asimetrik bilgi çeşidi
incelenmiştir. Kredi kanalıyla yakın ilgisinden ötürü, kredi tayınlaması ve kredi çöküşü
konuları da yine ayrıntılı olarak araştırılmıştır.
Asimetrik bilgi kavramı birbirleri ile etkileşim içerisinde bulunan ekonomik birimlerden
bir tarafın diğerine oranla daha fazla bilgiye sahip olması durumudur. İki taraf arasında
bilginin asimetrik olması durumunda daha çok bilgiye sahip olan taraf haksız bir üstünlük
kazanmaktadır. Kredi piyasalarında asimetrik bilgi sorunu ise kredi arzında bulunan
kurumlar ile kredi talebinde bulunan bireyler ya da firmalar arasındaki bilgi
eksikliklerinden kaynaklanmaktadır.
Piyasada dürüst olmayan borçlanıcıların yer alması ve kredinin alınabilmesi için olumlu
niteliklerin daha önemli olması sebebi ile söz konusu borçlanıcıların kredi talebinde
bulundukları kurumlara karşı kendi nitelikleri ile ilgili tamamen dürüst

135
davranmamaktadırlar. Böyle durumlarda borçlanıcı ve borç verenler arasında asimetrik
bilginin oluşması beraberinde çeşitli sorunların yaşanmasına ve kredi kanalının etkin
şekilde işleyememesine neden olmaktadır.
Asimetrik bilgi ortaya çıktığı piyasalarda ters seçim (adverse selection) ve ahlaki tehlike
(moral hazard) olarak ifade edilen iki temel soruna yol açmaktadır. Ters seçim, faiz
oranlarının yükselmesi nedeniyle kredi piyasasında sadece en riskli borç talep edenlerin
kalması durumunda ortaya çıkmaktadır. Bu nedenle, bankalar için kredi talebinde bulunan
müşteriler arasından alacağı krediyi geri ödeme olasılığı yüksek olanların belirlenmesi son
derece önemlidir. Bankanın kredi talebinde bulunanlar arasından iyi kalite borçlanıcıları
ayırt etmesi için çeşitli eleme araçlarının kullanılması gerekmektedir.
Amerikan piyasalarında gözlemlenen mortgage problemleri, ters seçim probleminin en
belirgin özelliklerini taşımaktadır. Önce, ödeme kapasitesi düşük kişilere konut kredisi
verilmiş ve konut satın almak için başvuruda bulunanlardan sadece gelirlerini belirtmeleri
istenmiş ancak bunu kanıtlamaları istenmemiştir. Bunun sonucunda, kredilerin geri
dönüsünde sıkıntı yasayan finans kuruluşları krize girmiş ve piyasalarda zarara uğrayan
mortgage fonları birbirini izlemiştir. Ardından finans kuruluşları birbirlerine olan güvenini
kaybetmiş ve kredi arzını düşürmüştür. Bütün bunlar, düşük kaliteli kredi isteyenlerin
piyasada sayılarının artmasına ve kredi verenlerin de ters seçimlerde bulunmalarına neden
olmuştur.
Kredi piyasalarında ahlaki tehlike sorunu kredi arz edenler ile kredi talep edenler arasında
kredi sözleşmesi imzalanmadan önce simetrik olan bilginin, sözleşme yapıldıktan sonra
kredi alanların aldıkları kredileri sözleşmede belirtilen koşullar dahilinde kullanmamaları
ve bu durumun kredi verenler tarafından gözlenememesi sebebi ile asimetrik bilgiye
dönüşmesi sonucu ortaya çıkmaktadır (Kutlar ve Sarıkaya, 2003).
Bankalar, ahlaki tehlike sorunuyla başa çıkabilmek için borçluya kredi sözleşmesi
imzalatmaktadırlar. Kredi sözleşmeleri, uygun koşullar altında krediyi ödemelerini
sağlamak için borçlulara sorumluk yüklemekte ve bu yönde gayret göstermeleri yönünde
teşvik etmektedir. Bankaların, borçlunun sözleşme vadesinde ödeme yapmasını
garantilemek için amaç dahilinde kredinin kullanılıp kullanılmadığını denetlemesi
gerekmektedir. Eğer bankalar kredi sözleşmesi yapıldıktan sonra kredinin belirtilen

136
koşullarda kullanılıp kullanılmadığını gözlemleyemezse, ahlaki tehlike sorunu ortaya
çıkmaktadır.
Bankaların verdikleri kredilerle finanse edilen yatırım projelerinin başarısız olması
durumda, oluşacak maliyeti bankalar üstlenmektedir. Sonuç olarak, bankalar, ahlaki tehlike
sorununa engel olmak için kredi tayınlamasına gitmektedirler. Kredi piyasasında kredi
arzında bulunan tarafın, piyasada talep edilen kadar krediyi vermeyip daha az miktarlarda
vermesine veya talep edilen miktar kadar kredi vermek istememesi, kredi piyasasında kredi
tayınlaması olarak tanımlanmaktadır (Jaffee, 1971).
Ters seçim söz konusu olduğunda tayınlamaya gidilmesinin nedeni, kredi portföylerinin
riskli hale gelmesi; ahlaki tehlike durumunda tayınlamaya gidilmesinin nedenini ise,
yatırımcıların riskli projelere girmesinde teşviklerin artabileceği düşüncesi
oluşturmaktadır. Kredi tayınlaması enformasyon problemlerini çözmede etkin bir
mekanizma olmasa da borç veren tarafından alınan riski sınırlayan bir olgudur. Literatürde
kredi tayınlamasına enformasyonla ilgili olarak değinen modeller, 1976’da Jaffee Russell
ve 1981’de Stiglitz Weiss tarafından tanımlanmıştır.
Kredi çöküşü ise kredi arzındaki büyük bir gerileme olarak tanımlanmaktadır. Kredi
çöküşü yaşandığı zaman, krediler ile faiz arasındaki ilişki değişmektedir. Kredi çöküşü, iki
farklı biçimde ortaya çıkmaktadır. Birincisi, belirlenmiş faiz oranları üzerinden kredi
arzının azalmasıdır. İkincisi ise, kredi tayınlamasına gidilmesidir.
Kredi çöküşünde, aşırı kredi talebinin olduğu dönemde cari faiz üzerinden ödünç alınacak
fon bulunamamaktadır. Ayrıca, bu döneminde, bankalar kredi vermek için gönülsüz
davranmaktadırlar. Çünkü doğrudan borçlanmaya yönelinmesi nedeniyle bankalara olan
fon akışı azalmakta ve merkez bankası, bankaları kredi arzını sınırlandırmaları yönünde
zorlamaktadır. Bu nedenle; kredi çöküşü, bir kredi arzı sorunu olarak ele alınmaktadır
(Clair ve Tucker, 1993).
Buna karşın, Bernanke vd. (1991), kredi arzındaki azalmayı hem talep ve hem de arz
faktörlerine bağlamaktadırlar. Kriz dönemlerinde borçluların bilanço yapılarının
bozulması, kredibilitelerini azaltmaktadır. Dolayısıyla, kredi talepleri düşmektedir. Kredi
kayıpları nedeniyle bankaların öz sermayesi daralmakta ve bu da, bankaların kredi arzını
daraltmasına neden olmaktadır.

137
Çalışmanın bir sonraki bölümünde Türkiye'deki tüketici kredilerinin yıllar itibariyle
gelişimi ve mevcut durumu ortaya konulmuştur. Bu kapsamda; konut, ihtiyaç, taşıt, diğer
krediler ve bireysel kredi kartları olmak üzere alt türler itibariyle tüketici kredileri
incelenmiştir. Ayrıca Türkiye'de tüketici kredilerindeki büyümenin analizi de yapılmıştır.
Ulaşılan sonuçlar, daha sonraki bölümlerde yapılacak ampirik çalışmalara bir temel
sağlamaktadır.
Tüketici kredileri, bankacılık sektörü ve finansman şirketleri gibi kredi kurumları
tarafından kullandırılan bir kredi türüdür. Bankalar geleneksel olarak yatırım ya da isletme
kredileri ile doğrudan üretimi finanse ederken, tüketici kredileri bireylerin tüketim
harcamalarını finanse etmektedirler. Bu bağlamda tüketici kredileri tüketime yönelik
harcamaların finansmanı için kullanılan krediler olduğu ifade edilebilir.
Tüketici kredilerinin ilk ortaya çıkısı 19. yüzyıla kadar gitmekle beraber asıl yaygınlaşması
20. yüzyılın baslarında gerçekleşmiştir. Tüketici kredilerinin yasal bir alt yapıya dönüşmesi
ise 1970’lere kadar uzanmaktadır. ABD’de yasal bir alt yapıya dayanarak 1970’lerde
başlayan tüketici kredisi uygulaması giderek daha fazla gelişme göstermiştir. Özellikle
1920’lerden sonra otomobil ve beyaz eşya gibi dayanıklı tüketim malı üretiminin artması
bu tür kuruluşların faaliyetlerinin genişlemesine neden olmuştur. Bu gelişmeleri takip eden
bankalar aynı tarihlerde tüketici kredisi alanına girmeye başlamışlardır. 20. Yüzyılın ikinci
yarısından itibaren ise tüketici kredileri çok hızlı bir artış göstererek ABD ekonomisinin
temel unsurlarından biri haline gelmiştir.
Avrupa’da ise tüketici kredileri ilk kez İngiltere’de 1938’lerde ortaya çıkmış ve 1950
yılından sonra yaygınlık kazanmaya başlamıştır. İngiltere hükümeti uyguladığı Keynesci
politikalara uygun olarak tüketici kredileri ile harcamaların önemli derecede artacağını
görmüş ve uygulamayı desteklemiştir. Benzer uygulamalar daha sonra Fransa, Batı
Almanya ve İtalya gibi diğer önemli Avrupa ülkelerinde görülmüştür. Tüketici kredileri
halen Avrupa Birliği’nin finansman politikalarının önemli bir parçasını oluşturmaktadır
(Arslan ve Karan, 2009).
Tüketici kredileri Türkiye'de ise ilk kez 1989 yılında kullandırılmıştır. Bankaları tüketici
kredisine yönelten etmenler arasında, 1980’li yıllarda mevduat faiz oranlarının serbest
bırakılmasıyla bankalarda biriken yüksek mevduatlar, bankacılıkta artan rekabet

138
koşullarıyla düşen kâr marjlarının körüklediği ürün çeşitlendirme gereksinimi, bankaların
riski dağıtma ve tabana yayma politikası sayılabilir.
Türkiye’de tüketici kredilerine olan talebin artmasında ise 2001 krizi öncesi kişisel
gelirlerin enflasyonist ortamda reel olarak gerilemiş olmasıyla mal ve hizmetlerin peşin
alım olanağının azalması, 2000’li yıllarda yaşanan istikrarlı büyüme, krediler karşısında
teminat gösterilen varlıkların değerinin artması, ekonomide oluşan iyimser hava (Başçı,
2006) ve tasarruflarda görülen azalışlar etken olmuştur (Aydın, 1991).
Tüketici kredileri 1993 yılında 35 milyon TL seviyesindeyken, bu rakam 2005 yılında 28
milyar TL’ye, 2014 yılında ise 268 milyar TL’ye yükselmiştir. Bireysel kredi kartı tutarları
da 1993'te 5 milyon TL seviyesindeyken , 2005 yılında 17 milyar TL'ye, 2014 yılında ise
72 milyar TL'ye yükselmiştir. Tüketici kredilerindeki hızlı artış, bu tür kredilerin
bankaların toplam kredileri içerisindeki payının da artmasına neden olmuştur. 1993 yılında
%5'ler seviyesinde olan tüketici kredilerinin toplam krediler içindeki payı, 2004 yılında
%25'ler seviyesine yükselmiş, Bu tarihten sonra da hep %30'lardan yüksek seviyelerde
kalmıştır.
Tüketici kredileri kendi içerisinde temelde üç gruba ayrılır. Konut finansmanı ihtiyacının
giderilmesi için verilen krediler konut kredisi olarak ifade edilmektedir. Türkiye’de
uygulanmaya 2000’li yılların ortalarında başlanan mortgage kredileri de konut kredileri
kapsamında yer almaktadır. Birinci ve ikinci el taşıt alımlarında finansman ihtiyacı olması
durumunda sunulan kredi türü ise taşıt kredisi olarak bilinir. Bunların dışında eğitim,
evlilik ya da başka bir ihtiyacın finansmanı için kullanılan krediler ise ihtiyaç kredisi
olarak ifade edilmektedir. Ayrıca kredi kartlarından yapılan taksitli alışverişler de tüketici
kredileri içerisinde değerlendirilmektedir.
2005 yılında yaklaşık 12 milyar TL olan konut kredileri, 2011 yılında yaklaşık 70 milyon
TL’ye ve 2014 yılında 114 milyon TL'ye yükselmiştir. Buna göre son on yılda konut
kredileri yaklaşık on kat artış göstermiştir. Özellikle 2007-2008 yılları arasında konut
kredilerindeki artış hızında yaşanan gerilemede ABD Mortgage Krizi’nin ve ortaya çıkan
küresel dalgalanmaların önemli payı bulunmaktadır. Konut kredilerinin tüketici kredileri
içerisindeki payı ise 2005-2014 yılları arasında çok değişmemiş ve yaklaşık %40
civarlarında kalmıştır.
139
2005 yılında yaklaşık 6.128 milyon TL olan taşıt kredileri, 2011 yılında 6.925 milyon TL,
2014 yılında ise 6.225 milyon TL olmuştur. 2005-2014 arası dönemde taşıt kredileri,
yaşanan küresel krizlerin etkisiyle dalgalı bir seyir izlemiştir ve son on yıl içinde miktar
olarak değişme göstermemiştir. Dolayısıyla, taşıt kredilerindeki artış, diğer tüketici
kredilerindeki artışın oldukça gerisinde kalmıştır.
2005-2014 yılları arasında tüketici kredileri sürekli olarak artış göstermekle birlikte, taşıt
kredilerinin tüketici kredileri içerisindeki payı da gerileme göstermiştir. 2005 yılında %22
seviyelerinde olan bu oran, 2011 yılında %4’e, 2014’de ise %2’ye gerilemiştir. Söz konusu
gerilemede, tüketicilerin daha düşük faiz oranlı kredilere yönelmelerinin de önemli payı
bulunmaktadır. Taşıt kredilerinde vade yapısına bakıldığında, 2014 yılı itibariyle ferdi taşıt
kredilerin çok büyük bir kısmının orta ve uzun vadeli, çok küçük bir kısmının ise kısa
vadeli olduğu görülmektedir. Diğer taraftan kullandırılan krediler sabit faizli olarak tahsis
edilmektedir. Bu sebeple de taşıt kredilerinin faiz oranlarındaki değişmelere duyarlılığı
düşüktür.
2005 yılında 9.624 milyon TL olan ihtiyaç kredileri, 2008 yılında 38.547 milyon TL’ye,
2011 yılında 85.709 milyon TL’ye, 2014 yılında ise 147.651 milyon TL'ye yükselmiştir.
İhtiyaç kredilerindeki yükseliş trendi, ihtiyaç ve diğer kredilerin toplam krediler
içerisindeki payını arttırmıştır. İhtiyaç ve diğer krediler, tüketici kredileri içerisinde en
fazla paya sahip kredi türü olup, söz konusu kredi türünün toplam tüketici kredileri
içerisindeki payı 2005 yılında %34 iken, bu oran 2011 yılında %53’e, 2014’de ise %55’e
yükselmiştir.
Genel olarak tüketici kredileri bankalar tarafından verilen bireysel müşteri temsilciliği
aracılığı ile sağlansa da, eğitim, ihtiyaç gibi miktarı konut ve araç kredilerine göre daha
düşük olan kredilerin kullanımında kredi kartlarından da yararlanılmaktadır. Aslında
tüketici kredilerinin bir türü gibi görünse de kredi kartları, tüketici kredilerinden farklı
olarak gerek kullanım hacmi, gerekse sağladığı opsiyonlarla tüketici kredilerinden farklı
özellikler göstermektedir.
Kredi kartı; mülkiyeti kendilerine ait olmak üzere banka yada finansal kuruluşların
müşterilerine önceden belirlenen limitlerde, anlaşmalı işyerlerinden yurtiçi ve yurtdışında
mal ve hizmet satın alma ile nakit ödeme birimleri veya otomatik ödeme makinelerinden
nakit çekimlerde kullanılmak amacıyla verilen karttır (Yılmaz, 2000).

140
Kredi kartlarının Türkiye’deki gelişim süreci Avrupa ülkeleri ile paralellik göstermektedir.
Fakat batıda önce tüketici kredisinin uygulaması başlamış, daha sonra tüketici kredilerinin
kolay verilmesi ve kullanılmasını sağlamak üzere kredi kartları piyasaya çıkmıştır.
Türkiye’de ise batıdaki gelişmenin tersine önce kredi kartları kullanılmaya başlanmış, daha
sonra tüketici kredileri hizmeti verilmeye başlanmıştır.
Türkiye’de gerek kredi kartı sayıları gerekse kredi kartı kullanım hacimleri yıllar itibariyle
sürekli olarak artış göstermektedir. Ulaştığı rakamsal boyut bireysel kredi kartlarını
Türkiye'nin bankacılık ve kredi sisteminde önemli bir konuma getirmektedir. Bankalararası
Kart Merkezi verilerine göre, kredi kartı sayıları yıllar itibariyle önemli artışlar göstermiş
olup, 2003 yılı sonunda yaklaşık 20 milyon adet olan kredi kartı sayısı, 2007 yılında 37
milyon adede, 2011 yılında ise 51 milyon adede ve 2014 yılında yaklaşık 57 milyon adede
yükselmiştir.
Bireysel kredi kartı tutarlarına bakıldığında ise, kart sayılarındaki artışa paralel şekilde
rakamsal büyüklüğün de sürekli olarak artış gösterdiği görülmektedir. 2005 yılında 17.055
milyon TL olan bireysel kredi kartı rakamları 2011 yılında 54.374 milyon TL’ye, 2014
yılında ise 72.699 milyon TL’ye yükselmiştir. Dolayısıyla 2005-2014 yılları arası dönemde
bireysel kredi kartı rakamları yaklaşık dört kat artış göstermiştir.
Bireysel kredi kartlarından yapılan net işlem hacmi yanında, işlem hacminin GSYH'a olan
oranı da Türkiye'de yıllar içinde artış göstermektedir. Kredi kartlarından yapılan işlem
hacminin GSYH'a oranı 2009 yılında yaklaşık %22 iken 2014 yılında bu oran %27'i
geçmiş bulunmaktadır.
Türkiye’de finansal istikrarsızlığın baskın olduğu, yüksek faizli ve düşük büyüme hızlı
yıllarda yeterince gelişim göstermeyen tüketici kredileri, 2001 krizinden sonra giderek
artan bir trend izlemiştir. Kamu borçlanma gereksiniminin azalması, kişi başına düşen
gelirin artması ve daha öngörülebilir bir hale gelmesi, hanehalkının borçlanma
maliyetlerinin azalmasıyla, tüketici kredileri pazarı bankacılık sektöründe en hızlı büyüyen
alanlardan birisi olarak öne çıkmıştır. 2001 krizinden sonra tüketici kredilerinde görülen
artışı daha net olarak; kurumsal kredilerdeki artışla karşılaştırarak da değerlendirilebilinir.
Söz konusu dönemde ticari kredilerde yıllık reel artış yüzde 17,1 iken, tüketici kredilerinde
bu oran yüzde 26,6 olmuştur. Tüketici kredilerindeki büyüme hızı çoğu sene kurumsal
kredilerdeki büyüme hızından daha yüksek olarak gerçekleşmiştir.

141
Türkiye'de tüketici kredileri piyasasının, toplam kredilere ve ticari kredilere göre
yoğunlaşmasının daha yüksek olduğu görülmektedir. Başka bir ifadeyle, Türkiye'deki ilk
10 bankanın diğer bankalara oranla daha yüksek oranda tüketici kredisi kullandırdığı
gözlemlenmektedir. Buna karşın, küçük ölçekli bankaların toplam tüketici kredileri
içindeki payı, diğer kredi türlerine göre daha düşüktür. Ayrıca tüketici kredisi
kullandırmada mevduat bankalarının baskınlığı da devam etmektedir.
Türkiye'de tüketici kredilerinin zaman içerisindeki gelişimi ve mevcut yapısına ilişkin bu
bilgilerden sonra, tüketici kredisi kullanan hanehalklarının tüketim düzleştirmesi yapmaları
ve bu durumun Türkiye'de Merkez Bankası'nın para politikalarını etkinsizleştirdiği
argümanı inceleme konusu yapılmıştır. Argümana göre, tüketici kredilerindeki hızlı
büyüme sonrası hanehalklarının tüketim davranışı literatürde "sürekli gelir hipotezi" olarak
adlandırılan tüketim kalıbına uygun olarak gelişmiştir.
Ludvigson (1999), Amerika için yaptığı çalışmada tüketici kredilerinin tüketim için
belirleyici olduğunu sürekli gelir hipotezini kullanarak göstermiştir. Baccheta ve Gerlach
(1997) aynı şekilde diğer ülkeler için yaptıkları çalışmalarda da tüketici kredileri ile
tüketim düzeyi arasında ilişki bulmuşlardır. Bu çalışmalara karşın, Hall (1978) bugünkü
tüketimin belirleyicisinin geçmiş dönem tüketim düzeyleri olduğunu söyleyerek, tüketici
kredisi kullanımı gibi gelir düzeyindeki geçici değişikliklerinin bugünkü tüketim düzeyi
üzerinde herhangi bir etkisi olmadığını savunmuştur. Cambell ve Mankiw (1989), Hayashi
(1982, 1985), Chah, Ramey ve Starr (1995) ise çalışmalarında bugünkü tüketim düzeyinin
belirleyicisinin geçmiş dönem gelir düzeyleri olduğunu yaptıkları ampirik çalışmalarla
kanıtlamaya çalışmışlardır.
Türkiye'de tüketici kredilerindeki büyüme sonrası hanehalklarının tüketim düzleştirmesi
yapmaları ve tüketim davranışlarını sürekli gelir hipotezine uygun olarak yapılandırdıkları
argümanını analiz etmek amacıyla Ludvigson (1999)'un modeli 1995-2014 arasındaki
yıllar için test edilmiştir. Ayrıca hem toplam tüketici kredileri hem de kredi kartları için iki
farklı alt örneklem grubu kullanılmıştır. Toplam tüketici kredileri için birinci alt örneklem
1995-2006 yılları arasını kapsarken, ikinci alt örneklem ise 2006-2014 yıllarını
kapsamaktadır. Kredi kartları için ise birinci alt örneklem 1995-2004 yılları arasını
kapsarken, ikinci alt örneklem ise 2004-2014 yıllarını kapsamaktadır.

142
Sonuç olarak, 2006-2014 yılları arasında tüketici kredilerindeki ve gelirdeki artışın
tüketimdeki artışın anlamlı birer tahmin edicisi olmadıkları gösterilmiştir. Bu sonuç sürekli
gelir hipoteziyle birebir uyumludur. Aynı sonuç kredi kartlarında 2004-2014 yılları arası
için de geçerlidir. Kredi kartlarındaki artış hanehalkı tüketimindeki artışın anlamlı bir
tahmin edicisi değildir. Buna karşın, sürekli gelir hipotezinin geçerli olmadığı sadece
toplam tüketici kredileri için 2006 yılı öncesi dönemde ve kredi kartları için 2004 yılı
öncesi dönemde savunulabilir. Bir başka ifadeyle Türkiye'de erken dönem verisiyle yapılan
analizlerde sürekli gelir hipotezinin varsayımlarını reddetmek mümkün değildir.
Bu sonuçlar, tüketici kredilerindeki ve bireysel kredi kartlarındaki artışın parasal aktarım
mekanizmalarından kredi kanalının etkinliğini azalttığı argümanını doğrular niteliktedir.
Günümüzde tüketici kredilerine ve kredi kartlarına kolaylıkla ulaşabilen hanehalkları,
ekonomik daralma, finansal krizler veya Merkez Bankası'nın uyguladığı sıkılaştırıcı para
politikası dönemlerinde tüketimleri düzleştirmekte ve daralan finansal piyasalardan
minimum düzeyde etkilenmektedirler. Bir başka ifadeyle, hanehalklarının tüketim
davranışları sürekli gelir hipoteziyle uyumlu hale gelmektedir. Hall (1978)'un da iddia
ettiği gibi borçlanan hanehalklarının sadece geçici gelirleri artmakta olup, sadece geçici
geliri değiştiren toplam talep yönlü para politikalarının hanehalklarının tüketim
davranışları üzerinde bir etkisi bulunmamaktadır. Dolayısıyla elde edilen sonuçlar Hall
(1978)'un argümanlarını da destekleyici yöndedir.
Yukarıda açıklanan analizde, toplam krediler için 2006 yılının, kredi kartları için ise 2004
yılının yapısal kırılma tarihleri olarak belirlenmesinde Harvey, Leybourne ve Taylor
(2006) modeli kullanılmıştır. Model kullanılarak hem önceden bilinen hem de bilinmeyen
kırılma tarihleri için test yapılmıştır. Bilinen kırılma tarihleri için toplam kredilerde 2006
yılı birinci çeyrek ve kredi kartlarında 2004 yılı birinci çeyrek tarihleri seçilmiştir. Bu
tarihlerin bilinen kırılma tarihleri olarak seçilmesinde Bankacılık Düzenleme ve Denetleme
Kurumu'nun tüketici kredilerindeki yapısal kırılmayı analiz ettiği çalışma referans olarak
alınmıştır.
Test sonucunda toplam kredilerde 2006 yılı birinci çeyrek ve kredi kartlarında 2004 yılı
birinci çeyrek tarihleri için %1 anlamlılık düzeyinde kırılma olmadığı boş hipotezi
reddedilmiştir. Buna karşın önceden bilinmeyen yapısal kırılma testi için model sonuçları
toplam kredilerde 2003 yılı üçüncü çeyreğini kredi kartlarında ise 2004 dördüncü çeyreğini
yapısal kırılma tarihleri olarak göstermiştir. Buna karşın bu tarihler sırasıyla %10 ve %5

143
anlamlılık düzeyinde kırılma olmadığı boş hipotezini reddetmektedir. Sonuç olarak daha
yüksek anlamlılık düzeylerine sahip 2006 birinci çeyrek ve 2004 birinci çeyrek tarihleri
sırasıyla toplam tüketici kredileri ve kredi kartları için yapısal kırılma tarihleri olarak
seçilmişlerdir.
Tüketici kredileri ve kredi kartlarındaki büyümenin kredi kanalının çalışmasını ve Merkez
Bankası'nın para politikalarını etkinsizleştirdiği argümanını reddeden bir kısım
çalışmalarda ise tam tersi bir argüman savunulmaktadır. Bu argümana göre özellikle kredi
kartı kullanan tüketicilerin parasal daralma dönemlerinde yükselen faizler nedeniyle
likidite kısıtı içine düştükleri, bu nedenle kredi kartı kullanan tüketicilerin Merkez Bankası
para politikalarına çok daha duyarlı oldukları ve dolayısıyla kredi kartlarının kredi
kanalının çalışmasının etkinliğini arttırdığı ileri sürülmektedir.
Gross ve Souleles (2002), likidite kısıtı argümanının halen geçerli olduğunu, çünkü tüketici
kredileri içindeki önemli bir payın değişken faizli bireysel kredi kartlarından oluştuğunu
savunmaktadırlar. Buna göre, değişken faizli kredi kartı kullanan tüketiciler faizleri
yükselten daraltıcı para politikalarına karşı daha duyarlı olmaktadır. Türkiye'de de
yukarıda bahsedildiği üzere toplam tüketici kredileri içinde bireysel kredi kartlarının oranı
yaklaşık %30 düzeyindedir. Bu nedenle Türkiye'de kredi kartı kullanan hanehalklarının da
likidite kısıtı içinde olup olmadıkları bu çalışmada analiz edilmiştir.
Likidite kısıtı argümanına karşın, yukarıda da bahsedildiği üzere Türkiye'de 2004 yılından
sonra kredi kartı kullanımında önemli bir büyüme gerçekleşmiştir. Günümüzde likidite
kısıtı içindeki tüketiciler dahi yeni kredi kartları çıkarabilmekte veya mevcut kredi
kartlarının limitini yükseltebilmektedirler. Daraltıcı para politikaları sonucu yükselen
faizlere karşın kredi kartları tüketicilere düşük işlem maliyetli borç alma olanağı sunmakta
olup, onların likite kısıtı içine düşmelerini engellemektedir. Dolayısıyla, Merkez
Bankası'nın daraltıcı para politikalarının ve yükselen faizlerin hanehalklarının tüketim
davranışları üzerinde herhangi bir etkisi olmayabilir.
Bu çalışmada yapılan ampirik analizler göstermektedir ki; Türkiye'de yükselen faizler
hanehalklarının kredi kartlarına ulaşmasında bir engel teşkil etmemektedir. 2002-2014
yılları arasındaki veriler kullanılarak yapılan analizde kredi kartı kullanımın arttığı ve bu
durumun hanehalklarını çok daha likit duruma getirdiği gözlemlenmiştir. Bir başka

144
ifadeyle, daraltıcı para politikası dönemlerinde tüketiciler yeni kredi kartı çıkarabilmekte
veya kredi kartı limitleri yükselterek çok daha likit hale gelmektedirler.
Yukarıda açıklanan hususlar bu çalışmada para politikasındaki bir değişmeye karşılık kredi
kartı bilançosu ve kredi kartı likiditesinin etki-tepki fonksiyonları kullanılarak tahmin
edilmeye çalışılmıştır. Kredi kartı bilançosu ve likiditesinin tepkileri hem daraltıcı hem de
genişletici para politikalarına karşı test edilmiştir. Kredi kartı likiditesi olarak kredi
kartlarının toplam kullanılmayan limitleri tanımlanmıştır. Etki tepki fonksiyonlarının
tahmininde beş değişkenli bir VAR modeli kullanılmıştır. Birim kök, eşbütünleşme,
Granger nedensellik ve Geweke eşbütünleşme testleri çalışmada sunulmuşlardır.
Etki-tepki fonksiyonları Türkiye'de para politikasının etkinliği konusunda yeni kanıtlar
sunmaktadır. Buna göre, daraltıcı para politikaları hanehalklarının yeni kredi kartları
çıkarmaları ve mevcut kredi kartı limitlerini arttırmalarına neden olurken, aynı zamanda
hanehalklarının likiditesi artmaktadır. Aynı şekilde, genişletici para politikalarının kredi
kartı piyasasında genişletici bir etkisi mevcut olmasına karşın, bu etki hanehalklarının
tüketim düzeyini çok fazla değiştirmemektedir.
Merkez Bankasının daraltıcı para politikası şoklarına karşı; kredi kartı bakiyesi ve
likiditesinin gösterdiği tepkiler, para politikasının daraltıcı etkilerinin kredi kartlarının
kullanımıyla kısıtlandığına işaret etmektedir. Bir başka ifadeyle, kredi kartlarının kullanımı
daraltıcı politikaların hanehalkı tüketimi üzerindeki etkisini sınırlandırmaktadır. Kredi
kartları daraltıcı politika dönemlerinde hanehalklarına her daim likidite sağlamaya devam
etmektedir.
Günümüzde Dünyada olduğu gibi Türkiye'de de tüketici kredileri ve kredi kartları hemen
her tüketici için kolaylıkla ulaşılabilen ve yaygın olarak kullanılan finansal araçlar haline
gelmişlerdir. Bu durum hanehalklarını eskisine göre çok daha likit hale getirmiş ve onlara
tüketimlerini düzleştirme imkanı sağlamıştır. Dolayısıyla, Merkez Bankaları'nın tüketici
davranışlarını etkileme gücü büyük ölçüde sınırlandırılmıştır. Merkez Bankalarının
gelecekteki politikalarını şekillendirirken bu durumu göz önüne almaları önem arz
etmektedir.

145
APPENDIX B: CURRICULUM VITAE
PERSONAL INFORMATION
Surname, Name: GÖKSAL, Koray
Nationality: Turkish (TC)
Date of Birth: 02 October 1979
Place of Birth: Ankara
email: [email protected]
EDUCATION
Degree
Institution
Year of Graduation
MS Turkish Military Academy,
Department of Operations Research 2005
MS
Middle East Technical University,
Department of Economics
2005
BS
Hacettepe University,
Department of Economics
2001
PROFESSIONAL EXPERIENCE
Year
Place Enrollment
2011- Present Yıldırım Beyazıt University,
Department of Economics Research Assistant
2006-2011
Başkent University,
Department of Economics
Research Assistant

146
PUBLICATIONS
Oğuz, F., Akkemik, K.A., Göksal, K. (2015). Toward a wider market definition in
broadband: The case of Turkey. Utilities Policy, 37, 111-119
Akkemik, K. A., Göksal, K. (2014). Do Exports Explain Industrial Agglomeration and
Regional Disparities in Turkey? Journal of International Development, 26 (4), 471-491.
Oğuz, F., Akkemik, K.A., Göksal, K. (2014). Can Law Impose Competition? A Critical
Discussion and Evidence from the Turkish Electricity Generation Market. Renewable and
Sustainable Energy Reviews, 30, 381-387.
Akkemik, K. A, Göksal, K., Li, J. (2012). Energy Consumption - Income Nexus in Chinese
Provinces: Heterogeneous Panel Causality Analysis. Applied Energy, 99, 445-454.
Akkemik, K. A., Göksal, K. (2012). Energy Consumption - GDP Nexus: Heterogeneous
Panel Causality Analysis. Energy Economics, 34 (4), 865-873
Akkemik, K. A., Göksal, K. (2010). Do Chinese Exports Crowd-Out Turkish Exports?
İktisat, İşletme ve Finans, 25 (287), 9-32.