Leaf anatomy and morphometry in three eucalypt clones treated with glyphosate
Upload
westernsydneyCategory
view
0download
0
Conservation value of eucalypt plantations established for wood production and multiple environmental benefits in agricultural landscapes
Final Report for NAP/NHT2 Eucalypt Plantations project SLA 0013 R3 NAP by Rod Kavanagh, Brad Law, Frank Lemckert, Matthew Stanton, Mark Chidel, Traecey Brassil, Alison Towerton and Trent Penman Forest and Rangeland Ecosystems Research NSW Industry and Investment (formerly NSW Department of Primary Industries) January 2010

2
Conservation value of eucalypt plantations established for wood production and multiple environmental benefits in agricultural landscapes Lead organisation: NSW Industry and Investment (formerly NSW
Department of Primary Industries) Forest and Rangeland Ecosystems Research Program,
Forest Science Centre, West Pennant Hills Contacts: Dr Rod Kavanagh, 02 9872 0160 [email protected]
Dr Brad Law, 02 9872 0162 [email protected]
Dr Frank Lemckert, 02 9872 0159 [email protected]
Date commenced: 1 July 2006 Date completed: 30 June 2009 Project jointly funded by the NSW and Commonwealth Governments through the National Action Plan for Salinity and the Natural Heritage Trust 2 Funding implemented through the State Level Activities Round 3, 2005/2007 Eucalypt Plantations project SLA 0013 R3 NAP

3
Bat box Apartment box
Paddock (cropping) Paddock (grazing)
Eucalypt plantation (E. crebra) Eucalypt plantation (E. camaldulensis)

4
Eucalypt plantation (E. camaldulensis) Eucalypt plantation (E. sideroxylon)
Small remnant (E. albens) Small remnant
Large remnant (Breeza State Forest) Large remnant (Pine Ridge State Forest)

5
Summary This project documented the capacity of young eucalypt plantations to restore habitat for fauna within a highly fragmented, and ecologically degraded, agricultural landscape. The study compared fauna occupancy within 4-6 year old eucalypt plantations and paddocks used for grazing and intensive cropping with remnant forest and woodland in the region. The study sought to validate inferences from a previous study in another region about the importance of plantation age and size and proximity to remnant vegetation. It also sought to calibrate forestry-type plantations with eucalypt plantings established primarily for broad environmental benefits. The study assessed opportunities for improving habitat for fauna in agroforestry plantations. It also documented the capacity of eucalypt plantations to provide critical resources for breeding and year-round occupancy for a range of vertebrate species. We found that the responses varied across the different taxonomic groups of fauna investigated. Young (4-6 year old) eucalypt plantations had a surprisingly similar avifauna to that recorded in remnant forest and woodland in the Liverpool Plains region. This favourable comparison may have been due, in part, to the small size and isolation of forest remnants in the region, to the frequent occurrences of larger remnants on low fertility soils, and to their long history of grazing and logging disturbance. These factors would have resulted in the occurrence of a more simplified avifauna within remnants. However, the avifauna of young eucalypt plantations is necessarily dependent on the species composition of nearby remnant forest and woodland. Significantly, many bird species appeared capable of utilising young eucalypt plantations within four years of plantation establishment on ex-pastoral and cropping sites. Open paddocks on agricultural sites were again shown to provide very poor habitat for most birds (e.g. Kavanagh et al. 2007) and, accordingly, bird communities in agricultural areas were highly simplified and depauperate. While clearly not in the same class as remnant forest and woodland, the key point is that eucalypt plantations have enormous potential and capacity to quickly restore or supplement habitat for many bird species in agricultural landscapes. Forestry plantations (i.e. those with typically fewer, and often non-local tree species, and with fewer or no shrubs) were also found to make a significant contribution to bird species conservation, as observed previously for “environmental-type” eucalypt plantings established primarily for habitat restoration and improved landscape amenity (Kavanagh et al. 2007). For example, the mean number of woodland-dependent bird species recorded per 10 minute count in forestry plantings on the Liverpool Plains was 41.2% of that recorded in forest remnants. This compares with 82.1% for environmental plantings near Albury (Kavanagh et al. 2007). In part, these differences reflect the larger amounts of native vegetation cover retained in the Albury area (approx. 12.7% within 5 km radius around each of 120 sites) compared to the more intensively-farmed landscape on the Liverpool Plains (approx. 8.7% native vegetation remaining within a 5 km radius around each of 43 sites). Woodland-dependent bird species were

6
much less likely to be recorded in paddocks on the Liverpool Plains (0.2% of the mean counts recorded in remnants) than those in the Albury region (17.4% of the mean counts in remnants; mainly associated with clumps of paddock trees). These comparisons illustrate the importance of the amount of native vegetation that is retained in the landscape and the scarcity of paddock trees on the Liverpool Plains. They also illustrate the significant contributions that eucalypt trees planted on ex-farming sites can make for regional bird species conservation. Eucalypt plantings established for forestry purposes appear to make a significant, though lesser, contribution to regional bird species conservation compared to that found previously for environmental plantings on similar sites in the Albury region. The differences in performance, relative to remnants, between these forestry plantings and the Albury plantings may also have been due, in part, to the older age-classes of trees planted near Albury (7-25 years). The importance to fauna of plantation tree age-class could not be addressed rigorously in this study. All planted sites were the same age (4-6 years at the time of sampling), except for two sites that were slightly older. These two sites had bird species assemblages that were more similar to remnant forest and woodland than most other plantation sites. These results support those of Kavanagh et al. (2007) who found that older (10-25 years) planted sites generally had a richer avifauna than younger sites (7-10 years). The forestry plantings, while generally more vigorous, were also more simple structurally and floristically (i.e. comprising fewer tree species and no shrubs) compared to those studied near Albury. These characteristics should also have accounted for some of the observed differences between localities but the forestry plantations (usually 2-3 tree species) performed better than expected. This study has shown that eucalypt plantings have the capacity to provide the resources needed by many bird species for breeding and year-round occupancy. This is evident from the generally stable numbers of bird species recorded in eucalypt plantations during all four seasons of the year. The study confirmed the importance to recovery of woodland-dependent bird species of establishing eucalypt plantations in those parts of agricultural landscapes that are near (< 500 m) remnant forest and woodland, or at least near clumps of remnant trees. Isolated plantings experienced much slower rates of occupancy by woodland-dependent birds. The ultrasonic survey of insectivorous bats found that the young eucalypt plantings were not preferentially used compared to tree-less paddocks. Plantings were typically used by 7-8 species in both spring and summer, and activity averaged 87 passes per night at a detector site. However, the activity within plantings was similar to tree-less paddocks and it was about six times less than that found in small remnants on the plains. The very high activity levels in small remnants on the Liverpool Plains could be related to the widespread rich, basalt soils. This geology was strongly related to overall bat foraging activity, probably because soil productivity influences flying invertebrate numbers and in turn the feeding behaviour of bats. Neither planting area nor shape influenced bat activity on the Liverpool Plains, rather total activity and species richness was correlated positively with the number of

7
remnant trees on the site, but negatively with the extent of remnant cover. This result is likely to reflect the importance of remnant tree structure, but lower activity in the larger remnants (State Forests), which are restricted to sedimentary geology. However, it is important to note that State Forests supported the only records of two threatened species, Nyctophilus corbeni and Chalinolobus picatus. The results from radio-tracking four different bat species support the findings from the ultrasonic survey, in that plantings were not preferentially used by individual bats. The percentage nocturnal use of plantings was relatively small (mean = 12 % in summer and 14 % in spring), although similar to the extent of plantation in the landscape (17 %) immediately surrounding (< 500 m) our radio-tracking study area. These results suggest that plantings provide useable foraging habitat for manoeuvrable bat species, but that much greater areas are likely to be required to make significant contributions to restoring bat habitat in heavily cleared landscapes. In contrast to providing foraging habitat, plantings did not provide roosting habitat. Most bat roosts were found in tree hollows, which were absent in the plantings. Although decorticating bark was abundant in eucalypt plantings, only Nyctophilus geoffroyi was observed beneath bark and only in remnant trees. As diurnal roosts are a critical resource for bats to shelter and breed in, our results emphasise the importance of retaining hollow-bearing trees in the landscape and within plantings. Habitat searches for reptiles recorded 18 species of reptiles either within remnants and/or plantings, but no reptiles were observed in paddocks. The majority of records were of skinks (274 records), with Morethia boulengeri being the most widely recorded species (77 individuals from 20 sites) followed by Cryptoblepharus virgatus (62 individuals from 11 sites). However, most species were infrequently recorded with 13 of the 18 species being represented by three or less individuals. Frogs were occasionally recorded during the transect searches, but not in sufficient numbers to make any assessments of their status. Larger remnants had greater species richness and total reptile abundance than the other habitat types. Remnants appeared to have greater numbers of animals relative to plantings, but this depended on the planting. Increased structural complexity in remnants appeared to be the most important factor in providing better habitat, with many plantings having little or no ground cover available as shelter for reptiles. Arboreal marsupials and nocturnal forest birds were largely confined to remnant vegetation, except where plantations were located near remnants. The only arboreal marsupial frequently using young eucalypt plantations was the Koala. Two adult males were radio-tracked with GPS collars for up to eight months and found to utilize all vegetation types in this agricultural landscape. Koalas foraged and occasionally sheltered in plantations, but appeared to prefer shelter during the day in taller, remnant trees. Remote motion-sensing cameras recorded 15 species of terrestrial mammals, nine of which were introduced pests, two of which were significant predators of native animals. Young eucalypt plantations clearly provided useful habitat for a wide range of terrestrial mammals, especially kangaroos and wallabies

8
(4 species). The Red Fox was very common in all vegetation types in this landscape. Eucalypt plantings clearly lack certain resources and habitat components that are important for many fauna. A rigorous field experiment was established to test the effect of supplementing plantings with nest boxes and ground cover. Initial inspections to document the use of these resources found that the addition of nest boxes provided otherwise missing tree hollow resources for two species of bats, two species of marsupials, two species of parrot and tree frogs. Invertebrates also made extensive use of all kinds of boxes provided. One kind of nest box used in this trial was commonly used by the Common Starling, a pest species. Nest box uptake by some species such as Sugar Gliders was limited by proximity to remnant populations. The addition of cover boards greatly increased the counts of reptiles in plantings compared to those without added cover, further indicating that lack of cover is the main restriction on the use of plantings by reptiles. Both forms of habitat supplementation (nest boxes and ground cover) will require further inspections and surveys in coming years to fully test the hypotheses of the experiment. Recommendations to improve the biodiversity values of eucalypt plantations need to consider the varying requirements of different fauna groups. Birds benefit from a high stocking rate of trees in plantations, but many bats are unable to forage in dense vegetation. A practical recommendation to balance the needs of these two groups could be to plant at a high density to minimise weeds and optimise tree growth and form, but then to thin some patches non-commercially within the plantation to create gaps. Consideration could also be given to alternate planting of eucalypts and fast-growing acacias, with the latter self-thinning creating gaps in the plantation and increased ground cover with fallen dead wood. The aim would be to maximise structural complexity at the patch scale. Our results suggest the floristic composition (i.e. a few commercial species of eucalypts) compared to richer environmental plantings has less effect on fauna than structural components. The composition of biodiversity inhabiting eucalypt plantations is influenced differentially by the surrounding landscape. Birds and less mobile terrestrial fauna benefit enormously when plantations are established close to existing remnants. The landscape scale is of less importance to bats, but the retention of remnant trees on farms, even when scattered in the landscape, is vital for bats. Plantation patch area appeared to be less important for birds than proximity to remnants. Artificial ground cover and nest boxes are predicted to benefit a wide range of fauna, but the extent is yet to be fully revealed.

9
1. Introduction Habitat loss is regarded as the most important factor accounting for loss of species worldwide (Andrén 1994, Fahrig 2001, Foley et al. 2005, Bennett et al. 2006) and in the agricultural regions of Australia (Saunders 1989, Goldney and Bowie 1990, Ford et al. 2001, Radford et al. 2005). The re-establishment of native vegetation, either through natural regeneration (fencing to exclude stock) or by planting trees and shrubs, has been suggested as a potential solution to the widespread loss of habitat for many species in agricultural landscapes (Hobbs 1993, Saunders and Hobbs 1995, Vesk and MacNally 2006). While tree plantings provide a range of environmental, ecological, economic and social benefits, there is considerable uncertainty about whether revegetation can effectively restore habitat for declining and threatened species in rural landscapes (Vesk et al. 2008). Over the past decade in Australia there have been many studies, mostly focused on birds, that have sought to determine the responses of fauna to revegetation in agricultural landscapes (see review by Munro et al. 2007). The consensus to date is that revegetation is not a good replacement of remnant vegetation for many species. However, there is a valuable role for tree plantings in providing habitat for some species in places where currently there is none available, and potentially to augment the carrying capacity of nearby remnant vegetation. Studies have shown that highly mobile species (e.g. birds, bats) are among those most likely to take advantage of the new habitat provided by eucalypt plantations, and that benefits are more likely to occur when plantings are established near remnant vegetation (Kavanagh et al. 2005). Much remains to be learned about the value of tree plantings in restoring habitat for wildlife in agricultural areas (Munro et al. 2007). Clearly, young eucalypt plantations lack many of the habitat attributes needed by animals; attributes which are more likely to be found in older, more structurally and floristically complex areas of remnant forest and woodland. Benchmarking the relative values to wildlife of tree plantings in different locations and landscape contexts, in different tree species mixtures, and in varying patch areas, age-classes and structural complexity, is important to better understand wildlife responses to revegetation and to support policies aimed at redressing land degradation in agricultural areas. Background context
During 2001-2004, we conducted a large-scale study (136 sites) of the birds, mammals, reptiles and amphibians occurring in eucalypt plantings and remnant vegetation on farms in the Albury-Wodonga region of southern NSW. Our report to the federal government’s Joint Venture Agroforestry Program (Kavanagh et al. 2005) documented the extent to which eucalypt plantings can assist farmers and regional conservation planners to improve biological diversity in agricultural landscapes in south-eastern Australia, and identified a number of important variables influencing their effectiveness. The report showed that significant improvements in vertebrate species diversity and abundance, including many woodland-dependent species, occur when trees

10
are planted in agricultural landscapes. Plantings of native trees and shrubs of all shapes and sizes, especially those older than 10 years and larger than 5 ha, provide habitat for a wide range of species. Birds and bats displayed the greatest response wherever trees were planted, but other groups used eucalypt plantings when they were located near remnants. We recommended that remnant vegetation should become the focal point for restoration efforts. Also, we identified a wide range of management actions that can be taken to protect or enhance biodiversity values in eucalypt plantings established primarily for nature conservation. Subsequently, we completed a study, funded by the NSW Environmental Trust and based on the above-mentioned 136 sites (Weinberg et al. 2008), which tested the rigour of common assumptions made about habitat surrogates as used to underpin several “biodiversity toolkits” that have been developed in Queensland, New South Wales and Victoria. This study compared the predictions of these toolkits for a range of vegetation types, including eucalypt plantations, with real data on species occurrence that had been collected at the same sites. This study identified critical threshold levels in vegetation condition and landscape context and contributed to a better understanding of the roles of re-vegetation and remnant vegetation in biodiversity conservation. The current study builds upon this existing base of knowledge and extends the geographical relevance of the work to include the Liverpool Plains region near Quirindi and Gunnedah. Significantly, it also broadens the scope of existing studies to include eucalypt plantations established for commercial wood production. These plantings typically had fewer tree species and no shrubs planted compared to the more diverse plantings studied near Albury which were established primarily for habitat restoration and to improve landscape amenity. 1.1 Aims The principal aims of this study were:
• To validate inferences from the Albury-Wodonga study (Kavanagh et al. 2005, Law and Chidel 2006, Kavanagh et al. 2007) about the importance to fauna of plantation size (area), tree age-class, and proximity of eucalypt plantations to remnant vegetation;
• To calibrate forestry-type plantings (i.e. those with typically fewer, and often non-local tree species, and with fewer or no shrubs) with eucalypt plantings established primarily for habitat restoration (i.e. most of those sampled previously in the Albury-Wodonga region);
• To explore the opportunities for improving habitat for fauna in commercial eucalypt (agroforestry) plantations;
• To document the correlations between vertebrate species presence in eucalypt plantations and the capacity of plantations to provide the critical resources needed for breeding and year-round occupancy;
• To provide recommendations for improving conservation outcomes at farm, landscape and catchment scales.

11
The principal outcomes of the project will be significant new information about the conservation value of eucalypt plantations established for commercial wood production and multiple environmental benefits. This knowledge will be relevant to applications in high salinity priority landscapes on the western slopes of NSW. It will be tempered by an understanding of the practical realities of growing trees on farms, but will also contain an appreciation of the potential for farmers to influence conservation outcomes as a result of their varying approaches to plantation management.

12
2. General methods 2.1 Study area The Liverpool Plains region on the north-western slopes of NSW stretches from Quirindi in the south to Narrabri in the north, and from Tamworth in the east to the Pilliga forests in the west. Most of the region occurs on flat, fertile, basalt-derived, black soils that have been extensively cleared and now support intensive cropping for sorghum and sunflowers as the dominant land use. Red, sandy soils, which are generally located on gentle slopes around the edges of the cropping lands, have also been extensively cleared and now support grazing by cattle and horses as the main land use. Small (< 2,000 ha) isolated forest areas are located on sandy and rocky ridges in the region. These areas, which are mostly State Forests, have been protected from clearing but all are subject to timber harvesting and grazing by leaseholders. The native vegetation that once occurred throughout the more fertile parts of the region consisted of White Box and Yellow Box woodlands with a grassy understorey and Red Gum, Grey Box, Grey Ironbark and White Cypress Pine forests with a shrubby understorey. Forest and River Red Gums occur along the major river systems and creeks. Only small patches of these vegetation types now remain and all have been heavily cut for fence posts and firewood and all are grazed regularly. The forests on the less fertile upper slopes and ridges are in comparatively good condition. Broad-leaved Ironbark, Blakelys Red Gum, Grey Box and small areas of White Box are associated with a patchy but occasionally dense mid-storey of White or Black Cypress Pine and, usually, a well-defined shrubby understorey. The climate of the region is characterised by hot, wet summers and cold, drier autumn-winters. Mean annual rainfall for Quirindi during 1882-2009 (127 years) was 683 mm, with mean daily maximum and minimum temperatures of 32.2oC (January) and 1.6oC (July) for the period 1907-2009 (89 years), respectively (Bureau of Meteorology). Rainfall in the region was well below the long-term average in 2002, 2003, 2005, 2006 and 2009, near average in 2001 and 2007, and above average in 2000, 2004 and 2008. 2.2 Research design The research design and sampling sites were based on the 400 ha of planted eucalypt forests established on 14 farms in the Liverpool Plains region between Quirindi and Gunnedah in 2002-2004 (Walsh et al. 2005). These forests were established at an operational scale by State Forests of NSW using funding provided by the NSW Salinity Strategy. The purpose was to develop new products and environmental service markets for planted forests in priority salinity hazard landscapes. These plantations were also intended to act as a lever to attract additional investment in planted forests in the region. Plantation patches were selected for study within the available range (2-40 ha) in area and compared with similar-sized and, for reference, much larger patches of remnant native vegetation as well as paddock sites typical of the surrounding agricultural matrix. Each plantation consisted of 1-4 tree species (usually 2-3) that were selected, depending on local site conditions, from

13
Eucalyptus camaldulensis ssp1, E. camaldulensis ssp2, E. crebra, E. sideroxylon, E. pilligaensis and Corymbia maculata. A total of 43 sites were selected for sampling: 27 sites in young eucalypt plantations, 11 sites (including 5 in State Forests) in remnant forest and woodland, and 5 sites in paddocks that were representative of the dominant farming (grazing and cropping) land-use in the region (Fig. 2.1, Table 2.1). These sites were distributed across an elevation range from 268-426 m (median 360 m a.s.l.). Vegetation type and condition, patch area, connectivity and landscape context all have important influences on the likelihood of species occurrence. Accordingly, data were extracted for each study site to enable analyses to be undertaken in relation to the area of eucalypt plantation and remnant vegetation occurring within a 500 m, and a 5,000 m, radius of each site (Table 2.1). Predominant soil type was recorded. General habitat characteristics were also recorded visually within a 20 x 50 m plot centred on each site (Table 2.2). The five sites located in the largest remnants were those established in Pine Ridge State Forest, Spring Ridge State Forest, Doona State Forest, Breeza State Forest and Vickery State Forest (Fig. 2.1). An additional six sites were located among fragmented remnant forests and woodlands on farming properties and roadside reserves among the predominantly grazed portions of the landscape. The 27 eucalypt plantation sites were located on 13 properties (1-4 sites per property) mainly on red, sandy or rocky soils but also on some black soil locations. One paddock was selected from each of five different properties including both red (i.e. grazed) and black (i.e. cropping) soil locations (Fig. 2.1). Most of the eucalypt plantation sites were sampled about 4-6 years after planting in 2002 and five of these sites were also sampled in 2001 before the trees were planted (i.e. as paddocks). Two plantation sites (sites 1 and 2) were planted beneath a sparse canopy of mature eucalypt trees (Eucalyptus albens and E. melliodora, respectively). Two plantation sites (sites 23 and 25) were slightly older than the rest and were sampled approximately 10 years after planting. Nine eucalypt plantation sites were scheduled to receive habitat supplementation through the provision of nest boxes and the placement of artificial ground cover (i.e. wooden palings). These sites were paired with other similar plantation sites that did not receive habitat supplementation. Counts of the breeding season and non-breeding season populations of vertebrate species were undertaken on all study sites using standardized, formal survey methods that were appropriate for each taxonomic group. Bird nest searches were undertaken on all sites for all species during the breeding season.

14
Fig. 2.1. Distribution of the 43 study sites in the Liverpool Plains region of NSW.

15
Table 2.1. Landscape context of the 43 study sites.
Site Type
Patch area (ha)
Remnants within 5,000 m
(ha)
Remnants within 500 m
(ha)
Remnants near 500 m
(ha)
Eucalypt plantation within
500 m (ha)Plantation area-
edge ratio
Basalt soils within 500 m
(ha)
Sedimentary soils within 500 m (ha)
Elevation (m a.s.l.)
1 Eucalypt planting 6.5 395 6 139 8 34 78 0 4262 Eucalypt planting 16.6 321 6 6 17 74 78 0 3803 Remnant 376 44 131 10 39 78 0 4184 Eucalypt planting 13 330 0 0 17 24 78 0 3705 Eucalypt planting 12.7 76 0 0 19 58 78 0 3646 Paddock 105 0 0 0 0 78 0 3587 Eucalypt planting 4.2 45 0 0 4 41 78 0 3648 Eucalypt planting 9 16 0 0 10 39 78 0 3689 Eucalypt planting 1.7 204 0 0 2 31 0 78 36810 Eucalypt planting 14.5 1387 9 10 17 29 3 75 35311 Eucalypt planting 8.9 995 5 29 9 32 0 78 36312 Eucalypt planting 40.1 1669 0 71 41 77 0 78 32513 Eucalypt planting 15.5 1544 8 18 56 66 0 78 32514 Eucalypt planting 4.2 1234 0 0 4 14 55 23 33315 Remnant 2062 16 80 0 0 15 63 33016 State Forest 1753 46 1500 0 0 55 24 33117 Eucalypt planting 1.8 593 0 0 2 31 1 77 36018 Eucalypt planting 22.2 400 0 0 23 45 0 78 34919 Paddock 379 0 0 23 45 0 78 33720 Eucalypt planting 2.8 329 0 0 4 17 8 70 32921 Eucalypt planting 1.9 337 0 0 2 16 27 51 33522 Remnant 236 20 92 0 0 0 78 36023 Eucalypt planting 13 269 20 101 0 0 0 78 36324 Eucalypt planting 16.1 435 4 4 25 36 2 76 33825 Eucalypt planting 4 425 4 4 17 41 3 75 33726 Paddock 483 1 4 22 55 31 47 32327 Eucalypt planting 12.7 494 0 0 13 84 67 11 31328 State Forest 1236 78 933 0 0 0 78 41829 Eucalypt planting 3.4 513 0 0 5 12 39 39 36530 Eucalypt planting 2.5 486 0 0 5 12 39 39 36031 Paddock 483 0 0 4 12 39 39 36532 Remnant 354 5 5 0 0 66 12 38833 Eucalypt planting 9.7 374 13 37 13 25 0 78 39034 Eucalypt planting 5 367 0 0 7 25 0 78 39835 Eucalypt planting 1.5 374 0 0 10 23 0 78 37336 Paddock 372 0 0 7 25 0 78 38837 Remnant 377 23 37 9 35 0 78 39338 Eucalypt planting 27.7 1025 2 10 29 41 0 78 26839 State Forest 1897 33 2262 0 0 0 78 28640 State Forest 2062 78 1527 0 0 0 78 36541 State Forest 1533 78 1700 0 0 0 78 33842 Eucalypt planting 3.8 401 4 100 5 34 2 76 36143 Remnant 492 52 176 0 0 8 70 357
2.3 Research schedule Confirmation of participation in the study by all landowners was obtained in July 2006. Bird census counts were completed on all sites in each of five seasons: September 2006, January 2007, March-April 2007, August 2007 and November-December 2008. Bat activity surveys were completed on all sites in each of two seasons (September 2006 and February 2007), as well as harp-trapping on remnants and selected planted sites to develop a bat-call key for the region. Reptile and amphibian surveys were completed on all sites in each of two seasons (September 2006 and April 2007). Arboreal marsupials and nocturnal birds were surveyed twice on all sites in April- May 2009 and again in May 2009. The larger remnants and the larger planted sites were also surveyed at other times including September 2006, January 2007, March-April 2007 and August 2007.

16
Habitat supplementation works, including the erection of approximately 350 nest boxes and the placement of approximately 200 wooden cover board stations on the ground, were initiated in late 2007 and completed in late 2008 on 9 eucalypt plantation sites. A total of up to 50 nest boxes, including three different nest box designs and sizes, were placed randomly on a grid pattern approximately 25-50 m apart throughout each plantation. Cover board stations, each comprising approximately 10 overlapping paling fence posts (1.2 m long), were established on a 5 x 5 10 m grid within each plantation site scheduled for habitat supplementation. Nest boxes were inspected in December 2008 and in March 2009, and cover boards were inspected in March 2009 and September 2009. Remote cameras (one per site) were set for approximately 15 days near the midpoint of each site during April-May 2009. No chemical attractants were used. Focal animal tracking was completed for two adult male Koalas and 18 bats. Ten bats were radio-tracked during February 2008 and eight during September 2008. The two Koalas were radio-tracked from May 2008 until November 2008. The outbreak of Equine Influenza in NSW during 2007/2008 required the postponement of planned spring 2007 fauna surveys and delayed the completion of habitat supplementation works.

17
Table 2.2. List of habitat variables recorded on study sites in the Liverpool Plains region.
Target Variable Methodology
Topographic position Nine point scale; 1=Peak to 9=Flat Remnant tree height (m) Mean height of remnant trees > 5m above
ground Remnant tree cover (%) Visual estimate of projective cover of remnant
trees; 0 (none), <10 % (very sparse), 10-30 % (sparse), 30-50 % (moderate), 50-70 % (mid-dense), > 70 % (dense)
Plantation tree height (m) Mean height of plantations trees Plantation tree cover (%) Visual estimate of projective cover of plantation
trees; 0 (none), <10 % (very sparse), 10-30 % (sparse), 30-50 % (moderate), 50-70 % (mid-dense), > 70 % (dense)
Shrub height (m) Mean height of vegetation < 5m above ground (includes shrubs, understorey trees and young eucalypts)
Shrub cover (%) Visual estimate of projective cover of understorey vegetation; 0 (none), <10 % (very sparse), 10-30 % (sparse), 30-50 % (moderate), 50-70 % (mid-dense), > 70 % (dense)
Ground vegetation height (m) Mean height of ground cover Ground cover (%) Visual estimate of projective cover of ground
vegetation (includes herbaceous, small woody plants, grasses and crops); 0 (none), <10 % (very sparse), 10-30 % (sparse), 30-50 % (moderate), 50-70 % (mid-dense), > 70 % (dense)
Hollow index (0-3 ) Visual rating of hollow numbers within 200 m of site
Remnant tree index Visual rating of remnant tree numbers within 200 m of site
Dominant tree species Numerically dominant tree species on site Water Presence/absence of surface water (creek or
farm dam) within site

18
3. Diurnal birds 3.1 Introduction Birds are a large and conspicuous component of the fauna occurring in all Australian landscapes. We know that many species of birds have not fared well since European settlement, while others have flourished. Rural landscapes, where substantial clearing of forest and woodland has occurred, are the areas experiencing the greatest changes (Barrett et al. 2007). Of most concern are the species which have already declined significantly, the “woodland-dependent” birds, many of which have disappeared entirely from large areas within south-eastern Australia’s pastoral and cropping landscapes (Olsen et al. 2005, Olsen 2008). Several classifications of woodland-dependent bird species have been proposed for south-eastern Australia (Bennett and Ford 1997, Reid 2000, Kavanagh et al. 2007), all with a high level of agreement. However, not all woodland-dependent species are declining (Barrett et al. 2007). There is a wide range in the correlations between bird species occurrences and the amounts of retained native tree cover in the landscape, with some woodland-dependent species capable of existing in small, fragmented patches of forest and woodland (Levin et al. 2009). The latter group of species (e.g. Noisy Miner, Striated Pardalote) typically has little requirement for a well-developed shrub or mid-storey layer, or significant ground cover, instead finding suitable habitat among the tree canopy. Other woodland-dependent species (e.g. White-throated Treecreeper, Brown Treecreeper, Eastern Yellow Robin, Fuscous Honeyeater, White-throated Gerygone, Spotted Pardalote, Grey Fantail, Rufous Whistler, Varied Sitella, Crested Shrike-tit, and many others) require much less fragmented and more structurally-diverse stands of forest and woodland as habitat (Kavanagh et al. 2007, Levin et al. 2009). Habitat loss is regarded as the most important factor accounting for loss of species worldwide (Andrén 1994, Fahrig 2001, Foley et al. 2005, Bennett et al. 2006) and in the agricultural regions of Australia (Saunders 1989, Goldney and Bowie 1990, Ford et al. 2001, Radford et al. 2005). The re-establishment of native vegetation, either through natural regeneration (fencing to exclude stock) or by planting trees and shrubs, has been suggested as a potential solution to the widespread loss of habitat for many species in agricultural landscapes (Hobbs 1993, Saunders and Hobbs 1995, Vesk and MacNally 2006). While tree plantings provide a range of environmental, ecological, economic and social benefits, there is considerable uncertainty about whether revegetation can effectively restore habitat for declining and threatened species in rural landscapes (Vesk et al. 2008). Over the past decade in Australia there have been many studies, mostly focused on birds, that have sought to determine the responses of fauna to revegetation in agricultural landscapes (see review by Munro et al. 2007). The consensus to date is that revegetation is not a good replacement of remnant vegetation for many species. However, there is a valuable role for tree plantings in providing habitat for some species in places where currently there is none available, and potentially to augment the carrying capacity of

19
nearby remnant vegetation. Studies have shown that highly mobile species (e.g. birds, bats) are among those most likely to take advantage of the new habitat provided by eucalypt plantations, and that benefits are more likely to occur when plantings are established near remnant vegetation (Kavanagh et al. 2005). Much remains to be learned about the value of tree plantings in restoring habitat for wildlife in agricultural areas (Munro et al. 2007). Clearly, young eucalypt plantations lack many of the habitat attributes needed by animals; attributes which are more likely to be found in older, more structurally and floristically complex areas of remnant forest and woodland. Benchmarking the relative values to wildlife of tree plantings in different locations and landscape contexts, in different tree species mixtures, and in varying patch areas, age-classes and structural complexity, is important to better understand wildlife responses to revegetation and to support policies aimed at redressing land degradation in agricultural areas. In this Chapter, we report on bird species richness and abundance, and changes in bird species composition, occurring in young (4-6 year old) eucalypt plantations that have been established primarily for commercial wood production. We compare the avifauna occurring in these plantations to that occurring in remnant forest and woodland in the region and to that occurring on cleared paddocks used for grazing or cropping and which were representative of the sites planted to eucalypts. We predicted that birds would quickly occupy these young plantations, thus leading to an overall improvement in bird conservation in the region. However, we expected that more bird species, particularly those classified as woodland-dependent, would be recorded within remnants and in those eucalypt plantations that were larger in area than others and located in landscapes where there were more residual old trees. 3.2 Methods Sampling Systematic (fixed time, fixed area) counts were made for birds at two sampling points in each study site (n=43 sites). Sampling points were 100 m apart. A point-based, 10-minute count at each of the two 0.785 ha (50 m radius) circular plots was employed as the basic sampling unit for diurnal birds in this study. Two counts were made at each point, on different days and by two different observers. Bird census counts were completed on all sites in each of five seasons (September 2006, January 2007, March-April 2007, August 2007 and November-December 2008). The method required a single observer to stand quietly and record the total number of individuals of each species heard and seen that occupied the surrounding area during the sample period. The data were recorded in four distance categories around each point: 0-10 m, 10-20 m, 20-30 m and 30-50 m. Each bird recorded was placed in the distance category closest to the observer that it reached during the sampling period. Birds flying through the area were not recorded on the plots unless they were regarded as making some use of that vegetation type, for example, foraging in the airspace above.

20
Data were also collected in April 2001 from 12 paddock sites, including five (sites 12, 18, 24, 30 and 33) that were subsequently planted to eucalypts in 2002 as part of this study. The same sampling methods were used but only one visit was made to each site. Analysis Differences between vegetation type (eucalypt plantations, larger more intact remnants, smaller more degraded remnants, and cleared paddocks) were assessed using Generalised Linear Mixed Effects models, implemented in R version 2.8.0 (R Development Core Team 2008) using the lme4 package, to account for the repeated sampling undertaken at each site during the study. Each site was visited during five seasons between 2006-2008. Sites were treated as random effects while vegetation type and sampling period were treated as fixed effects in the models. A poisson link-function was used. Dependent variables included the total numbers of species and of individuals recorded at each site during each of the four 10 min. counts undertaken within 50 m radius of the two sampling plots. Analyses were also made on the components of these two variables that were classified as either “woodland-dependent” (72 species) or “non-woodland-dependent” (62 species) birds. The similarities in bird species assemblage composition between the sites, and according to land use (i.e. vegetation type), were calculated using the Bray-Curtis metric on untransformed data representing the average abundances for each species at each site across all five sampling periods. The results were ordinated using non-metric multi-dimensional scaling (MDS). Bird community data were compared using analysis of similarities (ANOSIM). A similarity percentages (SIMPER) test was used to determine which bird species contributed the most to differences in the bird species community composition for each vegetation type. These methods are described by Clarke (1993) and all analyses of bird community data were implemented in Primer version 6.1.6 (Clarke and Gorley 2006). The relations between bird species and four major landscape variables were investigated using Canonical Correspondence Analysis. This method is fully described in Jongman et al. (1995) and was implemented using CANOCO version 3.15 (ter Braak 1997). The landscape variables used in the analysis were: the area (in ha) of remnant forest and woodland occurring within a 500 m radius of each sampling site, the area of remnant forest and woodland occurring within a 5 km radius, the area of eucalypt plantation occurring within a 500 m radius, and the area of basalt soils (an indicator of fertility) occurring in a 500 m radius. Correlations between landscape variables were investigated using Spearman Rank Correlation Test (implemented in R). 3.3 Results A total of 134 bird species was recorded during this study (Table 3.1). Seventy-two species were classified as woodland-dependent and sixty-two species as non-woodland-dependent (Table 3.1). One additional species, the Crimson Rosella Platycercus elegans, was recorded in 2001 prior to the main study.

21
Pre-plantation establishment Before plantation establishment, surveys were undertaken in 2001 on 12 paddock sites, five of which were subsequently planted in 2002. No birds were recorded within 50 m radius on these plots during sampling. Post-plantation establishment The main study was conducted during 2006-2008 when the eucalypt plantations were 4-6 years of age. The following results refer to that period. Species richness One hundred and eleven bird species were recorded during formal census counts within 50 m radius of sampling points at the 43 sites. Of these, 18 species were recorded at more than 50% of the sites, 7 of which were classified as woodland-dependent (Striated Pardalote, Weebill, Yellow Thornbill, Noisy Miner, Rufous Whistler, Grey Butcherbird and Mistletoebird) and 11 as non-woodland-dependent (Crested Pigeon, Galah, Eastern Rosella, Red-rumped Parrot, Superb Fairy-wren, Yellow-rumped Thornbill, Willie Wagtail, Black-faced Cuckoo-shrike, Pied Butcherbird, Australian Magpie and Common Starling) (Table 3.1). The greatest number of species per unit area was recorded in the larger forest remnants in the region, that is, in the five State Forests sampled (Fig. 3.1). Fewer species were recorded in some sample periods in the smaller, more degraded, remnants but these differences were not significant statistically (P=0.51) across the duration of the study. Compared to the larger forest remnants, fewer bird species were recorded in young (4-6 year old) eucalypt plantations (P<0.01), and these differences were even greater for bird species recorded in paddocks used for cropping and grazing (P<0.01). Compared to paddocks, all other vegetation types (i.e. large forest remnants, smaller remnants and young eucalypt plantations) had significantly more bird species recorded per time unit-area of sampling (P<0.01). While clearly not in the same class as remnant forest and woodland, many bird species appeared capable of utilising young eucalypt plantations within four years of plantation establishment on ex-pastoral and cropping sites (Fig. 3.1). Season of sampling had an influence on bird counts. Fewer bird species (P<0.01) were recorded on average across all plots in late summer (January 2007) and autumn (March-April 2007) than at other times of the year (i.e. late winter – August 2007, spring – September 2006, and early summer – November and December 2008).

22
Table 3.1. Classification of the 134 bird species recorded in this study as either woodland-dependent (n=72) or non-woodland-dependent (n=62). The number of sites and the number of individuals recorded for each species within 50 m radius during formal census counts is indicated. Species recorded as “0” were present but not recorded during census counts. The four-letter code for each species is provided.
__________________________________________________________________________________
Common Name Scientific Name Code No. Sites No. Inds (<50m) __________________________________________________________________________________
Woodland-dependent species Brown Goshawk Accipiter fasciatus BRGH 3 4 Collared Sparrowhawk Accipiter cirrhocephalus COSH 0 0 Painted Button-quail Turnix varia PABQ 1 2 Common Bronzewing Phaps chalcoptera COBW 11 18 Peaceful Dove Geopelia striata PEDO 5 12 Musk Lorikeet Glossopsitta concinna MULO 10 98 Little Lorikeet Glossopsitta pusilla LILO 8 32 Australian King Parrot Alisterus scapularis AUKP 6 27 Red-winged Parrot Aprosmictus erythropterus REWP 2 6 Turquoise Parrot Neophema pulchella TUPA 2 2 Fan-tailed Cuckoo Cacomantis flabelliformis FATC 5 6 Horsfield's Bronze-Cuckoo Chrysococcyx basalis HOBC 8 15 Shining Bronze-Cuckoo Chrysococcyx lucidus SHBC 5 7 Channel-billed Cuckoo Scythrops novaehollandiae CHBC 0 0 Southern Boobook Ninox novaeseelandiae SOBO 2 2 Australian Owlet-nightjar Aegotheles cristatus AONJ 1 1 Laughing Kookaburra Dacelo novaeguineae LAKO 11 26 Sacred Kingfisher Todiramphus sanctus SAKF 3 6 Dollarbird Eurystomus orientalis DOBI 4 10 White-throated Treecreeper Cormobates leucophaeus WTTC 7 59 Brown Treecreeper Climacteris picumnus BRTC 3 15 Spotted Pardalote Pardalotus punctatus SPPA 19 92 Striated Pardalote Pardalotus striatus STPA 37 792 Speckled Warbler Chthonicola sagittata SPWA 8 28 Weebill Smicrornis brevirostris WEBI 33 1799 Western Gerygone Gerygone fusca WEGE 22 188 White-throated Gerygone Gerygone olivacea WHTG 19 97 Inland Thornbill Acanthiza apicalis INTB 8 40 Chestnut-rumped Thornbill Acanthiza uropygialis CRTB 1 4 Buff-rumped Thornbill Acanthiza reguloides BUTB 2 9 Yellow Thornbill Acanthiza nana YETB 25 447 Striated Thornbill Acanthiza lineata STTB 3 16 Red Wattlebird Anthochaera carunculata REWB 4 9 Spiny-cheeked Honeyeater Acanthagenys rufogularis SPHE 15 55 Striped Honeyeater Plectorhyncha lanceolata STHE 10 46 Noisy Friarbird Philemon corniculatus NOFB 17 118 Little Friarbird Philemon citreogularis LIFB 3 14 Blue-faced Honeyeater Entomyzon cyanotis BFHE 2 6 Noisy Miner Manorina melanocephala NOMI 33 842 Yellow-faced Honeyeater Lichenostomus chrysops YFHE 8 49 White-eared Honeyeater Lichenostomus leucotis WEHE 1 2 Yellow-tufted Honeyeater Lichenostomus melanops YTHE 0 0 Fuscous Honeyeater Lichenostomus fuscus FUHE 3 6 White-plumed Honeyeater Lichenostomus penicillatus WPHE 22 181 Brown-headed Honeyeater Melithreptus brevirostris BHHE 3 20

23
Eastern Spinebill Acanthorhynchus tenuirostris EASB 1 1 Jacky Winter Microeca fascinans JAWI 6 47 Red-capped Robin Petroica goodenovii RECR 8 34 Hooded Robin Melanodryas cucullata HORO 1 2 Eastern Yellow Robin Eopsaltria australis EAYR 8 92 Grey-crowned Babbler Pomatostomus temporalis GCBA 3 32 White-browed Babbler Pomatostomus superciliosus WHBB 0 0 Spotted Quail-thrush Cinclosoma punctatum SPQT 0 0 Varied Sittella Daphoenositta chrysoptera VASI 3 6 Crested Shrike-tit Falcunculus frontatus CRST 1 1 Golden Whistler Pachycephala pectoralis GOWH 4 10 Rufous Whistler Pachycephala rufiventris RUWH 27 272 Grey Shrike-thrush Colluricincla harmonica GRST 9 25 Leaden Flycatcher Myiagra rubecula LEFC 3 13 Grey Fantail Rhipidura fuliginosa GRFT 20 134 White-bellied Cuckoo-shrike Coracina papuensis WBCS 5 10 White-winged Triller Lalage sueurii WHWT 3 8 Olive-backed Oriole Oriolus sagittatus OLBO 6 6 Dusky Woodswallow Artamus cyanopterus DUWS 2 6 Grey Butcherbird Cracticus torquatus GRBB 27 190 White-winged Chough Corcorax melanorhamphos WHWC 13 168 Apostlebird Struthidea cinerea APBI 2 24 Satin Bowerbird Ptilonorhynchus violaceus SABB 0 0 Diamond Firetail Stagonopleura guttata DIFT 3 4 Mistletoebird Dicaeum hirundinaceum MIBI 23 119 Tree Martin Hirundo nigricans TRMA 7 27 Silvereye Zosterops lateralis SIEY 6 39
Non-woodland-dependent species
Stubble Quail Coturnix pectoralis STQU 7 13 Brown Quail Coturnix ypsilophora BRQU 2 3 Australian Wood Duck Chenonetta jubata AUWD 1 2 Pacific Black Duck Anas superciliosa PABD 0 0 White-faced Heron Egretta novaehollandiae WHFH 0 0 White-necked Heron Ardea pacifica WHNH 0 0 Straw-necked Ibis Threskiornis spinicollis STNI 0 0 Black-shouldered Kite Elanus axillaris BLSK 1 2 Black Kite Milvus migrans BLKI 0 0 Whistling Kite Haliastur sphenurus WHKI 0 0 Spotted Harrier Circus assimilis SPHA 1 1 Wedge-tailed Eagle Aquila audax WETE 1 1 Little Eagle Hieraaetus morphnoides LIEA 0 0 Brown Falcon Falco berigora BRFA 3 6 Australian Hobby Falco longipennis AUHO 3 3 Black Falcon Falco subniger BLFA 0 0 Peregrine Falcon Falco peregrinus PEFA 0 0 Nankeen Kestrel Falco cenchroides NAKE 6 15 Little Button-quail Turnix velox LIBQ 1 1 Red-chested Button-quail Turnix pyrrhothorax RCBQ 3 3 Masked Lapwing Vanellus miles MALW 0 0 Crested Pigeon Ocyphaps lophotes CRPI 28 126 Bar-shouldered Dove Geopelia humeralis BASD 5 11 Galah Cacatua roseicapilla GALA 33 330 Little Corella Cacatua sanguinea LICO 1 2 Sulphur-crested Cockatoo Cacatua galerita SUCC 9 112 Cockatiel Nymphicus hollandicus COCK 7 17 Eastern Rosella Platycercus eximius EARO 36 610 Australian Ringneck Barnardius zonarius AURN 1 1 Red-rumped Parrot Psephotus haematonotus RERP 24 156 Pallid Cuckoo Cuculus pallidus PACU 0 0

24
Tawny Frogmouth Podargus strigoides TAFM 1 1 Rainbow Bee-eater Merops ornatus RABE 0 0 Superb Fairy-wren Malurus cyaneus SUFW 25 330 Variegated Fairy-wren Malurus lamberti VAFW 1 5 Chestnut-rumped Heathwren Hylacola pyrrhopygia CRHW 2 4 Yellow-rumped Thornbill Acanthiza chrysorrhoa YRTB 30 484 Singing Honeyeater Lichenostomus virescens SIHE 4 19 Brown Honeyeater Lichmera indistincta BRHE 1 4 Scarlet Honeyeater Myzomela sanguinolenta SCHE 1 1 Crested Bellbird Oreoica gutturalis CRBB 0 0 Restless Flycatcher Myiagra inquieta REFC 2 2 Magpie-lark Grallina cyanoleuca MALA 20 59 Willie Wagtail Rhipidura leucophrys WIWT 29 185 Black-faced Cuckoo-shrike Coracina novaehollandiae BFCS 30 74 Pied Butcherbird Cracticus nigrogularis PIBB 33 110 Australian Magpie Gymnorhina tibicen AUMA 36 238 Pied Currawong Strepera graculina PICU 13 42 Australian Raven Corvus coronoides AURA 18 53 Singing Bushlark Mirafra javanica SIBL 5 13 Richard's Pipit Anthus novaeseelandiae RIPI 1 4 House Sparrow Passer domesticus HOSP 0 0 Zebra Finch Taeniopygia guttata ZEFI 2 5 Double-barred Finch Taeniopygia bichenovii DOBF 10 62 (Eurasian) Goldfinch Carduelis carduelis GOFI 0 0 Welcome Swallow Hirundo neoxena WESW 4 7 Fairy Martin Hirundo ariel FAMA 1 9 Rufous Songlark Cincloramphus mathewsi RUSL 6 7 Brown Songlark Cincloramphus cruralis BRSL 1 16 Golden-headed Cisticola Cisticola exilis GOHC 0 0 Common Starling Sturnus vulgaris COST 23 263 Common Myna Acridotheres tristis COMY 0 0 __________________________________________________________________________________

25
0
2
4
6
8
10
12
14
16
18
20
22
24
26
Sep-06 Dec-06 Mar-07 Jun-07 Sep-07 Dec-07 Mar-08 Jun-08 Sep-08 Dec-08
Mea
n nu
mbe
r of s
peci
es /
site
PaddockPlantingRemnantState Forest
Fig. 3.1. Mean (±SE) number of bird species recorded per site
0
2
4
6
8
10
12
14
16
18
20
22
24
26
28
30
Sep-06 Dec-06 Mar-07 Jun-07 Sep-07 Dec-07 Mar-08 Jun-08 Sep-08 Dec-08
Mea
n nu
mbe
r of i
ndiv
idua
ls /
10 m
in. c
ount
PaddockPlantingRemnantState Forest
Fig. 3.2. Mean (±SE) number of individuals recorded per 10 minute count

26
Bird abundance Nine thousand eight hundred and ninety birds were recorded during census counts. Of these, 12 species of woodland-dependent birds were recorded on more than 1% of total counts (i.e. all of those species indicated above as occurring on more than 50% sites, plus Western Gerygone, Noisy Friarbird, White-plumed Honeyeater, Grey Fantail and White-winged Chough) and 11 species of non-woodland-dependent birds (i.e. all of those species indicated above as occurring on more than 50% sites, with the deletion of Black-faced Cuckoo-shrike and the addition of Sulphur-crested Cockatoo). Results for individual birds were similar to those for bird species richness (Fig. 3.2). The greatest number of individuals per unit area was recorded in the larger forest remnants in the region. Again, compared to the larger forest remnants, fewer birds were recorded in young (4-6 year old) eucalypt plantations (P<0.01) and in paddocks (P<0.01), but the smaller, more degraded, remnants were not significantly different (P=0.71). Again, compared to paddocks used for cropping and grazing, significantly more birds per time-area sampled were recorded in all other vegetation types (i.e. large forest remnants, smaller remnants and young eucalypt plantations) (all P<0.01). Again, fewer birds (P<0.01) were recorded on average across all plots in late summer (January 2007), but census counts undertaken in late winter (August 2007) recorded more birds than expected (P<0.01) while those undertaken in early summer (November and December 2008) recorded fewer than expected (P<0.05) compared to spring (September 2006) counts. Bird assemblages The composition of bird communities differed between sites in accordance with vegetation type / land use (ANOSIM Global R=0.43, P<0.01). Surprisingly, many of the young eucalypt plantation sites were clustered nearer to the remnant sites than to the paddock sites, indicating that significant changes in bird community composition had already occurred (Figs. 3.3 and 3.4). The eucalypt plantation sites not forming part of this cluster, and more closely associated with paddocks (e.g. sites 4, 5, 8, 14), were those most distant from native forest and woodland remnants (Table 2.1). The largest eucalypt plantation sampled (site 12, ~ 40 ha) was the plantation site most closely embedded within the cluster of remnant sites. ANOSIM pairwise tests showed that bird assemblages were most similar between larger and smaller remnants (R statistic 0.008, P=0.398) and most different between larger remnants (State Forests) and paddocks (R statistic 0.9, P<0.01). Bird assemblages were also similar (albeit less so) between eucalypt plantations and State Forests (R statistic 0.176, P=0.136) and between eucalypt plantations and smaller remnants (R statistic 0.223, P=0.073). The bird assemblages of paddocks were different from those of eucalypt plantations (R statistic 0.866, P<0.01) and smaller remnants (R statistic 0.755, P<0.01).

27
Resemblance: S17 Bray Curtis similarity
Land usePaddockPlantingRemnantState Forest1
23
4
5
6
7
8
9
10
11
1213
14
1516
17
18
19
20
21
22
23
24
25
26
27
28
29
30
31
32
33
34
35
36 37
38
39
40
41
42
43
2D Stress: 0.13
Fig. 3.3. Similarity between sites based on their bird species assemblages as totalled over five sampling periods (NMDS plot).
Group average
28 40 22 23 16 37 32 15 39 41 3 43 25 38 10 18 24 33 20 30 11 34 12 9 7 35 13 21 29 17 1 2 14 27 42 8 5 4 26 36 31 6 19
Samples
100
80
60
40
20
0
Sim
ilarit
y
Resemblance: S17 Bray Curtis similarity
Land usePaddockPlantingRemnantState Forest
Fig. 3.4. Similarity between sites based on their bird species assemblages as totalled over five sampling periods (Group Average Dendrogram).

28
SIMPER tests defined the similarities in bird assemblages between sites within the groups as 16.22, 35.96, 38.28 and 48.19 for paddocks, remnants, eucalypt plantings and State Forests, respectively. The greatest dissimilarity between groups was for paddocks and State Forests (97.41), while the least dissimilarity was between smaller remnants and State Forests (60.61). Smaller remnants and paddocks were also quite different in their bird species assemblages (94.23), as were eucalypt planting and paddocks (92.69). More similar were eucalypt plantings and State Forests (66.50) and eucalypt plantings and smaller remnants (68.48). SIMPER analysis was also used to determine the bird species contributing most to differences in bird species assemblages between each vegetation type. The four species having the greatest influence (i.e. contribution to dissimilarity) between vegetation types were the Weebill, Noisy Miner, Yellow Thornbill and Striated Pardalote (Table 3.2).

29
Table 3.2. The main species contributing to overall dissimilarity between bird species assemblages in eucalypt plantations, large remnants, smaller remnants and paddocks, based on SIMPER analysis. Symbol (-) indicates species that were not principal contributors to differences in pairwise comparisons between vegetation types.
__________________________________________________________________________________
Species Average abundance
Plantings Large remnants Smaller remnants Paddocks
__________________________________________________________________________________
Weebill 9.49 13.08 7.66 - Striated Pardalote 3.51 5.72 6.88 - Eastern Rosella 2.99 3.44 4.59 - Noisy Miner 3.24 5.92 9.50 - Yellow-rumped Thornbill 3.10 - 1.92 - Superb Fairy-wren 1.78 - 2.70 - Australian Magpie 0.77 - 3.01 1.40 Pied Butcherbird 0.67 - 0.56 - Common Starling 1.76 - 0.83 - Galah 1.09 2.52 3.36 1.00 Willie Wagtail 0.92 - 1.42 - Western Gerygone 1.11 0.92 - - Red-rumped Parrot 0.96 - - - Yellow Thornbill 1.14 8.92 3.38 - Rufous Whistler - 2.92 3.24 - Grey Butcherbird - 2.68 2.20 - Grey Fantail - 2.36 - - Spotted Pardalote - 2.08 - - Noisy Friarbird - 1.28 - - Striped Honeyeater - 1.52 - - Crested Pigeon - 1.44 1.29 - White-winged Chough - 1.48 - - Eastern Yellow Robin - 1.60 - - White-plumed Honeyeater - 1.04 2.83 - Spiny-cheeked Honeyeater - 0.88 - - White-throated Treecreeper - 2.04 - - Mistletoebird - 1.00 1.04 - Inland Thornbill - 1.32 - - Silvereye - 1.44 - - Australian Raven - 0.56 - - Sulphur-crested Cockatoo - - 3.43 - Singing Bushlark - - - 0.40 Cumulative percentage 91.11 90.91 90.90 92.53 ___________________________________________________________________________________

30
Species relations with landscape variables The landscape variable most influential in explaining the distribution of bird species was the area of remnant forest and woodland present within 500 m radius of the sampling sites (Fig. 3.5). Other important variables were the area of high fertility (basalt) soils within 500 m radius, the area of eucalypt plantation within 500 m radius, and the area of remnant forest and woodland within 5 km radius of the sampling sites. Approximately one-third of sites across each vegetation type or land use category, except for State Forests, were found on or near basalt soils (Table 2.1). The remainder were located predominantly on sedimentary soils. The sites where eucalypt plantations were established were negatively correlated with the area of remnant forest within 500 m in the landscape (Spearman rank correlation co-efficient r = -0.31, P<0.05) (Fig. 3.5). The median area (ha) of remnant forest within 500 m of sampling sites was 0 (range 0-20.1) for eucalypt plantations, 0 (range 0-0.9) for paddocks, 21.9 (range 4.8-51.7) for smaller remnants, and 78.1 (range 33.1-78.1) for larger remnants (State Forests) (Table 2.1). These data illustrate the paucity of remnant forest and woodland in the region. Woodland-dependent birds were the species most closely associated with remnant forest and woodland (Fig. 3.5). Species displaying the strongest affinity with sites in close proximity to remnant forest and woodland were: White-throated Treecreeper, Grey Shrike-thrush, Inland Thornbill, Speckled Warbler, Striped Honeyeater, Eastern Yellow Robin, Spotted Pardalote, Yellow Thornbill, Musk Lorikeet, Grey Fantail, Jacky Winter, Rufous Whistler, Laughing Kookaburra, White-plumed Honeyeater, Grey Butcherbird, Mistletoebird, Pied Currawong and Common Bronzewing. Other woodland-dependent birds that were more likely to be recorded in young eucalypt plantations were: Noisy Friarbird, Western Gerygone, Red-capped Robin, Weebill, Spiny-cheeked Honeyeater and White-winged Chough. Non-woodland-dependent birds associated with eucalypt plantations were: Red-rumped Parrot, Yellow-rumped Thornbill, Magpie Lark and Black-faced Cuckoo-shrike (Fig. 3.5). Species associated with higher fertility sites included: Common Starling, Australian Magpie, Eastern Rosella, Pied Butcherbird, Superb Fairy Wren, Galah and Crested Pigeon. Several woodland-dependent birds also showed an affinity for high fertility sites: Noisy Miner, Striated Pardalote, White-plumed Honeyeater and Laughing Kookaburra.

31
-1 0 1 2
-1
0
1
COBW
GRSTLAKO
SPWA
RECR
INTB
STHE
JAWI
PICUAURA
SPHE
MALA
WTTC
DOBFBFCS
SPPA
EAYRMULO
PIBB
SUCC
NOFB
MIBICRPI
GRFT
RERP
WHWC
WPHE
WIWT
GRBB
AUMA
COST
RUWH
WEGE
GALA
SUFW
YETB
YRTB
EAROSTPA
NOMI
WEBI
Remnant 5km
Remnant 500m
Plantation 500m
Basalt 500m
Fig. 3.5. Relations between the 41 most common or widely-distributed bird species and 4 habitat or landscape variables assessed at each of the 43 sites. Species classified as woodland-dependent indicated in bold type. See Table 3.1 for species name codes and Table 2.1 for landscape variables.

32
3.4 Discussion Young (4-6 year old) eucalypt plantations had a surprisingly similar avifauna to that recorded in remnant forest and woodland in the Liverpool Plains region. This favourable comparison may have been due, in part, to the small size and isolation of forest remnants in the region, to their frequent occurrences on low fertility soils, and to their long history of grazing and logging disturbance. These factors would have resulted in the occurrence of a more simplified avifauna within remnants. However, the avifauna of young eucalypt plantations is necessarily dependent on the species composition of nearby remnant forest and woodland. Significantly, many bird species appeared capable of utilising young eucalypt plantations within four years of plantation establishment on ex-pastoral and cropping sites. Open paddocks on agricultural sites were again shown to provide very poor habitat for most birds (e.g. Kavanagh et al. 2007) and, accordingly, bird communities in agricultural areas were highly simplified and depauperate. While clearly not in the same class as remnant forest and woodland, the key point is that eucalypt plantations have enormous potential and capacity to quickly restore or supplement habitat for many bird species in agricultural landscapes. This study sought to validate inferences from other studies, in particular the studies by Kavanagh et al. 2005, Law and Chidel 2006, Kavanagh et al. 2007 in the Albury-Wodonga region, about the importance to fauna of plantation size (area), tree age-class, and the proximity of eucalypt plantations to remnant vegetation. Additionally, this study sought to confirm the importance of remnant forest and woodlands in maintaining vertebrate species richness in agricultural landscapes and the significant contribution made by eucalypt plantations established in these landscapes. Firstly, it is clear that forestry-type plantations (i.e. those with typically fewer, and often non-local tree species, and with fewer or no shrubs) also make a significant contribution to bird species conservation, as observed previously for “environmental-type” eucalypt plantings established primarily for habitat restoration and improved landscape amenity (Kavanagh et al. 2007). For example, the mean number of woodland-dependent bird species recorded per 10 minute count in forestry plantings on the Liverpool Plains was 41.2% of that recorded in forest remnants. This compares with 82.1% for environmental plantings near Albury (Kavanagh et al. 2007). In part, these differences reflect the larger amounts of native vegetation cover retained in the Albury area (approx. 12.7% within 5 km radius around each of 120 sites) compared to the more intensively-farmed landscape on the Liverpool Plains (approx. 8.7% native vegetation remaining within a 5 km radius around each of 43 sites). Woodland-dependent bird species were much less likely to be recorded in paddocks on the Liverpool Plains (0.2% of the mean counts recorded in remnants) than those in the Albury region (17.4% of the mean counts in remnants; mainly associated with clumps of paddock trees). These comparisons illustrate the importance of the amount of native vegetation that is retained in the landscape. They also illustrate the significant contributions that eucalypt trees planted on ex-farming sites can

33
make for regional bird species conservation. Eucalypt plantings established for forestry purposes appear to make a significant, though lesser, contribution to regional bird species conservation compared to that found previously for environmental plantings on similar sites in the Albury region. The differences in performance, relative to remnants, between these forestry plantings and the Albury plantings may also have been due, in part, to the older age-classes of trees planted near Albury (7-25 years). The importance to fauna of plantation tree age-class could not be addressed rigorously in this study. All planted sites were the same age (4-6 years at the time of sampling), except for two sites that were slightly older (approximately 10 years old; sites 23 and 25). However, these two sites had bird species assemblages that were more similar to remnant forest and woodland than most other plantation sites (Fig. 3.3). These results support those of Kavanagh et al. (2007) who found that older (10-25 years) planted sites generally had a richer avifauna than younger sites (7-10 years). The forestry plantings, while generally more vigorous, were also more simple structurally and floristically (i.e. comprising fewer tree species and no shrubs) compared to those studied near Albury. These characteristics should also have accounted for some of the observed differences between localities but the forestry plantations (usually 2-3 tree species) performed better than expected. The importance to birds of plantation area was not directly assessed in this study. Most planted sites covered an area of about 10 ha (mean 10.2 ha, median 8.9 ha), with some as small as 2 ha and others as large as 40 ha. Proximity to remnant vegetation appeared to have a stronger influence in shaping bird species assemblages. This study has shown that eucalypt plantings have the capacity to provide the resources needed by many bird species for breeding and year-round occupancy. This is evident from the generally stable numbers of bird species recorded in eucalypt plantations during all four seasons of the year. Eucalypt plantings clearly lack certain resources and habitat components that are important for birds. These include old trees (including those with hollows for nesting and shelter), logs on the ground and standing dead timber, and usually shrubs. An experiment to supplement the habitat for birds and other fauna in eucalypt plantations using surrogates (e.g. nest boxes, cover boards) is described in Chapter 8 of this report. This study confirmed the importance to recovery of woodland-dependent bird species of establishing eucalypt plantations in those parts of agricultural landscapes that are near (< 500 m) remnant forest and woodland, or at least near clumps of remnant trees. Isolated plantings experienced much slower rates of occupancy by woodland-dependent birds.

34
4. Bats 4.1 Introduction Bats (Microchiroptera) are a hidden, but major part of the fauna in rural landscapes. Bats have been relatively well studied in south-eastern Australia where many species commute from tree-roosts across cleared land to forage in small remnants, even isolated paddock trees on farms (Law et al. 1999, Law et al. 2000, Lumsden et al. 2002a; Lumsden and Bennett 2005; Law and Chidel 2006). It is less well known how effective tree-plantings, either environmentally or commercially focused, are for restoring habitat for bats in heavily cleared landscapes. Because flight aids movement across the landscape (Lumsden et al. 2002a) it potentially facilitates the encounter and use of farm plantings by bats. One study of 120 sites in the Albury-Wodonga region found that bats were broadly distributed and foraged across the entire landscape, with all bat species using the various kinds of plantings assessed (Law and Chidel 2006). Plantings were used frequently by bats, but their use was not significantly greater than the use of paddocks and was under a third of that in remnant vegetation. Patch size had little influence on bat activity (see also Law et al. 1999), although old, large plantings (10-25 years, 20-100 ha) benefited bats most, supporting twice the activity found in paddocks. It was suggested that this may have resulted from the more open and patchy tree stand structure of these plantings induced by drought and grazing associated mortality. Just one taxon, Nyctophilus spp., was found to be associated with the high stem densities of younger plantings. The importance of landscape context to the use of young plantings by bats was also investigated as part of a broader study in the Albury-Wondonga area (Kavanagh et al. 2005). Bat activity in young plantings was not strongly influenced by landscape context when activity was compared between a variegated (9 % native remnants remaining) and a cleared landscape (5 % native remnants remaining). Although large remnants of woodland were absent from the cleared landscape, scattered trees were moderately common (7.5 % of the landscape, not including isolated trees in paddocks) and it is likely that these are vital for facilitating the use of otherwise cleared landscapes (Law et al. 2000; Lumsden and Bennett 2005). We predict from these results that the number of scattered remnant trees will be strongly related to bat activity levels in other landscapes. It is not yet known how bats are influenced by land-use differences within the matrix, for example cropping compared to grazing. In this chapter we investigate the use of plantings by bats in comparison to other vegetation classes on the Liverpool Plains using two techniques. First, we used ultrasonic detectors to record activity levels of microchiropteran bats across each of the vegetation classes. The activity levels recorded provide a useful index for comparing habitat use, especially when calls are identified to species level. However, ultrasonic detectors do not collect data on habitat use by individuals and how an individual might apportion different behaviours (roosting and foraging) into different habitats.

35
Thus our second aim was to radio-track individual bats to identify roosts and foraging areas at one of the most extensive plantation areas on the Liverpool Plains, interspersed with a patchwork of remnant vegetation and extensively cleared plains used for cropping. We investigated whether bats roost diurnally beneath the exfoliating bark of plantation trees, because there is growing recognition that some bat species, especially the genus Nyctophilus, roost beneath the peeling bark of trees at certain times of the year (Tidemann and Flavel 1987; Lumsden et al. 2002a; Turbill 2006; Turbill and Geiser 2008). Secondly, we recorded the extent to which plantations met the needs of nocturnal activity for individual bats. A suite of species were tracked because foraging and roosting preferences are likely to vary between species. 4.2 Methods Harp-trapping Opportunistic harp-trapping was undertaken in 2006 and 2007 as part of the Anabat study and during 2008 while radio-tracking (see below). Traps were set within the plantations, along tracks in remnants and in State Forests. Trapping data was primarily used to establish a reference call library for the study area by recording identified bats upon release with an Anabat detector, but also to confirm species presence for those difficult to identify by call. Ultrasonic Activity Pre-plantation establishment Prior to plantation establishment bat activity was sampled in 12 paddocks on 23-24 April 2001 using Anabat detectors (Titley Electronics, Ballina, Australia) angled at 45o from the ground. Each paddock was sampled at a single site for one night. Detectors were connected to delay switches (Titley Electronics) that operate by switching on a cassette recorder at the sound of a high frequency bat call and downloading the call with the time and a calibration tone onto one side of a 120 min cassette. Depending on activity levels, this method usually allows sampling entire nights. Bat passes were displayed on Anabat 6 software and identified manually. Identifications were made on passes comprising > 2 pulses after comparison with reference calls collected from nearby areas. Calls of poor quality or short duration were assigned to species groups or assigned to unidentified bat passes and incorporated into a measure of total bat activity. More details are provided below. Post-plantation establishment We sampled bat activity after plantation establishment in spring 2006 (September) and summer 2007 (February) using Anabat detectors. Each site was sampled remotely at a single location for two consecutive nights. To minimise the effects of nightly variation in activity, sampling was only undertaken in warm conditions, avoiding rain, very windy conditions and the full moon. Up to 12 detectors were used per night to sample simultaneously a mixed set of vegetation classes each night. Detectors were positioned within the interior of a patch, well away from edges, except for linear strips, which were all edges. The microphone was protected from rainfall inside an s-shaped PVC pipe, which was set one metre above ground and angled up at 45o from horizontal. The microphone faced into

36
vegetation openings or gaps to minimise the influence of call attenuation from vegetation (Parsons, 1996; Patriquin et al., 2003), but always avoided tracks that may serve as bat flyways (Law and Chidel, 2002). Detectors sampled entire nights by recording files to a lap-top computer via a zero-crossing interface (Anabat ZCAIM, Titley Electronics) or to a memory card using CF-ZCAIM, with each pass being converted to a single file. A pass follows the definition of Law et al. (1998), consisting of a minimum of three pulses, with pulses not separated from another pulse by more than five seconds. Bat activity in a site was expressed for each species as the number of passes per night averaged across nights. Since there was no difference in median activity across years, we also averaged these data. Automated Identification of Calls to Species
All files collected after plantation establishment were processed by Anascheme software (Matt Gibson, Ballarat University, unpubl.), which has been designed to automate the process of call identification. Anascheme reads Anabat files and models individual pulses using regression analysis (Gibson and Lumsden 2003). The regression model allows the extraction of a range of parameters that can be used to develop an identification key. An identification key was constructed for the suite of species known to occur in the Liverpool Plains study area by extracting pulse parameters from a library of hand-released reference calls (795 call sequences) collected from bats trapped as part of this study, nearby areas and from a web-based library of calls (Pennay et al. 2004). Calls were collected from bats trapped in woodland and plantations from the Liverpool Plains, Pilliga and Forbes areas to avoid the effect of geographic variation on call parameters (Law et al. 2002). Some calls were supplemented from other areas where their calls were not thought to vary across regions (e.g. Mormopterus beccarrii – Reinhold et al. 2001). The key was trained using 70 % of the library calls, while the remaining 30 % were used to test the key’s reliability and for making refinements (< 5 % errors - B. Law and M. Chidel unpubl. data). Classification Trees (Statistica - Version 6), which take a hierarchical approach to separating groups (Herr et al. 1997; Gannon et al. 2004), were used to build the key by identifying pulse parameters that could distinguish different species. To develop our key we followed an iterative procedure that involved analysing narrow call frequency ranges that comprised only two or three overlapping species. The resulting key used the characteristic frequencies and shapes of different species’ ultrasound calls to differentiate between species, and was conservative in its identification to avoid mis-identifications. Files containing calls from different species were either classified as ‘unknown’ or, if most calls were attributed to the same species, were identified as passes of the ‘dominant’ species. More details about the automated identification key are outlined by Adams et al. submitted and two published studies (Lumsden and Bennett 2005; Law and Chidel 2006). The following options were set to be used for the Anascheme key. Identifications were only made when a minimum of 50 % of pulses within a pass was identified to the same species and only passes with a minimum of three pulses classified to the same species were identified. As part of this process we excluded pulses classed as unknown, including species grouping,

37
from contributing to the total number of pulses, because they usually lack diagnostic characteristics or they are of poor quality and are typically ignored when a pass is identified manually. Exceptions to excluding species groupings are outlined below. Three species of Nyctophilus occur in the study area (N. corbeni, N. geoffroyi and N. gouldi – Pennay and Gosper 2002; Turbill and Ellis 2006, Law unpubl. data), but it is not possible to distinguish them, even by the manual method, so calls from these three species were lumped as Nyctophilus spp. Second, Vespadelus vulturnus and Miniopterus schreibersii were difficult to consistently separate. However, a search of data-base records (DEC Wildlife Atlas, 16/5/2007) found no trap records of the subterranean-roosting M. schreibersii, indicating it is likely to be absent throughout the study area (see also Pennay and Gosper 2002). As such we considered this frequency band to represent calls of V. vulturnus only. The Mormopterus genus creates some confusion because of taxonomic uncertainty and difficulty with field identification. For example, recent survey work has identified the presence of Mormopterus sp.2 in north-west NSW (M. Pennay pers. comm.), although there is no evidence yet that it occurs away from major water courses in the area. It was not captured by the authors from 109 trap nights in the study area or during extensive trapping in the nearby Pilliga area (authors’ unpubl. data). Calls of Mormopterus sp.3 partially overlap with Mormopterus sp.4, so only those distinctive to the species were used in analyses. Finally, M. beccarrii was included in our key based on call properties described in Reinhold et al. (2001) and reference calls collected in Queensland. To identify feeding buzzes in Anascheme a filter was constructed to recognise short sequences of steep linear calls produced in rapid repetition, which typifies feeding buzzes. In a sample of 90 manually identified feeding buzzes our filter recognised 74 %. Testing on non-feeding buzzes revealed that Nyctophilus calls (n=46) were not identified as feeding buzzes, but occasional clutter calls from species calling at high frequencies were confused with feeding buzzes. Accordingly, all files matching our feeding buzz filter were manually checked to exclude non-feeding buzzes. Feeding activity was expressed as the mean number of feeding buzzes per night and feeding rate as the number of buzzes/total activity. Radio-tracking We quantified the extent of plantation use by individual bats at three adjacent properties (Paringa, Yongala and Connamara), which supported an 11 year old plantation (13.5 ha), a large contiguous block of mostly 5 year old plantation (36.3 ha) and surrounding remnants of woodland and land cleared for grazing and cropping (Fig. 4.1). The older plantation comprised primarily Eucalyptus sideroxylon E. crebra and E. melliodora, at a stem density of about 770 ha-1. Another smaller, young plantation (13.5 ha) in a poor, stunted condition was also located nearby (Fig. 4.1). Remnants and plantations comprised only 3 % and 0.8 %, respectively, of the area within a 5 km radius surrounding our site. On a more local scale, remnants represented 25 % of the area within a 500 m radius of our site, compared to 17 % for plantations and 58 % for paddocks.

38
Bats were tracked in the late summer and spring of 2008. During the summer tracking session, we compared bats with two foraging styles that are likely to make contrasting use of plantations. Nyctophilus geoffroyi was tracked because they are slow flying and manoeuvrable (O’Neill and Taylor 1986; Brigham et al. 1997; McKenzie et al. 2002) and were considered likely to forage in plantations with high stem densities (Law and Chidel 2006). The species is also known to roost under exfoliating bark outside of the maternity season (Lumsden et al. 2002a). In contrast, Scotorepens are faster-flying and less manoeuvrable and tend to fly in semi-cluttered air spaces, including flyways (McKenzie et al. 2002), which would not be considered characteristic of plantations. Little is known of the roosting ecology of Scotorepens species. Large foraging areas and difficulties in locating roosts (see Results) shifted our emphasis in the following spring to the Little Forest Bat Vespadelus vulturnus. Individuals captured close to plantations were expected to forage within a one km radius (Campbell et al. 2005), thus making the species highly suited, on a local scale, for revealing relative use of plantations and remnants. Where possible, females were selected for tracking because they are likely to be more selective of roosting and foraging habitat than males (Law and Anderson 2000; Lumsden et al. 2002a). Bats were caught in harp-traps within the plantations or along tracks in an adjacent remnant. We glued (Vetbond) single-stage transmitters (0.35 g) with 20 cm antennas (Titley Electronics, Ballina) mid-dorsally to the skin of bats. Small batteries resulted in 5 – 7 days of transmitter life. Transmitters as a proportion of body weight were 4.3 % for S. balstoni, 4.5 % for N. geoffroyi, 5.5 % for S. greyi and 9 % for V. vulturnus. Although transmitter weight was high for V. vulturnus, the species has been successfully tracked with transmitters representing a similar proportion of body weight (Campbell et al. 2005). Roosts To locate day roost trees we searched for signals from 4WD vehicles across an extensive area of the surrounding plains and the nearby Pine Ridge State Forest. When signals were received we tracked bats on foot using directional antennas. At roost trees we recorded the type of roost (e.g. hollow branch, hollow trunk, etc), tree species, senescence, aspect, estimated canopy cover above roost (scale of 1-5) and measured diameter at breast height over bark (dbh), tree height and distance to its previous roost. The density of trees surrounding the roost was calculated using the point-quarter method (Brower et al. 1990), whereby we measured the distance to the four nearest trees (> 10cm dbh) in each quadrant of the roost tree. Tree characteristics were also measured for these four trees. Where possible, we counted bats exiting their roost at dusk. Foraging
We quantified nocturnal use of plantations by 2-4 people taking simultaneous fixes at 3-5 min intervals, with a new radio-frequency being triangulated every 5 mins, during the first 4 hours of the night. Bats were tracked with 3 element-yagi antennas (Titley Electronics) from fixed locations that were positioned strategically on high points adjacent to the plantations. Compass bearings

39
were subsequently plotted in Arcview GIS software (ESRI, California) and overlayed onto an aerial photograph. Signal strength was used in combination with intersections of bearings that fell within plantations to classify bats as using plantation air space or non-plantation habitat (paddock or remnant vegetation). Intersections that fell on the edge of plantations were classified as in the plantation. Because most tracking took place from fixed locations adjacent to plantations it was not possible to determine the time bats spent using other habitat types, such as woodland or paddocks. Some time was also spent tracking bats opportunistically from a vehicle to confirm foraging areas, especially for bats not regularly using the local area. In spring, we used a different method to quantify the percentage of night-time spent by bats in plantations. We used four remote data loggers to determine the presence/absence of radio-tagged bats within the 13 ha section of older plantation. Each remote unit consisted of a modified scanner receiver (Uniden Bearcat UBC60XLT) and custom-designed data-logger based on a microprocessor (BASIC Stamp, Parallax) powered by a 12 volt sealed lead acid battery (Körtner and Geiser 1998). Each scanner-receiver was connected to an omni-directional antenna (Titley Electronics model CDB 151) via a six metre cable that was placed at a height of approximately 5 m in a nearby tree. The units were set to spend 20 seconds scanning for each of the 8 programmed radio frequencies every 5 minutes and stored the data on an 8-kbyte EPROM.

40
Fig. 4.1. Radio-tracking study area at Paringa, Yongala and Connamara properties, Liverpool Plains. Plantation boundaries are delineated. Remnant tree cover and extensive cropping on the plains are also visible.

41
Sensitivity of the remote data-loggers was set so that radio signals were detected only when hand-held transmitters were placed within the plantation. Loggers were individually calibrated to have a detection radius of approximately 60 m giving a combined sampling of 4.5 ha within the 13 ha plantation (Fig 4.1). This conservative sensitivity setting was chosen for the loggers to reduce the likelihood of detecting bats flying outside the plantation, but still maintain a high probability of detecting a bat as it crossed into one or more of the loggers’ zones of detection. Use of plantation was scored by recording a presence every 5 min in at least of one of the data-loggers within the plantation. For comparison, a single logger was used to detect bats using one patch of nearby remnant vegetation. Trial data were collected from two loggers deployed on 25/09/08, but as we did not have sufficient coverage over the plantation to determine the extent of use by radio-tagged bats, these data have been omitted from results. Two additional loggers placed in the adjacent Connamara plantation failed due to disturbance by livestock. Statistical Analysis Box plots were used to compare bat activity levels and species richness between the eight broad categories of vegetation. We modelled total activity and species richness using a large number of predictor variables (n=23), based on site attributes (Table 2.2) and GIS derived variables (Table 2.2). A principal components analysis (PCA) with a variamax rotation was used to reduce the number of predictor variables. Variables were considered to contribute to a principal component factor if the factor loading was greater than 0.7. PCA factors were included if the eigenvalue was greater than 1. A generalised linear modelling framework was then used to compare differences in species richness and bat activity with the range of habitat features. The models used a Gaussian distribution, as a result it was necessary to use a ln(x+1) transformation on bat activity to achieve normality. A multi-model inference framework (Burnham and Anderson, 2002) was applied with all possible combinations of the PCA variables considered. The best set of models was selected using a Akaike’s Information Criterion (AIC) (Akaike, 1973) corrected for small sample sizes (Burnham and Anderson, 2002). Models within 7 AIC points of the best model were considered to form the best set of models as they have support (Burnham and Anderson, 2002). A model averaging approach was then used to derive a final model following the methods described in Burnham and Anderson (2002). Spatial relationships between sites were tested using Morans I. Differences in species composition across vegetation categories were investigated using non-metric multi-dimensional scaling (Primer 6.1.6, 2006). Ordination of sites used the Bray-Curtis similarity matrix and was based on the activity levels of species recorded in sites, after activity was square root transformed to increase the contribution from rare species (Clarke 1993). Analysis of similarity (ANOSIM) was used to test for differences in species composition between vegetation categories and SIMPER (Similarity Percentages – species contributions) was used to identify taxa that contributed most to significant dissimilarities (Clarke and Gorley 2006). The response of individual bat species to landscape and habitat variables was explored with Canonical Correspondence Analysis (CCA). Mean activity of

42
each individual species was ln transformed prior to analysis. Relationships were interpreted using a bi-plot, where environmental variables are represented as vectors and species are overlayed. The length of the vector from the centre of the bi-plot indicates the influence of that environmental variable. The strength of the association of a species with an environmental variable (closest vector) can be determined from the distance along the vector if a perpendicular line is drawn between it and the species. Vectors pointing in opposite directions indicate an inverse relationship. Roost trees located by radio-tracking were distinguished from locally available trees using Principal Components Analysis. This analysis provides a representation of the similarity between samples (roost and available trees), based on five tree attributes (dbh, tree height, senescence, number of hollows and canopy cover). Dissimilarity was expressed using the Euclidean distance, after data were normalised, because tree attributes were measured on different scales. Results were visually represented on a 2-D plot of the first two PC-axes using Primer. 4.3 Results Harp-trapping Over three years, we accumulated 109 trap-nights on the Liverpool Plains that resulted in the capture of 222 bats (Table 4.1). Trapping success was poorest in plantations, probably because they were characterised by many open inter-row spaces, rather than a single well-developed flyway along a track. Just one threatened species was caught; a single female Greater Long-eared Bat Nyctophilus corbeni in Pine Ridge State Forest (0.5 % of captures). Ultrasonic activity Pre-plantation establishment
In April 2001, 222 bat passes from 10 species were recorded across 12 paddocks. Tadarida australis represented the greatest percentage of calls (28 %), followed by C. gouldii (11 %), while generally few passes were recorded for the remaining species. Paddocks adjacent to remnant vegetation (22 passes per night) supported twice the activity level of paddocks distant from remnant vegetation (10 passes per night). Post-establishment We sampled 42 sites in 2006 and 2007 for a total of 1680 hours, which resulted in 37212 stored files. Anascheme recognized 30461 of these as bat passes with more than two pulses. The remainder had fewer than three pulses or consisted of noise not produced by bats, such as stridulating insects. Anascheme identified 61 % of recognized passes to species or species complex, with 12 taxa recorded in total (Table 4.2). The remainder were identified as unknowns reflecting the extent of overlap in the call parameters of species in this area. Slightly more calls were recorded in spring 2006 than in summer 2007, although the median number of calls per night (100) was identical between years (Fig. 4.2). Vespadelus vulturnus was the most frequently recorded species, while C. picatus was the least recorded with no records in 2006. Species activity levels were relatively similar between years, except for

43
Mormopterus sp.3 and sp.4 and Nyctophilus spp., which recorded more passes in 2006. In contrast, Scotorepens greyi/sp. and T. australis recorded more passes in 2007. Three threatened species were identified from their calls; C. picatus, S. flaviventris and M. beccarrii.
Table 4.1. Total number of bats captured in harp traps from 2006-2008 on the Liverpool Plains. Number of trap-nights in plantations, remnants and State Forests are also shown.
Species Plantation Remnant State Forest
Vespadelus vulturnus 9 22 72
Chalinolobus gouldii 8 30
Nyctophilus geoffroyi 7 20 26
Chalinolobus morio 5 4 23
Scotorepens balstoni 4 19
Mormopterus sp4 2 18
Scotorepens greyii 12 16
Scotorepens sp 10
Nyctophilus gouldi 6
Mormopterus sp3 1
Nyctophilus corbeni 1
Total 21 72 222
Trap Effort 35 44 30

44
Table 4.2: Total number of passes recorded for each bat taxa identified by Anascheme in spring 2006 and summer 2007 (n=42 sites).
Species 2006 2007
Chalinolobus gouldii 1222 967
Chalinolobus morio 1035 1172
Chalinolobus picatus 0 15
Mormopterus beccarii 25 9
Mormopterus sp3 322 231
Mormopterus sp4 918 171
Mormopterus sp4/sp3 2137 505
Nyctophilus spp. 228 125
Saccolaimus flaviventris 86 94
Scotorepens balstoni 55 20
Scotorepens greyii/Scotorepens sp.
404 1157
Tadarida australis 41 122
Vespadelus vulturnus 4295 3370
Total Calls 17847 12614
Median 25%-75% Non-Outlier Range 2006 2007
0
100
200
300
400
500
600
Tota
l cal
ls
Fig. 4.2. Box plot of total calls per night in spring 2006 and summer 2007 (n=42 sites).

45
Summarising environmental variation across sites - Principal Components Analysis
The first 6 PCA factors explained 84% of the variation in the dataset, with loadings for the PCA factors presented in Table 4.3. PCA1 relates negatively to remnant structure, including the number of remnant trees and hollows within 200m and the cover and height of remnant trees at the site. PCA2 is a geological factor with a positive relationship with sedimentary geology and a negative relationship with basalt. PCA3 relates positively to remnant area within a 5km radius, elevation and topographic position and a weak relationship with the shrub height and cover. Large positive values of PCA3 are likely to reflect State Forest areas with large negative values representing open paddocks. PCA4 has a negative relationship with the area of the surrounding landscape covered by plantings. PCA4 has a negative relationship with the area of the surrounding landscape covered by plantings. PCA5 is a negative relationship with the cover and height of plantings at the site. PCA6 relates negatively to the cover and height of ground vegetation. Total activity Box plots show that total bat activity varied from a median of 650 passes per night in remnants to a low of 40 passes per night in paddocks (Fig 4.3). Median activity in the various types of plantings was greatest in older plantings, although values overlapped with other plantings and paddocks. One exception to this pattern was for under-plantings, which was the category with the second highest activity level. State Forests recorded a median of 176 passes per night, which was 2 times greater than the median activity for plantings when combined. Sixteen models fell within the best subset of models for predicting bat activity. The model averaged output appears in Table 4.4. Significant relationships at the p=0.05 level occur when the lower and upper limits do not overlap zero. Significant relationships were associated with PCA1 and PCA3. All other estimates were relatively small and considered not to effect bat activity. Bat activity decreased as remnant structure decreased on a site (PCA1). Activity also decreased as PCA3 increased, suggesting a reduction of activity as shrub cover and its height, along with remnant area in the landscape, increased. This appears to represent lower activity within State Forests compared to smaller remnants with low shrub cover (Fig. 4.3).

46
Table 4.3. Loadings for the Principal Components Analysis factors. Those in bold are considered to contribute significantly to the factor with loadings greater than 0.7
PCA1 PCA2 PCA3 PCA4 PCA5 PCA6
Position -0.287 0.721 -0.102 Number of residual trees < 200m -0.892 0.159 0.222 Number of hollows <200m -0.705 0.235 -0.137 0.263 -0.27 Residual tree cover -0.912 0.176 0.196 Residual tree height -0.894 0.125 Plantation cover 0.25 -0.139 -0.871 Plantation height 0.254 0.207 -0.135 -0.895 Shrub cover -0.435 0.187 0.483 0.425 0.313 -0.211 Shrub height -0.369 0.143 0.573 0.41 0.308 -0.112 Ground cover 0.248 0.127 0.212 0.833 Ground height -0.234 -0.17 0.114 -0.222 -0.31 0.646 RemArea5000 -0.195 0.336 0.775 0.214 -0.266 RemArea0500 -0.569 0.185 0.324 0.325 0.331 -0.299 SizeOf0500Rem -0.323 0.19 0.61 0.344 0.321 PlantArea0500 0.221 0.141 -0.885 PlantingEdgeRatio -0.146 -0.145 -0.871 0.114 Bas0500 -0.976 Sed0500 0.976 BasP 0.107 -0.965 0.122 SedP -0.107 0.965 -0.122 Elev -0.298 -0.194 -0.707 0.209 -0.328

47
Table 4.4. Model averaged output for bat species activity. Values in bold represent significant relationships.
Estimate 95% lower
95% upper
(Intercept) 4.859 4.623 5.094 PCA1 -0.192 -0.283 -0.101 PCA2 -0.044 -0.145 0.057 PCA3 -0.357 -0.511 -0.204 PCA4 -0.004 -0.101 0.092 PCA5 -0.023 -0.148 0.102 PCA6 0.037 -0.109 0.183
Species richness
Box plots show that median species richness ranges from 10 species in remnants to 6.5 species in old and strip plantings (Fig. 4.3). Species richness was intermediate for other types of plantings, paddocks and State Forests. Thirty two models fell within the best subset of models for predicting bat species richness. The model averaged output appears in Table 4.5. In the final model, the only significant relationship occurred with PCA1. Bat species richness decreased with a decrease in remnant structure on the site and within 200m. While not significant, bat species richness increased with an increase in tree cover through plantings but decreased as cover and height of plantations increased. The estimates of PCA2, PCA3 and PCA5 were close to zero and therefore considered to have no effect on bat species richness.

48
Median 25%-75% Non-Outlier Range
Rem
nant
Und
er-p
lant
ing
Sta
te F
ores
t
Old
Pla
ntin
g
Sm
all p
lant
ing
Stri
p
Pla
ntin
g
Pad
dock
0
200
400
600
800
1000
Tota
l cal
ls
Median 25%-75% Non-Outlier Range
Rem
nant
Und
er-p
lant
ing
Sta
te F
ores
t
Old
Pla
ntin
g
Sm
all p
lant
ing
Stri
p
Pla
ntin
g
Pad
dock
0
2
4
6
8
10
12
Spe
cies
Ric
hnes
s
Fig. 4.3. Box-plots of total bat activity and species richness for eight different vegetation categories sampled in the Liverpool Plains. Medians, 25-75 % quartiles and non-outlier ranges are shown.

49
Table 4.5. Model averaged output for bat species richness. Values in bold represent significant relationships.
Estimate 95% lower 95% upper
(Intercept) 7.561 7.097 8.025 PCA1 -0.322 -0.502 -0.143 PCA2 -0.004 -0.121 0.113 PCA3 -0.104 -0.360 0.153 PCA4 -0.202 -0.545 0.141 PCA5 0.041 -0.200 0.281 PCA6 -0.024 -0.248 0.199
Species composition The MDS plot shows that species composition is distinct for two broad groups; one comprising remnants and state forests and the other plantings and paddocks (Fig. 4.4). There was no clear separation between small planting and large plantings. ANOSIM indicated that bat composition differed between the vegetation categories (Global Rho = 0.434, P=0.01). Remnants were different from plantings (Global Rho = 0.693, P=0.01) and paddocks (Global Rho = 0.736, P=0.01), and state forests were also different from plantings (Global Rho = 0.0.494, P=0.03) and paddocks (Global Rho = 0.528, P=0.04). State forests did not differ from remnants (Global Rho = 0.212, P=0.13), nor did plantings differ from paddocks (Global Rho = 0.11, P=0.16). SIMPER analysis indicated that S. balstoni and C. gouldii were the main species discriminating remnants from plantings and paddocks, although Scotorepens sp. and C. picatus were also more active in remnants. The main species discriminating State Forests from plantings and paddocks were S. flaviventris, C. picatus, Scotorepens sp. and S. balstoni. Tadarida australis and Mormopterus spp. were the most typical species contributing to paddocks.

50
Categoriesremnantplantingpaddockstate forest
2D Stress: 0.21
Fig. 4.4. Multi-dimensional scaling of Anabat detector sites using transformed activity data from individual species (species composition).
Foraging activity Our Anascheme filter recorded 337 feeding buzzes across 2006 and 2007 (72 % in 2006), which represented just 1.1 % of all passes recorded over this period. Significant spatial autocorrelation was observed for the number of feeding buzzes. To account for this, a spatially lagged response variable was calculated and included in every model. Forty six models fell within the best subset of models for predicting the number of feeding buzzes. The model averaged output appears in Table 4.6. Other than the SLRV, one significant relationship was observed. The number of feeding buzzes increased as the amount of basalt in the local area increased (PCA2). Estimates for all other variables were small. We also expressed foraging activity as the rate of feeding (feeding buzzes/total activity). Significant spatial autocorrelation was not observed for these data. Thirty two models fell within the best subset of models for predicting the rate of feeding. The model averaged output appears in Table 4.7. The rate of feeding had a significant relationship with local geology, with an increased foraging rate in the basalt sites compared with the sedimentary sites. No other variables showed meaningful relationships.

51
Table 4.6. Model averaged output for feeding buzz data. Values in bold represent significant relationships.
Estimate 95% lower
95% upper
(Intercept) 0.536 0.151 0.920 SLRV 0.156 0.007 0.305 PCA1 -0.044 -0.117 0.028 PCA2 -0.115 -0.225 -0.006 PCA3 -0.034 -0.141 0.073 PCA4 0.001 -0.078 0.079 PCA5 0.005 -0.082 0.091 PCA6 0.031 -0.093 0.155
Table 4.7. Model averaged output for foraging rate (feeding buzzes/total activity). Values in bold represent significant relationships.
Estimate 95% lower
95% upper
(Intercept) 0.090 0.071 0.110 PCA1 0.000 -0.004 0.005 PCA2 -0.015 -0.025 -0.006 PCA3 0.002 -0.007 0.010 PCA4 0.004 -0.008 0.016 PCA5 0.002 -0.009 0.013 PCA6 0.006 -0.009 0.020
Activity of Individual Species Seven environmental variables were included in the final CCA model (Fig. 4.5). Variables included 2 plantation variables, 3 remnant vegetation variables, ground cover and basalt. These environmental variables explained 26 % of the variation in the data. Geographic co-ordinates and elevation values were partialled out in the analysis and were found to explain 14 % of the variation in the dataset. The biplot shows that the activity of most bat species was not related to plantation cover or its extent in the local landscape, although weak correlations were present for Mormopterus sp3 and Mormopterus sp4 (Fig. 4.5). Rather, the area of remnant vegetation and number of residual trees was strongly related to the activity of C. picatus and to a lesser extent S. balstoni, S. grey/sp. and S. flaviventris. Chalinolobus
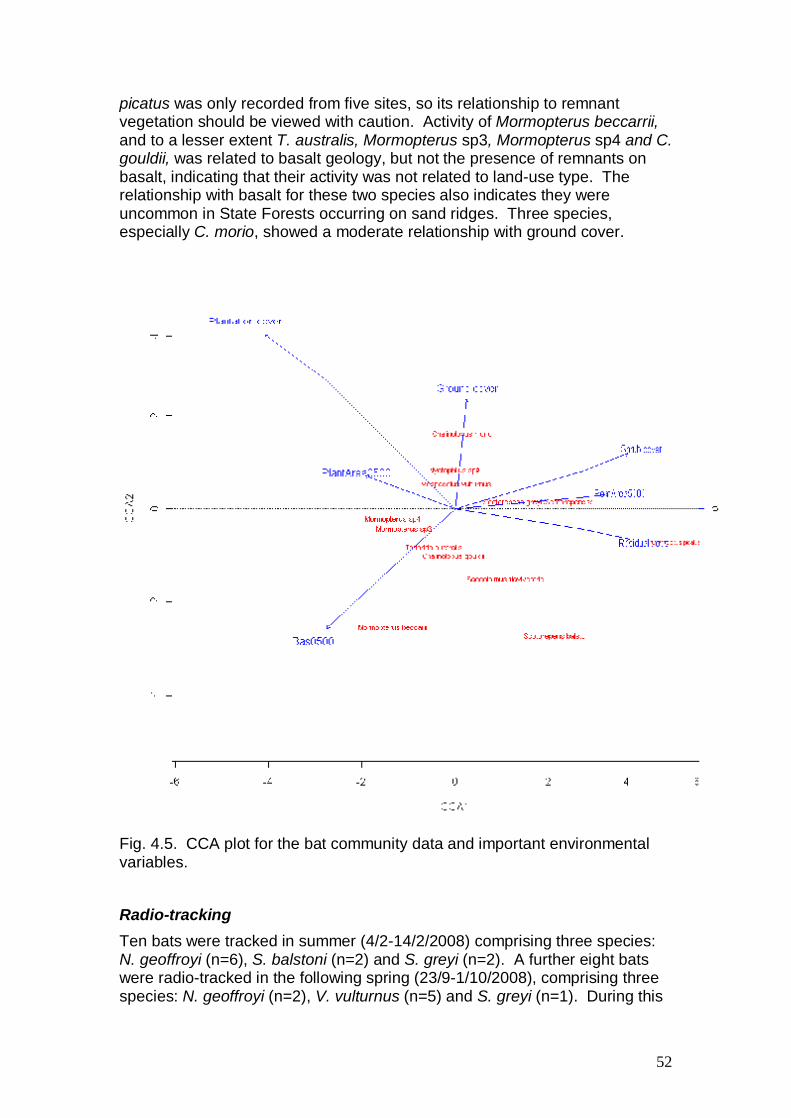
52
picatus was only recorded from five sites, so its relationship to remnant vegetation should be viewed with caution. Activity of Mormopterus beccarrii, and to a lesser extent T. australis, Mormopterus sp3, Mormopterus sp4 and C. gouldii, was related to basalt geology, but not the presence of remnants on basalt, indicating that their activity was not related to land-use type. The relationship with basalt for these two species also indicates they were uncommon in State Forests occurring on sand ridges. Three species, especially C. morio, showed a moderate relationship with ground cover.
Fig. 4.5. CCA plot for the bat community data and important environmental variables. Radio-tracking Ten bats were tracked in summer (4/2-14/2/2008) comprising three species: N. geoffroyi (n=6), S. balstoni (n=2) and S. greyi (n=2). A further eight bats were radio-tracked in the following spring (23/9-1/10/2008), comprising three species: N. geoffroyi (n=2), V. vulturnus (n=5) and S. greyi (n=1). During this

53
time, bats were tracked for 1-7 days for 60 diurnal roost days (Table 4.8). All but three bats caught for radio-tracking were trapped in Paringa remnant. Three bats caught in the adjacent plantations were one N. geoffroyi (584 - Connamara) and two V. vulturnus (384, 304 - Yongala). Roosts No roosts were located within plantations. All 28 individual roost trees were located in remnant trees, usually within patches of remnant vegetation, which graded across the landscape from intact vegetation to scattered paddock trees (Fig 4.6). Three roosts (S. balstoni, N. geoffroyi and V. vulturnus) were found in isolated paddock trees. Radio signals from two female N. geoffroyi in spring could not be located during the day. One of these (665) was received at dusk on three consecutive nights at Pine Ridge State Forest and was followed as it commuted towards the plantation study area. Its exact roosts were never located. The signal from the other missing bat (143) was lost on the night after finding its first roost. The characteristics of roost trees used by each bat are shown in Table 4.8. Bats typically roosted inside tree hollows (74 %) as well as occasionally in fissures (13 %) and beneath peeling bark (13 %). Only N. geoffroyi was observed roosting beneath bark. A range of tree species were used as roosts (Fig. 4.7), with live trees being more commonly used as roosts than dead trees (68 %, n=28 roosts). Greater use of live trees as roosts was consistent across all species (N. geoffroyi – 63 %, n=12; S. greyi – 80 %, n=5; V. vulturnus - 83 %, n=6), except one (S. balstoni – 40 %, n=5). Live trees were much more common near roost trees than dead trees (93 % vs 7 %). The PCA based on measurements of five tree attributes revealed extensive overlap between roost and locally available trees (Fig. 4.8). The first two PC-axes accounted for 70 % of the variation in the data. There was a trend towards roost trees grouping at the top left of the plot, which was most associated with late senescent trees and multiple hollows. The median senescence score for roost trees was 3.5, which corresponds to a mature live tree in the early stage of senescence. However, a number of available trees also had these attributes, indicating that potential roost trees were locally common. Twenty-three per cent of available trees had hollows, which converts to an availability of 37 hollow trees /ha surrounding roosts. For example, although large trees were generally used as roosts (mean dbh = 77 + 11 cm; range = 33-361 cm), this diameter was very similar to the average tree size available around roosts (dbh = 61 + 3 cm).

54
Fig. 4.6. Bat roost locations recorded at Paringa, Yongala and Connamara, Liverpool Plains. Plantings are delineated by a dark boundary.
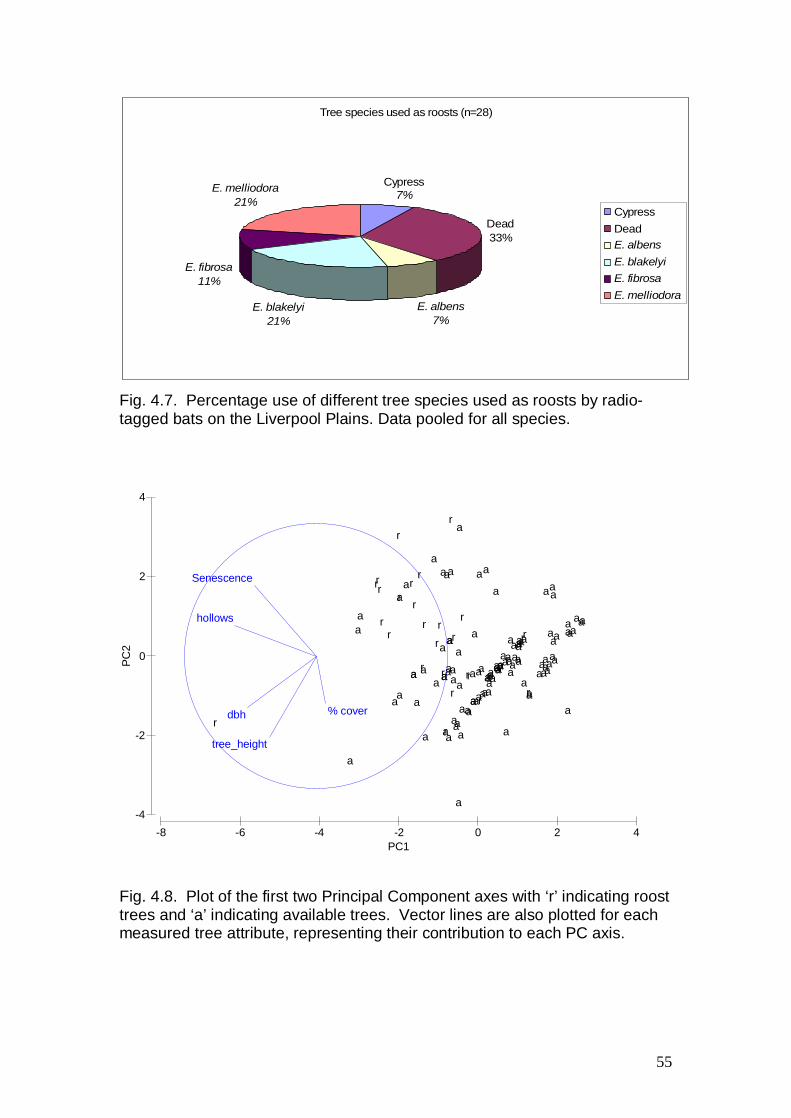
55
Tree species used as roosts (n=28)
E. albens7%
E. blakelyi21%
E. fibrosa11%
Dead33%
Cypress7%E. melliodora
21%CypressDeadE. albensE. blakelyiE. fibrosaE. melliodora
Fig. 4.7. Percentage use of different tree species used as roosts by radio-tagged bats on the Liverpool Plains. Data pooled for all species.
-8 -6 -4 -2 0 2 4PC1
-4
-2
0
2
4
PC2
r
r
r
rr
r
r
r
rr
r
r
r
r
r
r
rrr
r
rr
r
rrr
r
r
aa aa
aa
a
aa a a
aa
a
a
a
a
a
a
aaa
a
a
a
aa
a
a
a
a
a
a
a
a
a
a
a
a
aaaaa a
a
a
a aa aa
a aa a
aa
a
aa aaa
a
a
a
a a
a
a
aa
a
a
a
a
aa
a
a
a
a
a
aa
a
aaa
a
a
a
a
a
aa
a
a
a
a
a
a
a
a
a
a
a
a
a
a
adbh
tree_height
Senescence
hollows
% cover
Fig. 4.8. Plot of the first two Principal Component axes with ‘r’ indicating roost trees and ‘a’ indicating available trees. Vector lines are also plotted for each measured tree attribute, representing their contribution to each PC axis.

56
Bats switched between roost trees regularly, shifting on average every 1-3.5 days (Table 4.8). The greatest time spent at a single roost was for one male S. balstoni that roosted alone in the hollow branch of a dead eucalypt for five consecutive days before shifting to a small hollow in a Black Cypress (dbh = 45 cm). When roosts were switched, bats usually moved < 200 m to another roost (Table 4.8), although a maximum of 586 m was recorded for one roost movement of an S. greyi. Foraging
Summer 2008 In February, bats were tracked from fixed locations over six nights for a total of 7.1 h. Just 12 % of all fixes were located in plantations (n=113), however this was similar to the local availability of plantation area surrounding our site (17 %). Pooled across individuals, all species spent a small percentage of time in the plantations: N. geoffroyi (5 %), S. balstoni (27 %) and S. greyi (13 %) (Table 4.9). Most individuals did not restrict their movements to our tracking area and they were often not recorded by any station for a period of time and this varied greatly between individuals. For instance, four of six N. geoffroyi were never triangulated to fall within plantation and they were out of range for 55 % of all fixes. This included one female (665) that roosted during the day in Pine Ridge State Forest and was found to commute across 7.5 km of cleared plains to forage for a small percentage of time around remnant trees and plantations. It was originally caught in Paringa remnant. Spring 2008 In September, data were recorded by four remotely stationed data loggers of which three were placed within the plantation and one within a patch of nearby remnant vegetation. Of the loggers within the plantation, two recorded data for five consecutive nights (26/09/08 – 30/10/08) while the third collected data for four nights (26/09/08 – 29/09/08). The logger in the remnant successfully collected data for two nights only (26/09/08 – 27/09/08). Neither of the two radio-tagged N. geoffroyi was recorded at night, either by the remote data loggers or by manual observation, nor were they found during the extensive day time searches for roosts. We concluded that the transmitters of these bats had either been dropped onto the ground and were unable to be located, had failed or that the bats moved out of range beyond the surrounding study area. The single Scotorepens greyi (226) that was tracked remained within the wider study area. However, the transmitter signal from this bat was very strong and was recorded by the remote data-loggers while the bat was in its daytime roost located approximately 420 m from the plantation. This is a distance well beyond the normal transmitter test range. At night, this individual was recorded extensively (42 % of time) within the range of the remote data loggers positioned in the plantation, but because of the strong signal strength, we cannot confidently assign these data to foraging within the plantation. Indeed, manual searching at night recorded the bat flying along the road through remnant vegetation, below the plantation. It was not recorded by the single logger positioned in remnant vegetation.

57
When pooled across individuals, the five female V. vulturnus spent 14 % of recorded foraging time in plantations. Again, the percentage use is similar to the local availability of plantation area (17 %). The percentage use varied greatly between individuals. One bat (304) spent a much larger proportion (39 %) of its time within the plantation, where it was trapped, and had diurnal roosts (n=2) approximately 600m from the plantation edge. This bat also spent 21 % of recorded time within range of our logger in a nearby patch of open remnant vegetation (total time within range of at least one remote data-logger = 60%). Two further bats spent 15 % (096) and 14 % (226) of night-time within the plantation and had roosts approximately 500 m and 200 m, respectively from the plantation edge. Bat 226 spent 39 % of recorded time within range of our logger in the remnant vegetation, and this was very close to its observed day time roosts. The two remaining bats (184 & 386) spent very little of recorded time (0%, 0.4%) within the plantation. The bats 096, 184 and 386 (all trapped in plantation), also spent little time (1.6 % , 0 %, 0 %, respectively) near our logger in the remnant, indicating they mostly foraged out of range of the data-loggers.

58
Table 4.8. Characteristics of roost trees for individual bats tracked during summer and spring 2008 on the Liverpool Plains. Means + SE are calculated for each individual bat.
Bat No. Species
Sex Season
Days Found
No. Roosts
Mean Days per
roost Mean DBH
Mean Distance Between Roosts
(m)
Mean Stems/ha
surrounding roosts
Mean Senescence
(0-8)
Mean Canopy cover %
585 N. geoffroyi F Summer 8 4 2 59.4 + 12.4 146 + 27 329 2 50-75
627 N. geoffroyi F Summer 7 2 3.5 69.5 + 28.5 58 55 5 5-25
665 N. geoffroyi F Summer 6 0 - - - - - -
707 N. geoffroyi M Summer 5 3 1.67 183.8 + 88.8 66 + 10 51 5.3 25-50
735 N. geoffroyi F Summer 4 2 2 35.0 + 2.0 184 155 4.5 5-25
684 S. balstoni M Summer 3 2 1.5 78.3 + 37.8 144 27 6 < 5
767 S. balstoni F Summer 2 1 2 40.0 - 35 3.5 5-25
825 S. balstoni M Summer 7 2 3.5 59.8 + 14.8 95 14 3.5 5-25
527 S. greyi M Summer 5 1 5 82.0 - 49 2 < 5
794 S. greyi F Summer 5 2 2.5 63.5 + 12.5 587 34 4 5-25
143 N. geoffroyi F Spring 1 1 - 71.0 - 1451 4 < 5
266 S. greyi F Spring 2 2 1 72.5 + 15.5 214 38 1 5-25
096 V. vulturnus F Spring 1 1 - 78.0 - 2 6 < 5
184 V. vulturnus F Spring 1 1 - 78.0 - 85 6 < 5
226 V. vulturnus F Spring 2 1 2 85.0 - 79 4 < 5
304 V. vulturnus F Spring 4 2 2 56.5 + 6.5 246 276 2 5-25
384 V. vulturnus F Spring 3 1 3 70.0 - 127 1 < 5

59
Table 4.9. The % of nocturnal fixes recorded for individuals of three bat species within plantations or along their edge on the Liverpool Plains in February 2006. N = the total number fixes attempted for each individual.
Bat Species % fixes in plantation N
S. greyi (527) 20 10
S. greyi (684) 0 5 S. balstoni (765) 0 3
S. balstoni (767) 40 5
S. balstoni (825) 28 18 N. geoffroyi (584) 5 19
N. geoffroyi (627) 0 10
N. geoffroyi (665) 16 19 N. geoffroyi (707) 0 10
N. geoffroyi (735) 0 8
N. geoffroyi (794) 0 10
4.4 Discussion The key result from our ultrasonic survey was that five year old eucalypt plantings growing in the heavily modified landscape of the Liverpool Plains were not used preferentially by bats over tree-less paddocks. Plantings were typically used by 7-8 species in both spring and summer, and activity averaged 87 passes per night at a detector site. This is a moderate level of activity that is slightly greater than in young environmental plantings near Albury (50 passes night-1 - Law and Chidel 2006). This would suggest that the commercial timber production focus on the Liverpool Plains, using native tree species, was not detrimental to bats compared to environmentally-focused plantings at Albury. However, the activity within plantings fell within the upper range of the activity recorded in tree-less paddocks and it was about six times less than that found in small remnants on the plains. The much higher bat activity recorded in remnants is consistent with the study at Albury (Law and Chidel 2006), although activity in those remnants was less than half that recorded in remnants on the Liverpool Plains. The very high activity levels in remnants on the Liverpool Plains could be related to the widespread rich, basalt soils. Basalt geology was strongly related to overall bat foraging activity, probably because soil productivity influences flying invertebrate numbers and in turn the feeding behaviour of bats. Interestingly, activity levels for three of the four largest bat species were best correlated with basalt geology, the exception being S. flaviventris, suggesting that larger species prefer more fertile lands where may be more abundant. Neither planting size nor shape influenced bat activity on the Liverpool Plains (see also Law and Chidel 2006). The two older plantings (11 years old)

60
sampled supported more activity than younger plantings, which is again consistent with the greater activity supported by plantings up to 25 years old near Albury (Law and Chidel 2006). We expect that bat activity will increase further as the plantings age, but predict this will be limited by the extent to which vegetation density (i.e. acoustic clutter) decreases (Law and Chidel 2006). At Albury, Nyctophilus spp. was the only taxon correlated with the higher vegetation density found in plantings (Law and Chidel 2006), but we did not find this association on the Liverpool Plains. Instead, ground cover provided a better correlation for Nyctophilus spp. (and C. morio – see also Lloyd et al. 2006). Activity in young under-plantings was even greater than older plantings, but these were planted adjacent to, and beneath, extensive remnant trees, which probably exerted a strong influence on bat activity and species richness. Indeed, total activity and species richness was correlated positively with the number of remnant trees on the site, but negatively with large extents of remnant cover. This result is likely to reflect the importance of remnant tree structure, but lower activity in State Forests, which are restricted to sedimentary geology. At Albury, activity levels in young plantings were not associated with connectivity (the amount of remnant vegetation surrounding sites) (Law and Chidel 2006), nor did a cleared landscape with some scattered tree cover (8 % of landscape) support less activity (Kavanagh et al. 2005). These results reinforce the importance of remnant trees, even when scattered in the landscape (Law et al. 1999; Law et al. 2000; Lumsden and Bennett 2005; Law and Chidel 2006), and additionally highlights geology as a driver of bat activity. Yet large State Forests are also a vital feature of the landscape as they supported the only records of two threatened species, N. corbeni and C. picatus. Turbill and Ellis (2006) found an association between N. corbeni and large tracts of woodland, but the presence of this species on the Liverpool Plains was not previously known. Differences in the land-use of paddocks (i.e. the matrix) did not have a strong influence on bat activity. Activity at tree-less paddocks was similar between the Liverpool Plains, which were mainly cropped for canola or sorghum, and Albury, which was mainly grazed. It is notable that paddocks in the Liverpool Plains were more isolated and supported fewer scattered trees than Albury, although this difference may have been partly compensated for by the rich basalt soils. The results from radio-tracking four different bat species support the findings from the ultrasonic survey described above, in that plantings were not preferentially used by individual bats. The percentage nocturnal use of plantings was relatively small (mean = 12 % in summer and 14 % in spring), although similar to the extent of plantation in the landscape immediately surrounding (< 500 m) our radio-tracking study area (17 %). In other words, plantings were neither selected nor avoided. Notably, N. geoffroyi captured in and adjacent to 5 and 11 year old plantings infrequently foraged in them. However, this species moved over a large range encompassing many kms and we typically found it difficult to locate these bats. Such widespread movements have been found for this species in other rural landscapes, for instance covering 6-12 km to forage among the farmland mosaic in the northern plains region of Victoria (Lumsden et al. 2002a). The less mobile V.

61
vulturnus is a species that should also have the manoeuvrability required to forage in dense plantings. Its percentage use of plantings was still in proportion to the local availability of plantings. Some females clearly used the planting more than others, but similarly, other females focused their foraging in neighbouring remnant vegetation. These results would suggest that plantings do provide useable foraging habitat for manoeuvrable bat species, but that much greater areas are likely to be required to make significant contributions to restoring bat habitat in heavily cleared landscapes. Support for this contention comes from the fact that only two aerial-interceptor species (Mormopterus sp.3 and sp.4) recorded more ultrasonic calls in areas with more plantings. Future research should investigate the use of plantings where they are isolated from remnant vegetation. In contrast to providing foraging habitat, plantings did not provide roosting habitat. Young plantings clearly do not provide tree hollows, which is the primary roost type for most bat species in Australia (Churchill 2008), and they would not expect to do so for at least 100 years (Mackowski 1984). However, decorticating bark is abundant in eucalypt plantings. Only N. geoffroyi was observed beneath bark and bark roosts represented just 36 % of N. geoffroyi roosts, which is very similar to one third recorded in Victoria (Lumsden et al. 2002b). As diurnal roosts are a critical resource for bats to shelter and breed in our results emphasise the importance of retaining hollow-bearing trees in the landscape and within plantings (Lumsden et al. 2002a, b). Nest boxes have been used successfully to provide a local source of roosts for bats and other fauna in plantations (Smith and Agnew, 2002), but they are not likely to be long lasting. The extent to which nest boxes increase the use of plantings is the subject of an experiment discussed in Chapter 8.

62
5. Nocturnal birds and arboreal marsupials 5.1 Introduction Most species of arboreal marsupial are dependent on hollows in old trees for diurnal shelter and breeding. Accordingly, this fauna group is likely to be slow in colonising the new habitat provided by eucalypt plantations, unless remnant forest is adjacent. Only a few studies have investigated the responses of arboreal marsupials to revegetation in agricultural landscapes in south-eastern Australia (Kavanagh et al. 2005, Cunningham et al. 2007, Loyn et al. 2008). These studies have shown that arboreal marsupials are uncommon in eucalypt plantations, unless they are older (>25 years), and only when remnant vegetation is nearby. We know that the Sugar Glider Petaurus breviceps, Squirrel Glider P. norfolcensis and the Common Brushtail Possum Trichosurus vulpecula are capable of maintaining high population densities in remnant forest and woodland along roadsides and in riparian strips, but there are thresholds in the spacing between forest fragments beyond which there is little movement by arboreal marsupials (Suckling 1984, Lindenmayer et al. 2000, van der Ree 2002, van der Ree et al. 2003). Most species of nocturnal birds are also dependent on tree hollows for nesting and shelter. Only one study has investigated the responses of nocturnal birds to revegetation in agricultural landscapes (Kavanagh et al. 2005), however, the large home-ranges of the owls, and the call-playback method of detection, made it impossible to assign records of the larger species to any particular vegetation category. Several of the smaller species of nocturnal birds are known to occur in linear strips of remnant forest and woodland on farms (Kavanagh and Stanton 1998, 2002). The Koala Phascolarctos cinereus is a special case. It does not require tree hollows for breeding and, although it does appear to prefer larger trees for diurnal shelter, it often forages in young eucalypt trees (Kavanagh et al. 2007 b). The Liverpool Plains region near Gunnedah is well known as a “hot spot: for Koalas in NSW. (Lunney et al. 2009). In this Chapter we report the results of standardised listening, call-playback and spotlighting surveys for all species of nocturnal birds and arboreal marsupials to determine the relative value of eucalypt plantings, remnant forest and woodlands, and cleared paddocks as habitat for these species. 5.2 Methods The basis for sampling was a 200 m transect located at each of the 43 sites. After an initial 10 minute period of listening for any calling animals, one observer walked slowly along the transect line for approximately 20 minutes, listening and spotlighting with a 50 watt spotlight for any animals present. On the larger remnants and larger plantations only, at the end of the transect, approximately 15 minutes was spent alternately broadcasting calls through a megaphone (Toa ER-66, 10W) and listening for any responses. Pre-recorded calls broadcast on these occasions included the Barking Owl Ninox connivens, Powerful Owl N. strenua and the Masked Owl Tyto novaehollandiae. The call-playback sessions had to be attenuated, either in

63
duration or volume, when houses or domestic stock were nearby (< 500 m), and were not attempted at all in paddocks or small plantations. Perpendicular distances from the transect line were recorded for all observations. Arboreal marsupials and nocturnal birds were surveyed twice on all sites in April- May 2009 and again in May 2009. The larger remnants and the larger planted sites were also surveyed at other times including September 2006, January 2007, March-April 2007 and August 2007. Remote cameras (one per site) were set for approximately 15 days near the midpoint of each site during April-May 2009 (see Chapter 6) and some images of arboreal marsupials and nocturnal birds were recorded. Focal animal tracking was undertaken for two adult male Koalas to determine their use of the eucalypt plantations in which they were trapped in relation to the surrounding vegetation types and land uses available. The two Koalas were radio-tracked using GPS data loggers attached to a collar from May 2008 until November 2008. 5.3 Results Five species of arboreal marsupials and five species of nocturnal birds were observed during the study (Table 5.1). As expected, all species were most abundant in remnant vegetation. The Common Brushtail Possum was the species most frequently encountered during spotlight visits, but almost all records of it were made in remnant vegetation. Several species were observed using young eucalypt plantations, but no arboreal marsupials or nocturnal birds were recorded in paddocks.

64
Table 5.1. Nocturnal birds and arboreal marsupials detected during spotlighting surveys presented as the mean reporting rate per visit (two hectare search for 20 minutes). “p” indicates species encountered outside of search area but within the vegetation type.
CommonName Paddock Planting Remnant State Forest
Australian Owlet-nightjar 0.04 0.50 1.60 White-throated Nightjar p Tawny Frogmouth 0.33 0.50 0.80 Southern Boobook 0.26 0.17 0.80 Masked Owl 0.20 Diurnal Birds at roost 2.74 9.17 2.80 Feathertail Glider 0.20 Squirrel Glider p 0.17 Sugar Glider 0.07 0.17 0.20 Common Brushtail Possum p 2.83 4.00 Koala 0.07 0.40
Table 5.2. Nocturnal birds and arboreal marsupials detected by motion-sensing cameras as a percentage of the sites in each category.
Species Paddock Planting Remnant State Forest
Tawny Frogmouth 11% Owl species 7% Nightjar species 20% Common Brushtail Possum 4% 67% 20% Koala 17% 20%
Koala tracking In addition to spotlighting records, Koalas were observed using young eucalypt plantations at four sites and also in many of the remnant forest and woodland sites in the study. In early May, two adult male Koalas were trapped and fitted with GPS data-logger radio-transmitters (220 grams) to determine their use of eucalypt plantations in relation to the surrounding rural lands mosaic of vegetation types. Six accurate positional fixes were obtained for these animals every day at 4-hourly intervals.

65
Koala A was tracked for 204 days until November 2008, at which point its Minimum Convex Polygon (MCP) home-range was estimated to be 219 ha, although it spent most of its time in much smaller areas (Table 5.3, Fig. 5.1). Koala B was tracked for 140 days until September 2008 when its MCP home-range was estimated to be 575 ha. This animal roamed much more widely among the pastoral lands that contained many scattered patches of remnant trees (Table 5.3, Fig. 5.1). Many of the location fixes for these two Koalas occurred within several patches of eucalypt plantation (composed mainly of Eucalyptus camaldulensis and E. pilligaensis), all of which were extensively used by the Koalas for foraging and diurnal shelter (Fig. 5.2). The GPS data-loggers also showed that both animals occasionally travelled long distances (up to one kilometre) along the ground to reach favoured feeding areas. Sometimes this involved crossing cleared paddocks and croplands, including fences, and one Koala was directly observed climbing over a barbed-wire fence. Table 5.3. Data summary and home-ranges of two Koalas tracked using GPS data-loggers
Attribute \ Koala Koala A (red) Koala B (yellow)
Days tracked 203.8 139.5 Total track points 1224 838 Total good track points 731 509 Minimum Convex Polygon home range
218.9 ha 575.4 ha
Adaptive Kernel 95% 55.7 ha (3 polygons) 393.6 ha (3 polygons) Fixed Kernel 95% 12.0 ha (3 polygons) 34.4 ha (13 polygons)
5.4 Discussion Remnant forest and woodland is clearly the most important habitat for nocturnal birds and arboreal mammals. Many species occasionally use eucalypt plantations and this usage is expected to increase as the trees become older. Establishing eucalypt plantations near remnant trees and woodlands is crucial to ensure their use by arboreal marsupials and nocturnal birds. Cleared cropping and grazing lands provide little or no habitat for these species. The Koala was shown to be the species most capable of utilising and benefiting from the establishment of eucalypt plantations in this region. While both tracked animals were often observed foraging and sheltering during the day among 6-10 year old planted trees, they appeared to prefer nearby older, taller remnant trees for diurnal shelter.

66
Fig. 5.1. Distribution of location points for two adult male Koalas radio-tracked near Spring Ridge.
Fig. 5.2. Home-ranges (MCP) for two adult male Koalas. Eucalypt plantations indicated by the yellow shading. Other vegetation types present were cleared crop lands and grazing areas with scattered remnant trees.

67
6. Terrestrial mammals 6.1 Introduction Terrestrial mammals encompass native and exotic species ranging in size from 10 g to more than 80,000 g, many of which are cryptic and difficult to detect. All of the introduced pest animals have adapted well to agricultural environments and pose a continuing and significant threat to small and mid-size-range native mammals (and other animals) living in the same areas. Some terrestrial mammals (particularly the smallest and the largest species) may be abundant in farmlands but, in part due to increased predation pressure in agricultural landscapes, many native terrestrial mammals are largely confined to remnant forest and woodland. The responses of terrestrial mammals to revegetation in agricultural landscapes are very poorly known (Munro et al. 2007). Most species are primarily nocturnal and have limited capacity to move large distances (> 5 km) in search of suitable habitat. Consequently, mammals (both terrestrial and arboreal) are among the most vulnerable fauna groups to habitat loss and fragmentation (Saunders et al. 1991). Remote, motion-sensing, cameras have recently been shown to be effective in assessing the presence of a wide range of terrestrial mammals, including introduced predators (Claridge et al. 2004, Towerton et al. 2008). This method provides a relatively unbiased way of comparing differences in mammal species occupancy at each site. In this Chapter we report the results of remote cameras set at each site to detect the presence of a wide range of terrestrial mammals to determine the relative value of eucalypt plantings, remnant forest and woodlands, and cleared paddocks as habitat for these species. 6.2 Methods Terrestrial Mammals were assessed using four separate methods, principally by remote cameras, but supplementary records were made during nocturnal spotlighting surveys, during diurnal bird surveys and by analysis of pellets regurgitated by predatory birds. Standard methods of trapping small mammals using a range of trap sizes was discounted as a cost-effective method following preliminary work during the pre-plantation establishment stage of the study. Only one species, the House Mouse Mus domesticus, was encountered during this initial trapping phase. Remote, motion-sensing cameras (one per site) were set for approximately 15 days near the midpoint of the 200 m transect at each of 41 sites during April-May 2009. Two paddock sites were not sampled due to the presence of stock and pending cultivation. Moultrie Game Spy i60 cameras were used. All cameras were set at approximately 0.8 m height on a tree, fence post or steel post, facing south, and were aimed (with the built-in sighting laser) at the ground approximately 6 metres away. Spotlighting methods were described in Chapter 5. Spotlighting targeted both arboreal and terrestrial species. Diurnal bird surveys (Chapter 3) were useful for detecting large mammals, particularly macropods. Mammals were

68
recorded consistently by one of the observers and those records are presented here Regurgitated pellets from nocturnal and diurnal birds were collected opportunistically during the study. Plantation sites with supplementary nest boxes (see Chapter 8) were visited more frequently resulting in a greater chance that pellets would be found (nest box poles were frequently used as hunting perches by nocturnal and diurnal birds). Pellets found beneath Southern Boobook Owl roosts formed the largest part of the collection. Some pellets could not be assigned to species conclusively. 6.3 Results The motion-sensing cameras captured 1779 identifiable images of terrestrial mammals, excluding domestic stock (i.e. cattle, sheep, horses and dogs) (Table 6.1). The Eastern Grey Kangaroo Macropus giganteus comprised 47% of all records and was detected on 33 of the 41 sites sampled. This species probably occurs on the majority of the sites. Only 2 sites (both eucalypt plantations surrounded by intensively cultivated land and electric fencing) had no macropods detected by the cameras. Red Fox Vulpes vulpes, Brown Hare Lepus capensis and Rabbit Oryctolagus cuniculus were the most commonly detected feral animals. Domestic livestock were commonly detected, and in one case a camera was damaged. Table 6.1 shows the percent of sites in each land use category where species were detected. Table 6.2 presents the data as the mean number of images taken of each species. Unidentifiable terrestrial mammals (an additional 177 images) were not included in the tables and are not considered further. Spotlighting contributed additional species, notably Short-beaked Echidna Tachyglossus aculeatus, Common Dunnart Sminthopsis murina, Black Rat Rattus rattus and House Mouse. Table 6.3 displays the terrestrial mammals detected by spotlighting as the mean reporting rate per visit in each land use category. Of the small species, only the House Mouse was detected with any regularity. The Eastern Grey Kangaroo was also the most commonly detected terrestrial mammal during daylight surveys, with 81 records from 211 visits (Table 6.4). Other macropods, and the Brown Hare and European Rabbit, were also likely to be detected but there were no records of these species on paddock sites using this method. A total of 16 Southern Boobook Owl pellets were collected opportunistically under known Boobook roosts and nearby perches. An additional seven pellets (probably mostly from Barn Owls, but also two likely from a Black-shouldered Kite and a Brown Falcon) were collected under nest box poles in plantations. House Mouse dominated the contents of the pellets, except the two from within State Forests. These results are presented in Table 6.5.

69
Table 6.1. Terrestrial mammals detected by motion-sensing cameras with occurrence expressed as the percentage of sites in each land use category.
Species Paddock Planting Remnant State Forest
Eastern Grey Kangaroo 100% 70% 100% 100% Common Wallaroo 67% 26% 67% 20% Red-necked Wallaby 33% 41% 83% 20% Swamp Wallaby 67% 48% 67% 60% Brown Hare 67% 56% 33% 40% European Rabbit 67% 40% Red Deer 7% Feral Goat 20% Feral Pig 11% 33% Feral Cat 4% 20% Red Fox 67% 59% 33% 80%
Table 6.2. Terrestrial mammals detected by motion-sensing cameras expressed as the mean reporting rate per two week period.
Species Paddock Planting Remnant State Forest
Eastern Grey Kangaroo 29.7 21.3 15.5 17.6 Common Wallaroo 4.7 1.7 5.5 1.4 Red-necked Wallaby 1.3 6.3 8.2 2.8 Swamp Wallaby 3.0 5.8 7.0 7.8 Brown Hare 7.7 3.2 0.5 0.8 European Rabbit 12.8 4.2 Red Deer 0.3 Feral Goat 0.6 Feral Pig 0.2 1.0 Feral Cat 0.1 0.2 Red Fox 16.3 1.8 0.7 1.8

70
Table 6.3 Terrestrial mammals detected during spotlighting surveys expressed as the mean reporting rate per visit (two hectare search for 20 minutes). “p” indicates species encountered outside of search area but within the vegetation type.
CommonName Paddock Planting Remnant State Forest
Short-beaked Echidna 0.04 Common Dunnart 0.07 Eastern Grey Kangaroo 0.20 0.81 0.50 1.00 Common Wallaroo 0.17 0.20 Red-necked Wallaby 0.22 0.17 0.40 Swamp Wallaby 0.22 P Black Rat P House Mouse 0.33 0.67 Brown Hare P 0.11 Rabbit 0.04 0.33 Fox P 0.19 0.33 P Pig (feral) p P
6.4 Discussion Nine of the 15 species (60 %) of terrestrial mammals recorded in this landscape were introduced species that are now problem pests for farmers, including two species that are also significant predators of native animals. The remote cameras were very effective in recording the occurrences of medium and large-sized terrestrial mammals at all sites. Occurrences of the smallest species (e.g. House Mouse, Common Dunnart) were clearly underestimated using the cameras (Tables 6.3 and 6.5). Nonetheless, the cameras were a valuable method of recording the occurrences of macropods and introduced predators and pest species. Young eucalypt plantations clearly provide useful habitat for a wide range of terrestrial mammals, especially kangaroos and wallabies (4 species). The Red Fox was very common in all vegetation types in this landscape.

71
Table 6.4. Records of terrestrial mammals collected during diurnal bird surveys presented as the mean number of records per site in each vegetation type.
Species Plantings Remnants State Forest
Total records
Eastern Grey Kangaroo 2.19 1.67 2.40 81 Common Wallaroo 0.48 2.33 1.60 35 Red-necked Wallaby 0.44 2.00 0.60 27 Swamp Wallaby 0.44 0.67 0.60 19 Brown Hare 0.81 0.33 0.20 25 European Rabbit 0.15 1.17 0.20 12 House Mouse 0.04 1 Feral Pig 0.04 0.17 0.60 5 Feral Cat 0.04 1 Red Fox 0.19 0.17 0.40 8
Table 6.5. Mammals and other prey detected in regurgitated pellets collected from predatory birds and presented as the mean number of prey items per pellet.
Location (No. pellets) Predator
House Mouse
Common Dunnart Bird Beetle
Grass-hopper
Native Forest Roost (2)
Southern Boobook 0.5 2
Plantation Roost (14)
Southern Boobook 1.43 0.07 0.93 0.21
Pole in Plantation (7)
Not Southern Boobook 2.43

72
7. Reptiles and amphibians
7.1 Introduction Reptiles form a significant component of the Australian vertebrate fauna in any landscape. As ectotherms, they are pre-adapted to the variable conditions of Australia that can limit food availability and they have diversified and spread across the landscape. Relatively few studies have looked at reptiles in relation to fragmented rural landscapes. One species of gecko in Western Australia coped well within a fragmented region of the wheat belt whereas another did not (Sarre et al. 1995). Work in south-eastern Australia found various factors to influence reptile distribution for each species (Fisher et al. 2003), with one skink being found to either prefer areas with few rocks, many spiders and high tree cover, another sites with many ants and beetles and a high tree cover and a third (along with a legless lizard) sites with a simple microhabitat structure. Grazing was considered a potentially significant problem because it simplified the vegetation in patches. Reptiles in remnants and plantations on the NSW/Victorian Border area were found to be low in abundance in all sites, but were still significantly more diverse and abundant in larger remnants, but plantings contained similar numbers of reptiles as smaller remnants (Kavanagh et al 2005). Cleared paddocks supported no reptiles and loss of ground cover appeared to be critical in the reduction of reptiles. In general, many species of reptiles have been recorded from rural lands (see Cogger 2000), however the need for retained remnant vegetation for nearly all species is unknown. For smaller species (most skinks, geckoes and small snakes) the presence of ground cover in the form of logs, rocks, grass tussocks or deep leaf litter is likely to be critical for their survival, buffering against more extreme environmental conditions and providing shelter from predators. More mobile species may be able to utilise sites lacking cover if appropriate resources are available within migratory distance. This project documented the capacity of young eucalypt plantations to restore habitat for fauna within a highly fragmented, and ecologically degraded, agricultural landscape. The study compared fauna occupancy within 4-6 year old eucalypt plantations and paddocks used for grazing and intensive cropping with remnant forest and woodland in the region. The study sought to validate inferences from a previous study about the importance of plantation size and proximity to remnant vegetation. It also sought to calibrate forestry-type plantations with eucalypt plantings established primarily for broad environmental benefits. Finally, by adding supplementary cover to some plantings, the study provides an initial assessment of opportunities for improving habitat for reptiles in agroforestry plantations (see Chapter 8).

73
7.2 Methods Study Area Details of the study area are provided in Chapter 2. However, the basic aim was to conduct reptile searches in four different habitat types: state forests (larger remnants), remnants, plantings and paddocks. This allowed comparisons of the relative value of the different habitats to reptiles within a highly fragmented agricultural landscape. Differing numbers of replicates were available in each of these four treatment categories, dependant on availability of sites. Surveys A total of 43 different sites were surveyed representing three different habitat types: remnants, plantings and paddocks. Sites were surveyed varying numbers of times, depending on their location and importance for analyses. They were surveyed using time constrained visual/habitat searches ranging from 30-180 person minutes, but typically 60 person minutes in duration (standardised to 60 minutes for analyses). Searches started at one corner of a survey site, with the searcher/s initially visually searching the ground, ground cover and tree trunks to locate and identify any active reptiles. This was followed by an active search, turning over cover within the study site to locate sheltering reptiles whilst continuing to search for reptiles moving away from cover (active search). The size of the area searched depended on how much cover was available for inspection, but it was considered that time constrained surveys provided the most accurate reflection of relative reptile species richness and abundance. The number of these surveys undertaken at each site is noted in Table 7.1. Any incidental observations of reptiles (and frogs) within a planting were also noted to add to the species list present in the area and so allow the fullest consideration of the reptiles that might benefit from the presence of plantings and habitat supplementation. We attempted to first visually identify any herpetofauna observed in order to avoid disturbing other animals in the search area. If this could not be done, we attempted to catch the animal by hand to identify it using Cogger (2000). If the reptile could not be captured and its identity remained uncertain, it was recorded as an unidentified member of that family. Analysis Due to the limited data obtained, statistical analyses were difficult to undertake with any confidence. Preferentially, data are presented as graphs or figures to provide a visual assessment of the patterns related to the sampled areas. However, some univariate and multivariate analyses of the distribution of reptiles amongst the different treatments was undertaken using habitat variables collected at each site and GIS derived variables (these are detailed in chapter 4).

74
Table 7.1. Number of surveys at each site
Site Site Type Cover boards
Total effort in minutes
Number of visits
1 Planting 90 2 2 Planting 60 1 3 Remnant 90 2 4 Planting 90 2 5 Planting 90 2 6 Paddock 60 1 7 Planting 90 2 8 Planting Yes 150 3 9 Planting 150 3 10 Planting Yes 150 3 11 Planting 150 3 12 Planting 150 3 13 Planting 150 3 14 Planting 150 3 15 Remnant 150 3 16 Remnant 150 3 17 Planting Yes 180 4 18 Planting 180 4 19 Paddock 90 2 20 Planting Yes 180 4 21 Planting Yes 180 4 22 Remnant 60 2 23 Planting 90 2 24 Planting Yes 180 4 25 Planting 180 4 26 Paddock 90 2 27 Planting 90 2 28 Remnant 180 4 29 Planting 120 3 30 Planting 120 3 31 Paddock 30 1

75
32 Remnant 90 2 33 Planting Yes 180 4 34 Planting 180 4 35 Planting 90 2 36 Paddock 90 2 37 Remnant 120 3 38 Planting Yes 150 3 39 Remnant 90 2 40 Remnant 90 2 41 Remnant 180 4 42 Planting 60 1 43 Remnant 60 1
Principal Components Analysis (PCA)
Initially, a large number of predictor variables (n = 23) were available for analyses, being based on collected site attributes and GIS derived variables. The number of variables retained for further analyses was reduced through the use of a principal components analysis (PCA) with a variamax rotation, which allowed the retention of “important” variables. Variables were considered to contribute to a principal component factor if the factor loading was greater than 0.7. PCA factors were included if the eigenvalue was greater than 1. Univariate analysis
A generalised linear modelling framework was used to compare differences in species richness and reptile abundance within the range of habitat features. The species richness model used a poisson distribution and the activity model used a Gaussian distribution after a ln(x+1) transformation. Predictor variables were those retained after the running of the PCA. A multi-model inference framework (Burnham and Anderson, 2002) was applied with all possible combinations of the six PCA variables considered, resulting in 63 models. The best set of models was selected using a Akaike’s Information Criterion (AIC) (Akaike, 1973) corrected for small sample sizes (Burnham and Anderson, 2002). Models within 7 AIC points of the best model were considered to form the best set of models as they have support (Burnham and Anderson, 2002). A model averaging approach was then used to derive a final model following the methods described in Burnham and Anderson (2002). Canonical Correspondence Analysis Canonical Correspondence Analysis (CCA) used to examine variation in community data in relation to environmental variables.

76
All analyses were conducted using the R-package v 2.8.1 (R-Development Core Team 2008) in association with the vegan library (Oksanen et al. 2009). 7.3 Results A total of 291 records were made of reptiles through the surveys (Table 7.2), although these will sometimes have been the same animal seen multiple times and a number of times the individual seen could not be identified to species. A total of 18 different species of reptiles were identified during transect surveys. This covered 11 species of skinks, two dragons, one varanid, three snakes and one legless lizard. Thirteen species were represented by no more than three recorded individuals and so most are relatively rare, according to the counts. The vast majority of records were of skinks (274 records), with Morethia boulengeri being the most widely recorded species (77 individuals from 20 sites) followed by Cryptoblepharus virgatus (62 individuals from 11 sites; see Table 7.2).

77
Table 7.2. Reptile species recorded during the surveys
Scientific name Common name No. counted No. sites
Amphibolurus nobbi Nobbi 2 1 Anomalopus leuckartii Two-clawed Worm-skink 24 9 Carlia tetradactyla Southern Rainbow-skink 1 1 Cryptoblepharus virgatus
Cream-striped Shinning-skink 62 11
Ctenotus sp. 1 1 Ctenotus robustus Robust Ctenotus 10 6 Ctenotus taeniolatus Copper-tailed Skink 1 1 Delma inornata Patternless Delma 1 1 Demansia psammophis Yellow-faced Whip Snake 7 5 Dragon Unidentified 1 1 Egernia sp. 3 2 Lampropholis guichenoti
Pale-flecked Garden Sunskink 3 3
Lampropholis sp. 2 2 Lerista bougainvillii South-eastern Slider 1 1 Lerista sp. 2 2 Lygisaurus foliorum Tree-base Litter-skink 4 2 Menetia greyii Common Dwarf Skink 9 4
Morethia boulengeri South-eastern Morethia Skink 77 20
Pogona barbata Bearded Dragon 4 4 Pseudechis guttatus Spotted Black Snake 1 1 Pseudonaja textilis Eastern Brown Snake 1 1 Skink Unidentified 71 25
Reptile Unidentified (probably snake) 1 1
Tiliqua scincoides Eastern Blue-tongue 1 1 Varanus varius Lace Monitor 1 1

78
Frogs were not targeted in this study because as this group cannot be accurately sampled using the survey methods employed. There were no water bodies located within the survey sites that could allow a basic assessment of the frogs present. However, a few frogs were observed opportunistically on transects, generally through the turning of cover under which they were sheltering (Table 7.3). Many more were recorded crossing roads or calling at water bodies after rains and so there are considerably more frogs present than were observed. Table 7.3. Frog species recorded during the surveys (*species recorded on transects)
Scientific name Common name No. counted No. sites
Litoria caerulea* Green Tree Frog 3(2*) 2(2*) Litoria dentata Bleating Tree Frog 4 4 Litoria peronii Peron's Tree Frog 1 1 Litoria rubella Desert Tree Frog 0 NA Limnodynastes fletcheri Long-thumbed Frog 1 1
Limnodynastes ornatus Ornate Burrowing Frog 1 1
Limnodynastes tasmaniensis Spotted Grass Frog 6 5 Uperoleia laevigata Smooth Toadlet 0 NA
Three additional reptile species were located opportunistically outside of transects when travelling between sites (Table 7.4). Of these only the carpet python is likely to be found in wooded areas. The other two species would not be expected in the remnants or plantings as they prefer open grassy habitats or water in the case of the turtle.

79
Table 7.4. Incidental reptile species
Scientific name Common name No.
Counted No. sites
Chelodina longicollis* Eastern Snake-necked Turtle 0 NA
Morelia spilota Carpet Python 0 NA Tympanocryptis tetraporophora
Four-pored Earless Dragon 0 NA
There was a difference in the species richness across the four site types searched. State Forests (large remnants) had the largest number of species, followed by other remnants, plantings and finally paddocks, where no reptiles were ever recorded (Fig. 7.1). Abundance per hour of survey effort showed the medians of the remnants and forests as similar, with both supporting great numbers of reptiles than the plantings and the reptile-free paddocks (Fig. 7.2).
Fig. 7.1. Species richness and Fig. 7.2. Reptile abundance and site type site type Principal Components Analysis The first 6 PCA factors explained 84% of the variation in the dataset (Fig. 7.3). Loadings for the PCA factors are presented in Table 7.5. PCA1 relates negatively to remnant structure; specifically the number of remnant trees and
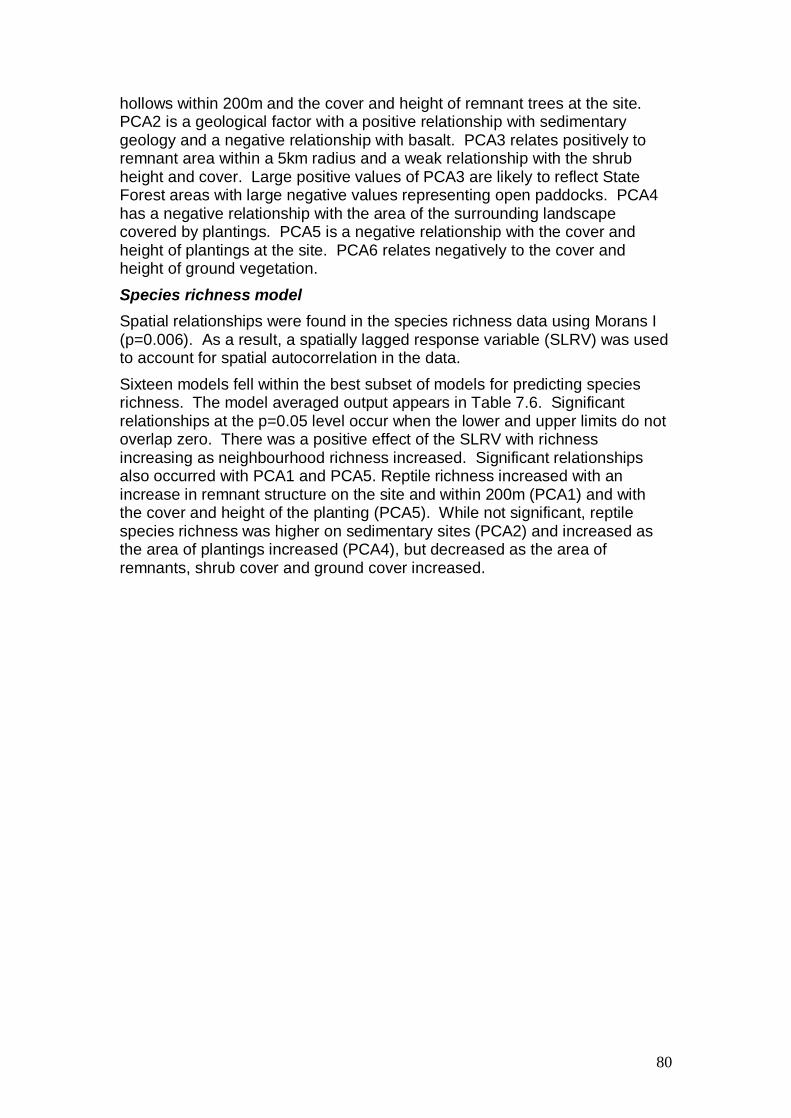
80
hollows within 200m and the cover and height of remnant trees at the site. PCA2 is a geological factor with a positive relationship with sedimentary geology and a negative relationship with basalt. PCA3 relates positively to remnant area within a 5km radius and a weak relationship with the shrub height and cover. Large positive values of PCA3 are likely to reflect State Forest areas with large negative values representing open paddocks. PCA4 has a negative relationship with the area of the surrounding landscape covered by plantings. PCA5 is a negative relationship with the cover and height of plantings at the site. PCA6 relates negatively to the cover and height of ground vegetation. Species richness model Spatial relationships were found in the species richness data using Morans I (p=0.006). As a result, a spatially lagged response variable (SLRV) was used to account for spatial autocorrelation in the data. Sixteen models fell within the best subset of models for predicting species richness. The model averaged output appears in Table 7.6. Significant relationships at the p=0.05 level occur when the lower and upper limits do not overlap zero. There was a positive effect of the SLRV with richness increasing as neighbourhood richness increased. Significant relationships also occurred with PCA1 and PCA5. Reptile richness increased with an increase in remnant structure on the site and within 200m (PCA1) and with the cover and height of the planting (PCA5). While not significant, reptile species richness was higher on sedimentary sites (PCA2) and increased as the area of plantings increased (PCA4), but decreased as the area of remnants, shrub cover and ground cover increased.

81
Fig. 7.3. Cumulative variation explained by PCA factors with eigenvalues greater than 1. Abundance model No spatial relationships were found to exist in the abundance data (p=0.844) and therefore no SLRV was calculated. Sixteen models fell within the best subset of models for predicting reptile abundance. The model averaged output appears in Table 7.7. Significant relationships were seen with PCA1 and PCA2. Abundance increased with remnant structure and on sedimentary sites compared with the basalt sites. While not significant, abundance of reptiles decreased as remnant area and shrub cover increased. In addition, abundance increased as planting area in the landscape and planting structure increased (PCA 5) and ground cover decreased (PCA6).

82
Table 7.5. Loadings for the PCA factors. Ones in bold have loadings greater than 0.7
PCA1 PCA2 PCA3 PCA4 PCA5 PCA6
Position -0.34 0.653 -0.115 -0.187 Number of residual trees < 200m -0.909 -0.155 0.198
Number of hollows <200m -0.738 0.192 0.279 0.251 Residual tree cover -0.904 0.134 -0.189 0.202 Residual tree height -0.884 0.142 -0.138 Plantation cover 0.293 0.143 -0.129 0.119 -0.851 Plantation height 0.284 0.252 -0.173 -0.861 Shrub cover -0.382 0.186 0.615 -0.399 0.319 0.168 Shrub height -0.311 0.142 0.693 -0.378 0.311 Ground cover 0.212 0.107 -0.109 0.281 -0.842 Ground height -0.245 -0.192 0.218 -0.31 -0.645 RemArea5000 -0.168 0.306 0.798 0.156 0.259 RemArea0500 -0.54 0.174 0.437 -0.305 0.315 0.282 SizeOf0500Rem -0.396 0.128 0.67 -0.32 0.252 0.113 PlantArea0500 0.23 0.148 0.892 PlantingEdgeRatio 0.104 -0.122 -0.188 0.864 -0.103 Bas0500 -0.974 Sed0500 0.974 BasP -0.965 0.141 SedP 0.965 -0.141 Elev -0.322 -0.148 -0.64 -0.299 0.369
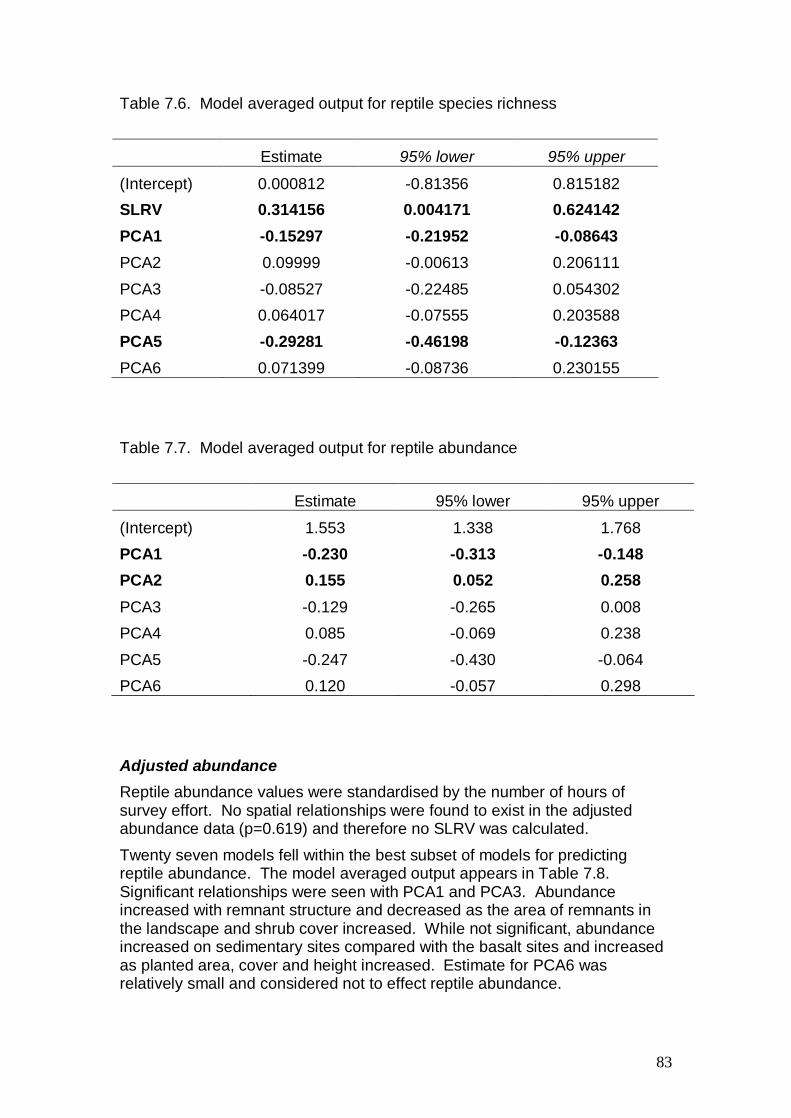
83
Table 7.6. Model averaged output for reptile species richness
Estimate 95% lower 95% upper
(Intercept) 0.000812 -0.81356 0.815182 SLRV 0.314156 0.004171 0.624142 PCA1 -0.15297 -0.21952 -0.08643 PCA2 0.09999 -0.00613 0.206111 PCA3 -0.08527 -0.22485 0.054302 PCA4 0.064017 -0.07555 0.203588 PCA5 -0.29281 -0.46198 -0.12363 PCA6 0.071399 -0.08736 0.230155
Table 7.7. Model averaged output for reptile abundance
Estimate 95% lower 95% upper
(Intercept) 1.553 1.338 1.768 PCA1 -0.230 -0.313 -0.148 PCA2 0.155 0.052 0.258 PCA3 -0.129 -0.265 0.008 PCA4 0.085 -0.069 0.238 PCA5 -0.247 -0.430 -0.064 PCA6 0.120 -0.057 0.298
Adjusted abundance Reptile abundance values were standardised by the number of hours of survey effort. No spatial relationships were found to exist in the adjusted abundance data (p=0.619) and therefore no SLRV was calculated. Twenty seven models fell within the best subset of models for predicting reptile abundance. The model averaged output appears in Table 7.8. Significant relationships were seen with PCA1 and PCA3. Abundance increased with remnant structure and decreased as the area of remnants in the landscape and shrub cover increased. While not significant, abundance increased on sedimentary sites compared with the basalt sites and increased as planted area, cover and height increased. Estimate for PCA6 was relatively small and considered not to effect reptile abundance.

84
Table 7.2. Model averaged output for standardised reptile abundance
Estimate 95% lower 95% upper
(Intercept) 1.095 0.919 1.271 PCA1 -0.191 -0.258 -0.123 PCA2 0.041 -0.036 0.118 PCA3 -0.117 -0.229 -0.005 PCA4 0.122 -0.010 0.253 PCA5 -0.116 -0.262 0.030 PCA6 0.049 -0.079 0.178
Multivariate analysis
Both non-metric multidimensional scaling and generalised dissimilarity modelling were attempted on the data, but it was found that the analyses were highly unstable with the removal of single sites or single variables resulting in significant changes in the output of the analysis. For this reason, these analyses are not included. Canonical Correspondence Analysis
CCA used to examine variation in community data in relation to environmental variables. Geographic co-ordinates and elevation (XYZ) values were partialled out in the analysis and were found to explain 8.2% of the variation in the dataset. Six environmental variables were included in the final CCA model (Fig. 7.4). Variables included one plantation variable, three remnant vegetation variables, ground cover and moisture rating. These environmental variables explained 27.6% of the variation in the data.

85
Fig. 7.4. CCA plot for the reptile community data 7.4 Discussion The first aim of the study was to compare the relative value of 4-6 year old eucalypt plantations with other available habitat in the area, and so attempt to validate if the results and conclusions of the Albury-Wodonga study (Kavanagh et al 2005) can be applied to a broader scale. The results of this study mirror closely those found for the Albury-Wodonga study, suggesting reptile responses to retained habitats and plantings are relatively universal along the western slopes of NSW. In both studies, comparisons of the reptiles present in the plantations with those present in paddocks used for grazing and intensive cropping, and in remnant woodlands indicate that the patches of remnant woodland provide the best habitat for reptiles. The numbers of different species using plantings and the mean numbers of individuals detected within plantings was lower than in the remnants, however plantings are far superior to cleared and grazed paddocks where no reptiles were ever recorded. As found at Albury, reptile abundance was notably greater in the remnants. Results from the current study also indicate that presence of larger and older trees provides better reptile habitat and that the presence of more retained vegetation or plantings, and so more woodland,

86
increases reptile abundance and diversity. Where plantings are undertaken to increase biodiversity, there can be confidence that there will be an increase in reptile abundance and diversity, although the extent of that increase may be variable. The reduced number of reptiles in plantings appears to be in large part partly due to the reduced level of ground cover available. There is considerably more coarse woody debris present in remnants and most reptiles were located on or under this material during the transect searches. There were also more grass tussocks present in remnants where grazing is generally less intense and these also provide significant cover for some of the small skinks. It was apparent during surveys of plantings that reptiles were far more likely to be located where piles of leaves from the planted trees had accumulated, providing most of the little available cover for shelter by skinks. The presence of Cryptoblepharus virgatus was strongly dependent on the presence of large old trees with hollows and exfoliating bark or large numbers of dead trees on the ground. The presence of ground cover for shelter appears to be critical for small reptiles and this is totally absent from paddocks and essentially absent from many plantings that remain grazed. Site preparation prior to plantings generally results in the clearing of all downed woody material, rocks and old dead or live trees to minimise the difficulties in planting seedlings and maximise the available area for plantings. Hence, where the presence of reptiles in plantings is considered of value, the deliberate retention of cover such as rocks or old woody debris will be of great value. In addition, retaining planted trees that die adds considerably to the available habitat complexity, rather than them being removed. Grazing remains an important issue in the ability of plantings to maintain populations of reptiles. Heavy grazing has been identified to be detrimental to reptiles (Smith et al. 1996, Woinarski and Ash 2002 and James 2003), either by decreasing abundance or diversity of reptile species. However, other studies have found some reptiles to be little impacted by grazing (e.g., James 2003, Read 2002) and Morton (1990) suggested that many reptiles have been resilient to grazing due to their metabolic efficiency and non-herbivorous nature. The results of this study suggest that heavy grazing is likely to be detrimental to many reptiles and has had a major impact on reptiles in the region. Ground cover of all types was almost completely absent in many sites and its absence appeared to lead to the absence of many of the small skinks. Species able to use standing trees as cover may better tolerate such effects. Patch size appears to be of importance in to reptile maintenance as larger reserves in the Quirindi area clearly had larger numbers of more diverse reptiles. Species dependent on forest or woodland resources are unlikely to cross cleared lands to reach new areas or exchange populations leaving larger retained patches as the best long-term habitat. The effects though are species specific. Anderson and Burgin (2002) noted that there were different impacts of fragmentation edges on the three skinks they studied. One was most prevalent in the interior of a patch, one at the edge and one scattered through, but with the adults and juveniles more prevalent in the middle and subadults on the outside. The high edge to core ratio of very small patches or thin strips, which are typical of plantings, is unfavourable habitat for two species, but may favour the third. Plantings that are “attached” to areas of

87
retained vegetation appear to provide the best habitat for reptiles as they are connected to more secure habitats that reptiles can migrate to and from and they increase patch size to maintain larger populations. They also provide a different type of habitat to remnants and so increase habitat heterogeneity, perhaps providing the habitat preferred by species that prefer more open edge areas.

88
8. Habitat supplementation within plantations and its effects on wildlife occupancy 8.1 Introduction Two critical resources that are typically absent or scarce in plantations are tree hollows and dead wood on the ground. The short rotation cycles of plantations precludes the formation of hollows in eucalypts, which take more than 100 years to form and that are a critical resource for many species of fauna (Tyndale-Biscoe and Calaby 1975, McIllroy 1978, Mackowski 1984, Smith and Lindenmayer 1988, Scotts 1991, Traill 1991, Gibbons and Lindenmayer 2002). Retained native vegetation is probably the best source of hollows and it also provides a self-sustaining system that could allow the recruitment of new hollow-bearing trees in the future. However, in agricultural or degraded areas where retained vegetation is absent, rare or composed primarily of young regrowth, mature, isolated paddock trees may provide the only locally available hollows (Law et al. 2000). In areas where there is an absence or very few hollow-bearing trees, provision of nest boxes could provide an artificial refuge for many species, thus increasing the biodiversity value of plantations. At least seven species of possums and gliders are known to use nest boxes (Menkhorst 1984), in addition to bats and many birds that require hollows (e.g. parrots). Nest boxes have been used successfully at sites where forests have been re-established, such as the Tower Hill Game Reserve (Suckling and Macfarlane 1983) and the Organ Pipes National Park (Irvine and Bender 1995), both in Victoria. In a recent review, Beyer and Goldingay (2006) recognised three management applications of nest boxes: 1) species introduction, 2) support of populations of endangered species, and 3) strategic placement such as to enhance habitat connectivity. In relation to this last point, nest boxes have been placed in plantations on farmland to potentially attract mammal species that eat insect pests (Smith and Agnew 2002). Although this form of enhancement has considerable potential for increasing the diversity of hollow-dependent species in tree plantations, experimental studies that test the extent of colonisation are lacking. The provision of dead wood or artificial ground cover should benefit many species of ground dwelling animals. There is a close association between many species of reptiles and small mammals with logs on the ground (Nichols and Bamford 1985; Webb 1985; Dickman 1991; Brown and Nelson 1993; Halliger 1993; Catling and Burt 1995). Dead and dying wood provides a foraging resource for many species of insectivorous birds (Recher et al. 1985). This resource is also likely to play a significant role in enhancing the species richness of the greatest contributor to biodiversity – the invertebrates.

89
Our aim was to establish a long-term, rigorous field experiment to test the effect of supplementing plantings with artificial habitat in the form of nest boxes and ground cover, using a before and after comparison. We predicted that the addition of nest boxes/ground cover will increase the relative abundance of targeted fauna species within the supplemented plantations in relation to paired control plantations. Artificial cover was inspected once within 12 months of installation to confirm the suitability of the boxes/ground cover for different species and the extent and range of use by fauna. Tests of our hypothesis will require further inspections and surveys in coming years. 8.2 Methods There are a range of factors that could be used to select sites for habitat supplementation, including the planting’s size, shape, proximity to remnant vegetation and an index of the site’s isolation (amount of remnant vegetation in a 5 km radius surrounding the site). We considered the most important factor to be the local neighbourhood, which accounts for the local availability and maturity of remnant vegetation and geology. Accordingly, we used a paired approach, so that each manipulated site was paired with, where possible, a nearby control site (i.e. in the same neighbourhood), so that both sites had a similar opportunity of being colonised by a similar suite of species. As far as possible, we also matched sites so that size, shape and isolation were similar. Roughly equal numbers of plantings were allocated to distant or nearby to remnant vegetation. From the original number of sites surveyed we identified eight that were suitable for supplementation and that had a suitable pair to be used as control, giving 16 sites in total. One exception was the matching of two sites distant from each other, although these sites were similar in size, shape and isolation. Boxes were also added to one additional 2 ha planting, which did not have a suitable matching pair. The list of paired sites with the site’s attributes is provided in Table 8.1. Nest boxes Three nest box designs were added to the plantings. One was designed specifically for bats (Fig 8.1), one was designed with multiple compartments to attract different species, including parrots, gliders, bats and smaller arboreal fauna (the “apartment” – Fig 8.2), and one larger design (cavern) targeted possums and owls. Boxes were installed individually at the top of termite resistant cypress posts obtained from thinning operations by Forests NSW in a nearby state forest. Posts were 4 m long, 14-16 cm diameter at the butt end, with the bark left in place. Boxes were positioned 3 m high after the posts were dug into the ground. The density of boxes was held constant across sites, but given the very different sizes of plantings, we restricted the installation of boxes to 10 ha in each site. For example, boxes were installed throughout a 10 ha planting (Fig 8.3), but in only a portion of larger plantings. Generally, the density of boxes added was as follows; bat boxes 1.5 per ha, apartment boxes 3 per ha and owl boxes 0.5 per ha. For the smallest plantings (2 ha), the number of boxes was reduced proportionately in relation to its area. Across all nine

90
manipulated sites 343 sites were added in total. The exact number of boxes added per site is provided in Table 8.2. All nest boxes were inspected systematically on a single occasion (17/03/2008 -20/03/2008). Preliminary Inspections of nest boxes at some sites occurred in December 2008. Compartment boxes were checked by removing them from the post and inspecting each cavity individually using an inspection camera with light and flexible head (Rigid SeeSnake micro). Bat boxes were not removed from the post and were checked by extending the inspection camera or by shinning a light up into the bottom entrances. Cavern nest boxes were not removed for inspection and were checked by adding an extension piece to the camera and placing this into the box entrance. Animals were not captured, but were identified by visual observation only.
Fig. 8.1. Bat box design

91
Box constructed of pallet ply (12-15 mm) for side walls. These are 300x1200 mm (4 boxes per sheet).
Front wall and structural internal walls made of 35x90 mm rough sawn pine or cheap hardwood. (1200+240+180+180mm)
Other internal walls made of recycled solid timber board 19x90 mm. (420+290+235 +235+200+200mm)
Lid made of 17 mm form ply. Overhangs front and sides of box to reduce water and wildlife damage. (~400*150mm)
Four strength critical points to be fixed with screws on each side (8 screws ~40 mm). (circles)
All vertical timber pieces to be glued with weatherproof adhesive.
Nails in points indicated (stars and arrows).
Cavities namedF1, R1, R2, R3, R4, R5.
Apartment Box (cross-section) with cutting list
25mm hole
Post
50 mm hole
F1
R1
R5
R4
R3
R2
Fig. 8.2 Apartment box design

92
Fig 8.3. Nest box layout

93
Table 8.1. Site details for the habitat supplementation experiment showing eight site pairs, half of which were supplemented with artificial habitat and the other half were retained as controls.
Pair #
Site
number
Area
(ha) Size Shape
Proximity to remnant (> 10 ha)
Surrounding Remnant
Area
Supplemented
1 2 17 large patch < 500 m 276
2 4 17 large linear > 500 m 288
3 8 10 small linear > 500 m 6
4 10 16 large patch > 500 m 1230
5 38 29 large patch < 500 m 1069
6 20/21 6 small linear > 500 m 331
7 24 29 large patch > 500 m 499
8 33 11 small patch < 500 m 369
9 17 2 small patch < 500 m 596
Controls
1 1 8 small patch < 500 m 323
2 5 19 large patch > 500 m 71
3 7 4 small patch > 500 m 29
4 11 9 small patch < 500 m 882
5 12 41 large patch < 500 m 1642
6 29/30 6 small linear > 500 m 515
7 18 23 large patch > 500 m 409
8 34 5 small patch > 500 m 364

94
Table 8.2: Number of boxes with different designs added to each plantation site.
Site Apartment Bat Cavern Total
4 30 15 5 50
8 30 15 5 50
10 30 15 5 50
17 6 3 1 10
20 13 5 2 20
21 5 6 2 13
24 30 15 5 50
33 30 15 5 50
38 30 15 5 50
Total 204 104 35 343
Ground cover Habitat supplementation for reptiles was provided in the form of a grid of “woody” cover placed in eight of the plantings. The grid consisted of 25 cover “stations” arranged in five rows of five stations each. Each station was made up of five or six 100 cm X 10 cm X 1 cm wooden planks placed edge to edge to form a rectangle of cover for reptiles. The planks sometimes overlapped and provided cracks that reptiles could move through to reach the relative safety of the area under the boards. These boards were placed in the plantings between 12th and 13th of May 2008. To check the stations, they were approached slowly to observe any reptiles on or immediately adjacent to them. The boards were then turned over one at a time to look for individuals sheltering below them. These boards were checked at the same time as the visual and hand searches were being conducted, with reptiles associated with the boards being specifically identified. The survey methods used to count reptiles in these plantings have already been described in the section on reptiles and frogs. Each planting provided with supplemental habitat was surveyed twice after the addition of the boards. Cover boards were inspected in March 2009 and September 2009. 8.3 Results The addition of nest boxes provided otherwise missing tree hollow resources for two species of bats, two species of marsupials, two species of parrot and tree frogs (Table 8.2). Invertebrates also made extensive use of all kinds of boxes provided. The Common Starling, an unwelcome pest species, made extensive use of apartment boxes (the F1 cavity; Fig. 8.2). Of interest was the widespread use of nest boxes by supposedly terrestrial species (e.g. Common Dunnart and House Mouse). Sugar Gliders were used the majority of available boxes on the one site where they occurred (site 33).

95
Table 8.2. Number of nest-box compartments used by hollow-dwelling fauna in eucalypt plantations
Species Apartment Bat Cavern Total
Wasp 47 12 1 59 Ants 34 32 Other insects 4 8 12 Spider 253 105 7 363 Litoria caerulea 1 1 Litoria peroni 1 1 Unidentified frog (scats) 5 5 Cryptoblepharus sp. 4 3 Pogona barbata *1 *1 2 Unidentified reptile (scats) 1 1 Eastern Rosella 3 3 Red-rumped Parrot 4 4 Common Starling 68 68 Unidentified Bird (down) 20 1 20 Common Dunnart 4 1 5 Sugar Glider 23 1 22 Lesser Long-eared Bat 8 13 21 Gould’s Wattled Bat 1 9 10 Unidentified Bat (scats) 10 1 11 House Mouse 10 10 Black Rat 5 5 Unidentified mammals (scats) 19 19 Unidentified vertebrate sign 14 1 14
Bats were recorded in 30 boxes (76 % in bat boxes) from seven of the eight experimental sites. The one site where bats did not use boxes was a large, isolated linear planting (site 4). Two species were identified using boxes. Gould’s Wattled Bat Chalinolobus gouldii was recorded from 10 boxes across four sites and Lesser Long-eared Bat Nyctophilus geoffroyi was recorded from 21 boxes across six sites.

96
Fig. 8.4. Nyctophilus geoffroyi in a bat box The rate of uptake of nest-boxes by fauna was high (Table 8.3), with apartment boxes used by a wide range of species. Some boxes were not checked because they had been dislodged from their post. Table 8.3. Overall use of the three types of nest boxes by invertebrates and vertebrates.
Boxes Apartment Bat Cavern
Percent used by invertebrates 80% 89% 24% Percent used by vertebrates 76% 24% 21% Total nest-boxes checked 269 100 33
The use of nest-boxes established on planted sites was influenced by proximity to remnant vegetation. Site 4, which was distant from remnant vegetation had a low uptake by fauna (Table 8.4). Site 17 also had a low uptake, but this site was only 2 ha in size and hence had only 10 nest-boxes established.

97
Table 8.4. Vertebrate use of nest boxes as cavities used by site.
Species\Site 4 8 10 17 20 21 24 33 38 Total
Litoria caerulea 1 1 Litoria peronii 1 1 Unknown frog 5 5 Pogona barbata 1 1 2 Cryptoblepharus sp. 2 2 4 Unknown reptile 1 1 Red-rumped Parrot 2 1 1 4 Eastern Rosella 1 2 3 Common Starling 19 27 9 3 10 68 Unknown bird 1 3 1 7 9 21 Common Dunnart 1 3 1 5 Sugar Glider 24 24 Gould's Wattled Bat 4 2 3 1 10 Lesser Long-eared Bat 3 3 5 5 2 3 21 Unidentified bat 10 1 11 House Mouse 7 1 1 1 10 Black Rat 5 5 Unknown mammal 1 3 3 2 10 19 Unknown vertebrate 7 1 1 1 4 1 15
Cavity occupation 8% 18% 23% 2% 35% 30% 17% 18% 15% 19%
Ground cover 70% (21/30) of the reptiles seen on transects with boards were found on or under the boards. Three species were commonly found under or on the cover boards (Morethia boulengeri, Demansia psammophis and Anomalopus leuckartii). Three species not associated with the boards but located on transects with boards were Ctenotus taeniolatus, Ctenotus robustus and

98
Cryptoblepharus virgatus. The control sites had an abundance of 25 animals before the placement of the cover boards and 15 animals after. The cover sites had 13 animals before and 30 animals after the placement of the boards. The species richness for the control sites was seven before the board placement and six after board placement. For the cover sites species richness was six prior to the board placement and nine after the placements of the cover boards. It was notable that even larger reptiles such as whip snakes (Demansia psammophis) and bearded dragons (Pogona barbata) were recorded under the boards. There was no statistical difference in species richness or reptile abundance between the control sites and the sites with cover boards (Fig. 8.5, Fig. 8.6).
Fig. 8.5. Reptile abundance in Fig. 8.6. Species richness in plantings plantings 8.4 Discussion Initial inspections of the nest boxes revealed use by a wide range of fauna. The rapid colonisation of this artificial shelter ranged from species with high mobility (birds and bats) to less mobile ground mammals, frogs and invertebrates. Nest box uptake was limited by proximity to remnant populations by some species such as the Sugar Glider. The two species of bats using nest boxes are well known for roosting in artificial structures, such as nest boxes, including those placed in plantations

99
(Smith and Agnew 2002, Beyer and Goldingay 2006). Both of these bats will roost in a variety of structures, including under bark, although hollows are preferred sites for raising young in maternity roosts (Lumsden et al. 2002b). Notably, none of the N. geoffroyi radio-tracked prior to nest box installation were found to roost within plantations. It remains to be seen if, and how quickly, other bat species begin to roost in the nest boxes. Whether the provision of artificial roost sites will increase the activity and species richness of bats beyond that previously recorded, which was at a level similar to surrounding paddocks, will need to be revealed by future surveys of this experiment. The potential to restore habitat through the introduction of artificial cover cannot yet be fully assessed as insufficient time has passed to provide a conclusive indication of population and community changes. However, the initial indications are that artificial habitat restoration can provide significant opportunities to accelerate the colonisation or increase the use of plantings by reptiles. The diversity of reptiles found using plantings with boards was significantly greater than in plantings without this supplemental habitat. The number and diversity of reptiles present in plantings increased substantially after the introduction of the cover boards. This could possibly be a result of the reptiles already in the planting congregating around the boards and so being more “countable” without increasing the actual numbers present. However this would seem unlikely and it still suggests that the boards were providing new and better habitat to move to. In general, there was minimal ground cover present within plantings. The presence of a fallen sapling, a retained old tree or an accumulation of leaves left a focal point to locate reptiles when boards were not present and almost all small reptiles, and particularly skinks, were located associated any available cover. If there was no cover there were no reptiles in the plantings as exemplified by the total absence of reptiles in cleared paddocks. So, introducing woody debris or grass cover (or any artificial cover for that matter) provides cover that is otherwise absent and can be used to greatly improve the value of the planting to reptiles. An important question is how much cover is required to start improving the habitat in plantings and how much would be needed to lead to a planting being as rich in reptiles as in remnants, if that is possible. The former is straightforward as essentially any cover added is valuable as there is usually no cover. In plantings where some rocks or debris have been retained, the inclusion of larger woody debris is probably of most importance as this likely provides better refuge habitat from predators and dry conditions. During the drought conditions prevalent during the Albury-Wodonga study, nearly all reptiles encountered in the latter part of the study were associated with large woody material found in remnants (Kavanagh et al. 2005) and so this is very important habitat to provide. The smaller skinks were apparently quite willing to use the small boards, but even snakes and dragons were found under the boards and so smaller debris can be of value to most reptiles. The arrangement used of a five by five grid of five cover planks provides a good starting point to improve habitat, but it is unknown if this level of added cover is sufficient cover for a sustainable population of small skinks. Clearly, this arrangement provides a much smaller amount of material compared to what is

100
found in the remnants where it was estimated that at least 10 times the amount of debris was available with much of this being in the form of larger logs. The potential to put in place a typical level of forest debris may be prohibitively expensive. Therefore, a preferable option is to retain all possible cover at the time of planting on planted sites thus leaving the maximum cover possible to benefit wildlife. The addition of cover boards contributed to an increase in abundance and diversity of reptiles found in tree plantations. Both forms of habitat supplementation (nest boxes and ground cover) will require further inspections and surveys in coming years to fully test the experiment’s hypotheses.
Fig. 8.7. A Sugar Glider inhabiting an apartment box on site 33.

101
9. Acknowledgements This project began as a NSW State Government initiative to establish 400 ha of commercial eucalypt plantations in a predominantly agricultural region (the Liverpool Plains of northern NSW). The objectives of the project were to demonstrate the role that tree plantings can play in reducing salinity, in providing a viable alternative industry (timber) for rural landowners, and in restoring habitat for wildlife in an intensively farmed landscape. This study addressed the last objective. Brian Royal (Forests NSW) undertook the task of assessing the best opportunities for tree planting on the Liverpool Plains to achieve these objectives and subsequently established joint-venture agreements with all of the landholders involved in this study. Steve Dobson (Forests NSW) liaised with landholders and contractors to ensure that all plantations were established according to plan. Peter Walsh (Forests NSW) also assisted with project management and liaison during the establishment phase of this study. The following landowners are sincerely thanked for their participation and enthusiastic support for the study, and for their generous co-operation in permitting access to researchers at all hours of the day and night: Colin and Barbara Atkinson, David Brownhill, Ian and Marilyn Carter, Brian Cobcroft, Geoff Colbourn, James and Jacquie Crossing, David and Wendy Cudmore, Sandy and Carmen Cudmore, Andrew and Vanessa Cunliffe, Robert and Edwina Duddy, Ian and Ali Hall, Ted Homer, Neil and Sharon Jackson, John and Noreen Malden, Linda Malden, Jim and Katrina McDonald, Ken and Sue McLennan, John Smith, Geoff and Til Symonds and Ted Wilkinson. Farm Managers Glen Eade, Joe Fleming, Will and Gareth are thanked for their kind assistance. Excellent scientific support was provided by wildlife consultants Stephen Debus, Andrew C. M. Smith and Graham Turner. We would also like to thank volunteers Sonia and Daniel Chidel and Anja Klingenböck for their help. Gerhard Kortner kindly loaned data loggers to assist with radio-tracking bats. The habitat supplementation component of this study was a major undertaking that is not expected to realise its full potential for some years. It is our intention to continue assessments of the rate of uptake by fauna in habitat-supplemented areas. We thank Matt de Jongh (Forests NSW) for harvest planning and liaison to supply the hundreds of White Cypress Pine poles needed to support nest boxes in designated eucalypt plantation study sites. Local sawmiller, Chris Austin, undertook the cutting and transport of these poles, and he also provided, at considerably reduced cost, a supply of wooden palings to serve as ground cover for small vertebrates. Steve Dobson (Forests NSW) and Andrew Laurie (local fencing contractor) erected all of the poles for the nest boxes. Finally, we would like thank Chris Standalost, Neil Rodgers and James Warwick (supervisors at Parramatta Correctional Centre) who co-ordinated and oversaw the construction of 450 nest boxes, including a range of unusual designs.

102
All research was carried out under scientific licences provided by the Department of Environment, Climate Change and Water and by the Department of Primary Industries - Forests NSW Animal Care and Ethics Committee.

103
10. References Akaike, H. (1973). Information theory as an extension of the maximum
likelihood principle. Second International Symposium on Information Theory (eds B. N. Petrov and F. Csaki), pp. 267-281. Akademiai Kiado, Budapest.
Andersen, A.N., Penman, T.D., Debas, N. and Houadria, M. (2009). Ant community responses to experimental fire and logging in a eucalypt forest of south-eastern Australia. Forest Ecology and Management 258, 188-197.
Anderson, L. and Burgin, S. (2002). Influence of woodland remnant edges on small skinks (Richmond, New South Wales). Austral Ecology 27, 630-37.
Andrén H. (1994). Effects of habitat fragmentation on birds and mammals in landscapes with different proportions of suitable habitat: a review. Oikos 71, 355–66.
Barrett, G.W., Silcocks, A.F., Cunningham, R., Oliver, D.L., Weston, M.A., and Baker, J. (2007). Comparison of atlas data to determine the conservation status of bird species in New South Wales, with an emphasis on woodland-dependent species. Australian Zoologist 34, 37–77.
Bennett, A.F. and Ford, L.A. (1997). Land use, habitat change and the conservation of birds in fragmented rural environments: a landscape perspective from the Northern Plains, Victoria, Australia. Pacific Conservation Biology 3, 244–61.
Bennett, A.F., Radford, J.Q. and Haslem, A. (2006). Properties of land mosaics: implications for nature conservation in agricultural environments. Biological Conservation 133, 250–264.
Beyer, G.L. and Goldingay, R.L. (2006). The value of nest boxes in the research and management of Australian hollow-using arboreal marsupials. Wildlife Research 33, 161-174.
Brigham, R.M., Francis, R.L. and Hamdorf, S. (1997). Microhabitat use by two species of Nyctophilus bats: a test of ecomorphology theory. Australian Journal of Zoology 45, 553-60.
Brower, J.E., Zar, J.H. and von Ende, C.N. (1990). Field and Laboratory Methods for General Ecology. Wm. C. Brown Publishers, USA.
Brown, G.W. and Nelson, J.L. (1993). Influence of successional stage of Eucalyptus regnans (Mountain Ash) on habitat use by reptiles in the Central Highlands, Victoria. Australian Journal of Ecology 18, 405-417.
Burnham, K.P. and Anderson, D.R. (2002). Model Selection and Multimodel Inference: A Practical Information-Theoretic Approach. Springer, New York.

104
Campbell, S., Lumsden, L., Kirkwood, R., and Coulson, G. (2005). Day roost selection by female little forest bats (Vespadelus vulturnus) within remnant woodland on Phillip Island, Victoria. Wildlife Research 32, 183-91.
Catling, P.C. and Burt, R.J. (1995). Studies of the Ground-dwelling Mammals of Eucalypt Forests in South-eastern New South Wales: the Effect of Habitat Variables on Distribution and Abundance. Wildlife Research 22, 271-288.
Churchill, S. (2008). Australian Bats. New Holland Publishers, Sydney. Claridge A.W., Mifsud G., Dawson J. and Saxon M.J. (2004). Use of infrared
digital cameras to investigate the behaviour of cryptic species. Wildlife Research 31, 645–650.
Clarke, K.R. (1993). Non-parametric multivariate analyses of changes in community structure. Australian Journal of Ecology 18, 117-143.
Clarke, K.R. and Gorley, R.N. (2006). PRIMER v6, User Manual/Tutorial. Primer-E Ltd, Plymouth, UK.
Cogger, H.G. 2000. Retpiles and Amphibians of Australia. Reed-New Holland Press, Sydney.
Cunningham, R.B, Lindenmayer, D.B., Crane, M., Michael, D. and MacGregor, C. (2007). Reptile and arboreal marsupial response to replanted vegetation in agricultural landscapes. Ecological Applications 17, 609-619.
Dickman, C.R. (1991). Use of trees by ground-dwelling mammals: implications for management. Pp. 125-36 in Conservation of Australia's forest fauna, ed. by D. Lunney. R. Zool. Soc. N.S.W., Mosman.
Fahrig, L. (2001). How much habitat is enough? Biological Conservation 100, 65–74.
Ferrier, S. and Guisan, A. (2006). Spatial modelling of biodiversity at the community level. Journal of Applied Ecology 43, 393-404.
Ferrier, S., Drielsma, M., Manion, G. and Watson, G. (2002). Extended statistical approaches to modelling spatial pattern in biodiversity in northeast New South Wales. II. Community -level modelling. Biodiversity and Conservation 11, 2309-2338.
Ferrier, S., Manion, G., Elith, J. and Richardson, K. (2007). Using generalized dissimilarity modelling to analyse and predict patterns of beta diversity in regional biodiversity assessment. Diversity and Distributions 13, 252-264.
Foley, J.A., DeFries, R., Asner, G.P., Barford, C., Bonan, G., Carpenter, S.R. et al. (2005). Global consequences of land use. Science 309, 570-574.
Ford, H.A., Barrett, G.W., Saunders, D.A., and Recher, H.F. (2001). Why have birds in the woodlands of southern Australia declined? Biological Conservation 97, 71–88.
Gannon, W.L., O’Farrel, M.J. Corben, l.C. and Bedrick, E.J. (2004). Call character lexicon and analysis of field recordings of bat echolocation

105
calls. Pp. 478-484 in Echolocation in bats and dolphins (J.A. Thomas, C.F. Moss and M. Vatar, eds.). The University of Chicago Press, Chicago, 604 pp.
Gibbons, P. and Lindenmayer, D.B. (2002) Tree hollows and wildlife conservation in Australia. CSIRO Publishing.
Gibson, M. and Lumsden, L. (2003). The Anascheme automated bat call identification system. The Australasian Bat Society Newsletter 20, 24-6.
Goldney, D.C., and Bowie, I.J.S. (1990). Some management implications for the conservation of vegetation remnants and associated fauna in the central western region of New South Wales. Proceedings of the Ecological Society of Australia 16, 427–440.
Halliger, M. (1993). Reptiles on regenerating mine sites in western. New South Wales. Pp. 327-332 in Herpetology in Australia a diverse discipline, ed. By D. Lunney and D. Ayers. Transactions of the Royal Zoological Society of New South Wales.
Herr, A., Klomp, N.I. and Atkinson, J.S. (1997). Identification of bat echolocation calls using a decision tree classification system. Complexity International, 4, URL http://www.csu.edu.au/ci/vol4/herr/batcall.html
Hobbs R.J. (1993). Can revegetation assist in the conservation of biodiversity in agricultural areas? Pacific Conservation Biology 1, 29–38.
Irvine, R. and Bender R. (1995). Initial Results from Bat Roosting Boxes at organ Pipes National Park. The Vic. Nat. 112(5), 212-17.
James C. (2003). Response of vertebrates to fenceline contrasts in grazing intensity in semi-arid woodlands of eastern Australia. Austral Ecology 28, 137-151.
Jongman, R.H.G., ter Braak, C.J.F. and van Tongeren, O.F.R. (1995). Data Analysis in Community and Landscape Ecology. Cambridge University Press, Cambridge.
Kavanagh, R., Law, B., Lemckert, F., Stanton, M., Chidel, M., Brassil, T., Towerton, A. and Herring, M. (2005). Biodiversity in eucalypt plantings established to reduce salinity. Report No. 05/165 to the Joint Venture Agroforestry Program, RIRDC, Canberra. (http://www.rirdc.gov.au/reports/AFT/05-165.pdf)
Kavanagh, R.P. and Stanton, M.A. (1998). Nocturnal forest birds and arboreal marsupials of the southwestern slopes, New South Wales. Australian Zoologist 30, 449-466.
Kavanagh, R.P. and Stanton, M.A. (2002). Response to habitat fragmentation by the Powerful Owl (Ninox strenua), Sooty Owl (Tyto tenebricosa) and Masked Owl (Tyto novaehollandiae) and other nocturnal fauna in south-eastern Australia. Pp. 265-276 in I. Newton, R. Kavanagh, J. Olsen and I. Taylor (eds) Ecology and Conservation of Owls. CSIRO, Melbourne.

106
Kavanagh, R.P., Stanton, M.A. and Brassil, T.E. (2007 b). Koalas continue to occupy their previous home-ranges after selective logging in Callitris-Eucalyptus forest. Wildlife Research 34, 94-107.
Kavanagh, R.P., Stanton, M.A. and Herring, M.W. (2007). Eucalypt plantings on farms benefit woodland birds in south-eastern Australia. Austral Ecology 32, 635-650.
Körtner, G. and Geiser, F. (1998). Ecology of natural hibernation in the marsupial mountain pygmy-possum (Burramys parvus). Oecologia 113, 170-178
Law, B.S. and Chidel, M. (2002). Tracks and riparian zones facilitate the use of Australian regrowth forest by insectivorous bats. Journal of Applied Ecology 39, 605-17.
Law, B.S. and Chidel, M. (2006). Eucalypt plantings on farms: Use by insectivorous bats in south-eastern Australia. Biological Conservation 133, 236-249.
Law, B.S., and Anderson, J. (2000). Roost preferences and foraging ranges of the eastern forest bat Vespadelus pumilus under two disturbance histories on the mid-north coast of New South Wales. Austral Ecology 25, 352-67.
Law, B.S., Anderson, J. and Chidel, M. (1998). A survey of bats on the south-west slopes region of NSW with suggestions of improvements for bat surveys. Australian Zoologist 30, 467-79.
Law, B.S., Anderson, J. and Chidel, M. (1999). Bat communities in a fragmented forest landscape on the south-west slopes of New South Wales, Australia. Biological Conservation 88, 333-45.
Law, B.S., Chidel, M., and Turner, G., 2000. The use by wildlife of paddock trees in farmland. Pacific Conservation Biology 6, 130-43.
Law, B.S., Reinhold, L. and Pennay, M. (2002). Geographic variation in the echolocation calls of Vespadelus spp. (Vespertilionidae) from New South Wales and Queensland, Australia. Acta Chiropterologica 4, 201-15.
Levin, N., McAlpine, C., Phinn, S., Price, B., Pullar, D., Kavanagh, R.P. and Law, B.S. (2009). Mapping forest patches and scattered trees from SPOT images and testing their ecological importance for woodland birds in a fragmented agricultural landscape. International Journal of Remote Sensing 30, 3147-3169.
Lindenmayer, D.B., McCarthy, M.A., Parris, K.M. and Pope, M.L. (2000). Habitat fragmentation, landscape context, and mammalian assemblages in southeastern Australia. Journal of Mammalogy 81, 787-797.
Lloyd A., Law B. and Goldingay R. (2006). Bat activity on riparian zones and upper slopes in Australian timber production forests and the effectiveness of riparian buffers. Biological Conservation 129, 207-20.
Loyn, R.H., McNabb, E., Macak, P., Chick, R. and Hughes, B. (2008). Eucalypt plantations in largely treeless landscapes: what can they do for wildlife? Special Liftout No. 83, Australian Forest Growers, August 2008 31 (1), 6pp.

107
Lumsden, L.F. and Bennett, A.F. (2005). Scattered trees in rural landscapes: foraging habitat for insectivorous bats in south-eastern Australia. Biological Conservation 122, 205-22.
Lumsden, L.F., Bennett, A.F. and Silins, J.E. (2002a). Location of roosts of the lesser long-eared bat Nyctophilus geoffroyi and Gould’s wattled bat Chalinolobus gouldii in a fragmented landscape in south-eastern Australia. Biological Conservation 106, 237-49.
Lumsden, L.F., Bennett, A.F. and Silins, J.E. (2002b). Selection of roost sites by the lesser long-eared bat (Nyctophilus geoffroyi) and Gould’s wattled bat (Chalinolobus gouldii) in south-eastern Australia. Journal of Zoology, London 257, 207-18.
Lunney, D., Crowther, M.S., Shannon, I. and Bryant, J.V. (2009). Combining a map-based public survey with an estimation of site occupancy to determine the recent and changing distribution of the koala in New South Wales. Wildlife Research 36, 262-273.
Mackowski, C.M. (1984). The ontogeny of hollows in blackbutt (Eucalyptus pilularis) and its relevance to the management of forests for possums, gliders and timber. Pp 553-67 in Possums and Gliders. ed by A.P. Smith and I.D. Hume I.D, Australian Mammal Society, Sydney.
MacNally, R. and Brown, G.W. (2001). Reptiles and habitat fragmentation in the box-ironbark forests of central Victoria, Australia: predictions, compositional change and faunal nestedness. Oecologia 128, 116–25.
McIllroy, J.C. (1978). The effects of forestry practices on wildlife in Australia: A review. Australian Forestry 41, 78-94.
McKenzie, N.L., Start, A.N. and Bullen, R.D. (2002). Foraging ecology and organization of a desert bat fauna. Australian Journal of Zoology 50, 529-48.
Menkhorst, P.W. (1984). The application of nest boxes in research and management of possums and gliders. Pp 517-525 in Possums and Gliders, ed. by A.P. Smith and I.D. Hume. Australian Mammal Society, Sydney.
Morton, S.R. (1990). The impact of European settlement on the vertebrate animals of arid Australia: a conceptual model. Proceedings of the Ecological Society of Australia 16, 201-213.
Munro, N.T., Lindenmayer, D.B. and Fischer, J. (2007). Faunal response to revegetation in agricultural areas of Australia: A review. Ecological Management and Restoration 8, 199-207.
Nichols, O.G. and Bamford, M.J. (1985). Reptile and frog utilisation of rehabilitated bauxite minesites and dieback-affected sites in Western Australia’s Jarrah Eucalyptus marginata forest. Biological Conservation 34, 227-249.
O’Neill, M.G. and Taylor, R.J. (1986). Observations on flight patterns and foraging behaviour of Tasmanian bats. Australian Wildlife Research 13, 427-32.

108
Oksanen, S., Kindt, R., Legendre, P., O'Hara, B., Simpson, G., Solymos, P., Henry, M., Stevens, H. and Wagner, H. (2009). vegan: Community Ecology Package. R package version 1.15-3. http://cran.r-project.org/, http://vegan.r-forge.r-project.org/
Olsen, P. [compiler] (2008). The State of Australia’s Birds 2008. Birds Australia, December 2008. Wingspan 18 (4) Supplement.
Olsen, P., Weston, M., Tzaro, C. and Silcocks, A. [compilers] (2005). The State of Australia’s Birds 2008 – Woodlands and Birds. Birds Australia, December 2005. Wingspan 15 (4) Supplement.
Parsons, S. (1996). A comparison of the performance of a brand of broad band and several brands of narrow-band bat detectors in two different habitat types. Bioacoustics 7, 33-43.
Patriquin, K.P., Hogberg, L.K., Chruszcz, B.J. and Barclay, R.M.R. (2003). The influence of habitat structure on the ability to detect ultrasound using bat detectors. Wildlife Society Bulletin 31, 475-81.
Pennay, M. and Gosper, C. (2002). Brigalow Belt South Stage 2 Vertebrate Fauna Survey, Analysis and Modelling Projects. Resource and Conservation Division, Planning NSW. Sydney.
Pennay, M., Law, B. and Reinhold, L. (2004). Bat Calls of NSW: region based guide to the echolocation calls of Microchiropteran bats. NSW Dept. Environment and Conservation, Hurstville.
R Development Core Team (2008). R: A language and environment for statistical computing. R Foundation for Statistical Computing, Vienna, Austria. ISBN 3-900051-07-0, URL http://www.R-project.org.
Radford, J.Q., Bennett, A.F. and Cheers, G.J. (2005). Landscape-level thresholds of habitat cover for woodland-dependent birds. Biological Conservation 124, 317–337.
Read, J.L. (2002). Experimental trial of Australian arid zone reptiles as early warning indicators of overgrazing by cattle. Austral Ecology 27, 55-66.
Recher, H.F., Holmes, R.T., Schulz, M., Shields, J. and Kavanagh, R. (1985). Foraging patterns of breeding birds in eucalypt forest and woodland of southeastern Australia. Australian Journal of Ecology 10, 399-419.
Reid J.W.R. (2000). Threatened and Declining Birds in the New South Wales Sheep-Wheat Belt: Landscape Relationships – Modelling Bird Atlas Data Against Vegetation Cover. Consultancy report to NSW National Parks and Wildlife Service,Sydney.
Reinhold, L., Law, B., Ford, G. and Pennay, M. (2001). Key to the bat calls of south-east Queensland and north-east New South Wales. Forest Ecosystem Research and Assessment Technical Paper 2001-07, Department of Natural Resources and Mines, Queensland, 62 pp.
Sarre, S., Smith, G.T. and Meyers, J.A. (1995). Persistence of two species of gecko (Oedura reticulata and Gehyra variegata) in remnant habitat. Biological Conservation 71, 25-33.

109
Saunders D.A. and Hobbs R.J. (1995). Habitat reconstruction: the revegetation imperative. Pp. 104-112 in Conserving Biodiversity: Threats and Solutions, ed. by R.A. Bradstock, T.D. Auld, D.A. Keith, R.T. Kingsford, D. Lunney and D.P. Sivertsen. Surrey Beatty and Sons, Sydney.
Saunders, D.A. (1989). Changes in the avifauna of a region, district and remnant as a result of fragmentation of native vegetation: the wheatbelt of Western Australia. A case study. Biological Conservation 50, 99-135.
Saunders, D.A., Hobbs, R.J. and Margules, C.R. (1991). Biological consequences of ecosystem fragmentation: a review. Conservation Biology 5, 18–32.
Schaub, A. and Scnitzler, H.-U. (2007). Echolocation behaviour of the bat Vespertilio murinus reveals the border between habitat types “edge” and “open space”. Behavioural Ecology and Sociobiology 61, 513-23.
Schnitzler, H.-U., Moss, C.F. and Denzinger, A. (2003). From spatial orientation to food acquisition in echolocating bats. Trends in Ecology and Evolution 18, 386-94.
Scotts, D.J. (1991). Old-growth forests: their ecological characteristics and value to forest-dependent vertebrate fauna of south-east Australia. Pp. 147-159 in Conservation of Australia’s Forest Fauna, ed. by D. Lunney. Royal Zoological Society of New South Wales, Mosman.
Smith, A.P. and Lindenmayer, D.B. (1988). Tree hollow requirements of Leadbeater’s Possum and other possums and gliders in timber production ash forests of the Victorian Central Highlands. Australian Wildlife Research 15, 347-362.
Smith, G. C. and Agnew, G. (2002). The value of ‘bat boxes’ for attracting hollow-dependent fauna to farm forestry plantations in southeast Queensland. Ecological Management & Restoration 3, 37-46.
Smith, G.T., Arnold, G.W., Sarre, S., Abensperg-Traun, M. and Steven, D.E. (1996). The effect of habitat fragmentation and livestock grazing on animal communities in Eucalyptus saluris woodland in the Western Australian Wheatbelt. Journal of Applied Ecology 33, 1302-1310.
Suckling, G.C. (1984). Population ecology of the sugar glider, Petaurus breviceps, in a system of fragmented habitats. Australian Wildlife Research 11, 49-75.
Suckling, G.C. and Macfarlane, M.A. (1983). Introduction of the Sugar Glider, Petaurus breviceps, into Re-established Forest of the Tower Hill State Game Reserve, Vic. Australian Wildlife Research 10, 249-258.
Ter Braak, C.J.F. (1997). Canoco v3.15: User Manual. DLO Agricultural Mathematics Group, Wageningen, the Netherlands.
Tidemann, C.R. and Flavel, S.C. (1987). Factors affecting choice of diurnal roost site by tree-hole bats (Microchiroptera) in south-eastern Australia. Australian Wildlife Research 14, 459–473.

110
Towerton, A.L., Penman, T.D., Blake, M.E., Deane, A.T., Kavanagh, R.P. and Dickman, C.R. (2008). The potential for remote cameras to monitor visitation by birds and predators at Malleefowl mounds. Ecological Management and Restoration 9, 64-67.
Traill, B.J. (1991). Box-ironbark forests: tree hollows, wildlife and management. Pp. 119-23 in D. Lunney (ed) Conservation of Australia's forest fauna. Roy. Zool. Soc. N.S.W., Mosman.
Turbill, C. (2006). Roosting and thermoregulatory behaviour of male Gould’s long-eared bats Nyctophilus gouldi: Energetic benefits of thermally unstable tree roosts. Australian Journal of Zoology 54, 57-60.
Turbill, C. and Ellis, M. (2006). Distribution and abundance of the south-eastern form of the greater long-eared bat Nyctophilus timoriensis. Australian Mammalogy 28, 1-6.
Turbill, C. and Geiser, F. (2008). Hibernation by tree-roosting bats. J. Comp. Physiol. B 178, 597–605.
Tyndale-Biscoe, C.H. and Calaby, J.H. (1975). Eucalypt forests as refuge for wildlife. Australian Forestry 38, 117-133.
van der Ree, R. (2002). The population ecology of the squirrel glider (Petaurus norfolcensis) within a network of remnant linear habitats. Wildlife Research 29, 329-340.
van der Ree, R., Bennett, A.F. and Gilmore, D.C. (2003). Gap-crossing by gliding marsupials: thresholds for use of isolated woodland patches in an agricultural landscape. Biological Conservation 115, 241-249.
Vesk, P. and MacNally, R. (2006). The clock is ticking – revegetation and habitat for birds and arboreal mammals in rural landscapes of southern Australia. Agriculture Ecosystems and Environment 112, 356–366.
Vesk, P.A., Nolan, R., Thomson, J.R., Dorrough, J.W. and MacNally, R. (2008). Time lags in provision of habitat resources through revegetation. Biological Conservation 141, 174-186.
Walsh, P., Montagu, K., Royal, B. and Dobson, S. (2005). Targeting planted forests for dryland salinity control: Background to the operational scale tree planting pilot project and the associated research trials on the Liverpool Plains, New South Wales. Technical Paper No. 69, Forest Resources Research, NSW Department of Primary Industries, Sydney.
Webb, G.A. (1985). Habitat use and activity patterns in some southeastern Australian skinks. Pp. 23-30 in The Biology of Australasian Frogs and Reptiles, ed. By G. Grigg, R. Shine and H. Ehmann. Royal Zoological Society of New South Wales.
Weinberg, A.Z., Kavanagh, R.P., Law, B.S. and Penman, T.D. (2007/08). Testing biodiversity toolkits – How well do they predict vertebrate species richness? Report to NSW Environmental Trust. May 2007 (updated to include BioMetric v.1.8 in March 2008).

111
Woinarski, J.C.Z. and Ash, A. (2002). Response of vertebrates to pastoralism, military land use and landscape position in an Australian tropical savanna. Austral Ecology 27, 311-323.

112
Copyright © 2022 FDOKUMEN