Where was the global price of silver established? Evidence ...
13
Where was the global price of silver established? Evidence from London and New York (1878-1953) Shaen Corbet a,b* , Fergal O’Connor c a DCU Business School, Dublin City University, Dublin 9, Ireland b School of Accounting, Finance and Economics, University of Waikato, New Zealand c Cork University Business School, University College Cork, Ireland * Corresponding Author: [email protected] Abstract This paper utilises a newly compiled data set of monthly silver prices for the London and New York markets, as well as the monthly Dollar-Sterling exchange rate, from 1878 and 1953 in order to investigate the source and flows of information and price discovery between those markets. Re- sults indicate that London was the dominant market and pricing leader of silver throughout this period. Further evidence suggests that there existed dynamic information flows both within years and decades. These phenomena can be explained due to the use of silver for agricultural market payments and international silver production flows respectively. Keywords: Silver; Price Discovery; Information Flows; Historical data. 1. Introduction By the 1930’s there was one ‘Global’ price of silver, due to improved communications technology such as the telegraph , and not a collection of local prices (Herbert [1932]). This paper uses a newly transcribed data set of monthly silver prices for the London and New York markets, and the monthly Dollar-Sterling exchange rate, covering 1878-1953 to assess where this ’global’ price of silver was being set. This research investigates the long-run flow of information and price discovery of in international silver markets while adding to the literature using long-run data sets to assess this issue (Jordà et al. [2019]). In the 19th century silver was still the currency for large part of the world (White [1917]). The decline of monetary silver began in 1837 when Germany began demonetising silver, quickly followed by Scandinavia. Further declines continued in the following years as in 1877 the Latin Monetary union stopped minting silver and by 1893, Austria, Hungry and India also abandoned silver coinage (Hasan [2006]). China was the last Major nation to stop using monetary silver in 1935. Preprint submitted to Finance Research Letters May 26, 2021
-
Upload
khangminh22 -
Category
Documents
-
view
6 -
download
0
Transcript of Where was the global price of silver established? Evidence ...

Where was the global price of silver established?Evidence from London and New York (1878-1953)
Shaen Corbeta,b∗, Fergal O’Connorc
aDCU Business School, Dublin City University, Dublin 9, Ireland
bSchool of Accounting, Finance and Economics, University of Waikato, New Zealand
cCork University Business School, University College Cork, Ireland
∗Corresponding Author: [email protected]
Abstract
This paper utilises a newly compiled data set of monthly silver prices for the London and NewYork markets, as well as the monthly Dollar-Sterling exchange rate, from 1878 and 1953 in orderto investigate the source and flows of information and price discovery between those markets. Re-sults indicate that London was the dominant market and pricing leader of silver throughout thisperiod. Further evidence suggests that there existed dynamic information flows both within yearsand decades. These phenomena can be explained due to the use of silver for agricultural marketpayments and international silver production flows respectively.
Keywords: Silver; Price Discovery; Information Flows; Historical data.
1. Introduction
By the 1930’s there was one ‘Global’ price of silver, due to improved communications technologysuch as the telegraph , and not a collection of local prices (Herbert [1932]). This paper uses a newlytranscribed data set of monthly silver prices for the London and New York markets, and the monthlyDollar-Sterling exchange rate, covering 1878-1953 to assess where this ’global’ price of silver wasbeing set. This research investigates the long-run flow of information and price discovery of ininternational silver markets while adding to the literature using long-run data sets to assess thisissue (Jordà et al. [2019]).
In the 19th century silver was still the currency for large part of the world (White [1917]). Thedecline of monetary silver began in 1837 when Germany began demonetising silver, quickly followedby Scandinavia. Further declines continued in the following years as in 1877 the Latin Monetaryunion stopped minting silver and by 1893, Austria, Hungry and India also abandoned silver coinage(Hasan [2006]). China was the last Major nation to stop using monetary silver in 1935.
Preprint submitted to Finance Research Letters May 26, 2021

London had a long tradition of precious metals trading, with some bullion banks which operatedduring this period pre-dating the formation of the Bank of England (O’Connor et al. [2015]). Londonwas considered to be the market where buying and selling orders from all over the world interacted(Herbert [1932]). It’s geographical location between New York and Bombay also provided morecertainty in the timing and delivery of forward contracts. Up to the 1920’s, London’s position as acentre for commodity trade was further enhanced due to a dominance in trade with the Far Eastwhere silver was in demand from China and India for monetary purposes. Mexico and Americawere the major suppliers, but their silver generally flowed first to London and only then onto finaldestinations in the Far East (Spalding [1922]).
The London silver price was established through a daily auction (The Silver Fixing) whichstarted in 1897 and continued until 2014, when its name was changed to the LBMA Silver Price.There were four Bullion brokers involved in the daily Fixing 1, who also worked together to regulateissues such as commissions in the market (Blagg [2014]).
Handy and Harman, the New York Bullion dealer, had been closely linked to London from thelate 1860’s and had begun the practice of publishing a dollar silver price based on the London priceless shipping and insurance costs. This came to be the ‘official Price’ in the US market, which wasused in contract writing. As American supplies of new silver increased they began to quote a silverprice for ‘nearby delivery in New York’ (Harman [1932]).
But there was an argument as to the "Global" price of silver was set. Herbert [1932] statedthat the London prices was regarded as "the" silver price even in the United States. However somesilver market analysts, such as Hochschild quoted in Herbert [1932], stated that New York was amore prominent market than that London, and he believed that Shanghai and Bombay were thetwo most important markets in the period after the first world war.
Insert Figure 1 about here
Support for the argument that the United States was the silver price leader of the day surroundthe fact that most international mining production before 1930 was found to have passed througheither New York or San Francisco, both of whom were primary selling markets for the substantiallevels of production that continued to grow at pace as presented in Figure 1. Bombay and Shanghaioperated primarily as the largest sources of global demand, with London operated as a central nodeconnecting both of these regions as the supply of silver moved from the west to the east. Much ofthe silver sold on the London Fixing London never passed through it physically (Herbert [1932]).
Much research on modern silver markets has pointed to the market being efficient (Aggarwalet al. [2016]) and New York being the most important market for silver (Vigne et al. [2017]).
1Mocatta and Goldsmid, Sharps and Wilkins, Pixley, Abell, Langley and Bland, and Samuel Montagu and Co.
2
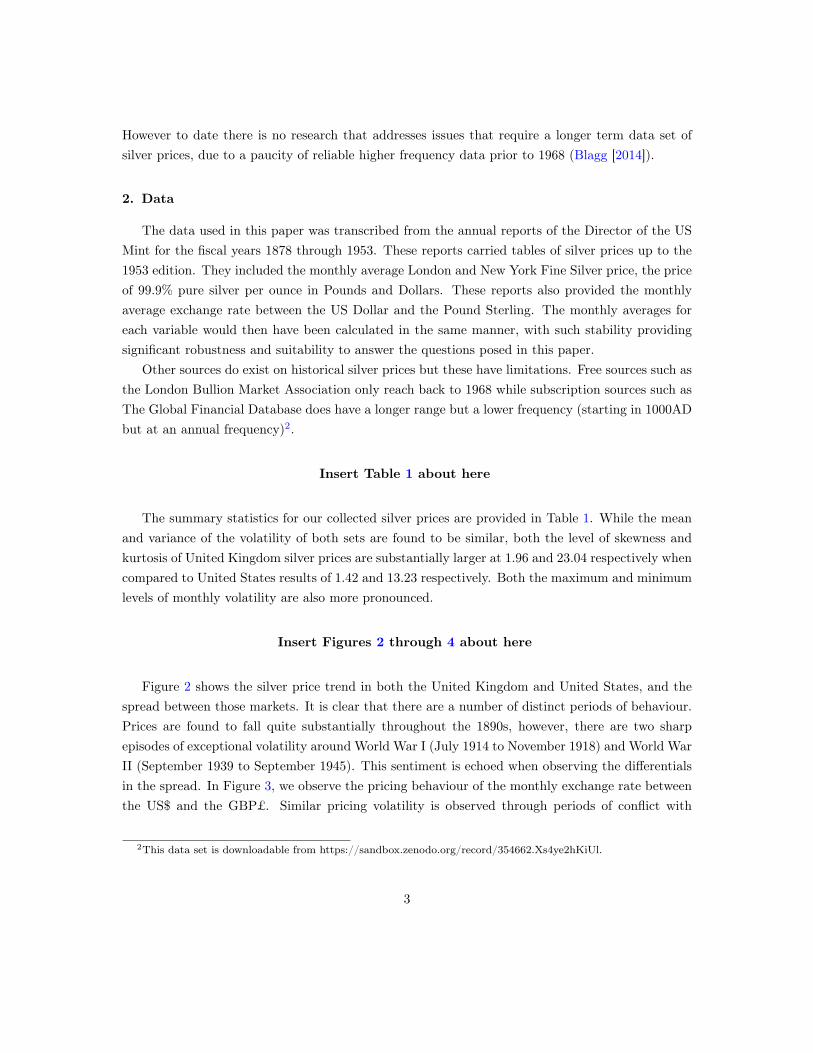
However to date there is no research that addresses issues that require a longer term data set ofsilver prices, due to a paucity of reliable higher frequency data prior to 1968 (Blagg [2014]).
2. Data
The data used in this paper was transcribed from the annual reports of the Director of the USMint for the fiscal years 1878 through 1953. These reports carried tables of silver prices up to the1953 edition. They included the monthly average London and New York Fine Silver price, the priceof 99.9% pure silver per ounce in Pounds and Dollars. These reports also provided the monthlyaverage exchange rate between the US Dollar and the Pound Sterling. The monthly averages foreach variable would then have been calculated in the same manner, with such stability providingsignificant robustness and suitability to answer the questions posed in this paper.
Other sources do exist on historical silver prices but these have limitations. Free sources such asthe London Bullion Market Association only reach back to 1968 while subscription sources such asThe Global Financial Database does have a longer range but a lower frequency (starting in 1000ADbut at an annual frequency)2.
Insert Table 1 about here
The summary statistics for our collected silver prices are provided in Table 1. While the meanand variance of the volatility of both sets are found to be similar, both the level of skewness andkurtosis of United Kingdom silver prices are substantially larger at 1.96 and 23.04 respectively whencompared to United States results of 1.42 and 13.23 respectively. Both the maximum and minimumlevels of monthly volatility are also more pronounced.
Insert Figures 2 through 4 about here
Figure 2 shows the silver price trend in both the United Kingdom and United States, and thespread between those markets. It is clear that there are a number of distinct periods of behaviour.Prices are found to fall quite substantially throughout the 1890s, however, there are two sharpepisodes of exceptional volatility around World War I (July 1914 to November 1918) and World WarII (September 1939 to September 1945). This sentiment is echoed when observing the differentialsin the spread. In Figure 3, we observe the pricing behaviour of the monthly exchange rate betweenthe US$ and the GBP£. Similar pricing volatility is observed through periods of conflict with
2This data set is downloadable from https://sandbox.zenodo.org/record/354662.Xs4ye2hKiUl.
3

episodes of price fixing visible during periods of tremendous international turmoil. In Figure 4 weobserve the volatility of silver prices in both New York and London where there is quite a lowlevel of comparative volatility throughout the 1884 to 1915 period, but episodes of substantial andfrequent volatility are evident thereafter.
3. Analysis
We focus on three distinct questions surrounding the flow of information and price discoverybetween New York and London silver prices. First, we ask as to whether the role of war influencedthe pricing dynamics between these international silver exchanges (H1). Further, we investigateas to whether such dynamics vary on a monthly basis (H2), and as to whether it changes bythe decade analysed (H3). To complete this task we develop on two standard measures of pricediscovery commonly employed in the literature: the Hasbrouck [1995] Information Share (IS) (as inAkyildirim et al. [2019], and the Gonzalo and Granger [1995] Component Share (CS) measure, asin Martinez and Tse [2019]. We build on the error correction parameters and variance-covarianceof the error terms from the Vector Error Correction Model (VECM):
Hasbrouck [1995] demonstrates that the contribution of a price series to price discovery (the‘information share’) can be measured by the proportion of the variance in the common efficient priceinnovations that is explained by innovations in that price series, whereas Gonzalo and Granger [1995]decompose a cointegrated price series into a permanent component and a temporary componentusing error correction coefficients.
∆p1,t = α1(p1,t−1 − p2,t−1) +
200∑i=1
γi∆p1,t−i +
200∑j=1
δj∆p2,t−j + ε1,t (1)
∆p2,t = α2(p1,t−1 − p2,t−1) +
200∑k=1
ϕk∆p1,t−k +
200∑m=1
φm∆p2,t−m + ε2,t (2)
where ∆pi,t is the change in the log price (pi,t) of the asset traded in market i at time t. Thenext stage is to obtain the component shares (CS) from the normalised orthogonal coefficients tothe vector of error correction, or:
CS1 = γ1 =α2
α2 − α1;CS2 = γ2 =
α1
α1 − α2(3)
Given the covariance matrix of the reduced form VECM error terms where:
M =
(m11 0
m12 m22
)=
(σ1 0
ρσ2 σ2(1 − ρ2)12
)(4)
We can then calculate the information share (IS) using:
4

IS1 =(γ1m11 + γ2m12)2
(γ1m11 + γ2m12)2 + (γ2m22)2(5)
IS2 =(γ2m22)2
(γ1m11 + γ2m12)2 + (γ2m22)2(6)
As used by Corbet et al. [2018], the combined measure is known as the Information LeadershipShare (ILS) which is calculated as:
ILS1 =
∣∣∣ IS1
IS2
CS2
CS1
∣∣∣∣∣∣ IS1
IS2
CS2
CS1
∣∣∣+∣∣∣ IS2
IS1
CS1
CS2
∣∣∣ and ILS2 =
∣∣∣ IS2
IS1
CS1
CS2
∣∣∣∣∣∣ IS1
IS2
CS2
CS1
∣∣∣+∣∣∣ IS2
IS1
CS1
CS2
∣∣∣ (7)
We estimate all three price discovery metrics as they measure different aspects of price discovery.The first stage of the analysis focuses on the influence of periods of war, specifically that of WorldWars I and II, on the relationship between US and UK silver market price discovery. In Table 2we observe the relationship for each of the measured IS, CS, IL and ILS. In all scenarios, the UKsilver market substantially leads the US in terms of price discovery and information flow. The UKinformation flow of price discovery is measured as 0.9026 during non-war periods. During wars,this estimated relationship reduces to 0.7858, but the information flow remains strongly sourced inthe UK upon US silver markets. London then acted as a nexus for suppliers, in the new world, andbuyers, in Asia, in contrast to Hochschild’s assertions at the time.
Insert Tables 2 and 3 about here
In Table 3 we specifically analyse as to whether there exist variations in the price discoveryand information flow relationship as separated by the month of the year analysed within thisunique dataset. Evidence suggests that while the UK silver markets leads the US silver market forprice discovery, there are two interesting dynamics. First, there is a substantial variation in theinformation share of price discovery at the change of each year in December and January, wherethe average information share of 0.8777 identified within UK silver markets falls to 0.6725 and0.7420 respectively. Further, a second unexpected result is found in the dilution of the relationshipbetween UK and US silver market price discovery in August to 0.6964, possibly reflecting strongChinese demand for silver for harvest periods, when silver was more likely to be route directly fromSan Francisco, rather than through London (White [1917]).
Insert Table 4 about here
Finally, in Table 4 we analyse differentials in the information and price discovery relationship be-tween the UK and US silver markets by decade analysed. Results between 1870 and 1899 are stable
5

and indicate a persistent leadership role of UK silver markets of approximately 0.885. Throughoutthe early 1900s we begin to see a reduction in this relationship, with the strongest influence denotedfrom the US to UK silver markets during the 1930 through 1939 periods at 0.842. There are twopotential explanations for these results. First, as denoted in Figure 1, there is a potential role fordifferentials in production, where between 1884 and 1953, the total value of silver production wasfound to have reached its lowest point in 1932. Second, the Silver Purchase Act of 1934 forced theUS Government to buy domestic and foreign silver for $1.26 for ounce, increasing the importanceof US markets in this period.
4. Conclusions
This paper uses three newly transcribed and previously unavailable monthly data sets for Londonand New York Silver prices, and the Dollar-Sterling Exchange Rate, to examine where the ’Global’silver price was set between 1878 and 1953. We find that London was consistently the dominantmarket based on all measures of information flow used, but that there was variation in the strengthof this dominance during periods of war and at certain month each year. While this data frequencyallows this question to be addressed effectively, a data set of daily silver prices for the two marketswould allow a more precise analysis.
This new monthly dataset will allow research to take place on many questions which are currentin the literature on precious metals, such as whether silver can act as a safe haven for investors intimes of financial crashes, see for example Peng [2019], or whether the silver market was efficientin this early period. Finding a reliable source monthly data between 1953 and 1968 would allowresearchers to assess where the price was set in the period to the end of Bretton Moods.
Bibliography
Aggarwal, R., B. Lucey, and F. O’Connor (2016). World Metals Markets, in The World ScientificHandbook of Futures Markets.
Akyildirim, E., S. Corbet, P. Katsiampa, N. Kellard, and A. Sensoy (2019). The development ofbitcoin futures: Exploring the interactions between cryptocurrency derivatives. Finance ResearchLetters.
Blagg, M. (2014). 1897-1939, A New Era for the London Silver Price. Alchemist. Alchemist 75,18–20.
Corbet, S., B. Lucey, M. Peat, and S. Vigne (2018). Bitcoin futures - what use are they? EconomicsLetters 172, 23–27.
6

Gonzalo, J. and C. Granger (1995). Estimation of common long-memory components in cointegratedsystems. Journal of Business & Economic Statistics 13 (1), 27–35.
Harman, H. &. (1932). Silver Market 1932. Technical report, Pandick Press, Inc., New York.
Hasan, M. S. (2006). Equilibrium and efficiency of exchange rates in a silver-based monetary system- the cases of India and Iran. Economics Letters 93 (3), 318–322.
Hasbrouck, J. (1995). One security, many markets: Determining the contributions to price discovery.The Journal of Finance 50 (4), 1175–1199.
Herbert, M. (1932). The Silver Market. Washington: U.S. Department of Commerce.
Jordà, Ò., K. Knoll, D. Kuvshinov, M. Schularick, and A. Taylor (2019). The rate of return oneverything, 1870 - 2015. The Quarterly Journal of Economics 134 (3), 1225–1298.
Martinez, V. and Y. Tse (2019). The impact of tick-size reductions in foreign currency futuresmarkets. Finance Research Letters 28, 32–38.
O’Connor, F., B. Lucey, J. Batten, and D. Baur (2015). The financial economics of gold - A survey.International Review of Financial Analysis 41.
Peng, X. (2019). Do precious metals act as hedges or safe havens for china’s financial markets?Finance Research Letters, 101353.
Spalding, W. (1922). The London Money Market (2nd ed.). London: Sir Isaac Pitman and Sons.
Vigne, S., B. Lucey, F. O’Connor, and L. Yarovaya (2017). The financial economics of white preciousmetals - A survey. International Review of Financial Analysis 52.
White, B. (1917). Silver: Its history and romance. London: Hodder and Stoughton.
7

Figure 1: Total Value of World Silver Production in US$’s (1884 - 1953)
Note: The above figure presents the total value of silver production between January 1884 through December 1953 basedon US Geological Survey data. War dates in this analysis are considered to denoted as the period July 28, 1914 throughNovember 11, 1918 for World War I and denoted to be the period September 1, 1939 through September 2, 1945 for WorldWar II.
Table 1: Summary Statistics for US and UK Silver Prices, In Pounds Sterling
United Kingdom United StatesVolatilityMean 0.00120 0.00117Variance 0.00176 0.00172Skewness 1.96172 1.42151Kurtosis 23.04109 13.23364Maximum 44.89% 33.38%Date Oct-45 Oct-45Minimum -21.47% -19.59%Date Dec-20 Jan-36Observations 840 840
PriceMaximum 91.77 94.37Date Feb-20 Feb-20Minimum 13.41 13.38Date Feb-31 Feb-31
8

Figure 2: Silver prices and market spread as recorded in the UK and US (1884 - 1953)
a) Silver prices as recorded in the UK and US
b) The market spread between UK and US silver markets
Note: The above panel presents the price of silver as recorded in the UK and US between January 1884 through December1953. The lower panel presents the market spread between UK and US silver markets during the same period.
9

Figure 3: Monthly Exchange Rate US$ to GBP£, January (1884 - 1953)
Note: The above figure presents the monthly exchange rate between the US dollar and the UK pound between January1884 and December 1953.
Table 2: Price Discovery and Information Flow Statistics for UK and US Silver Markets
IS CS IL ILS Lags
H1: How did war influence the price discovery relationship?
YES UK 0.7858 0.7760 0.8296 0.7975 8US 0.2142 0.2240 0.1704 0.2025
NO UK 0.9026 0.9150 0.9731 0.9757 17US 0.0974 0.0850 0.0269 0.0243
Note: The above table presents the average IS, CS, IL and ILS relationships as represented by the flow of price discoverysourced within the UK and US silver markets during this time.
10
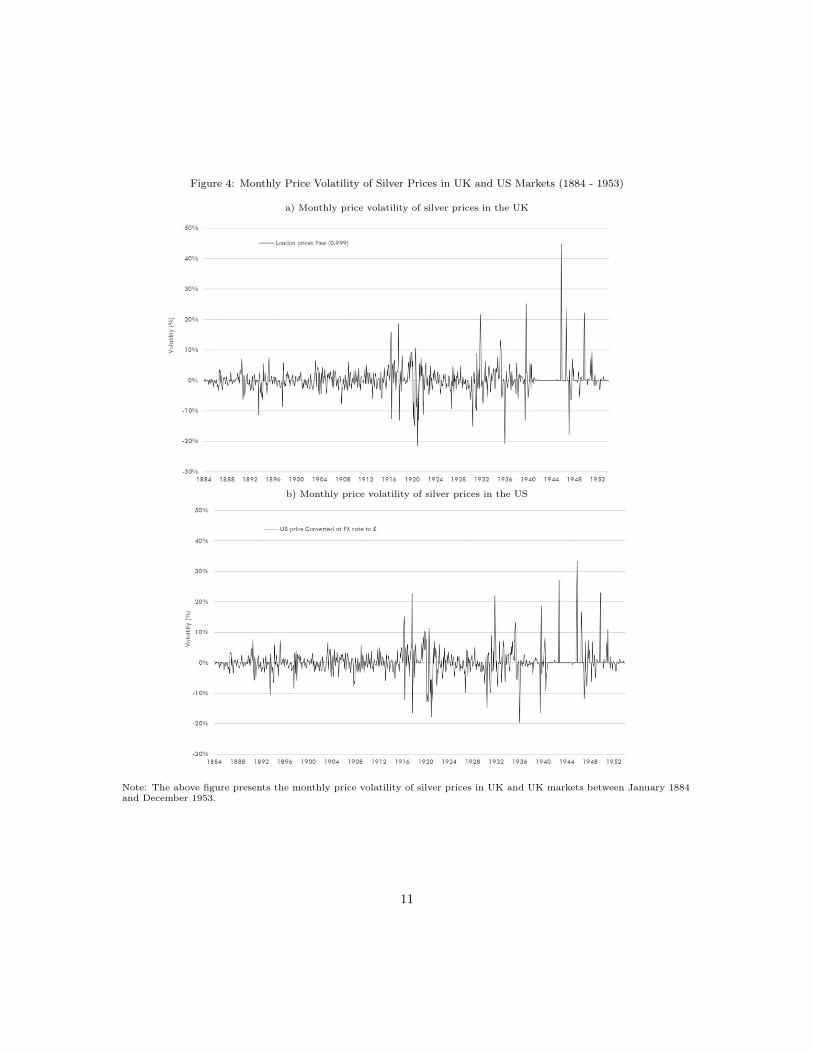
Figure 4: Monthly Price Volatility of Silver Prices in UK and US Markets (1884 - 1953)
a) Monthly price volatility of silver prices in the UK
b) Monthly price volatility of silver prices in the US
Note: The above figure presents the monthly price volatility of silver prices in UK and UK markets between January 1884and December 1953.
11

Table 3: Price Discovery and Information Flow Statistics for UK and US Silver Markets
IS CS IL ILS Lags
H2: Did the price discovery relationship change by month?
January UK 0.6725 0.8406 0.9476 0.9574 46US 0.3275 0.1594 0.0524 0.0426
February UK 0.9411 0.8133 0.9263 0.9741 52US 0.0589 0.1867 0.0737 0.0259
March UK 0.9021 0.7947 0.9213 0.9234 46US 0.3979 0.2053 0.0787 0.0766
April UK 0.8425 0.9548 0.9730 0.9754 9US 0.1575 0.0452 0.0270 0.0246
May UK 0.8610 0.8876 0.9695 0.9750 9US 0.1390 0.1124 0.0305 0.0250
June UK 0.8641 0.9098 0.9711 0.9753 54US 0.1359 0.0902 0.0289 0.0247
July UK 0.9750 0.9456 0.8032 0.9758 52US 0.0250 0.0544 0.1968 0.0242
August UK 0.6964 0.7604 0.5742 0.6948 52US 0.3036 0.2396 0.4258 0.3052
September UK 0.9090 0.7813 0.9645 0.9751 13US 0.0910 0.2187 0.0355 0.0249
October UK 0.8860 0.8327 0.9551 0.9735 8US 0.1140 0.2673 0.0449 0.0265
November UK 0.8997 0.8176 0.9545 0.9740 51US 0.1003 0.2824 0.0455 0.0260
December UK 0.7420 0.7453 0.9698 0.9734 47US 0.2580 0.0547 0.0302 0.0266
Note: The above figure presents the average IS, CS, IL and ILS relationships as segregated by each month per year ofinvestigation and represented by the flow of price discovery sourced within the UK and US silver markets during this time.
12

Table 4: Price Discovery and Information Flow Statistics for UK and US Silver Markets
IS CS IL ILS Lags
H3: Did the price discovery relationship change over time?
1870 UK 0.8859 0.7869 0.9621 0.9744 6US 0.1141 0.2131 0.0379 0.0256
1880 UK 0.8855 0.7882 0.9622 0.9744 9US 0.1145 0.2118 0.0378 0.0256
1890 UK 0.8829 0.7911 0.9621 0.9743 9US 0.1171 0.2089 0.0379 0.0257
1900 UK 0.8780 0.8071 0.9634 0.9744 9US 0.1220 0.1929 0.0366 0.0256
1910 UK 0.8696 0.7851 0.9591 0.9737 9US 0.1304 0.2149 0.0409 0.0263
1920 UK 0.8594 0.8430 0.9657 0.9743 9US 0.1406 0.1570 0.0343 0.0257
1930 UK 0.8420 0.8071 0.9239 0.9345 9US 0.1580 0.1929 0.0761 0.0655
1940 UK 0.8581 0.8128 0.9616 0.9737 6US 0.1419 0.1872 0.0384 0.0263
1950 UK 0.9065 0.8159 0.9558 0.9744 56US 0.0935 0.1841 0.0442 0.0256
Note: The above figure presents the average IS, CS, IL and ILS relationships as segregated by each decade of investigationand represented by the flow of price discovery sourced within the UK and US silver markets during this time.
13