Conservation genetics of evolutionary lineages of the endangered mountain yellow-legged frog, Rana...
10
Conservation genetics of evolutionary lineages of the endangered mountain yellow-legged frog, Rana muscosa (Amphibia: Ranidae), in southern California Sean. D. Schoville a,⇑,1 , Tate S. Tustall b , Vance T. Vredenburg c , Adam R. Backlin d , Elizabeth Gallegos d , Dustin A. Wood d , Robert N. Fisher d a Department of Environmental Science, Policy and Management, University of California, Berkeley, 137 Mulford Hall #3114, Berkeley, CA 94720-3114, United States b Department of Integrative Biology, University of California, Berkeley, 3060 Valley Life Sciences Bldg. #3140, Berkeley, CA 94720-3140, United States c Department of Biology, San Francisco State University, 1600 Holloway Ave., San Francisco, CA 94132, United States d U.S. Geological Survey, Western Ecological Research Center, San Diego Field Station, 4165 Spruance Road Suite 200, San Diego, CA 92101, United States article info Article history: Received 3 January 2011 Received in revised form 12 April 2011 Accepted 16 April 2011 Available online 8 May 2011 Keywords: Population genetics Captive breeding Bottleneck Reintroduction Biogeography abstract Severe population declines led to the listing of southern California Rana muscosa (Ranidae) as endangered in 2002. Nine small populations inhabit watersheds in three isolated mountain ranges, the San Gabriel, San Bernardino and San Jacinto. One population from the Dark Canyon tributary in the San Jacinto Moun- tains has been used to establish a captive breeding population at the San Diego Zoo Institute for Conser- vation Research. Because these populations may still be declining, it is critical to gather information on how genetic variation is structured in these populations and what historical inter-population connectiv- ity existed between populations. Additionally, it is not clear whether these populations are rapidly losing genetic diversity due to population bottlenecks. Using mitochondrial and microsatellite data, we examine patterns of genetic variation in southern California and one of the last remaining populations of R. mus- cosa in the southern Sierra Nevada. We find low levels of genetic variation within each population and evidence of genetic bottlenecks. Additionally, substantial population structure is evident, suggesting a high degree of historical isolation within and between mountain ranges. Based on estimates from a multi-population isolation with migration analysis, these populations diversified during glacial episodes of the Pleistocene, with little gene flow during population divergence. Our data demonstrate that unique evolutionary lineages of R. muscosa occupy each mountain range in southern California and should be managed separately. The captive breeding program at Dark Canyon is promising, although mitigating the loss of neutral genetic diversity relative to the natural population might require additional breeding frogs. Ó 2011 Elsevier Ltd. All rights reserved. 1. Introduction Over the last few decades, dramatic and persistent population declines have been documented in amphibian species throughout the world (Wake and Vredenburg, 2008) resulting in an unprece- dented crisis with over 32.5% of known species considered ‘‘glob- ally threatened’’. Tremendous effort has been expended to collect information and document declines (Global Amphibian Assess- ment, 2004), but in many cases adequate information is lacking for prioritizing major threats or management actions. In those few cases where restoration and recovery efforts have been under- taken for amphibians (Griffiths and Pavajeau, 2008; Semlitsch, 2002), basic information on population demography and connec- tivity have been essential in setting management guidelines. How- ever, this information can be difficult to obtain using field ecological methods, especially if populations have declined to very low numbers. Genetic data provide an alternative method to reconstruct the demography of populations and can be used to estimate historical migration rates between populations, even after substantial fragmentation has taken place (Delaney et al., 2010; Frankham, 1995). In the United States, the number of endangered frog species or candidates for listing is disproportionally represented in the west (US Fish and Wildlife Service), where population declines have been particularly notable in Rana species for several decades (Fisher and Shaffer, 1996; Hayes and Jennings, 1986). The southern mountain yellow-legged frog, Rana muscosa, along with its sister species, the Sierra mountain yellow-legged frog Rana sierrae, is a prominent example of an enigmatic range-wide population crash. 0006-3207/$ - see front matter Ó 2011 Elsevier Ltd. All rights reserved. doi:10.1016/j.biocon.2011.04.025 ⇑ Corresponding author. Tel.: +1 619 246 9853. E-mail addresses: [email protected] (Sean. D. Schoville), tatet2@berkeley. edu (T.S. Tustall), [email protected] (V.T. Vredenburg), [email protected] (A.R. Backlin), [email protected] (E. Gallegos), [email protected] (D.A. Wood), rfi[email protected] (R.N. Fisher). 1 Present address: Scripps Institution of Oceanography, University of California, San Diego, La Jolla, CA 92093-0202, United States. Biological Conservation 144 (2011) 2031–2040 Contents lists available at ScienceDirect Biological Conservation journal homepage: www.elsevier.com/locate/biocon
-
Upload
independent -
Category
Documents
-
view
2 -
download
0
Transcript of Conservation genetics of evolutionary lineages of the endangered mountain yellow-legged frog, Rana...
Biological Conservation 144 (2011) 2031–2040
Contents lists available at ScienceDirect
Biological Conservation
journal homepage: www.elsevier .com/ locate /biocon
Conservation genetics of evolutionary lineages of the endangered mountainyellow-legged frog, Rana muscosa (Amphibia: Ranidae), in southern California
Sean. D. Schoville a,⇑,1, Tate S. Tustall b, Vance T. Vredenburg c, Adam R. Backlin d, Elizabeth Gallegos d,Dustin A. Wood d, Robert N. Fisher d
a Department of Environmental Science, Policy and Management, University of California, Berkeley, 137 Mulford Hall #3114, Berkeley, CA 94720-3114, United Statesb Department of Integrative Biology, University of California, Berkeley, 3060 Valley Life Sciences Bldg. #3140, Berkeley, CA 94720-3140, United Statesc Department of Biology, San Francisco State University, 1600 Holloway Ave., San Francisco, CA 94132, United Statesd U.S. Geological Survey, Western Ecological Research Center, San Diego Field Station, 4165 Spruance Road Suite 200, San Diego, CA 92101, United States
a r t i c l e i n f o a b s t r a c t
Article history:Received 3 January 2011Received in revised form 12 April 2011Accepted 16 April 2011Available online 8 May 2011
Keywords:Population geneticsCaptive breedingBottleneckReintroductionBiogeography
0006-3207/$ - see front matter � 2011 Elsevier Ltd. Adoi:10.1016/j.biocon.2011.04.025
⇑ Corresponding author. Tel.: +1 619 246 9853.E-mail addresses: [email protected] (Sean. D
edu (T.S. Tustall), [email protected] (V.T. VredenbuBacklin), [email protected] (E. Gallegos), [email protected] (R.N. Fisher).
1 Present address: Scripps Institution of OceanographDiego, La Jolla, CA 92093-0202, United States.
Severe population declines led to the listing of southern California Rana muscosa (Ranidae) as endangeredin 2002. Nine small populations inhabit watersheds in three isolated mountain ranges, the San Gabriel,San Bernardino and San Jacinto. One population from the Dark Canyon tributary in the San Jacinto Moun-tains has been used to establish a captive breeding population at the San Diego Zoo Institute for Conser-vation Research. Because these populations may still be declining, it is critical to gather information onhow genetic variation is structured in these populations and what historical inter-population connectiv-ity existed between populations. Additionally, it is not clear whether these populations are rapidly losinggenetic diversity due to population bottlenecks. Using mitochondrial and microsatellite data, we examinepatterns of genetic variation in southern California and one of the last remaining populations of R. mus-cosa in the southern Sierra Nevada. We find low levels of genetic variation within each population andevidence of genetic bottlenecks. Additionally, substantial population structure is evident, suggesting ahigh degree of historical isolation within and between mountain ranges. Based on estimates from amulti-population isolation with migration analysis, these populations diversified during glacial episodesof the Pleistocene, with little gene flow during population divergence. Our data demonstrate that uniqueevolutionary lineages of R. muscosa occupy each mountain range in southern California and should bemanaged separately. The captive breeding program at Dark Canyon is promising, although mitigatingthe loss of neutral genetic diversity relative to the natural population might require additional breedingfrogs.
� 2011 Elsevier Ltd. All rights reserved.
1. Introduction
Over the last few decades, dramatic and persistent populationdeclines have been documented in amphibian species throughoutthe world (Wake and Vredenburg, 2008) resulting in an unprece-dented crisis with over 32.5% of known species considered ‘‘glob-ally threatened’’. Tremendous effort has been expended to collectinformation and document declines (Global Amphibian Assess-ment, 2004), but in many cases adequate information is lackingfor prioritizing major threats or management actions. In thosefew cases where restoration and recovery efforts have been under-
ll rights reserved.
. Schoville), [email protected]), [email protected] ([email protected] (D.A. Wood),
y, University of California, San
taken for amphibians (Griffiths and Pavajeau, 2008; Semlitsch,2002), basic information on population demography and connec-tivity have been essential in setting management guidelines. How-ever, this information can be difficult to obtain using fieldecological methods, especially if populations have declined to verylow numbers. Genetic data provide an alternative method toreconstruct the demography of populations and can be used toestimate historical migration rates between populations, even aftersubstantial fragmentation has taken place (Delaney et al., 2010;Frankham, 1995).
In the United States, the number of endangered frog species orcandidates for listing is disproportionally represented in the west(US Fish and Wildlife Service), where population declines havebeen particularly notable in Rana species for several decades(Fisher and Shaffer, 1996; Hayes and Jennings, 1986). The southernmountain yellow-legged frog, Rana muscosa, along with its sisterspecies, the Sierra mountain yellow-legged frog Rana sierrae, is aprominent example of an enigmatic range-wide population crash.

2032 S. D. Schoville et al. / Biological Conservation 144 (2011) 2031–2040
Although these species were once considered abundant in mon-tane aquatic habitats of California (Schoenherr, 1976; Stebbinsand Cohen, 1995), they have declined dramatically (>93%) acrosstheir range, even in well-protected habitats of the National Parksand National Forests (Vredenburg et al., 2007). The decline of R.muscosa in southern California has been even more severe, withextinction at >99% of historical sites (Backlin et al., 2004), leadingto its listing as an endangered distinct population segment (US Fishand Wildlife Service, 2002). A number of factors have been linkedto the decline of R. muscosa in the Sierra Nevada, including chytrid-iomycosis (Briggs et al., 2005) and predation by invasive trout(Vredenburg, 2004). In southern California, additional threats in-clude habitat degradation, stream channelization, fire, post-firedebris flows, and pollution, and remaining populations mostly per-sist in headwater sites that do not experience these issues.
Previously, mitochondrial data were used to characterize thephylogenetic relationships, split R. muscosa and R. sierrae, and iden-tify three major geographically isolated clades within each lineage(Macey et al., 2001; Vredenburg et al., 2007). While this informa-tion has been critical in the conservation of this species, there isa pressing need to examine genetic diversity within the remainingpopulations and connectivity among populations. In southernCalifornia, ongoing monitoring efforts have located nine extantpopulations in three mountain ranges (Backlin et al., 2004; Lewis,2009), some separated by only a few kilometers. Efforts to restorehabitat are ongoing and a program for captive breeding andreintroduction has been set up by the San Diego Zoo Institute forConservation Research. In order to facilitate the managementand recovery of endangered populations of southern CaliforniaR. muscosa, we analyze patterns of mitochondrial and microsatellite
genetic diversity. Our analysis focuses on answering three centralquestions, utilizing data from over 600 individuals and includingthe closest remaining population in the Sierra Nevada. First, whatare the levels of genetic variation in southern California R. muscosaand is there a reduction of variation in the captive population rel-ative to its source population? Second, how is genetic variationstructured among populations at a local and regional scale? Andthird, what is the history of population divergence and gene flowin southern R. muscosa? Based on our results, we discuss how man-agement efforts and captive breeding programs can maintain evo-lutionary diversity in populations of southern California R. mucosa.
2. Material and methods
2.1. Field sampling
U.S. Geological Survey (USGS) personnel collected tissue sam-ples of Rana muscosa during surveys in 2003–2009 from nine un-ique locations: South Fork Big Rock Creek, Little Rock Creek, BearGulch, Vincent Gulch, Devils Canyon, East Fork City Creek, Fuller-Mill Creek, Dark Canyon, and Tahquitz Creek (Fig. 1). Additionally,we obtained samples in 2004 from Milestone Basin, the nearest ex-tant population in the southern Sierra Nevada. Other populationsin the southern Sierra Nevada are considered extinct (Vredenburget al., 2007). Tissue samples consisted of toe clips of post-metamorphicfrogs and tail clips of tadpoles, preserved in 95% ethanol, takenfrom 614 individuals across all populations (SupplementaryTable 1S), representing the majority of animals alive and presentin southern California for the last decade and are currently main-tained by USGS.
2.2. Genetic data collection
Genomic DNA was extracted using PrepMan Ultra™ reagent(Applied Biosystems), with the following modifications to the man-
ufacturer’s protocol: tissue was combined with 45 ll of PrepManand 40 mg of silica beads, shaken on a beadbeater for 90 s, digestedand centrifuged for 30 s. We amplified each individual at ninemicrosatellite loci (Supplementary Table 2S) by polymerase chainreaction (PCR) using primers designed by Genetic Information Ser-vices (GIS). PCR products were run on a 3730 capillary sequencerwith the GeneScan� Liz 500 size standard (Applied Biosystems).
Sequence data encompassing the mitochondrial ND1–ND2genes, including tRNAs Ile, Gln and Met (�1500 bp), was targetedto match sequences available from previous studies (Macey et al.,2001; Vredenburg et al., 2007). In a subset of 57 individuals sam-pled across populations of southern California R. muscosa (Supple-mentary Table 1S), we PCR amplified four overlapping segmentsand sequenced in both directions using BigDye v3.1� chemistry.We edited and aligned chromatograms in Sequencher� v.4.8 (GeneCodes Corporation). Sequences from previous analyses includepopulations of R. muscosa and its sister taxon, R. sierrae, as wellas the out-groups Rana catesbeiana, Rana aurora, and Rana cascadae.All unique haplotypes have been submitted to GenBank at theNational Center for Biotechnology Information (NCBI, JF27239-JF27259).
2.3. Population genetic analysis
Variability at each microsatellite locus was tested for deviationfrom Hardy–Weinberg equilibrium (HWE) using chi-square andFisher’s Exact tests, across all available samples and for a subsetof the data including only adult frogs. HWE tests were conductedfor each locus within each population, and due to the large numberof tests (n = 90), the level of statistical significance (a = 0.05) wasadjusted by Dunn-Šidák correction (1 � (1 � a)1/n). We also calcu-lated the mean number of alleles (allelic richness), observed andexpected heterozygosity, and the fixation index averaged acrossloci for each population. All statistical tests were conducted withinGENALEX v6.4 (Peakall and Smouse, 2006) and ARLEQUIN v3.5.1.2(Excoffier and Lischer, 2010).
To test for genetic bottlenecks in each population, we calculatedthe sign-test (Cornuet and Luikart, 1996) and M-ratio statistic (Garzaand Williamson, 2001). The sign-test examines whether there isan excess of heterozygosity across loci, which occurs when theeffective population size is sharply reduced during a populationbottleneck. This was calculated in the program BOTTLENECK (Piryet al., 1999) assuming the two-phase model (T.P.M.) with varianceset to 30 and probability set to 70%, and significance assessed over10,000 replicates. The M-ratio statistic examines the ratio of thenumber of alleles and the allele range, with the expectation thatthe number of alleles declines faster than the allele range in a bot-tlenecked population. The M-ratio was calculated in ARLEQUIN andtested for significance by comparison to simulated data. We simu-lated genetic diversity in a population with constant size at amicrosatellite locus evolving under a single step mutation model,with a mean size of multistep mutation set to 3.5 and theproportion of single steps set at 0.89 (as suggested by Garza andWilliamson, 2001, based on their survey of the literature). Fromeach simulated dataset, a sample size of 20 diploid individualswas drawn, from a total of 10,000 datasets. Critical values(a = 0.05) of the M-ratio, below which an M-ratio value would belikely to indicate a bottleneck, were determined for two levels ofancestral theta, h = 1 and 10.
In order to compare the captive population of R. muscosa fromDark Canyon to the resident population, a principal coordinateanalysis (PCoA) was used to summarize microsatellite genetic var-iation in these two groups. The eigenvectors of the PCoA were cal-culated from a covariance matrix with data standardization usingthe program GENALEX.

Fig. 1. Approximate geographical distribution of Rana muscosa and R. sierrae in California (boxes), with genetic sampling locations (circles) superimposed on a digitalelevation map.
S. D. Schoville et al. / Biological Conservation 144 (2011) 2031–2040 2033
2.4. Geographic pattern of genetic variation
A mitochondrial gene tree was estimated using an unrootedBayesian method in the program MRBAYES v3.1.2 (Ronquist andHuelsenbeck, 2003). The data were partitioned by gene (ND1, t-Ile, t-Met, t-Gln, and ND2) and the software MRMODELTEST2v2.3 (Nylander, 2004) was used to estimate models of molecularevolution for each partition using Akaike Information Criteria(AIC, Akaike, 1973). The best fitting models were: ND1 GTR + G,t-Ile K80, t-Met K80, t-Gln HKY, and ND2 GTR + G. Two indepen-dent runs of MRBAYES were used to build a 50% majority-rule con-sensus tree. The following conditions were used: 30 million steps,four chains, genealogies sampled every 1000 steps. Performance ofthe Markov Chain Monte Carlo (MCMC) sampler was assessed forconvergence using TRACER v1.5 (Rambaut and Drummond,2009), where a 25% burn-in was selected before summarizinggenealogies. To visualize evolutionary relationships using themicrosatellite data, average Nei’s genetic distance was calculatedfor pairwise population comparisons and used to plot an unrootedneighbor-joining tree.
Population structure in the microsatellite data was assessedusing a Bayesian clustering algorithm implemented in the programSTRUCTURE v2.3.3, with population identifiers used as prior infor-mation (Hubisz et al., 2009; Pritchard et al., 2000). We used theadmixture model with correlated allele frequencies to accountfor any migrants in the dataset, following recommendations ofFrançois and Durand (2010). STRUCTURE was run for the adult frogdataset by setting the cluster (‘‘k’’) value incrementally from 1 to11with eleven independent runs at each k value. A burn-in period of100,000 steps was followed by MCMC sampling for 1 million steps.After determination of the k value with the lowest log-likelihoodscore (k = 9), the 11 independent runs at k = 9 were summarizedusing the program CLUMPP (Jakobsson and Rosenberg, 2007) withthe LargeKGreedy algorithm and 10,000 permutations. The pro-
gram DISTRUCT (Rosenberg, 2004) was used to graphically displaythe output. The STRUCTURE analysis was also run using the entiredataset, with a three iterations at each k and an additional 10 iter-ations at k = 9.
In addition, population differentiation based on microsatellitegenetic variation was measured using pairwise F-statistics (FST),an analysis of molecular variance (AMOVA), and principle coordi-nates analysis. FST was measured in the adult frogs using two met-rics of genetic variation, the number of alleles and the correctedpairwise difference based on the sum of squared differences inthe number of repeats. Geographical partitioning of microsatellitegenetic variation between the San Gabriel, San Bernardino andSan Jacinto Mountains was assessed using an AMOVA with F statis-tics (Excoffier et al., 1992). Genetic variation was partitioned hier-archically at four levels: within individuals, among individuals,among populations, and among regions. Differentiation at thesehierarchical levels was assessed for statistical significance by per-muting the data 1000 times in ARLEQUIN. PCoA was used to sum-marize microsatellite genetic variation of all adult frogs, among allpopulations. The eigenvectors of the PCoA were calculated from acovariance matrix with data standardization using the programGENALEX.
Finally, both mitochondrial and microsatellite genetic data wereexamined for genetic isolation by distance (IBD). Matrices of genet-ic distance were compared to two different measures of geographicdistance. First, a matrix of log-transformed Euclidean distance wascalculated between all sites. However, amphibians often havestrong preferences and ecological restrictions for habitat type dur-ing dispersal, which can alter the observed relationship betweengeographic distance and genetic distance of population pairs(Wang et al., 2009). Therefore, a second matrix of least-cost dis-tance was calculated using python scripts (Etherington, 2010) inArcGIS v9.3 (ESRI), with cost penalties assigned for changes in ele-vation and movement away from freshwater habitat. Maps of digital

2034 S. D. Schoville et al. / Biological Conservation 144 (2011) 2031–2040
elevation (30 arcsecond resolution) and water boundaries weredownloaded from the California Spatial Information Library (CaSIL,www.atlas.ca.gov). Mitochondrial genetic variation (available fromeight sites) was used to calculate PhiST assuming a Jukes-Cantorsubstitution model, and a mantel test of genetic and geographicdistance was conducted using the program IBD (Jensen et al.,2005), with statistical significance assessed with 1000 permuta-tions. Similarly, microsatellite genetic distance (available fromnine sites) based on the estimator â was tested against geograph-ical distance in the program GENEPOP’007 (Rousset, 2008), withstatistical significance assessed with 1000 permutations.
2.5. Biogeographic history
We examined the fit of an isolation with migration model(Nielsen and Wakeley, 2001) to our data in order to reconstruct thepopulation history of southern California populations of R. muscosa.This model parameterizes the divergence time, population sizeand migration rate of diverging populations using multi-locus coa-lescent analysis. Recently, the method has been extended in theprogram IMa2 (Hey, 2010) to infer the divergence time and demog-raphy of up to four populations assuming a known phylogeny. Weuse this model to examine the history of four regions in our study(Sierra Nevada, San Gabriel, San Bernardino, and San Jacinto Moun-tains). Populations within each mountain range were combinedand relationships based on the mitochondrial gene tree were usedto define the four-population phylogeny. The analysis was runusing both mitochondrial and microsatellite data (the VincentGulch population was excluded due to missing mitochondrialdata), with 40 heated chains (geometric heating with nonlinear-ity = 0.975 and b = 0.75). After an initial run was monitored forconvergence to determine an appropriate burn-in (350,000 steps),the state of the Markov chain was saved and used to seed five sep-arate runs (1 million steps, with 10,000 genealogies saved fromeach). These runs were combined to estimate demographic anddivergence time parameters. Because no mitochondrial mutationrate is available based on fossil studies of Rana, we set the substi-tution rate to 0.65%/million years (with a range of 0.57–0.69%) fol-lowing Macey et al. (2001) and the generation time was set to7 years. The generation time is based on unpublished estimatesfrom field ecological data (A. Backlin and V. Vredenburg). Likeli-hood ratio tests were used to assess the significance of migrationrate estimates (a = 0.001).
3. Results
3.1. Genetic variation
Several populations exhibit statistically significant deviationsfrom HWE after Dunn-Šidák correction (Supplementary Table 3S)and the number of significant tests is higher using the chi-squaremethod versus Fisher’s Exact method. When only adult frogs areconsidered, the number of significant tests declines, irrespectiveof the statistical method. There is no clear trend of deviation fromHWE at specific loci across all populations and there is no clearpredominance of deviations in specific populations, which suggeststhat HWE deviations are not a result of null alleles or admixture.For measures of population differentiation (STRUCTURE, FST, andAMOVA) that might be sensitive to deviations from HWE, we con-ducted analyses using adult samples and all individuals. The re-sults are qualitatively similar, so all individuals were used inother analyses.
Comparison of microsatellite variability averaged across loci(Table 1) shows that the mean number of alleles and observed het-erozygosity are similar across populations, except that the captive
population has lower values. Differences in the observed and ex-pected heterozygosity, as measured in the fixation index, showthat most populations do not have a deficit of heterozygous indi-viduals. However, East Fork City Creek and Little Rock Creek dohave deficits that differ significantly from zero, but the level ofinbreeding is not high. Several other populations, including Vin-cent Gulch, Bear Gulch, Fuller-Mill Creek and the captive popula-tion, have an excess of observed heterozygosity resulting innegative fixation indices, but these are not significantly differentfrom zero. Signatures of population bottlenecks are evident acrosssouthern California R. muscosa populations (Table 2). Based on thesign-test and Wilcoxin sign-rank test, Dark Canyon shows a signif-icant bottleneck, while East Fork City Creek is significant under thestandardized difference test. Using the M-ratio statistic, all popula-tions have values below critical thresholds of a sample drawn froma moderate (h = 1) to large (h = 10) population. This includes theMilestone Basin population in the Sierra Nevada. Differences in ge-netic variability in the resident Dark Canyon population and cap-tive population are evident in the principal coordinates analysis(Fig. 2). A plot of the first two components (representing 27.1%and 24.4% of the variation, respectively) indicates less dispersion(or total genetic variation) along the two axes in the captivepopulation.
3.2. Geographic structure of population genetic variation
Mitochondrial haplotypes from the San Gabriel, San Bernardinoand San Jacinto Mountains differ by 0.1–2.0% in an uncorrectedpairwise comparison and unique mitochondrial haplotypes arefound in almost every population. Shared haplotypes occur onlybetween Little Rock Creek and Devils Canyon, and Fuller-Mill Creekand Dark Canyon. The Bayesian gene tree (Fig. 3A) places southernCalifornia R. muscosa in two distinct clades, one exclusive to thesouthern mountain ranges and the other shared between thesouthern mountain ranges and the Sierra Nevada. Samples fromLittle Rock Creek and Devils Canyon in the San Gabriel Mountainsoccur in both clades. The neighbor-joining tree estimated fromaverage Nei’s genetic distance of the microsatellite data (Supple-mentary Fig. 1S) is topologically similar to the mitochondrial genetree, except that populations in the San Gabriel Mountains are notsplit into two clades and the Milestone Basin population is esti-mated to be more closely related to the San Bernardino and SanJoaquin Mountain populations.
The analysis of microsatellite variation using the admixturemodel of STRUCTURE shows a distinct plateau in the log likelihoodof the data at nine clusters (Fig. 3B). The improvement in the log-likelihood from k = 8 to k = 9 is slight, and results in subdividingindividuals with incomplete assignment to a 9th cluster in theDark Canyon population. Clusters represent every distinct sam-pling site, except Vincent Gulch and Bear Gulch are indistinguish-able, and the sample from Tahquitz Creek and the captivepopulation are not distinguished from the resident Dark Canyonpopulation. Two individuals from South Fork Big Rock Creek ap-pear to be admixed or migrants from Devils Canyon. When the datainclude all samples, the peak in the log-likelihood occurs at k = 9and the results are qualitatively the same (Supplementary Fig. 2S).
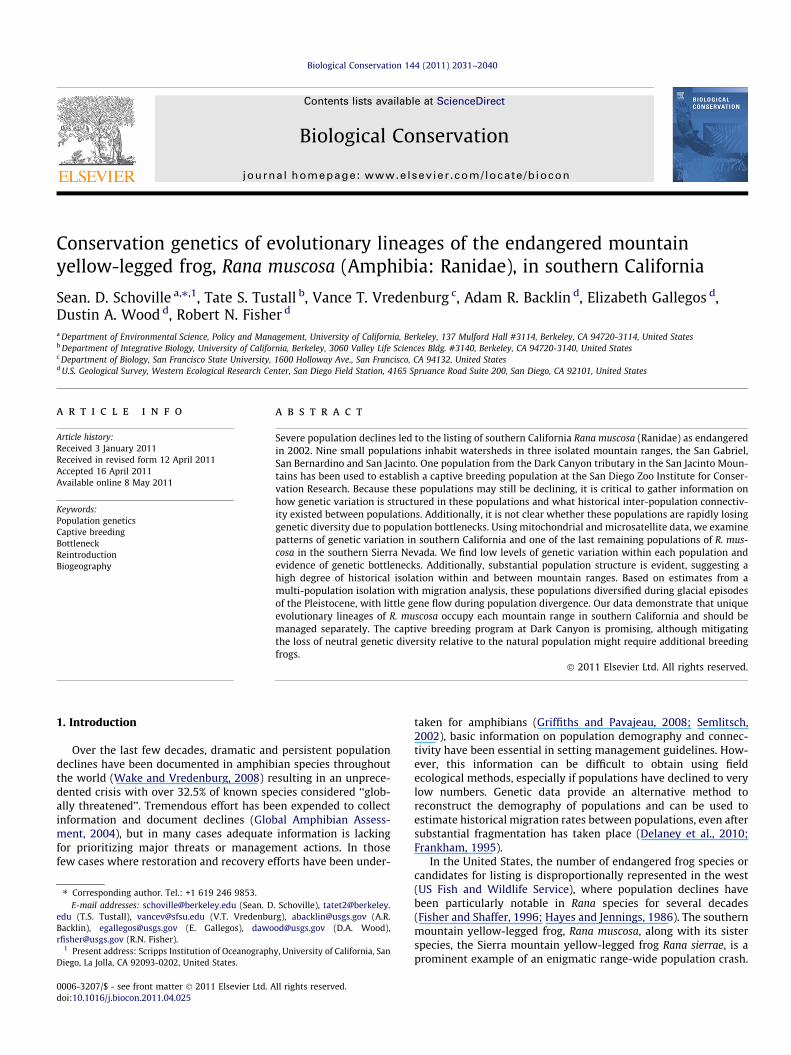
Population differentiation based on pairwise FST of the microsat-ellite data (Table 3), using the number of alleles or corrected pair-wise divergence, provides evidence of significant populationdifferentiation in all populations comparisons, except in contrastsof Vincent Gulch and Bear Gulch, and the Dark Canyon residentand captive populations. Similarly, the AMOVA of populations fromSan Gabriel, San Bernardino and San Jacinto (SupplementaryTable 4S) shows evidence of significant genetic structure amongpopulations within each mountain range (24% of the total varia-tion) and among mountain ranges (25% of the total variation).

Table 1Genetic variability of microsatellite loci in populations of southern California Rana muscosa.
All Individuals Adults
N AR Ho He F N AR Ho He F
Milestone BasinMean 56.000 4.444 0.358 0.400 0.108 56.000 4.667 0.358 0.400 0.109SE 14.056 1.271 0.107 0.112 0.068 14.056 1.333 0.107 0.112 0.068
Devils CanyonMean 53.667 4.222 0.480 0.504 0.082 23.667 3.889 0.512 0.480 �0.052SE 3.543 0.364 0.079 0.059 0.070 1.795 0.309 0.089 0.069 0.071
Little Rock CreekMean 61.778 4.333 0.475 0.523 0.106 40.667 4.111 0.434 0.521 0.178SE 2.414 0.289 0.063 0.052 0.049 4.298 0.611 0.060 0.053 0.053
South Fork Big Rock CreekMean 71.889 4.556 0.411 0.433 0.116 9.111 2.889 0.446 0.454 0.023SE 6.617 0.648 0.080 0.079 0.076 0.772 0.512 0.089 0.077 0.090
Vincent GulchMean 12.667 3.222 0.556 0.454 �0.254 12.444 3.333 0.511 0.426 �0.218SE 1.213 0.683 0.118 0.094 0.119 1.435 0.553 0.115 0.088 0.129
Bear GulchMean 20.556 3.778 0.539 0.466 �0.129 40.333 2.556 0.514 0.431 �0.170SE 2.205 0.521 0.125 0.104 0.037 4.055 0.338 0.127 0.104 0.104
East Fork City CreekMean 80.556 3.333 0.263 0.305 0.236 18.333 4.778 0.253 0.301 0.210SE 8.774 0.333 0.072 0.068 0.127 1.312 0.364 0.076 0.067 0.129
Fuller-Mill CreekMean 42.667 5.556 0.647 0.583 �0.060 29.889 4.111 0.651 0.577 �0.115SE 3.371 0.242 0.100 0.077 0.062 2.632 0.389 0.101 0.086 0.027
Dark CanyonMean 76.778 4.667 0.467 0.468 0.013 56.000 4.667 0.358 0.400 0.109SE 5.387 0.289 0.046 0.026 0.066 14.056 1.333 0.107 0.112 0.068
Captive populationMean 36.556 1.667 0.248 0.241 �0.028 36.556 1.778 0.250 0.242 �0.032SE 7.848 0.373 0.066 0.064 0.035 7.848 0.401 0.067 0.064 0.036
Total over Loci and populationsMean 46.737 3.737 0.434 0.413 �0.012 27.424 3.323 0.432 0.411 �0.035SE 3.144 0.201 0.031 0.025 0.032 2.183 0.194 0.031 0.026 0.033
N sample size; AR mean number of alleles; Ho observed heterozygosity; He expected heterozygosity; F fixation index ((Ho � He)/He).
Table 2Statistical tests of genetic bottlenecks in Rana muscosa populations.
Sign test p-value Standardized difference test Wilcoxin sign-rank deficiency test M-ratio* Standard deviation
Milestone Basin 0.53257 0.25193 0.5 0.16001 0.08982Devils Canyon 0.58308 0.46852 0.78711 0.19986 0.08104Little Rock Creek 0.55832 0.4858 0.82031 0.20755 0.06429South Fork Big Rock Creek 0.43969 0.0566 0.45508 0.21913 0.08367Vincent Gulch 0.12511 0.05119 0.99609 0.27455 0.11485Bear Gulch 0.62448 0.44211 0.54492 0.2175 0.09429East Fork City Creek 0.38881 0.04406 0.15039 0.17473 0.11237Fuller-Mill Creek 0.5487 0.18393 0.5 0.19571 0.0658Dark Canyon 0.00512 0.05855 0.00977 0.17857 0.03724Captive population 0.08826 0.08043 0.98438 0.20969 0.12407
* Statistically significant tests shown in bold type. Based on simulations, M-ratio values less than 0.42 (h = 10) or 0.43 (h = 1) are significant and indicate a bottleneck.
S. D. Schoville et al. / Biological Conservation 144 (2011) 2031–2040 2035
Within-individual variation is also significant and accounts for 51%of the total variation. PCoA analysis of all adult frogs (Supplemen-tary Fig. 3S) shows clear separation of populations in the threemountain ranges along the first two axes (�54% of the total varia-tion). Populations within each mountain range occupy uniquecoordinate space in the PCoA, with the exception of Vincent Gulchand Bear Gulch and the captive and resident Dark Canyon popula-tion. Finally, a weak trend of isolation by distance is supported inthe mitochondrial dataset, with log-transformed Euclidean dis-tance significantly correlated to genetic distance (r = 0.393,p = 0.018) as well as least-cost geographic distance (r = 0.395,p = 0.022). However, isolation by distance is not evident in the
microsatellite dataset with either log-transformed Euclidean dis-tance (â = 0.329, p = 0.123) or least-cost distance (â = 0.730,p = 0.116).
3.3. Biogeographic history
The multi-population isolation with migration model (Fig. 4)estimates the split of San Bernardino and San Jacinto populationsat 47,000 years before present (95% range: 33,654–127,885 YBP),the split of San Gabriel and the combined San Bernardino-San Jac-into lineage at 289,423 YBP (95% range: 275,962–3641,346 YBP),and the split of southern California lineages from the Sierra Nevada

Coo
rdin
ate
2
Coordinate 1
Dark Canyon
Captive Population
Fig. 2. Principal coordinates analysis of microsatellite variation in the Dark Canyonresident population and captive breeding population. The first two componentsaccount for 52% of the total genetic variation.
2036 S. D. Schoville et al. / Biological Conservation 144 (2011) 2031–2040
(Milestone Basin) at 1.42 MYBP (95% range: 1299,038–4745,192YBP). San Jacinto and San Bernardino have smaller effective popu-lations (Ne = 10,817, 95% range: 10,817–39,664) compared toeither the San Gabriel (Ne = 284,856, 95% range: 191,106–782,452) or Milestone Basin populations (Ne = 118,991, 95% range:104,567–400,241; Fig. 4). Going backwards in time, effective pop-
Fig. 3. Population genetic structure in southern California Rana muscosa indicated by the(posterior probability support values shown at the nodes) and (B) STRUCTURE analysis owith increasing number of clusters (k), ten replicates at each k, showing a distinct platemembership shown at k = 9.
ulation size grows considerably in the combined San Jacinto andSan Bernardino lineage (Ne = 616,586, 95% range: 219,952–1914,663), the combined southern California mountains lineage(Ne = 659,856, 95% range: 501,202–7020,432), and the ancestrallineage of the entire genealogy (Ne = 4546,875, 95% range:2635,817–6991,579). Migration between populations is only ob-served in the most recent time period, from San Gabriel into SanJacinto (2Nm = 0.157, 95% range: 0.093–0.412), San Bernardino intoSan Gabriel (2Nm = 1.079, 95% range: 0.592–1.983), and San Gabrielinto San Bernardino (2Nm = 0.098, 95% range: 0.024–0.219).
4. Discussion
4.1. Conservation genetics of southern california rana muscosa
The precipitous decline of populations of R. muscosa in southernCalifornia led to their listing as a federally endangered distinctpopulation segment in 2002 (US Fish and Wildlife Service, 2002).Based on mark-recapture surveys, the nine remaining populationsare small and have not been observed exchanging migrants (Backlinet al., 2004). These populations have continued to decline and
(A) Bayesian mitochondrial gene tree of R. muscosa, R. sierrae, and related out-groupsf microsatellite variation of adult frogs (plot of the posterior likelihood of the data
au at k = 9), with corresponding plot of individual posterior probabilities for cluster
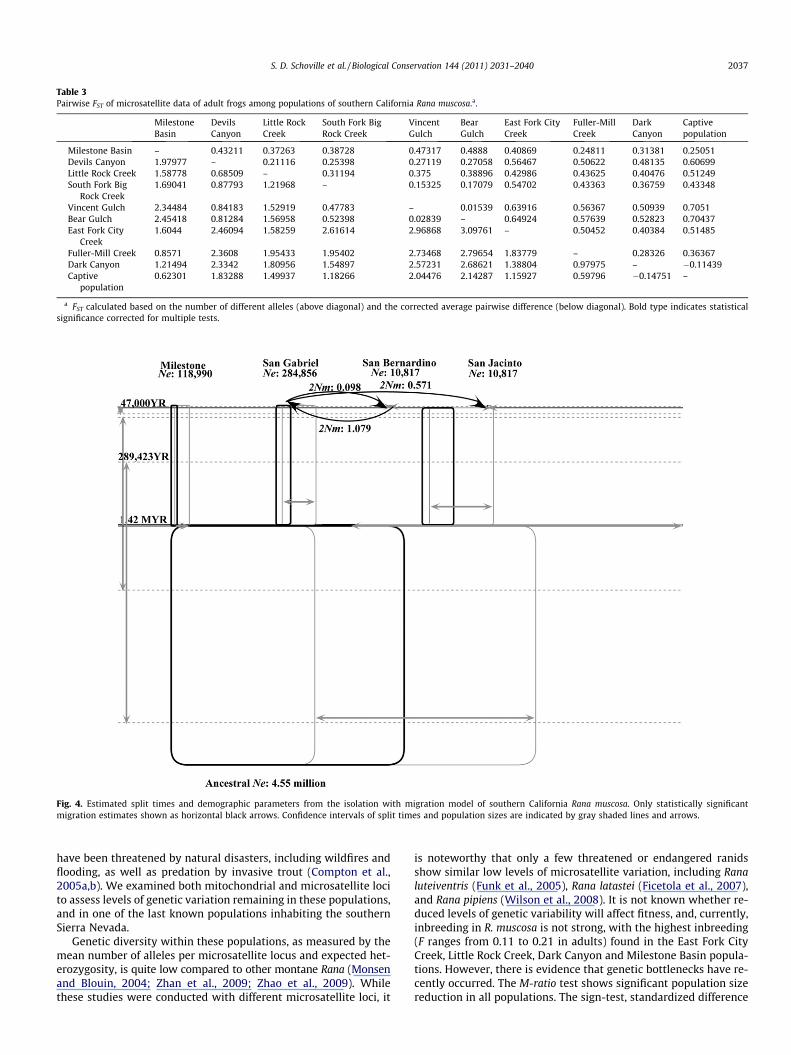
Table 3Pairwise FST of microsatellite data of adult frogs among populations of southern California Rana muscosa.a.
MilestoneBasin
DevilsCanyon
Little RockCreek
South Fork BigRock Creek
VincentGulch
BearGulch
East Fork CityCreek
Fuller-MillCreek
DarkCanyon
Captivepopulation
Milestone Basin – 0.43211 0.37263 0.38728 0.47317 0.4888 0.40869 0.24811 0.31381 0.25051Devils Canyon 1.97977 – 0.21116 0.25398 0.27119 0.27058 0.56467 0.50622 0.48135 0.60699Little Rock Creek 1.58778 0.68509 – 0.31194 0.375 0.38896 0.42986 0.43625 0.40476 0.51249South Fork Big
Rock Creek1.69041 0.87793 1.21968 – 0.15325 0.17079 0.54702 0.43363 0.36759 0.43348
Vincent Gulch 2.34484 0.84183 1.52919 0.47783 – 0.01539 0.63916 0.56367 0.50939 0.7051Bear Gulch 2.45418 0.81284 1.56958 0.52398 0.02839 – 0.64924 0.57639 0.52823 0.70437East Fork City
Creek1.6044 2.46094 1.58259 2.61614 2.96868 3.09761 – 0.50452 0.40384 0.51485
Fuller-Mill Creek 0.8571 2.3608 1.95433 1.95402 2.73468 2.79654 1.83779 – 0.28326 0.36367Dark Canyon 1.21494 2.3342 1.80956 1.54897 2.57231 2.68621 1.38804 0.97975 – �0.11439Captive
population0.62301 1.83288 1.49937 1.18266 2.04476 2.14287 1.15927 0.59796 �0.14751 –
a FST calculated based on the number of different alleles (above diagonal) and the corrected average pairwise difference (below diagonal). Bold type indicates statisticalsignificance corrected for multiple tests.
Fig. 4. Estimated split times and demographic parameters from the isolation with migration model of southern California Rana muscosa. Only statistically significantmigration estimates shown as horizontal black arrows. Confidence intervals of split times and population sizes are indicated by gray shaded lines and arrows.
S. D. Schoville et al. / Biological Conservation 144 (2011) 2031–2040 2037
have been threatened by natural disasters, including wildfires andflooding, as well as predation by invasive trout (Compton et al.,2005a,b). We examined both mitochondrial and microsatellite locito assess levels of genetic variation remaining in these populations,and in one of the last known populations inhabiting the southernSierra Nevada.
Genetic diversity within these populations, as measured by themean number of alleles per microsatellite locus and expected het-erozygosity, is quite low compared to other montane Rana (Monsenand Blouin, 2004; Zhan et al., 2009; Zhao et al., 2009). Whilethese studies were conducted with different microsatellite loci, it
is noteworthy that only a few threatened or endangered ranidsshow similar low levels of microsatellite variation, including Ranaluteiventris (Funk et al., 2005), Rana latastei (Ficetola et al., 2007),and Rana pipiens (Wilson et al., 2008). It is not known whether re-duced levels of genetic variability will affect fitness, and, currently,inbreeding in R. muscosa is not strong, with the highest inbreeding(F ranges from 0.11 to 0.21 in adults) found in the East Fork CityCreek, Little Rock Creek, Dark Canyon and Milestone Basin popula-tions. However, there is evidence that genetic bottlenecks have re-cently occurred. The M-ratio test shows significant population sizereduction in all populations. The sign-test, standardized difference

2038 S. D. Schoville et al. / Biological Conservation 144 (2011) 2031–2040
test, and Wilcoxin sign-rank test show a significant result in twodifferent populations. The negative fixation indices in several addi-tional populations (Table 1) show a trend towards an excess of ob-served heterozygosity. However, it is well known that there is lessstatistical power to detect a bottleneck with the sign-test or Wilc-oxin sign-rank test (Williamson-Natesan, 2005), unless a strongbottleneck is very recent and/or ongoing, because heterozygosityrapidly returns to equilibrium values.
Population structure is evident among populations in southernCalifornia in both mitochondrial and microsatellite datasets(Fig. 3). With the exception of Vincent and Bear Gulch (which arenot distinguishable in our data), every population appears to begenetically isolated with very little inter-population gene flow.This is not entirely surprising, as closely related ranids show a highdegree of population structure among drainage basins (Funk et al.,2005; Lind et al., 2011). While the observed bottlenecks could ex-plain allele frequency differences between our populations of R.muscosa, the analysis of the Dark Canyon wild and captive popula-tion suggests that recent bottlenecks are not inflating populationstructure. Isolation by distance is also known to exaggerate popu-lation structure (Frantz et al., 2009) and to positively bias detectionof population bottlenecks (Leblois et al., 2006), but it does not ap-pear to be a factor in the observed genetic structure of the micro-satellite data. While a weak signature of isolation by distance isevident in the mitochondrial dataset, it is likely to reflect olderdemographic events that are retained in the coalescent history ofthe mitochondrial loci. The pattern of IBD in the mitochondrialdata is consistent with our biogeographic model, where IBD is anexpected outcome of the initial spatial expansion and stepwisediversification of R. muscosa into southern California.
4.2. Biogeographic history of Southern California mountains
R. muscosa occupies streams in montane forests of the San Jacin-to, San Bernardino and San Gabriel Mountains, with a surroundinglandscape of unsuitable habitat. While dispersal between thesepopulations and to/from the southern Sierra Nevada is unlikely tooccur in the current climate, paleoclimate records suggest a greaterdegree of habitat connectivity in the past (Hall, 2007). Fossil re-cords indicate the presence of mixed conifer forest almost 900 mlower than present during the last glacial period (�41 KYBP;Anderson et al., 2002) and a significantly cooler and wetter climatelasting into the Holocene period (Bird and Kirby, 2006). Duringperiods of wetter climate, stream drainages and lacustrine environ-ments expanded around the southern California mountains and thewestern Mojave Basin (Orme, 2008). It is likely that pluvio-glacialcycles of the Pleistocene epoch increased the amount of suitablehabitat for R. muscosa, facilitating spatial movement and popula-tion expansion, while warm and dry interglacial climates led toperiods of genetic isolation.
Estimates of divergence time from the isolation with migrationmodel are a plausible fit to this scenario (Fig. 4). Our analysissuggests that population divergence between San Jacinto and SanBernardino populations began near the end of last glacial stage(�47 KYBP), as gene flow was sufficiently reduced (2Nm 6 1) tofacilitate divergence due to genetic drift. The San Gabriel lineageis estimated to have diverged from the combined San Jacinto-SanBernardino lineage near the end of an earlier glacial stage (�289KYBP). Finally, the divergence of southern California populationsfrom the Sierra Nevada is estimated at 1.42 MYBP, occurring nearthe end of an early Pleistocene glacial stage (Lisiecki and Raymo,2005). While estimates of effective population size have large con-fidence intervals, the relative increases going backwards in timemay be indicative of substantial population declines during thepresent interglacial period. Estimates of effective population sizesuggest that the San Jacinto and San Bernardino lineages are smal-
ler than the other lineages. However, these estimates may be in-flated by underlying population structure in each mountainrange (Wakeley, 2001), which is not accounted for in the isolationwith migration model (Hey, 2010). While the effect of recent bot-tlenecks might decrease estimated rates of gene flow, it is notlikely to have an effect on estimates of divergence time (Johnsonet al., 2007).
4.3. Captive breeding, reintroduction and conserving evolutionarylineages
Efforts to maintain viable populations during severe populationdecline typically benefit from programs that facilitate recruitment,including captive breeding and reintroduction (Ballou and Foose,2010). Amphibians are considered good candidates for captivebreeding programs because they have high fecundity, breed multipletimes as adults, and have low maintenance requirements (Griffithsand Pavajeau, 2008). Estimates of population size in southernCalifornia R. muscosa, based on field surveys and mark-recaptureresults, projected that the eight main extant populations werealready in the range of a few hundred individuals or less in 2003(Backlin et al., 2004). Theoretical research suggests that a geneticmeltdown can occur when a small number of individuals (i.e. lessthan 100) comprise the entire breeding population (Lynch et al.,1995), although in practice high inbreeding rates have not alwaysresulted in the demographic collapse of small populations (Kellerand Waller, 2002). Irrespective of the effects of genetic inbreeding,it is essential to maintain larger populations in order to avoid sto-chastic changes in population size due to unpredicted environmen-tal events. During an extreme drought event in August 2006, 82tadpoles were salvaged from drying pools in Dark Canyon tributaryunder federal and state permit, and used to initiate a captivebreeding program at the San Diego Zoo. The captive populationcannot be distinguished genetically from the natural populationbased on microsatellite variation, a result which is supported byboth the Bayesian clustering analysis and measurements of pair-wise FST. However, there is evidence that the captive populationhas less neutral genetic variation, with fewer alleles across loci,lower heterozygosity and less total genetic variation in the princi-ple components analysis.
While conservation efforts of southern California R. muscosashould be directed at maintaining populations in as many sitesas possible, more recent surveys have found very few frogs at sitesin the San Gabriel and San Bernardino Mountains (Compton et al.,2005a,b). Due to recent catastrophic environmental events (firesand subsequent flooding), remaining populations of southernCalifornia R. muscosa continue to decline and genetic diversity lossis likely to be rapid in these populations. At some point, a translo-cation program may be necessary to bring breeding frogs into con-tact or to avoid severe inbreeding depression. Translocationmethods have improved substantially and become an increasinglysuccessful strategy for restoring viable amphibian populations(Germano and Bishop, 2009). However, it is also important tomaintain the unique characteristics of natural populations and toavoid out-breeding depression by mixing evolutionary indepen-dent lineages (Moritz, 1999). Based on the observed genetic struc-ture and biogeographic history, the remaining populations ofsouthern California R. muscosa represent seven distinct popula-tions, with separate lineages represented in each mountain range.Efforts should be taken quickly to ensure that the integrity of theselineages is not sacrificed to maintain a viable gene pool.
Acknowledgements
Samples were collected under a California Department of Fishand Game (CDFG) Scientific Collecting Permit (#90, #5429,

S. D. Schoville et al. / Biological Conservation 144 (2011) 2031–2040 2039
#6178) and US Fish and Wildlife recovery permit TE-045994-11.This is contribution #379 of the Amphibian Research and Monitor-ing Initiative (ARMI). Funding sources include the US ForestService, US Fish and Wildlife Service, California State Parks, CDFGUS Bureau of Land Management, Agua Caliente Band of MissionIndians, Caltrans, the USGS ARMI Program and by National ScienceFoundation Grant EF-0723563. The following people assisted withsample collection: C. Hitchcock, K. Meyer, S. Schuster, C. Brown, K.Baumberger, M. Canfield, S. Hathaway, R. Hirsch, M. Jennings, N.Scott, M. Warburton, and T. Hovey. M. Le, E. Sternberg, and D.Daversa provided assistance during laboratory work. We alsothank three anonymous reviewers for their comments. The use oftrade names does not imply U.S. Government endorsement.
Appendix A. Supplementary material
Supplementary data associated with this article can be found, inthe online version, at doi:10.1016/j.biocon.2011.04.025.
References
Akaike, H., 1973. Information theory and an extension of the maximum likelihoodprinciple. In: B.N. Petrov, F. Caski, (Eds.), 2nd International Symposium onInformation Theory. Akademiai Kiado, Budapest.
Anderson, R.S., Power, M.J., Smith, S.J., Springer, K., Scott, E., 2002. Paleoecology of amiddle Wisconsin deposit from southern California. Quaternary Research 58,310–317.
Backlin, A.R., Hitchcock, C.J., Fisher, R.N., Warburton, M.L., Trenham, P., Hathaway,S.A., Brehme, C.S., 2004. Natural history and recovery analysis for southernCalifornia populations of the mountain yellow-legged frog (Rana muscosa),2003. US Geological Survey Final Report prepared for the California Departmentof Fish and Game, Angeles and San Bernardino National Forests, pp. 1–96.
Ballou, J., Foose, T., 2010. Demographic and genetic management of captivepopulations. Wild Mammals in Captivity: Principles and Techniques for ZooManagement, 219.
Bird, B., Kirby, M., 2006. An alpine lacustrine record of early Holocene NorthAmerican Monsoon dynamics from Dry Lake, southern California (USA). Journalof Paleolimnology 35, 179–192.
Briggs, C., Vredenburg, V., Knapp, R., Rachowicz, L., 2005. Investigating thepopulation-level effects of chytridiomycosis: an emerging infectious diseaseof amphibians. Ecology 86, 3149–3159.
Compton, S.L., Backlin, A.R., Hitchcock, C.J., Fisher, R.N., Hathaway, S.A., 2005a. Datasummary for the 2005 mountain yellow-legged frog (Rana muscosa) surveysconducted in the Angeles National Forest, pp. 1–11. US Geological Survey DataSummary Prepared For the Angeles National Forest, Arcadia, CA.
Compton, S.L., Backlin, A.R., Hitchcock, C.J., Fisher, R.N., Hathaway, S.A., 2005b. Datasummary for the 2005 mountain yellow-legged frog (Rana muscosa) surveysconducted in the San Bernardino National Forest. US Geological Survey DataSummary Prepared for the San Bernardino National Forest, San Bernardino, CA,pp. 1–14.
Cornuet, J., Luikart, G., 1996. Description and power analysis of two tests fordetecting recent population bottlenecks from allele frequency data. Genetics144, 2001.
Delaney, K.S., Riley, S.P.D., Fisher, R.N., 2010. A rapid, strong, and convergent geneticresponse to urban habitat fragmentation in four divergent and widespreadvertebrates. PLoS One 5, e12767.
Etherington, T.R., 2010. Python based GIS tools for landscape genetics: visualisinggenetic relatedness and measuring landscape connectivity. Methods in Ecologyand Evolution.
Excoffier, L., Lischer, H.E.L., 2010. Arlequin suite ver 3.5: a new series of programs toperform population genetics analyses under Linux and Windows. MolecularEcology Resources 10, 564–567.
Excoffier, L., Smouse, P., Quattro, J., 1992. Analysis of molecular variance inferredfrom metric distances among DNA haplotypes: application to humanmitochondrial DNA restriction data. Genetics 131, 479.
Ficetola, G.F., Garner, T.W.J., De Bernardi, F., 2007. Genetic diversity, but nothatching success, is jointly affected by postglacial colonization and isolation inthe threatened frog, Rana latastei. Molecular Ecology 16, 1787–1797.
Fisher, R.N., Shaffer, H.B., 1996. The decline of amphibians in California’s GreatCentral Valley. Conservation Biology 10, 1387–1397.
François, O., Durand, E., 2010. The state of the field: spatially explicit Bayesianclustering models in population genetics. Molecular Ecology Resources 10, 773–784.
Frankham, R., 1995. Conservation genetics. Annual Review of Genetics 29, 305–327.Frantz, A., Cellina, S., Krier, A., Schley, L., Burke, T., 2009. Using spatial Bayesian
methods to determine the genetic structure of a continuously distributedpopulation: clusters or isolation by distance? Journal of Applied Ecology 46,493–505.
Funk, W.C., Blouin, M.S., Corn, P.S., Maxell, B.A., Pilliod, D.S., Amish, S., Allendorf,F.W., 2005. Population structure of Columbia spotted frogs (Rana luteiventris) isstrongly affected by the landscape. Molecular Ecology 14, 483–496.
Garza, J.C., Williamson, E.G., 2001. Detection of reduction in population size usingdata from microsatellite loci. Molecular Ecology 10, 305–318.
Germano, J.M., Bishop, P.J., 2009. Suitability of amphibians and reptiles fortranslocation. Conservation Biology 23, 7–15.
Global Amphibian Assessment, 2004. <http://www.globalamphibians.org/>.Griffiths, R.A., Pavajeau, L., 2008. Captive breeding, reintroduction, and the
conservation of Amphibians. Conservation Biology 22, 852–861.Hall, C.A., 2007. Introduction to the Geology of Southern California and its Native
Plants. University of California Press, Berkeley, CA.Hayes, M.P., Jennings, M.R., 1986. Decline of ranid frog species in western North
America: are bullfrogs (Rana catesbeiana) responsible? Journal of Herpetology20, 490–509.
Hey, J., 2010. Isolation with migration models for more than two populations.Molecular Biology and Evolution 27, 905.
Hubisz, M.J., Falush, D., Stephens, M., Pritchard, J.K., 2009. Inferring weak populationstructure with the assistance of sample group information. Molecular EcologyResources 9, 1322–1332.
Jakobsson, M., Rosenberg, N.A., 2007. CLUMPP: a cluster matching and permutationprogram for dealing with label switching and multimodality in analysis ofpopulation structure. Bioinformatics 23, 1801–1806.
Jensen, J.L., Bohonak, A.J., Kelley, S.T., 2005. Isolation by distance, web service. BMCGenetics 6, 13.
Johnson, J.A., Dunn, P.O., Bouzat, J.L., 2007. Effects of recent population bottleneckson reconstructing the demographic history of prairie chickens. MolecularEcology 16, 2203–2222.
Keller, L.F., Waller, D.M., 2002. Inbreeding effects in wild populations. Trends inEcology & Evolution 17, 230–241.
Leblois, R., Estoup, A., Streiff, R., 2006. Genetics of recent habitat contraction andreduction in population size: does isolation by distance matter? MolecularEcology 15, 3601–3615.
Lewis, T., 2009. New population of mountain yellow-legged frog (Rana muscosa)discovered. Herpetological Bulletin 108, 1–2.
Lind, A., Spinks, P., Fellers, G., Shaffer, H., 2011. Rangewide phylogeography andlandscape genetics of the Western US endemic frog Rana boylii (Ranidae):implications for the conservation of frogs and rivers. Conservation Genetics 12,269–284.
Lisiecki, L.E., Raymo, M.E., 2005. A Pliocene–Pleistocene stack of 57 globallydistributed benthic d18O records. Paleoceanography, 20.
Lynch, M., Conery, J., Burger, R., 1995. Mutation accumulation and the extinction ofsmall populations. The American Naturalist 146, 489–518.
Macey, J.R., Strasburg, J.L., Brisson, J.A., Vredenburg, V.T., Jennings, M., Larson, A.,2001. Molecular phylogenetics of western North American frogs of the Ranaboylii species group. Molecular Phylogenetics and Evolution 19, 131–143.
Monsen, K.J., Blouin, M.S., 2004. Extreme isolation by distance in a montane frogRana cascadae. Conservation Genetics 5, 827–835.
Moritz, C., 1999. Conservation units and translocations: strategies for conservingevolutionary processes. Hereditas 130, 217–228.
Nielsen, R., Wakeley, J., 2001. Distinguishing migration from isolation. A Markovchain Monte Carlo approach. Genetics 158, 885–896.
Nylander, J.A.A., 2004. MrModeltest v2. Program distributed by the author,Evolutionary Biology Centre, Uppsala University.
Orme, A., 2008. Lake Thompson, Mojave Desert, California: The Late PleistoceneLake System and its Holocene Desiccation. Late Cenozoic Drainage History ofthe Southwestern Great Basin and Lower Colorado River Region: Geologic andBiotic Perspectives, p. 261.
Peakall, R., Smouse, P.E., 2006. GENALEX version 6.1: genetic analysis in Excel.Population genetic software for teaching and research. Molecular Ecology Notes6, 288–295.
Piry, S., Luikart, G., Cornuet, J.M., 1999. Computer note. BOTTLENECK: a computerprogram for detecting recent reductions in the effective size using allelefrequency data. Journal of Heredity 90, 502.
Pritchard, J.K., Stephens, M., Donnelly, P., 2000. Inference of population structureusing multilocus genotype data. Genetics 155, 945–959.
Rambaut, A., Drummond, A.J., 2009. TRACER: MCMC Trace Analysis Tool Versionv1.5.0. University of Oxford, Oxford.
Ronquist, F., Huelsenbeck, J.P., 2003. MrBayes 3: Bayesian phylogenetic inferenceunder mixed models. Bioinformatics 19, 1572–1574.
Rosenberg, N.A., 2004. DISTRUCT: a program for the graphical display of populationstructure. Molecular Ecology Notes 4, 137–138.
Rousset, F., 2008. Genepop’007: a complete reimplementation of the Genepopsoftware for Windows and Linux. Molecular Ecology Resources 8, 103–106.
Schoenherr, A.A., 1976. The Herpetofauna of the San Gabriel Mountains Los Angeles,California Including Distribution and Biogeography. In Special Publication of theSouthwestern Herpetologist’s Society.
Semlitsch, R., 2002. Critical elements for biologically based recovery plans ofaquatic breeding amphibians. Conservation Biology 16, 619–629.
Stebbins, R.C., Cohen, N.W., 1995. A Natural History of Amphibians. PrincetonUniversity Press, Princeton, NJ.
US Fish and Wildlife Service, Endangered Species Program. <http://www.fws.gov/endangered/>.
US Fish and Wildlife Service, 2002. Endangered and Threatened Wildlife and Plants.Determination of Endangered Status for the Southern California Distinct

2040 S. D. Schoville et al. / Biological Conservation 144 (2011) 2031–2040
Vertebrate Population Segment of the Mountain Yellow-legged Frog (Ranamuscosa) Federal Register, pp. 44382–44392.
Vredenburg, V., 2004. Reversing introduced species effects: experimental removalof introduced fish leads to rapid recovery of a declining frog. Proceedings of theNational Academy of Sciences of the United States of America 101, 7646.
Vredenburg, V.T., Bingham, R., Knapp, R., Morgan, J.A.T., Moritz, C., Wake, D., 2007.Concordant molecular and phenotypic data delineate new taxonomy andconservation priorities for the endangered mountain yellow-legged frog.Journal of Zoology 271, 361–374.
Wake, D.B., Vredenburg, V.T., 2008. Are we in the midst of the sixth massextinction? A view from the world of amphibians. Proceedings of the NationalAcademy of Sciences 105, 11466–11473.
Wakeley, J., 2001. The coalescent in an island model of population subdivision withvariation among demes. Theoretical Population Biology 59, 133–144.
Wang, I.J., Savage, W.K., Shaffer, H.B., 2009. Landscape genetics and least-cost pathanalysis reveal unexpected dispersal routes in the California tiger salamander(Ambystoma californiense). Molecular Ecology 18, 1365–1374.
Williamson-Natesan, E., 2005. Comparison of methods for detecting bottlenecksfrom microsatellite loci. Conservation Genetics 6, 551–562.
Wilson, G.A., Fulton, T.L., Kendell, K., Scrimgeour, G., Paszkowski, C.A., Coltman,D.W., 2008. Genetic diversity and structure in Canadian northern leopard frog(Rana pipiens) populations: implications for reintroduction programs. CanadianJournal of Zoology – Revue Canadienne de Zoologie 86, 863–874.
Zhan, A., Li, C., Fu, J., 2009. Big mountains but small barriers: Population geneticstructure of the Chinese wood frog (Rana chensinensis) in the Tsinling and DabaMountain region of northern China. BMC Genetics 10, 17.
Zhao, S., Dai, Q., Fu, J., 2009. Do rivers function as genetic barriers for the plateauwood frog at high elevations? Journal of Zoology 279, 270–276.