Connecting customers to opportunities for 150 years
493
Connecting customers to opportunities for 150 years HSBC Holdings plc Annual Report and Accounts 2014
-
Upload
khangminh22 -
Category
Documents
-
view
0 -
download
0
Transcript of Connecting customers to opportunities for 150 years

Connecting customers toopportunities for 150 years
HSBC Holdings plc8 Canada SquareLondon E14 5HQUnited KingdomTelephone: 44 020 7991 8888www.hsbc.com
H
SB
C H
old
ing
s plc
An
nu
al Rep
ort an
d A
ccou
nts 2014
HSBC Holdings plc Annual Report and Accounts 2014
HSBC: then and nowIt is 150 years since HSBC was founded in Hong Kong to finance trade between Asia and Europe. Much has changed since then, as our cover photos demonstrate. The top photo shows Hong Kong harbour, with the HSBC office (extreme left) a few years after it was established in 1865. The bottom image shows the harbour today, with the HSBC building sixth from left (partially hidden).
Hong Kong has been transformed both physically and economically, from trading outpost to international financial centre. HSBC has mirrored Hong Kong’s rise to global prominence, growing from
a small regional trading bank into one of the world’s largest banking and financial services organisations today.
HSBC’s Hong Kong office is still at 1 Queen’s Road Central, as it was in 1865. The current HSBC building is the fourth to occupy the site, but the values on which the bank was founded remain the same. HSBC still aims to be where the growth is, connecting customers to opportunities, enabling businesses to thrive and economies to prosper, and helping people to fulfil their hopes and realise their ambitions.
We are proud to have served our customers with distinction for 150 years.
t
This document comprises the Annual Report and Accounts 2014 for HSBC Holdings plc and its subsidiaries. It contains the Strategic Report, the Report of the Directors, the Directors’ Remuneration Report and the Financial Statements, together with the Independent Auditor’s Report thereon, as required by the UK Companies Act 2006 (Strategic Report and Directors’ Report) Regulations 2013. The Strategic Report on pages 1 to 39, the Report of the Directors on pages 40 to 299 and the Directors’ Remuneration Report on pages 300 to 327 have each been drawn up in accordance with the requirements of English law, and liability in respect thereof is also governed by English law.
Additional information, including commentary on 2013 compared with 2012, may be found in the Form 20-F filed with the US Securities and Exchange Commission (‘SEC’) and available on www.hsbc.com and www.sec.gov.
Certain defined terms
Unless the context requires otherwise, ‘HSBC Holdings’ means HSBC Holdings plc and ‘HSBC’, the ‘Group’, ‘we’, ‘us’ and ‘our’ refer to HSBC Holdings together with its subsidiaries. Within this document the Hong Kong Special Administrative Region of the People’s Republic of China is referred to as ‘Hong Kong’. When used in the terms ‘shareholders’ equity’ and ‘total shareholders’ equity’, ‘shareholders’ means holders of HSBC Holdings ordinary shares and those preference shares and capital securities issued by HSBC Holdings classified as equity. The abbreviations ‘US$m’ and ‘US$bn’ represent millions and billions (thousands of millions) of US dollars, respectively.
Financial statements
The consolidated financial statements of HSBC and the separate financial statements of HSBC Holdings have been prepared in accordance with International Financial Reporting Standards (‘IFRSs’) as issued by the International Accounting Standards Board (‘IASB’) and as endorsed by the European Union (‘EU’). EU endorsed IFRSs could differ from IFRSs as issued by the IASB if, at any point in time, new or amended IFRSs were not to be endorsed by the EU. At 31 December 2014, there were no unendorsed standards effective for the year ended 31 December 2014 affecting these consolidated and separate financial statements, and there was no difference between IFRSs endorsed by the EU and IFRSs issued by the IASB in terms of their application to HSBC. Accordingly, HSBC’s financial statements for the year ended 31 December 2014 are prepared in accordance with IFRSs as issued by the IASB.
We use the US dollar as our presentation currency because the US dollar and currencies linked to it form the major currency bloc in which we transact and fund our business. Unless otherwise stated, the information presented in this document has been prepared in accordance with IFRSs.
When reference to ‘adjusted’ is made in tables or commentaries, the comparative information has been expressed at constant currency (see page 40), the impact of fair value movements in respect of credit spread charges on HSBC’s own debt has been eliminated and the effects of other significant items have been adjusted as reconciled on page 44. Adjusted return on risk-weighted assets is defined and reconciled on page 62.
Financial Statements 328 Statement of Directors’ Responsibilities 329 Independent Auditor’s Report 334 Financial Statements 345 Notes on the Financial Statements
Shareholder Information 458 Shareholder information 466 Abbreviations 470 Glossary 478 Index
Strategic Report 1 Overview 2 Cautionary statement regarding forward-looking statements 3 Highlights 4 Group Chairman’s Statement 7 Group Chief Executive’s Review 9 Strategic objectives 12 Business model 26 Strategic priorities 28 Outcomes
Report of the Directors Financial Review
40 Financial summary 63 Global businesses 78 Geographical regions 106 Other information 111 Risk 238 Capital
Corporate Governance
263 Corporate Governance Report 264 Biographies of Directors and senior management 270 Board of Directors 276 Board committees 288 Internal control 290 Going concern 291 Employees
Directors’ Remuneration Report 300 Directors’ Remuneration Report
© Copyright HSBC Holdings plc 2015 All rights reserved
No part of this publication may be reproduced, stored in a retrieval system, or transmitted, in any form or by any means, electronic, mechanical, photocopying, recording, or otherwise, without the prior written permission of HSBC Holdings plc.
Published by Group Finance, HSBC Holdings plc, London
Cover designed by Black Sun Plc, London; text pages designed by Black Sun Plc and Group Finance, HSBC Holdings plc, London
Printed by DG3 Asia Limited, Hong Kong, on Revive 100 White Offset paper using vegetable oil-based inks. Made in Austria, the paper comprises 100% de-inked post-consumer waste. Pulps used are totally chlorine-free.
The FSC® logo identifies products which contain wood from well-managed forests certified in accordance with the rules of the Forest Stewardship Council®.
Photography Cover: (top) HSBC Archives; (bottom) Matthew Mawson Group Chairman and Group Chief Executive by George Brooks
GPS 15011902

Overview
HSBC HOLDINGS PLC
1
Str
ateg
ic R
epo
rt
Fi
nan
cial
Rev
iew
Cor
pora
te G
over
nanc
e
Fina
ncia
l Sta
tem
ents
Sh
areh
old
er In
form
atio
n
Who we are
HSBC is one of the largest banking and financial services organisations in the world.
Customers:
51m Served by:
266,000 employees (257,600 FTE)
Through four global businesses: – Retail Banking and Wealth Management – Commercial Banking – Global Banking and Markets – Global Private Banking
Located in:
73 countries and territories
Across five geographical regions: – Europe – Asia – Middle East and North Africa – North America – Latin America
Offices:
Over 6,100 Global headquarters: – London
Market capitalisation:
US$182bn Listed on stock exchanges in: – London – Hong Kong – New York – Paris – Bermuda
Shareholders:
216,000 in 127 countries and territories
Our purpose Our purpose is to be where the growth is, connecting customers to opportunities, enabling businesses to thrive and economies to prosper, and ultimately helping people to fulfil their hopes and realise their ambitions.
Our strategic priorities We aim to be the world’s leading and most respected international bank. We will achieve this by focusing on the needs of our customers and the societies we serve, thereby delivering long-term sustainable value to all our stakeholders.
In 2013, we announced a set of three interconnected and equally weighted priorities for 2014 to 2016 to help us deliver our strategy:
– grow the business and dividends; – implement Global Standards; and – streamline processes and procedures.
Each priority is complementary and underpinned by initiatives being undertaken within our day-to-day business. Together they create value for our customers and shareholders, and contribute to the long-term sustainability of HSBC.
How we measure performance We track our progress in implementing our strategy with a range of financial and non-financial measures or key performance indicators. From 2015, we have revised our targets to better reflect the changing regulatory and operating environment.
Highlights of 2014 are shown on page 3. For further information on our new targets see page 32.
Rewarding performance The remuneration of all staff within the Group, including executive Directors, is based on the achievement of financial and non-financial objectives. These objectives, which are aligned with the Group’s strategy, are detailed in individuals’ annual scorecards. To be considered for a variable pay award, an individual must have fully complied with HSBC Values.
For further information on HSBC Values, see page 10.

Overview (continued) Cautionary statement / Highlights
HSBC HOLDINGS PLC
2
Cautionary statement regarding forward-looking statements The Annual Report and Accounts 2014 contains certain forward-looking statements with respect to HSBC’s financial condition, results of operations, capital position and business.
Statements that are not historical facts, including statements about HSBC’s beliefs and expectations, are forward-looking statements. Words such as ‘expects’, ‘anticipates’, ‘intends’, ‘plans’, ‘believes’, ‘seeks’, ‘estimates’, ‘potential’ and ‘reasonably possible’, variations of these words and similar expressions are intended to identify forward-looking statements. These statements are based on current plans, estimates and projections, and therefore undue reliance should not be placed on them. Forward-looking statements speak only as of the date they are made. HSBC makes no commitment to revise or update any forward-looking statements to reflect events or circumstances occurring or existing after the date of any forward-looking statements.
Written and/or oral forward-looking statements may also be made in the periodic reports to the US Securities and Exchange Commission, summary financial statements to shareholders, proxy statements, offering circulars and prospectuses, press releases and other written materials, and in oral statements made by HSBC’s Directors, officers or employees to third parties, including financial analysts.
Forward-looking statements involve inherent risks and uncertainties. Readers are cautioned that a number of factors could cause actual results to differ, in some instances materially, from those anticipated or implied in any forward-looking statement. These include, but are not limited to:
• changes in general economic conditions in the markets in which we operate, such as continuing or deepening recessions and fluctuations in employment beyond those factored into consensus forecasts; changes in foreign exchange rates and interest rates; volatility in equity markets; lack of liquidity in wholesale funding markets; illiquidity and downward price pressure in national real estate markets; adverse changes in central banks’ policies with respect to the provision of liquidity support to financial markets; heightened market concerns over sovereign creditworthiness in over-indebted countries;
adverse changes in the funding status of public or private defined benefit pensions; and consumer perception as to the continuing availability of credit and price competition in the market segments we serve;
• changes in government policy and regulation, including the monetary, interest rate and other policies of central banks and other regulatory authorities; initiatives to change the size, scope of activities and interconnectedness of financial institutions in connection with the implementation of stricter regulation of financial institutions in key markets worldwide; revised capital and liquidity benchmarks which could serve to deleverage bank balance sheets and lower returns available from the current business model and portfolio mix; imposition of levies or taxes designed to change business mix and risk appetite; the practices, pricing or responsibilities of financial institutions serving their consumer markets; expropriation, nationalisation, confiscation of assets and changes in legislation relating to foreign ownership; changes in bankruptcy legislation in the principal markets in which we operate and the consequences thereof; general changes in government policy that may significantly influence investor decisions; extraordinary government actions as a result of current market turmoil; other unfavourable political or diplomatic developments producing social instability or legal uncertainty which in turn may affect demand for our products and services; the costs, effects and outcomes of product regulatory reviews, actions or litigation, including any additional compliance requirements; and the effects of competition in the markets where we operate including increased competition from non-bank financial services companies, including securities firms; and
• factors specific to HSBC, including discretionary RWA growth and our success in adequately identifying the risks we face, such as the incidence of loan losses or delinquency, and managing those risks (through account management, hedging and other techniques). Effective risk management depends on, among other things, our ability through stress testing and other techniques to prepare for events that cannot be captured by the statistical models it uses; and our success in addressing operational, legal and regulatory, and litigation challenges, notably compliance with the DPA.

HSBC HOLDINGS PLC
3
Str
ateg
ic R
epo
rt
Fi
nan
cial
Rev
iew
Cor
pora
te G
over
nanc
e
Fina
ncia
l Sta
tem
ents
Sh
areh
old
er In
form
atio
n
Highlights – Profit before tax was down 17%
to US$18.7bn on a reported basis. Adjusted profit before tax, excluding the effect of significant items and currency translation, was broadly unchanged at US$22.8bn.
– Reinforced HSBC’s capital strength. Our CRD IV transitional common equity tier 1 ratio was 10.9% compared with 10.8% at the end of 2013.
– Dividends to shareholders increased to US$9.6bn as capital strength created capacity for organic growth and allowed us to increase the dividends paid.
Profit before taxation (reported basis)
Capital strength (CRD IV common equity tier 1 ratio transitional)1
Dividends per ordinary share (in respect of year)3
US$18.7bn £11.3bn HK$145bn 10.9% At 31 December
US$0.50
Cost efficiency ratio (reported basis)2
Return on average ordinary shareholders’ equity4
Share price (at 31 December)
67.3% 7.3% £6.09
HK$74.00US$47.23 American Depositary Share
For a description of the difference between reported and adjusted performance, see page 40. For footnotes, see page 39.
19.0
21.9
20.6
22.6
18.7
2010 2011 2012 2013 2014
10.8
10.9
2013 2014
0.36
0.410.45
0.49 0.50
2010 2011 2012 2013 2014
55.2
57.5
62.8
59.6
67.3
2010 2011 2012 2013 2014
9.5
10.9
8.4 9.2
7.3
2010 2011 2012 2013 2014
6.51
4.91
6.47 6.62 6.09
2010 2011 2012 2013 2014

Overview (continued) Group Chairman’s Statement
HSBC HOLDINGS PLC
4
As economic activity in much of the world failed to reach the levels required to rebuild sustainable consumer confidence and prompt renewed investment expenditure, governments most impacted expanded their stimulus measures and the major central banks maintained interest rates at their unprecedented low levels. Concerns over deflationary trends, particularly in the eurozone, grew. Although China delivered growth which comfortably surpassed all other major economies, expectations of slower growth in the future weighed heavily on market sentiment and contributed to significant commodity price falls and further curtailment of global investment spending.
Unsurprisingly in this environment, revenue growth opportunities were strongest in our Asian businesses, with expansion in lending and debt capital financing. Cost progression continued globally in large part to implement regulatory change and enhance risk controls, notably around financial system integrity and conduct. Streamlining initiatives could only partly offset this cost expansion. Further customer redress costs and regulatory penalties around past failings reinforced the Board’s continuing commitment to prioritise whatever further investment in systems and controls is necessary to mitigate future repetition.
It is clear now that societal, regulatory and public policy expectations of our industry are changing its long-term cost structure. Technological advancements around data analytics, including ‘big data’, are providing much more sophisticated tools to enhance our capabilities to protect the financial system from bad actors. Also, as more and more customers choose to transact online and through mobile devices, we are making the necessary investment to protect ourselves and our customers from cyber threats. Building the required analytical capabilities entails considerable investment in systems and in maintaining customer data which is accurate and up to date. Reconfiguring customer and transactional data to the digital age is no small endeavour given legacy systems and a multiplicity of historical data standards globally. The benefits, however, of enhanced customer due diligence capabilities and greater systems security essentially go to the core of our systemic role and allow us to be more proactive in fulfilling that role as a key gatekeeper to the financial system.
As our industry reshapes in response to public policy and regulatory directives, we now need to demonstrate, through clarity of our business model, the value to society of our scale and diversification. We must
never forget that investors have choices where to invest and individuals have choices where to make their careers. Thus it is essential that we can demonstrate a positive contribution to the societies we serve in order to bolster the business friendly environment that all agree is essential for economic growth and prosperity.
For 150 years HSBC has been following trade and investment flows to serve customers as they fulfil their financial ambitions. In a world which has moved from being interconnected to being interdependent, our business model is increasingly relevant to companies of all sizes and to individuals whose financial future is linked to economic activity in multiple countries.
This can be seen most markedly in our Commercial Banking business, which delivered a record year buoyed by the expansion of supply chain management solutions and increasing cross-border payment flows. Our network coverage of the countries which originate more than 85% of the world’s payment activity drives this key element of our business model. On the investment side, throughout our network we saw corporate flows continuing to target the higher growth emerging markets. At the same time, growth in outward investment from mainland China accelerated as its major companies sought diversification and access to both skill bases and markets. These trends played to HSBC’s scale and presence in the key financial centres, allowing us to support customers with debt and equity financing solutions, offering tailored liquidity and transactional banking support and providing risk management solutions primarily against our clients’ interest rate and foreign exchange exposures. Success was evidenced by growing recognition in industry awards, the most important of which are referred to in the Group Chief Executive’s Review. Finally, our Retail Banking and Wealth Management business continued its journey to build a sustainable customer focused business model, completing the removal of formulaic links between product sales and performance-related pay of our staff, and expanding our digital and mobile offerings.
Group Chairman’s Statement
HSBC’s performance in 2014 reflected another year of consolidation in the reshaping and strengthening of the Group against a backdrop of geopolitical and economic headwinds, many of which could not have been foreseen at the outset of the year.

HSBC HOLDINGS PLC
5
Str
ateg
ic R
epo
rt
Fi
nan
cial
Rev
iew
Cor
pora
te G
over
nanc
e
Fina
ncia
l Sta
tem
ents
Sh
areh
old
er In
form
atio
n
Performance in 2014 Profit before tax of US$18.7bn on a reported basis was US$3.9bn or 17% lower than that achieved in 2013. This primarily reflected lower business disposal and reclassification gains and the negative effect, on both revenue and costs, of significant items including fines, settlements, UK customer redress and associated provisions. On the adjusted basis that is one of the key metrics used to assess current year management and business performance, profit before tax was US$22.8bn, broadly in line with 2013 on a comparable basis.
Earnings per share were US$0.69, against US$0.84 in 2013. The Group’s capital position remained strong with the transitional common equity tier 1 ratio standing at 10.9% at the end of the year, compared with 10.8% 12 months earlier, and our end point ratio at 11.1% compared with 10.9%. Based on this capital strength and the Group’s capital generating capabilities, the Board approved a fourth interim dividend in respect of 2014 of US$0.20 per share, taking the total dividends in respect of the year to US$0.50 per share (US$9.6bn, US$0.4bn higher than in respect of 2013).
Taking into account this financial performance, together with the further progress made in reshaping the Group, responding to regulatory change and implementing Global Standards, the Board considered executive management to have made good progress during 2014 towards strengthening HSBC’s long-term competitive position.
The Group Chief Executive’s Review analyses in detail the important benchmarks and highlights of 2014.
Regulatory landscape becomes clearer but still much to do A great deal of progress was made during 2014 to finalise the framework under which globally systemic banks like HSBC will be required to operate when it is fully implemented. This clarity is essential if we are to be able to position our global businesses to meet the return expectations of those who invest in us within an acceptable risk appetite.
In particular, major progress was made in addressing the challenge of ‘too big to fail’, largely through finalising proposals to augment existing loss absorbing capacity with ‘bail-inable’ debt and through greater definition of how resolution frameworks
would operate in practice. In both cases, this involved the critical issue of how to address cross-border implications and home and host country regulatory responsibilities.
There is, however, still much to complete. The regulatory reform agenda for 2015 is very full with pending public policy decisions, regulatory consultations and impact studies in areas of far reaching influence to the structure of our industry. These include the conclusion of structural separation deliberations in Europe, further work on so called ‘shadow banking’ including identifying non-bank systemically important institutions, addressing the resolution framework for central counterparties, finalising the calibration of the leverage ratio, calibrating the quantum of total loss absorbing capacity to be raised and settling the disposition of that capacity within global groups.
Restoration of trust in our industry remains a significant challenge as further misdeeds are uncovered but it is a challenge we must meet successfully.
In addition, further work will be undertaken on utilising standardised risk weights to overcome regulatory loss of confidence in internally modelled capital measures and a ‘fundamental review of the trading book’ is also underway within the regulatory community to look again at capital support for this activity. These measures, which in aggregate are designed to make the industry structurally more stable, will take the next five or so years to implement, an indication of the scale of the transformation to be completed.
During 2014, the UK government also confirmed the permanence of the UK bank levy. This was introduced in 2010, in part to address the burden borne by taxpayers from failures during the global financial crisis; in 2014, the cost to HSBC of the levy was US$1.1bn, an increase of US$0.2bn over 2013. 58% of the levy we pay does not relate to our UK banking activity.
Rebuilding trust Restoration of trust in our industry remains a significant challenge as further misdeeds are uncovered but it is a challenge we must meet successfully. We owe this not just to
society but to our staff to ensure they can be rightly proud of the organisation to which they have committed their careers. When commentators extrapolate instances of control failure or individual misconduct to question the culture of the firm it strikes painfully at the heart of our identity.
Swiss Private Bank The recent disclosures around unacceptable historical practices and behaviour within the Swiss private bank remind us of how much there still is to do and how far society’s expectations have changed in terms of banks’ responsibilities. They are also a reminder of the need for constant vigilance over the effectiveness of our controls and the imperative to embed a robust and ethical compliance culture.
We deeply regret and apologise for the conduct and compliance failures highlighted which were in contravention of our own policies as well as expectations of us.
In response to, and in parallel with, the tax investigations prompted by the data theft more than eight years ago, we have been completely overhauling our private banking business, putting the entire customer base through enhanced due diligence and tax transparency filters. Our Swiss Private Bank customer base and the countries we serve are now both about one-third of the size they were in 2007. In addition, HSBC is already working to implement the OECD’s Common Reporting Standard and other measures to foster greater transparency. We cannot change the past. But, looking to the future, we can and must reinforce controls and provide demonstrable evidence of their effectiveness. This forms part of our commitment to Global Standards, to ensure that we will never knowingly do business with counterparties seeking to evade taxes or use the financial system to commit financial crime.
Banking standards More broadly, following the publication in 2013 of the Parliamentary Commission on Banking Standards, considerable progress has been made in giving effect to its recommendations. The Financial Services (Banking Reform) Act of 2013 provided greater clarity on the accountabilities and responsibilities of management and the Board. We welcome the appointment of Dame Colette Bowe to lead the Banking Standards Review Council and have committed to support her fully in its work. The current Fair and Effective Markets

Overview (continued) Group Chairman’s Statement / Group Chief Executive’s Review
HSBC HOLDINGS PLC
6
Review being conducted by the Bank of England, Her Majesty’s Treasury and the Financial Conduct Authority is an extremely timely and important exercise to re-establish the integrity of wholesale financial markets.
In terms of our own governance of these areas, the Conduct & Values Committee of the Board that we created at the beginning of 2014 to focus on behavioural issues has established itself firmly as the central support to the Board in these important areas.
Board changes Since we reported at the interim stage we have taken further steps to augment the skills and experience within the Board and to address succession to key roles.
On 1 January 2015, Phillip Ameen joined the Board and the Group Audit Committee as an independent non-executive Director. Phil was formerly Vice President, Comptroller and Principal Accounting Officer of General Electric Corp. He brings with him extensive financial and accounting experience gained in one of the world’s leading international companies as well as a depth of technical knowledge from his long service in the accounting standard setting world. As a serving Director on HSBC’s US businesses he also brings further detailed insight to Group Board discussions and enhances the strong links that already exist between the Group Board and its major subsidiaries.
Sir Simon Robertson had previously indicated his intention to retire from the Board at the upcoming AGM. I am delighted to report that Simon has agreed to stay on for at least a further
year as Deputy Chairman. He has been a considerable support to me and to Stuart Gulliver, in addition to his role leading the non-executives, and we are all delighted that we shall continue to benefit from his wisdom and experience.
150th anniversary 2015 marks the 150th anniversary of our founding back in Hong Kong and Shanghai as a small regional bank focused on trade and investment. All of us within HSBC owe a huge debt of gratitude and respect to our forebears who charted the course that has taken HSBC to one of the most important institutions serving the financial needs of this inter-dependent world.
Outlook It is impossible not to reflect on the very broad range of uncertainties and challenges to be addressed in 2015 and beyond, most of which are outside our control, particularly against a backdrop of patchy economic recovery and limited policy ammunition. Unexpected outcomes arising from current geopolitical tensions, eurozone membership uncertainties, political changes, currency and commodity price realignments, interest rate moves and the effectiveness of central banks’ unconventional policies, to name but a few, all could materially affect economic conditions and confidence around investment and consumption decisions. One economic uncertainty stands out for a major financial institution headquartered in the UK, that of continuing UK membership of the EU. Today, we publish a major research study which concludes that working to complete the Single Market in
services and reforming the EU to make it more competitive are far less risky than going it alone, given the importance of EU markets to British trade.
There are also many underlying positive trends that shape our thinking about the coming year. We are very encouraged by the trends in outward investment from China, the potential for further liberalisation and internationalisation of the renminbi and the reshaping of the Chinese economy from export dependence to domestic consumption. We are positive on the opportunities that will arise from Capital Markets Union within Europe and the declared focus of the incoming Commission on growth and jobs. The strength of the US economy and the benefits of lower oil prices should be positive drivers of growth. There is much to be gained from successful negotiation of the Transatlantic Trade and Investment Partnership and the Trans-Pacific Partnership. Current attention on funding infrastructure investment globally is potentially of huge significance.
Finally, on behalf of the Board, I want again to express our thanks and gratitude to our 266,000 colleagues around the world who worked determinedly in 2014 to build an HSBC fit for the next 150 years.
D J Flint Group Chairman
23 February 2015

HSBC HOLDINGS PLC
7
Stra
tegi
c Rep
ort
Fina
ncia
l Rev
iew
Co
rpor
ate
Gove
rnan
ce
Fina
ncia
l Sta
tem
ents
Sh
areh
olde
r Inf
orm
atio
n
Profits disappointed, although a tough fourth quarter masked some of the progress made over the preceding three quarters. Many of the challenging aspects of the fourth quarter results were common to the industry as a whole. In spite of this, there were a number of encouraging signs, particularly in Commercial Banking, Payments & Cash Management and renminbi products and services. We were also able to continue to grow the dividend.
Reported profit before tax in 2014 was US$18.7bn, US$3.9bn lower than in the previous year. This reflected lower gains from disposals and reclassifications, and the negative effect of other significant items, including fines, settlements, UK customer redress and associated provisions, totalling US$3.7bn.
Adjusted profit before tax, which excludes the year-on-year effects of currency translation differences and significant items, was US$22.8bn, broadly unchanged on 2013.
Asia continued to provide a strong contribution to Group profits. Middle East and North Africa reported a record profit before tax in 2014. Together, Asia and MENA generated more than 70% of adjusted Group profit before tax.
Commercial Banking also delivered a record reported profit, which is evidence of the successful execution of our strategy. Revenue in CMB continued to grow,
notably in our two home markets of Hong Kong and the UK.
Global Banking and Markets performed relatively well for the first three quarters of the year, but, like much of the rest of the industry, suffered a poor fourth quarter. Revenue was lower in 2014, particularly in our Markets businesses, but all other client-facing businesses delivered year-on-year growth.
Revenue was also lower in Retail Banking and Wealth Management, due primarily to the continuing repositioning of the business. However, in our Global Asset Management business we continued our strategy of strengthening collaboration across our global businesses, which helped to attract net new money of US$29bn.
Global Private Banking continues to undergo a comprehensive overhaul which was accelerated from 2011. As part of this overhaul, we are implementing tough financial crime, regulatory compliance and tax transparency measures. In order to achieve our desired business model and informed by our six filters process, we have also sold a number of businesses and customer portfolios, including assets in Japan, Panama and Luxembourg. The number of customer accounts in our Swiss Private Bank is now nearly 70% lower than at its peak. We continued to remodel the Private Bank in 2014, which included the sale of a customer portfolio in Switzerland to LGT Bank. One consequence of this remodelling
was a reduction in revenue. We have also grown the parts of the business that fit our new model, attracting US$14bn of net new money in 2014, mostly through clients of Global Banking & Markets and Commercial Banking.
Loan impairment charges were lower, reflecting the current economic environment and the changes we have made to our portfolio since 2011.
Operating expenses were higher due to increased regulatory and compliance costs, inflationary pressures and investment in strategic initiatives to support growth, primarily in Commercial Banking in Asia and Europe. Significant items, which include restructuring costs, were also higher than last year.
We agreed settlements in respect of inquiries by the UK Financial Conduct Authority and the US Commodity Futures Trading Commission into the foreign exchange market in 2014. HSBC was badly let down by a few individuals whose actions do not reflect the vast majority of employees who uphold the values and standards expected of the bank. This matter is now rightly in the hands of the Serious Fraud Office.
Our balance sheet remained strong, with a ratio of customer advances to customer accounts of 72%. Excluding the effects of currency translation, customer loans and advances grew by US$28bn during 2014.
The common equity tier 1 ratio on a transitional basis was 10.9% and on a CRD IV end point basis was 11.1% at 31 December 2014.
Connecting customers to opportunities 2015 is HSBC’s 150th anniversary. Founded in Hong Kong in 1865 to finance local and international trade, the bank expanded rapidly to capture the increasing flow of commerce between Asia, Europe and North America. Our ability to connect customers across the world remains central to the bank’s strategy today and in 2014 we continued to develop and grow the product areas that rely on international connectivity.
Our market-leading Global Trade and Receivables Finance business remains strong and we were voted best global trade finance bank and best trade finance bank in MENA in the Global Trade Review ‘Leaders In Trade’ Awards.
Group Chief Executive’s Review
2014 was a challenging year in which we continued to work hard to improve business performance while managing the impact of a higher operating cost environment.
Str
ateg
ic R
epo
rt
Fin
anci
al R
evie
w
Cor
pora
te G
over
nanc
e Fi
nanc
ial S
tate
men
ts
Sh
areh
old
er In
form
atio
n

Overview/Strategic objectives Group Chief Executive’s Review / Value creation and long-term sustainability
HSBC HOLDINGS PLC
8
In Payments and Cash Management, we increased customer mandates and improved client coverage. We were recognised as the best global cash management bank for the third successive year in the 2014 Euromoney Cash Management Survey.
Our share of the capital financing market continued to improve and we were ranked number one for debt capital markets in our home markets of the UK and Hong Kong, and number one for Equity Capital Markets in Hong Kong by Dealogic. HSBC was also named global bond house of the year, global derivatives house of the year and Asian bond house of the year in the International Financing Review Awards 2014.
We consolidated our leadership of the rapidly growing renminbi market in 2014. According to SWIFT, the renminbi is now the fifth most widely used payment currency in the world, up from 13th just two years ago. We increased revenue from renminbi products and retained our ranking as number one issuer of offshore renminbi bonds worldwide over the last twelve months. HSBC was also recognised as the best overall provider for products and services in Asiamoney’s Offshore Renminbi Services Survey in 2014, and renminbi house of the year in the 2014 Asia Risk Awards.
Operating a global business It is already clear that the regulatory costs of operating a global business model have increased since we announced our strategy for HSBC in 2011.
As the Group Chairman’s Statement explains, the regulatory environment continues to evolve.
Our commitment to be the world’s leading international bank means that improving our regulatory and compliance abilities and implementing Global Standards must remain priorities for HSBC. Our Compliance staff headcount has more than doubled since 2011 and there is more work still to do to strengthen the Group’s compliance capability.
At the same time, the level of capital that we hold has increased by over 60% since before the financial crisis. Specifically, we have further strengthened our capital levels in response to increasing capital
requirements from the UK Prudential Regulation Authority.
Whilst we expected an increase in the amount of capital we were required to hold when setting targets for the Group in 2011, we could not have foreseen the full extent of the additional costs and capital commitment that would subsequently be asked of us. The pace of change has been exceptional. As a consequence, some of the targets that we set for the Group in 2011 are no longer realistic.
In recognition of that fact, we have set new medium-term targets that better reflect the ongoing operating environment.
We are setting a revised return on equity target of more than 10%. This target is modelled using a common equity tier 1 capital ratio on a CRD IV end point basis in the range of 12% to 13%.
Our cost target will be to grow our revenue faster than costs (‘positive jaws’) on an adjusted basis.
We are also restating our commitment to grow the dividend. To be clear, the progression of dividends should be consistent with the growth of the overall profitability of the Group and is predicated on our ability to meet regulatory capital requirements in a timely manner.
These targets offer a realistic reflection of the capabilities of HSBC in the prevailing operating environment.
Our employees I am grateful for the hard work, dedication and professionalism of all of our employees in 2014.
Extensive work was required to prepare HSBC for stress tests in a number of jurisdictions throughout the year, the results of which confirmed the capital strength of the Group. HSBC will face additional stress testing in 2015.
We all have to work continuously to make sure that the Group remains compliant with anti-money laundering and sanctions legislation and this effort continued in 2014.
Management and staff across the Group continued to work very closely with the Monitor to deliver our commitments under the terms of our December 2012
settlement agreements with the US authorities and the UK Financial Conduct Authority. We have now received the second annual report from the Monitor. Whilst it confirmed that we continue to comply with the obligations we undertook in the Deferred Prosecution Agreement with the US Department of Justice, as we expected we still have substantial work to do.
Summary and outlook The business remains in a good position structurally to capitalise on broader market trends and the macroeconomic backdrop remains favourable, notwithstanding the continuing low interest rate environment. There are still a number of historical issues left to resolve and we will make further progress on these in 2015. We will also continue the work we started in 2011 to simplify the Group to make it easier to manage and control.
Our 2014 results show a business powered by our continued strength in Hong Kong, with significant additional contributions from the rest of Asia and the Middle East and North Africa. The continuing success of Commercial Banking and the resilience of our differentiated Global Banking & Markets business illustrate the effectiveness of our strategy to bridge global trade and capital flows. Retail Banking & Wealth Management remains a work in progress, but we took considerable further steps to de-risk the business in 2014. Global Private Banking continues to attract net new money from clients in our other global businesses. We maintain a sharp focus on generating net savings to offset increased costs arising from inflation, and the cost of implementing global standards.
Our early 2015 performance has been satisfactory.
We continue to focus on the execution of our strategy and on delivering value to shareholders.
S T Gulliver Group Chief Executive
23 February 2015

HSBC HOLDINGS PLC
9
Str
ateg
ic R
epo
rt
Fi
nan
cial
Rev
iew
Cor
pora
te G
over
nanc
e
Fina
ncia
l Sta
tem
ents
Sh
areh
old
er In
form
atio
n
Strategic objectives
Value creation and long-term sustainability We continue to follow the vision for HSBC we first outlined in 2011 along with the clear strategy that will help us achieve it. Our strategy guides where and how we seek to compete. We constantly assess our progress against this strategy and provide regular updates to stakeholders.
Through our principal activities – making payments, holding savings, enabling trade, providing finance and managing risks – we play a central role in society and in the economic system. Our target is to build and maintain a business which is sustainable in the long term.
How we create value Banks, and the individuals within them, play a crucial role in the economic and social system, creating value for many parties in different ways.
We provide a facility for customers to securely and conveniently deposit their savings. We allow funds to flow from savers and investors to borrowers, either directly or through the capital markets. The borrowers use these loans or other forms of credit to buy goods or invest in businesses. By these means, we help the economy to convert savings which may be individually short-term into financing which is, in aggregate, longer term. We bring together investors and people looking for investment funding. We develop new financial products. We also facilitate personal and commercial transactions by acting as payment agent both within countries and internationally. Through these activities, we take on risks which we then manage and reflect in our prices.
Our direct lending includes residential and commercial mortgages and overdrafts, and term loan facilities. We finance importers and exporters engaged in international trade and provide advances to companies secured on amounts owed to them by their customers.
We also offer additional financial products and services including broking, asset management, financial advisory services, life insurance, corporate finance, securities services and alternative investments. We make markets in financial assets so that investors have confidence in efficient pricing and the availability of buyers and sellers. We provide these products for clients ranging from governments to large and mid-market corporates, small and medium-sized enterprises, high net worth individuals and retail customers. We help customers raise financing from external investors in debt and equity capital markets. We create liquidity and price transparency in these securities allowing investors to buy and sell them on the secondary market. We exchange national currencies, helping international trade.
We offer products that help a wide range of customers to manage their risks and exposures through, for example, life insurance and pension products for retail customers and receivables finance or
documentary trade instruments for companies. Corporate customers also ask us to help with managing the financial risks arising in their businesses by employing our expertise and market access.
An important way of managing risks arising from changes in asset and liability values and movements in rates is provided by derivative products such as forwards, futures, swaps and options. In this connection, we are an active market-maker and derivative counterparty. Customers use derivatives to manage their risks, for example, by:
– using forward foreign currency contracts to hedge their income from export sales or costs of imported materials;
– using an inflation swap to hedge future inflation-linked liabilities, for example, for pension payments;
– transforming variable payments of debt interest into fixed rate payments, or vice versa; or
– providing investors with hedges against movements in markets or particular stocks.
Value creation
Riskand
Capital
Employees
Third parties
Governments
Shareholders
Customers
Branches and offices Networks Markets
Personal, corporate, governmental, institutional and high net worth customers and counterparties
Products and Income
Loans/credit Deposits + investments Financial services
Interest and fee income Trading and other income
Costs
Loan losses
Salaries and other payments
Infrastructure and other costs
Taxes
Dividends
Retained profit
Allocation
Variable pay Employees

Strategic objectives Value creation and long-term sustainability / HSBC Values / Our strategy
HSBC HOLDINGS PLC
10
We charge customers a spread, representing the difference between the price charged to the customer and the theoretical cost of executing an offsetting hedge in the market. We retain that spread at maturity of the transaction if the risk management of the position has been effective.
We then use derivatives along with other financial instruments to constrain the risks arising from customer business within risk limits. Normally, our customers both buy and sell relevant instruments, in which case our focus is on managing any residual risks through transactions with other dealers or professional counterparties. Where we do not fully hedge the residual risks we may gain or lose money as market movements affect the net value of the portfolio.
Stress tests and other risk management techniques are also used to ensure that potential losses remain within our risk appetite under a wide range of potential market scenarios.
In addition, we manage risks within HSBC, including those which arise from the business we do with customers. For further information on our risks, see page 21, and on how we manage them, see page 24.
Long-term sustainability At HSBC, we understand that the continuing financial success of our business is closely connected to the economic, environmental and social landscape in which we operate. For us, sustainability means building our business for the long term by balancing social, environmental and economic considerations in the decisions we make. This enables us to help businesses thrive, reward shareholders and employees, pay taxes and duties in
the countries in which we operate and contribute to the health and growth of communities. Achieving a sustainable return on equity and long-term profit growth is built on this foundation.
How we do business is as important as what we do: our responsibilities to our customers, employees and shareholders as well as to wider society go far beyond simply being profitable. These include our consistent implementation of the highest standards everywhere we operate to detect, deter and protect against financial crime.
Sustainability underpins our strategic priorities and enables us to fulfil our purpose. Our ability to identify and address environmental, social and ethical developments which present risks or opportunities for the business contributes to our financial success. Sustainable decision-making shapes our reputation, drives employee engagement and affects the risk profile of the business – and can help reduce costs and secure new revenue streams.
Our international presence and the long-established position of many of our businesses in HSBC’s home and priority growth markets, when combined with our wide-ranging portfolio of products and services, differentiate HSBC from our competitors and give our business and operating models an inherent resilience. This has enabled the Group to remain profitable through the most turbulent of times for our industry, and we are confident that the models will continue to stand us in good stead in the future and will underpin the achievement of our strategic priorities. Our business and operating models are described in more detail on page 12. For further information about sustainability at HSBC, see page 36.
HSBC Values Embedding HSBC Values in every decision and every interaction with customers and with each other is a top priority for the Group and is shaping the way we do business.
The role of HSBC Values in daily operating practice is fundamental to our culture, and is particularly important in light of developments in regulatory policy, investor confidence and society’s expectations of banks. HSBC Values are integral to the selection, assessment, recognition, remuneration and training of our employees. We expect our executives and employees to act with courageous integrity in the execution of their duties in the following ways:
HSBC Values
Be dependable and do the right thing
– stand firm for what is right, deliver on commitments, be resilient and trustworthy;
– take personal accountability, be decisive, use judgement and common sense, empower others.
Be open to different ideas and cultures
– communicate openly, honestly and transparently, value challenge, learn from mistakes;
– listen, treat people fairly, be inclusive, value different perspectives.
Be connected with our customers, communities, regulators and each other
– build connections, be externally focused, collaborate across boundaries;
– care about individuals and their progress, show respect, be supportive and responsive.

HSBC HOLDINGS PLC
11
Str
ateg
ic R
epo
rt
Fi
nan
cial
Rev
iew
Cor
pora
te G
over
nanc
e
Fina
ncia
l Sta
tem
ents
Sh
areh
old
er In
form
atio
n
Our strategy
Long-term trends
Our strategy is aligned to two long-term trends:
– The world economy is becoming ever more interconnected, with growth in world trade and cross-border capital flows continuing to outstrip growth in average gross domestic product. Over the next decade we expect growth in trade and capital flows to outstrip GDP growth and 35 markets to generate 85% of world trade growth with a similar degree of concentration in cross-border capital flows.
– Of the world’s top 30 economies, we expect those of Asia, Latin America, the Middle East and Africa to have increased by around four-fold in size by 2050, benefiting from demographics and urbanisation. By this time they will be larger than those of Europe and North America combined. By 2050, we expect 18 of the 30 largest economies will be from Asia, Latin America or the Middle East and Africa.
Competitive advantages
What matters in this environment is:
– having an international network and global product capabilities to capture international trade and movements in capital; and
– being able to take advantage of organic investment opportunities in the most attractive growth markets and maintaining the capacity to invest.
HSBC’s competitive advantages come from:
– our meaningful presence in and long-term commitment to our key strategic markets;
– our business network, which covers over 85% of global trade and capital flows;
– our balanced business portfolio centred on our global client franchise;
– our strong ability to add to our capital base while also providing competitive rewards to our staff and good returns to our shareholders;
– our stable funding base, with about US$1.4 trillion of customer accounts of which 72% has been advanced to customers; and
– our local balance sheet strength and trading capabilities in the most relevant financial hubs.
A two-part approach
Responding to these long-term trends, we have developed a two-pronged approach that reflects our competitive advantages:
– A network of businesses connecting the world. HSBC is well positioned to capture growing international trade and capital flows. Our global reach and range of services place us in a strong position to serve clients as they grow from small enterprises into large multi-nationals through our Commercial Banking and Global Banking & Markets businesses.
– Wealth management and retail with local scale. We aim to capture opportunities arising from social mobility and wealth creation in our priority growth markets across Asia, Latin America and the Middle East, through our Premier proposition and Global Private Banking business. We expect to invest in full scale retail businesses only in markets where we can achieve profitable scale.

Business model Market presence / Organisation
HSBC HOLDINGS PLC
12
Business model
Market presence Our business model is based on an international network connecting and serving a cohesive portfolio of markets.
Our comprehensive range of banking and related financial services is provided by operating subsidiaries and associates. Services are primarily delivered by domestic banks, typically with local deposit bases.
The UK and Hong Kong are our home markets, and a further 19 countries form our priority growth markets (see below). These 21 markets accounted for over 90% of our profit before tax in 2014, and are the primary focus of capital deployment. Network markets are markets with strong international relevance which serve to complement our international presence, operating mainly through Commercial Banking and Global Banking and Markets. Our combination of home, priority growth and network markets covers around 85% of all international trade and financial flows.
The final category, small markets, includes those where our operations are of sufficient scale to operate profitably, or markets where we maintain representative offices.
Our legal entities are regulated by their local regulators and on a Group-wide basis we are regulated from the UK by the Prudential Regulation Authority (‘PRA’) for prudential matters (safety and soundness) and by the Financial Conduct Authority (‘FCA’) for conduct (consumer and market protection).
HSBC’s markets
Investment criteria We use six filters to guide our decisions about when and where to invest. The first two – international connectivity and economic development – determine whether the business is strategically relevant. The next three – profitability, efficiency and liquidity – determine whether the financial position of the business is attractive. The sixth filter – the risk of financial crime – governs our activities in high risk jurisdictions, and is applied to protect us by restricting the scope of our business where appropriate.
Decisions over where to invest additional resources have three components:
– Strategic: we will only invest in businesses aligned to our strategy, mostly in our home and priority growth markets and in target businesses and clients;
– Financial: the investment must be value accretive for the Group, and must meet minimum returns, revenue and cost hurdles; and
– Risk: the investment must be consistent with our risk appetite.
We conduct an annual geographic and business portfolio review following the six filter approach to update our market and business priorities.
Using the six filters in decision-making
Homemarkets
Asia
− Hong Kong
Europe Middle East andNorth Africa
NorthAmerica
LatinAmerica
Prioritygrowthmarkets
Networkmarkets
Smallmarkets
− UK
− Australia− Mainland China− India − Indonesia− Malaysia− Singapore− Taiwan
− Operations primarily focused on international clients and businesses of Commercial Banking and Global Banking and Markets− Together with home and priority growth markets these cover around 85% of international trade and capital flows
− Markets where HSBC has profitable scale and focused operations− Representative Offices
− France− Germany− Switzerland − Turkey
− Egypt− Saudi Arabia− UAE
− Canada− USA
− Argentina− Brazil− Mexico
What is thestrategic relevance?
Are the currentreturns attractive?
What is the financial crime risk?
1. Connectivity2. Economic development
3. Profitability4. Efficiency5. Liquidity
6. Financial crime risk
Low High
Yes Invest
Turnaround/improve
Continue as is
No
Yes
No
High
Medium/lowDiscontinue/dispose
Risk mitigation
Risk mitigation
Risk mitigation

HSBC HOLDINGS PLC
13
Str
ateg
ic R
epo
rt
Fi
nan
cial
Rev
iew
Cor
pora
te G
over
nanc
e
Fina
ncia
l Sta
tem
ents
Sh
areh
old
er In
form
atio
n
Organisation Our operating model is based on a matrix management structure comprising global businesses, geographical regions and global functions.
The matrix is overlaid on a legal entity structure headed by HSBC Holdings plc.
Holding company HSBC Holdings, the holding company of the Group, is the primary source of equity capital for its subsidiaries and provides non-equity capital to them when necessary.
Under authority delegated by the Board of HSBC Holdings, the Group Management Board (‘GMB’) is responsible for the management and day-to-day running of the Group, within the risk appetite set by the Board. GMB works to ensure that there are sufficient cash resources to pay dividends to shareholders, interest to bondholders, expenses and taxes.
HSBC Holdings does not provide core funding to any banking subsidiary, nor is it a lender of last resort and does not carry out any banking business in its own right. Subsidiaries operate as separately capitalised entities implementing the Group strategy.
Global management structure The following table lists our four global businesses, five geographical regions and 11 global functions, and summarises their responsibilities under HSBC’s management structure. For details of our principal subsidiaries see Note 22 on the Financial Statements. A simplified Group structure chart is provided on page 462.
Global management structure
− Retail Banking and Wealth Management− Commercial Banking− Global Banking and Markets− Global Private Banking
Global businesses Global functions
− Communications− Company Secretaries− Corporate Sustainability− Finance− HSBC Technology and Services− Human Resources− Internal Audit− Legal− Marketing− Risk (including Compliance)− Strategy and Planning
Establish and manage all policies, processes and delivery platforms relevant to their activities, are fully accountable for their costs globally and are responsible for managing their headcount.
Responsible for setting globally consistent business strategies and operating models and issuing planning guidance regarding their businesses, and are accountable for their profit and loss performance and for managing their headcount.
Legal entities
Operate under their own boards of directors as separately capitalised entities, implementing Group strategy and delivering Group products and services. They are required to consider risk and maintain a capital buffer consistent with the Group’s risk appetite for their relevant country or region. They manage their own funding and liquidity within parameters set centrally.
HSBC Holdings plc
Geographical regions
− Europe− Asia− Middle East and North Africa− North America− Latin America
Share responsibility for executing business strategies set by the global businesses. They represent the Group to customers, regulators, employee groups and other stakeholders; allocate capital; manage risk appetite, liquidity and funding by legal entity; and are accountable for profit and loss performance in line with global business plans.

Business model (continued) Organisation / Governance
HSBC HOLDINGS PLC
14
Structural Reform
Banking structural reform and recovery and resolution planning Globally there have been a number of developments relating to banking structural reform and the introduction of recovery and resolution regimes.
As recovery and resolution planning has developed, some regulators and national authorities have also required changes to the corporate structures of banks. These include requiring the local incorporation of banks or ring-fencing of certain businesses. In the UK, ring-fencing legislation has been enacted requiring the separation of retail and small and medium-sized enterprise (‘SME’) deposits from trading activity (see below). Similar requirements have been introduced or are in the process of being introduced in other jurisdictions.
Policy background to recovery and resolution Following the financial crisis, G20 leaders requested that the Financial Stability Board (‘FSB’) establish more effective arrangements for the recovery and resolution of 28 (now 30) designated Global Systemically Important Banks (‘G-SIBs’), resulting in a series of policy recommendations in relation to recovery and resolution planning, cross-border co-operation agreements and measures to mitigate obstacles to resolution.
In December 2013, the PRA set out rules for the recovery and resolution of UK banks and international banks operating in the UK. These rules were modified as part of the implementation of the EU Bank Recovery and Resolution Directive from January 2015.
HSBC resolution strategy and corporate structure changes We have been working with the Bank of England, the PRA and our other primary regulators to develop and agree a resolution strategy for HSBC. It is our view that a resolution strategy whereby the Group breaks up at a subsidiary bank level at the point of resolution (referred to as a Multiple Point of Entry strategy) rather than being kept together as a Group at the point of resolution (referred to as a Single Point of Entry strategy) is the optimal approach as it
is aligned to our existing legal and business structure.
In common with all G-SIBs, we are working with our regulators to understand inter-dependencies between different businesses and subsidiary banking entities in the Group in order to enhance resolvability.
We have initiated plans to mitigate or remove critical inter-dependencies to further facilitate the resolution of the Group. In particular, in order to remove operational dependencies (where one subsidiary bank provides critical services to another), we have determined to transfer such critical services from the subsidiary banks to a separately incorporated group of service companies (‘ServCo group’). The ServCo group will be separately capitalised and funded to ensure continuity of services in resolution. A significant portion of the ServCo group already exists and therefore this initiative involves transferring the remaining critical services still held by subsidiary banks into the ServCo group. The services will then be provided to the subsidiary banks by the ServCo group.
UK ring-fencing In December 2013, the UK’s Financial Services (Banking Reform) Act 2013 (‘Banking Reform Act’) received Royal Assent. It implements most of the recommendations of the Independent Commission on Banking (‘ICB’), which inter alia require large banking groups to ‘ring-fence’ UK retail banking activity in a separately incorporated banking subsidiary (a ‘ring-fenced bank’) that is prohibited from engaging in significant trading activity. For these purposes, the UK excludes the Crown Dependencies. Ring-fencing is to be completed by 1 January 2019.
In July 2014, secondary legislation was finalised. This included provisions further detailing the applicable individual customers to be transferred to the ring-fenced bank by reference to gross worth and enterprises to be transferred based on turnover, assets and number of employees. In addition, the secondary legislation places restrictions on the activities and geographical scope of ring-fenced banks.
In October 2014, the PRA published a consultation paper on ring-fencing rules in
relation to legal structure, governance, and continuity of services and facilities. The PRA intends to undertake further consultations and finalise ring-fencing rules in due course. The PRA also published a discussion paper concerning operational continuity in resolution.
As required by the PRA’s consultation paper, a provisional ring-fencing project plan was presented to the UK regulators in November 2014. This plan provided for ring-fencing of the activities prescribed in the legislation, broadly the retail and SME services that are currently part of HSBC Bank plc (‘HSBC Bank’), in a separate subsidiary.
In addition, the plan reflected the operational continuity expectations of each of the PRA’s consultation and discussion papers by providing for the proposed enhancement of the ServCo group. The plan remains subject to further planning and approvals internally and is ultimately subject to the approval of the PRA, FCA and other applicable regulators.
European banking structural reform In January 2014, the European Commission published legislative proposals on the structural reform of the European banking sector which would prohibit proprietary trading in financial instruments and commodities, and enable supervisors, at their discretion, to require certain trading activities to be undertaken in a separate subsidiary from deposit taking activities.
The ring-fenced deposit taking entity would be subject to separation from the trading entity including requirements for separate capital and management structures, issuance of own debt and arms-length transactions between entities.
The draft proposals contain a provision which would permit derogation by member states that have implemented their own structural reform legislation, subject to meeting certain conditions. This derogation may benefit the UK in view of the Banking Reform Act.
The proposals are currently subject to discussion in the European Parliament and the Council. The implementation date for any separation under the final rules would depend upon the date on which the final legislation (if any) is agreed.

HSBC HOLDINGS PLC
15
Str
ateg
ic R
epo
rt
Fi
nan
cial
Rev
iew
Cor
pora
te G
over
nanc
e
Fina
ncia
l Sta
tem
ents
Sh
areh
old
er In
form
atio
n
Governance The Board is committed to establishing and maintaining the highest standards of corporate governance wherever we operate. Good corporate governance is critical to HSBC’s long-term success and sustainability.
We believe that a robust and transparent corporate governance framework is vital to the sustainable success of HSBC. Strengthening our corporate governance framework to support the successful implementation of our Global Standards programme is a continuing focus for the Board.
Role of the Board and Committees The strategy and risk appetite for HSBC is set by the Board, which delegates the day-to-day
running of the business to the GMB. Risk Management Meetings of the GMB are held in addition to regular GMB meetings.
The key roles of the non-executive committees established by the Board are described in the chart below. The terms of reference of the principal non-executive Board committees are available at www.hsbc.com/boardcommittees. For further details on Group corporate governance, see page 263.
The committee structure and governance framework of the HSBC Holdings Board
For footnote, see page 39.
GMB executive committees
Executive management committee which isresponsible for management and day-to-day running of HSBC under the direct authority of the Board.
Group ManagementBoard
Financial SystemVulnerabilitiesCommittee
Chairman’sCommittee
Conduct & ValuesCommittee
Non-executive responsibility for oversight of (i) controls and procedures to identify areas where HSBC and the financial system more broadly may become exposed to financial crime or system abuse, and(ii) HSBC policies and procedures sufficient to ensure the continuing obligations to regulatoryand law enforcement agencies are met.
Acts on behalf of the Board between scheduled Board meetings to facilitate ad hoc unforeseen business requiring urgent Board approval.
Non-executive responsibility for oversight of, and advice to the Board on, HSBC policies, procedures and standards to ensure that the Group conducts business responsibly and consistently adheres to HSBC Values.
HSBC Holdings plcBoard of Directors
Group AuditCommittee
Group Remuneration Committee
Group RiskCommittee
NominationCommittee
Non-executive responsibility for leading the process for Board appointments and foridentifying and nominating,for approval by the Board, candidates for appointment to the Board.
Non-executive responsibilityfor oversight of, and adviceto the Board on, matters relating to financial reporting and of internal controls over financial reporting.
Non-executive responsibilityfor oversight of, and advice to the Board on, high levelrisk-related matters andrisk governance.
Non-executive responsibilityfor setting the overarching principles, parameters and governance framework of the Group’s remuneration policy and the remuneration of senior executives.
Philanthropic and Community InvestmentOversight Committee5
Non-executive responsibility for the oversight of HSBC’s philanthropic and community investment activities in support of the Group’s corporate sustainability objectives.
Group Management Board
Risk Management Meeting
Provide strategic direction and oversight of enterprise-wide management of all risks through a strong risk governance framework, with particular focus on defining risk appetite and monitoring the risk profile, including assessments of current and emerging risks.Recommend and/or approve key risk limits, policies and methodologies for the management of risks. Develop and implement Global Standards reflecting best practices for adoption across the Group.

Business model (continued) Global businesses
HSBC HOLDINGS PLC
16
Global businesses Our four global businesses are Retail Banking and Wealth Management (‘RBWM’), Commercial Banking (‘CMB’), Global Banking and Markets (‘GB&M’) and Global Private Banking (‘GPB’). They are responsible for
developing, implementing and managing their business propositions consistently across the Group, focusing on profitability and efficiency. They set their strategies within the parameters of the Group strategy in liaison with the geographical regions; are responsible for issuing planning guidance
regarding their businesses; are accountable for their profit and loss performance; and manage their headcount. The main business activities of our global business and their products and services are summarised below.
Main business activities by global business in 2014
For footnotes, see page 39.
Retail Banking and Wealth Management
Products and services RBWM takes deposits and provides transactional banking services to enable customers to manage their day-to-day finances and save for the future. We offer credit facilities to assist them in their short or longer-term borrowing requirements and we provide financial advisory, broking, insurance and investment services to help them to manage and protect their financial futures.
We develop products designed to meet the needs of specific customer segments, which may include a range of different services and delivery channels.
RBWM offers four main types of service:
– HSBC Premier: we provide a dedicated relationship manager to our mass affluent customers and their immediate families, offering specialist and tailored advice. Customers can access emergency travel assistance, priority telephone banking and an online ‘global view’ of their Premier accounts around the world.
– HSBC Advance: we offer our emerging affluent customers control over their day-to-day finances and access to a range of preferential products, rates and terms. HSBC Advance is also the start of a relationship where we give customers support and guidance to help them to realise their ambitions.
– Wealth Solutions & Financial Planning: a financial planning process designed around individual customer needs to help our clients to protect, grow and manage their wealth. We offer investment and wealth insurance products manufactured by Global Asset Management, Markets and HSBC Insurance and by selected third-party providers.
– Personal Banking: we provide globally standardised but locally delivered, reliable, easy to understand, good-value banking products and services using global product platforms and globally set service standards.
RBWM delivers services through four principal channels: branches, self-service terminals, telephone service centres and digital (internet and mobile).
Customers RBWM serves nearly 50 million customers. We are committed to building lifelong relationships with our customers as they move from one stage of their lives to the next, offering tailored products and services
appropriate to their diverse goals, aspirations and ambitions. We recognise that some of our customers face financial challenges and, in these cases, we aim to be tolerant, fair and understanding and to support them during difficult times.
We put the customer at the heart of everything we do. We constantly carry out research and invest resources to make sure that customers can access our services conveniently, securely and reliably. We have conducted work to ensure that we sell products that meet their needs and at a price that represents a fair exchange of value between customers and shareholders, and have introduced new incentive programmes that have no formulaic links to sales volumes but are focused on assessing how well we are meeting our customers’ needs.
We measure customer satisfaction through an independent market research survey of retail banking customers in selected countries and calculate a Customer Recommendation Index to measure performance. This is benchmarked against average scores of a peer group of banks in each market and we set targets for our business relative to our competitor set of banks. We expect continuous improvements across markets in which we operate. We aim
RBWM CMB GB&M GPB
− Deposits− Account services
− Deposits− Payments and cash
management
− Deposits− Payments and cash
management− Balance sheet management
− Deposits− Account services
Globalbusinesses
Liabilitydriven
− Credit and lending − Credit and lending− International trade and
receivables finance
− Credit and lending− Asset and trade finance
− Credit and lendingAssetdriven
− Asset management− Wealth solutions and
financial planning− Broking6
− Insurance (distribution;life manufacturing)
− Commercial insuranceand investments
− Corporate finance7
− Markets8
− Securities services
− Investment management9
− Financial advisory10
− Broking6
− Corporate finance (via GB&M)7
− Alternative investments11
– Trusts and estate planning
Fee drivenand other

HSBC HOLDINGS PLC
17
Str
ateg
ic R
epo
rt
Fi
nan
cial
Rev
iew
Cor
pora
te G
over
nanc
e
Fina
ncia
l Sta
tem
ents
Sh
areh
old
er In
form
atio
n
to handle customer complaints promptly and fairly, monitoring trends to further improve our services.
Commercial Banking
Products and services CMB provides a broad range of banking and financial services to enable customers to manage and grow their businesses domestically and internationally. We aim to be recognised as the leading international trade and business bank by connecting customers to markets and by enhancing collaboration within the Group, both geographically and between global businesses. A global operating model increases transparency, enables consistency, improves efficiency and ensures the right outcomes for our customers.
CMB customer offerings typically include:
– Credit and Lending: we offer a broad range of domestic and cross-border financing, including overdrafts, corporate cards, term loans and syndicated, leveraged, acquisition and project finance. Asset finance is also offered in selected countries.
– Global Trade and Receivables Finance: we support customers’ access to the world’s trade flows and provide unrivalled experience in addressing today’s most complex trade challenges. Our comprehensive suite of products and services, letters of credit, collections, guarantees, receivables finance, supply chain solutions, commodity and structured finance and risk distribution, can be combined into global solutions that make it easier for businesses to manage risk, process transactions and fund activities throughout the trade cycle.
– Payments and Cash Management: we are strategically located where most of the world’s payments and capital flows originate. We provide local, regional and global transaction banking services including payments, collections, account services, e-commerce and liquidity management via e-enabled platforms to address the needs of our customers.
– Insurance and Investments: we offer business and financial protection, trade insurance, employee benefits, corporate wealth management and a variety of other commercial risk insurance products in selected countries.
– Collaboration: our CMB franchise represents a key client base for products and services provided by GB&M, RBWM and GPB, including foreign exchange, interest rate, capital markets and advisory services, payroll and personal accounts services and wealth management and wealth transition services.
HSBC is leading the development of the renminbi as a trade currency, with renminbi capabilities in more than 50 markets.
Our range of products, services and delivery channels is tailored to meet the needs of specific customer segments.
Customers We have organised ourselves around our customers’ needs and their degree of complexity by developing three distinct segments within CMB: Business Banking, Mid-Market and Large Corporates.
– Business Banking now has two distinct needs-based servicing models: relationship managers focused on customers with more complex needs; and portfolio management for customers requiring simpler, more routine products and services.
– We have brought increased focus to our Mid-Market customers and are re-configuring our organisation and resources across our home and priority growth markets to provide enhanced relationship management.
– For our Large Corporate customers, who typically have complex and multi-country needs, we provide globally managed senior coverage teams, who are also able to coordinate with other global businesses.
To ensure that our customers remain at the heart of our business, we continue to place the utmost value on customer feedback and customer engagement. We are now in the 6th year of our Client Engagement Programme, a global survey of 15 markets designed to deepen our understanding of our customers and reinforce our relationship with them. This initiative, combined with other insight programmes, helps us to identify customers’ critical business issues so that we can tailor solutions and services offered to better meet their needs.
Building long-term relationships with reputable customers is core to our growth strategy and organisational values.
Global Banking and Markets
Products and services GB&M provides wholesale capital markets and transaction banking services organised across eight client-facing businesses.
GB&M products and services include:
– Sales and trading services in the secondary market are provided in Markets, which includes four businesses organised by asset class: – Credit and Rates sell, trade and distribute
fixed income securities to clients including corporates, financial institutions, sovereigns, agencies and public sector issuers. They assist clients in managing risk via interest rate and credit derivatives, and facilitate client financing via repurchase (‘repo’) agreements.
– Foreign Exchange provides spot and derivative products to meet the investment demands of institutional investors, the hedging needs of small and medium-sized enterprises (‘SME’s), middle-market enterprises (‘MME’s) and large corporates in GB&M and CMB, and the needs of RBWM and GPB customers in our branches. Foreign Exchange trades on behalf of clients in over 90 currencies.
– Equities provides sales and trading services for clients, including direct market access and financing and hedging solutions.
– Capital Financing offers strategic financing and advisory services focusing on a client’s capital structure. Products include debt and equity capital raising in the primary market, transformative merger and acquisition advisory and execution, and corporate lending and specialised structured financing solutions such as leveraged and acquisition finance, asset and structured finance, real estate, infrastructure and project finance, and export credit.
– Payments and Cash Management helps clients move, control, access and invest their cash. Products include non-retail deposit taking and international, regional and domestic payments and cash management services.
– Securities Services provides custody and clearing services to corporate and institutional clients and funds administration to both domestic and cross-border investors.
– Global Trade and Receivables Finance provides trade services on behalf of GB&M clients to support them throughout their trade cycle.
In addition to the above, Balance Sheet Management is responsible for the management of liquidity and funding for the Group. It also manages structural interest rate positions within the Markets limit structure.

Business model (continued) Global businesses / Employees
HSBC HOLDINGS PLC
18
Customers GB&M provides tailored financial solutions to major governmental, corporate and institutional clients worldwide. Managed as a global business with regional oversight, GB&M operates a long-term relationship management approach to build a full understanding of clients’ financial requirements and strategic goals.
Client coverage is centralised in Banking, which contains relationship managers organised by sector, region and country who work to understand client needs and provide holistic solutions by bringing together our broad array of product capabilities and utilising our extensive global network.
Our goal is to be a ‘Top 5’ bank to our priority clients. We strive to achieve this goal by assembling client coverage teams across our geographical network who work alongside product specialists in developing individually tailored solutions to meet client needs. Our client coverage and product teams are supported by a unique customer relationship management platform and comprehensive client planning process. Our teams utilise these platforms to better serve global client relationships, which facilitates our ability to connect clients to international growth opportunities.
Global Private Banking
Products and services Drawing on the strength of HSBC and the most suitable products from the marketplace, we work with our clients to provide solutions to grow, manage and preserve wealth for today and for the future. Our products and services include Private Banking, Investment Management and Private Wealth Solutions.
GPB products and services include:
– Private Banking services comprise multicurrency and fiduciary deposits, account services, and credit and specialist lending. GPB also accesses HSBC’s universal banking capabilities to offer products and services such as credit cards, internet banking and corporate and investment banking solutions.
– Investment Management comprises advisory and discretionary investment services and brokerage across asset classes. This includes a complete range of investment vehicles, portfolio management, securities services and alternatives.
– Private Wealth Solutions comprise trusts and estate planning, designed to protect wealth and preserve it for future generations.
Customers GPB serves the needs of high net worth and ultra-high net worth individuals and their families in our home and priority growth markets.
Within these broad segments, GPB has teams dedicated to serving HSBC’s global priority clients, which include our most significant Group relationships, and other clients who benefit from our private banking proposition and services offered by CMB and GB&M. Our aim is to build and grow connectivity with these customers Group-wide, establishing strong relationships across all global businesses to meet clients’ needs. We aim to build on HSBC’s commercial banking heritage to be the leading private bank for high net worth business owners.
Relationship managers are the dedicated points of contact for our clients, tailoring services to meet their individual needs. They develop a thorough understanding of their clients – including their family, business, lifestyle and ambitions – and introduce them to specialists equipped to help build the best financial strategy. Specialists include:
– investment advisers, who discuss investment ideas in line with a client’s investment and risk profile;
– credit advisers, who provide expertise in complex liquidity and lending requirements; and
– wealth planners, who have the knowledge and expertise to manage wealth now and for future generations.
The use of digital platforms continues to grow in line with strong demand from self-directed clients. These platforms enable clients to access account information, investment research and online transactional capabilities directly. We continue to invest in digital systems to better meet clients’ evolving expectations and needs.
Employees Successfully enhancing a values-led high performance culture in HSBC is critical to implementing Global Standards sustainably. We continue to focus on embedding HSBC Values in every decision and interaction between colleagues and with customers.
– We aim to attract, retain and motivate the very best people, and our remuneration policy supports this endeavour.
– We actively manage succession planning by defining the capabilities we need and complement this by identifying talented individuals and ensuring they are provided with appropriate career and development opportunities to fulfil their potential in HSBC.
– We provide training and development opportunities to enable employees to acquire the technical and leadership skills needed to enhance their careers.
– We are committed to a diverse and inclusive culture reflective of our customer base.
– We encourage employees to engage in the local communities in which they work.
At the end of 2014 we had a total workforce of 266,000 full-time and part-time employees compared with 263,000 at the end of 2013 and 270,000 at the end of 2012. Our main centres of employment were as follows (approximate numbers):
UK48,000
India32,000
Hong Kong30,000
Brazil21,000
MainlandChina
21,000
Mexico17,000
US15,000
France9,000
Other73,000

HSBC HOLDINGS PLC
19
Str
ateg
ic R
epo
rt
Fi
nan
cial
Rev
iew
Cor
pora
te G
over
nanc
e
Fina
ncia
l Sta
tem
ents
Sh
areh
old
er In
form
atio
n
Profile of leadership At the date of this Report, the Executive Management of HSBC consists of four Executive Directors, 11 Group Managing Directors and 60 Group General Managers. Of these, 13 (17%) are female. This leadership team is based in 17 different countries and comprises 13 different nationalities. 71% have served with HSBC for more than 10 years and the total average tenure is 20 years.
HSBC has 13 non-executive Directors.
Employment proposition
HSBC Values In 2014, education on HSBC Values continued for all levels of employees through induction and other training programmes that covered relevant technical, management and leadership skills. We require a high behavioural standard from all our employees, and our focus on values and courageous integrity continues to be instilled at every level in the Group. For example, our employee induction programme has been refreshed to further reinforce courageous integrity and meeting the needs of our customers. Also, an assessment of adherence to our values and supporting behaviours has been formalised as part of our performance appraisal process for all employees. In 2014, some 145,000 employees received values training in addition to 135,000 employees in 2013. A further 100,000 employees are expected to receive this training in 2015. A number of employees left the Group for breaching our values.
Employee development The development of employees is essential if our businesses and operations are to strengthen and prosper. We take a systematic approach to identifying, developing and deploying talented employees to ensure we have a robust supply of high calibre individuals with the values, skills and experience for current and future senior management positions.
We keep our approach to training current and under constant review in order to improve the quality of our curricula and ensure employees are equipped with the technical and leadership skills to operate in a global organisation. We are standardising our training to help employees provide a consistently high quality experience for customers in all our markets and support the mitigation of current and emerging risks and the Global Standards programme.
Employee engagement Strong employee engagement leads to positive commercial outcomes and underpins improved business performance, increased customer satisfaction, higher productivity, talent retention and reduced absenteeism.
We assess our employees’ engagement through our Global People Surveys, which were held annually from 2007 to 2011 and biennially thereafter. The latest Survey, in 2013, focused on supporting a values-led high performance culture by assessing if our employees were engaged in the Group’s purpose and felt able to deliver on our ambition to become the world’s leading international bank.
Our employees’ engagement continues to be positive when compared with the financial services industry and sector best-in-class benchmark. The overall engagement score in 2013 was 68%, which was four percentage points ahead of the financial services industry norm and eight points behind the best-in-class benchmark. Strong scores were registered in risk awareness (81% and nine points above best-in-class benchmark), leadership capability (67%) and living the HSBC Values (77%). Employee development significantly improved from six points below best-in-class in 2011 to three points above in 2013. Aspects that required attention included pride and advocacy, which were 12 and 13 points, respectively, below best in class norms and had fallen from 2011 levels. The next Global People Survey will be conducted in 2015.
HSBC also conducts a regular survey, Snapshot, which is sent to one quarter of our employees every three months. Insights from Snapshot provide a timely indication of employee sentiment towards the organisation, including signifiers of engagement. As at the end of September 2014, the favourable responses to selected questions were: support for HSBC’s strategy, 81%; intend to still be working at HSBC in three years’ time, 74%; pride in working for HSBC, 79%; and willingness to recommend HSBC to other senior professionals as a great place to further their career, 68%. Aspects for further attention include helping employees see the positive effects of HSBC’s strategic priorities, 62%.
Succession planning Our talent strategy aims to ensure that high-quality candidates are available to fill key positions and meet business needs across all areas of the Group. We directly align succession planning with talent management, individual development and career planning. The succession plan defines the number, distribution, types of roles and capabilities needed by HSBC, and talented individuals are then aligned to these roles. This approach in turn defines the individual’s career path and development plan. In 2014, we assessed 104 senior employees with the potential to become leaders and determined their career development needs. Potential successors must demonstrate an understanding of our Global Standards and exemplify HSBC Values.
Our talent strategy supports our aspirations in emerging markets, where in 2014 the representation of those defined as talent was 34%. We closely monitor local nationals identified as short-term and medium-term successors to key leadership roles so as to improve the proportion of local nationals in senior management over the medium term.
Diversity and inclusion HSBC is committed to a diverse and inclusive culture where employees can be confident their views are encouraged, their concerns are attended to, they work in an environment where bias, discrimination and harassment on any matter (including gender, age, ethnicity, religion, sexuality and disability) are not tolerated, and advancement is based on merit. Our diversity helps us support our increasingly diverse customer base and acquire, develop and retain a secure supply of skilled and committed employees.
Oversight of our diversity and inclusion agenda resides with senior executives on the Group Diversity Committee, complemented by a number of subsidiary People/Diversity Committees. We have over 55 employee network groups representing gender, ethnicity, age, sexuality, disability, religion, culture, working parents, health and community volunteering. These groups are instrumental in driving an inclusive culture and maintaining effective dialogue between management and employees.

Business model (continued) Employees / Risk overview
HSBC HOLDINGS PLC
20
Gender balance An area of continued focus is gender representation, particularly at senior levels of our organisation. We are addressing bias in hiring, promotions and talent identification, expanding mentoring and sponsorship, introducing better support for returning parents and increasing flexible working opportunities.
The gender balance for HSBC Directors and employees at 31 December 2014 was as follows:
Gender balance Headcount Male Female Total
Executive Directors 4 – 4 Non-executive
Directors 6 6 12 Directors 10 6 16 Senior employees 6,719 2,076 8,795 Other employees 120,496 136,966 257,462
Total 127,225 139,048 266,273
% Male Female Total
Executive Directors 100 – 100 Non-executive
Directors 50.0 50.0 100 Directors 62.5 37.5 100 Senior employees 76.4 23.6 100 Other employees 46.8 53.2 100
Total 47.8 52.2 100
Overall, Group-wide female representation was 52.2% at 31 December 2014, largely unchanged on 2013. Female representation at senior levels rose from 22.7% in 2013 to 23.6% in 2014, and our target is to improve this to 25% by 2015. The proportion of females in our talent pipeline improved from 32.2% in 2013 to 34.0% in December 2014 and female representation on the GMB was 20% (three out of fifteen) in December 2014.
The average age of our employees was 36.2 years and average tenure was 8.5 years.
Unconscious bias It is recognised that social behaviour may be driven by stereotypes that operate automatically and therefore unconsciously. These stereotypes can lead to a less inclusive environment. We are addressing this by incorporating inclusive behaviours in our processes and continue to deliver ‘unconscious bias’ training to 8,700 managers and 18,500 employees in 2014 (8,300 managers and 50,000 employees in 2013).
In 2015, our diversity and inclusion priorities will continue to address unconscious bias through targeted education, encourage the career development of diverse talent with a continued emphasis on gender and local nationals and extend inclusion to cover wider aspects of diversity, for example, sexual orientation, ethnicity and disability. We continue to enhance a bias-free approach to performance management and improve internal and external candidate lists, connecting and utilising our Employee Resource Network Groups globally and maintaining a consistent global framework of governance and sponsorship to drive a diverse and inclusive culture throughout the Group.
Health, welfare and safety We regard the physical and psychological health, welfare and safety of our people as being of the utmost importance. We recently introduced a global occupational health framework which requires the proactive management of employee welfare and encourages the sharing of best practice across the Group. Between August 2012 and the end of 2014, 96% of assigned HSBC employees carried out our bi-annual online health and safety training.
We run a number of employee assistance programmes tailored to local requirements. Skilled professional counsellors are available on free phone lines 24 hours a day and seven days a week to help employees manage personal or work-related problems that create stress and affect their work. Free face-to-face counselling is also provided, as is support for partners and dependents. Programmes are offered in the UK, Hong Kong, North America and India.
Whistleblowing HSBC operates a global Compliance disclosure line (telephone and email) which is available to allow employees to make disclosures when the normal channels for airing grievances or concerns are unavailable or inappropriate. The Compliance disclosure line is available to capture employee concerns on a number of matters, including breaches of law or regulation, allegations of bribery and corruption, failure to comply with Group policies, suspicions of money laundering, breaches of internal controls and fraud or deliberate error in the financial records of any Group company. Global Regulatory Compliance is responsible for the operation of the Compliance disclosure line and the handling of disclosure cases. Cases are reviewed and referred for appropriate investigation. Whistleblowing cases may also be raised directly with senior executives, line managers, Human Resources and Security and Fraud.
Additional local whistleblowing lines are in place in several countries, operated by Security and Fraud, Human Resources and Regulatory Compliance. Disclosures made on the local whistleblowing lines are escalated to Global Regulatory Compliance or Financial Crime Compliance. Global Regulatory Compliance also monitors an external email address for complaints regarding accounting and internal financial controls or auditing matters ([email protected] highlighted under Investor Relations and Governance on www.hsbc.com). Cases received are escalated to the Group Chief Accounting Officer, Group Finance Director or Group Chief Executive as appropriate.
HSBC’s policies and procedures for capturing and responding to whistleblowing disclosures relating to accounting or auditing matters are overseen by the Group Audit Committee. Those relating to other whistleblowing disclosures are overseen by the Conduct & Values Committee.
Disclosures and actions taken are reported on a periodic basis to the Conduct & Values Committee, Group Audit Committee and the Financial System Vulnerabilities Committee in respect of matters relating to financial crime compliance.

HSBC HOLDINGS PLC
21
Str
ateg
ic R
epo
rt
Fi
nan
cial
Rev
iew
Cor
pora
te G
over
nanc
e
Fina
ncia
l Sta
tem
ents
Sh
areh
old
er In
form
atio
n
Risk overview All our activities involve, to varying degrees, the measurement, evaluation, acceptance and management of risk or combinations of risks.
As a provider of banking and financial services, we actively manage risk as a core part of our day-to-day activities. We employ a risk management framework at all levels of the organisation, underpinned by a strong risk culture and reinforced by HSBC Values and our Global Standards. It ensures that our risk profile remains conservative and aligned to our risk appetite, which describes the type and quantum of risk we are willing to accept in achieving our strategic objectives.
Risk and our strategic priorities The Group’s three strategic priorities are reflected in our management of risk.
Grow the business and dividends – we ensure risk is maintained at an acceptable and appropriate level while creating value and generating profits.
Implement Global Standards – we are transforming how we detect, deter and protect against financial crime through the deployment of Global Standards, which govern how we do business and with whom.
Streamline processes and procedures – our disposal programme has made HSBC easier to manage and control. By focusing on streamlining our processes and procedures, we are making HSBC less complex and
complicated to operate, creating capacity for growth. Our business and operating models are described on page 12. For further information on Global Standards, see page 26.
Risk in 2014 Concerns remained during 2014 over the sustainability of economic growth in both developed and emerging markets, while geopolitical tensions rose or remained high in many parts of the world.
We continued to sustain a conservative risk profile based on our core philosophy of maintaining balance sheet, liquidity and capital strength by reducing exposure to the most likely areas of stress:
– we managed selectively our exposures to sovereign debt and bank counterparties to ensure that the overall quality of the portfolio remained strong;
– we regularly assessed higher risk countries and sectors and adjusted our risk appetite, limits and exposures accordingly;
– we use stress testing, both internal and regulatory programmes, to assess vulnerabilities and proactively adjust our portfolios, where required;
– we continued to reposition and exit certain portfolios through our six filters process (see page 12) and our focus on certain products or customer segments;
– we made our client selection filters more robust in managing the risk of financial crime; and
– we mitigated risks, for example reputational and operational, when they were forecast to exceed our risk appetite.
The diversification of our lending portfolio across global businesses and geographical regions, together with our broad range of products, ensured that we were not overly dependent on a limited number of countries or markets to generate income and growth.
We monitored a range of key risk metrics in 2014 as part of our risk appetite process, supported by a limit and control framework.
Risk appetite is discussed on page 25.
Our approach to stress testing is discussed on page 117 and regulatory stress testing programmes on page 125.
Risks incurred in our business activities Our principal banking risks are credit risk, liquidity and funding risks, market risk, operational risk, compliance risk, fiduciary risk, reputational risk, pension risk and sustainability risk. We also incur insurance risk.
The chart overleaf provides a high level guide to how our business activities are reflected in our risk measures and in the Group’s balance sheet. The third-party assets and liabilities indicate the contribution each business makes to the balance sheet, while RWAs illustrate the relative size of the risks incurred in respect of each business. For a description of our principal risks, see page 114.

Business model (continued) Risk overview
HSBC HOLDINGS PLC
22
Exposure to risks arising from the business activities of global businesses
For footnote, see page 39.
For further information on credit risk, see page 127; capital and risk-weighted assets, see page 238; market risk, including value at risk, see page 175; and operational risk see page 186.
Top and emerging risks Identifying and monitoring top and emerging risks are integral to our approach to risk management.
We define a ‘top risk’ as being a current, emerged risk which has arisen across any of our risk categories, global businesses or regions and has the potential to have a material impact on our financial results or our reputation and the sustainability of our long-term business model, and which may form and crystallise within a one-year time horizon. We consider an ‘emerging risk’ to be one with potentially significant but uncertain outcomes which may form and crystallise beyond a year, in the event of which it could have a material effect on our ability to achieve our long-term strategy.
Our top and emerging risk framework enables us to identify and manage current and forward-looking risks to ensure our risk appetite remains appropriate. The ongoing
assessment of our top and emerging risks is informed by a comprehensive suite of risk factors which may result in our risk appetite being revised.
During 2014, senior management paid particular attention to a number of top and emerging risks. Our current ones are summarised overleaf.
We made a number of changes to our top and emerging risks during 2014 to reflect our assessment of their effect on HSBC. ‘Macroeconomic risks arising from an emerging market slowdown’ was replaced by ‘Economic outlook and government intervention’ as developed economies demonstrated signs of stress in the second half of 2014. ‘Third party risk management’ was identified as an emerging risk due to the risks associated with the use of third-party service providers, which may be less transparent and more challenging to manage or influence. While ‘People risk’ is inherent
within a number of our top and emerging risks, it has now been disclosed as a standalone risk, as the risks in this area continue to heighten.
When the top and emerging risks listed below resulted in our risk appetite being exceeded, or had the potential to exceed our risk appetite, we took steps to mitigate them, including reducing our exposure to areas of stress. Given the impact on the Group of breaching the US Deferred Prosecution Agreement (‘US DPA’), significant senior management attention was given to tracking and monitoring our compliance with its requirements and improving policies, processes and controls to help minimise the risk of a breach. For a detailed account of these risks see page 118 and for a summary of our risk factors, see page 113.
RBWM CMB GB&M GPB
HSBC
− HSBC holding company andcentral operations
− Deposits− Accounts services− Credit and lending− Asset management− Wealth solutions and
financial planning− Broking− Insurance
(distribution; life manufacturing)
− Deposits− Payments and cash
management− Credit and lending− International trade
and receivables finance
− Commercial insurance and investments
− Deposits− Payments and cash
management− Balance sheet
management− Credit and lending− Asset and trade
finance− Corporate finance− Markets− Securities services
− Deposits− Account services− Credit and lending− Investment
management− Financial advisory− Broking− Corporate finance
(via GB&M)− Alternative
investments− Trusts and estate
planning
Global business
Business activities
Risk profile
Balance sheet 12
Liquidity and funding risk (page 163), Pension risk (page 200), Fiduciary risk (page 200), Reputational risk (page 199),Compliance risk (page 189), Sustainability risk (page 201) and Insurance risk (page 190). The latter is predominantly in RBWM and CMB.
Other(including Holding Company)
RWAs
US$bn− Assets 373− Customer
accounts 364
US$bn− Assets 1,840− Customer
accounts 319
US$bn− Assets 88− Customer
accounts 85
US$bn− Assets 165− Customer
accounts 1
US$bn− Assets 499− Customer
accounts 581
US$bn− Credit risk 168− Operational risk 37
US$bn− Credit risk 399− Operational risk 33
US$bn− Credit risk 326− Counterparty
credit risk 90− Operational risk 44− Market risk 56
US$bn− Credit risk 17− Operational risk 4
US$bn− Credit risk 45− Operational risk –

HSBC HOLDINGS PLC
23
Str
ateg
ic R
epo
rt
Fi
nan
cial
Rev
iew
Cor
pora
te G
over
nanc
e
Fina
ncia
l Sta
tem
ents
Sh
areh
old
er In
form
atio
n
Top and emerging risks – /
Risk Description Mitigants
Macroeconomic and geopolitical risk
Economic outlook and government intervention
Weak economic growth in both developed and emerging market countries could adversely affect global trade and capital flows and our profits from operations in those countries.
We closely monitor economic developments in key markets and appropriate action is taken as circumstances evolve.
Increased geopolitical risk Our operations are exposed to risks arising from
political instability and civil unrest in a number of countries, which may have a wider effect on regional stability and regional and global economies.
We monitor the geopolitical and economic outlook, particularly in countries where we have material exposures and/or a physical presence.
Macro-prudential, regulatory and legal risks to our business model
Regulatory developments affecting our business model and Group profitability
Governments and regulators continue to develop policies which may impose new requirements, particularly in the areas of capital and liquidity management and business structure.
We engage closely with governments and regulators in the countries in which we operate to help ensure that the new requirements are considered properly.
Regulatory investigations, fines, sanctions, commitments and consent orders and requirements relating to conduct of business and financial crime negatively affecting our results and brand
Financial service providers are at risk of regulatory sanctions or fines related to conduct of business and financial crime. Breach of the US DPA may allow the US authorities to prosecute HSBC with respect to matters covered thereunder.
Programmes to enhance the management of conduct are progressing in all global businesses and functions. We continue to take steps to address the requirements of the US DPA and other consent orders in consultation with the relevant regulatory agencies.
Dispute risk HSBC is party to legal proceedings arising out of its
normal business operations which could give rise to potential financial loss and significant reputational damage.
We identify and monitor emerging regulatory and judicial trends. We are enhancing our financial crime and regulatory compliance controls and resources.
Risks related to our business operations, governance and internal control systems
Heightened execution risk The complexity of projects to meet regulatory
demands and risks arising from business and portfolio disposals may affect our ability to execute our strategy.
We have strengthened our prioritisation and governance processes for significant projects.
People risk Significant demands are being placed on the
human capital of the Group due to the extent of the regulatory reform agenda.
We have reviewed our remuneration policy to ensure we can remain competitive and retain our key talent and continue to increase the level of specialist resources in key areas.
Third-party risk management Risks arising from the use of third-party service
providers may be less transparent and more challenging to manage or influence.
We are strengthening our risk management processes and procedures in relation to the use and monitoring of third-party service providers.
Internet crime and fraud HSBC is increasingly exposed to fraudulent and
criminal activities as a result of increased usage of internet and mobile channels.
We continually assess these threats as they evolve and adapt our controls and defences to mitigate them.
Information security risk HSBC and other multinational organisations
continue to be the targets of cyber attacks. We have invested significantly in staff training and
enhanced multi-layered controls to protect our information and technical infrastructure.
Data management New regulatory requirements necessitate more
frequent and granular data submissions, which must be produced on a consistent, accurate and timely basis.
Our Data Strategy Board is driving consistent data aggregation, reporting and management across the Group.
Model risk Adverse consequences could result from decisions
based on incorrect model outputs or from models that are poorly developed, implemented or used.
Model development, usage and validation are subject to governance and independent review.
T E
E
E
T
T
T
T
T
E
T
T
T
T

Business model (continued) Risk overview
HSBC HOLDINGS PLC
24
How we manage risk Managing risk effectively is fundamental to the delivery of our strategic priorities.
Our enterprise-wide risk management framework fosters the continuous monitoring of the risk environment and an integrated evaluation of risks and their
interactions. It also ensures that we have a robust and consistent approach to risk management at all levels of the organisation and across all risk types.
This framework is underpinned by a strong risk culture, which is instrumental in aligning the behaviours of individuals with the
Group’s attitude to assuming and managing risk and ensuring that our risk profile remains in line with our risk appetite and strategy. It is reinforced by the HSBC Values and our Global Standards.
Our approach to managing risk is summarised below.
Driving our risk culture
Risk Management Framework
Approves risk appetite, plans and performance targets (page 270).Role of HSBC Board
Formulate and implement strategy within risk appetite.Responsible for risk governance and controls.
Role of senior management
Risks arising from our business activities that are measured, monitored and managed (page 114).Principal banking and insurance risks
Our risk governance framework ensures appropriate oversight of and accountability for management of risk (page 204).Our risk culture empowers our people to do the right thing for our customers, reinforced by our approach to remuneration (page 34).Our ‘Three lines of defence’ model defines roles and responsibilities for risk management (page 186).An independent Risk function ensures the necessary balance in risk/return decisions (page 204).
Risk governance framework Three lines of defence model
Independent Risk function People
Describes the risks we are prepared to accept based on our long-term strategy, core risk principles, HSBC Values and risk management competencies (page 205).
Risk appetite
Processes to identify, monitor and mitigate risks that exceed our risk appetite (page 117).
Top andemerging risks Risk map Stress testing
Risk management processes and procedures
GRC advises on risk appetite, risk governance and other high-level risk related matters (page 280).FSVC advises on financial crime and financial systems abuse (page 282).CVC advises on polices and procedures to ensure we adhere to HSBC Values (page 286).Other sub-committees of the Board are described on page 276.
Group Risk Committee
(‘GRC’)
Financial SystemVulnerabilities Committee
(‘FSVC’)
Conduct & Values Committee
(‘CVC’)
Role of Board Committees
Cont
rols
Proc
ess
Underpinned by HSBC Values

HSBC HOLDINGS PLC
25
Str
ateg
ic R
epo
rt
Fi
nan
cial
Rev
iew
Cor
pora
te G
over
nanc
e
Fina
ncia
l Sta
tem
ents
Sh
areh
old
er In
form
atio
n
Risk appetite The Group’s risk appetite statement (‘RAS’) is a key component in the management of risk. It describes the types and quantum of risks that we are willing to accept in achieving our medium and long-term strategic objectives. The RAS is approved by the Board on the advice of the Group Risk Committee.
Our risk appetite is established and monitored via the Group risk appetite framework, which provides a globally consistent and structured approach to the management, measurement and control of risk in accordance with our core risk principles. The framework outlines the processes, policies, metrics and governance bodies and how to address risk appetite as part of day-to-day business and risk management activities.
The RAS guides the annual planning process by defining the desired forward-looking risk profile of the Group in achieving our strategic objectives and plays an important role in our six filters process. Our risk appetite may be revised in response to our assessment of the top and emerging risks we have identified.
Quantitative and qualitative metrics are assigned to a number of key categories including returns, capital, liquidity and funding, securitisations, cost of risk and intra-Group lending, risk categories such as credit, market and operational risk, risk diversification and concentration, and financial crime compliance. These measures are reviewed annually for continued relevance.
Measurement against the metrics:
– guides underlying business activity, ensuring it is aligned to risk appetite statements;
– enables the key underlying assumptions to be monitored and, where necessary, adjusted through subsequent business planning cycles;
– allows the business decisions needed to mitigate risk to be promptly identified; and
– informs risk-adjusted remuneration.
Risk appetite is embedded in day-to-day risk management decisions through the use of risk tolerances and limits for material risk types. This ensures that our risk profile remains aligned with our risk appetite, balancing risk and returns.
Global businesses and geographical regions are required to align their risk appetite statements with the Group’s.
Some of the core metrics that were measured, monitored and presented monthly to the Risk Management Meeting of the GMB during 2014 are tabulated below:
Key risk appetite metrics 2014
target actual
Common equity tier 1 ratio1 10% 11.1%
Return on equity Trendingupwards to
12-15%by 2016 7.3%
RoRWA13 2.2-2.6% 1.5%Cost efficiency ratio Mid-50s 67.3% Advances to customer
accounts ratio Below 90% 72.2%Cost of risk
(loan impairment charges)
Below 15%of operating
income 5.4%
For footnotes, see page 39.
In the early part of 2014, we undertook our annual review of our risk appetite statement. It was approved by the Risk Managament Meeting of the GMB in January 2014 and the HSBC Holdings Board in February 2014. The core aspects of the RAS were incorporated into the 2014 scorecards for the Executive Directors, as set out on page 405 of the Annual Report and Accounts 2013.
We also strengthened the Group’s RAS in 2014 by incorporating into it measures related to the core financial crime compliance principles of deterrence, detection and protection. Targets for 2015 are discussed on page 32.
For details of requirements under CRD IV, see page 239.
How risk affects our performance The management of risk is an integral part of all our activities. Risk measures our exposure to uncertainty and the consequent variability of return.
Credit metrics in our retail portfolio benefited from the continued sale of non-strategic portfolios, an improved economic environment across many markets and growth in Asia and in the core business in the US, while our wholesale portfolios remained broadly stable with an overall favourable change in key impairment metrics. Loan impairment charges fell for reasons outlined on page 29.
Operational losses rose, driven by UK customer redress programme charges and settlements relating to legal and regulatory matters. There are many factors which could affect estimated liabilities with respect to legal and regulatory matters and there remains a high degree of uncertainty as to the eventual cost of fines, penalties and redress for these matters.
HSBC is party to legal proceedings, investigations and regulatory matters in a number of jurisdictions arising out of our normal business operations. Our provisions for legal proceedings and regulatory matters and for customer remediation at 31 December 2014 totalled US$4.0bn.
The reported results of HSBC reflect the choice of accounting policies, assumptions and estimates that underlie the preparation of our consolidated financial statements and reflect our assessment of the financial impact of risks affecting the Group. For a description of material legal proceedings and regulatory matters, see Note 40 on the Financial Statements on page 446.
Provisions for legal proceedings and regulatory matters and for customer remediation are disclosed in Note 29 on the Financial Statements on page 420.
For details of operational losses, see page 188.
For details of our critical accounting estimates and judgements, see page 62.

Strategic priorities Grow the business / Implement Global Standards
HSBC HOLDINGS PLC
26
Strategic priorities
We previously defined three interconnected and equally weighted priorities for 2014 to 2016 to help us deliver our strategy:
− grow the business and dividends;
− implement Global Standards; and
− streamline processes and procedures.
Each priority is complementary and underpinned by initiatives within our day-to-day business. Together, they create value for our customers and shareholders and contribute to the long-term sustainability of HSBC.
In the process, we shall maintain a robust, resilient and environmentally sustainable business in which our customers can have confidence, our employees can take pride and our communities can trust.
Grow the business and dividends In growing the business and dividends, our targets are to grow risk-weighted assets in line with our organic investment criteria, progressively grow dividends, while reducing the effect of legacy and non-strategic activities on our profit and RWAs.
Our strategy is to take advantage of the continuing growth of international trade and capital flows, and wealth creation, particularly in Asia, the Middle East and Latin America. We aim to achieve growth by leveraging our international network and client franchise to improve HSBC’s market position in products aligned to our strategy.
To facilitate this growth, we recycle RWAs from low into high performing businesses within our risk appetite.
In 2014, we launched a number of investment priorities to capitalise on our global network and accelerate organic growth:
− Global Trade and Receivables Finance: We are investing in our sales and product capabilities, particularly for high growth products and trade corridors, and expanding in trade hubs as a means of reinforcing HSBC’s leading position in trade.
− Payments and Cash Management: We aim to deliver improved client coverage and products via investments in better sales coverage and customer proposition and mobile enhancements.
− Foreign Exchange: We aim to improve our services to clients and efficiency by improving our electronic trading platforms and capabilities.
− Renminbi: Building on our market-leading position, we are investing to roll out our renminbi servicing capabilities internationally, with the aim of capturing a larger share of offshore renminbi foreign exchange and capital markets opportunities.
Industry awards and market share gains have validated our strategy. Our market shares in core international connectivity products such as Payments and Cash Management, Global Trade and Receivables Finance and Foreign Exchange have all improved consistently over the past three years. For three consecutive years, including 2014, HSBC has been voted the top global cash manager for corporate and financial institutions in the Euromoney Cash Management survey. In the same survey, HSBC was voted best global cash manager for non-financial institutions for a second consecutive year in 2014. We have also been voted the ‘Best Overall for Products and Services’ by Asiamoney in its Offshore Renminbi Services survey every year since the survey’s inception in 2012.
We aim to continue investing in key growth markets and align global resources to city clusters with fast-growing international revenue pools:
− UK and Hong Kong as our home markets: Our goal is to strengthen and develop our home market position in key products, such as mortgages and personal lending.
− China: Mainland China continues to be of strategic significance for HSBC and presents a structural long-term growth opportunity. We therefore continue to invest in organic growth, particularly in Guangdong and other economically important regions. We strive to invest and be the first to capture opportunities that may arise from regulatory changes such as the introduction of the Shanghai Free-Trade Zone.
− US and Germany: We continue to improve our position in the world’s largest economy and in Europe’s leading
trade nation through the expansion of our corporate franchise. In 2014, we broadened our customer base by enhancing our products, widening our geographical coverage and adjusting our risk appetite. International revenues increased through deeper relationships with customers and developing cross-business opportunities.
Our universal banking model enables us to generate revenues across global businesses. In 2014, cross-business collaboration revenues grew in all of our identified opportunities, except for Markets revenue from CMB customers primarily due to lower foreign exchange volatility. Approximately half of the total collaboration revenues for the year came from Markets and Capital Financing products provided to CMB customers. In GPB, net new money resulting from cross-business client referrals doubled from 2013.
Implement Global Standards At HSBC, we are adopting the highest or most effective financial crime controls and deploying them everywhere we operate.
Two new global policies set out these controls for anti-money laundering (‘AML’) and sanctions. They are our Global Standards.
In line with our ambition to be recognised as the world’s leading international bank, we aspire to set the industry standard for knowing our customers and detecting, deterring and protecting against financial crime. Delivering on this means introducing a more consistent, comprehensive approach to managing financial crime risk – from understanding more about our customers, what they do and where and why they do it, to ensuring their banking activity matches what we would expect it to be. We aim to apply our financial crime risk standards throughout the lifetime of our customer relationships: from selecting and onboarding customers to managing our ongoing relationships and monitoring and assessing the changing risk landscape in the bank.
Our new global AML policy is designed to stop criminals laundering money through HSBC. It sets out global requirements for carrying out customer due diligence, monitoring transactions and escalating concerns about suspicious activity.

HSBC HOLDINGS PLC
27
Str
ateg
ic R
epo
rt
Fi
nan
cial
Rev
iew
Cor
pora
te G
over
nanc
e
Fina
ncia
l Sta
tem
ents
Sh
areh
old
er In
form
atio
n
Our new global sanctions policy aims to ensure that we comply with local sanctions-related laws and regulations in countries where we operate, as well as with global sanctions imposed by the UN Security Council, European Union, US, UK and Hong Kong governments.
In many cases, our policy extends beyond what we are legally required to do, reflecting the fact that HSBC has no appetite for business with illicit actors.
We expect our Global Standards to underpin our business practices now and in the future, and to provide a source of competitive advantage. Global Standards are expected to allow us to:
– strengthen our response to the ongoing threat of financial crime;
– make consistent – and therefore simplify – the ways by which we monitor and enforce high standards at HSBC;
– strengthen policies and processes that govern how we do business and with whom; and
– ensure that we consistently apply our HSBC Values.
Implementing Global Standards Each global business and Financial Crime Compliance have identified where and how they need to enhance existing procedures to meet the Global Standards. They are now in the process of deploying the systems, processes, training and support to put the enhanced procedures into practice in each country of operation.
This is being done in two stages:
– delivering policy components with limited infrastructure dependency according to an accelerated timeline; and
– implementing, in parallel, long-term strategic control enhancements and associated enhancements to infrastructure.
During 2014, we made material progress in a number of areas, including:
– global implementation of customer selection policies and governance;
– first deployment of enhanced customer due diligence procedures for gathering and verifying customer information;
– integration of global sanctions screening lists into our customer and transaction screening tools;
– targeted training for the highest risk roles and all-employee campaigns to raise awareness of financial crime risk and encourage escalation;
– global roll out of financial intelligence and investigations units to follow up on escalations and alerts, and identify emerging trends and issues; and
– the establishment of global procedures and governance to exit business that is outside our financial crime risk appetite.
Governance framework The global businesses and Financial Crime Compliance, supported by HSBC Technology and Services, are formally accountable for delivering business procedures, controls and the associated operating environment to implement our new policies within each global business and jurisdiction. This accountability is overseen by the Global Standards Execution Committee, which is under the chairmanship of the Group Chief Risk Officer and consists of the Chief Executive Officers of each global business and the Global Head of Financial Crime Compliance.
Correspondingly, and to promote closer integration with business as usual, a report on the implementation of Global Standards is a standing item at the Group’s Risk Management Meeting. The Financial System Vulnerabilities Committee and the Board continue to receive regular reports on the Global Standards programme as part of their continued role in providing oversight.
Risk appetite Financial crime risk controls are a part of our everyday business and they are governed according to our global financial crime risk appetite statement. This aims to ensure sustainability in the long term. Our overarching appetite and approach to financial crime risk is that we will not tolerate operating without the systems and controls in place designed to detect and prevent financial crime and will not conduct business with individuals or entities we believe are engaged in illicit behaviour.
Enterprise-wide risk assessment We have conducted our second annual enterprise-wide assessment of our risks and controls related to sanctions and AML compliance. The outcome of this assessment has formed the basis for risk management planning, prioritisation and resource allocation for 2015.
The Monitor Under the agreements entered into with the US Department of Justice (‘DoJ’), the UK FCA (formerly the Financial Services Authority (‘FSA’)) and the US Federal Reserve Board (‘FRB’) in 2012, including the five-year Deferred Prosecution Agreement (‘US DPA’), an independent compliance monitor (‘the Monitor’) was appointed to evaluate our progress in fully implementing our obligations and produce regular assessments of the effectiveness of our Compliance function.
Michael Cherkasky began his work as the Monitor in July 2013, charged with evaluating and reporting upon the effectiveness of the Group’s internal controls, policies and procedures as they relate to ongoing compliance with applicable AML, sanctions, terrorist financing and proliferation financing obligations, over a five-year period.
HSBC is continuing to take concerted action to remedy AML and sanctions compliance deficiencies and to implement Global Standards. HSBC is also working to implement the agreed recommendations flowing from the Monitor’s 2013 review. We recognise we are only part way through a journey, being two years into our five-year US DPA. We look forward to maintaining a strong, collaborative relationship with the Monitor and his team.

Strategic priorities/Outcomes Streamline processes / Financial performance
HSBC HOLDINGS PLC
28
Streamline processes and procedures We continue to refine our operational processes, develop our global functions, implement consistent business models and streamline IT.
Since 2011, we have changed how HSBC is managed by introducing a leaner reporting structure and establishing an operating model with global businesses and functions. These changes – together with improvements in software development productivity, process optimisation and our property portfolio – realised US$5.7bn in sustainable savings, equivalent to US$6.1bn on an annualised (run rate) basis. This exceeded our commitment to deliver US$2.5–3.5bn of sustainable savings at the outset of the organisational effectiveness programme included in the first phase of our strategy.
Sustainable savings arise from the reduction or elimination of complexity, inefficiencies or unnecessary activities, and release capital that can be reinvested in growing our business as well as increase returns to shareholders.
The reorganisation of the Group into four global businesses and eleven global functions further allows us to run globally consistent operating models. This establishes the foundation for our next stage of streamlining.
Going forward, we aim to fund investments in growth and compliance and offset inflation through efficiency gains. This requires net cost reductions. This programme will be applied to:
– improving the end-to-end optimisation of processes and servicing channels;
– technology simplification, reducing the number of applications used across the Group; and
– enhancing infrastructure, including optimising our real estate utilisation and the location where certain activities are carried out.
Streamlining is expected to be achieved through a combination of simplifying and globalising our processes, products, systems and operations. ‘Simplifying’ involves identifying inefficiencies or excessive complexity and redesigning or rationalising processes to make them easier to understand and manage and more efficient. ‘Globalising’ involves developing standard global processes and implementing them around the Group.
Cost efficiency ratio Our cost efficiency ratio for 2014 was 67.3%, up from 59.6% in 2013. This change was driven by higher legal, regulatory and conduct settlement costs; inflationary pressures; continued investment in strategic initiatives; and a rise in the bank levy. Cost increases were partly offset by realised sustainable savings of US$1.3bn.
Outcomes
Financial performance Performance reflected lower gains on disposals and the negative effect of other significant items.
Reported results
2014 US$m
2013 US$m
2012 US$m
Net interest income 34,705 35,539 37,672Net fee income 15,957 16,434 16,430Other income 10,586 12,672 14,228
Net operating income14 61,248 64,645 68,330
LICs15 (3,851) (5,849) (8,311)
Net operating income 57,397 58,796 60,019Total operating
expenses (41,249) (38,556) (42,927)
Operating profit 16,148 20,240 17,092Income from
associates16 2,532 2,325 3,557
Profit before tax 18,680 22,565 20,649
For footnotes, see page 39.
Profit before tax of US$18.7bn on a reported basis was US$3.9bn or 17% lower than that achieved in 2013. This primarily reflected lower business disposal and reclassification gains and the negative effect, on both revenue and costs, of other significant items including fines, settlements, UK customer redress and associated provisions.
Reported net operating income before loan impairment charges and other credit risk provisions (‘revenue’) of US$61bn was US$3.4bn or 5% lower than in 2013. In 2014 there were lower gains (net of losses) from disposals and reclassifications (2013 included a US$1.1bn accounting gain arising from the reclassification of Industrial Bank Co. Limited (‘Industrial Bank’) as a financial investment following its issue of additional share capital to third parties, and a US$1.1bn gain on the sale of our operations in Panama). In addition, other significant items included adverse fair value movements on non-qualifying hedges of US$0.5bn compared with favourable movements of US$0.5bn in 2013, a US$0.6bn provision arising from the ongoing review of compliance with the Consumer Credit Act in the UK as well as a net adverse movement on debit valuation adjustments on derivative contracts of US$0.4bn. These factors were partially offset by favourable fair value movements of US$0.4bn on our own debt

HSBC HOLDINGS PLC
29
Str
ateg
ic R
epo
rt
Fi
nan
cial
Rev
iew
Cor
pora
te G
over
nanc
e
Fina
ncia
l Sta
tem
ents
Sh
areh
old
er In
form
atio
n
designated at fair value, which resulted from changes in credit spreads, compared with adverse movements of US$1.2bn in 2013 together with a US$0.4bn gain on the sale of our shareholding in Bank of Shanghai in 2014.
Loan impairment charges and other credit risk provisions (‘LICs’) of US$3.9bn were US$2.0bn or 34% lower than in 2013, notably in North America, Europe and Latin America.
Operating expenses of US$41bn were US$2.7bn or 7% higher than in 2013, primarily as a result of significant items which were US$0.9bn higher than in 2013. These included settlements and provisions in connection with foreign exchange investigations of US$1.2bn and a charge of US$0.6bn in the US relating to a settlement agreement with the Federal Housing Finance Agency.
Income from associates of US$2.5bn was US$0.2bn or 9% higher than 2013, primarily reflecting the non-recurrence of an impairment charge of US$106m on the investment in our banking associate in Vietnam in 2013.
The Board approved a 5% increase in the fourth interim dividend in respect of 2014 to US$0.20 per share, US$0.01 higher than the fourth interim dividend in respect of 2013. Total dividends in respect of 2014 were US$9.6bn (US$0.50 per share), US$0.4bn higher than in 2013.
The transitional CET1 ratio of 10.9% was up from 10.8% at the end of 2013 and our end point basis of 11.1% was up from 10.9% at the end of 2013, as a result of continued capital generation and management actions offset by RWA growth, foreign exchange movements and regulatory changes.
Adjusted performance For further information on non-GAAP financial measures, see page 40
.
From reported results to adjusted performance To arrive at adjusted performance: – we adjust for the year-on-year effects of
foreign currency translation; and – we adjust for the effect of significant items. Reconciliations of our reported results to an adjusted basis are set out on page 44.
On an adjusted basis, profit before tax of US$23bn was broadly unchanged compared with 2013. Lower LICs, notably in North America, Europe and Latin America, together with a marginal rise
in revenue was largely offset by higher operating expenses.
The following commentary is on an adjusted basis.
Revenue was broadly unchanged. Growth in CMB, notably in our home markets of Hong Kong and the UK, was offset by decreased revenue in RBWM, GB&M and GPB
Revenue rose by US$0.1bn to US$62bn. Revenue increased in CMB following growth in average lending and deposit balances in Hong Kong, together with rising average deposit balances and wider lending spreads in the UK. Revenue also benefited from higher term lending fees in the UK.
These factors were mostly offset by lower revenue in RBWM, GB&M and GPB. In RBWM, it was primarily driven by the run-off of our US Consumer and Mortgage Lending (‘CML’) portfolio with revenue in Principal RBWM broadly unchanged. In GB&M, revenue was lower due to the introduction of the funding fair value adjustment (‘FFVA’) on certain derivative contracts which resulted in a charge of US$263m, together with a decrease from our Foreign Exchange business, partly offset by an increase in Capital Financing. In GPB, revenue was down reflecting a managed reduction in client assets as we continued to reposition the business, and reduced market volatility.
LICs fell in the majority of our regions, notably in North America, Europe and Latin America
LICs were US$1.8bn or 31% lower than in 2013, primarily in North America and mainly in RBWM, reflecting reduced levels of delinquency and new impaired loans in the CML portfolio, together with decreased lending balances from the continued portfolio run-off and loan sales. LICs were also lower in Europe, mainly reflecting a fall in individually assessed charges in the UK in CMB and GB&M, and higher net releases of credit risk provisions on available-for-sale asset-backed securities (‘ABS’s) in GB&M in the UK. LICs were lower in Latin America too, primarily in Mexico and, to a lesser extent, in Brazil. In Mexico, the decrease in LICs mainly reflected lower individually assessed charges in CMB, while in Brazil LICs were lower in both RBWM and CMB, partly offset by an increase in GB&M.
Adjusted profit before tax (US$bn)
Reported profit attributable to ordinary shareholders (US$m)
Reported earnings per share (US$)
Return on tangible equity (%)
22.6
18.7
0.4 23.0 4.1 22.8
2013 2014
Reported Currency translationand significant items
Adjusted profit
13,454
15,631
13,115
2012 2013 2014
0.74
0.84
0.69
2012 2013 2014
9.8
11.0
8.5
2012 2013 2014

Outcomes (continued) Financial performance
HSBC HOLDINGS PLC
30
Operating expenses were higher, in part reflecting increases in Regulatory Programmes and Compliance costs and inflation, partly offset by further sustainable cost savings
Operating expenses were US$38bn, US$2.2bn or 6% higher than in 2013. Regulatory Programmes and Compliance costs increased as a result of continued focus on Global Standards and the broader regulatory reform programme being implemented by the industry to build the necessary infrastructure to meet today’s enhanced compliance standards.
Operating expenses also increased due to inflationary pressures, including wage inflation, primarily in Asia and Latin America, and an increase in the UK bank levy charge compared with 2013. We continued to invest in strategic initiatives in support of organically growing our business, primarily in CMB. We also increased expenditure on marketing and advertising to support revenue generating initiatives, primarily in RBWM.
These factors were partially offset by further sustainable cost savings in the year of US$1.3bn, primarily by re-engineering certain of our back office processes.
The number of employees expressed in full-time equivalent numbers (‘FTE’s) at the end of 2014 increased by 3,500 or 1%. The average number of FTEs was broadly unchanged as reductions through sustainable savings programmes were offset by the initiatives related to the Regulatory Programmes and Compliance and business growth.
Income from associates rose, mainly in Asia and the Middle East and North Africa
Income from associates increased, primarily reflecting higher contributions from Bank of Communications Co, Limited (‘BoCom’) and The Saudi British Bank, principally reflecting balance sheet growth.
The effective tax rate was 21.3% compared with 21.1% in 2013. For more details of the Group’s financial performance, see page 46.
Balance sheet strength Total reported assets were US$2.6 trillion, 1% lower than at 31 December 2013. On a constant currency basis, total assets were US$85bn or 3% higher. Our balance sheet remained strong with a ratio of customer advances to customer accounts of 72%. This was a consequence of our business model and of our conservative risk appetite, which is based on funding the growth in customer loans with growth in customer accounts.
On a constant currency basis, loans and advances grew by US$28bn and customer accounts increased by US$47bn. For further information on the Balance Sheet, see page 57, and on the Group’s liquidity and funding, see page 163.
Total assets (US$bn)
Post-tax return on average total assets (%)
Loans and advances to customers17 (US$bn)
Customer accounts17 (US$bn)
Ratio of customer advances to customer deposits17 (%)
For footnote, see page 39.
2,6932,671
2,634
2012 2013 2014
0.6
0.7
0.5
2012 2013 2014
963992
975
2012 2013 2014
1,3111,361 1,351
2012 2013 2014
73.4 72.972.2
2012 2013 2014

HSBC HOLDINGS PLC
31
Str
ateg
ic R
epo
rt
Fi
nan
cial
Rev
iew
Cor
pora
te G
over
nanc
e
Fina
ncia
l Sta
tem
ents
Sh
areh
old
er In
form
atio
n
Capital strength Our approach to managing Group capital is designed to ensure that we exceed current regulatory requirements and are well placed to meet those expected in the future.
We monitor capital adequacy, inter alia, by using capital ratios, which measure capital relative to a regulatory assessment of risks taken, and the leverage ratio, which measures capital relative to exposure.
In June 2013, the European Commission published the final Regulation and Directive, known collectively as CRD IV, to give effect to the Basel III framework in the EU. This came into effect on 1 January 2014.
Under the new regime, common equity tier 1 (‘CET1’) represents the highest form of
eligible regulatory capital against which the capital strength of banks is measured. In 2014 we managed our capital position to meet an internal target ratio on a CET1 end point basis of greater than 10%. This has since been reviewed and, in 2015, we expect to manage Group capital to meet a medium-term target for return on equity of more than 10%. This is modelled on a CET1 ratio on an end point basis in the range of 12% to 13%.
Leverage ratio The following table presents our estimated leverage ratio in accordance with PRA instructions. The numerator is calculated using the CRD IV end point tier 1 capital definition and the exposure measure is
calculated using the EU delegated act published in January 2015 (which is based on the Basel III 2014 revised definition).
Estimated leverage ratio 2014
US$bn At 31 December Tier 1 capital under CRD IV (end point) 142Exposures after regulatory adjustment 2,953Estimated leverage ratio (end point) 4.8%
For further details of the leverage ratio, see page 251.
For further information on the Group’s capital and our risk-weighted assets, see page 239.
Capital ratios and risk-weighted assets
CRD IV1
Common equity tier 1 ratio (transitional)
Total capital ratio (transitional)
Common equity tier 1 ratio (end point)
Risk-weighted assets (‘RWA’s)
(%) (%) (%) (US$bn)
Basel 2.51
Core tier 1 ratio Total capital ratio Risk-weighted assets (%) (%) (US$bn)
For footnote, see page 39.
10.810.9
2013 2014
14.9
15.6
2013 2014
10.9
11.1
2013 2014
1,2151,220
2013 2014
12.3
13.6
2012 2013
16.1
17.8
2012 2013
1,1241,093
2012 2013

Outcomes (continued) Financial performance
HSBC HOLDINGS PLC
32
Meeting our targets
We set financial targets against which we measure our performance. In 2011, we articulated our ambition to be the leading international bank and specified financial metrics against which we would measure performance through 2013. Targets were set under our understanding at the time of capital requirements and included a CET1 ratio of 9.5-10.5% under Basel III; return on equity (‘ROE’) of 12-15%; and a cost efficiency ratio (‘CER’) of 48-52% supported by US$2.5-3.5bn in sustainable cost savings over three years. Over the period to 2013, we strengthened our capital position, realised US$4.9bn in sustainable savings and increased dividend pay-outs to shareholders in line with targets.
In May 2013, we defined our strategic priorities for the period from 2014 to 2016 and revisited the financial metrics used to track performance. We continued to target an ROE of 12-15% and added a further target of US$2-3bn in sustainable savings. To allow for investment in growth initiatives and to reflect the increasing requirements involved in operating as a global bank, we revised the CER target to the mid-50s, adding that revenues must grow faster than costs (‘positive jaws’). We defined a target CET1 ratio, on an end point basis, as greater than 10% and continued to seek progressive dividends for shareholders. We also set a cap on our loans to deposits ratio of 90%.
During 2014, we achieved a CET1 ratio on an end point basis of 11.1% and declared US$9.6bn of total dividends in respect of the year. We realised incremental sustainable savings of US$1.3bn and maintained a loans-to-deposits ratio of 72%. The ROE of 7.3% and the CER of 67.3% fell short of our target.
Changing regulatory and operating environment When we set our targets in 2011, we did so based on a CET1 ratio on an end point basis of greater than 10%. Whilst this factored in foreseeable capital requirements, it did not anticipate, and could not have anticipated, the full extent of capital commitments and additional costs asked of us in the years to come. These factors have included:
• progressively strengthening our capital levels in response to increasing capital requirements;
• the stepped increase in costs due to the implementation of regulatory change and enhancing risk controls, notably around financial system integrity and conduct;
• an increase in the bank levy;
• the continuing low interest rate environment; and
• the impact of significant items, notably the high level of fines, settlements, UK customer redress and associated provisions.
As a consequence, we are setting new targets that better reflect the present and ongoing operating environment.
From 2015, our return on equity target will therefore be replaced with a medium-term target of more than 10%. This is modelled on a CET1 ratio on an end point basis in the range of 12% to 13%.
At the same time, we are reaffirming our target of growing business revenues faster than operating expenses (on an adjusted basis).
We also remain committed to delivering a progressive dividend. The progression of dividends will be consistent with the growth of the overall profitability of the Group and is predicated on our continued ability to meet regulatory capital requirements.
We remain strongly capitalised, providing capacity for both organic growth and dividend return to shareholders.
Brand value
Maintenance of the HSBC brand and our overall reputation remains a priority for the Group. This is our fourth year of using the Brand Finance valuation method reported in The Banker magazine as our brand value benchmark. The Brand Finance methodology provides a comprehensive measure of the strength of the brand and its impact across all business lines and customer segments. It is wholly independent and is publicly reported. Our target is a top three position in the banking peer group and we have achieved this target with an overall value of US$27.3bn
Pre-tax return on risk-weighted assets13 (%)
Dividend payout ratio (%)
Brand value (US$bn)
For footnote, see page 39.
(up 2% from 2014), placing us third. We maintain an AAA rating for our brand in this year’s report.
In addition to the Brand Finance measure, we have reviewed our performance in the Interbrand Annual Best Global Brands report, published in September 2014. This showed HSBC as the top ranked banking brand with a valuation of US$13.1bn (up from US$12bn in 2013) and in second place when all financial services brands are considered.
1.8
2.0
1.5
2012 2013 2014
55.4 57.1
71.0
2012 2013 2014
22.9
26.927.3
Feb-2013 Feb-2014 Feb-2015
3rdplace
2ndplace
3rdplace

HSBC HOLDINGS PLC
33
Str
ateg
ic R
epo
rt
Fi
nan
cial
Rev
iew
Cor
pora
te G
over
nanc
e
Fina
ncia
l Sta
tem
ents
Sh
areh
old
er In
form
atio
n
We believe this performance is driven by an underlying strong brand equity established in recent years and a consistent and active programme of activities in support of the brand throughout 2014.
Economic contribution By running a sustainable business, HSBC is able to make a valuable contribution to the economy by paying dividends to our shareholders, salaries to our employees, payments to suppliers, and tax revenues to governments in the countries and territories where we operate. We also finance companies so that they, in turn, can create employment.
HSBC’s net tax paid18 2014
US$bn 2013
US$bn
Tax on profits 3.6 4.7Employer taxes 1.6 1.6UK bank levy19 1.0 0.7Irrecoverable value-added
tax 0.9 0.8 Other duties and levies 0.8 0.8
Year ended 31 December 7.9 8.6
For footnotes, see page 39.
Taxes collected for government20
2014
US$bn 2013
US$bn Region UK 1.7 1.5Rest of Europe 1.1 1.3Asia 2.0 1.5North America 1.0 1.0Latin America 3.3 3.5
9 1Year ended 31 December 9.1 8.8
For footnote, see page 39.
Distribution of economic benefits
2014
US$bn 2013
US$bn 2012
US$bn Net cash tax
outflow 7.9 8.6 9.3Distributions to
shareholders and non-controlling interests 10.6 10.2 8.7
Employee compensation and benefits 20.4 19.2 20.5
General administrative expenses including premises and procurement 18.6 17.1 20.0
Pro-forma post-tax profit allocation21
2014
% 2013
%
Retained earnings/capital 32 53Dividends 53 35Variable pay 15 12
Year ended 31 December 100 100
For footnote, see page 39. Market capitalisation and total shareholder return Closing market price US$0.50 ordinary shares in issue
Market capitalisation London Hong Kong
American Depositary Share22
19,218m US$182bn £6.09 HK$74.00 US$47.232013: 18,830m 2012: 18,476m
2013: US$207bn 2012: US$194bn
2013: £6.622012: £6.47
2013: HK$84.152012: HK$81.30
2013: US$55.132012: US$53.07
Total shareholder return23 Over 1 year Over 3 years Over 5 years
To 31 December 2014 97 144 109 Benchmarks: – MSCI Banks24 100 160 132
For footnotes, see page 39.

Outcomes (continued) Remuneration
HSBC HOLDINGS PLC
34
Remuneration Our remuneration strategy rewards commercial success and compliance with our risk management framework.
The quality of our people and their commitment to the Group are fundamental to our success. We therefore aim to attract, retain and motivate the very best people who are committed to a long-term career with HSBC in the long-term interests of shareholders.
Employee remuneration Our remuneration strategy is designed to reward competitively the achievement of long-term sustainable performance. HSBC’s reward package comprises four key elements of remuneration:
– fixed pay;
– benefits;
– annual incentive; and
– the Group Performance Share Plan (‘GPSP’).
The governance of our remuneration principles and oversight of their implementation by the Group Remuneration Committee ensures what we pay our people is aligned to our business strategy and performance is judged not only on what is achieved over the short- and long-term but also, importantly, on how it is achieved, as we believe the latter contributes to the long-term sustainability of the business. Full details of our remuneration policy may be found under Remuneration Policy on our website (http://www.hsbc.com/investor-relations/governance).
Industry changes and key challenges New regulatory requirements such as the bonus cap have influenced how we pay our senior executives and those of our employees identified by the PRA as having a material impact on the institution’s risk profile, being what are termed ‘material risk takers’ (‘MRTs’). This year, a new requirement has been introduced for firms to ensure that clawback (i.e. a firm’s ability
to recoup paid and/or vested awards) can be applied to all variable pay awards granted on or after 1 January 2015 for a period of at least seven years from the date of award. These requirements present challenges for HSBC in ensuring that the total compensation package for our employees in all of the markets in which we operate around the world remains competitive, in particular, relative to other banks not subject to these requirements.
Looking ahead to 2015/2016, further significant regulatory changes to executive remuneration are expected and it is possible that we will need to make changes to our remuneration policy in 2016. The number and volume of changes that have been and are being proposed hinders our ability to communicate with any certainty to our current and potential employees the remuneration policies and structures that would apply to them. It also contributes to a general misunderstanding about how our policies work and the effect of those policies on employee performance. For full details of industry changes and key challenges, see page 300.
Variable pay pool The total variable pay pool for 2014 was US$3.7bn, down from US$3.9bn in 2013:
Group2014
US$m2013
US$mVariable pay pool25
– total 3,660 3,920– as a percentage of pre-tax
profit (pre-variable pay) 16% 15%– percentage of pool deferred 14% 18%
For footnote, see page 39.
The Group Remuneration Committee considers many factors in determining HSBC’s variable pay pool, including the performance of the Group considered in the context of our risk appetite statement.
This ensures that the variable pay pool is shaped by risk considerations and by an integrated approach to business, risk and capital management which supports achievement of our strategic objectives.
The Group Remuneration Committee also takes into account Group profitability, capital strength, shareholder returns, the distribution of profits between capital, dividends and variable pay, the commercial requirement to remain market competitive and overall affordability. For full details of variable pay pool determination, see pages 309.
Relative importance of expenditure on pay The following chart provides a breakdown of total staff pay relative to the amount paid out in dividends.
Relative importance of expenditure on pay (US$m)
For footnotes, see page 39.
Directors’ remuneration The remuneration policy for our executive and non-executive Directors was approved at the Annual General Meeting on 23 May 2014. The full policy is available in the Directors’ Remuneration Report in the Annual Report and Accounts 2013, a copy of which can be obtained by visiting the following website: http://www.hsbc.com/ investor-relations/financial-and-regulatory-reports.
The single total figure for Directors’ remuneration required by Schedule 8 of the Large and Medium-Sized Companies (Accounts and Reports) Regulations 2008 is as follows:
4%
Ordinarydividends26
Employee compensationand benefits27
2014 2013
4%
9,600
20,366
9,200
19,626
(430)
19,196
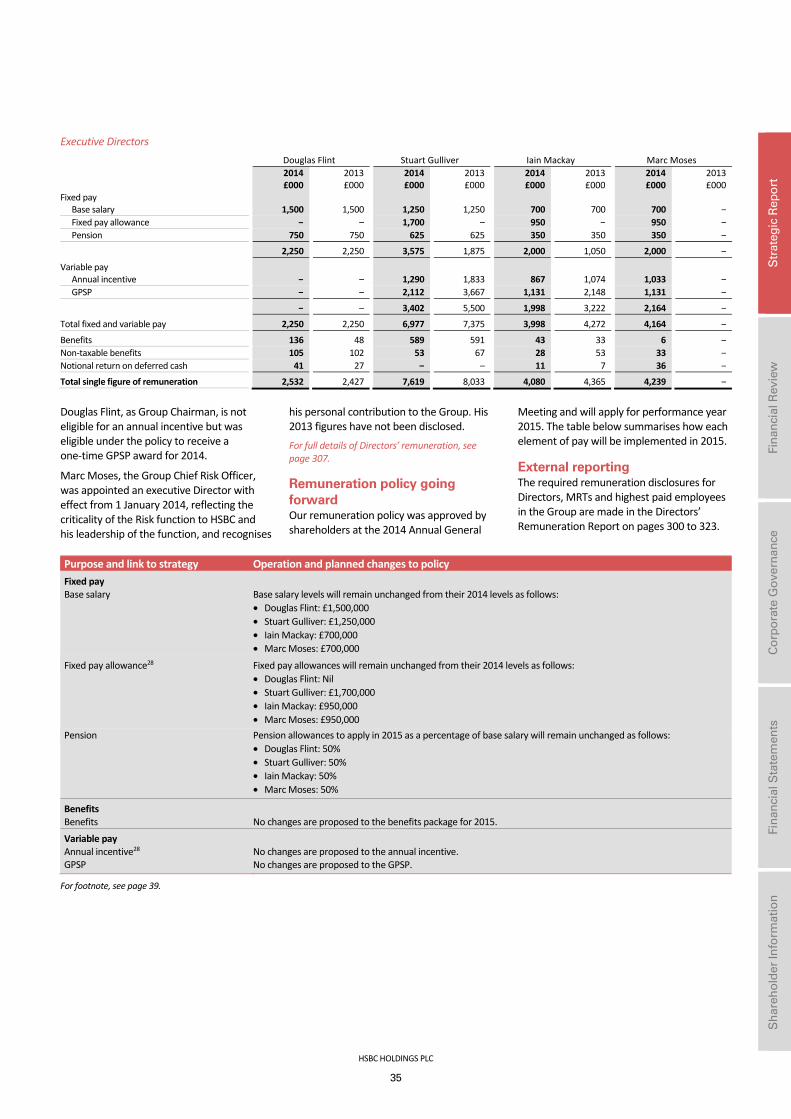
HSBC HOLDINGS PLC
35
Str
ateg
ic R
epo
rt
Fi
nan
cial
Rev
iew
Cor
pora
te G
over
nanc
e
Fina
ncia
l Sta
tem
ents
Sh
areh
old
er In
form
atio
n
Executive Directors Douglas Flint Stuart Gulliver Iain Mackay Marc Moses
2014 £000
2013£000
2014£000
2013£000
2014£000
2013 £000
2014£000
2013£000
Fixed pay Base salary 1,500 1,500 1,250 1,250 700 700 700 –Fixed pay allowance – – 1,700 – 950 – 950 –Pension 750 750 625 625 350 350 350 –
2,250 2,250 3,575 1,875 2,000 1,050 2,000 –
Variable pay Annual incentive – – 1,290 1,833 867 1,074 1,033 –GPSP – – 2,112 3,667 1,131 2,148 1,131 –
– – 3,402 5,500 1,998 3,222 2,164 –
Total fixed and variable pay 2,250 2,250 6,977 7,375 3,998 4,272 4,164 –
Benefits 136 48 589 591 43 33 6 –Non-taxable benefits 105 102 53 67 28 53 33 –Notional return on deferred cash 41 27 – – 11 7 36 –
Total single figure of remuneration 2,532 2,427 7,619 8,033 4,080 4,365 4,239 –
Douglas Flint, as Group Chairman, is not eligible for an annual incentive but was eligible under the policy to receive a one-time GPSP award for 2014.
Marc Moses, the Group Chief Risk Officer, was appointed an executive Director with effect from 1 January 2014, reflecting the criticality of the Risk function to HSBC and his leadership of the function, and recognises
his personal contribution to the Group. His 2013 figures have not been disclosed. For full details of Directors’ remuneration, see page 307.
Remuneration policy going forward Our remuneration policy was approved by shareholders at the 2014 Annual General
Meeting and will apply for performance year 2015. The table below summarises how each element of pay will be implemented in 2015.
External reporting The required remuneration disclosures for Directors, MRTs and highest paid employees in the Group are made in the Directors’ Remuneration Report on pages 300 to 323.
Purpose and link to strategy Operation and planned changes to policy Fixed pay Base salary Base salary levels will remain unchanged from their 2014 levels as follows:
• Douglas Flint: £1,500,000 • Stuart Gulliver: £1,250,000 • Iain Mackay: £700,000 • Marc Moses: £700,000
Fixed pay allowance28 Fixed pay allowances will remain unchanged from their 2014 levels as follows: • Douglas Flint: Nil • Stuart Gulliver: £1,700,000 • Iain Mackay: £950,000 • Marc Moses: £950,000
Pension Pension allowances to apply in 2015 as a percentage of base salary will remain unchanged as follows:• Douglas Flint: 50% • Stuart Gulliver: 50% • Iain Mackay: 50% • Marc Moses: 50%
Benefits Benefits No changes are proposed to the benefits package for 2015.
Variable pay Annual incentive28 No changes are proposed to the annual incentive.GPSP No changes are proposed to the GPSP.
For footnote, see page 39.

Outcomes (continued) Sustainability
HSBC HOLDINGS PLC
36
Sustainability Sustainability underpins our strategic priorities and enables us to fulfil our purpose as an international bank.
At HSBC, how we do business is as important as what we do. For us, sustainability means building our business for the long term by balancing social, environmental and economic considerations in the decisions we make. This enables us to help businesses thrive and contribute to the health and growth of communities.
Approach to corporate sustainability Corporate sustainability is governed by the Conduct & Values Committee, a sub-committee of the Board which oversees and advises on a range of issues including adherence to HSBC’s values and ensuring we respond to the changing expectations of society and key stakeholders.
Sustainability priorities are set and programmes are led by the Global Corporate Sustainability function. HSBC’s country operations, global functions and global businesses work together to ensure sustainability is embedded into the Group’s business and operations and properly implemented. Executives within the Risk and the HSBC Technology and Services functions hold a specific remit to deliver aspects of the sustainability programme for the Group.
Our sustainability programme focuses on three areas: sustainable finance; sustainable operations, and sustainable communities.
Sustainable finance We anticipate and manage the risks and opportunities associated with a changing climate, environment and economy. In a rapidly changing world, we must ensure our business anticipates and prepares for shifts in environmental priorities and societal expectations.
Sustainability risk framework We manage the risk that the financial services which we provide to customers may have unacceptable effects on people or the environment. Sustainability risk can also lead to commercial risk for customers, credit risk for HSBC and significant reputational risk.
For over 10 years we have been working with our business customers to help them
understand and manage their environmental and social impact in relation to sensitive sectors and themes. We assess and support customers using our own policies which we regularly review and refine. We have policies covering agricultural commodities, chemicals, defence, energy, forestry, freshwater infrastructure, mining and metals, World Heritage Sites and Ramsar Wetlands. We also apply the Equator Principles.
We welcome constructive feedback from non-governmental organisations and campaign groups and regularly discuss matters of shared interest with them.
Our sustainability risk framework is based on robust policies, formal processes and well-trained, empowered people.
In 2014, we trained risk and relationship managers in sustainability risk, focusing on the recent policy updates and revised processes. Our designated Sustainability Risk Managers provided training to executives from Risk, GB&M and CMB in every geographical region.
We have used the Equator Principles since 2003. A new version of the Equator Principles – EP3 – was launched in 2013, and HSBC introduced these changes on 1 January 2014 following training and the development of clear templates to ensure the transition was smooth.
Data and the independent assurance of our application of the Equator Principles will be available at hsbc.com in April 2015.
Policy reviews and updates in 2014 In 2014, we published the reports of two independent reviews into the content and implementation of our Forest Land and Forest Products Sector Policy, by Proforest and PricewaterhouseCoopers LLP, respectively. We also issued new policies on forestry, agricultural commodities and World Heritage Sites and Ramsar Wetlands, reflecting the recommendations. These documents can be found online at hsbc.com/sus-risk.
Forestry policy The new forestry policy, issued in March 2014, requires forestry customers to gain 100% certification by the Forest Stewardship Council (‘FSC’) or the Programme for the Endorsement of Forest Certification (‘PEFC’) in high risk countries by 31 December 2014. Certification requires that customers are operating legally and sustainably.
Feedback from stakeholders on the new policy was positive. Timber customers from affected countries such as Turkey and Mexico
were receptive to the new standards, gained certification as a result of the new requirement and benefited from advice. Other customer relationships will end as soon as contractual terms allow, in cases where customers have been unable or unwilling to meet the new standards.
Agricultural commodities policy The new agricultural commodities policy requires palm oil customers to become members of the Roundtable on Sustainable Palm Oil (‘RSPO’) by 30 June 2014, to have at least one operation certified by the end of 2014 and all operations by the end of 2018.
A number of customer relationships will be closed where the deadline has not been met. Other customers have succeeded in joining the RSPO and having at least one operation certified by the end of 2014. One example is an Indonesian processing, refining and export company. HSBC started to engage with this and other companies in January 2014 on the changes and continued to offer advice. The management of the company sought expert advice from third parties to understand more about RSPO certification, which they found was less complex than they had imagined. Two units of the company obtained RSPO certification in June 2014, and one further is planned.
In order to encourage the shift towards sustainable palm oil we have introduced a discounted prepayment export finance product for trade flows of certified sustainable palm oil. This structured, bespoke financing was launched in Singapore and Indonesia in 2014 and in Malaysia in early 2015.
The inaugural financing using this product was for a major palm oil exporter which has been a member of the RSPO for ten years and is now fully certified. The product is available to both existing and future clients and is hoped to encourage an expansion in the proportion of palm oil that is certified sustainable.
Customers in Malaysia, Indonesia, mainland China, Taiwan, South Korea, Thailand, Turkey and Mexico have decided to certify their operations as a result of HSBC’s new policies and deadlines. A number of others were already certified. Fuller reporting on the effect of these new policies will be available in April 2015 at hsbc.com.

HSBC HOLDINGS PLC
37
Str
ateg
ic R
epo
rt
Fi
nan
cial
Rev
iew
Cor
pora
te G
over
nanc
e
Fina
ncia
l Sta
tem
ents
Sh
areh
old
er In
form
atio
n
The World Heritage Sites and Ramsar Wetlands policy This is designed to protect unique sites of outstanding international significance as listed by the UN and wetlands of international importance. The policy relates to all business customers involved in major projects, particularly in sectors such as forestry, agriculture, mining, energy, property and infrastructure development.
The policy helps HSBC to make balanced and clear decisions on whether or not to finance projects which could have an effect on these sites or wetlands. HSBC has avoided financing projects in light of the policy. Our approach to managing sustainability risk is described on page 237.
Climate business We understand that in response to climate change there is a shift required towards a lower-carbon economy. We are committed to accelerating that shift by supporting customers involved in ‘climate business’ by seeking long-term low-carbon commercial business opportunities. Our climate business includes clients in the solar, wind, biomass, energy efficiency, low-carbon transport and water sectors. In 2014, our Climate Change Research team was recognised as the top team in the industry. We were also a leader in public markets equity-related wind financings for international companies, including the largest wind turbine equity raising since 2010 as part of the €1.4bn Vestas refinancing.
‘Green bonds’ are any type of bond instruments where the proceeds will be exclusively applied to finance climate or environmental projects. In April 2014, HSBC became a member of the International Capital Market Association Executive Committee for the Green Bond Principles. The Green Bond Principles are voluntary process guidelines that recommend transparency and disclosure and promote integrity in the development of the green bond market by clarifying the approach for issuance of a green bond.
In 2014, we commissioned a report, ‘Bonds and Climate Change: the state of the market in 2014’ from the Climate Bonds Initiative to help raise awareness of climate financing.
HSBC has been at the forefront of this fast-developing area. In 2014, we were the sole global coordinator and joint leader, manager and bookrunner for the first green bond issue by an Asian corporate issuer, Advanced Semiconductor Engineering Inc. We also acted as sole global coordinator on the first green bond issued by Abengoa, the first high-yield green bond to be issued in Europe as well as the being a joint lead manager and bookrunner for the first government issuer in the Canadian market for the Province of Ontario.
UN Environment Programme Finance Initiative Principles for Sustainable Insurance As a signatory to the Principles for Sustainable Insurance (‘PSI’), a global sustainability framework, HSBC’s Insurance business has committed to integrating environmental, social and governance issues across its processes, and to publicly disclosing its progress in doing so on an annual basis. A global programme manager has been appointed to provide leadership, co-ordination and control of Insurance sustainability initiatives world-wide and ensure alignment with the Group’s approach and the requirements of the PSI initiative. This includes driving appropriate activities both within the Insurance business and with partners, regulators and other industry players; disseminating industry best practice, and developing global insurance sustainability initiatives.
Sustainable operations Managing our own environmental footprint supports business efficiency and is part of our long-term contribution to society. We work together and with our suppliers to find new ways to reduce the impact of our operations on the environment. We are purchasing renewable energy, designing and operating our buildings and data centres more efficiently and reducing waste. We have committed to cut our annual per employee carbon emissions from 3.5 to 2.5 tonnes by 2020.
Sustainability Leadership Programme To deliver our ten sustainability goals we have trained 847 senior managers through HSBC’s Sustainability Leadership Programme since 2009. The programme is a mix of hands-on learning and leadership development sessions and is aligned to the HSBC Values agenda. The programme participants are expected to embed sustainability into decision-making and project delivery in the businesses and functions where they work.
Renewable energy procurement In 2014, we signed three power purchase agreements with renewable energy generators in the UK and India. This is expected to provide 9% of HSBC’s energy. In August, a 10-megawatt solar power plant in Hyderabad, India came online to provide the Group with clean energy. This is expected to power three Global Service Centres and a Technology Centre in India. HSBC played a key role in facilitating the project by agreeing to purchase the plant’s energy at a government backed fixed price for the next ten years. The plant will provide a clean and reliable source of energy. In addition, we have redefined our renewables target only to count energy from newly constructed renewable energy sources which have been commissioned by HSBC.
Paper use Our paper goal is being achieved in three ways: ensuring that the paper we buy is from a sustainable source in accordance with our paper sourcing policy, reducing the volume of paper consumed by our offices and branches and providing paperless banking for all retail and commercial customers. We have continued to reduce the total amount of paper purchased and to increase the proportion of paper we use that is certified as sustainably sourced by the FSC and PEFC. Since 2011, we have achieved a 53% reduction in paper purchased. Certified sustainably sourced paper reached 92% of all paper used by the end of 2014.

Outcomes (continued) Sustainability / Footnotes
HSBC HOLDINGS PLC
38
Our 10-point sustainable operations strategy
1. Sustainability engagement: encourage employees to deliver improved efficiency by 2020
2. Supply chain collaboration: sustainable savings through efficiency and innovation
3. HSBC Eco-efficiency fund: US$50m annually to develop new ways of working, based on employee innovations
4. Energy: reduce annual energy consumption per employee by 1MWh by 2020, compared to 6.2MWh in 2011
5. Waste: use less, and recycle 100% of our office waste and electronic waste
6. Renewables: aim to increase energy consumption from renewables to 25% by 2020 from zero
7. Green buildings: design, build and run energy efficient, sustainable buildings to the highest international standards
8. Data centres: achieve an energy efficiency (power usage effectiveness) rating of 1.5 by 2020
9. Travel: reduce travel emissions per employee
10. Paper: paperless banking available for all retail and commercial customers and 100% sustainably sourced paper by 2020
Carbon emissions HSBC’s carbon dioxide emissions are calculated on the basis of the energy used in our buildings and employee business travel from over 28 countries (covering about 93% of our operations by FTE). The data gathered on energy consumption and distance travelled are converted to carbon dioxide emissions using conversion factors from the following sources, if available, in order of preference:
1. factors provided by the data/service providers;
2. factors provided by the local public environmental authorities. For electricity, if specific factors cannot be obtained from the above two sources we use the latest available carbon
emission factors for national grid electricity from the International Energy Agency as recommended for use by the Greenhouse Gas Protocol; and
3. for other types of energy and travel, if no specific factors can be obtained from the first two sources, we use the latest available factors provided by the UK Department for Environment, Food and Rural Affairs and/or the Department of Energy and Climate Change in the UK.
To incorporate all of the operations over which we have financial (management) control, the calculated carbon dioxide emissions are scaled up on the basis of the FTE coverage rate to account for any missing data (typically less than 10% of FTEs). In addition, emission uplift rates are applied to allow for uncertainty on the quality and coverage of emission measurement and estimation. The rates are 4% for electricity, 10% for other energy and 6% for business travel, based on the Intergovernmental Panel on Climate Change Good Practice Guidance and Uncertainty Management in National Greenhouse Gas Inventories, and our internal analysis of data coverage and quality.
Carbon dioxide emissions in tonnes 2014 2013
Total 752,000 889,000From energy 633,000 755,000From travel 119,000 134,000
Carbon dioxide emissions in tonnes per FTE 2014 2013
Total 2.92 3.43From energy 2.46 2.91From travel 0.46 0.52
Our greenhouse gas reporting year runs from October to September. For the year ended 30 September 2014, carbon dioxide emissions from our global operations were 752,000 tonnes.
Sustainable communities We believe that education and resources such as safe water and sanitation are essential to resilient communities which are, in turn, the basis of thriving economies and businesses.
We provide financial contributions to community projects, and thousands of employees across the world get involved by volunteering their time and sharing their skills.
Volunteering and donations Thousands of HSBC employees globally are involved every year in volunteering for our Community Investment programmes. Further details on our programmes are available at hsbc.com and will be updated with information for 2014 in April 2015.
In 2014, we donated a total of US$114m to community projects (2013: US$117m). Of this, US$66m was donated in Europe (2013: US$64m); US$28m was donated in Asia-Pacific (2013: US$24m); US$3m was donated in the Middle East (2013: US$5m); US$10m was donated in North America (2013: US$11m); and US$7m was donated in Latin America (2013: US$12m).
Employees gave 303,922 hours of their time to volunteer during the working day (2013: 255,925 hours).
Human rights We apply human rights considerations directly as they affect our employees and indirectly through our suppliers and customers, in the latter case in particular through our project finance lending and sustainability risk policies. Human rights issues most directly relevant for HSBC are those relating to the right to just and favourable conditions of work and remuneration, the right to equal pay for equal work, the right to form and join trade unions, the right to rest and leisure and the prohibition of slavery and child labour. Alongside our own commitments, such as our HSBC Code of Conduct for Suppliers (in place since 2005), the HSBC Global Standards Manual and HSBC Values, we have signed up to global commitments and standards, including the UN Global Compact, the Universal Declaration of Human Rights and the Global Sullivan Principles. Further detail on our 2014 performance will be available from the end of April 2015 on our website, along with independent assurance of our application of the Equator Principles and carbon emissions.
On behalf of the Board
D J Flint Group Chairman HSBC Holdings plc
23 February 2015

HSBC HOLDINGS PLC
39
Str
ateg
ic R
epo
rt
Fi
nan
cial
Rev
iew
Cor
pora
te G
over
nanc
e
Fina
ncia
l Sta
tem
ents
Sh
areh
old
er In
form
atio
n
Footnotes to Strategic Report
1 On 1 January 2014, CRD IV came into force and capital and RWAs at 31 December 2014 are calculated and presented on this basis. Prior to this, capital and RWAs were calculated and presented on a Basel 2.5 basis. In addition, capital and RWAs at 31 December 2013 were also estimated based on the Group’s interpretation of final CRD IV legislation and final rules issued by the PRA. At 31 December 2012, the CRD IV estimated capital and RWAs were based on the July 2011 draft CRD IV text.
2 Dividends recorded in the financial statements are dividends per ordinary share declared in a year and are not dividends in respect of, or for, that year. The third interim dividend for 2013 of US$0.10 was paid on 11 December 2013. The fourth interim dividend for 2013 of US$0.19 was paid on 30 April 2014. First, second and third interim dividends for 2014, each of US$0.10 per ordinary share, were paid on 10 July 2014, 9 October 2014 and 10 December 2014, respectively. Note 9 on the Financial Statements provides more information on the dividends declared in 2014. On 23 February 2015, the Directors declared a fourth interim dividend for 2014 of US$0.20 per ordinary share in lieu of a final dividend, which will be payable to ordinary shareholders on 30 April 2015 in cash in US dollars, or in pounds sterling or Hong Kong dollars at exchange rates to be determined on 20 April 2015, with a scrip dividend alternative. The reserves available for distribution at 31 December 2014 were US$48,883m.
Quarterly dividends of US$15.5 per 6.20% non-cumulative Series A US dollar preference share, equivalent to a dividend of US$0.3875 per Series A American Depositary Share, each of which represents one-fortieth of a Series A US dollar preference share, were paid on 17 March 2014, 16 June 2014, 15 September 2014 and 15 December 2014.
Quarterly coupons of US$0.508 per security were paid with respect to 8.125% capital securities on 15 January 2014, 15 April 2014, 15 July 2014 and 15 October 2014.
Quarterly coupons of US$0.50 per security were paid with respect to 8% capital securities on 17 March 2014, 16 June 2014, 15 September 2014 and 15 December 2014.
3 The cost efficiency ratio is defined as total operating expenses divided by net operating income before loan impairment charges and other credit risk provisions. 4 The return on average ordinary shareholders’ equity is defined as profit attributable to ordinary shareholders of the parent company divided by average
ordinary shareholders’ equity. 5 Established on 5 December 2014. 6 Intermediation of securities, funds and insurance products, including Securities Services in GB&M. 7 Merger and acquisition, event and project financing, and co-investments in GPB. 8 Including Foreign Exchange, Rates, Credit and Equities. 9 Including portfolio management. 10 Including private trust and estate planning (for financial and non-financial assets). 11 Including hedge funds, real estate and private equity. 12 The sum of balances presented does not agree to consolidated amounts because inter-company eliminations are not presented here. 13 Pre-tax return on average risk-weighted assets is calculated using average RWAs based on a Basel 2.5 basis for all periods up to and including 31 December
2013 and on a CRD IV end point basis for all periods from 1 January 2014. 14 Net operating income before loan impairment charges and other credit risk provisions, also referred to as ‘revenue’. 15 Loan impairment charges and other credit risk provisions. 16 Share of profit in associates and joint ventures. 17 From 1 January 2014, non-trading reverse repos and repos are presented as separate lines in the balance sheet. Previously, non-trading reverse repos were
included within ‘Loans and advances to banks’ and ‘Loans and advances to customers’ and non-trading repos were included within ‘Deposits by banks’ and ‘Customer accounts’. Comparative data have been re-presented accordingly. Non-trading reverse repos and repos have been presented as separate lines in the balance sheet to align disclosure with market practice and provide more meaningful information in relation to loans and advances. The extent to which reverse repos and repos represent loans to/from customers and banks is set out in Note 17 on the Financial Statements.
18 Taxes paid by HSBC relate to HSBC’s own tax liabilities and is reported on a cash flow basis. 19 UK bank levy paid reflects the payments made to the tax authorities during the calendar year and may differ from the recognition of liabilities charged to the
income statement. 20 Taxes collected relate to those taxes which HSBC is liable to pay as agent for taxation authorities across the world and include all employee-related taxes,
together with taxes withheld from payments of interest and charged on the provision of goods and services to its customers. Taxes collected are reported on a cash flow basis.
21 Excludes movements in the fair value of own debt and before variable pay distributions. 22 Each American Depositary Share represents five ordinary shares. 23 Total shareholder return is defined as the growth in share value and declared dividend income during the relevant period. 24 The Morgan Stanley Capital International World Bank Index. 25 The 2014 Group pre-tax pre-variable pay profit calculation as described in the Directors’ Remuneration Report on page 309 .The percentage of variable pay
deferred for the Code Staff population was 50%. 26 Dividends per ordinary share in respect of that year. For 2014, this includes the first, second and third interim dividends paid in 2014 of US$5.8bn (gross of scrip)
and a fourth interim dividend of US$3.8bn. 27 Employee compensation and benefits in 2013 totalled US$19,196m which included an accounting gain arising from a change in the basis of delivering ill-health
benefits in the UK of US$430m. Excluding this accounting gain, 2013 employee compensation and benefits totalled US$19,626m. 28 This approach applies to all executive Directors with the exception of the Group Chairman, Douglas Flint, who is not eligible for a fixed pay allowance or variable
pay awards.

Report of the Directors: Financial summary Use of non-GAAP financial measures
HSBC HOLDINGS PLC
40
Financial summary Use of non-GAAP financial measures 40
Consolidated income statement 45
Group performance by income and expense item 46
Net interest income 46
Net fee income 48
Net trading income 49
Net income/(expense) from financial instruments designated at fair value 50
Gains less losses from financial investments 51
Net insurance premium income 51
Other operating income 52
Net insurance claims and benefits paid and movement in liabilities to policyholders 53
Loan impairment charges and other credit risk provisions 53
Operating expenses 54
Share of profit in associates and joint ventures 55
Tax expense 56
Consolidated balance sheet 57
Movement in 2014 58
Reconciliation of RoRWA measures 62
Critical accounting estimates and judgements 62
The management commentary included in the Report of the Directors: ‘Financial Review’, together with the ‘Employees’ and ‘Corporate sustainability’ sections of ‘Corporate Governance’ and the ‘Directors’ Remuneration Report’ is presented in compliance with the IFRSs Practice Statement ‘Management Commentary’ issued by the IASB.
Use of non-GAAP financial measures Our reported results are prepared in accordance with IFRSs as detailed in the Financial Statements on page 334. In measuring our performance, the financial measures that we use include those which have been derived from our reported results in order to eliminate factors which distort year-on-year comparisons. These are considered non-GAAP financial measures. The primary non-GAAP financial measure we use is ‘adjusted performance’. Other non-GAAP financial measures are described and reconciled to the most relevant reported financial measure when used.
Adjusted performance
Adjusted performance is computed by adjusting reported results for the year-on-year effects of foreign currency translation differences and significant items which distort year-on-year comparisons.
Previously we used the non-GAAP financial measure of ‘underlying performance’, which was calculated by adjusting reported results for the year-on-year effects of currency translation differences, own credit spread and acquisitions, disposals and dilutions. In 2014, we modified our approach to better align it with the way we view our performance internally and with feedback received from investors. Adjusted performance builds on underlying performance by maintaining the adjustment for currency translation differences and incorporating the adjustments for own credit spread and acquisitions, disposals and dilutions into the definition of significant items. We use the term ‘significant items’ to collectively describe the group of individual adjustments which are excluded from reported results when arriving at adjusted performance. Significant items, which are detailed below, are those items which management and investors would ordinarily identify and consider separately when assessing performance in order to better understand the underlying trends in the business.
We believe adjusted performance provides useful information for investors by aligning internal and external reporting, identifying and quantifying items management believe to be significant and providing insight into how management assesses year-on-year performance.
We arrive at adjusted performance by excluding from our reported results:
• the year-on-year effects of foreign currency translation differences. This is done by comparing reported results for 2014 with reported results for 2013 retranslated at 2014 exchange rates. The foreign currency translation differences reflect the movements of the US dollar against most major currencies; and
• significant items which distort the year-on-year comparison of reported results by obscuring the underlying factors and trends which affect operations. Significant items include adjustments for own credit spread and acquisitions, disposals and dilutions which were previously part of our underlying measure. The following pages provide further details, including a reconciliation from reported to adjusted results.

HSBC HOLDINGS PLC
41
Str
ateg
ic R
epo
rt
Fi
nan
cial
Rev
iew
Co
rpo
rate
Go
vern
ance
Fin
anci
al S
tate
men
ts
S
har
eho
lder
Info
rmat
ion
For acquisitions, disposals and changes of ownership levels of subsidiaries, associates, joint ventures and businesses, we eliminate the gain or loss on disposal or dilution and any associated gain or loss on reclassification or impairment recognised in the year incurred, and remove the operating profit or loss of the acquired, disposed of or diluted subsidiaries, associates,
joint ventures and businesses from all the years presented so we can view results on a like-for-like basis. Disposal of strategic investments other than those included in the above definition would be included in other significant items if material.
The following acquisitions, disposals and changes to ownership levels affected adjusted performance:
Disposal gains/(losses) affecting adjusted performance
Date Disposal gain/(loss)
US$m
Reclassification gain in respect of our holding in Industrial Bank Co., Limited following the issue of additional share capital to third parties1 Jan 2013 1,089
HSBC Insurance (Asia-Pacific) Holdings Limited’s disposal of its shareholding in Bao Viet Holdings1 Mar 2013 104Household Insurance Group Holding company’s disposal of its insurance manufacturing business1 Mar 2013 (99)HSBC Seguros, S.A. de C.V., Grupo Financiero HSBC’s disposal of its property and Casualty Insurance business
in Mexico1 Apr 2013 20 HSBC Bank plc’s disposal of its shareholding in HSBC (Hellas) Mutual Funds Management SA2 Apr 2013 (7)HSBC Insurance (Asia-Pacific) Holdings Limited disposal of its shareholding in Hana HSBC Life Insurance
Company Limited1 May 2013 28 HSBC Bank plc’s disposal of HSBC Assurances IARD2 May 2013 (4)The Hongkong and Shanghai Banking Corporation Limited’s disposal of HSBC Life (International) Limited’s
Taiwan branch operations2 June 2013 (36)HSBC Markets (USA) Inc.’s disposal of its subsidiary, Rutland Plastic Technologies2 Aug 2013 17HSBC Insurance (Singapore) Pte Ltd’s disposal of its Employee Benefits Insurance business in Singapore2 Aug 2013 (8)HSBC Investment Bank Holdings plc’s disposal of its investment in associate FIP Colorado2 Aug 2013 (5)HSBC Investment Bank Holdings plc group’s disposal of its investment in subsidiary, Viking Sea Tech1 Aug 2013 54HSBC Latin America Holdings UK Limited’s disposal of HSBC Bank (Panama) S.A.2 Oct 2013 1,107HSBC Latin America Holdings UK Limited’s disposal of HSBC Bank (Peru) S.A.2 Nov 2013 (18)HSBC Latin America Holdings UK Limited’s disposal of HSBC Bank (Paraguay) S.A.2 Nov 2013 (21)Reclassification loss in respect of our holding in Yantai Bank Co., Limited following an increase in its
registered share capital1 Dec 2013 (38)HSBC Latin America Holdings UK Limited’s disposal of HSBC Bank (Colombia) S.A.1 Feb 2014 18Reclassification loss in respect of our holding in Vietnam Technological & Commercial Joint Stock Bank
following the loss of significant influence1 Jun 2014 (32)HSBC Bank Middle East Limited’s disposal of its operations in Pakistan1 Oct 2014 (27)
For footnotes, see page 109.
Foreign currency translation differences (‘constant currency’)
Foreign currency translation differences reflect the movements of the US dollar against most major currencies during 2014. We exclude the translation differences when using constant currency because it allows us to assess balance sheet and income statement performance on a like-for-like basis to better understand the underlying trends in the business.
Foreign currency translation differences
Foreign currency translation differences for 2013 are computed by retranslating into US dollars for non-US dollar branches, subsidiaries, joint ventures and associates: • the income statements for 2013 at the average rates of
exchange for 2014; and • the balance sheet at 31 December 2013 at the prevailing
rates of exchange on 31 December 2014. No adjustment has been made to the exchange rates used to translate foreign currency denominated assets and liabilities into the functional currencies of any HSBC branches, subsidiaries, joint ventures or associates. When reference is made to foreign currency translation differences in tables or commentaries, comparative data reported in the functional currencies of HSBC’s operations have been translated at the appropriate exchange rates applied in the current year on the basis described above.

Report of the Directors: Financial summary (continued) Use of non-GAAP financial measures
HSBC HOLDINGS PLC
42
Other significant items
The following tables detail the effect of other significant items in 2014 and 2013 on each of our geographical segments and global businesses.
Other significant items affecting adjusted performance – (gains)/losses
Europe Asia MENA North
America Latin America
Total
US$m US$m US$m US$m US$m US$mRevenue Debit valuation adjustment on derivative contracts 234 69 5 16 8 332Fair value movements on non-qualifying hedges3 235 4 302 541Gain on sale of several tranches of real estate secured accounts
in the US (168) (168)Gain on sale of shareholding in Bank of Shanghai (428) (428)Impairment of our investment in Industrial Bank 271 271Provisions arising from the ongoing review of compliance with the
Consumer Credit Act in the UK 632 632
Year ended 31 December 2014 1,101 (84) 5 150 8 1,180
Operating expenses Charge in relation to the settlement agreement with the Federal
Housing Finance Authority 550 550 Settlements and provisions in connection with foreign exchange
investigations 1,187 1,187 Restructuring and other related costs 123 9 2 28 116 278Regulatory provisions in GPB 16 49 65UK customer redress programmes 1,275 1,275
Year ended 31 December 2014 2,601 58 2 578 116 3,355
RBWM CMB GB&M GPB Other Total US$m US$m US$m US$m US$m US$mRevenue Debit valuation adjustment on derivative contracts 332 332Fair value movements on non-qualifying hedges3 493 (1) 8 1 40 541Gain on sale of several tranches of real estate secured accounts
in the US (168) (168)Gain on sale of shareholding in Bank of Shanghai (428) (428)Impairment of our investment in Industrial Bank 271 271Provisions arising from the ongoing review of compliance with the
Consumer Credit Act in the UK 568 24 40 632
Year ended 31 December 2014 893 23 340 41 (117) 1,180
Operating expenses Charge in relation to the settlement agreement with the Federal
Housing Finance Authority 17 533 550 Settlements and provisions in connection with foreign exchange
investigations 1,187 1,187 Restructuring and other related costs 88 37 27 6 120 278Regulatory provisions in GPB 65 65UK customer redress programmes 992 138 145 1,275
Year ended 31 December 2014 1,097 175 1,892 71 120 3,355

HSBC HOLDINGS PLC
43
Str
ateg
ic R
epo
rt
Fi
nan
cial
Rev
iew
Co
rpo
rate
Go
vern
ance
Fin
anci
al S
tate
men
ts
S
har
eho
lder
Info
rmat
ion
Europe Asia MENA North
America Latin America
Total
US$m US$m US$m US$m US$m US$mRevenue Net gain on completion of Ping An disposal (553) (553)Debit valuation adjustment on derivative contracts (65) (40) (2) 14 (13) (106)Fair value movements on non-qualifying hedges3 (297) 32 (246) (511)FX gains relating to sterling debt issued by HSBC Holdings (442) (442)Write-off of allocated goodwill relating to the GPB Monaco business 279 279Loss on sale of several tranches of real estate secured accounts in
the US 123 123 Loss on sale of non-real estate secured accounts in the US 271 271Loss on early termination of cash flow hedges in the US run-off
portfolio 199 199 Loss on sale of an HFC Bank UK secured loan portfolio 146 146
Year ended 31 December 2013 (379) (561) (2) 361 (13) (594)
Operating expenses Restructuring and other related costs 217 86 4 101 75 483UK customer redress programmes 1,235 1,235Madoff-related litigation costs 298 298Regulatory provisions in GPB 317 35 352US customer remediation provisions relating to CRS 100 100Accounting gain arising from change in basis of delivering ill-health
benefits in the UK (430) (430)
Year ended 31 December 2013 1,637 121 4 201 75 2,038 RBWM CMB GB&M GPB Other Total US$m US$m US$m US$m US$m US$mRevenue Net gain on completion of Ping An disposal (553) (553)Debit valuation adjustment on derivative contracts (106) (106)Fair value movements on non-qualifying hedges3 (262) 18 (267) (511)FX gains relating to sterling debt issued by HSBC Holdings (442) (442)Write-off of allocated goodwill relating to the GPB Monaco business 279 279Loss on sale of several tranches of real estate secured accounts in
the US 123 123 Loss on sale of non-real estate secured accounts in the US 271 271Loss on early termination of cash flow hedges in the US run-off
portfolio 199 199 Loss on sale of an HFC Bank UK secured loan portfolio 146 146
Year ended 31 December 2013 477 (88) 279 (1,262) (594)
Operating expenses Restructuring and other related costs 167 31 13 73 199 483UK customer redress programmes 953 148 134 1,235Madoff-related litigation costs 298 298Regulatory provisions in GPB 352 352US customer remediation provisions relating to CRS 100 100Accounting gain arising from change in basis of delivering ill-health
benefits in the UK (189) (160) (81) (430)
Year ended 31 December 2013 1,031 19 364 425 199 2,038
For footnote, see page 109.

Report of the Directors: Financial summary (continued) Use of non-GAAP financial measures / Consolidated income statement
HSBC HOLDINGS PLC
44
The following table reconciles selected reported items for 2014 and 2013 to adjusted items. Equivalent tables
are provided for each of our global businesses and geographical segments on www.hsbc.com.
Reconciliation of reported and adjusted items 2014 2013 Change5
US$m US$m %Revenue4
Reported 61,248 64,645 (5)Currency translation adjustment6 (686) Own credit spread7 (417) 1,246 Acquisitions, disposals and dilutions (9) (2,757) Other significant items 1,180 (594)
Adjusted 62,002 61,854
Loan impairment charges and other credit risk provisions Reported (3,851) (5,849) 34Currency translation adjustment6 168 Acquisitions, disposals and dilutions 67 Other significant items
Adjusted (3,851) (5,614) 31
Total operating expenses Reported (41,249) (38,556) (7)Currency translation adjustment6 348 Acquisitions, disposals and dilutions 40 488 Other significant items 3,355 2,038
Adjusted (37,854) (35,682) (6)
Adjusted cost efficiency ratio 61.1% 57.7%
Share of profit in associates and joint ventures Reported 2,532 2,325 9Currency translation adjustment6 11 Acquisitions, disposals and dilutions 87 Other significant items
Adjusted 2,532 2,423 4
Profit before tax Reported 18,680 22,565 (17)Currency translation adjustment6 (159) Own credit spread7 (417) 1,246 Acquisitions, disposals and dilutions 31 (2,115) Other significant items 4,535 1,444
Adjusted 22,829 22,981 (1)
For footnotes, see page 109.
Adjusted profit before tax
2014 2013 Change5
US$m US$m %By global business Retail Banking and Wealth Management 7,648 7,959 (4)Commercial Banking 8,940 7,910 13 Global Banking and Markets 8,114 9,208 (12)Global Private Banking 738 900 (18)Other (2,611) (2,996) 13
Year ended 31 December 22,829 22,981 (1)
By geographical region Europe 3,905 4,301 (9)Asia8 14,635 14,309 2 Middle East and North Africa 1,854 1,673 11 North America 2,111 2,048 3 Latin America 324 650 (50)
Year ended 31 December 22,829 22,981 (1)
For footnotes, see page 109.

HSBC HOLDINGS PLC
45
Str
ateg
ic R
epo
rt
Fi
nan
cial
Rev
iew
Co
rpo
rate
Go
vern
ance
Fin
anci
al S
tate
men
ts
S
har
eho
lder
Info
rmat
ion
Consolidated income statement Five-year summary consolidated income statement
2014
US$m 2013
US$m 2012
US$m 2011
US$m 2010
US$m
Net interest income 34,705 35,539 37,672 40,662 39,441Net fee income 15,957 16,434 16,430 17,160 17,355Net trading income 6,760 8,690 7,091 6,506 7,210Net income/(expense) from financial instruments designated
at fair value 2,473 768 (2,226) 3,439 1,220 Gains less losses from financial investments 1,335 2,012 1,189 907 968Dividend income 311 322 221 149 112Net insurance premium income 11,921 11,940 13,044 12,872 11,146Gains on disposal of US branch network, US cards business and
Ping An Insurance (Group) Company of China, Ltd – – 7,024 – – Other operating income 1,131 2,632 2,100 1,766 2,562
Total operating income 74,593 78,337 82,545 83,461 80,014
Net insurance claims and benefits paid and movement in liabilities to policyholders (13,345) (13,692) (14,215) (11,181) (11,767)
Net operating income before loan impairment charges and other credit risk provisions 61,248 64,645 68,330 72,280 68,247
Loan impairment charges and other credit risk provisions (3,851) (5,849) (8,311) (12,127) (14,039)
Net operating income 57,397 58,796 60,019 60,153 54,208
Total operating expenses (41,249) (38,556) (42,927) (41,545) (37,688)
Operating profit 16,148 20,240 17,092 18,608 16,520
Share of profit in associates and joint ventures 2,532 2,325 3,557 3,264 2,517
Profit before tax 18,680 22,565 20,649 21,872 19,037
Tax expense (3,975) (4,765) (5,315) (3,928) (4,846)
Profit for the year 14,705 17,800 15,334 17,944 14,191
Profit attributable to shareholders of the parent company 13,688 16,204 14,027 16,797 13,159Profit attributable to non-controlling interests 1,017 1,596 1,307 1,147 1,032 Five-year financial information
2014US$
2013US$
2012 US$
2011 US$
2010US$
Basic earnings per share 0.69 0.84 0.74 0.92 0.73Diluted earnings per share 0.69 0.84 0.74 0.91 0.72Dividends per ordinary share9 0.49 0.48 0.41 0.39 0.34
% % % % %
Dividend payout ratio10 71.0 57.1 55.4 42.4 46.6Post-tax return on average total assets 0.5 0.7 0.6 0.6 0.6Return on average ordinary shareholders’ equity 7.3 9.2 8.4 10.9 9.5
Average foreign exchange translation rates to US$: US$1: £ 0.607 0.639 0.631 0.624 0.648US$1: € 0.754 0.753 0.778 0.719 0.755
For footnotes, see page 109.
Unless stated otherwise, all tables in the Annual Report and Accounts 2014 are presented on a reported basis.
For a summary of our financial performance in 2014, see page 28.

Report of the Directors: Financial summary (continued) Group performance by income and expense item
HSBC HOLDINGS PLC
46
Group performance by income and expense item Net interest income 2014 2013 2012 US$m US$m US$m
Interest income 50,955 51,192 56,702Interest expense (16,250) (15,653) (19,030)
Net interest income11 34,705 35,539 37,672
Average interest-earning assets 1,786,536 1,669,368 1,625,068
Gross interest yield12 2.85% 3.07% 3.49%Less: cost of funds (1.05%) (1.10%) (1.36%)
Net interest spread13 1.80% 1.97% 2.13%
Net interest margin14 1.94% 2.13% 2.32%
For footnotes, see page 109.
Summary of interest income by type of asset 2014 2013 2012
Averagebalance
Interestincome Yield
Averagebalance
Interestincome Yield
Average balance
Interestincome Yield
US$m US$m % US$m US$m % US$m US$m %Short-term funds and loans and
advances to banks27 237,148 3,068 1.29 236,377 2,851 1.21
235,831
3,505 1.49 Loans and advances to customers27 931,311 37,429 4.02 897,322 38,529 4.29 891,699 40,870 4.58Reverse repurchase agreements –
non-trading26,27 198,273 1,800 0.91 114,324 995 0.87
83,105
975 1.17 Financial investments 399,816 8,323 2.08 393,309 8,002 2.03 387,329 9,078 2.34Other interest-earning assets 19,988 335 1.68 28,036 815 2.91 27,104 2,274 8.39
Total interest-earning assets 1,786,536 50,955 2.85 1,669,368 51,192 3.07 1,625,068 56,702 3.49Trading assets and financial assets
designated at fair value15,16,26 238,958 5,596 2.34 354,817 5,763 1.62
368,406
6,931 1.88 Impairment provisions (14,015) (15,954) (17,421) Non-interest-earning assets 668,564 683,785 730,901
Year ended 31 December 2,680,043 56,551 2.11 2,692,016 56,955 2.12 2,706,954 63,633 2.35
For footnotes, see page 109.
Summary of interest expense by type of liability and equity 2014 2013 2012
Averagebalance
Interestexpense Cost
Averagebalance
Interestexpense Cost
Average balance
Interestexpense Cost
US$m US$m % US$m US$m % US$m US$m %
Deposits by banks17,27 61,217 481 0.79 61,616 555 0.90 78,023 1,001 1.28Financial liabilities designated at fair value
– own debt issued18 66,374 837 1.26 72,333 967 1.34
75,016
1,325 1.77 Customer accounts19,27 1,088,493 9,131 0.84 1,035,500 8,794 0.85 1,012,056 10,650 1.05Repurchase agreements – non-trading26,27 190,705 652 0.34 94,410 405 0.43 55,536 387 0.70Debt securities in issue 129,724 4,554 3.51 150,976 4,182 2.77 161,348 4,755 2.95Other interest-bearing liabilities 10,120 595 5.88 11,345 750 6.61 19,275 912 4.73
Total interest-bearing liabilities 1,546,633 16,250 1.05 1,426,180 15,653 1.10 1,401,254 19,030 1.36 Trading liabilities and financial liabilities
designated at fair value (excluding own debt issued)26 178,518 2,856 1.60 301,353 3,027 1.00
318,883
3,445 1.08 Non-interest bearing current accounts 185,990 184,370 177,085 Total equity and other non-interest bearing
liabilities 768,902 780,113 809,732
Year ended 31 December 2,680,043 19,106 0.71 2,692,016 18,680 0.69 2,706,954 22,475 0.83
For footnotes, see page 109.

HSBC HOLDINGS PLC
47
Str
ateg
ic R
epo
rt
Fi
nan
cial
Rev
iew
Co
rpo
rate
Go
vern
ance
Fin
anci
al S
tate
men
ts
S
har
eho
lder
Info
rmat
ion
Reported net interest income of US$35bn decreased by US$834m or 2% compared with 2013. This included the
significant items and currency translation summarised in the table below.
Significant items and currency translation 2014 2013 US$m US$mSignificant items Provisions arising from the ongoing review of compliance with the Consumer Credit Act in the UK (632) –Acquisitions, disposals and dilutions 38 386
(594) 386Currency translation – 518
Year ended 31 December (594) 904
On a reported basis, net interest spread and margin both fell, reflecting lower yields on customer lending in North America and Europe. In North America, this was due to changes in the composition of the lending portfolios towards lower yielding secured assets and to the run-off of the CML portfolio. In Europe, it was principally due to a significant item, namely provisions arising from the ongoing review of compliance with the Consumer Credit Act (‘CCA’) in the UK. These factors were partially offset by a lower cost of funds.
Excluding the significant items and currency translation tabulated above, net interest income rose by US$664m or 2% from 2013, driven by increases in Asia, partly reflecting growth in customer lending volumes.
Interest income
Reported interest income was broadly unchanged, as decreases in interest income from customer lending (which included the effect of the CCA provisions) were offset by increases in income from short-term funds, as well as a rise due to the change in the management of reverse repo transactions (see page 48).
Interest income on loans and advances to customers decreased, principally in North America and Latin America, partially offset by increases in Asia. In North America, this was a consequence of the disposal of the higher yielding non-real estate loan portfolio and the reduction in the CML portfolio from run-off and sales. In addition, new lending to customers in RBWM and CMB was at lower yields, reflecting a shift in the portfolio towards higher levels of lower yielding first lien real estate secured loans. In Latin America, interest income on customer lending also decreased, reflecting a fall in yields in both Brazil and Mexico, despite the rise in average balances in term lending in both countries. In Brazil, the falling yield reflected the shift in product and client mix to more secured, relationship-led lending while, in Mexico, it was driven by reductions in Central Bank interest rates. The region was also affected by the disposal of non-strategic businesses.
By contrast, we recorded increased interest income on customer lending in Asia, driven by growth in term lending volumes and, to a lesser extent, residential mortgages during the year. This increase in balances
was partially offset by compressed yields. In Europe, excluding the effect of the CCA provisions noted above, interest income on customer lending rose due to increases in mortgage and term lending balances.
Interest income on short-term funds and financial investments increased both in Latin America and Asia, as interest rates rose in certain countries in these regions (notably in Brazil, Argentina and mainland China) and average balances grew. However, in Europe, interest income on short-term funds and financial investments fell as maturing positions were replaced by longer-term but lower-yielding bonds.
Interest expense
Reported interest expense increased in the year. We recorded increased interest expense on customer accounts in Asia and Latin America, partly offset by a reduction in North America. In Asia, the growth was principally from an increase in the average balances of customer accounts. In Latin America, interest expense on customer accounts rose as reductions in average balances were more than offset by the increase in the cost of funds due to interest rate rises, notably in Brazil. However, the effects of this were partly offset by a fall in the cost of funds in Mexico as Central Bank rates fell, and the disposal of non-strategic businesses. Conversely, in North America, interest expense on customer deposits declined as a result of a strategic decision to re-price deposits downwards. In addition, other interest expense decreased due to a release of accrued interest associated with an uncertain tax position.
Interest expense on debt issued rose. We recorded an increase in the cost of funds which was partly offset by decreased overall balances. Interest expense rose in Latin America, notably in Brazil, in line with interest rate rises and increased medium-term loan note balances. By contrast, in North America the business disposals led to a decline in our funding requirements. The cost of funds also fell as higher coupon debt matured and was repaid. In Europe, interest expense on debt also decreased, as average outstanding balances fell as a result of net redemptions and the cost of funds reduced.

Report of the Directors: Financial summary (continued) Group performance by income and expense item
HSBC HOLDINGS PLC
48
Repos and reverse repos
During the final quarter of 2013, GB&M changed the way it managed reverse repurchase (‘reverse repo’) and repurchase (‘repo’) activities. This had the effect of reducing the net interest margin as average interest earning assets and interest bearing liabilities increased significantly. These reverse repo and repo agreements have a lower gross yield and cost of funds, respectively, than the remainder of our portfolio.
‘Net interest income’ includes the expense of internally funded trading assets, while related revenue is reported in ‘Net trading income’. The internal cost of funding these assets decreased, as average trading asset balances fell to a greater extent than trading liabilities. In reporting our global business results, this cost is included within ‘Net trading income’.
Net fee income 2014
US$m2013
US$m 2012
US$m
Account services 3,407 3,581 3,563Funds under management 2,658 2,673 2,561Cards 2,460 2,455 3,030Credit facilities 1,890 1,907 1,761Broking income 1,371 1,388 1,350Imports/exports 1,115 1,157 1,196Unit trusts 1,005 891 739Underwriting 872 866 739Remittances 833 849 819Global custody 726 698 737Insurance 516 551 696Other 2,692 2,957 2,958
Fee income 19,545 19,973 20,149
Less: fee expense (3,588) (3,539) (3,719)
Year ended 31 December 15,957 16,434 16,430
Reported net fee income fell by US$477m, primarily in Latin America and North America. In Latin America, the decrease included the effect of currency translation and the continued repositioning and disposal of businesses, notably the sale of our Panama operations in 2013. In North America, net fee income was lower following the expiry of the Transition Servicing Agreements we entered into with the buyer of the Card and Retail Services (‘CRS’) business, and adverse adjustments to mortgage servicing rights valuations.
Account services fee income decreased, notably in Latin America and Europe. In Latin America, the fall was due to a reduction in customer numbers in Mexico, as we continued to reposition the business, and in Brazil, due to strong market competition. In Europe, account services fees were lower, primarily in Switzerland due
to the repositioning of our GPB business, and in the UK, in part reflecting the implementation of the Retail Distribution Review in 2013.
By contrast, unit trust fees rose, primarily in Asia, due to increased sales of equity funds in Hong Kong.
Other fee income declined in North America due to the expiry of the Transition Servicing Agreements and in Latin America following the sale of our operations in Panama in 2013 and the continued repositioning of the business in Mexico.
In addition, fee expenses were higher due to adverse adjustments to mortgage servicing rights valuations in North America, reflecting mortgage interest rate decreases in 2014 which compared with increases in 2013.

HSBC HOLDINGS PLC
49
Str
ateg
ic R
epo
rt
Fi
nan
cial
Rev
iew
Co
rpo
rate
Go
vern
ance
Fin
anci
al S
tate
men
ts
S
har
eho
lder
Info
rmat
ion
Net trading income 2014
US$m 2013
US$m 2012
US$m
Trading activities20 5,419 6,921 5,249Ping An contingent forward sale contract – (682) (553)Net interest income on trading activities 1,907 2,047 2,683Gain/(loss) on termination of hedges 1 (194) –Other trading income – hedge ineffectiveness:
– on cash flow hedges 34 22 35– on fair value hedges 19 65 (27)
Fair value movement on non-qualifying hedges21 (620) 511 (296)
Year ended 31 December 6,760 8,690 7,091
For footnotes, see page 109.
Reported net trading income of US$6.8bn was US$1.9bn lower, predominantly in Europe. The reduction in net
trading income was partly driven by the significant items summarised in the table below.
Significant items and currency translation
2014 US$m
2013US$m
Significant items Included within trading activities: (332) 548
– Debit valuation adjustment on derivative contracts (332) 106– FX gains relating to sterling debt issued by HSBC Holdings 442
Included in other net trading income: (539) (346)– Ping An contingent forward sale contract22 (682)– Loss on early termination of cash flow hedges in the US run-off portfolio (199)– Fair value movement on non-qualifying hedges (541) 511– Acquisitions, disposals and dilutions 2 24
(871) 202Currency translation – (11)
Year ended 31 December (871) 191
For footnote, see page 109. Excluding the significant items and currency translation tabulated above, net trading income from trading activities decreased by US$0.6bn, notably in Markets within GB&M. This was predominantly driven by our Foreign Exchange business, which was affected by lower volatility and reduced client flows. In Equities, revenue decreased, as 2013 benefited from higher revaluation gains which more than offset a rise in 2014 in revenue from increased client flows and higher derivatives income.
In 2014, we revised our estimation methodology for valuing uncollateralised derivative portfolios by introducing the funding fair value adjustment (‘FFVA’), resulting in a reduction in net trading income of US$263m, primarily in Rates (US$164m) and Credit (US$97m). Excluding the FFVA, Credit was also affected by adverse movements on credit spreads and a reduction in revenue in Legacy Credit. By contrast, Rates was affected by favourable market movements, notably in
Asia, along with minimal fair value movements on our own credit spread on structured liabilities compared with adverse movements in 2013. These factors were partly offset by a fall in Rates in Europe.
Included within net trading income from trading activities, there were favourable foreign exchange movements on assets held as economic hedges of foreign currency debt designated at fair value, compared with adverse movements in 2013. These movements offset fair value movements on the foreign currency debt which are reported in ‘Net income/(expense) from financial instruments designated at fair value’.
In addition, net interest income from trading activities fell due to lower average balances, notably relating to reverse repo and repo agreements, in line with the change in the way GB&M manages these agreements. The net interest income from these activities is now recorded in ‘Net interest income’.

Report of the Directors: Financial summary (continued) Group performance by income and expense item
HSBC HOLDINGS PLC
50
Net income/(expense) from financial instruments designated at fair value 2014
US$m2013
US$m 2012
US$mNet income/(expense) arising from:
– financial assets held to meet liabilities under insurance and investment contracts 2,300 3,170 2,980 – liabilities to customers under investment contracts (435) (1,237) (996)– HSBC’s long-term debt issued and related derivatives 508 (1,228) (4,327)
– change in own credit spread on long-term debt (significant item) 417 (1,246) (5,215)– other changes in fair value22 91 18 888
– other instruments designated at fair value and related derivatives 100 63 117
Year ended 31 December 2,473 768 (2,226)
For footnote, see page 109.
Assets and liabilities from which net income/(expense) from financial instruments designated at fair value arose 2014
US$m2013
US$m 2012
US$m
Financial assets designated at fair value at 31 December 29,037 38,430 33,582 Financial liabilities designated at fair value at 31 December 76,153 89,084 87,720
Including: Financial assets held to meet liabilities under:
– insurance contracts and investment contracts with DPF 10,650 10,717 8,376 – unit-linked insurance and other insurance and investment contracts 16,333 25,423 23,655
Long-term debt issues designated at fair value 69,681 75,278 74,768 The accounting policies for the designation of financial instruments at fair value and the treatment of the associated income and expenses are described in Note 2 on the Financial Statements.
The majority of the financial liabilities designated at fair value are fixed-rate long-term debt issues, the interest rate profile of which has been changed to floating through swaps as part of a documented interest rate management strategy. The movement in fair value of these long-term debt issues and the related hedges includes the effect of our credit spread changes and any ineffectiveness in the economic relationship between the related swaps and own debt. The size and direction of the changes in the credit spread on our debt and ineffectiveness, which are recognised in the income statement, can be volatile from year to year, but do not alter the cash flows expected as part of the documented interest rate management strategy. As a consequence, fair value movements arising from changes in our own credit spread on long-term debt and other fair value movements on the debt and related derivatives are not regarded internally as part of managed performance and are therefore not allocated to global businesses, but are reported in ‘Other’. Credit spread movements on own debt designated at fair value are excluded from adjusted results, and related fair value movements are not included in the calculation of regulatory capital.
Reported net income from financial instruments designated at fair value was US$2.5bn in 2014, compared with US$768m in 2013. The former included favourable movements in the fair value of our own long-term debt of US$417m due to changes in credit spread, compared with adverse movements of US$1.2bn in 2013. Excluding
this significant item, net income from financial instruments designated at fair value increased by US$42m.
Net income arising from financial assets held to meet liabilities under insurance and investment contracts of US$2.3bn was US$870m lower than in 2013. This was driven by weaker equity market performance in the UK and France, partly offset by improved equity market performance in Hong Kong and higher net income on the bonds portfolio in Brazil.
Investment gains or losses arising from equity markets result in a corresponding movement in liabilities to customers, reflecting the extent to which unit-linked policyholders, in particular, participate in the investment performance of the associated asset portfolio. Where these relate to assets held to back investment contracts, the corresponding movement in liabilities to customers is also recorded under ‘Net income/(expense) from financial instruments designated at fair value’. This is in contrast to gains or losses related to assets held to back insurance contracts or investment contracts with discretionary participation features (‘DPF’), where the corresponding movement in liabilities to customers is recorded under ‘Net insurance claims and benefits paid and movement in liabilities to policyholders’.
Other changes in fair value reflected a net favourable movement due to interest and exchange rate hedging ineffectiveness. This was partly offset by net adverse foreign exchange movements on foreign currency debt designated at fair value and issued as part of our overall funding strategy (offset from assets held as economic hedges in ‘Net trading income’).

HSBC HOLDINGS PLC
51
Str
ateg
ic R
epo
rt
Fi
nan
cial
Rev
iew
Co
rpo
rate
Go
vern
ance
Fin
anci
al S
tate
men
ts
S
har
eho
lder
Info
rmat
ion
Gains less losses from financial investments 2014
US$m 2013
US$m 2012
US$m Net gains/(losses) from disposal of:
– debt securities 665 491 781– equity securities 1,037 1,697 823– other financial investments 6 (1) 5
1,708 2,187 1,609Impairment of available-for-sale equity securities (373) (175) (420)
Year ended 31 December 1,335 2,012 1,189 Reported gains less losses from financial investments were US$1.3bn, a decrease of US$677m from 2013. The
decrease primarily reflected the significant items summarised below.
Significant items and currency translation 2014 2013 US$m US$mSignificant items Gain on sale of shareholding in Bank of Shanghai 428 –Impairment on our investment in Industrial Bank (271) –Net gain on completion of Ping An disposal22 1,235Acquisitions, disposals and dilutions 5
157 1,240Currency translation (10)
Year ended 31 December 157 1,230
For footnote, see page 109.
Excluding the significant items and currency translation noted above, gains less losses from financial investments increased by US$396m, primarily driven by higher net gains on the disposal of debt securities as we actively managed the Legacy Credit portfolio. In addition, we
reported higher gains on sale of available-for-sale equity securities and lower impairments on available-for-sale equity securities from improved market conditions and business performance of the underlying portfolio.
Net insurance premium income 2014
US$m2013
US$m 2012
US$mGross insurance premium income 12,370 12,398 13,602Reinsurance premiums (449) (458) (558)Year ended 31 December 11,921 11,940 13,044 Reported net insurance premium income was broadly unchanged, with reductions in Europe and Latin America largely offset by higher premium income in Asia.
In Asia, premium income rose, primarily in Hong Kong, due to increased new business from deferred annuity, universal life and endowment contracts. This was partly offset by lower new business from unit-linked contracts.
In Europe, premium income decreased, mainly in the UK, reflecting lower sales following the withdrawal of
external independent financial adviser distribution channels for certain linked insurance contracts in the second half of 2013. This was partly offset by increases in France, mainly reflecting higher sales of investment contracts with DPF.
Net insurance premium income also fell in Latin America, primarily in Brazil, reflecting lower sales, in part due to changes in our distribution channel.

Report of the Directors: Financial summary (continued) Group performance by income and expense item
HSBC HOLDINGS PLC
52
Other operating income 2014
US$m 2013
US$m 2012
US$m
Rent received 162 155 210 Gains/(losses) recognised on assets held for sale 220 (729) 485 Gains on investment properties 120 113 72 Gain on disposal of property, plant and equipment, intangible assets and
non-financial investments 32 178 187 Gains/(losses) arising from dilution of interest in Industrial Bank and other associates
and joint ventures (32) 1,051 – Gain on disposal of HSBC Bank (Panama) S.A. – 1,107 –Change in present value of in-force long-term insurance business 261 525 737 Other 368 232 409
Year ended 31 December 1,131 2,632 2,100
Change in present value of in-force long-term insurance business 2014
US$m 2013
US$m 2012
US$m
Value of new business 870 924 1,027Expected return (545) (505) (420)Assumption changes and experience variances (116) 88 69Other adjustments 52 18 61
Year ended 31 December 261 525 737
Reported other operating income of US$1.1bn decreased by US$1.5bn from 2013. This was largely due to the significant items summarised in the table below.
Significant items and currency translation 2014
US$m 2013
US$m Significant items Included within gains/(losses) recognised on assets held for sale: 168 (772)
– write-off of allocated goodwill relating to the GPB Monaco business – (279)– loss on sale of the non-real estate portfolio in the US – (271)– gain/(loss) on sale of several tranches of real estate secured accounts in the US 168 (123) – Household Insurance Group Holding company’s disposal of its insurance manufacturing business2 – (99)
Included within the remaining line items: (41) 2,193– reclassification gain in respect of our holding in Industrial Bank Co., Limited following the issue of
additional share capital to third parties2 – 1,089 – HSBC Latin America Holdings UK Limited’s disposal of HSBC Bank (Panama) S.A.3 – 1,107– HSBC Insurance (Asia-Pacific) Holdings Limited’s disposal of its shareholding in Bao Viet Holdings2 – 104– loss on sale of an HFC Bank UK secured loan portfolio – (146)– acquisitions, disposals and dilutions (41) 39
Currency translation – (18)
Year ended 31 December 127 1,403
Excluding the significant items and currency translation tabulated above, other operating income decreased by US$0.2bn compared with 2013. This was primarily from lower favourable movements in 2014 in present value of in-force (‘PVIF’) long-term insurance business, and lower disposal and revaluation gains on investment properties, mainly in Hong Kong. The decrease was partly offset by gains reported in Legacy Credit in GB&M in the UK as we actively managed the portfolio.
Lower favourable movements in the PVIF long-term insurance business asset in 2014 were mainly due to the following factors:
• a reduction in the value of new business, mainly in Brazil, due to higher interest rates and lower volumes; and
• adverse assumption changes and experience variances in 2014 compared with favourable movements in 2013. This was mainly driven by falling interest rates in France and adverse actuarial assumption updates in Hong Kong, partly offset by the favourable effects of interest rate fluctuations, mainly in Asia and Brazil.

HSBC HOLDINGS PLC
53
Str
ateg
ic R
epo
rt
Fi
nan
cial
Rev
iew
Co
rpo
rate
Go
vern
ance
Fin
anci
al S
tate
men
ts
S
har
eho
lder
Info
rmat
ion
Net insurance claims and benefits paid and movement in liabilities to policyholders 2014
US$m 2013
US$m 2012
US$m Net insurance claims and benefits paid and movement in liabilities to policyholders:
– gross 13,723 13,948 14,529– less reinsurers’ share (378) (256) (314)
Year ended 31 December24 13,345 13,692 14,215
For footnote, see page 109.
Reported net insurance claims and benefits paid and movement in liabilities to policyholders were US$347m lower than in 2013.
Movements in claims resulting from investment returns on the assets held to support policyholder contracts, where the policyholder bears investment risk, decreased. This reflected weaker equity market performance in the UK and France, partly offset by improved equity market performance in Hong Kong and higher net income on the
bonds portfolio in Brazil. The gains or losses recognised on the financial assets designated at fair value held to support these insurance and investment contract liabilities are reported in ‘Net income from financial instruments designated at fair value’.
Reductions in claims resulting from a decrease in new business written in Europe and Latin America were mostly offset by increases in Hong Kong as explained under ‘Net earned insurance premiums’.
Loan impairment charges and other credit risk provisions
2014US$m
2013 US$m
2012US$m
Loan impairment charges: – new allowances net of allowance releases 5,010 7,344 9,306– recoveries of amounts previously written off (955) (1,296) (1,146)
4,055 6,048 8,160
Individually assessed allowances 1,780 2,320 2,139Collectively assessed allowances 2,275 3,728 6,021
Impairment/(releases of impairment) on available-for-sale debt securities (319) (211) 99
Other credit risk provisions 115 12 52
Year ended 31 December 3,851 5,849 8,311
Impairment charges on loans and advances to customers as a percentage of average gross loans and advances to customers27 0.4% 0.7% 0.9%
For footnote, see page 109.
Reported loan impairment charges and other credit risk provisions (‘LICs’) of US$3.9bn were US$2.0bn lower than in 2013, primarily in North America, Europe and Latin America. The percentage of impairment charges to average gross loans and advances fell to 0.4% at 31 December 2014 from 0.7% at 31 December 2013.
Individually assessed charges decreased by US$540m, primarily in Europe, partly offset by an increase in Asia and the Middle East and North Africa. In Europe, they were lower, mainly in CMB in the UK, reflecting improved quality in the portfolio and the economic environment, as well as in GB&M. In Asia, the increase was on a small number of exposures in Hong Kong and in mainland China, primarily in CMB and GB&M, while in the Middle East and North Africa we recorded net charges compared with net releases in 2013, mainly due to lower releases on a particular UAE-related exposure in GB&M.
Collectively assessed charges declined by US$1.5bn, primarily due to decreases in North America and Latin America. In North America, the reduction was mainly in RBWM, reflecting reduced levels of delinquency and new impaired loans in the CML portfolio. A decrease in
lending balances from continued portfolio run-off and loan sales was partly offset by an increase relating to less favourable market value adjustments of underlying properties as improvements in housing market conditions were less pronounced in 2014 than in 2013. In Latin America, the reduction in collectively assessed charges was driven by the adverse effect of changes to the impairment model and assumption revisions for restructured loan portfolios in Brazil which occurred in 2013, both in RBWM and CMB. Charges were also lower due to reduced Business Banking provisions reflecting improved delinquency rates and the effect of the disposal of non-strategic businesses.
Net releases of credit risk provisions of US$204m were broadly unchanged, as higher releases on available-for-sale ABSs in GB&M in Europe were offset by provisions in Latin America and North America. In Latin America, a provision was made in Brazil against a guarantee in GB&M. In North America we recorded provisions in Canada, compared with releases in 2013, and in the US reflecting a deterioration in the underlying asset values of a specific GB&M exposure.

Report of the Directors: Financial summary (continued) Group performance by income and expense item
HSBC HOLDINGS PLC
54
Operating expenses 2014 2013 2012
US$m US$m US$mBy expense category Employee compensation and benefits 20,366 19,196 20,491 Premises and equipment (excluding depreciation and impairment) 4,204 4,183 4,326General and administrative expenses 14,361 12,882 15,657
Administrative expenses 38,931 36,261 40,474Depreciation and impairment of property, plant and equipment 1,382 1,364 1,484Amortisation and impairment of intangible assets 936 931 969
Year ended 31 December 41,249 38,556 42,927
Staff numbers (full-time equivalents) 2014 2013 2012Geographical regions Europe 69,363 68,334 70,061 Asia8 118,322 113,701 112,766Middle East and North Africa 8,305 8,618 8,765 North America 20,412 20,871 22,443 Latin America 41,201 42,542 46,556
At 31 December 257,603 254,066 260,591
For footnote, see page 109.
Reported operating expenses of US$41bn were US$2.7bn or 7% higher than in 2013. The increase in operating expenses was partly driven by the significant items noted in the table below, including settlements
and provisions in connection with foreign exchange investigations, of which US$809m was recorded in the fourth quarter of 2014 (see Note 40 on the Financial Statements for further details).
Significant items and currency translation 2014 2013 US$m US$mSignificant items Accounting gain arising from change in basis of delivering ill-health benefits in the UK – (430)Charge in relation to settlement agreement with Federal Housing Finance Authority 550 –Madoff-related litigation costs – 298Settlements and provisions in connection with foreign exchange investigations 1,187 –Regulatory provisions in GPB 65 352UK customer redress programmes 1,275 1,235US customer remediation provision relating to CRS – 100Restructuring and other related costs 278 483Acquisitions, disposals and dilutions 40 488
3,395 2,526Currency translation – 348
Year ended 31 December 3,395 2,874
Excluding significant items and currency translation, operating expenses were US$2.2bn or 6% higher than in 2013.
Regulatory Programmes and Compliance costs increased as a result of the continued focus on Global Standards and the broader regulatory reform programme being implemented by the industry to build the necessary infrastructure to meet today’s enhanced compliance standards, along with implementation costs to meet obligations such as stress tests in different jurisdictions and structural reform.
During 2014, we accelerated the deployment of Global Standards throughout the Group. Our global businesses and Compliance function have developed operating procedures to meet our new global AML and sanctions policies and these are now being implemented in every
country, encompassing local requirements as necessary. During 2014, we invested in developing our financial crime compliance expertise and building strategic infrastructure solutions for customer due diligence, transaction monitoring and sanctions screening.
We continued to invest in strategic initiatives in support of organically growing our business, primarily in CMB in both Asia, in Business Banking and Global Trade and Receivables Finance and, to a lesser extent, in Europe. We also increased expenditure on marketing and advertising to support revenue generating initiatives, primarily in RBWM's core propositions of Premier and Advance and personal lending products.

HSBC HOLDINGS PLC
55
Str
ateg
ic R
epo
rt
Fi
nan
cial
Rev
iew
Co
rpo
rate
Go
vern
ance
Fin
anci
al S
tate
men
ts
S
har
eho
lder
Info
rmat
ion
The increase in costs also reflected:
• inflationary pressures, including wage inflation, primarily in Asia and Latin America;
• the UK bank levy charge, which increased to US$1.1bn in 2014 from US$904m in 2013, mainly due to an increase in the rate of the levy. Both years also included adjustments relating to the previous year’s bank levy charge (2014: US$45m favourable adjustment; 2013: US$12m adverse adjustment); and
• the Financial Services Compensation Scheme levy in the UK, as a result of the timing of the recognition.
During 2014, we generated further sustainable savings of US$1.3bn, primarily driven by re-engineering our back office processes, which in part offset the investments and inflation noted above.
The average number of FTEs was broadly unchanged as reductions through sustainable savings programmes were broadly offset by the initiatives related to Regulatory Programmes and Compliance and business growth.
Reported cost efficiency ratios25
2014
% 2013
% 2012
%
HSBC 67.3 59.6 62.8
Geographical regions Europe 93.7 84.0 108.4 Asia8 44.0 40.7 39.4Middle East and North Africa 47.7 51.5 48.0 North America 78.9 72.9 60.8 Latin America 71.7 56.1 58.7
Global businesses Retail Banking and Wealth Management 71.2 64.5 58.4 Commercial Banking 45.9 43.1 45.9 Global Banking and Markets 67.7 51.9 54.2 Global Private Banking 74.8 91.4 67.6
For footnotes, see page 109.
Share of profit in associates and joint ventures 2014
US$m 2013
US$m 2012
US$m Associates
Bank of Communications Co., Limited 1,974 1,878 1,670Ping An Insurance (Group) Company of China, Ltd – – 763Industrial Bank Co., Limited – – 670The Saudi British Bank 455 403 346Other 64 5 72
Share of profit in associates 2,493 2,286 3,521 Share of profit in joint ventures 39 39 36
Year ended 31 December 2,532 2,325 3,557
HSBC’s reported share of profit in associates and joint ventures was US$2.5bn, an increase of US$207m or 9%, in part due to the non-recurrence of an impairment charge of US$106m on our banking associate in Vietnam in 2013. Excluding this, our share of profit in associates and joint ventures increased, driven by higher contributions from BoCom and The Saudi British Bank.
Our share of profit from BoCom rose as a result of balance sheet growth and increased trading income, partly offset by higher operating expenses and a rise in loan impairment charges.
At 31 December 2014, we performed an impairment review of our investment in BoCom and concluded that it was not impaired, based on our value in use calculation
(see Note 20 on the Financial Statements for further details).
In future periods, the value in use may increase or decrease depending on the effect of changes to model inputs. It is expected that the carrying amount will increase in 2015 due to retained profits earned by BoCom. At the point where the carrying amount exceeds the value in use, HSBC would continue to recognise its share of BoCom’s profit or loss, but the carrying amount would be reduced to equal the value in use, with a corresponding reduction in income, unless the market value has increased to a level above the carrying amount.
Profits from The Saudi British Bank rose, reflecting strong balance sheet growth.

Report of the Directors: Financial summary (continued) Group performance by income and expense item / Consolidated balance sheet
HSBC HOLDINGS PLC
56
Tax expense
2014
US$m 2013
US$m 2012
US$m
Profit before tax 18,680 22,565 20,649 Tax expense (3,975) (4,765) (5,315)
Profit after tax for the year ended 31 December 14,705 17,800 15,334
Effective tax rate 21.3% 21.1% 25.7% The effective tax rate for 2014 of 21.3% was lower than the blended UK corporation tax rate for the year of 21.5%. The effective tax rate in the year reflected the following recurring benefits: tax exempt income from government bonds and equities held by a number of Group entities and recognition of the Group’s share of post-tax profits of associates and joint ventures within our pre-tax income. In addition, the effective tax rate reflected a current tax credit for prior periods. This was partly offset by non-tax deductible settlements and provisions in connection with foreign exchange investigations.
The tax expense decreased by US$0.8bn to US$4.0bn for 2014, primarily due to a reduction in accounting profits and the benefit of the current tax credit for previous years.
In 2014, the tax borne and paid by the Group to the relevant tax authorities, including tax on profits, bank levy and employer-related taxes, was US$7.9bn (2013: US$8.6bn). The amount differs from the tax charge reported in the income statement due to indirect taxes such as VAT and the bank levy which are included in pre-tax profit, and the timing of payments. We also play a major role as tax collector for governments in the jurisdictions in which we operate. Such taxes include employee-related taxes and taxes withheld from payments to deposit holders. In 2014, we collected US$9.1bn (2013: US$8.8bn).

HSBC HOLDINGS PLC
57
Str
ateg
ic R
epo
rt
Fi
nan
cial
Rev
iew
Co
rpo
rate
Go
vern
ance
Fin
anci
al S
tate
men
ts
S
har
eho
lder
Info
rmat
ion
Consolidated balance sheet Five-year summary consolidated balance sheet 2014
US$m 2013
US$m 2012
US$m 2011
US$m 2010
US$m ASSETS Cash and balances at central banks 129,957 166,599 141,532 129,902 57,383Trading assets26 304,193 303,192 408,811 330,451 385,052Financial assets designated at fair value 29,037 38,430 33,582 30,856 37,011Derivatives 345,008 282,265 357,450 346,379 260,757Loans and advances to banks27 112,149 120,046 117,085 139,078 141,869Loans and advances to customers27,28 974,660 992,089 962,972 899,010 897,847Reverse repurchase agreements – non-trading26,27 161,713 179,690 70,112 83,328 126,921Financial investments 415,467 425,925 421,101 400,044 400,755Other assets 161,955 163,082 179,893 196,531 147,094
Total assets at 31 December 2,634,139 2,671,318 2,692,538 2,555,579 2,454,689 LIABILITIES AND EQUITY Liabilities Deposits by banks27 77,426 86,507 95,480 95,205 87,221Customer accounts27 1,350,642 1,361,297 1,311,396 1,223,140 1,190,763Repurchase agreements – non-trading26,27 107,432 164,220 40,567 48,402 60,325Trading liabilities26 190,572 207,025 304,563 265,192 300,703Financial liabilities designated at fair value 76,153 89,084 87,720 85,724 88,133Derivatives 340,669 274,284 358,886 345,380 258,665Debt securities in issue 95,947 104,080 119,461 131,013 145,401Liabilities under insurance contracts 73,861 74,181 68,195 61,259 58,609Other liabilities 121,459 120,181 123,141 134,171 109,954
Total liabilities at 31 December 2,434,161 2,480,859 2,509,409 2,389,486 2,299,774 Equity Total shareholders’ equity 190,447 181,871 175,242 158,725 147,667Non-controlling interests 9,531 8,588 7,887 7,368 7,248
Total equity at 31 December 199,978 190,459 183,129 166,093 154,915
Total liabilities and equity at 31 December 2,634,139 2,671,318 2,692,538 2,555,579 2,454,689
Five-year selected financial information 2014
US$m 2013
US$m 2012
US$m 2011
US$m 2010
US$m
Called up share capital 9,609 9,415 9,238 8,934 8,843Capital resources29,30 190,730 194,009 180,806 170,334 167,555Undated subordinated loan capital 2,773 2,777 2,778 2,779 2,781Preferred securities and dated subordinated loan capital31 47,208 48,114 48,260 49,438 54,421Risk-weighted assets29 1,219,765 1,092,653 1,123,943 1,209,514 1,103,113
Financial statistics Loans and advances to customers as a percentage of
customer accounts27 72.2 72.9 73.4 73.5 75.4 Average total shareholders’ equity to average total assets 7.01 6.55 6.16 5.64 5.53
Net asset value per ordinary share at year-end32 (US$) 9.28 9.27 9.09 8.48 7.94Number of US$0.50 ordinary shares in issue (millions) 19,218 18,830 18,476 17,868 17,686
Closing foreign exchange translation rates to US$: US$1: £ 0.642 0.605 0.619 0.646 0.644US$1: € 0.823 0.726 0.758 0.773 0.748
For footnotes, see page 109.
A more detailed consolidated balance sheet is contained in the Financial Statements on page 337.

Report of the Directors: Financial summary (continued) Consolidated balance sheet
HSBC HOLDINGS PLC
58
Movement in 2014
Total reported assets were US$2.6 trillion, 1% lower than at 31 December 2013. On a constant currency basis, total assets were US$85bn or 3% higher.
Our balance sheet remains strong with a ratio of customer advances to customer accounts of 72%. Although customer loans and customer accounts have fallen on a reported basis, both have increased on a constant currency basis, notably rising in Asia.
The following commentary is on a reported basis unless otherwise stated.
Assets
Cash and balances at central banks decreased by US$37bn, notably in Europe, in part reflecting net reductions in repurchase and reverse repurchase agreements.
Trading assets were broadly unchanged. Excluding adverse foreign exchange movements of US$18bn, trading assets grew, primarily from the holdings of debt securities in Asia to support GB&M’s Rates business. In Europe, trading assets were broadly unchanged as increased holdings of equity securities were broadly offset by reductions in several other asset classes.
Financial assets designated at fair value decreased by US$9bn, notably in Europe, largely from the transfer to ‘Assets held for sale’ of balances relating to the UK Pension business of HSBC Life (UK) Limited.
Derivative assets increased by 22%, notably in Europe relating to interest rate and foreign exchange derivative contracts reflecting market movements, including changes in yield curves and foreign exchange rates.
Loans and advances to customers marginally decreased by US$17bn or 2% including adverse foreign exchange movements of US$45bn. Excluding these movements, customer lending grew by US$28bn, or 3%, largely from growth in Asia of US$32bn and, to a lesser extent, in North America and Latin America. By contrast, balances decreased in Europe by US$15bn, as term lending growth in CMB and GB&M was more than offset by a fall in corporate overdraft balances relating to a small number of customers, as explained further below.
In Asia, term lending to CMB and GB&M customers grew, which included growth in commercial real estate and other property-related lending. Mortgage balances also increased, mainly in Hong Kong. In North America, the growth in balances was driven by increased term lending to corporate and commercial customers in CMB and GB&M, partly offset by a decline in RBWM from the continued reduction in the US run-off portfolio and the transfer to ‘Assets held for sale’ of US first lien mortgage balances. Balances also rose in Latin America, mainly in CMB in Brazil and GB&M in Mexico.
The fall in lending in Europe of US$15bn was driven by a reduction in corporate overdraft balances. In the UK, a small number of clients benefit from the use of net interest arrangements across their overdraft and deposit positions. During the year, as we aligned our approach in our Payments and Cash Management business to be more globally consistent, many of these clients increased the frequency with which they settled these balances, reducing their overdraft and deposit balances which fell by US$28bn. Other customer loans and advances increased by US$13bn, mainly in CMB and GB&M, driven by an increase in term lending to corporate and commercial customers, notably in the second half of the year.
Reverse repurchase agreements decreased by US$18bn, driven by a managed reduction in Europe as we reassessed the overall returns of these activities in light of new regulatory requirements. This decrease was partly offset by increases in Asia and North America.
Liabilities
Repurchase agreements decreased by US$57bn or 35%, driven by a decrease in Europe, notably in the UK and France, reflecting the managed reduction in reverse repurchase agreements in Europe as noted above.
Customer accounts decreased marginally by US$11bn, and included adverse foreign exchange movements of US$58bn. Excluding these movements, balances increased by US$47bn or 4%, with growth in all regions, notably Asia, of US$36bn. The increase in Asia reflected growth in our Payments and Cash Management business in CMB and GB&M, an increase in balances in Securities Services in GB&M and a rise in RBWM, in part reflecting successful deposit campaigns. In Europe, balances increased marginally despite a US$28bn fall in corporate current accounts, mainly in GB&M, in line with the fall in corporate overdraft balances, and a reduction in client deposits in GPB. These factors were more than offset by growth in CMB and, to a lesser extent, in GB&M as deposits from our Payments and Cash Management business increased together with a rise in RBWM balances reflecting customers’ continued preference for holding balances in current and savings accounts.
Trading liabilities fell by US$16bn including adverse foreign exchange movements of US$12bn. Excluding these, balances fell reflecting changes in client demand.
Financial liabilities designated at fair value reduced by US$13bn, mainly in Europe reflecting the transfer to ‘Liabilities held for sale’ of balances relating to the UK Pension business of HSBC Life (UK) Limited.
The increase in derivative liabilities was in line with that of ‘Derivative assets’ as the underlying risk is broadly matched.

HSBC HOLDINGS PLC
59
Str
ateg
ic R
epo
rt
Fi
nan
cial
Rev
iew
Co
rpo
rate
Go
vern
ance
Fin
anci
al S
tate
men
ts
S
har
eho
lder
Info
rmat
ion
Equity
Total shareholders’ equity rose by 5%, driven by profits generated in the year, which were partially offset by dividends paid. In addition, shareholders’ equity increased as we issued new contingent convertible securities of US$5.7bn during 2014. For further details
of these securities, see Note 35 on the Financial Statements. These movements were partly offset by a reduction of US$9bn in our foreign exchange reserve reflecting the notable appreciation in the US dollar against sterling and the euro, particularly in the second half of the year.
Reconciliation of consolidated reported and constant currency assets and liabilities 31 December 2014 compared with 31 December 2013
31 Dec 13 as reported
Currency translation adjustment33
31 Dec 13 at 31 Dec 14 exchange rates
31 Dec 14 as reported
Reported change
Constant currency change
US$m US$m US$m US$m % %
Cash and balances at central banks 166,599 (9,384) 157,215 129,957 (22) (17)Trading assets 303,192 (18,176) 285,016 304,193 7 Financial assets designated at fair value 38,430 (2,467) 35,963 29,037 (24) (19)Derivative assets 282,265 (16,582) 265,683 345,008 22 30 Loans and advances to banks27 120,046 (4,923) 115,123 112,149 (7) (3)Loans and advances to customers27 992,089 (45,494) 946,595 974,660 (2) 3 Reverse repurchase agreements –
non-trading26,27 179,690 (9,961) 169,729 161,713 (10) (5)Financial investments 425,925 (15,285) 410,640 415,467 (2) 1 Other assets 163,082 (385) 162,697 161,955 (1)
Total assets 2,671,318 (122,657) 2,548,661 2,634,139 (1) 3 Deposits by banks27 86,507 (3,317) 83,190 77,426 (10) (7)Customer accounts27 1,361,297 (57,673) 1,303,624 1,350,642 (1) 4 Repurchase agreements – non-trading26, 27 164,220 (7,730) 156,490 107,432 (35) (31)Trading liabilities 207,025 (12,208) 194,817 190,572 (8) (2)Financial liabilities designated at
fair value 89,084 (3,930) 85,154 76,153 (15) (11)Derivative liabilities 274,284 (16,214) 258,070 340,669 24 32 Debt securities in issue 104,080 (5,089) 98,991 95,947 (8) (3)Liabilities under insurance contracts 74,181 (4,447) 69,734 73,861 6 Other liabilities 120,181 (4,221) 115,960 121,459 1 5
Total liabilities 2,480,859 (114,829) 2,366,030 2,434,161 (2) 3
Total shareholders’ equity 181,871 (7,720) 174,151 190,447 5 9 Non-controlling interests 8,588 (108) 8,480 9,531 11 12
Total equity 190,459 (7,828) 182,631 199,978 5 9
Total liabilities and equity 2,671,318 (122,657) 2,548,661 2,634,139 (1) 3
For footnotes, see page 109.

Report of the Directors: Financial summary (continued) Consolidated balance sheet
HSBC HOLDINGS PLC
60
Combined view of lending and deposits26,27
2014 2013 Change US$m US$m %
Customers – amortised cost Loans and advances to customers 974,660 992,089 (2)Loans and advances to customers reported in ‘Assets held for sale’34 577 1,703 (66)Reverse repurchase agreements – non-trading 66,310 88,215 (25)
Combined customer lending 1,041,547 1,082,007 (4) Customer accounts 1,350,642 1,361,297 (1)Customer accounts reported in ‘Liabilities of disposal groups held for sale’ 145 2,187 (93)Repurchase agreements – non-trading 79,556 121,515 (35)
Combined customer deposits 1,430,343 1,484,999 (4) Banks – amortised cost Loans and advances to banks 112,149 120,046 (7)Reverse repurchase agreements – non-trading 95,403 91,475 4
Combined bank lending 207,552 211,521 (2) Deposits by banks 77,426 86,507 (10)Repurchase agreements – non-trading 27,876 42,705 (35)
Combined bank deposits 105,302 129,212 (19) Customers and banks – fair value Trading assets – reverse repos 1,297 10,120 (87)
– loans and advances to customers 908 7,180 (87)– loans and advances to banks 389 2,940 (87)
Trading liabilities – repos 3,798 17,421 (78)– customer accounts 898 9,611 (91)– deposits by banks 2,900 7,810 (63)
For footnotes, see page 109.
Financial investments 2014 2013
Equity
securities Debt
securities Total Equity
securities Debt
securities Total US$bn US$bn US$bn US$bn US$bn US$bn
Balance Sheet Management – 306.8 306.8 – 314.4 314.4Insurance entities – 48.5 48.5 – 46.4 46.4Structured entities 0.1 14.9 15.0 0.1 22.6 22.7Principal Investments 2.0 – 2.0 2.7 – 2.7Other 8.6 34.6 43.2 6.3 33.4 39.7
At 31 December 10.7 404.8 415.5 9.1 416.8 425.9

HSBC HOLDINGS PLC
61
Str
ateg
ic R
epo
rt
Fi
nan
cial
Rev
iew
Co
rpo
rate
Go
vern
ance
Fin
anci
al S
tate
men
ts
er
Info
rmat
ion
Customer accounts by country 2014
US$m 2013
US$m
Europe 545,959 581,933UK 439,313 462,796France35 40,750 45,149Germany 15,757 16,615 Switzerland 11,058 16,796 Turkey 7,856 7,795 Other 31,225 32,782
Asia8 577,491 548,483Hong Kong 389,094 365,905Australia 19,312 19,812 India 11,678 11,549 Indonesia 5,788 5,865 Mainland China 46,588 40,579 Malaysia 16,292 17,093Singapore 43,731 43,988 Taiwan 14,901 12,758 Other 30,107 30,934
Middle East and North Africa (excluding Saudi Arabia) 39,720 38,683 Egypt 7,663 7,401 UAE 19,771 18,433 Other 12,286 12,849
North America 138,884 140,809US 84,894 80,037Canada 43,871 47,872Other 10,119 12,900
Latin America 48,588 51,389Argentina 4,384 4,468 Brazil 23,204 23,999Mexico 18,360 21,529Other 2,640 1,393
At 31 December 1,350,642 1,361,297
For footnotes, see page 109.

Report of the Directors: Financial summary / Global businesses Reconciliation of RoRWA / Critical accounting estimates and judgements / Summary
HSBC HOLDINGS PLC
62
Reconciliation of RoRWA measures Performance Management During 2014, we targeted a return on average ordinary shareholders’ equity of 12%–15%. For internal management purposes we monitored global businesses and geographical regions by pre-tax return on RWAs, a metric which combines return on equity and regulatory capital efficiency objectives. We targeted a return on average risk-weighted assets of 2.2%-2.6% in 2014.
In addition to the return on average risk-weighted assets (‘RoRWA’) we measure our performance internally using the non-GAAP measure of adjusted RoRWA, which is adjusted profit before tax as a percentage of average risk-weighted assets adjusted for the effects of foreign
currency translation differences and the effects of significant items. Excluded from adjusted RoRWA are certain items which distort year-on-year performance as explained on page 40.
We also present the non-GAAP measure of adjusted RoRWA which is further adjusted for the effect of operations that are not regarded as contributing to the long-term performance of the Group. These include the run-off portfolios and the CRS business which was sold in 2012.
The CRS average RWAs in the table below represent the average of the associated operational risk RWAs that were not immediately released on disposal and have not already been adjusted as part of the adjusted RoRWA calculation. At the end of 2014, the residual CRS operational risk RWAs relating to the CRS portfolio were fully amortised.
Reconciliation of adjusted RoRWA (excluding run-off portfolios and Card and Retail Services) 2014 2013 Pre-tax
return Average
RWAs36 RoRWA36Pre-tax return
Average RWAs36 RoRWA36
US$m US$bn % US$m US$bn %
Reported 18,680 1,209 1.5 22,565 1,104 2.0
Adjusted37 22,829 1,207 1.9 22,981 1,071 2.1Run-off portfolios 870 115 0.8 443 121 0.4Legacy credit in GB&M 172 48 0.4 186 33 0.6US CML and other38 698 67 1.0 257 88 0.3
Card and Retail Services – – – – 4 –
Adjusted (excluding run-off portfolios and CRS) 21,959 1,092 2.0 22,538 946 2.4
Reconciliation of reported and adjusted average risk-weighted assets Year ended 31 December 2014 2013 Change US$bn US$bn %
Average reported RWAs36 1,209 1,104 9.5Currency translation adjustment33 – (8) Acquisitions, disposals and dilutions (2) (21) Other significant items – (4)
Average adjusted RWAs36 1,207 1,071 12.6
For footnotes, see page 109.
Critical accounting estimates and judgements The results of HSBC reflect the choice of accounting policies, assumptions and estimates that underlie the preparation of HSBC’s consolidated financial statements. The significant accounting policies, including the policies which include critical accounting estimates and judgements, are described in Note 1 and in the individual Notes on the Financial Statements. The accounting policies listed below are highlighted as they involve a high degree of judgement and estimation uncertainty and have a material impact on the financial statements:
• Impairment of loans and advances: Note 1(k) on page 349;
• Deferred tax assets: Note 8 on page 365;
• Valuation of financial instruments: Note 13 on page 378;
• Impairment of interests in associates: Note 20 on page 403;
• Goodwill impairment: Note 21 on page 407; and
• Provisions: Note 29 on page 420.
In view of the inherent uncertainties and the high level of subjectivity involved in the recognition or measurement of the items above, it is possible that the outcomes in the next financial year could differ from those on which management’s estimates are based, resulting in the recognition and measurement of materially different amounts from those estimated by management in the 2014 Financial Statements.

HSBC HOLDINGS PLC
63
Str
ateg
ic R
epo
rt
Fi
nan
cial
Rev
iew
Co
rpo
rate
Gov
ern
ance
Fin
anci
al S
tate
men
ts
S
har
eho
lder
Info
rmat
ion
Global businesses
Summary 63
Retail Banking and Wealth Management 64
Commercial Banking 67
Global Banking and Markets 70
Global Private Banking 72
Other 75
Analysis by global business 76
Summary HSBC reviews operating activity on a number of bases, including by geographical region and by global business.
The commentaries below present global businesses followed by geographical regions (page 78). Performance is discussed in this order because certain strategic themes, business initiatives and trends affect more than one geographical region. All commentaries are on an
adjusted basis (page 40) unless stated otherwise, while tables are on a reported basis unless stated otherwise.
Basis of preparation
The results of global businesses are presented in accordance with the accounting policies used in the preparation of HSBC’s consolidated financial statements. Our operations are closely integrated and, accordingly, the presentation of global business data includes internal allocations of certain items of income and expense. These allocations include the costs of certain support services and global functions, to the extent that these can be meaningfully attributed to operational business lines. While such allocations have been made on a systematic and consistent basis, they necessarily involve some subjectivity.
Where relevant, income and expense amounts presented include the results of inter-segment funding along with inter-company and inter-business line transactions. All such transactions are undertaken on arm’s length terms.
The expense of the UK bank levy is included in the Europe geographical region as HSBC regards the levy as a cost of being headquartered in the UK. For the purposes of the presentation by global business, the cost of the levy is included in ‘Other’.
Profit/(loss) before tax 2014 2013 2012 US$m % US$m % US$m %
Retail Banking and Wealth Management 5,651 30.3 6,649 29.5 9,575 46.4 Commercial Banking 8,744 46.8 8,441 37.4 8,535 41.3 Global Banking and Markets 5,889 31.5 9,441 41.8 8,520 41.3 Global Private Banking 626 3.4 193 0.9 1,009 4.9 Other39 (2,230) (12.0) (2,159) (9.6) (6,990) (33.9)
Year ended 31 December 18,680 100.0 22,565 100.0 20,649 100.0
Total assets40 2014 2013 US$m % US$m %
Retail Banking and Wealth Management 499,083 18.9 517,085 19.4Commercial Banking 372,739 14.2 360,623 13.5Global Banking and Markets 1,839,644 69.8 1,975,509 74.0Global Private Banking 88,342 3.4 97,655 3.7Other 164,537 6.2 171,812 6.4Intra-HSBC items (330,206) (12.5) (451,366) (17.0)
At 31 December 2,634,139 100.0 2,671,318 100.0
For footnotes, see page 109.
Risk-weighted assets 2014 2013 US$bn % US$bn %
Retail Banking and Wealth Management 205.1 16.8 233.5 21.4Commercial Banking 432.4 35.4 391.7 35.8Global Banking and Markets 516.1 42.3 422.3 38.6Global Private Banking 20.8 1.8 21.7 2.0Other 45.4 3.7 23.5 2.2
At 31 December 1,219.8 100.0 1,092.7 100.0
Principal Retail Banking and Wealth Management business
RBWM comprises the Principal RBWM business, the US run-off portfolio and the disposed-of US CRS business. We believe that looking at the Principal RBWM business allows management to more clearly discuss the cause of material changes from year-to-year in the ongoing
business and to assess the factors and trends in the business which are expected to have a material effect in future years. The reconciliation of RBWM to Principal RBWM is on page 64. Tables which reconcile reported to adjusted financial measures are available on www.hsbc.com.

Report of the Directors: Global businesses (continued) RBWM
HSBC HOLDINGS PLC
64
Retail Banking and Wealth Management RBWM provides banking and wealth management services for our personal customers to help them secure their future prosperity and realise their ambitions.
US Total US run-off Principal RBWM CRS portfolio RBWM US$m US$m US$m US$m2014
Net interest income 16,782 – 1,390 15,392Net fee income 6,668 – (4) 6,672Other income/
(expense)42 1,144 – (49) 1,193
Net operating income4 24,594 – 1,337 23,257
LICs43 (1,819) – (30) (1,789)
Net operating income 22,775 1,307 21,468Total operating
expenses (17,522) – (738) (16,784)
Operating profit 5,253 – 569 4,684Income from
associates44 398 – – 398
Profit before tax 5,651 – 569 5,082
RoRWA36 2.6% – 0.8% 3.3% 2013
Net interest income 18,339 – 2,061 16,278Net fee income 7,021 – 11 7,010Other income/
(expense)42
1,380 – (400) 1,780
Net operating income4 26,740 – 1,672 25,068
LICs43 (3,227) – (705) (2,522)
Net operating income 23,513 – 967 22,546Total operating
expenses
(17,248) – (1,166) (16,082)
Operating profit/(loss) 6,265 – (199) 6,464Income/(expense) from
associates44
384 – (1) 385
Profit/(loss) before tax 6,649 – (200) 6,849
RoRWA36 2.6% – (0.2%) 4.4% 2012
Net interest income 20,298 1,267 2,563 16,468Net fee income 7,205 395 33 6,777Other income/
(expense)42
6,358 3,155 (200) 3,403
Net operating income4 33,861 4,817 2,396 26,648
LICs43 (5,515) (322) (2,569) (2,624)
Net operating income/ (expense)
28,346 4,495 (173) 24,024
Total operating expenses
(19,769) (729) (1,103) (17,937)
Operating profit/(loss) 8,577 3,766 (1,276) 6,087Income from
associates44
998 – 2 996
Profit/(loss) before tax 9,575 3,766 (1,274) 7,083
RoRWA36 3.1% 14.7% (1.1%) 4.2%
For footnotes, see page 109.
Principal RBWM RoRWA
3.3%
Global mobile application downloads surpass
6 million
Best Mobile Banking Application 2014 (Global Finance Magazine)
Strategic direction
RBWM provides retail banking and wealth management services for personal customers in markets where we have, or can build, the scale in our target customer segments to do so cost effectively.
We focus on three strategic imperatives:
• building a consistent, high standard, customer needs-driven wealth management service for retail customers drawing on our Insurance and Asset Management businesses;
• using our global expertise to improve customer service and productivity to provide a high standard of banking solutions and service to our customers efficiently; and
• simplifying and re-shaping the RBWM portfolio of businesses to focus our capital and resources on key markets.
Our three growth priorities are customer growth in target segments, deepening customer relationships through wealth management and relationship-led lending, and enhancing distribution capabilities, including digital.
Implementing Global Standards, enhancing risk management control models and simplifying processes also remain top priorities for RBWM.
Review of reported performance
• On a reported basis, RBWM profit before tax reduced by US$1.0bn to US$5.7bn, while Principal RBWM profit before tax fell by US$1.8bn to US$5.1bn. The reduction in RBWM partly reflected the effects of significant items (see page 42) including provisions of US$568m arising from the ongoing review of compliance with the CCA in the UK, adverse movements in non-qualifying hedges of US$493m in 2014 compared with favourable movements of US$262m in 2013, UK customer redress provisions of US$992m compared with US$953m in 2013, and disposals.
• In the US run-off portfolio, a profit before tax was recorded compared with a loss in 2013. A reduction in revenue was more than offset by lower LICs reflecting decreased lending balances, reduced new impaired loans and lower delinquency levels. Operating expenses also fell, mainly from the non-recurrence of a customer remediation provision relating to our former CRS business and lower divestiture costs.

HSBC HOLDINGS PLC
65
Str
ateg
ic R
epo
rt
Fi
nan
cial
Rev
iew
Co
rpo
rate
Gov
ern
ance
Fin
anci
al S
tate
men
ts
S
har
eho
lder
Info
rmat
ion
Review of adjusted performance45
The commentary that follows reflects performance in our Principal RBWM46 business (see page 63).
Profit before tax (US$m)
• Profit before tax fell by US$0.7bn to US$6.9bn. Revenue was broadly unchanged, while lower LICs were more than offset by higher operating expenses.
Revenue (US$m)
• Revenue was broadly unchanged despite the effect of de-risking initiatives and against a backdrop of continued low interest rates and muted growth in certain key markets. Higher income from current accounts, savings and deposits was broadly offset by lower revenues from personal lending and wealth management products.
Principal RBWM: management view of adjusted revenue 2014 2013 US$m US$m
Current accounts, savings and deposits 5,839 5,606Wealth management products 6,201 6,263
– investment distribution47 3,456 3,568– life insurance manufacturing 1,603 1,602– asset management 1,142 1,093
Personal lending 11,300 11,455– mortgages 3,169 3,182– credit cards 4,339 4,310– other personal lending48 3,792 3,963
Other49 645 873
Net operating income4 23,985 24,197
For footnotes, see page 109.
• Revenue from current accounts, savings and deposits increased by 4%. This reflected an increase in customer account balances, of 4% compared with 2013, mainly in Hong Kong and the UK. In addition, higher revenue reflected increased spreads on savings products in the UK and, to a lesser extent, on deposits in mainland China where market interest rates increased.
• Revenue from wealth management products reduced by 1%. Investment distribution income declined, mainly as a result of lower fees in the UK, in part reflecting the Retail Distribution Review undertaken in 2013, and in Brazil reflecting a change in product mix. Life insurance manufacturing income was broadly unchanged. This reflected higher new business sales and investment income in Hong Kong, and a net favourable movement in the PVIF asset in Brazil, offset by a reduction in the PVIF asset in France where a fall in long-term yields increased the cost of guarantees on savings business.
• Personal lending revenue was down by 1%. While mortgage and credit card revenues were broadly unchanged, other personal lending income declined by 4%, notably in the UK due to the cessation of certain overdraft fees.
• LICs decreased by 22% with reductions across all regions, mainly in Brazil due to impairment model changes and assumption revisions for restructured loans in 2013 which were not repeated in 2014. LICs also reduced in the US and the UK, partly reflecting lower delinquency levels and reduced outstanding credit card and UK loan balances.
Operating expenses (US$m)
• Operating expenses increased by 7%, reflecting inflationary pressures, particularly in Latin America, in addition to higher costs associated with Regulatory Programmes and Compliance. The increase also reflected the timing of the recognition of the Financial Services Compensation Scheme levy in the UK and higher marketing costs across the regions. These factors were partly offset by sustainable cost savings of over US$200m.
5,082
6,8491,829 6,911799 7,648
2014 2013
Reported Currency translationand significant items
Adjusted profit
23,25725,068728 23,985
(871)
24,197
2014 2013
Reported Currency translationand significant items
Adjusted revenue
16,784 16,082
(1,099)
15,685
(1,441)
14,641
2014 2013
Reported Currency translationand significant items
Adjusted operating expenses

Report of the Directors: Global businesses (continued) RBWM / CMB
HSBC HOLDINGS PLC
66
Growth priorities
Focus on relationship-led personal lending to drive balance sheet growth
• In 2014, we continued to focus on improving the quality of our revenue through the ongoing implementation of de-risking initiatives, although these have weighed on income. They included the introduction of a new discretionary incentive framework for our Retail Banking customer-facing staff similar to the one launched for Wealth Management relationship managers (‘RM’s) in 2013, removing the formulaic link between product sales and variable pay for front line staff. We also continued to simplify our product range, improve our risk governance and align our practices following regulatory changes.
• We aim to deepen relationships with our existing customers and use personal lending to generate new business, targeting different segments and offerings in each market. To achieve this we continued to use improved analytics to support product decisions. Based on pricing and customer response measures, we enhanced revenue and grew balances in certain targeted segments, including the re-launch of the Advance segment in 17 markets in 2014. Lending and deposit balances and revenue per customer for Advance increased compared with 2013.
• We maintained discipline around growing lending within our risk appetite in our home and priority growth markets. Home loan average balances increased by 3% in 2014, reflecting growth in our priority markets, notably with double-digit growth in approximately half of these countries as we re-balanced the product mix towards secured loans, although this mix change translated into lower spreads. In our home markets, we continued to target growth in unsecured lending, with average balances marginally higher including an increase in average card balances in Hong Kong, partly offset by a reduction in the UK. Despite overall balance growth, LICs remained lower than in 2013.
• Customer recommendation levels improved in several markets during 2014, with the total volume of complaints related to products and services decreasing by more than 20% in the second half of the year, compared with the equivalent period in 2013. Further work is required and is ongoing to better meet our customer needs as they continue to evolve.
Continue to develop wealth management with a focus on growing customer balances
• We remain committed to capturing opportunities from wealth creation, primarily through our Premier offering with its customers generating nearly four times the average revenue of non-Premier clients.
• Although revenue from wealth management products remained lower than expected we continued to grow wealth balances, which comprise investment and insurance balances. These balances increased compared with 2013 across insurance, mutual funds and equities trading.
• In 2014, Global Asset Management continued its strategy of strengthening collaboration across the global businesses to serve their customers. This helped to attract US$29bn of net new money principally in fixed income and liquidity products, in particular with GB&M clients. The investment performance in over 74% of Global Asset Management’s eligible funds by value were above the market median.
• In 2014, we improved our RMs’ productivity through new training programmes and tools. Client contact and coverage rates increased from 2013 with higher numbers of client appointments, financial reviews and needs fulfilled per RM.
Develop digital capabilities to support customers and reduce cost
• We continue to develop our digital channels and streamline processes to improve the customer experience and to deliver cost savings through our distribution network.
• In 2014, downloads of our global mobile application, now with enriched functionality, were over 3m with the total number of downloads surpassing 6m. Global Finance magazine presented HSBC with the award for Best Mobile Banking App at its 2014 World’s Best Internet Bank event based on the application’s global reach and functionality.
• In addition, we launched our first straight-through on-line mortgage application service in the UK and, by the end of 2014, 14% of our annual approvals were produced online. We also deployed new Premier platforms, digital capabilities and tablet-based tools to enhance the end-to-end delivery process and customer experience. Across our priority growth markets, the revenue derived from digital channels increased by 18% compared with 2013.

HSBC HOLDINGS PLC
67
Str
ateg
ic R
epo
rt
Fi
nan
cial
Rev
iew
Co
rpo
rate
Gov
ern
ance
Fin
anci
al S
tate
men
ts
S
har
eho
lder
Info
rmat
ion
Commercial Banking CMB offers a full range of commercial financial services and tailored solutions to more than 2.5 million customers ranging from small and medium-sized enterprises to publicly quoted companies in almost 60 countries.
2014 2013 2012 US$m US$m US$m
Net interest income 10,506 10,200 10,361 Net fee income 4,738 4,717 4,470 Other income42 1,059 1,448 1,720
Net operating income4 16,303 16,365 16,551
LICs43 (1,675) (2,384) (2,099)
Net operating income 14,628 13,981 14,452
Total operating expenses (7,489) (7,049) (7,598)
Operating profit 7,139 6,932 6,854
Income from associates44 1,605 1,509 1,681
Profit before tax 8,744 8,441 8,535
RoRWA36 2.1% 2.2% 2.2%
Record reported profit before tax of
US$8.7bn
10% Growth in customer lending balances
(excluding the effect of currency translation)
Best Global Cash Management Bank for Corporates and Financial Institutions
for the third consecutive year (Euromoney 2014)
Strategic direction
CMB aims to be the banking partner of choice for our customers building on our rich heritage, international capabilities and relationships to enable global connectivity. We have four growth priorities: • providing consistency and efficiency for our customers
through a business model organised around global customer segments and products;
• utilising our distinctive geographical network to support and facilitate global trade and capital flows;
• delivering excellence in our core flow products – specifically in Trade and in Payments and Cash Management; and
• enhancing collaboration with other global businesses. Implementing Global Standards, enhancing risk management controls and simplifying processes also remain top priorities for CMB.
For footnotes, see page 109.
Review of reported performance
• In 2014, CMB reported a record profit before tax of US$8.7bn, 4% higher than in 2013. Reported profit before tax included the effect of a number of significant items (see page 42), notably the gain on sale of our operations in Panama of US$479m in 2013. The increase in reported profit before tax was also driven by a reduction in LICs, although this was partly offset by higher operating expenses.
Review of adjusted performance45
Profit before tax (US$m)
• Profit before tax grew by 13% to US$8.9bn. This was driven by increased revenue and a reduction in LICs, partly offset by a rise in operating expenses.
Revenue (US$m)
• Revenue grew by 5%, driven by Credit and Lending and Payments and Cash Management, notably in our home markets of Hong Kong and the UK. This was due to higher net interest income from growth in average lending and deposit balances in Hong Kong and rising average deposit balances and wider lending spreads in the UK. Higher net fee income was driven by an increase in term lending fees in the UK.
• Despite lending spread compression compared with 2013, spreads in 2014 stabilised and showed signs of recovery in certain markets. In addition, we saw notable growth in our UK lending balances in the second half of 2014.
8,744 8,441196 8,940
(531)
7,910
2014 2013
Reported Currency translationand significant items
Adjusted profit
16,303 16,3659 16,312
(886)
15,479
2014 2013
Reported Currency translationand significant items
Adjusted revenue

Report of the Directors: Global businesses (continued) CMB
HSBC HOLDINGS PLC
68
Management view of adjusted revenue 2014 2013 US$m US$m
Global Trade and Receivables Finance 2,680 2,625Credit and Lending 6,316 5,938Payments and Cash Management,
current accounts and savings deposits 5,018 4,709 Markets products, Insurance and
Investments and Other51 2,298 2,207
Net operating income4 16,312 15,479
For footnotes, see page 109.
The table above has been restated to reclassify Foreign Exchange revenue. In 2014, ‘Markets products, Insurance and Investments and Other’ included Foreign Exchange revenue of US$207m previously included within ‘Global Trade and Receivables Finance’ (2013: US$213m) and US$516m previously included within ‘Payments and Cash Management’ (2013: US$462m).
• Global Trade and Receivables Finance revenue increased by 2% compared with 2013. Average balances rose, with growth in Asia, Europe and Latin America. The effect was partly offset by spread compression in Latin America, reflecting a change in portfolio mix in Brazil. In 2014, spread compression stabilised and showed signs of recovery in certain markets.
• Credit and Lending revenue increased by 6% compared with 2013, reflecting higher average balances in Hong Kong and the US and, to a lesser extent, in Brazil. Revenue also increased in the UK due to wider lending spreads and increased fee income from term lending due to higher new business volumes. These factors were partly offset by spread compression in Latin America, primarily in Brazil as discussed above and in Mexico due to the repositioning of the business, and in mainland China.
• Payments and Cash Management revenue increased by 7% compared with 2013. This reflected strong deposit growth, notably in the UK and Hong Kong, along with an increase in high value payment transaction volumes. This was partly offset by spread compression, notably in Europe.
• Markets products, Insurance and Investments and Other revenue was 4% higher, primarily in North America. In Canada, this reflected the non-recurrence of a write-down of an investment property held for sale in 2013 and a gain on sale of an investment portfolio in 2014. In the US, higher revenue was driven by a gain on sale of a real estate portfolio.
• LICs decreased by US$663m, mainly in Europe and Latin America. Lower LICs in Europe reflected a reduction in individually assessed loan impairment charges in the UK. The reduction in Latin America was driven by lower individually assessed charges in Mexico, in particular relating to homebuilders, and lower collectively assessed impairments in Brazil due to impairment model changes and assumption revisions for restructured loans in the Business Banking portfolios in 2013 not repeated in 2014. These factors were partly offset by higher individually
assessed charges in Asia, notably in mainland China and Hong Kong.
Operating expenses (US$m)
• Operating expenses increased by 8%, principally in Europe, Latin America and Asia. In Europe and Asia, higher costs reflected increased investment in staff to support business growth and inflationary pressures, while in Latin America costs rose due to inflation which was largely attributable to union-agreed salary increases in Brazil and Argentina. In addition, operating expenses increased due to higher Regulatory Programmes and Compliance costs.
• Income from associates increased by 4% due to the improved performance of BoCom and The Saudi British Bank.
Growth priorities
Providing consistency through a globally led business model
• Our business strategy is built on the foundation of global scale and consistency, focusing on customer segments and customer behaviour to ensure we provide tailored products to suit their needs. We continue to invest in providing global product coverage for our business segments. This enables us to manage risk more efficiently.
• The creation of new senior management positions and a more defined global strategy within our customer segments enabled us to improve client coverage. In 2014, we appointed a new Global Head of International Subsidiary Banking to drive investment in supporting our international customers across our network. We also established dedicated RM teams for international subsidiary banking in key markets to focus on meeting the needs of these subsidiaries and growing the associated revenue streams.
• We appointed a new Global Head of Lending and Transaction Management with a remit to support all segments. This globally-aligned product group is designed to optimise capital allocation and improve revenue mix within our risk appetite.
• In 2014, we redefined our Large Corporate segment to focus on a smaller number of higher-value clients. The Large Corporate segment experienced strong
7,489 7,049
(189)
7,300
(284)
6,765
2014 2013
Reported Currency translationand significant items
Adjusted operating expenses

HSBC HOLDINGS PLC
69
Str
ateg
ic R
epo
rt
Fi
nan
cial
Rev
iew
Co
rpo
rate
Gov
ern
ance
Fin
anci
al S
tate
men
ts
S
har
eho
lder
Info
rmat
ion
growth in most markets fuelled by multi-country flow mandates and increased event-driven capital markets activity. The increased focus on ‘global wallet’ and connectivity led to increased awareness amongst our customers of our franchise and capabilities, resulting in stronger global strategic partnerships.
• In addition, we increased our market presence in six of our key MME markets (Hong Kong, the UK, Canada, the US, Mexico and Brazil). We made further progress by appointing regional and country heads of MME and by enhancing our client management system.
• In Business Banking, we invested in additional RMs in key markets, increased training worldwide and continued to deploy a globally consistent customer management system within our relationship-managed portfolios. Six major campaigns were launched in 2014 to help SME customers achieve their growth ambitions and expand overseas, including offering funds in the UK, France, the US, Canada, Australia and Turkey totalling US$18bn.
Utilising our geographical network to support our customers’ international growth ambitions
• HSBC’s network across the major global trade corridors continued to assist us to provide value-added solutions for our clients. For example, we helped one of the largest retailers in the US to improve its supply chain management by providing holistic financing and liquidity solutions including working capital, trade and supply chain finance.
• In Payments and Cash Management, CMB remained well positioned to benefit from global trends such as the increase in cross-border payment flows as we are strategically located where more than 85% of the world’s payment activity originates. For example, new customer mandates increased by 23% on 2013. In addition, we improved our digital offering, migrating
over 80,000 customers to date from legacy platforms to core electronic banking channels, and continued to develop innovative products. These included the enhancement of our Global Liquidity Solutions, which enables customers in mainland China to connect their operating cash with their liquidity structures globally.
Delivering excellence in our core products
• HSBC is one of the largest trade finance banks in the world with access to more than 85% of the world’s trade and capital flows. We continued to enhance our open account financing capabilities through investment in Receivables Finance and Supply Chain, specifically the launch of a new Supply Chain Solutions platform and the consolidation of the existing Receivables platform into regional hubs. This offers customers broader access to expertise and liquidity and gives us the ability to deploy our capabilities rapidly in new markets, providing better risk management and lower operating costs.
• Against the backdrop of declining commodity prices, we achieved double-digit asset balance growth in Commodity and Structured Trade Finance compared with 2013.
Enhancing collaboration with other global businesses
• We maintained our focus on strengthening CMB’s collaboration with GB&M and GPB by increasing product coverage across the Group to our customers. In 2014, CMB customers generated over 80% of HSBC’s total collaboration revenues. Revenue from collaboration remained broadly unchanged compared with 2013. This was driven by lower sales of Markets products to CMB customers, notably in the Foreign Exchange business, offset by growth in the sale of Capital Financing products with regard to mergers and acquisitions and debt capital markets.

Report of the Directors: Global businesses (continued) GB&M
HSBC HOLDINGS PLC
70
Global Banking and Markets GB&M provides tailored financial solutions to major government, corporate and institutional clients worldwide.
2014 2013 2012 US$m US$m US$m
Net interest income 7,022 6,766 6,960 Net fee income 3,560 3,482 3,329 Net trading income50 5,861 6,780 5,690 Other income42 1,335 2,148 2,294
Net operating income4 17,778 19,176 18,273
LICs43 (365) (207) (670)
Net operating income 17,413 18,969 17,603
Total operating expenses (12,028) (9,960) (9,907)
Operating profit 5,385 9,009 7,696
Income from associates44 504 432 824
Profit before tax 5,889 9,441 8,520
RoRWA36 1.2% 2.3% 2.1%
Client flows up in Equities, although subdued in Foreign Exchange
Sustained growth in revenues in Payments and Cash Management
Bond and Derivatives House of the year
(International Finance Review 2014)
Strategic direction GB&M’s business model and strategy is well established with the objective of being a ‘top 5’ bank to our priority clients and in our chosen products and geographies. We focus on the following growth priorities: • connecting clients to international growth opportunities; • continuing to be well positioned in products that will
benefit from global trends; and • leveraging our distinctive international expertise and
geographical network which connects developed and faster-growing regions.
Enhancing risk management controls, implementing Global Standards and collaborating with other global businesses also remain top priorities for GB&M.
For footnotes, see page 109.
Review of reported performance
• GB&M’s reported profit before tax of US$5.9bn was down by US$3.6bn, primarily in Europe and North America, from higher operating expenses and lower revenue. The increase in operating expenses and decrease in revenue reflected a number of significant items (see page 42). Operating expenses included settlements and provisions of US$1.2bn in connection with foreign exchange investigations, of which US$809m was recorded in the fourth quarter of 2014, and a charge of US$533m in the US relating to a settlement agreement with the Federal Housing Finance Agency, which are included in significant items.
Review of adjusted performance45
Profit before tax (US$m)
• Profit before tax of US$8.1bn was US$1.1bn lower than in 2013, driven by higher operating expenses and a fall in revenue, which included the introduction of the FFVA on certain derivative contracts that resulted in a charge of US$263m.
Revenue (US$m)
• Revenue was lower principally due to the effect of the FFVA and a reduction in our Foreign Exchange business which was partly offset by an increase in Capital Financing.
5,889
9,441
2,225 8,114(233)
9,208
2014 2013
Reported Currency translationand significant items
Adjusted profit
17,77819,176
328 18,106
(644)
18,532
2014 2013
Reported Currency translationand significant items
Adjusted revenue

HSBC HOLDINGS PLC
71
Str
ateg
ic R
epo
rt
Fi
nan
cial
Rev
iew
Co
rpo
rate
Gov
ern
ance
Fin
anci
al S
tate
men
ts
S
har
eho
lder
Info
rmat
ion
Management view of adjusted revenue
2014
US$m 2013
US$m
Markets52 6,262 6,933– Credit 567 801– Rates 1,563 1,678– Foreign Exchange 2,916 3,140– Equities 1,216 1,314
Capital Financing 4,066 3,981Payments and Cash Management 1,794 1,743Securities Services 1,698 1,653Global Trade and Receivables Finance 767 723Balance Sheet Management 3,020 3,046Principal Investments 531 450Other53 (32) 3
Total operating income4 18,106 18,532
For footnotes, see page 109.
• The table below outlines the effect on businesses and total adjusted operating income of the FFVA:
Effect of FFVA on total operating income
2014
US$m 2013
US$m
Total operating income 18,106 18,532– FFVA in Rates (164) –– FFVA in Credit (97) –– FFVA in other businesses (2) –
Total operating income excluding FFVA 18,369 18,532– of which Rates excluding FFVA 1,727 1,678– of which Credit excluding FFVA 664 801
• Excluding the above, revenue in the majority of our Markets businesses was lower. This was predominantly driven by a decline in our Foreign Exchange business, which was affected by lower volatility, notably in the first half of 2014, and reduced client flows. Credit revenue also decreased due to adverse movements in credit spreads and a reduction in Legacy Credit. Equities revenue fell too, as 2013 benefited from higher revaluation gains which more than offset a rise in revenue from increased client flows and higher derivatives income in 2014. By contrast, Rates revenue rose due to favourable market movements, notably in Asia, along with minimal fair value movements on our own credit spread on structured liabilities compared with adverse movements in 2013. These factors were partly offset by a fall in Rates revenue in Europe.
• In Capital Financing, revenue grew by US$85m, as the effects of increased volumes and market share gains across our advisory, equity capital markets and lending products were partly offset by spread and fee compression.
• Payments and Cash Management revenue was marginally higher, due to both increased deposit balances, notably in Asia, and a rise in high value transaction volumes, partly offset by spread compression. We also experienced growth in Securities Services revenue, in part from new business in Europe, and Global Trade and Receivables Finance from growth in lending balances.
• LICs were higher due to a revision to certain estimates used in our corporate collective loan impairment calculation and increased individually assessed provisions, including a provision against a guarantee in Brazil recorded as a credit risk provision. These were partially offset by higher net releases on available-for-sale ABSs in our legacy portfolio than in 2013.
Operating expenses (US$m)
• Operating expenses increased by 6%, primarily due to higher Regulatory Programmes and Compliance related costs and from increased staff costs. These factors were partially offset by sustainable savings of over US$80m.
Growth priorities
Connecting clients to international growth opportunities
• Following the re-shaping of GB&M in 2013, as part of which we brought together all our financing businesses into Capital Financing, including lending, debt capital markets and equity capital markets, we continued to focus on better aligning our resources with clients’ needs. We segmented our client base and created a Client Strategy Group to ensure that GB&M’s product, sector and coverage expertise supports clients in the growth of their business activities. Strong collaboration between these teams was recently demonstrated by our appointment as the joint global coordinator and joint book runner on the largest European corporate equity rights issue since 2011. This was our fifth transaction with this client in the last 12 months.
• We are utilising our global network to provide solutions for our clients in both established markets and faster-growing regions. Our ability to connect clients to opportunities was highlighted by the first Sukuk bond issued outside the Islamic world on which we acted as sole structuring advisor, joint lead manager and joint book runner.
• We continued to strengthen our Foreign Exchange franchise by enhancing our risk management capabilities and further developing our distribution platforms and electronic pricing capabilities. This will improve our systems and governance whilst enabling us to better serve clients with a robust and efficient offering.
12,028
9,960
(1,897)
10,131
(398)
9,562
2014 2013
Reported Currency translationand significant items
Adjusted operating expenses

Report of the Directors: Global businesses (continued) GB&M/GPB
HSBC HOLDINGS PLC
72
Continuing to be well positioned in products that will benefit from global trends
• Capturing new opportunities arising from the internationalisation of the renminbi continues to be one of our key growth priorities. Recently, we acted as joint lead manager, book runner and financial advisor on a pioneering Formosa bond issue, which simultaneously listed on three exchanges worldwide. We were also voted ‘Best Overall for Products and Services’ by Asiamoney Offshore RMB Services Survey 2014 for the third consecutive year, demonstrating our continued leading position in the overseas renminbi market.
• In November 2014 we launched the Stock Connect programme, a mechanism linking trading and clearing between the Shanghai and Hong Kong securities markets. This will give our clients direct access to the Chinese A-share market and the ability to fund equity purchases in renminbi.
• Geographical expansion of large corporates and rising world trade are expected to increase the demand for cross-border payments and related services. Our strength in Payments and Cash Management was recognised by Euromoney, who named HSBC the ‘Best Global Cash Manager for Non-financial Institutions’ and ‘Best Global Cash Manager for Corporate and Financial Institutions’, for the second and third consecutive years, respectively. We were also able to win a mandate for renminbi cash management and additional foreign exchange and deposit business from a global automotive group which is seeking to expand into mainland China.
Leveraging our distinctive international expertise and geographical network which connects developed and faster-growing regions
• Our distinctive geographical network and global expertise allows us to provide a truly international service to our clients. We recently demonstrated the value of our global capital markets capabilities and leading position in faster-growing markets to a European automotive group. We advised and acted as joint sub-underwriter on a domestic securitisation in mainland China which was structured to attract both international and domestic investors. We were the first foreign bank to advise on the structuring of an internationally rated ABS transaction in mainland China.
• GB&M continues to focus on collaborating with other global businesses and supporting clients in accessing a range of products across our Markets and Capital Financing businesses. In 2014, collaboration revenue between GB&M and CMB was broadly unchanged, driven by a reduction in Foreign Exchange which was offset by growth in Capital Financing, notably in advisory.
Global Private Banking
GPB serves high net worth individuals and families with complex and international needs within the Group’s priority markets.
2014 2013 2012
US$m US$m US$m
Net interest income 994 1,146 1,294 Net fee income 1,056 1,150 1,232 Other income42 327 143 646
Net operating income4 2,377 2,439 3,172
LICs43 8 (31) (27)
Net operating income 2,385 2,408 3,145
Total operating expenses (1,778) (2,229) (2,143)
Operating profit 607 179 1,002
Income from associates44 19 14 7
Profit before tax 626 193 1,009
RoRWA36 2.9% 0.9% 4.6%
Positive net new money of
US$14bn in areas targeted for growth
since December 2013
Performance continued to be affected by actions taken to reposition the customer
base
Best Family Office Offering (Private Banker International Global Wealth Awards)
Strategic direction
GPB aims to build on HSBC’s commercial banking heritage to be the leading private bank for high net worth business owners by:• capturing growth opportunities in home and priority growth
markets, particularly from intra-Group collaboration by accessing owners and principals of CMB and GB&M clients; and
• repositioning the business to concentrate on onshore markets and a smaller number of target offshore markets, aligned with Group priorities.
Implementing Global Standards, enhancing risk management controls, tax transparency and simplifying processes also remain top priorities for GPB.
For footnotes, see page 109.

HSBC HOLDINGS PLC
73
Str
ateg
ic R
epo
rt
Fi
nan
cial
Rev
iew
Co
rpo
rate
Gov
ern
ance
Fin
anci
al S
tate
men
ts
S
har
eho
lder
Info
rmat
ion
Review of reported performance
• Reported profit before tax of US$626m was US$433m higher than in 2013. This was due to a small number of significant items (see page 42), most notably in 2013 from the loss on write-off of allocated goodwill relating to our Monaco business of US$279m and regulatory provisions of US$352m.
• We expect our GPB results in 2015 to be affected by the reduction in our client assets as we continue to reposition our business model, including reducing the number of clients in non-priority markets.
Review of adjusted performance45
Profit before tax (US$m)
• Profit before tax fell by US$162m to US$738m, mainly due to reduced revenue as we continued to reposition the business, partly offset by lower operating expenses and LICs.
Revenue (US$m)
• Revenue decreased by 11% compared with 2013, due to lower trading income and net fee income reflecting a managed reduction in client assets and lower market volatility. Net interest income also declined, mainly in Europe and Asia, driven by a reduction in deposit balances and lower treasury income, respectively, both reflecting actions to reposition the business. In addition, lending spreads narrowed compared with 2013.
• Net loan impairment releases in 2014 compared with charges of US$33m in 2013, largely due to releases of collective impairment allowances in the UK and in the US.
Operating expenses (US$m)
• Operating expenses decreased by 5%, primarily due to the release of a UK customer redress provision recognised in 2012, the non-recurrence of the UK provision relating to a bilateral Rubik tax agreement between the UK and Swiss governments, and the managed reduction in staff numbers.
Reported client assets54
2014 2013US$bn US$bn
At 1 January 382 398Net new money (3) (26)Of which: areas targeted for growth 14 (7)
Value change 8 12Disposals (11) (3)Exchange and other (11) 1
At 31 December 365 382
Reported client assets by geography 2014 2013 US$bn US$bn
Europe 179 197Asia 112 108North America 63 65Latin America 11 12
At 31 December 365 382
For footnote, see page 109.
• On a reported basis, client assets, which include funds under management and cash deposits, decreased, mainly in Europe, due to the effect of the sale of a portfolio of clients in Switzerland, the disposal of our HSBC Trinkaus & Burkhardt AG business in Luxembourg and negative net new money. In addition there were unfavourable foreign exchange movements, mainly in Europe. This was partly offset by favourable market movements. Negative net new money of US$3bn was mainly driven by the continued repositioning of our business, though we attracted positive net new money of US$14bn in areas that we have targeted for growth, including our home and priority growth markets and the high net worth client segment.
626
193
112 738
707 900
2014 2013
Reported Currency translationand significant items
Adjusted profit
2,377 2,43941 2,418286 2,725
2014 2013
Reported Currency translationand significant items
Adjusted revenue
1,778
2,229
(71)
1,707(423)
1,806
2014 2013
Reported Currency translationand significant items
Adjusted operating expenses

Report of the Directors: Global businesses (continued) GPB /Other
HSBC HOLDINGS PLC
74
• On a reported basis, our return on assets, defined as the percentage of revenue to average client assets, was 63bps in 2014, broadly unchanged compared with 2013. On an adjusted basis, our return on assets was 6bps lower in 2014, reflecting the effect of the repositioning and reduced market volatility. Our client return on assets, which excludes treasury and capital revenue, also decreased by 4bps.
• In January 2015, the Swiss National Bank removed its currency cap with the euro which resulted in the appreciation of the Swiss franc. We monitor the impact of foreign exchange rate fluctuations on a continuing basis and do not expect any significant effect on the reported results of our GPB business.
Strategic direction
Capture growth in our home and priority growth markets and focus on collaboration revenues
• In 2014, new referrals from other global businesses generated net new money of over US$10bn, which was US$5.5bn higher than in 2013. In total, 74% of our net new money from areas targeted for growth in 2014 came from Group-referred clients, helped by adopting a more coordinated and systematic approach to identifying client needs in conjunction with the other global businesses.
• We integrated our collaboration efforts with GB&M and CMB into one team, the Corporate Client Group (‘CCG’). This was established to improve client introductions to and from GPB by standardising best practices and developing tailored offerings to meet client needs more effectively. The CCG is also responsible for enhancing coverage of existing personal and corporate relationships through a coordinated approach. In addition, the Global Solutions Group was established to deliver bespoke solutions to ultra-high net worth and global priority clients. This involves working closely with GB&M and CMB to enhance the service we offer to these sophisticated clients.
• We also established the Wealth Client Group with responsibility for ensuring greater alignment and increased collaboration with RBWM, including utilising RBWM’s transactional banking capabilities.
• To support client growth, we expanded our product offering with investment opportunities in three new Alternatives products, comprising one private equity fund and two real estate funds. We strengthened our investment group by ensuring that the majority of
clients with assets greater than US$5m now have access to a dedicated investment counsellor. We partnered with the GB&M Global Research team to improve the advisory services for our clients supported by easy client access to a wider range of investment research reports. We plan to deploy this globally by the end of 2015. We also worked closely with HSBC Securities Services to provide our ultra-high net worth and family office clients with access to our institutional global custody platform in Europe and the Middle East and North Africa, providing clients with access to trade capture, clearing and settlement, safekeeping and investment administration services.
Repositioning the business
• We continued to reposition the GPB business model and client base in 2014 by reviewing our portfolio and seeking to ensure that all clients comply with our Global Standards, including financial crime compliance and tax transparency standards.
• We remain focused on clients with wider Group connectivity within our home and priority growth markets. Following the announcement of the sale of a portfolio of clients in Switzerland to LGT Bank (Switzerland) Ltd earlier this year, we completed the migration of US$8bn of client assets in the second half of 2014. We also continued to reduce the number of clients in non-priority markets.
• In 2014, we continued to streamline and rationalise the business, closing a number of non-strategic representative offices, and we announced the consolidation of our trust business in Europe into a regional hub in Jersey. We also commenced development of a new global IT banking platform. This is expected to deliver improved efficiency, enhanced services and a consistent client offering by consolidating GPB’s multiple systems onto a single banking platform. We remain on track to deliver the first phase of the implementation in 2015.
• We enhanced our digital capabilities with the deployment of a new mobile application in Switzerland, Monaco, Luxembourg and Guernsey, enabling clients to view their investment holdings and transactions while on the move. We introduced a secure tablet application for front office staff in Switzerland delivering digital document browsing during client visits, and also deployed video meeting capabilities in the US. Wider deployment of these and other applications is scheduled for 2015.

HSBC HOLDINGS PLC
75
Str
ateg
ic R
epo
rt
Fi
nan
cial
Rev
iew
Co
rpo
rate
Gov
ern
ance
Fin
anci
al S
tate
men
ts
S
har
eho
lder
Info
rmat
ion
Other39 ‘Other’ contains the results of HSBC’s holding company and financing operations, central support and functional costs with associated recoveries, unallocated investment activities, centrally held investment companies, certain property transactions and movements in fair value of own debt. 2014 2013 2012 US$m US$m US$m
Net interest expense (501) (737) (730)Net fee income/
(expense) (65) 64 194 Net trading income/
(expense)50 (92) 6 (537)
Changes in fair value of long-term debt issued and related derivatives 508 (1,228) (4,327)
Changes in other financial instruments designated at fair value (9) (576) (1,136)
Net income/(expense) from financial instruments designated at fair value 499 (1,804) (5,463)
Other income 6,524 8,122 8,868
Net operating income4 6,365 5,651 2,332
LICs43 –
Net operating income 6,365 5,651 2,332
Total operating expenses (8,601) (7,796) (9,369)
Operating loss (2,236) (2,145) (7,037)
Income/(expense) from associates44 6 (14) 47
Loss before tax (2,230) (2,159) (6,990)
For footnotes, see page 109.
Review of reported performance
Reported loss before tax of US$2.2bn was 3% higher than in 2013. This was driven by increased operating costs partly offset by higher revenue.
The increase in loss before tax of US$71m included favourable movements in the fair value of own debt of US$417m in 2014 compared with adverse movements of US$1.2bn in 2013. These results also included the following items in 2013:
• gain on derecognition of Industrial Bank as an associate (US$1.1bn);
• net gain on disposal of Ping An Insurance (Group) Company of China, Ltd (‘Ping An’) (US$553m); and
• foreign exchange gains relating to sterling debt issued by HSBC Holdings (US$442m);
and the following items in 2014: • gain on sale of our shareholding in Bank of Shanghai
in 2014 (US$428m); and • an impairment on our investment in Industrial Bank
(US$271m). For further details of all significant items, see page 42.
Review of adjusted performance45
Loss before tax (US$m)
• The loss before tax decreased, reflecting increased revenue partly offset by higher operating costs.
Revenue (US$m)
• Revenue rose by US$1.3bn, primarily due to favourable movements in 2014 of US$96m on interest and exchange rate ineffectiveness in the hedging of long-term debt designated at fair value issued principally by HSBC Holdings and its European subsidiaries, compared with adverse movements of US$551m in 2013. In addition, recoveries of certain expenses from global businesses increased, reflecting higher operating expenses, and we recorded a gain arising from the external hedging of an intra-Group financing transaction in Europe. There was also a release of accrued interest on uncertain tax reserves in the US. These factors were partly offset by the expiry of the TSAs relating to the sale of the CRS business in the US and lower income from investment properties in Asia.
Operating expenses (US$m)
(2,230) (2,159)(381) (2,611)
(837) (2,996)
2014 2013
Reported Currency translationand significant items
Adjusted loss
6,3655,651
(501)
5,864
(1,119)
4,532
2014 2013
Reported Currency translationand significant items
Adjusted revenue
8,6017,796
(120)8,481
(261)
7,535
2014 2013
Reported Currency translationand significant items
Adjusted operating expenses

Report of the Directors: Global businesses (continued) Analysis
HSBC HOLDINGS PLC
76
• Operating expenses increased by US$946m due to higher costs associated with Regulatory Programmes and Compliance, an increase in Global Resourcing costs in India and mainland China and the 2013 release of a litigation provision in Asia. In addition, the UK bank levy charge of US$1.1bn in 2014 was
higher than the charge of US$916m in 2013, primarily due to an increase in the rate of the levy. This was partly offset by a reduction in North America by the expiry of the TSAs relating to the sale of the CRS business.
Analysis by global business HSBC profit/(loss) before tax and balance sheet data 2014
Retail Banking
and Wealth Management
US$m
CommercialBanking
US$m
GlobalBanking and
MarketsUS$m
GlobalPrivate
BankingUS$m
Other39
US$m
Inter- segment
elimination55
US$m Total
US$m Profit/(loss) before tax
Net interest income/(expense) 16,782 10,506 7,022 994 (501) (98) 34,705
Net fee income/(expense) 6,668 4,738 3,560 1,056 (65) 15,957
Trading income/(expense) excludingnet interest income
(28) 620 4,063 298 (100) 4,853
Net interest income/(expense) on trading activities
9 (2) 1,798 (4) 8 98 1,907
Net trading income/(expense)50 (19) 618 5,861 294 (92) 98 6,760
Changes in fair value of long- term debt issued and related derivatives
508 508 Net income/(expense) from other
financial instruments designated at fair value
1,675 288 12 (1) (9) 1,965
Net income/(expense) from financial instruments designated at fair value
1,675 288 12 (1) 499 2,473 Gains less losses from financial
investments
14 31 1,117 9 164 1,335 Dividend income 24 18 80 5 184 311Net insurance premium income 10,570 1,296 5 50 11,921Other operating income 719 248 124 33 6,176 (6,169) 1,131
Total operating income 36,433 17,743 17,781 2,440 6,365 (6,169) 74,593
Net insurance claims56 (11,839) (1,440) (3) (63) (13,345)
Net operating income4 24,594 16,303 17,778 2,377 6,365 (6,169) 61,248
Loan impairment (charges)/ recoveries and other credit risk provisions
(1,819) (1,675) (365) 8 (3,851)
Net operating income 22,775 14,628 17,413 2,385 6,365 (6,169) 57,397
Employee expenses57 (5,038) (2,439) (3,655) (732) (8,502) (20,366)Other operating expenses (12,484) (5,050) (8,373) (1,046) (99) 6,169 (20,883)
Total operating expenses (17,522) (7,489) (12,028) (1,778) (8,601) 6,169 (41,249)
Operating profit/(loss) 5,253 7,139 5,385 607 (2,236) 16,148
Share of profit in associates and joint ventures
398 1,605 504 19 6 2,532
Profit/(loss) before tax 5,651 8,744 5,889 626 (2,230) 18,680
% % % % % %
Share of HSBC’s profit before tax 30.3 46.8 31.5 3.4 (12.0) 100.0Cost efficiency ratio 71.2 45.9 67.7 74.8 135.1 67.3 Balance sheet data40 US$m US$m US$m US$m US$m US$mLoans and advances to customers
(net)27
359,744 313,999 254,463 44,102 2,352 974,660 Total assets 499,083 372,739 1,839,644 88,342 164,537 (330,206) 2,634,139Customer accounts27 581,421 363,654 319,121 85,465 981 1,350,642

HSBC HOLDINGS PLC
77
Str
ateg
ic R
epo
rt
Fi
nan
cial
Rev
iew
Co
rpo
rate
Go
vern
ance
Fin
anci
al S
tate
men
ts
S
har
eho
lder
Info
rmat
ion
2013
Retail Bankingand Wealth
ManagementUS$m
CommercialBanking
US$m
GlobalBanking and
MarketsUS$m
GlobalPrivate
BankingUS$m
Other39 US$m
Inter- segment
elimination55
US$m Total
US$m Profit/(loss) before tax
Net interest income/(expense) 18,339 10,200 6,766 1,146 (737) (175) 35,539
Net fee income 7,021 4,717 3,482 1,150 64 16,434
Trading income/(expense) excludingnet interest income
689 649 4,953 390 (38) 6,643
Net interest income/(expense) on trading activities
(3) 1,827 4 44 175 2,047
Net trading income50 686 649 6,780 394 6 175 8,690
Changes in fair value of long-term debt issued and related derivatives
– – – (1,228) – (1,228)Net income/(expense) from other
financial instruments designated at fair value
1,638 332 599 4 (576) (1) 1,996
Net income/(expense) from financial instruments designated at fair value
1,638 332 599 4 (1,804) (1) 768 Gains less losses from financial
investments
55 1 747 (3) 1,212 2,012 Dividend income 21 15 129 8 149 322Net insurance premium income 10,543 1,375 6 16 11,940Other operating income/(expense) 544 621 670 (239) 6,761 (5,725) 2,632
Total operating income 38,847 17,910 19,179 2,476 5,651 (5,726) 78,337
Net insurance claims56 (12,107) (1,545) (3) (37) (13,692)
Net operating income4 26,740 16,365 19,176 2,439 5,651 (5,726) 64,645
Loan impairment charges and other credit risk provisions
(3,227) (2,384) (207) (31) (5,849)
Net operating income 23,513 13,981 18,969 2,408 5,651 (5,726) 58,796
Employee expenses57 (5,219) (2,327) (3,549) (776) (7,325) (19,196)Other operating expenses (12,029) (4,722) (6,411) (1,453) (471) 5,726 (19,360)
Total operating expenses (17,248) (7,049) (9,960) (2,229) (7,796) 5,726 (38,556)
Operating profit/(loss) 6,265 6,932 9,009 179 (2,145) 20,240
Share of profit/(loss) in associates and joint ventures
384 1,509 432 14 (14) 2,325
Profit/(loss) before tax 6,649 8,441 9,441 193 (2,159) 22,565 % % % % % %
Share of HSBC’s profit before tax 29.5 37.4 41.8 0.9 (9.6) 100.0Cost efficiency ratio 64.5 43.1 51.9 91.4 138.0 59.6 Balance sheet data40 US$m US$m US$m US$m US$m US$mLoans and advances to customers
(net)27
375,086 297,852 272,473 44,224 2,454 992,089 Total assets 517,085 360,623 1,975,509 97,655 171,812 (451,366) 2,671,318Customer accounts27 579,994 354,298 328,800 96,770 1,435 1,361,297
For footnotes, see page 109.

Report of the Directors: Geographical regions Summary / Europe
HSBC HOLDINGS PLC
78
Geographical regions Summary 78
Europe 79
Asia 84
Middle East and North Africa 91
North America 96
Latin America 101
Summary Additional information on results in 2014 may be found in the ‘Financial Summary’ on pages 40 to 62.
In the analysis of profit and loss by geographical regions that follows, operating income and operating expenses include intra-HSBC items of US$2,972m (2013: US$2,628m; 2012: US$2,684m).
From 1 January 2014, the geographical region ‘Asia’ replaced the geographical regions previously reported as ‘Hong Kong’ and ‘Rest of Asia-Pacific’. This aligns with changes made in the financial information used internally to manage the business. Comparative data have been represented accordingly.
All commentaries are on an adjusted basis (page 40) unless otherwise stated, while tables are on a reported basis unless otherwise stated.
Profit/(loss) before tax 2014 2013 2012 US$m % US$m % US$m %
Europe 596 3.2 1,825 8.1 (3,414) (16.5)Asia8 14,625 78.3 15,853 70.3 18,030 87.3Middle East and North Africa 1,826 9.8 1,694 7.5 1,350 6.5North America 1,417 7.6 1,221 5.4 2,299 11.1Latin America 216 1.1 1,972 8.7 2,384 11.6
Year ended 31 December 18,680 100.0 22,565 100.0 20,649 100.0
Total assets40 2014 2013 US$m % US$m %
Europe 1,290,926 49.0 1,392,959 52.1Asia8 878,723 33.4 831,791 31.1Middle East and North Africa 62,417 2.4 60,810 2.3North America 436,859 16.6 432,035 16.2Latin America 115,354 4.4 113,999 4.3Intra-HSBC items (150,140) (5.8) (160,276) (6.0)
At 31 December 2,634,139 100.0 2,671,318 100.0
Risk-weighted assets58 2014 2013 US$bn % US$bn %
At 31 December 1,219.8 100.0 1,092.7 100.0
Europe 375.4 30.1 300.1 27.1Asia8 499.8 40.0 430.7 38.9Middle East and North Africa 63.0 5.0 62.5 5.7North America 221.4 17.8 223.8 20.2Latin America 88.8 7.1 89.5 8.1
For footnotes, see page 109.

HSBC HOLDINGS PLC
79
Str
ateg
ic R
epo
rt
Fi
nan
cial
Rev
iew
Co
rpo
rate
Go
vern
ance
Fin
anci
al S
tate
men
ts
S
har
eho
lder
Info
rmat
ion
Europe Our principal banking operations in Europe are HSBC Bank plc in the UK, HSBC France, HSBC Bank A.S. in Turkey, HSBC Private Bank (Suisse) SA and HSBC Trinkaus & Burkhardt AG. Through these subsidiaries we provide a wide range of banking, treasury and financial services to personal, commercial and corporate customers across Europe.
2014 2013 2012 US$m US$m US$m
Net interest income 10,611 10,693 10,394 Net fee income 6,042 6,032 6,169 Net trading income 2,534 4,423 2,707 Other income/(expense) 2,384 (181) (1,662)
Net operating income4 21,571 20,967 17,608
LICs43 (764) (1,530) (1,921)
Net operating income 20,807 19,437 15,687
Total operating expenses (20,217) (17,613) (19,095)
Operating profit/(loss) 590 1,824 (3,408)
Income/(expense) from associates44 6 1 (6)
Profit/(loss) before tax 596 1,825 (3,414)
Cost efficiency ratio 93.7% 84.0% 108.4%RoRWA36 0.2% 0.6% (1.0%)
Year-end staff numbers 69,363 68,334 70,061
Best Debt House in Western Europe for the second consecutive year
(Euromoney Awards)
UK No1 Trade Bank (Global Finance Magazine)
US$3.1bn of regulatory fines, provisions,
penalties and UK customer redress
For footnotes, see page 109.
Economic background
The UK recovery continued through the second half of 2014, though the pace of expansion moderated towards the end of the year. Preliminary estimates indicate that the annual rate of growth of real Gross Domestic Product (‘GDP’) was 2.6%. The unemployment rate fell to 5.7% in the three months to December and wage growth accelerated slightly from a very low level. The annual Consumer Price Index (‘CPI’) measure of inflation reached a 14-year low of 0.5% in December. After a period of rapid activity in 2013 and the early months of 2014, there were signs that both economic activity and price inflation in the housing market were moderating as the year ended. The Bank of England kept the Bank Rate steady at 0.5%.
The recovery in eurozone economic activity in 2014 was slow and uneven across member states. Real GDP in the region as a whole grew by 0.9% in the year. The German and Spanish economies grew by 1.6% and 1.5%, respectively, while French GDP grew by a more modest 0.4%. Eurozone inflation fell to minus 0.2% in December, prompting fears that the region could move towards a sustained period of deflation. The likelihood that low growth and inflation could persist for an extended period prompted the European Central Bank (‘ECB’) to cut the main refinancing rate and the deposit rate to 0.05% and minus 0.2%, respectively, in September and embark on a policy of balance sheet expansion starting with purchases of covered bonds and asset-backed securities.
Financial overview
Profit before tax (US$m)
Our European operations reported a profit before tax of US$596m in 2014 compared with US$1.8bn in 2013. The decrease in reported profit before tax was driven by a number of significant items and increased operating expenses, partly offset by reduced LICs. The former included charges relating to UK customer redress of US$1.3bn, settlements and provisions in relation to regulatory investigations into foreign exchange of US$1.2bn, of which US$809m was recorded in the fourth quarter of 2014, and provisions arising from the ongoing review of compliance with the CCA in the UK of US$632m. For further details of all significant items, see page 42.
596
1,825
3,309 3,9052,476 4,301
2014 2013
Reported Currency translationand significant items
Adjusted profit

Report of the Directors: Geographical regions (continued) Europe
HSBC HOLDINGS PLC
80
Profit/(loss) before tax by country within global businesses
Retail Bankingand Wealth
ManagementUS$m
Commercial Banking
US$m
GlobalBanking and
MarketsUS$m
GlobalPrivate
BankingUS$m
Other US$m
TotalUS$m
UK 589 2,193 (801) 191 (2,228) (56)France35 (181) 240 354 (199) 214Germany 28 71 162 27 (10) 278Switzerland 5 2 38 (3) 42Turkey (155) 5 92 (6) (64)Other 33 34 240 59 (184) 182
Year ended 31 December 2014 314 2,548 49 315 (2,630) 596 UK 1,471 1,684 1,246 252 (3,493) 1,160France35 285 255 351 21 (162) 750Germany 30 70 183 44 (25) 302Switzerland 2 2 (291) (287)Turkey (74) 36 108 (1) 1 70Other 41 41 (89) (190) 27 (170)
Year ended 31 December 2013 1,753 2,088 1,801 (165) (3,652) 1,825 UK 343 832 (111) 235 (6,355) (5,056)France35 135 203 514 (11) (263) 578Germany 29 64 283 40 (72) 344Switzerland – 2 1 133 – 136Turkey (32) 71 104 – 1 144Other 34 36 195 102 73 440
Year ended 31 December 2012 509 1,208 986 499 (6,616) (3,414)
For footnote, see page 109.
Adjusted profit before tax decreased by US$396m, primarily reflecting an increase in costs which was partly offset by a reduction in LICs; revenue was broadly in line with 2013.
Country business highlights
In the UK, overall CMB lending increased by 7% compared with 2013, with new lending and re-financing before attrition and amortisation increasing by 38% and over 85% of small business loan applications approved. In addition, Business Banking launched a campaign to offer further support and lending to SME customers. As part of this, £5.8bn (US$9.9bn) of future lending was made available to help finance growth across the UK. Lending in Global Trade and Receivables Finance also grew by 3% as we built on our position in the market in Trade Finance and reduced attrition from our existing clients in Receivables Finance.
In RBWM, we approved £11.4bn (US$18.8bn) of new mortgage lending to over 118,000 customers, including £3.5bn (US$5.8bn) to over 27,500 first-time buyers. However, our aggregate amount of mortgage balances drawn down decreased marginally. The loan-to-value (‘LTV’) ratio on new lending was 60% compared with an average of 43.7% for the total mortgage portfolio. In October 2014, we expanded our mortgage distribution channels to include an intermediary in order to reach the growing proportion of the mortgage market in the UK that wishes to source its finance that way.
As part of the re-shaping of the GB&M business in 2013, we brought together all our financing businesses into Capital Financing, including lending, debt capital markets and equity capital markets. We increased our sector
expertise and enhanced our geographical spread by appointing two new co-heads of UK Banking. In 2014, the advisory and equity capital markets businesses within Capital Financing experienced volume growth that outstripped the market.
In France, in GB&M, we acted as sole advisor on one of the largest mergers and acquisitions (‘M&A’) transactions in Europe. In CMB, our Payments and Cash Management business implemented the Single Euro Payments Area platform (‘SEPA’) for euro-denominated credit transfer and direct debit payments across our European locations. This allows our clients to make and receive payments in euros from their HSBC accounts in the 34 countries that have implemented SEPA, all governed by a consistent set of standards, rules and conditions. In addition, in CMB, we allocated a further €1.5bn (US$2.0bn) to the SME fund and approved over €2.0bn (US$2.7bn) of lending in 2014. In RBWM, we experienced strong growth in home loans.
In Germany, as part of our growth initiative, we opened three branches in Dortmund, Mannheim and Cologne, increased the number of relationship managers by 26% and held a number of roadshows in countries including France, mainland China and the UK to reinforce Germany as a key international hub. In GPB, we disposed of our HSBC Trinkaus & Burkhardt AG business in Luxembourg.
In Turkey, the regulator imposed interest rate caps on credit cards and overdrafts which affected revenue. Despite this, in September 2014 CMB launched a TRL2bn (US$914m) international fund in order to provide sustainable support and global connectivity for international business, of which TRL1.1bn (US$519m) was drawn down.
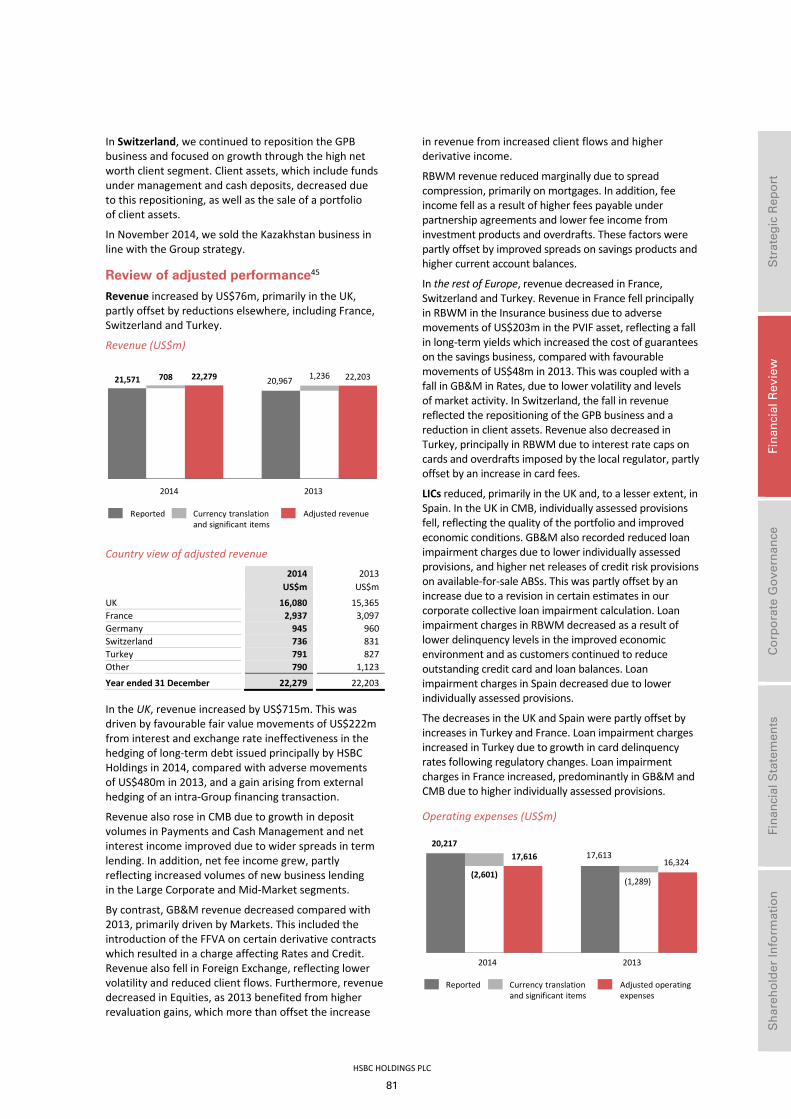
HSBC HOLDINGS PLC
81
Str
ateg
ic R
epo
rt
Fi
nan
cial
Rev
iew
Co
rpo
rate
Go
vern
ance
Fin
anci
al S
tate
men
ts
S
har
eho
lder
Info
rmat
ion
In Switzerland, we continued to reposition the GPB business and focused on growth through the high net worth client segment. Client assets, which include funds under management and cash deposits, decreased due to this repositioning, as well as the sale of a portfolio of client assets.
In November 2014, we sold the Kazakhstan business in line with the Group strategy.
Review of adjusted performance45
Revenue increased by US$76m, primarily in the UK, partly offset by reductions elsewhere, including France, Switzerland and Turkey.
Revenue (US$m)
Country view of adjusted revenue
2014 2013 US$m US$m
UK 16,080 15,365France 2,937 3,097Germany 945 960Switzerland 736 831Turkey 791 827Other 790 1,123
Year ended 31 December 22,279 22,203
In the UK, revenue increased by US$715m. This was driven by favourable fair value movements of US$222m from interest and exchange rate ineffectiveness in the hedging of long-term debt issued principally by HSBC Holdings in 2014, compared with adverse movements of US$480m in 2013, and a gain arising from external hedging of an intra-Group financing transaction.
Revenue also rose in CMB due to growth in deposit volumes in Payments and Cash Management and net interest income improved due to wider spreads in term lending. In addition, net fee income grew, partly reflecting increased volumes of new business lending in the Large Corporate and Mid-Market segments.
By contrast, GB&M revenue decreased compared with 2013, primarily driven by Markets. This included the introduction of the FFVA on certain derivative contracts which resulted in a charge affecting Rates and Credit. Revenue also fell in Foreign Exchange, reflecting lower volatility and reduced client flows. Furthermore, revenue decreased in Equities, as 2013 benefited from higher revaluation gains, which more than offset the increase
in revenue from increased client flows and higher derivative income.
RBWM revenue reduced marginally due to spread compression, primarily on mortgages. In addition, fee income fell as a result of higher fees payable under partnership agreements and lower fee income from investment products and overdrafts. These factors were partly offset by improved spreads on savings products and higher current account balances.
In the rest of Europe, revenue decreased in France, Switzerland and Turkey. Revenue in France fell principally in RBWM in the Insurance business due to adverse movements of US$203m in the PVIF asset, reflecting a fall in long-term yields which increased the cost of guarantees on the savings business, compared with favourable movements of US$48m in 2013. This was coupled with a fall in GB&M in Rates, due to lower volatility and levels of market activity. In Switzerland, the fall in revenue reflected the repositioning of the GPB business and a reduction in client assets. Revenue also decreased in Turkey, principally in RBWM due to interest rate caps on cards and overdrafts imposed by the local regulator, partly offset by an increase in card fees.
LICs reduced, primarily in the UK and, to a lesser extent, in Spain. In the UK in CMB, individually assessed provisions fell, reflecting the quality of the portfolio and improved economic conditions. GB&M also recorded reduced loan impairment charges due to lower individually assessed provisions, and higher net releases of credit risk provisions on available-for-sale ABSs. This was partly offset by an increase due to a revision in certain estimates in our corporate collective loan impairment calculation. Loan impairment charges in RBWM decreased as a result of lower delinquency levels in the improved economic environment and as customers continued to reduce outstanding credit card and loan balances. Loan impairment charges in Spain decreased due to lower individually assessed provisions.
The decreases in the UK and Spain were partly offset by increases in Turkey and France. Loan impairment charges increased in Turkey due to growth in card delinquency rates following regulatory changes. Loan impairment charges in France increased, predominantly in GB&M and CMB due to higher individually assessed provisions.
Operating expenses (US$m)
21,571 20,967708 22,279 1,236 22,203
2014 2013
Reported Currency translationand significant items
Adjusted revenue
20,21717,613
(2,601)
17,616
(1,289)
16,324
2014 2013
Reported Currency translationand significant items
Adjusted operating expenses

Report of the Directors: Geographical regions (continued) Europe
HSBC HOLDINGS PLC
82
Operating expenses rose by US$1.3bn, mainly in the UK, reflecting growth in Regulatory Programmes and Compliance costs in all businesses and increased staff costs. In addition, the UK bank levy charge of US$1.1bn in respect of 2014 was US$0.2bn higher than in 2013,
primarily due to an increase in the rate of the levy. Expenses also increased due to the timing of the recognition of the Financial Services Compensation Scheme levy in the UK. These increases were partly offset by sustainable cost savings of over US$330m.
Profit/(loss) before tax and balance sheet data – Europe 2014
Retail Banking
and Wealth Management
US$m
CommercialBanking
US$m
GlobalBanking and
MarketsUS$m
GlobalPrivate
BankingUS$m
Other US$m
Inter-segment
elimination55
US$m Total
US$m
Profit/(loss) before tax Net interest income/(expense) 5,196 3,616 1,956 594 (654) (97) 10,611
Net fee income/(expense) 2,456 1,900 1,087 626 (27) 6,042
Trading income/(expense) excluding net interest income
(260) 33 1,943 140 (92) 1,764
Net interest income/(expense) on trading activities
14 2 660 (4) 1 97 770
Net trading income/(expense)50 (246) 35 2,603 136 (91) 97 2,534
Changes in fair value of long-term debt issued and related derivatives
614 614 Net income/(expense) from other
financial instruments designated at fair value
616 119 14 (1) (11) 737
Net income/(expense) from financial instruments designated at fair value
616 119 14 (1) 603 1,351 Gains less losses from financial
investments
12 10 730 9 11 772 Dividend income 3 7 50 2 3 65Net insurance premium
income/(expense)
2,741 217 50 3,008 Other operating income/(expense) (127) 45 (3) 29 1,249 (186) 1,007
Total operating income 10,651 5,949 6,437 1,445 1,094 (186) 25,390
Net insurance claims56 (3,450) (306) (63) (3,819)
Net operating income4 7,201 5,643 6,437 1,382 1,094 (186) 21,571
Loan impairment (charges)/ recoveries and other credit risk provisions
(268) (502) 4 2 (764)
Net operating income 6,933 5,141 6,437 1,386 1,096 (186) 20,807
Total operating expenses (6,621) (2,594) (6,391) (1,071) (3,726) 186 (20,217)
Operating profit/(loss) 312 2,547 46 315 (2,630) 590
Share of profit in associates and joint ventures
2 1 3 6
Profit/(loss) before tax 314 2,548 49 315 (2,630) 596 % % % % % %
Share of HSBC’s profit before tax 1.7 13.6 0.3 1.7 (14.1) 3.2Cost efficiency ratio 91.9 46.0 99.3 77.5 340.6 93.7 Balance sheet data40 US$m US$m US$m US$m US$m US$mLoans and advances to customers
(net)27
165,112 106,342 113,136 24,766 377 409,733 Total assets 221,679 120,819 948,951 64,676 64,182 (129,381) 1,290,926Customer accounts27 202,413 135,837 166,075 41,380 254 545,959

HSBC HOLDINGS PLC
83
Str
ateg
ic R
epo
rt
Fi
nan
cial
Rev
iew
Co
rpo
rate
Go
vern
ance
Fin
anci
al S
tate
men
ts
S
har
eho
lder
Info
rmat
ion
2013
Retail Banking and Wealth
Management US$m
CommercialBanking
US$m
GlobalBanking and
MarketsUS$m
GlobalPrivate
BankingUS$m
Other US$m
Inter- segment
elimination55
US$m Total
US$m
Profit/(loss) before tax
Net interest income/(expense) 5,600 3,353 1,774 722 (694) (62) 10,693
Net fee income/(expense) 2,545 1,789 957 744 (3) – 6,032
Trading income excluding net interest income
206 30 2,181 192 698 – 3,307
Net interest income on trading activities
2 5 1,013 4 30 62 1,116
Net trading income50 208 35 3,194 196 728 62 4,423
Changes in fair value of long-term debt issued and related derivatives
(936) (936)Net income/(expense) from other
financial instruments designated at fair value
1,059 271 591 4 (570) (1) 1,354
Net income/(expense) from financial instruments designated at fair value
1,059 271 591 4 (1,506) (1) 418 Gains less losses from financial
investments
52 344 (17) 379 Dividend income 4 2 65 4 75Net insurance premium
income/(expense)
2,782 361 (1) 16 3,158 Other operating income/(expense) (103) 9 110 (253) 766 529
Total operating income/(expense) 12,147 5,820 7,034 1,416 (709) (1) 25,707
Net insurance claims56 (4,136) (567) (37) (4,740)
Net operating income/(expense)4 8,011 5,253 7,034 1,379 (709) (1) 20,967
Loan impairment charges and other credit risk provisions
(329) (935) (242) (24) (1,530)
Net operating income/(expense) 7,682 4,318 6,792 1,355 (709) (1) 19,437
Total operating expenses (5,934) (2,231) (4,987) (1,519) (2,943) 1 (17,613)
Operating profit/(loss) 1,748 2,087 1,805 (164) (3,652) 1,824
Share of profit/(loss) in associates and joint ventures
5 1 (4) (1) 1
Profit/(loss) before tax 1,753 2,088 1,801 (165) (3,652) 1,825 % % % % % %
Share of HSBC’s profit before tax 7.8 9.2 8.0 (0.7) (16.2) 8.1Cost efficiency ratio 74.1 42.5 70.9 110.2 (415.1) 84.0 Balance sheet data40 US$m US$m US$m US$m US$m US$mLoans and advances to customers
(net)27
177,357 105,498 145,136 27,289 830 456,110 Total assets 238,499 124,242 1,054,506 75,718 72,174 (172,180) 1,392,959 Customer accounts27 205,288 134,120 191,715 49,789 1,021 581,933
For footnotes, see page 109.

Report of the Directors: Geographical regions (continued) Asia
HSBC HOLDINGS PLC
84
Asia8
HSBC’s principal banking subsidiaries in Hong Kong are The Hongkong and Shanghai Banking Corporation Limited and Hang Seng Bank Limited. The former is the largest bank incorporated in Hong Kong and is our flagship bank in Asia.
We offer a wide range of banking and financial services in mainland China, through our local subsidiaries HSBC Bank (China) Company Limited and Hang Seng Bank (China) Limited. We also participate indirectly in mainland China through our associate, Bank of Communications.
Outside Hong Kong and mainland China, we conduct business in 18 countries and territories in Asia, with particularly strong coverage in Australia, India, Indonesia, Malaysia and Singapore.
2014 2013 2012 US$m US$m US$m
Net interest income 12,273 11,432 10,707 Net fee income 5,910 5,936 5,418 Net trading income 2,622 2,026 2,516 Other income 2,872 5,038 6,691
Net operating income4 23,677 24,432 25,332
LICs43 (647) (498) (510)
Net operating income 23,030 23,934 24,822
Total operating expenses (10,427) (9,936) (9,980)
Operating profit 12,603 13,998 14,842
Income from associates44 2,022 1,855 3,188
Profit before tax 14,625 15,853 18,030
Cost efficiency ratio 44.0% 40.7% 39.4% RoRWA36 3.1% 3.8% 4.4%
Year-end staff numbers 118,322 113,701 112,766
10% Growth in customer lending balances
excluding the effect of currency translation
Market leader for Asia ex-Japan Bonds
(Bloomberg)
Best Bank in Asia (The Euromoney Awards of Excellence 2014)
For footnotes, see page 109.
Economic background
Hong Kong’s real GDP growth slowed in 2014 relative to 2013 due to weaker domestic demand, partly attributable to the slowdown in the annual growth of retail sales. Labour market conditions softened with unemployment rising, albeit from historically low levels. Tourism arrivals to Hong Kong held up overall, up by 16% in the year compared with 2013, driven by the growth of visitors from mainland China. Headline CPI inflation averaged just over 4% for 2014, with a number of expiring government subsidies offsetting lower inflation in fuel and food prices.
In mainland China, real GDP growth slowed from 7.7% in 2013 to 7.4% in 2014, largely due to a slowdown in activity in construction and manufacturing investment which was only partially offset by resilient infrastructure investment. Headline annual CPI inflation fell steadily to 1.5% in December, significantly below the government’s target of 3.5%. The People’s Bank of China eased monetary policy in November by cutting policy interest rates for the first time since July 2012. The one-year deposit rate was lowered by 25bps to 2.75% and the one-year lending rate by 40bps to 5.6%. Further measures were announced in December to support bank lending and spur economic activity.
Japan experienced significant economic volatility during 2014 from the imposition of a 3 percentage point consumption tax increase, which took effect on 1 April. The economy recorded annualised GDP growth of 5.8% in the first quarter of 2014, but growth slowed sharply after the tax rise, as government stimuli and exports were unable to offset the decline in private consumption. GDP grew at an annualised rate of 2.2% in the fourth quarter after falls of 6.7% and 1.9% in the preceding quarters. The Bank of Japan announced another round of quantitative easing on 31 October 2014, prompting further depreciation of the yen.
In India, a new government with a strong mandate for reform boosted market sentiment regarding the long-term prospects for the country’s economy. However, the recovery remained constrained in 2014 with many infrastructure projects delayed pending government clearance. The steep decline in international commodity prices during the second half of the year helped push down goods price inflation and reduce the current account deficit. Following an interest rate rise early in 2014, the central bank kept monetary policy stable throughout the year.
The downward trend in global commodity prices permitted Indonesia and Malaysia to cut costly fuel subsidies, which is expected to reduce external imbalances and improve their fiscal position. Domestic demand in these countries remained relatively robust throughout 2014, supporting economic growth. In Singapore, GDP growth slowed in 2014 from weaker export growth and domestic economic restructuring. The Monetary Authority maintained its policy of gradual currency appreciation.
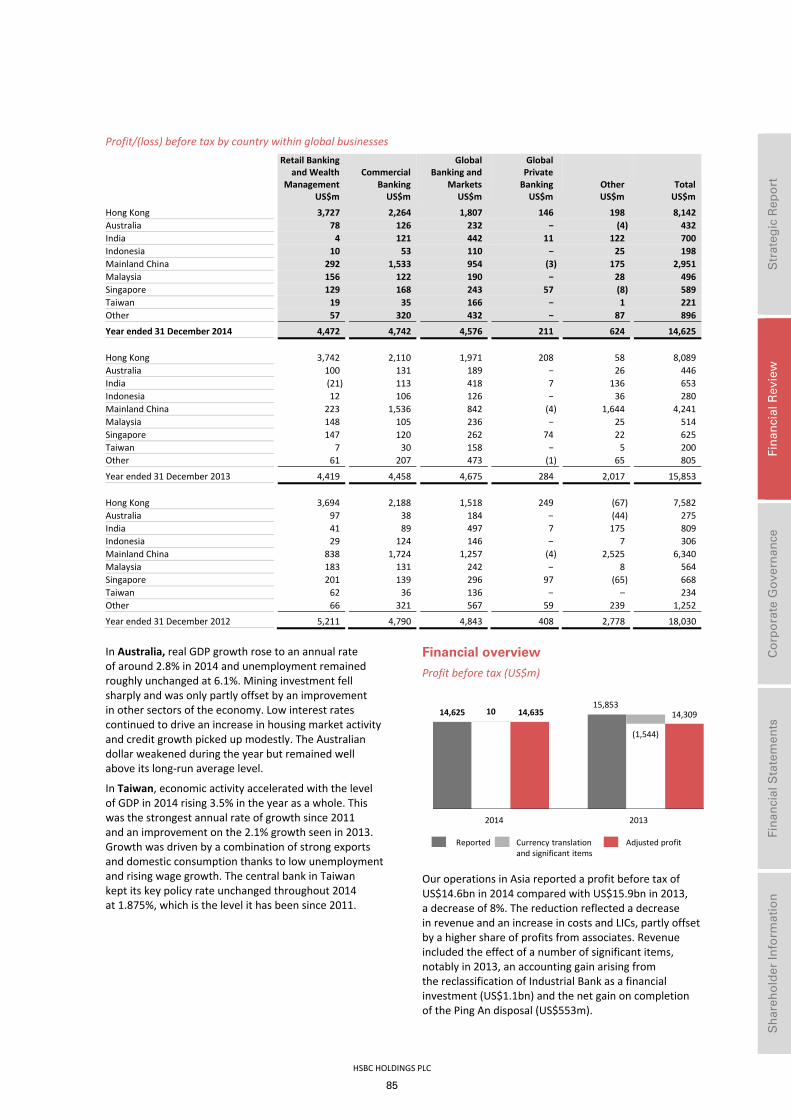
HSBC HOLDINGS PLC
85
Str
ateg
ic R
epo
rt
Fi
nan
cial
Rev
iew
Co
rpo
rate
Go
vern
ance
Fin
anci
al S
tate
men
ts
S
har
eho
lder
Info
rmat
ion
Profit/(loss) before tax by country within global businesses
Retail Bankingand Wealth
ManagementUS$m
Commercial Banking
US$m
GlobalBanking and
MarketsUS$m
GlobalPrivate
BankingUS$m
Other US$m
TotalUS$m
Hong Kong 3,727 2,264 1,807 146 198 8,142Australia 78 126 232 (4) 432India 4 121 442 11 122 700Indonesia 10 53 110 25 198Mainland China 292 1,533 954 (3) 175 2,951Malaysia 156 122 190 28 496Singapore 129 168 243 57 (8) 589Taiwan 19 35 166 1 221Other 57 320 432 87 896
Year ended 31 December 2014 4,472 4,742 4,576 211 624 14,625 Hong Kong 3,742 2,110 1,971 208 58 8,089Australia 100 131 189 26 446India (21) 113 418 7 136 653Indonesia 12 106 126 36 280Mainland China 223 1,536 842 (4) 1,644 4,241Malaysia 148 105 236 25 514Singapore 147 120 262 74 22 625Taiwan 7 30 158 5 200Other 61 207 473 (1) 65 805
Year ended 31 December 2013 4,419 4,458 4,675 284 2,017 15,853 Hong Kong 3,694 2,188 1,518 249 (67) 7,582Australia 97 38 184 – (44) 275 India 41 89 497 7 175 809 Indonesia 29 124 146 – 7 306 Mainland China 838 1,724 1,257 (4) 2,525 6,340 Malaysia 183 131 242 – 8 564 Singapore 201 139 296 97 (65) 668 Taiwan 62 36 136 – – 234 Other 66 321 567 59 239 1,252
Year ended 31 December 2012 5,211 4,790 4,843 408 2,778 18,030
In Australia, real GDP growth rose to an annual rate of around 2.8% in 2014 and unemployment remained roughly unchanged at 6.1%. Mining investment fell sharply and was only partly offset by an improvement in other sectors of the economy. Low interest rates continued to drive an increase in housing market activity and credit growth picked up modestly. The Australian dollar weakened during the year but remained well above its long-run average level.
In Taiwan, economic activity accelerated with the level of GDP in 2014 rising 3.5% in the year as a whole. This was the strongest annual rate of growth since 2011 and an improvement on the 2.1% growth seen in 2013. Growth was driven by a combination of strong exports and domestic consumption thanks to low unemployment and rising wage growth. The central bank in Taiwan kept its key policy rate unchanged throughout 2014 at 1.875%, which is the level it has been since 2011.
Financial overview
Profit before tax (US$m)
Our operations in Asia reported a profit before tax of US$14.6bn in 2014 compared with US$15.9bn in 2013, a decrease of 8%. The reduction reflected a decrease in revenue and an increase in costs and LICs, partly offset by a higher share of profits from associates. Revenue included the effect of a number of significant items, notably in 2013, an accounting gain arising from the reclassification of Industrial Bank as a financial investment (US$1.1bn) and the net gain on completion of the Ping An disposal (US$553m).
14,62515,853
10 14,635
(1,544)
14,309
2014 2013
Reported Currency translationand significant items
Adjusted profit

Report of the Directors: Geographical regions (continued) Asia
HSBC HOLDINGS PLC
86
Analysis of mainland China profit/(loss) before tax
Retail Bankingand Wealth
ManagementUS$m
Commercial Banking
US$m
GlobalBanking and
MarketsUS$m
GlobalPrivate
BankingUS$m
Other US$m
TotalUS$m
BoCom and other associates 255 1,421 296 – 1 1,973Mainland China operations 37 112 658 (3) 174 978Industrial Bank – – – – – –Ping An – – – – – –
Year ended 31 December 2014 292 1,533 954 (3) 175 2,951 BoCom and other associates 247 1,360 284 – (38) 1,853Mainland China operations (24) 176 558 (4) 40 746Industrial Bank – – – – 1,089 1,089Ping An – – – – 553 553
Year ended 31 December 2013 223 1,536 842 (4) 1,644 4,241 BoCom and other associates 214 1,193 248 – – 1,655Mainland China operations (52) 176 606 (4) 66 792Industrial Bank 54 273 343 – – 670Ping An 622 82 60 – 2,459 3,223
Year ended 31 December 2012 838 1,724 1,257 (4) 2,525 6,340
In 2014, significant items included the gain on sale of our investment in Bank of Shanghai (US$428m) and an impairment of our investment in Industrial Bank (US$271m). See page 42 for further details of significant items.
On an adjusted basis, profit before tax rose by US$326m or 2%, driven by higher revenue partly offset by increased operating expenses and LICs.
Country business highlights
We continued to focus on our strategic priorities for Asia, using our international network to drive organic growth and connect customers across borders. We completed the sale of our investment in Bank of Shanghai and implemented a discretionary incentive framework that removes the formulaic link between product sales and remuneration. We also saw continued adoption of our mobile banking applications, extended the contact-less payment systems to Android phones and enhanced our digital banking capabilities.
In Hong Kong, average mortgage balances in RBWM increased by 7%, with average LTV ratios of 47% on new mortgage drawdowns and an estimated 29% on the portfolio as a whole. In November 2014, to coincide with the launch of the Hong Kong-Shanghai Stock Connect platform, we rolled out new services allowing retail customers to trade and invest in eligible shares that are listed on the Shanghai Stock Exchange. We strengthened our cards offering with the launch of the ‘Visa Signature’ card product in Hong Kong and continued building new merchant partnerships across the region. We also re-launched our Advance offering to emerging affluent customers in Hong Kong and nine other regional markets. We were awarded ‘International Retail Bank of the Year’ by Asian Banking and Finance.
In CMB, we were one of the first foreign banks to announce renminbi cross-border pooling capability in the Shanghai Free Trade Zone. The collaboration between CMB and GB&M continued throughout the year, as a
consequence of which 157 primary markets transactions were completed in 2014, up from 122 in 2013, primarily for debt capital market issuances and leveraged asset finance mandates. In addition, we were named ‘Best Commercial Bank’ by FinanceAsia Achievement Awards 2014.
In GB&M, we maintained our market leadership in Asia ex-Japan G3 currency and investment grade bonds, and led the market in Hong Kong dollar bond issuances. We were involved in three of the five largest equity capital market transactions during 2014, as well as the first Sukuk sovereign bond issuance in Hong Kong. Furthermore, we continued to lead the market in offshore renminbi bond issuance in Hong Kong, becoming one of the Hong Kong Monetary Authority’s primary liquidity providers for offshore renminbi. We also acted as a joint book runner for an offshore preference share issuance for a mainland Chinese bank, the first mainland Chinese Basel III compliant additional tier-1 capital offering. We remain well-positioned to service our institutional investors using Stock Connect through our integrated Custody Plus platform.
In mainland China, we continued to develop our branch network, which comprised 173 HSBC outlets, 25 HSBC rural bank outlets and 50 Hang Seng Bank outlets at the end of the year. In RBWM, we were one of the first foreign banks to launch renminbi derivative products linked to the US dollar/renminbi rate and were awarded ‘Best Foreign Retail Bank’ by The Asian Banker for the sixth consecutive year. During 2014, we were the first foreign custodian bank to service renminbi qualified foreign institutional investors based in Singapore and South Korea. We also became a member of the Shanghai Gold Exchange’s international board, a newly established trading platform connecting mainland China’s gold market to global investors. In addition, we received regulatory approval to be one of the first market makers to directly trade renminbi, euro and Singaporean dollars in mainland China’s interbank foreign exchange market.
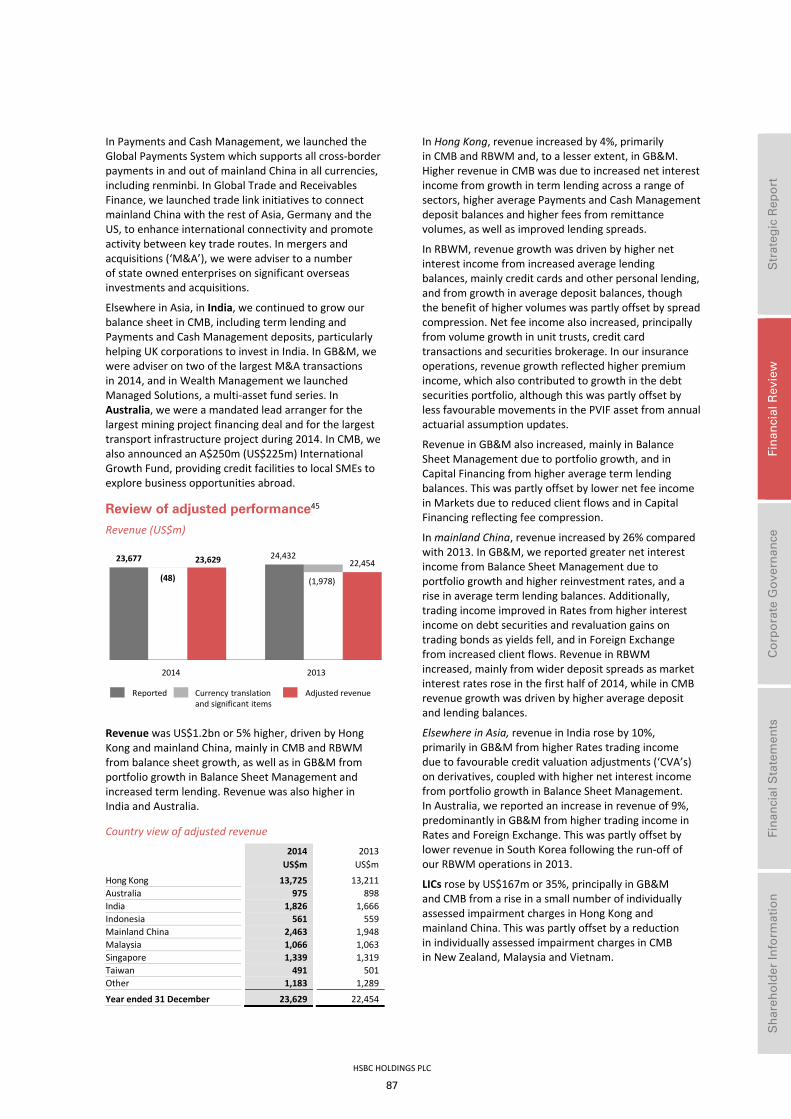
HSBC HOLDINGS PLC
87
Str
ateg
ic R
epo
rt
Fi
nan
cial
Rev
iew
Co
rpo
rate
Go
vern
ance
Fin
anci
al S
tate
men
ts
S
har
eho
lder
Info
rmat
ion
In Payments and Cash Management, we launched the Global Payments System which supports all cross-border payments in and out of mainland China in all currencies, including renminbi. In Global Trade and Receivables Finance, we launched trade link initiatives to connect mainland China with the rest of Asia, Germany and the US, to enhance international connectivity and promote activity between key trade routes. In mergers and acquisitions (‘M&A’), we were adviser to a number of state owned enterprises on significant overseas investments and acquisitions.
Elsewhere in Asia, in India, we continued to grow our balance sheet in CMB, including term lending and Payments and Cash Management deposits, particularly helping UK corporations to invest in India. In GB&M, we were adviser on two of the largest M&A transactions in 2014, and in Wealth Management we launched Managed Solutions, a multi-asset fund series. In Australia, we were a mandated lead arranger for the largest mining project financing deal and for the largest transport infrastructure project during 2014. In CMB, we also announced an A$250m (US$225m) International Growth Fund, providing credit facilities to local SMEs to explore business opportunities abroad.
Review of adjusted performance45
Revenue (US$m)
Revenue was US$1.2bn or 5% higher, driven by Hong Kong and mainland China, mainly in CMB and RBWM from balance sheet growth, as well as in GB&M from portfolio growth in Balance Sheet Management and increased term lending. Revenue was also higher in India and Australia.
Country view of adjusted revenue
2014 2013 US$m US$m
Hong Kong 13,725 13,211 Australia 975 898 India 1,826 1,666 Indonesia 561 559 Mainland China 2,463 1,948 Malaysia 1,066 1,063 Singapore 1,339 1,319 Taiwan 491 501 Other 1,183 1,289
Year ended 31 December 23,629 22,454
In Hong Kong, revenue increased by 4%, primarily in CMB and RBWM and, to a lesser extent, in GB&M. Higher revenue in CMB was due to increased net interest income from growth in term lending across a range of sectors, higher average Payments and Cash Management deposit balances and higher fees from remittance volumes, as well as improved lending spreads.
In RBWM, revenue growth was driven by higher net interest income from increased average lending balances, mainly credit cards and other personal lending, and from growth in average deposit balances, though the benefit of higher volumes was partly offset by spread compression. Net fee income also increased, principally from volume growth in unit trusts, credit card transactions and securities brokerage. In our insurance operations, revenue growth reflected higher premium income, which also contributed to growth in the debt securities portfolio, although this was partly offset by less favourable movements in the PVIF asset from annual actuarial assumption updates.
Revenue in GB&M also increased, mainly in Balance Sheet Management due to portfolio growth, and in Capital Financing from higher average term lending balances. This was partly offset by lower net fee income in Markets due to reduced client flows and in Capital Financing reflecting fee compression.
In mainland China, revenue increased by 26% compared with 2013. In GB&M, we reported greater net interest income from Balance Sheet Management due to portfolio growth and higher reinvestment rates, and a rise in average term lending balances. Additionally, trading income improved in Rates from higher interest income on debt securities and revaluation gains on trading bonds as yields fell, and in Foreign Exchange from increased client flows. Revenue in RBWM increased, mainly from wider deposit spreads as market interest rates rose in the first half of 2014, while in CMB revenue growth was driven by higher average deposit and lending balances.
Elsewhere in Asia, revenue in India rose by 10%, primarily in GB&M from higher Rates trading income due to favourable credit valuation adjustments (‘CVA’s) on derivatives, coupled with higher net interest income from portfolio growth in Balance Sheet Management. In Australia, we reported an increase in revenue of 9%, predominantly in GB&M from higher trading income in Rates and Foreign Exchange. This was partly offset by lower revenue in South Korea following the run-off of our RBWM operations in 2013.
LICs rose by US$167m or 35%, principally in GB&M and CMB from a rise in a small number of individually assessed impairment charges in Hong Kong and mainland China. This was partly offset by a reduction in individually assessed impairment charges in CMB in New Zealand, Malaysia and Vietnam.
23,677 24,432
(48)
23,629
(1,978)
22,454
2014 2013
Reported Currency translationand significant items
Adjusted revenue

Report of the Directors: Geographical regions (continued) Asia
HSBC HOLDINGS PLC
88
Operating expenses (US$m) Operating expenses rose by US$753m following investment in the region, notably in Regulatory Programmes and Compliance, and increased use of our Global Services Centres across the Group. Cost growth also reflected wage inflation and additional headcount, notably in Hong Kong and mainland China to support business growth, mainly in CMB, as well as increased marketing activity. These factors were partly offset by around US$270m of sustainable cost savings achieved in 2014.
Share of profit from associates and joint ventures rose by US$71m, mainly from BoCom, reflecting higher revenue from balance sheet growth and trading income, partly offset by increases in operating expenses and LICs.
10,4279,936
(58)
10,369
(320)
9,616
2014 2013
Reported Currency translationand significant items
Adjusted operating expenses
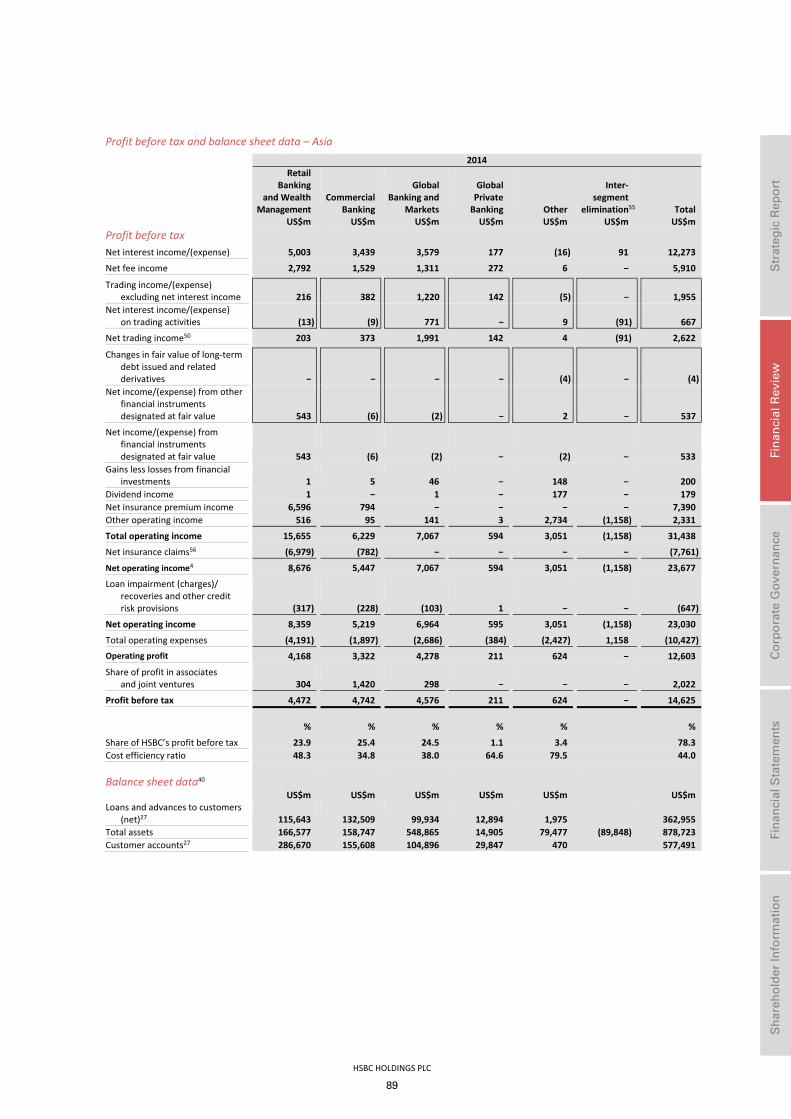
HSBC HOLDINGS PLC
89
Str
ateg
ic R
epo
rt
Fi
nan
cial
Rev
iew
Co
rpo
rate
Go
vern
ance
Fin
anci
al S
tate
men
ts
S
har
eho
lder
Info
rmat
ion
Profit before tax and balance sheet data – Asia 2014
Retail Banking
and Wealth Management
US$m
CommercialBanking
US$m
GlobalBanking and
MarketsUS$m
GlobalPrivate
BankingUS$m
Other US$m
Inter- segment
elimination55
US$m Total
US$m Profit before tax
Net interest income/(expense) 5,003 3,439 3,579 177 (16) 91 12,273
Net fee income 2,792 1,529 1,311 272 6 5,910
Trading income/(expense) excluding net interest income 216 382 1,220 142 (5) 1,955
Net interest income/(expense) on trading activities (13) (9) 771 9 (91) 667
Net trading income50 203 373 1,991 142 4 (91) 2,622
Changes in fair value of long-term debt issued and related derivatives (4) (4)
Net income/(expense) from other financial instruments designated at fair value 543 (6) (2) 2 537
Net income/(expense) from financial instruments designated at fair value 543 (6) (2) (2) 533
Gains less losses from financial investments 1 5 46 148 200
Dividend income 1 1 177 179Net insurance premium income 6,596 794 7,390Other operating income 516 95 141 3 2,734 (1,158) 2,331
Total operating income 15,655 6,229 7,067 594 3,051 (1,158) 31,438
Net insurance claims56 (6,979) (782) (7,761)
Net operating income4 8,676 5,447 7,067 594 3,051 (1,158) 23,677
Loan impairment (charges)/ recoveries and other credit risk provisions (317) (228) (103) 1 (647)
Net operating income 8,359 5,219 6,964 595 3,051 (1,158) 23,030
Total operating expenses (4,191) (1,897) (2,686) (384) (2,427) 1,158 (10,427)Operating profit 4,168 3,322 4,278 211 624 12,603
Share of profit in associates and joint ventures 304 1,420 298 2,022
Profit before tax 4,472 4,742 4,576 211 624 14,625 % % % % % %
Share of HSBC’s profit before tax 23.9 25.4 24.5 1.1 3.4 78.3Cost efficiency ratio 48.3 34.8 38.0 64.6 79.5 44.0 Balance sheet data40 US$m US$m US$m US$m US$m US$mLoans and advances to customers
(net)27 115,643 132,509 99,934 12,894 1,975 362,955 Total assets 166,577 158,747 548,865 14,905 79,477 (89,848) 878,723Customer accounts27 286,670 155,608 104,896 29,847 470 577,491

Report of the Directors: Geographical regions (continued) Asia/Middle East and North Africa
HSBC HOLDINGS PLC
90
2013
Retail Banking and Wealth
Management US$m
CommercialBanking
US$m
GlobalBanking and
MarketsUS$m
GlobalPrivate
BankingUS$m
Other US$m
Inter- segment
elimination55
US$m Total
US$m Profit before tax
Net interest income/(expense) 4,895 3,103 3,245 205 (124) 108 11,432
Net fee income/(expense) 2,758 1,518 1,419 249 (8) – 5,936
Trading income/(expense) excluding net interest income 238 377 1,483 175 (739) – 1,534
Net interest income/(expense) on trading activities (16) (6) 608 – 14 (108) 492
Net trading income/(expense)50 222 371 2,091 175 (725) (108) 2,026
Changes in fair value of long-term debt issued and related derivatives – – – – (1) – (1)
Net income/(expense) from other financial instruments designated at fair value 315 – 7 – (7) – 315
Net income/(expense) from financial instruments designated at fair value 315 – 7 – (8) – 314
Gains less losses from financial investments (1) – 58 14 1,204 – 1,275
Dividend income – 1 6 – 145 – 152Net insurance premium income 6,263 654 1 – – – 6,918Other operating income 764 97 163 12 3,871 (1,232) 3,675
Total operating income 15,216 5,744 6,990 655 4,355 (1,232) 31,728
Net insurance claims56 (6,609) (687) – – – – (7,296)
Net operating income4 8,607 5,057 6,990 655 4,355 (1,232) 24,432
Loan impairment charges and other credit risk provisions (347) (144) (3) (4) – – (498)
Net operating income 8,260 4,913 6,987 651 4,355 (1,232) 23,934
Total operating expenses (4,138) (1,786) (2,560) (367) (2,317) 1,232 (9,936)
Operating profit 4,122 3,127 4,427 284 2,038 – 13,998
Share of profit/(loss) in associates and joint ventures 297 1,331 248 – (21) – 1,855
Profit before tax 4,419 4,458 4,675 284 2,017 – 15,853 % % % % % %
Share of HSBC’s profit before tax 19.6 19.8 20.7 1.3 8.9 70.3 Cost efficiency ratio 48.1 35.3 36.6 56.0 53.2 40.7 Balance sheet data40 US$m US$m US$m US$m US$m US$mLoans and advances to customers
(net)27 111,769 122,882 89,722 10,904 1,620 336,897 Total assets 158,456 146,898 515,023 12,994 82,453 (84,033) 831,791Customer accounts27 278,392 141,958 96,546 31,250 337 548,483
For footnotes, see page 109.

HSBC HOLDINGS PLC
91
Str
ateg
ic R
epo
rt
Fi
nan
cial
Rev
iew
Co
rpo
rate
Go
vern
ance
Fin
anci
al S
tate
men
ts
S
har
eho
lder
Info
rmat
ion
Middle East and North Africa The network of branches of HSBC Bank Middle East Limited, together with HSBC’s subsidiaries and associates, gives us wide coverage in the region. Our associate in Saudi Arabia, The Saudi British Bank (40% owned), is the Kingdom’s sixth largest bank by total assets.
2014 2013 2012 US$m US$m US$m
Net interest income 1,519 1,486 1,470Net fee income 650 622 595Net trading income 314 357 390Other income/(expense) 65 38 (25)
Net operating income4 2,548 2,503 2,430
LICs43 6 42 (286)
Net operating income 2,554 2,545 2,144
Total operating expenses (1,216) (1,289) (1,166)
Operating profit 1,338 1,256 978
Income from associates44 488 438 372
Profit before tax 1,826 1,694 1,350
Cost efficiency ratio 47.7% 51.5% 48.0%RoRWA36 2.9% 2.7% 2.2%
Year-end staff numbers 8,305 8,618 8,765
Best Investment Bank in the Middle East
(Euromoney 2014)
Record reported profit before tax of
US$1.8bn
Completed disposal of our operations in Jordan and Pakistan
in line with the Group’s six filters investment criteria
For footnotes, see page 109.
Economic background
Economic activity across the Middle East and North Africa remained strong during 2014, despite heightened geopolitical uncertainties and weaker global oil prices towards the end of the year. The region’s energy exporters fared particularly well, buoyed by an oil-funded fiscal stimulus and an expansionary monetary stance. Saudi Arabia, the Middle East’s largest oil exporter, grew strongly as the Kingdom pushed ahead with its infrastructure and industrial expansion programme. The United Arab Emirates (‘UAE’), however, showed the most significant gains in momentum, boosted by growth in both its export-orientated non-oil sector and an increasingly expansionary fiscal stance. Though showing some gains as growth picked up speed, inflation remained muted at under 5% across the Gulf.
Egypt showed further signs of stabilisation in 2014. Although still below the trend levels that prevailed prior to the 2011 revolution, some momentum in growth was achieved in the second half of the year, boosted by the receipt of further concessional funding and an improvement in political order and policy making following the May presidential election. Inflation rose and the budget deficit remained high, recording a third successive double-digit deficit as a percentage of GDP. International reserves fell in the latter months of the year, highlighting ongoing pressure on the currency which remained subject to significant controls.
Financial overview
Profit before tax (US$m)
Our operations in the Middle East and North Africa reported a profit before tax of US$1.8bn, an increase of 8% on a reported basis, despite the effects of business disposals, including the loss on sale of our Pakistan business. See page 42 for further details of our significant items.
On an adjusted basis, profit before tax grew by 11% driven by higher revenue and increased income from our associate, The Saudi British Bank.
1,8261,694
28 1,854
(21)
1,673
2014 2013
Reported Currency translationand significant items
Adjusted profit

Report of the Directors: Geographical regions (continued) Middle East and North Africa
HSBC HOLDINGS PLC
92
Profit/(loss) before tax by country within global businesses
Retail Bankingand Wealth
ManagementUS$m
Commercial Banking
US$m
GlobalBanking and
MarketsUS$m
GlobalPrivate
BankingUS$m
Other US$m
TotalUS$m
Egypt 64 94 177 335 United Arab Emirates 154 190 364 (46) 662 Saudi Arabia 91 168 203 19 5 486 Other 14 152 182 (5) 343
Year ended 31 December 2014 323 604 926 19 (46) 1,826 Egypt 31 37 166 (29) 205United Arab Emirates 142 290 275 1 (72) 636Saudi Arabia 82 146 188 15 7 438Other 3 172 240 415
Year ended 31 December 2013 258 645 869 16 (94) 1,694 Egypt 67 71 157 – (5) 290United Arab Emirates 143 235 141 1 (56) 464Saudi Arabia 60 120 170 9 18 377Other (18) 161 113 – (37) 219
Year ended 31 December 2012 252 587 581 10 (80) 1,350
Country business highlights
In the UAE, we made significant progress in executing the strategic plan we announced in 2013. In RBWM, we expanded our range of products in Wealth Management, including the launch of the International Bonds and Portfolio Advisory Service to widen our offering for Premier clients. The introduction of a financial health check to better understand customer needs coupled with the opening of a Customer Service Unit in Abu Dhabi illustrated our focus on putting the customer first.
In CMB, we enhanced our services to customers that trade internationally by completing the implementation of our International Subsidiary Business model across the region in order to better meet their cross-border banking requirements and cement our strategic relationships. We also launched a second tranche of the International Growth Fund for AED1bn (US$272m). We continued to invest in our Payments and Cash Management business including recruiting client-facing and specialised staff and won the Best Regional Cash Management Provider in the Middle East award.
In GB&M, we advised a major regional airline on its investment in a European air carrier and a large investment company in Dubai on its inaugural US$1bn bond issue. In addition, we increased our collaboration with CMB, particularly in Capital Financing, focusing on existing clients and taking advantage of our connectivity with other regions.
The drop in oil prices did not have a material impact on our financial performance in the UAE.
In Egypt, in RBWM, we expanded our product offering with enhanced features and reduced pricing for credit cards, and were ranked number one in the customer recommendation index. In GB&M, we acted as the global coordinator, structuring bank, mandated lead arranger and facility agent for a government entity. This reflected our commitment to supporting the Egyptian
government’s plan for the development of the country’s infrastructure.
In Saudi Arabia, through our associates, The Saudi British Bank and HSBC Saudi Arabia Limited, we acted as joint financial advisor, joint lead manager and a receiving bank on the US$6bn National Commercial Bank initial public offering (‘IPO’). This was the Middle East’s largest ever IPO and the world’s second largest in 2014.
Review of adjusted performance45
Revenue (US$m)
Revenue increased in the majority of our markets, most notably in Egypt in all global businesses and in the UAE.
Country view of adjusted revenue
2014 2013 US$m US$m
UAE 1,448 1,401 Egypt 531 451 Rest of MENA 566 550
Year ended 31 December 2,545 2,402
In Egypt, revenue increased by US$80m, reflecting higher net interest income in RBWM due to improved deposit spreads as a result of re-pricing, and the non-recurrence of losses on disposal of available-for-sale debt securities
2,548 2,503
(3)
2,545
(101)
2,402
2014 2013
Reported Currency translationand significant items
Adjusted revenue

HSBC HOLDINGS PLC
93
Str
ateg
ic R
epo
rt
Fi
nan
cial
Rev
iew
Co
rpo
rate
Go
vern
ance
Fin
anci
al S
tate
men
ts
S
har
eho
lder
Info
rmat
ion
in GB&M in 2013. In addition, the Central Bank resumed interest payments on overnight placements during 2014, which contributed to the rise in revenue in all global businesses.
In the UAE, revenue increased by US$47m, primarily in GB&M reflecting a rise in Capital Financing due to increased advisory mandates in Project and Export Finance and a gain on restructuring a specific loan in Credit and Lending. In addition, revenue rose in our Equities and Securities Services businesses from increased customer flows, which in part reflected the upgrade of the UAE to emerging markets status in the MSCI Index. In RBWM, revenue increased, but to a lesser extent, reflecting higher net interest income as mortgage balances rose and deposit spreads improved due to re-pricing initiatives. This was partially offset by reduced revenue in CMB from lower spreads on lending balances, reflecting a highly liquid and competitive market coupled with lower charges on foreign exchange transactions in Payments and Cash Management.
In the rest of the region, revenue was higher with increases in Oman and Qatar partly offset by a reduction in Algeria. Higher revenue in Oman in part reflected growth in customer advances in CMB. The increase in Qatar was driven by fees in GB&M reflecting increased customer flows in our Securities Services business, which in part reflected the upgrade of Qatar to emerging markets status in the MSCI Index. The reduction in Algeria reflected regulatory restrictions on foreign exchange spreads charged on corporate customer transactions. Net loan impairment releases were lower by US$44m, primarily driven by lower impairment releases for a particular UAE-related exposure in GB&M.
Operating expenses (US$m)
Operating expenses of US$1,183m decreased by US$31m, mainly due to reductions in Egypt and the UAE. In Egypt, expenses fell following charges recorded in 2013 relating to changes in the interpretation of tax regulations. In the UAE, expenses reduced due to the non-recurrence of charges incurred in 2013 on customer redress programmes in RBWM relating to fees charged on overseas credit card transactions. This was partly offset by wage inflation, investment in Regulatory Programmes and Compliance, growth in customer-facing staff in RBWM and increased service and product support staff in CMB. Share of profits from associates and joint ventures increased by 12%, mainly from The Saudi British Bank. This was driven by higher revenue resulting from strong balance sheet growth.
1,216 1,289
(33)
1,183
(75)
1,214
2014 2013
Reported Currency translationand significant items
Adjusted operating expenses

Report of the Directors: Geographical regions (continued) Middle East and North Africa
HSBC HOLDINGS PLC
94
Profit/(loss) before tax and balance sheet data – Middle East and North Africa 2014
Retail Banking
and Wealth Management
US$m
CommercialBanking
US$m
GlobalBanking and
MarketsUS$m
GlobalPrivate
BankingUS$m
Other US$m
Inter- segment
elimination55
US$m Total
US$m
Profit/(loss) before tax
Net interest income 615 467 410 3 24 1,519
Net fee income/(expense) 152 268 240 (10) 650
Trading income/(expense) excluding net interest income 58 68 207 (5) 328
Net interest income on trading activities 10 (24) (14)
Net trading income/(expense)50 58 68 217 (5) (24) 314
Net expense from financial instruments designated at fair value (3) (3)
Gains less losses from financial investments 1 1 20 22
Dividend income 1 1 12 14Other operating income 8 27 108 (111) 32
Total operating income 835 805 926 93 (111) 2,548
Net insurance claims56
Net operating income4 835 805 926 93 (111) 2,548
Loan impairment (charges)/ recoveries and other credit risk provisions (26) (21) 53 6
Net operating income 809 784 979 93 (111) 2,554
Total operating expenses (578) (348) (256) (145) 111 (1,216)Operating profit/(loss) 231 436 723 (52) 1,338
Share of profit in associates and joint ventures 92 168 203 19 6 488
Profit/(loss) before tax 323 604 926 19 (46) 1,826 % % % % % %
Share of HSBC’s profit before tax 1.7 3.2 5.0 0.1 (0.2) 9.8 Cost efficiency ratio 69.2 43.2 27.6 155.9 47.7 Balance sheet data40 US$m US$m US$m US$m US$m US$mLoans and advances to customers
(net)27 6,318 13,104 9,641 29,063 Total assets 7,073 14,911 39,229 77 2,900 (1,773) 62,417Customer accounts27 18,024 11,809 9,630 257 39,720

HSBC HOLDINGS PLC
95
Str
ateg
ic R
epo
rt
Fi
nan
cial
Rev
iew
Co
rpo
rate
Go
vern
ance
Fin
anci
al S
tate
men
ts
S
har
eho
lder
Info
rmat
ion
2013
Retail Banking and Wealth
Management US$m
CommercialBanking
US$m
GlobalBanking and
MarketsUS$m
GlobalPrivate
BankingUS$m
Other US$m
Inter- segment
elimination55
US$m Total
US$m
Profit/(loss) before tax
Net interest income 585 486 390 4 21 1,486
Net fee income/(expense) 161 269 197 (5) – 622
Trading income excluding net interest income 59 85 220 – 364
Net interest income on trading activities 14 (21) (7)
Net trading income50 59 85 234 (21) 357
Net expense from financial instruments designated at fair value (2) (2)
Gains less losses from financial investments (18) (18)
Dividend income 9 9Other operating income 25 30 15 99 (120) 49
Total operating income 830 870 827 96 (120) 2,503
Net insurance claims56
Net operating income4 830 870 827 96 (120) 2,503
Loan impairment (charges)/ recoveries and other credit risk provisions (49) (20) 110 1 42
Net operating income 781 850 937 1 96 (120) 2,545
Total operating expenses (606) (350) (256) (197) 120 (1,289)
Operating profit/(loss) 175 500 681 1 (101) 1,256
Share of profit in associates and joint ventures 83 145 188 15 7 438
Profit/(loss) before tax 258 645 869 16 (94) 1,694 % % % % % %
Share of HSBC’s profit before tax 1.1 2.9 3.8 0.1 (0.4) 7.5Cost efficiency ratio 73.0 40.2 31.0 – 205.2 51.5 Balance sheet data40 US$m US$m US$m US$m US$m US$mLoans and advances to customers
(net)27 6,152 11,814 9,241 4 27,211 Total assets 7,016 13,776 39,302 64 3,340 (2,688) 60,810Customer accounts27 18,771 12,402 7,432 1 77 38,683
For footnotes, see page 109.

Report of the Directors: Geographical regions (continued) North America
HSBC HOLDINGS PLC
96
North America Our principal North American businesses are located in the US and Canada. Operations in the US are primarily conducted through HSBC Bank USA, N.A., and HSBC Finance, a national consumer finance company. HSBC Markets (USA) Inc. is the intermediate holding company of, inter alia, HSBC Securities (USA) Inc. Canadian operations are conducted through HSBC Bank Canada.
2014 2013 2012 US$m US$m US$m
Net interest income 5,015 5,742 8,117 Net fee income 1,940 2,143 2,513 Net trading income 411 948 507 Gains on disposals of US
branch network and cards business – – 4,012
Other income/(expense) 786 (30) (456)
Net operating income4 8,152 8,803 14,693
LICs43 (322) (1,197) (3,457)
Net operating income 7,830 7,606 11,236
Total operating expenses (6,429) (6,416) (8,940)
Operating profit 1,401 1,190 2,296
Income from associates44 16 31 3
Profit before tax 1,417 1,221 2,299
Cost efficiency ratio 78.9% 72.9% 60.8%RoRWA36 0.6% 0.5% 0.8%
Year-end staff numbers 20,412 20,871 22,443
Best Export Finance Arranger in North America
(Trade Finance Awards for Excellence – 2014)
11% increase in
CMB customer lending balances on a reported basis
73% decrease in
loan impairment charges on a reported basis
For footnotes, see page 109.
Economic background
In the US, real GDP rose by 2.4% in 2014, after 2.2% growth in 2013. Both consumer spending and business fixed investment increased at a moderate pace in 2014, climbing 2.5% and 5.2%, respectively. Growth in residential investment slowed markedly, however, to 1.8% in 2014, from 11.9% in 2013. Government expenditure fell by 0.2% in 2014, as a decline in federal government spending more than offset an increase in state and local government expenditure. The unemployment rate fell from 6.7% at the end of 2013 to 5.6% at the end of 2014. CPI inflation averaged 1.6% in 2014, after averaging 1.5% in 2013. The Federal Reserve continued to pursue a highly accommodative monetary policy in 2014, keeping the federal funds rate in a 0.00% to 0.25% range. It gradually reduced its monthly purchases of longer-term Treasury securities and agency mortgage-backed securities during the first ten months of the year, bringing its asset purchase programme to a conclusion at the end of October.
Canadian real GDP grew at a 2.4% annual rate through the first three quarters of 2014, an improvement on the 1.8% increase observed during the comparable period in 2013. Exports were supported by US economic growth and rising oil production. Business investment was largely unchanged in 2014. The annual rate of CPI inflation rose to a peak of 2.4% in late 2013 and early 2014. However, as the oil price fell late in the year, fuel prices declined and the annual rate of inflation dropped to 1.5% in December, below the Bank of Canada’s 2% inflation target. Monetary policy remained accommodative with the Bank of Canada keeping its policy rate at 1% throughout 2014, where it has been since September 2010.
Financial overview
Profit before tax (US$m)
Our operations in North America reported a profit before tax of US$1.4bn in 2014 compared with US$1.2bn in 2013. The increase of US$196m primarily reflected lower LICs, mainly in the US CML portfolio. This was partly offset by lower revenue, primarily reflecting continued CML run-off and a reduction in GB&M in the US. Costs were broadly unchanged as portfolio run-off broadly offset a US$550m charge in relation to a settlement with the Federal Housing Finance Authority. See page 42 for further details of significant items.
1,4171,221
694 2,111 827 2,048
2014 2013
Reported Currency translationand significant items
Adjusted profit

HSBC HOLDINGS PLC
97
Str
ateg
ic R
epo
rt
Fi
nan
cial
Rev
iew
Co
rpo
rate
Go
vern
ance
Fin
anci
al S
tate
men
ts
S
har
eho
lder
Info
rmat
ion
Profit/(loss) before tax by country within global businesses
Retail Banking and Wealth Management US$m
Commercial Banking US$m
Global Banking and Markets US$m
Global Private Banking US$m
Other US$m
Total US$m
US 513 400 (403) 82 (60) 532 Canada 96 514 242 (23) 829 Other 23 (1) 49 3 (18) 56
Year ended 31 December 2014 632 913 (112) 85 (101) 1,417 US (358) 296 633 53 (350) 274 Canada 131 506 280 (3) 914 Other 20 (16) 16 4 9 33
Year ended 31 December 2013 (207) 786 929 57 (344) 1,221 US 2,746 637 661 72 (2,901) 1,215 Canada 207 577 314 (1) (16) 1,081 Other 42 (15) (18) 1 (7) 3
Year ended 31 December 2012 2,995 1,199 957 72 (2,924) 2,299
Adjusted profit before tax was US$63m higher, reflecting a reduction in LICs and operating expenses, partially offset by a decrease in revenue.
Country business highlights
In the US, CMB added US$4.0bn in 2014 to its SME fund which supports businesses that trade or aspire to trade internationally, raising the programme’s total available funding to US$5.0bn. Of this, US$3.7bn was utilised at 31 December 2014. Corporate lending balances rose as we continued to be successful in our markets targeted for expansion, with balances in both the Midwest and the West Coast increasing by more than 25% year on year.
In RBWM, we continued to optimise the mortgage origination process to improve the customer experience and expanded our digital channel capabilities. The re-launch of our Global Premier programme along with other related campaigns led to approximately 22,000 new Premier customers being added in 2014, an increase of 25%.
Despite lower revenue in GB&M, we continued to execute our growth strategy utilising GB&M’s unique client franchise, its geographical network and product capabilities to connect our markets. In addition collaboration with CMB resulted in revenue from its clients rising by 19%.
In Canada, CMB continued to focus on the acquisition of new clients, to whom advances reached over US$1.3bn. We created a dedicated International Subsidiary Banking team to manage and support our international clients on a consistent basis. GB&M focused on increasing its multinational client base, and the Project and Export Finance business continued to reflect growth. Our focus in RBWM continued to be on developing the Premier customer base, building mortgage, credit card, and deposit balances and growing assets under management.
We continued to make progress in our strategy to accelerate the run-off and sale of our US CML portfolio. We completed the sale of several tranches of real estate secured accounts with an aggregate unpaid principal
balance of US$2.9bn during 2014 and recognised a cumulative gain on sale of US$168m. Gross lending balances in the CML portfolio, including loans held for sale, were US$25bn at 31 December 2014, a decline of US$5.8bn from 2013.
Review of adjusted performance45
Revenue (US$m)
Revenue fell in the US in RBWM, partly reflecting continued CML run-off, and in GB&M. Revenue also reduced in Canada, mainly reflecting the continued run-off of the Consumer Finance business.
Country view of adjusted revenue 2014 2013
US$m US$m
US 6,083 7,071 Canada 1,921 1,975 Other 264 293
Year ended 31 December 8,268 9,339
In the US, revenue decreased by US$988m, mainly in RBWM where lower average lending balances driven by the continued run-off and loan sales of the CML portfolio led to lower net interest income. In addition, loan yields fell, partly reflecting the sale of our higher yielding CML non-real estate personal loan portfolio, which resulted in a significant shift in product mix towards increased levels of lower yielding first lien real estate loans. Revenue also declined due to lower deposit volumes and narrower deposit spreads. The fall in revenue was partly offset by
8,1528,803
116 8,268536 9,339
2014 2013
Reported Currency translationand significant items
Adjusted revenue

Report of the Directors: Geographical regions (continued) North America
HSBC HOLDINGS PLC
98
releases of mortgage loan repurchase obligations related to loans previously sold, which compared with provisions in 2013.
Revenue decreased in GB&M, driven by a reduction in Balance Sheet Management income due to lower reported gains on sales of available-for-sale debt securities as a result of our ongoing portfolio repositioning for risk management purposes, and the adverse performance of economic hedges used to manage interest rate risk. Credit revenue also reduced, primarily in our legacy credit portfolio partly reflecting net adverse fair value movements on the portfolio.
By contrast, revenue increased in CMB, mainly reflecting increased lending balances in markets targeted for expansion and higher income in GB&M from increased collaboration in acquisition financing activity.
In Canada, revenue decreased by US$54m, mainly in RBWM reflecting a fall in net interest income due to lower average lending balances from the continued run-off of the Consumer Finance business. Excluding this, RBWM revenues rose, driven by higher fees partly reflecting increased sales of wealth management products. In CMB, revenues also increased, largely because of the non-recurrence of a reduction in the fair value of an investment property held for sale and recognised in 2013. By contrast, GB&M revenue decreased, reflecting lower trading income from foreign exchange and a reduction in reported gains on sales of available-for-sale debt securities.
LICs fell, mainly in the CML portfolio reflecting reduced levels of delinquency, new impaired loans and lower lending balances from the continued run-off and loan sales. This was partly offset by less favourable market value adjustments to underlying property prices because improvements in housing market conditions were less pronounced in 2014 than in 2013. LICs also fell in Principal RBWM, mainly reflecting lower levels of delinquency, and in Canada in CMB from lower individually and collectively assessed impairment charges.
Operating expenses (US$m)
Operating expenses decreased by US$285m, primarily in the US, reflecting lower divestiture costs as our former Cards business reached the end of the data separation process, and lower average staff numbers and costs resulting from the continued run-off and sales of tranches of our CML portfolio. In addition, we also achieved over US$185m of sustainable cost savings, primarily reflecting organisational effectiveness initiatives. Partly offsetting the lower operating expenses were higher legal costs and the growth in costs associated with Regulatory Programmes and Compliance, reflecting our continued investment in Global Standards.
6,429 6,416
(578)
5,851(280)
6,136
2014 2013
Reported Currency translationand significant items
Adjusted operating expenses

HSBC HOLDINGS PLC
99
Str
ateg
ic R
epo
rt
Fi
nan
cial
Rev
iew
Co
rpo
rate
Go
vern
ance
Fin
anci
al S
tate
men
ts
S
har
eho
lder
Info
rmat
ion
Profit/(loss) before tax and balance sheet data – North America 2014
Retail Banking and Wealth
Management US$m
CommercialBanking
US$m
GlobalBanking and
MarketsUS$m
GlobalPrivate
BankingUS$m
Other US$m
Inter- segment
elimination55
US$m Total
US$m Profit/(loss) before tax
Net interest income 2,645 1,455 587 204 157 (33) 5,015
Net fee income/(expense) 497 572 775 130 (34) 1,940
Trading income/(expense) excluding net interest income (165) 34 302 13 3 187
Net interest income/(expense) on trading activities 7 1 183 33 224
Net trading income/(expense)50 (158) 35 485 13 3 33 411
Changes in fair value of long-term debt issued and related derivatives (99) (99)
Net income from other financial instruments designated at fair value
Net expense from financial instruments designated at fair value (99) (99)
Gains less losses from financial investments 15 237 5 257
Dividend income 13 8 16 3 4 44Net insurance premium income Other operating income 268 61 101 1 1,872 (1,719) 584Total operating income 3,265 2,146 2,201 351 1,908 (1,719) 8,152
Net insurance claims56
Net operating income4 3,265 2,146 2,201 351 1,908 (1,719) 8,152
Loan impairment (charges)/ recoveries and other credit risk provisions (117) (148) (63) 8 (2) (322)
Net operating income 3,148 1,998 2,138 359 1,906 (1,719) 7,830
Total operating expenses (2,516) (1,101) (2,250) (274) (2,007) 1,719 (6,429)Operating profit/(loss) 632 897 (112) 85 (101) 1,401
Share of profit in associates and joint ventures 16 16
Profit/(loss) before tax 632 913 (112) 85 (101) 1,417 % % % % % %
Share of HSBC’s profit before tax 3.4 4.9 (0.6) 0.5 (0.5) 7.6Cost efficiency ratio 77.1 51.3 102.2 78.1 105.2 78.9 Balance sheet data40 US$m US$m US$m US$m US$m US$mLoans and advances to customers
(net)27 60,365 41,966 21,110 6,346 – 129,787 Total assets 74,680 48,411 319,819 8,386 16,823 (31,260) 436,859Customer accounts27 51,258 45,275 30,301 12,050 – 138,884

Report of the Directors: Geographical regions (continued) North America / Latin America
HSBC HOLDINGS PLC
100
2013
Retail Banking and Wealth
Management US$m
CommercialBanking
US$m
GlobalBanking and
MarketsUS$m
GlobalPrivate
BankingUS$m
Other US$m
Inter- segment
elimination55
US$m Total
US$m Profit/(loss) before tax
Net interest income 3,483 1,430 582 195 89 (37) 5,742
Net fee income 605 593 741 125 79 2,143
Trading income excluding net interest income 48 40 613 19 7 727
Net interest income on trading activities 11 1 172 37 221
Net trading income50 59 41 785 19 7 37 948
Changes in fair value of long-term debt issued and related derivatives – – – (288) – (288)
Net income from other financial instruments designated at fair value
Net expense from financial instruments designated at fair value (288) (288)
Gains less losses from financial investments 4 282 8 294
Dividend income 12 9 48 4 4 77Net insurance premium income 34 – – – – – 34Other operating income/
(expense) (454) 229 1 1,829 (1,713) (108)
Total operating income 3,743 2,073 2,667 344 1,728 (1,713) 8,842
Net insurance claims56 (39) (39)
Net operating income4 3,704 2,073 2,667 344 1,728 (1,713) 8,803
Loan impairment charges and other credit risk provisions (950) (223) (20) (4) (1,197)
Net operating income 2,754 1,850 2,647 340 1,728 (1,713) 7,606
Total operating expenses (2,960) (1,096) (1,718) (283) (2,072) 1,713 (6,416)
Operating profit/(loss) (206) 754 929 57 (344) 1,190
Share of profit/(loss) in associates and joint ventures (1) 32 31
Profit/(loss) before tax (207) 786 929 57 (344) 1,221 % % % % % %
Share of HSBC’s profit before tax (0.9) 3.5 4.1 0.3 (1.6) 5.4Cost efficiency ratio 79.9 52.9 64.4 82.3 119.9 72.9 Balance sheet data40 US$m US$m US$m US$m US$m US$mLoans and advances to customers
(net)27 66,192 37,735 18,070 5,956 127,953 Total assets 82,530 45,706 313,701 8,542 13,211 (31,655) 432,035Customer accounts27 53,600 49,225 24,113 13,871 140,809
For footnotes, see page 109.

HSBC HOLDINGS PLC
101
Str
ateg
ic R
epo
rt
Fi
nan
cial
Rev
iew
Co
rpo
rate
Go
vern
ance
Fin
anci
al S
tate
men
ts
S
har
eho
lder
Info
rmat
ion
Latin America Our operations in Latin America principally comprise HSBC Bank Brasil S.A.-Banco Múltiplo, HSBC México, S.A. and HSBC Bank Argentina S.A. In addition to banking services, we operate insurance businesses in Brazil, Mexico and Argentina.
2014 2013 2012 US$m US$m US$m
Net interest income 5,310 6,186 6,984 Net fee income 1,415 1,701 1,735 Net trading income 856 936 971 Other income 691 1,745 1,261
Net operating income4 8,272 10,568 10,951
LICs43 (2,124) (2,666) (2,137)
Net operating income 6,148 7,902 8,814
Total operating expenses (5,932) (5,930) (6,430)
Operating profit 216 1,972 2,384
Income from associates44 –
Profit before tax 216 1,972 2,384
Cost efficiency ratio 71.7% 56.1% 58.7% RoRWA36 0.2% 2.0% 2.4%
Year-end staff numbers 41,201 42,542 46,556
Further progress made in repositioning our businesses in Brazil and Mexico
Loan House and Bond House of the Year (LatinFinance, 2014)
#1 in Domestic Cash Management
in Argentina and Mexico (Euromoney Cash Management Survey, 2014)
For footnotes, see page 109.
Economic background
Data for the third quarter of 2014 suggested that Latin America may have seen a material slowdown in its average real annual GDP growth in 2014 to nearly 1.0% from 2.6% in 2013.
A slowdown in the Brazilian economy explains much of this weakness. The level of economic activity was broadly unchanged in 2014 following growth of 2.5% in 2013, but deteriorating business confidence and the resulting contraction in business investment spending were the main factors behind the economic slowdown. To mitigate inflationary pressures from a weakening currency, the central bank raised the key policy rate by 75bps in the fourth quarter to 11.75%.
Mexico’s economic growth accelerated in 2014 after low real GDP growth of only 1.1% in 2013. Consumer spending, the main area of weakness in 2013, accelerated during the year and the improvement in US demand served to boost exports. Inflationary pressures remained muted and the Mexican central bank cut its key policy rate to 3% from 3.5% at the start of the year.
The Argentinian economy contracted in 2014 due to falling commodity prices, a stagnant Brazilian economy and a technical default on the dollar-denominated external debt of the country. A significant devaluation of the Argentine peso at the beginning of 2014 fuelled higher inflation.
Financial overview
Profit before tax (US$m)
Latin America reported a profit before tax of US$216m in 2014 compared with US$2.0bn in 2013. The reduction was due to lower revenue, primarily driven by the non-recurrence of the US$1.1bn gain on sale of our operations in Panama in 2013 partly offset by a decrease in LICs.
Adjusted profit before tax decreased by US$326m, and included a loss before tax in Brazil. The reduction in profit primarily reflected higher operating expenses, mainly due to inflationary and union-agreed salary increases in Brazil and Argentina, and lower revenue in Mexico and Brazil as we progressed with repositioning our business. These factors were partly offset by an increase in revenue in Argentina and a reduction in LICs, primarily in Mexico.
216
1,972
108 324 (1,322)
650
2014 2013
Reported Currency translationand significant items
Adjusted profit

Report of the Directors: Geographical regions (continued) Latin America
HSBC HOLDINGS PLC
102
Profit/(loss) before tax by country within global businesses
Retail Bankingand Wealth
ManagementUS$m
Commercial Banking
US$m
GlobalBanking and
MarketsUS$m
GlobalPrivate
BankingUS$m
Other US$m
TotalUS$m
Argentina 52 135 219 (22) 384Brazil (174) (153) 115 (2) (33) (247)Mexico 36 (52) 89 (2) (20) 51Other (4) 7 27 (2) 28
Year ended 31 December 2014 (90) (63) 450 (4) (77) 216 Argentina 97 142 170 (1) 408Brazil (114) (43) 514 5 (11) 351Mexico 154 (160) 115 (3) 11 117Other 289 525 368 (1) (85) 1,096
Year ended 31 December 2013 426 464 1,167 1 (86) 1,972 Argentina 209 169 174 – (46) 506Brazil 94 359 696 17 (43) 1,123Mexico 338 176 201 2 (18) 699Other (33) 47 82 1 (41) 56
Year ended 31 December 2012 608 751 1,153 20 (148) 2,384
Country business highlights
In 2014, in our priority growth markets of Brazil, Mexico and Argentina, we continued to implement strategic initiatives to improve future returns whilst we faced economic and inflationary pressures. In Brazil, we made progress in our efforts to transform the business in order to ensure its long-term sustainability. In RBWM, we are updating our business model by concentrating RMs on specific client segments in order to better serve customer needs. We also updated certain features of our lending products to improve our competitiveness such as increasing the duration of some of our personal loans, and further strengthened our retail credit capabilities to improve the quality of originations. We continued to rationalise our branch network, closing 21 branches in areas with lower growth potential as we concentrated our efforts on city clusters with faster-growing revenue pools, and launching 60 client service units with a focus on sales and automated transactions. In CMB, we increased MME market presence and in RBWM we grew lending by 4% following contraction in the past two years. In addition, we saw increased client activity in GB&M, mainly in our Rates business.
In Mexico, we remained focused on achieving sustainable growth although revenue was subdued. In RBWM we introduced RMs dedicated to our Advance segment to improve productivity and customer experience. We launched a balance transfer campaign, selectively increased credit limits for lower risk customers and saw mortgage balances grow by 5% reflecting competitive pricing. In CMB we improved processes in the Business Banking segment to allow RMs to better support their clients. In GB&M, lending balances rose by 48% as a result of new business initiatives following energy reforms in the second half of 2014. We made strong progress on repositioning our business, which has reduced customer numbers, and continued to focus on streamlining, managing our cost
base and strengthening our risk management and controls.
In Argentina, we continued to manage our business conservatively as the economic environment remained challenging. We focused our growth on GB&M and corporate CMB customers and continued to follow cautious lending policies in RBWM and Business Banking. We retained leading market positions in Trade and Foreign Exchange.
Review of adjusted performance45
Revenue (US$m)
Revenue was higher in Argentina due to favourable results in GB&M and growth in RBWM and CMB. This was partly offset by reductions in Mexico across all global businesses and in Brazil, primarily in CMB and GB&M.
Country view of adjusted revenue 2014 2013
US$m US$m
Argentina 1,070 718 Brazil 4,821 4,932 Mexico 2,304 2,479 Other 58 (54)
Year ended 31 December 8,253 8,075
8,272
10,568
(19)
8,253
(2,493)
8,075
2014 2013
Reported Currency translationand significant items
Adjusted revenue

HSBC HOLDINGS PLC
103
Str
ateg
ic R
epo
rt
Fi
nan
cial
Rev
iew
Co
rpo
rate
Go
vern
ance
Fin
anci
al S
tate
men
ts
S
har
eho
lder
Info
rmat
ion
In Argentina, revenue increased by US$352m, primarily in GB&M, together with growth in RBWM and CMB. In GB&M, the increase reflected favourable trading results and higher revenue in Balance Sheet Management, as volumes and spreads related to short-term funds grew in a volatile market.
Revenue increased in RBWM, primarily due to growth in insurance revenue from higher investment income which reflected movements in the bond markets. In addition, revenue rose from increased net interest income, driven by wider spreads due to higher interest rates coupled with growth in average deposit balances. In CMB, revenue increased due to growth in net interest income reflecting wider spreads due to an increase in interest rates, higher average lending balances and growth in Payments and Cash Management deposit balances. Higher balances also led to increased fees from both Payments and Cash Management and Trade products.
In Mexico, revenue decreased by US$175m, mainly in RBWM and, to a lesser extent, in CMB and GB&M.
In RBWM, revenue fell primarily due to lower sales volumes in the insurance business. Revenue was also adversely affected as we continued to progress with repositioning the business. In addition, we experienced narrower liability spreads on current accounts, savings and deposits following a decrease in interest rates although the effect was partly offset by higher mortgage balances.
In CMB, net interest income decreased due to asset spread compression and a reduction in average lending balances. This was notably in Business Banking, where we continued to reposition the business, there were pre-payments by a small number of large corporates and a portion of loans to certain homebuilders were written off. Net interest income was also adversely affected by narrower deposit spreads following a decrease in interest rates. In addition, fee income decreased as a result of lower Account Services and Payments and Cash Management fees reflecting fewer customers, as we continued to reposition the business.
In GB&M, lower revenue was primarily due to market movements which affected counterparty credit spreads resulting in increased CVA charges, and lower gains on disposal of available-for-sale securities.
In Brazil, revenue decreased in CMB and GB&M, while RBWM remained broadly unchanged. In CMB, revenue was lower, despite growth in overall lending balances, as the portfolio mix changed to reflect an increase in lower-yielding MMEs.
In GB&M, revenue reduced in Balance Sheet Management, though this was partly offset by growth
in Rates revenue, driven by higher client activity. Revenue in RBWM was broadly unchanged. Insurance revenue increased due to favourable movements in the PVIF asset compared with adverse movements in 2013. This was offset by a decrease in fee income across a number of products, in part reflecting a change in mix by customers towards more secured, lower-yielding assets and strong market competition.
LICs fell, primarily in Mexico and, to a lesser extent, in Brazil.
In Mexico, LICs improved due to lower individually assessed charges in CMB, in particular relating to certain homebuilders following a change in the public housing policy in 2013, and in GB&M due to the non-recurrence of a large specific provision booked in 2013.
In Brazil, the fall was driven by changes to the impairment model and assumption revisions for restructured loan account portfolios which occurred in 2013 in both RBWM and CMB. In addition, collectively assessed impairments reduced in CMB, notably in Business Banking, reflecting improved delinquency rates. This was partly offset by an increase in GB&M driven by an individually assessed impairment and a provision made against a guarantee.
Operating expenses (US$m)
Operating expenses increased by US$796m, primarily in Brazil and Argentina, largely due to union-agreed salary increases and inflationary pressures. In addition, we saw higher transactional taxes in Argentina in line with a growth in revenue and increased infrastructure costs across the region. We also incurred specific costs in Brazil in 2014 relating to an accelerated depreciation charge and an impairment of an intangible asset in RBWM. Despite these factors, our strict cost control continued and we progressed with our strategic focus on streamlining, which resulted in sustainable cost savings of over US$155m.
5,932 5,930
(125)
5,807
(919)
5,011
2014 2013
Reported Currency translationand significant items
Adjusted operating expenses
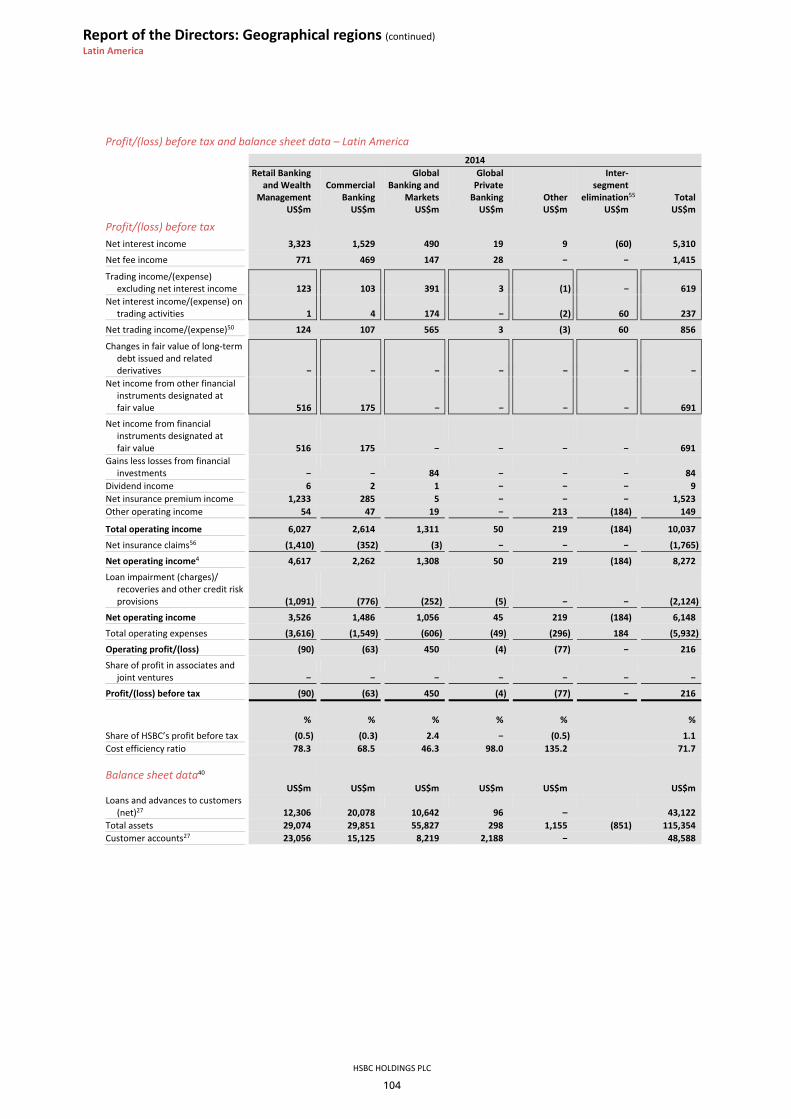
Report of the Directors: Geographical regions (continued) Latin America
HSBC HOLDINGS PLC
104
Profit/(loss) before tax and balance sheet data – Latin America 2014
Retail Banking and Wealth
Management US$m
CommercialBanking
US$m
GlobalBanking and
MarketsUS$m
GlobalPrivate
BankingUS$m
Other US$m
Inter- segment
elimination55
US$m Total
US$m
Profit/(loss) before tax Net interest income 3,323 1,529 490 19 9 (60) 5,310
Net fee income 771 469 147 28 1,415
Trading income/(expense) excluding net interest income 123 103 391 3 (1) 619
Net interest income/(expense) on trading activities 1 4 174 (2) 60 237
Net trading income/(expense)50 124 107 565 3 (3) 60 856
Changes in fair value of long-term debt issued and related derivatives
Net income from other financial instruments designated at fair value 516 175 691
Net income from financial instruments designated at fair value 516 175 691
Gains less losses from financial investments 84 84
Dividend income 6 2 1 9Net insurance premium income 1,233 285 5 1,523Other operating income 54 47 19 213 (184) 149
Total operating income 6,027 2,614 1,311 50 219 (184) 10,037
Net insurance claims56 (1,410) (352) (3) (1,765)
Net operating income4 4,617 2,262 1,308 50 219 (184) 8,272
Loan impairment (charges)/ recoveries and other credit risk provisions (1,091) (776) (252) (5) (2,124)
Net operating income 3,526 1,486 1,056 45 219 (184) 6,148
Total operating expenses (3,616) (1,549) (606) (49) (296) 184 (5,932)
Operating profit/(loss) (90) (63) 450 (4) (77) 216
Share of profit in associates and joint ventures
Profit/(loss) before tax (90) (63) 450 (4) (77) 216 % % % % % %
Share of HSBC’s profit before tax (0.5) (0.3) 2.4 (0.5) 1.1Cost efficiency ratio 78.3 68.5 46.3 98.0 135.2 71.7 Balance sheet data40 US$m US$m US$m US$m US$m US$mLoans and advances to customers
(net)27 12,306 20,078 10,642 96 – 43,122 Total assets 29,074 29,851 55,827 298 1,155 (851) 115,354Customer accounts27 23,056 15,125 8,219 2,188 48,588

HSBC HOLDINGS PLC
105
Str
ateg
ic R
epo
rt
Fi
nan
cial
Rev
iew
Co
rpo
rate
Go
vern
ance
Fin
anci
al S
tate
men
ts
S
har
eho
lder
Info
rmat
ion
2013
Retail Banking and Wealth
Management US$m
CommercialBanking
US$m
GlobalBanking and
MarketsUS$m
GlobalPrivate
BankingUS$m
Other US$m
Inter- segment
elimination55
US$m Total
US$m
Profit/(loss) before tax
Net interest income/(expense) 3,776 1,828 775 24 (12) (205) 6,186
Net fee income 952 548 168 32 1 1,701
Trading income/(expense) excluding net interest income 138 117 456 4 (4) 711
Net interest income on trading activities 20 205 225
Net trading income/(expense)50 138 117 476 4 (4) 205 936
Changes in fair value of long-term debt issued and related derivatives
Net income from other financial instruments designated at fair value 264 61 1 326
Net income from financial instruments designated at fair value 264 61 1 326
Gains less losses from financial investments 1 81 82
Dividend income 5 3 1 9Net insurance premium income 1,464 360 6 1,830Other operating income 312 485 310 1 196 (189) 1,115
Total operating income 6,911 3,403 1,818 61 181 (189) 12,185
Net insurance claims56 (1,323) (291) (3) (1,617)
Net operating income4 5,588 3,112 1,815 61 181 (189) 10,568
Loan impairment charges and other credit risk provisions (1,552) (1,062) (52) (2,666)
Net operating income 4,036 2,050 1,763 61 181 (189) 7,902
Total operating expenses (3,610) (1,586) (596) (60) (267) 189 (5,930)
Operating profit/(loss) 426 464 1,167 1 (86) 1,972
Share of profit in associates and joint ventures
Profit/(loss) before tax 426 464 1,167 1 (86) 1,972 % % % % % %
Share of HSBC’s profit before tax 1.9 2.0 5.2 (0.4) 8.7Cost efficiency ratio 64.6 51.0 32.8 98.4 147.5 56.1 Balance sheet data40 US$m US$m US$m US$m US$m US$mLoans and advances to customers
(net)27 13,616 19,923 10,304 75 43,918 Total assets 30,584 30,001 52,977 337 634 (534) 113,999Customer accounts27 23,943 16,593 8,994 1,859 51,389
For footnotes, see page 109.

Report of the Directors: Other information FuM/Taxes paid/Property/Disclosure philosophy
HSBC HOLDINGS PLC
106
Other information Funds under management and assets held in custody 106
Taxes paid by region and country 106
Property 107
Our disclosure philosophy 107
Disclosures arising from EDTF recommendations 108
Funds under management and assets held in custody Funds under management59 2014 2013 US$bn US$bnFunds under management At 1 January 921 910Net new money 38 (18)Value change 40 34Exchange and other (45) (5)
At 31 December 954 921 2014 2013 US$bn US$bnFunds under management by
business
Global Asset Management 445 420Global Private Banking 275 282Affiliates 5 5Other 229 214
At 31 December 954 921
For footnote, see page 109.
Funds under management (‘FuM’) at 31 December 2014 amounted to US$954bn, an increase of 4%, primarily due to favourable market movements and net inflows in the year.
Global Asset Management FuM increased by 6% to US$445bn as we attracted US$29bn of net new money, notably in fixed income products from our customers in Europe and Asia, as well as from net inflows into liquidity funds in Europe and North America. In addition, we transferred FuM of US$18bn which had previously been reported within Other FuM and we benefited from favourable movements in equity and bond markets. These increases were partly offset by adverse foreign exchange movements reflecting the strengthening of the US dollar against all major currencies.
GPB FuM decreased by 3% to US$275bn due to the ongoing repositioning of our client base, which gave rise to disposals of a portfolio of assets in Switzerland to LGT Bank (Switzerland) Ltd and our HSBC Trinkaus & Burkhardt AG business in Luxembourg with a combined
FuM of US$8bn, and negative net new money in Europe. In addition, there were unfavourable foreign exchange movements, mainly in Europe. This was partly offset by favourable market movements, also principally in Europe, and from positive net new money in areas targeted for growth.
Other FuM increased by 7% to US$229bn, primarily due to strong net inflows and favourable market movements. This was partly offset by the transfer of FuM into Global Asset Management noted above.
Assets held in custody59 and under administration
Custody is the safekeeping and servicing of securities and other financial assets on behalf of clients. At 31 December 2014, we held assets as custodian of US$6.4 trillion, 3% higher than the US$6.2 trillion held at 31 December 2013. This was mainly driven by incremental net asset inflows in Asia and Europe, and notably in Middle East and North Africa, partly offset by adverse foreign exchange movements.
Our assets under administration business, which includes the provision of bond and loan administration services and the valuation of portfolios of securities and other financial assets on behalf of clients, complements the custody business. At 31 December 2014, the value of assets held under administration by the Group amounted to US$3.2 trillion, which was 6% higher than at 31 December 2013. This was mainly driven by incremental net asset inflows in the Funds business in Europe and Asia, which was partly offset by adverse foreign exchange movements.
Taxes paid by region and country The following tables reflect a geographical view of HSBC’s operations and the basis of preparation is aligned to the Group’s approach in meeting its country-by- country reporting obligations as laid out in Article 89 of the EU’s CRD IV.
Breakdown of tax paid by region60 2014
US$bn 2013
US$bn Region UK 2.4 2.1Rest of Europe 1.3 1.5Asia 2.7 2.5Middle East and North Africa 0.2 0.3North America (0.1) 0.4Latin America 1.4 1.8
Total 7.9 8.6
For footnote, see page 109.

HSBC HOLDINGS PLC
107
Str
ateg
ic R
epo
rt
Fin
anci
al R
evie
w
Co
rpo
rate
Gov
ern
ance
Fi
nan
cial
Sta
tem
ents
S
har
eho
lder
Info
rmat
ion
Taxes paid by country60
2014 2013 2012 US$m US$m US$mTotal taxes paid analysed
by regions Asia 2,687 2,536 2,639Home and priority growth
markets 2,399 2,185 2,225 – Hong Kong 1,273 1,248 974– Mainland China 278 207 276– India 290 318 349– Australia 204 105 209– Malaysia 133 106 193– Indonesia 76 74 113– Singapore 101 88 89– Taiwan 44 39 22
Other markets 288 351 414
Europe 3,709 3,570 3,213Home and priority growth
markets 3,466 3,326 3,021 – UK 2,363 2,107 1,906– France 790 844 679– Germany 131 151 200– Switzerland 107 142 160– Turkey 75 82 76
Other markets 243 244 192
Middle East and North Africa 210 251 284
Priority growth markets 162 213 234– UAE 102 98 120– Egypt 60 115 114
Other markets 48 38 50
North America (108) 414 1,236Priority growth markets
– US (377) 125 798– Canada 269 285 434
Other markets – 4 4
Latin America 1,384 1,836 1,977Priority growth markets 1,338 1,645 1,835
– Brazil 804 1,002 1,174– Argentina 333 318 391– Mexico 201 325 270
Other markets 46 191 142
Total 7,882 8,607 9,349
For footnote, see page 109.
Property At 31 December 2014, we operated from some 7,885 operational properties worldwide, of which approximately 1,965 were located in Europe, 2,500 in Asia, 450 in North America, 2,700 in Latin America and 275 in the Middle East and North Africa. These properties had an area of approximately 54.3m square feet (2013: 56.6m square feet).
Our freehold and long leasehold properties, together with all our leasehold land in Hong Kong, were valued in 2014. The value of these properties was US$10.8bn
(2013: US$10.3bn) in excess of their carrying amount in the consolidated balance sheet on an historical cost based measure. In addition, properties with a net book value of US$1.6bn (2013: US$1.5bn) were held for investment purposes.
Our operational properties are stated at cost, being historical cost or fair value at the date of transition to IFRSs (their deemed cost) less any impairment losses, and are depreciated on a basis calculated to write off the assets over their estimated useful lives. Properties owned as a consequence of an acquisition are recognised initially at fair value. Further details are included in Note 23 on the Financial Statements.
Our disclosure philosophy HSBC strives to maintain the highest standards of disclosure in our reporting.
It has long been our policy to provide disclosures that help investors and other stakeholders understand the Group’s performance, financial position and changes thereto. In accordance with this policy:
• In order to make the financial statements and notes thereon easier to understand, we have undertaken an initiative to provide more focused information and to remove duplication where possible. As a result, we have changed the location and the wording used to describe certain accounting policies within the notes, removed certain immaterial disclosures and changed the order of certain sections. In applying materiality to financial statement disclosures, we consider both the amount and nature of each item. The main changes to the presentation of the financial statements and notes thereon in 2014 are described on pages 346 and 347.
• The information provided in the ‘Notes on the Financial Statements’ and the ‘Report of the Directors’ goes beyond the minimum levels required by accounting standards, statutory and regulatory requirements and listing rules. In particular, we provide additional disclosures having regard to the recommendations of the Enhanced Disclosures Task Force (‘EDTF’) report ‘Enhancing the Risk Disclosures of Banks’ issued in October 2012. The report aims to help financial institutions identify areas that investors had highlighted needed better and more transparent information about banks’ risks, and how these risks relate to performance measurement and reporting. In addition, we continue to enhance our disclosures in line with good practice recommendations issued by relevant regulators and standard setters and in response to feedback received from users of our financial statements.

Report of the Directors: Other information (continued) EDTF disclosures/Footnotes
HSBC HOLDINGS PLC
108
Disclosures arising from EDTF recommendations Type of risk Recommendation Disclosure PageGeneral 1 The risks to which the business is exposed. 112 to 117 2 Our risk appetite and stress testing. 117 to 118 3 Top and emerging risks, and the changes during the reporting period. 118 to 124 4 Discussion of future regulatory developments affecting our business
model and Group profitability, and its implementation in Europe. 119 to 120 and 252 to
256Risk governance, risk
management and business model
5 Group Risk Committee, and their activities. 280 to 2816 Risk culture and risk governance and ownership. 1117 Diagram of the risk exposure by global business segment. 22
8 Stress testing and the underlying assumptions. 117 to 118Capital adequacy and
risk-weighted assets 9 Pillar 1 capital requirements.
For calculation of Pillar 1 capital requirements, see the Pillar 3 Disclosures 2014 document. 258 to 259
10 Reconciliation of the accounting balance sheet to the regulatory balance sheet. 249
11 Flow statement of the movements in regulatory capital since the previous reporting period, including changes in the different tiers of regulatory capital. 245
12 Discussion of targeted level of capital, and the plans on how to establish this. 239 and 252 to 258
13 Analysis of risk-weighted assets by risk type, global business and geographical region, and market risk RWAs. 240
14 For analysis of the capital requirements for each Basel asset class, see the Pillar 3 Disclosures 2014 document.
15 For analysis of credit risk for each Basel asset class, see the Pillar 3 Disclosures 2014 document.
16 Flow statements reconciling the movements in risk-weighted assets for each risk-weighted asset type. 242 to 244
17 For discussion of Basel credit risk model performance, see the Pillar 3 Disclosures 2014 document.
Liquidity 18 Analysis of the Group’s liquid asset buffer. 165 to 166Funding 19 Encumbered and unencumbered assets analysed by balance sheet
category. 171 to 173 20 Consolidated total assets, liabilities and off-balance sheet commitments
analysed by remaining contractual maturity at the balance sheet date. 426 to 435 21 Analysis of the Group’s sources of funding and a description of our
funding strategy. 168Market risk 22 Relationship between the market risk measures for trading and
non-trading portfolios and the balance sheet, by business segment. 179 to 180 23 Discussion of significant trading and non-trading market risk factors. 176 to 179 24 VaR assumptions, limitations and validation. 223 to 224 25 Discussion of stress tests, reverse stress tests and stressed VaR. 224 to 225Credit risk 26 Analysis of the aggregate credit risk exposures, including details of both
personal and wholesale lending. 129 to 130 27 Discussion of the policies for identifying impaired loans, defining
impairments and renegotiated loans, and explaining loan forbearance policies. 137 and 208 to 213
28 Reconciliations of the opening and closing balances of impaired loans and impairment allowances during the year. 137 and 142 to 143
29 Analysis of counterparty credit risk that arises from derivative transactions. 150 to 151
30 Discussion of credit risk mitigation, including collateral held for all sources of credit risk. 146 to 150
Other risks 31 Quantified measures of the management of operational risk. 187 to 189 32 Discussion of publicly known risk events. 118 to 124
The 32 recommendations listed above were made in the report ‘Enhancing the Risk Disclosures of Banks’ issued by the Enhanced Disclosure Task Force of the Financial Stability Board in October 2012.

HSBC HOLDINGS PLC
109
Str
ateg
ic R
epo
rt
Fin
anci
al R
evie
w
Co
rpo
rate
Gov
ern
ance
Fi
nan
cial
Sta
tem
ents
S
har
eho
lder
Info
rmat
ion
Footnotes to pages 40 to 108
Use of non-GAAP financial measures 1 The operating results of these disposals were removed from adjusted results in addition to disposal gains and losses. 2 The operating results of these disposals and acquisitions were not removed from adjusted results as they were not significant. 3 Excludes items where there are substantial offsets in the income statement for the same year. 4 Net operating income before loan impairment charges and other credit risk provisions, also referred to as revenue. 5 Positive numbers are favourable: negative numbers are unfavourable. 6 ‘Currency translation adjustment’ is the effect of translating the results of subsidiaries and associates for the previous year at the average rates
of exchange applicable in the current year. 7 ‘Own credit spread’ includes the fair value movements on our long-term debt attributable to credit spread where the net result of such
movements will be zero upon maturity of the debt. This does not include fair value changes due to own credit risk in respect of trading liabilities or derivative liabilities.
8 From 1 January 2014, the geographical region ‘Asia’ replaced the geographical regions previously reported as ‘Hong Kong’ and ‘Rest of Asia-Pacific’ (see Note 11 on the Financial Statements for further details). Comparative data have been represented accordingly.
Consolidated income statement 9 Dividends recorded in the financial statements are dividends per ordinary share declared in a year and are not dividends in respect of, or for,
that year. For further information, see footnote 3 on page 39. 10 Dividends per ordinary share expressed as a percentage of basic earnings per share. 11 Net interest income includes the cost of internally funding trading assets, while the related external revenues are reported in ‘Trading income’.
In our global business results, the cost of funding trading assets is included with Global Banking and Market’s net trading income as interest expense.
12 Gross interest yield is the average annualised interest rate earned on average interest-earning assets (‘AIEA’). 13 Net interest spread is the difference between the average annualised interest rate earned on AIEA, net of amortised premiums and loan fees,
and the average annualised interest rate paid on average interest-bearing funds. 14 Net interest margin is net interest income expressed as an annualised percentage of AIEA. 15 Interest income on trading assets is reported as ‘Net trading income’ in the consolidated income statement. 16 Interest income on financial assets designated at fair value is reported as ‘Net income from financial instruments designated at fair value’ in the
consolidated income statement. 17 Including interest-bearing bank deposits only. 18 Interest expense on financial liabilities designated at fair value is reported as ‘Net income on financial instruments designated at fair value’ in
the consolidated income statement, other than interest on own debt which is reported in ‘Interest expense’. 19 Including interest-bearing customer accounts only. 20 Net trading income includes a favourable movement of US$15m (2013: unfavourable movement of US$66m; 2012: unfavourable movement of
US$629m), associated with changes in the fair value of issued structured notes and other hybrid instrument liabilities arising from movements in HSBC issuance spreads.
21 Trading income also includes movements on non-qualifying hedges. These hedges are derivatives entered into as part of a documented interest rate management strategy for which hedge accounting was not, nor could be, applied. They are principally cross-currency and interest rate swaps used to economically hedge fixed rate debt issued by HSBC Holdings and floating rate debt issued by HSBC Finance. The size and direction of the changes in the fair value of non-qualifying hedges that are recognised in the income statement can be volatile from year-to-year, but do not alter the cash flows expected as part of the documented interest rate management strategy for both the instruments and the underlying economically hedged assets and liabilities if the derivative is held to maturity.
22 In 2013, we recorded a net gain on US$553m on the completion of the Ping An disposal. This represented the net effect of US$1,235m gain on de-recognition of equity securities classified as available for sale and recorded in ‘Gains less losses from financial investments’, partly offset by US$682m on a contingent forward sale contract, recorded in ‘Net trading income’.
23 Other changes in fair value include gains and losses arising from changes in the fair value of derivatives that are managed in conjunction with HSBC’s long-term debt issued.
24 Net insurance claims and benefits paid and movement in liabilities to policyholders arise from both life and non-life insurance business. For non-life business, amounts reported represent the cost of claims paid during the year and the estimated cost of incurred claims. For life business, the main element of claims is the liability to policyholders created on the initial underwriting of the policy and any subsequent movement in the liability that arises, primarily from the attribution of investment performance to savings-related policies. Consequently, claims rise in line with increases in sales of savings-related business and with investment market growth.
25 The cost efficiency ratio is defined as total operating expenses divided by net operating income before loan impairment charges and other credit risk provisions.
Consolidated balance sheet 26 In 2013, GB&M changed the way it manages reverse repo and repo activities in the Credit and Rates business. This led to a decrease in amounts
classified as ‘Trading assets’ and ‘Trading liabilities’ in the balance sheet and an increase in the amount classified as ‘Non-trading reverse repos’ at amortised cost and ‘Non-trading repos’ at amortised cost respectively.
27 From 1 January 2014, non-trading reverse repos and repos are presented as separate lines in the balance sheet. Previously, non-trading reverse repos were included within ‘Loans and advances to banks’ and ‘Loans and advances to customers’ and non-trading repos were included within ‘Deposits by banks’ and ‘Customer accounts’. Comparative data have been re-presented accordingly. Non-trading reverse repos and repos have been presented as separate lines in the balance sheet to align disclosure with market practice and provide more meaningful information in relation to loans and advances. The extent to which reverse repos and repos represent loans to/from customers and banks is set out in Note 17 on the Financial Statements.
28 Net of impairment allowances. 29 On 1 January 2014, CRD IV came into force and the calculation of capital resources and risk-weighted assets at 31 December 2014 are
calculated and presented on this basis. 2011 to 2013 comparatives are on a Basel 2.5 basis. 2010 comparatives are on a Basel II basis. 30 Capital resources are total regulatory capital, the calculation of which is set out on page 246. 31 Including perpetual preferred securities, details of which can be found in Note 30 on the Financial Statements. 32 The definition of net asset value per ordinary share is total shareholders’ equity, less non-cumulative preference shares and capital securities,
divided by the number of ordinary shares in issue excluding shares the company has purchased and are held in treasury.

Report of the Directors: Other information / Risk Footnotes / Risk profile
HSBC HOLDINGS PLC
110
33 ‘Currency translation adjustment’ is the effect of translating the assets and liabilities of subsidiaries and associates for the previous year-end at the rates of exchange applicable at the current year-end.
34 Balance included in disposal groups of assets held for sale. 35 France primarily comprises the domestic operations of HSBC Finance, HSBC Assurances Vie and the Paris branch of HSBC Bank plc.
Reconciliation of RoRWA measures 36 Risk-weighted assets (‘RWA’s) and pre-tax return on average risk-weighted assets (‘RoRWA’). 37 Adjusted RoRWA is calculated using adjusted pre-tax return and reported average RWAs at constant currency and adjusted for the effects of
significant items. 38 ‘Other’ includes treasury services related to the US Consumer and Mortgage Lending business and commercial operations in run-off. US CML
includes loan portfolios within the run-off business that are designated held for sale.
Global businesses and geographical regions 39 The main items reported under ‘Other’ are the results of HSBC’s holding company and financing operations, which includes net interest earned
on free capital held centrally, operating costs incurred by the head office operations in providing stewardship and central management services to HSBC, along with the costs incurred by the Group Service Centres and Shared Service Organisations and associated recoveries. The results also include fines and penalties as part of the settlement of investigations into past inadequate compliance with anti-money laundering and sanctions laws, the UK bank levy together with unallocated investment activities, centrally held investment companies, gains arising from the dilution of interests in associates and joint ventures and certain property transactions. In addition, ‘Other’ also includes part of the movement in the fair value of long-term debt designated at fair value (the remainder of the Group’s movement on own debt is included in GB&M).
40 Assets by geographical region and global businesses include intra-HSBC items. These items are eliminated, where appropriate, under the heading ‘Intra-HSBC items’ or ‘inter-segment elimination’, as appropriate.
41 For disposed of businesses, this includes the gain or loss on disposal and material results of operations as described on page 40. 42 Other income in this context comprises where applicable net trading income, net income/(expense) from other financial instruments designated
at fair value, gains less losses from financial investments, dividend income, net insurance premium income and other operating income less net insurance claims and benefits paid and movement in liabilities to policyholders.
43 Loan impairment charges and other credit risk provisions. 44 Share of profit in associates and joint ventures. 45 See ‘Use of non-GAAP financial measures’ on page 40. Reconciliation of adjusted results to reported results is provided in the Form 20-F filed
with the Securities and Exchange Commission, which is available on www.hsbc.com. 46 The Principal RBWM business measure excludes the effects of the US run-off portfolio and the disposed-of US CRS business. Concentrating on
the Principal RBWM business allows management to identify material changes in the ongoing business and assess the factors and trends which are expected to have a material effect on it in future years. Tables which reconcile reported to adjusted financial measures for Principal RBWM are available on www.hsbc.com.
47 ‘Investment distribution’ includes Investments, which comprises mutual funds (HSBC manufactured and third party), structured products and securities trading, and Wealth Insurance distribution, consisting of HSBC manufactured and third-party life, pension and investment insurance products.
48 ‘Other personal lending’ includes personal non-residential closed-end loans and personal overdrafts. 49 ‘Other’ mainly includes the distribution and manufacturing (where applicable) of retail and credit protection insurance. 50 In the analysis of global businesses, net trading income/(expense) comprises all gains and losses from changes in the fair value of financial
assets and financial liabilities classified as held for trading, related external and internal interest income and interest expense, and dividends received; in the statutory presentation internal interest income and expense are eliminated.
51 ‘Markets products, Insurance and Investments and Other’ includes revenue from Foreign Exchange, insurance manufacturing and distribution, interest rate management and GCF products.
52 In 2014, Markets included a favourable fair value movement of US$15m on the widening of credit spreads on structured liabilities (2013: adverse fair value movement of US$66m; 2012: adverse fair value movement of US$629m).
53 ‘Other’ in GB&M includes net interest earned on free capital held in the global business not assigned to products, allocated funding costs and gains resulting from business disposals. Within the management view of total operating income, notional tax credits are allocated to the businesses to reflect the economic benefit generated by certain activities which is not reflected within operating income, for example notional credits on income earned from tax-exempt investments where the economic benefit of the activity is reflected in tax expense. In order to reflect the total operating income on an IFRS basis, the offset to these tax credits are included within ‘Other’.
54 ‘Client assets’ are translated at the rates of exchange applicable for their respective period-ends, with the effects of currency translation reported separately. The main components of client assets are funds under management (US$275bn as at 31 December 2014) which are not reported on the Group’s balance sheet, and customer deposits (US$90bn as at 31 December 2014), of which US$85bn is reported on the Group’s balance sheet and US$5bn are off-balance sheet deposits.
55 Inter-segment elimination comprises (i) the costs of shared services and Group Service Centres included within ‘Other’ which are recovered from global businesses, and (ii) the intra-segment funding costs of trading activities undertaken within GB&M. HSBC’s Balance Sheet Management business, reported within GB&M, provides funding to the trading businesses. To report GB&M’s ‘Net trading income’ on a fully funded basis, ‘Net interest income’ and ‘Net interest income/(expense) on trading activities’ are grossed up to reflect internal funding transactions prior to their elimination in the inter-segment column.
56 Net insurance claims and benefits paid and movement in liabilities to policyholders. 57 ‘Employee expenses’ comprise costs directly incurred by each global business. The reallocation and recharging of employee and other expenses
directly incurred in the ‘Other’ category are shown in ‘Other operating expenses’. 58 RWAs are non-additive across geographical regions due to market risk diversification effects within the Group. 59 Funds under management and assets held in custody are not reported on the Group’s balance sheet, except where it is deemed that we
are acting as principal rather than agent in our role as investment manager, and these assets are consolidated as Structured entities (see Note 39 on the Financial Statements).
60 Taxes paid by HSBC relate to HSBC’s own tax liabilities including tax on profits earned, employer taxes, bank levy and other duties/levies such as stamp duty. Numbers are reported on a cash flow basis.

HSBC HOLDINGS PLC
111
Str
ateg
ic R
epo
rt
Fi
nan
cial
Rev
iew
Co
rpo
rate
Go
vern
ance
Fin
anci
al S
tate
men
ts
S
har
eho
lder
Info
rmat
ion
Risk Page App1
Risk profile2 111
Managing risk2 112
Risk management framework 112
Risk factors 113
Risks managed by HSBC 114
Risk management processes and procedures 117
Risk governance 204
Risk appetite 205
Top and emerging risks2 118
Macroeconomic and geopolitical risk 118
Macro-prudential, regulatory and legal risks to our business model 119
Regulatory commitments and consent orders 120
Risks related to our business operations, governance and internal control systems 122
Areas of special interest2 124
Financial crime compliance and regulatory compliance 124
Private Bank 124
Regulatory stress tests 125
Oil and gas prices 126
Russia 126
Eurozone 126
Credit risk4 127 206
Liquidity and funding4 163 215
Market risk4 175 221
Operational risk2 186 228
Compliance risk 189 229
Legal risk 229
Global security and fraud risk 230
Systems risk 231
Vendor risk management 231
Risk management of insurance operations3 190 231
Other material risks2 199
Reputational risk 199 235
Fiduciary risk 200 235
Pension risk 200 236
Sustainability risk 201 237
1 Appendix to Risk – risk policies and practices.
2 Unaudited. 3 Audited. 4 Audited where indicated.
For details of HSBC’s policies and practices regarding risk management and governance see the Appendix to Risk on page 204.
Risk profile (Unaudited)
Managing our risk profile
• A strong balance sheet remains core to our philosophy.
• Our portfolios continue to be aligned to our risk appetite and strategy.
• Our risk management framework is supported by strong forward-looking risk identification.
Maintaining capital strength and a strong liquidity position
• Our transitional common equity tier 1 capital ratio remains strong at 10.9%.
• We have sustained our strong liquidity position throughout 2014.
• The ratio of customer advances to deposits remains significantly below 90%.
Strong governance
• Robust risk governance and accountability is embedded across the Group.
• The Board, advised by the Group Risk Committee, approves our risk appetite.
• Our global risk operating model supports adherence to globally consistent standards and risk management policies across the Group.
Our top and emerging risks
• Macroeconomic and geopolitical risk.
• Macro-prudential, regulatory and legal risks to our business model.
• Risks related to our business operations, governance and internal control systems.

Report of the Directors: Risk (continued) Managing risk
HSBC HOLDINGS PLC
112
Managing risk (Unaudited)
As a provider of banking and financial services, we actively manage risk as a core part of our day-to-day activities.
Risk management framework
Our risk management framework, which is employed at all levels of the organisation, is set out on page 24. The key elements are discussed below.
The Group’s Risk Appetite Statement is a key component in our management of risk and is described on page 24.
Risk governance framework
Robust risk governance and accountability are embedded throughout the Group through an established framework that ensures appropriate oversight of and accountability for the effective management of risk at all levels of the organisation and across all risk types. Adherence to consistent standards and risk management policies is required across HSBC by our Global Standards and our Global Risk operating model.
The Board has ultimate responsibility for approving HSBC’s risk appetite and the effective management of risk.
• The Group Risk Committee advises the Board on risk appetite and its alignment with strategy, risk governance and internal controls and high-level risk related matters.
• The Financial System Vulnerabilities Committee reports to the Board on matters relating to financial crime and financial system abuse and provides a forward-looking perspective on financial crime risk.
• The Conduct & Values Committee was established in January 2014 to oversee the design and application of HSBC’s policies, procedures and standards, to ensure that we conduct business responsibly and consistently adhere to HSBC Values and to advise the Board accordingly.
Executive accountability for the ongoing monitoring, assessment and management of the risk environment and the effectiveness of our risk management policies resides with the Risk Management Meeting of the GMB. Day-to-day risk management activities are the responsibility of senior managers of individual businesses, supported by global functions as described under ‘Three lines of defence’ below.
The executive and non-executive risk governance structures and their interactions are set out on page 204, with similar arrangements in place for major operating subsidiaries. The report of the Group Risk Committee is on page 280. The Report of the Financial System Vulnerabilities Committee is on page 282. The report of the Conduct & Values Committee is on page 286.
Three lines of defence
We use a three lines of defence model in the management of risk.
• First line – every employee is responsible for the risks that form part of their day to day jobs. The first line of defence ensures that all key risks within their operations are identified, mitigated and monitored by appropriate internal controls within an overall control environment.
• Second line – global functions such as Risk, Finance and Human Resources form the second line of defence. They are responsible for providing assurance, challenge and oversight of the activities conducted by the first line.
• Third line – Internal Audit forms the third line of defence, providing independent assurance to senior management and the Board over the first and second lines of defence.
For details of our operational risk management framework, see page 186.
People
All employees are required to identify, assess and manage risk within the scope of their assigned responsibilities and, as such, they are critical to the effectiveness of the three lines of defence. Personal accountability for Global Standards is reinforced by HSBC Values.
Clear and consistent employee communication on risk conveys strategic messages and sets the tone from senior leadership. A suite of mandatory training on critical risk and compliance topics is deployed to embed skills and understanding and strengthen the risk culture within HSBC. It reinforces the attitude to risk in the behaviour expected of employees, as described in our risk policies. The training is updated regularly, describing technical aspects of the various risks assumed by the Group and how they should be managed effectively. Staff are supported in their roles by a disclosure line which enables them to raise concerns confidentially (see page 20).
Our risk culture is reinforced by our approach to remuneration. Individual awards, including those for executives, are based on compliance with HSBC Values and the achievement of financial and non-financial objectives which are aligned to our risk appetite and global strategy. For further information on risk and remuneration, see the Report of the Group Remuneration Committee on page 300.
Independent Risk function
Global Risk, headed by the Group Chief Risk Officer, is responsible for enterprise-wide risk oversight including the establishment of global policy, the monitoring of risk profiles and forward-looking risk identification and management. Global Risk also has functional responsibility for risk management in support of HSBC’s global businesses and regions through an integrated network of Risk sub-functions which are independent

HSBC HOLDINGS PLC
113
Str
ateg
ic R
epo
rt
Fi
nan
cial
Rev
iew
Co
rpo
rate
Go
vern
ance
Fin
anci
al S
tate
men
ts
S
har
eho
lder
Info
rmat
ion
from the sales and trading functions of our businesses. This independence ensures the necessary balance in risk/return decisions.
We run Global Risk like a business, ensuring that the function is dynamic and responsive to the needs of its stakeholders.
Risks faced by HSBC
All of our activities involve, to varying degrees, the analysis, evaluation, acceptance and management of risks or combinations of risks.
Risk factors
We have identified a comprehensive suite of risk factors which covers the broad range of risks our businesses are exposed to.
A number of the risk factors have the potential to affect the results of our operations or financial condition, but may not necessarily be deemed as top or emerging risks. However, they inform the ongoing assessment of our top and emerging risks which may result in our risk appetite being revised. The risk factors are:
Macroeconomic and geopolitical risk
• Current economic and market conditions may adversely affect our results.
• We are subject to political and economic risks in the countries in which we operate, including the risk of government intervention.
• We may suffer adverse effects as a result of the renewed economic and sovereign debt tensions in the eurozone.
• Changes in foreign currency exchange rates may affect our results.
Macro-prudential, regulatory and legal risks to our business model
• Failure to implement our obligations under the deferred prosecution agreements could have a material adverse effect on our results and operations.
• Failure to comply with certain regulatory requirements would have a material adverse effect on our results and operations.
• Failure to meet the requirements of regulatory stress tests could have a material adverse effect on our capital position, operations, results and future prospects.
• We are subject to a number of legal and regulatory actions and investigations, the outcomes of which are inherently difficult to predict, but unfavourable outcomes could have a material adverse effect on our operating results and brand.
• Unfavourable legislative or regulatory developments, or changes in the policy of regulators or governments, could have a material adverse effect on our operations, financial condition and prospects.
• HSBC Holdings and its UK subsidiaries may become subject to stabilisation provisions under the Bank Act
2009, as amended, in certain significant stress situations.
• Structural separation of banking and trading activities proposed or enacted in a number of jurisdictions could have a material adverse effect on our operations and operating results.
• We are subject to tax-related risks in the countries in which we operate which could have a material adverse effect on our operating results.
Risks related to our business, business operations, governance and internal control systems
• The delivery of our strategic priorities is subject to execution risk.
• We may not achieve all the expected benefits of our strategic initiatives.
• We operate in markets that are highly competitive.
• Our risk management measures may not be successful.
• Operational risks are inherent in our business.
• Our operations are subject to the threat of fraudulent activity.
• Our operations are subject to disruption from the external environment.
• Our operations utilise third-party suppliers and service providers.
• Our operations are highly dependent on our information technology systems.
• We may not be able to meet regulatory requests for data.
• Our operations have inherent reputational risk.
• We may suffer losses due to employee misconduct.
• We rely on recruiting, retaining and developing appropriate senior management and skilled personnel.
• Our financial statements are based in part on judgements, estimates and assumptions which are subject to uncertainty.
• HSBC could incur losses or be required to hold additional capital as a result of model limitations or failure.
• Third parties may use us as a conduit for illegal activities without our knowledge, which could have a material adverse effect on us.
• We have significant exposure to counterparty risk.
• Market fluctuations may reduce our income or the value of our portfolios.
• Liquidity, or ready access to funds, is essential to our businesses.
• Any reduction in the credit rating assigned to HSBC Holdings, any subsidiaries of HSBC Holdings or any of their respective debt securities could increase the cost or decrease the availability of our funding and adversely affect our liquidity position and interest margins.

Report of the Directors: Risk (continued) Risks managed by HSBC
HSBC HOLDINGS PLC
114
• Risks concerning borrower credit quality are inherent in our businesses.
• Our insurance business is subject to risks relating to insurance claim rates and changes in insurance customer behaviour.
• HSBC Holdings is a holding company and, as a result, is dependent on loan payments and dividends from its subsidiaries to meet its obligations, including
obligations with respect to its debt securities, and to provide profits for payment of future dividends to shareholders.
• We may be required to make substantial contributions to our pension plans.
Risks managed by HSBC
The principal risks associated with our banking and insurance manufacturing operations are described in the tables below.
Description of risks – banking operations
Risks Arising from Measurement, monitoring and management of risk Credit risk (page 127)
The risk of financial loss if a customer or counterparty fails to meet an obligation under a contract.
Credit risk arises principally from direct lending, trade finance and leasing business, but also from certain other products such as guarantees and derivatives.
Credit risk is:
• measured as the amount which could be lost if a customer or counterparty fails to make repayments. In the case of derivatives, the measurement of exposure takes into account the current mark-to-market value to HSBC of the contract and the expected potential change in that value over time caused by movements in market rates;
• monitored within limits approved by individuals within a framework of delegated authorities. These limits represent the peak exposure or loss to which HSBC could be subjected should the customer or counterparty fail to perform its contractual obligations; and
• managed through a robust risk control framework which outlines clear and consistent policies, principles and guidance for risk managers.
Liquidity and funding risk (page 163)
The risk that we do not have sufficient financial resources to meet our obligations as they fall due or that we can only do so at excessive cost.
Liquidity risk arises from mismatches in the timing of cash flows.
Funding risk arises when the liquidity needed to fund illiquid asset positions cannot be obtained at the expected terms and when required.
Liquidity and funding risk is:
• measured using internal metrics including stressed operational cash flow projections, coverage ratios and advances to core funding ratios;
• monitored against the Group’s liquidity and funding risk framework and overseen by regional Asset and Liability Management Committees (‘ALCO’s), Group ALCO and the Risk Management Meeting; and
• managed on a stand-alone basis with no reliance on any Group entity (unless pre-committed) or central bank unless this represents routine established business as usual market practice.
Market risk (page 175)
The risk that movements in market factors, including foreign exchange rates and commodity prices, interest rates, credit spreads and equity prices, will reduce our income or the value of our portfolios.
Exposure to market risk is separated into two portfolios:
• trading portfolios comprise positions arising from market-making and warehousing of customer-derived positions.
• non-trading portfolios comprise positions that primarily arise from the interest rate management of our retail and commercial banking assets and liabilities, financial investments designated as available for sale and held to maturity, and exposures arising from our insurance operations (page 198).
Market risk is:
• measured in terms of value at risk, which is used to estimate potential losses on risk positions as a result of movements in market rates and prices over a specified time horizon and to a given level of confidence, augmented with stress testing to evaluate the potential impact on portfolio values of more extreme, though plausible, events or movements in a set of financial variables;
• monitored using measures including the sensitivity of net interest income and the sensitivity of structural foreign exchange which are applied to the market risk positions within each risk type; and
• managed using risk limits approved by the GMB for HSBC Holdings and our various global businesses. These units are allocated across business lines and to the Group’s legal entities.

HSBC HOLDINGS PLC
115
Str
ateg
ic R
epo
rt
Fi
nan
cial
Rev
iew
Co
rpo
rate
Go
vern
ance
Fin
anci
al S
tate
men
ts
S
har
eho
lder
Info
rmat
ion
Risks Arising from Measurement, monitoring and management of risk Operational risk (page 186)
The risk of loss resulting from inadequate or failed internal processes, people and systems or from external events, including legal risk (along with accounting, tax, security and fraud, people, systems, projects, operations and organisational change risk).
Operational risk arises from day to day operations or external events, and is relevant to every aspect of our business.
Compliance risk and fiduciary risk are discussed below. Other operational risks are covered in the Appendix to Risk (page 204).
Operational risk is:
• measured using both the top risk analysis process and the risk and control assessment process, which assess the level of risk and effectiveness of controls;
• monitored using key indicators and other internal control activities; and
• managed primarily by global business and functional managers. They identify and assess risks, implement controls to manage them and monitor the effectiveness of these controls utilising the operational risk management framework. Global Operational Risk is responsible for the framework and for overseeing the management of operational risks within businesses and functions.
Compliance risk (page 189)
The risk that we fail to observe the letter and spirit of all relevant laws, codes, rules, regulations and standards of good market practice, and incur fines and penalties and suffer damage to our business as a consequence.
Compliance risk is part of operational risk, and arises from rules, regulations, other standards and Group policies, including those relating to anti-money laundering, anti-bribery and corruption, counter-terrorist and proliferation financing, sanctions compliance and conduct of business.
The DPA is discussed on page 120 and the Monitor on page 27.
Compliance risk is:
• measured by reference to identified metrics, incident assessments (whether affecting HSBC or the wider industry), regulatory feedback and the judgement and assessment of the managers of our global businesses and functions;
• monitored against our compliance risk assessments and metrics, the results of the monitoring and control activities of the second line of defence functions, including the Financial Crime Compliance and Regulatory Compliance functions, and the results of internal and external audits and regulatory inspections; and
• managed by establishing and communicating appropriate policies and procedures, training employees in them, and monitoring activity to assure their observance. Proactive risk control and/or remediation work is undertaken where required.
Other material risks
Reputational risk (page 199)
The risk that illegal, unethical or inappropriate behaviour by the Group itself, members of staff or clients or representatives of the Group will damage HSBC’s reputation, leading potentially to a loss of business, fines or penalties.
Reputational risk is the risk of failure to meet stakeholder expectations as a result of any event, behaviour, action or inaction, either by HSBC itself, its employees or those with whom it is associated, that may cause stakeholders to form a negative view of HSBC.
Reputational risk is:
• measured by reference to our reputation as indicated by our dealings with all relevant stakeholders, including media, regulators, customers and employees;
• monitored through a reputational risk management framework, taking into account the results of the compliance risk monitoring activity outlined above; and
• managed by every member of staff and is covered by a number of policies and guidelines. There is a clear structure of committees and individuals charged with mitigating reputational risk, including the Group Reputational Risk Policy Committee and regional/business equivalents.
Fiduciary risk (page 200)
The risk of breaching our fiduciary duties, defined as any duty where HSBC holds, manages, oversees or has responsibilities for assets for a third party that involves a legal and/or regulatory duty to act with the highest standard of care and with utmost good faith.
Fiduciary risk is part of operational risk, and arises from our business activities where we act in a fiduciary capacity (‘designated businesses’) as Trustee, Investment Manager or as mandated by law or regulation.
Fiduciary risk is:
• measured by each designated business monitoring against their own risk appetite statements and by the operational risk and control assessment process, which assesses the level of risk and the effectiveness of the key controls;
• monitored through a combination of testing, key indicators and other metrics such as client and regulatory feedback; and
• managed within the designated businesses via established governance frameworks, and comprehensive policies, procedures and training programmes.

Report of the Directors: Risk (continued) Risks managed by HSBC
HSBC HOLDINGS PLC
116
Description of risks – banking operations (continued)
Risks Arising from Measurement, monitoring and management of risk Pension risk (page 236)
The risk that contributions from Group companies and members fail to generate sufficient funds to meet the cost of accruing benefits for the future service of active members, and the risk that the performance of assets heldin pension funds is insufficient to cover existing pension liabilities.
Pension risk arises from investments delivering an inadequate return, economic conditions leading to corporate failures, adverse changes in interest rates or inflation, or members living longer than expected (longevity risk). Pension risk includes operational risks listed above.
Pension risk is:
• measured in terms of the schemes’ ability to generate sufficient funds to meet the cost of their accrued benefits;
• monitored through the specific risk appetite that has been developed at both Group and regional levels; and
• managed locally through the appropriate pension risk governance structure and globally through the Risk Management Meeting.
Sustainability risk (page 237)
The risk that the environmental and social effects of providing financial services outweigh the economic benefits.
Sustainability risk arises from the provision of financial services to companies or projects which run counter to the needs of sustainable development.
Sustainability risk is:
• measured by assessing the potential sustainability effect of a customer’s activities and assigning a Sustainability Risk Rating to all high risk transactions;
• monitored quarterly by the Risk Management Meeting and monthly by Group Sustainability Risk management; and
• managed using sustainability risk policies covering project finance lending and sector-based sustainability polices for sectors with high environmental or social impacts.
Our insurance manufacturing subsidiaries are separately regulated from our banking operations. Risks in the insurance entities are managed using methodologies and processes appropriate to insurance activities, but remain subject to oversight at Group level. Our insurance
operations are also subject to the operational risks and the other material risks presented above in relation to the banking operations, and these are covered by the Group’s risk management processes.
Description of risks – insurance manufacturing operations
Risks Arising from Measurement, monitoring and management of risk
Financial risks (page 194)
Our ability to effectively match the liabilities arising under insurance contracts with the asset portfolios that back them are contingent on the management of financial risks such as market, credit and liquidity risks, and the extent to which these risks are borne by the policyholders.
Liabilities to policyholders under unit-linked contracts move in line with the value of the underlying assets, and as such the policyholder bears the majority of the financial risks.
Contracts with DPF share the performance of the underlying assets between policyholders and the shareholder in line with the type of contract and the specific contract terms.
Exposure to financial risks arises from:
• market risk of changes in the fair values of financial assets or their future cash flows from fluctuations in variables such as interest rates, foreign exchange rates and equity prices;
• credit risk and the potential for financial loss following the default of third parties in meeting their obligations; and
• liquidity risk of entities not being able to make payments to policyholders as they fall due as there are insufficient assets that can be realised as cash.
Financial risks are:
• measured separately for each type of risk: − market risk is measured in terms of exposure to fluctuations in
key financial variables;
− credit risk is measured as the amount which could be lost if a customer or counterparty fails to make repayments; and
− liquidity risk is measured using internal metrics including stressed operational cash flow projections.
• monitored within limits approved by individuals within a framework of delegated authorities; and
• managed through a robust risk control framework which outlines clear and consistent policies, principles and guidance for risk managers. Subsidiaries manufacturing products with guarantees are usually exposed to falls in market interest rates and equity prices to the extent that the market exposure cannot be managed by utilising any discretionary participation (or bonus) features within the policy contracts they issue.

HSBC HOLDINGS PLC
117
Str
ateg
ic R
epo
rt
Fi
nan
cial
Rev
iew
Co
rpo
rate
Go
vern
ance
Fin
anci
al S
tate
men
ts
S
har
eho
lder
Info
rmat
ion
Risks Arising from Measurement, monitoring and management of risk
Insurance risk (page 198)
The risk that, over time, the cost of acquiring and administering a contract, claims and benefits may exceed the aggregate amount of premiums received and investment income.
The cost of claims and benefits can be influenced by many factors, including mortality and morbidity experience, lapse and surrender rates and, if the policy has a savings element, the performance of the assets held to support the liabilities.
Insurance risk is:
• measured in terms of life insurance liabilities; • monitored by the RBWM Risk Management Committee, which
checks the risk profile of the insurance operations against a risk appetite for insurance business agreed by the GMB; and
• managed both centrally and locally using product design, underwriting, reinsurance and claims-handling procedures.
Risk management processes and procedures
In addition to risk appetite, the following processes are integral to risk management at HSBC:
• risk identification through our top and emerging risk process;
• mapping our risk profile; and
• stress testing and scenario analysis.
Risk identification
We identify and monitor risks continuously. This process, which is informed by analysis of our risk factors and the results of our stress testing programme, gives rise to the classification of certain key risks as top or emerging. Changes in our assessment of top and emerging risks may result in adjustments to our business strategy and, potentially, our risk appetite.
Our current top and emerging risks are discussed below.
Mapping our risk profile
Risks are assumed by our global businesses in accordance with their risk appetite and are managed at Group, global business and regional levels. All risks are recorded and monitored through our risk map process, which describes our risk profile by risk type in the different regions and global businesses.
In addition to our principal banking and insurance risks, the risk map process identifies and monitors risks such as model, financial management, capital, Islamic finance and strategic risks. These risks are regularly assessed through our risk appetite framework, stress tested and considered for classification as top and emerging risks.
Stress testing
We conduct stress testing scenarios across the Group on both an enterprise-wide basis and at a major subsidiary level, reflecting our business strategy and its resultant risk exposures. Our stress testing and scenario analysis programme examines the sensitivities of our capital plans and unplanned demand for regulatory capital under a number of scenarios and ensures that top and emerging risks are appropriately considered. These scenarios include, but are not limited to, adverse macroeconomic events, failures at country, sector and counterparty levels, geopolitical occurrences and a variety of projected major operational risk events.
The Stress Testing Management Board, which is chaired by the Group Finance Director, is responsible for stress testing strategy and stewardship. Stress testing models are approved through the Group’s Model Oversight Committee framework. Updates on stress testing are provided at each meeting of the Risk Management Meeting of the GMB. The Group Risk Committee is informed and consulted, and approves, as appropriate.
The development of macroeconomic scenarios is a critical part of the process. Potential scenarios are defined and generated by an expert panel comprising economic experts from various global teams including Risk and Finance. Variables and assumptions underpinning the scenarios, including economic indicators such as yield curves, exchange rates and volatilities, are expanded and enriched by internal and external teams. Once approved by the governing committee, they are circulated to the regional and global business stress testing teams along with instructions for the exercise.
Scenarios are translated into financial impacts, such as on our forecast profitability and RWAs, using a suite of stress testing models and methodologies. Models are subject to independent model review and go through a process of validation and approval. Model overlays may be considered where necessary.
Stress testing results are subject to a review and challenge process at regional and Group levels and action plans are developed to mitigate identified risks. The extent to which these action plans would be implemented in the event of particular scenarios occurring depends on senior management’s evaluation of the risks and their potential consequences, taking into account HSBC’s risk appetite.
In addition to the Group-wide risk scenarios, each major HSBC subsidiary conducts regular macroeconomic and event-driven scenario analyses specific to their region. They may also participate in local regulatory stress testing programmes.
Stress testing is applied to risks such as market risk, liquidity and funding risk and credit risk to evaluate the potential effect of stress scenarios on portfolio values, structural long-term funding positions, income or capital.
Reverse stress testing is run annually on both Group and subsidiary entity bases. This stress test is conducted by assuming the business model is non-viable and working backwards to identify a range of occurrences that could

Report of the Directors: Risk (continued) Top and emerging risks
HSBC HOLDINGS PLC
118
bring that event about. Non-viability might occur before the bank’s capital is depleted, and could result from a variety of events. These include idiosyncratic or systemic events or combinations thereof, and/or could imply failure of the Group’s holding company or one of its major subsidiaries. They would not necessarily mean the simultaneous failure of all the major subsidiaries. Reverse stress testing is used to strengthen our resilience by helping to inform early-warning triggers, management actions and contingency plans designed to mitigate the potential stresses and vulnerabilities which the Group might face.
HSBC participated in regulatory stress testing programmes in a number of jurisdictions during 2014, as outlined on page 125.
Top and emerging risks /(Unaudited)
Our approach to identifying and monitoring top and emerging risks is described on page 22.
During 2014, senior management paid particular attention to a number of top and emerging risks. Our current top and emerging risks are as follows:
Macroeconomic and geopolitical risks
Economic outlook and government intervention
Increased geopolitical risk
Economic outlook and government intervention
Economic growth in both developed and emerging market countries remained weak in 2014.
Oil and commodity prices have declined significantly since the middle of 2014 as a result of increasing global demand-supply imbalances. The precipitous fall in energy prices over such a short span of time changes both the nature and the distribution of risks. It sharpens fiscal and financing challenges for energy exporters, and although it brings benefits for oil importers, it also accentuates deflationary risks among some of these (particularly in the eurozone). In addition, the prospect of low oil prices for a prolonged period may reduce investment in exploration and thus poses the danger of significantly reduced future supply.
The economic recovery in the eurozone is still at risk. Deflationary pressures persist as a result of low oil prices and despite much looser monetary policy. Acceleration in the structural reform agenda could also accentuate deflationary pressures in the short-term. The eurozone is discussed further in ‘Areas of special interest’ on page 126. Japan fell into a technical recession in the third quarter of 2014 and policy responses may not be sufficient to support a recovery in economic activity. Resilience in US economic activity represents an upside to the world economy.
Emerging markets, particularly those with domestic vulnerabilities, remain exposed to monetary policy normalisation in the US and to greater risk aversion. While high by international standards, mainland China’s GDP growth in 2014 was the lowest in over two decades and recent forecasts indicate a lower trajectory than in recent years. Years of excessive investment, notably in the property market, has stoked potential financial bubbles, requiring the implementation of a new economic growth model.
Potential impact on HSBC
• HSBC’s results could be adversely affected by a prolonged period of low or negative interest rates, low inflation levels or deflation and/or low oil prices.
• We earn a significant proportion of our profits from our operations in emerging markets. Our results could be adversely affected by a prolonged slowdown in emerging market growth.
• Global trade and capital flows may contract as a result of weaker economic growth, the introduction of protectionist measures, the emergence of geopolitical risks or increasing redenomination risk. This may curtail our profitability.
Mitigating actions
• We closely monitor economic developments in key markets and sectors with the aim of ensuring trends are identified, the implications for specific customers, customer segments or portfolios are assessed and appropriate mitigating action, which may include revising key risk appetite metrics and limits, is taken as circumstances evolve.
• We use stress testing, both internal and regulatory programmes, to assess the effect of changes in economic conditions on our operations. Regulatory stress tests are discussed on page 124.
Increased geopolitical risk
Our operations are exposed to risks arising from political instability and civil unrest in many parts of the world, which may have a wider effect on regional stability and regional and global economies.
Geopolitical risk increased during 2014. Military escalation and/or civil war remain a possibility in Ukraine, while sanctions targeting the Russian government, institutions and individuals, together with falling oil prices, have had an adverse effect on the Russian economy.
In the Middle East, the civil war in Syria has been complicated by the seizure of parts of Iraq and Syria by Islamic State, a terrorist group. Elsewhere in the region, chaos in Libya, ongoing tensions between Israel and Palestine and fraught negotiations over Iran’s nuclear programme are combining to increase risks to stability. In Asia, there was no easing in the maritime sovereignty disputes involving mainland China and its neighbours, while tensions remain high over the line of control between India and Pakistan, raising concerns over a possible wider conflict between the two nuclear-armed neighbours.
T E
E
E
E
E

HSBC HOLDINGS PLC
119
Str
ateg
ic R
epo
rt
Fi
nan
cial
Rev
iew
Co
rpo
rate
Go
vern
ance
Fin
anci
al S
tate
men
ts
S
har
eho
lder
Info
rmat
ion
Civil unrest and demonstrations in a number of countries during 2014, including Turkey and Hong Kong, have also contributed to geopolitical risk as governments took measures to contain them.
A number of emerging and developed markets will hold elections in 2015, which could lead to further market volatility. In addition, a sustained period of low oil prices may affect stability in countries that rely heavily on oil production as a significant source of revenue.
Potential impact on HSBC
• Our results are subject to the risk of loss from unfavourable political developments, currency fluctuations, social instability and changes in government policies on matters such as expropriation, authorisations, international ownership, interest-rate caps, foreign exchange transferability and tax in the jurisdictions in which we operate.
• Actual conflict could expose our staff to physical risk and/or result in physical damage to our assets.
Mitigating actions
• We continuously monitor the geopolitical outlook, in particular in countries where we have material exposures and/or a physical presence.
• Our internal credit risk rating of sovereign counterparties takes these factors into account and drives our appetite for conducting business in those countries. Where necessary, we adjust our country limits and exposures to reflect our risk appetite and mitigate risks as appropriate.
Macro-prudential, regulatory and legal risks to our business model
Regulatory developments affecting our business model and Group profitability
Regulatory investigations, fines, sanctions, commitments and consent orders and requirements relating to conduct of business and financial crime negatively affecting our results and brand
Dispute risk
Financial service providers face increasingly stringent and costly regulatory and supervisory requirements, often involving the provision of large amounts of data, particularly in the areas of capital and liquidity management, conduct of business, operational structures and the integrity of financial services delivery. Increased government intervention and control over financial institutions both on a sector-wide basis and individually, together with measures to reduce systemic risk, may significantly alter the competitive landscape locally, regionally and/or globally for some or all of the Group’s businesses. These measures may be introduced as formal requirements in a supra-equivalent manner and to differing timetables by different regulatory regimes.
Regulatory developments affecting our business model and Group profitability
Regulatory changes affect our activities, both of the Group as a whole and of some or all of our principal subsidiaries. These changes include:
• the UK’s Financial Services (Banking Reform) Act 2013 which requires the ring-fencing of our UK retail banking activities from wholesale banking, together with the structural separation of other activities as envisaged in the legislation and rules adopted in the US (including the Volcker Rule adopted in December 2013 under the Dodd-Frank Act), measures adopted in France restricting certain trading activities and potential further changes under European Commission proposals for structural measures for larger EU banks;
• the implementation of extra-territorial laws, including the US Foreign Account Tax Compliance Act (‘FATCA’) and other related initiatives to share tax information such as those being pursued by the OECD more generally;
• changes in the regime for the operation of capital markets, notably mandatory central clearing of over the counter (‘OTC’) derivatives, including under the Dodd-Frank Act and the EU’s European Market Infrastructure Regulation (‘EMIR’);
• changes arising from the increasing focus by regulators on how institutions conduct business, particularly with regard to the delivery of fair outcomes for customers and orderly/transparent markets, promoting effective competition in the interests of consumers (including the outcome of the current investigation by the UK Competition and Markets Authority on the personal current account and SME banking market in the UK and recent indications of further FCA focus on UK wholesale markets);
• the outcome of the Fair and Effective Financial Markets Review being undertaken by the Bank of England which will consider changes in the operation of wholesale financial markets in the UK;
• restrictions on the structure of remuneration imposed under CRD IV and UK regulations and increasing requirements to detail management accountability within the Group to meet the requirements of the Senior Managers’ Regime in the UK (including the continued focus in the UK on the progress being made in implementing wider recommendations made by the Parliamentary Commission on Banking Standards on matters relating to institutional ‘culture’, employee conduct and obligations more generally such as whistleblowing etc.);
• the implementation of CRD IV, notably the UK application of the capital buffer framework and its interaction with Pillar 2;
• the effect of proposals for the UK Financial Policy Committee to be given more powers to impose leverage constraints on UK banks;
T
T
T
T

Report of the Directors: Risk (continued) Top and emerging risks
HSBC HOLDINGS PLC
120
• the proposals from the Financial Stability Board which are subject to consultation and translation into national regulations but which would require G-SIB’s to hold minimum levels of capital and subordinated debt as total loss absorbing capacity (‘TLAC’);
• requirements flowing from arrangements for the resolution strategy of the Group and its individual operating entities, which may have different effects in different countries;
• the continuing stress tests by supervisory authorities and the implication for capital requirements and capital transfers within the Group;
• the tightening by regulators in a number of countries of credit controls on mortgage lending and unsecured portfolios; and
• the continued risk of further changes to regulation relating to taxes affecting financial service providers, including financial transaction taxes.
Potential impact on HSBC
• Proposed changes in and/or the implementation of regulations including mandatory central clearing of OTC derivatives, EMIR, ring-fencing and similar requirements, the Volcker Rule, recovery and resolution plans, FATCA and findings from competition orientated enquiries and investigations may affect the manner in which we conduct our activities and how the Group is structured.
• Requirements for higher levels of capital or TLAC may increase the funding costs for the Group and reduce our return on equity.
• Mandatory central clearing of OTC derivatives also brings new risks to HSBC in our role as a clearing member, as we will be required to underwrite losses incurred by central clearing counterparties from the default of other clearing members and their clients. Hence central clearing brings with it a new element of interconnectedness between clearing members and clients which we believe may increase rather than reduce our exposure to systemic risk.
• Increased regulatory scrutiny of conduct of business (including incentive structures, remuneration, product governance and sales processes) and management accountability may affect the industry in areas such as employee recruitment and retention, product pricing and profitability in both retail and wholesale markets. HSBC’s businesses may be affected by these developments.
• These measures have the potential to increase our cost of doing business and curtail the types of business we can carry out, with the consequent risk of decreased profitability.
Mitigating actions
• We are engaged closely with governments and regulators in the countries in which we operate to help ensure that the new requirements are
considered properly and can be implemented in an effective manner.
• We have developed and are implementing a global approach to the management of conduct and have established a Conduct & Values Committee as a sub-committee of the Board to oversee the management of conduct across the Group.
• We have enhanced our governance around central clearing counterparties and appointed specialists to manage the associated liquidity and collateral risks.
• We continue to enhance and strengthen governance and resourcing more generally around regulatory change management and the implementation of required measures to actively address this ongoing and significant agenda of regulatory change.
Regulatory investigations, fines, sanctions, commitments and consent orders and requirements relating to conduct of business and financial crime negatively affecting our results and brand
Financial service providers are at risk of regulatory sanctions or fines related to conduct of business and financial crime. The incidence of regulatory proceedings against financial service firms is increasing, with a consequent increase also in civil litigation arising from or relating to issues which are subject to regulatory investigation, sanction or fine. In addition, criminal prosecutions of financial institutions for, among other alleged conduct, breaches of AML and sanctions regulations, antitrust violations, market manipulation, aiding and abetting tax evasion, and providing unlicensed cross-border banking services, have become more commonplace and may increase in frequency due to increased media attention and higher expectations from prosecutors and the public. Moreover, financial service providers may face similar or broader legal proceedings, investigations or regulatory actions across many jurisdictions as a result of, among other things, increased media attention and higher expectations from regulators and the public. Any such prosecution or investigation of, or legal proceeding or regulatory action brought against, HSBC or one or more of its subsidiaries could result in substantial fines, penalties and/or forfeitures and could have a material adverse effect on our results, business, financial condition, prospects and reputation, including the potential loss of key licences, requirement to exit certain businesses and withdrawal of funding from depositors and other stakeholders.
Regulatory commitments and consent orders
In December 2012, HSBC Holdings, HSBC North America Holdings Inc. (‘HNAH’) and HSBC Bank USA, N.A. (‘HSBC Bank USA’) entered into agreements with US and UK authorities regarding past inadequate compliance with AML and sanctions laws. Among these agreements, HSBC Holdings and HSBC Bank USA entered into a five-year deferred prosecution agreement (‘US DPA’) with the US Department of Justice (‘DoJ’) and HSBC Holdings entered
T

HSBC HOLDINGS PLC
121
Str
ateg
ic R
epo
rt
Fi
nan
cial
Rev
iew
Co
rpo
rate
Go
vern
ance
Fin
anci
al S
tate
men
ts
S
har
eho
lder
Info
rmat
ion
into a two-year DPA with the New York County District Attorney (the ‘DANY DPA’). HSBC Holdings also entered into an undertaking with the FSA (the ‘FCA Direction’) to comply with certain forward-looking obligations with respect to AML and sanctions requirements. In addition, HSBC Holdings entered into a cease and desist order with the US FRB with respect to compliance with US AML and sanctions requirements.
The agreements with the DoJ and the FRB and the FCA Direction require us to retain an independent monitor to evaluate our progress in fully implementing our obligations and produce regular assessments of the effectiveness of our Financial Crime Compliance function. The Monitor is discussed on page 27.
HSBC has fulfilled all of the requirements imposed by the DANY DPA, which expired by its terms at the end of the two-year period of that agreement in December 2014.
While we still have significant work to do to build and improve our AML and sanctions compliance programme, and our DPA with the DoJ and other settlement agreements remain in place, the expiration of the DANY DPA is an important milestone.
HSBC Bank USA is also subject to an agreement entered into with the Office of the Comptroller of the Currency (‘OCC’) in December 2012, the Gramm-Leach-Bliley Act (‘GLBA’) Agreement and other consent orders.
Potential impact on HSBC
• It is difficult to predict the outcome of the regulatory proceedings involving our businesses. Unfavourable outcomes may have a material adverse effect on our reputation, brand and results, including loss of business and withdrawal of funding.
• Our significant involvement in facilitating international capital flows and trade exposes the Group to the risk of financial crime or inadvertently breaching restrictions and sanctions imposed by the US Office of Foreign Assets Control and other regulators.
• Breach of the US DPA at any time during its term may allow the DoJ to prosecute HSBC Holdings or HSBC Bank USA in relation to the matters which are the subject of the US DPA.
• The design and execution of AML and sanctions remediation plans is complex and requires major investments in people, systems and other infrastructure. This complexity creates significant execution risk, which could impact our ability to effectively manage financial crime risk and remedy AML and sanctions compliance deficiencies in a timely manner. This could, in turn, impact HSBC’s ability to satisfy the Monitor or comply with the terms of the US DPA, the FCA Direction, or the FRB Cease and Desist Order, and may require HSBC to take additional remedial measures in the future.
• Failure to comply with the requirements of consent orders or the GLBA Agreement within the time
periods specified in them or otherwise as may be extended, could result in supervisory action. Any such action could have a material adverse effect on the consolidated results and operation of HSBC.
Mitigating actions
• Steps to address many of the requirements of the US DPA, the FCA Direction and the GLBA Agreement have either already been taken or are under way in consultation with the relevant regulatory agencies. These include simplifying the Group’s control structure, strengthening the governance structure with new leadership appointments, revising key policies and implementing Global Standards to detect, deter and protect against financial crime (see page 26). In addition, we have substantially increased spending and staffing in the Financial Crime Compliance and Regulatory Compliance functions in the past few years.
• During 2014, we approved a new global strategy for transaction monitoring. Globally standardised AML investigations processes have been developed and are being implemented, starting in priority countries.
Conduct of business
Regulators in the UK and other countries have continued to increase their focus on ‘conduct’ matters relating to fair outcomes for customers and orderly/transparent markets including, for example, attention to sales processes and incentives, product and investment suitability, product governance, employee activities and accountabilities as well as the risks of market abuse in relation to benchmark, index, other rate setting processes, wider trading activities and more general conduct of business concerns.
In the UK, the FCA is making increasing use of existing and new powers of intervention and enforcement, including powers to consider past business undertaken and implement customer compensation and redress schemes or other, potentially significant, remedial work. The FCA is also now regulating areas of activity not previously regulated by them, such as consumer credit, and considering competition issues in the markets they regulate. Additionally, the FCA and other regulators increasingly take actions in response to customer complaints or where they see poor customer outcomes and/or market abuses, either specific to an institution or more generally in relation to a particular product. There have been examples of this approach by regulators in the context of the possible mis-selling of PPI, of interest rate hedging products for SMEs and of wealth management products.
The Group also remains subject to a number of other regulatory proceedings including investigations and reviews by various national regulatory, competition and enforcement authorities relating to certain past submissions made by panel banks and the process for making submissions in connection with the setting of Libor and other interbank offered and benchmark

Report of the Directors: Risk (continued) Top and emerging risks
HSBC HOLDINGS PLC
122
interest rates. There are also ongoing investigations into foreign exchange, precious metals and credit default swap related activities. Details of these investigations can be found in Note 40 on the Financial Statements.
Potential impact on HSBC
• HSBC may face regulatory censure or sanctions including fines and/or be exposed to legal proceedings and litigation.
• Regulators in the UK and other countries may identify future industry-wide mis-selling, market conduct or other issues that could affect the Group. This may lead from time to time to significant direct costs or liabilities and/or changes in the practices of such businesses. Also, decisions taken by the Financial Ombudsman Service in the UK (or similar overseas bodies) could, if applied to a wider class or grouping of customers, have a material adverse effect on the operating results, financial condition and prospects of the Group.
Mitigating actions
• Programmes to enhance the management of conduct of business are progressing in all global businesses and functions.
• Performance management arrangements for managers and staff are being reviewed, focusing on reward linked to values-based behaviour and good conduct.
• Enhancements to surveillance capabilities and benchmark rate setting processes are ongoing and HSBC Holdings and its subsidiaries are cooperating fully with all regulatory investigations and reviews.
Dispute risk
HSBC is party to legal proceedings and regulatory matters in a number of jurisdictions arising out of its normal business operations. Further details are provided in Note 40 on the Financial Statements.
Potential impact on HSBC
• Dispute risk gives rise to potential financial loss and significant reputational damage which could adversely affect customer and investor confidence.
Mitigating actions
• We continue to focus on identifying emerging regulatory and judicial trends in order to limit exposure to litigation or regulatory enforcement action in the future.
• We are enhancing our financial crime and regulatory compliance controls and resources.
Risks related to our business operations, governance and internal control systems
Heightened execution risk
People risk
Internet crime and fraud
Information security risk
Data management
Model risk
Third party risk management
Heightened execution risk
The financial services industry is currently facing an unprecedented period of scrutiny. Regulatory requests, legal matters and business initiatives all require a significant amount of time and resources to implement. The magnitude and complexity of projects within HSBC required to meet these demands has resulted in heightened execution risk. There also remains heightened risk around the execution of a number of disposals across the Group in line with our strategy.
Potential impact on HSBC
• These factors may affect the successful delivery of our strategic priorities.
• The potential risks of disposals include regulatory breaches, industrial action, loss of key personnel and interruption to systems and processes during business transformation. They can have both financial and reputational implications.
Mitigating actions
• We have strengthened our prioritisation and governance processes for significant projects and have invested in our project implementation and IT capabilities.
• Risks related to disposals are carefully assessed and monitored and are subject to close management oversight.
People risk
The demands being placed on the human capital of the Group are unprecedented. The cumulative workload arising from a regulatory reform programme that is often extra-territorial and still evolving is hugely consumptive of human resources, placing increasingly complex and conflicting demands on a workforce where the expertise is in short supply and globally mobile.
Potential impact on HSBC
• Changes in remuneration policy and practice resulting from the new regulations under CRD IV apply globally to all employees of EU headquartered banks. The key change is the application of a cap on variable pay that can be paid to any ‘material risk-taker’ (based on qualitative and quantitative criteria issued by the
T
T
T
T
T
T
T
E
T
T

HSBC HOLDINGS PLC
123
Str
ateg
ic R
epo
rt
Fi
nan
cial
Rev
iew
Co
rpo
rate
Go
vern
ance
Fin
anci
al S
tate
men
ts
S
har
eho
lder
Info
rmat
ion
EBA). This presents significant challenges for HSBC because a significant number of our material risk takers are based outside the EU.
• The policy statement issued by the PRA extends the Remuneration Code to require all PRA-authorised firms to apply clawback to vested/paid variable remuneration on a Group-wide basis for any material risk takers receiving variable pay from 1 January 2015.
• The introduction by the PRA and FCA in the UK of the Senior Managers and Certification regimes and of the related Rules of Conduct (the detail of which is currently subject to consultation) are intended to set clearer expectations of the accountabilities and behaviour of both senior and more junior employees. However, there are a number of uncertainties around the precise impact of these regimes at present (including on more senior employees, on non-UK based employees and on non-executive directors).
• Organisational changes to support the Group’s strategy and/or implement regulatory reform programmes have the potential to lead to increased staff turnover.
Mitigating actions
• The changes in remuneration under the new CRD IV regulations has necessitated a review of our remuneration policy, especially the balance between fixed and variable pay, to ensure we can remain competitive on a total compensation basis and retain our key talent.
• Risks related to organisational change and disposals are subject to close management oversight.
• We continue to increase the level of specialist resources within Financial Crime Compliance, Regulatory Compliance and stress testing and to engage with our regulators as they finalise new regulations.
Internet crime and fraud
HSBC is increasingly exposed to fraudulent and criminal activities as a result of increased usage of internet and mobile services by customers. We also face the risk of breakdowns in processes or procedures and systems failure or unavailability, and our business is subject to disruption from events that are wholly or partially beyond our control, such as internet crime and acts of terrorism.
Potential impact on HSBC
• Internet crime could result in financial loss and/or customer data and sensitive information being compromised. They may also give rise to losses in service to customers. The same threats apply equally when we rely on external suppliers or vendors for services provided to us and our customers.
Mitigating actions
• We continually assess these threats as they evolve and adapt our controls to mitigate them.
• We have increased our defences through enhanced monitoring and have implemented additional controls, such as two-factor authentication, to reduce the possibility of losses from fraud.
Information security risk
The security of our information and technology infrastructure is crucial for maintaining our banking applications and processes while protecting our customers and the HSBC brand. HSBC and other multinational organisations continue to be the targets of cyber-attacks which may disrupt services including the availability of our external facing websites, compromise organisational and customer information or expose security weaknesses.
Potential impact on HSBC
• Information security risk gives rise to potential financial loss and reputational damage which could adversely affect customer and investor confidence. Loss of customer data would also trigger regulatory breaches which could result in fines and penalties being incurred.
Mitigating actions
• We have invested significantly in addressing this risk through increased training to raise staff awareness of the requirements, enhanced multi-layered controls protecting our information and technical infrastructure, heightened monitoring and management of potential cyber-attacks and continued vulnerability assessment.
Data management
HSBC must have a clear data strategy to meet the volume, granularity, frequency and scale of regulatory and other reporting requirements. As a G-SIB, HSBC is also required to comply with the principles for effective risk data aggregation and risk reporting as set out by the Basel Committee on Banking Supervision (‘the Basel Committee’) in its paper.
Potential impact on HSBC
• Ineffective data management could adversely affect our ability to aggregate and report complete, accurate and consistent data to regulators, investors and senior management on a timely basis.
• Financial institutions that fail to meet their Basel Committee data obligations by the required deadline may face supervisory measures.
Mitigating actions
• Since the Data Strategy Board was established in 2012, we have set a data strategy for the Group and defined Group-level principles, standards and policies to enable consistent data aggregation, reporting and management.
T
T
T

Report of the Directors: Risk (continued) Top and emerging risks / Areas of special interest
HSBC HOLDINGS PLC
124
• A number of key initiatives and projects to implement our data strategy and work towards meeting our Basel Committee data obligations are in progress.
Model risk
HSBC uses models for a range of purposes in managing its business, including regulatory and economic capital calculations, stress testing, granting credit, pricing and financial reporting. Model risk is the potential for adverse consequences as a result of decisions based on incorrect model outputs and reports or the use of such information for purposes for which it was not designed. Model risk could arise from models that are poorly developed, implemented or used, or from the modelled outcome being misunderstood and acted upon inappropriately by management. The regulatory environment and supervisory concerns over banks’ use of internal models to determine regulatory capital further contribute to model risk.
Potential impact on HSBC
• HSBC could incur losses or be required to hold additional capital as a result of model limitations or failure.
• Supervisory concerns over the internal models and assumptions used by banks in the calculation of regulatory capital have led to the imposition of risk weight and loss given default floors. Such changes have the potential to increase our capital requirement and/or make it more volatile.
Mitigating actions
• We aim to mitigate model risk through appropriate governance over model development, usage and validation, together with independent review, monitoring and feedback.
Third-party risk management
We have increased our risk management focus on our use of third-party service providers, in part in response to increased scrutiny by global regulators. This includes how outsourcing decisions are made, how the key relationships are managed and the consistency of risk management across the range of third parties used. Risks arising from the use of third-party service providers may be less transparent and therefore more challenging to manage or influence.
Potential impact on HSBC
• Any deficiency in the management of third-party service providers could lead to a variety of risks including business disruption, regulatory failings, loss of confidential information and financial crime.
Mitigating actions
• We are enhancing our third-party risk management capability in line with guidance issued by the OCC and FRB, strengthening controls over third-party use and
increasing the monitoring and assurance over these controls.
Areas of special interest (Unaudited)
During 2014, we considered a number of particular areas because of the effect they may have on the Group. Whilst these areas may already have been identified in top and emerging risks, further details of the actions taken during the year are provided below.
Financial crime compliance and regulatory compliance
In recent years, we have experienced increasing levels of compliance risk as regulators and other agencies pursued investigations into historical activities, and we continued to work with them in relation to existing issues. This has included the matters giving rise to the DPAs reached with US authorities in relation to investigations regarding inadequate compliance with anti-money laundering and sanctions law, and the related undertaking with the FSA (the ‘FCA Direction’). The work of the Monitor, who has been appointed to assess our progress against our various obligations is discussed on page 27.
We continue to respond to a number of investigations by the FCA into the possible mis-selling in the UK of certain products, including sales of PPI, of interest rate hedging products for SMEs and of wealth management products. In addition, we also remain subject to a number of other regulatory proceedings including investigations and reviews by various national regulatory, competition and enforcement authorities relating to certain past submissions made by panel banks and the process for making submissions in connection with the setting of Libor and other interbank offered and benchmark interest rates. There are also investigations in progress into activities related to foreign exchange, precious metals and credit default swaps. Details of these investigations and legal proceedings can be found in Note 40 on the Financial Statements.
It is clear from both our own and wider industry experience that the level of activity among regulators and law enforcement agencies in investigating possible breaches of regulations has increased, and that the direct and indirect costs of such breaches can be significant. Coupled with a substantial rise in the volume of new regulation, much of which has some element of extra-territorial reach, and the geographical spread of our businesses, we believe that the level of inherent compliance risk that we face as a Group will continue to remain high for the foreseeable future.
Further information about the Group’s compliance risk management may be found on page 189.
Private Bank
Past practices at our Swiss private bank and the financial affairs of some of our Swiss private banking clients have been subject to recent media coverage. The media focus has been on historical events that show the standards to
T
E

HSBC HOLDINGS PLC
125
Str
ateg
ic R
epo
rt
Fi
nan
cial
Rev
iew
Co
rpo
rate
Go
vern
ance
Fin
anci
al S
tate
men
ts
S
har
eho
lder
Info
rmat
ion
which we operate today were not universally in place in our Swiss operations eight years ago.
Since then, we have fundamentally changed the way HSBC is run and have established much tighter central control around who are our customers. We have put in place tough, world-class financial crime, regulatory compliance and tax transparency standards, enforced by a team of over 7,000 compliance staff.
GPB, and in particular its Swiss private bank, has undergone a radical transformation. We have taken significant steps over the past several years to implement reforms and exit clients who did not meet strict new HSBC standards, including those where we had concerns in relation to tax compliance. As a result of this repositioning, HSBC’s Swiss private bank has reduced its client base by almost 70% since 2007.
We are fully committed to the exchange of information with relevant authorities and are actively pursuing measures that ensure clients are tax transparent, even in advance of a regulatory or legal requirement to do so. We are also cooperating with relevant authorities investigating these matters.
Regulatory stress tests
Stress testing is an important tool for regulators to assess vulnerabilities in the banking sector and in individual banks, the results of which could have a significant effect on minimum capital requirements, risk and capital management practices and planned capital actions, including the payment of dividends, going forward.
We are subject to regulatory stress testing in many jurisdictions. These have increased both in frequency and in the granularity of information required by supervisors. They include the programmes of the PRA, the FRB, the EBA, the ECB, the Hong Kong Monetary Authority (‘HKMA’) and other regulators. Assessment by regulators is on both quantitative and qualitative bases, the latter focusing on portfolio quality, data provision, stress testing capability, forward-looking capital management processes and internal management processes.
In 2014, the Group took part in the first PRA concurrent stress test exercise involving major UK banks. The exercise was run on an enterprise-wide basis and comprised the EBA base scenario and a stress scenario that predominantly followed the EBA stress scenario with an additional overlay of variables reflecting the vulnerabilities facing the UK banking system, including significant declines in the value of sterling, residential and commercial property prices and bond and equity prices, along with a downturn in economic activity and rising unemployment. HSBC’s submission was made to the PRA at the end of June 2014. The Group also participated in the complementary programme of regular data provision to the Bank of England under its Firm Data Submission Framework.
The PRA disclosed the results of the 2014 Concurrent Stress Test on 16 December 2014. The stressed CET1
capital ratio of HSBC was deemed by the PRA to fall to a minimum of 8.7%, taking into account approved management mitigating actions. This was above the target minimum of 4.5%.
The EBA conducted a Europe-wide stress test in the first half of 2014, administered via the PRA for UK banks. The base scenario covered a wide range of risks including credit, market, securitisation, sovereign and funding risks. The adverse macroeconomic scenario included country-specific shocks to sovereign bond spreads, short-term interest rates and residential property prices, together with a decline in world trade, currency depreciation in Central and Eastern Europe and slow-downs or contractions in GDP growth around the world.
The EBA disclosed results of the stress test exercise on 26 October 2014. Our stressed CET1 capital ratio was projected to fall to a low point of 8.7% at the end of 2015, above the EBA minimum threshold of 5.5%. Our fully-loaded stressed CET1 ratio was projected to be 9.3% at the end of 2016, which compared favourably with other major European banks.
The PRA and EBA results demonstrate HSBC’s continued capital strength.
The ECB conducted its comprehensive assessment in the first half of 2014, which comprised an Asset Quality Review and the ECB’s stress testing process, the latter using the EBA scenarios. HSBC France and HSBC Malta fell within scope and both passed the exercise, the results of which were also published in October 2014. The CET1 ratio for HSBC France was projected to fall from 12.9% in 2013 to 6.6% by the end of 2016, remaining above the regulatory minimum. The fall reflected the impact of stress on HSBC France’s business model, which includes the Group’s euro Rates trading business, and the effect of ECB credit loss benchmarks on the loan portfolio.
HNAH participates in the Comprehensive Capital Analysis and Review (‘CCAR’) and Dodd-Frank Stress Testing (‘DFAST’) programmes of the FRB and HSBC Bank USA in the OCC’s DFAST programme. Both made their first submissions under these programmes on 6 January 2014. On 26 March 2014, the FRB informed HNAH that it objected to the submitted capital plan on qualitative grounds and a resubmission of its capital plan was required by 5 January 2015, together with improvements to its stress testing processes. However, the FRB approved the capital actions included in HNAH’s CCAR submission and HNAH was allowed to proceed with the payment of dividends on the outstanding preferred shares and trust preferred securities of HNAH and its subsidiaries. HNAH’s stressed CET1 capital ratio was forecast by the FRB to fall to a minimum of 9.4% under the supervisory ‘severely adverse’ scenario, above the regulatory minimum ratio of 4.5%. HNAH made its CCAR 2015 submission, which also served as the required re-submission for the CCAR 2014, and HSBC Bank USA made its DFAST 2015 submission, on 5 January 2015. Disclosure by the FRB and HNAH and HSBC Bank USA of the results of the exercises, based on the supervisory scenarios published in November 2014, will be made in

Report of the Directors: Risk (continued) Areas of special interest / Credit risk
HSBC HOLDINGS PLC
126
March 2015. In addition, the FRB will also provide its non-objection or objection to HNAH’s capital plan and the capital actions included within its 2015 CCAR submission.
The Hongkong and Shanghai Banking Corporation participated in the HKMA stress test exercise in the first half of 2014. The HKMA stress scenario envisaged a significant deceleration of growth in mainland China and a sharper contraction in Hong Kong.
Oil and gas prices
Oil and commodity prices have declined significantly since the middle of 2014 as a result of increasing global demand and supply imbalances and changes in market sentiment. There is considerable uncertainty regarding the future price levels during 2015 and beyond. Prolonged depressed oil prices will affect countries, industries and individual companies differently:
• Country level: net oil importers are likely to benefit from reduced oil prices. In advanced economies, this is likely to increase consumer disposable income while in emerging market countries it is more likely to benefit the governments’ fiscal position. The impact on oil exporting countries will depend on the importance of the oil receipts to fiscal revenues, the extraction costs and the amount of fiscal reserves that the countries are able to draw upon.
• Industry level: the oil and gas industry and supporting services will be affected, though this will vary depending on the relevant sub-sector. Large integrated producers are likely to remain resilient. Within the pure producers sector, the higher cost pure producers, such as shale and oil sands producers, are likely to experience higher levels of stress. Similarly, infrastructure and services providers are likely to come under stress as producers curtail capital expenditure. Industries where oil and gas represent major costs, such as haulage, transport and shipping, are likely to benefit if prices remain depressed.
The oil and gas sector has been considered a higher risk sector for some time and has been under enhanced monitoring and controls with risk appetite and new money lending under increased scrutiny.
HSBC has a diversified lending profile to the oil and gas sector. Lending in GB&M is concentrated predominately in upstream activities and with large investment-grade global integrated producers. CMB mainly focuses on lending to service companies and pure producers. The exposures are diversified across a number of countries.
The overall portfolio has drawn risk exposures amounting to about US$34bn, with just over 47% consisting of exposures to oil service companies and non-integrated producers. In-depth client reviews have been conducted on larger clients considered to be potentially vulnerable to depressed oil prices for a period of one to two years, particularly, but not exclusively, focusing on oil service companies, and producers (and their suppliers) reliant on expensive extraction methods such as shale or oil sands.
Following these reviews, about US$0.5bn of exposures have been identified as being of sufficient concern to require close management. Whilst weakening credit is evident in this population, no new customers were identified as being impaired at this stage.
Russia
During 2014, tensions have risen between the Russian Federation (‘Russia’) and western countries (‘the West’) in respect of Ukraine. The West’s response to date has been to impose sanctions on a selected list of Russian individuals, banks and corporates during the course of 2014. Monitoring and action in response to the sanctions requirements is ongoing and will impose some restrictions on HSBC’s business in Russia, although the effect on the Group is not expected to be significant. Our exposures to counterparties incorporated or domiciled in Ukraine are not considered material.
The fourth quarter of 2014 saw significant falls in the value of the Russian rouble and the price of crude oil, and multiple interest rate rises implemented by Russia’s central bank. The impact of these developments is being monitored by management and, combined with the sanctions, means the outlook for Russia remains highly uncertain with the economy expected to contract in 2015.
Our exposures to Russia mainly consist of loans and advances. At 31 December 2014 these amounted to US$4bn.
In addition to the above, a number of our multinational clients have indirect exposure to Russia through majority or minority stakes in Russia-based entities, via dependency of supply or from reliance on exports. The operations and businesses of such clients may be negatively affected should the scope and nature of sanctions and other actions be widened or the Russian economy deteriorate. Also, we run operations in neighbouring countries where the financial system has strong links to the Russian economy. Management is monitoring the quantum and potential severity of such risks.
Eurozone
In recent years the EU has introduced a series of legislative changes designed to better equip it to deal with a financial crisis and to reduce the risks of contagion in the event of an EU member country experiencing financial difficulties. The outcome of current negotiations on the terms of the Greek bail out is highly uncertain. The debt may be rescheduled or Greece may default on its debts; there is also the possibility that Greece may eventually exit the euro. Our exposures to Greece mainly consist of loans and advances and reverse repos. At 31 December 2014 these amounted to US$4bn and US$2bn respectively. Included in loans and advances are US$2bn related to the shipping industry, denominated in US dollars and booked in the UK. We believe the shipping industry is less sensitive to the Greek economy as it is mainly dependent on international trade.

HSBC HOLDINGS PLC
127
Str
ateg
ic R
epo
rt
Fi
nan
cial
Rev
iew
Co
rpo
rate
Go
vern
ance
Fin
anci
al S
tate
men
ts
S
har
eho
lder
Info
rmat
ion
Credit risk Page App1 Tables Page
Credit risk 129 206 Summary of credit risk 129 Gross loans to customers and banks over five years 130 Loan impairment charge over five years 130 Loan impairment charges by geographical region 130 Loan impairment charges by industry 130 Loan impairment allowances over five years 130Credit risk management 206
Credit exposure 130Maximum exposure to credit risk 130Other credit risk mitigants 130 Maximum exposure to credit risk 131 Loan and other credit-related commitments 131
Concentration of exposure 132 206Financial investments 132Trading assets 132Derivatives 132Loans and advances 132 Gross loans and advances to customers by industry sector
and by geographical region 132
Credit quality of financial instruments 133 207Credit quality classification Distribution of financial instruments by credit quality 134Past due but not impaired gross financial
instruments 136 Past due but not impaired gross financial instruments by
geographical region 136
Ageing analysis of days for past due but not impaired
gross financial instruments 136
Impaired loans 137 Movement in impaired loans by geographical region 137Renegotiated loans and forbearance 138 208 Renegotiated loans and advances to customers by
geographical region 139 Movement in renegotiated loans by geographical region 140Impairment of loans and advances 141 Loan impairment charge to the income statement by
industry sector 141
Loan impairment charge to the income statement by
assessment type 141
Charge for impairment losses as a percentage of average gross loans and advances to customers by geographical region 142
Movement in impairment allowances by industry sector
and geographical region 142
Movement in impairment allowances on loans and
advances to customers and banks 143 Impairment assessment 212
Wholesale lending 144 Total wholesale lending 144Commercial real estate 145 Commercial real estate lending 145
Commercial real estate loans and advances including loan
commitments by level of collateral 147
Other corporate, commercial and financial (non-bank) loans and advances including loan commitments by level of collateral rated CRR/EL8 to 10 only 148
Loans and advances to banks including loan commitments
by level of collateral 149 Other credit risk exposures 149Derivatives 149
Notional contract amounts and fair values of derivatives
by product type 150 OTC collateral agreements by type 150Reverse repos – non-trading by geographical
region 151 Reverse repos – non-trading by geographical region 151 Loan Management Unit 213

Report of the Directors: Risk (continued) Credit risk
HSBC HOLDINGS PLC
128
Page App1 Tables Page
Personal lending 151 Total personal lending 151Mortgage lending 152
Other personal lending 153 HSBC Finance US Consumer and Mortgage Lending
residential mortgages 153 HSBC Finance: foreclosed properties in the US 153
Trends in two months and over conctractual delinquency
in the US 153
Gross loan portfolio of HSBC Finance and real estate
secured balances 154
Number of renegotiated real estate secured accounts
remaining in HSBC Finance’s portfolio 154 HSBC Finance loan modifications and re-age
programmes 154 Collateral and other credit enhancements held 156 Residential mortgage loans including loan commitments
by level of collateral 156 Supplementary information 157 Gross loans and advances by industry sector over 5 years 157
Reconciliation of reported and constant currency impaired
loans, allowances and charges by geographical region 158
Reconciliation of reported and constant currency loan
impairment charges to the income statement 158 Loan impairment charges by industry sector over 5 years 159
Charge for impairment losses as a percentage of average
gross loans and advances to customers 159 Movement in impairment allowances over 5 years 159 Gross loans and advances to customers by country 160Refinance risk 214
HSBC Holdings 161 HSBC Holdings – maximum exposure to credit risk 161
Securitisation exposures and other structured products 161 214 Overall exposure of HSBC 161
Carrying amount of HSBC’s consolidated holdings of ABSs 162 Definitions and classifications of ABSs and CDOs 214
Representations and warranties related to mortgage sales and securitisation activities 162
1 Appendix to Risk – risk policies and practices.

HSBC HOLDINGS PLC
129
Str
ateg
ic R
epo
rt
Fi
nan
cial
Rev
iew
Co
rpo
rate
Go
vern
ance
Fin
anci
al S
tate
men
ts
S
har
eho
lder
Info
rmat
ion
Credit risk (Unaudited)
Credit risk is the risk of financial loss if a customer or counterparty fails to meet an obligation under a contract. It arises principally from direct lending, trade finance and leasing business, but also from other products such as guarantees and credit derivatives and from holding assets in the form of debt securities.
There were no material changes to our policies and practices for the management of credit risk in 2014. A summary of our current policies and practices regarding credit risk is provided in the Appendix to Risk on page 204.
Our maximum exposure to credit risk is presented on page 131 and credit quality on page 133. While credit risk arises across most of our balance sheet, losses have typically been incurred on loans and advances and securitisation exposures and other structured products. As a result, our disclosures focus primarily on these two areas.
This year we have redesigned the ‘Credit risk’ section in order to enhance clarity and reduce duplication. It now begins with a summary of credit risk followed by an overview of our gross exposures. We describe various measures of credit quality such as past due status, impaired loans and renegotiated loans before analysing impairment allowances. There are specific sections on wholesale lending and personal lending where additional detail is provided and we cover areas of particular focus such as our exposure to commercial real estate in wholesale lending and our Consumer and Mortgage Lending (‘CML’) portfolio in personal lending. This is followed by a section describing our securitisation exposures and other structured products. Information on our exposures to oil and gas, Russia and Greece is provided in ‘Areas of special interest’ on page 126.
Following the change in balance sheet presentation explained on page 347, non-trading reverse repos are shown separately on the balance sheet and are no longer included in ‘Loans and advances to customers’ and ‘Loans and advances to banks’. Comparative data have been re-presented accordingly. As a result, any analysis that references loans and advances to customers or banks excludes non-trading reverse repos. The amount of the non-trading reverse repos to customers and banks is set out on page 151.
Loan impairment charges, loan impairment allowances and impaired loans all reduced compared with 2013.
Gross loans and advances decreased by US$28bn which included adverse foreign exchange movements of US$51bn; excluding these movements customer lending grew in 2014.
The commentary that follows is on a constant currency basis, whilst tables are presented on a reported basis.
Summary of credit risk (Unaudited)
2014 2013 PageUS$bn US$bn
At year-end Maximum exposure to
credit risk 3,133 3,112 131
Gross loans and advances1 – personal lending 393 411 132– wholesale lending 706 716 132
Total 1,099 1,127 132
Impaired loans – personal lending 15 19 137– wholesale lending 14 18 137
Total 29 37 137
Impaired loans as a % ofgross loans and advances – personal lending 3.9% 4.6%– wholesale lending 2.0% 2.5%– total 2.7% 3.3%
US$bn US$bn Impairment allowances
– personal lending 4.6 6.6 143– wholesale lending 7.8 8.6 143
Total 12.4 15.2 143
Loans and advances net of impairment allowances1 1,087 1,112
For year ended 31 December Loan impairment charge
– personal lending 1.8 3.1 141– wholesale lending 2.3 2.9 141
Total 4.1 6.0 141
For footnote, see page 202.
See page 158 for further details in respect of the constant currency reconciliation. For an analysis of loans and advances by country see page 160.
Wholesale gross loans and advances increased by US$21bn. Asia grew by US$16bn and North America by US$10bn with more modest levels of growth in the Middle East and North Africa and Latin America. This was offset by a decrease of US$15bn in Europe. Loan impairment charges were lower in 2014 as we continued to benefit from the improvement in various economies and the low interest rate environment.
Personal lending balances, excluding the planned US CML portfolio run off, grew by US$7.7bn. This was primarily driven by increased mortgage and other lending in Asia and growth in the mortgage portfolio in both North America and Latin America. The growth was partially offset by lower lending balances in Europe due to repayments on the mortgage and credit card portfolio in the UK. The CML portfolio declined by a further US$5.7bn during the year. Loan impairment charges were down as a result of improvements in the US housing market and the continued run-off of the CML portfolio.

Report of the Directors: Risk (continued) Credit risk
HSBC HOLDINGS PLC
130
Gross loans to customers and banks over five years1 (US$bn) (Unaudited)
Loan impairment charge over five years (US$bn) (Unaudited)
Loan impairment charges by geographical region (US$bn) (Unaudited)
Loan impairment charges by industry (US$bn) (Unaudited)
Loan impairment allowances over five years (Unaudited)
For footnote, see page 202.
Credit exposure Maximum exposure to credit risk (Audited)
The table on page 131 provides information on balance sheet items, offsets and loan and other credit-related commitments. Commentary on balance sheet movements is provided on page 58. The offset on derivatives increased in line with the increase in maximum exposure amounts.
The offset on corporate and commercial loans to customers decreased by US$31bn. This reduction was in the UK where a small number of clients benefit from the use of net interest arrangements across their overdraft and deposit positions. During the year, as we aligned our approach in our Payments and Cash Management business to be more globally consistent, many of these clients increased the frequency with which they settled these balances thereby reducing the amount of offset available.
‘Maximum exposure to credit risk’ table (page 131)
The table presents our maximum exposure to credit risk from balance sheet and off-balance sheet financial instruments before taking account of any collateral held or other credit enhancements (unless such enhancements meet accounting offsetting requirements). For financial assets recognised on the balance sheet, the maximum exposure to credit risk equals their carrying amount; for financial guarantees and similar contracts granted, it is the maximum amount that we would have to pay if the guarantees were called upon. For loan commitments and other credit-related commitments, it is generally the full amount of the committed facilities.
The offset in the table relates to amounts where there is a legally enforceable right of offset in the event of counterparty default and where, as a result, there is a net exposure for credit risk purposes. However, as there is no intention to settle these balances on a net basis under normal circumstances, they do not qualify for net presentation for accounting purposes.
In the case of derivatives the offset column also includes collateral received in cash and other financial assets.
Other credit risk mitigants
While not disclosed as an offset in the ‘Maximum exposure to credit risk’ table, other arrangements are in place which reduce our maximum exposure to credit risk. These include a charge over collateral over borrowers’ specific assets such as residential properties. Other credit risk mitigants include short positions in securities and financial assets held as part of linked insurance/ investment contracts where the risk is predominantly borne by the policyholder. In addition, we hold collateral in the form of financial instruments that are not recognised on the balance sheet. See Note 32 and from page 147 and page 156 respectively on the Financial Statements for further details on collateral in respect of certain loans and advances and derivatives.
393 367 391 392 378
620 647 666 698 692
32 27 24 19 15
15 15 15 18 14
2010 2011 2012 2013 2014 2010 2011 2012 2013 2014
Personal Wholesale
ImpairedNot impaired
11.2
9.3
5.4
3.1 1.8 2.4 2.2 2.8 2.9 2.3
2010 2011 2012 2013 2014 2010 2011 2012 2013 2014
Personal Wholesale
1.7
0.5
1.2
2.6
1.1
0.6 0.3
2.0
Europe Asia MENA NorthAmerica
LatinAmerica
2013 2014
– –
0.6
2.5
0.8
2.2
(0.1)(0.1)
1.9
0.3
2.0
–
First lienresidentialmortgages
Otherpersonallending
Commercialreal
estate
Othercorporate
commercial
Financial
2013 2014
12.3 9.8 8.2 6.6 4.6 7.9 7.9 8.0 8.6 7.8
38% 37% 35% 35% 30%
53% 51% 53% 48%55%
2010 2011 2012 2013 2014 2010 2011 2012 2013 2014
Personal Wholesale
Loan impairment allowances (US$bn)Loan impairment allowances as a % of impaired loans

HSBC HOLDINGS PLC
131
Str
ateg
ic R
epo
rt
Fi
nan
cial
Rev
iew
Co
rpo
rate
Go
vern
ance
Fin
anci
al S
tate
men
ts
S
har
eho
lder
Info
rmat
ion
Maximum exposure to credit risk (Audited) 2014 2013 Maximum
exposure Offset Net Maximum exposure Offset Net
US$m US$m US$m US$m US$m US$m
Cash and balances at central banks 129,957 – 129,957 166,599 – 166,599Items in the course of collection from other banks 4,927 – 4,927 6,021 – 6,021Hong Kong Government certificates of indebtedness 27,674 – 27,674 25,220 – 25,220
Trading assets 228,944 – 228,944 239,301 (1,777) 237,524– Treasury and other eligible bills 16,170 – 16,170 21,584 – 21,584– debt securities 141,532 – 141,532 141,644 – 141,644– loans and advances to banks 27,581 – 27,581 27,885 – 27,885– loans and advances to customers 43,661 – 43,661 48,188 (1,777) 46,411
Financial assets designated at fair value 9,031 – 9,031 12,719 – 12,719– Treasury and other eligible bills 56 – 56 50 – 50– debt securities 8,891 – 8,891 12,589 – 12,589– loans and advances to banks 84 – 84 76 – 76– loans and advances to customers – – – 4 – 4
Derivatives 345,008 (313,300) 31,708 282,265 (252,344) 29,921
Loans and advances to customers held at amortised cost1
974,660 (67,094) 907,566 992,089 (96,726) 895,363
– personal 388,954 (4,412) 384,542 404,126 (1,348) 402,778– corporate and commercial 535,184 (59,197) 475,987 537,922 (90,215) 447,707– financial (non-bank financial institutions) 50,522 (3,485) 47,037 50,041 (5,163) 44,878
Loans and advances to banks held at amortised cost1
112,149 (258) 111,891 120,046 (587) 119,459
Reverse repurchase agreements – non-trading 161,713 (5,750) 155,963 179,690 (22,267) 157,423Financial investments 404,773 – 404,773 416,785 – 416,785
– Treasury and other similar bills 81,517 – 81,517 78,111 – 78,111– debt securities 323,256 – 323,256 338,674 – 338,674
Other assets 35,264 – 35,264 37,324 (22) 37,302– assets held for sale 1,375 – 1,375 3,306 (22) 3,284– endorsements and acceptances 10,775 – 10,775 11,624 – 11,624– other 23,114 – 23,114 22,394 – 22,394
Financial guarantees and similar contracts2 47,078 – 47,078 46,300 – 46,300Loan and other credit-related commitments3 651,380 – 651,380 587,603 – 587,603
At 31 December 3,132,558 (386,402) 2,746,156 3,111,962 (373,723) 2,738,239
For footnotes, see page 202.
Loan and other credit-related commitments3 (Unaudited)
Europe Asia4 MENA North
America Latin
America Total US$m US$m US$m US$m US$m US$m
Personal 86,247 96,497 2,995 15,636 11,679 213,054Corporate and commercial 98,045 138,366 20,141 102,911 17,540 377,003Financial5 26,605 9,355 711 23,559 1,093 61,323
At 31 December 2014 210,897 244,218 23,847 142,106 30,312 651,380 Personal 92,148 74,445 2,940 15,647 9,774 194,954Corporate and commercial 91,895 120,084 19,045 92,837 21,956 345,817Financial5 18,930 8,477 705 17,478 1,242 46,832
At 31 December 2013 202,973 203,006 22,690 125,962 32,972 587,603
For footnotes, see page 202.

Report of the Directors: Risk (continued) Credit risk
HSBC HOLDINGS PLC
132
Concentration of exposure (Unaudited)
Concentrations of credit risk are described in the Appendix to Risk on page 206.
The geographical diversification of our lending portfolio and our broad range of global businesses and products ensured that we did not overly depend on a few markets to generate growth in 2014. This diversification also supported our strategy for growth in faster-growing markets and those with international connectivity.
Financial investments
Our holdings of available-for-sale government and government agency debt securities, corporate debt securities, ABSs and other securities were spread across a wide range of issuers and geographical regions in 2014, with 15% invested in securities issued by banks and other financial institutions and 72% in government or government agency debt securities. We also held assets backing insurance and investment contracts. For an analysis of financial investments, see Note 18 on the Financial Statements.
Trading assets
Trading securities remained the largest concentration within trading assets at 77% compared with 75% in 2013. The largest concentration within the trading securities
portfolio was in government and government agency debt securities. We had significant exposures to US Treasury and government agency debt securities (US$26bn) and UK (US$9.3bn) and Hong Kong (US$6.9bn) government debt securities. For an analysis of debt and equity securities held for trading, see Note 12 on the Financial Statements.
Derivatives
Derivative assets were US$345bn at 31 December 2014 (2013: US$282bn). Details of derivative amounts cleared through an exchange, central counterparty and non-central counterparty are shown on page 150. For an analysis of derivatives, see page 150 and Note 16 on the Financial Statements.
Loans and advances to customers
The following tables analyse loans and advances to customers by industry sector and by the location of the principal operations of the lending subsidiary or, in the case of the operations of The Hongkong and Shanghai Banking Corporation, HSBC Bank, HSBC Bank Middle East Limited (‘HSBC Bank Middle East’) and HSBC Bank USA, by the location of the lending branch. The distribution of loans across geographical regions and industries remained similar to last year. For an analysis of loans and advances by country see page 160.
Gross loans and advances to customers by industry sector and by geographical region (Audited)
Europe Asia4 MENA North America
Latin America Total
As a % of total gross
US$m US$m US$m US$m US$m US$m loans
Personal 178,531 129,515 6,571 65,400 13,537 393,554 39.9– first lien residential mortgages6 131,000 93,147 2,647 55,577 4,153 286,524 29.0– other personal7 47,531 36,368 3,924 9,823 9,384 107,030 10.9
Corporate and commercial 210,585 220,799 20,588 57,862 30,722 540,556 54.8– manufacturing 39,456 37,767 2,413 15,299 12,051 106,986 10.9– international trade and services 76,629 72,814 9,675 13,484 8,189 180,791 18.3– commercial real estate 28,187 35,678 579 6,558 2,291 73,293 7.4– other property-related 7,126 34,379 1,667 8,934 281 52,387 5.3– government 2,264 1,195 1,552 164 968 6,143 0.6– other commercial8 56,923 38,966 4,702 13,423 6,942 120,956 12.3
Financial 23,103 13,997 3,291 9,034 1,393 50,818 5.1– non-bank financial institutions 21,867 13,410 3,289 9,034 1,199 48,799 4.9– settlement accounts 1,236 587 2 – 194 2,019 0.2
Asset-backed securities reclassified 1,938 – – 131 – 2,069 0.2
Total gross loans and advances to customers at 31 December 2014 (A) 414,157 364,311 30,450 132,427 45,652 986,997 100.0
Percentage of A by geographical region 42.0% 36.9% 3.1% 13.4% 4.6% 100.0% –
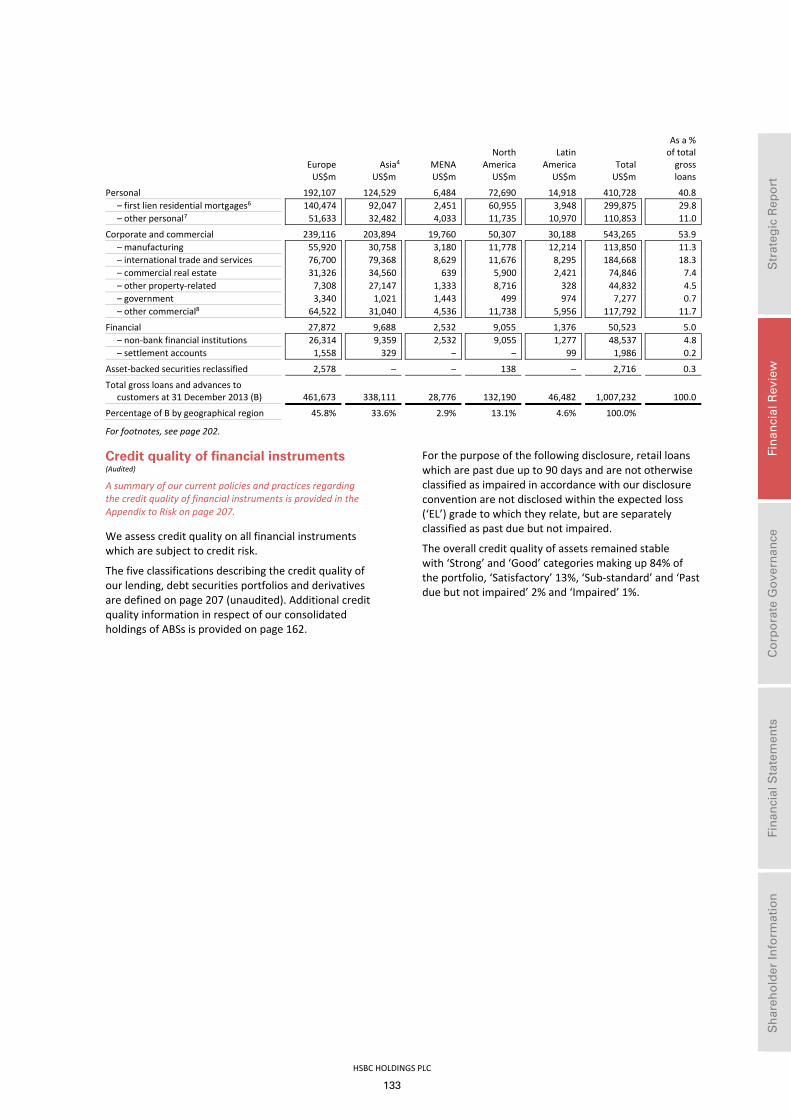
HSBC HOLDINGS PLC
133
Str
ateg
ic R
epo
rt
Fi
nan
cial
Rev
iew
Co
rpo
rate
Go
vern
ance
Fin
anci
al S
tate
men
ts
S
har
eho
lder
Info
rmat
ion
Europe Asia4 MENA North America
Latin America Total
As a % of total gross
US$m US$m US$m US$m US$m US$m loans
Personal 192,107 124,529 6,484 72,690 14,918 410,728 40.8– first lien residential mortgages6 140,474 92,047 2,451 60,955 3,948 299,875 29.8– other personal7 51,633 32,482 4,033 11,735 10,970 110,853 11.0
Corporate and commercial 239,116 203,894 19,760 50,307 30,188 543,265 53.9– manufacturing 55,920 30,758 3,180 11,778 12,214 113,850 11.3– international trade and services 76,700 79,368 8,629 11,676 8,295 184,668 18.3– commercial real estate 31,326 34,560 639 5,900 2,421 74,846 7.4– other property-related 7,308 27,147 1,333 8,716 328 44,832 4.5– government 3,340 1,021 1,443 499 974 7,277 0.7– other commercial8 64,522 31,040 4,536 11,738 5,956 117,792 11.7
Financial 27,872 9,688 2,532 9,055 1,376 50,523 5.0– non-bank financial institutions 26,314 9,359 2,532 9,055 1,277 48,537 4.8– settlement accounts 1,558 329 – – 99 1,986 0.2
Asset-backed securities reclassified 2,578 – – 138 – 2,716 0.3
Total gross loans and advances to customers at 31 December 2013 (B) 461,673 338,111 28,776 132,190 46,482 1,007,232 100.0
Percentage of B by geographical region 45.8% 33.6% 2.9% 13.1% 4.6% 100.0%
For footnotes, see page 202.
Credit quality of financial instruments (Audited)
A summary of our current policies and practices regarding the credit quality of financial instruments is provided in the Appendix to Risk on page 207.
We assess credit quality on all financial instruments which are subject to credit risk.
The five classifications describing the credit quality of our lending, debt securities portfolios and derivatives are defined on page 207 (unaudited). Additional credit quality information in respect of our consolidated holdings of ABSs is provided on page 162.
For the purpose of the following disclosure, retail loans which are past due up to 90 days and are not otherwise classified as impaired in accordance with our disclosure convention are not disclosed within the expected loss (‘EL’) grade to which they relate, but are separately classified as past due but not impaired.
The overall credit quality of assets remained stable with ‘Strong’ and ‘Good’ categories making up 84% of the portfolio, ‘Satisfactory’ 13%, ‘Sub-standard’ and ‘Past due but not impaired’ 2% and ‘Impaired’ 1%.

Report of the Directors: Risk (continued) Credit risk
HSBC HOLDINGS PLC
134
Distribution of financial instruments by credit quality (Audited) Neither past due nor impaired Past due
but notimpaired
Total gross
amount
Impairment allowances9
Total Strong Good Satisfactory
Sub-standard Impaired
US$m US$m US$m US$m US$m US$m US$m US$m US$mCash and balances at central
banks 127,971 1,438 195 353 129,957 129,957Items in the course of collection
from other banks 4,515 46 365 1 4,927 4,927Hong Kong Government
certificates of indebtedness 27,674 – – – 27,674 27,674Trading assets10 168,521 35,042 24,740 641 228,944 228,944
– treasury and other eligible bills 13,938 1,641 559 32 16,170 16,170
– debt securities 111,138 17,786 12,305 303 141,532 141,532– loans and advances:
to banks 17,492 4,961 5,016 112 27,581 27,581to customers 25,953 10,654 6,860 194 43,661 43,661
Financial assets designated at fair value10 3,017 4,476 1,207 331 9,031 9,031– treasury and other eligible
bills 5 – – 51 56 56– debt securities 3,011 4,476 1,124 280 8,891 8,891– loans and advances:
to banks 1 – 83 – 84 84to customers – – – – – –
Derivatives10 269,490 58,596 15,962 960 345,008 345,008Loans and advances to customers
held at amortised cost11 487,734 239,136 196,685 20,802 13,357 29,283 986,997 (12,337) 974,660– personal 320,678 32,601 15,109 1,130 8,876 15,160 393,554 (4,600) 388,954– corporate and commercial 141,375 192,799 171,748 18,986 3,922 13,795 542,625 (7,441) 535,184– financial (non-bank
financial institutions) 25,681 13,736 9,828 686 559 328 50,818 (296) 50,522Loans and advances to banks
held at amortised cost 83,766 19,525 7,945 914 1 47 112,198 (49) 112,149Reverse repurchase agreements
– non-trading 98,470 28,367 33,283 1,593 – – 161,713 – 161,713Financial investments 347,218 27,373 22,600 5,304 – 2,278 404,773 404,773
– treasury and other similar bills 68,966 6,294 4,431 1,826 – – 81,517 81,517
– debt securities 278,252 21,079 18,169 3,478 – 2,278 323,256 323,256Other assets 13,015 7,564 12,976 631 210 884 35,280 (16) 35,264
– assets held for sale 802 43 79 – 2 465 1,391 (16) 1,375– endorsements and
acceptances 1,507 4,644 4,281 298 34 11 10,775 10,775– accrued income and other 10,706 2,877 8,616 333 174 408 23,114 23,114
At 31 December 2014 1,631,391 421,563 315,958 31,530 13,568 32,492 2,446,502 (12,402) 2,434,100

HSBC HOLDINGS PLC
135
Str
ateg
ic R
epo
rt
Fi
nan
cial
Rev
iew
Co
rpo
rate
Go
vern
ance
Fin
anci
al S
tate
men
ts
S
har
eho
lder
Info
rmat
ion
Neither past due nor impaired Past due Total gross
amount
Strong Good Satisfactory
Sub- standard
but not impaired Impaired
Impairment allowances9
Total
US$m US$m US$m US$m US$m US$m US$m US$m US$m
Cash and balances at central banks 162,017 2,877 265 1,440 166,599 166,599
Items in the course of collection from other banks 5,590 66 286 79 6,021 6,021
Hong Kong Government certificates of indebtedness 25,220 – – – 25,220 25,220
Trading assets10 163,444 39,475 34,868 1,514 239,301 239,301– treasury and other eligible
bills 17,235 3,585 758 6 21,584 21,584 – debt securities 107,831 16,498 16,167 1,148 141,644 141,644– loans and advances:
to banks 15,804 5,546 6,342 193 27,885 27,885to customers 22,574 13,846 11,601 167 48,188 48,188
Financial assets designated at fair value10 6,608 5,183 671 257 12,719 12,719 – treasury and other eligible
bills 50 – – – 50 50 – debt securities 6,490 5,179 664 256 12,589 12,589– loans and advances:
to banks 68 – 7 1 76 76to customers – 4 – – 4 4
Derivatives10 220,711 47,004 13,425 1,125 282,265 282,265
Loans and advances to customers held at amortised cost11 488,504 243,077 199,821 23,942 15,460 36,428 1,007,232 (15,143) 992,089 – personal 326,269 39,024 14,882 1,580 10,175 18,798 410,728 (6,602) 404,126– corporate and commercial 132,943 194,966 174,905 21,281 5,009 16,877 545,981 (8,059) 537,922– financial (non-bank
financial institutions) 29,292 9,087 10,034 1,081 276 753 50,523 (482) 50,041
Loans and advances to banks held at amortised cost 91,498 21,131 6,266 1,123 11 75 120,104 (58) 120,046
Reverse repurchase agreements – non-trading 111,543 37,878 28,265 2,004 – – 179,690 – 179,690
Financial investments 362,799 27,833 17,556 6,089 – 2,508 416,785 416,785– treasury and other similar
bills 69,364 5,595 1,856 1,296 – – 78,111 78,111 – debt securities 293,435 22,238 15,700 4,793 – 2,508 338,674 338,674
Other assets 12,501 8,028 14,848 1,159 307 592 37,435 (111) 37,324– assets held for sale 1,129 642 1,050 351 89 156 3,417 (111) 3,306– endorsements and
acceptances 1,976 4,824 4,562 225 19 18 11,624 11,624 – accrued income and other 9,396 2,562 9,236 583 199 418 22,394 22,394
At 31 December 2013 1,650,435 432,552 316,271 38,732 15,778 39,603 2,493,371 (15,312) 2,478,059
For footnotes, see page 202.

Report of the Directors: Risk (continued) Credit risk
HSBC HOLDINGS PLC
136
Past due but not impaired gross financial instruments (Audited)
Past due but not impaired gross financial instruments are those loans where, although customers have failed to make payments in accordance with the contractual terms
of their facilities, they have not met the impaired loan criteria described on page 137.
Overall, past due but not impaired balances decreased by US$2.2bn, mainly due to continued run-off and loan sales in the CML portfolio.
Past due but not impaired gross financial instruments by geographical region (Audited)
Europe Asia4 MENA
North America
Latin America Total
US$m US$m US$m US$m US$m US$mLoans and advances to customers held at
amortised cost 2,409 4,260 704 4,634 1,350 13,357 – personal 1,159 2,880 182 3,759 896 8,876– corporate and commercial 1,244 1,102 508 623 445 3,922– financial (non-bank financial institutions) 6 278 14 252 9 559
Other financial instruments 6 52 31 97 25 211
At 31 December 2014 2,415 4,312 735 4,731 1,375 13,568 Loans and advances to customers held at
amortised cost 2,399 4,211 757 6,453 1,640 15,460 – personal 1,287 2,764 174 4,817 1,133 10,175– corporate and commercial 1,092 1,197 580 1,635 505 5,009– financial (non-bank financial institutions) 20 250 3 1 2 276
Other financial instruments 45 49 50 101 73 318
At 31 December 2013 2,444 4,260 807 6,554 1,713 15,778
For footnote, see page 202.
Ageing analysis of days for past due but not impaired gross financial instruments (Audited) Up to 29
days 30-59days
60-89days
90-179 days
180 days and over Total
US$m US$m US$m US$m US$m US$m
Loans and advances to customers held at amortised cost 10,427 2,057 801 54 18 13,357– personal 6,477 1,717 676 5 1 8,876– corporate and commercial 3,417 328 114 48 15 3,922– financial (non-bank financial institutions) 533 12 11 1 2 559
Other financial instruments 130 33 18 12 18 211
At 31 December 2014 10,557 2,090 819 66 36 13,568 Loans and advances to customers held at amortised cost 11,689 2,587 1,057 76 51 15,460
– personal 7,170 2,124 865 16 – 10,175– corporate and commercial 4,290 418 190 60 51 5,009– financial (non-bank financial institutions) 229 45 2 – – 276
Other financial instruments 214 55 26 12 11 318
At 31 December 2013 11,903 2,642 1,083 88 62 15,778

HSBC HOLDINGS PLC
137
Str
ateg
ic R
epo
rt
Fi
nan
cial
Rev
iew
Co
rpo
rate
Go
vern
ance
Fin
anci
al S
tate
men
ts
S
har
eho
lder
Info
rmat
ion
Impaired loans (Audited)
Impaired loans and advances are those that meet any of the following criteria:
• wholesale loans and advances classified as Customer Risk Rating (‘CRR’) 9 or CRR 10. These grades are assigned when the bank considers that either the customer is unlikely to pay their credit obligations in full, without recourse to security, or when the customer is more than 90 days past due on any material credit obligation to HSBC.
• retail loans and advances classified as Expected Loss (‘EL’) 9 or EL 10. These grades are typically assigned to retail loans and advances more than 90 days past due unless individually they have been assessed as not impaired.
• renegotiated loans and advances that have been subject to a change in contractual cash flows as a result of a concession which the lender would not
otherwise consider, and where it is probable that without the concession the borrower would be unable to meet the contractual payment obligations in full, unless the concession is insignificant and there are no other indicators of impairment. Renegotiated loans remain classified as impaired until there is sufficient evidence to demonstrate a significant reduction in the risk of non-payment of future cash flows, and there are no other indicators of impairment.
For loans that are assessed for impairment on a collective basis, the evidence to support reclassification as no longer impaired typically comprises a history of payment performance against the original or revised terms, depending on the nature and volume of renegotiation and the credit risk characteristics surrounding the renegotiation. For loans that are assessed for impairment on an individual basis, all available evidence is assessed on a case-by-case basis. For further details of the CRR and the EL scales see page 207.
Movement in impaired loans by geographical region (Unaudited)
Europe Asia4 MENA North
America Latin
America Total US$m US$m US$m US$m US$m US$m
Impaired loans at 1 January 2014 13,228 1,623 2,285 15,123 4,244 36,503– personal 2,938 526 317 13,669 1,348 18,798– corporate and commercial 9,714 1,082 1,765 1,427 2,889 16,877– financial5 576 15 203 27 7 828
Classified as impaired during the year 3,367 1,970 346 4,724 3,342 13,749– personal 1,168 857 193 4,360 1,958 8,536– corporate and commercial 2,166 1,113 153 354 1,383 5,169– financial5 33 – – 10 1 44
Transferred from impaired to unimpaired during the year (1,661) (230) (320) (2,609) (730) (5,550)– personal (282) (184) (178) (2,551) (364) (3,559)– corporate and commercial (1,319) (46) (53) (57) (366) (1,841)– financial5 (60) – (89) (1) – (150)
Amounts written off (2,037) (617) (111) (1,369) (2,048) (6,182)– personal (631) (470) (77) (1,007) (1,371) (3,556)– corporate and commercial (1,201) (147) (29) (356) (673) (2,406)– financial5 (205) – (5) (6) (4) (220)
Net repayments and other (2,655) (698) (219) (4,175) (1,443) (9,190)– personal (649) (238) (13) (3,645) (514) (5,059)– corporate and commercial (1,975) (457) (140) (506) (926) (4,004)– financial5 (31) (3) (66) (24) (3) (127)
Impaired loans at 31 December 2014 10,242 2,048 1,981 11,694 3,365 29,330– personal 2,544 491 242 10,826 1,057 15,160– corporate and commercial 7,385 1,545 1,696 862 2,307 13,795– financial5 313 12 43 6 1 375
Impaired loans as a percentage of gross loans 2.3% 0.5% 4.8% 8.4% 6.1% 2.7%– personal 1.4% 0.4% 3.7% 16.6% 7.8% 3.9%– corporate and commercial 3.5% 0.7% 8.2% 1.5% 7.5% 2.5%– financial5 0.7% 0.0% 0.3% 0.0% 0.0% 0.2%

Report of the Directors: Risk (continued) Credit risk
HSBC HOLDINGS PLC
138
Movement in impaired loans by geographical region (continued) (Unaudited)
Europe Asia4 MENA North
America Latin
America Total US$m US$m US$m US$m US$m US$m
Impaired loans at 1 January 2013 11,145 1,624 2,474 20,345 3,188 38,776 – personal 2,466 611 368 18,726 1,580 23,751 – corporate and commercial 8,058 967 1,872 1,592 1,604 14,093 – financial5 621 46 234 27 4 932
Classified as impaired during the year 4,952 1,424 419 6,168 4,333 17,296– personal 1,176 798 107 5,319 1,872 9,272– corporate and commercial 3,726 623 306 837 2,453 7,945– financial5 50 3 6 12 8 79
Transferred from impaired to unimpaired during the year (1,215) (145) (166) (3,198) (642) (5,366)– personal (265) (137) (68) (3,172) (266) (3,908)– corporate and commercial (804) (8) (85) (24) (375) (1,296)– financial5 (146) – (13) (2) (1) (162)
Amounts written off (1,411) (538) (165) (1,706) (1,957) (5,777)– personal (423) (444) (79) (1,433) (1,456) (3,835)– corporate and commercial (927) (91) (75) (270) (499) (1,862)– financial5 (61) (3) (11) (3) (2) (80)
Net repayments and other (243) (742) (277) (6,486) (678) (8,426)– personal (16) (302) (11) (5,771) (382) (6,482)– corporate and commercial (339) (409) (253) (708) (294) (2,003)– financial5 112 (31) (13) (7) (2) 59
Impaired loans at 31 December 2013 13,228 1,623 2,285 15,123 4,244 36,503– personal 2,938 526 317 13,669 1,348 18,798– corporate and commercial 9,714 1,082 1,765 1,427 2,889 16,877– financial5 576 15 203 27 7 828
Impaired loans as a percentage of gross loans 2.7% 0.4% 6.5% 10.9% 7.5% 3.2%– personal 1.5% 0.4% 4.9% 18.8% 9.0% 4.6%– corporate and commercial 4.0% 0.5% 8.9% 2.8% 9.6% 3.1%– financial5 1.1% 0.0% 2.3% 0.2% 0.1% 0.5%
For footnotes, see page 202.
Impaired loans decreased by US$7.2bn during the year. Personal impaired loans declined mainly due to the continued run off and loan sales in the CML portfolio in North America. In personal lending, ‘Net repayments and other’ includes US$2.9bn of CML portfolio assets that were reclassified as held for sale and also sold during the year.
Impaired loans in wholesale lending declined mainly in Europe and, to a lesser extent, in North America and Latin America due to repayments and a reduction in new impaired loans which reflected improvements in the economic conditions in these markets. These decreases were offset by an increase in Asia.
Renegotiated loans and forbearance (Audited)
Current policies and procedures regarding renegotiated loans and forbearance are described in the Appendix to Risk on page 208.
The contractual terms of a loan may be modified for a number of reasons, including changes in market conditions, customer retention and other factors not related to the current or potential credit deterioration of a customer. ‘Forbearance’ describes concessions made on the contractual terms of a loan in response to an obligor’s financial difficulties. We classify and report loans on which concessions have been granted under conditions of credit distress as ‘renegotiated loans’
when their contractual payment terms have been modified, because we have significant concerns about the borrowers’ ability to meet contractual payments when due. On renegotiation, where the existing agreement is cancelled and a new agreement is made on substantially different terms, or if the terms of an existing agreement are modified such that the renegotiated loan is substantially a different financial instrument, the loan would be derecognised and recognised as a new loan for accounting purposes. However, the newly recognised financial asset will retain the renegotiated loan classification. Concessions on loans made to customers which do not affect the payment structure or basis of repayment, such as waivers of financial or security covenants, do not directly provide concessionary relief to customers in terms of their ability to service obligations as they fall due and are therefore not included in this classification.
The most significant portfolio of renegotiated loans remained in North America, substantially all of which were retail loans held by HSBC Finance.
The following tables show the gross carrying amounts of the Group’s holdings of renegotiated loans and advances to customers by industry sector, geography and credit quality classification.

HSBC HOLDINGS PLC
139
Str
ateg
ic R
epo
rt
Fi
nan
cial
Rev
iew
Co
rpo
rate
Go
vern
ance
Fin
anci
al S
tate
men
ts
S
har
eho
lder
Info
rmat
ion
Renegotiated loans and advances to customers by geographical region (Audited)
Europe Asia4 MENA
North America
Latin America Total
US$m US$m US$m US$m US$m US$m
First lien residential mortgages 1,605 94 58 13,540 60 15,357– neither past due nor impaired 529 63 19 3,695 32 4,338– past due but not impaired 221 8 1 1,894 5 2,129– impaired 855 23 38 7,951 23 8,890
Other personal lending7 324 292 27 1,267 326 2,236– neither past due nor impaired 184 173 16 453 14 840– past due but not impaired 40 22 5 214 1 282– impaired 100 97 6 600 311 1,114
Corporate and commercial 5,469 501 1,439 427 1,324 9,160– neither past due nor impaired 1,383 102 483 36 303 2,307– past due but not impaired 68 – 31 1 1 101– impaired 4,018 399 925 390 1,020 6,752
Financial5 413 4 323 1 1 742– neither past due nor impaired 219 – 305 – – 524– past due but not impaired – – – – – –– impaired 194 4 18 1 1 218
Renegotiated loans at 31 December 2014 7,811 891 1,847 15,235 1,711 27,495– neither past due nor impaired 2,315 338 823 4,184 349 8,009– past due but not impaired 329 30 37 2,109 7 2,512– impaired 5,167 523 987 8,942 1,355 16,974
Impairment allowances on renegotiated loans 1,458 170 458 1,499 704 4,289– renegotiated loans as % of total gross loans 1.9% 0.2% 6.1% 11.5% 3.7% 2.8%
First lien residential mortgages 1,820 117 91 16,853 76 18,957
– neither past due nor impaired 392 78 47 4,332 32 4,881– past due but not impaired 517 11 3 2,684 4 3,219– impaired 911 28 41 9,837 40 10,857
Other personal lending7 431 318 58 1,277 531 2,615– neither past due nor impaired 253 207 33 503 18 1,014– past due but not impaired 39 24 17 284 2 366– impaired 139 87 8 490 511 1,235
Corporate and commercial 7,270 330 1,583 658 2,161 12,002– neither past due nor impaired 1,796 134 677 47 493 3,147– past due but not impaired 193 4 126 34 5 362– impaired 5,281 192 780 577 1,663 8,493
Financial5 235 2 362 1 1 601– neither past due nor impaired 93 – 265 – – 358– past due but not impaired – – – – – –– impaired 142 2 97 1 1 243
Renegotiated loans at 31 December 2013 9,756 767 2,094 18,789 2,769 34,175– neither past due nor impaired 2,534 419 1,022 4,882 543 9,400– past due but not impaired 749 39 146 3,002 11 3,947– impaired 6,473 309 926 10,905 2,215 20,828
Impairment allowances on renegotiated loans 1,867 101 460 2,285 1,014 5,727– renegotiated loans as % of total gross loans 2.1% 0.2% 7.3% 14.2% 6.0% 3.4%
For footnotes, see page 202.
The following table shows movements in renegotiated loans during the year. Renegotiated loans reduced by US$6.7bn to US$27bn in 2014. Renegotiated loans in personal lending reduced by US$4bn. Included within ‘other’ movements is US$1.9bn of CML portfolio assets that were transferred to held for sale. New renegotiated
loans and write-offs reduced as a result of improvements in the US housing market and economic conditions.
Renegotiated loans in wholesale lending decreased by US$2.7bn. The reductions were mainly concentrated in Europe and Latin America and were the result of increased write-offs and repayments.

Report of the Directors: Risk (continued) Credit risk
HSBC HOLDINGS PLC
140
Movement in renegotiated loans by geographical region (Unaudited)
Europe Asia4 MENA
NorthAmerica
Latin America Total
US$m US$m US$m US$m US$m US$mRenegotiated loans at 1 January 2014 9,756 767 2,094 18,789 2,769 34,175
– personal 2,251 435 149 18,130 607 21,572 – corporate and commercial 7,270 330 1,583 658 2,161 12,002 – financial 235 2 362 1 1 601
Loans renegotiated in the year without derecognition 1,543 371 296 862 725 3,797 – personal 433 83 10 774 310 1,610 – corporate and commercial 939 288 286 78 415 2,006 – financial 171 – – 10 – 181
Loans renegotiated in the year resulting in recognition of a new loan 500 5 79 – 92 676 – personal 69 2 – – 28 99 – corporate and commercial 381 – 61 – 64 506 – financial 50 3 18 – – 71
Repayments (2,416) (246) (562) (1,518) (1,036) (5,778)– personal (635) (96) (47) (1,319) (288) (2,385)– corporate and commercial (1,757) (149) (445) (189) (747) (3,287)– financial (24) (1) (70) (10) (1) (106)
Amounts written off (828) (42) (23) (640) (510) (2,043)– personal (88) (28) (7) (568) (223) (914)– corporate and commercial (740) (14) (16) (72) (286) (1,128)– financial – – – – (1) (1)
Other (744) 36 (37) (2,258) (329) (3,332)– personal (101) (10) (20) (2,210) (48) (2,389)– corporate and commercial (624) 46 (30) (48) (283) (939)– financial (19) – 13 – 2 (4)
At 31 December 2014 7,811 891 1,847 15,235 1,711 27,495 – personal 1,929 386 85 14,807 386 17,593 – corporate and commercial 5,469 501 1,439 427 1,324 9,160 – financial 413 4 323 1 1 742
Renegotiated loans at 1 January 2013 9,974 944 2,389 26,162 2,758 42,227
– personal 2,817 493 190 25,474 781 29,755– corporate and commercial 6,829 447 1,859 685 1,975 11,795– financial 328 4 340 3 2 677
Loans renegotiated in the year without derecognition 2,807 49 101 1,727 1,311 5,995– personal 264 8 16 1,335 507 2,130– corporate and commercial 2,541 41 85 391 803 3,861– financial 2 – – 1 1 4
Loans renegotiated in the year resulting in recognition of a new loan 105 113 14 – 62 294– personal 17 76 14 – 25 132– corporate and commercial 88 37 – – 37 162– financial – – – – – –
Repayments (2,139) (233) (541) (1,759) (707) (5,379)– personal (489) (111) (64) (1,387) (353) (2,404)– corporate and commercial (1,574) (121) (477) (370) (354) (2,896)– financial (76) (1) – (2) – (79)
Amounts written off (426) (25) (38) (1,035) (409) (1,933)– personal (99) (20) (9) (995) (233) (1,356)– corporate and commercial (303) (5) (29) (40) (175) (552)– financial (24) – – – (1) (25)
Other (565) (81) 169 (6,306) (246) (7,029)– personal (259) (11) 2 (6,297) (120) (6,685)– corporate and commercial (311) (69) 145 (8) (125) (368)– financial 5 (1) 22 (1) (1) 24
At 31 December 2013 9,756 767 2,094 18,789 2,769 34,175– personal 2,251 435 149 18,130 607 21,572– corporate and commercial 7,270 330 1,583 658 2,161 12,002– financial 235 2 362 1 1 601
For footnote, see page 202.

HSBC HOLDINGS PLC
141
Str
ateg
ic R
epo
rt
Fi
nan
cial
Rev
iew
Co
rpo
rate
Go
vern
ance
Fin
anci
al S
tate
men
ts
S
har
eho
lder
Info
rmat
ion
Impairment of loans and advances (Audited)
A summary of our current policies and practices regarding impairment assessment is provided in the Appendix to Risk on page 212. For an analysis of loan impairment charges and other credit risk provisions by global business, see page 76.
The tables below analyse the impairment allowances recognised for impaired loans and advances that are either individually or collectively assessed, and collective impairment allowances on loans and advances that are classified as not impaired.
Loan impairment charge to the income statement by industry sector (Unaudited)
Europe Asia4 MENA
North America
Latin America Total
US$m US$m US$m US$m US$m US$m
Personal 245 321 25 117 1,095 1,803– first lien residential mortgages (75) 6 (24) 26 15 (52)– other personal7 320 315 49 91 1,080 1,855
Corporate and commercial 790 327 6 196 937 2,256– manufacturing and international trade and
services
520 197 36 116 382 1,251 – commercial real estate and other property-
related
78 29 (28) 27 176 282 – other commercial8 192 101 (2) 53 379 723
Financial5 44 (4) (32) (13) 1 (4)
Total loan impairment charge for the year ended 31 December 2014 1,079 644 (1) 300 2,033 4,055
Personal 320 345 46 963 1,522 3,196– first lien residential mortgages (11) (7) (13) 647 11 627– other personal7 331 352 59 316 1,511 2,569
Corporate and commercial 1,467 152 (13) 253 1,115 2,974– manufacturing and international trade and
services
800 134 37 125 594 1,690 – commercial real estate and other property-
related
432 (2) (5) 79 322 826 – other commercial8 235 20 (45) 49 199 458
Financial5 (55) (14) (77) 19 5 (122)
Total loan impairment charge for the year ended 31 December 2013 1,732 483 (44) 1,235 2,642 6,048
Loan impairment charge to the income statement by assessment type (Unaudited)
Europe Asia4 MENA
North America
Latin America Total
US$m US$m US$m US$m US$m US$m
Individually assessed impairment allowances 617 351 32 190 590 1,780– new allowances 1,112 542 134 298 738 2,824– release of allowances no longer required (486) (171) (95) (88) (90) (930)– recoveries of amounts previously written off (9) (20) (7) (20) (58) (114)
Collectively assessed impairment allowances12 462 293 (33) 110 1,443 2,275– new allowances net of allowance releases 757 426 2 205 1,726 3,116– recoveries of amounts previously written off (295) (133) (35) (95) (283) (841)
Total loan impairment charge for the year ended 31 December 2014 1,079 644 (1) 300 2,033 4,055
Individually assessed impairment allowances 1,376 145 (86) 262 623 2,320– new allowances 1,828 316 196 398 702 3,440– release of allowances no longer required (402) (145) (235) (98) (31) (911)– recoveries of amounts previously written off (50) (26) (47) (38) (48) (209)
Collectively assessed impairment allowances12 356 338 42 973 2,019 3,728– new allowances net of allowance releases 943 479 82 1,058 2,253 4,815– recoveries of amounts previously written off (587) (141) (40) (85) (234) (1,087)
Total loan impairment charge for the year ended 31 December 2013 1,732 483 (44) 1,235 2,642 6,048
For footnotes, see page 202.
Total loan impairment charges of US$4.1bn were US$2.0bn lower than in 2013 reflecting reduced impairment charges in both the personal lending and
the corporate and commercial lending portfolios, primarily in North America, Europe and Latin America.

Report of the Directors: Risk (continued) Credit risk
HSBC HOLDINGS PLC
142
In North America, loan impairment charges relating to both first lien mortgages and other personal lending decreased, which reflected reduced levels of both delinquency and new impaired loans in the CML portfolio, and a fall in lending balances from continued run-off and loan sales. This was partly offset by lower favourable market value adjustments of underlying properties as improvements in housing market conditions were less pronounced in 2014 than in 2013.
In Europe, the reduction in loan impairment charges was primarily in corporate and commercial lending, as a result of lower individually assessed impairment allowances reflecting the improved quality of the portfolio and economic conditions. Loan impairment charges also decreased in personal lending, albeit to a lesser extent, due to lower delinquency levels in the improved economic environment and as customers continued to reduce outstanding credit card and loan balances. These factors
were partly offset by an increase in collectively assessed allowances in the corporate and commercial lending sector as we revised certain estimates in our collective corporate loan impairment calculation, and in the financial industry sector reflecting charges compared with releases in 2013.
In Latin America, the reduction in loan impairment charges in the other personal lending and the corporate and commercial portfolios primarily reflected the prior year adverse effect of changes to the impairment model and assumption revisions for restructured loan portfolios in Brazil. Individually assessed allowances were broadly stable. There were lower loan impairment charges in Mexico in the commercial real estate and other property related sector, in particular relating to certain homebuilders. In Brazil individually assessed allowances increased due to an impairment relating to a corporate customer in the other commercial sector.
Charge for impairment losses as a percentage of average gross loans and advances to customers by geographical region (Unaudited)
Europe Asia4 MENA North
America Latin America Total
% % % % % %
New allowances net of allowance releases 0.37 0.22 0.14 0.32 5.00 0.53Recoveries (0.08) (0.04) (0.14) (0.09) (0.72) (0.10)
Total charge for impairment losses at 31 December 2014 0.29 0.18 – 0.23 4.28 0.43
Amount written off net of recoveries 0.49 0.13 0.58 0.97 3.59 0.58
New allowances net of allowance releases 0.65 0.20 0.15 1.00 5.93 0.81Recoveries (0.17) (0.05) (0.29) (0.09) (0.57) (0.14)
Total charge for impairment losses at 31 December 2013 0.48 0.15 (0.14) 0.91 5.36 0.67
Amount written off net of recoveries 0.42 0.12 0.38 1.10 3.69 0.59
For footnote, see page 202.
Movement in impairment allowances by industry sector and by geographical region (Unaudited)
Europe Asia4 MENA North
America Latin America Total
US$m US$m US$m US$m US$m US$m
Impairment allowances at 1 January 2014 5,598 1,214 1,583 4,242 2,564 15,201
Amounts written off Personal (724) (463) (157) (1,030) (1,359) (3,733)
– first lien residential mortgages (21) (17) (4) (731) (40) (813)– other personal7 (703) (446) (153) (299) (1,319) (2,920)
Corporate and commercial (1,202) (146) (47) (346) (684) (2,425)– manufacturing and international trade and services (732) (86) (41) (81) (428) (1,368)– commercial real estate and other property-related (342) (53) (6) (153) (39) (593)– other commercial8 (128) (7) – (112) (217) (464)
Financial5 (203) – (8) (6) (4) (221)
Total amounts written off (2,129) (609) (212) (1,382) (2,047) (6,379)
Recoveries of amounts written off in previous years Personal 271 143 35 86 283 818
– first lien residential mortgages 3 3 – 40 33 79– other personal7 268 140 35 46 250 739
Corporate and commercial 29 9 7 25 58 128– manufacturing and international trade and services 19 7 7 6 46 85– commercial real estate and other property-related 11 – – 3 1 15– other commercial8 (1) 2 – 16 11 28
Financial5 4 1 – 4 – 9
Total recoveries of amounts written off in previous years 304 153 42 115 341 955
Charge to income statement 1,079 644 (1) 300 2,033 4,055
Exchange and other movements13 (397) (46) (6) (635) (362) (1,446)
Impairment allowances at 31 December 2014 4,455 1,356 1,406 2,640 2,529 12,386
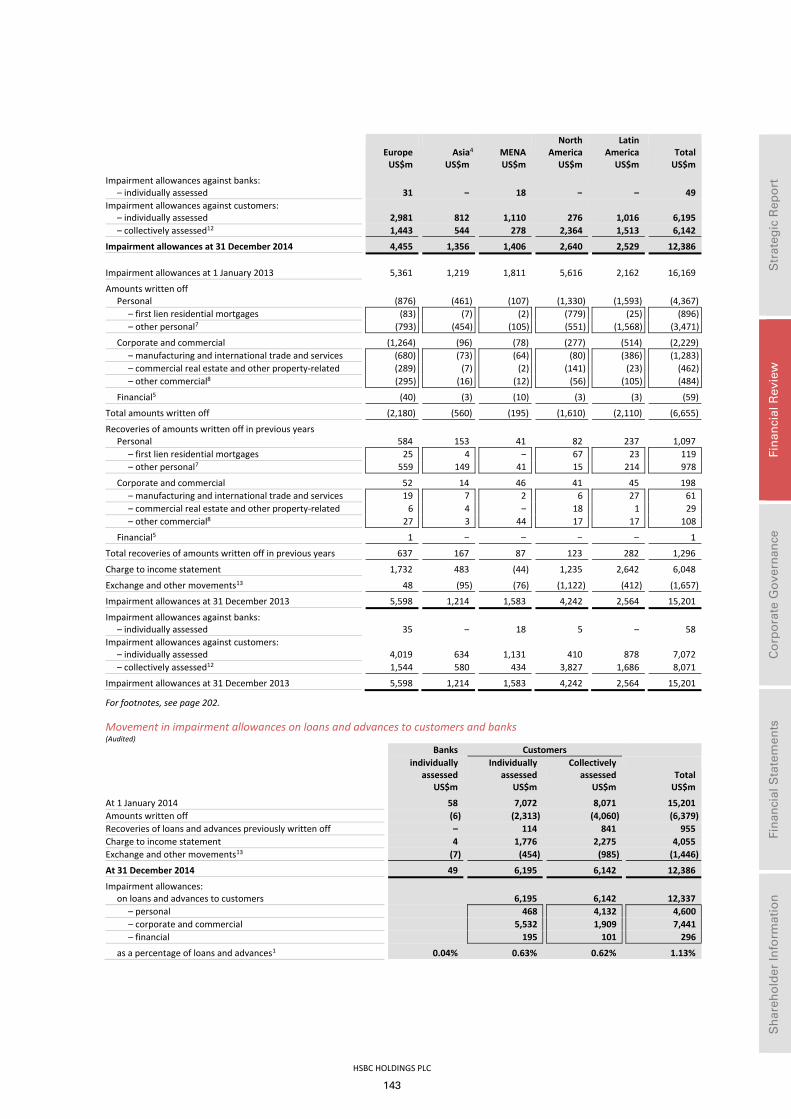
HSBC HOLDINGS PLC
143
Str
ateg
ic R
epo
rt
Fi
nan
cial
Rev
iew
Co
rpo
rate
Go
vern
ance
Fin
anci
al S
tate
men
ts
S
har
eho
lder
Info
rmat
ion
Europe Asia4 MENA North
America Latin America Total
US$m US$m US$m US$m US$m US$m
Impairment allowances against banks: – individually assessed 31 – 18 – – 49
Impairment allowances against customers: – individually assessed 2,981 812 1,110 276 1,016 6,195– collectively assessed12 1,443 544 278 2,364 1,513 6,142
Impairment allowances at 31 December 2014 4,455 1,356 1,406 2,640 2,529 12,386
Impairment allowances at 1 January 2013 5,361 1,219 1,811 5,616 2,162 16,169
Amounts written off Personal (876) (461) (107) (1,330) (1,593) (4,367)
– first lien residential mortgages (83) (7) (2) (779) (25) (896)– other personal7 (793) (454) (105) (551) (1,568) (3,471)
Corporate and commercial (1,264) (96) (78) (277) (514) (2,229)– manufacturing and international trade and services (680) (73) (64) (80) (386) (1,283)– commercial real estate and other property-related (289) (7) (2) (141) (23) (462)– other commercial8 (295) (16) (12) (56) (105) (484)
Financial5 (40) (3) (10) (3) (3) (59)
Total amounts written off (2,180) (560) (195) (1,610) (2,110) (6,655)
Recoveries of amounts written off in previous years Personal 584 153 41 82 237 1,097
– first lien residential mortgages 25 4 – 67 23 119– other personal7 559 149 41 15 214 978
Corporate and commercial 52 14 46 41 45 198– manufacturing and international trade and services 19 7 2 6 27 61– commercial real estate and other property-related 6 4 – 18 1 29– other commercial8 27 3 44 17 17 108
Financial5 1 – – – – 1
Total recoveries of amounts written off in previous years 637 167 87 123 282 1,296
Charge to income statement 1,732 483 (44) 1,235 2,642 6,048
Exchange and other movements13 48 (95) (76) (1,122) (412) (1,657)
Impairment allowances at 31 December 2013 5,598 1,214 1,583 4,242 2,564 15,201
Impairment allowances against banks: – individually assessed 35 – 18 5 – 58
Impairment allowances against customers: – individually assessed 4,019 634 1,131 410 878 7,072– collectively assessed12 1,544 580 434 3,827 1,686 8,071
Impairment allowances at 31 December 2013 5,598 1,214 1,583 4,242 2,564 15,201
For footnotes, see page 202.
Movement in impairment allowances on loans and advances to customers and banks (Audited) Banks Customers individually
assessed Individually
assessed Collectively
assessed Total US$m US$m US$m US$m
At 1 January 2014 58 7,072 8,071 15,201Amounts written off (6) (2,313) (4,060) (6,379)Recoveries of loans and advances previously written off – 114 841 955Charge to income statement 4 1,776 2,275 4,055Exchange and other movements13 (7) (454) (985) (1,446)
At 31 December 2014 49 6,195 6,142 12,386
Impairment allowances: on loans and advances to customers 6,195 6,142 12,337
– personal 468 4,132 4,600– corporate and commercial 5,532 1,909 7,441– financial 195 101 296
as a percentage of loans and advances1 0.04% 0.63% 0.62% 1.13%

Report of the Directors: Risk (continued) Credit risk
HSBC HOLDINGS PLC
144
Movement in impairment allowances on loans and advances to customers and banks (continued) (Audited) Banks Customers individually
assessed Individually
assessed Collectively
assessed Total US$m US$m US$m US$m
At 1 January 2013 57 6,572 9,540 16,169Amounts written off (4) (1,937) (4,714) (6,655)Recoveries of loans and advances previously written off – 209 1,087 1,296Charge to income statement 5 2,315 3,728 6,048Exchange and other movements13 – (87) (1,570) (1,657)
At 31 December 2013 58 7,072 8,071 15,201
Impairment allowances: on loans and advances to customers 7,072 8,071 15,143
– personal 589 6,013 6,602– corporate and commercial 6,096 1,963 8,059– financial 387 95 482
as a percentage of loans and advances1 0.05% 0.70% 0.80% 1.35%
For footnotes, see page 202.
Wholesale lending
On a reported basis gross loans decreased by US$11bn, which included adverse foreign exchange movements of US$32bn, mainly in Europe.
The following commentary is on a constant currency basis.
Wholesale lending grew by US$21bn in the year. In Asia, balances grew by US$16bn as we continued to leverage our position in emerging markets. In North America, we also experienced strong growth of US$10bn as we executed our strategy of expanding our core offerings and proactively targeting companies with international
banking requirements in key growth markets. The fall in lending in Europe of US$15bn was mainly driven by a reduction in corporate overdraft balances. In the UK, a small number of clients benefited from the use of net interest arrangements across their overdraft and deposit positions. During the year, as we aligned our approach in our Payments and Cash Management business to be more globally consistent, many of these clients increased the frequency with which they settled these balances, reducing their overdraft and deposit balances, which fell by US$28bn. The Middle East and North Africa and Latin America grew by US$6bn and US$4bn, respectively.
Total wholesale lending (Unaudited)
Europe Asia4 MENA North
America Latin America Total
US$m US$m US$m US$m US$m US$m
Corporate and commercial (A) 210,585 220,799 20,588 57,862 30,722 540,556– manufacturing 39,456 37,767 2,413 15,299 12,051 106,986– international trade and services 76,629 72,814 9,675 13,484 8,189 180,791– commercial real estate 28,187 35,678 579 6,558 2,291 73,293– other property-related 7,126 34,379 1,667 8,934 281 52,387– government 2,264 1,195 1,552 164 968 6,143– other commercial8 56,923 38,966 4,702 13,423 6,942 120,956
Financial (non-bank financial institutions) (B) 23,103 13,997 3,291 9,034 1,393 50,818Asset-backed securities reclassified 1,938 – – 131 – 2,069Loans and advances to banks (C) 21,978 62,960 10,495 7,405 9,360 112,198
Gross loans at 31 December 2014 (D) 257,604 297,756 34,374 74,432 41,475 705,641
Impairment allowances on wholesale lending Corporate and commercial (a) 3,112 1,089 1,171 608 1,461 7,441
– manufacturing 529 242 141 152 348 1,412– international trade and services 877 533 536 157 237 2,340– commercial real estate 909 44 147 101 476 1,677– other property-related 203 55 219 57 12 546– government 4 – 1 – – 5– other commercial 590 215 127 141 388 1,461
Financial (non-bank financial institutions) (b) 221 13 21 39 2 296Loans and advances to banks (c) 31 – 18 – – 49
Impairment allowances at 31 December 2014 (d) 3,364 1,102 1,210 647 1,463 7,786
(a) as a percentage of (A) 1.48% 0.49% 5.69% 1.05% 4.76% 1.38%(b) as a percentage of (B) 0.96% 0.09% 0.64% 0.43% 0.14% 0.58%(c) as a percentage of (C) 0.14% – 0.17% – – 0.04%(d) as a percentage of (D) 1.31% 0.37% 3.52% 0.87% 3.53% 1.10%
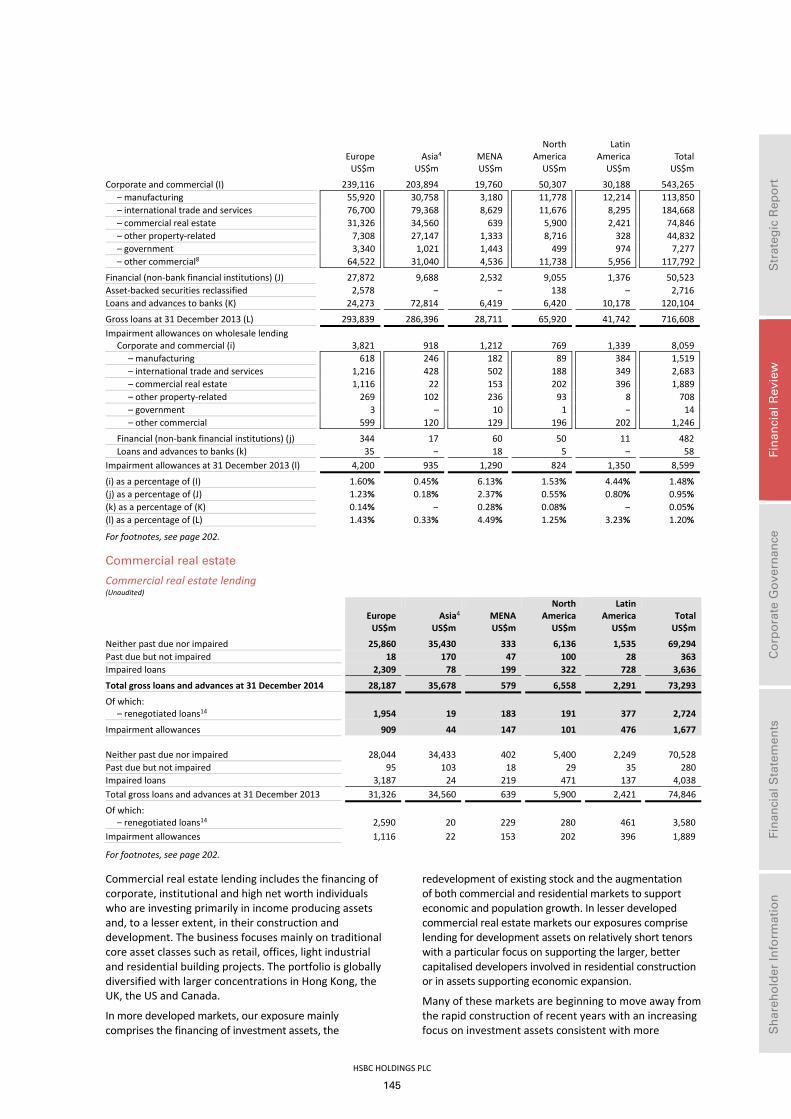
HSBC HOLDINGS PLC
145
Str
ateg
ic R
epo
rt
Fi
nan
cial
Rev
iew
Co
rpo
rate
Go
vern
ance
Fin
anci
al S
tate
men
ts
S
har
eho
lder
Info
rmat
ion
Europe Asia4 MENA
North America
Latin America Total
US$m US$m US$m US$m US$m US$m
Corporate and commercial (I) 239,116 203,894 19,760 50,307 30,188 543,265– manufacturing 55,920 30,758 3,180 11,778 12,214 113,850– international trade and services 76,700 79,368 8,629 11,676 8,295 184,668– commercial real estate 31,326 34,560 639 5,900 2,421 74,846– other property-related 7,308 27,147 1,333 8,716 328 44,832– government 3,340 1,021 1,443 499 974 7,277– other commercial8 64,522 31,040 4,536 11,738 5,956 117,792
Financial (non-bank financial institutions) (J) 27,872 9,688 2,532 9,055 1,376 50,523Asset-backed securities reclassified 2,578 – – 138 – 2,716Loans and advances to banks (K) 24,273 72,814 6,419 6,420 10,178 120,104
Gross loans at 31 December 2013 (L) 293,839 286,396 28,711 65,920 41,742 716,608Impairment allowances on wholesale lending
Corporate and commercial (i) 3,821 918 1,212 769 1,339 8,059– manufacturing 618 246 182 89 384 1,519– international trade and services 1,216 428 502 188 349 2,683– commercial real estate 1,116 22 153 202 396 1,889– other property-related 269 102 236 93 8 708– government 3 – 10 1 – 14– other commercial 599 120 129 196 202 1,246
Financial (non-bank financial institutions) (j) 344 17 60 50 11 482Loans and advances to banks (k) 35 – 18 5 – 58
Impairment allowances at 31 December 2013 (l) 4,200 935 1,290 824 1,350 8,599
(i) as a percentage of (I) 1.60% 0.45% 6.13% 1.53% 4.44% 1.48%(j) as a percentage of (J) 1.23% 0.18% 2.37% 0.55% 0.80% 0.95%(k) as a percentage of (K) 0.14% – 0.28% 0.08% – 0.05%(l) as a percentage of (L) 1.43% 0.33% 4.49% 1.25% 3.23% 1.20%
For footnotes, see page 202.
Commercial real estate
Commercial real estate lending (Unaudited)
Europe Asia4 MENA North
America Latin America Total
US$m US$m US$m US$m US$m US$m
Neither past due nor impaired 25,860 35,430 333 6,136 1,535 69,294Past due but not impaired 18 170 47 100 28 363Impaired loans 2,309 78 199 322 728 3,636
Total gross loans and advances at 31 December 2014 28,187 35,678 579 6,558 2,291 73,293
Of which: – renegotiated loans14 1,954 19 183 191 377 2,724
909Impairment allowances 909 44 147 101 476 1,677 Neither past due nor impaired 28,044 34,433 402 5,400 2,249 70,528Past due but not impaired 95 103 18 29 35 280Impaired loans 3,187 24 219 471 137 4,038Total gross loans and advances at 31 December 2013 31,326 34,560 639 5,900 2,421 74,846
Of which: – renegotiated loans14 2,590 20 229 280 461 3,580
Impairment allowances 1,116 22 153 202 396 1,889
For footnotes, see page 202.
Commercial real estate lending includes the financing of corporate, institutional and high net worth individuals who are investing primarily in income producing assets and, to a lesser extent, in their construction and development. The business focuses mainly on traditional core asset classes such as retail, offices, light industrial and residential building projects. The portfolio is globally diversified with larger concentrations in Hong Kong, the UK, the US and Canada.
In more developed markets, our exposure mainly comprises the financing of investment assets, the
redevelopment of existing stock and the augmentation of both commercial and residential markets to support economic and population growth. In lesser developed commercial real estate markets our exposures comprise lending for development assets on relatively short tenors with a particular focus on supporting the larger, better capitalised developers involved in residential construction or in assets supporting economic expansion.
Many of these markets are beginning to move away from the rapid construction of recent years with an increasing focus on investment assets consistent with more

Report of the Directors: Risk (continued) Credit risk
HSBC HOLDINGS PLC
146
developed markets. A significant amount of exposure is centred on cities which are key locations of economic, political or cultural importance.
Total commercial real estate was US$73bn at 31 December 2014, a reduction of US$1.6bn which included adverse foreign exchange movements of US$3.3bn, mainly in Europe.
Refinance risk in commercial real estate
Commercial real estate lending tends to require the repayment of a significant proportion of the principal at maturity. Typically, a customer will arrange repayment through the acquisition of a new loan to settle the existing debt. Refinance risk is the risk that a customer, being unable to repay the debt on maturity, fails to refinance it at commercial rates. Refinance risk is described in more detail on page 214. We monitor our commercial real estate portfolio closely, assessing those drivers that may indicate potential issues with refinancing. The principal driver is the vintage of the loan, when origination reflected previous market norms which do not apply in the current market. Examples might be higher LTV ratios and/or lower interest cover ratios. The range of refinancing sources in the local market is also an important consideration, with risk increasing when lenders are restricted to banks and when bank liquidity is limited. In addition, underlying fundamentals such as the reliability of tenants, the ability to let and the condition of the property are important, as they influence property values.
For the Group’s commercial real estate portfolios as a whole, the behaviour of markets and the quality of assets did not cause undue concern in 2014. In the UK, which was subject to heightened concerns in recent years, the drivers described above are not currently causing sufficient concern to warrant enhanced management attention.
Further details on our UK portfolio are as follows: at 31 December 2014, we had US$20bn (2013: US$22bn) of commercial real estate loans of which US$5.9bn (2013: US$6.8bn) were due to be refinanced within the next 12 months. Of these balances, cases subject to close monitoring in our Loan Management Unit amounted to US$2.1bn (2013: US$2.4bn). US$1.3bn (2013: US$1.6bn) were disclosed as impaired with impairment allowances of US$0.6bn (2013: US$0.6bn). Where these loans are not considered impaired it is because there is sufficient evidence to indicate that the associated contractual cash flows will be recovered or that the loans will not need to be refinanced on terms we would consider below market norms.
Collateral on loans and advances Details of the Group’s practice regarding the use of collateral are provided in the Appendix to Risk on page 213.
Collateral held is analysed separately below for commercial real estate and for other corporate, commercial and financial (non-bank) lending. This reflects the greater correlation between collateral performance and principal repayment in the commercial
real estate sector than applies to other lending. In each case, the analysis includes off-balance sheet loan commitments, primarily undrawn credit lines.
The collateral measured in the tables below consists of fixed first charges on real estate and charges over cash and marketable financial instruments. The values in the tables represent the expected market value on an open market basis; no adjustment has been made to the collateral for any expected costs of recovery. Cash is valued at its nominal value and marketable securities at their fair value. The LTV ratios presented are calculated by directly associating loans and advances with the collateral that individually and uniquely supports each facility. When collateral assets are shared by multiple loans and advances, whether specifically or, more generally, by way of an all monies charge, the collateral value is pro-rated across the loans and advances protected by the collateral.
Other types of collateral which are commonly taken for corporate and commercial lending such as unsupported guarantees and floating charges over the assets of a customer’s business are not measured in the tables below. While such mitigants have value, often providing rights in insolvency, their assignable value is not sufficiently certain and they are therefore assigned no value for disclosure purposes.
For impaired loans the collateral values cannot be directly compared with impairment allowances recognised. The LTV tables below use open market values with no adjustments. Impairment allowances are calculated on a different basis, by considering other cash flows and adjusting collateral values for costs of realising collateral as explained further on page 212.
Commercial real estate loans and advances
The value of commercial real estate collateral is determined by using a combination of professional and internal valuations and physical inspections. Due to the complexity of valuing collateral for commercial real estate, local valuation policies determine the frequency of review on the basis of local market conditions. Revaluations are sought with greater frequency as concerns over the performance of the collateral or the direct obligor increase. Revaluations may also be sought where customers amend their banking requirements, resulting in the Group extending further funds or other significant rearrangements of exposure or collateral, which may change the customer risk profile. As a result, the real estate collateral values used for CRR1-7 might date back to the last point at which such considerations applied. For CRR 8 and 9-10 almost all collateral would have been revalued within the last three years.
In Hong Kong, market practice is typically for lending to major property companies to be either secured by guarantees or unsecured. In Europe, facilities of a working capital nature are generally not secured by a first fixed charge and are therefore disclosed as not collateralised.

HSBC HOLDINGS PLC
147
Str
ateg
ic R
epo
rt
Fi
nan
cial
Rev
iew
Co
rpo
rate
Go
vern
ance
Fin
anci
al S
tate
men
ts
S
har
eho
lder
Info
rmat
ion
Commercial real estate loans and advances including loan commitments by level of collateral (Audited)
Europe Asia4 MENA North
America Latin America
Total
US$m US$m US$m US$m US$m US$mRated CRR/EL 1 to 7
Not collateralised 5,351 16,132 361 87 1,719 23,650Fully collateralised 25,873 26,323 23 9,093 556 61,868Partially collateralised (A) 1,384 1,599 – 1,819 152 4,954
– collateral value on A 1,032 901 – 1,199 47 3,179
32,608 44,054 384 10,999 2,427 90,472
Rated CRR/EL 8 Not collateralised 34 7 – 9 2 52Fully collateralised 568 23 – 30 1 622
LTV ratio: – less than 50% 64 – – 16 1 81– 51% to 75% 222 11 – 10 – 243– 76% to 90% 132 9 – 4 – 145– 91% to 100% 150 3 – – – 153
Partially collateralised (B) 365 – – 7 – 372– collateral value on B 296 – – 2 – 298
967 30 – 46 3 1,046
Rated CRR/EL 9 to 10 Not collateralised 369 48 6 1 499 923Fully collateralised 992 15 7 166 178 1,358
LTV ratio: – less than 50% 78 6 7 28 10 129– 51% to 75% 593 2 – 91 43 729– 76% to 90% 167 2 – 17 53 239– 91% to 100% 154 5 – 30 72 261
Partially collateralised (C) 1,085 15 181 37 50 1,368– collateral value on C 664 5 89 30 13 801
2,446 78 194 204 727 3,649
At 31 December 2014 36,021 44,162 578 11,249 3,157 95,167 Rated CRR/EL 1 to 7
Not collateralised 4,865 14,164 192 137 935 20,293Fully collateralised 24,154 25,317 21 8,627 1,728 59,847Partially collateralised (D) 2,664 2,377 139 704 484 6,368
– collateral value on D 1,827 1,688 24 303 292 4,134
31,683 41,858 352 9,468 3,147 86,508
Rated CRR/EL 8 Not collateralised 109 10 – 1 3 123Fully collateralised 793 – 72 68 1 934
LTV ratio: – less than 50% 139 – – 15 – 154– 51% to 75% 367 – 72 49 1 489– 76% to 90% 173 – – 4 – 177– 91% to 100% 114 – – – – 114
Partially collateralised (E) 360 2 – 13 – 375– collateral value on E 281 1 – 11 – 293
1,262 12 72 82 4 1,432
Rated CRR/EL 9 to 10 Not collateralised 564 – 7 4 521 1,096Fully collateralised 1,079 12 31 233 286 1,641
LTV ratio: – less than 50% 275 2 7 39 32 355– 51% to 75% 436 6 7 110 57 616– 76% to 90% 209 3 17 62 62 353– 91% to 100% 159 1 – 22 135 317
Partially collateralised (F) 1,815 5 181 240 56 2,297– collateral value on F 1,284 5 89 115 34 1,527
3,458 17 219 477 863 5,034
At 31 December 2013 36,403 41,887 643 10,027 4,014 92,974
For footnote, see page 202.

Report of the Directors: Risk (continued) Credit risk
HSBC HOLDINGS PLC
148
Other corporate, commercial and financial (non-bank loans) are analysed separately below. For financing activities in other corporate and commercial lending, collateral value is not strongly correlated to principal repayment performance. Collateral values are generally refreshed when an obligor’s general credit performance deteriorates and we have to assess the
likely performance of secondary sources of repayment should it prove necessary to rely on them.
Accordingly, the table below reports values only for customers with CRR 8 to 10, recognising that these loans and advances generally have valuations which are comparatively recent.
Other corporate, commercial and financial (non-bank) loans and advances including loan commitments by level of collateral rated CRR/EL 8 to 10 only (Audited)
Europe Asia4 MENA North
America Latin America
Total
US$m US$m US$m US$m US$m US$mRated CRR/EL 8
Not collateralised 2,051 237 15 320 227 2,850Fully collateralised 629 56 72 331 11 1,099
LTV ratio: 13 – less than 50% 120 13 – 186 5 324– 51% to 75% 293 – – 72 6 371– 76% to 90% 51 9 69 46 – 175– 91% to 100% 165 34 3 27 – 229
Partially collateralised (A) 105 44 1 148 6 304– collateral value on A 46 17 1 68 4 136
68 2,785 337 88 799 244 4,253
Rated CRR/EL 9 to 10 Not collateralised 4,185 939 813 62 1,420 7,419Fully collateralised 615 143 147 231 124 1,260
LTV ratio: – less than 50% 169 68 25 48 48 358– 51% to 75% 136 27 19 39 35 256– 76% to 90% 168 16 6 35 26 251– 91% to 100% 142 32 97 109 15 395
Partially collateralised (B) 624 364 547 251 140 1,926– collateral value on B 341 169 92 141 46 789
5,424 1,446 1,507 544 1,684 10,605
At 31 December 2014 8,209 1,783 1,595 1,343 1,928 14,858 Rated CRR/EL 8
Not collateralised 2,411 185 37 328 456 3,417Fully collateralised 259 51 1 227 70 608
LTV ratio: – less than 50% 65 38 1 84 11 199– 51% to 75% 103 4 – 47 10 164– 76% to 90% 25 8 – 31 5 69– 91% to 100% 66 1 – 65 44 176
Partially collateralised (C) 435 23 528 345 73 1,404– collateral value on C 17 5 398 89 18 527
3,105 259 566 900 599 5,429
Rated CRR/EL 9 to 10 Not collateralised 1,467 685 1,089 26 1,615 4,882Fully collateralised 1,121 161 49 309 266 1,906
LTV ratio: – less than 50% 124 57 2 24 159 366– 51% to 75% 161 21 47 29 49 307– 76% to 90% 156 53 – 46 43 298– 91% to 100% 680 30 – 210 15 935
Partially collateralised (D) 1,192 304 770 359 290 2,915– collateral value on D 606 150 102 149 131 1,138
3,780 1,150 1,908 694 2,171 9,703
At 31 December 2013 6,885 1,409 2,474 1,594 2,770 15,132
For footnote, see page 202.
Loans and advances to banks are typically unsecured. Collateral values held for customers rated CRR 9 to 10
(i.e. classified as impaired) are separately disclosed.

HSBC HOLDINGS PLC
149
Str
ateg
ic R
epo
rt
Fi
nan
cial
Rev
iew
Co
rpo
rate
Go
vern
ance
Fin
anci
al S
tate
men
ts
S
har
eho
lder
Info
rmat
ion
Loans and advances to banks including loan commitments by level of collateral (Audited)
Europe Asia4 MENA North
America Latin America
Total
US$m US$m US$m US$m US$m US$mRated CRR/EL 1 to 8
Not collateralised 22,405 64,210 10,472 7,985 9,406 114,478Fully collateralised 104 1,587 – – – 1,691Partially collateralised (A) 5 – – – – 5
– collateral value on A 3 – – – – 3
22,514 65,797 10,472 7,985 9,406 116,174Rated CRR/EL 9 to 10
Not collateralised 102 1 21 – – 124
At 31 December 2014 22,616 65,798 10,493 7,985 9,406 116,298 Rated CRR/EL 1 to 8
Not collateralised 21,225 72,986 6,373 7,210 9,837 117,631Fully collateralised 3,614 1,376 – – 266 5,256Partially collateralised (B) 68 560 – – – 628
– collateral value on B 3 389 – – – 392
24,907 74,922 6,373 7,210 10,103 123,515Rated CRR/EL 9 to 10
Not collateralised 153 – 312 14 – 479
At 31 December 2013 25,060 74,922 6,685 7,224 10,103 123,994
For footnote, see page 202.
Other credit risk exposures
In addition to collateralised lending, other credit enhancements are employed and methods used to mitigate credit risk arising from financial assets. These are described in more detail below:
• some securities issued by governments, banks and other financial institutions benefit from additional credit enhancement provided by government guarantees that cover the assets. Details of government guarantees are included in Notes 12, 15 and 18 on the Financial Statements.
• debt securities issued by banks and financial institutions include ABSs and similar instruments which are supported by underlying pools of financial assets. Credit risk associated with ABSs is reduced through the purchase of credit default swap (‘CDS’) protection. Disclosure of the Group’s holdings of ABSs and associated CDS protection is provided on page 162.
• trading assets include loans and advances held with trading intent. These mainly consist of cash collateral posted to satisfy margin requirements on derivatives, settlement accounts, reverse repos and stock borrowing. There is limited credit risk on cash collateral posted since in the event of default of the counterparty these would be set-off against the related liability. Reverse repos and stock borrowing are by their nature collateralised. Collateral accepted as security that the Group is permitted to sell or repledge under these arrangements is described in Note 19 on the Financial Statements.
• the Group’s maximum exposure to credit risk includes financial guarantees and similar contracts granted, as well as loan and other credit-related commitments. Depending on the terms of the arrangement, we may have recourse to additional credit mitigation in the event that a guarantee is called upon or a loan commitment is drawn and subsequently defaults. For further information on these arrangements, see Note 37 on the Financial Statements.
Derivatives
HSBC participates in transactions exposing us to counterparty credit risk. Counterparty credit risk is the risk of financial loss if the counterparty to a transaction defaults before satisfactorily settling it. It arises principally from OTC derivatives and securities financing transactions and is calculated in both the trading and non-trading books. Transactions vary in value by reference to a market factor such as interest rate, exchange rate or asset price.
The counterparty risk from derivative transactions is taken into account when reporting the fair value of derivative positions. The adjustment to the fair value is known as the credit value adjustment (‘CVA’). For an analysis of CVA, see Note 13 on the Financial Statements.
The table below reflects by risk type the fair values and gross notional contract amounts of derivatives cleared through an exchange, central counterparty and non-central counterparty.
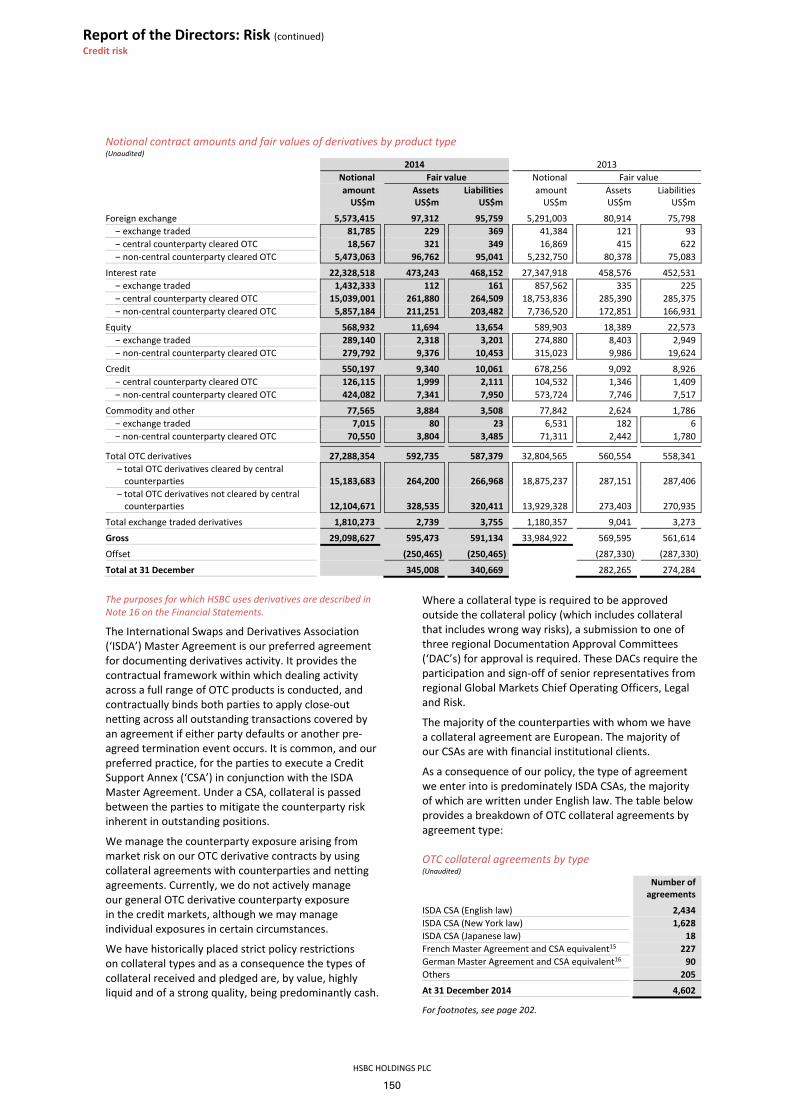
Report of the Directors: Risk (continued) Credit risk
HSBC HOLDINGS PLC
150
Notional contract amounts and fair values of derivatives by product type (Unaudited) 2014 2013 Notional Fair value Notional Fair value amount Assets Liabilities amount Assets Liabilities US$m US$m US$m US$m US$m US$m
Foreign exchange 5,573,415 97,312 95,759 5,291,003 80,914 75,798– exchange traded 81,785 229 369 41,384 121 93– central counterparty cleared OTC 18,567 321 349 16,869 415 622– non-central counterparty cleared OTC 5,473,063 96,762 95,041 5,232,750 80,378 75,083
Interest rate 22,328,518 473,243 468,152 27,347,918 458,576 452,531– exchange traded 1,432,333 112 161 857,562 335 225– central counterparty cleared OTC 15,039,001 261,880 264,509 18,753,836 285,390 285,375– non-central counterparty cleared OTC 5,857,184 211,251 203,482 7,736,520 172,851 166,931
Equity 568,932 11,694 13,654 589,903 18,389 22,573– exchange traded 289,140 2,318 3,201 274,880 8,403 2,949– non-central counterparty cleared OTC 279,792 9,376 10,453 315,023 9,986 19,624
Credit 550,197 9,340 10,061 678,256 9,092 8,926– central counterparty cleared OTC 126,115 1,999 2,111 104,532 1,346 1,409– non-central counterparty cleared OTC 424,082 7,341 7,950 573,724 7,746 7,517
Commodity and other 77,565 3,884 3,508 77,842 2,624 1,786– exchange traded 7,015 80 23 6,531 182 6– non-central counterparty cleared OTC 70,550 3,804 3,485 71,311 2,442 1,780
Total OTC derivatives 27,288,354 592,735 587,379 32,804,565 560,554 558,341– total OTC derivatives cleared by central
counterparties 15,183,683 264,200 266,968 18,875,237 287,151 287,406 – total OTC derivatives not cleared by central
counterparties 12,104,671 328,535 320,411 13,929,328 273,403 270,935
Total exchange traded derivatives 1,810,273 2,739 3,755 1,180,357 9,041 3,273
Gross 29,098,627 595,473 591,134 33,984,922 569,595 561,614
Offset (250,465) (250,465) (287,330) (287,330)
Total at 31 December 345,008 340,669 282,265 274,284
The purposes for which HSBC uses derivatives are described in Note 16 on the Financial Statements.
The International Swaps and Derivatives Association (‘ISDA’) Master Agreement is our preferred agreement for documenting derivatives activity. It provides the contractual framework within which dealing activity across a full range of OTC products is conducted, and contractually binds both parties to apply close-out netting across all outstanding transactions covered by an agreement if either party defaults or another pre-agreed termination event occurs. It is common, and our preferred practice, for the parties to execute a Credit Support Annex (‘CSA’) in conjunction with the ISDA Master Agreement. Under a CSA, collateral is passed between the parties to mitigate the counterparty risk inherent in outstanding positions.
We manage the counterparty exposure arising from market risk on our OTC derivative contracts by using collateral agreements with counterparties and netting agreements. Currently, we do not actively manage our general OTC derivative counterparty exposure in the credit markets, although we may manage individual exposures in certain circumstances.
We have historically placed strict policy restrictions on collateral types and as a consequence the types of collateral received and pledged are, by value, highly liquid and of a strong quality, being predominantly cash.
Where a collateral type is required to be approved outside the collateral policy (which includes collateral that includes wrong way risks), a submission to one of three regional Documentation Approval Committees (‘DAC’s) for approval is required. These DACs require the participation and sign-off of senior representatives from regional Global Markets Chief Operating Officers, Legal and Risk.
The majority of the counterparties with whom we have a collateral agreement are European. The majority of our CSAs are with financial institutional clients.
As a consequence of our policy, the type of agreement we enter into is predominately ISDA CSAs, the majority of which are written under English law. The table below provides a breakdown of OTC collateral agreements by agreement type: OTC collateral agreements by type (Unaudited)
Number of agreements
ISDA CSA (English law) 2,434ISDA CSA (New York law) 1,628ISDA CSA (Japanese law) 18French Master Agreement and CSA equivalent15 227German Master Agreement and CSA equivalent16 90Others 205
At 31 December 2014 4,602
For footnotes, see page 202.

HSBC HOLDINGS PLC
151
Str
ateg
ic R
epo
rt
Fi
nan
cial
Rev
iew
Co
rpo
rate
Go
vern
ance
Fin
anci
al S
tate
men
ts
S
har
eho
lder
Info
rmat
ion
See page 130 and Note 32 on the Financial Statements for details regarding legally enforceable right of offset in the event of counterparty default and collateral received in respect of derivatives.
Reverse repos – non-trading by geographical region
Following the change in balance sheet presentation explained on page 347, non-trading reverse repos are presented separately on the face of the balance sheet
and are no longer included in ‘Loans and advances to customers’ and ‘Loans and advances to banks’.
Comparative data have been re-presented accordingly. As a result, any analysis in the Credit Risk section that references loans and advances to customers or banks excludes non-trading reverse repos to customers or banks, respectively. For reference, the amount of non-trading reverse repos to customers and banks is set out below.
Reverse repos – non-trading by geographical region (Audited)
Europe Asia4 MENA
North America
Latin America Total
US$m US$m US$m US$m US$m US$m
With customers 25,841 5,409 – 35,060 – 66,310With banks 34,748 22,813 19 29,008 8,815 95,403
At 31 December 2014 60,589 28,222 19 64,068 8,815 161,713 With customers 48,091 6,448 – 33,676 – 88,215With banks 49,631 12,973 24 23,744 5,103 91,475
At 31 December 2013 97,722 19,421 24 57,420 5,103 179,690
For footnote, see page 202.
Personal lending
We provide a broad range of secured and unsecured personal lending products to meet customer needs. Personal lending includes advances to customers for asset purchases such as residential property where the
loans are secured by the assets being acquired. We also offer loans secured on existing assets, such as first liens on residential property, and unsecured lending products such as overdrafts, credit cards and payroll loans.
Total personal lending (Unaudited)
Europe Asia4 MENANorth
America Latin America Total
US$m US$m US$m US$m US$m US$mFirst lien residential mortgages (A) 131,000 93,147 2,647 55,577 4,153 286,524
Of which: – interest only (including offset) 44,163 956 – 276 – 45,395– affordability including ARMs 337 5,248 – 16,452 – 22,037
Other personal lending (B) 47,531 36,368 3,924 9,823 9,384 107,030– other 34,567 25,695 2,633 4,328 4,846 72,069– credit cards 12,959 10,289 897 1,050 3,322 28,517– second lien residential mortgages – 56 2 4,433 – 4,491– motor vehicle finance 5 328 392 12 1,216 1,953
Total gross loans at 31 December 2014 (C) 178,531 129,515 6,571 65,400 13,537 393,554Impairment allowances on personal lending
First lien residential mortgages (a) 306 46 97 1,644 36 2,129Other personal lending (b) 786 208 97 350 1,030 2,471
– other 438 87 59 43 672 1,299– credit cards 347 119 33 36 298 833– second lien residential mortgages – – – 271 – 271– motor vehicle finance 1 2 5 – 60 68
Total impairment allowances at 31 December 2014 (c) 1,092 254 194 1,994 1,066 4,600
(a) as a percentage of A 0.2% – 3.7% 3.0% 0.9% 0.7%(b) as a percentage of B 1.7% 0.6% 2.5% 3.6% 11.0% 2.3%(c) as a percentage of C 0.6% 0.2% 3.0% 3.0% 7.9% 1.2%

Report of the Directors: Risk (continued) Credit risk
HSBC HOLDINGS PLC
152
Europe Asia4 MENA
North America
Latin America Total
US$m US$m US$m US$m US$m US$mFirst lien residential mortgages (D) 140,474 92,047 2,451 60,955 3,948 299,875
Of which: – interest only (including offset) 49,460 1,115 – 352 – 50,927– affordability including ARMs 508 5,593 – 16,274 – 22,375
Other personal lending (E) 51,633 32,482 4,033 11,735 10,970 110,853– other 37,126 21,636 2,728 5,309 5,651 72,450– credit cards 14,496 10,274 915 1,145 3,526 30,356– second lien residential mortgages – 91 2 5,261 – 5,354– motor vehicle finance 11 481 388 20 1,793 2,693
Total gross loans at 31 December 2013 (F) 192,107 124,529 6,484 72,690 14,918 410,728Impairment allowances on personal lending
First lien residential mortgages (d) 439 57 124 2,886 32 3,538Other personal lending (e) 959 222 169 532 1,182 3,064
– other 553 93 104 59 881 1,690– credit cards 403 127 61 47 217 855– second lien residential mortgages – – – 426 – 426– motor vehicle finance 3 2 4 – 84 93
Total impairment allowances at 31 December 2013 (f) 1,398 279 293 3,418 1,214 6,602
(d) as a percentage of D 0.3% 0.1% 5.1% 4.7% 0.8% 1.2%(e) as a percentage of E 1.9% 0.7% 4.2% 4.5% 10.8% 2.8%(f) as a percentage of F 0.7% 0.2% 4.5% 4.7% 8.1% 1.6%
For footnote, see page 202.
Total personal lending was US$394bn at 31 December 2014, down from US$411bn at the end of 2013 (US$392bn on a constant currency basis). We continued to run-off our CML portfolio in North America and the balance declined by a further US$5.7bn during the year.
Personal lending excluding the US CML run-off portfolio grew by US$7.7bn on a constant currency basis in 2014. This was mainly due to increased mortgage and other lending in Asia and growth in the mortgage portfolio in the US and Brazil. It was partially offset by a reduction in personal lending in UK.
Mortgage lending (Unaudited)
We offer a wide range of mortgage products designed to meet customer needs, including capital repayment, interest-only, affordability and offset mortgages.
Group credit policy prescribes the range of acceptable residential property LTV thresholds with the maximum upper limit for new loans set at between 75% and 95%.
Specific LTV thresholds and debt-to-income ratios are managed at regional and country levels and, although the parameters must comply with Group policy, strategy and risk appetite, they differ in the various locations in which we operate to reflect the local economic and housing market conditions, regulations, portfolio performance, pricing and other product features.
The commentary that follows is on a constant currency basis
Personal lending excluding the US CML run-off portfolio, mortgage lending balances increased by US$3.9bn during the year. Mortgage lending in Asia, excluding the reclassification to Other Personal lending discussed on page 153, grew by US$4.8bn. The increases were primarily attributable to continued growth in Hong Kong (US$2.9bn) and, to a lesser extent, in Australia (US$0.5bn),
Malaysia (US$0.4bn), and Taiwan (US$0.3bn) as a result of strong demand and competitive customer offerings. The quality of our Asian mortgage book remained high with negligible defaults and impairment allowances. The average LTV ratio on new mortgage lending in Hong Kong was 47% compared with an estimated 29% for the overall portfolio.
In North America, our Canadian mortgage balances increased by US$0.5bn during the year as a result of a focused mortgage campaign and process improvements. The Premier mortgage portfolio in the US also increased by US$0.9bn during 2014 as we continued to focus on growth in our core portfolios. Our business in the US exhibited lower collectively assessed impairment charges due to continued improvement in the credit quality of the mortgage portfolio. The US CML portfolio declined by US$5.7bn in 2014.
Mortgage lending in Brazil increased by US$0.5bn as a result of improvements to both our process and products offered and overall growth in the mortgage market in the country during the year.
In Europe, there was a marginal decline of US$1.4bn or 1% due to decreased lending and effects of repayments, mainly in the UK mortgage portfolio.
Interest-only products made up US$44bn of total UK mortgage lending, including US$19bn of offset mortgages in First Direct. The LTV ratio on new lending was 60% compared with an average of 43.7% for the total mortgage portfolio. The credit quality of our UK mortgage portfolio remained high and both loan impairment charges and delinquency levels declined in 2014.
We grew our mortgage book in France by US$0.6bn in the year due to strong demand.

HSBC HOLDINGS PLC
153
Str
ateg
ic R
epo
rt
Fi
nan
cial
Rev
iew
Co
rpo
rate
Go
vern
ance
Fin
anci
al S
tate
men
ts
S
har
eho
lder
Info
rmat
ion
Other personal lending (Unaudited)
Other personal lending increased by US$3.7bn in 2014. This was driven by growth in personal loans and revolving credit facilities in Asia, mainly in Hong Kong (US$3.1bn). We also reclassified US$1.7bn of loans in mainland China from Residential mortgages to other personal lending as the supporting collateral over some of the properties either under construction or completed was yet to be fully registered. These increases were partially offset by a reduction in credit card lending of US$0.7bn in the UK and US$0.3bn in Turkey, due to repayments. Term lending in North America, primarily Canada, declined by US$0.7bn during the year. There was also a US$0.2bn reduction in the auto finance dealers run off portfolio in Brazil.
HSBC Finance US Consumer and Mortgage Lending – residential mortgages17 (Unaudited) 2014 2013
US$m US$mResidential mortgages:
– first lien 21,915 27,305Other personal lending:
– second lien 2,509 3,014
Total (A) at 31 December 24,424 30,319
Impairment allowances 1,679 3,028– as a percentage of A 6.9% 10.0%
For footnote, see page 202.
HSBC Finance
Mortgage lending balances in HSBC Finance declined by US$5.7bn during 2014. In addition to the continued loan sales in the CML portfolio, we transferred a further US$2.9bn to assets held for sale during the year, and expect to sell these in multiple transactions over the next 12 months.
The decrease in impairment allowances reflected lower levels of both new impaired loans and loan balances outstanding as a result of continued liquidation of the portfolio. This included loan sales and loss estimates due
to lower delinquency and loss severity levels than in 2013.
Across the first and second lien residential mortgages in our CML portfolio, two months and over delinquent balances reduced by US$2.5bn to US$2.4bn during 2014 reflecting the continued portfolio run-off and loan sales.
HSBC Finance: foreclosed properties in the US (Unaudited)
2014 2013 US$m US$m
Number of foreclosed properties at year-end
2,139 4,254
Number of properties added to foreclosed inventory in the period
3,716 9,752
Average (gain)/loss on sale of foreclosed properties18
(1%) 1%
Average total loss on foreclosed properties19
51% 51%
Average time to sell foreclosed properties (days)
189 154
For footnotes, see page 202.
The number of foreclosed properties at 31 December 2014 significantly decreased compared with the end of 2013 as during 2014 more properties were sold than were added to the foreclosed inventory. We added fewer properties to the inventory as many of them were sold prior to taking title as a result of the ongoing sale of receivables from the CML portfolio.
HSBC Bank USA
In HSBC Bank USA, mortgage balances grew by US$0.9bn during 2014 as we implemented our strategy to grow the HSBC Premier customer base. Credit quality improved further during 2014 and balances which were two months and over delinquent in our first lien residential mortgage portfolio declined by US$0.3bn to US$1.1bn at December 2014. We also continued to sell all agency eligible new originations in the secondary market as a means of managing our interest rate risk and improving structural liquidity.
Trends in two months and over contractual delinquency in the US (Unaudited) 2014 2013 US$m US$mIn personal lending in the US First lien residential mortgages 3,271 5,931
– Consumer and Mortgage Lending 2,210 4,595– other mortgage lending 1,061 1,336
Second lien residential mortgages 216 406– Consumer and Mortgage Lending 154 276– other mortgage lending 62 130
Credit card 17 25Personal non-credit card 7 25
Total at 31 December 3,511 6,387
% %As a percentage of the equivalent loans and receivables balances First lien residential mortgages 8.6 14.0Second lien residential mortgages 5.0 8.1Credit card 2.4 3.4Personal non-credit card 1.4 4.9
Total at 31 December 8.1 13.1

Report of the Directors: Risk (continued) Credit risk
HSBC HOLDINGS PLC
154
Gross loan portfolio of HSBC Finance real estate secured balances (Unaudited)
Re-aged20 Modified
and re-aged Modified
Totalrenegotiated
loans
Total non-renegotiated
loans
Total gross loans
Total impairment allowances
Impairmentallowances/gross loans
US$m US$m US$m US$m US$m US$m US$m %
At 31 December 2014 6,637 6,581 587 13,805 10,619 24,424 1,679 7At 31 December 2013 8,167 8,213 768 17,148 13,171 30,319 3,028 10
For footnote, see page 202.
Number of renegotiated real estate secured accounts remaining in HSBC Finance’s portfolio (Unaudited) Number of renegotiated loans (000s) Total number
of loans(000s)
Re-aged
Modifiedand re-aged Modified Total
At 31 December 2014 85 64 6 155 297At 31 December 2013 102 78 8 188 352 HSBC Finance loan modifications and re-age programmes
HSBC Finance maintains loan modification and re-age (‘loan renegotiation’) programmes in order to manage customer relationships, improve collection opportunities and, if possible, avoid foreclosure.
Since 2006, HSBC Finance has implemented an extensive loan renegotiation programme, and a significant portion of its loan portfolio has been subject to renegotiation at some stage in the life of the customer relationship as a consequence of the economic conditions in the US and the characteristics of HSBC Finance’s customer base.
The volume of loans that qualify for modification has reduced significantly in recent years and we expect this trend to continue. Volumes of new loan modifications are decreasing due to improvements in economic conditions, the cessation of new real estate secured and personal non-credit card receivables originations, and the continued run-off and loan sales in the CML portfolio.
Qualifying criteria
For an account to qualify for renegotiation it must meet certain criteria, and HSBC Finance retains the right to decline a renegotiation. The extent to which HSBC Finance renegotiates accounts that are eligible under its existing policies varies according to its view of prevailing economic conditions and other factors which may change from year to year. In addition, exceptions to policies and practices may be made in specific situations in response to legal or regulatory agreements or orders.
Renegotiated real estate secured are not eligible for a subsequent renegotiation for 12 months, with a maximum of five renegotiations permitted within a five-year period. Borrowers must be approved for a modification and, to activate it, must generally make
two minimum qualifying monthly payments within 60 days. In certain circumstances where the debt has been restructured in bankruptcy proceedings, fewer or no payments may be required. Real estate secured loans involving a bankruptcy and accounts whose borrowers are subject to a Chapter 13 plan filed with a bankruptcy court generally may be considered current upon receipt of one qualifying payment, while accounts whose borrowers have filed for Chapter 7 bankruptcy protection may be re-aged upon receipt of a signed reaffirmation agreement. In addition, some products accounts may be re-aged without receipt of a payment in certain special circumstances (e.g. in the event of a natural disaster or a hardship programme).
2014 compared with 2013
At 31 December 2014, renegotiated real estate secured accounts in HSBC Finance represented 91% (2013: 91%) of North America’s total renegotiated loans. US$8.0bn of renegotiated real estate secured loans were classified as impaired (2013: US$10bn). During 2014, the aggregate number of renegotiated loans in HSBC Finance reduced, due to the run-off and loan sales in the CML portfolio, despite renegotiation activity continuing.
Within the constraints of our Group credit policy, HSBC Finance’s policies allow for multiple renegotiations under certain circumstances. Consequently, a significant proportion of loans included in the table above have undergone multiple re-ages or modifications. In this regard, multiple modifications have remained consistent at 70% to 75% of total modifications.
The accounts that received second or subsequent renegotiations during the year do not appear in the statistics presented. These statistics treat a loan as an addition to the volume of renegotiated loans on its first renegotiation only.

HSBC HOLDINGS PLC
155
Str
ateg
ic R
epo
rt
Fi
nan
cial
Rev
iew
Co
rpo
rate
Go
vern
ance
Fin
anci
al S
tate
men
ts
S
har
eho
lder
Info
rmat
ion
Types of loan renegotiation programmes in HSBC Finance • A temporary modification is a change to the contractual terms
of a loan that results in HSBC Finance giving up a right to contractual cash flows over a pre-defined period. With a temporary modification the loan is expected to revert back to the original contractual terms, including the interest rate charged, after the modification period. An example is reduced interest payments. A substantial number of HSBC Finance modifications involve interest rate reductions, which lower the amount of interest income HSBC Finance is contractually entitled to receive in future periods. Historically, modifications were granted for terms as low as six months, although, more recent modifications have a minimum term of two years. Loans that have been re-aged are classified as impaired with the exception of first-time loan re-ages that were less than 60 days past due at the time of re-age. These remain classified as impaired until they have demonstrated a history of payment performance against their original contracted terms for at least 12 months.
• A permanent modification is a change to the contractual terms of a loan that results in HSBC Finance giving up a right to contractual cash flows over the life of the loan. An example is a permanent reduction in the interest rate charged. Permanent or long-term modifications which are due to an underlying hardship event remain classified as impaired for their full life. The term ‘re-age’ describes a renegotiation by which the contractual delinquency status of a loan is reset to current after demonstrating payment performance. The overdue principal and/or interest is deferred and paid at a later date. Loan re-ageing enables customers who have been unable to make a small number of payments to have their loan delinquency status reset to current so that their credit score is not affected by the overdue balances. Loans that have been re-aged remain classified as impaired until they have demonstrated a history of payment performance against the original contractual terms for at least 12 months. A temporary or permanent modification may also lead to a re-ageing of a loan although a loan may be re-aged without any modification to its original terms and conditions. Where loans have been granted multiple concessions, subject to the qualifying criteria discussed above, the concession is deemed to have been made due to concern regarding the
borrower’s ability to pay, and the loan is disclosed as impaired. The loan remains disclosed as impaired from that date forward until the borrower has demonstrated a history of repayment performance for the period of time required for either modifications or re-ages, as described above.
Valuation of foreclosed properties in the US We obtain real estate by foreclosing on the collateral pledged as security for residential mortgages. Prior to foreclosure, carrying amounts of the loans in excess of fair value less costs to sell are written down to the discounted cash flows expected to be recovered, including from the sale of the property. Broker price opinions are obtained and updated every 180 days and real estate price trends are reviewed quarterly to reflect any improvement or additional deterioration. Our methodology is regularly validated by comparing the discounted cash flows expected to be recovered based on current market conditions (including estimated cash flows from the sale of the property) to the updated broker price opinion, adjusted for the estimated historical difference between interior and exterior appraisals. The fair values of foreclosed properties are initially determined on the basis of broker price opinions. Within 90 days of foreclosure, a more detailed property valuation is performed reflecting information obtained from a physical interior inspection of the property and additional allowances or write-downs are recorded as appropriate. Updates to the valuation are performed no less than once every 45 days until the property is sold, with declines or increases recognised through changes to allowances.
Second lien mortgages in the US The majority of second lien residential mortgages were taken up by customers who held a first lien mortgage issued by a third party. Second lien residential mortgage loans have a risk profile characterised by higher LTV ratios, because in the majority of cases the loans were taken out to complete the refinancing of properties. Loss severity on default of second liens has typically approached 100% of the amount outstanding, as any equity in the property is consumed through the repayment of the first lien loan. Impairment allowances for these loans were determined by applying a roll-rate migration analysis which captures the propensity of these loans to default based on past experience. Once we believe that a second lien residential mortgage loan is likely to progress to write-off, the loss severity assumed in establishing our impairment allowance is close to 100% in the CML portfolios, and more than 80% in HSBC Bank USA.
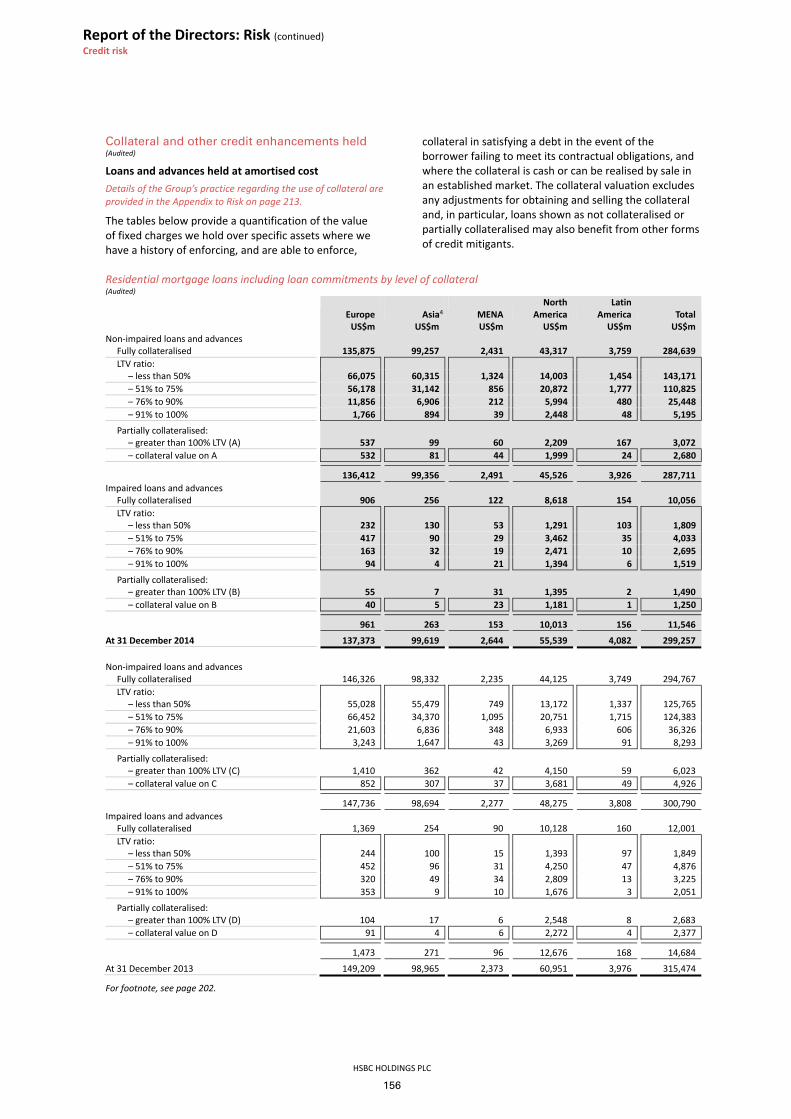
Report of the Directors: Risk (continued) Credit risk
HSBC HOLDINGS PLC
156
Collateral and other credit enhancements held (Audited)
Loans and advances held at amortised cost Details of the Group’s practice regarding the use of collateral are provided in the Appendix to Risk on page 213.
The tables below provide a quantification of the value of fixed charges we hold over specific assets where we have a history of enforcing, and are able to enforce,
collateral in satisfying a debt in the event of the borrower failing to meet its contractual obligations, and where the collateral is cash or can be realised by sale in an established market. The collateral valuation excludes any adjustments for obtaining and selling the collateral and, in particular, loans shown as not collateralised or partially collateralised may also benefit from other forms of credit mitigants.
Residential mortgage loans including loan commitments by level of collateral (Audited)
Europe Asia4 MENA North
America Latin America
Total
US$m US$m US$m US$m US$m US$mNon-impaired loans and advances
Fully collateralised 135,875 99,257 2,431 43,317 3,759 284,639LTV ratio:
– less than 50% 66,075 60,315 1,324 14,003 1,454 143,171– 51% to 75% 56,178 31,142 856 20,872 1,777 110,825– 76% to 90% 11,856 6,906 212 5,994 480 25,448– 91% to 100% 1,766 894 39 2,448 48 5,195
Partially collateralised: – greater than 100% LTV (A) 537 99 60 2,209 167 3,072– collateral value on A 532 81 44 1,999 24 2,680
136,412 99,356 2,491 45,526 3,926 287,711Impaired loans and advances
Fully collateralised 906 256 122 8,618 154 10,056LTV ratio:
– less than 50% 232 130 53 1,291 103 1,809– 51% to 75% 417 90 29 3,462 35 4,033– 76% to 90% 163 32 19 2,471 10 2,695– 91% to 100% 94 4 21 1,394 6 1,519
Partially collateralised: – greater than 100% LTV (B) 55 7 31 1,395 2 1,490– collateral value on B 40 5 23 1,181 1 1,250
961 263 153 10,013 156 11,546
At 31 December 2014 137,373 99,619 2,644 55,539 4,082 299,257 Non-impaired loans and advances
Fully collateralised 146,326 98,332 2,235 44,125 3,749 294,767LTV ratio:
– less than 50% 55,028 55,479 749 13,172 1,337 125,765– 51% to 75% 66,452 34,370 1,095 20,751 1,715 124,383– 76% to 90% 21,603 6,836 348 6,933 606 36,326– 91% to 100% 3,243 1,647 43 3,269 91 8,293
Partially collateralised: – greater than 100% LTV (C) 1,410 362 42 4,150 59 6,023– collateral value on C 852 307 37 3,681 49 4,926
147,736 98,694 2,277 48,275 3,808 300,790Impaired loans and advances
Fully collateralised 1,369 254 90 10,128 160 12,001LTV ratio:
– less than 50% 244 100 15 1,393 97 1,849– 51% to 75% 452 96 31 4,250 47 4,876– 76% to 90% 320 49 34 2,809 13 3,225– 91% to 100% 353 9 10 1,676 3 2,051
Partially collateralised: – greater than 100% LTV (D) 104 17 6 2,548 8 2,683– collateral value on D 91 4 6 2,272 4 2,377
1,473 271 96 12,676 168 14,684
At 31 December 2013 149,209 98,965 2,373 60,951 3,976 315,474
For footnote, see page 202.

HSBC HOLDINGS PLC
157
Str
ateg
ic R
epo
rt
Fi
nan
cial
Rev
iew
Co
rpo
rate
Go
vern
ance
Fin
anci
al S
tate
men
ts
S
har
eho
lder
Info
rmat
ion
Supplementary information
Gross loans and advances by industry sector over five years (Unaudited)
2014
Currency translation adjustment Movement 2013 2012 2011 2010
US$m US$m US$m US$m US$m US$m US$m
Personal 393,554 (19,092) 1,918 410,728 415,093 393,625 425,320– first lien residential mortgages6 286,524 (12,372) (979) 299,875 301,862 278,963 268,681– other personal7 107,030 (6,720) 2,897 110,853 113,231 114,662 156,639
Corporate and commercial 540,556 (24,729) 22,020 543,265 513,229 472,784 445,505– manufacturing 106,986 (5,856) (1,008) 113,850 112,149 96,054 91,121– international trade and services 180,791 (8,232) 4,355 184,668 169,389 152,709 146,567– commercial real estate 73,293 (3,270) 1,717 74,846 76,760 73,941 71,880– other property-related 52,387 (922) 8,477 44,832 40,532 39,539 34,838– government 6,143 (395) (739) 7,277 10,785 11,079 8,594– other commercial8 120,956 (6,054) 9,218 117,792 103,614 99,462 92,505
Financial 50,818 (2,303) 2,598 50,523 46,871 44,832 41,213– non-bank financial institutions 48,799 (2,180) 2,442 48,537 45,430 43,888 39,651– settlement accounts 2,019 (123) 156 1,986 1,441 944 1,562
Asset-backed securities reclassified 2,069 (147) (500) 2,716 3,891 5,280 5,892
Total gross loans and advances to customers (A) 986,997 (46,271) 26,036 1,007,232 979,084 916,521 917,930
Gross loans and advances to banks 112,198 (4,925) (2,981) 120,104 117,142 139,203 142,027
Total gross loans and advances 1,099,195 (51,196) 23,055 1,127,336 1,096,226 1,055,724 1,059,957
Impaired loans and advances to customers 29,283 (1,538) (5,607) 36,428 38,671 41,584 46,871– as a percentage of A 3.0% 3.6% 3.9% 4.5% 4.8%
Impairment allowances on loans and advances to customers 12,337 (776) (2,030) 15,143 16,112 17,511 20,083 – as a percentage of A 1.2% 1.5% 1.6% 1.9% 2.2%
Loan impairment charge 4,055 (160) (1,833) 6,048 8,160 11,505 13,548– new allowances net of allowance
releases 5,010 (158) (2,176) 7,344 9,306 12,931 14,568 – recoveries (955) (2) 343 (1,296) (1,146) (1,426) (1,020)
For footnotes, see page 202.
The personal lending currency effect on gross loans and advances of US$19bn was made up as follows: Europe US$13bn, Asia US$2.6bn, Latin America US$1.8bn, North America US$1.8bn. The wholesale lending currency effect
on gross loans and advances of US$32bn was made up as follows: Europe US$21bn, Asia US$4.8bn, Latin America US$4.7bn, North America US$1.5bn and Middle East and North Africa US$0.3bn.

Report of the Directors: Risk (continued) Credit risk
HSBC HOLDINGS PLC
158
Reconciliation of reported and constant currency impaired loans, allowances and charges by geographical region (Unaudited)
31 Dec 13 as reported
Currency translation adjustment21
31 Dec 13 at 31 Dec 14 exchange rates
Movement – constant currency basis
31 Dec 14 as reported
Reported change22
Constant currency change22
US$m US$m US$m US$m US$m % %Impaired loans Europe 13,228 (1,011) 12,217 (1,975) 10,242 (23) (16)Asia4 1,623 (54) 1,569 479 2,048 26 31Middle East and North Africa 2,285 (8) 2,277 (296) 1,981 (13) (13)North America 15,123 (42) 15,081 (3,387) 11,694 (23) (22)Latin America 4,244 (425) 3,819 (454) 3,365 (21) (12)
36,503 (1,540) 34,963 (5,633) 29,330 (20) (16)
Impairment allowances Europe 5,598 (420) 5,178 (723) 4,455 (20) (14)Asia4 1,214 (32) 1,182 174 1,356 12 15Middle East and North Africa 1,583 (4) 1,579 (173) 1,406 (11) (11)North America 4,242 (28) 4,214 (1,574) 2,640 (38) (37)Latin America 2,564 (294) 2,270 259 2,529 (1) 11
15,201 (778) 14,423 (2,037) 12,386 (19) (14)
Loan impairment charge Europe 1,732 62 1,794 (715) 1,079 (38) (40)Asia4 483 (17) 466 178 644 33 38Middle East and North Africa (44) – (44) 43 (1) 98 98North America 1,235 (15) 1,220 (920) 300 (76) (75)Latin America 2,642 (190) 2,452 (419) 2,033 (23) (17)
6,048 (160) 5,888 (1,833) 4,055 (33) (31)
For footnotes, see page 202.
Reconciliation of reported and constant currency loan impairment charges to the income statement (Unaudited)
31 Dec 13 as reported
Currency translation adjustment21
31 Dec 13 at 31 Dec 14 exchange
rates
Movement – constant currency
basis 31 Dec 14
as reported Reported change22
Constant currency change22
US$m US$m US$m US$m US$m % %Loan impairment charge Europe 1,732 62 1,794 (715) 1,079 (38) (40)
– new allowances 3,082 99 3,181 (736) 2,445 (21) (23)– releases (713) (11) (724) (338) (1,062) (49) (47)– recoveries (637) (26) (663) 359 (304) 52 54
Asia4 483 (17) 466 178 644 33 38– new allowances 953 (31) 922 193 1,115 17 21– releases (303) 8 (295) (23) (318) (5) (8)– recoveries (167) 6 (161) 8 (153) 8 5
Middle East and North Africa (44) – (44) 43 (1) 98 98– new allowances 408 (1) 407 (52) 355 (13) (13)– releases (365) 2 (363) 49 (314) 14 13– recoveries (87) (1) (88) 46 (42) 52 52
North America 1,235 (15) 1,220 (920) 300 (76) (75)– new allowances 1,640 (17) 1,623 (715) 908 (45) (44)– releases (282) 2 (280) (213) (493) (75) (76)– recoveries (123) – (123) 8 (115) 7 7
Latin America 2,642 (190) 2,452 (419) 2,033 (23) (17)– new allowances 3,262 (243) 3,019 (312) 2,707 (17) (10)– releases (338) 34 (304) (29) (333) 1 (10)– recoveries (282) 19 (263) (78) (341) (21) (30)
Total 6,048 (160) 5,888 (1,833) 4,055 (33) (31)– new allowances 9,345 (193) 9,152 (1,622) 7,530 (19) (18)– releases (2,001) 35 (1,966) (554) (2,520) (26) (28)– recoveries (1,296) (2) (1,298) 343 (955) 26 26
For footnotes, see page 202.

HSBC HOLDINGS PLC
159
Str
ateg
ic R
epo
rt
Fi
nan
cial
Rev
iew
Co
rpo
rate
Go
vern
ance
Fin
anci
al S
tate
men
ts
S
har
eho
lder
Info
rmat
ion
Loan impairment charges by industry sector over five years (Unaudited)
2014 2013 2012 2011 2010US$m US$m US$m US$m US$m
Loan impairment charge/(release) Personal 1,803 3,196 5,362 9,318 11,187Corporate and commercial 2,256 2,974 2,802 2,114 2,198Financial5 (4) (122) (4) 73 163
Year ended 31 December 4,055 6,048 8,160 11,505 13,548
For footnotes, see page 202.
Charge for impairment losses as a percentage of average gross loans and advances to customers (Unaudited) 2014 2013 2012 2011 2010 % % % % %
New allowances net of allowance releases 0.53 0.81 1.00 1.34 1.65Recoveries (0.10) (0.14) (0.12) (0.15) (0.12)
Total charge for impairment losses 0.43 0.67 0.88 1.19 1.53
Amount written off net of recoveries 0.58 0.59 0.93 1.14 2.08
Movement in impairment allowances over five years (Unaudited)
2014 2013 2012 2011 2010US$m US$m US$m US$m US$m
Impairment allowances at 1 January 15,201 16,169 17,636 20,241 25,649
Amounts written off (6,379) (6,655) (9,812) (12,480) (19,300)– personal (3,733) (4,367) (6,905) (10,431) (16,458)– corporate and commercial (2,425) (2,229) (2,677) (2,009) (2,789)– financial5 (221) (59) (230) (40) (53)
Recoveries of amounts written off in previous years 955 1,296 1,146 1,426 1,020– personal 818 1,097 966 1,175 846– corporate and commercial 128 198 172 242 156– financial5 9 1 8 9 18
Loan impairment charge 4,055 6,048 8,160 11,505 13,548Exchange and other movements13 (1,446) (1,657) (961) (3,056) (676)
Impairment allowances at 31 December 12,386 15,201 16,169 17,636 20,241
Impairment allowances – individually assessed 6,244 7,130 6,629 6,662 6,615– collectively assessed 6,142 8,071 9,540 10,974 13,626
Impairment allowances at 31 December 12,386 15,201 16,169 17,636 20,241
Amount written off net of recoveries as a percentage of average gross loans and advances to customers 0.6% 0.6% 1.0% 1.2% 2.2%
For footnotes, see page 202.

Report of the Directors: Risk (continued) Credit risk
HSBC HOLDINGS PLC
160
Gross loans and advances to customers by country (Unaudited) First lien
residential mortgages6
US$m
Other personal7
US$m
Property- related
US$m
Commercial, international trade and other
US$m
Total US$m
Europe 131,000 47,531 35,313 200,313 414,157UK 123,239 21,023 25,927 156,577 326,766France 2,914 12,820 7,341 21,834 44,909Germany 6 212 304 7,275 7,797Switzerland 298 8,149 225 614 9,286Turkey 645 3,389 297 4,244 8,575Other 3,898 1,938 1,219 9,769 16,824
Asia 93,147 36,368 70,057 164,739 364,311Hong Kong 56,656 22,891 52,208 82,362 214,117Australia 9,154 815 2,130 6,360 18,459India 1,235 285 613 5,099 7,232Indonesia 64 469 202 5,476 6,211Mainland China 4,238 1,981 6,606 24,875 37,700Malaysia 5,201 1,750 1,988 5,217 14,156Singapore 9,521 5,878 4,210 11,951 31,560Taiwan 3,920 626 118 7,057 11,721Other 3,158 1,673 1,982 16,342 23,155
Middle East and North Africa (excluding Saudi Arabia) 2,647 3,924 2,246 21,633 30,450Egypt 1 510 98 2,272 2,881UAE 2,263 1,782 1,545 13,814 19,404Other 383 1,632 603 5,547 8,165
North America 55,577 9,823 15,492 51,535 132,427US 37,937 5,482 11,461 38,632 93,512Canada 16,236 4,085 3,708 11,825 35,854Other 1,404 256 323 1,078 3,061
Latin America 4,153 9,384 2,572 29,543 45,652Argentina 15 1,169 93 2,119 3,396Brazil 2,067 5,531 1,077 16,814 25,489Mexico 1,967 2,642 1,336 9,503 15,448Other 104 42 66 1,107 1,319
At 31 December 2014 286,524 107,030 125,680 467,763 986,997Europe 140,474 51,633 38,634 230,932 461,673
UK 132,174 22,913 28,127 185,534 368,748France 2,661 13,840 8,442 23,962 48,905Germany 7 218 127 6,361 6,713Switzerland 364 8,616 269 320 9,569Turkey 833 4,002 305 4,059 9,199Other 4,435 2,044 1,364 10,696 18,539
Asia 92,047 32,482 61,707 151,875 338,111Hong Kong 53,762 19,794 44,904 75,547 194,007Australia 9,468 1,236 2,511 7,138 20,353India 1,080 297 425 4,231 6,033Indonesia 69 447 78 5,361 5,955Mainland China 4,880 300 5,808 22,149 33,137Malaysia 5,140 1,994 1,997 5,420 14,551Singapore 10,283 5,754 3,953 12,188 32,178Taiwan 3,797 660 158 5,198 9,813Other 3,568 2,000 1,873 14,643 22,084
Middle East and North Africa (excluding Saudi Arabia) 2,451 4,033 1,972 20,320 28,776Egypt 1 477 146 2,232 2,856UAE 2,082 1,842 1,331 12,344 17,599Other 368 1,714 495 5,744 8,321
North America 60,955 11,735 14,616 44,884 132,190US 42,317 6,257 10,174 30,952 89,700Canada 17,036 5,116 3,912 13,079 39,143Other 1,602 362 530 853 3,347
Latin America 3,948 10,970 2,749 28,815 46,482Argentina 20 1,425 62 2,103 3,610Brazil 1,811 6,466 1,268 17,132 26,677Mexico 2,117 3,079 1,398 8,994 15,588Other – – 21 586 607
At 31 December 2013 299,875 110,853 119,678 476,826 1,007,232
For footnotes, see page 202.

HSBC HOLDINGS PLC
161
Str
ateg
ic R
epo
rt
Fi
nan
cial
Rev
iew
Co
rpo
rate
Go
vern
ance
Fin
anci
al S
tate
men
ts
S
har
eho
lder
Info
rmat
ion
The above tables analyse loans and advances by industry sector and by the location of the principal operations of the lending subsidiary or, in the case of the operations of The Hongkong and Shanghai Banking Corporation, HSBC Bank, HSBC Bank Middle East and HSBC Bank USA, by the location of the lending branch.
HSBC Holdings (Audited)
Risk in HSBC Holdings is overseen by the HSBC Holdings Asset and Liability Management Committee (‘HALCO’). The major risks faced by HSBC Holdings are credit risk, liquidity risk and market risk (in the form of interest rate risk and foreign exchange risk), of which the most significant is credit risk.
Credit risk in HSBC Holdings primarily arises from transactions with Group subsidiaries and from guarantees issued in support of obligations assumed
by certain Group operations in the normal conduct of their business. It is reviewed and managed within regulatory and internal limits for exposures by our Global Risk function, which provides high-level centralised oversight and management of credit risks worldwide.
HSBC Holdings’ maximum exposure to credit risk at 31 December 2014 is shown below. Its financial assets principally represent claims on Group subsidiaries in Europe and North America.
All the derivative transactions are with HSBC undertakings that are banking counterparties (2013: 100%) and for which HSBC Holdings has in place master netting arrangements. Since 2012, the credit risk exposure has been managed on a net basis and the remaining net exposure is specifically collateralised in the form of cash.
HSBC Holdings – maximum exposure to credit risk (Audited) 2014 2013
Maximumexposure Offset
Exposure tocredit risk
(net) Maximum exposure Offset
Exposure tocredit risk
(net) US$m US$m US$m US$m US$m US$m
Cash at bank and in hand: – balances with HSBC undertakings 249 – 249 407 – 407
Derivatives 2,771 (2,610) 161 2,789 (2,755) 34 Loans and advances to HSBC undertakings 43,910 – 43,910 53,344 – 53,344 Financial investments in HSBC undertakings 4,073 – 4,073 1,210 – 1,210 Financial guarantees and similar contracts 52,023 – 52,023 52,836 – 52,836 Loan and other credit-related commitments 16 – 16 1,245 – 1,245
At 31 December 103,042 (2,610) 100,432 111,831 (2,755) 109,076
The credit quality of loans and advances and financial investments, both of which consist of intra-Group lending, is assessed as ‘strong’ or ‘good’, with 100% of the exposure being neither past due nor impaired (2013: 100%).
Securitisation exposures and other structured products (Audited)
This section contains information about our exposure to asset-backed securities (‘ABS’s), some of which are held through consolidated structured entities and are summarised in the table below. A summary of the nature of HSBC’s exposures is provided in the Appendix to Risk on page 214.
Overall exposure of HSBC (Audited)
Carrying amount23
2014 2013 US$bn US$bn
Asset-backed securities 48.9 50.1– fair value through profit or loss 3.6 3.1– available for sale24 29.7 42.7– held to maturity24 13.4 1.1– loans and receivables 2.2 3.2
At 31 December 48.9 50.2
For footnotes, see page 202.
The following table summarises the carrying amount of our ABS exposure by categories of collateral and includes assets held in the GB&M legacy credit portfolio with a carrying value of US$23bn (2013: US$28bn).
At 31 December 2014, the available-for-sale reserve in respect of ABSs was a deficit of US$777m (2013: deficit of US$1,643m). For 2014, the impairment write-back in respect of ABSs was US$276m (2013: write-back of US$289m).

Report of the Directors: Risk (continued) Credit risk / Liquidity and funding
HSBC HOLDINGS PLC
162
Carrying amount of HSBC’s consolidated holdings of ABSs23 (Audited)
Trading Available for sale
Held to maturity
Designated at fair value throughprofit or loss
Loans and receivables Total
Of whichheld through consolidated SEs
US$m US$m US$m US$m US$m US$m US$mMortgage-related assets:
Sub-prime residential 122 3,081 – – 308 3,511 2,075US Alt-A residential 96 3,022 11 – 110 3,239 2,411US Government agency and sponsored
enterprises: MBSs 82 10,401 13,436 – – 23,919 –
Other residential 928 1,220 – – 330 2,478 652Commercial property 654 3,627 – – 516 4,797 2,854
Leveraged finance-related assets 172 3,660 – – 218 4,050 2,526Student loan-related assets 242 3,545 – – 119 3,906 3,284Other assets 1,264 1,114 – 19 646 3,043 758
At 31 December 2014 3,560 29,670 13,447 19 2,247 48,943 14,560 Mortgage-related assets:
Sub-prime residential 178 2,977 – – 403 3,558 2,782US Alt-A residential 101 3,538 18 – 134 3,791 2,926US Government agency and sponsored
enterprises: MBSs 178 18,661 1,110 – – 19,949 –
Other residential 618 1,925 – – 399 2,942 1,513Commercial property 133 5,667 – 104 669 6,573 5,146
Leveraged finance-related assets 294 5,011 – – 251 5,556 4,310Student loan-related assets 196 3,705 – – 121 4,022 3,495Other assets 1,271 1,265 – 34 1,186 3,756 989
At 31 December 2013 2,969 42,749 1,128 138 3,163 50,147 21,161
For footnote, see page 202.
Representations and warranties related to mortgage sales and securitisation activities (Unaudited)
We have been involved in various activities related to the sale and securitisation of residential mortgages that are not recognised on our balance sheet. These activities include:
• the purchase of US$24bn of third-party originated mortgages by HSBC Bank USA and their securitisation by HSBC Securities (USA) Inc. (‘HSI’) between 2005 and 2007;
• HSI acting as underwriter for the third-party issuance of private label mortgage-backed securities (‘MBS’s) with an original issuance value of US$37bn, most of which were sub-prime; and
• the origination and sale by HSBC Bank USA of mortgage loans, primarily to government-sponsored entities.
In selling and securitising mortgage loans, various representations and warranties may be made to purchasers of the mortgage loans and MBSs. When purchasing and securitising mortgages originated by third parties and underwriting third-party MBSs, the obligation to repurchase loans in the event of a breach of loan level representations and warranties resides predominantly with the organisation that originated the loan.
Participants in the US mortgage securitisation market that purchased and repackaged whole loans, such as
servicers, originators, underwriters, trustees or sponsors of securitisations, have been the subject of lawsuits and governmental and regulatory investigations and inquiries.
At 31 December 2014, a liability of US$27m (2013: US$99m) was recognised in respect of various representations and warranties regarding the origination and sale by HSBC Bank USA of mortgage loans, primarily to government sponsored entities. These relate to, among other things, the ownership of the loans, the validity of the liens, the loan selection and origination process and compliance with the origination criteria established by the agencies. In the event of a breach of its representations and warranties, HSBC Bank USA may be obliged to repurchase the loans with identified defects or to indemnify the buyers. The estimated liability was based on the level of outstanding repurchase demands, the level of outstanding requests for loan files and the expected future repurchase demands in respect of mortgages sold to date which were either two or more payments delinquent or might become delinquent at an estimated conversion rate. Repurchase demands of US$3m were outstanding at 2014 (2013: US$44m). For further information on legal proceedings and regulatory matters, see Note 40 on the Financial Statements.

HSBC HOLDINGS PLC
163
Str
ateg
ic R
epo
rt
Fi
nan
cial
Rev
iew
Co
rpo
rate
Gov
ern
ance
Fin
anci
al S
tate
men
ts
S
har
eho
lder
Info
rmat
ion
Liquidity and funding Page App1 Tables Page
Liquidity and funding 164 215Primary sources of funding 215
Liquidity and funding in 2014 164Customer deposit markets 164Wholesale senior funding markets 164
Liquidity regulation 164
Management of liquidity and funding risk 165 215Inherent liquidity risk categorisation 215Core deposits 216Advances to core funding ratio 165 216 Advances to core funding ratios 165Stressed coverage ratios 165 216 Stressed one-month and three-month coverage ratios 165Stressed scenario analysis 216Liquid assets of HSBC’s principal operating
entities 166 217 Liquid assets of HSBC’s principal entities 166 Net contractual cash flows 166 217 Net cash inflows/(outflows) for inter-bank loans and
intra-group deposits and reverse repo, repo and short positions 167
Wholesale debt monitoring 218Liquidity behaviouralisation 218Funds transfer pricing 219
Contingent liquidity risk arising from committed lending facilities 167
The Group’s contractual undrawn exposures monitored under the contingent liquidity risk limit structure 167
Sources of funding 168Repos and stock lending 219 Funding sources and uses 168Cross-border intra-Group and cross-currency
liquidity and funding risk 169 Advances to core funding ratios by material currency 169 Wholesale term debt maturity profile
169 Wholesale funding cash flows payable by HSBC under
financial liabilities by remaining contractual maturities 170
Encumbered and unencumbered assets 171 220 Summary of assets available to support potential future funding and collateral needs (on and off-balance sheet) 171
Collateral 171The effect of active collateral management 220Off-balance sheet collateral received and pledged
for reverse repo, stock borrowing and derivative transactions 171
Analysis of on-balance sheet encumbered and unencumbered assets
171 Analysis of on-balance sheet encumbered and unencumbered assets 172
Additional contractual obligations 173
Contractual maturity of financial liabilities 173 Cash flows payable by HSBC under financial liabilities by remaining contractual maturities 173
Management of cross-currency liquidity and funding risk 221
HSBC Holdings 174 221 Cash flows payable by HSBC Holdings under financial liabilities by remaining contractual maturities 174
1 Appendix to Risk – risk policies and practices.

Report of the Directors: Risk (continued) Liquidity and funding
HSBC HOLDINGS PLC
164
Liquidity and funding
Liquidity risk is the risk that the Group does not have sufficient financial resources to meet its obligations as they fall due, or will have to do so at an excessive cost. The risk arises from mismatches in the timing of cash flows.
There were no material changes to our policies and practices for the management of liquidity and funding risks in 2014.
Following the change in balance sheet presentation explained on page 347, the advances to deposits ratio now excludes non-trading reverse repos and repos with customers. The change had no effect on the 31 December 2013 ratio as disclosed. A summary of our current policies and practices regarding liquidity and funding is provided in the Appendix to Risk on page 215.
Our liquidity and funding risk management framework The objective of our liquidity framework is to allow us to withstand very severe liquidity stresses. It is designed to be adaptable to changing business models, markets and regulations. Our liquidity and funding risk management framework requires: • liquidity to be managed by operating entities on a
stand-alone basis with no implicit reliance on the Group or central banks;
• all operating entities to comply with their limits for the advances to core funding ratio; and
• all operating entities to maintain a positive stressed cash flow position out to three months under prescribed Group stress scenarios.
Liquidity and funding in 2014 (Unaudited)
The liquidity position of the Group strengthened in 2014, and we continued to enjoy strong inflows of customer deposits and maintained good access to wholesale markets. Customer accounts increased by 4% (US$47bn) on a constant currency basis. On a reported basis, customer account balances decreased marginally by 1% (US$11bn). Loans and advances to customers increased by 3% (US$28bn) on a constant currency basis. On a reported basis, loans and advances to customers decreased by 2% (US$17bn). These changes resulted in a small decrease in our advances to deposits ratio to 72% (2013:73%)
HSBC UK recorded a decrease in its advances to core funding (‘ACF’) ratio to 97% at 31 December 2014 (2013: 100%), mainly because core deposits increased more than advances, and due to the disposal of legacy assets.
The Hongkong and Shanghai Banking Corporation recorded an increase in its ACF ratio to 75% at 31 December 2014 (2013: 72%), mainly because advances increased more than core deposits.
HSBC USA recorded an increase in its ACF ratio to 100% at 31 December 2014 (2013: 85%), mainly because of growth in customer advances.
HSBC UK, The Hongkong and Shanghai Banking Corporation and HSBC USA are defined in footnotes 26 to 28 on page 202. The ACF ratio is discussed on page 216. Customer deposit markets (On constant currency basis)
Retail Banking and Wealth Management
RBWM customer account balances increased by 4%, driven by our two home markets of the UK and Hong Kong and the majority of our priority growth markets.
Commercial Banking
Customer accounts increased by 7% in 2014, driven by growth in Payments and Cash Management accounts in our two home markets.
Global Banking and Markets
Customer accounts increased by 2% in 2014, mainly from a rise in Payments and Cash Management accounts.
Global Private Banking
GPB customer account balances decreased by 10% compared with the end of 2013 following the continued repositioning of the GPB business and a client portfolio disposal.
Wholesale senior funding markets
Conditions in the bank wholesale debt markets were generally positive in 2014, supporting increased primary market issuance volumes across the capital structure from banks when compared with 2013. Periods of volatility remained, however, particularly during the latter months of the year when concerns around the decline in the oil price and growth in Europe combined with a variety of other factors to leave the outlook uncertain, with market confidence affected as a result.
In 2014, we issued the equivalent of US$20bn (2013: US$16bn) of senior term debt securities in the public capital markets in a range of currencies and maturities from a number of Group entities.
Liquidity regulation (Unaudited)
The European adoption of the Basel Committee framework (legislative texts known as the Capital Requirements Regulation and Directive – ‘CRR/CRD IV’) was published in June 2013, and required the reporting of the liquidity coverage ratio (‘LCR’) and the net stable funding ratio (‘NSFR’) to European regulators from January 2014, which was subsequently delayed until 30 June 2014. A significant level of interpretation has been required to report and calculate the LCR as defined in the CRR text as certain areas were only addressed by the finalisation of the LCR delegated act in January 2015, which will not become a regulatory standard until 1 October 2015. The European calibration of NSFR is still pending following the Basel Committee’s final recommendation in October 2014.

HSBC HOLDINGS PLC
165
Str
ateg
ic R
epo
rt
Fi
nan
cial
Rev
iew
Co
rpo
rate
Gov
ern
ance
Fin
anci
al S
tate
men
ts
S
har
eho
lder
Info
rmat
ion
Management of liquidity and funding risk (Audited)
Our liquidity and funding risk management framework (‘LFRF’) employs two key measures to define, monitor and control the liquidity and funding risk of each of our operating entities. The ACF ratio is used to monitor the structural long-term funding position, and the stressed coverage ratio, incorporating Group-defined stress scenarios, is used to monitor the resilience to severe liquidity stresses.
The three principal entities listed in the tables below represented 66% (2013: 66%) of the Group’s customer accounts. Including the other principal entities, the percentage was 95% (2013: 94%).
Advances to core funding ratio
The table to the right shows the extent to which loans and advances to customers in our principal banking entities were financed by reliable and stable sources of funding.
ACF limits set for principal operating entities at 31 December 2014 ranged between 80% and 120%.
Core funding represents the core component of customer deposits and any term professional funding with a residual contractual maturity beyond one year. Capital is excluded from our definition of core funding.
Stressed coverage ratios
The ratios tabulated below express stressed cash inflows as a percentage of stressed cash outflows over both one-month and three-month time horizons. Operating entities are required to maintain a ratio of 100% or greater out to three months.
Inflows included in the numerator of the stressed coverage ratio are generated from liquid assets net of
assumed haircuts, and cash inflows related to assets contractually maturing within the time period.
In general, customer advances are assumed to be renewed and as a result do not generate a cash inflow.
Advances to core funding ratios25
(Audited) At 31 December 2014 2013 % %
HSBC UK26 Year-end 97 100Maximum 102 107Minimum 97 100Average 100 104
The Hongkong and Shanghai Banking Corporation27
Year-end 75 72Maximum 75 77Minimum 72 70Average 74 74
HSBC USA28 Year-end 100 85Maximum 100 85Minimum 85 78Average 95 82
Total of HSBC’s other principal entities29
Year-end 92 93Maximum 94 93Minimum 92 89Average 93 91
For footnotes, see page 202.
The one-month stressed coverage ratio for HSBC UK increased as certain assets previously treated as realisable under stress between 1 and 3 months were reassessed as being either realisable within 1 month or beyond 3 months. The three-month stressed coverage ratio remained broadly unchanged.
The stressed coverage ratios for the other entities remained broadly unchanged.
Stressed one-month and three-month coverage ratios25
(Audited)
Stressed one-month coverage
ratios at 31 December Stressed three-month coverage
ratios at 31 December 2014 2013 2014 2013 % % % %HSBC UK26
Year-end 117 106 109 109Maximum 117 114 109 109Minimum 102 100 103 101Average 107 106 104 103
The Hongkong and Shanghai Banking Corporation27 Year-end 117 119 112 114Maximum 119 131 114 126Minimum 114 113 111 109Average 116 119 112 114
HSBC USA28 Year-end 111 114 104 110Maximum 122 126 111 119Minimum 108 110 104 109Average 115 115 107 112
Total of HSBC’s other principal entities29 Year-end 121 121 108 114Maximum 121 128 115 119Minimum 114 113 108 109Average 117 120 110 113
For footnotes, see page 202.
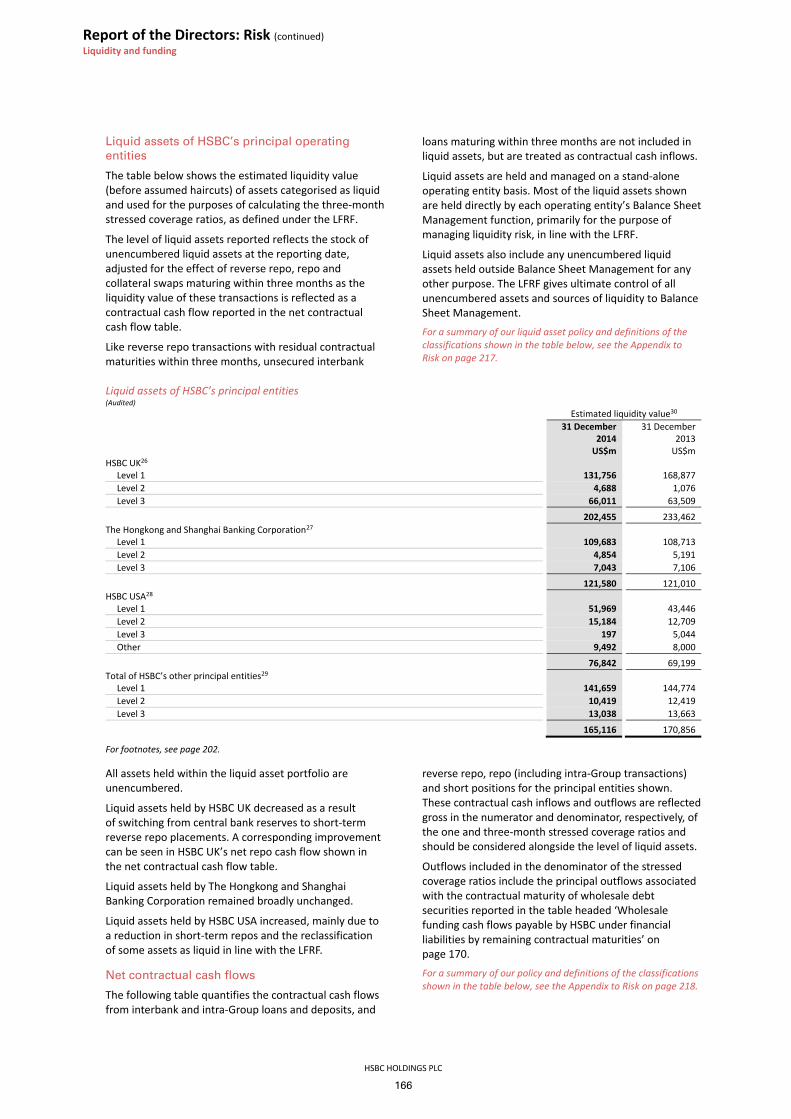
Report of the Directors: Risk (continued) Liquidity and funding
HSBC HOLDINGS PLC
166
Liquid assets of HSBC’s principal operating entities
The table below shows the estimated liquidity value (before assumed haircuts) of assets categorised as liquid and used for the purposes of calculating the three-month stressed coverage ratios, as defined under the LFRF.
The level of liquid assets reported reflects the stock of unencumbered liquid assets at the reporting date, adjusted for the effect of reverse repo, repo and collateral swaps maturing within three months as the liquidity value of these transactions is reflected as a contractual cash flow reported in the net contractual cash flow table.
Like reverse repo transactions with residual contractual maturities within three months, unsecured interbank
loans maturing within three months are not included in liquid assets, but are treated as contractual cash inflows.
Liquid assets are held and managed on a stand-alone operating entity basis. Most of the liquid assets shown are held directly by each operating entity’s Balance Sheet Management function, primarily for the purpose of managing liquidity risk, in line with the LFRF.
Liquid assets also include any unencumbered liquid assets held outside Balance Sheet Management for any other purpose. The LFRF gives ultimate control of all unencumbered assets and sources of liquidity to Balance Sheet Management. For a summary of our liquid asset policy and definitions of the classifications shown in the table below, see the Appendix to Risk on page 217.
Liquid assets of HSBC’s principal entities (Audited) Estimated liquidity value30
31 December
2014 31 December 2013
US$m US$mHSBC UK26
Level 1 131,756 168,877Level 2 4,688 1,076Level 3 66,011 63,509
202,455 233,462The Hongkong and Shanghai Banking Corporation27
Level 1 109,683 108,713Level 2 4,854 5,191Level 3 7,043 7,106
121,580 121,010HSBC USA28
Level 1 51,969 43,446Level 2 15,184 12,709Level 3 197 5,044Other 9,492 8,000
76,842 69,199Total of HSBC’s other principal entities29
Level 1 141,659 144,774Level 2 10,419 12,419Level 3 13,038 13,663
165,116 170,856
For footnotes, see page 202.
All assets held within the liquid asset portfolio are unencumbered.
Liquid assets held by HSBC UK decreased as a result of switching from central bank reserves to short-term reverse repo placements. A corresponding improvement can be seen in HSBC UK’s net repo cash flow shown in the net contractual cash flow table.
Liquid assets held by The Hongkong and Shanghai Banking Corporation remained broadly unchanged.
Liquid assets held by HSBC USA increased, mainly due to a reduction in short-term repos and the reclassification of some assets as liquid in line with the LFRF.
Net contractual cash flows
The following table quantifies the contractual cash flows from interbank and intra-Group loans and deposits, and
reverse repo, repo (including intra-Group transactions) and short positions for the principal entities shown. These contractual cash inflows and outflows are reflected gross in the numerator and denominator, respectively, of the one and three-month stressed coverage ratios and should be considered alongside the level of liquid assets.
Outflows included in the denominator of the stressed coverage ratios include the principal outflows associated with the contractual maturity of wholesale debt securities reported in the table headed ‘Wholesale funding cash flows payable by HSBC under financial liabilities by remaining contractual maturities’ on page 170. For a summary of our policy and definitions of the classifications shown in the table below, see the Appendix to Risk on page 218.

HSBC HOLDINGS PLC
167
Str
ateg
ic R
epo
rt
Fi
nan
cial
Rev
iew
Co
rpo
rate
Gov
ern
ance
Fin
anci
al S
tate
men
ts
S
har
eho
lder
Info
rmat
ion
Net cash inflows/(outflows) for interbank and intra-Group loans and deposits and reverse repo, repo and short positions (Audited) At 31 December 2014 At 31 December 2013
Cash flows
within 1 month Cash flows from
1 to 3 months Cash flows
within 1 month Cash flows from 1 to 3 months
US$m US$m US$m US$mInterbank and intra-Group loans and deposits HSBC UK26 (14,110) (2,846) (19,033) (5,272)The Hongkong and Shanghai Banking Corporation27 (1,277) 6,862 2,314 7,487HSBC USA28 (18,353) 1,648 (24,268) 729Total of HSBC’s other principal entities29 (1,322) 6,158 4,295 10,149
Reverse repo, repo, stock borrowing, stock lending and outright short positions (including intra-Group)
HSBC UK26 (16,070) 11,551 (39,064) 149The Hongkong and Shanghai Banking Corporation27 8,139 8,189 12,662 4,297HSBC USA28 (4,928) – (11,001) –Total of HSBC’s other principal entities29 (22,110) (11,120) (40,223) 9,551
For footnotes, see page 202.
Contingent liquidity risk arising from committed lending facilities (Audited)
The Group’s operating entities provide commitments to various counterparties. In terms of liquidity risk, the most significant risk relates to committed lending facilities which, whilst undrawn, give rise to contingent liquidity risk as they could be drawn during a period of liquidity stress. Commitments are given to customers and committed lending facilities are provided to consolidated multi-seller conduits established to enable clients to access flexible market-based sources of finance (see page 443), consolidated securities investment conduits and third-party sponsored conduits.
The consolidated securities investment conduits include Solitaire Funding Limited (‘Solitaire’) and Mazarin Funding Limited (‘Mazarin’). They issue asset-backed commercial paper secured against the portfolio of securities held by them. At 31 December 2014, HSBC
UK had undrawn committed lending facilities to these conduits of US$11bn (2013: US$15bn), of which Solitaire represented US$9.5bn (2013: US$11bn) and the remaining US$1.6bn (2013: US$4bn) pertained to Mazarin. Although HSBC UK provides a liquidity facility, Solitaire and Mazarin have no need to draw on it so long as HSBC purchases the commercial paper issued, which it intends to do for the foreseeable future. At 31 December 2014, the commercial paper issued by Solitaire and Mazarin was entirely held by HSBC UK. Since HSBC controls the size of the portfolio of securities held by these conduits, no contingent liquidity risk exposure arises as a result of these undrawn committed lending facilities.
The table below shows the level of undrawn commitments to customers outstanding for the five largest single facilities and the largest market sector, and the extent to which they are undrawn.
The Group’s contractual undrawn exposures at 31 December monitored under the contingent liquidity risk limit structure (Audited)
HSBC UK26 HSBC USA28 HSBC Canada
The Hongkong and Shanghai Banking
Corporation27 2014 2013 2014 2013 2014 2013 2014 2013 US$bn US$bn US$bn US$bn US$bn US$bn US$bn US$bnCommitments to conduits Consolidated multi-seller conduits
– total lines 9.8 10.1 2.3 2.5 0.2 1.0 – –– largest individual lines 0.9 0.7 0.5 0.5 0.2 0.7 – –
Consolidated securities investment conduits – total lines
11.1 14.8 – – – – – – Third party conduits – total lines – – 0.1 0.7 – – – – Commitments to customers
– five largest31 2.6 4.4 7.1 6.3 1.7 1.5 1.5 2.4– largest market sector32 16.6 9.5 10.0 8.2 3.5 3.4 3.2 2.7
For footnotes, see page 202.
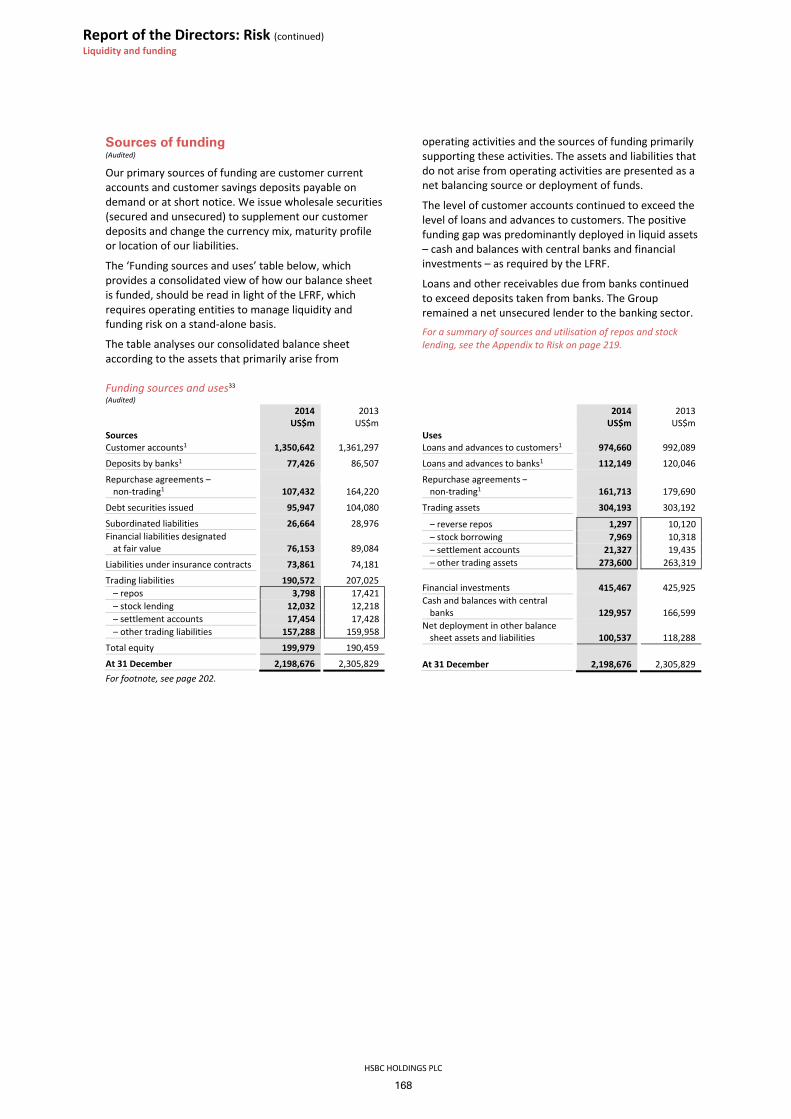
Report of the Directors: Risk (continued) Liquidity and funding
HSBC HOLDINGS PLC
168
Sources of funding (Audited)
Our primary sources of funding are customer current accounts and customer savings deposits payable on demand or at short notice. We issue wholesale securities (secured and unsecured) to supplement our customer deposits and change the currency mix, maturity profile or location of our liabilities.
The ‘Funding sources and uses’ table below, which provides a consolidated view of how our balance sheet is funded, should be read in light of the LFRF, which requires operating entities to manage liquidity and funding risk on a stand-alone basis.
The table analyses our consolidated balance sheet according to the assets that primarily arise from
operating activities and the sources of funding primarily supporting these activities. The assets and liabilities that do not arise from operating activities are presented as a net balancing source or deployment of funds.
The level of customer accounts continued to exceed the level of loans and advances to customers. The positive funding gap was predominantly deployed in liquid assets – cash and balances with central banks and financial investments – as required by the LFRF.
Loans and other receivables due from banks continued to exceed deposits taken from banks. The Group remained a net unsecured lender to the banking sector. For a summary of sources and utilisation of repos and stock lending, see the Appendix to Risk on page 219.
Funding sources and uses33 (Audited) 2014 2013 US$m US$mSources Customer accounts1 1,350,642 1,361,297
Deposits by banks1 77,426 86,507
Repurchase agreements – non-trading1 107,432 164,220
Debt securities issued 95,947 104,080
Subordinated liabilities 26,664 28,976Financial liabilities designated
at fair value 76,153 89,084
Liabilities under insurance contracts 73,861 74,181
Trading liabilities 190,572 207,025– repos 3,798 17,421– stock lending 12,032 12,218– settlement accounts 17,454 17,428– other trading liabilities 157,288 159,958
Total equity 199,979 190,459
At 31 December 2,198,676 2,305,829
2014 2013US$m US$m
Uses Loans and advances to customers1 974,660 992,089
Loans and advances to banks1 112,149 120,046
Repurchase agreements –non-trading1 161,713 179,690
Trading assets 304,193 303,192
– reverse repos 1,297 10,120– stock borrowing 7,969 10,318– settlement accounts 21,327 19,435– other trading assets 273,600 263,319
Financial investments 415,467 425,925Cash and balances with central
banks
129,957 166,599Net deployment in other balance
sheet assets and liabilities
100,537 118,288
At 31 December 2,198,676 2,305,829 For footnote, see page 202.

HSBC HOLDINGS PLC
169
Str
ateg
ic R
epo
rt
Fi
nan
cial
Rev
iew
Co
rpo
rate
Gov
ern
ance
Fin
anci
al S
tate
men
ts
S
har
eho
lder
Info
rmat
ion
Cross-border, intra-Group and cross-currency liquidity and funding risk (Unaudited)
The stand-alone operating entity approach to liquidity and funding mandated by the LFRF restricts the exposure of our operating entities to the risks that can arise from extensive reliance on cross-border funding. Operating entities manage their funding sources locally, focusing predominantly on the local customer deposit base. The RBWM, CMB and GPB customer relationships that give rise to core deposits within an operating entity generally reflect a local customer relationship with that operating entity. Access to public debt markets is co-ordinated globally by the Global Head of Balance Sheet Management and the Group Treasurer with Group ALCO monitoring all planned public debt issuance on a monthly basis. As a general principle, operating entities are only permitted to issue in their local currency and are encouraged to focus on local private placements. The public issuance of debt instruments in foreign currency is tightly controlled and generally restricted to HSBC Holdings and HSBC Bank.
A central principle of our stand-alone approach to LFRF is that operating entities place no future reliance on other Group entities. However, operating entities may, at their discretion, utilise their respective committed facilities from other Group entities if necessary. In addition, intra-Group large exposure limits are applied by national regulators to individual legal entities locally, which restricts the unsecured exposures of legal entities to the rest of the Group to a percentage of the lender’s regulatory capital.
Our LFRF also considers the ability of each entity to continue to access foreign exchange markets under stress when a surplus in one currency is used to meet a deficit in another currency, for example, by using the foreign currency swap markets. Where appropriate, operating entities are required to monitor stressed coverage ratios and ACF ratios for non-local currencies and set limits for them. Foreign currency swap markets in currency pairs settled through the Continuous Link Settlement Bank are considered to be extremely deep and liquid and it is assumed that capacity to access these markets is not exposed to idiosyncratic risks. The table below shows the ACF ratios by material currencies for the year ended 31 December 2014.
Advances to core funding ratios by material currency25 (Unaudited)
At 31 December
2014 %
HSBC UK26 Local currency (sterling) 98US dollars 100Euros 99Consolidated 97
The Hongkong and Shanghai Banking Corporation27 Local currency (Hong Kong dollars) 81US dollars 74Consolidated 75
HSBC USA28 Local currency (US dollars) 100Consolidated 100
Total of HSBC’s other principal entities29 Local currency 97US dollars 101Consolidated 92
For footnotes, see page 202.
For all HSBC’s operating entities, the only significant foreign currencies that exceed 5% of Group balance sheet liabilities are the Hong Kong dollar, euro, sterling and US dollar.
Wholesale term debt maturity profile (Unaudited)
The maturity profile of our wholesale term debt obligations is set out in the table on page 170, ‘Wholesale funding principal cash flows payable by HSBC under financial liabilities by remaining contractual maturities’.
The balances in the table do not agree directly with those in the consolidated balance sheet as the table presents gross cash flows relating to principal payments and not the balance sheet carrying value, which includes debt securities and subordinated liabilities measured at fair value.

HSBC HOLDINGS PLC
170
Report of the Directors: Risk (continued) Liquidity and funding
W
hole
sale
fund
ing
cash
flow
s pay
able
by
HSBC
und
er fi
nanc
ial l
iabi
litie
s by
rem
aini
ng c
ontr
actu
al m
atur
ities
(U
naud
ited)
D
ue n
ot
mor
e th
an
1 m
onth
Due
over
1 m
onth
but n
ot
m
ore
than
3 m
onth
s
Due
over
3 m
onth
s
but n
ot
m
ore
than
6 m
onth
s
Due
over
6 m
onth
s
but n
ot
m
ore
than
9 m
onth
s
Due
over
9 m
onth
s
but n
ot
m
ore
than
1 ye
ar
Due
over
1 ye
ar
bu
t not
mor
e th
an
2
year
s
Due
over
2 ye
ars
bu
t not
mor
e th
an
5
year
s Du
e ov
er5
year
s To
tal
US$
mU
S$m
US$
mU
S$m
US$
mU
S$m
US$
mU
S$m
US$
m
Debt
secu
ritie
s iss
ued
17
,336
17,1
6119
,030
9,35
29,
055
27,3
1240
,855
31,9
2817
2,02
9–
uns
ecur
ed C
Ds a
nd C
P
5,63
79,
337
9,23
74,
793
3,01
03,
506
4,15
818
539
,863
– u
nsec
ured
seni
or M
TNs
1,
300
5,67
97,
684
2,92
24,
794
17,6
7623
,523
20,7
1584
,293
– u
nsec
ured
seni
or st
ruct
ured
not
es
1,
363
1,08
22,
049
1,14
997
94,
757
8,44
46,
789
26,6
12–
secu
red
cove
red
bond
s
––
–20
5–
–2,
765
2,94
25,
912
– se
cure
d AB
CP
8,
602
––
––
––
–8,
602
– se
cure
d AB
S
212
1,06
360
283
272
915
1,56
2–
4,36
7–
oth
ers
22
2–
––
–45
840
31,
297
2,38
0
Subo
rdin
ated
liab
ilitie
s
–15
0–
318
511
35,
556
40,4
8746
,494
– su
bord
inat
ed d
ebt s
ecur
ities
–15
0–
318
511
35,
556
34,7
5040
,757
– p
refe
rred
secu
ritie
s
––
––
––
–5,
737
5,73
7
At 3
1 De
cem
ber 2
014
17
,336
17,3
1119
,030
9,35
59,
240
27,4
2546
,411
72,4
1521
8,52
3
De
bt se
curit
ies i
ssue
d
25,4
269,
752
17,9
4211
,659
10,5
8731
,839
46,9
3431
,066
185,
205
– u
nsec
ured
CDs
and
CP
7,
589
7,20
69,
867
3,23
95,
043
4,44
92,
749
40,1
42–
uns
ecur
ed se
nior
MTN
s
6,28
471
5,44
84,
221
3,06
221
,428
33,0
9121
,433
95,0
38–
uns
ecur
ed se
nior
stru
ctur
ed n
otes
987
1,42
31,
952
1,68
91,
718
3,71
26,
036
5,02
122
,538
– se
cure
d co
vere
d bo
nds
1,
250
225
2,74
73,
317
7,53
9–
secu
red
ABCP
10,3
8310
,383
– se
cure
d AB
S
741,
052
675
1,26
076
41,
861
2,31
17,
997
– o
ther
s
109
164
1,29
51,
568
Subo
rdin
ated
liab
ilitie
s
281,
171
144
61,
460
3,37
441
,801
47,9
84–
subo
rdin
ated
deb
t sec
uriti
es
28
1,17
114
46
460
3,37
434
,899
40,0
82–
pre
ferr
ed se
curit
ies
1,
000
6,90
27,
902
At 3
1 De
cem
ber 2
013
25
,426
9,78
019
,113
11,8
0310
,593
33,2
9950
,308
72,8
6723
3,18
9

HSBC HOLDINGS PLC
171
Str
ateg
ic R
epo
rt
Fi
nan
cial
Rev
iew
Co
rpo
rate
Gov
ern
ance
Fin
anci
al S
tate
men
ts
S
har
eho
lder
Info
rmat
ion
Encumbered and unencumbered assets (Unaudited)
The table on page 172, ‘Analysis of on-balance sheet encumbered and unencumbered assets’, summarises the total on and off-balance sheet assets that are capable of supporting future funding and collateral needs and shows the extent to which these assets are currently pledged for this purpose. The objective of this disclosure is to facilitate an understanding of available and unrestricted assets that could be used to support potential future funding and collateral needs.
The disclosure is not designed to identify assets which would be available to meet the claims of creditors or to predict assets that would be available to creditors in the event of a resolution or bankruptcy.
An asset is defined as encumbered if it has been pledged as collateral against an existing liability, and as a result is no longer available to the Group to secure funding, satisfy collateral needs or be sold to reduce the funding requirement. An asset is therefore categorised as unencumbered if it has not been pledged against an existing liability. Unencumbered assets are further analysed into four separate sub-categories; ‘readily realisable assets’, ‘other realisable assets’, ‘reverse repo/stock borrowing receivables and derivative assets’ and ‘cannot be pledged as collateral’.
At 31 December 2014, the Group held US$1,770bn of unencumbered assets that could be used to support potential future funding and collateral needs, representing 85% of the total assets that can support funding and collateral needs (on and off-balance sheet). Of this amount, US$765bn (US$684bn on-balance sheet) were assessed to be readily realisable.
Summary of assets available to support potential future funding and collateral needs (on and off-balance sheet) (Unaudited) 2014 2013 US$bn US$bn
Total on-balance sheet assets 2,634 2,671Less:
Reverse repo/stock borrowing receivables and derivative assets (518) (482)Other assets that cannot be pledged as collateral (281) (255)
Total on-balance sheet assets that can support funding and collateral needs 1,835 1,934Add off-balance sheet assets:
Fair value of collateral received from reverse repo/stock borrowing/derivatives that is available to sell or repledge 257 265
Total assets that can support funding and collateral needs (on and off-balance sheet) 2,092 2,199Less:
On-balance sheet assets pledged (146) (187)Off-balance sheet collateral received from reverse repo/stock borrowing/derivatives which has been
repledged or sold (176) (187)
Assets available to support future funding and collateral needs at 31 December 1,770 1,825
For a summary of our policy on collateral management and definition of encumbrance, see the Appendix to Risk on page 213.
Collateral (Unaudited)
Off-balance sheet collateral received and pledged for reverse repo, stock borrowing and derivative transactions
The fair value of assets accepted as collateral that we are permitted to sell or repledge in the absence of default was US$257bn at 31 December 2014 (2013: US$265bn). The fair value of any such collateral sold or repledged was US$176bn (2013: US$187bn). We are obliged to return equivalent securities. These transactions are conducted under terms that are usual and customary to standard reverse repo, stock borrowing and derivative transactions.
The fair value of collateral received and repledged in relation to reverse repos, stock borrowing and
derivatives is reported on a gross basis. The related balance sheet receivables and payables are reported on a net basis where required under IFRSs offset criteria.
As a consequence of reverse repo, stock borrowing and derivative transactions where the collateral received could be but had not been sold or repledged, we held US$81bn (2013: US$78bn) of unencumbered collateral available to support potential future funding and collateral needs at 31 December 2014.
Analysis of on-balance sheet encumbered and unencumbered assets
The table below presents an analysis of on-balance sheet holdings only, and shows the amounts of balance sheet assets on a liquidity and funding basis that are encumbered. The table therefore excludes any available off-balance sheet holdings received in respect of reverse repos, stock borrowing or derivatives.

Report of the Directors: Risk (continued) Liquidity and funding
HSBC HOLDINGS PLC
172
Analysis of on-balance sheet encumbered and unencumbered assets (Unaudited) Encumbered Unencumbered
Assets pledged as collateral
Readily realisable
assets
Other realisable
assets
Reverse repos/stock borrowing receivablesand derivative
assets
Cannot be pledged as collateral Total
US$m US$m US$m US$m US$m US$mCash and balances at central banks – 123,990 425 – 5,542 129,957Items in the course of collection from other
banks – – – – 4,927 4,927Hong Kong Government certificates of
indebtedness – – – – 27,674 27,674Trading assets 59,162 182,305 17,869 9,266 35,591 304,193
– Treasury and other eligible bills 1,994 14,122 4 – 50 16,170– debt securities 46,311 94,941 23 – 257 141,532– equity securities 10,857 62,855 1,497 – 40 75,249– loans and advances to banks – 2,530 4,818 2,781 17,452 27,581– loans and advances to customers – 7,857 11,527 6,485 17,792 43,661
Financial assets designated at fair value – 177 2,330 26,530 29,037– Treasury and other eligible bills – – 52 – 4 56– debt securities – 177 1,058 – 7,656 8,891– equity securities – – 1,139 – 18,867 20,006– loans and advances to banks and
customers – – 81 – 3 84Derivatives – – – 345,008 – 345,008Loans and advances to banks 178 3,573 74,231 762 33,405 112,149Loans and advances to customers 24,329 92,238 840,241 1,170 16,682 974,660Reverse repurchase agreements – non-trading – – – 161,713 – 161,713Financial investments 61,785 275,732 22,780 – 55,170 415,467
– Treasury and other eligible bills 3,176 75,896 2,167 – 278 81,517– debt securities 58,609 192,411 18,266 – 53,970 323,256– equity securities – 7,425 2,347 – 922 10,694
Prepayments, accrued income and other assets 294 6,334 29,780 – 38,768 75,176
Current tax assets – – – – 1,309 1,309Interest in associates and joint ventures – 22 17,875 – 284 18,181Goodwill and intangible assets – – – – 27,577 27,577Deferred tax – – – – 7,111 7,111At 31 December 2014 145,748 684,371 1,005,531 517,919 280,570 2,634,139 Cash and balances at central banks – 161,240 269 – 5,090 166,599Items in the course of collection from other banks – – – – 6,021 6,021Hong Kong Government certificates of
indebtedness – – – – 25,220 25,220Trading assets 99,326 142,211 14,654 20,438 26,563 303,192
– Treasury and other eligible bills 3,402 17,976 206 – – 21,584– debt securities 83,563 57,850 – – 231 141,644– equity securities 8,373 55,156 363 – – 63,892– loans and advances to banks 1,796 2,813 6,151 5,263 11,861 27,884– loans and advances to customers 2,192 8,416 7,934 15,175 14,471 48,188
Financial assets designated at fair value 19 2,706 1,883 – 33,822 38,430– Treasury and other eligible bills – – – – 50 50– debt securities 19 826 776 – 10,968 12,589– equity securities – 1,874 1,103 – 22,734 25,711– loans and advances to banks and
customers – 6 4 – 70 80Derivatives – – – 282,265 – 282,265Loans and advances to banks 162 8,342 80,231 – 31,311 120,046Loans and advances to customers 32,218 102,203 854,724 65 2,879 992,089Reverse repurchase agreements – non-trading – – – 179,690 – 179,690Financial investments 54,473 289,093 31,096 – 51,263 425,925
– Treasury and other eligible bills 2,985 72,849 2,052 – 226 78,112– debt securities 51,488 210,516 25,720 – 50,949 338,673– equity securities – 5,728 3,324 – 88 9,140
Prepayments, accrued income and other assets 1,028 16,788 24,619 – 34,407 76,842
Current tax assets – – – – 985 985Interest in associates and joint ventures – 12 16,356 – 272 16,640Goodwill and intangible assets – – – – 29,918 29,918Deferred tax – – – – 7,456 7,456At 31 December 2013 187,226 722,595 1,023,832 482,458 255,207 2,671,318

HSBC HOLDINGS PLC
173
Str
ateg
ic R
epo
rt
Fi
nan
cial
Rev
iew
Co
rpo
rate
Gov
ern
ance
Fin
anci
al S
tate
men
ts
S
har
eho
lder
Info
rmat
ion
The US$24bn (2013: US$32bn) of loans and advances to customers reported in the table above as encumbered have been pledged predominantly to support the issuance of secured debt instruments such as covered bonds and ABSs, including asset-backed commercial paper issued by consolidated multi-seller conduits. It also includes those pledged in relation to any other form of secured borrowing.
In total, the Group pledged US$121bn (2013: US$150bn) of negotiable securities, predominantly as a result of market-making in securities financing to our clients.
Additional contractual obligations
Under the terms of our current collateral obligations under derivative contracts (which are ISDA compliant CSA contracts and contracts entered for pension obligations, and exclude the contracts entered for special purpose vehicles and additional termination events) and based on the positions at 31 December 2014, we estimate that we could be required to post additional collateral of up to US$0.5bn (2013: US$0.7bn) in the event of a one-notch downgrade in credit ratings, which would increase to US$1.2bn (2013: US$1.2bn) in the event of a two-notch downgrade.
Contractual maturity of financial liabilities (Audited)
The balances in the table below do not agree directly with those in our consolidated balance sheet as the table incorporates, on an undiscounted basis, all cash flows relating to principal and future coupon payments (except for trading liabilities and derivatives not treated as hedging derivatives). Undiscounted cash flows payable in relation to hedging derivative liabilities are classified according to their contractual maturities. Trading liabilities and derivatives not treated as hedging derivatives are included in the ‘On demand’ time bucket and not by contractual maturity. A maturity analysis of repos and debt securities in issue included in trading liabilities is presented in Note 31 on the Financial Statements.
In addition, loans and other credit-related commitments and financial guarantees and similar contracts are generally not recognised on our balance sheet. The undiscounted cash flows potentially payable under financial guarantees and similar contracts are classified on the basis of the earliest date they can be called.
Cash flows payable by HSBC under financial liabilities by remaining contractual maturities (Audited)
On demand US$m
Due within 3 months US$m
Due between 3 and 12 months
US$m
Due between 1 and 5 years US$m
Due after 5 years US$m
Deposits by banks 52,682 17,337 3,600 3,580 390Customer accounts 1,088,769 187,207 61,687 15,826 390Repurchase agreements – non-trading 8,727 91,542 6,180 23 1,057Trading liabilities 190,572 – – – –Financial liabilities designated at fair value 365 2,201 9,192 28,260 39,397Derivatives 335,168 375 1,257 4,231 1,517Debt securities in issue 9 32,513 30,194 37,842 7,710Subordinated liabilities – 737 1,256 10,003 42,328Other financial liabilities 41,517 23,228 4,740 1,893 988
1,717,809 355,140 118,106 101,658 93,777Loan and other credit-related commitments 406,561 101,156 64,582 62,312 16,769Financial guarantees and similar contracts 13,166 6,306 13,753 9,575 4,278
At 31 December 2014 2,137,536 462,602 196,441 173,545 114,824 Deposits by banks 56,198 22,965 3,734 2,819 686Customer accounts 1,097,159 196,048 57,243 15,520 726Repurchase agreements – non-trading 37,117 112,621 14,177 – –Trading liabilities 207,025 – – – –Financial liabilities designated at fair value 18,689 1,967 3,223 39,554 64,144Derivatives 269,554 456 1,684 6,099 1,638Debt securities in issue 2,528 35,401 33,695 46,141 6,526Subordinated liabilities 55 391 2,687 11,871 44,969Other financial liabilities 31,996 30,706 6,564 2,376 1,300
1,720,321 400,555 123,007 124,380 119,989Loan and other credit-related commitments 377,352 79,599 55,124 59,747 16,872Financial guarantees and similar contracts 18,039 4,796 12,040 7,479 3,988
At 31 December 2013 2,115,712 484,950 190,171 191,606 140,849

Report of the Directors: Risk (continued) Liquidity and funding / Market risk
HSBC HOLDINGS PLC
174
HSBC Holdings (Audited)
Liquidity risk in HSBC Holdings is overseen by HALCO. Liquidity risk arises because of HSBC Holdings’ obligation to make payments to debt holders as they fall due. The liquidity risk related to these cash flows is managed by matching debt obligations with internal loan cash flows and by maintaining an appropriate liquidity buffer that is monitored by HALCO.
At 31 December 2014, the Group had US$9.2bn of CRD IV compliant non-common equity capital instruments, of which US$3.5bn were classified as tier 2 and US$5.7bn were classified as additional tier 1 (for details on the additional tier 1 instruments issued during the year see Note 35 on the Financial Statements). The balances in the table below do not agree directly
with those on the balance sheet of HSBC Holdings as the table incorporates, on an undiscounted basis, all cash flows relating to principal and future coupon payments (except for derivatives not treated as hedging derivatives). Undiscounted cash flows payable in relation to hedging derivative liabilities are classified according to their contractual maturities. Derivatives not treated as hedging derivatives are included in the ‘On demand’ time bucket.
In addition, loan commitments and financial guarantees and similar contracts are generally not recognised on our balance sheet. The undiscounted cash flows potentially payable under financial guarantees and similar contracts are classified on the basis of the earliest date on which they can be called.
Cash flows payable by HSBC Holdings under financial liabilities by remaining contractual maturities (Audited)
On demand
Due within 3 months
Due between 3 and 12 months
Due between 1 and 5 years
Due after 5 years
US$m US$m US$m US$m US$m
Amounts owed to HSBC undertakings 1,441 985 42 449 –Financial liabilities designated at fair value – 210 642 6,345 19,005Derivatives 1,066 – – 103 –Debt securities in issue – 16 50 263 1,303Subordinated liabilities – 252 770 5,815 28,961Other financial liabilities – 1,132 158 – –
2,507 2,595 1,662 12,975 49,269Loan commitments 16 – – – –Financial guarantees and similar contracts 52,023 – – – –
At 31 December 2014 54,546 2,595 1,662 12,975 49,269 Amounts owed to HSBC undertakings 2,053 1,759 2,315 857 5,654Financial liabilities designated at fair value – 299 671 4,921 26,518Derivatives 704 – – – –Debt securities in issue – 37 1,780 279 1,451Subordinated liabilities – 225 676 5,699 24,812Other financial liabilities – 885 284 – –
2,757 3,205 5,726 11,756 58,435Loan commitments 1,245 – – – –Financial guarantees and similar contracts 52,836 – – – –
At 31 December 2013 56,838 3,205 5,726 11,756 58,435

HSBC HOLDINGS PLC
175
Str
ateg
ic R
epo
rt
Fin
anci
al R
evie
w
Co
rpo
rate
Gov
ern
ance
Fi
nan
cial
Sta
tem
ents
S
har
eho
lder
Info
rmat
ion
Market risk Page App1 Tables Page
Market risk in 2014 176Exposure to market risk 176 221Overview of market risk in global businesses 221 Types of risk by global business 176Market risk governance 222
Market risk measures 223Monitoring and limiting market risk exposures 176 223Sensitivity analysis 176 223Value at risk 176 223Stress testing 176 224 Market risk stress testing 176
Trading portfolios 176 225Value at risk of the trading portfolios 176 Daily VaR (trading portfolios) 176 Trading VaR 177Back-testing 177 224 Back-testing of trading VaR against hypothetical
profit and loss for the Group 177 Gap risk 225De-peg risk 225ABS/MBS exposures 225
Non-trading portfolios 178 225Value at risk of the non-trading portfolios 178 Daily VaR (non-trading portfolios) 178 Non-trading VaR 178Credit spread risk for available-for-sale debt
securities (including SICs) 178 226 Equity securities classified as available for sale 179 226 Fair value of equity securities 179
Market risk balance sheet linkages 179 Balances included and not included in trading VaR 179 Market risk linkages to the accounting balance sheet 180
Structural foreign exchange exposures 181 226
Non-trading interest rate risk 181 226Interest rate risk behaviouralisation 181 226Balance Sheet Management 227Third-party assets in Balance Sheet Management 181 Third-party assets in Balance Sheet Management 181
Sensitivity of net interest income 181 227 Sensitivity of projected net interest income 182 Sensitivity of reported reserves to interest rate movements 183
Defined benefit pension schemes 183 228 HSBC’s defined benefit pension schemes 183
Additional market risk measures applicable only to the parent company 183 228
Foreign exchange risk 183 HSBC Holdings – foreign exchange VaR 183Sensitivity of net interest income 184 Sensitivity of HSBC Holdings net interest income to
interest rate movements 184 Interest rate repricing gap table 185 Repricing gap analysis of HSBC Holdings 185
1 Appendix to Risk – risk policies and practices.

Report of the Directors: Risk (continued) Market risk
HSBC HOLDINGS PLC
176
Market risk is the risk that movements in market factors, including foreign exchange rates and commodity prices, interest rates, credit spreads and equity prices, will reduce our income or the value of our portfolios.
There were no material changes to our policies and practices for the management of market risk in 2014.
Exposure to market risk Exposure to market risk is separated into two portfolios: • Trading portfolios comprise positions arising from
market-making and warehousing of customer-derived positions. The interest rate risk on fixed-rate securities issued by HSBC Holdings is not included in Group VaR. The management of this risk is described on page 222.
• Non-trading portfolios comprise positions that primarily arise from the interest rate management of our retail and commercial banking assets and liabilities, financial investments designated as available for sale and held to maturity, and exposures arising from our insurance operations (see page 225).
Monitoring and limiting market risk exposures Our objective is to manage and control market risk exposures while maintaining a market profile consistent with our risk appetite. We use a range of tools to monitor and limit market risk exposures, including: • Sensitivity analysis includes the sensitivity of net interest
income and the sensitivity of structural foreign exchange, which are used to monitor the market risk positions within each risk type;
• Value at risk (‘VaR’) is a technique that estimates the potential losses that could occur on risk positions as a result of movements in market rates and prices over a specified time horizon and to a given level of confidence; and
• In recognition of VaR’s limitations we augment VaR with stress testing to evaluate the potential impact on portfolio values of more extreme, though plausible, events or movements in a set of financial variables. Examples of scenarios reflecting current market concerns are the slowdown in mainland China and the potential effects of a sovereign debt default, including its wider contagion effects.
A summary of our market risk management framework including current policies is provided in the Appendix to Risk on page 221.
Market risk in 2014 (Unaudited)
Global financial markets were characterised by low inflation and weak global growth, leading monetary authorities to maintain accommodative policies, using measures such as low interest rates and asset purchases.
With US data showing GDP growth, the US Federal Reserve's asset purchase programme came to an end. Despite this, US dollar bond yields fell further. Market focus switched to actions that the ECB can take to address the issues of low growth and deflation. A sustained period of deflation would have a severe detrimental impact on countries already in recession and with high debt to GDP ratios. 2014 can be characterised as a period of benign rates and equity markets in the G7 group of countries.
Against this backdrop, we maintained an overall defensive risk profile in our trading businesses. Defensive positions are characterised by low net open positions or the purchase of volatility protection via options trades. The lower trading VaR from defensive positioning was offset by an increase caused by lower diversification and regulatory changes to the calibrations used in calculating VaR. Non-trading VaR declined during the year as low interest rates, especially in US dollars, caused the duration of non-trading assets to decrease.
Trading portfolios (Audited)
Value at risk of the trading portfolios
Trading VaR predominantly resides within Global Markets. This was higher at 31 December 2014 than at 31 December 2013 due to an increase in interest rate trading VaR, the removal of diversification effects within risk not in VaR (‘RNIV’) and lower portfolio diversification benefit across asset classes.
The daily levels of total trading VaR over the last year are set out in the graph below.

HSBC HOLDINGS PLC
177
Str
ateg
ic R
epo
rt
Fin
anci
al R
evie
w
Co
rpo
rate
Gov
ern
ance
Fi
nan
cial
Sta
tem
ents
S
har
eho
lder
Info
rmat
ion
Daily VaR (trading portfolios), 99% 1 day (US$m) (Unaudited)
The Group trading VaR for the year is shown in the table below.
Trading VaR, 99% 1 day34
(Audited)
Foreign exchange and
Interest Credit
Portfolio diversification
commodity rate Equity spread incl RNIV35 Total36
US$m US$m US$m US$m US$m US$m
At 31 December 2014 9.8 45.4 7.3 12.5 (14.3) 60.7Average 16.9 39.5 6.9 13.7 (17.8) 59.2Maximum 34.2 50.6 15.6 20.9 77.8 At 31 December 2013 16.0 33.4 9.2 14.2 (20.7) 52.1Average 15.2 33.4 5.1 16.5 (20.3) 49.9Maximum 26.4 71.9 14.1 25.5 81.3
For footnotes, see page 202.
Back-testing (Unaudited) In 2014, the Group experienced one loss exception and two profit exceptions.
The loss exception was due primarily to losses from increased volatility in foreign exchange currencies and interest rates in some developed markets combined with flattening yield curves.
The profit exceptions were driven by the tightening of spreads, and exposures to emerging market foreign exchange and interest rates. There is no evidence of model errors or control failures.
The graph below shows the daily trading VaR against hypothetical profit and loss for the Group during 2014. It excludes exceptions that were exempted by the PRA for regulatory capital purposes.
Back-testing of trading VaR against hypothetical profit and loss for the Group (US$m) (Unaudited)
-50
-30
-10
10
30
50
70
90
Dec-13 Feb-14 Apr-14 May-14 Jul-14 Aug-14 Oct-14 Dec-14
Trading VaR
IR trading
CS tradingFX trading
Equity trading
Diversification incl RNIV
-130
-80
-30
20
70
120
Jan 2014 Feb 2014 Mar 2014 May 2014 Jun 2014 Jul 2014 Sep 2014 Oct 2014 Nov 2014 Dec 2014
USDm
Back-testing exceptionHypothetical profit and loss VaR (99%)

Report of the Directors: Risk (continued) Market risk
HSBC HOLDINGS PLC
178
Non-trading portfolios (Audited)
Value at risk of the non-trading portfolios
Non-trading VaR of the Group includes contributions from all global businesses. There is no commodity risk in the non-trading portfolios. The decrease of non-trading VaR during 2014 was due primarily to the shortening of the duration in the non-trading book from lower interest rates, especially in US dollars. The credit spread risks component also added to a lower non-trading VaR as a result of the reduction in the overall position combined
with lower volatilities and credit spread baselines utilised in the VaR calculations. This movement included the reduction in credit spread risks relating to the Group’s holdings of available-for-sale debt securities (excluding those held in insurance operations which are discussed further on page 194.
In the year, the decline in non-trading interest rate and credit spread VaR components was offset by a decrease in diversification benefit. The daily levels of total non-trading VaR over the last year are set out in the graph below.
Daily VaR (non-trading portfolios), 99% 1 day (US$m) (Unaudited)
The Group non-trading VaR for the year is shown in the table below.
Non-trading VaR, 99% 1 day (Audited)
Interest
rate Credit
spread Portfolio
diversification Total US$m US$m US$m US$m
At 31 December 2014 88.2 62.5 (28.5) 122.2Average 103.3 73.3 (37.4) 139.2Maximum 147.7 91.9 189.0 At 31 December 2013 150.6 80.4 (76.4) 154.6Average 145.7 106.6 (82.1) 170.2Maximum 221.7 135.7 252.3 The management of interest rate risk in the banking book is described further in ‘Non-trading interest rate risk’ below, including the role of Balance Sheet Management (‘BSM’).
Non-trading VaR excludes equity risk on available-for- sale securities, structural foreign exchange risk and interest rate risk on fixed rate securities issued by HSBC Holdings, the management of which is described in the relevant sections below. These sections together describe the scope of HSBC’s management of market risks in non-trading books.
Credit spread risk for available-for-sale debt securities (including SICs)
The effect of movements in VaR credit spreads on our available-for-sale debt securities was US$81m (2013: US$113m) at 31 December 2014. This sensitivity includes the gross exposure for the securities investment conduits (‘SICs’) consolidated within our balance sheet based on credit spread VaR. This sensitivity excludes losses which would have been absorbed by the capital note holders.
The decrease in this sensitivity at 31 December 2014 compared with 31 December 2013 was due mainly to reducing the overall positions and lower volatilities and credit spread baselines observed during the year.
-120
-80
-40
0
40
80
120
160
200
240
280
Dec-13 Feb-14 Apr-14 May-14 Jul-14 Aug-14 Oct-14 Dec-14
Non-trading VAR
Diversification
IR non-trading
CS non-trading

HSBC HOLDINGS PLC
179
Str
ateg
ic R
epo
rt
Fin
anci
al R
evie
w
Co
rpo
rate
Gov
ern
ance
Fi
nan
cial
Sta
tem
ents
S
har
eho
lder
Info
rmat
ion
Equity securities classified as available for sale
Fair value of equity securities (Audited) 2014 2013 US$bn US$bn
Private equity holdings37 2.0 2.7Investment to facilitate ongoing
business38
1.2 1.2 Other strategic investments 7.5 5.2
At 31 December 10.7 9.1
For footnotes, see page 202.
The fair value of equity securities classified as available for sale can fluctuate considerably. The table above sets out the maximum possible loss on shareholders’ equity
from available-for-sale equity securities. The increase in other strategic investments was largely due to the increase in the market value of the Industrial Bank investment offsetting the decrease in private equity holdings from the disposal of various direct and private equity fund investments.
Market risk balance sheet linkages (Unaudited)
The information below and on page 180 aims to facilitate an understanding of linkages between line items in the balance sheet and positions included in our market risk disclosures, in line with recommendations made by the Enhanced Disclosure Task Force.
Balances included and not included in trading VaR (Unaudited)
Balancesheet
Balancesincluded intrading VaR
Balances not included in trading VaR
Primarymarket risksensitivities
US$m US$m US$m At 31 December 2014 Assets Cash and balances at central banks 129,957 129,957 BTrading assets 304,193 276,419 27,774 AFinancial assets designated at fair value 29,037 29,037 ADerivatives 345,008 333,880 11,128 ALoans and advances to banks 112,149 112,149 BLoans and advances to customers 974,660 974,660 BReverse repurchase agreements – non-trading 161,713 161,713 CFinancial investments 415,467 415,467 A
Liabilities Deposits by banks 77,426 77,426 BCustomer accounts 1,350,642 1,350,642 BRepurchase agreements – non-trading 107,432 107,432 CTrading liabilities 190,572 170,576 19,996 AFinancial liabilities designated at fair value 76,153 76,153 ADerivatives 340,669 334,199 6,470 ADebt securities in issue 95,947 95,947 C
The table represents account lines where there is some exposure to market risk according to the following asset classes: A Foreign exchange, interest rate, equity and credit spread. B Foreign exchange and interest rate. C Foreign exchange, interest rate and credit spread.
The table above splits the assets and liabilities into two categories:
• those that are included in the trading book and are measured by VaR; and
• those that are not in the trading book and/or are not measured by VaR.
The breakdown of financial instruments included and not included in trading VaR provides a linkage with market risk to the extent that it is reflected in our risk framework. However, it is important to highlight that
the table does not reflect how we manage market risk, since we do not discriminate between assets and liabilities in our VaR model.
The assets and liabilities included in trading VaR give rise to a large proportion of the income included in net trading income. As set out on page 49, HSBC’s net trading income in 2014 was US$6,760m (2013: US$8,690m). Adjustments to trading income such as valuation adjustments do not feed the trading VaR model.

Report of the Directors: Risk (continued) Market risk
HSBC HOLDINGS PLC
180
Market risk linkages to the accounting balance sheet
Trading assets and liabilities The Group’s trading assets and liabilities are in almost all cases originated by GB&M. The assets and liabilities are classified as held for trading if they have been acquired or incurred principally for the purpose of selling or repurchasing in the near term, or form part of a portfolio of identified financial instruments that are managed together and for which there is evidence of a recent pattern of short-term profit-taking. These assets and liabilities are treated as traded risk for the purposes of market risk management, other than a limited number of exceptions, primarily in Global Banking where the short-term acquisition and disposal of the assets are linked to other non-trading related activities such as loan origination.
Financial assets designated at fair value Financial assets designated at fair value within HSBC are predominantly held within the Insurance entities. The majority of these assets are linked to policyholder liabilities for either unit-linked or insurance and investment contracts with DPF. The risks of these assets largely offset the market risk on the liabilities under the policyholder contracts, and are risk managed on a non-trading basis.
Financial liabilities designated at fair value Financial liabilities designated at fair value within HSBC are primarily fixed-rate securities issued by HSBC entities for funding purposes. An accounting mismatch would arise if the debt securities were accounted for at amortised cost because the derivatives which economically hedge market risks on the securities would be accounted for at fair value with changes recognised in the income statement. The market risks of these liabilities are treated as non-traded risk, the principal risks being interest rate and/or foreign exchange risks. We also incur liabilities to customers under investment contracts, where the liabilities on unit-linked contracts are based on the fair value of assets within the unit-linked funds. The exposures on these funds are treated as non-traded risk and the principal risks are those of the underlying assets in the funds.
Derivative assets and liabilities We undertake derivative activity for three primary purposes; to create risk management solutions for clients, to manage the portfolio risks arising from client business and to manage and hedge our own risks. Most of our derivative exposures arise from sales and trading activities within GB&M and are treated as traded risk for market risk management purposes. Within derivative assets and liabilities there are portfolios of derivatives which are not risk managed on a trading intent basis and are treated as non-traded risk for VaR measurement
purposes. These arise when the derivative was entered into in order to manage risk arising from non-traded exposures. They include non-qualifying hedging derivatives and derivatives qualifying for fair value and cash flow hedge accounting. The use of non-qualifying hedges whose primary risks relate to interest rate and foreign exchange exposure is described on page 181. Details of derivatives in fair value and cash flow hedge accounting relationships are given in Note 16 on the Financial Statements. Our primary risks in respect of these instruments relate to interest rate and foreign exchange risks.
Loans and advances to customers The primary risk on assets within loans and advances to customers is the credit risk of the borrower. The risk of these assets is treated as non-trading risk for market risk management purposes.
Financial investments Financial investments include assets held on an available-for-sale and held-to-maturity basis. An analysis of the Group’s holdings of these securities by accounting classification and issuer type is provided in Note 18 on the Financial Statements and by businessactivity on page 60. The majority of these securities are mainly held within Balance Sheet Management (‘BSM’) in GB&M. The positions which are originated in order to manage structural interest rate and liquidity risk are treated as non-trading risk for the purposes of market risk management. Available-for-sale security holdings within insurance entities are treated as non-trading risk and are largely held to back non-linked insurance policyholder liabilities. The other main holdings of available-for-sale assets are the ABSs within GB&M’s legacy credit business, which are treated as non-trading risk for market risk management purposes, the principal risk being the credit risk of the obligor. The Group’s held-to-maturity securities are principally held within the Insurance business. Risks of held-to-maturity assets are treated as non-trading for risk management purposes.
Repurchase (repo) and reverse repurchase (reverse repo) agreements non-trading Reverse repo agreements, classified as assets, are a form of collateralised lending. HSBC lends cash for the term of the reverse repo in exchange for receiving collateral (normally in the form of bonds). Repo agreements, classified as liabilities, are the opposite of reverse repo, allowing HSBC to obtain funding by providing collateral to the lender. Both transaction types are treated as non-trading risk for market risk management and the primary risk is counterparty credit risk.
For information on the accounting policies applied to financial instruments at fair value, see Note 13 on the Financial Statements.

HSBC HOLDINGS PLC
181
Str
ateg
ic R
epo
rt
Fin
anci
al R
evie
w
Co
rpo
rate
Gov
ern
ance
Fi
nan
cial
Sta
tem
ents
S
har
eho
lder
Info
rmat
ion
Structural foreign exchange exposures (Unaudited)
For our policies and procedures for managing structural foreign exchange exposures, see page 226 of the Appendix to Risk.
For details of structural foreign exchange exposures see Note 33 on the Financial Statements.
Non-trading interest rate risk (Unaudited)
For our policies regarding the funds transfer pricing process for non-trading interest rate risk and liquidity and funding risk, see pages 226 and 219, respectively, of the Appendix to Risk.
Asset, Liability and Capital Management (‘ALCM’) is responsible for measuring and controlling non-trading interest rate risk under the supervision of the Risk Management Meeting. Its primary responsibilities are:
• to define the rules governing the transfer of non-trading interest rate risk from the global businesses to BSM;
• to define the rules governing the interest rate risk behaviouralisation applied to non-trading assets/liabilities (see below);
• to ensure that all market interest rate risk that can be neutralised is transferred from the global businesses to BSM; and
• to define the rules and metrics for monitoring the residual interest rate risk in the global businesses, including any market risk that cannot be neutralised.
The different types of non-trading interest rate risk and the controls which we use to quantify and limit exposure to these risks can be categorised as follows:
• risk which is transferred to BSM and managed by BSM within a defined market risk mandate, predominantly through the use of fixed rate liquid assets (government bonds) held in available-for-sale portfolios and/or interest rate derivatives which are part of fair value hedging or cash flow hedging relationships. This non-trading interest rate risk is reflected in non-trading VaR, as well as in our net interest income (see below) or economic value of equity (‘EVE’) sensitivity;
• risk which remains outside BSM because it cannot be hedged or which arises due to our behaviouralised transfer pricing assumptions. This risk is not reflected in non-trading VaR, but is captured by our net interest income or EVE sensitivity and corresponding limits are part of our global and regional risk appetite statements for non-trading interest rate risk. A typical example would be margin compression created by unusually low rates in key currencies;
• basis risk which is transferred to BSM when it can be hedged. Any residual basis risk remaining in the global businesses is reported to ALCO. This risk is not reflected in non-trading VaR, but is captured by our net interest income or EVE sensitivity. A typical example would be a managed rate savings product transfer-priced using a Libor-based interest rate curve; and
• model risks which cannot be captured by non-trading VaR, net interest income or EVE sensitivity, but are controlled by our stress testing framework. A typical example would be prepayment risk on residential mortgages or pipeline risk.
Interest rate risk behaviouralisation
For our policies regarding interest risk behaviouralisation, see page 226 of the Appendix to Risk.
Third-party assets in Balance Sheet Management (Unaudited)
For our BSM governance framework, see page 227 of the Appendix to Risk.
Third-party assets in BSM decreased by 9% during 2014. Deposits with central banks reduced by US$31bn, predominantly in Europe due to a combination of reduced repo activity and a decrease in balances with the ECB as deposit rates became negative. Loans and advances to banks decreased by US$6bn, mainly in Hong Kong and the rest of Asia. Financial investments reduced by US$8bn due to foreign exchange movements, net sales and maturities in Hong Kong and the Americas, partially offset by the increased deployment of funds into securities in Asia.
Third-party assets in Balance Sheet Management (Unaudited)
2014 2013US$m US$m
Cash and balances at central banks 103,008 134,086Trading assets 4,610 5,547Financial assets designated at fair
value – 72 Loans and advances1:
– to banks 53,842 59,355– to customers 1,931 2,146
Reverse repurchase agreements 59,172 58,968Financial investments 306,763 314,427Other 2,470 3,700
At 31 December 531,796 578,301
For footnote, see page 202.
Sensitivity of net interest income (Unaudited)
The table below sets out the effect on our future accounting net interest income (excluding insurance) of an incremental 25 basis points parallel rise or fall in all yield curves worldwide at the beginning of each quarter during the 12 months from 1 January 2015. The sensitivities shown represent the change in the base case projected net interest income that would be expected under the two rate scenarios assuming that all other non-interest rate risk variables remain constant, and there are no management actions. In deriving our base case net interest income projections the re-pricing rate of assets and liabilities used is derived from current yield curves. The interest rate sensitivities are indicative and based on simplified scenarios. The limitations of this analysis are discussed in the Appendix to Risk on page 227.
Assuming no management response, a sequence of such rises (‘up-shock’) would increase planned net interest

Report of the Directors: Risk (continued) Market risk
HSBC HOLDINGS PLC
182
income for 2015 by US$885m (2014: US$938m), while a sequence of such falls (‘down-shock’) would decrease planned net interest income by US$2,089m (2014: US$1,734m).
The net interest income (‘NII’) sensitivity of the Group can be split into three key components; the structural sensitivity arising from the four global businesses excluding BSM and Markets, the sensitivity of the funding of the trading book (Markets) and the sensitivity of BSM.
The structural sensitivity is positive in a rising rate environment and negative in a falling rate environment. The sensitivity of the funding of the trading book is negative in a rising rate environment and positive in a falling rate environment, and in terms of the impact on profit the change in net interest income would be expected to be offset by a similar change in net trading income. The sensitivity of BSM will depend on its position. Typically, assuming no management response, the sensitivity of BSM is negative in a rising rate environment and positive in a falling rate environment.
The NII sensitivity figures below also incorporate the effect of any interest rate behaviouralisation applied and the effect of any assumed repricing across products under the specific interest rate scenario. They do not incorporate the effect of any management decision to change the HSBC balance sheet composition.
See page 227 in the Risk Appendix for more information about interest rate behaviouralisation and the role of BSM.
The NII sensitivity in BSM arises from a combination of the techniques that BSM use to mitigate the transferred interest rate risk and the methods they use to optimise net revenues in line with their defined risk mandate. The figures in the table below do not incorporate the effect of any management decisions within BSM, but in reality it is likely that there would be some short-term adjustment in BSM positioning to offset the NII effects of the specific interest rate scenario where necessary.
The NII sensitivity arising from the funding of the trading book is comprised of the expense of funding trading assets, while the revenue from these trading assets is reported in net trading income. This leads to an asymmetry in the NII sensitivity figures which is cancelled out in our global business results, where we include both net interest income and net trading income. It is likely, therefore, that the overall effect on profit before tax of the funding of the trading book will be much less pronounced than shown in the figures below.
The up-shock sensitivity remained broadly unchanged in 2014. The down-shock sensitivity increased predominantly due to a change in BSM’s interest rate risk profile in US dollars.
Sensitivity of projected net interest income39 (Unaudited)
US dollarbloc
US$m
Rest ofAmericas
blocUS$m
HongKong
dollarbloc
US$m
Rest ofAsiabloc
US$m
Sterling bloc
US$m
Euro bloc
US$m Total
US$m Change in 2015 projected net interest income
arising from a shift in yield curves of:
+25 basis points at the beginning of each quarter 209 (9) 245 265 321 (146) 885–25 basis points at the beginning of each quarter (521) (1) (494) (259) (783) (31) (2,089)
Change in 2014 projected net interest income arising from a shift in yield curves of:
+25 basis points at the beginning of each quarter (107) 12 327 236 598 (128) 938–25 basis points at the beginning of each quarter (291) (23) (412) (233) (761) (14) (1,734)
For footnote, see page 202.
We monitor the sensitivity of reported reserves to interest rate movements on a monthly basis by assessing the expected reduction in valuation of available-for-sale portfolios and cash flow hedges due to parallel movements of plus or minus 100bps in all yield curves. These particular exposures form only a part of our
overall interest rate exposures. The accounting treatment of our remaining interest rate exposures, while economically largely offsetting the exposures shown in the below table, does not require revaluation movements to go to reserves.

HSBC HOLDINGS PLC
183
Str
ateg
ic R
epo
rt
Fin
anci
al R
evie
w
Co
rpo
rate
Gov
ern
ance
Fi
nan
cial
Sta
tem
ents
S
har
eho
lder
Info
rmat
ion
The table below describes the sensitivity of our reported reserves to the stipulated movements in yield curves and the maximum and minimum month-end figures during the year. The sensitivities are indicative and based on
simplified scenarios. The change in sensitivity of reported reserves is predominantly due to a reduction in the available-for-sale securities portfolio.
Sensitivity of reported reserves to interest rate movements (Unaudited)
US$m
Maximum impact US$m
MinimumimpactUS$m
At 31 December 2014 + 100 basis point parallel move in all yield curves (3,696) (5,212) (3,696)As a percentage of total shareholders’ equity (1.9%) (2.7%) (1.9%)
– 100 basis point parallel move in all yield curves 3,250 4,915 3,250As a percentage of total shareholders’ equity 1.7% 2.6% 1.7% At 31 December 2013 + 100 basis point parallel move in all yield curves (5,762) (5,992) (5,507)As a percentage of total shareholders’ equity (3.2%) (3.3%) (3.0%)
– 100 basis point parallel move in all yield curves 5,634 5,786 4,910As a percentage of total shareholders’ equity 3.1% 3.2% 2.7% Defined benefit pension schemes (Audited)
Market risk arises within our defined benefit pension schemes to the extent that the obligations of the schemes are not fully matched by assets with determinable cash flows.
HSBC’s defined benefit pension schemes (Audited) 2014 2013 US$bn US$bn
Liabilities (present value) 42.1 40.5
% %Assets:
Equities 18 18Debt securities 68 70Other (including property) 14 12
At 31 December 100 100
For details of our defined benefit schemes, see Note 6 on the Financial Statements, and for pension risk management see page 200.
Additional market risk measures applicable only to the parent company (Audited)
The principal tools used in the management of market risk are VaR for foreign exchange rate risk and the projected sensitivity of HSBC Holdings’ net interest income to future changes in yield curves and interest rate gap repricing tables for interest rate risk.
Foreign exchange risk
Total foreign exchange VaR arising within HSBC Holdings in 2014 was as follows:
HSBC Holdings – foreign exchange VaR (Audited)
2014 US$m
2013 US$m
At 31 December 29.3 54.1Average 42.1 51.1Minimum 29.3 46.7Maximum 50.0 64.1
The foreign exchange risk largely arises from loans to subsidiaries of a capital nature that are not denominated in the functional currency of either the provider or the recipient and which are accounted for as financial assets. Changes in the carrying amount of these loans due to foreign exchange rate differences are taken directly to HSBC Holdings’ income statement. These loans, and most of the associated foreign exchange exposures, are eliminated on consolidation.

Report of the Directors: Risk (continued) Market risk
HSBC HOLDINGS PLC
184
Sensitivity of net interest income (Audited)
HSBC Holdings monitors net interest income sensitivity over a five year time horizon reflecting the longer-term perspective on interest rate risk management appropriate to a financial services holding company. These sensitivities assume that any issuance where HSBC Holdings has an option to reimburse at a future call date is called at this date. The table below sets out the effect on HSBC Holdings’ future net interest income over a five
year time horizon of incremental 25 basis point parallel falls or rises in all yield curves worldwide at the beginning of each quarter during the 12 months from 1 January 2015.
Assuming no management actions, a sequence of such rises would increase planned net interest income for the next five years by US$600m (2013: increase of US$602m), while a sequence of such falls would decrease planned net interest income by US$539m (2013: decrease of US$464m).
Sensitivity of HSBC Holdings’ net interest income to interest rate movements39 (Audited) US dollar
bloc Sterling
bloc Euro
bloc Total US$m US$m US$m US$mChange in projected net interest income as at 31 December arising
from a shift in yield curves
2014 of + 25 basis points at the beginning of each quarter
0-1 year 78 9 2 892-3 years 281 17 34 3324-5 years 138 17 24 179
of – 25 basis points at the beginning of each quarter 0-1 year (58) (9) (1) (68)2-3 years (276) (16) (12) (304)4-5 years (138) (17) (12) (167)
2013 of + 25 basis points at the beginning of each quarter
0-1 year 104 (14) 2 922-3 years 382 (93) 38 3274-5 years 245 (101) 38 182
of – 25 basis points at the beginning of each quarter 0-1 year (53) 13 (2) (42)2-3 years (300) 91 (33) (242)4-5 years (243) 101 (38) (180)
For footnote, see page 202.
The interest rate sensitivities tabulated above are indicative and based on simplified scenarios. The figures represent hypothetical movements in net interest income based on our projected yield curve scenarios, HSBC Holdings’ current interest rate risk profile and assumed changes to that profile during the next five years. Changes to assumptions concerning the risk profile over the next five years can have a significant impact on the net interest income sensitivity for that period. However, the figures do not take into account
the effect of actions that could be taken to mitigate this interest rate risk.
Interest rate repricing gap table
The interest rate risk on the fixed-rate securities issued by HSBC Holdings is not included within the Group VaR but is managed on a repricing gap basis. The interest rate repricing gap table below analyses the full-term structure of interest rate mismatches within HSBC Holdings’ balance sheet.

HSBC HOLDINGS PLC
185
Str
ateg
ic R
epo
rt
Fin
anci
al R
evie
w
Co
rpo
rate
Gov
ern
ance
Fi
nan
cial
Sta
tem
ents
S
har
eho
lder
Info
rmat
ion
Repricing gap analysis of HSBC Holdings (Audited)
Total Up to
1 year From over 1
to 5 years From over 5
to 10 years More than 10 years
Non-interest bearing
US$m US$m US$m US$m US$m US$m
Cash at bank and in hand: – balances with HSBC undertakings 249 – – – – 249
Derivatives 2,771 – – – – 2,771Loans and advances to HSBC undertakings 43,910 41,603 290 1,093 – 924Financial investments in HSBC undertakings 4,073 3,010 – 731 – 332Investments in subsidiaries 96,264 – – – – 96,264Other assets 597 – – – – 597
147 8641Total assets 147,864 44,613 290 1,824 – 101,137(1Amounts owed to HSBC undertakings (2,892) (1,877) – – – (1,015)
Financial liabilities designated at fair values (18,679) (850) (5,472) (5,400) (4,263) (2,694)Derivatives (1,169) – – – – (1,169)Debt securities in issue (1,009) – – (1,013) – 4Other liabilities (1,415) – – – – (1,415)Subordinated liabilities (17,255) (779) (3,766) (2,000) (10,195) (515)Total equity (105,445) – – – – (105,445)
(Total liabilities and equity (147,864) (3,506) (9,238) (8,413) (14,458) (112,249)
Off-balance sheet items attracting interest rate sensitivity – (21,525) 7,295 7,400 5,763 1,067
Net interest rate risk gap at 31 December 2014 – 19,582 (1,653) 811 (8,695) (10,045)
Cumulative interest rate gap – 19,582 17,929 18,740 10,045 – Cash at bank and in hand:
– balances with HSBC undertakings 407 357 – – – 50Derivatives 2,789 – – – – 2,789Loans and advances to HSBC undertakings 53,344 49,979 290 1,239 645 1,191Financial investments in HSBC undertakings 1,210 300 – 731 – 179Investments in subsidiaries 92,695 – – – – 92,695Other assets 391 – – – – 391
Total assets 150,836 50,636 290 1,970 645 97,295
Amounts owed to HSBC undertakings (11,685) (10,865) – – – (820)Financial liabilities designated at fair values (21,027) (1,928) (4,655) (7,810) (4,325) (2,309)Derivatives (704) – – – – (704)Debt securities in issue (2,791) (1,722) – – (1,069) –Other liabilities (1,375) – – – – (1,375)Subordinated liabilities (14,167) – (3,030) (2,066) (8,912) (159)Total equity (99,087) – – – – (99,087)
Total liabilities and equity (150,836) (14,515) (7,685) (9,876) (14,306) (104,454)
Off-balance sheet items attracting interest rate sensitivity – (18,620) 4,382 9,876 4,421 (59)
Net interest rate risk gap at 31 December 2013 – 17,501 (3,013) 1,970 (9,240) (7,218)
Cumulative interest rate gap – 17,501 14,488 16,458 7,218 –

Report of the Directors: Risk (continued) Operational risk
HSBC HOLDINGS PLC
186
Operational risk (Unaudited)
Page App1 Tables Page
Operational risk 186 228
Operational risk management framework 186 Three lines of defence 186 Operational risk management framework 187
Operational risk in 2014 187Frequency and amount of operational risk losses 188 Frequency of operational risk incidents by risk category 189
Distribution of operational risk losses in US dollars by
risk category 228
Compliance risk 189 229Legal risk 229Global security and fraud risk 230Systems risk 231Vendor risk management 231
1 Appendix to Risk – risk policies and practices. Operational risk is relevant to every aspect of our business and covers a wide spectrum of issues, in particular legal, compliance, security and fraud. Losses arising from breaches of regulation and law, unauthorised activities, error, omission, inefficiency, fraud, systems failure or external events all fall within the definition of operational risk.
Responsibility for minimising operational risk lies with HSBC’s management and staff. Each regional, global business, country, business unit and functional head is required to maintain oversight over the operational risks and internal controls of the business and operational activities for which they are responsible. A summary of our current policies and practices regarding operational risk is provided in the Appendix to Risk on page 228.
Operational risk management framework
The Group Operational Risk function and the operational risk management framework (‘ORMF’) directs business management in discharging their responsibilities.
The ORMF defines minimum standards and processes, and the governance structure for operational risk and internal control across the Group. To implement the ORMF a ‘three lines of defence’ model is used for the management of risk, as described below:
Three lines of defence
A diagrammatic representation of the ORMF is presented on page 187.
Activity to embed the use of our operational risk management framework continued in 2014. At the same time, we are streamlining operational risk management processes and harmonising framework components and risk management processes. This is expected to lead to a stronger operational risk management culture and more forward-looking risk insights to enable businesses to determine whether material risks are being managed within the Group’s risk appetite and whether further action is required. In addition, the Security and Fraud Risk and Financial Crime Compliance functions have built a Financial Intelligence Unit (‘FIU’) which provides intelligence on the potential risks of financial crime posed by customers and business prospects to enable better risk management decision-making. The FIU provides context and expertise to identify, assess and understand financial crime risks holistically in clients, sectors and markets.
Articulating our risk appetite for material operational risks helps the organisation understand the level of risk HSBC is willing to accept. The Group operational risk appetite statement is approved annually by the GRC. The Group risk appetite statement, which includes operational risk appetite metrics, was approved by the HSBC Holdings Board. Monitoring operational risk exposure against risk appetite on a regular basis and implementing our risk acceptance process drives risk awareness in a forward-looking manner. It assists management in determining whether further action is required.
Operational risk and control assessments (‘RCAs’) are performed by individual business units and functions. The risk and control assessment process is designed to provide business areas and functions with a forward looking view of operational risks and an assessment of the effectiveness of controls, and a tracking mechanism for action plans so that they can proactively manage operational risks within acceptable levels. Risk and control assessments are reviewed and updated at least annually.
Every employee at HSBC is responsible for the risks that are a part of their day to day jobs. The first line of defence ensures all key risks
within their operations are identified, mitigated and monitored by appropriate internal controls
within an overall control environment.
Consists of the global functions such as Risk, Finance and HR who are responsible for
providing assurance, challenge and oversight of the activities conducted by the first line.
Internal Audit provides independent assuranceover the first and second lines of defence.
Firstline of
defence
Secondline of
defence
Thirdline of
defence

HSBC HOLDINGS PLC
187
Str
ateg
ic R
epo
rt
Fin
anci
al R
evie
w
Co
rpo
rate
Gov
ern
ance
Fi
nan
cial
Sta
tem
ents
S
har
eho
lder
Info
rmat
ion
Operational risk management framework
• RCAs are used to inform the evaluation of the effectiveness of controls over top risks. • Key Indicators are used to help monitor the risks and controls. • Scenarios provide management with a quantified view of our top and emerging operational risks. • Internal incidents are used to forecast typical losses. • External sources are used to inform the assessment of extreme scenarios.
Appropriate means of mitigation and controls are considered. These include:
• making specific changes to strengthen the internal control environment;
• investigating whether cost-effective insurance cover is available to mitigate the risk; and
• other means of protecting us from loss.
In addition, an enhanced scenario analysis process has been implemented across material legal entities to improve the quantification and management of material risks.
Operational risk in 2014
During 2014, our operational risk profile continued to be dominated by compliance and legal risks as referred to under ‘Top and emerging risks’ on page 118. Losses were realised relating to events that occurred in previous years. These events included the possible historical mis-selling of payment protection insurance (‘PPI’) products in the UK (see Note 29 on the Financial Statements). A number of mitigating actions continue to be taken to prevent future mis-selling incidents.
The incidence of regulatory and other proceedings against financial service firms is increasing. Proposed changes relating to capital and liquidity requirements, remuneration and/or taxes could increase our cost of doing business, reducing future profitability. We remain subject to a number of regulatory proceedings including investigations and reviews by various national regulatory, competition and enforcement authorities relating to certain past submissions made by panel banks and the process for making submissions in connection with the
setting of Libor and other interbank offered and benchmark interest rates. There are also investigations into foreign exchange, precious metals and credit default swap-related activities in progress. In response, we have undertaken a number of initiatives, including the restructuring of our Compliance sub-functions, enhancing our governance and oversight, measures to implement Global Standards as described on page 26 and other measures put in place designed to ensure we have the appropriate people, processes and procedures to manage emerging risks and new products and business. For further details see 'Compliance risk' on page 189 and for details of the investigations and legal proceedings see Note 40 on the Financial Statements.
In November 2014, the UK FCA and the US Commodity Futures Trading Commission (‘CFTC’) each announced having concluded regulatory settlements with a number of banks, including HSBC Bank plc, in connection with their respective investigations of trading and other conduct involving foreign exchange benchmark rates. Under the settlement terms, HSBC Bank plc agreed to pay a financial penalty to the FCA and a civil monetary penalty to the CFTC and to undertake various remedial actions. For further information, see Note 40 on the Financial Statements.
We have undertaken a review of our compliance with the fixed-sum unsecured loan agreement requirements of the UK Consumer Credit Act (‘CCA’). A liability has been recognised within ‘Accruals, deferred income and other liabilities’ for the repayment of interest to customers where annual statements did not remind them of their right to partially prepay the loan, notwithstanding that the customer loan documentation did include this right.
Operational Risk Standards• Regulatory Compliance• Financial Crime Compliance• Fiduciary• Legal• Information• Accounting• Tax• External Fraud• Internal Fraud• People• Political• Physical• Business Continuity• Systems• Operations• Project
Reportingand
ManagementActions
Risk Awareness and Culture
Governance Identify Set Risk Appetite Assess Control Report
Risk and Control Assessment
Capital Modelling
ScenarioAnalysis
Key Indicators
Incidents/Internal Loss
External Events

Report of the Directors: Risk (continued) Operational risk
HSBC HOLDINGS PLC
188
There is uncertainty as to whether other technical requirements of the CCA have been met, for which we have assessed an additional contingent liability. For further details see Note 40 on the Financial Statements.
We have settled claims by the US Federal Housing Finance Agency in relation to the purchase of mortgage backed securities by the Federal National Mortgage Associations (‘Fannie Mae’) and the Federal Home Loan Mortgage Association (‘Freddie Mac’) between 2005 and 2007. For further information, see Note 40 on the Financial Statements.
Other operational risks included:
• fraud risks: the threat of fraud perpetrated by or against our customers, especially in retail and commercial banking, may grow during adverse economic conditions. We increased monitoring, analysed root causes and reviewed internal controls to enhance our defences against external attacks and reduce the level of loss in these areas. In addition, Group Security and Fraud Risk worked closely with the global businesses to continually assess these threats as they evolved and adapt our controls to mitigate these risks;
• level of change creating operational complexity: the Global Risk function is engaged with business management in business transformation initiatives to ensure robust internal controls are maintained, including through participation in all relevant management committees. The Global Transactions Team has developed an enhanced risk management framework to be applied to the management of disposal risks;
• information security: the security of our information and technology infrastructure is crucial for maintaining our banking services and protecting our customers and the HSBC brand. A failure of the control framework which protects this could have implications for the wider financial sector and result in direct financial loss and/or the loss of customer data and other sensitive information which could undermine both our reputation and our ability to retain the trust of our customers. Programmes of work have been ongoing to strengthen internal security controls to prevent unauthorised access to our systems which may affect live services or facilitate data loss or fraud. In common with other banks and multinational organisations, we continue to be a target of increasingly sophisticated cyber-attacks such as ‘distributed denial of service’ attacks which can affect the availability of customer-facing websites. In addition, reliance on standard internet technologies, protocols and services means we are subject to wide-scale remediation when flaws are reported in these technologies. Lessons learnt from attacks experienced within the industry and information sharing with other financial institutions, government agencies and external intelligence
providers allows us to develop a better understanding of our own susceptibilities and to develop scenarios to test against. They will continue to be a focus of ongoing initiatives to strengthen the control environment. Significant investment has already been made in enhancing controls around data access, the heightened monitoring of potential cyber-attacks and continued training to raise staff awareness. This is an area that will require continual investment in our operational processes and contingency plans;
• vendor risk management: we continue to focus on the management of vendor risks including making good progress with the implementation of the supplier performance management programme with our most important suppliers. Additional focus is put on the screening of suppliers to enable HSBC to identify if any suppliers are on a sanctions list and to exit such relationships. Vendor risk management is a core element of third party risk management; and
• compliance with regulatory agreements and orders: Failure to implement our obligations under the DPAs could have a material adverse effect on our results and operations. Legal proceedings are discussed in Note 40 on the Financial Statements and further details regarding compliance risk are set out below.
Other operational risks are also monitored and managed through the use of the ORMF. Further information on the nature of these risks is provided in ‘Top and emerging risks’ on page 118.
Frequency and amount of operational risk losses
The profile of operational risk incidents and associated losses is summarised below, showing the distribution of operational risk incidents in terms of their frequency of occurrence and total loss amount in US dollars.
Operational losses rose in 2014, driven by UK customer redress programme charges and settlements relating to legal and regulatory matters.
As in 2013, the operational risk incident profile in 2014 comprised both high frequency, low impact events and high impact events that occurred much less frequently. For example, losses due to external fraud incidents such as credit card fraud occurred more often than other types of event, but the amounts involved were often small in value. By contrast, operational risk incidents in the compliance category were relatively low frequency events, but the total cost was significant.
The number of fraud cases was broadly unchanged during 2014 due to the continued strong control environment.
Losses due to significant historical events, including the possible mis-selling of PPI products in the UK and the incidence of regulatory matters described in Note 40 on the Financial Statements remained substantial in 2014.

HSBC HOLDINGS PLC
189
Str
ateg
ic R
epo
rt
Fin
anci
al R
evie
w
Co
rpo
rate
Gov
ern
ance
Fi
nan
cial
Sta
tem
ents
S
har
eho
lder
Info
rmat
ion
Frequency of operational risk incidents by risk category (individual loss >US$10k)
Distribution of operational risk losses in US dollars by risk category
Compliance risk (Unaudited)
Compliance risk is the risk that we fail to observe the letter and spirit of all relevant laws, codes, rules, regulations and standards of good market practice, and incur fines and penalties and suffer damage to our business as a consequence.
In 2014, we completed the restructuring of our Compliance sub-function within Global Risk into two new sub-functions: Financial Crime Compliance and Regulatory Compliance, appropriately supported by shared Compliance Chief Operating Officer, Assurance and Reputational Risk Management teams. We continue to ensure that the Compliance sub-functions, through
their operation and the execution of the Group strategy, including measures to implement Global Standards, are well positioned to meet increased levels of regulation and scrutiny from regulators and law enforcement agencies. In addition, the measures we have put in place are designed to ensure we have the appropriate people, processes and procedures to manage emerging risks and new products and business.
Enhanced global AML and sanctions policies, incorporating risk appetite, were approved by the Board in January 2014. The policies adopt and seek to enforce the highest or most effective standards globally, including a globally consistent approach to knowing our customers.
The policies are being implemented in phases through the development and application of procedures required to embed them in our day to day business operations globally. The overriding policy objective is for every employee to engage in only ‘the right kind of business, conducted in the right way’.
HSBC has fulfilled all of the requirements imposed by the DANY DPA, which expired by its terms at the end of the two-year period of that agreement in December 2014. Breach of the US DPA at any time during its term may allow the DoJ to prosecute HSBC Holdings or HSBC Bank USA in relation to the matters which are the subject of the US DPA. For further information, see ‘Regulatory commitments and consent orders’ on page 120.
In May 2014, the Board approved a globally consistent approach to the management of regulatory conduct designed to ensure we deliver fair outcomes for our customers and conduct orderly and transparent operations in financial markets. Implementation of the global conduct approach is managed through the global lines of business and functions and covers all our business and operational activities. Examples of these activities are disclosed in ‘Conduct of business’ on page 121.
It is clear that the level of inherent compliance risk that we face will continue to remain high for the foreseeable future. However, we consider that good progress is being made and will continue to be made in ensuring that we are well placed to effectively manage those risks.
1%
0%
6%
39%
4%
23%
24%
2%
1%
0%
5%
39%
7%
22%
25%
1%
Accounting and Tax
Financial Crime Compliance
Regulatory Compliance
Fraud
Legal
Operations and Systems
People
Other
2014
2013
2%
0%
54%
6%
30%
7%
1%
0%
3%
0%
43%
16%
14%
22%
2%
0%
Accounting and Tax
Financial Crime Compliance
Regulatory Compliance
Fraud
Legal
Operations and Systems
People
Other
2014
2013

Report of the Directors: Risk (continued) Risk management of insurance operations
HSBC HOLDINGS PLC
190
Risk management of insurance operations (Audited)
Page App1 Tables Page
HSBC’s bancassurance model 190Overview of insurance products 231Nature and extent of risks 232
Risk management of insurance operations in 2014 191
Asset and liability matching 191 Balance sheet of insurance manufacturing subsidiaries: – by type of contract 191 – by geographical region 193 Movement in total equity of insurance operations 193
Financial risks 194 232 Financial assets held by insurance manufacturing subsidiaries 194
Market risk 194 232 Financial return guarantees 195
Sensitivity of HSBC’s insurance manufacturing
subsidiaries to market risk factors 195 Credit risk 196 234 Treasury bills, other eligible bills and debt securities in
HSBC’s insurance manufacturing subsidiaries 1
196 Reinsurers’ share of liabilities under insurance contracts 197Liquidity risk 197 234 Expected maturity of insurance contract liabilities 197
Remaining contractual maturity of investment contract
liabilities 197
Insurance risk 198 235 Analysis of insurance risk – liabilities under insurance
contracts 198
Sensitivities to non-economic assumptions 198 Sensitivity analysis 198
1 Appendix to Risk – policies and practices.
The majority of the risk in our insurance business derives from manufacturing activities and can be categorised as insurance risk and financial risk. Insurance risk is the risk, other than financial risk, of loss transferred from the holder of the insurance contract to the issuer (HSBC). Financial risks include market risk, credit risk and liquidity risk.
There were no material changes to our policies and practices for the management of risks arising in the insurance operations in 2014. A summary of HSBC’s policies and practice regarding the risk management of insurance operations and the main contracts we manufacture is provided in the Appendix to Risk on page 231.
HSBC’s bancassurance model (Unaudited)
We operate an integrated bancassurance model which provides insurance products principally for customers with whom we have a banking relationship. Insurance products are sold through all global businesses, but predominantly by RBWM and CMB through our branches and direct channels worldwide.
The insurance contracts we sell relate to the underlying needs of our banking customers, which we can identify from our point-of-sale contacts and customer knowledge. The majority of sales are of savings and investment products and term and credit life contracts.
By focusing largely on personal and SME lines of business we are able to optimise volumes and diversify individual insurance risks.
Where we have operational scale and risk appetite, mostly in life insurance, these insurance products are manufactured by HSBC subsidiaries. Manufacturing insurance allows us to retain the risks and rewards associated with writing insurance contracts by keeping part of the underwriting profit, investment income and distribution commission within the Group.
Where we do not have the risk appetite or operational scale to be an effective insurance manufacturer, we engage with a handful of leading external insurance companies in order to provide insurance products to our customers through our banking network and direct channels. These arrangements are generally structured with our exclusive strategic partners and earn the Group a combination of commissions, fees and a share of profits.
We distribute insurance products in all of our geographical regions. We have core life insurance manufacturing entities, the majority of which are direct subsidiaries of legal banking entities, in seven countries (Argentina, Brazil, Mexico, France, the UK, Hong Kong and Singapore). There are also life insurance manufacturing subsidiaries in mainland China, Malaysia and Malta.

HSBC HOLDINGS PLC
191
Str
ateg
ic R
epo
rt
Fi
nan
cial
Rev
iew
Co
rpo
rate
Go
vern
ance
Fin
anci
al S
tate
men
ts
S
har
eho
lder
Info
rmat
ion
Risk management of insurance operations in 2014
We measure the risk profile of our insurance manufacturing businesses using an economic capital approach, where assets and liabilities are measured on a market value basis and a capital requirement is held to ensure that there is less than a 1 in 200 chance of insolvency over the next year, given the risks that the businesses are exposed to. In 2014 we aligned the measurement approach for market, credit and insurance risks in the economic capital model to the new pan-European Solvency II insurance capital regulations, which are applicable from 2016.
The risk profile of our life insurance manufacturing businesses did not change materially during 2014 and liabilities to policyholders on these contracts remained constant at US$74bn (2013: US$74bn). However, a notable change arose in the UK where HSBC Life (UK) Ltd entered into an agreement to sell its pensions business.
The full effect will only be recognised once regulatory approval is received and the portfolio is transferred to the purchaser.
Asset and liability matching (Audited)
A principal tool used to manage exposures to both financial and insurance risk, in particular for life insurance contracts, is asset and liability matching. In many markets in which we operate it is neither possible nor appropriate to follow a perfect asset and liability matching strategy. For long-dated non-linked contracts, in particular, this results in a duration mismatch between assets and liabilities. We therefore structure portfolios to support projected liabilities from non-linked contracts.
The tables below show the composition of assets and liabilities by contract and by geographical region and demonstrate that there were sufficient assets to cover the liabilities to policyholders in each case at the end of 2014.
Balance sheet of insurance manufacturing subsidiaries by type of contract (Audited)
Insurance contracts Investment contracts
With DPF
Unit-linked Annuities Other40
WithDPF41
Unit-linked Other
Other assets42
Total
US$m US$m US$m US$m US$m US$m US$m US$m US$m
Financial assets 29,040 11,278 1,517 6,253 24,238 2,561 4,322 5,732 84,941– trading assets – – 3 – – – – – 3– financial assets designated at
fair value 4,304 11,111 533 782 6,346 2,223 1,684 1,713 28,696 – derivatives 12 1 – 1 101 1 10 73 199– financial investments 21,152 – 886 5,167 15,677 – 1,807 3,812 48,501– other financial assets 3,572 166 95 303 2,114 337 821 134 7,542
Reinsurance assets 190 262 – 617 – – – 2 1,071PVIF43 – – – – – – – 5,307 5,307Other assets and investment
properties 698 328 23 107 831 7 26 7,383 9,403
Total assets 29,928 11,868 1,540 6,977 25,069 2,568 4,348 18,424 100,722
Liabilities under investment contracts – – – – – 2,542 4,155 – 6,697 – designated at fair value – – – – – 2,542 3,770 – 6,312– carried at amortised cost – – – – – – 385 – 385
Liabilities under insurance contracts 29,479 11,820 1,473 6,021 25,068 – – – 73,861
Deferred tax44 12 – 11 18 – – – 1,180 1,221Other liabilities – – – – – – – 8,577 8,577
Total liabilities 29,491 11,820 1,484 6,039 25,068 2,542 4,155 9,757 90,356
Total equity – – – – – – – 10,366 10,366
Total liabilities and equity at 31 December 201445 29,491 11,820 1,484 6,039 25,068 2,542 4,155 20,123 100,722

Report of the Directors: Risk (continued) Risk management of insurance operations
HSBC HOLDINGS PLC
192
Insurance contracts Investment contracts
With DPF
Unit-linked Annuities Other40
WithDPF41
Unit-linked Other
Other assets42
Total
US$m US$m US$m US$m US$m US$m US$m US$m US$m
Financial assets 26,382 13,348 1,651 4,728 25,676 9,720 4,375 5,846 91,726– trading assets – – 3 – – – – – 3– financial assets designated at
fair value 3,850 13,131 532 761 6,867 9,293 1,706 1,757 37,897 – derivatives 1 3 – – 215 5 – 55 279– financial investments 19,491 – 959 3,780 16,556 – 1,853 3,745 46,384– other financial assets 3,040 214 157 187 2,038 422 816 289 7,163
Reinsurance assets 182 291 522 439 – – – 2 1,436PVIF43 – – – – – – – 5,335 5,335Other assets and investment
properties 757 284 23 113 791 19 31 546 2,564
Total assets 27,321 13,923 2,196 5,280 26,467 9,739 4,406 11,729 101,061
Liabilities under investment contracts – – – – – 9,730 4,209 – 13,939 – designated at fair value – – – – – 9,730 3,761 – 13,491– carried at amortised cost – – – – – – 448 – 448
Liabilities under insurance contracts 26,920 13,804 2,158 4,872 26,427 – – – 74,181
Deferred tax44 12 – 17 1 – – – 1,163 1,193Other liabilities – – – – – – – 2,048 2,048
Total liabilities 26,932 13,804 2,175 4,873 26,427 9,730 4,209 3,211 91,361
Total equity – – – – – – – 9,700 9,700
Total liabilities and equity at 31 December 201345 26,932 13,804 2,175 4,873 26,427 9,730 4,209 12,911 101,061
For footnotes, see page 202.
Our most significant life insurance products are investment contracts with DPF issued in France, insurance contracts with DPF issued in Hong Kong and unit-linked contracts issued in Latin America, Hong Kong and the UK.
Our exposure to financial risks arising in the above balance sheet varies depending on the type of contract issued. For unit-linked contracts, the policyholder bears the majority of the exposure to financial risks whereas, for non-linked contracts, the majority of financial risks are borne by the shareholder (HSBC). For contracts with DPF, the shareholder is exposed to financial risks to the extent that the exposure cannot be managed by utilising any discretionary participation (or bonus) features within the policy contracts issued.
As noted above, during the year HSBC entered into an agreement to sell its UK pensions business, and the related balances are reported as a disposal group held for sale under IFRS 5 (and are therefore included within the ‘Other assets’ column in the table above). The disposal group comprises US$6.8bn of total liabilities, being liabilities under unit-linked investment contracts, unit-linked insurance contracts and annuity contracts. It also comprises US$6.8bn of total assets, being financial and reinsurance assets backing the liabilities, and the associated PVIF on these contracts. The transfer is subject to regulatory approvals and is expected to complete in the second half of 2015. As part of the transaction we also entered into a reinsurance agreement transferring certain risks and rewards of the business to the purchaser from 1 January 2014 until completion of the transaction. A gain of US$42m was recognised on entering into this reinsurance agreement.

HSBC HOLDINGS PLC
193
Str
ateg
ic R
epo
rt
Fi
nan
cial
Rev
iew
Co
rpo
rate
Go
vern
ance
Fin
anci
al S
tate
men
ts
S
har
eho
lder
Info
rmat
ion
Balance sheet of insurance manufacturing subsidiaries by geographical region46 (Audited)
Europe Asia4
Latin America Total
US$m US$m US$m US$m
Financial assets 30,178 47,443 7,320 84,941 – trading assets – – 3 3– financial assets designated at fair value 10,610 12,497 5,589 28,696– derivatives 172 27 – 199 – financial investments 16,947 30,010 1,544 48,501– other financial assets 2,449 4,909 184 7,542
Reinsurance assets 308 748 15 1,071 PVIF43 711 4,175 421 5,307Other assets and investment properties 7,650 1,145 608 9,403
Total assets 38,847 53,511 8,364 100,722
Liabilities under investment contracts: – designated at fair value 1,585 4,727 – 6,312– carried at amortised cost – – 385 385
Liabilities under insurance contracts 27,312 39,990 6,559 73,861Deferred tax44 273 806 142 1,221Other liabilities 7,932 460 185 8,577
Total liabilities 37,102 45,983 7,271 90,356
Total equity 1,745 7,528 1,093 10,366
Total liabilities and equity at 31 December 201445 38,847 53,511 8,364 100,722 Financial assets 41,557 42,352 7,817 91,726
– trading assets – – 3 3– financial assets designated at fair value 20,742 11,420 5,735 37,897– derivatives 272 7 – 279– financial investments 18,080 26,505 1,799 46,384– other financial assets 2,463 4,420 280 7,163
Reinsurance assets 823 596 17 1,436PVIF43 1,156 3,730 449 5,335Other assets and investment properties 868 1,101 595 2,564
Total assets 44,404 47,779 8,878 101,061
Liabilities under investment contracts: – designated at fair value 8,760 4,731 – 13,491– carried at amortised cost – – 448 448
Liabilities under insurance contracts 31,786 35,619 6,776 74,181Deferred tax44 407 645 141 1,193Other liabilities 1,474 371 203 2,048
Total liabilities 42,427 41,366 7,568 91,361
Total equity 1,977 6,413 1,310 9,700
Total liabilities and equity at 31 December 201345 44,404 47,779 8,878 101,061
For footnotes, see page 202.
Movement in total equity of insurance operations (Audited)
Total equity 2014 2013 US$m US$m
At 1 January 9,700 9,989Change in PVIF of long-term insurance business43 261 525Return on net assets 1,835 848Capital transactions (673) (590)Disposals of subsidiaries/portfolios 1 (675)Exchange differences and other (758) (397)
At 31 December 10,366 9,700
For footnote, see page 202.

Report of the Directors: Risk (continued) Risk management of insurance operations
HSBC HOLDINGS PLC
194
Financial risks (Audited)
Details on the nature of financial risks and how they are managed are provided in the Appendix to Risk on page 232.
Financial risks can be categorised into:
• market risk – risk arising from changes in the fair values of financial assets or their future cash flows from fluctuations in variables such as interest rates, credit spreads, foreign exchange rates and equity prices;
• credit risk – the risk of financial loss following the failure of third parties to meet their obligations; and
• liquidity risk – the risk of not being able to make payments to policyholders as they fall due as there are insufficient assets that can be realised as cash.
The following table analyses the assets held in our insurance manufacturing subsidiaries at 31 December 2014 by type of contract, and provides a view of the exposure to financial risk. For unit-linked contracts, which pay benefits to policyholders determined by reference to the value of the investments supporting the policies, we typically designate assets at fair value; for non-linked contracts, the classification of the assets is driven by the nature of the underlying contract.
Financial assets held by insurance manufacturing subsidiaries (Audited) Unit-linked Non-linked Other contracts47 contracts48 assets49 Total US$m US$m US$m US$mTrading assets
Debt securities – 3 – 3
Financial assets designated at fair value 13,334 13,649 1,713 28,696Treasury bills – 40 16 56Debt securities 4,589 3,507 618 8,714Equity securities 8,745 10,102 1,079 19,926
Financial investments Held-to-maturity: debt securities – 21,789 2,494 24,283
Available-for-sale: – 22,899 1,319 24,218– debt securities – 22,899 1,290 24,189– equity securities – – 29 29
Derivatives 2 124 73 199Other financial assets49 503 6,905 134 7,542
Total financial assets at 31 December 201445 13,839 65,369 5,733 84,941 Trading assets
Debt securities – 3 – 3
Financial assets designated at fair value 22,424 13,716 1,757 37,897Treasury bills – – 50 50Debt securities 7,809 3,910 546 12,265Equity securities 14,615 9,806 1,161 25,582
Financial investments Held-to-maturity: debt securities – 21,784 2,142 23,926
Available-for-sale: – 20,855 1,603 22,458– debt securities – 20,855 1,594 22,449– equity securities – – 9 9
Derivatives 8 216 55 279Other financial assets49 636 6,238 289 7,163
Total financial assets at 31 December 201345 23,068 62,812 5,846 91,726
For footnotes, see page 202.
Approximately 67% of financial assets were invested in debt securities at 31 December 2014 (2013: 64%) with 24% (2013: 28%) invested in equity securities.
Under unit-linked contracts, premium income less charges levied is invested in a portfolio of assets. We manage the financial risks of this product on behalf of the policyholders by holding appropriate assets in segregated funds or portfolios to which the liabilities are linked. These assets represented 16% (2013: 25%) of the total financial assets of our insurance manufacturing subsidiaries at the end of 2014. The reduction of US$9.3bn in the value of assets backing unit-linked contracts is largely due to the classification of US$6.3bn of assets relating to the UK pensions business as held for
sale (see page 192) and the transfer of US$2.9bn assets backing other unit-linked investment contracts to a third party during the year.
The remaining financial risks are managed either solely on behalf of the shareholder, or jointly on behalf of the shareholder and policyholders where DPF exist.
Market risk (Audited)
Market risk arises when mismatches occur between product liabilities and the investment assets which back them. For example, mismatches between asset and liability yields and maturities give rise to interest rate risk.

HSBC HOLDINGS PLC
195
Str
ateg
ic R
epo
rt
Fi
nan
cial
Rev
iew
Co
rpo
rate
Go
vern
ance
Fin
anci
al S
tate
men
ts
S
har
eho
lder
Info
rmat
ion
Our current portfolio of assets includes debt securities issued at a time when yields were higher than those observed in the current market. As a result, yields on extant holdings of debt securities exceed those available on current issues.
Long-term insurance or investment products may incorporate benefits that are guaranteed. Fixed guaranteed benefits, for example for annuities in payment, are reserved for as part of the calculation of liabilities under insurance contracts.
The risk of shareholder capital being required to meet liabilities to policyholders increases in products that offer guaranteed financial returns where current yields fall below guaranteed levels for a prolonged period. Reserves are held against the cost of guarantees, calculated by stochastic modelling. Where local rules require, these reserves are held through policyholder liabilities. Any remainder is accounted for as a deduction
to PVIF on the relevant product. The table below shows the total reserve held for the cost of guarantees, the range of investment returns on assets supporting these products and the implied investment return that would enable the business to meet the guarantees.
The financial guarantees offered on some portfolios exceeded the current yield on the assets that back them. The cost of guarantees increased to US$777m (2013: US$575m) primarily because of falling yields in France throughout 2014. As these yields fell, the cost of guarantees on closed portfolios reported in the 2.1%-4.0% and 4.1%-5.0% categories increased, driven by reduced reinvestment yield assumptions. In addition, there was a closed portfolio in Hong Kong with a guaranteed rate of 5.0% compared with the current yield of 4.1%. We reduced short-term bonus rates paid to policyholders on certain DPF contracts to manage the immediate strain on the business.
Financial return guarantees45,50 (Audited)
2014 2013
Investment returns implied by guarantee
Currentyields
Cost ofguarantees
Investment returns implied by
guarantee Current yields
Cost of guarantees
% % US$m % % US$m
Capital 0.0 0.0 – 3.5 81 0.0 0.0 – 4.4 57Nominal annual return 0.1 – 2.0 3.6 – 3.6 6 0.1 – 2.0 4.1 – 4.1 9Nominal annual return51 2.1 – 4.0 3.5 – 4.1 646 2.1 – 4.0 4.2 – 4.4 471Nominal annual return 4.1 – 5.0 3.5 – 4.1 30 4.1 – 5.0 4.1 – 4.4 25Real annual return52 0.0 – 6.0 4.7 – 7.5 14 0.0 – 6.0 6.4 – 6.4 13
At 31 December 777 575
For footnotes, see page 202.
In addition to the above, a deduction from PVIF of US$53m (2013: US$134m) is made in respect of the modelled cost of guaranteed annuity options attached to certain unit-linked pension products in Brazil.
The following table illustrates the effects of selected interest rate, equity price and foreign exchange rate scenarios on our profit for the year and the total equity of our insurance manufacturing subsidiaries.
Where appropriate, we include the impact of the stress on the PVIF in the results of the sensitivity tests. The relationship between the profit and total equity and the risk factors is non-linear and, therefore, the results disclosed should not be extrapolated to measure sensitivities to different levels of stress. The sensitivities
are stated before allowance for management actions which may mitigate the effect of changes in market rates. The sensitivities presented allow for adverse changes in policyholder behaviour that may arise in response to changes in market rates.
The effects of +/-100 basis points parallel shifts in yield curves have increased from 2013 to 2014, driven mainly by falling yields and a flattening of the yield curve in France during 2014. In the low yield environment the projected cost of options and guarantees described above is particularly sensitive to yield curve movements. The market value of available-for-sale bonds is also sensitive to yield curve movements hence the larger opposite stresses on equity.
Sensitivity of HSBC’s insurance manufacturing subsidiaries to market risk factors (Audited) 2014 2013
Effect on profit
after tax
Effect on total
equity
Effect on profit after tax
Effect on total equity
US$m US$m US$m US$m
+ 100 basis points parallel shift in yield curves 290 (345) 151 (199)– 100 basis points parallel shift in yield curves53 (549) 214 (230) 139 10% increase in equity prices 180 180 149 149 10% decrease in equity prices (153) (153) (129) (129)10% increase in US dollar exchange rate compared to all currencies 54 54 21 21 10% decrease in US dollar exchange rate compared to all currencies (54) (54) (21) (21)

Report of the Directors: Risk (continued) Risk management of insurance operations
HSBC HOLDINGS PLC
196
Credit risk (Audited)
Credit risk can give rise to losses through default and can lead to volatility in our income statement and balance sheet figures through movements in credit spreads, principally on the US$53bn (2013: US$51bn) bond portfolio supporting non-linked contracts and shareholders’ funds.
The sensitivity of the profit after tax of our insurance subsidiaries to the effects on asset values of increases in credit spreads was a reduction of US$7m (2013: US$21m). The sensitivity of total equity was a reduction of US$9m (2013: US$46m). The sensitivities are relatively small because the vast majority of the debt securities held by our insurance subsidiaries are classified as either held to maturity or available for sale, and consequently any changes in the fair value of these financial investments, absent impairment, would have no effect
on the profit after tax (or to total equity in the case of the held-to-maturity securities). We calculate the sensitivity based on a one-day movement in credit spreads over a two-year period. A confidence level of 99%, consistent with our Group VaR, is applied.
Credit quality (Audited)
The following table presents an analysis of treasury bills, other eligible bills and debt securities within our insurance business by measures of credit quality.
Only assets supporting liabilities under non-linked insurance and investment contracts and shareholders’ funds are included in the table as financial risk on assets supporting unit-linked liabilities is predominantly borne by the policyholder. 84.8% (2013: 83.4%) of the assets included in the table are invested in investments rated as ‘strong’. For a definition of the five credit quality classifications, see page 207.
Treasury bills, other eligible bills and debt securities in HSBC’s insurance manufacturing subsidiaries (Audited) Neither past due nor impaired Strong Good Satisfactory Sub-standard Total US$m US$m US$m US$m US$mSupporting liabilities under non-linked insurance and
investment contracts
Trading assets – debt securities 3 – – – 3Financial assets designated at fair value 2,550 530 214 255 3,549
– treasury and other eligible bills 5 – – 35 40– debt securities 2,545 530 214 220 3,509
Financial investments – debt securities 38,515 4,312 1,662 200 44,689 41,068 4,842 1,876 455 48,241Supporting shareholders’ funds54 Financial assets designated at fair value 214 322 30 69 635
– treasury and other eligible bills – – – 16 16– debt securities 214 322 30 53 619
Financial investments – debt securities 3,378 196 154 54 3,782 3,592 518 184 123 4,417Total45 Trading assets – debt securities 3 – – – 3Financial assets designated at fair value 2,764 852 244 324 4,184
– treasury and other eligible bills 5 – – 51 56– debt securities 2,759 852 244 273 4,128
Financial investments – debt securities 41,893 4,508 1,816 254 48,471At 31 December 2014 44,660 5,360 2,060 578 52,658
Supporting liabilities under non-linked insurance and investment contracts
Trading assets – debt securities 3 – – – 3Financial assets designated at fair value 2,780 691 224 215 3,910
– debt securities 2,780 691 224 215 3,910Financial investments – debt securities 36,113 4,596 1,699 231 42,639 38,896 5,287 1,923 446 46,552Supporting shareholders’ funds54 Financial assets designated at fair value 191 298 73 34 596
– treasury and other eligible bills 50 – – – 50– debt securities 141 298 73 34 546
Financial investments – debt securities 3,356 176 139 65 3,736 3,547 474 212 99 4,332Total45 Trading assets – debt securities 3 – – – 3Financial assets designated at fair value 2,971 989 297 249 4,506
– treasury and other eligible bills 50 – – – 50– debt securities 2,921 989 297 249 4,456
Financial investments – debt securities 39,469 4,772 1,838 296 46,375At 31 December 2013 42,443 5,761 2,135 545 50,884
For footnotes, see page 202.

HSBC HOLDINGS PLC
197
Str
ateg
ic R
epo
rt
Fi
nan
cial
Rev
iew
Co
rpo
rate
Go
vern
ance
Fin
anci
al S
tate
men
ts
S
har
eho
lder
Info
rmat
ion
Credit risk also arises when assumed insurance risk is ceded to reinsurers. The split of liabilities ceded to reinsurers and outstanding reinsurance recoveries, analysed by credit quality, is shown below. Our exposure
to third parties under the reinsurance agreements described in the Appendix to Risk on page 235 is included in this table.
Reinsurers’ share of liabilities under insurance contracts45 (Audited) Neither past due nor impaired Past due but Strong Good Satisfactory Sub-standard not impaired Total US$m US$m US$m US$m US$m US$m
Unit-linked insurance 75 185 – – – 260Non-linked insurance55 751 11 10 – – 772
At 31 December 2014 826 196 10 – – 1,032
Reinsurance debtors 11 6 – – 21 38 Unit-linked insurance 72 218 – – – 290Non-linked insurance55 1,103 8 7 – – 1,118
At 31 December 2013 1,175 226 7 – – 1,408
Reinsurance debtors 17 1 – – 10 28
For footnotes, see page 202.
Liquidity risk (Audited)
The following tables show the expected undiscounted cash flows for insurance contract liabilities and the remaining contractual maturity of investment contract liabilities at 31 December 2014. The liquidity risk
exposure is borne in conjunction with policyholders for the majority of our business, and wholly borne by the policyholder in the case of unit-linked business.
The profile of the expected maturity of the insurance contracts at 31 December 2014 remained comparable with 2013.
Expected maturity of insurance contract liabilities45 (Audited) Expected cash flows (undiscounted) Within 1 year 1-5 years 5-15 years Over 15 years Total US$m US$m US$m US$m US$m
Unit-linked insurance 709 3,280 9,243 14,544 27,776Non-linked insurance55 3,504 12,718 29,905 33,108 79,235
At 31 December 2014 4,213 15,998 39,148 47,652 107,011 Unit-linked insurance 1,106 3,609 9,757 13,725 28,197Non-linked insurance55 3,977 11,731 26,848 31,306 73,862
At 31 December 2013 5,083 15,340 36,605 45,031 102,059
For footnotes, see page 202.
Remaining contractual maturity of investment contract liabilities (Audited) Liabilities under investment contracts issued
by insurance manufacturing subsidiaries46 Unit-linked
investment contracts
Investment contracts with DPF
Other investment contracts
Total US$m US$m US$m US$mRemaining contractual maturity:
– due within 1 year 151 – 389 540– due over 1 year to 5 years 133 – – 133– due over 5 years to 10 years 194 – – 194– due after 10 years 766 – – 766– undated56 1,298 25,068 3,765 30,131
At 31 December 2014 2,542 25,068 4,154 31,764 Remaining contractual maturity:
– due within 1 year 232 – 454 686– due over 1 year to 5 years 778 – – 778– due over 5 years to 10 years 852 – – 852– due after 10 years 2,254 – – 2,254– undated56 5,614 26,427 3,755 35,796
At 31 December 2013 9,730 26,427 4,209 40,366
For footnotes, see page 202.

Report of the Directors: Risk (continued) Risk management of insurance operations / Other material risks
HSBC HOLDINGS PLC
198
Insurance risk
Insurance risk is principally measured in terms of liabilities under the contracts in force.
A principal risk we face is that, over time, the cost of acquiring and administering a contract, claims and benefits may exceed the aggregate amount of premiums received and investment income. The cost of claims and benefits can be influenced by many factors, including
mortality and morbidity experience, lapse and surrender rates and, if the policy has a savings element, the performance of the assets held to support the liabilities. The following table analyses our life insurance risk exposures by geographical region and by type of business. The insurance risk profile and related exposures remain largely consistent with those observed at 31 December 2013.
Analysis of insurance risk – liabilities under insurance contracts46 (Audited)
Europe Asia Latin
America Total US$m US$m US$m US$m
Non-linked insurance55 829 34,261 1,883 36,973Insurance contracts with DPF57 367 29,112 – 29,479Credit life 56 87 – 143Annuities 71 127 1,275 1,473Other 335 4,935 608 5,878
Unit-linked insurance 1,415 5,729 4,676 11,820
Investment contracts with DPF41,57 25,068 – – 25,068
Liabilities under insurance contracts at 31 December 2014 27,312 39,990 6,559 73,861 Non-linked insurance55 1,383 30,554 2,013 33,950
Insurance contracts with DPF57 380 26,540 – 26,920Credit life 130 74 – 204Annuities 622 129 1,407 2,158Other 251 3,811 606 4,668
Unit-linked insurance 3,976 5,065 4,763 13,804
Investment contracts with DPF41,57 26,427 – – 26,427
Liabilities under insurance contracts at 31 December 2013 31,786 35,619 6,776 74,181
For footnotes, see page 202.
Our most significant life insurance products are insurance contracts with DPF issued in Hong Kong, investment contracts with DPF issued in France and unit-linked contracts issued in Latin America, Hong Kong and the UK.
Sensitivities to non-economic assumptions (Audited)
Policyholder liabilities and PVIF for life manufacturers are determined by reference to non-economic assumptions including mortality and/or morbidity, lapse rates and expense rates. The table below shows the sensitivity of profit and total equity to reasonably possible changes in these non-economic assumptions at that date across all our insurance manufacturing subsidiaries.
Mortality and morbidity risk is typically associated with life insurance contracts. The effect on profit of an increase in mortality or morbidity depends on the type of business being written. Our largest exposures to mortality and morbidity risk exist in Brazil, France and Hong Kong.
Sensitivity to lapse rates depends on the type of contracts being written. For insurance contracts, claims are funded by premiums received and income earned on the investment portfolio supporting the liabilities. For a portfolio of term assurance, an increase
in lapse rates typically has a negative effect on profit due to the loss of future premium income on the lapsed policies. However, some contract lapses have a positive effect on profit due to the existence of policy surrender charges. Brazil, France, Hong Kong and the UK are where we are most sensitive to a change in lapse rates.
Expense rate risk is the exposure to a change in the cost of administering insurance contracts. To the extent that increased expenses cannot be passed on to policyholders, an increase in expense rates will have a negative effect on our profits.
Sensitivity analysis (Audited)
2014 2013 US$m US$m
Effect on profit after tax and total equity at 31 December
10% increase in mortality and/or morbidity rates
(65)
(76)
10% decrease in mortality and/or morbidity rates
72
79
10% increase in lapse rates57 (108) (119)10% decrease in lapse rates57 122 13310% increase in expense rates (106) (101)10% decrease in expense rates 106 100
For footnote, see page 202.

HSBC HOLDINGS PLC
199
Str
ateg
ic R
epo
rt
Fi
nan
cial
Rev
iew
Co
rpo
rate
Go
vern
ance
Fin
anci
al S
tate
men
ts
S
har
eho
lder
Info
rmat
ion
Other material risks Page App1 Tables Page
Reputational risk 199 235
Fiduciary risk 200
Pension risk 200 236The principal plan 200 The principal plan – target asset allocation 200 Benefit payments (US$m) 201Future developments 201Defined contribution plans 201
Sustainability risk 201 237
1 Appendix to Risk – risk policies and practices.
Reputational risk (Unaudited)
Reputational risk is the failure to meet stakeholder expectations as a result of any event, behaviour, action or inaction, either by HSBC itself, our employees or those with whom we are associated, that might cause stakeholders to form a negative view of HSBC.
Reputational risk relates to perceptions, whether based on fact or otherwise. Stakeholders’ expectations are constantly changing and thus reputational risk is dynamic and varies between geographies, groups and individuals. As a global bank, HSBC shows unwavering commitment to operating, and to be seen to be operating, to the high standards we have set for ourselves in every jurisdiction. Reputational risk might result in financial or non-financial impacts, loss of confidence, adverse effects on our ability to keep and attract customers, or other consequences. Any lapse in standards of integrity, compliance, customer service or operating efficiency represents a potential reputational risk.
A number of measures to address the requirements of the US DPA and otherwise to enhance our AML, sanctions and other regulatory compliance frameworks have been taken and/or are ongoing. These measures, which should also serve over time to enhance our reputational risk management, include the following:
• simplifying our business through the progressive implementation of our Group strategy, including the adoption of a global financial crime risk filter, which should help to standardise our approach to doing business in higher risk countries;
• an increase in reputational risk resources in each region in which we operate and the introduction of a central case management and tracking process for reputational risk and client relationship matters;
• the creation of combined reputational risk and client selection committees within the global businesses with a clear process to escalate and address matters at the appropriate level;
• the continued roll-out of training and communication about the HSBC Values Programme that defines the way everyone in the Group should act and seeks to
ensure that the Values are embedded into our operations; and
• the continuous development and implementation of the Global Standards around financial crime compliance, which underpin our businesses. This includes ensuring globally consistent application of policies that govern AML and sanctions compliance programmes.
In July 2014, the new reputational risk and customer selection policies were issued which define a consistent and structured approach to managing these risks:
• Reputational risk (new policy): defines reputational risk and sets out HSBC’s approach to managing it;
• Customer selection and business acceptance (new policy): outlines the risk factors to be considered when a new customer relationship is identified;
• Customer selection and exit management: establishes the globally sustainable approach to customer selection and exit management for all accounts and relationships in all business lines. This details the criteria under which escalation or approval is required; and
• Sixth filter: customers operating in high risk jurisdictions carry particular financial crime risks and may require specific approvals, or be considered for an exit, if the relationship exceeds HSBC’s global risk appetite.
HSBC has zero tolerance for knowingly engaging in any business, activity or association where foreseeable reputational damage has not been considered and mitigated. There must be no barriers to open discussion and the escalation of issues that could affect the Group negatively. While there is a level of risk in every aspect of business activity, appropriate consideration of potential harm to HSBC’s good name must be a part of all business decisions.
Detecting and preventing illicit actors’ access to the global financial system calls for constant vigilance and we will continue to cooperate closely with all governments to achieve success. This is integral to the execution of our strategy, to HSBC Values and to preserving and enhancing our reputation.

Report of the Directors: Risk (continued) Other material risks
HSBC HOLDINGS PLC
200
Fiduciary risk (Unaudited)
Fiduciary risk is the risk to the Group of breaching our fiduciary duties when we act in a fiduciary capacity as trustee or investment manager or as mandated by law or regulation.
A fiduciary duty is one where HSBC holds, manages, oversees or has responsibility for assets for a third party that involves a legal and/or regulatory duty to act with a high standard of care and with good faith. A fiduciary must make decisions and act in the interests of the third party and must place the wants and needs of the client first, above the needs of the Group.
We may be held liable for damages or other penalties caused by failure to act in accordance with these duties. Fiduciary duties may also arise in other circumstances, such as when we act as an agent for a principal, unless the fiduciary duties are specifically excluded (e.g. under the agency appointment contract).
Our principal fiduciary businesses (the ‘designated businesses’) have developed fiduciary risk appetite statements for their various fiduciary roles and have put in place key indicators to monitor their related risks.
Pension risk (Audited)
We operate a number of defined benefit and defined contribution pension plans throughout the world. The majority of pension risk arises from the Group’s defined benefit plans of which the largest is the HSBC Bank (UK) Pension Scheme (‘the principal plan’).
During 2014, a new global pension risk framework was established, with accompanying new global policies on the management of risks related to defined benefit and defined contribution plans. In addition, a new Global Pensions Oversight Committee was established to oversee the running of all pension plans sponsored by HSBC around the world.
At 31 December 2014, the Group’s aggregate defined benefit pension plan obligation was US$42bn and the net asset was US$2.7bn (2013: US$40bn and US$0.1bn, respectively). The increase in the net asset was mainly due to the increase in the principal plan’s assets exceeding the increase in its benefit obligation. Of the Group total amounts, the principal plan contributed US$30bn to the defined benefit obligation and US$4.8bn to the net asset. The principal plan is the largest contributor to pension risk in the Group.
The principal plan (Audited)
The principal plan is overseen by a corporate trustee who has fiduciary responsibility for the operation of the pension scheme. The principal plan comprises a defined benefit section and a defined contribution section. Unless stated otherwise, this narrative relates to the defined benefit section.
The investment strategy of the principal plan is to hold the majority of assets in bonds, with the remainder in a more diverse range of investments, and includes a portfolio of interest rate and inflation swaps in order to reduce interest rate risk and inflation risk (see Note 41 in the Financial Statements). The target asset allocation of the principal plan at the year-end is shown below. HSBC and the trustee have developed a general framework which, over time, will see the plan’s asset strategy evolve to be less risky: this is described in further detail below.
The principal plan – target asset allocation 2014 2013 % %
Equities58 19.4 19.4Bonds 64.5 64.5Alternative assets59 10.6 10.6Property 5.5 5.5Cash60 – –
At 31 December 100.0 100.0
For footnotes, see page 202.
The latest actuarial valuation of the principal plan was made as at 31 December 2011 by C G Singer, Fellow of the Institute and Faculty of Actuaries, of Towers Watson Limited. At that date, the market value of the plan’s assets was £18bn (US$28bn) (including assets relating to both the defined benefit and defined contribution plans, and additional voluntary contributions). The market value of the plan assets represented 100% of the amount expected to be required, on the basis of the assumptions adopted, to provide the benefits accrued to members after allowing for expected future increases in earnings under the projected unit method. There was therefore no resulting surplus/deficit and hence no recovery plan was required.
The expected cash flows from the principal plan were projected by reference to the Retail Price Index (‘RPI’) swap break-even curve at 31 December 2011. Salary increases were assumed to be 0.5% per annum above RPI and inflationary pension increases, subject to a minimum of 0% and a maximum of 5% (maximum of 3% per annum in respect of service accrued since 1 July 2009), were assumed to be in line with RPI. The projected cash flows were discounted at the Libor swap curve at 31 December 2011 plus a margin for the expected return on the investment strategy of 160bps per annum. The mortality experience of the principal plan’s pensioners over the six-year period (2006-2011) was analysed and, on the basis of this analysis, the mortality assumptions were set, based on the SAPS S1 series of tables adjusted to reflect the pensioner experience. Allowance was made for future improvements to mortality rates in line with the Continuous Mortality Investigation core projections with a long-run improvement rate set at 2% for males and 1.5% for females. The benefits expected to be payable from the defined benefit plan from 2015 are shown in the chart below.

HSBC HOLDINGS PLC
201
Str
ateg
ic R
epo
rt
Fi
nan
cial
Rev
iew
Co
rpo
rate
Go
vern
ance
Fin
anci
al S
tate
men
ts
S
har
eho
lder
Info
rmat
ion
Future benefit payments (US$m)
As part of the 31 December 2011 valuation, calculations were also made of the amount of assets that might be needed to meet the liabilities if the principal plan was discontinued and the members’ benefits bought out with an insurance company (although in practice this may not be possible for a plan of this size) or the Trustee continued to run the plan without the support of HSBC. The amount required under this approach was estimated to be £26bn (US$41bn) as at 31 December 2011. In arriving at this estimation, a more prudent assumption about future mortality was made than for the assessment of the ongoing position and it was assumed that the Trustee would alter the investment strategy to be an appropriately matched portfolio of UK government bonds. An explicit allowance for expenses was also included.
HSBC and the trustee have developed a general framework which, over time, will see the principal plan’s asset strategy evolve to be less risky and further aligned to the expected future cash-flows, referred to as the Target Matching Portfolio (‘TMP’). The TMP would therefore contain sufficient assets, the majority of which will be bond-like in nature, which are more closely aligned to the liability profile. Progress towards the TMP can be achieved by asset returns in excess of that assumed and/or additional funding. In 2013, HSBC agreed to make general framework contributions of £64m (US$100m) in each of the calendar years 2013, 2014 and 2015 as well as £128m (US$200m) in 2016. Further contributions have been agreed to be made in future years, which are linked to the continued implementation of the general framework.
HSBC Bank is also making contributions to the principal plan in respect of the accrual of benefits of defined
benefit section members. Since April 2013, HSBC has paid contributions at the rate of 43% of pensionable salaries (less member contributions).Contribution levels will be reviewed as part of the next actuarial valuation, which has an effective date of 31 December 2014. The results of this valuation are expected to be included in the Annual Report and Accounts 2015.
Future developments (Unaudited)
Future service accrual for active members of the defined benefit section will cease with effect from 30 June 2015. All active members of the defined benefit section will become members of the defined contribution section from 1 July 2015, and their accrued defined benefit pensions based on service to 30 June 2015 will continue to be linked to final salary on retirement (underpinned by increases in CPI). The defined benefit service cost will therefore reduce to zero from 1 July 2015 and the defined contribution service cost will increase.
Defined contribution plans
Our global strategy is to move from defined benefit pension provisions to defined contribution, dependent on local legislative requirements and emerging practice. In defined contribution pension plans, the sponsor contributions are known, while the ultimate benefit will vary, typically with investment returns achieved by employee investment choices. While the market risk of defined contribution plans is significantly less than that of defined benefit plans, the Bank is still exposed to operational and reputational risk.
Sustainability risk (Unaudited)
Assessing the environmental and social impacts of providing finance to our customers is integral to our overall risk management processes.
In 2014, we issued new policies on forestry, agricultural commodities, World Heritage Sites and Ramsar Wetlands, following an extensive internal and external review of our previous forestry policy. The results of two independent reviews into the content and implementation of our previous policy were published on www.hsbc.com. A summary of our current policies and practices regarding reputational risk, pension risk and sustainability risk is provided in the Appendix to Risk on page 235.
0
200
400
600
800
1,000
1,200
1,400
1,600
1,800
2015
2021
2027
2033
2039
2045
2051
2057
2063
2069
2075
2081
2087
2093
2099
2105

Report of the Directors: Risk (continued) Footnotes
HSBC HOLDINGS PLC
202
Footnotes to Risk
Credit risk 1 From 1 January 2014, non-trading reverse repos and repos are presented as separate lines in the balance sheet. Previously, non-
trading reverse repos were included within ‘Loans and advances to banks’ and ‘Loans and advances to customers’ and non-trading repos were included within ‘Deposits by banks’ and ‘Customer accounts’. Comparative data have been re-presented accordingly.
2 At 31 December 2014, the credit quality of financial guarantees and similar contracts was: US$17bn strong, US$16bn good, US$12bn satisfactory, and US$2bn sub-standard.
3 The amount of the loan commitments reflects, where relevant, the expected level of take-up of pre-approved loan offers made by mailshots to personal customers. In addition to those amounts, there is a further maximum possible exposure to credit risk of US$71bn (2013: US$34bn), reflecting the full take-up of loan commitments. The take-up of such offers is generally at modest levels. At 31 December 2014, the credit quality of loan and other credit-related commitments was: US$322bn strong, US$191bn good, US$127bn satisfactory, US$10bn sub-standard and US$0.8bn impaired.
4 From 1 January 2014, the geographical region ‘Asia’ replaced the geographical regions previously reported as ‘Hong Kong’ and ‘Rest of Asia-Pacific’ (see Note 23 on the Financial Statements for further details). Comparative data have been re-presented to reflect this change.
5 ‘Financial’ includes loans and advances to banks. 6 ‘First lien residential mortgages’ include Hong Kong Government Home Ownership Scheme loans of US$3.4bn at 31 December 2014
(2013: US$3.2bn). Where disclosed, earlier comparatives were 2012: US$3.2bn; 2011: US$3.3bn; 2010: US$3.5bn. 7 ‘Other personal lending’ includes second lien mortgages and other property-related lending. 8 ‘Other commercial loans and advances’ include advances in respect of agriculture, transport, energy and utilities. 9 Impairment allowances are not reported for financial instruments, for which the carrying amount is reduced directly for impairment
and not through the use of an allowance account. 10 Impairment is not measured for assets held in trading portfolios or designated at fair value as assets in such portfolios are managed
according to movements in fair value, and the fair value movement is taken directly to the income statement. Consequently, we report all such balances under ‘Neither past due nor impaired’.
11 ‘Loans and advances to customers’ includes asset-backed securities that have been externally rated as strong (2014: US$1.2bn; 2013: US$1.7bn), good (2014: US$256m; 2013: US$255m), satisfactory (2014: US$332m; 2013: US$200m), sub-standard (2014: US$94m; 2013: US$283m) and impaired (2014: US$128m; 2013: US$252m).
12 ‘Collectively assessed impairment allowances’ are allocated to geographical segments based on the location of the office booking the allowances or provisions.
13 Included within ‘Exchange and other movements’ is US$0.4bn of impairment allowances reclassified to held for sale (2013: US$0.2bn). 14 Of the US$2,724m (2013: US$3,580m) of renegotiated loans, US$608m (2013: US$716m) were neither past due nor impaired, US$1m
(2013: US$52m) was past due but not impaired and US$2,115m (2013: US$2,812m) were impaired. 15 French Banking Federation Master Agreement Relating to Transactions on Forward Financial Instruments plus CSA equivalent. 16 The German Master Agreement for Financial Derivative Transactions. 17 HSBC Finance lending is shown on a management basis and includes loans transferred to HSBC USA Inc. which are managed by HSBC
Finance. 18 Property acquired through foreclosure is initially recognised at the lower of the carrying amount of the loan or its fair value less
estimated costs to sell (‘initial foreclosed property carrying amount’). The average gain/loss on sale of foreclosed properties is calculated as cash proceeds less the initial foreclosed properties carrying amount divided by the unpaid loan principal balance prior to write-down (excluding any accrued finance income) plus certain other ancillary disbursements that, by law, are reimbursable from the cash proceeds (e.g. real estate tax advances) and were incurred prior to our taking title to the property. This ratio represents the portion of our total loss on foreclosed properties that occurred after we took title to the property.
19 The average total gain/loss on foreclosed properties includes both the gain/loss on sale of the foreclosed property as discussed in footnote 18 and the cumulative write-downs recognised on the loans up to the time we took title to the property.
20 Included in this category are loans of US$1.5bn (2013: US$1.9bn) that have been re-aged once and were less than 60 days past due at the point of re-age. These loans are not classified as impaired following re-age due to the overall expectation that these customers will perform on the original contractual terms of their borrowing in the future.
21 ‘Currency translation’ is the effect of translating the results of subsidiaries and associates for the previous year at the average rates of exchange applicable in the current year.
22 Negative numbers are favourable: positive numbers are unfavourable. 23 Carrying amount of the net principal exposure. 24 Total includes holdings of ABSs issued by Freddie Mac and Fannie Mae.
Liquidity and funding 25 The most favourable metrics are smaller advances to core funding and larger stressed one-month and three-month coverage ratios. 26 The HSBC UK entity shown comprises four legal entities; HSBC Bank plc (including all overseas branches, and SPEs consolidated by
HSBC Bank plc for Financial Statement purposes), Marks and Spencer Financial Services Limited, HSBC Private Bank (UK) Ltd and HSBC Trust Company (UK) Limited, managed as a single operating entity, in line with the application of UK liquidity regulation as agreed with the UK PRA.
27 The Hongkong and Shanghai Banking Corporation represents the Group in Hong Kong, including its overseas branches. Each branch is monitored and controlled for liquidity and funding risk purposes as a stand-alone operating entity.
28 The HSBC USA principal entity shown represents the HSBC USA Inc consolidated group; predominantly HSBC USA Inc and HSBC Bank USA, NA. The HSBC USA Inc consolidated group is managed as a single operating entity.
29 The total shown for other principal HSBC operating entities represents the combined position of all the other operating entities overseen directly by the Risk Management Meeting of the GMB.
30 Estimated liquidity value represents the expected realisable value of assets prior to management assumed haircuts. 31 The undrawn balance for the five largest committed liquidity facilities provided to customers other than facilities to conduits.

HSBC HOLDINGS PLC
203
Str
ateg
ic R
epo
rt
Fi
nan
cial
Rev
iew
Co
rpo
rate
Go
vern
ance
Fin
anci
al S
tate
men
ts
S
har
eho
lder
Info
rmat
ion
32 The undrawn balance for the total of all committed liquidity facilities provided to the largest market sector, other than facilities to conduits.
33 The residual contractual maturity profile of the balance sheet is set out on in Note 31 on the Financial Statements.
Market risk 34 Trading portfolios comprise positions arising from the market-making and warehousing of customer-derived positions. 35 Portfolio diversification is the market risk dispersion effect of holding a portfolio containing different risk types. It represents the
reduction in unsystematic market risk that occurs when combining a number of different risk types, for example, interest rate, equity and foreign exchange, together in one portfolio. It is measured as the difference between the sum of the VaR by individual risk type and the combined total VaR. A negative number represents the benefit of portfolio diversification. As the maximum occurs on different days for different risk types, it is not meaningful to calculate a portfolio diversification benefit for these measures. For presentation purposes, portfolio diversification within the trading portfolio includes VaR-based RNIV.
36 The total VaR is non-additive across risk types due to diversification effects. 37 Investments in private equity are primarily made through managed funds that are subject to limits on the amount of investment. Potential
new commitments are subject to risk appraisal to ensure that industry and geographical concentrations remain within acceptable levels for the portfolio as a whole. Regular reviews are performed to substantiate the valuation of the investments within the portfolio.
38 Investments held to facilitate ongoing business include holdings in government-sponsored enterprises and local stock exchanges. 39 Instead of assuming that all interest rates move together, we group our interest rate exposures into currency blocs whose rates are
considered likely to move together. See ‘Cautionary statement regarding forward-looking statements’.
Risk management of insurance operations 40 Other includes term assurance, credit life insurance, universal life insurance and remaining non-life insurance. 41 Although investment contracts with discretionary participation features (‘DPF’) are financial investments, HSBC continues to account
for them as insurance contracts as permitted by IFRS 4. 42 The Other assets column shows shareholder assets as well as assets and liabilities classified as held for sale. The majority of the assets
for insurance businesses classified as held for sale are reported as ‘Other assets and investment properties’ and totalled US$6.8bn at 31 December 2014 (31 December 2013: nil). The majority of these assets were debt and equity securities. All liabilities for insurance businesses classified as held for sale are reported in ‘Other liabilities’ and totalled US$6.8bn at 31 December 2014 (31 December 2013: nil). The majority of these liabilities were liabilities under insurance contracts and liabilities under investment contracts.
43 Present value of in-force long-term insurance contracts and investment contracts with DPF. 44 Deferred tax includes the deferred tax liabilities arising on recognition of PVIF. 45 Does not include associated insurance company SABB Takaful Company or joint venture insurance company Canara HSBC Oriental
Bank of Commerce Life Insurance Company Limited. 46 HSBC has no insurance manufacturing subsidiaries in the Middle East and North Africa or North America. 47 Comprise unit-linked life insurance contracts and linked long-term investment contracts. 48 Comprise non-linked insurance contracts and non-linked long-term investment contracts. 49 Comprise mainly loans and advances to banks, cash and intercompany balances with other non-insurance legal entities. 50 The cost of guarantees figure presented comprises the modelled cost of guarantees under products manufactured by our insurance
subsidiaries, including both the cost of guarantees reserved for through policyholder liabilities and the amount accounted for as a deduction to PVIF. This is considered to provide more relevant information than the total liabilities to policyholders established for guaranteed products manufactured by our insurance subsidiaries as disclosed in prior periods.
51 A block of contracts in France with guaranteed nominal annual returns in the range 1.25%-3.72% are reported entirely in the 2.1%-4.0% category in line with the average guaranteed return of 2.7% offered to policyholders by these contracts.
52 Real annual return guarantees provide the policyholder a guaranteed return in excess of the rate of inflation, and are supported by inflation-linked debt securities with yields that are also expressed in real terms.
53 Where a –100 basis point parallel shift in the yield curve would result in a negative interest rate, the effects on profit after tax and total equity have been calculated using a minimum rate of 0%.
54 Shareholders’ funds comprise solvency and unencumbered assets. 55 Non-linked insurance includes remaining non-life business. 56 In most cases, policyholders have the option to terminate their contracts at any time and receive the surrender values of their policies.
These may be significantly lower than the amounts shown. 57 Insurance contracts and investment contracts with DPF can give policyholders the contractual right to receive, as a supplement to their
guaranteed benefits, additional benefits that may be a significant portion of the total contractual benefits, but whose amount and timing are determined by HSBC. These additional benefits are contractually based on the performance of a specified pool of contracts or assets, or the profit of the company issuing the contracts.
Pension risk 58 In 2014, option overlay strategies which are expected to improve the risk/return profile of the equity allocation were implemented. 59 Alternative assets includes ABSs, MBSs and infrastructure assets. 60 Whilst there is no target cash allocation, the amount of cash is expected to vary between 0-5% depending upon the liquidity
requirements of the scheme, which will affect the actual allocation of bonds correspondingly.

Report of the Directors: Risk (continued) Appendix to Risk – Policies and practices
HSBC HOLDINGS PLC
204
Appendix to Risk Risk policies and practices This appendix describes the significant policies and practices employed by HSBC in managing our credit risk, liquidity and funding, market risk, operational risk (including compliance risk, legal risk and fiduciary risk), insurance risk, reputational risk, pension risk and sustainability risk.
Risk governance (Unaudited)
Our strong risk governance reflects the importance placed by the Board and the Group Risk Committee (‘GRC’) on shaping the Group’s risk strategy and managing risks effectively. It is supported by a clear policy framework of risk ownership, a risk appetite process through which the types and levels of risk that we are prepared to accept in executing our strategy are articulated and monitored, performance scorecards cascaded from the GMB that align business and risk objectives, and the accountability of all staff for identifying, assessing and managing risks within the scope of their assigned responsibilities. This personal accountability, reinforced by the governance structure, mandatory learning and our approach to remuneration, helps to foster a disciplined and constructive culture of risk management and control throughout HSBC.
The executive and non-executive risk governance structures and their interactions are set out in the following table. Each major operating subsidiary has established a board committee with non-executive responsibility for oversight of risk-related matters and an executive committee with responsibility for risk-related matters.
Governance structure for the management of risk
Authority Membership Responsibilities include: Board Executive and non-executive Directors • Approving risk appetite, strategy and performance targets for the
Group • Approving appointment of chief risk officers of subsidiary
companies • Encouraging a strong risk governance culture which shapes the
Group’s attitude to risk
GRC Independent non-executive Directors • Advising the Board on: – risk appetite and alignment with strategy – alignment of remuneration with risk appetite (through advice
to the Group Remuneration Committee) – risks associated with proposed strategic acquisitions and
disposals • Overseeing high-level risk related matters • Reviewing the effectiveness of the Group’s systems of risk
management and internal controls (other than over financial reporting)
• Overseeing the maintenance and development of a supportive culture in relation to the management of risk
Financial System Vulnerabilities Committee
Non-executive Directors, including the Chairman of the Group Remuneration Committee, and co-opted non-director members
• Overseeing controls and procedures designed to identify areas of exposure to financial crime or system abuse
• Overseeing matters relating to anti-money laundering, sanctions, terrorist financing and proliferation financing
• Reviewing policies and procedures to ensure continuing obligations to regulatory and law enforcement agencies are met
Conduct & Values Committee
Independent non-executive Directors • Ensuring that in the conduct of its business, HSBC treats all stakeholders fairly
• Advising the Board on HSBC policies, procedures and standards to ensure that the Group conducts business responsibly and consistently adheres to the HSBC Values
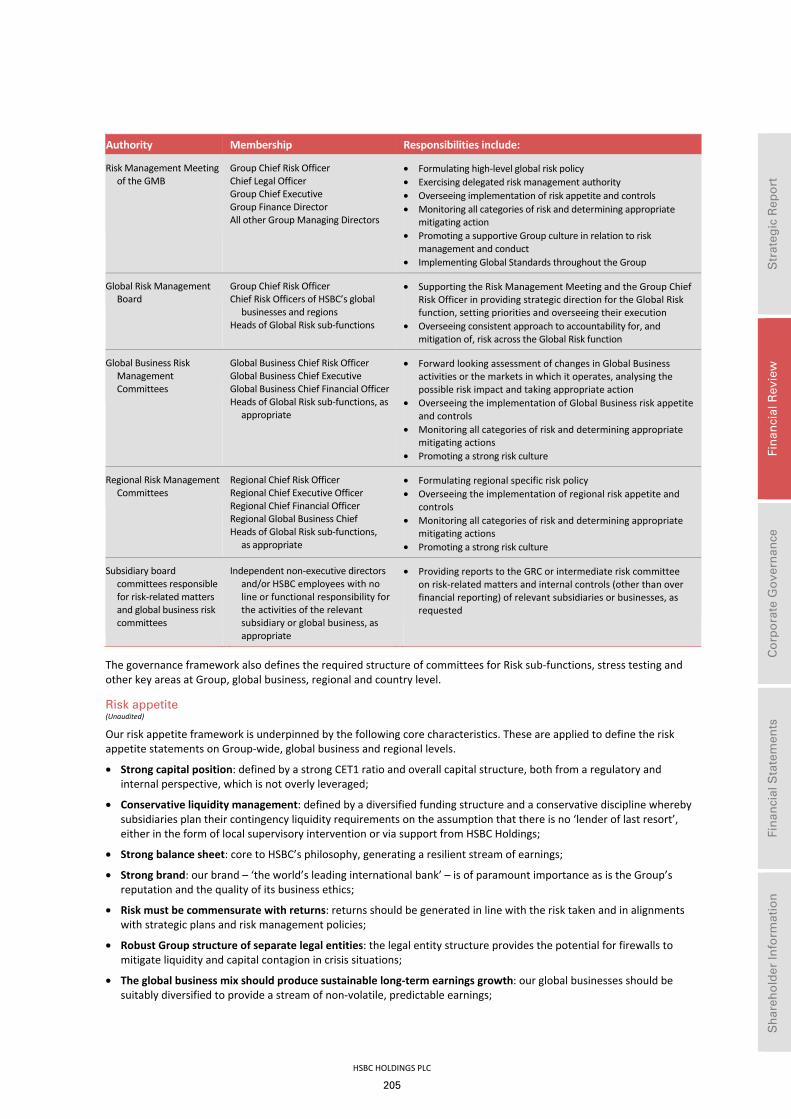
HSBC HOLDINGS PLC
205
Str
ateg
ic R
epo
rt
Fi
nan
cial
Rev
iew
Co
rpo
rate
Go
vern
ance
Fin
anci
al S
tate
men
ts
S
har
eho
lder
Info
rmat
ion
Authority Membership Responsibilities include:
Risk Management Meeting of the GMB
Group Chief Risk OfficerChief Legal Officer Group Chief Executive Group Finance Director All other Group Managing Directors
• Formulating high-level global risk policy • Exercising delegated risk management authority • Overseeing implementation of risk appetite and controls • Monitoring all categories of risk and determining appropriate
mitigating action • Promoting a supportive Group culture in relation to risk
management and conduct • Implementing Global Standards throughout the Group
Global Risk Management Board
Group Chief Risk OfficerChief Risk Officers of HSBC’s global
businesses and regions Heads of Global Risk sub-functions
• Supporting the Risk Management Meeting and the Group Chief Risk Officer in providing strategic direction for the Global Risk function, setting priorities and overseeing their execution
• Overseeing consistent approach to accountability for, and mitigation of, risk across the Global Risk function
Global Business Risk Management Committees
Global Business Chief Risk OfficerGlobal Business Chief Executive Global Business Chief Financial Officer Heads of Global Risk sub-functions, as
appropriate
• Forward looking assessment of changes in Global Business activities or the markets in which it operates, analysing the possible risk impact and taking appropriate action
• Overseeing the implementation of Global Business risk appetite and controls
• Monitoring all categories of risk and determining appropriate mitigating actions
• Promoting a strong risk culture
Regional Risk Management Committees
Regional Chief Risk OfficerRegional Chief Executive Officer Regional Chief Financial Officer Regional Global Business Chief Heads of Global Risk sub-functions,
as appropriate
• Formulating regional specific risk policy • Overseeing the implementation of regional risk appetite and
controls • Monitoring all categories of risk and determining appropriate
mitigating actions • Promoting a strong risk culture
Subsidiary board committees responsible for risk-related matters and global business risk committees
Independent non-executive directors and/or HSBC employees with no line or functional responsibility for the activities of the relevant subsidiary or global business, as appropriate
• Providing reports to the GRC or intermediate risk committee on risk-related matters and internal controls (other than over financial reporting) of relevant subsidiaries or businesses, as requested
The governance framework also defines the required structure of committees for Risk sub-functions, stress testing and other key areas at Group, global business, regional and country level.
Risk appetite (Unaudited)
Our risk appetite framework is underpinned by the following core characteristics. These are applied to define the risk appetite statements on Group-wide, global business and regional levels.
• Strong capital position: defined by a strong CET1 ratio and overall capital structure, both from a regulatory and internal perspective, which is not overly leveraged;
• Conservative liquidity management: defined by a diversified funding structure and a conservative discipline whereby subsidiaries plan their contingency liquidity requirements on the assumption that there is no ‘lender of last resort’, either in the form of local supervisory intervention or via support from HSBC Holdings;
• Strong balance sheet: core to HSBC’s philosophy, generating a resilient stream of earnings;
• Strong brand: our brand – ‘the world’s leading international bank’ – is of paramount importance as is the Group’s reputation and the quality of its business ethics;
• Risk must be commensurate with returns: returns should be generated in line with the risk taken and in alignments with strategic plans and risk management policies;
• Robust Group structure of separate legal entities: the legal entity structure provides the potential for firewalls to mitigate liquidity and capital contagion in crisis situations;
• The global business mix should produce sustainable long-term earnings growth: our global businesses should be suitably diversified to provide a stream of non-volatile, predictable earnings;

Report of the Directors: Risk (continued) Appendix to Risk – Policies and practices
HSBC HOLDINGS PLC
206
• Risk diversification: the globally diverse nature of our activities produces significant risk diversification benefits which must be closely assessed on an ongoing basis and reflected in our capital requirements; and
• Financial crime risk: our overarching approach and appetite to financial crime risk is that the Group will not tolerate operating without systems and controls in place aimed at preventing and detecting financial crime and will not conduct business with individuals or entities we believe are engaged in illicit behaviour.
Credit risk
Credit risk management (Audited)
The role of an independent credit control unit is fulfilled by the Global Risk function. Credit approval authorities are delegated by the Board to certain executive officers of HSBC Holdings. Similar credit approval authorities are delegated by the boards of subsidiary companies to executive officers of the relevant subsidiaries. In each major subsidiary, a Chief Risk Officer reports to the local Chief Executive Officer on credit-related issues, while maintaining a direct functional reporting line to the Group Chief Risk Officer in Global Risk. Details of the roles and responsibilities of the credit risk management function and the policies and procedures for managing credit risk are set out below. There were no significant changes in 2014.
The high-level oversight and management of credit risk provided globally by the Credit Risk function in Global Risk
• to formulate Group credit policy. Compliance, subject to approved dispensations, is mandatory for all operating companies which must develop local credit policies consistent with Group policies;
• to guide operating companies on our appetite for credit risk exposure to specified market sectors, activities and banking products and controlling exposures to certain higher-risk sectors;
• to undertake an independent review and objective assessment of risk. Global Risk assesses all commercial non-bank credit facilities and exposures over designated limits, prior to the facilities being committed to customers or transactions being undertaken;
• to monitor the performance and management of portfolios across the Group;
• to control exposure to sovereign entities, banks and other financial institutions, as well as debt securities which are not held solely for the purpose of trading;
• to set Group policy on large credit exposures, ensuring that concentrations of exposure by counterparty, sector or geography do not become excessive in relation to our capital base, and remain within internal and regulatory limits;
• to control our cross-border exposures (see page 207);
• to maintain and develop our risk rating framework and systems, the governance of which is under the general oversight of the Group Model Oversight Committee (‘MOC’). The Group MOC meets bi-monthly and reports to the Risk Management Meeting. It is chaired by the risk function and its membership is drawn from Global Risk and relevant global functions or businesses;
• to report to the Risk Management Meeting, the GRC and the Board on high risk portfolios, risk concentrations, country limits and cross-border exposures, large impaired accounts, impairment allowances, stress testing results and recommendations and retail portfolio performance; and
• to act on behalf of HSBC Holdings as the primary interface, for credit-related issues, with the Bank of England, the PRA, local regulators, rating agencies, analysts and counterparts in major banks and non-bank financial institutions.
Principal objectives of our credit risk management
• to maintain across HSBC a strong culture of responsible lending and a robust risk policy and control framework;
• to both partner and challenge our businesses in defining, implementing and continually re-evaluating our risk appetite under actual and scenario conditions; and
• to ensure there is independent, expert scrutiny of credit risks, their costs and their mitigation.
Concentration of exposure (Audited)
Concentrations of credit risk arise when a number of counterparties or exposures have comparable economic characteristics or such counterparties are engaged in similar activities or operate in the same geographical areas or industry sectors so that their collective ability to meet contractual obligations is uniformly affected by changes in economic, political or other conditions. We use a number of controls and measures to minimise undue concentration of exposure in our portfolios across industry, country and global business. These include portfolio and counterparty limits, approval and review controls, and stress testing.
Wrong-way risk occurs when a counterparty’s exposures are adversely correlated with its credit quality. There are two types of wrong-way risk:
• general wrong-way risk occurs when the probability of counterparty default is positively correlated with general risk factors such as, for example, where the counterparty is resident and/or incorporated in a higher-risk country and seeks to sell a non-domestic currency in exchange for its home currency; and

HSBC HOLDINGS PLC
207
Str
ateg
ic R
epo
rt
Fi
nan
cial
Rev
iew
Co
rpo
rate
Go
vern
ance
Fin
anci
al S
tate
men
ts
S
har
eho
lder
Info
rmat
ion
• specific wrong-way risk occurs when the exposure to a particular counterparty is positively correlated with the probability of counterparty default, such as a reverse repo on the counterparty’s own bonds. It is HSBC policy that specific wrong-way transactions are approved on a case-by-case basis.
We use a range of tools to monitor and control wrong-way risk, including requiring the business to obtain prior approval before undertaking wrong-way risk transactions outside pre-agreed guidelines.
Cross-border exposures
We assess the vulnerability of countries to foreign currency payment restrictions, including economic and political factors, when considering impairment allowances on cross-border exposures. Impairment allowances are assessed in respect of all qualifying exposures within vulnerable countries unless these exposures and the inherent risks are:
• performing, trade-related and of less than one year’s maturity; • mitigated by acceptable security cover which is, other than in exceptional cases, held outside the country concerned; • in the form of securities held for trading purposes for which a liquid and active market exists, and which are measured
at fair value daily; and • performing facilities with a principal (excluding security) of US$1m or below and/or with maturity dates shorter than
three months.
Credit quality of financial instruments (Audited)
Our credit risk rating systems and processes differentiate exposures in order to highlight those with greater risk factors and higher potential severity of loss. In the case of individually significant accounts that are predominantly within our wholesale businesses, risk ratings are reviewed regularly and any amendments are implemented promptly. Within our retail businesses, risk is assessed and managed using a wide range of risk and pricing models to generate portfolio data.
Our risk rating system facilitates the internal ratings – based approach under the Basel framework adopted by the Group to support calculation of our minimum credit regulatory capital requirement. Our credit quality classifications are defined below.
Special attention is paid to problem exposures in order to accelerate remedial action. When appropriate, our operating companies use specialist units to provide customers with support to help them avoid default wherever possible.
Group and regional Credit Review and Risk Identification teams regularly review exposures and processes in order to provide an independent, rigorous assessment of credit risk across the Group, reinforce secondary risk management controls and share best practice. Internal audit, as a tertiary control function, focuses on risks with a global perspective and on the design and effectiveness of primary and secondary controls, carrying out oversight audits via the sampling of global and regional control frameworks, themed audits of key or emerging risks and project audits to assess major change initiatives.
The five credit quality classifications defined below each encompass a range of granular internal credit rating grades assigned to wholesale and retail lending businesses and the external ratings attributed by external agencies to debt securities.
Credit quality classification (Unaudited) Debt securities
and other bills Wholesale lending
and derivatives Retail lending
External credit rating
Internal credit rating
12 month probability of default %
Internal credit rating1
Expected loss %
Quality classification Strong A– and above CRR21 to CRR2 0 – 0.169 EL31 to EL2 0 – 0.999Good BBB+ to BBB– CRR3 0.170 – 0.740 EL3 1.000 – 4.999Satisfactory BB+ to B and
unrated
CRR4 to CRR5 0.741 – 4.914 EL4 to EL5 5.000 – 19.999 Sub-standard B- to C CRR6 to CRR8 4.915 – 99.999 EL6 to EL8 20.000 – 99.999Impaired Default CRR9 to CRR10 100 EL9 to EL10 100+ or defaulted4
1 We observe the disclosure convention that, in addition to those classified as EL9 to EL10, retail accounts classified EL1 to EL8 that are delinquent by 90 days or more are considered impaired, unless individually they have been assessed as not impaired (see page 136, ‘Past due but not impaired gross financial instruments’).
2 Customer risk rating. 3 Expected loss. 4 The EL percentage is derived through a combination of PD and LGD, and may exceed 100% in circumstances where the LGD is above 100%
reflecting the cost of recoveries.

Report of the Directors: Risk (continued) Appendix to Risk – Policies and practices
HSBC HOLDINGS PLC
208
Quality classification definitions
• ‘Strong’ exposures demonstrate a strong capacity to meet financial commitments, with negligible or low probability of default and/or low levels of expected loss. Retail accounts operate within product parameters and only exceptionally show any period of delinquency.
• ‘Good’ exposures require closer monitoring and demonstrate a good capacity to meet financial commitments, with low default risk. Retail accounts typically show only short periods of delinquency, with any losses expected to be minimal following the adoption of recovery processes.
• ‘Satisfactory’ exposures require closer monitoring and demonstrate an average to fair capacity to meet financial commitments, with moderate default risk. Retail accounts typically show only short periods of delinquency, with any losses expected to be minor following the adoption of recovery processes.
• ‘Sub-standard’ exposures require varying degrees of special attention and default risk is of greater concern. Retail portfolio segments show longer delinquency periods of generally up to 90 days past due and/or expected losses are higher due to a reduced ability to mitigate these through security realisation or other recovery processes.
• ‘Impaired’ exposures have been assessed as impaired. These include wholesale exposures where the bank considers that either the customer is unlikely to pay its credit obligations in full, without recourse by the bank to the actions such as realising security if held, or the customer is past due more than 90 days on any material credit obligation; retail accounts include loans and advances classified as EL9 to EL10, and for those classified EL1 to EL8 they are greater than 90 days past due unless individually they have been assessed as not impaired; and renegotiated loans that have met the requirements to be disclosed as impaired and have not yet met the criteria to be returned to the unimpaired portfolio (see below).
The customer risk rating (‘CRR’) 10-grade scale summarises a more granular underlying 23-grade scale of obligor probability of default (‘PD’). All HSBC customers are rated using the 10 or 23-grade scale, depending on the degree of sophistication of the Basel II approach adopted for the exposure.
Each CRR band is associated with an external rating grade by reference to long-run default rates for that grade, represented by the average of issuer-weighted historical default rates. This mapping between internal and external ratings is indicative and may vary over time.
The expected loss (‘EL’) 10-grade scale for retail business summarises a more granular underlying EL scale for this customer segment; this combines obligor and facility/product risk factors in a composite measure.
For debt securities and certain other financial instruments, external ratings have been aligned to the five quality classifications based upon the mapping of related CRR to external credit grade. The most recent mapping review resulted in ‘B‘ being mapped to CRR5. Accordingly ‘B‘ ratings are now mapped to ‘Satisfactory’. This represents a change in disclosure mapping unrelated to changes in counterparty creditworthiness.
Renegotiated loans and forbearance (Audited)
A range of forbearance strategies is employed in order to improve the management of customer relationships, maximise collection opportunities and, if possible, avoid default, foreclosure or repossession. They include extended payment terms, a reduction in interest or principal repayments, approved external debt management plans, debt consolidations, the deferral of foreclosures and other forms of loan modifications and re-ageing.
Our policies and practices are based on criteria which enable local management to judge whether repayment is likely to continue. These typically provide a customer with terms and conditions that are more favourable than those provided initially. Loan forbearance is only granted in situations where the customer has showed a willingness to repay their loan and is expected to be able to meet the revised obligations.
Identifying renegotiated loans
The contractual terms of a loan may be modified for a number of reasons including changing market conditions, customer retention and other factors not related to the current or potential credit deterioration of a customer. When the contractual payment terms of a loan are modified because we have significant concerns about the borrower’s ability to meet contractual payments when due, these loans are classified as ‘renegotiated loans’.
For retail lending our credit risk management policy sets out restrictions on the number and frequency of renegotiations, the minimum period an account must have been opened before any renegotiation can be considered and the number of qualifying payments that must be received. The application of this policy varies according to the nature of the market, the product and the management of customer relationships through the occurrence of exceptional events. When considering whether there is significant concern regarding a customer’s ability to meet contractual loan repayments when due, we assess the customer’s delinquency status, account behaviour, repayment history, current financial situation and continued ability to repay. If the customer is not meeting contractual repayments or it is evident that they will be unable to do so without the renegotiation, there will be a significant concern regarding their ability to meet contractual payments, and the loan will be disclosed as impaired, unless the concession granted is insignificant as discussed below.

HSBC HOLDINGS PLC
209
Str
ateg
ic R
epo
rt
Fi
nan
cial
Rev
iew
Co
rpo
rate
Go
vern
ance
Fin
anci
al S
tate
men
ts
S
har
eho
lder
Info
rmat
ion
For loan restructurings in wholesale lending, indicators of significant concerns regarding a borrower’s ability to pay include:
• the debtor is currently in default on any of its debt; • the debtor has declared or is in the process of declaring bankruptcy or entering into a similar process; • there is significant doubt as to whether the debtor will continue to be a going concern; • currently, the debtor has securities that have been delisted, are in the process of being delisted, or are under threat of
being delisted from an exchange as a result of trading or financial difficulties; • based on estimates and projections that only encompass current business capabilities, the Group forecasts that
the debtor’s entity-specific cash flows will be insufficient to service the debt (both interest and principal) in accordance with the contractual terms of the existing agreement through maturity. In this instance, actual payment default may not yet have occurred; and
• absent the modification, the debtor cannot obtain funds from sources other than its existing creditors at an effective interest rate equal to the current market interest rate for similar debt for a non-distressed debtor.
Where the modification of a loan’s contractual payment terms represents a concession for economic or legal reasons relating to the borrower’s financial difficulty, and is a concession that we would not otherwise consider, then the renegotiated loan is disclosed as impaired in accordance with our impaired loan disclosure convention described in more detail on page 212, unless the concession is insignificant and there are no other indicators of impairment. Insignificant concessions are primarily restricted to our CML portfolio in HSBC Finance, where loans which are in the early stages of delinquency (less than 60 days delinquent) and typically have the equivalent of two payments deferred for the first time, are excluded from our impaired loan classification, as the contractual payment deferrals are deemed to be insignificant compared with payments due on the loan as a whole. For details of HSBC Finance’s loan renegotiation programmes and portfolios, see pages 154 and 155.
Credit quality classification of renegotiated loans (Audited)
Under IFRSs, an entity is required to assess whether there is objective evidence that financial assets are impaired at the end of each reporting period. A loan is impaired and an impairment allowance is recognised when there is objective evidence of a loss event that has an effect on the cash flows of the loan which can be reliably estimated. Granting a concession to a customer that we would not otherwise consider, as a result of their financial difficulty, is objective evidence of impairment and impairment losses are measured accordingly.
A renegotiated loan is presented as impaired when:
• there has been a change in contractual cash flows as a result of a concession which the lender would otherwise not consider, and
• it is probable that without the concession, the borrower would be unable to meet contractual payment obligations in full.
This presentation applies unless the concession is insignificant and there are no other indicators of impairment.
The renegotiated loan will continue to be disclosed as impaired until there is sufficient evidence to demonstrate a significant reduction in the risk of non-payment of future cash flows, and there are no other indicators of impairment. For loans that are assessed for impairment on a collective basis, the evidence typically comprises a history of payment performance against the original or revised terms, as appropriate to the circumstances. For loans that are assessed for impairment on an individual basis, all available evidence is assessed on a case-by-case basis.
For retail lending the minimum period of payment performance required depends on the nature of loans in the portfolio, but is typically not less than six months. Where portfolios have more significant levels of forbearance activity, such as that undertaken by HSBC Finance, the minimum repayment performance period required may be substantially more (for further details on HSBC Finance see page 153). Payment performance periods are monitored to ensure they remain appropriate to the levels of recidivism observed within the portfolio. These performance periods are in addition to a minimum of two payments which must be received within a 60-day period for the customer to initially qualify for the renegotiation (in the case of HSBC Finance, in certain circumstances, for example where debt has been restructured in bankruptcy proceedings, fewer or no qualifying payments may be required). The qualifying payments are required in order to demonstrate that the renegotiated terms are sustainable for the borrower. For corporate and commercial loans, which are individually assessed for impairment and where non-monthly payments are more commonly agreed, the history of payment performance will depend on the underlying structure of payments agreed as part of the restructuring.
Renegotiated loans are classified as unimpaired where the renegotiation has resulted from significant concern about a borrower’s ability to meet their contractual payment terms but the renegotiated terms are based on current market rates and contractual cash flows are expected to be collected in full following the renegotiation. Unimpaired renegotiated loans also include previously impaired renegotiated loans that have demonstrated satisfactory performance over a period of time or have been assessed based on all available evidence as having no remaining indicators of impairment.
Report of the Directors: Risk (continued) Appendix to Risk – Policies and practices
HSBC HOLDINGS PLC
210
Loans that have been identified as renegotiated retain this designation until maturity or derecognition. When a loan is restructured as part of a forbearance strategy and the restructuring results in derecognition of the existing loan, such as in some debt consolidations, the new loan is disclosed as renegotiated.
When determining whether a loan that is restructured should be derecognised and a new loan recognised, we consider the extent to which the changes to the original contractual terms result in the renegotiated loan, considered as a whole, being a substantially different financial instrument. The following are examples of circumstances that, individually or in aggregate, are likely to result in this test being met and derecognition accounting being applied:
• an uncollateralised loan becomes fully collateralised; • the addition or removal of cross-collateralisation provisions; • removal or addition of conversion features attached to the loan agreement; • a change in the currency in which the principal or interest is denominated; • a change in the liquidation preference or ranking of the instrument; or • the contract is altered in any other manner so that the terms under the new or modified contract are substantially
different from those under the original contract.
The following are examples of factors that we consider may indicate that the revised loan is a substantially different financial instrument, but are unlikely to be conclusive in themselves:
• changes in guarantees or loan covenants provided; • less significant changes to collateral arrangements; or • the addition of repayment provisions or prepayment premium clauses.
Renegotiated loans and recognition of impairment allowances (Audited)
For retail lending, renegotiated loans are segregated from other parts of the loan portfolio for collective impairment assessment to reflect the higher rates of losses often encountered in these segments. When empirical evidence indicates an increased propensity to default and higher losses on such accounts, such as for re-aged loans in the US, the use of roll-rate methodology ensures these factors are taken into account when calculating impairment allowances by applying roll rates specifically calculated on the pool of loans subject to forbearance. When the portfolio size is small or when information is insufficient or not reliable enough to adopt a roll-rate methodology, a basic formulaic approach based on historical loss rate experience is used. As a result of our roll-rate methodology, we recognise collective impairment allowances on homogeneous groups of loans, including renegotiated loans, where there is historical evidence that there is a likelihood that loans in these groups will progress through the various stages of delinquency, and ultimately prove irrecoverable as a result of events occurring before the balance sheet date. This treatment applies irrespective of whether or not those loans are presented as impaired in accordance with our impaired loans disclosure convention. When we consider that there are additional risk factors inherent in the portfolios that may not be fully reflected in the statistical roll rates or historical experience, these risk factors are taken into account by adjusting the impairment allowances derived solely from statistical or historical experience. For further details of the risk factor adjustments see Note 1k on the Financial Statements.
In the corporate and commercial sectors, renegotiated loans are typically assessed individually. Credit risk ratings are intrinsic to the impairment assessment. A distressed restructuring is classified as an impaired loan. The individual impairment assessment takes into account the higher risk of the non-payment of future cash flows inherent in renegotiated loans.
Corporate and commercial forbearance (Unaudited)
In the corporate and commercial sectors, forbearance activity is undertaken selectively where it has been identified that repayment difficulties against the original terms have already materialised, or are very likely to materialise. These cases are treated as impaired loans where:
• the customer is experiencing, or is very likely to experience, difficulty in meeting a payment obligation to the Group (i.e. due to current credit distress); and
• the Group is offering to the customer revised payment arrangements which constitute a concession (i.e. it is offering terms it would not normally be prepared to offer).
These cases are described as distressed restructurings. The agreement of a restructuring which meets the criteria above requires all loans, advances and counterparty exposures to the customer to be treated as impaired. Against the background of this requirement, as a customer approaches the point at which it becomes clear that there is an increasing risk that a restructuring of this kind might be necessary, the exposures will typically be regarded as sub-standard to reflect the deteriorating credit risk profile and will be graded as impaired when the restructure is proposed for approval, or sooner if there is sufficient concern regarding the customer’s likeliness to pay.

HSBC HOLDINGS PLC
211
Str
ateg
ic R
epo
rt
Fi
nan
cial
Rev
iew
Co
rpo
rate
Go
vern
ance
Fin
anci
al S
tate
men
ts
S
har
eho
lder
Info
rmat
ion
For the purposes of determining whether changes to a customer’s agreement should be treated as a distressed restructuring the following types of modification are regarded as concessionary:
• transfers from the customer of receivables from third parties, real estate, or other assets to satisfy fully or partially a debt;
• issuance or other granting of an equity interest to satisfy fully or partially a debt unless the equity interest is granted pursuant to existing terms for converting the debt into an equity interest; and
• modification of the terms of a debt, such as one or more of the following:
– reduction (absolute or contingent) of the stated interest rate for the remaining original life of the debt; – extension of the maturity date or dates at a stated interest rate lower than the current market rate for new debt
with similar risk; – reduction (absolute or contingent) of the face amount or maturity amount of the debt; and – reduction (absolute or contingent) of accrued interest.
Modifications that are unrelated to payment arrangements, such as the restructuring of collateral or security arrangements or the waiver of rights under covenants within documentation, are not regarded by themselves to be evidence of credit distress affecting payment capacity. Typically, covenants are in place to give the Group rights of repricing or acceleration, but they are frequently set at levels where payment capacity has yet to be affected, providing rights of action at earlier stages of credit deterioration. Such concessions do not directly affect the customer’s ability to service the original contractual debt and are not reported as renegotiated loans. However, where a customer requests a non-payment related covenant waiver, the significance of the underlying breach of covenant will be considered together with any other indicators of impairment, and where there is a degree of severity of credit distress indicating uncertainty of payment, all available evidence will be considered in determining whether a loss event has occurred. The waiver will not, however, trigger classification as a renegotiated loan as payment terms have not been modified.
When both payment-related and non-payment related modifications are made together as a result of significant concerns regarding the payment of contractual cash flows, the loan is treated as a distressed restructuring and disclosed as a renegotiated loan.
Within corporate and commercial business segments, modifications of several kinds are frequently agreed for a customer contemporaneously. Transfer to an interest-only arrangement is the most common type of modification granted in the UK, whether in isolation or in combination with other concessions. Throughout the rest of the world, term extensions occur more frequently with other types of concession such as interest rate changes occurring less often.
In assessing whether payment-related forbearance is a satisfactory and sustainable strategy, the customer’s entire exposure and facilities will be reviewed and their ability to meet the terms of both the revised obligation and other credit facilities not amended in the renegotiation is assessed. Should this assessment identify that a renegotiation will not deal with a customer’s payment capacity issues satisfactorily, other special management options may be applied. This process may identify the need to provide assistance to a customer specifically to restructure their business operations and activities so as to restore satisfactory payment capacity.
When considering acceptable restructuring terms we consider the ability of the customer to be able to service the revised interest payments as a necessity. When principal payment modifications are considered, again we require the customer to be able to comply with the revised terms as a necessary pre-condition for the restructuring to proceed. When principal payments are modified resulting in permanent forgiveness, or when it is otherwise considered that there is no longer a realistic prospect of recovery of outstanding principal, the affected balances are written off. When principal repayments are postponed, it is expected that the customer will be capable of paying in line with the renegotiated terms, including instances when the postponed principal repayment is expected from refinancing. In all cases, a loan renegotiation is only granted when the customer is expected to be able to meet the revised terms.
Modifications may be made on a temporary basis when time is needed for the customer to make arrangements for payment, when deterioration in payment capacity is expected to be acute but short lived, or when more time is needed to accommodate discussions regarding a more permanent accommodation with other bankers, for example in syndicated facilities where multilateral negotiation commonly features.
If a restructuring proceeds and the customer demonstrates satisfactory performance over a period of time, the case may be returned to a non-impaired grade (CRR1-8) provided no other indicators of impairment remain. Such a case cannot be returned to a non-impaired grade when a specific impairment allowance remains against any of the customer’s credit facilities. The period of performance will vary depending on the frequency of payments to be made by the customer under the amended agreement and the extent to which the customer’s financial position is considered to have improved.

Report of the Directors: Risk (continued) Appendix to Risk – Policies and practices
HSBC HOLDINGS PLC
212
Impairment assessment (Audited)
It is our policy that each operating company in HSBC creates impairment allowances for impaired loans promptly and appropriately, when there is objective evidence that impairment of a loan or portfolio of loans has occurred.
For details of our impairment policies on loans and advances and financial investments, see Note 1k on the Financial Statements.
Impairment and credit risk mitigation
The existence of collateral has an effect when calculating impairment on individually assessed impaired loans. When we no longer expect to recover the principal and interest due on a loan in full or in accordance with the original terms and conditions, it is assessed for impairment. If exposures are secured, the current net realisable value of the collateral will be taken into account when assessing the need for an impairment allowance. No impairment allowance is recognised in cases where all amounts due are expected to be settled in full on realisation of the security.
Personal lending portfolios are generally assessed for impairment on a collective basis as the portfolios typically consist of large groups of homogeneous loans. Two methods are used to calculate allowances on a collective basis: a roll-rate methodology or a more basic formulaic approach based on historical losses. In 2014, we reviewed the impairment allowance methodology used for retail banking and small business portfolios across the Group to ensure that the assumptions used in our collective assessment models continued to appropriately reflect the period of time between a loss event occurring and the account proceeding to delinquency and eventual write-off.
• The historical loss methodology is typically used to calculate collective impairment allowances for secured or low default portfolios such as mortgages until the point at which they are individually identified and assessed as impaired. For loans which are collectively assessed using historical loss methodology, the historical loss rate is derived from the average contractual write-off net of recoveries over a defined period. The net contractual write-off rate is the actual amount of loss experienced after the realisation of collateral and receipt of recoveries.
• A roll-rate methodology is more commonly adopted for unsecured portfolios when there are sufficient volumes of empirical data to develop robust statistical models. In certain circumstances mortgage portfolios have a statistically significant number of defaults and losses available, enabling reliable roll rates to be generated. In these cases a roll-rate methodology is applied until the point at which the loans are individually identified and assessed as impaired, and the average loss rate for each delinquency bucket is adjusted to reflect the average loss expected following realisation of security and receipt of recoveries. The average loss expected is derived from average historical collateral realisation values.
The nature of the collective allowance assessment prevents individual collateral values or LTV ratios from being included within the calculation. However, the loss rates used in the collective assessment are adjusted for the collateral realisation experiences which will vary depending on the LTV composition of the portfolio. For example, mortgage portfolios under a historical loss rate methodology with lower LTV ratios will typically experience lower loss history and consequently a lower net contractual write-off rate.
For wholesale collectively assessed loans, historical loss methodologies are applied to measure loss event impairments which have been incurred but not reported. Loss rates are derived from the observed contractual write-off net of recoveries over a defined period, typically no less than 60 months. The net contractual write-off rate is the actual or expected amount of loss experienced after realisation of collateral and receipt of recoveries. These historical loss rates are adjusted by an economic factor which amends the historical averages to better represent current economic conditions affecting the portfolio. In order to reflect the likelihood of a loss event not being identified and assessed an emergence period assumption is applied which reflects the period between a loss occurring and its identification. The emergence period is estimated by management for each identified portfolio. The factors that may influence this estimation include economic and market conditions, customer behaviour, portfolio management information, credit management techniques and collection and recovery experiences in the market. The emergence period is assessed empirically on a periodic basis and may vary over time as these factors change.
Write-off of loans and advances (Audited)
For details of our policy on the write-off of loans and advances, see Note 1k on the Financial Statements.
In HSBC Finance, the carrying amounts of residential mortgage and second lien loans in excess of net realisable value are written off at or before the time foreclosure is completed or settlement is reached with the borrower. If there is no reasonable expectation of recovery, and foreclosure is pursued, the loan is normally written off no later than the end of the month in which the loan becomes 180 days contractually past due. We regularly obtain new appraisals for these collateral dependent loans (every 180 days) and adjust carrying values to the most recent appraisal if they have improved or deteriorated as the best estimate of the cash flows that will be received on the disposal of the collateral.
Unsecured personal facilities, including credit cards, are generally written off at between 150 and 210 days past due, the standard period being the end of the month in which the account becomes 180 days contractually delinquent. Write-off

HSBC HOLDINGS PLC
213
Str
ateg
ic R
epo
rt
Fi
nan
cial
Rev
iew
Co
rpo
rate
Go
vern
ance
Fin
anci
al S
tate
men
ts
S
har
eho
lder
Info
rmat
ion
periods may be extended, generally to no more than 360 days past due but, in very exceptional circumstances, to longer than that figure in a few countries where local regulation or legislation constrain earlier write-off or where the realisation of collateral for secured real estate lending takes this time.
In retail lending, final write-off should occur within 60 months of the default at the latest.
In the event of bankruptcy or analogous proceedings, write-off may occur earlier than at the periods stated above. Collections procedures may continue after write-off.
Impairment methodologies (Audited)
To identify objective evidence of impairment for available-for-sale ABSs, an industry standard valuation model is normally applied which uses data with reference to the underlying asset pools and models their projected future cash flows. The estimated future cash flows of the securities are assessed at the specific financial asset level to determine whether any of them are unlikely to be recovered as a result of loss events occurring on or before the reporting date.
The principal assumptions and inputs to the models are typically the delinquency status of the underlying loans, the probability of delinquent loans progressing to default, the prepayment profiles of the underlying assets and the loss severity in the event of default. However, the models utilise other variables relevant to specific classes of collateral to forecast future defaults and recovery rates. Management uses externally available data and applies judgement when determining the appropriate assumptions in respect of these factors. We use a modelling approach which incorporates historically observed progression rates to default to determine if the decline in aggregate projected cash flows from the underlying collateral will lead to a shortfall in contractual cash flows. In such cases, the security is considered to be impaired.
In respect of CDOs, expected future cash flows for the underlying collateral are assessed to determine whether there is likely to be a shortfall in the contractual cash flows of the CDO.
When a security benefits from a contract provided by a monoline insurer that insures payments of principal and interest, the expected recovery on the contract is assessed in determining the total expected credit support available to the ABS.
Loan Management Unit (Unaudited)
The HSBC Loan Management Unit (‘LMU’) is a front line customer contact department within Wholesale Credit and Market Risk that assumes responsibility for managing business customer relationships requiring intensive and close control where the bank's lending is at risk. LMU operates on a regional basis across the Group and is independent of the originating business management units. It reports locally to the chief credit officer position. Customers are identified and transferred to LMU by business management or the Wholesale Credit and Market Risk approval teams.
Customers managed by LMU are normally operating outside the Group’s risk appetite. They typically show symptoms of significant financial difficulty, the management team displays limited experience of managing a business in distress and the management and financial information provided to the bank is insufficient and unreliable.
The levels of customer exposure under management and the size of the LMU team varies between countries depending on the breadth of business undertaken locally but LMU will always manage highly distressed situations where individual customer exposure exceeds US$1.5m.
The primary focus of LMU is to protect the bank's capital and minimise losses by working consensually with customers to promote and support viable recovery strategies wherever achievable, with the ultimate intention of returning the customer to front line relationship management. In some cases, rehabilitation is not possible and LMU will consider a range of options to protect the bank's exposure and solvency of the customer. On occasion, it is not possible to find a satisfactory solution and the customer may file for insolvency or local equivalent. In all outcomes, LMU seeks to treat customers fairly, sympathetically and positively, in a professional way with transparent processes and procedures.
Remediation and restructuring strategies available in the business and LMU include granting a customer various types of concessions while seeking to enhance the ability of the customer to ultimately repay the Group which could include enhancing the overall security available to the bank. Any decision to approve a concession will be a function of the region's specific country and sector appetite, the key metrics of the customer, the market environment, the loan structure and security. Internal reviews on customers managed directly by LMU are performed on a scheduled basis in accordance with relevant accounting guidelines, credit policies and national banking regulations. Under certain circumstances, concessions granted may result in the loan being classified as a renegotiated loan.
Collateral and other credit enhancements held (Audited)
Loans and advances held at amortised cost
The Group’s practice is to lend on the basis of customers’ ability to meet their obligations out of cash flow resources rather than rely on the value of security offered. Depending on a customer’s standing and the type of product, facilities may be provided without security. For other lending, a charge over collateral is obtained and considered in determining the credit decision and pricing. In the event of default, the bank may utilise the collateral as a source of repayment.

Report of the Directors: Risk (continued) Appendix to Risk – Policies and practices
HSBC HOLDINGS PLC
214
Depending on its form, collateral can have a significant financial effect in mitigating our exposure to credit risk.
Additionally, risk may be managed by employing other types of collateral and credit risk enhancements such as second charges, other liens and unsupported guarantees, but the valuation of such mitigants is less certain and their financial effect has not been quantified.
Refinance risk (Audited)
Many types of lending require the repayment of a significant proportion of the principal at maturity. Typically, the mechanism of repayment for the customer is through the acquisition of a new loan to settle the existing debt. Refinance risk arises where a customer is unable to repay such term debt on maturity, or to refinance debt at commercial rates. When there is evidence that this risk may apply to a specific contract, HSBC may need to refinance the loan on concessionary terms that it would not otherwise have considered, in order to recoup the maximum possible cash flows from the contract and potentially avoid the customer defaulting on the repayment of principal. When there is sufficient evidence that borrowers, based on their current financial capabilities, may fail at maturity to repay or refinance their loans, these loans are disclosed as impaired with recognition of a corresponding impairment allowance where appropriate.
Nature of HSBC’s securitisation and other structured exposures (Audited)
Mortgage-backed securities (‘MBS’s) are securities that represent interests in groups of mortgages and provide investors with the right to receive cash from future mortgage payments (interest and/or principal). An MBS which references mortgages with different risk profiles is classified according to the highest risk class.
Collateralised debt obligations (‘CDO’s) are securities backed by a pool of bonds, loans or other assets such as asset-backed securities (‘ABS’s). CDOs may include exposure to sub-prime or Alt-A mortgage assets where these are part of the underlying assets or reference assets. As there is often uncertainty surrounding the precise nature of the underlying collateral supporting CDOs, all CDOs supported by residential mortgage-related assets are classified as sub-prime. Our holdings of ABSs and CDOs and direct lending positions, and the categories of mortgage collateral and lending activity, are described overleaf.
Our exposure to non-residential mortgage-related ABSs includes securities with collateral relating to commercial property mortgages, leveraged finance loans, student loans, and other assets such as securities with other receivable-related collateral.
Definitions and classifications of ABSs and CDOs
Categories of ABSs and CDOs Definition Classification
Sub-prime Loans to customers who have limited credit histories, modest incomes or high debt-to-income ratios or have experienced credit problems caused by occasional delinquencies, prior charge-offs, bankruptcy or other credit-related actions.
For US mortgages, a FICO score of 620 or less has primarily been used to determine whether a loan is sub-prime. For non-US mortgages, management judgement is used.
US Home Equity Lines of Credit (‘HELoC’s) (categorised within ‘Sub-prime’)
A form of revolving credit facility provided to customers, which is supported in the majority of circumstances by a second lien or lower ranking charge over residential property.
Holdings of HELoCs are classified as sub-prime.
US Alt-A Lower risk loans than sub-prime, but they share higher risk characteristics than lending under fully conforming standard criteria.
US credit scores and the completeness of documentation held (such as proof of income), are considered when determining whether an Alt-A classification is appropriate. Non sub-prime mortgages in the US are classified as Alt-A if they are not eligible for sale to the major US Government mortgage agencies or sponsored entities.
US Government agency and sponsored enterprises mortgage-related assets
Securities that are guaranteed by US Government agencies such as the Government National Mortgage Association (‘Ginnie Mae’), or by US Government sponsored entities including Fannie Mae and Freddie Mac.
Holdings of US Government agency and US Government sponsored enterprises’ mortgage-related assets are classified as prime exposures.

HSBC HOLDINGS PLC
215
Str
ateg
ic R
epo
rt
Fi
nan
cial
Rev
iew
Co
rpo
rate
Go
vern
ance
Fin
anci
al S
tate
men
ts
S
har
eho
lder
Info
rmat
ion
Categories of ABSs and CDOs Definition Classification
UK non-conforming mortgages (categorised within ‘Sub-prime’)
UK mortgages that do not meet normal lending criteria. Examples include mortgages where the expected level of documentation is not provided (such as income with self-certification), or where poor credit history increases risk and results in pricing at a higher than normal lending rate.
UK non-conforming mortgages are treated as sub-prime exposures.
Other residential mortgages
Residential mortgages, including prime mortgages, that do not meet any of the classifications described above.
Prime residential mortgage-related assets are included in this category.
Liquidity and funding (Audited)
The management of liquidity and funding is primarily undertaken locally (by country) in our operating entities in compliance with the Group’s liquidity and funding risk management framework (the ‘LFRF’), and with practices and limits set by the GMB through the Risk Management Meeting and approved by the Board. These limits vary according to the depth and the liquidity of the markets in which the entities operate. Our general policy is that each defined operating entity should be self-sufficient in funding its own activities. Where transactions exist between operating entities, they are reflected symmetrically in both entities.
As part of our Asset, Liability and Capital Management (‘ALCM’) structure, we have established ALCOs at Group level, in the regions and in operating entities. The terms of reference of all ALCOs include the monitoring and control of liquidity and funding.
The primary responsibility for managing liquidity and funding within the Group’s framework and risk appetite resides with the local operating entities’ ALCOs. Our most significant operating entities are overseen by regional ALCOs, Group ALCO and the Risk Management Meeting. The remaining smaller operating entities are overseen by regional ALCOs, with appropriate escalation of significant issues to Group ALCO and the Risk Management Meeting.
Operating entities are predominately defined on a country basis to reflect our local management of liquidity and funding. Typically, an operating entity will be defined as a single legal entity. However, to take account of the situation where operations in a country are booked across multiple subsidiaries or branches:
• an operating entity may be defined as a wider sub-consolidated group of legal entities if they are incorporated in the same country, liquidity and funding are freely fungible between the entities and permitted by local regulation, and the definition reflects how liquidity and funding are managed locally; or
• an operating entity may be defined more narrowly as a principal office (branch) of a wider legal entity operating in multiple countries, reflecting the local country management of liquidity and funding.
The Risk Management Meeting reviews and agrees annually the list of entities it directly oversees and the composition of these entities.
Primary sources of funding (Audited)
Customer deposits in the form of current accounts and savings deposits payable on demand or at short notice form a significant part of our funding, and we place considerable importance on maintaining their stability. For deposits, stability depends upon maintaining depositor confidence in our capital strength and liquidity, and on competitive and transparent pricing.
We also access wholesale funding markets by issuing senior secured and unsecured debt securities (publically and privately) and borrowing from the secured repo markets against high quality collateral, in order to obtain funding for non-banking subsidiaries that do not accept deposits, to align asset and liability maturities and currencies and to maintain a presence in local wholesale markets.
The management of liquidity and funding risk (Audited)
Inherent liquidity risk categorisation
We place our operating entities into one of two categories (low and medium) to reflect our assessment of their inherent liquidity risk considering political, economic and regulatory factors within the host country and factors specific to the operating entities themselves, such as their local market, market share and balance sheet strength. The categorisation involves management judgement and is based on the perceived liquidity risk of an operating entity relative to other entities in the Group. The categorisation is intended to reflect the possible impact of a liquidity event, not the probability of an event, and forms part of our risk appetite. It is used to determine the prescribed stress scenario that we require our operating entities to be able to withstand and manage to.

Report of the Directors: Risk (continued) Appendix to Risk – Policies and practices
HSBC HOLDINGS PLC
216
Core deposits
A key element of our internal framework is the classification of customer deposits into core and non-core based on our expectation of their behaviour during periods of liquidity stress. This characterisation takes into account the inherent liquidity risk categorisation of the operating entity originating the deposit, the nature of the customer and the size and pricing of the deposit. No deposit is considered to be core in its entirety unless it is contractually collateralising a loan. The core deposit base in each operating entity is considered to be a long-term source of funding and therefore is assumed not to be withdrawn in the liquidity stress scenario that we use to calculate our principal liquidity risk metrics.
The three filters considered in assessing whether a deposit in any operating entity is core are:
• price: any deposit priced significantly above market or benchmark rates is generally treated as entirely non-core; • size: depositors with total funds above certain monetary thresholds are excluded. Thresholds are established by
considering the business line and inherent liquidity risk categorisation; and • line of business: the element of any deposit remaining after the application of the price and size filters is assessed on
the basis of the line of business with which the deposit is associated. The proportion of any customer deposit that can be considered core under this filter is between 35% and 90%.
Repo transactions and bank deposits cannot be classified as core deposits.
Advances to core funding ratio
Core customer deposits are an important source of funding to finance lending to customers, and mitigate against reliance on short-term wholesale funding. Limits are placed on operating entities to restrict their ability to increase loans and advances to customers without corresponding growth in core customer deposits or long-term debt funding with a residual maturity beyond one year; this measure is referred to as the ‘advances to core funding’ ratio.
Advances to core funding ratio limits are set by the Risk Management Meeting for the most significant operating entities, and by regional ALCOs for smaller operating entities, and are monitored by ALCM teams. The ratio describes loans and advances to customers as a percentage of the total of core customer deposits and term funding with a remaining term to maturity in excess of one year. In general, customer loans are assumed to be renewed and are included in the numerator of the ratio, irrespective of the contractual maturity date. Reverse repo arrangements are excluded from the advances to core funding ratio.
Stressed coverage ratios
Stressed coverage ratios are derived from stressed cash flow scenario analyses and express stressed cash inflows as a percentage of stressed cash outflows over one-month and three-month time horizons.
The stressed cash inflows include:
• inflows (net of assumed haircuts) expected to be generated from the realisation of liquid assets; and • contractual cash inflows from maturing assets that are not already reflected as a utilisation of liquid assets.
In line with the approach adopted for the advances to core funding ratio, customer loans are generally assumed not to generate any cash inflows under stress scenarios and are therefore excluded from the numerator of the stressed coverage ratio, irrespective of the contractual maturity date.
A stressed coverage ratio of 100% or higher reflects a positive cumulative cash flow under the stress scenario being monitored. Group operating entities are required to maintain a ratio of 100% or more out to three months under the combined market-wide and HSBC-specific stress scenario defined by the inherent liquidity risk categorisation of the operating entity concerned.
Compliance with operating entity limits is monitored by ALCM teams and reported monthly to the Risk Management Meeting for the main operating entities and to regional ALCOs for the smaller operating entities.
Stressed scenario analysis (Unaudited)
We use a number of standard Group stress scenarios designed to model:
• combined market-wide and HSBC-specific liquidity crisis scenarios; and • market-wide liquidity crisis scenario.
These scenarios are modelled by all operating entities. The appropriateness of the assumptions for each scenario is reviewed by ALCM regularly and formally approved by the Risk Management Meeting and the Board annually as part of the liquidity and funding risk appetite approval process.
Stressed cash outflows are determined by applying a standard set of prescribed stress assumptions to the Group’s cash flow model. Our framework prescribes the use of two market-wide scenarios and two further combined market-wide and HSBC-specific stress scenarios of increasing severity. In addition to our standard stress scenarios, individual operating entities are required to design their own scenarios to reflect specific local market conditions, products and funding bases.

HSBC HOLDINGS PLC
217
Str
ateg
ic R
epo
rt
Fi
nan
cial
Rev
iew
Co
rpo
rate
Go
vern
ance
Fin
anci
al S
tate
men
ts
S
har
eho
lder
Info
rmat
ion
The two combined market-wide and HSBC-specific scenarios model a more severe scenario than the market-wide scenario. The relevant combined market-wide and HSBC-specific stress scenario that an operating entity manages to is based upon its inherent liquidity risk categorisation. The key assumptions factored into the two combined market-wide and HSBC-specific stress scenarios are summarised as follows:
• all non-core deposits are deemed to be withdrawn within three months (80% within one month), with the level of non-core deposits dependent on the operating entity’s inherent liquidity risk categorisation;
• the ability to access interbank funding and unsecured term debt markets ceases for the duration of the scenario; • the ability to generate funds from illiquid asset portfolios (securitisation and secured borrowing) is restricted to 25-75%
of the lower of issues in the last six months or expected issues in the next six months. The restriction is based on current market conditions and is dependent on the operating entity’s inherent liquidity risk categorisation;
• the ability to access repo funding ceases for any asset not classified as liquid under our liquid asset policy for the duration of the scenario;
• drawdowns on committed lending facilities must be consistent with the severity of the market stress being modelled and dependent on the inherent liquidity risk categorisation of the operating entity;
• outflows are triggered by a defined downgrade in long-term ratings. We maintain an ongoing assessment of the appropriate number of notches to reflect;
• customer loans are assumed to be renewed at contractual maturity; • interbank loans and reverse repos are assumed to run off contractually; and • assets defined as liquid assets are assumed to be realised in cash ahead of their contractual maturity, after applying a
defined stressed haircut of up to 20%.
Liquid assets of HSBC’s principal operating entities (Audited)
Stressed scenario analysis and the numerator of the coverage ratio include the assumed cash inflows that would be generated from the realisation of liquid assets, after applying the appropriate stressed haircut. These assumptions are made on the basis of management’s expectation of when an asset is deemed to be realisable.
Liquid assets are unencumbered assets that meet the Group’s definition of liquid assets and are either held outright or as a consequence of a reverse repo transaction with a residual contractual maturity beyond the time horizon of the stressed coverage ratio being monitored. Any unencumbered asset held as a result of reverse repo transactions with a contractual maturity within the time horizon of the stressed coverage ratio being monitored is excluded from the stock of liquid assets and is instead reflected as a contractual cash inflow.
Our framework defines the asset classes that can be assessed locally as high quality and realisable within one month and between one month and three months. Each local ALCO has to be satisfied that any asset which may be treated as liquid in accordance with the Group’s liquid asset policy will remain liquid under the stress scenario being managed to.
Inflows from the utilisation of liquid assets within one month can generally only be based on confirmed withdrawable central bank deposits or the sale or repo of government and quasi-government exposures generally restricted to those denominated in the sovereign’s domestic currency. High quality ABSs (predominantly US MBSs) and covered bonds are also included but inflows assumed for these assets are capped.
Inflows after one month are also reflected for high quality non-financial and non-structured corporate bonds and equities within the most liquid indices.
Internal categorisation Cash inflow recognised Asset classes Level 1 Within one month • Central government
• Central bank (including confirmed withdrawable reserves) • Supranationals • Multilateral development banks • Coins and banknotes
Level 2 Within one month but capped • Local and regional government • Public sector entities • Secured covered bonds and pass-through ABSs • Gold
Level 3 From one to three months • Unsecured non-financial entity securities • Equities listed on recognised exchanges and within liquid indices
Any entity owned and controlled by central or local/regional government but not explicitly guaranteed is treated as a public sector entity.
Any exposure explicitly guaranteed is reflected as an exposure to the ultimate guarantor.

Report of the Directors: Risk (continued) Appendix to Risk – Policies and practices
HSBC HOLDINGS PLC
218
In terms of the criteria used to ensure liquid assets are of a high quality, the Group’s liquid asset policy sets out the following additional criteria:
1. Central bank and central government exposures denominated in the domestic currency of the related sovereign and held onshore in the domestic banking system qualify as level 1 liquid assets.
2. Central bank and central government exposures denominated in the domestic currency of the related sovereign and held offshore must be risk weighted 20% or lower under the Basel standardised risk weighting methodology to qualify as level 1 liquid assets.
3. Central bank and central government exposures denominated in a currency other than the currency of the related sovereign (i.e. foreign currency) must be risk weighted 20% or lower under the Basel standardised risk weighting methodology and issued in a limited number of major currencies to qualify as level 1 liquid assets.
The treatment of eurozone countries using the euro as their domestic currency depends on whether the exposures are held onshore in the domestic banking system or offshore. Central bank and central government exposures held onshore in the domestic banking system qualify as level 1 liquid assets under criteria 1, but central bank and central government exposures held offshore are considered to be denominated in a foreign currency under criteria 3.
4. Local/regional government exposures held onshore and considered by the local regulator to be the same risk as central government exposures can be considered central government exposures.
5. Supranationals and multilateral development banks must be 0% risk weighted under the Basel standardised risk- weighting methodology to qualify as level 1 liquid assets.
6. To qualify as a level 2 liquid asset, the exposure must be risk weighted 20% or lower under the Basel standardised risk-weighting methodology.
7. To qualify as a level 3 liquid asset, an unsecured non-financial corporate debt exposure must satisfy a minimum internal rating requirement.
On a case-by-case basis, operating entities are permitted to treat other assets as liquid if these assets are realistically assessed to be liquid under stress. These liquid assets are reported as ‘Other’, separately from level 1, level 2 and level 3 liquid assets.
Net cash flow arising from interbank and intragroup loans and deposits
Under the LFRF, a net cash inflow within three months arising from interbank and intra-Group loans and deposits will give rise to a lower liquid asset requirement. Conversely, a net cash outflow within three months arising from interbank and intra-Group loans and deposits will give rise to a higher liquid assets requirement.
Net cash flow arising from reverse repo, repo, stock borrowing, stock lending and outright short positions (including intra-Group)
A net cash inflow represents liquid resources in addition to liquid assets because any unencumbered asset held as a consequence of a reverse repo transaction with a residual contractual maturity within the stressed coverage ratio time period is not reflected as a liquid asset.
The impact of net cash outflow depends on whether the underlying collateral encumbered as a result will qualify as a liquid asset when released at the maturity of the repo. The majority of the Group’s repo transactions are collateralised by liquid assets and, as such, any net cash outflow shown is offset by the return of liquid assets, which are excluded from the liquid asset table above.
Wholesale debt monitoring (Unaudited)
Where wholesale debt term markets are accessed to raise funding, ALCO is required to establish cumulative rolling three-month and 12-month debt maturity limits to ensure no concentration of maturities within these timeframes.
Liquidity behaviouralisation (Unaudited)
Liquidity behaviouralisation is applied to reflect our assessment of the expected period for which we are confident that we will have access to our liabilities, even under a severe liquidity stress scenario, and the expected period for which we must assume that we will need to fund our assets. Behaviouralisation is applied when the contractual terms do not reflect the expected behaviour. Liquidity behaviouralisation is reviewed and approved by local ALCO in compliance with policies set by the Risk Management Meeting. Our approach to liquidity risk management will often mean different approaches are applied to assets and liabilities. For example, management may assume a shorter life for liabilities and a longer-term funding requirement for assets. All core deposits are assumed under the Group’s core/non-core and advances to core funding frameworks to have a liquidity behaviouralised life beyond one year and to represent a homogeneous source of core funding. The behaviouralisation of assets is far more granular and seeks to differentiate the period for which we must assume that we will need to fund the asset.

HSBC HOLDINGS PLC
219
Str
ateg
ic R
epo
rt
Fi
nan
cial
Rev
iew
Co
rpo
rate
Go
vern
ance
Fin
anci
al S
tate
men
ts
S
har
eho
lder
Info
rmat
ion
Funds transfer pricing (Unaudited)
Our funds transfer pricing policies give rise to a two-stage funds transfer pricing approach, reflecting the fact that we separately manage interest rate risk and liquidity and funding risk under different assumptions. They have been developed to be consistent with our risk management frameworks. Each operating entity is required to apply the Group’s transfer pricing policy framework to determine for each material currency the most appropriate interest rate risk transfer pricing curve, a liquidity premium curve (which is the spread over the interest rate risk transfer pricing curve) and a liquidity recharge assessment (which is the spread under or over the interest rate risk transfer pricing curve).
The interest rate risk transfer pricing policy seeks to ensure that all market interest rate risk arising structurally from non-trading (banking book) assets and liabilities which is capable of being neutralised externally in the market or neutralised internally by off-setting transfers, is transferred to BSM to be managed centrally as non-trading market risk. For each material currency each operating entity employs a single interest rate risk transfer pricing curve. The transfer price curve used for this purpose reflects how BSM in each operating entity is best able to neutralise the interest rate risk in the market at the point of transfer. Where basis risk can be identified between the re-pricing basis of an external asset or external liability and the re-pricing basis of the interest rate risk transfer pricing curve, this basis risk may be transferred to BSM provided it can neutralise the basis risk in the market.
Liquidity and funding risk is transfer priced independently from interest rate risk because the liquidity and funding risk of an operating entity is transferred to ALCO to be managed centrally. ALCO monitors and manages the advances to core funding ratio and delegates the management of the liquid asset portfolio and execution of the wholesale term debt funding plan to BSM. This assists ALCO in ensuring the Group’s stressed coverage ratios remain above 100% out to three months.
The liquidity and funding risk transfer price consists of two components:
• Liquidity recharge: the cost of holding the benchmark liquid asset (the yield under the transfer price) to meet stressed cash outflows. The benchmark liquid asset is decided by ALCO and based on the weighted average duration that can be achieved by investing in level 1 liquid assets, with a residual duration of up to one year.
• Liquidity premium: the assessed cost/value of term funding (the yield over the transfer price) to pay for term debt and core deposits.
The assessed cost of holding liquid assets is allocated to the outflows modelled by the Group’s internal stressed coverage ratio framework.
Liquidity premium is charged to any asset that affects our three-month stressed coverage ratios based on the assessed behaviouralised liquidity life of the asset, with any asset affecting the Group’s advances to core funding metric required to have a minimum behaviouralised life of at least one year, and the prevailing liquidity premium curve rate set by ALCO and calibrated in line with Group’s calibration principles. Core deposits therefore share equally in the liquidity premiums charged to the assets they support, after deducting the cost of any term funding.
Repos and stock lending
GB&M provides collateralised security financing services to its clients, providing them with cash financing or specific securities. When cash is provided to clients against collateral in the form of securities, the cash provided is recognised on the balance sheet as a reverse repo. When securities are provided to clients against cash collateral the cash received is recognised on the balance sheet as a repo or, if the securities are equity securities, as stock lending.
Each operating entity manages its collateral through a central collateral pool, in line with the LFRF. When specific securities need to be delivered and the entity does not have them currently available within the central collateral pool, the securities are borrowed on a collateralised basis. When securities are borrowed against cash collateral the cash provided is recognised on the balance sheet as a reverse repo or, if the securities are equity securities, as stock borrowing.
Operating entities may also borrow cash against collateral in the form of securities, using the securities available in the central collateral pool. Repos and stock lending can be used in this way to fund the cash requirement arising from securities owned outright by Markets to facilitate client business, and the net cash requirement arising from financing client securities activity.
Reverse repos, stock borrowing, repos and stock lending are reported net when the IFRSs offsetting criteria are met. In some cases transactions to borrow or lend securities are collateralised using securities. These transactions are off-balance sheet.
Any security accepted as collateral for a reverse repo or stock borrowing transaction must be of very high quality and its value subject to an appropriate haircut. Securities borrowed under reverse repo or stock borrowing transactions can only be recognised as part of the liquidity asset buffer for the duration of the transactions and only if the security received is eligible under the liquid asset policy within the LFRF.
Credit controls are in place to ensure that the fair value of any collateral received remains appropriate to collateralise the cash or fair value of securities given.
Report of the Directors: Risk (continued) Appendix to Risk – Policies and practices
HSBC HOLDINGS PLC
220
The effect of active collateral management
Collateral is managed on an operating entity basis, consistent with the approach adopted in managing liquidity and funding. Available collateral held by each operating entity is managed as a single collateral pool. In deciding which collateral to pledge, each operating entity seeks to optimise the use of the available collateral pool within the confines of the LFRF, irrespective of whether the collateral pledged is recognised on-balance sheet or was received in respect of reverse repo, stock borrowing or derivative transactions.
Managing collateral in this manner affects the presentation of asset encumbrance in that we may encumber on-balance sheet holdings while maintaining available unencumbered off-balance sheet holdings, even though we are not seeking to directly finance the on-balance sheet holdings pledged.
In quantifying the level of encumbrance of negotiable securities, the encumbrance is analysed by individual security. When a particular security is encumbered and we hold the security both on-balance sheet and off-balance sheet with the right to repledge, we assume for the purpose of this disclosure that the off-balance sheet holding received from the third party is encumbered ahead of the on-balance sheet holding.
An on-balance sheet encumbered and off-balance sheet unencumbered asset will occur, for example, if we receive a specific security as a result of a reverse repo/stock borrowing transaction, but finance the cash lent by pledging a generic collateral basket, even if the security received is eligible for the collateral basket pledged. It will also occur if we receive a generic collateral basket as a result of a reverse repo transaction but finance the cash lent by pledging specific securities, even if the securities pledged are eligible for the collateral basket.
Encumbered and unencumbered assets
Definitions of the categories included in the table ‘Analysis of on-balance sheet encumbered and unencumbered assets’: • Encumbered assets are assets on our balance sheet which have been pledged as collateral against an existing liability, and as a result
are assets which are unavailable to the bank to secure funding, satisfy collateral needs or be sold to reduce potential future funding requirements.
• Unencumbered – readily realisable assets are assets regarded by the bank to be readily realisable in the normal course of business to secure funding, meet collateral needs, or be sold to reduce potential future funding requirements, and are not subject to any restrictions on their use for these purposes.
• Unencumbered – other realisable assets are assets where there are no restrictions on their use to secure funding, meet collateral needs, or be sold to reduce potential future funding requirements, but they are not readily realisable in the normal course of business in their current form.
• Unencumbered – reverse repo/stock borrowing receivables and derivative assets are assets related specifically to reverse repo, stock borrowing and derivative transactions. They are shown separately as these on-balance sheet assets cannot be pledged but often give rise to the receipt of non-cash assets which are not recognised on the balance sheet, and can additionally be used to raise secured funding, meet additional collateral requirements or be sold.
• Unencumbered – cannot be pledged as collateral are assets that have not been pledged and which we have assessed could not be pledged and therefore could not be used to secure funding, meet collateral needs, or be sold to reduce potential future funding requirements. An example is assets held by the Group’s insurance subsidiaries that back liabilities to policyholders and support the solvency of these entities.
Historically, the Group has not recognised any contingent liquidity value for assets other than those assets defined under the LFRF as being liquid assets, and any other negotiable instruments that under stress are assumed to be realisable after three months, even though they may currently be realisable. This approach has generally been driven by our risk appetite not to place any reliance on central banks. In a few cases, we have recognised the contingent value of discrete pools of assets, but the amounts involved are insignificant. As a result, we have reported the majority of our loans and advances to customers and banks in the category ‘Other realisable assets’ as management would need to perform additional actions in order to make the assets transferable and readily realisable.
Additional information
The amount of assets pledged to secure liabilities reported in Note 19 on the Financial Statements may be greater than the book value of assets reported as being encumbered in the table on page 172. Examples of where such differences occur are:
• ABSs and covered bonds, where the amount of liabilities issued plus the required mandatory over-collateralisation is lower than the book value of assets pledged to the pool. Any difference is categorised in the table above as ‘Unencumbered – readily realisable assets’;
• negotiable securities held by custodians or settlement agents, where a floating charge has been given over the entire holding to secure intra-day settlement liabilities, are only reported as encumbered to the extent that we have a liability to the custodian or settlement agent at the reporting date, with the balance reported as ‘Unencumbered – readily realisable assets’; and
• assets pre-positioned with central banks or government agencies are only reported as encumbered to the extent that we have secured funding with the collateral. The unutilised pre-positioned collateral is reported as ‘Unencumbered – readily realisable assets’.

HSBC HOLDINGS PLC
221
Str
ateg
ic R
epo
rt
Fi
nan
cial
Rev
iew
Co
rpo
rate
Go
vern
ance
Fin
anci
al S
tate
men
ts
S
har
eho
lder
Info
rmat
ion
Securities reflected on the balance sheet that are pledged as collateral against an existing liability or lent are reflected as encumbered for the duration of the transaction. When securities are received as collateral or borrowed, and when we have the right to sell or re-pledge these securities, they are reflected as available and unencumbered for the duration of the transaction, unless re-pledged or sold. Further analysis regarding the encumbrance of securities resulting from repos and stock lending and available unencumbered assets arising from reverse repos and stock borrowing is provided under the heading ‘Encumbered and unencumbered assets’ on page 171.
In the normal course of business we do not seek to utilise repo financing as a source of funding to finance customer assets, beyond the collateralised security financing activities within Markets described above.
The original contractual maturity of reverse repo, stock borrowing, repo and stock lending is short term with the vast majority of transactions being for less than 90 days.
Management of cross-currency liquidity and funding risk (Unaudited)
Our liquidity and funding risk framework also considers the ability of each entity to continue to access foreign exchange markets under stress when a surplus in one currency is used to meet a deficit in another currency, for example, by the use of the foreign currency swap markets. Where appropriate, operating entities are required to monitor stressed coverage ratios and advances to core funding ratios for non-local currencies.
HSBC Holdings (Audited)
HSBC Holdings’ primary sources of cash are dividends received from subsidiaries, interest on and repayment of intra-group loans and interest earned on its own liquid funds. HSBC Holdings also raises ancillary funds in the debt capital markets through subordinated and senior debt issuance. Cash is primarily used for the provision of capital to subsidiaries, interest payments to debt holders and dividend payments to shareholders.
HSBC Holdings is also subject to contingent liquidity risk by virtue of loan and other credit-related commitments and guarantees and similar contracts issued. Such commitments and guarantees are only issued after due consideration of HSBC Holdings’ ability to finance the commitments and guarantees and the likelihood of the need arising.
HSBC Holdings actively manages the cash flows from its subsidiaries to optimise the amount of cash held at the holding company level. The ability of subsidiaries to pay dividends or advance monies to HSBC Holdings depends on, among other things, their respective local regulatory capital and banking requirements, statutory reserves, and financial and operating performance. During 2014 and 2013, none of the Group’s subsidiaries experienced significant restrictions on paying dividends or repaying loans and advances. Also, there are no foreseen restrictions envisaged by our subsidiaries on paying dividends or repaying loans and advances. None of the subsidiaries which are excluded from our regulatory consolidation has capital resources below its minimum regulatory requirement.
Market risk
Market risk is the risk that movements in market factors, including foreign exchange rates and commodity prices, interest rates, credit spreads and equity prices, will reduce our income or the value of our portfolios. Market risk exposures (including graphs and tables) are provided under Market Risk on page 175.
Exposure to market risk (Unaudited)
Exposure to market risk is separated into two portfolios:
• Trading portfolios comprise positions arising from market-making and the warehousing of customer-derived positions.
• Non-trading portfolios comprise positions that primarily arise from the interest rate management of our retail and commercial banking assets and liabilities, financial investments designated as available for sale and held to maturity, and exposures arising from our insurance operations.
Where appropriate, we apply similar risk management policies and measurement techniques to both trading and non-trading portfolios. Our objective is to manage and control market risk exposures in order to optimise return on risk while maintaining a market profile consistent with our status as one of the world’s largest banking and financial services organisations.
The nature of the hedging and risk mitigation strategies performed across the Group corresponds to the market risk management instruments available within each operating jurisdiction. These strategies range from the use of traditional market instruments, such as interest rate swaps, to more sophisticated hedging strategies to address a combination of risk factors arising at portfolio level.

Report of the Directors: Risk (continued) Appendix to Risk – Policies and practices
HSBC HOLDINGS PLC
222
Overview of market risk in global businesses (Unaudited)
The diagram below illustrates the main business areas where trading and non-trading market risks reside and market risk measures to monitor and limit exposures.
1 The interest rate risk on the fixed-rate securities issued by HSBC Holdings is not included in the Group VaR. The management of this risk is
described on page 181.
Market risk governance (Audited)
Market risk is managed and controlled through limits approved by the Risk Management Meeting of the GMB for HSBC Holdings and our various global businesses. These limits are allocated across business lines and to the Group’s legal entities.
The management of market risk is principally undertaken in Global Markets, where 77% of the total value at risk of HSBC (excluding insurance) and almost all trading VaR resides, using risk limits approved by the GMB. VaR limits are set for portfolios, products and risk types, with market liquidity being a primary factor in determining the level of limits set.
Group Risk, an independent unit within Group Head Office, is responsible for our market risk management policies and measurement techniques. Each major operating entity has an independent market risk management and control function which is responsible for measuring market risk exposures in accordance with the policies defined by Group Risk, and monitoring and reporting these exposures against the prescribed limits on a daily basis. The market risk limits are governed according to the framework illustrated to the left.
Each operating entity is required to assess the market risks arising on each product in its business and to transfer them to either its local Markets unit for management, or to separate books managed under the supervision of the local ALCO.
Our aim is to ensure that all market risks are consolidated within operations that have the necessary skills, tools, management and governance to manage them. In certain cases where the market risks cannot be fully transferred, we identify the impact of varying scenarios on valuations or on net interest income resulting from any residual risk positions. Further details on the control and management process for residual risks are provided on page 224.
Model risk is governed through Model Oversight Committees (‘MOC’s) at the regional and global Wholesale Credit and Market Risk levels. They have direct oversight and approval responsibility for all traded risk models utilised for risk measurement and management and stress testing. The MOCs prioritise the development of models, methodologies and practices used for traded risk management within the Group and ensure that they remain within our risk appetite and business plans. The Markets MOC reports into the Group MOC, which oversees all model risk types at Group level. Group MOC informs the Group Risk Management Meeting about material issues at least on a bi-annual basis. The Risk Management Meeting is the Group’s ‘Designated Committee’ according to regulatory rules and has delegated day-to-day governance of all traded risk models to the Markets MOC.
Trading risk Non-trading risk
Risk types– Foreign exchange & commodities– Interest rates– Credit spreads– Equities
– Structural foreign exchange
– Interest rates1
– Credit spreads
Risk measure VaR | Sensitivity | Stress testing VaR | Sensitivity | Stress testing
Global businesses GB&M, incl BSM GB&M, incl BSM GPB CMB RBWM
Chairman/CEO
Risk Management Meetingof the GMB
HSBC Holdings Board
Entity RiskManagement Committee
Principal Office Manager
Business/Desk/Trader
Group Traded Risk
Gen
eral
mea
sure
sS
pec
ific
mea
sure
s

HSBC HOLDINGS PLC
223
Str
ateg
ic R
epo
rt
Fi
nan
cial
Rev
iew
Co
rpo
rate
Go
vern
ance
Fin
anci
al S
tate
men
ts
S
har
eho
lder
Info
rmat
ion
Our control of market risk in the trading and non-trading portfolios is based on a policy of restricting individual operations to trading within a list of permissible instruments authorised for each site by Group Risk, of enforcing new product approval procedures, and of restricting trading in the more complex derivative products only to offices with appropriate levels of product expertise and robust control systems.
Market risk measures (Audited)
Monitoring and limiting market risk exposures
Our objective is to manage and control market risk exposures while maintaining a market profile consistent with our risk appetite.
We use a range of tools to monitor and limit market risk exposures including sensitivity analysis, value at risk and stress testing.
Sensitivity analysis (Unaudited)
Sensitivity analysis measures the impact of individual market factor movements on specific instruments or portfolios, including interest rates, foreign exchange rates and equity prices, such as the effect of a one basis point change in yield. We use sensitivity measures to monitor the market risk positions within each risk type. Sensitivity limits are set for portfolios, products and risk types, with the depth of the market being one of the principal factors in determining the level of limits set.
Value at risk (Audited)
Value at risk (‘VaR’) is a technique that estimates the potential losses on risk positions as a result of movements in market rates and prices over a specified time horizon and to a given level of confidence. The use of VaR is integrated into market risk management and is calculated for all trading positions regardless of how we capitalise those exposures. Where there is not an approved internal model, we use the appropriate local rules to capitalise exposures.
In addition, we calculate VaR for non-trading portfolios in order to have a complete picture of risk. Our models are predominantly based on historical simulation. VaR is calculated at a 99% confidence level for a one-day holding period. Where we do not calculate VaR explicitly, we use alternative tools as summarised in the Market Risk Stress Testing table found in the Stress testing section below.
Our VaR models derive plausible future scenarios from past series of recorded market rates and prices, taking into account inter-relationships between different markets and rates such as interest rates and foreign exchange rates. The models also incorporate the effect of option features on the underlying exposures.
The historical simulation models used incorporate the following features:
• historical market rates and prices are calculated with reference to foreign exchange rates and commodity prices, interest rates, equity prices and the associated volatilities;
• potential market movements utilised for VaR are calculated with reference to data from the past two years; and
• VaR measures are calculated to a 99% confidence level and use a one-day holding period.
The nature of the VaR models means that an increase in observed market volatility will lead to an increase in VaR without any changes in the underlying positions.
We are committed to the ongoing development of our in-house risk models.
VaR model limitations
Although a valuable guide to risk, VaR should always be viewed in the context of its limitations. For example:
• the use of historical data as a proxy for estimating future events may not encompass all potential events, particularly those which are extreme in nature;
• the use of a holding period assumes that all positions can be liquidated or the risks offset during that period. This may not fully reflect the market risk arising at times of severe illiquidity, when the holding period may be insufficient to liquidate or hedge all positions fully;
• the use of a 99% confidence level, by definition, does not take into account losses that might occur beyond this level of confidence;
• VaR is calculated on the basis of exposures outstanding at the close of business and therefore does not necessarily reflect intra-day exposures; and
• VaR is unlikely to reflect loss potential on exposures that only arise under conditions of significant market movement.

Report of the Directors: Risk (continued) Appendix to Risk – Policies and practices
HSBC HOLDINGS PLC
224
Risk not in VaR framework (Unaudited)
Our VaR model is designed to capture significant basis risks such as credit default swap versus bond, asset swap spreads and cross-currency basis. Other basis risks which are not completely covered in VaR, such as the Libor tenor basis, are complemented by our risk not in VaR (‘RNIV’) calculations, and are integrated into our capital framework.
The RNIV framework therefore aims to capture and capitalise material market risks that are not adequately covered in the VaR model. An example of this is Libor-overnight index swap basis risk for minor currencies. In such instances the RNIV framework uses stress tests to quantify the capital requirement. On average in 2014, the capital requirement derived from these stress tests represented 2.6% of the total internal model-based market risk requirement.
Risks covered by RNIV represent 18% of market risk RWAs for models with regulatory approval and include those resulting from underlying risk factors which are not observable on a daily basis across asset classes and products, such as dividend risk and correlation risks.
Risk factors are reviewed on a regular basis and either incorporated directly in the VaR models, where possible, or quantified through the VaR-based RNIV approach or a stress test approach within the RNIV framework. The severity of the scenarios is calibrated to be in line with the capital adequacy requirements. The outcome of the VaR-based RNIV is included in the VaR calculation and back-testing; a stressed VaR RNIV is also computed for the risk factors considered in the VaR-based RNIV approach.
In 2014, we modified our RNIV model on a non-diversified basis across risk factors to comply with new PRA CRD IV implementation guidelines.
Level 3 assets
The fair values of Level 3 assets and liabilities in trading portfolios are disclosed on page 380, and represent only a small proportion of the overall trading portfolio. Market risk arising from Level 3 instruments is managed by various market risk techniques such as stress testing and notional limits. The table on page 384 shows the movement in Level 3 financial instruments.
Back-testing
We routinely validate the accuracy of our VaR models by back-testing them against both clean and hypothetical profit and loss against the corresponding VaR numbers. Hypothetical profit and loss excludes non-modelled items such as fees, commissions and revenues of intra-day transactions.
We would expect on average to see two or three profits and two or three losses in excess of VaR at the 99% confidence level over a one-year period. The actual number of profits or losses in excess of VaR over this period can therefore be used to gauge how well the models are performing. To ensure a conservative approach to calculating our risk exposures, it is important to note that profits in excess of VaR are only considered when back-testing the accuracy of our models and are not used to calculate the VaR numbers used for risk management or capital purposes.
We back-test our Group VaR at various levels which reflect a full legal entity scope of HSBC, including entities that do not have local permission to use VaR for regulatory purposes.
Stress testing (Unaudited)
Stress testing is an important tool that is integrated into our market risk management tool to evaluate the potential impact on portfolio values of more extreme, although plausible, events or movements in a set of financial variables. In such abnormal scenarios, losses can be much greater than those predicted by VaR modelling.
Stress testing is implemented at legal entity, regional and overall Group levels. A standard set of scenarios is utilised consistently across all regions within the Group. Scenarios are tailored to capture the relevant events or market movements at each level. The risk appetite around potential stress losses for the Group is set and monitored against referral limits.
Market Risk Stress Testing
Sensitivities Technical Hypothetical Historical
Reverse Stress Testing
Impact of a single risk factor e.g. break of a currency peg
Impact of the largest move in each risk factor without consideration of any underlying market correlation
Impact of potential macroeconomic events, e.g. slowdown in mainland China
Scenarios that incorporate historical observations of market movements e.g. Black Monday 1987 for equities

HSBC HOLDINGS PLC
225
Str
ateg
ic R
epo
rt
Fi
nan
cial
Rev
iew
Co
rpo
rate
Go
vern
ance
Fin
anci
al S
tate
men
ts
S
har
eho
lder
Info
rmat
ion
Market risk reverse stress tests are undertaken on the premise that there is a fixed loss. The stress test process identifies which scenarios lead to this loss. The rationale behind the reverse stress test is to understand scenarios which are beyond normal business settings that could have contagion and systemic implications.
Stressed VaR and stress testing, together with reverse stress testing and the management of gap risk, provide management with insights regarding the ‘tail risk’ beyond VaR for which HSBC’s appetite is limited.
Trading portfolios (Audited)
Gap risk
Certain products are structured in such a way that they give rise to enhanced gap risk, being the risk that loss is incurred upon occurrence of a gap event. A gap event is a significant and sudden change in market price with no accompanying trading opportunity. Such movements may occur, for example, when, in reaction to an adverse event or unexpected news announcement, some parts of the market move far beyond their normal volatility range and become temporarily illiquid. In 2014 gap risk principally arose from non-recourse loan transactions, mostly for corporate clients, where the collateral against the loan is limited to the posted shares. Upon occurrence of a gap event, the value of the equity collateral could fall below the outstanding loan amount.
Given their characteristics, these transactions make little or no contribution to VaR nor to traditional market risk sensitivity measures. We capture their risks within our stress testing scenarios and monitor gap risk on an ongoing basis. We did not incur any notable gap loss in 2014.
De-peg risk
For certain currencies (pegged or managed) the spot exchange rate is pegged at a fixed rate (typically to USD or EUR), or managed within a predefined band around a pegged rate. De-peg risk is the risk of the peg or managed band changing or being abolished, and moving to a floating regime.
HSBC has considerable experience in managing fixed and managed currency regimes. Using stressed scenarios on spot rates, we are able to analyse how de-peg events would impact the positions held by HSBC. We monitor such scenarios to pegged or managed currencies, such as the Hong Kong dollar, renminbi, Middle Eastern currencies and the Swiss franc with appreciation capped against the euro during 2014, and limit any potential losses that would occur. This complements traditional market risk metrics, such as historical VaR, which may not fully capture the risk involved in holding positions in pegged or managed currencies. Historical VaR relies on past events to determine the likelihood of potential profits or losses. However, pegged or managed currencies may not have experienced a de-peg event during the historical timeframe being considered.
ABS/MBS exposures
The ABS/MBS exposures within the trading portfolios are managed within sensitivity and VaR limits as described on page 176, and are included within the stress testing scenarios described above.
Non-trading portfolios (Audited)
Most of the Group’s non-trading VaR relates to Balance Sheet Management (‘BSM’) or local treasury management functions. Contributions to Group non-trading VaR are driven by interest rates and credit spread risks arising from all global businesses. There is no commodity market risk in the non-trading portfolios.
Non-trading VaR also includes the interest rate risk of non-trading financial instruments held by the global businesses and transferred into portfolios managed by BSM or local treasury functions. In measuring, monitoring and managing risk in our non-trading portfolios, VaR is just one of the tools used. The management of interest rate risk in the banking book is described further in ‘Non-trading interest rate risk’ below, including the role of BSM.
Non-trading VaR excludes equity risk on available-for-sale securities, structural foreign exchange risk, and interest rate risk on fixed rate securities issued by HSBC Holdings, the scope and management of which are described in the relevant sections below.
Our control of market risk in the non-trading portfolios is based on transferring the assessed market risk of non-trading assets and liabilities created outside BSM or Markets, to the books managed by BSM, provided the market risk can be neutralised. The net exposure is typically managed by BSM through the use of fixed rate government bonds (liquid assets held in available-for-sale books) and interest rate swaps. The interest rate risk arising from fixed rate government bonds held within available-for-sale portfolios is reflected within the Group’s non-traded VaR. Interest rate swaps used by BSM are typically classified as either a fair value hedge or a cash flow hedge and are included within the Group’s non-traded VaR. Any market risk that cannot be neutralised in the market is managed by local ALCO in segregated ALCO books.

Report of the Directors: Risk (continued) Appendix to Risk – Policies and practices
HSBC HOLDINGS PLC
226
Credit spread risk for available-for-sale debt instruments
The risk associated with movements in credit spreads is primarily managed through sensitivity limits, stress testing and VaR. The VaR shows the effect on income from a one-day movement in credit spreads over a two-year period, calculated to a 99% confidence interval.
Equity securities classified as available for sale
Potential new commitments are subject to risk appraisal to ensure that industry and geographical concentrations remain within acceptable levels for the portfolio. Regular reviews are performed to substantiate the valuation of the investments within the portfolio and investments held to facilitate ongoing business, such as holdings in government-sponsored enterprises and local stock exchanges.
Structural foreign exchange exposures (Unaudited)
Structural foreign exchange exposures represent net investments in subsidiaries, branches and associates, the functional currencies of which are currencies other than the US dollar. An entity’s functional currency is that of the primary economic environment in which the entity operates.
Exchange differences on structural exposures are recognised in ‘Other comprehensive income’. We use the US dollar as our presentation currency in our consolidated financial statements because the US dollar and currencies linked to it form the major currency bloc in which we transact and fund our business. Our consolidated balance sheet is, therefore, affected by exchange differences between the US dollar and all the non-US dollar functional currencies of underlying subsidiaries.
We hedge structural foreign exchange exposures only in limited circumstances. Our structural foreign exchange exposures are managed with the primary objective of ensuring, where practical, that our consolidated capital ratios and the capital ratios of individual banking subsidiaries are largely protected from the effect of changes in exchange rates. This is usually achieved by ensuring that, for each subsidiary bank, the ratio of structural exposures in a given currency to risk-weighted assets denominated in that currency is broadly equal to the capital ratio of the subsidiary in question.
We may also transact hedges where a currency in which we have structural exposures is considered likely to revalue adversely, and it is possible in practice to transact a hedge. Any hedging is undertaken using forward foreign exchange contracts which are accounted for under IFRSs as hedges of a net investment in a foreign operation, or by financing with borrowings in the same currencies as the functional currencies involved.
Non-trading interest rate risk (Unaudited)
Non-trading interest rate risk in non-trading portfolios arises principally from mismatches between the future yield on assets and their funding cost, as a result of interest rate changes. Analysis of this risk is complicated by having to make assumptions on embedded optionality within certain product areas such as the incidence of mortgage prepayments, and from behavioural assumptions regarding the economic duration of liabilities which are contractually repayable on demand such as current accounts, and the re-pricing behaviour of managed rate products. These assumptions around behavioural features are captured in our interest rate risk behaviouralisation framework, which is described below.
We aim, through our management of market risk in non-trading portfolios, to mitigate the effect of prospective interest rate movements which could reduce future net interest income, while balancing the cost of such hedging activities on the current net revenue stream.
Analysis of interest rate risk is complicated by having to make assumptions on embedded optionality within certain product areas such as the incidence of mortgage prepayments.
Our funds transfer pricing policies give rise to a two stage funds transfer pricing approach. For details see page 219.
Interest rate risk behaviouralisation
Unlike liquidity risk, which is assessed on the basis of a very severe stress scenario, non-trading interest rate risk is assessed and managed according to ‘business-as-usual’ conditions. In many cases the contractual profile of non-trading assets/liabilities arising from assets/liabilities created outside Markets or BSM does not reflect the behaviour observed.
Behaviouralisation is therefore used to assess the market interest rate risk of non-trading assets/liabilities and this assessed market risk is transferred to BSM, in accordance with the rules governing the transfer of interest rate risk from the global businesses to BSM.
Behaviouralisation is applied in three key areas:
• the assessed re-pricing frequency of managed rate balances;
• the assessed duration of non-interest bearing balances, typically capital and current accounts; and
• the base case expected prepayment behaviour or pipeline take-up rate for fixed rate balances with embedded optionality.

HSBC HOLDINGS PLC
227
Str
ateg
ic R
epo
rt
Fi
nan
cial
Rev
iew
Co
rpo
rate
Go
vern
ance
Fin
anci
al S
tate
men
ts
S
har
eho
lder
Info
rmat
ion
Interest rate behaviouralisation policies have to be formulated in line with the Group’s behaviouralisation policies and approved at least annually by local ALCO, regional ALCM and Group ALCM, in conjunction with local, regional and Group market risk monitoring teams.
The extent to which balances can be behaviouralised is driven by:
• the amount of the current balance that can be assessed as ‘stable’ under business-as-usual conditions; and
• for managed rate balances, the historic market interest rate re-pricing behaviour observed; or
• for non-interest bearing balances, the duration for which the balance is expected to remain under business-as-usual conditions. This assessment is often driven by the re-investment tenors available to BSM to neutralise the risk through the use of fixed rate government bonds or interest rate derivatives, and for derivatives the availability of cash flow hedging capacity.
Balance Sheet Management
Effective governance across BSM is supported by the dual reporting lines it has to the CEO of GB&M and to the Group Treasurer. In each operating entity, BSM is responsible for managing liquidity and funding under the supervision of the local ALCO (which usually meets on a monthly basis). It also manages the non-trading interest rate positions transferred to it within a Global Markets limit structure.
In executing the management of the liquidity risk on behalf of ALCO, and managing the non-trading interest rate positions transferred to it, BSM invests in highly-rated liquid assets in line with the Group’s liquid asset policy. The majority of the liquidity is invested in central bank deposits and government, supranational and agency securities with most of the remainder held in short-term interbank and central bank loans.
Withdrawable central bank deposits are accounted for as cash balances. Interbank loans, statutory central bank reserves and loans to central banks are accounted for as loans and advances to banks. BSM’s holdings of securities are accounted for as available-for-sale or, to a lesser extent, held-to-maturity assets.
Statutory central bank reserves are not recognised as liquid assets. The statutory reserves that would be released in line with the Group’s stressed customer deposit outflow assumptions are reflected as stressed inflows.
BSM is permitted to use derivatives as part of its mandate to manage interest rate risk. Derivative activity is predominantly through the use of vanilla interest rate swaps which are part of cash flow hedging and fair value hedging relationships.
Credit risk in BSM is predominantly limited to short-term bank exposure created by interbank lending, exposure to central banks and high quality sovereigns, supranationals or agencies which constitute the majority of BSM’s liquidity portfolio. BSM does not manage the structural credit risk of any Group entity balance sheets.
BSM is permitted to enter into single name and index credit derivatives activity, but it does so to manage credit risk on the exposure specific to its securities portfolio in limited circumstances only. The risk limits are extremely limited and closely monitored. At 31 December 2014 and 31 December 2013, BSM had no open credit derivative index risk.
VaR is calculated on both trading and non-trading positions held in BSM. It is calculated by applying the same methodology used for the Markets business and utilised as a tool for market risk control purposes.
BSM holds trading portfolio instruments in only very limited circumstances. Positions and the associated VaR were not significant during 2014 and 2013.
Sensitivity of net interest income (Unaudited)
A principal part of our management of market risk in non-trading portfolios is to monitor the sensitivity of projected net interest income under varying interest rate scenarios (simulation modelling). This monitoring is undertaken at an entity level by local ALCOs.
Entities apply a combination of scenarios and assumptions relevant to their local businesses, and standard scenarios which are required throughout HSBC. The latter are consolidated to illustrate the combined pro forma effect on our consolidated net interest income.
Projected net interest income sensitivity figures represent the effect of the pro forma movements in net interest income based on the projected yield curve scenarios and the Group’s current interest rate risk profile. This effect, however, does not incorporate actions which would probably be taken by BSM or in the business units to mitigate the effect of interest rate risk. In reality, BSM seeks proactively to change the interest rate risk profile to minimise losses and optimise net revenues. The net interest income sensitivity calculations assume that interest rates of all maturities move by the same amount in the ‘up-shock’ scenario. Rates are not assumed to become negative in the ‘down-shock’ scenario which may, in certain currencies, effectively result in non-parallel shock. In addition, the net interest income sensitivity calculations take account of the effect on net interest income of anticipated differences in changes between interbank interest rates and interest rates over which the entity has discretion in terms of the timing and extent of rate changes.
Report of the Directors: Risk (continued) Appendix to Risk – Policies and practices
HSBC HOLDINGS PLC
228
Defined benefit pension schemes (Audited)
Market risk arises within our defined benefit pension schemes to the extent that the obligations of the schemes are not fully matched by assets with determinable cash flows. Pension scheme obligations fluctuate with changes in long-term interest rates, inflation, salary levels and the longevity of scheme members. Pension scheme assets include equities and debt securities, the cash flows of which change as equity prices and interest rates (and credit risk) vary. There is a risk that market movements in equity prices and interest rates could result in asset values which, taken together with regular ongoing contributions, are insufficient over time to cover the level of projected obligations and these, in turn, could increase with a rise in inflation and members living longer. Management and, in certain instances, trustees (who act on behalf of the pension schemes’ beneficiaries) assess these risks using reports prepared by independent external consultants, take action and, where appropriate, adjust investment strategies and contribution levels accordingly.
HSBC Holdings (Audited)
As a financial services holding company, HSBC Holdings has limited market risk activity. Its activities predominantly involve maintaining sufficient capital resources to support the Group’s diverse activities; allocating these capital resources across our businesses; earning dividend and interest income on its investments in our businesses; providing dividend payments to HSBC Holdings’ equity shareholders and interest payments to providers of debt capital; and maintaining a supply of short-term capital resources for deployment under extraordinary circumstances. It does not take proprietary trading positions.
The main market risks to which HSBC Holdings is exposed are non-trading interest rate risk and foreign currency risk. Exposure to these risks arises from short-term cash balances, funding positions held, loans to subsidiaries, investments in long-term financial assets and financial liabilities including debt capital issued. The objective of HSBC Holdings’ market risk management strategy is to reduce exposure to these risks and minimise volatility in capital resources, cash flows and distributable reserves. Market risk for HSBC Holdings is monitored by HSBC Holdings ALCO in accordance with its risk appetite statement.
HSBC Holdings uses interest rate swaps and cross currency interest rate swaps to manage the interest rate risk and foreign currency risk arising from its long-term debt issues.
Operational risk (Unaudited)
The objective of our operational risk management is to manage and control operational risk in a cost effective manner within targeted levels of operational risk consistent with our risk appetite, as defined by the GMB.
Operational risk is organised as a specific risk discipline within Global Risk, and a formal governance structure provides oversight over its management. The Global Operational Risk function reports to the Group Chief Risk Officer and supports the Global Operational Risk Committee. It is responsible for establishing and maintaining the operational risk management framework (‘ORMF’) and monitoring the level of operational losses and the effectiveness of the control environment. It is also responsible for operational risk reporting at Group level, including the preparation of reports for consideration by the Risk Management Meeting and Group Risk Committee. The Global Operational Risk Committee meets at least quarterly to discuss key risk issues and review the effective implementation of the ORMF.
The ORMF defines minimum standards and processes and the governance structure for the management of operational risk and internal control in our geographical regions, global businesses and global functions. The ORMF has been codified in a high level standards manual supplemented with detailed policies which describes our approach to identifying, assessing, monitoring and controlling operational risk and gives guidance on mitigating action to be taken when weaknesses are identified.
Business managers throughout the Group are responsible for maintaining an acceptable level of internal control commensurate with the scale and nature of operations, and for identifying and assessing risks, designing controls and monitoring the effectiveness of these controls. The ORMF helps managers to fulfil these responsibilities by defining a standard risk assessment methodology and providing a tool for the systematic reporting of operational loss data.
A centralised database is used to record the results of the operational risk management process. Operational risk and control self-assessments are input and maintained by business units. Business and functional management and Business Risk and Control Managers monitor the progress of documented action plans to address shortcomings. To ensure that operational risk losses are consistently reported and monitored at Group level, all Group companies are required to report individual losses when the net loss is expected to exceed US$10,000, and to aggregate all other operational risk losses under US$10,000. Losses are entered into the Group Operational Risk database and are reported to the Risk Management Meeting on a monthly basis.
For further details, see the Pillar 3 Disclosures 2014 report.

HSBC HOLDINGS PLC
229
Str
ateg
ic R
epo
rt
Fi
nan
cial
Rev
iew
Co
rpo
rate
Go
vern
ance
Fin
anci
al S
tate
men
ts
S
har
eho
lder
Info
rmat
ion
Compliance risk (Unaudited)
Compliance risk falls within the definition of operational risk. All Group companies are required to observe the letter and spirit of all relevant laws, codes, rules, regulations and standards of good market practice. These rules, regulations, standards and Group policies include those relating to anti-money laundering, anti-bribery and corruption, counter-terrorist and proliferation financing, sanctions compliance, conduct of business, market conduct and other financial regulations.
The two Compliance sub-functions: Financial Crime Compliance (‘FCC’) and Regulatory Compliance (‘RC’), are appropriately supported by shared Compliance Chief Operating Officer, Assurance and Reputational Risk Management teams. The Global Head of Financial Crime Compliance and the Global Head of Regulatory Compliance both report to the Group Chief Risk Officer.
There are compliance teams in each of the countries where we operate and in all global businesses. These compliance teams are principally overseen by Heads of Financial Crime Compliance and Regulatory Compliance located in Europe, the US, Canada, Latin America, Asia and the Middle East and North Africa. The effectiveness of the regional and global business compliance teams are reviewed by the Assurance team.
Global policies and procedures require the prompt identification and escalation to Financial Crime Compliance or Regulatory Compliance of all actual or suspected breaches of any law, rule, regulation, policy or other relevant requirement. These escalation procedures are supplemented by a requirement for the submission of compliance certificates at the half-year and year-end by all Group companies and functions detailing any known breaches as above. The contents of these escalation and certification processes are reported to the Risk Management Meeting, the Group Risk Committee and the Board. They are disclosed in the Annual Report and Accounts and Interim Report, as appropriate.
Our focus on compliance and conduct issues is further reinforced by the Financial System Vulnerabilities Committee, which reports to the Board on matters relating to financial crime and financial system abuse and provides a forward-looking perspective on financial crime risk. In addition, the Conduct & Values Committee reports to the Board on matters relating to the responsible conduct of business and adherence to HSBC’s Values.
In 2014, the new enhanced global AML and sanctions policies and a globally consistent approach to the management of conduct were approved by the Board as described in ‘Compliance risk’ on page 189.
Legal risk (Unaudited)
Each legal department is required to have processes and procedures in place to manage legal risk that conform to Group standards.
Legal risk falls within the definition of operational risk and includes:
• contractual risk, which is the risk of a member of HSBC suffering financial loss, legal or regulatory action or reputational damage because its rights and/or obligations under a contract to which it is a party are technically defective;
• dispute risk, which is the risk of a member of HSBC suffering financial loss or reputational damage due to an adverse dispute environment or a failure to take appropriate steps to defend, prosecute and/or resolve actual or threatened legal claims brought against or by a Group member;
• legislative risk, which is the risk that an HSBC company fails to adhere to the laws of the jurisdictions in which it operates; and
• non-contractual rights risk, which is the risk that a Group member’s assets are not properly owned or protected or are infringed by others or the infringement by a Group member of another party’s rights.
Our global legal function assists management in controlling legal risk. There are legal departments in 49 of the countries in which we operate. In addition to the Group Legal function, there are regional legal functions in each of Europe, North America, Latin America, the Middle East and North Africa and Asia headed by regional General Counsels, and a global General Counsel responsible for each of the global businesses.
Global security and fraud risk (Unaudited)
Security and fraud risk issues are managed at Group level by Global Security and Fraud Risk. This unit, which has responsibility for information, fraud, contingency, financial intelligence, physical and geopolitical risks is fully integrated within the central Group Risk function. This enables management to identify and mitigate the permutations of these and other non-financial risks to its business lines across the jurisdictions in which we operate.
The Information Security Risk function is responsible for defining the strategy and policy by which the organisation protects its information assets and services from compromise, corruption or loss, whether caused deliberately or inadvertently by internal or external parties. It provides independent advice, guidance and oversight to the business about the effectiveness of information security controls and practices in place or being proposed.

Report of the Directors: Risk (continued) Appendix to Risk – Policies and practices
HSBC HOLDINGS PLC
230
The Fraud Risk function is responsible for ensuring that effective prevention, detection and investigation measures are in place against all forms of fraudulent activity, whether initiated internally or externally, and is available to support any part of the business. To achieve that and to attain the level of integration needed to face the threat, the management of all types of fraud (e.g. card fraud, non-card fraud and internal fraud, including investigations) is established within one management structure and is part of the Global Risk function.
We use technology extensively to prevent and detect fraud. For example, customers’ credit and debit card spending is monitored continuously and suspicious transactions are highlighted for verification, internet banking sessions are reviewed and transactions monitored in a similar way and all new account applications are screened for fraud. We have a fraud systems strategy which is designed to provide minimum standards and allow easier sharing of best practices to detect fraud and minimise false alerts.
We have developed a holistic and effective anti-fraud strategy which, in addition to the use of advanced technology, includes fraud prevention policies and practices, the implementation of strong internal controls, investigations response teams and liaison with law enforcement where appropriate.
The Contingency Risk function is responsible for ensuring that the group’s critical systems, processes and functions have the resilience to maintain continuity in the face of major disruptive events.
Within this wider risk, Business Continuity Management covers the pre-planning for recovery, seeking to minimise the adverse effects of major business disruption, either globally, regionally or within country, against a range of actual or emerging risks. The pre-planning concentrates on the protection of customer services, our staff, revenue generation, the integrity of data and documents and meeting regulatory requirements.
Each business has its own recovery plan, which is developed following the completion of a Business Impact Analysis. This determines how much time the business could sustain an outage before the level of losses becomes unacceptable, i.e. its criticality. These plans are reviewed and tested every year. The planning is undertaken against Group policy and standards and each business confirms in an annual compliance certificate that all have been met. Should there be exceptions, these are raised and their short-term resolution is overseen by Group and regional business continuity teams.
It is important that plans are dynamic and meet all risks, particularly those of an emerging nature such as possible pandemics and cyber-attacks. The ORMF is used to measure our resilience to these risks, and is confirmed to Group and regional risk committees.
Resilience is managed through various risk mitigation measures. These include agreeing with IT acceptable recovery times of systems, ensuring our critical buildings have the correct infrastructure to enable ongoing operations, requiring critical vendors to have their own recovery plans and arranging with Group Insurance appropriate cover for business interruption costs.
The Financial Intelligence Unit is jointly administered by Security and Fraud Risk and Financial Crime Compliance. It uses advanced analytics and subject matter expertise to detect indicators of financial crime in the Group’s clients and counter-parties.
The Physical Security function develops practical physical, electronic and operational counter-measures to ensure that the people, property and assets managed by the Group are protected from crime, theft, attack and groups hostile to HSBC’s interests.
Geopolitical risk unit provides both regular and ad hoc reporting to business executives and senior Security and Fraud Risk management on geopolitical risk profiles and evolving threats in countries in which the Group operates. This both enhances strategic business planning and provides an early view into developing security risks. Security travel controls and guidance are also maintained.
Systems risk (Unaudited)
Systems risk is the risk of failure or other deficiency in the automated platforms that support the Group’s daily execution (application systems) and the systems infrastructure on which they reside (data centres, networks and distributed computers).
The management of systems risk is overseen globally by the HSBC Technology and Services (‘HTS’) organisation. Oversight is provided through monthly risk management committee meetings that provide a comprehensive overview of existing and emerging top risks.
HTS line management manages the control environment over systems risks using risk and control assessments and scenario analysis. Key risk indicators are used to assure a consistent basis of risk evaluation across geographical and line of business boundaries. Material risks are monitored through the periodic testing of associated key controls.
Business-critical services have been identified through a central, global oversight body. Quantitative scorecards, called risk appetite statements, are used for monitoring performance, and have been established for each of these services.

HSBC HOLDINGS PLC
231
Str
ateg
ic R
epo
rt
Fi
nan
cial
Rev
iew
Co
rpo
rate
Go
vern
ance
Fin
anci
al S
tate
men
ts
S
har
eho
lder
Info
rmat
ion
Service Resilience and Systems Continuity Planning functions are in place to ensure systems meet agreed target service levels and, in the event of major disruptive events, can be recovered within recovery time objectives agreed with the business.
Vendor risk management (Unaudited)
Our vendor risk management (‘VRM’) programme is a global framework for managing risk with third party vendors, especially where we are reliant on outsourced agreements to provide critical services to our customers. VRM contains a rigorous process to identify material contracts and their key risks and ensure controls are in place to manage and mitigate these risks. Global and regional governance structures have been implemented to oversee vendor third party service providers.
Risk management of insurance operations
Overview of insurance products (Audited)
HSBC manufactures the following main classes of contract:
• life insurance contracts with discretionary participation features (‘DPF’); • credit life insurance business; • annuities; • term assurance and critical illness policies; • linked life insurance; • investment contracts with DPF; • unit-linked investment contracts; and • other investment contracts (including pension contracts written in Hong Kong).
We additionally write a small amount of non-life insurance business primarily covering personal and commercial property.
Nature and extent of risks (Audited)
The majority of the risks in our Insurance business derive from manufacturing activities and can be categorised between financial risks and insurance risk; financial risks include market risk, credit risk and liquidity risk. Operational and sustainability risks are also present and are covered by the Group’s respective overall risk management processes.
The following sections describe how financial risks and insurance risk are managed. The assets of insurance manufacturing subsidiaries are included within the consolidated risk disclosures on pages 111 to 203, although separate disclosures in respect of insurance manufacturing subsidiaries are provided in the ‘Risk management of insurance operations’ section on pages 190 to 198.
Insurance manufacturers establish control procedures complying with the guidelines and requirements issued by Group Insurance and local regulatory requirements. Country level oversight is exercised by local risk management committees. Country Chief Risk Officers have direct reporting lines into local Insurance Chief Executive Officers and functional reporting lines into the Group Insurance Chief Risk Officer, who has overall accountability for risk management in insurance operations globally. The Group Insurance Executive Committee oversees the control framework globally and is accountable to the RBWM Risk Management Committee on risk matters.
In addition, local ALCOs monitor and review the duration and cash flow matching of insurance assets and liabilities.
All insurance products, whether manufactured internally or by a third party, are subjected to a product approval process prior to introduction.
Financial risks (Audited)
Our insurance businesses are exposed to a range of financial risks, including market risk, credit risk and liquidity risk. Market risk includes interest rate, equity and foreign exchange risks. The nature and management of these risks is described below.
Manufacturing subsidiaries are exposed to financial risks when, for example, the proceeds from financial assets are not sufficient to fund the obligations arising from insurance and investment contracts. In many jurisdictions, local regulatory requirements prescribe the type, quality and concentration of assets that these subsidiaries must maintain to meet insurance liabilities. These requirements complement Group-wide policies.

Report of the Directors: Risk (continued) Appendix to Risk – Policies and practices
HSBC HOLDINGS PLC
232
Market risk (Audited)
Description of market risk
The main features of products manufactured by our insurance manufacturing subsidiaries which generate market risk, and the market risk to which these features expose the subsidiaries, are discussed below.
Interest rate risk arises to the extent that yields on the assets are lower than the investment returns implied by the guarantees payable to policyholders by insurance manufacturing subsidiaries. When the asset yields are below guaranteed yields, products may be closed to new business, repriced or restructured. A list of the different types of guarantees within our insurance contracts is outlined below.
Categories of guaranteed benefits • annuities in payment; • deferred/immediate annuities: these consist of two phases – the savings and investing phase and the retirement income phase; • annual return: the annual return is guaranteed to be no lower than a specified rate. This may be the return credited to the
policyholder every year, or the average annual return credited to the policyholder over the life of the policy, which may occur on the maturity date or the surrender date of the contract; and
• capital: policyholders are guaranteed to receive no less than the premiums paid plus declared bonuses less expenses.
The proceeds from insurance and investment products with DPF are primarily invested in bonds with a proportion allocated to other asset classes in order to provide customers with the potential for enhanced returns. Subsidiaries with portfolios of such products are exposed to the risk of falls in market prices which cannot be fully reflected in the discretionary bonuses. An increase in market volatility could also result in an increase in the value of the guarantee to the policyholder.
Long-term insurance and investment products typically permit the policyholder to surrender the policy or let it lapse at any time. When the surrender value is not linked to the value realised from the sale of the associated supporting assets, the subsidiary is exposed to market risk. In particular, when customers seek to surrender their policies when asset values are falling, assets may have to be sold at a loss to fund redemptions.
A subsidiary holding a portfolio of long-term insurance and investment products, especially with DPF, may attempt to reduce exposure to its local market by investing in assets in countries other than that in which it is based. These assets may be denominated in currencies other than the subsidiary’s local currency. Where the foreign exchange exposure associated with these assets is not hedged, for example because it is not cost effective to do so, this exposes the subsidiary to the risk of its local currency strengthening against the currency of the related assets.
For unit-linked contracts, market risk is substantially borne by the policyholder, but market risk exposure typically remains as fees earned for management are related to the market value of the linked assets.
Asset and liability matching
It is not always possible to match asset and liability durations, partly because there is uncertainty over policyholder behaviour which introduces uncertainty over the receipt of all future premiums and the timing of claims, and partly because the forecast payment dates of liabilities may exceed the duration of the longest dated investments available.
We use models to assess the effect of a range of future scenarios on the values of financial assets and associated liabilities, and ALCOs employ the outcomes in determining how to best structure asset holdings to support liabilities. The scenarios include stresses applied to factors which affect insurance risk such as mortality and lapse rates. Of particular importance is assessing the expected pattern of cash inflows against the benefits payable on the underlying contracts, which can extend for many years.
Our current portfolio of assets includes debt securities issued at a time when yields were higher than those observed in the current market. As a result, yields on extant holdings of debt securities exceed those available on current issues. We reduced short-term bonus rates paid to policyholders on certain participating contracts to manage the immediate strain on the business. Should interest rates and yield curves remain low further reductions may be necessary.
How market risk is managed
All our insurance manufacturing subsidiaries have market risk mandates which specify the investment instruments in which they are permitted to invest and the maximum quantum of market risk which they may retain. They manage market risk by using some or all of the techniques listed below, depending on the nature of the contracts they write.
Techniques for managing market risk • for products with DPF, adjusting bonus rates to manage the liabilities to policyholders. The effect is that a significant portion of the
market risk is borne by the policyholder; • structuring asset portfolios to support projected liability cash flows; • using derivatives, to a limited extent, to protect against adverse market movements or better match liability cash flows;

HSBC HOLDINGS PLC
233
Str
ateg
ic R
epo
rt
Fi
nan
cial
Rev
iew
Co
rpo
rate
Go
vern
ance
Fin
anci
al S
tate
men
ts
S
har
eho
lder
Info
rmat
ion
• for new products with investment guarantees, considering the cost when determining the level of premiums or the price structure; • periodically reviewing products identified as higher risk, which contain investment guarantees and embedded optionality features
linked to savings and investment products; • including features designed to mitigate market risk in new products, such as charging surrender penalties to recoup losses incurred
when policyholders surrender their policies; • exiting, to the extent possible, investment portfolios whose risk is considered unacceptable; and • repricing of premiums charged to policyholders.
In the product approval process, the risks embedded in new products are identified and assessed. When, for example, options and guarantees are embedded in new products, the due diligence process ensures that complete and appropriate risk management procedures are in place. For all but the simplest of guaranteed benefits the assessment is undertaken by Group Insurance. Management reviews certain exposures more frequently when markets are more volatile to ensure that any matters arising are dealt with in a timely fashion.
How the exposure to market risk is measured
Our insurance manufacturing subsidiaries monitor exposures against mandated limits regularly and report them to Group Insurance. Exposures are aggregated and reported on a quarterly basis to senior risk management forums in Group Insurance.
In addition, large insurance manufacturing subsidiaries perform a high-level monthly assessment of market risk exposure against risk appetite. This is submitted to Group Insurance and a global assessment presented to the RBWM Risk Management Committee.
Standard measures for quantifying market risks • for interest rate risk, the sensitivities of the net present values of asset and expected liability cash flows, in total and by currency, to a
one basis point parallel shift in the discount curves used to calculate the net present values; • for equity price risk, the total market value of equity holdings and the market value of equity holdings by region and country; and • for foreign exchange risk, the total net short foreign exchange position and the net foreign exchange positions by currency.
The standard measures are relatively straightforward to calculate and aggregate, but they have limitations. The most significant one is that a parallel shift in yield curves of one basis point does not capture the non-linear relationships between the values of certain assets and liabilities and interest rates. Non-linearity arises, for example, from investment guarantees and product features which enable policyholders to surrender their policies. We bear the shortfall if the yields on investments held to support contracts with guaranteed benefits are less than the investment returns implied by the guaranteed benefits.
We recognise these limitations and augment our standard measures with stress tests which examine the effect of a range of market rate scenarios on the aggregate annual profits and total equity of our insurance manufacturing subsidiaries, after taking into consideration tax and accounting treatments where material and relevant. The results of these tests are reported to Group Insurance and risk committees every quarter.
The table, ‘Sensitivity of HSBC’s insurance manufacturing subsidiaries to market risk factors’ on page 195, indicates the sensitivity of insurance manufacturers profit and total equity to market risk factors.
Credit risk (Audited)
Description of credit risk
Credit risk arises in two main areas for our insurance manufacturers:
(i) risk of default by debt security counterparties after investing premiums to generate a return for policyholders and shareholders; and
(ii) risk of default by reinsurance counterparties and non-reimbursement for claims made after ceding insurance risk.
How credit risk is managed
Our insurance manufacturing subsidiaries are responsible for the credit risk, quality and performance of their investment portfolios. Our assessment of the creditworthiness of issuers and counterparties is based primarily upon internationally recognised credit ratings and other publicly available information.
Investment credit exposures are monitored against limits by our local insurance manufacturing subsidiaries, and are aggregated and reported to Group Insurance Credit Risk and Group Credit Risk. Stress testing is performed by Group Insurance on the investment credit exposures using credit spread sensitivities and default probabilities.

Report of the Directors: Risk (continued) Appendix to Risk – Policies and practices
HSBC HOLDINGS PLC
234
We use a number of tools to manage and monitor credit risk. These include a Credit Watch Report which contains a watch-list of investments with current credit concerns and is circulated fortnightly to senior management in Group Insurance and the individual Country Chief Risk Officers to identify investments which may be at risk of future impairment.
Liquidity risk (Audited)
Description of liquidity risk
It is an inherent characteristic of almost all insurance contracts that there is uncertainty over the amount of claims liabilities that may arise and the timing of their settlement, and this creates liquidity risk.
There are three aspects to liquidity risk. The first arises in normal market conditions and is referred to as funding liquidity risk; specifically, the capacity to raise sufficient cash when needed to meet payment obligations. Secondly, market liquidity risk arises when the size of a particular holding may be so large that a sale cannot be completed around the market price. Finally, standby liquidity risk refers to the capacity to meet payment terms in abnormal conditions.
How liquidity risk is managed
Our insurance manufacturing subsidiaries primarily fund cash outflows arising from claim liabilities from the following sources of cash inflows:
• premiums from new business, policy renewals and recurring premium products; • interest and dividends on investments and principal repayments of maturing debt investments; • cash resources; and • the sale of investments.
They manage liquidity risk by utilising some or all of the following techniques:
• matching cash inflows with expected cash outflows using specific cash flow projections or more general asset and liability matching techniques such as duration matching;
• maintaining sufficient cash resources; • investing in good credit-quality investments with deep and liquid markets to the degree to which they exist; • monitoring investment concentrations and restricting them where appropriate, for example, by debt issues or issuers;
and • establishing committed contingency borrowing facilities.
Each of these techniques contributes to mitigating the three types of liquidity risk described above.
Every quarter, our insurance manufacturing subsidiaries are required to complete and submit liquidity risk reports to Group Insurance for collation and review. Liquidity risk is assessed in these reports by measuring changes in expected cumulative net cash flows under a series of stress scenarios designed to determine the effect of reducing expected available liquidity and accelerating cash outflows. This is achieved, for example, by assuming new business or renewals are lower, and surrenders or lapses are greater, than expected.
Insurance risk (Audited)
Insurance risk is the risk, other than financial risk, of loss transferred from the holder of the insurance contract to the issuer (HSBC). The principal risk we face in manufacturing insurance contracts is that, over time, the cost of acquiring and administering a contract, claims and benefits may exceed the aggregate amount of premiums received and investment income.
The cost of claims and benefits can be influenced by many factors, including mortality and morbidity experience, lapse and surrender rates and, if the policy has a savings element, the performance of the assets held to support the liabilities.
Insurance risks are controlled by high-level policies and procedures set both centrally and locally, taking into account where appropriate local market conditions and regulatory requirements. Formal underwriting, reinsurance and claims-handling procedures designed to ensure compliance with regulations are applied, supplemented with stress testing.
As well as exercising underwriting controls, we use reinsurance as a means of mitigating exposure to insurance risk. Where we manage our exposure to insurance risk through the use of third-party reinsurers, the associated revenue and manufacturing profit is ceded to the reinsurers. Although reinsurance provides a means of managing insurance risk, such contracts expose us to credit risk, the risk of default by the reinsurer.
The principal drivers of our insurance risk are described below. The liabilities for long-term contracts are set by reference to a range of assumptions around these drivers. These typically reflect the issuers’ own experiences. The type and quantum of insurance risk arising from life insurance depends on the type of business, and varies considerably.
• mortality and morbidity: the main contracts which generate exposure to these risks are term assurance, whole life products, critical illness and income protection contracts and annuities. The risks are monitored on a regular basis,

HSBC HOLDINGS PLC
235
Str
ateg
ic R
epo
rt
Fi
nan
cial
Rev
iew
Co
rpo
rate
Go
vern
ance
Fin
anci
al S
tate
men
ts
S
har
eho
lder
Info
rmat
ion
and are primarily mitigated by underwriting controls and reinsurance and by retaining the ability in certain cases to amend premiums in the light of experience;
• lapses and surrenders: the risks associated with this are generally mitigated by product design, the application of surrender charges and management actions, for example, managing the level of bonus payments to policyholders. A detailed persistency analysis at a product level is carried out at least on an annual basis; and
• expense risk is mitigated by pricing, for example, retaining the ability in certain cases to amend premiums and/or policyholder charges based on experience, and cost management discipline.
Liabilities are affected by changes in assumptions (see ‘Sensitivity analysis’ on page 198).
Reputational risk (Unaudited)
We regularly review our policies and procedures for safeguarding against reputational risk. This is an evolutionary process which takes account of relevant developments, industry guidance, best practice and societal expectations.
We have always aspired to the highest standards of conduct and, as a matter of routine, take account of reputational risks to our business. Reputational risks can arise from a wide variety of causes. As a banking group, our good reputation depends not only upon the way in which we conduct our business, but also by the way in which clients to whom we provide financial services, and our vendors, conduct themselves.
The Global Head of Financial Crime Compliance and the Global Head of Regulatory Compliance are the risk stewards for reputational risk. The development of policies, and an effective control environment for the identification, assessment, management and mitigation of reputational risk, is co-ordinated through the Group Reputational Risk Policy Committee (‘GRRPC’), which is chaired by the Group Chairman. The primary role of the GRRPC is to consider areas and activities presenting significant reputational risk and, where appropriate, to make recommendations to the Group Risk Management Meeting for policy or procedural changes to mitigate such risk. Each of the Group’s geographical regions is required to ensure that reputational risks are also considered at a regional level, either through a special section of their respective Regional Risk Management Committee meetings, or a Regional Reputational Risk Policy Committee. A summary of the minutes from the regional meetings is tabled at GRRPC. Significant issues posing reputational risk are reported to Group Risk Committee and the Holdings Board and, where appropriate, to the Conduct & Values Committee.
In July 2014, the new Reputational Risk and Customer Selection policies were issued which define a consistent and structured approach to managing these risks. For further details, see ‘Reputational risk’ on page 199. Each of the global businesses and functions is required to have a procedure to assess and address reputational risks potentially arising from proposed business transactions and client activity. These are supported by a central team which ensures that issues are directed to the appropriate forum, that decisions taken are implemented and that management information is collated and actions reported to senior management. In 2014, the combined Reputational Risk and Client Selection committees were created within the global businesses with a clear process to escalate and address matters at the appropriate level. The global functions manage and escalate reputational risks within established operational risk frameworks.
Standards on all major aspects of business are set for HSBC and for individual subsidiaries, businesses and functions. Reputational risks, including environmental, social and governance matters, are considered and assessed by the Board, the GMB, the Risk Management Meeting, the Global Standards Steering Meeting, subsidiary company boards, Board committees and senior management during the formulation of policy and the establishment of our standards. These policies, which form an integral part of the internal control system (see page 288), are communicated through manuals and statements of policy and are promulgated through internal communications and training. The policies set out our risk appetite and operational procedures in all areas of reputational risk, including money laundering deterrence, counter-terrorist financing, environmental impact, anti-bribery and corruption measures and employee relations. The policy manuals address risk issues in detail and co-operation between Group departments and businesses is required to ensure a strong adherence to our risk management system and our sustainability practices.
Fiduciary risk (Unaudited)
Business activities in which fiduciary risk is inherent are only permitted within designated lines of business. Fiduciary risk is managed within the designated businesses via a comprehensive policy framework and monitoring of key indicators. The Group’s principal fiduciary businesses and activities (‘designated businesses and activities’) are:
• HSBC Securities Services, which is exposed to fiduciary risk via its Funds Services and Corporate Trust and loan agency activities;
• HSBC Global Asset Management, which is exposed to fiduciary risks via its investment management activities on behalf of clients;
• HSBC Global Private Banking, which is exposed to fiduciary risks via its private trust division and discretionary investment management;

Report of the Directors: Risk (continued) Appendix to Risk – Policies and practices
HSBC HOLDINGS PLC
236
• HSBC Insurance, which is exposed to fiduciary risks via the investment management activities it undertakes when providing insurance products and services;
• RBWM Trust Investment Wrappers, required by regulation for the provision of normal RBWM Wealth Management products and services; and
• HSBC Employee Pension Scheme activities, where fiduciary duties may arise as part of carrying out a function of discretion or control over an HSBC employee pension scheme's operations.
The Group’s requirements for the management of fiduciary risk are laid down in the fiduciary section of the Global Risk Functional Instruction Manual, which is owned by Global Operational Risk. No business other than the designated businesses may undertake fiduciary activities without notifying Global Operational Risk and receiving specific dispensations from the relevant fiduciary policy requirements.
Other policies around the provision of advice, including investment advice and corporate advisory, and the management of potential conflicts of interest, also mitigate our fiduciary risks.
Pension risk (Audited)
We operate a number of pension plans throughout the world, as described in the Pension risk section on page 200 and below.
In order to fund the benefits associated with defined benefit plans, sponsoring Group companies (and, in some instances, employees) make regular contributions in accordance with advice from actuaries and in consultation with the scheme’s trustees (where relevant). The defined benefit plans invest these contributions in a range of investments designed to meet their long-term liabilities.
The level of these contributions has a direct impact on HSBC’s cash flow and would normally be set to ensure that there are sufficient funds to meet the cost of the accruing benefits for the future service of active members. However, higher contributions will be required when plan assets are considered insufficient to cover the existing pension liabilities. Contribution rates are typically revised annually or triennially, depending on the plan. The agreed contributions to the principal plan are revised triennially.
A deficit in a defined benefit plan may arise from a number of factors, including:
• investments delivering a return below that required to provide the projected plan benefits. This could arise, for example, when there is a fall in the market value of equities, or when increases in long-term interest rates cause a fall in the value of fixed income securities held;
• the prevailing economic environment leading to corporate failures, thus triggering write-downs in asset values (both equity and debt);
• a change in either interest rates or inflation which causes an increase in the value of the scheme liabilities; and
• scheme members living longer than expected (known as longevity risk).
A plan’s investment strategy is determined after taking into consideration the market risk inherent in the investments and its consequential impact on potential future contributions. The long-term investment objectives of both HSBC and, where relevant and appropriate, the trustees are:
• to limit the risk of the assets failing to meet the liabilities of the plans over the long-term; and • to maximise returns consistent with an acceptable level of risk so as to control the long-term costs of the defined
benefit plans.
In pursuit of these long-term objectives, a benchmark is established for the allocation of the defined benefit plan assets between asset classes. In addition, each permitted asset class has its own benchmarks, such as stock market or property valuation indices and, where relevant, desired levels of out-performance. The benchmarks are reviewed at least triennially within 18 months of the date at which an actuarial valuation is made, or more frequently if required by local legislation or circumstances. The process generally involves an extensive asset and liability review.
Ultimate responsibility for investment strategy rests with either the trustees or, in certain circumstances, a management committee. The degree of independence of the trustees from HSBC varies in different jurisdictions.
Defined contribution plans result in far less exposure to market risk for the bank, but remain exposed to operational and reputational risks as they place the responsibility and flexibility more directly with employees. To manage these risks, the performance of defined contribution investment funds are monitored and local engagement with employees is actively promoted to ensure they are provided with sufficient information about the options available to them.
Pension plans in the UK
The HSBC Bank (UK) Pension Scheme (the principal plan) has both defined benefit and defined contribution sections. The defined benefit section accounts for approximately 72% of our total defined benefit obligations around the world. The defined benefit section was closed to new entrants in 1996 and from 1 July 2015 it will be closed to further accrual for

HSBC HOLDINGS PLC
237
Str
ateg
ic R
epo
rt
Fi
nan
cial
Rev
iew
Co
rpo
rate
Go
vern
ance
Fin
anci
al S
tate
men
ts
S
har
eho
lder
Info
rmat
ion
current employees who are in that section, who will join the defined contribution section for future pensions. All new employees have joined the defined contribution section since 1996. The principal plan is overseen by an independent corporate trustee who has a fiduciary responsibility for the operation of the pension plan. The trustee is responsible for monitoring and managing the investment strategy and administration of scheme benefits. The principal plan holds a diversified portfolio of investments to meet future cash flow liabilities arising from accrued benefits as they fall due to be paid. The trustee of the principal plan is required to produce a written Statement of Investment Principles which governs decision-making about how investments are made and the need for adequate diversification is taken into account in the choice of asset allocation and manager structure in the defined benefit section. Longevity risk in the principal plan is assessed as part of the measurement of the pension liability and managed through the funding process of the plan.
Sustainability risk (Unaudited)
Sustainability risks arise from the provision of financial services to companies or projects which run counter to the needs of sustainable development; in effect, this risk arises when the environmental and social effects outweigh economic benefits. Within Group Head Office, a separate function, Global Corporate Sustainability, is mandated to manage these risks globally working through local offices as appropriate. Sustainability Risk Managers have regional or national responsibilities for advising on and managing environmental and social risks. Global Corporate Sustainability’s risk management responsibilities include:
• formulating sustainability risk policies. This includes overseeing our sustainability risk standards, our application of the Equator Principles and our sustainability policies (covering agricultural commodities, chemicals, defence, energy, forestry, freshwater infrastructure, mining and metals, and World Heritage Sites and Ramsar Wetlands); undertaking an independent review of transactions where sustainability risks are assessed to be high; and supporting our operating companies to assess similar risks of a lower magnitude;
• building and implementing systems-based processes to ensure consistent application of policies, reduce the costs of sustainability risk reviews and capture management information to measure and report on the effect of our lending and investment activities on sustainable development; and
• providing training and capacity building within our operating companies to ensure sustainability risks are identified and mitigated consistently to either our own standards, international standards or local regulations, whichever is higher.

Report of the Directors: Capital (continued) Overview / Risk-weighted assets
HSBC HOLDINGS PLC
238
Capital Page App1 Tables Page
Capital overview 239 Capital ratios 239
Capital management 257 Total regulatory capital and risk-weighted assets 239Approach and policy 257Stress testing 257Risks to capital 257Risk-weighted asset targets 257Capital generation 258
Capital measurement and allocation 258Regulatory capital 258Pillar 1 capital requirements 258Pillar 2 capital requirements 259Pillar 3 disclosure requirements 260
Risk-weighted assets 239 RWAs by risk type 240 RWAs by global businesses 240 RWAs by geographical regions 240Credit risk RWAs 240 Credit risk exposure – RWAs by geographical region 240 Credit risk exposure – RWAs by global businesses 240
RWA movement by geographical regions by key driver –
credit risk – IRB only 242
RWA movement by global businesses by key driver –
credit risk – IRB only 242 Counterparty credit risk and market risk RWAs 243 Counterparty credit risk RWAs 243
RWA movement by key driver – counterparty
credit risk – advanced approach 243 Market risk RWAs 244
RWA movement by key driver – market risk –
internal model based 244
Capital and RWA movements by major driver – CRD IV
end point basis 245 Operational risk RWAs 244RWA movement by key driver – basis of
preparation and supporting notes 260 Credit risk drivers – definitions and quantifications 260Counterparty risk drivers – definitions and
quantifications 261 Market risk drivers – definitions and
quantifications 261
Capital structure 245 Source and application of total regulatory capital 245 Composition of regulatory capital 246
Reconciliation of regulatory capital from transitional basis
to an estimated CRD IV end point basis 247 Regulatory balance sheet 248 Reconciliation of balance sheets – financial accounting to
regulatory scope of consolidation 249 Regulatory and accounting consolidations 248
Leverage ratio 251 Estimated leverage ratio 251Leverage ratio: basis of preparation 261
Regulatory developments 252Regulatory capital buffers 252 Capital requirements framework 254Regulatory stress testing 254RWA developments 254Leverage ratio proposals 255Banking structural reform and recovery and
resolution planning 255
Other regulatory updates 256
1 Appendix to Capital.

HSBC HOLDINGS PLC
239
Str
ateg
ic R
epo
rt
Fi
nan
cial
Rev
iew
Co
rpo
rate
Go
vern
ance
Fin
anci
al S
tate
men
ts
S
har
eho
lder
Info
rmat
ion
Our objective in the management of Group capital is to maintain appropriate levels of capital to support our business strategy and meet our regulatory and stress testing related requirements.
Capital highlights
• The transitional CET1 ratio of 10.9% was up from 10.8% at the end of 2013 as a result of continued capital generation and management initiatives offset by RWA growth, foreign exchange movements and regulatory changes.
• The end point CET1 ratio of 11.1% was up from 10.9% at the end of 2013 as a result of similar drivers.
Capital overview (Unaudited)
Capital ratios (Unaudited) At 31 December 2014 2013 % %CRD IV transitional Common equity tier 1 ratio 10.9 10.8Tier 1 ratio 12.5 12.0Total capital ratio 15.6 14.9
CRD IV end point Common equity tier 1 ratio 11.1 10.9
Basel 2.5 Core tier 1 ratio n/a 13.6Tier 1 ratio n/a 14.5Total capital ratio n/a 17.8 Total regulatory capital and risk-weighted assets (Unaudited) CRD IV CRD IV
transitional at
transitional estimated at
Basel 2.5 at
31 Dec 2014 31 Dec 2013 31 Dec 2013 US$m US$m US$mCommon equity tier 1
capital
133,200 131,233 Core tier 1 capital 149,051Additional tier 1 capital 19,539 14,408 9,104Tier 2 capital 37,991 35,538 35,854
Total regulatory capital 190,730 181,179 194,009
Risk-weighted assets 1,219,765 1,214,939 1,092,653
On 1 January 2014, CRD IV came into force and capital and RWAs at 31 December 2014 are calculated and presented on the Group’s interpretation of final CRD IV legislation and final rules issued by the PRA. Prior to 1 January 2014, RWAs and capital were calculated and presented in accordance with the previous regime under CRD III, also referred to as ‘Basel 2.5’. As a result, unless otherwise stated, comparatives for capital and RWAs at 31 December 2013 are on a Basel 2.5 basis.
The capital and RWAs on a CRD IV basis incorporate the effect of the PRA’s final rules as set out in the PRA Rulebook. This transposed various areas of national discretion within the final CRD IV legislation into UK law. In its final rules, the PRA did not adopt most of the CRD IV transitional provisions available, instead opting for an acceleration of the CRD IV end point definition of common equity tier 1 (‘CET1’) capital. However, CRD IV
transitional provisions for unrealised gains were applied, such that unrealised gains on investment property and available-for-sale securities are not recognised for capital until 1 January 2015. As a result, our transitional capital ratio in 2014 is slightly lower than the comparable end point capital ratio.
In April 2014, the PRA published its rules and supervisory statements implementing some of the CRD IV provisions relating to capital buffers, further details of which are provided in the ‘Regulatory capital buffers’ section on page 252.
In June 2014, the PRA published its revised expectations in relation to capital ratios for major UK banks and building societies, namely that from 1 July 2014 we are expected to meet a 7% CET1 ratio using the CRD IV end point definition. This applies alongside CRD IV requirements.
Despite the rules published to date, there remains continued uncertainty around the amount of capital that UK banks will be required to hold. This relates specifically to the quantification and interaction of capital buffers and Pillar 2. The PRA is currently consulting on their revised approach to Pillar 2, the PRA buffer and its interaction with the CRD IV buffers. Furthermore, there are a significant number of draft and unpublished EBA technical and implementation standards due in 2015.
Our approach to managing Group capital is designed to ensure that we exceed current regulatory requirements and that we respect the payment priority of our capital providers. Throughout 2014, we complied with the PRA’s regulatory capital adequacy requirements, including those relating to stress testing. We are also well placed to meet our expected future capital requirements.
During 2014, we managed our capital position to meet an internal target CET1 ratio on an end point basis of greater than 10%. This has since been reviewed, and in 2015 we expect to manage Group capital to meet a medium-term target for return on equity of more than 10%. This is modelled on a CET1 ratio on an end point basis in the range of 12% to 13%. A summary of our policies and practices regarding capital management, measurement and allocation is provided in the Appendix to Capital on page 257.
Risk-weighted assets (Unaudited)
CRD IV contributed to an increased capital requirement. The key changes introduced were:
• securitisation positions which were previously deducted 50% from core tier 1 and 50% from total capital, are now included in RWAs at 1,250%;
• an additional capital charge to cover the risk of mark-to-market losses on expected counterparty risk referred to as credit valuation adjustment (‘CVA’) risk;
• deferred tax assets and significant investments, subject to thresholds, are now risk weighted at 250%;

Report of the Directors: Capital (continued) Risk weighted-assets
HSBC HOLDINGS PLC
240
• increased risk weights on exposures to financial institutions, referred to as asset value correlation (‘AVC’); and
• new requirements for exposures to central counterparties (‘CCP’). There are enhanced incentives for clearing OTC derivative transactions through CCP.
RWAs by risk type (Unaudited)
CRD IV transitional
and end point Basel 2.5
basis 2014 2013 2013 US$bn US$bn US$bn
Credit risk 955.3 936.5 864.3Standardised approach 356.9 358.6 329.5IRB foundation approach 16.8 13.5 13.6IRB advanced approach 581.6 564.4 521.2
Counterparty credit risk 90.7 95.8 45.8Standardised approach 25.2 36.6 3.6Advanced approach 65.5 59.2 42.2
Market risk 56.0 63.4 63.4
Operational risk 117.8 119.2 119.2
At 31 December 1,219.8 1,214.9 1,092.7
Of which: US run-off portfolios 99.2 142.3 104.9Legacy credit in GB&M 44.1 63.7 26.4US CML and Other 55.1 78.6 78.5Card and Retail Services1 – 1.1 1.1
For footnotes, see page 256.
RWAs by global businesses (Unaudited)
CRD IV transitional
and end point Basel 2.5
basis 2014 2013
US$bn US$bnRetail Banking and Wealth
Management 205.1 233.5 Commercial Banking 432.4 391.7Global Banking and Markets 516.1 422.3Global Private Banking 20.8 21.7Other 45.4 23.5
At 31 December 1,219.8 1,092.7
RWAs by geographical regions2 (Unaudited)
CRD IV transitional
and end point Basel 2.5
basis 2014 2013
US$bn US$bn
Europe 375.4 300.1Asia 499.8 430.7Middle East and North Africa 63.0 62.5North America 221.4 223.8Latin America 88.8 89.5
At 31 December 1,219.8 1,092.7
For footnote, see page 256.
Credit risk RWAs (Unaudited)
Credit risk exposure – RWAs by geographical region
Europe Asia3 MENA North
America Latin
America Total US$bn US$bn US$bn US$bn US$bn US$bnCRD IV basis IRB approach 216.1 213.1 15.6 142.0 11.6 598.4
IRB advanced approach 203.3 213.1 11.6 142.0 11.6 581.6IRB foundation approach 12.8 – 4.0 – – 16.8
Standardised approach 47.1 186.0 39.0 29.6 55.2 356.9
RWAs at 31 December 2014 263.2 399.1 54.6 171.6 66.8 955.3Basel 2.5 basis IRB advanced approach 157.1 182.9 11.2 161.5 8.5 521.2IRB foundation approach 9.8 – 3.8 – – 13.6Standardised approach 44.5 165.9 40.0 22.7 56.4 329.5
RWAs at 31 December 2013 211.4 348.8 55.0 184.2 64.9 864.3
For footnote, see page 256.
Credit risk exposure – RWAs by global businesses
Principal
RBWM
RBWM(US run-off
portfolio) Total
RBWM CMB GB&M GPB Other Total US$bn US$bn US$bn US$bn US$bn US$bn US$bn US$bnCRD IV basis IRB approach 55.9 47.3 103.2 217.4 255.6 10.2 12.0 598.4
IRB advanced approach 55.9 47.3 103.2 209.4 248.1 10.0 10.9 581.6IRB foundation approach – – – 8.0 7.5 0.2 1.1 16.8
Standardised approach 60.4 4.8 65.2 181.8 70.1 6.6 33.2 356.9
RWAs at 31 December 2014 116.3 52.1 168.4 399.2 325.7 16.8 45.2 955.3Basel 2.5 basis
IRB advanced approach 58.4 72.6 131.0 183.2 192.8 10.4 3.8 521.2IRB foundation approach – – 6.3 5.8 0.1 1.4 13.6
Standardised approach 60.6 3.1 63.7 169.3 71.6 6.9 18.0 329.5
RWAs at 31 December 2013 119.0 75.7 194.7 358.8 270.2 17.4 23.2 864.3

HSBC HOLDINGS PLC
241
Str
ateg
ic R
epo
rt
Fi
nan
cial
Rev
iew
Co
rpo
rate
Go
vern
ance
Fin
anci
al S
tate
men
ts
S
har
eho
lder
Info
rmat
ion
Credit risk RWAs are calculated using three approaches, as permitted by the PRA. For consolidated Group reporting, we have adopted the advanced internal ratings-based (‘IRB’) approach for the majority of our business, with a small proportion being on the foundation IRB approach and the remaining portfolios on the standardised approach.
Standardised approach
For portfolios treated under the standardised approach, credit risk RWAs increased by US$27.4bn, which reflected a reduction of US$13.6bn due to foreign exchange movements.
Corporate growth in Asia, Europe, North America and Latin America, including term and trade-related lending, increased RWAs by US$25.0bn, of which growth in our associate, BoCom, accounted for US$6.4bn.
The move to a CRD IV basis increased RWAs on 1 January 2014 by US$7.1bn. This movement mainly comprised material holdings and deferred tax asset amounts in aggregate below the capital threshold risk-weighted at 250% US$28.3bn, partially offset by the reclassification of non-credit obligation assets to the IRB approach for reporting purposes US$16.3bn and the netting of collective impairments against exposure at default under the standardised approach US$3.5bn.
During the year, several individually immaterial portfolios moved from the IRB approach to the standardised approach, increasing standardised RWAs by US$6.0bn and reducing IRB RWAs by US$4.8bn.
The disposal of our operations in Jordan, Pakistan, Colombia and Kazakhstan reduced RWAs by US$1.0bn.
In Asia, movement in the fair value of our material holdings, mainly in Industrial Bank, resulted in an increase in RWAs of US$5.9bn. This was partially offset by the reclassification of Vietnam Technological and Commercial Joint Stock Bank from an associate to an investment, which reduced RWAs by US$1.1bn.
Internal ratings-based approach
Credit risk RWA movements by key driver for portfolios treated under the IRB approach are set out in the tables on page 242 and 243. For basis of preparation on Credit risk, Counterparty credit risk and Market risk RWA flow, see Annual Reports and Accounts Appendix to Capital on page 257. For portfolios treated under the IRB approach, credit risk RWAs increased by US$63.6bn which reflected a reduction of US$20.1bn due to foreign exchange movements driven by the strengthening of the US dollar against other currencies.
Acquisitions and disposals
In GB&M, the sale of ABSs in North America reduced RWAs by US$4.2bn. Additionally, GB&M continued to manage down the securitisation positions held through the sale of certain structured investment conduit positions, lowering RWAs by US$3.0bn in Europe. The disposal of our businesses in Kazakhstan, Colombia, Pakistan and Jordan resulted in a reduction in RWAs of
US$1.2bn in Europe, Latin America, the Middle East and North Africa.
Book size
Book size movement reflected higher corporate lending, including term and trade-related lending, increasing RWAs by US$40.3bn in Asia, Europe and North America for CMB and GB&M. Sovereign book growth in GB&M increased RWAs by US$3.3bn, mainly in Asia, Latin America, the Middle East and North Africa.
In North America, in RBWM, continued run-off of the US CML retail mortgage portfolios resulted in a RWA reduction of US$6.9bn.
Book quality
RWAs reduced by US$8.5bn in the US run-off portfolio, primarily due to continued run-off which resulted in an improvement in the book quality of the residual portfolio.
Book quality improvements in the Principal RBWM business of US$5.9bn related to model recalibrations reflecting improving property prices in the US and favourable changes in portfolio mix reducing RWAs in Europe.
A ratings upgrade for securitisation portfolio resulted in a decrease in RWAs of US$3.2bn.
This was partially offset by adverse movements in average customer credit quality in corporate, sovereign and institutional portfolios in Europe, North America, Middle East, North Africa, Asia and Latin America increased RWAs by US$7.6bn.
Model updates
In Europe, a loss given default (‘LGD’) floor applied to UK corporate portfolios resulted in an increase in RWAs of US$19.0bn in CMB and GB&M.
This was partially offset by model updates in North America, primarily the implementation of new risk models for the US mortgage run-off portfolio, resulting in a decrease in RWAs of US$6.2bn.
Methodology and policy changes
Methodology and policy updates increased RWAs by US$52.2bn.
CRD IV impact
The rise related to the implementation of CRD IV rules at 1 January 2014, which increased RWAs by US$48.2bn. The main CRD IV movements arose from securitisation positions that were previously deducted from capital and are now included as a part of credit risk RWAs and risk-weighted at 1250%, resulting in a US$40.2bn increase in GB&M, primarily Europe. CRD IV also introduced an asset valuation correlation multiplier for financial counterparties, producing a US$9.2bn increase in RWAs primarily in GB&M in Asia and Europe.

Report of the Directors: Capital (continued) Risk-weighted assets
HSBC HOLDINGS PLC
242
Internal updates
A decrease in RWAs of US$9.2bn arose from the set-off of negative AFS reserves against EAD for GB&M legacy credit portfolios.
In Asia, internal methodology changes associated with trade finance products accounted for a reduction in RWAs of US$4.9bn.
Additionally, the transfer of individually immaterial portfolios moving to the standardised approach reduced IRB RWAs by US$4.8bn in Principal RBWM and CMB in most regions and increased RWAs in the standardised approach by US$6.0bn.
The reclassification of part of the mortgage portfolio led to a decrease in RWAs of US$4.5bn in North America, of which US$4.1bn was in the run-off portfolio.
External updates
Selected portfolios with a low default history, mainly in Europe, Asia and North America, were subjected to external updates with the introduction of LGD floors applied to corporates and institutions, increasing RWAs by US$9.8bn. A further RWA floor was introduced on retail mortgages in Asia, resulting in an increase of US$1.7bn.
Non-credit obligation assets
The reclassification of non-credit obligation assets from the standardised to the IRB approach for reporting purposes increased RWAs under the latter approach by US$16.3bn and reduced the STD RWAs by the same amount.
RWA movement by geographical regions by key driver – credit risk – IRB only (Unaudited)
Europe Asia MENA North
America Latin
America Total US$bn US$bn US$bn US$bn US$bn US$bnRWAs at 1 January 2014 on
Basel 2.5 basis
166.9 182.9 15.0 161.5 8.5 534.8
Foreign exchange movement (11.6) (4.0) (0.2) (2.4) (1.9) (20.1)Acquisitions and disposals (3.5) – (0.7) (4.2) (0.1) (8.5)Book size 11.4 19.5 1.8 2.9 2.0 37.6Book quality (1.5) – (0.8) (10.3) 1.4 (11.2)Model updates 19.4 0.3 – (6.1) – 13.6
New/updated models 19.4 0.3 – (6.1) – 13.6
Methodology and policy 35.0 14.4 0.5 0.6 1.7 52.2Internal updates (11.7) (5.2) (0.2) (6.4) (0.1) (23.6)External updates 2.2 8.5 (0.2) 0.7 0.1 11.3CRD IV impact 37.0 5.7 0.4 4.9 0.2 48.2NCOA moving from STD to IRB 7.5 5.4 0.5 1.4 1.5 16.3
Total RWA movement 49.2 30.2 0.6 (19.5) 3.1 63.6
RWAs at 31 December 2014 on CRD IV basis
216.1 213.1 15.6 142.0 11.6 598.4
RWAs at 1 January 2013 on
Basel 2.5 basis 150.7 162.3 12.6 187.1 11.2 523.9
Foreign exchange movement 3.3 (4.5) (0.5) (1.9) (1.0) (4.6)Acquisitions and disposals (1.5) – – (8.6) (1.7) (11.8)Book size 2.1 21.2 1.4 (10.6) 0.2 14.3Book quality (1.5) 5.3 1.3 (10.8) (0.3) (6.0)Model updates 11.6 – 0.1 (0.2) – 11.5
Portfolios moving onto IRB approach 13.4 – – – – 13.4New/updated models (1.8) – 0.1 (0.2) – (1.9)
Methodology and policy 2.2 (1.4) 0.1 6.5 0.1 7.5Internal updates (0.2) (7.8) 0.1 (0.6) 0.1 (8.4)External updates 2.4 6.4 – 7.1 – 15.9
Total RWA movement 16.2 20.6 2.4 (25.6) (2.7) 10.9
RWAs at 31 December 2013 on Basel 2.5 basis
166.9 182.9 15.0 161.5 8.5 534.8
For footnote, see page 256.

HSBC HOLDINGS PLC
243
Str
ateg
ic R
epo
rt
Fi
nan
cial
Rev
iew
Co
rpo
rate
Go
vern
ance
Fin
anci
al S
tate
men
ts
S
har
eho
lder
Info
rmat
ion
RWA movement by global businesses by key driver – credit risk – IRB only (Unaudited)
Principal RBWM
RBWM (US run-off)
Total RBWM CMB GB&M GPB Other Total
US$bn US$bn US$bn US$bn US$bn US$bn US$bn US$bnRWAs at 1 January 2014 on
Basel 2.5 basis
58.4 72.6 131.0 189.5 198.5 10.6 5.2 534.8 Foreign exchange movement (2.6) – (2.6) (8.7) (8.1) (0.2) (0.5) (20.1)Acquisitions and disposals – – – – (8.2) – (0.3) (8.5)Book size 1.8 (6.9) (5.1) 23.2 21.1 (0.5) (1.1) 37.6Book quality (5.7) (8.6) (14.3) 2.8 (0.2) (0.3) 0.8 (11.2)Model updates 0.6 (6.2) (5.6) 12.2 7.0 – – 13.6
New/updated models 0.6 (6.2) (5.6) 12.2 7.0 – – 13.6
Methodology and policy 3.4 (3.6) (0.2) (1.6) 45.5 0.6 7.9 52.2Internal updates (3.0) (3.9) (6.9) (5.0) (11.2) (0.5) – (23.6)External updates 1.8 – 1.8 2.5 6.3 0.5 0.2 11.3CRD IV impact – – – (0.7) 48.6 0.2 0.1 48.2NCOA moving from STD to IRB 4.6 0.3 4.9 1.6 1.8 0.4 7.6 16.3
Total RWA movement (2.5) (25.3) (27.8) 27.9 57.1 (0.4) 6.8 63.6
RWAs at 31 December 2014 on CRD IV basis
55.9 47.3 103.2 217.4 255.6 10.2 12.0 598.4
RBWMUS$bn
CMBUS$bn
GB&MUS$bn
GPBUS$bn
Other US$bn
TotalUS$bn
RWAs at 1 January 2013 on Basel 2.5 basis
163.1 169.0 177.7 9.6 4.5 523.9
Foreign exchange movement (0.4) (1.5) (2.7) 0.1 (0.1) (4.6)Acquisitions and disposals (10.1) (0.1) (1.6) – – (11.8)Book size (12.7) 14.5 13.5 (0.7) (0.3) 14.3Book quality (6.4) 3.5 (3.4) 0.3 – (6.0)Model updates (0.2) 10.1 (1.0) 2.6 – 11.5
Portfolios moving onto IRB approach – 10.0 0.8 2.6 – 13.4New/updated models (0.2) 0.1 (1.8) – – (1.9)
Methodology and policy (2.3) (6.0) 16.0 (1.3) 1.1 7.5Internal updates (2.3) (3.4) (0.6) (2.1) – (8.4)External updates – (2.6) 16.6 0.8 1.1 15.9
Total RWA movement (32.1) 20.5 20.8 1.0 0.7 10.9
RWAs at 31 December 2013 on Basel 2.5 basis
131.0 189.5 198.5 10.6 5.2 534.8
Counterparty credit risk and market risk RWAs (Unaudited)
Counterparty credit risk RWAs (Unaudited) CRD IV basis Basel 2.5 basis 2014 2013 US$bn US$bn
Advanced approach 65.5 42.2CCR IRB approach 62.0 42.2CVA 3.5 –
Standardised approach 25.2 3.5 CCR standardised approach 4.4 3.5 CVA 18.0 – CCP 2.8 –
RWAs at 31 December 90.7 45.7
RWA movement by key driver – counterparty credit risk – advanced approach (Unaudited)
CRD IV basis Basel 2.5 basis2014 2013
US$bn US$bn
RWAs at 1 January 42.2 45.7 0Book size 1.6 (0.9)
Book quality (0.6) (2.7)Model updates 0.1 – Methodology and policy 22.2 0.1
Internal updates (3.8) 0.1External regulatory updates 9.0 –CRD IV impact 17.0 –
Total RWA movement 23.3 (3.5)
RWAs at 31 December 65.5 42.2

Report of the Directors: Capital (continued) Risk-weighted assets / Capital structure
HSBC HOLDINGS PLC
244
Market risk RWAs (Unaudited) CRD IV basis Basel 2.5 basis 2014 2013 US$bn US$bnInternal model based
VaR 7.3 4.9 Stressed VaR 10.4 9.4 Incremental risk charge 20.1 23.1 Comprehensive risk measure – 2.6 Other VaR and stressed VaR 6.8 12.2
Internal model based 44.6 52.2 Standardised approach 11.4 11.2
At 31 December 56.0 63.4 RWA movement by key driver – market risk – internal model based (Unaudited) CRD IV basis Basel 2.5 basis 2014 2013 US$bn US$bn
RWAs at 1 January 52.2 44.5
Acquisitions and disposals (2.2) – Movement in risk levels (4.2) (14.5)Model updates – 17.6 Methodology and policy (1.2) 4.6
Internal updates (3.8) 4.6External updates 2.6 –
Total RWA movement (7.6) 7.7
RWAs at 31 December 44.6 52.2 Counterparty credit risk RWAs
Counterparty credit risk RWAs increased by US$45.0bn, in 2014. The RWA increase of US$21.7bn for the standardised approach mainly relates to the implementation of CRD IV on 1 January 2014, which introduced CVA and CCP RWAs.
Advanced approach Book size The increase in book size was mainly driven by business movements and the impact of the strengthening of the US dollar against other currencies on the mark to market of derivatives contracts.
Model updates In Europe, an LGD floor applied to UK corporate portfolios resulted in an increase in RWAs of US$2.2bn. This was offset by a decrease in RWAs of US$2.0bn due to model updates to the Internal Model Method (‘IMM’) used for selected portfolios in London.
Methodology and policy changes The CVA and AVC multiplier for financial counterparties introduced by the implementation of CRD IV increased RWAs by US$6.8bn and US$10.2bn, respectively, on 1 January 2014.
Within external regulatory and policy updates, selected portfolios were subject to PRA LGD floors, which increased RWAs by US$7.5bn, mainly in Europe and Asia. Additionally, guidance received in the fourth quarter of 2014 led to the application of a ‘potential future
exposure’ charge on sold options, contributing to a US$1.5bn increase in RWAs.
Decreases in RWAs from internal methodology updates were mainly driven by additional CVA exemptions following internal due diligence and review alongside a more efficient allocation of collateral in Europe, which decreased RWAs by US$3.8bn.
Market risk RWAs
Total market risk RWAs decreased by US$7.4bn in 2014.
Standardised approach The market risk RWA movements for portfolios not within the scope of modelled approaches resulted in an increase of US$0.2bn. The increase in RWAs of US$2.6bn related to CRD IV treatment of trading book securitisation positions that were previously deducted from capital. This was offset by reductions in RWAs of US$2.5bn for interest rate position risk, primarily in Latin America due to the introduction of the scenario matrix method for options and a general reduction in positions in Latin America and the US.
Internal model based Acquisitions and disposals The sale of our correlation trading portfolio, reduced comprehensive risk measure RWAs by US$2.0bn. The disposal of our business in Kazakhstan resulted in a reduction of US$0.2bn in RWAs.
Movement in risk levels Movement in risk levels reflected a decrease mainly in VaR and Stressed VaR as a result of reduced FX and Equity trading positions.
Methodology and policy changes The increase in RWAs from external updates related mainly to the introduction, for collateralised transactions, of the basis between the currency of trade and the currency of collateral into the VaR calculation and the removal of the diversification benefit from Risks not in VaR (‘RNIV’) calculations, driving an increase of US$6.7bn.
This was partially offset by decreases in RWAs of US$4.3bn from Internal updates, mainly due to refinements in the RNIV calculation for the Equities and Rates desks.
Further decreases in RWAs following regulatory approval for a change in the basis of consolidation for modelled market risk charges delivered a reduction in RWAs of US$4.1bn.
Operational risk RWAs
The reduction in operational risk RWAs of US$1.4bn was due to the full amortisation of operational risk RWAs for the US CRS portfolio disposed of in May 2012, combined with a lower three-year average operating income.

HSBC HOLDINGS PLC
245
Str
ateg
ic R
epo
rt
Fi
nan
cial
Rev
iew
Co
rpo
rate
Go
vern
ance
Fin
anci
al S
tate
men
ts
S
har
eho
lder
Info
rmat
ion
Capital and RWA movements by major driver – CRD IV end point basis (Unaudited)
CET1 capital RWAs US$bn US$bnCRD IV end point basis at
1 January 20144 132.5 1,214.9 Accounting profit for the period 13.7 –Regulatory adjustments to
accounting profit (1.0) – Dividends net of scrip5 (7.5) –Regulatory change: LGD floors 38.6Corporate lending growth – 64.8Management initiatives: 2.2 (66.3)
– legacy reduction and run-off 2.2 (43.0)
– portfolio and entity disposals – (5.2)
– RWA initiatives – (18.1)
Exchange differences (8.4) (33.6)Other movements 4.5 1.4
CRD IV end point basis at 31 December 2014 136.0 1,219.8
RWAs increased in the year, primarily from corporate lending growth and regulatory change. These have been largely offset by management initiatives and foreign exchange movements. Management initiatives include legacy reduction and run-off, portfolio and entity disposals and a number of other initiatives including a better alignment of VaR scope to management’s view of risk, improved collateral allocation, increased use of IMM and a review of product mappings to regulatory categories.
Capital structure Source and application of total regulatory capital (Audited)
CRD IV transitional
Basel 2.5
Year to 31 Dec 2014 US$m
Year to 31 Dec 2013 US$m
Movement in total regulatory capital Opening common equity/core tier 1 capital4 131,233 138,789
Contribution to common equity/core tier 1 capital from profit for the period 12,678 17,124Consolidated profits attributable to shareholders of the parent company 13,688 16,204Removal of own credit spread net of tax (328) 920Debit valuation adjustment 254 Deconsolidation of insurance entities and SPE entities (936)
Net dividends including foreseeable net dividends5 (7,541) (6,987)Dividends net of scrip recognised under Basel 2.5 (6,987)Update for fourth interim dividend scrip take-up in excess of plan 1,108 First interim dividend net of scrip (1,766) Second interim dividend net of scrip (1,686) Third interim dividend net of scrip (1,835) Fourth foreseeable interim dividend (4,131) Add back: planned scrip take-up 769
Decrease in goodwill and intangible assets deducted 2,424 535Ordinary shares issued 267 297Foreign currency translation differences (8,356) (1,294)
Other, including regulatory adjustments 2,495 587
Closing common equity/core tier 1 capital 133,200 149,051
Opening additional/other tier 1 capital4 14,408 12,259Issued hybrid capital securities net of redemptions 4,961 (1,151)Unconsolidated investments 17 (2,004)Other, including regulatory adjustments 153 –
Closing tier 1 capital 152,739 158,155
Opening other tier 2 capital4 35,538 29,758Issued tier 2 capital securities net of redemptions 2,414 1,609Unconsolidated investments 26 6,447Other, including regulatory adjustments 13 (1,960)
Closing total regulatory capital 190,730 194,009
For footnotes, see page 256.

Report of the Directors: Capital (continued) Capital structure
HSBC HOLDINGS PLC
246
Internal capital generation contributed US$5.1bn to common equity tier 1 capital, being profits attributable to shareholders of the parent company after regulatory adjustment for own credit spread, debit valuation
adjustment, deconsolidation of insurance entities and net of dividends. The 2014 fourth interim dividend is net of planned scrip.
Composition of regulatory capital CRD IV transitional Basel 2.5
Ref
At 31 Dec 2014 (Audited) US$m
Estimated at 31 Dec 2013 (Unaudited) US$m
At 31 Dec 2013 (Audited) US$m
Tier 1 capital Shareholders’ equity 166,617 164,057 173,449
Shareholders’ equity per balance sheet6 a 190,447 181,871 181,871Foreseeable interim dividend5 (3,362) (3,005) Preference share premium b (1,405) (1,405) (1,405)Other equity instruments c (11,532) (5,851) (5,851)Deconsolidation of special purpose entities7 a (323) (1,166) (1,166)Deconsolidation of insurance entities a (7,208) (6,387)
Non-controlling interests 4,640 3,644 4,955Non-controlling interests per balance sheet d 9,531 8,588 8,588Preference share non-controlling interests e (2,127) (2,388) (2,388)Non-controlling interests transferred to tier 2 capital f (473) (488) (488)Non-controlling interests in deconsolidated subsidiaries d (851) (757) (757)Surplus non-controlling interests disallowed in CET1 (1,440) (1,311)
Regulatory adjustments to the accounting basis (6,309) (2,230) 480Unrealised (gains)/losses in available-for-sale debt and equities8 (1,378) – 1,121Own credit spread9 767 1,112 1,037Debit valuation adjustment (197) (451) Defined benefit pension fund adjustment10 g (4,069) (1,731) (518)Reserves arising from revaluation of property (1,375) (1,281) (1,281)Cash flow hedging reserve (57) 121 121
Deductions (31,748) (34,238) (29,833)Goodwill and intangible assets h (22,475) (24,899) (25,198)Deferred tax assets that rely on future profitability
(excludes those arising from temporary differences) n (1,036) (680) Additional valuation adjustment (referred to as PVA) (1,341) (2,006) Investments in own shares through the holding of composite products
of which HSBC is a component (exchange traded funds, derivatives and index stock) (1,083) (677)
50% of securitisation positions (1,684)50% of tax credit adjustment for expected losses 151Negative amounts resulting from the calculation of expected loss amounts i (5,813) (5,976) (3,102)
Common equity/core tier 1 capital 133,200 131,233 149,051 Additional tier 1 capital Other tier 1 capital before deductions 19,687 14,573 16,110
Preference share premium b 1,160 1,160 1,405Preference share non-controlling interests e 1,955 1,955 2,388Allowable non-controlling interest in AT1 d 884 731 Hybrid capital securities j 15,688 10,727 12,317
Deductions (148) (165) (7,006)Unconsolidated investments11 (148) (165) (7,157)50% of tax credit adjustment for expected losses 151
Tier 1 capital 152,739 145,641 158,155

HSBC HOLDINGS PLC
247
Str
ateg
ic R
epo
rt
Fi
nan
cial
Rev
iew
Co
rpo
rate
Go
vern
ance
Fin
anci
al S
tate
men
ts
S
har
eho
lder
Info
rmat
ion
CRD IV transitional Basel 2.5
Ref
At 31 Dec 2014 (Audited) US$m
Estimated at 31 Dec 2013 (Unaudited) US$m
At 31 Dec 2013 (Audited) US$m
Tier 2 capital Total qualifying tier 2 capital before deductions 38,213 35,786 47,812
Reserves arising from revaluation of property and unrealised gains in available-for-sale equities 2,755
Collective impairment allowances k 2,616Allowable non-controlling interest in tier 2 d 99 86 Perpetual subordinated debt l 2,218 2,218 2,777Term subordinated debt m 35,656 33,242 39,364Non-controlling interests in tier 2 capital f 240 240 300
240Total deductions other than from tier 1 capital (222) (248) (11,958)Unconsolidated investments11 (222) (248) (7,157)50% of securitisation positions (1,684)50% negative amounts resulting from the calculation of expected loss
amounts i
(3,102) Other deductions (15)
Total regulatory capital 190,730 181,179 194,009
For footnotes, see page 256.
The references (a) – (n) identify balance sheet components on page 249 which are used in the calculation of regulatory capital.
Reconciliation of regulatory capital from transitional basis to an estimated CRD IV end point basis (Unaudited)
At
31 Dec 2014 Estimated at 31 Dec 2013
US$m US$m
Common equity tier 1 capital on a transitional basis 133,200 131,233Unrealised gains arising from revaluation of property 1,375 1,281Unrealised gains in available for sale reserves 1,378 –
Common equity tier 1 capital end point basis 135,953 132,514
Additional tier 1 capital on a transitional basis 19,539 14,408Grandfathered instruments:
Preference share premium (1,160) (1,160)Preference share non-controlling interests (1,955) (1,955)Hybrid capital securities (10,007) (10,727)
Transitional provisions: Allowable non-controlling interest in AT1 (487) (366)Unconsolidated investments 148 165
Additional tier 1 capital end point basis 6,078 365
Tier 1 capital end point basis 142,031 132,879 Tier 2 capital on a transitional basis 37,991 35,538Grandfathered instruments:
Perpetual subordinated debt (2,218) (2,218)Term subordinated debt (21,513) (21,513)
Transitional provisions: Non-controlling interest in tier 2 capital (240) (240)Allowable non-controlling interest in tier 2 396 345Unconsolidated investments (148) (165)
Tier 2 capital end point basis 14,268 11,747
Total regulatory capital end point basis 156,299 144,626

Report of the Directors: Capital (continued) Regulatory balance sheet
HSBC HOLDINGS PLC
248
The capital position presented on a CRD IV transitional basis follows the CRD IV legislation as implemented in the UK via the PRA’s final rules in the Policy Statement (‘PS 7/13’) issued in December 2013, and as incorporated in the PRA Rulebook.
The effects of draft EBA technical standards are not generally captured in our numbers. These could have additional effects on our capital position and RWAs.
Whilst CRD IV allows for the majority of regulatory adjustments and deductions from CET1 to be implemented on a gradual basis from 1 January 2014 to 1 January 2018, the PRA has largely decided not to make use of these transitional provisions. Due to the exclusion of unrealised gains on investment property and available-for-sale securities which are only capable of being recognised in CET1 capital from 1 January 2015, and PRA acceleration of unrealised losses on these items, our CET1 capital and ratio is lower on a transitional basis than it is on an end point basis.
For additional tier 1 and tier 2 capital, the PRA followed the transitional provisions timing as set out in CRD IV to apply the necessary regulatory adjustments and deductions. The effect of these adjustments is being phased in at 20% per annum from 1 January 2014 to 1 January 2018.
Furthermore, non-CRD IV compliant additional tier 1 and tier 2 instruments benefit from a grandfathering period. This progressively reduces the eligible amount by 10% annually, following an initial reduction of 20% on 1 January 2014, until they are fully phased out by 1 January 2022.
Under CRD IV, as implemented in the UK, banks are required to meet a minimum CET1 ratio of 4.0% of RWAs (increasing to 4.5% from 1 January 2015), a minimum tier 1 ratio of 5.5% of RWAs (increasing to 6% from 1 January 2015) and a total capital ratio of 8% of RWAs. Alongside CRD IV requirements, from 1 July 2014, the PRA expects major UK banks and building societies to meet a 7% CET1 ratio using the CRD IV end point definition. Going forward, as the grandfathering provisions fall away, we intend to meet these regulatory minima in an economically efficient manner by issuing non-common equity capital as necessary. At 31 December 2014, the Group had US$19.8bn of CRD IV compliant non-common equity capital instruments, of which US$3.5bn of tier 2 and US$5.7bn of additional tier 1 were issued during the year (for details on the additional tier 1 instruments issued during the year see Note 35 on the Financial Statements). At 31 December 2014, the Group also had US$37.1bn of non-common equity capital instruments qualifying as eligible capital under CRD IV by virtue of the application of the grandfathering provisions, after applying the 20% reduction outlined above.
Regulatory balance sheet Regulatory and accounting consolidations (Unaudited)
The basis of consolidation for the purpose of financial accounting under IFRS, described in Note 1 on the Financial Statements, differs from that used for regulatory purposes as described in ‘Structure of the regulatory group’ on page 13 of the Pillar 3 Disclosures 2014 report. The table below provides a reconciliation of the financial accounting balance sheet to the regulatory scope of consolidation.
Interests in banking associates are equity accounted in the financial accounting consolidation, whereas their exposures are proportionally consolidated for regulatory purposes in accordance with PRA’s application of EU legislation.
Subsidiaries engaged in insurance activities are excluded from the regulatory consolidation, leaving the investment to be recorded at cost. In prior years, the investment of these insurance subsidiaries was recorded at the net asset value. This change in treatment from 1 January 2014 has been aligned to the capital treatment under CRD IV where we have excluded post-acquisition reserves from our CET1 capital and the investment to be deducted from CET1 (subject to thresholds) valued at cost.
The regulatory consolidation does not include special purpose entities (‘SPEs’) where significant risk has been transferred to third parties. Exposures to these SPEs are risk-weighted as securitisation positions for regulatory purposes.
Entities in respect of which the basis of consolidation for financial accounting purposes differs from that used for regulatory purposes can be found in table 5 of the Pillar 3 Disclosures 2014 report.

HSBC HOLDINGS PLC
249
Str
ateg
ic R
epo
rt
Fi
nan
cial
Rev
iew
Co
rpo
rate
Go
vern
ance
Fin
anci
al S
tate
men
ts
S
har
eho
lder
Info
rmat
ion
Reconciliation of balance sheets – financial accounting to regulatory scope of consolidation (Unaudited) At 31 December 2014
Accountingbalance
sheet
Deconsolidationof insurance/ other entities
Consolidation of banking associates
Regulatorybalance
sheet Ref US$m US$m US$m US$mAssets Cash and balances at central banks 129,957 – 30,731 160,688Items in the course of collection from other banks 4,927 – 80 5,007Hong Kong Government certificates of indebtedness 27,674 – – 27,674Trading assets 304,193 (720) 2,357 305,830Financial assets designated at fair value 29,037 (28,791) 3,312 3,558Derivatives 345,008 (94) 353 345,267Loans and advances to banks 112,149 (2,727) 7,992 117,414Loans and advances to customers 974,660 (10,809) 116,484 1,080,335
of which: – impairment allowances on IRB portfolios i (6,942) – – (6,942)– impairment allowances on standardised portfolios (5,395) – (2,744) (8,139)
Reverse repurchase agreements – non-trading 161,713 (30) 7,510 169,193Financial investments 415,467 (50,420) 33,123 398,170Capital invested in insurance and other entities – 2,542 – 2,542Current tax assets 1,309 (16) – 1,293Prepayments, accrued income and other assets 75,176 (5,295) 8,501 78,382
of which: – goodwill and intangible assets of disposal groups
held for sale h 8 – – 8– retirement benefit assets g (5,028) – – (5,028)– impairment allowances on assets held for sale (16) – – (16)
of which: – IRB portfolios i (16) – – (16)– standardised portfolios – –
Interests in associates and joint ventures 18,181 – (17,479) 702of which: – positive goodwill on acquisition h 621 – (606) 15
Goodwill and intangible assets h 27,577 (5,593) 571 22,555Deferred tax assets n 7,111 163 474 7,748
Total assets 2,634,139 (101,790) 194,009 2,726,358
Liabilities and equity Hong Kong currency notes in circulation 27,674 – – 27,674Deposits by banks 77,426 (21) 40,530 117,935Customer accounts 1,350,642 (535) 141,858 1,491,965Repurchase agreements – non-trading 107,432 – – 107,432Items in course of transmission to other banks 5,990 (3) – 5,987Trading liabilities 190,572 (42) 50 190,580Financial liabilities designated at fair value 76,153 (6,317) – 69,836
of which: – term subordinated debt included in tier 2 capital m 21,822 – – 21,822– hybrid capital securities included in tier 1 capital j 1,495 – – 1,495
Derivatives 340,669 37 331 341,037Debt securities in issue 95,947 (7,797) 3,720 91,870Current tax liabilities 1,213 (138) 317 1,392Liabilities under insurance contracts 73,861 (73,861) – –Accruals, deferred income and other liabilities 53,396 (3,659) 5,145 54,882
of which: – retirement benefit liabilities 3,208 (2) 56 3,262– contingent liabilities and contractual commitments 234 – – 234
of which: – credit-related provisions on IRB portfolios i 132 – – 132– credit-related provisions on standardised portfolios 102 – – 102
Provisions 4,998 (63) – 4,935Deferred tax liabilities 1,524 (1,009) 2 517Subordinated liabilities 26,664 – 2,056 28,720
of which: – hybrid capital securities included in tier 1 capital j 2,761 – – 2,761– perpetual subordinated debt included in tier 2 capital l 2,773 – – 2,773– term subordinated debt included in tier 2 capital m 21,130 – – 21,130

Report of the Directors: Capital (continued) Regulatory balance sheet / Leverage ratio
HSBC HOLDINGS PLC
250
At 31 December 2014
Accountingbalance
sheet
Deconsolidation of insurance/ other entities
Consolidation of banking associates
Regulatorybalance
sheet Ref US$m US$m US$m US$m
Total shareholders’ equity a 190,447 (7,531) – 182,916of which: – other equity instruments included in tier 1 capital c, j 11,532 – – 11,532– preference share premium included in tier 1 capital b 1,405 – – 1,405
Non-controlling interests d 9,531 (851) – 8,680of which: – non-cumulative preference shares issued by subsidiaries
included in tier 1 capital e 2,127 – – 2,127 – non-controlling interests included in tier 2 capital, cumulative
preferred stock f 300 – – 300 – non-controlling interests attributable to holders of
ordinary shares in subsidiaries included in tier 2 capital f, m 173 – – 173
Total liabilities and equity at 31 December 2014 2,634,139 (101,790) 194,009 2,726,358 At 31 December 2013
Accountingbalance
sheet
Deconsolidation of insurance/ other entities
Consolidation of banking associates
Regulatorybalance
sheet Ref US$m US$m US$m US$mAssets Trading assets 303,192 32 1,686 304,910Loans and advances to customers 1,080,304 (13,182) 110,168 1,177,290
of which: – impairment allowances on IRB portfolios i (9,476) – – (9,476)– impairment allowances on standardised portfolios k (5,667) – (2,465) (8,132)
Financial investments 425,925 (52,680) 31,430 404,675Capital invested in insurance and other entities – 9,135 – 9,135Interests in associates and joint ventures 16,640 – (15,982) 658
of which: – positive goodwill on acquisition h 608 – (593) 15
Goodwill and intangible assets h 29,918 (5,369) 631 25,180Other assets 815,339 (37,634) 57,477 835,182
of which: – goodwill and intangible assets of disposal groups held for sale h 3 – – 3– retirement benefit assets g 2,140 – – 2,140– impairment allowances on assets held for sale (111) – – (111)
of which: – IRB portfolios i – – – –– standardised portfolios k (111) – – (111)
Total assets at 31 December 2013 2,671,318 (99,698) 185,410 2,757,030
Liabilities and equity Deposits by banks 129,212 (193) 33,296 162,315Customer accounts 1,482,812 (711) 142,924 1,625,025Trading liabilities 207,025 (129) 161 207,057Financial liabilities designated at fair value 89,084 (13,471) – 75,613
of which: – term subordinated debt included in tier 2 capital m 18,230 – – 18,230– hybrid capital securities included in tier 1 capital j 3,685 – – 3,685
Debt securities in issue 104,080 (9,692) 1,021 95,409Retirement benefit liabilities g 2,931 (11) 56 2,976Subordinated liabilities 28,976 2 2,961 31,939
of which: – hybrid capital securities included in tier 1 capital j 2,873 – – 2,873– perpetual subordinated debt included in tier 2 capital l 2,777 – – 2,777– term subordinated debt included in tier 2 capital m 23,326 – – 23,326
Other liabilities 436,739 (73,570) 4,991 368,160of which: – contingent liabilities and contractual commitments 177 – – 177
of which: – credit-related provisions on IRB portfolios i 155 – – 155– credit-related provisions on standardised portfolios k 22 – – 22

HSBC HOLDINGS PLC
251
Str
ateg
ic R
epo
rt
Fi
nan
cial
Rev
iew
Co
rpo
rate
Go
vern
ance
Fin
anci
al S
tate
men
ts
S
har
eho
lder
Info
rmat
ion
At 31 December 2013
Accountingbalance
sheet
Deconsolidation of insurance/ other entities
Consolidation of banking associates
Regulatorybalance
sheet Ref US$m US$m US$m US$m
Total shareholders’ equity a 181,871 (1,166) – 180,705of which: – other equity instruments included in tier 1 capital c, j 5,851 – – 5,851– preference share premium included in tier 1 capital b 1,405 – – 1,405
Non-controlling interests d 8,588 (757) – 7,831of which: – non-cumulative preference shares issued by subsidiaries
included in tier 1 capital e 2,388 – – 2,388– non-controlling interests included in tier 2 capital, cumulative
preferred stock f 300 – – 300– non-controlling interests attributable to holders of
ordinary shares in subsidiaries included in tier 2 capital f, m 188 – – 188
Total liabilities and equity at 31 December 2013 2,671,318 (99,698) 185,410 2,757,030
The references (a) – (n) identify balance sheet components which are used in the calculation of regulatory capital on page 246.
Leverage ratio (Unaudited)
For a detailed basis of preparation of the leverage ratio, see the Appendix to Capital, page 261.
Estimated leverage ratio (Unaudited)
EU Delegated Act basis at 31 Dec 2014
Basel III 2010 basis at 31 Dec 2013
US$bn US$bn
Total assets per accounting balance sheet 2,634 2,671
Deconsolidation of insurance/other entities (104) Capital invested in insurance entities 2 Consolidation of banking associates 194
Total assets per regulatory/accounting balance sheet 2,726 2,671Adjustment to reverse netting of loans and deposits allowable under IFRS 38 93
Reversal of accounting values: (525) (482)Derivatives (345) (282)Repurchase agreement and securities finance (180) (200)
Replaced with values after applying regulatory rules: Derivatives: 166 239 Mark-to-market value 81 69
Deductions of receivables assets for cash variation margin (82) Add-on amounts for potential future exposure 148 170Exposure amount resulting from the additional treatment for written credit derivatives 19
Repurchase agreement and securities finance: 188 147Gross securities financing transactions assets 269 Netted amounts of cash payables and cash receivables of gross securities financing
transactions assets (89)
Securities financing transactions assets netted under Basel III 2010 framework 147Measurement of counterparty risk 8
Addition of off balance sheet commitments and guarantees: 396 388Guarantees and contingent liabilities 67 85Commitments 321 295Other 8 8
Exclusion of items already deducted from the capital measure (36) (28)
Exposure measure after regulatory adjustments 2,953 3,028
Tier 1 capital under CRD IV (end point) 142 133
Estimated leverage ratio (end point) 4.8% 4.4% In January 2014, the Basel Committee published its finalised leverage ratio framework, along with public disclosure requirements applicable from 1 January 2015, updating its 2010 recommendations.
In June 2014, the PRA published its revised expectations in relation to the leverage ratio for major UK banks and building societies, namely that from 1 July 2014, we are expected to meet a 3% end point tier 1 leverage ratio,

Report of the Directors: Capital (continued) Regulatory developments
HSBC HOLDINGS PLC
252
calculated using the CRD IV definition of capital for the numerator and the Basel 2014 exposure measure for the denominator.
In October 2014, the European Commission adopted a delegated act to establish a common definition of the leverage ratio for EU banks (based on the Basel revised definition). This was published in the EU’s Official Journal in January 2015.
Under CRD IV, the legislative proposals and final calibration of the leverage ratio are expected to be determined following a review of the revised Basel proposals and the basis of the EBA’s assessment of the impact and effectiveness of the leverage ratio during a monitoring period between 1 January 2014 and 30 June 2016.
In January 2015, the PRA issued a letter setting out the approach to be taken for calculating the leverage ratio for 2014 year end disclosures. While the numerator continues to be calculated using the final CRD IV end point tier 1 capital definition, the exposure measure is now calculated based on the EU delegated act (rather than the Basel 2014 definition used in the Interim Report 2014). Reporting on the basis of the EU Delegated Act (rather than the Basel 2014 definition) results in an immaterial 2bps positive difference. Our leverage ratio for 2013 as disclosed above and in our Annual Report and Accounts 2013 was based on the Basel 2010 text at the direction of the PRA. The change to reporting on the EU Delegated Act from the Basel 2010 text contributes a US$115bn increase in the exposure measure. Key changes include: • A change to the regulatory scope of consolidation
increases the exposure measure by US$132bn.
• The netting of securities financing transactions (‘SFT’s) is based on the accounting criteria and an additional add-on for counterparty risk increases the exposure measure by US$66bn.
• The inclusion of written credit derivatives at a notional amount increases the exposure measure by US$23bn.
• Revision to permit the offsetting of cash variation margin against derivative assets and liabilities results in a decrease in the exposure measure of US$65bn.
• A change to the Credit Conversion Factors (‘CCF’s) applied to off-balance sheet exposures decreases the exposure measure by US$41bn.
For further details on the basis of preparation, see page 261.
It should be noted that the UK specific leverage ratio proposals published in October 2014 by the Financial Policy Committee (‘FPC’) are conceptually different to the Basel and CRD IV leverage frameworks and are not yet in place. Further details of the UK proposals can be found under ‘Leverage ratio proposals’ on page 255.
Regulatory developments (Unaudited)
Regulatory capital buffers
CRD IV establishes a number of capital buffers, to be met with CET1 capital, broadly aligned with the Basel III framework. CRD IV contemplates that these will be phased in from 1 January 2016, subject to national discretion.
Automatic restrictions on capital distributions apply if a bank’s CET1 capital falls below the level of its CRD IV combined buffer. This is defined as the total of the capital conservation buffer (‘CCB’), the countercyclical capital buffer (‘CCyB’), the global systemically important institutions (‘G-SII’s) buffer and the systemic risk buffer (‘SRB’) as these become applicable. The PRA have proposed that the use of the PRA buffer will not result in automatic restrictions on capital distributions.
In April 2014, HM Treasury published the statutory instrument ‘Capital Requirements (Capital Buffers and Macro-Prudential Measures) Regulations 2014’ transposing into UK legislation the main provisions in CRD IV related to capital buffers, with the exception of the SRB. In January 2015, HM Treasury published amendments to this statutory instrument in order to transpose the SRB.
The PRA is the designated authority for the G-SIIs buffer, the other systemically important institutions (‘O-SII’s) buffer and the CCB. In April 2014, they published rules and supervisory statements implementing the main CRD IV provisions in relation to these buffers. The Bank of England is the designated authority for the CCyB and other macro prudential measures. Whilst the PRA is the designated authority for applying and determining the SRB, the FPC is responsible for creating the SRB framework for calibration.
G-SII buffer
The G-SII buffer (which is the EU implementation of the Basel G-SIB buffer) is to be met with CET1 capital and will be phased in from 1 January 2016. In October 2014, finalised technical standards on the methodology for identification of G-SIIs were published in the EU’s Official Journal and came into effect from 1 January 2015.
In November 2014, the FSB and the Basel Committee updated the list of G-SIBs, using end-2013 data. The add-on of 2.5% previously assigned to HSBC was left unchanged.
Following direction from the PRA to UK banks in its Supervisory Statement issued in April 2014, and in accordance with the EBA final draft Implementing Technical Standards (‘ITS’) and guidelines published in June 2014, we published the EBA template in July 2014. This disclosed the information used for the identification and scoring process which underpins our G-SIB designation. The final ITS for disclosure requirements were published in September 2014, and will form the basis of our future 2015 disclosure of G-SII indicators.

HSBC HOLDINGS PLC
253
Str
ateg
ic R
epo
rt
Fi
nan
cial
Rev
iew
Co
rpo
rate
Go
vern
ance
Fin
anci
al S
tate
men
ts
S
har
eho
lder
Info
rmat
ion
Capital conservation buffer
The CCB was designed to ensure banks build up capital outside periods of stress that can be drawn down when losses are incurred and is set at 2.5% of RWAs. The PRA will phase-in this buffer from 1 January 2016 to 1 January 2019.
Countercyclical and other macro-prudential buffers
CRD IV contemplates a countercyclical buffer in line with Basel III, in the form of an institution-specific CCyB and the application of increased requirements to address macro-prudential or systemic risk.
In January 2014, the FPC issued a policy statement on its powers to supplement capital requirements, through the use of the CCyB and the Sectoral Capital Requirements (‘SCR’) tools. The CCyB is expected to be set in the range of 0-2.5% of relevant credit exposures RWAs, although it is uncapped. Under UK legislation, the FPC is required to determine whether to recognise any CCyB rates set by other EEA countries before 2016.
In June 2014, the FPC set the CCyB rate for UK exposures at 0%. At its September 2014 meeting, the FPC left the CCyB rate for UK exposures unchanged at 0% and recognised the 1% CCyB rates introduced by Norway and Sweden to become effective from 3 October 2015. In January 2015, the HKMA announced the application of a CCyB rate of 0.625% to Hong Kong exposures, to apply from 1 January 2016. In accordance with UK legislation and PRA supervisory statement PS 3/14, this rate will directly apply to the calculation of our institution-specific CCyB rate from 1 January 2016.
The institution-specific CCyB rate for the Group will be based on the weighted average of the CCyB rates that apply in the jurisdictions where relevant credit exposures are located. Currently the Group’s institution specific CCyB is zero. The SCR tool is not currently deployed in the UK.
Systemic risk buffer
In addition to the measures above, CRD IV sets out an SRB for the financial sector as a whole, or one or more sub-sectors, to be deployed as necessary by each EU member state with a view to mitigating structural macro-prudential risk.
In January 2015, the legislative changes necessary to transpose the SRB were implemented. The SRB is to be applied to ring fenced banks and building societies (over a certain threshold), which are together defined as ‘SRB institutions’. The SRB can be applied on an individual, sub-consolidated or consolidated basis and is applicable from 1 January 2019. By 31 May 2016, the FPC is required to create a framework for identifying the extent to which the failure or distress of SRB institutions will pose certain long-term non-cyclical systemic or macro-prudential risks. The PRA will apply this framework to determine whether specific SRB institutions would be subject to an SRB rate, and the level at which the buffer would be applied, and is able to exercise supervisory
judgement to determine what the rate should be. Where applicable, the buffer rate must be set in the range of 1% to 3%. The buffer rate would apply to all the SRB institution’s exposures unless the PRA has recognised a buffer rate set in another member state. If the SRB is applied on a consolidated basis it is expected that the higher of the G-SII or SRB would apply, in accordance with CRD IV.
Pillar 2 and the ‘PRA buffer’
Under the Pillar 2 framework, banks are already required to hold capital in respect of the internal capital adequacy assessment and supervisory review which leads to a final determination by the PRA of individual capital guidance under Pillar 2A and Pillar 2B. Pillar 2A was previously met by total capital, but since 1 January 2015, in accordance with the PRA supervisory statement SS 5/13, is met with at least 56% CET1.
Pillar 2A guidance is a point in time assessment of the amount of capital the PRA considers that a bank should hold to meet the overall financial adequacy rule. It is therefore subject to change pending annual assessment and the supervisory review process. During 2014, the Group Pillar 2A guidance amounted to 1.5% of RWAs, of which 0.9% was to be met by CET1. In February 2015, this was revised to 2.0% of RWAs, of which 1.1% is to be met by CET1 and is effective immediately.
In January 2015, the PRA published a consultation on the Pillar 2 Framework. This set out the methodologies that the PRA proposed to use to inform its setting of firms’ Pillar 2 capital requirements, including proposing new approaches for determining Pillar 2 requirements for credit risk, operational risk, credit concentration risk and pension obligation risk.
As part of CRD IV implementation, the PRA proposed to introduce a PRA buffer, to replace the capital planning buffer (‘CPB’) (known as Pillar 2B), also to be held in the form of CET1 capital. This was reconfirmed in the recent PRA consultation on the Pillar 2 framework. It is proposed that a PRA buffer will avoid duplication with CRD IV buffers and will be set for a particular firm depending on its vulnerability in a stress scenario or where the PRA has identified risk management and governance failings. In order to address weaknesses in risk management and governance, the PRA propose a scalar applied to firms’ CET1 Pillar 1 and Pillar 2A capital requirements. Where the PRA considers there is overlap between the CRD IV buffers and the PRA buffer assessment, the PRA proposes to set the PRA buffer as the excess capital required over and above the CCB and relevant systemic buffers. The PRA buffer will, however, be in addition to the CCyB and sectoral capital requirements.
The PRA expects to finalise the Pillar 2 framework in July 2015, with implementation expected from 1 January 2016. Until this consultation is finalised and revised rules and guidance issued, there remains uncertainty as to the exact buffer rate requirements, and their ultimate capital impact.
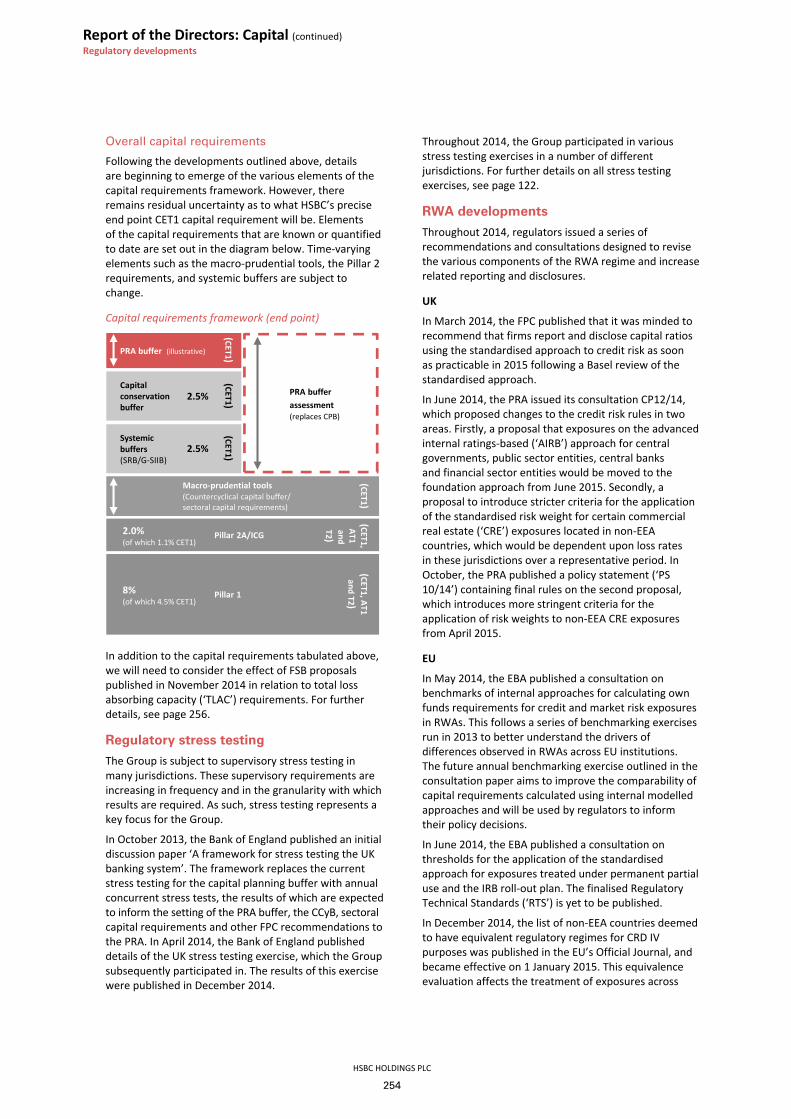
Report of the Directors: Capital (continued) Regulatory developments
HSBC HOLDINGS PLC
254
Overall capital requirements
Following the developments outlined above, details are beginning to emerge of the various elements of the capital requirements framework. However, there remains residual uncertainty as to what HSBC’s precise end point CET1 capital requirement will be. Elements of the capital requirements that are known or quantified to date are set out in the diagram below. Time-varying elements such as the macro-prudential tools, the Pillar 2 requirements, and systemic buffers are subject to change.
Capital requirements framework (end point)
In addition to the capital requirements tabulated above, we will need to consider the effect of FSB proposals published in November 2014 in relation to total loss absorbing capacity (‘TLAC’) requirements. For further details, see page 256.
Regulatory stress testing
The Group is subject to supervisory stress testing in many jurisdictions. These supervisory requirements are increasing in frequency and in the granularity with which results are required. As such, stress testing represents a key focus for the Group.
In October 2013, the Bank of England published an initial discussion paper ‘A framework for stress testing the UK banking system’. The framework replaces the current stress testing for the capital planning buffer with annual concurrent stress tests, the results of which are expected to inform the setting of the PRA buffer, the CCyB, sectoral capital requirements and other FPC recommendations to the PRA. In April 2014, the Bank of England published details of the UK stress testing exercise, which the Group subsequently participated in. The results of this exercise were published in December 2014.
Throughout 2014, the Group participated in various stress testing exercises in a number of different jurisdictions. For further details on all stress testing exercises, see page 122.
RWA developments
Throughout 2014, regulators issued a series of recommendations and consultations designed to revise the various components of the RWA regime and increase related reporting and disclosures.
UK
In March 2014, the FPC published that it was minded to recommend that firms report and disclose capital ratios using the standardised approach to credit risk as soon as practicable in 2015 following a Basel review of the standardised approach.
In June 2014, the PRA issued its consultation CP12/14, which proposed changes to the credit risk rules in two areas. Firstly, a proposal that exposures on the advanced internal ratings-based (‘AIRB’) approach for central governments, public sector entities, central banks and financial sector entities would be moved to the foundation approach from June 2015. Secondly, a proposal to introduce stricter criteria for the application of the standardised risk weight for certain commercial real estate (‘CRE’) exposures located in non-EEA countries, which would be dependent upon loss rates in these jurisdictions over a representative period. In October, the PRA published a policy statement (‘PS 10/14’) containing final rules on the second proposal, which introduces more stringent criteria for the application of risk weights to non-EEA CRE exposures from April 2015.
EU
In May 2014, the EBA published a consultation on benchmarks of internal approaches for calculating own funds requirements for credit and market risk exposures in RWAs. This follows a series of benchmarking exercises run in 2013 to better understand the drivers of differences observed in RWAs across EU institutions. The future annual benchmarking exercise outlined in the consultation paper aims to improve the comparability of capital requirements calculated using internal modelled approaches and will be used by regulators to inform their policy decisions.
In June 2014, the EBA published a consultation on thresholds for the application of the standardised approach for exposures treated under permanent partial use and the IRB roll-out plan. The finalised Regulatory Technical Standards (‘RTS’) is yet to be published.
In December 2014, the list of non-EEA countries deemed to have equivalent regulatory regimes for CRD IV purposes was published in the EU’s Official Journal, and became effective on 1 January 2015. This equivalence evaluation affects the treatment of exposures across
PRA buffer (illustrative)
Capital conservation buffer
Systemicbuffers(SRB/G-SIIB)
Pillar 2A/ICG
Pillar 1
(CET1)(CET1)
(CET1)
(CET1)(CET1, AT1
and T2 )
PRA bufferassessment(replaces CPB)
(CET1, AT1and T2)
2.5%
2.5%
2.0%(of which 1.1% CET1)
8%(of which 4.5% CET1)
Macro-prudential tools(Countercyclical capital buffer/sectoral capital requirements)

HSBC HOLDINGS PLC
255
Str
ateg
ic R
epo
rt
Fi
nan
cial
Rev
iew
Co
rpo
rate
Go
vern
ance
Fin
anci
al S
tate
men
ts
S
har
eho
lder
Info
rmat
ion
a number of different areas in CRD IV, such as the treatment of exposures to third country investment firms, credit institutions and exchanges; standardised risk weights applicable to exposures to central governments, central banks, regional governments, local authorities and public sector entities; and the calculation of RWAs for exposures to corporates, institutions, central governments and central banks under the IRB approach.
International
Throughout 2014, the Basel Committee published proposals across all Pillar 1 risk types, to update standardised, non-modelled approaches for calculating capital requirements and to provide the basis for the application of a capital floor.
In particular, in March 2014, the Basel Committee published finalised proposals for the standardised approach for calculating counterparty credit risk exposures for OTC derivatives, exchange traded derivatives and long settlement transactions. Following this, another technical paper on the foundations of the new standard was published in August 2014. The new approach is proposed to replace both the current exposure measure and the standardised method and is expected to come into effect on 1 January 2017.
In October 2014, the Basel Committee also published a consultation and a Quantitative Impact Study (‘QIS’) to revise the standardised approach for calculating operational risk. The proposals seek to establish a new unitary standardised approach to replace the current non-model-based approaches, which comprise the basic indicator approach and the standardised approach, including its variant the alternative standardised approach. An implementation date is yet to be proposed.
In December 2014, the Basel Committee undertook a further consultation on its fundamental review of the trading book. This included revisions to the market risk framework that was published for consultation in October 2013. The Committee intends to carry out a further QIS in early 2015 to inform finalised proposals expected at the end of 2015.
In December 2014, the Basel Committee published a revised framework for securitisation risk, which will come into effect on 1 January 2018.
In December 2014, the Basel Committee also published a consultation paper on revisions to the Standardised Approach for credit risk. Proposals include a reduced reliance on external credit ratings; increased granularity and risk sensitivity; and updated risk weight calibrations. Proposed calibration for risk weights are indicative only and will be further informed by responses from this consultation and results from a QIS.
Additionally, in December 2014, the Basel Committee published a consultation on the design of a capital floor framework, which will replace the Basel I floor. The calibration of the floor is, however, outside the scope of this consultation. The Committee has stated its intention
to publish final proposals including calibration and implementation timelines by the end of 2015.
All finalised Basel Committee proposals for standardised approaches for calculating risk requirements and the introduction of a revised capital floor would need to be transposed into EU requirements before coming into legal effect.
Leverage ratio proposals
In October 2014, the FPC published final recommendations on the design of a UK specific leverage ratio framework and calibration. This followed an earlier FPC consultation in July 2014 on the design of the framework. The FPC finalised recommendations included a minimum leverage ratio of 3% to be implemented as soon as practicable for UK G-SIBs and major UK banks and building societies, a supplementary leverage ratio buffer applied to systemically important firms of 35% of the relevant risk-weighted systemic risk buffer rates, and a further countercyclical leverage ratio buffer (‘CCLB’) of 35% of the relevant risk-weighted CCyB. The minimum leverage ratio is to be met 75% with CET1 and 25% with AT1, and both the supplementary leverage ratio buffer and CCLB are to be met 100% with CET1. The FPC recommended that HM Treasury provide the FPC with the necessary powers to direct the PRA to set leverage ratio requirements implementing the above mentioned calibration and framework.
HM Treasury published a consultation paper in November 2014, which responded to and agreed with the FPC recommendations in relation to the design of the leverage ratio framework. Specifically, HM Treasury agreed that the FPC should be granted powers to direct the PRA on a minimum requirement, additional leverage ratio buffer (for G-SIBs, major UK banks and building societies, including ring fenced banks) and a CCLB. HM Treasury did not, however, provide any views on the calibration. The consultation paper included legislative changes to provide the FPC with new powers. In February 2015, HM Treasury published a summary of responses, alongside the draft instrument which was laid before Parliament.
Banking structural reform and recovery and resolution planning
In the EU, the Bank Recovery and Resolution Directive (‘BRRD’) was finalised and published in June 2014. This came into effect from 1 January 2015, with the option to delay implementation of bail-in provisions until 1 January 2016. Regardless of this, the UK introduced bail-in powers from 1 January 2015. The UK transposition of the BRRD builds on the resolution framework already in place in the UK. In January 2015, the PRA published a policy statement containing updated requirements for recovery and resolution planning which revises PRA rules that have been in force since 1 January 2014. In addition, the EBA has produced a number of RTS, some of which are yet to be finalised, that will further inform the BRRD requirements.

Report of the Directors: Capital (continued) Regulatory developments / Appendix to Capital
HSBC HOLDINGS PLC
256
In December 2013, the UK’s Financial Services (Banking Reform) Act 2013 received royal assent, which implements ring-fencing recommendations of the ICB. This has been supplemented though secondary legislation which was finalised in July 2014. In October 2014, the PRA published a consultation paper on ring-fencing rules. The PRA intends to undertake further consultation and finalise ring-fencing rules in due course, with implementation by 1 January 2019.
In January 2014, the European Commission also published legislative proposals on ring-fencing trading activities from deposit taking and a prohibition on proprietary trading in financial instruments and commodities. This is currently under discussion in the European Parliament and the Council. For further details of the policy background and the Group’s approach to recovery and resolution planning, see page 14.
Total loss absorbing capacity proposals
In November 2014, as part of the ‘too big to fail’ agenda, the FSB published proposals for total loss absorbing capacity (‘TLAC’) for G-SIBs.
The FSB proposals include a minimum TLAC requirement in the range of 16-20% of RWAs and a TLAC leverage ratio of at least twice the Basel III tier 1 leverage ratio. The TLAC requirement is to be applied in accordance with individual resolution strategies, as determined by the G-SIB’s crisis management group. A QIS is currently underway, the results of which will inform finalised proposals. The conformance period for the TLAC requirement will also be influenced by the QIS, but will not be before 1 January 2019. Once finalised, it is expected that any new TLAC standard should be met alongside the Basel III minimum capital requirements.
The draft proposals require G-SIBs to be subject to a minimum TLAC requirement with the precise requirement to be informed by the QIS. There are a number of requirements relating to the types of liabilities which can be used to meet the TLAC requirement, the composition of TLAC, and the location of liabilities within a banking group, in accordance with its resolution strategy. The TLAC proposals are expected to be finalised in 2015 and will then need to be implemented into national legislation.
Other regulatory updates
In January 2015, the EBA published revised final draft RTS on prudent valuation. Finalised requirements will need to be adopted by the European Commission and published in the EU’s Official Journal before coming into effect.
In June 2014, the EBA and Basel Committee each issued a consultation on the Pillar 3 disclosures. The final EBA guidelines were issued in December 2014 and entail additional process and governance around the Pillar 3 report, as well as semi-annual or quarterly disclosure of key capital, ratio, RWA, leverage and risk model information, exceeding the scope of our current interim disclosures. The guidelines are subject to implementation by national supervisors and are expected to enter into force in 2015.
The final Basel standards on ‘Revised Pillar 3 disclosure requirements’ were issued in January 2015. They mandate extensive use of standardised templates to enhance comparability between banks’ disclosures as well as requiring a considerable volume of disclosures to be produced semi-annually, rather than annually as hitherto. The revised framework calls for disclosure at the latest from 2016 year-ends, concurrently with financial reports.
Footnotes to Capital 1 Operational risk RWAs, under the standardised approach, are calculated using an average of the last three years’ revenues. For business
disposals, the operational risk RWAs are not removed immediately on disposal, but diminish over a period of time. The RWAs for the CRS business represent the remaining operational risk RWAs for the business.
2 RWAs are non-additive across geographical regions due to market risk diversification effects within the Group. 3 From 1 January 2014, the geographical region ‘Asia’ replaced the geographical regions previously reported as ‘Hong Kong’ and ‘Rest of Asia-
Pacific’ (see Note 23 on the Financial Statements for further details). Comparative data have been re-presented to reflect this change. 4 CRD IV opening balances as at December 2013 were estimated based on the Group’s interpretation of final CRD IV legislation and final rules
issued by the PRA, details of which can be found in the basis of preparation on page 324 of the Annual Report and Accounts 2013. 5 This includes dividends on ordinary shares, quarterly dividends on preference shares and coupons on capital securities, classified as equity. 6 Includes externally verified profits for the year to 31 December 2014. 7 Mainly comprise unrealised gains/losses in available-for-sale debt securities related to SPEs. 8 Unrealised gains/losses in available-for-sale securities are net of tax. 9 Includes own credit spread on trading liabilities. 10 Under Basel 2.5 rules, any defined benefit asset is derecognised and a defined benefit liability may be substituted with the additional funding
that will be paid into the relevant schemes over the following five-year period. 11 Mainly comprise investments in insurance entities.

HSBC HOLDINGS PLC
257
Str
ateg
ic R
epo
rt
Fi
nan
cial
Rev
iew
Co
rpo
rate
Go
vern
ance
Fin
anci
al S
tate
men
ts
S
har
eho
lder
Info
rmat
ion
Appendix to Capital Capital management (Audited)
Approach and policy
Our approach to capital management is driven by our strategic and organisational requirements, taking into account the regulatory, economic and commercial environment in which we operate. Pre-tax return on risk-weighted assets (‘RoRWA’) is an operational metric by which the global businesses are managed on a day-to-day basis. The metric combines return on equity and regulatory capital efficiency objectives. It is our objective to maintain a strong capital base to support the risks inherent in our business and invest in accordance with our six filters framework, exceeding both consolidated and local regulatory capital requirements at all times.
Our policy on capital management is underpinned by a capital management framework which enables us to manage our capital in a consistent manner. The framework, which is approved by the GMB annually, incorporates a number of different capital measures including market capitalisation, invested capital, economic capital and regulatory capital. Given that CRD IV has been in effect since 1 January 2014, during 2014 we managed our internal capital ratio target on an end point CRD IV CET1 basis of greater than 10%. We have since reviewed this and in 2015 expect to manage group capital to meet a medium-term target for return on equity of more than 10%. This is modelled on CET1 ratio on an end point basis in the range of 12% to 13%.
Capital measures
• market capitalisation is the stock market value of HSBC;
• invested capital is the equity capital invested in HSBC by our shareholders, adjusted for certain reserves and goodwill previously amortised or written off;
• economic capital is the internally calculated capital requirement which we deem necessary to support the risks to which we are exposed; and
• regulatory capital is the capital which we are required to hold in accordance with the rules established by the PRA for the consolidated Group and by our local regulators for individual Group companies.
Our assessment of capital adequacy is aligned to our assessment of risks, including: credit, market, operational, interest rate risk in the banking book, pensions, insurance, structural foreign exchange risk and residual risks.
Stress testing
In addition to our internal stress tests, the Group is subject to supervisory stress testing in many jurisdictions. Supervisory requirements are increasing in frequency and in the granularity with which the results are required. These exercises include the programmes of the PRA, the FRB, the EBA, the ECB and the HKMA, as well as stress tests undertaken in other jurisdictions. We take into account the results of all such regulatory stress testing when assessing our internal capital requirements.
Risks to capital
Outside the stress-testing framework, a list of top and emerging risks is regularly evaluated for their effect on our CET1 capital ratio. In addition, other risks may be identified which have the potential to affect our RWAs and/or capital position. These risks are also included in the evaluation of risks to capital. The downside or upside scenarios are assessed against our capital management objectives and mitigating actions are assigned as necessary. The responsibility for global capital allocation principles and decisions rests with the GMB. Through our internal governance processes, we seek to maintain discipline over our investment and capital allocation decisions and seek to ensure that returns on investment meet the Group’s management objectives. Our strategy is to allocate capital to businesses and entities on the basis of their ability to achieve established RoRWA objectives and their regulatory and economic capital requirements.
Risk-weighted asset targets
RWA targets for our global businesses are established in accordance with the Group’s strategic direction and risk appetite, and approved through the Group’s annual planning process. As these targets are deployed to lower levels of management, action plans for implementation are developed. These may include growth strategies; active portfolio management; restructuring; business and/or customer-level reviews; RWA accuracy and allocation initiatives and risk mitigation. Our capital management process is articulated in the annual Group capital plan which forms part of the Annual Operating Plan that is approved by the Board.
Business performance against RWA targets is monitored through regular reporting to the Group ALCO. The management of capital deductions is also addressed in the RWA monitoring framework through additional notional charges for these items.

Report of the Directors: Capital (continued) Appendix to Capital
HSBC HOLDINGS PLC
258
Analysis is undertaken within the RWA monitoring framework to identify the key drivers of movements in the position, such as book size and book quality. Particular attention is paid to identifying and segmenting items within the day-to-day control of the business and those items that are driven by changes in risk models or regulatory methodology.
Capital generation
HSBC Holdings is the primary provider of equity capital to its subsidiaries and also provides them with non-equity capital where necessary. These investments are substantially funded by HSBC Holdings’ own capital issuance and profit retention. As part of its capital management process, HSBC Holdings seeks to maintain a prudent balance between the composition of its capital and its investment in subsidiaries.
Capital measurement and allocation (Unaudited)
The PRA supervises HSBC on a consolidated basis and therefore receives information on the capital adequacy of, and sets capital requirements for, the Group as a whole. Individual banking subsidiaries are directly regulated by their local banking supervisors, who set and monitor their capital adequacy requirements. In 2013, we calculated capital at a Group level using the Basel II framework as amended for CRD III, commonly known as Basel 2.5, and also estimated capital on an end point CRD IV basis. From 1 January 2014, our capital at Group level is calculated under CRD IV and supplemented by PRA rules to effect the transposition of directive requirements.
Our policy and practice in capital measurement and allocation at Group level is underpinned by the CRD IV rules. However, local regulators are at different stages of implementation and some local reporting is still on a Basel I basis, notably in the US for the reporting of RWAs for some institutions during 2014. In most jurisdictions, non-banking financial subsidiaries are also subject to the supervision and capital requirements of local regulatory authorities.
The Basel III framework, similarly to Basel II, is structured around three ‘pillars’: minimum capital requirements, supervisory review process and market discipline. The CRD IV legislation implemented Basel III in the EU and, in the UK, the ‘PRA rulebook CRR Firms Instrument 2013’ transposed the various national discretions under the CRD IV legislation into UK law. The CRD IV and PRA legislation came into force on 1 January 2014.
Regulatory capital
For regulatory purposes, our capital base is divided into three main categories, namely common equity tier 1, additional tier 1 and tier 2, depending on their characteristics.
• Common equity tier 1 capital is the highest quality form of capital, comprising shareholders’ equity and related non-controlling interests (subject to limits). Under CRD IV various capital deductions and regulatory adjustments are made against these items which are treated differently for the purposes of capital adequacy – these include deductions for goodwill and intangible assets, deferred tax assets that rely on future profitability, negative amounts resulting from the calculation of expected loss amounts under IRB, holdings of capital securities of financial sector entities and surplus defined benefit pension fund assets.
• Additional tier 1 capital comprises eligible non-common equity capital securities and any related share premium; it also includes qualifying securities issued by subsidiaries subject to certain limits. Holdings of additional tier 1 securities of financial sector entities are deducted.
• Tier 2 capital comprises eligible capital securities and any related share premium and qualifying tier 2 capital securities issued by subsidiaries subject to limits. Holdings of tier 2 capital securities of financial sector entities are deducted.
Pillar 1 capital requirements
Pillar 1 covers the capital resources requirements for credit risk, market risk and operational risk. Credit risk includes counterparty credit risk and securitisation requirements. These requirements are expressed in terms of RWAs.
Credit risk capital requirements
CRD IV applies three approaches of increasing sophistication to the calculation of Pillar 1 credit risk capital requirements. The most basic, the standardised approach, requires banks to use external credit ratings to determine the risk weightings applied to rated counterparties. Other counterparties are grouped into broad categories and standardised risk weightings are applied to these categories. The next level, the internal ratings-based (‘IRB’) foundation approach, allows banks to calculate their credit risk capital requirements on the basis of their internal assessment of a counterparty’s probability of default (‘PD’), but their estimates of exposure at default (‘EAD’) and loss given default (‘LGD’) are subject to standard supervisory parameters. Finally, the IRB advanced approach allows banks to use their own internal assessment in both determining PD and quantifying EAD and LGD.
The capital resources requirement, which is intended to cover unexpected losses, is derived from a formula specified in the regulatory rules which incorporates PD, LGD, EAD and other variables such as maturity and correlation. Expected losses under the IRB approaches are calculated by multiplying PD by EAD and LGD. Expected losses are deducted from capital to the extent that they exceed total accounting impairment allowances.

HSBC HOLDINGS PLC
259
Str
ateg
ic R
epo
rt
Fi
nan
cial
Rev
iew
Co
rpo
rate
Go
vern
ance
Fin
anci
al S
tate
men
ts
S
har
eho
lder
Info
rmat
ion
For credit risk we have adopted the IRB advanced approach for the majority of our portfolios, with the remainder on either IRB foundation or standardised approaches.
Under our CRD IV rollout plans, a number of our Group companies and portfolios are in transition to advanced IRB approaches. At the end of 2014, global models for sovereigns, banks, large corporates and portfolios in most of Europe, Asia and North America were on advanced IRB approaches. Others remain on the standardised or foundation approaches pending definition of local regulations or model approval, or under exemptions from IRB treatment. In some instances, regulators have allowed us to transition from advanced to standardised approaches for a limited number of portfolios.
• Counterparty credit risk
Counterparty credit risk (‘CCR’) arises for OTC derivatives and securities financing transactions. It is calculated in both the trading and non-trading books and is the risk that the counterparty to a transaction may default before completing the satisfactory settlement of the transaction. Three approaches to calculating CCR and determining exposure values are defined by CRD IV: standardised, mark-to-market and internal model method. These exposure values are used to determine capital requirements under one of the credit risk approaches: standardised, IRB foundation and IRB advanced.
We use the mark-to-market and internal model method approaches for CCR. Our longer-term aim is to migrate more positions from the mark-to-market to the internal model method approach.
In addition, CRD IV applies a capital requirement for CVA risk. Where we have both specific risk VaR approval and internal model method approval for a product, the CVA VaR approach has been used to calculate the CVA capital charge. Where we do not hold both approvals, the standardised approach has been applied.
• Securitisation
Securitisation positions are held in both the trading and non-trading books. For non-trading book securitisation positions, CRD IV specifies two methods for calculating credit risk requirements, the standardised and the IRB approaches. Both rely on the mapping of rating agency credit ratings to risk weights, which range from 7% to 1,250%.
Within the IRB approach, we use the ratings-based method for the majority of our non-trading book securitisation positions, and the internal assessment approach for unrated liquidity facilities and programme-wide enhancements for asset-backed securitisations.
The majority of securitisation positions in the trading book are treated for capital purposes as if they are held in the non-trading book under the standardised or IRB approaches. Other traded securitisation positions, known as correlation trading, are treated under an internal model approach approved by the PRA.
Market risk capital requirement
The market risk capital requirement is measured using internal market risk models where approved by the PRA, or the standard rules of the EU Capital Requirement Regulation. Our internal market risk models comprise VaR, stressed VaR and the incremental risk charge. Since the sale of our correlation portfolio in September 2014, there is no market risk capital requirement associated with the comprehensive risk measure.
Operational risk capital requirement
CRD IV includes a capital requirement for operational risk, again utilising three levels of sophistication. The capital required under the basic indicator approach is a simple percentage of gross revenues, whereas under the standardised approach it is one of three different percentages of total operating income less insurance premiums allocated to each of eight defined business lines. Both these approaches use an average of the last three financial years’ revenues. Finally, the advanced measurement approach uses banks’ own statistical analysis and modelling of operational risk data to determine capital requirements. We have adopted the standardised approach in determining our operational risk capital requirements.
Pillar 2 capital requirements
We conduct an internal capital adequacy assessment process (‘ICAAP’) to determine a forward looking assessment of our capital requirements given our business strategy, risk profile, risk appetite and capital plan. This process incorporates the Group’s risk management processes and governance framework. A range of stress tests are applied to our base capital plan. These, coupled with our economic capital framework and other risk management practices, are used to assess our internal capital adequacy requirements.
The ICAAP is examined by the PRA as part of its supervisory review and evaluation process, which occurs periodically to enable the regulator to define the individual capital guidance or minimum capital requirements for HSBC and our capital planning buffer where required.

Report of the Directors: Capital (continued) Appendix to Capital
HSBC HOLDINGS PLC
260
Pillar 3 disclosure requirements
Pillar 3 of the Basel regulatory framework is related to market discipline and aims to make firms more transparent by requiring them to publish, at least annually, wide-ranging information on their risks and capital, and how these are managed. Our Pillar 3 Disclosures 2014 are published on our website, www.hsbc.com, under Investor Relations.
RWA movement by key driver – basis of preparation and supporting notes (Unaudited)
Credit risk drivers – definitions and quantification
The causal analysis of RWA movements splits the total movement in IRB RWAs into six drivers, described below. The first four relate to specific, identifiable and measurable changes. The remaining two, book size and book quality, are derived after accounting for movements in the first four specific drivers.
1. Foreign exchange movements
This is the movement in RWAs as a result of changes in the exchange rate between the functional currency of the HSBC company owning each portfolio and US dollars, being our presentation currency for consolidated reporting. Our structural foreign exchange exposures are managed with the primary objective of ensuring, where practical, that our consolidated capital ratios and the capital ratios of individual banking subsidiaries are largely protected from the effect of changes in exchange rates. This is usually achieved by ensuring that, for each subsidiary bank, the ratio of structural exposures in a given currency to risk-weighted assets denominated in that currency is broadly equal to the capital ratio of the subsidiary in question. We hedge structural foreign exchange exposures only in limited circumstances.
2. Acquisitions and disposals
This is the movement in RWAs as a result of the disposal or acquisition of business operations. This can be whole businesses or parts of a business. The movement in RWAs is quantified based on the credit risk exposures as at the end of the month preceding a disposal or following an acquisition.
3. Model updates
New/updated models
RWA movements arising from the implementation of new models and from changes to existing parameter models are allocated to this driver. This figure will also include changes which arise following review of modelling assumptions. Where a model recalibration reflects an update to more recent performance data, the resulting RWA changes are not assigned here, but instead reported under book quality.
RWA changes are estimated based on the impact assessments made in the testing phase prior to implementation. These values are used to simulate the effect of new or updated models on the portfolio at the point of implementation, assuming there were no major changes in the portfolio from the testing phase to implementation phase.
Portfolios moving onto IRB approach
Where a portfolio moves from the standardised approach to the IRB approach, the RWA movement by key driver statement shows the increase in IRB RWAs, but does not show the corresponding reduction in standardised approach RWAs as its scope is limited to IRB only.
The movement in RWAs is quantified at the date at which the IRB approach is applied, and not during the testing phase as with a new/updated model.
4. Methodology and policy
Internal regulatory updates
This captures the effect on RWAs of changing the internal treatment of exposures. This may include, but is not limited to, a portfolio or a part of one moving from an existing IRB model onto a standardised model, identification of netting and credit risk mitigation.
External regulatory updates
This specifies the effect of additional or changing regulatory requirements. This includes, but is not limited to, regulatory-prescribed changes to the RWA calculation. The movement in RWAs is quantified by comparing the RWAs calculated for that portfolio under the old and the new requirements.
5. Book size
RWA movements attributed to this driver are those we would expect to experience for the given movement in exposure, as measured by EAD, assuming a stable risk profile. These RWA movements arise in the normal course of business, such as growth in credit exposures or reduction in book size from run-offs and write-offs.

HSBC HOLDINGS PLC
261
Str
ateg
ic R
epo
rt
Fi
nan
cial
Rev
iew
Co
rpo
rate
Go
vern
ance
Fin
anci
al S
tate
men
ts
S
har
eho
lder
Info
rmat
ion
The RWA movement is quantified as follows:
• RWA and EAD changes captured in the four drivers above are excluded from the total movements to create an adjusted movement in EAD and RWA for the period.
• The average RWA to EAD percentage is calculated for the opening position and is applied to the adjusted movement in EAD. This results in an estimated book size RWA movement based on the assumption that the EAD to RWA percentage is constant throughout the period.
As the calculation relies on averaging, the output is dependent upon the degree of portfolio aggregation and the number of discrete time periods for which the calculation is undertaken. For each quarter of 2014 this calculation was performed for each HSBC company with an IRB portfolio by global businesses, split by the main Basel categories of credit exposures, as described in the table below:
Basel categories of IRB credit exposures within HSBC
Central governments and central banks Corporate foundation IRB Qualifying revolving retail exposures Institutions Other advanced IRB Retail SME Corporate advanced IRB Retail mortgages Other retail
The total of the results is shown in book size within the RWA movement by key driver table.
6. Book quality
This represents RWA movements resulting from changes in the underlying credit quality of customers. These are caused by changes to IRB risk parameters which arise from actions such as, but not limited to, model recalibration, change in counterparty external rating, or the influence of new lending on the average quality of the book. The change in RWAs attributable to book quality is calculated as the balance of RWA movements after taking account of all drivers described above.
The RWA movement by key driver statement includes only movements which are calculated under the IRB approach. Certain classes of credit risk exposure are treated as capital deductions and therefore reductions are not shown in this statement. If the treatment of a credit risk exposure changes from RWA to capital deduction in the period, then only the reduction in RWAs would appear in the RWA movement by key driver tables. In this instance, a reduction in RWAs does not necessarily indicate an improvement in the capital position.
Counterparty risk drivers – definitions and quantification
The RWA movement by key driver for counterparty credit risk calculates the credit risk drivers 5 and 6 at a more granular level, by using transaction level details provided by regional sites. ‘Foreign exchange movement’ is not a reported layer for counterparty risk drivers, as there is cross currency netting across the portfolio.
Market risk drivers – definitions and quantification
The RWA movement by key driver for market risk combines the credit risk drivers 5 and 6 into a single driver called ‘Movements in risk levels’.
Leverage ratio: basis of preparation (Unaudited)
The numerator, capital measure, is calculated using the ‘end point’ definition of tier 1 capital applicable from 1 January 2022, which is set out in the final CRD IV rules. This is supplemented with the EBA’s Own Funds’ RTS to the extent that these have been published in the EU’s Official Journal of the European Commission as at the reporting date, as well as making reference to the PRA Rulebook where appropriate. The denominator, exposure measure, is calculated on the basis of the Leverage Ratio Delegated Act adopted by the European Commission in October 2014 and published in the EU’s Official Journal in January 2015, which is aligned to the Basel 2014 leverage ratio framework. This follows the same scope of regulatory consolidation used for the risk-based capital framework, which differs to the 2010 Basel text that required banks to include items using their accounting balance sheet. The exposure measure generally follows the accounting value, adjusted as follows:
• on-balance sheet, non-derivative exposures are included in the exposure measure net of specific provisions or accounting valuation adjustments (e.g. accounting credit valuation adjustments);
• loans are not netted with deposits;
• the scope of netting for derivatives is extended to all scenarios where we would recognise a netting agreement for regulatory purposes;
• the scope for offsetting of cash variation margin against derivative assets and liabilities is extended subject to certain additional conditions including the requirement that the margin be exchanged daily and be in the same currency as the currency of settlement of the derivative contract. For these purposes we have considered this to include any currency

Report of the Directors: Capital / Corporate Governance Appendix to Capital / Letter from the Group Chairman
HSBC HOLDINGS PLC
262
that can be used to make payments under the derivative contract, the governing qualifying master netting agreement, or its associated credit support annex. Such offsetting is not permitted under the Basel 2010 text;
• the approach to netting securities financing transactions (‘SFT’s) is aligned to that permitted under IFRS, though for the purposes of the leverage ratio there is an additional counterparty credit risk add-on to the extent that an SFT is under collateralised. This represents a stricter requirement compared with the Basel 2010 text;
• there is an add-on for potential future exposure for both OTC and exchange-traded derivatives;
• the notional amount of written credit derivatives is included in the exposure measure, subject to offsets for purchased protection. This represents a stricter requirement compared with the Basel 2010 text;
• off-balance sheet items are converted into credit exposure equivalents through the use of credit conversion factors (‘CCF’s). Depending on the risk category of the exposure a CCF of 10%, 20%, 50% or 100% is applied. In contrast, the Basel 2010 text requires that off-balance sheet items are included in full except for commitments that are unconditionally cancellable at any time by HSBC without prior notice, where only 10% of the exposures are included; and
• items deducted from the end point tier 1 capital such as goodwill and intangible assets, are excluded.

HSBC HOLDINGS PLC
263
Str
ateg
ic R
epo
rt
Fin
anci
al R
evie
w
Co
rpo
rate
Gov
ern
ance
Fi
nan
cial
Sta
tem
ents
S
har
eho
lder
Info
rmat
ion
Corporate Governance Page App1
Corporate Governance Report 263 Letter from the Group Chairman 263 Directors 264 Secretary 268 Group Managing Directors 268
Board of Directors 270 Directors 270 Corporate governance codes 275
Board committees 276 Group Management Board 276 Group Audit Committee 277 Group Risk Committee 280 Financial System Vulnerabilities Committee 282 Group Remuneration Committee 284 Nomination Committee 284 Conduct & Values Committee 286 Chairman’s Committee 288 Philanthropic and Community Investment
Oversight Committee 288
Internal control 288
Going concern 290
Employees 291 Reward 291 Employee relations 291 Diversity and inclusion 291 Employee development 291 Employment of disabled persons 291 Health and safety 291 Remuneration policy 292 Employee share plans 292
Other disclosures 293 Share capital 294 Directors’ interests 297 Dividends and shareholders 298
2014 Annual General Meeting 293
1 Appendix to Report of the Directors.
Corporate Governance Report The statement of corporate governance practices set out on pages 263 to 333 and information incorporated by reference constitutes the Corporate Governance Report of HSBC Holdings. The reports of Board Committees are contained within the Corporate Governance Report.
Letter from the Group Chairman Dear Shareholder
This year, 2015, marks the 150th anniversary of our foundation in Hong Kong and Shanghai. In these days of companies ascending to the top ranks of valuation within a decade or so of being formed and often descending as rapidly, we should reflect positively on the enormous skill and foresight of those who built this firm sustainably from modest beginnings to its position as one of the leading international banking groups in the world. Given the history of the world over this period and the episodic intensity of financial market crises, this could not have been achieved without strong governance and a prudent character. It is among the Board’s primary responsibilities to ensure that the firm’s governance and character are such as to underpin its continuing success. Describing what good governance and a prudent character look like is relatively simple; understanding how to embed these and to measure success in so doing is the greater challenge and one which lies firmly within the Board’s accountability.
At the heart of good governance lie three responsibilities reserved to the Board. Firstly, selection of the appropriate business model and countries within which to pursue all or elements of that model; secondly, determining the appropriate risk appetite of the firm across the variety of risks to which each business line is exposed; and finally, and most importantly, ensuring that the composition of the management team is best placed to deliver the right outcome for all stakeholders, is aligned in its incentives with the interests of shareholders and is committed to building long-term sustainable success, including in planning for its own succession.
Over the last four years, as the industry emerged from the global financial crisis and fresh regulatory requirements were determined, the Board has engaged actively with management on all these areas. Through this governance process, the Board has been able to endorse the progressive redefinition and clarity brought to HSBC’s business model, its geographic representation and its risk appetite proposed by Stuart Gulliver and his management team. At the same time, the Board has been able to assess the composition and quality of the most senior management team; the Board continued to be impressed by their dedication and commitment as well as their success in meeting the objectives set for them by the Board.
The Board also has a critical role in overseeing the performance of management, including oversight of the transformation agenda which is underway to simplify and control more effectively the management of the Group. This agenda reflects HSBC’s three strategic priorities: to implement Global Standards, grow the business and simplify and streamline processes. At each of its meetings and through its committees, the Board reviews progress made on implementation of this agenda, challenging management over the speed of delivery against agreed milestones and seeking insight into options considered but rejected.
Finally, governance is also about ensuring that the lessons of unexpected outcomes, of mistakes and of control failings are both acknowledged and responded to in a timely and effective manner. More importantly, it imposes a responsibility to ensure actions are taken to ensure that repetition is remote and that pre-emptive controls are established to warn, so far as is possible, of emerging areas of concern.
During 2014, regrettably, there were further instances of legal and regulatory proceedings that reinforced the need for greater governance oversight over conduct and financial crime risk. Indeed 2014 saw a sustained focus on conduct and behaviour

Report of the Directors: Corporate Governance (continued) Biographies
HSBC HOLDINGS PLC
264
risks with the establishment of the Banking Standards Review Council, the setting up of an enquiry by the UK Chancellor into Fair and Effective Markets and an update statement by former members of the Parliamentary Commission on Banking Standards.
HSBC has progressively enhanced its own governance oversight capabilities in these areas through the establishment in 2013 of the Financial System Vulnerabilities Committee to address financial crime matters and, in 2014, the Conduct & Values Committee, demonstrating the importance we place on adhering to high behavioural standards and ‘doing the right thing’. Reports from these committees can be found on pages 282 to 283 and 286 to 287, respectively.
Ensuring we have a diverse balance of skills, knowledge and experience on the Board is a fundamental aspect of successful corporate governance. Since my letter of last year the Board was strengthened by the appointments during 2014 of Jonathan Symonds and Heidi Miller as non-executive Directors on 14 April and 1 September, respectively, and Phil Ameen as of 1 January, 2015. These fresh appointments have added considerable experience in financial and governance matters and also in the case of Heidi Miller detailed banking expertise at the top level gained over more than 30 years in the industry. Biographies for all Directors can be found on pages 264 to 268.
Good governance has to extend throughout the Group, not just at the top company level. We address this by bringing together annually non-executives from our major subsidiaries in an NED forum to discuss governance issues and share best practices. Additionally, the chairmen of HSBC’s principal subsidiary company committees with responsibility for non-executive oversight of financial reporting and risk-related matters meet each year to share issues and to reinforce consistent standards.
As we view the year ahead, we will see finalisation of the new Senior Managers Regime brought in by the Financial Services (Banking Reform) Act 2013, which is likely to include specific responsibilities in respect of non-executive Directors. Also in this coming year, an update to the UK Corporate Governance Code will apply encompassing certain changes to its principles and provisions relating to remuneration, engagement with shareholders, risk management and going concern. The Board unreservedly supports the evolution of best practice, recognising that good governance is key both to sustainable success and to capturing the business growth opportunities that our distinctive business model affords us.
Douglas Flint Group Chairman 23 February 2015
Directors
Douglas Flint, CBE, 59 Group Chairman
Skills and experience: Douglas has extensive board-level experience and knowledge of governance, including experience gained through membership of the Boards of HSBC and BP p.l.c. He has considerable knowledge of finance and risk management in banking, multinational financial reporting, treasury and securities trading operations. He joined HSBC as Group Finance Director in 1995.
He is a member of the Institute of Chartered Accountants of Scotland and the Association of Corporate Treasurers and also a fellow of the Chartered Institute of Management Accountants. In 2006 he was honoured with a CBE in recognition of his services to the finance industry.
Appointed to the Board: 1995. Group Chairman since 2010.
Current appointments include: Douglas is a director of The Hong Kong Association and Chairman of the Institute of International Finance. He is a member of the Mayor of Beijing’s International Business Leaders’ Advisory Council as well as the Mayor of Shanghai’s International Business Leaders’ Advisory Council and the International Advisory Board of the China Europe International Business School, Shanghai. He is also an independent external member of the UK Government’s Financial Services Trade and Investment Board, a British Business Ambassador and was appointed a director of the Peterson Institute for International Economics on 10 December 2014.
Former appointments include: Douglas was formerly Group Finance Director, Chief Financial Officer and Executive Director, Risk and Regulation of HSBC and non-executive director and Chairman of the Audit Committee of BP p.l.c. He has chaired and been a member of highly influential bodies which set standards for taxation, governance, accounting and risk management. Douglas served as a partner in KPMG.
Stuart Gulliver, 55 Group Chief Executive Chairman of the Group Management Board
Skills and experience: Stuart joined HSBC in 1980. He is a career banker with over 30 years’ international experience. He has held a number of key roles in the Group’s operations worldwide, including in London, Hong Kong, Tokyo, Kuala Lumpur and the United Arab Emirates. Stuart played a leading role in developing and expanding Global Banking and Markets.
Appointed to the Board: 2008. Group Chief Executive since 2011.
Current appointments include: Stuart is Chairman of The Hongkong and Shanghai Banking Corporation Limited and of the Group Management Board. He is a member of the Monetary Authority of Singapore

HSBC HOLDINGS PLC
265
Str
ateg
ic R
epo
rt
Fin
anci
al R
evie
w
Co
rpo
rate
Gov
ern
ance
Fi
nan
cial
Sta
tem
ents
S
har
eho
lder
Info
rmat
ion
International Advisory Panel and the International Advisory Council of the China Banking Regulatory Commission.
Former appointments include: Stuart served as Chairman of Europe, Middle East and Global Businesses and of HSBC Bank plc, HSBC Bank Middle East Limited, HSBC Private Banking Holdings (Suisse) SA and HSBC France and Deputy Chairman of HSBC Trinkaus & Burkhardt AG and a member of its supervisory board. He was Head of Global Banking and Markets; Co-Head of Global Banking and Markets; Head of Global Markets; and Head of Treasury and Capital Markets in Asia-Pacific.
Phillip Ameen, 66 Independent non-executive Director
Member of the Group Audit Committee with effect from 1 January 2015.
Skills and experience: As a Certified Public Accountant with extensive financial and accounting experience, Phil served as Vice President, Comptroller, and Principal Accounting Officer of General Electric Capital Co. Prior to joining GE, he was a partner of KPMG. He also has a depth of technical knowledge from his participation in accounting standards setting.
Appointed to the Board: 1 January 2015
Current appointments include: A non-executive director of HSBC North America Holdings Inc., HSBC Bank USA, HSBC Finance Corporation and HSBC USA Inc. He is a non-executive director of Skyonic Corporation and R3 Fusion, Inc. and is a member of the Advisory Board of the Business School, University of North Carolina.
Former appointments include: Vice President, Comptroller and Principal Accounting Officer of General Electric Corp; a technical audit partner at Peat Marwick Mitchell & Co (now KPMG). He served on the International Financial Reporting Interpretations Committee of the International Accounting Standards Board, the Accounting Standards Executive Committee of the American Institute of Certified Public Accountants, the Financial Accounting Standards Board Emerging Issues Task Force, was Chair of the Committee on Corporate Reporting of Financial Executives International and was a Trustee of the Financial Accounting Foundation.
Kathleen Casey, 48 Independent non-executive Director
Member of the Group Audit Committee and the Financial System Vulnerabilities Committee.
Skills and experience: Kathleen has extensive financial regulatory policy experience. She is a former Commissioner of the US Securities and Exchange Commission, acting as the regulator’s principal representative in multilateral and bilateral regulatory dialogues, the G-20 Financial Stability Board and the International Organisation of Securities Commissions.
Appointed to the Board: 1 March 2014
Current appointments include: Kathleen is the Chairman of the Alternative Investment Management Association and a senior adviser to Patomak Global Partners. She is a member of the Board of Trustees of Pennsylvania State University, the Trust Fund Board of the Library of Congress and the Advisory Council of the Public Company Accounting Oversight Board.
Former appointments include: Kathleen was a Staff Director and Counsel of the United States Senate Committee on Banking, Housing, and Urban Affairs and Legislative Director and Chief of Staff for a US Senator.
Safra Catz, 53 Independent non-executive Director
Skills and experience: Safra has a background in international business leadership, having helped transform Oracle into the largest producer of business management software and the world’s leading supplier of software for information management.
Appointed to the Board: 2008
Current appointments include: Safra was appointed joint Chief Executive Officer of Oracle Corporation on 18 September 2014, having previously been President and Chief Financial Officer. She joined Oracle in 1999 and was appointed to the board of directors in 2001.
Former appointments include: Safra was Managing Director of Donaldson, Lufkin & Jenrette.
Laura Cha, GBS, 65 Independent non-executive Director
Chairman of the Philanthropic and Community Investment Oversight Committee since 5 December 2014 and a member of the Conduct & Values Committee and the Nomination Committee.
Skills and experience: Laura has extensive regulatory and policy making experience in the finance and securities sector in Hong Kong and mainland China. She is the former Vice Chairman of the China Securities Regulatory Commission, being the first person outside mainland China to join the Central Government of the People’s Republic of China at vice-ministerial rank. Laura was awarded Gold and Silver Bauhinia Stars by the Hong Kong Government for public service.
Appointed to the Board: 2011
Current appointments include: Laura is a non-executive Deputy Chairman of The Hongkong and Shanghai Banking Corporation Limited and non-official member of the Executive Council of Hong Kong SAR. She is a Hong Kong Delegate to the 12th National People’s Congress of China and a non-executive director of China Telecom Corporation Limited, Unilever PLC and Unilever N.V. Laura is also a Senior International Adviser for Foundation Asset Management Sweden AB and a member of the State Bar of California and the China Banking Regulatory Commission’s International Advisory Council. She is Chairman of the Financial Services Development Council of Hong Kong SAR and Vice Chairman of the International Advisory Council of the

Report of the Directors: Corporate Governance (continued) Biographies
HSBC HOLDINGS PLC
266
China Securities Regulatory Commission.
Former appointments include: Laura was a non-executive director of Bank of Communications Co., Ltd., Baoshan Iron and Steel Co. Limited, Johnson Electric Holdings Limited, Hong Kong Exchanges and Clearing Limited and Tata Consultancy Services Limited. She served as Chairman of the University Grants Committee in Hong Kong and the ICAC Advisory Committee on Corruption. Laura also served as Deputy Chairman of the Securities and Futures Commission in Hong Kong and was a member of the Advisory Board of the Yale School of Management.
Lord Evans of Weardale, 57 Independent non-executive Director
Chairman of the Financial System Vulnerabilities Committee and a member of the Conduct & Values Committee and Philanthropic and Community Investment Oversight Committee since 5 December 2014.
Skills and experience: Jonathan has extensive experience in national security policy and operations. Formerly Director General of MI5 with responsibility for the leadership, policy and strategy of the Security Service, including international and domestic counter-terrorism, counter-espionage and counter-proliferation activities and cyber security.
Appointed to the Board: 2013
Current appointments include: Jonathan is a non-executive director of the UK National Crime Agency and a Senior Adviser of Accenture plc. He is a member of the advisory board of Darktrace Limited and of Facewatch Limited.
Former appointments include: Jonathan has held various positions in the UK Security Service over a 30-year career with responsibility for the oversight of the Joint Terrorist Analysis Centre and the Centre for the Protection of National Infrastructure and attended the National Security Council.
Joachim Faber, 64 Independent non-executive Director
Chairman of the Group Risk Committee.
Skills and experience: Joachim has experience in banking and asset management with significant international experience, having worked in Germany, Tokyo, New York and London. He is a former Chief Executive Officer of Allianz Global Investors AG and member of the management board of Allianz SE. He has 14 years’ experience with Citigroup Inc. holding positions in Trading and Project Finance and as Head of Capital Markets for Europe, North America and Japan.
Appointed to the Board: 2012
Current appointments include: Joachim is Chairman of the supervisory board of Deutsche Börse AG and of the Shareholder Committee of Joh A. Benckiser SARL. He is an independent director of Coty Inc. and a director of Allianz France S.A. Joachim is also a member of the advisory board of the European School for Management
and Technology; and council member of The Hongkong – Europe Business Council.
Former appointments include: Joachim served as Chairman of various Allianz subsidiaries. He was a member of the supervisory board of Bayerische B rse AG, and of the supervisory board and Chairman of the audit and risk committee of OSRAM Licht AG. He was also a member of the German Council for Sustainable Development and a member of the advisory board of the Siemens Group Pension Board.
Rona Fairhead, CBE, 53 Independent non-executive Director
Member of the Financial System Vulnerabilities Committee and the Nomination Committee.
Skills and experience: Rona has a background in international industry, publishing, finance and general management. She was a former Chairman and Chief Executive Officer of the Financial Times Group Limited responsible for its strategy, management and operations and Finance Director of Pearson plc with responsibility for overseeing the day-to-day running of the finance function and directly responsible for global financial reporting and control, tax and treasury.
Appointed to the Board: 2004
Current appointments include: Rona is Chairman of HSBC North America Holdings Inc. She is a non-executive director of PepsiCo Inc. Rona is also a British Business Ambassador and, since 8 October 2014, Chairman of the BBC Trust.
Former appointments include: Rona was an Executive Vice President, Strategy and Group Control of Imperial Chemical Industries plc and Chairman and director of Interactive Data Corporation. She was a member of the board of the UK Government’s Cabinet Office until 1 September 2014 and a non-executive director of The Economist Newspaper Limited until 1 July 2014.
Sam Laidlaw, 59 Independent non-executive Director
Member of the Group Remuneration Committee and the Nomination Committee.
Skills and experience: Sam has international experience, particularly in the energy sector, having had responsibility for businesses in four continents. He is a qualified solicitor with a Master’s in Business Administration.
Appointed to the Board: 2008
Former appointments include: Sam was the Chief Executive Officer of Centrica plc and the lead non-executive board member of the UK Department for Transport until 31 December 2014. Sam was also an Executive Vice President of Chevron Corporation, non-executive director of Hanson PLC, Chief Executive Officer of Enterprise Oil plc, President and Chief Operating Officer of Amerada Hess Corporation, and a member of the UK Prime Minister’s Business Advisory Group.

HSBC HOLDINGS PLC
267
Str
ateg
ic R
epo
rt
Fin
anci
al R
evie
w
Co
rpo
rate
Gov
ern
ance
Fi
nan
cial
Sta
tem
ents
S
har
eho
lder
Info
rmat
ion
John Lipsky, 68 Independent non-executive Director
Member of the Group Risk Committee, the Nomination Committee and the Group Remuneration Committee.
Skills and experience: John has international experience having worked in Chile, New York, Washington and London and interacted with financial institutions, central banks and governments in many countries. He served at the International Monetary Fund as First Deputy Managing Director, Acting Managing Director and as Special Adviser.
Appointed to the Board: 2012
Current appointments include: John is a Senior Fellow, Foreign Policy Institute at the Paul H. Nitze School of Advanced International Studies, Johns Hopkins University. He is co-chairman of the Aspen Institute Program on the World Economy and a director of the National Bureau of Economic Research and the Center for Global Development. John is a member of the advisory board of the Stanford Institute for Economic Policy Research and the Council on Foreign Relations. He is Chairman of the World Economic Forum’s Global Agenda Council on the International Monetary System.
Former appointments include: John served as Vice Chairman of JPMorgan Investment Bank; a director of the American Council on Germany and the Japan Society; a trustee of the Economic Club of New York, and a Global Policy Adviser for Anderson Global Macro, LLC.
Rachel Lomax, 69 Independent non-executive Director
Chairman of the Conduct & Values Committee and a member of the Group Audit Committee and the Group Risk Committee.
Skills and experience: Rachel has experience in both the public and private sectors and a deep knowledge of the operation of the UK government and financial system.
Appointed to the Board: 2008
Current appointments include: Rachel is Chairman of the International Regulatory Strategy Group. She is a director of TheCityUK and Bruegel, a Brussels-based European think tank; a non-executive director of Arcus European Infrastructure Fund GP LLP and Heathrow Airport Holdings Limited. Rachel is also a member of the Council of Imperial College, London and President of the Institute of Fiscal Studies, a Trustee of the Ditchley Foundation, and a non-executive director and chairman of the corporate responsibility committee of Serco Group plc. Former appointments include: Rachel served as Deputy Governor, Monetary Stability, at the Bank of England and member of the Monetary Policy Committee, Permanent Secretary at the UK Government Departments for Transport and Work and Pensions and the Welsh Office, and Vice President and Chief of Staff to the President of the World Bank. She was a non-executive director of Reinsurance Group of America Inc. and The Scottish American Investment Company PLC.
Iain Mackay, 53 Group Finance Director
Skills and experience: Iain joined HSBC in 2007 as Chief Financial Officer of HSBC North America Holdings Inc. He has extensive financial and international experience, having worked in London, Paris, US, Africa and Asia. Iain is a member of the Institute of Chartered Accountants of Scotland.
Appointed to the Board: 2010
Current appointments include: Iain is a member of the Group Management Board and was also appointed as a member of the audit committee of the British Heart Foundation on 4 December 2014.
Former appointments include: Iain served as a director of Hang Seng Bank Limited, Chief Financial Officer, Asia-Pacific, Vice President and Chief Financial Officer of GE Global Consumer Finance and Vice President and Chief Financial Officer of GE Healthcare – Global Diagnostic Imaging.
Heidi Miller, 61 Independent non-executive Director
Member of the Group Risk Committee and Conduct & Values Committee since 1 September 2014.
Skills and experience: Heidi has extensive international banking and finance experience. She is a former President of International at JPMorgan Chase, and was responsible for leading the global expansion and international business strategy across the investment bank, asset management, and treasury and securities services divisions.
Appointed to the Board: 1 September 2014
Current appointments include: Heidi is a non-executive director of First Data Corporation and General Mills Inc. She is a Trustee of the International Financial Reporting Standards Foundation.
Former appointments include: Heidi served as non-executive director of Merck & Co. Inc. and also Progressive Corp until 1 August 2014. She was an Executive Vice President and Chief Executive Officer, Treasury and Securities Services at JPMorgan Chase & Co.; Executive Vice President and Chief Financial Officer of Bank One Corporation; Senior Executive Vice President of Priceline.com Inc.; and Executive Vice President and Chief Financial Officer of Citigroup Inc.
Marc Moses, 57 Group Chief Risk Officer
Skills and experience: Marc joined HSBC in 2005 as Chief Financial and Risk Officer, Global Banking and Markets. He has extensive risk management and financial experience. Marc is a member of the Institute of Chartered Accountants in England and Wales.
Appointed to the Board: 1 January 2014
Current appointments include: Marc is a member of the Group Management Board. A director of HSBC Private

Report of the Directors: Corporate Governance (continued) Biographies
HSBC HOLDINGS PLC
268
Bank (Suisse) SA and of HSBC Private Banking Holdings (Suisse) SA.
Former appointments include: Marc served as Chief Financial and Risk Officer, Global Banking and Markets and a director of HSBC Insurance (Bermuda) Limited. He was a European chief financial officer at JP Morgan and audit partner at PricewaterhouseCoopers.
Sir Simon Robertson, 73 Deputy Chairman and senior independent non-executive Director
Chairman of the Nomination Committee and the Group Remuneration Committee. Member of the Financial System Vulnerabilities Committee.
Skills and experience: Simon has a background in international corporate advisory work with a wealth of experience in mergers and acquisitions, merchant banking, investment banking and financial markets. He was honoured with a knighthood in recognition of his services to business. Simon has extensive international experience having worked in France, Germany, the UK and the US.
Appointed to the Board: 2006. Senior Independent non-executive Director since 2007 and Deputy Chairman since 2010.
Current appointments include: Simon is the founding member of Simon Robertson Associates LLP. He is a non-executive director of Berry Bros. & Rudd Limited, The Economist Newspaper Limited and Troy Asset Management. He is also a trustee of the Eden Project Trust and the Royal Opera House Endowment Fund.
Former appointments include: Simon served as non-executive Chairman of Rolls-Royce Holdings plc, Managing Director of Goldman Sachs International, Chairman of Dresdner Kleinwort Benson, and non-executive director of Royal Opera House, Covent Garden Limited and NewShore Partners Limited.
Jonathan Symonds, CBE, 55 Independent non-executive Director
Chairman of the Group Audit Committee since 1 September 2014. A member of the Group Remuneration Committee from 14 April 2014 until 1 September 2014 and a member of the Conduct & Values Committee.
Skills and experience: Jonathan has extensive international financial experience, having worked in the UK, US and Switzerland. He served as Chief Financial Officer of Novartis AG and AstraZeneca plc. Jonathan is a Fellow of the Institute of Chartered Accountants in England and Wales.
Appointed to the Board: 14 April 2014
Current appointments include: Jonathan is Chairman of HSBC Bank plc and of Innocoll AG. He is a non-executive director of Genomics England Limited and of Proteus Digital Health Inc.
Former appointments include: Jonathan was a partner and managing director of Goldman Sachs, and a partner of KPMG. He was a non-executive director and Chairman of the Audit Committee of Diageo plc.
Secretary Ben Mathews, 48 Group Company Secretary
Ben joined HSBC in June 2013 and became Group Company Secretary in July 2013. He is a Fellow of the Institute of Chartered Secretaries and Administrators. Former appointments include: Group Company Secretary of Rio Tinto plc and of BG Group plc.
Group Managing Directors
Ann Almeida, 58 Group Head of Human Resources and Corporate Sustainability(due to retire 31 May 2015)
Ann joined HSBC in 1992. A Group Managing Director since 2008. Former HSBC appointments include: Global Head of Human Resources for Global Banking and Markets, Global Private Banking, Global Transaction Banking and HSBC Amanah.
Samir Assaf, 54 Chief Executive, Global Banking and Markets
Samir joined HSBC in 1994. A Group Managing Director since 2011. He is Chairman of the Global Financial Markets Association and of HSBC France, a director of HSBC Trinkaus & Burkhardt AG and of HSBC Bank plc since 28 March 2014. Former appointments include: director of HSBC Global Asset Management Limited and of HSBC Bank Egypt S.A.E., Head of Global Markets, and Head of Global Markets for Europe, Middle East and Africa.
Peter Boyles, 59 Chief Executive of Global Private Banking
Peter joined HSBC in 1975. A Group Managing Director since October 2013. He is Chairman of HSBC Private Bank (Monaco) SA. Former appointments include: Chief Executive of HSBC France and Continental Europe. A director of HSBC Bank plc, HSBC Bank Malta p.l.c. and of HSBC Trinkaus & Burkhardt AG. Peter ceased to be a director of HSBC Global Asset Management Limited on 29 September 2014.

HSBC HOLDINGS PLC
269
Str
ateg
ic R
epo
rt
Fin
anci
al R
evie
w
Co
rpo
rate
Gov
ern
ance
Fi
nan
cial
Sta
tem
ents
S
har
eho
lder
Info
rmat
ion
Simon Cooper, 47 Chief Executive, Global Commercial Banking
Simon joined HSBC in 1989. A Group Managing Director and Chief Executive of Global Commercial Banking since October 2013. He is a director of HSBC Bank plc. Former HSBC appointments include: Chairman of HSBC Bank Egypt S.A.E. and of HSBC Bank Oman; Chairman and Chief Executive of HSBC Bank Middle East and Chief Executive of HSBC Korea. Head of Corporate and Investment Banking of HSBC Singapore. A director of The Saudi British Bank and of HSBC Bank Middle East Limited.
John Flint, 46 Chief Executive, Retail Banking and Wealth Management
John joined HSBC in 1989. A Group Managing Director since January 2013. He is a director of HSBC Private Banking Holdings (Suisse) SA. Former appointments include: a Director of HSBC Bank Canada, Chief of Staff to the Group Chief Executive and Group Head of Strategy and Planning, Chief Executive Officer, HSBC Global Asset Management, Group Treasurer, and Deputy Head of Global Markets.
Pam Kaur, 51 Group Head of Internal Audit
Pam joined HSBC and became a Group Managing Director in April 2013. She is a co-opted member of The Institute of Chartered Accountants in England & Wales. Former appointments include: Global Head of Group Audit for Deutsche Bank AG, Chief Financial Officer and Chief Operating Officer, Restructuring and Risk Division, Royal Bank of Scotland Group plc, Group Head of Compliance and Anti-Money Laundering, Lloyds TSB, and Global Director of Compliance, Global Consumer Group, Citigroup.
Alan Keir, 56 Chief Executive, HSBC Bank plc
Alan joined HSBC in 1981. A Group Managing Director since 2011. He is a director of HSBC Bank Middle East Limited, HSBC Trinkaus & Burkhardt AG and of HSBC France. Alan is a member of the Advisory Council of TheCityUK and of the Advisory Board of Bradford University School of Management. Former appointments include: Global Head, Global Commercial Banking; director of HSBC Bank A.S. and HSBC Bank Polska S.A.
Stuart Levey, 51 Chief Legal Officer
Stuart joined HSBC and became a Group Managing Director in 2012. Former appointments include: Under Secretary for Terrorism and Financial Intelligence in the US Department of the Treasury, Senior Fellow for National Security and Financial Integrity at the Council on Foreign Relations, Principal Associate Deputy Attorney General at the US Department of Justice, and Partner at Miller, Cassidy, Larroca & Lewin LLP and Baker Botts LLP.
Antonio Losada, 60 Chief Executive, Latin America
Antonio joined HSBC in 1973. A Group Managing Director since December 2012. He is a director of HSBC Latin America Holdings (UK) Limited, HSBC Bank Argentina S.A., HSBC Argentina Holdings S.A., HSBC Mexico, S.A., Institucion de Banca Multiple, Grupo Financiero HSBC, Grupo Financiero HSBC, S.A. de C.V. and of HSBC North America Holdings Inc. Former appointments include: Chief Executive Officer, HSBC Argentina; Chairman of HSBC Bank (Panama) S.A. and of HSBC Argentina Holdings S.A., and Deputy Head, Personal Financial Services, Brazil.
Sean O’Sullivan, 59 Group Chief Operating Officer (due to retire 31 March 2015)
Sean joined HSBC in 1980. A Group Managing Director since 2011. Former appointments include: Group Chief Technology and Services Officer, director and Chief Operating Officer of HSBC Bank plc, and Chief Operating Officer of HSBC Bank Canada.
Peter Wong, 63 Deputy Chairman and Chief Executive, The Hongkong and Shanghai Banking Corporation Limited
Peter joined HSBC in 2005. A Group Managing Director since 2010. He is Chairman of HSBC Bank (China) Company Limited and HSBC Bank Malaysia Berhad, and a non-executive director of Hang Seng Bank Limited, Shek O Development Company Limited and Bank of Communications Co. Ltd. He is also an independent non-executive director of Cathay Pacific Airways Limited. Former appointments include: Vice Chairman of HSBC Bank (Vietnam) Ltd, director of HSBC Bank Australia Limited and of Ping An Insurance (Group) Company of China, Ltd.

Report of the Directors: Corporate Governance (continued) Board of Directors
HSBC HOLDINGS PLC
270
Board of Directors The Board of Directors of HSBC Holdings (the ‘Board’) exists to promote the long-term success of the Company and deliver sustainable value to our shareholders. Led by the Group Chairman, it sets the strategy and risk appetite for the Group and approves capital and operating plans presented by management for the achievement of the strategic objectives. Implementation of the strategy is delegated to the Group Management Board (‘GMB’) which, in turn, is led by the Group Chief Executive.
Directors
HSBC Holdings has a unitary Board. The authority of the Directors is exercised in Board meetings where the Board acts collectively. The Directors who served during the year were Kathleen Casey (appointed 1 March 2014), Safra Catz, Laura Cha, Marvin Cheung (retired 1 August 2014), John Coombe (retired 23 May 2014), Lord Evans of Weardale, Joachim Faber, Rona Fairhead, Renato Fassbind (retired 1 September 2014), Douglas Flint, Stuart Gulliver, James Hughes-Hallett (retired 23 May 2014), Sam Laidlaw, John Lipsky, Rachel Lomax, Iain Mackay, Heidi Miller (appointed 1 September 2014), Marc Moses (appointed 1 January 2014), Sir Simon Robertson and Jonathan Symonds (appointed 14 April 2014).
Phillip Ameen was appointed with effect from 1 January 2015.
At the date of approval of the Annual Report and Accounts 2014, the Board comprised the Group Chairman, Group Chief Executive, Group Finance Director, Group Chief Risk Officer and 13 non-executive Directors.
The names and brief biographical details of the Directors are included on pages 264 to 268.
Executive Directors
The Group Chairman, Group Chief Executive, Group Finance Director and Group Chief Risk Officer are HSBC employees.
Non-executive Directors
Non-executive Directors are not HSBC employees and do not participate in the daily management of HSBC; they bring an independent perspective, constructively challenge and help develop proposals on strategy, scrutinise the performance of management in meeting agreed goals and objectives and monitor the Group’s risk profile and the reporting of performance. The non-executive Directors bring a wide variety of experience from the public and private sectors, including the leadership of large complex multinational enterprises.
Non-executive Directors’ terms of appointment
The Board has determined the minimum time commitment expected of non-executive Directors to be about 30 days per annum. Time devoted to the Company could be considerably more, particularly if serving on Board committees.
Non-executive Directors are appointed for an initial three-year term and, subject to re-election by shareholders at annual general meetings, are typically expected to serve two three-year terms. The Board may invite a director to serve additional periods. All Directors are subject to annual election by shareholders.
Letters setting out the terms of appointment of each of the non-executive Directors are available for inspection at the Company’s registered office.
Group Chairman and Group Chief Executive
The roles of Group Chairman and Group Chief Executive are separate, with a clear division of responsibilities between the running of the Board and the executive responsibility for running HSBC’s business. Descriptions of the roles and responsibilities of the Group Chairman and the Group Chief Executive are available at www.hsbc.com/investor-relations/governance/board-committees. Their key responsibilities are set out below.
Key responsibilities
Group Chairman – Douglas Flint • Leads the Board and ensures its effectiveness. • Develops relationships with governments, regulators and
investors. • Leads the Group’s interactions on matters of public policy and
regulatory reform with regard to the banking and financial services industry.
• Maintains corporate reputation and character. • Undertakes performance management of the Group Chief
Executive.
Group Chief Executive – Stuart Gulliver • Develops, and delivers performance against, business plans. • Develops Group strategy, in agreement with the Group
Chairman, for recommendation to the Board. • As Chairman of the GMB, drives performance within strategic
goals and commercial objectives agreed by the Board.
Deputy Chairman and senior independent non-executive Director
A description of the roles and responsibilities of the Deputy Chairman and senior independent non-executive Director, which has been approved by the Board, is available at www.hsbc.com/investor-relations/governance/board-committees. His key responsibilities are set out below.

HSBC HOLDINGS PLC
271
Str
ateg
ic R
epo
rt
Fi
nan
cial
Rev
iew
Co
rpo
rate
Go
vern
ance
Fin
anci
al S
tate
men
ts
S
har
eho
lder
Info
rmat
ion
Key responsibilities
Deputy Chairman and senior independent non-executive Director – Sir Simon Robertson
• Deputises for the Group Chairman at meetings of the Board or shareholders and supports the Group Chairman in his role.
• Acts as an intermediary for other non-executive Directors when necessary.
• Leads the non-executive Directors in the oversight of the Group Chairman.
• Ensures there is a clear division of responsibility between the Group Chairman and Group Chief Executive.
Appointment, retirement and re-election of Directors
The Board may at any time appoint any person who is willing to act as a Director, either to fill a vacancy or as an addition to the existing Board, but the total number of Directors shall not be less than five or exceed 25. Any Director so appointed by the Board shall retire at the Annual General Meeting following his or her appointment and shall be eligible for election but would not be taken into account in determining the number of Directors who are to retire by rotation at such meeting in accordance with the Articles of Association. The Board may appoint any Director to hold any employment or executive office and may revoke or terminate any such appointment. Shareholders may, by ordinary resolution, appoint a person a Director or remove any Director before the expiration of his or her period of office. On the recommendation of the Nomination Committee and in compliance with the UK Corporate Governance Code, the Board has decided that all of the Directors should be subject to annual re-election by shareholders. Accordingly, all of the Directors will retire at the forthcoming Annual General Meeting and offer themselves for election or re-election.
Powers of the Board
The Board is responsible for overseeing the management of HSBC globally and, in so doing, may exercise its powers, subject to any relevant laws and regulations and to the Articles. The Board has adopted terms of reference which are available at www.hsbc.com/1/2/ about/board-of-directors. The Board reviews its terms of reference annually.
In particular, the Board may exercise all the powers of the Company to borrow money and to mortgage or
charge all or any part of the undertaking, property or assets (present or future) of HSBC Holdings and may also exercise any of the powers conferred on it by the Companies Act 2006 and/or by shareholders. The Board is able to delegate and confer on any executive Director any of its powers, authorities and discretions (including the power to sub-delegate) for such time and on such terms as it thinks fits. In addition, the Board may establish any local or divisional boards or agencies for managing the business of HSBC Holdings in any specified locality and delegate and confer on any local or divisional board, manager or agent so appointed any of its powers, authorities and discretions (including the power to sub-delegate) for such time and on such terms as it thinks fit. The Board may also, by power of attorney or otherwise, appoint any person or persons to be the agent of HSBC Holdings and may delegate to any such person or persons any of its powers, authorities and discretions (including the power to sub-delegate) for such time and on such terms as it thinks fit.
The Board delegates the day-to-day management of HSBC Holdings to the GMB but reserves to itself approval of certain matters including operating plans, risk appetite and performance targets, procedures for monitoring and controlling operations, credit, market risk limits, acquisitions, disposals, investments, capital expenditure or realisation or creation of a new venture, specified senior appointments and any substantial change in balance sheet management policy.
HSBC Holdings was registered in Hong Kong under part XI of the Companies Ordinance on 17 January 1991.
Board meetings
Eight Board meetings and two one-day strategy meetings were held in 2014. At least one Board meeting each year is held in a key strategic location outside the UK. During 2014, Board meetings were held in Hong Kong and Beijing.
The table below shows each Director’s attendance at meetings of the Board during 2014.
During 2014, the non-executive Directors and the Group Chairman met once without the other executive Directors. The non-executive Directors also met four times without the Group Chairman, including to appraise the Group Chairman’s performance.

Report of the Directors: Corporate Governance (continued) Board of Directors
HSBC HOLDINGS PLC
272
2014 Board attendance record
Meetings attended
Meetings
eligible toattend as
a Director
Kathleen Casey1,8 5 5Safra Catz 8 8Laura Cha 8 8Marvin Cheung2 4 5John Coombe3 4 4Lord Evans of Weardale8 7 7Joachim Faber 8 8Rona Fairhead8 7 7Renato Fassbind4 7 7Douglas Flint 8 8Stuart Gulliver 8 8James Hughes-Hallett3 4 4Sam Laidlaw 8 8John Lipsky8 7 7Rachel Lomax 8 8Iain Mackay 8 8Heidi Miller5,8 2 2Marc Moses6 8 8Sir Simon Robertson 8 8Jonathan Symonds7 6 6
Meetings held in 20148 8
1 Appointed a Director on 1 March 2014. 2 Retired as a Director on 1 August 2014. 3 Retired as a Director on 23 May 2014. 4 Retired as a Director on 1 September 2014. 5 Appointed a Director on 1 September 2014. 6 Appointed a Director on 1 January 2014. 7 Appointed a Director on 14 April 2014. 8 A meeting was called at short notice. Those Directors not able to
attend were briefed prior to the meeting.
Board balance and independence of Directors
The Board comprises a majority of independent non-executive Directors. The size of the Board is considered to be appropriate given the complexity and geographical spread of our business and the significant time demands placed on the Directors.
The Nomination Committee regularly reviews the structure, size and composition of the Board (including skills, knowledge, experience, independence and diversity) and makes recommendations to the Board with regard to any changes.
The Board has adopted a policy on Board diversity which is consistent with the Group’s strategic focus on ethnicity, age and gender diversity for the employee base. Further information on the Board diversity policy can be found on page 285.
The Board considers all of the non-executive Directors to be independent. When determining independence the Board considers that calculation of the length of service of a non-executive Director begins on the date of his or her election by shareholders following their appointment as a Director of HSBC Holdings. Rona Fairhead has served on the Board for more than nine years and, in that respect only, does not meet the usual criteria for independence set out in the UK Corporate Governance Code. The Board has determined Rona Fairhead to be independent in character and judgement,
notwithstanding her length of service, taking into account her continuing level of constructive challenge of management and strong contribution to Board discussions. Rona Fairhead will stand for re-election at the 2015 Annual General Meeting. It is our view that the experience of current and previous service on an HSBC subsidiary company board can be a considerable benefit but that such service does not detract from a non-executive Director’s independence. The Board has concluded that there are no relationships or circumstances which are likely to affect a non-executive Director’s judgement and any relationships or circumstances which could appear to do so are not considered to be material.
In accordance with the Rules Governing the Listing of Securities on the Stock Exchange of Hong Kong Limited, each non-executive Director determined by the Board to be independent has provided an annual confirmation of his or her independence.
Information and support
The Board regularly reviews reports on performance against financial and other strategic objectives, business developments and investor and external relations. The chairmen of Board committees and the Group Chief Executive report to each meeting of the Board on the activities of the committees since the previous Board meeting. The Board receives regular reports and presentations on strategy and developments in the global businesses and principal geographical areas. Regular reports are also provided on the Group’s risk appetite, top and emerging risks, risk management, credit exposures and the Group’s loan portfolio, asset and liability management, liquidity, litigation, financial and regulatory compliance and reputational issues.
The Directors have free and open contact with management at all levels. When attending Board offsite meetings and when travelling for other reasons, non-executive Directors are encouraged to take opportunities to see local business operations at first hand and to meet local management.
Role of the Group Company Secretary
All Directors have access to the advice and services of the Group Company Secretary, who is responsible to the Board for ensuring that Board procedures and all applicable rules and regulations are complied with.
Under the direction of the Group Chairman, the Group Company Secretary’s responsibilities include ensuring good information flows within the Board and its committees and between senior management and non-executive Directors, as well as facilitating induction and assisting with professional development as required.
The Group Company Secretary is responsible for advising the Board through the Group Chairman on corporate governance matters.
The agenda and supporting papers are distributed in advance of all Board and Board committee meetings to allow time for appropriate review and to facilitate full discussion at the meetings. All Directors have full and
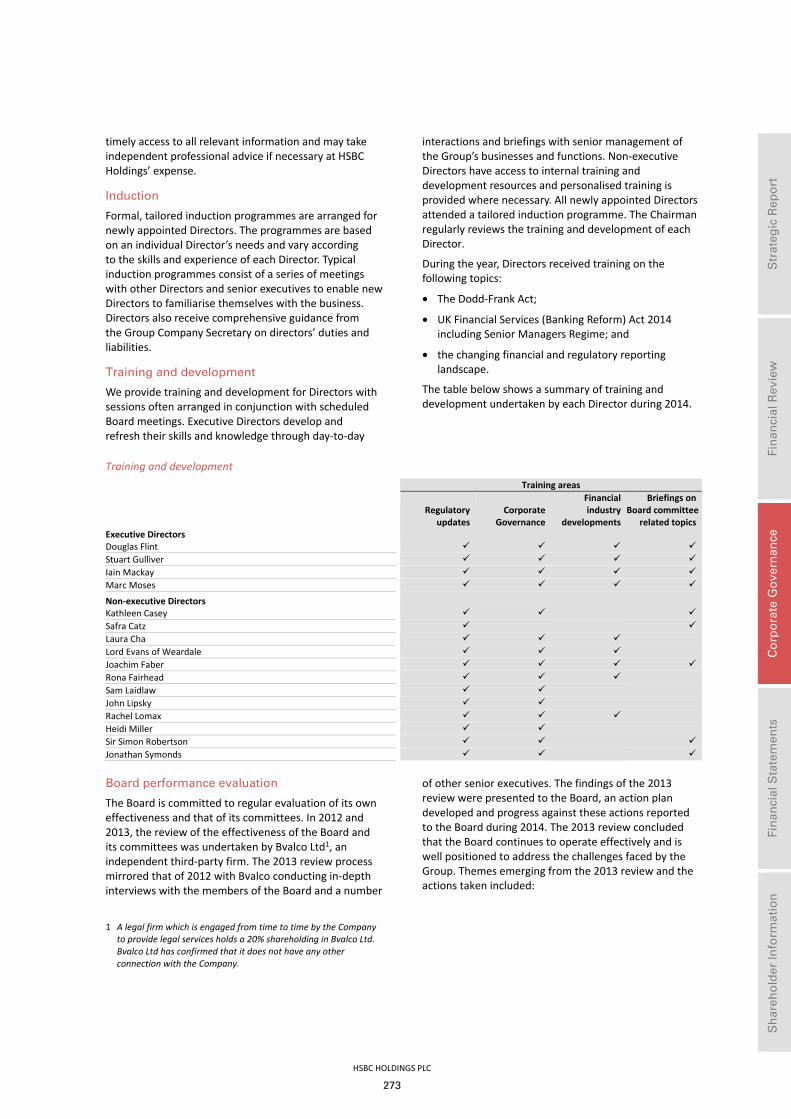
HSBC HOLDINGS PLC
273
Str
ateg
ic R
epo
rt
Fi
nan
cial
Rev
iew
Co
rpo
rate
Go
vern
ance
Fin
anci
al S
tate
men
ts
S
har
eho
lder
Info
rmat
ion
timely access to all relevant information and may take independent professional advice if necessary at HSBC Holdings’ expense.
Induction
Formal, tailored induction programmes are arranged for newly appointed Directors. The programmes are based on an individual Director’s needs and vary according to the skills and experience of each Director. Typical induction programmes consist of a series of meetings with other Directors and senior executives to enable new Directors to familiarise themselves with the business. Directors also receive comprehensive guidance from the Group Company Secretary on directors’ duties and liabilities.
Training and development
We provide training and development for Directors with sessions often arranged in conjunction with scheduled Board meetings. Executive Directors develop and refresh their skills and knowledge through day-to-day
interactions and briefings with senior management of the Group’s businesses and functions. Non-executive Directors have access to internal training and development resources and personalised training is provided where necessary. All newly appointed Directors attended a tailored induction programme. The Chairman regularly reviews the training and development of each Director.
During the year, Directors received training on the following topics:
• The Dodd-Frank Act;
• UK Financial Services (Banking Reform) Act 2014 including Senior Managers Regime; and
• the changing financial and regulatory reporting landscape.
The table below shows a summary of training and development undertaken by each Director during 2014.
Training and development Training areas
Regulatory updates
Corporate Governance
Financial industry developments
Briefings on Board committee related topics
Executive Directors Douglas Flint Stuart Gulliver Iain Mackay Marc Moses
Non-executive Directors Kathleen Casey Safra Catz Laura Cha Lord Evans of Weardale Joachim Faber Rona Fairhead Sam Laidlaw John Lipsky Rachel Lomax Heidi Miller Sir Simon Robertson Jonathan Symonds Board performance evaluation
The Board is committed to regular evaluation of its own effectiveness and that of its committees. In 2012 and 2013, the review of the effectiveness of the Board and its committees was undertaken by Bvalco Ltd1, an independent third-party firm. The 2013 review process mirrored that of 2012 with Bvalco conducting in-depth interviews with the members of the Board and a number
of other senior executives. The findings of the 2013 review were presented to the Board, an action plan developed and progress against these actions reported to the Board during 2014. The 2013 review concluded that the Board continues to operate effectively and is well positioned to address the challenges faced by the Group. Themes emerging from the 2013 review and the actions taken included:
1 A legal firm which is engaged from time to time by the Company to provide legal services holds a 20% shareholding in Bvalco Ltd. Bvalco Ltd has confirmed that it does not have any other connection with the Company.

Report of the Directors: Corporate Governance (continued) Board of Directors
HSBC HOLDINGS PLC
274
2013 Review of Board effectiveness
Theme Action taken
Ensuring an appropriate balance between regulatory, business and strategic issues at Board meetings.
Key issues have been further prioritised.
More time has been provided for the debate of these issues at Board meetings.
Providing further opportunities for the executive and non-executive Directors to meet outside of the formal setting of the boardroom.
Informal executive and non-executive Directors’ events have been planned around Board meetings providing additional forums for discussion.
Non-executive Directors have been invited to a number of events attended by executive Directors.
Arrangements made for non-executive Directors to meet senior members of local management teams in HSBC local offices when travelling.
Ensuring increased time and opportunity for non-executive Director meetings.
Non-executive Director-only sessions are scheduled around Board meetings.
A number of informal non-executive Director events were organised throughout the year.
Maintaining focus on succession planning. Succession planning remains a key area of focus with formal governance processes in place.
Those named in succession plans are scheduled to present to Board meetings.
A third and final review was facilitated by Bvalco during the year, providing continuity and allowing for progress against prior year themes to be evaluated.
Director performance evaluation
Evaluation of the individual performance of each non-executive Director is undertaken annually by the Group Chairman. During this evaluation, the Group Chairman discusses the individual contribution of the Director, explores training and development needs, seeks input on areas where the Director feels he or she could make a greater contribution and discusses whether the time commitment required of the Director can continue to be delivered. Based upon their individual evaluation, the Group Chairman has confirmed that all of the non-executive Directors continue to perform effectively, contribute positively to the governance of HSBC and demonstrate full commitment to their roles.
Evaluation of the individual performance of each executive Director is undertaken as part of the performance management process for all employees, the results of which are considered by the Group Remuneration Committee when determining variable pay awards each year.
The non-executive Directors, led by the Deputy Chairman and senior independent non-executive Director, are responsible for the evaluation of the performance of the Group Chairman.
The Board monitors the implementation of actions arising from each performance evaluation.
It is the intention of the Board to continue to undertake an evaluation of its performance and that of its committees and individual Directors annually, with independent external input to the process, as appropriate, at least every third year.
Relations with shareholders
All Directors are encouraged to develop an understanding of the views of major shareholders. Non-executive Directors are invited to attend analyst presentations and other meetings with institutional investors and their representative bodies. Directors also meet representatives of institutional shareholders annually to discuss corporate governance matters.
All executive Directors and certain other senior executives hold regular meetings with institutional investors. The Board receives a regular investor relations activity report which provides feedback from meetings with institutional shareholders and brokers, analysts’ forecasts, information from research reports and share price performance data. The Board also receives regular reports from one of our corporate brokers.
The Group’s shareholder communication policy is available on www.hsbc.com/governance.
On several occasions during 2014, non-executive Directors, including the Deputy Chairman and senior independent non-executive Director, met or corresponded with institutional investors and their representatives to discuss corporate governance topics and executive remuneration.
As Deputy Chairman and senior independent non-executive Director, Sir Simon Robertson is available to shareholders should they have concerns which contact through the normal channels of Group Chairman, Group Chief Executive, Group Finance Director, Group Chief Risk Officer, or other executives cannot resolve or for which such contact would be inappropriate. He may be contacted through the Group Company Secretary at 8 Canada Square, London E14 5HQ.

HSBC HOLDINGS PLC
275
Str
ateg
ic R
epo
rt
Fi
nan
cial
Rev
iew
Co
rpo
rate
Go
vern
ance
Fin
anci
al S
tate
men
ts
S
har
eho
lder
Info
rmat
ion
Conflicts of interest, indemnification of Directors and contracts of significance
The Board has adopted a policy and procedures relating to Directors’ conflicts and potential conflicts of interest and can determine the terms of authorisation for such situations. The Board’s powers to authorise conflicts are operating effectively and the procedures are being followed. A review of situational conflicts which have been authorised from time-to-time and the terms of those authorisations are undertaken by the Board annually.
The Articles of Association provide that Directors are entitled to be indemnified out of the assets of HSBC Holdings against claims from third parties in respect of certain liabilities. Such provisions have been in place during the financial year but have not been utilised by the Directors. All Directors have the benefit of directors’ and officers’ liability insurance.
None of the Directors had, during the year or at the end of the year, a material interest, directly or indirectly, in any contract of significance with any HSBC company.
Corporate governance codes
HSBC is committed to high standards of corporate governance. During 2014, HSBC has complied with the applicable code provisions of: (i) The UK Corporate Governance Code issued by the Financial Reporting Council in September 2012; and (ii) the Hong Kong Corporate Governance Code set out in Appendix 14 to the Rules Governing the Listing of Securities on The Stock
Exchange of Hong Kong Limited, save that the Group Risk Committee is responsible for the oversight of internal control (other than internal control over financial reporting) and risk management systems (Hong Kong Corporate Governance Code provision C.3.3 paragraphs (f), (g) and (h)). If there were no Group Risk Committee, these matters would be the responsibility of the Group Audit Committee. The UK Corporate Governance Code is available at www.frc.org.uk and the Hong Kong Corporate Governance Code is available at www.hkex.com.hk.
The Board has adopted a code of conduct for transactions in HSBC Group securities by Directors. The code of conduct complies with The Model Code in the Listing Rules of the FCA and with The Model Code for Securities Transactions by Directors of Listed Issuers (‘Hong Kong Model Code’) in the Rules Governing the Listing of Securities on The Stock Exchange of Hong Kong Limited, save that The Stock Exchange of Hong Kong Limited has granted certain waivers from strict compliance with the Hong Kong Model Code. The waivers granted by The Stock Exchange of Hong Kong Limited primarily take into account accepted practices in the UK, particularly in respect of employee share plans. Following specific enquiry, each Director has confirmed that he or she has complied with the code of conduct for transactions in HSBC Group securities throughout the year.
All Directors are routinely reminded of their obligations under the code of conduct for transactions in HSBC Group securities.

Report of the Directors: Corporate Governance (continued) Board committees
HSBC HOLDINGS PLC
276
Board committees
1 Established on 17 January 2014. 2 Established on 5 December 2014.
The Board has established a number of committees consisting of Directors, Group Managing Directors and, in the case of the Financial System Vulnerabilities Committee, co-opted non-director members. The key roles of the Board committees are described above. The Chairman of each non-executive Board committee reports to each meeting of the Board on the activities of the committee since the previous Board meeting.
Group Management Board
Role and members
The GMB exercises all of the powers, authorities and discretions of the Board of Directors in so far as they concern the management and day-to-day running of the Company and its subsidiaries.
Members Stuart Gulliver (Chairman), Iain Mackay and Marc Moses who are executive Directors, and Ann Almeida, Samir Assaf, Peter Boyles, Simon Cooper, John Flint, Pam Kaur (non-voting), Alan Keir, Stuart Levey, Antonio Losada, Sean O’Sullivan and Peter Wong, all of whom are Group Managing Directors.
The Group Chief Executive chairs the GMB. The head of each global business and global function and the chief
executive of each region attend GMB meetings, either as members or by invitation. The GMB is a key element of our management reporting and control structure such that all of our line operations are accountable either to a member of the GMB or directly to the Group Chief Executive, who in turn reports to the Group Chairman. The Board has set objectives and measures for the GMB. These align senior executives’ objectives and measures with the strategy and operating plans throughout HSBC. The Chairman of the GMB reports to each meeting of the Board on the activities of the GMB. The Group Chief Risk Officer chairs regular Risk Management Meetings of the GMB. The Risk Management Meetings provide strategic direction and oversight of enterprise-wide management of all risks and establish, maintain and periodically review the policy and guidelines for the management of risk within the Group. The Risk Management Meeting also reviews the development and implementation of Global Standards reflecting best practices which must be adopted and adhered to consistently throughout the Group. The Head of Group Financial Crime Compliance and Group Money Laundering Reporting Officer attends this section of the Risk Management Meeting.
HSBC Holdings plcBoard of Directors
Group RiskCommittee
Non-executive responsibility for oversight of, and advice to the Board on, high level
risk-related matters and risk governance.
Group AuditCommittee
Non-executive responsibilityfor oversight of, and advice
to the Board on, matters relating to financial
reporting and of internal controls over financial
reporting.
Group RemunerationCommittee
Non-executive responsibility for setting the overarching principles, parameters and
governance framework of the Group’s
remuneration policy and the remuneration of senior executives.
NominationCommittee
Non-executive responsibility for leading the process for
Board appointments and foridentifying and nominating,for approval by the Board,
candidates for appointment to the Board.
Executive management committee whichis responsible for management and
day-to-day running ofHSBC under the direct authority of the Board.
Group ManagementBoard
Financial SystemVulnerabilities
Committee
Non-executive responsibility for oversight of (i) controls and procedures to identify areas where HSBC and the
financial system more broadly may become
exposed to financial crimeor system abuse, and(ii) HSBC policies and
procedures sufficient to ensure the continuing
obligations to regulatoryand law enforcement
agencies are met.
Conduct & ValuesCommittee1
Non-executive responsibility for oversight of, and advice
to the Board on, HSBC policies, procedures
and standards to ensure that the Group conducts business responsibly and consistently adheres to
HSBC Values.
Philanthropic andCommunity Investment Oversight Committee2
Non-executive responsibility for the oversight of HSBC’s
philanthropic and community investment
activities in supportof the Group’s corporate sustainability objectives.
Chairman’sCommittee
Acts on behalf of the Board between scheduled Board
meetings to facilitate ad hoc unforeseen business
requiring urgent Board approval.
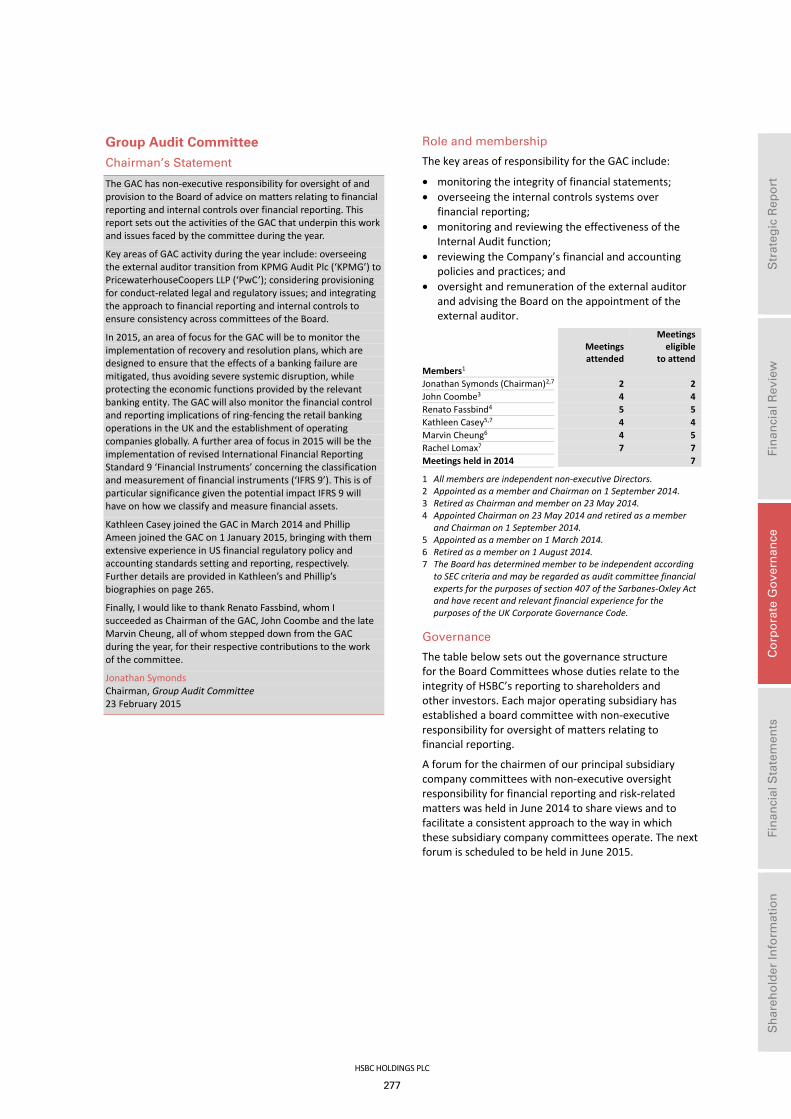
HSBC HOLDINGS PLC
277
Str
ateg
ic R
epo
rt
Fi
nan
cial
Rev
iew
Co
rpo
rate
Go
vern
ance
Fin
anci
al S
tate
men
ts
S
har
eho
lder
Info
rmat
ion
Group Audit Committee
Chairman’s Statement
The GAC has non-executive responsibility for oversight of and provision to the Board of advice on matters relating to financial reporting and internal controls over financial reporting. This report sets out the activities of the GAC that underpin this work and issues faced by the committee during the year.
Key areas of GAC activity during the year include: overseeing the external auditor transition from KPMG Audit Plc (‘KPMG’) to PricewaterhouseCoopers LLP (‘PwC’); considering provisioning for conduct-related legal and regulatory issues; and integrating the approach to financial reporting and internal controls to ensure consistency across committees of the Board.
In 2015, an area of focus for the GAC will be to monitor the implementation of recovery and resolution plans, which are designed to ensure that the effects of a banking failure are mitigated, thus avoiding severe systemic disruption, while protecting the economic functions provided by the relevant banking entity. The GAC will also monitor the financial control and reporting implications of ring-fencing the retail banking operations in the UK and the establishment of operating companies globally. A further area of focus in 2015 will be the implementation of revised International Financial Reporting Standard 9 ‘Financial Instruments’ concerning the classification and measurement of financial instruments (‘IFRS 9’). This is of particular significance given the potential impact IFRS 9 will have on how we classify and measure financial assets.
Kathleen Casey joined the GAC in March 2014 and Phillip Ameen joined the GAC on 1 January 2015, bringing with them extensive experience in US financial regulatory policy and accounting standards setting and reporting, respectively. Further details are provided in Kathleen’s and Phillip’s biographies on page 265.
Finally, I would like to thank Renato Fassbind, whom I succeeded as Chairman of the GAC, John Coombe and the late Marvin Cheung, all of whom stepped down from the GAC during the year, for their respective contributions to the work of the committee.
Jonathan Symonds Chairman, Group Audit Committee 23 February 2015
Role and membership
The key areas of responsibility for the GAC include:
• monitoring the integrity of financial statements; • overseeing the internal controls systems over
financial reporting; • monitoring and reviewing the effectiveness of the
Internal Audit function; • reviewing the Company’s financial and accounting
policies and practices; and • oversight and remuneration of the external auditor
and advising the Board on the appointment of the external auditor.
Meetings attended
Meetings eligible to attend
Members1 Jonathan Symonds (Chairman)2,7 2 2John Coombe3 4 4Renato Fassbind4 5 5Kathleen Casey5,7 4 4Marvin Cheung6 4 5Rachel Lomax7 7 7Meetings held in 2014 7
1 All members are independent non-executive Directors. 2 Appointed as a member and Chairman on 1 September 2014. 3 Retired as Chairman and member on 23 May 2014. 4 Appointed Chairman on 23 May 2014 and retired as a member
and Chairman on 1 September 2014. 5 Appointed as a member on 1 March 2014. 6 Retired as a member on 1 August 2014. 7 The Board has determined member to be independent according
to SEC criteria and may be regarded as audit committee financial experts for the purposes of section 407 of the Sarbanes-Oxley Act and have recent and relevant financial experience for the purposes of the UK Corporate Governance Code.
Governance
The table below sets out the governance structure for the Board Committees whose duties relate to the integrity of HSBC’s reporting to shareholders and other investors. Each major operating subsidiary has established a board committee with non-executive responsibility for oversight of matters relating to financial reporting.
A forum for the chairmen of our principal subsidiary company committees with non-executive oversight responsibility for financial reporting and risk-related matters was held in June 2014 to share views and to facilitate a consistent approach to the way in which these subsidiary company committees operate. The next forum is scheduled to be held in June 2015.

Report of the Directors: Corporate Governance (continued) Board committees
HSBC HOLDINGS PLC
278
Governance structure for the oversight of financial reporting
Authority Membership Responsibilities include:
Board Executive and non-executive Directors
• Financial reporting • Appointing senior financial officers
Disclosure Committee
Representatives from global businesses, functions and certain Group companies
• Reviewing the Group’s material communications with investors • Assisting the Group Chief Executive and Group Finance Director to discharge their
obligations relating to financial reporting under the Securities Exchange Act of 1934• Monitoring and reviewing the effectiveness of controls and procedures established
to ensure that information is disclosed appropriately and on a timely basis • Reporting findings and making recommendations to the Group Chief Executive,
Group Finance Director and the GAC
Subsidiary board committees responsible for oversight of financial reporting and global business audit committees
Independent non-executive directors and/or HSBC Group employees with no line of functional responsibility for the activities of relevant subsidiary or global business, as appropriate
• Providing reports to the GAC on financial statements and internal controls over financial reporting of relevant subsidiaries or businesses, as requested
How the Committee discharged its responsibilities
Throughout the year, the GAC received regular reports on a number of matters including internal audit findings and follow-up work, accounting issues and judgements, and legal and regulatory matters. The GAC received presentations from a number of members of the senior management including the Group Finance Director, Group Chief Accounting Officer and Group Head of Internal Audit. The Chairman of the GAC also had meetings with a number of these individuals separately, providing an additional forum to discuss specific issues.
During the year, the GAC held meetings with the Group Head of Internal Audit and with the external auditors in the absence of management.
In discharging its responsibilities the GAC undertakes the following principal activities:
• oversight and challenge of the effectiveness of internal control processes that form the internal control framework for financial reporting and also of those internal controls processes that relate to the Sarbanes-Oxley Act. The Group Head of Internal Audit and the external auditor regularly report to the GAC without management present. During the year, the GAC confirmed that the Finance function was adequately resourced and that qualifications and experience of staff in that function were appropriate. Further details on internal control can be found on pages 288 to 290;
• the adoption for full implementation in 2015 of the revised Committee of Sponsoring Organisations of the Treadway Commission (‘COSO’) framework, an integrated internal control framework to meet our internal controls obligations under the Sarbanes-Oxley Act and also under the UK and Hong Kong corporate governance codes;
• review of HSBC’s financial and accounting policies and their application to the reporting of the Group’s activities and financial performance. Further details of this area of the GAC’s work are provided in the
‘Principal activities and significant issues considered’ table on page 279;
• monitoring of the legal and regulatory environment; the GAC received regular reports on litigation and on the application of changes in law, regulation, accounting policies and practices including reports on developments in programmes to implement IFRSs, Basel III/CRD IV and the recommendations of the Parliamentary Commission on Banking Standards, particularly as they relate to accounting policies and financial reporting;
• review of the effectiveness of the Internal Audit function. The GAC’s effectiveness review encompassed the scope of the Internal Audit function’s work and the adequacy of the skills of the internal audit team. The GAC found the Internal Audit function remained effective and this conclusion was supported by the findings of a quality assurance review of the Internal Audit function undertaken by PwC. During the year, the GAC terms of reference and the audit charter of internal audit were updated to clarify the GAC’s responsibility for the oversight of the governance of the Internal Audit function and the reporting line of the Group Head of Internal Audit to the Chairman of the GAC. The Audit Charter is available on the HSBC website at www.hsbc.com/ investor-relations/governance/internal-control.
• an annual assessment of the effectiveness of the external auditor which includes assessments by the Group’s chief financial officers of its major geographical regions. The GAC also considered the level of scrutiny applied during the audit and the interaction of the auditor with senior management. Following this review the GAC was satisfied that KPMG continued to perform effectively as external auditor; and
• an annual review of the independence of the external auditor. All services provided by KPMG during the 2014 were pre-approved by the GAC and were entered into under the pre-approval policies established by the GAC. The pre-approved services

HSBC HOLDINGS PLC
279
Str
ateg
ic R
epo
rt
Fi
nan
cial
Rev
iew
Co
rpo
rate
Go
vern
ance
Fin
anci
al S
tate
men
ts
S
har
eho
lder
Info
rmat
ion
relate to regulatory reviews, agreed-upon procedures reports, other types of attestation reports, the provision of advice and other non-audit services allowed under the SEC independence rules. The services fall into the categories of audit services, audit-related services, tax services and other services.
Following its review, the GAC confirmed that it considered KPMG to be independent and KPMG, in accordance with industry standards, has provided the GAC with written confirmation of its independence for the duration of the financial year ended 31 December 2014. The GAC approved the remuneration and terms of engagement and recommended to the Board the re-appointment of KPMG for the financial year ended 31 December 2014.
The GAC’s oversight of the audit tender process in 2013 resulted in the GAC’s recommendation to the Board that PwC be appointed as the Group’s auditor for the financial year beginning on 1 January 2015. The GAC has recommended to the Board that PwC be appointed at the forthcoming Annual General Meeting. PwC provided written confirmation of its independence from HSBC prior to its appointment. During 2014, regular meetings were held with PwC’s audit engagement team to assist in developing the 2015 external audit plan.
The Board has approved, on the recommendation of the GAC, a policy for the employment by HSBC of former employees of KPMG and PwC. The GAC receives an annual report on such former employees who are employed and the number in senior positions. This report enables the GAC to consider whether there has been any impairment, or appearance of impairment, of the external auditor’s judgement, objectivity or independence in respect of the audit. An analysis of the remuneration paid in respect of audit and non-audit services provided by KPMG for each of the past three years is disclosed in Note 7 on the Financial Statements.
In addition to addressing the matters noted above, the GAC considered the significant accounting issues described below. The GAC considered the appropriateness of management’s judgements and estimates, where appropriate discussing these with KPMG, the external auditors, and reviewing the matters referred to in the external auditor’s report as risks of material mis-statement.
The GAC undertakes an annual review of its own terms of reference and effectiveness. The terms of reference can be found on our website at www.hsbc.com/ investor-relations/governance/ board-committees.
Principal activities and significant issues considered include:
Key area Action taken Appropriateness of provisioning for legal proceedings and regulatory matters
The GAC received reports from management on the recognition and amounts of provisions, the existence of contingent liabilities, and the disclosures relating to provisions and contingent liabilities, for legal proceedings and regulatory matters. Specific areas addressed included the legal action brought by the US Federal Housing Finance Agency in respect of mortgage-backed securities offerings, and provisioning arising from investigations conducted by the UK Financial Conduct Authority and US regulators and law enforcement agencies relating to trading activities in the foreign exchange market. In 2015, the GAC considered reports and disclosures concerning potential liabilities in connection with investigations of HSBC’s Swiss Private Bank by a number of tax administration, regulatory and law enforcement authorities.
Loan impairment, allowances and charges
The GAC reviewed loan impairment allowances for personal and wholesale lending. Significant judgements and estimates reviewed included a review of loss emergence periods across our wholesale loan portfolios, consideration of the effect of falling oil prices on potential wholesale loan impairments, notable individual cases of impairment in wholesale lending and the adequacy of collective impairment allowances on personal lending portfolios.
UK customer remediation The GAC considered the provisions for redress for mis-selling of payment protection insurance policies, provisions for mis-selling of interest rate hedging products, and liabilities in respect of breaches of the UK Consumer Credit Act.
Valuation of financial instruments
The GAC reviewed developments in market practice regarding accounting for funding costs in the valuation of uncollateralised derivatives. In line with evolving market practice, in the fourth quarter of 2014 we adopted an FFVA to account for the impact of incorporating the cost of funding into the valuation of uncollateralised derivatives.
Bank of Communications Co., Limited (‘BoCom’) impairment testing
During the year the GAC considered the regular impairment reviews of HSBC’s investment in BoCom and management’s conclusions that the investment is not impaired. When testing investments in associates for impairment, IFRS requires the carrying amount to be compared with the higher of fair value and value in use. The GAC reviewed a number of aspects of management’s work in this area including the sensitivity of the result of the impairment review to estimates and assumptions of projected future cash flows and the discount rate.
Goodwill impairment testing
No impairment was identified as a result of the annual goodwill impairment test, and the review for indicators of impairment as at 31 December 2014 identified no indicators of impairment. The result for GPB Europe is sensitive to key assumptions and is subject to enhanced disclosure.
Recognition of deferred tax assets
In considering the recoverability of the Group’s deferred tax assets, the GAC reviewed the recognition of deferred tax assets in the USA, Brazil and Mexico, and the associated projections of future taxable income.
Non-GAAP financial measures
The GAC considered the change in the non-GAAP financial measures presented from ‘underlying performance’ to an ‘adjusted performance’ measure in the 2014 ARA.

Report of the Directors: Corporate Governance (continued) Board committees
HSBC HOLDINGS PLC
280
Group Risk Committee
Chairman’s Statement
The Group Risk Committee (‘GRC’) oversees and advises the Board on high level risk-related matters and internal control, other than internal financial controls, which are overseen by the Group Audit Committee. The GRC is responsible for ensuring that Group risk profile and underlying business activity is in line with risk appetite as approved by the Board.
The tone from the top of the Group, which is set by senior management, is critical to effective risk management. During the year the GRC continued to focus on steps taken to communicate and reinforce the Group’s commitment to ‘doing the right thing’. This focus is reflected in the advice the GRC provides to the Group Remuneration Committee in connection with executive pay.
The implications of an evolving legal and regulatory framework for financial institutions present an ongoing challenge. The 2014 PRA and EBA stress testing programmes were a particular area of focus for the GRC during the year. The nature and pace of legal and regulatory change in 2014 has also led to increased scrutiny by the GRC of the Group’s risk appetite profile and management actions to mitigate legal and regulatory risks and exposures.
Geopolitical risk has remained an ongoing theme for the GRC, and during the year, the GRC held a joint meeting with the Group Audit Committee to consider key risks in China and the Asia Pacific region. It is expected that geopolitical risk will also be a theme for the GRC throughout 2015.
Heidi Miller joined the GRC in September 2014 and brings with her significant global financial services experience. Heidi has held a range of senior financial services sector appointments, most recently as President of JPMorgan International. Further details are provided in Heidi’s biography on page 267.
Toward the end of 2014 a regulatory driven industry-wide review of IT infrastructure commenced which will continue into 2015.
Joachim Faber Chairman, Group Risk Committee 23 February 2015
Role and membership
The GRC is responsible for:
• advising the Board on high-level risk-related matters and risk governance, including current and forward looking risk exposures, future risk strategy and management of risk within the Group;
• advising the Board on risk appetite and risk tolerance;
• reviewing the effectiveness of the Group’s risk management systems framework and internal control systems (other than internal financial control systems which is the responsibility of the Group Audit Committee);
• monitoring executive control and management of risk including top and emerging risks; and
• advising the Group Remuneration Committee on the alignment of remuneration with risk appetite.
The GRC is comprised of independent non-executive Directors as listed below.
Meetings attended
Meetings
eligibleto attend
Members Joachim Faber (Chairman) 13 13John Coombe1 5 5John Lipsky 13 13Rachel Lomax 13 13Heidi Miller2 4 4
Meetings held in 2014 13
1 Retired as a Director and member on 23 May 2014. 2 Appointed a member on 1 September 2014.
By invitation, John Trueman, a non-executive director of HSBC Bank plc, attended meetings of the GRC throughout 2014. Safra Catz, a non-executive Director of HSBC Holdings plc, attended two presentations given to the GRC on IT-related matters.
Governance of risk
All of HSBC’s activities involve the measurement, evaluation, acceptance and management of risk or combinations of risks. The Board, advised by the GRC, requires and encourages a strong risk governance culture which shapes the Group’s attitude to risk. The Board and the GRC oversee the maintenance and development of a strong risk management framework by continually monitoring the risk environment, top and emerging risks facing the Group and mitigating actions planned and taken.
The governance structure of the Board and its committees for the management of risk is set out in the table on page 24. The GRC has overall non-executive responsibility for oversight of risk across the Group. The Conduct & Values and the Financial System Vulnerabilities committees are responsible for the oversight of specific areas of risk which include the promotion and embedding of HSBC Group Values and HSBC Group principles and the oversight of matters relating to anti-money laundering, sanctions, terrorist financing and proliferation financing. The Conduct & Values and the Financial System Vulnerabilities committees regularly update the GRC on their activities.
Each major Group operating subsidiary has established a board committee with non-executive responsibility for oversight of risk-related matters and an executive committee with responsibility for risk-related matters. The GRC has set core terms of reference for subsidiary company non-executive risk and audit committees.
Further details of the structures in place for the management of risk across the Group are provided on pages 112 to 118.
How the GRC discharged its responsibilities
The GRC discussed top and emerging risks and the Group’s risk profile with management at each of its meetings. In monitoring top and emerging risks the GRC received reports and presentations from the Group Chief

HSBC HOLDINGS PLC
281
Str
ateg
ic R
epo
rt
Fi
nan
cial
Rev
iew
Co
rpo
rate
Go
vern
ance
Fin
anci
al S
tate
men
ts
S
har
eho
lder
Info
rmat
ion
Risk Officer (an executive Director), the Global Head of Financial Crime Compliance and Group Money Laundering Reporting Officer, and the Global Head of Regulatory Compliance. During the year, other members of the senior management attended GRC meetings including the Group Chief Operating Officer, the Global Head of Risk Strategy and Chief of Staff, the Head of Group Performance and Reward and the Group Chief Data Officer.
The Group Chief Risk Officer provided regular reports and presentations to the GRC, including at each meeting a presentation of the ‘risk map’ which describes our risk profile by risk type in the global businesses and regions, the Group Risk Appetite Statement, and the top and emerging risks report which summarised the
mitigating actions for identified risks. The GRC requested reports and updates from management on risk-related issues identified for in-depth consideration and also received regular reports on matters discussed at Risk Management Meetings of the GMB.
Page 118 provides further information on the top and emerging risks for the Group.
Throughout the year, the GRC Chairman met with the Group Chief Risk Officer, the Group Head of Internal Audit, the Group Finance Director, the Chief Legal Officer and other senior executives as required.
In addition to addressing the matters noted above, the GRC focused on a number of key areas including those set out in the table below.
Principal activities and significant issues considered include:
Key area Action taken The Group Risk Appetite Statement and monitoring of the Group risk profile against the Risk Appetite Statement
The GRC reviewed management proposals for revisions to the Group Risk Appetite Statement metrics for 2014. Following review, the Committee recommended a number of refinements to the Group Risk Appetite Statement to the Board including the cost efficiency, Common Equity Tier 1 Capital and sovereign exposure ratios.
The GRC regularly reviews the Group’s risk profile against the key performance metrics set out in the Risk Appetite Statement. The GRC reviewed management’s assessment of risk and provided scrutiny of management’s proposed mitigating actions.
PRA and EBA concurrent stress tests
The GRC monitored the PRA and EBA stress testing exercises and reviewed the results of stress testing prior to submission to the respective regulators. It received reports over the course of the PRA and EBA stress testing exercises and met three times during the year solely to consider stress testing related matters. At these meetings the GRC reviewed the stress test scenarios as set by the PRA and EBA and the enhancements to these scenarios where appropriate. The GRC oversaw a review of the lessons learnt from this stress testing exercise.
Internal Audit assessed progress on the regulatory stress tests programmes and reported its conclusions and recommendations to the GRC.
Execution risk Execution risk is the risk relating to the delivery of the Group strategy and is a standing agenda item for the GRC. Monitoring of this risk and challenging management’s assessment of execution risk and corresponding mitigating actions remain a priority for the GRC.
In addition to the regular reports received and ‘deep-dive reviews’ conducted on specific issues identified, the GRC requested reports from Internal Audit on the themes identified during the course of its work.
Legal and regulatory risks
The legal and regulatory environment continues to evolve in both complexity and the level of requirements placed on financial services sector firms.
The GRC received regular reports on legal and regulatory risks, reviewed management actions to mitigate these risks and considered the potential impact of future developments in this area on the Group. In 2015, these included reports concerning risks related to investigations of HSBC’s Swiss Private Bank by a number of tax administration, regulatory and law enforcement authorities. A particular area of focus for the GRC remains the uncertainty in respect of capital adequacy regulatory requirements; further time has been scheduled for the GRC to address this matter.
IT and data-related risks During the year, the GRC considered a number of IT and data-related risks including internet crime and fraud, data management and aggregation, and information security. The GRC reviewed management’s assessment of these risks and management actions to mitigate them.
IT and data-related risks are expected to remain an area of focus for the GRC during the course of 2015.
Geopolitical risk
The GRC received regular reports on geopolitical risks including the crises in the Middle East and Ukraine and the continued tensions in respect of maritime sovereignty in the South China Sea. Management provided regular updates on the implementation of mitigating actions in response to these matters which included the augmentation of anti-money laundering, sanctions and financial crime compliance controls. The GRC also held a joint meeting with the Group Audit Committee which focused on issues faced in mainland China and the Asia-Pacific region.
Further information on the identification, management and mitigation of the risks set out above is provided on pages 114 to 117.
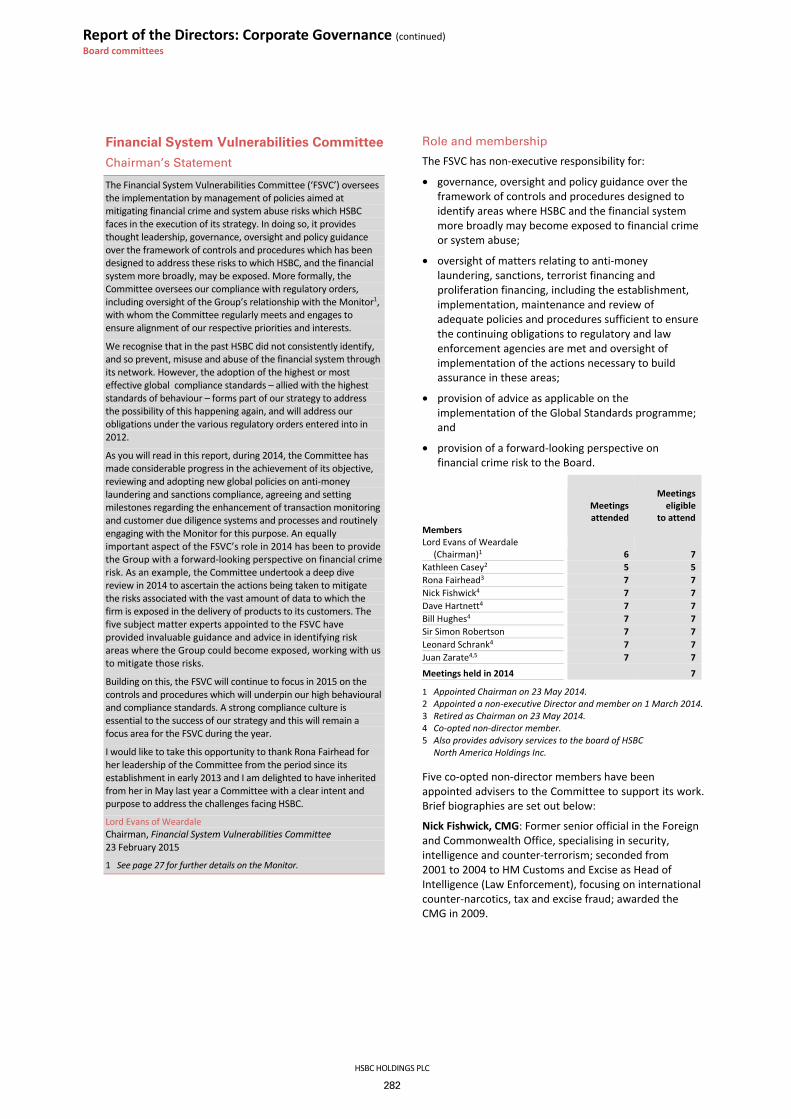
Report of the Directors: Corporate Governance (continued) Board committees
HSBC HOLDINGS PLC
282
Financial System Vulnerabilities Committee
Chairman’s Statement
The Financial System Vulnerabilities Committee (‘FSVC’) oversees the implementation by management of policies aimed at mitigating financial crime and system abuse risks which HSBC faces in the execution of its strategy. In doing so, it provides thought leadership, governance, oversight and policy guidance over the framework of controls and procedures which has been designed to address these risks to which HSBC, and the financial system more broadly, may be exposed. More formally, the Committee oversees our compliance with regulatory orders, including oversight of the Group’s relationship with the Monitor1, with whom the Committee regularly meets and engages to ensure alignment of our respective priorities and interests.
We recognise that in the past HSBC did not consistently identify, and so prevent, misuse and abuse of the financial system through its network. However, the adoption of the highest or most effective global compliance standards – allied with the highest standards of behaviour – forms part of our strategy to address the possibility of this happening again, and will address our obligations under the various regulatory orders entered into in 2012.
As you will read in this report, during 2014, the Committee has made considerable progress in the achievement of its objective, reviewing and adopting new global policies on anti-money laundering and sanctions compliance, agreeing and setting milestones regarding the enhancement of transaction monitoring and customer due diligence systems and processes and routinely engaging with the Monitor for this purpose. An equally important aspect of the FSVC’s role in 2014 has been to provide the Group with a forward-looking perspective on financial crime risk. As an example, the Committee undertook a deep dive review in 2014 to ascertain the actions being taken to mitigate the risks associated with the vast amount of data to which the firm is exposed in the delivery of products to its customers. The five subject matter experts appointed to the FSVC have provided invaluable guidance and advice in identifying risk areas where the Group could become exposed, working with us to mitigate those risks.
Building on this, the FSVC will continue to focus in 2015 on the controls and procedures which will underpin our high behavioural and compliance standards. A strong compliance culture is essential to the success of our strategy and this will remain a focus area for the FSVC during the year.
I would like to take this opportunity to thank Rona Fairhead for her leadership of the Committee from the period since its establishment in early 2013 and I am delighted to have inherited from her in May last year a Committee with a clear intent and purpose to address the challenges facing HSBC.
Lord Evans of Weardale Chairman, Financial System Vulnerabilities Committee 23 February 2015
1 See page 27 for further details on the Monitor.
Role and membership
The FSVC has non-executive responsibility for:
• governance, oversight and policy guidance over the framework of controls and procedures designed to identify areas where HSBC and the financial system more broadly may become exposed to financial crime or system abuse;
• oversight of matters relating to anti-money laundering, sanctions, terrorist financing and proliferation financing, including the establishment, implementation, maintenance and review of adequate policies and procedures sufficient to ensure the continuing obligations to regulatory and law enforcement agencies are met and oversight of implementation of the actions necessary to build assurance in these areas;
• provision of advice as applicable on the implementation of the Global Standards programme; and
• provision of a forward-looking perspective on financial crime risk to the Board.
Meetings attended
Meetingseligible
to attend Members Lord Evans of Weardale
(Chairman)1
6 7 Kathleen Casey2 5 5Rona Fairhead3 7 7Nick Fishwick4 7 7Dave Hartnett4 7 7Bill Hughes4 7 7Sir Simon Robertson 7 7Leonard Schrank4 7 7Juan Zarate4,5 7 7
Meetings held in 2014 7
1 Appointed Chairman on 23 May 2014. 2 Appointed a non-executive Director and member on 1 March 2014. 3 Retired as Chairman on 23 May 2014. 4 Co-opted non-director member. 5 Also provides advisory services to the board of HSBC
North America Holdings Inc.
Five co-opted non-director members have been appointed advisers to the Committee to support its work. Brief biographies are set out below:
Nick Fishwick, CMG: Former senior official in the Foreign and Commonwealth Office, specialising in security, intelligence and counter-terrorism; seconded from 2001 to 2004 to HM Customs and Excise as Head of Intelligence (Law Enforcement), focusing on international counter-narcotics, tax and excise fraud; awarded the CMG in 2009.

HSBC HOLDINGS PLC
283
Str
ateg
ic R
epo
rt
Fi
nan
cial
Rev
iew
Co
rpo
rate
Go
vern
ance
Fin
anci
al S
tate
men
ts
S
har
eho
lder
Info
rmat
ion
Dave Hartnett, CB: Former Permanent Secretary for Tax at HM Revenue and Customs; focused on tax policy development, compliance and enforcement and international tax issues during his 36-year career in tax administration; former deputy chairman of the Organisation for Economic Co-operation and Development’s Forum on Tax Administration.
Bill Hughes, CBE QPM: Former head of the UK’s Serious Organised Crime Agency; international experience in the disruption, dismantling and criminal investigation of organised crime.
Leonard Schrank: Former chief executive officer of SWIFT, the industry-owned, global financial messaging system; oversaw SWIFT’s relationship with the US Treasury Department and other countries on counter-terrorism issues. Member of MIT Corporation.
The Honourable Juan Zarate: Senior Advisor at the Center for Strategic and International Studies; the Senior National Security Analyst for CBS News; a Visiting Lecturer of Law at the Harvard Law School; national security consultant; former Deputy Assistant to the President and Deputy National Security Advisor for Combating Terrorism responsible for developing and implementing the US Government’s counter-terrorism strategy and policies related to transnational security threats; former Assistant Secretary of the Treasury for Terrorist Financing and Financial Crime; and former federal prosecutor who served on terrorism prosecution teams.
How the FSVC discharged its responsibilities
The FSVC has agreed areas of focus where HSBC and the financial system more broadly may become exposed to financial crime or system abuse, with the GRC retaining responsibility for high-level risk related matters and risk governance. Particular areas of focus for FSVC included: cyber security; technology and data systems; transaction
monitoring systems for anti-money laundering; sanctions and other financial crime related risks; and customer due diligence and know your customer procedures. Regular reports and updates on these focus areas were provided to the FSVC by the adviser members and relevant executives.
The FSVC also maintained oversight of obligations under the US and UK agreements and updates on HSBC’s interactions with the Monitor.
The Chief Legal Officer, Group Chief Risk Officer, Global Head of Financial Crime Compliance, the Group Money Laundering Reporting Officer, Global Head of Regulatory Compliance and the Group Head of Internal Audit provided reports to the FSVC including on meetings held with, and reports submitted to, regulators on the Group’s compliance-related initiatives made both in connection with the resolution of the investigations by US and UK regulatory and law enforcement authorities in December 2012 and also more generally. In addition to the scheduled Committee meetings, the Chairman met regularly with the Group Chairman, the adviser members of the Committee and senior executives as required.
During the year, the FSVC received regular updates on the Compliance Plan, which documents the Group’s strategy to augment HSBC’s anti-money laundering and sanctions compliance programme, which covers the related policies, procedures and enhanced training. Regular reports are also submitted to the FSVC on Group-wide whistleblowing disclosures and anti-bribery and corruption matters.
In addition to its reports to the Board, the FSVC also regularly updates the Group Risk Committee on specified matters to raise areas for its consideration as appropriate.
During the year, the FSVC focused on a number of key areas, as set out in the table below.
Principal activities and significant issues considered include:
Key area Action taken Financial crime-related issues The FSVC reviewed and adopted a Group policy on anti-money laundering which is now being
implemented across all of HSBC’s businesses. It received regular updates on the implementation of the IT strategy agreed as part of the work to manage and mitigate financial crime risks. A particular area of focus was on enhancements proposed by management in respect of the Group’s transaction monitoring systems.
Sanctions The FSVC reviewed and adopted a Group policy on sanctions compliance which is now being implemented, whilst the Group’s ongoing sanctions compliance programmes and management’s strategy to respond to the expansion of global sanctions were also routinely monitored by the Committee during the year.
Cyber security During 2014, the FSVC reviewed cyber-security risks and strategy in this area and proposed enhancements to the Group’s cyber security capabilities. The reviews included briefings on the Group’s ability to predict, respond and recover from cyber-attacks. Metrics and timelines were agreed with management to monitor progress in this area.
FATCA and tax transparency The FSVC received updates to tax transparency initiatives undertaken by HSBC and the Group-wideimplementation of the requirements under the Foreign Account Tax Compliance Act.

Report of the Directors: Corporate Governance (continued) Board committees
HSBC HOLDINGS PLC
284
Group Remuneration Committee
The Group Remuneration Committee is responsible for approving remuneration policy. As part of its role, it considers the terms of fixed pay, annual incentive plans, share plans, other long-term incentive plans, benefits and the individual remuneration packages of executive Directors and other senior Group employees and in doing so takes into account the pay and conditions across the Group. No Directors are involved in deciding their own remuneration.
Meetings attended
Meetings eligible to attend
Members1 Sir Simon Robertson (Chairman) 11 11John Coombe 2 6 6Renato Fassbind3 7 7John Lipsky4 5 5Sam Laidlaw 10 11Jonathan Symonds5 2 3Meetings held in 2014 11
1 All members are independent non-executive Directors. 2 Retired as a Director and member on 23 May 2014. 3 Resigned as a Director and member on 1 September 2014. 4 Appointed a member on 23 May 2014. 5 A member from 14 April 2014 until 1 September 2014.
The Directors’ Remuneration Report is set out on pages 300 to 327.
Nomination Committee
Chairman’s Statement
A key responsibility of the Nomination Committee (‘Nomco’) is to ensure there is an appropriate balance of skills, knowledge, experience, diversity and independence on the Board. Following Nomco’s recommendation, the Board appointed in 2014 four independent non-executive Directors, namely, Phillip Ameen, Kathleen Casey, Heidi Miller and Jonathan Symonds. They have brought different expertise and experience to the Board. HSBC now surpasses the target set under the Board’s own diversity policy, which states that 30% of the Board members should be female by 2020.
Another important responsibility of Nomco is to ensure that plans are in place for the selection, appointment and orderly succession of executive Directors and senior executives. Nomco met once last year to undertake with the Group Chief Executive an in-depth review of succession plans and concluded that they are sufficient and appropriate but need to be kept under annual review.
Nomco continues to monitor regulatory developments as they may require changes to the composition of the Board. Nomco has considered in detail the new requirements under the EU’s Capital Requirements Directive IV which came into effect on 1 July 2014 and which restrict the number of directorships that may be held by member of the Board. The ramifications of these new requirements for the current Board have been reviewed and the requirements are routinely kept under review.
Sir Simon Robertson Chairman, Nomination Committee 23 February 2015
Role and membership
Nomco has non-executive responsibility for leading the process for Board appointments and for identifying and nominating, for approval by the Board, candidates for appointment to the Board. Nomco is responsible for succession planning of Directors to the Board. In the course of this, it also oversees senior management succession planning.
Meetings attended
Meetingseligible
to attend Members1 Sir Simon Robertson (Chairman) 4 4Laura Cha2 2 2Rona Fairhead 4 4James Hughes-Hallett3 2 2Sam Laidlaw2 2 2John Lipsky 4 4
Meetings held in 2014 4
1 All members are independent non-executive Directors. 2 Appointed a member on 23 May 2014. 3 Retired as a Director and member on 23 May 2014.

HSBC HOLDINGS PLC
285
Str
ateg
ic R
epo
rt
Fi
nan
cial
Rev
iew
Co
rpo
rate
Go
vern
ance
Fin
anci
al S
tate
men
ts
S
har
eho
lder
Info
rmat
ion
How Nomco discharged its responsibilities
Nomco undertook the following key activities in the discharge of its responsibilities:
Principal activities and significant issues considered include:
Key area Action taken
Appointments of new Directors Following a rigorous selection process, Nomco recommended to the Board the appointment of four non-executive Directors during 2014: Phillip Ameen (with effect from 1 January 2015), Kathleen Casey, Heidi Miller and Jonathan Symonds; and an executive Director: Marc Moses, Group Chief Risk Officer. An external search consultancy, MWM Consulting, was used in relation to the appointment of three of the four non-executive Directors (Kathleen Casey, Heidi Miller and Jonathan Symonds). MWM Consulting has no additional connection with HSBC other than as search consultant for certain senior executive hires. Phillip Ameen was identified by the Committee through his existing role as an independent Director of HSBC North America Holdings Inc. since 2012 (where he chairs the Audit Committee and serves on the Risk Committee). He also brings extensive financial and accounting experience gained from a long career at General Electric (ultimately as Vice President, Comptroller and Principal Accounting Officer of General Electric Corp.), as well as a depth of technical knowledge from his participation in the accounting standard setting world.
Forward planning Nomco adopts a forward-looking approach to potential candidates for appointment to the Board that takes into account the needs and development of the Group’s businesses and the expected retirement dates of current Directors.
Size, structure and composition of the Board and it committees
Nomco monitors the size, structure and composition of the Board (including skills, knowledge, experience, diversity and independence). Nomco considered the election or re-election of Directors at the 2014 Annual General Meeting. It has also recommended to the Board that all Directors should stand for election or re-election at the 2015 Annual General Meeting.
Regulatory developments Nomco monitors regulatory developments as they may affect Board composition. During 2014, Nomco considered the implications of the corporate governance requirements of the EU’s Capital Requirements Directive IV and the Equality and Human Rights Commission’s guidance on the equality law framework.
Diversity Nomco believes that one of its important duties is to ensure that there is a proper balance on the Board to reflect diversity and the geographical nature of its business. Appointments to the Board are made on merit and candidates are considered against objective criteria, having due regard to the benefits of diversity on the Board. The Board diversity policy is available at www.hsbc.com/investor-relations/governance/corporate-governance-codes. Nomco regularly monitors the implementation of the Board’s diversity policy using the following measurable objectives: at least 25% of the Board should be female, with a target of 30% to be achieved by 2020; only external search consultants who are signatories to the Executive Search Firms Voluntary Code of Conduct should be engaged by Nomco; and at least 30% of candidates, proposed by search firms for consideration as non-executive Directors, should be women. We comply with these requirements and, as at the date of this report, 35.3% of the Board is female.
Director training and development
Nomco reviews and monitors the training and continuous professional development of Directors and senior management.
Time commitment and independence of non-executive Directors
Nomco assessed the independence of, and time required from, non-executive Directors. Nomco is satisfied that all non-executive Directors have the time to fulfil their fiduciary responsibilities to provide oversight of the business of the Group; and to serve on the relevant Committees of the Board. All Directors are asked to identify any other significant commitments they may have and confirm they have sufficient time to discharge what is expected of them as members of the Board.
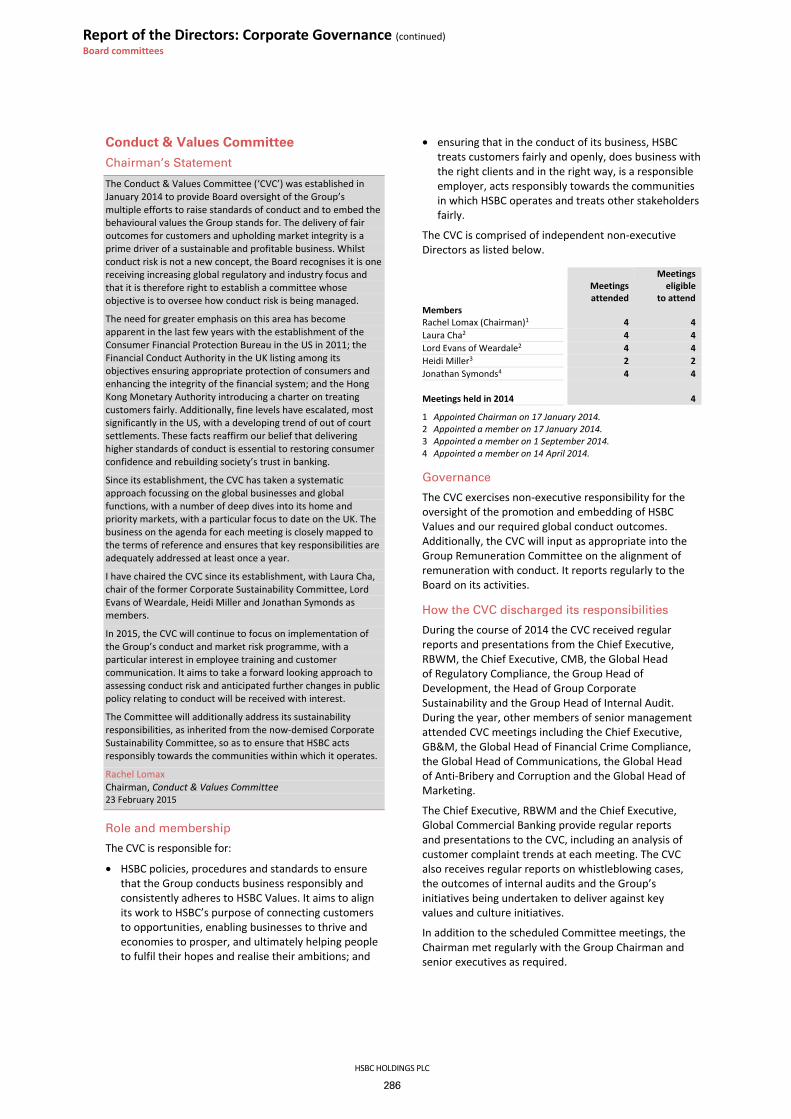
Report of the Directors: Corporate Governance (continued) Board committees
HSBC HOLDINGS PLC
286
Conduct & Values Committee Chairman’s Statement
The Conduct & Values Committee (‘CVC’) was established in January 2014 to provide Board oversight of the Group’s multiple efforts to raise standards of conduct and to embed the behavioural values the Group stands for. The delivery of fair outcomes for customers and upholding market integrity is a prime driver of a sustainable and profitable business. Whilst conduct risk is not a new concept, the Board recognises it is one receiving increasing global regulatory and industry focus and that it is therefore right to establish a committee whose objective is to oversee how conduct risk is being managed.
The need for greater emphasis on this area has become apparent in the last few years with the establishment of the Consumer Financial Protection Bureau in the US in 2011; the Financial Conduct Authority in the UK listing among its objectives ensuring appropriate protection of consumers and enhancing the integrity of the financial system; and the Hong Kong Monetary Authority introducing a charter on treating customers fairly. Additionally, fine levels have escalated, most significantly in the US, with a developing trend of out of court settlements. These facts reaffirm our belief that delivering higher standards of conduct is essential to restoring consumer confidence and rebuilding society’s trust in banking.
Since its establishment, the CVC has taken a systematic approach focussing on the global businesses and global functions, with a number of deep dives into its home and priority markets, with a particular focus to date on the UK. The business on the agenda for each meeting is closely mapped to the terms of reference and ensures that key responsibilities are adequately addressed at least once a year.
I have chaired the CVC since its establishment, with Laura Cha, chair of the former Corporate Sustainability Committee, Lord Evans of Weardale, Heidi Miller and Jonathan Symonds as members.
In 2015, the CVC will continue to focus on implementation of the Group’s conduct and market risk programme, with a particular interest in employee training and customer communication. It aims to take a forward looking approach to assessing conduct risk and anticipated further changes in public policy relating to conduct will be received with interest.
The Committee will additionally address its sustainability responsibilities, as inherited from the now-demised Corporate Sustainability Committee, so as to ensure that HSBC acts responsibly towards the communities within which it operates.
Rachel Lomax Chairman, Conduct & Values Committee 23 February 2015
Role and membership
The CVC is responsible for:
• HSBC policies, procedures and standards to ensure that the Group conducts business responsibly and consistently adheres to HSBC Values. It aims to align its work to HSBC’s purpose of connecting customers to opportunities, enabling businesses to thrive and economies to prosper, and ultimately helping people to fulfil their hopes and realise their ambitions; and
• ensuring that in the conduct of its business, HSBC treats customers fairly and openly, does business with the right clients and in the right way, is a responsible employer, acts responsibly towards the communities in which HSBC operates and treats other stakeholders fairly.
The CVC is comprised of independent non-executive Directors as listed below.
Meetings attended
Meetingseligible
to attend Members Rachel Lomax (Chairman)1 4 4Laura Cha2 4 4Lord Evans of Weardale2 4 4Heidi Miller3 2 2Jonathan Symonds4 4 4
Meetings held in 2014 4
1 Appointed Chairman on 17 January 2014. 2 Appointed a member on 17 January 2014. 3 Appointed a member on 1 September 2014. 4 Appointed a member on 14 April 2014.
Governance
The CVC exercises non-executive responsibility for the oversight of the promotion and embedding of HSBC Values and our required global conduct outcomes. Additionally, the CVC will input as appropriate into the Group Remuneration Committee on the alignment of remuneration with conduct. It reports regularly to the Board on its activities.
How the CVC discharged its responsibilities
During the course of 2014 the CVC received regular reports and presentations from the Chief Executive, RBWM, the Chief Executive, CMB, the Global Head of Regulatory Compliance, the Group Head of Development, the Head of Group Corporate Sustainability and the Group Head of Internal Audit. During the year, other members of senior management attended CVC meetings including the Chief Executive, GB&M, the Global Head of Financial Crime Compliance, the Global Head of Communications, the Global Head of Anti-Bribery and Corruption and the Global Head of Marketing.
The Chief Executive, RBWM and the Chief Executive, Global Commercial Banking provide regular reports and presentations to the CVC, including an analysis of customer complaint trends at each meeting. The CVC also receives regular reports on whistleblowing cases, the outcomes of internal audits and the Group’s initiatives being undertaken to deliver against key values and culture initiatives.
In addition to the scheduled Committee meetings, the Chairman met regularly with the Group Chairman and senior executives as required.

HSBC HOLDINGS PLC
287
Str
ateg
ic R
epo
rt
Fi
nan
cial
Rev
iew
Co
rpo
rate
Go
vern
ance
Fin
anci
al S
tate
men
ts
S
har
eho
lder
Info
rmat
ion
The Committee is additionally responsible for advising the Board, its committees and executive management on corporate sustainability policies across the Group including environmental, social and ethical issues. From this year, our progress on sustainability policies and performance is reported in the Strategic Report and on our website at hsbc.com/sustainability.
We will no longer publish a separate Sustainability Report as part of a progression towards an integrated approach to sustainability reporting. This change reflects best practice in reporting as well as the ongoing integration of sustainability matters into the strategy and management of HSBC.
During the year the CVC focused on a number of key areas, as set out in the table below.
Principal activities and significant issues considered include:
Key area Action taken Global approach to conduct The CVC endorsed a global approach to the management of conduct which defines and sets out required
outcomes. It received regular reports from the Global Head of Regulatory Compliance on how conduct is being managed consistently across the Group to deliver the required outcomes. It also sets out the programmes and governance to deliver conduct improvements. In developing this approach, Management has given consideration to strategy, business models and decision making, culture and behaviours, interactions with customers, the impact of activities in financial markets and governance structures, oversight frameworks and management information. There is close alignment between this and the work being done to promote and embed HSBC Values.
Values The CVC oversees the promotion and embedding of HSBC Values. In 2013, the Group launched a project to better understand how HSBC Values drive everyday behaviours. This included interviews with leadership teams and functional specialists, focus groups with line managers and staff, and reviews of management information and local documentation. The CVC received regular reports from management on this project and contributed to the subsequent action plan. It will continue to monitor the implementation of cultural change into 2015.
Customer experience Customer complaints. The CVC reviewed reports regarding customer experience, complaint trends and complaint handling. It considered improvements to the quality of complaint handling processes and root cause analysis. Sales processes and incentive schemes. The CVC considered the review mechanism established by RBWM management, the aim of which is to ensure that the RBWM product range is appropriately positioned to fulfil customers’ needs. The CVC also reviewed the changes implemented to sales processes and sales incentive schemes in the RBWM and CMB businesses and the effectiveness of new quality assurance programmes. This will continue into 2015.
Whistleblowing
The CVC has assumed responsibility for the governance of the Group’s whistleblowing policies and procedures, including the protection of whistleblowers. This responsibility does not extend to matters relating to financial reporting and associated auditing matters, which remain the responsibility of the Group Audit Committee. The CVC reviewed current whistleblowing processes and disclosures and received reports on an ongoing enhancement programme which takes account of recommendations made by the UK Parliamentary Commission on Banking Standards, regulatory guidance and emerging industry best practices.
Employee engagement
The CVC monitored employee engagement across the Group and received the results of quarterly Snapshot engagement surveys which were conducted during 2014. It will continue to monitor these survey results in 2015, as well as the results of a Group People Survey planned to take place later in the year.

Report of the Directors: Corporate Governance (continued) Internal control
HSBC HOLDINGS PLC
288
Chairman’s Committee
Role and membership
The Chairman’s Committee has the power to act on behalf of the Board between scheduled Board meetings to facilitate ad hoc unforeseen business requiring urgent Board approval. The Committee meets with such frequency and at such times as it may determine, the quorum for meetings is dependent upon the nature of the business to be transacted, as set out in its terms of reference.
Philanthropic and Community Investment Oversight Committee
Role and membership
The Philanthropic and Community Investment Oversight Committee, established by resolution of the Board in December 2014, will focus on the Group’s philanthropic activity, being monetary donations made to charitable organisations and the contribution of staff time toward voluntary activities.
The Committee has non-executive responsibility for the oversight of HSBC’s philanthropic and community investment activities in support of the Group’s corporate sustainability objectives.
The Committee will meet for the first time in 2015 and will meet at least twice each year. Members Laura Cha1 (Chairman) Lord Evans of Weardale1 Sir Malcolm Grant2,4 Ruth Kelly3,4 Stephen Moss3,4
1 Appointed on 5 December 2014. 2 Independent member. 3 Employee member. 4 Appointed on 19 February 2015.
Internal control Procedures
The Directors are responsible for maintaining and reviewing the effectiveness of risk management and internal control systems and for determining the nature and extent of the significant risks it is willing to take in achieving its strategic objectives. To meet this requirement and to discharge its obligations under the FCA Handbook and PRA Handbook, procedures have been designed for safeguarding assets against unauthorised use or disposal; for maintaining proper accounting records; and for ensuring the reliability and usefulness of financial information used within the business or for publication. These procedures can only provide reasonable but not absolute assurance against material mis-statement, errors, losses or fraud.
These procedures are designed to provide effective internal control within HSBC and accord with the Financial Reporting Council’s guidance for directors issued in its revised form in 2005. HSBC’s procedures have been in place throughout the year and up to 23 February 2015, the date of approval of the Annual Report and Accounts 2014. This guidance was amended following consultations undertaken by the Financial Reporting Council in November 2013 and April 2014, resulting in revised guidance on risk management, internal control and related financial and business reporting. The revised guidance applies to companies with financial years beginning on or after 1 October 2014.
In the case of companies acquired during the year, the risk management and internal controls in place are being reviewed against HSBC’s benchmarks and integrated into HSBC’s processes.
In 2014 the GAC and GRC endorsed the adoption of the COSO 2013 framework for the monitoring of risk management and internal control systems to satisfy the requirements of Section 404 of the Sarbanes-Oxley Act of 2002, the UK Corporate Governance Code and the Hong Kong Corporate Governance Code. Full implementation of the COSO 2013 framework will be completed in 2015. HSBC continued to evaluate its internal control over financial reporting under the Financial Reporting Council’s Internal Control Revised Guidance for Directors and the original 1992 Framework for the year ended 31 December 2014.
HSBC’s key risk management and internal control procedures include the following:
• Group Standards. Functional, operating, financial reporting and certain management reporting standards are established by global function management committees, for application throughout HSBC. These are supplemented by operating standards set by functional and local management as required for the type of business and geographical location of each subsidiary.
• Delegation of authority within limits set by the Board. Authority is delegated within limits set by

HSBC HOLDINGS PLC
289
Str
ateg
ic R
epo
rt
Fi
nan
cial
Rev
iew
Co
rpo
rate
Go
vern
ance
Fin
anci
al S
tate
men
ts
S
har
eho
lder
Info
rmat
ion
the Board to each relevant Group Managing Director to manage the day to day affairs of the business or function for which he or she is accountable. Delegation of authority from the Board requires those individuals to maintain a clear and appropriate apportionment of significant responsibilities and to oversee the establishment and maintenance of systems of control that are appropriate to their business or function. Appointments to the most senior positions within HSBC requires the approval of the Board.
• Risk identification and monitoring. Systems and procedures are in place to identify, control and report on the major risks facing HSBC (see page 21) including credit, market, liquidity and funding, capital, financial management, model, reputational, pension, strategic, sustainability, operational (including accounting, tax, legal, regulatory compliance, financial crime compliance, fiduciary, security and fraud, systems operations, project and people risk) and insurance risk. Exposure to these risks is monitored by risk management committees, asset, liability and capital management committees and executive committees in subsidiaries and, for the Group, in Risk Management Meetings (‘RMM’) of the GMB which are chaired by the Group Chief Risk Officer. RMM meets regularly to discuss enterprise-wide risk management issues. Asset, liability and capital management issues are monitored by the Group ALCO, which also reports to the RMM. HSBC’s operational risk profile and the effective implementation of the Group’s operational risk management framework is monitored by the Global Operational Risk Committee (‘GORC’), which reports to the RMM. Model risks are monitored by the Model Oversight Committee which also reports to the RMM. The minutes of the GMB meetings and the RMM are provided to members of the GAC, the GRC and the Board.
• Changes in market conditions/practices. Processes are in place to identify new risks arising from changes in market conditions/practices or customer behaviours, which could expose HSBC to heightened risk of loss or reputational damage. During 2014, attention was focused on:
− economic outlook and government intervention;
− increased geopolitical risk;
− regulatory developments affecting our business model and Group profitability;
− regulatory investigations, fines, sanctions commitments and consent orders and requirements relating to conduct of business and financial crime negatively affecting our results and brand;
− dispute risk;
− heightened execution risk;
− people risk;
− third party risk management;
− internet crime and fraud;
− information security risk;
− data management; and
− model risk.
• Strategic plans. Periodic strategic plans are prepared for global businesses, global functions and certain geographical regions within the framework of the Group’s strategy. Annual Operating Plans, informed by detailed analysis of risk appetite describing the types and quantum of risk that we are prepared to take in executing our strategy, are prepared and adopted by all major HSBC operating companies and set out the key business initiatives and the likely financial effects of those initiatives.
• Disclosure Committee. The Disclosure Committee reviews material public disclosures made by HSBC Holdings for any material errors, misstatements or omissions. The membership of the Disclosure Committee, which is chaired by the Group Company Secretary, includes the heads of Global Finance, Legal, Risk (including Financial Crime Compliance and Regulatory Compliance), Communications, Investor Relations, and Internal Audit functions and representatives from the principal regions and global businesses. The integrity of disclosures is underpinned by structures and processes within the Global Finance and Global Risk functions that support expert and rigorous analytical review of financial reporting complemented by certified reviews by heads of global businesses, global functions and certain legal entities.
• Financial reporting. The Group financial reporting process for preparing the consolidated Annual Report and Accounts 2014 is controlled using documented accounting policies and reporting formats, supported by a chart of accounts with detailed instructions and guidance on reporting requirements, issued by Group Finance to all reporting entities within the Group in advance of each reporting period end. The submission of financial information from each reporting entity to Group Finance is subject to certification by the responsible financial officer, and analytical review procedures at reporting entity and Group levels.
• Responsibility for risk management. Management of global businesses and global functions are primarily accountable for measuring, monitoring, mitigating and managing their risks and controls. Processes are in place to ensure weaknesses are escalated to senior management and addressed, supported by our three lines of defence model.
• IT operations. Centralised functional control is exercised over all IT developments and operations. Common systems are employed for similar business processes wherever practicable.
• Functional management. Global functional management is responsible for setting policies, procedures and standards for the following risks: credit, market, liquidity and funding, capital, financial

Report of the Directors: Corporate Governance (continued) Internal control / Going concern / Employees
HSBC HOLDINGS PLC
290
management, model, reputational, pension, strategic, sustainability and operational risk (including accounting, tax, legal, financial crime compliance, regulatory compliance, fiduciary, information security, security and fraud, systems and people risk) and insurance risk. Authorities to enter into credit and market risk exposures are delegated with limits to line management of Group companies. The concurrence of the appropriate global function is required, however, to credit proposals with specified higher risk characteristics. Credit and market risks are measured and reported at subsidiary company level and aggregated for risk concentration analysis on a Group-wide basis.
• Internal Audit. The establishment and maintenance of appropriate systems of risk management and internal control is primarily the responsibility of business management. The Global Internal Audit function, which is centrally controlled, provides independent and objective assurance in respect of the adequacy of the design and operating effectiveness of the Group’s framework of risk management, control and governance processes across the Group, focusing on the areas of greatest risk to HSBC using a risk-based approach. The Group Head of Internal Audit reports to the Chairman of the GAC and administratively to the Group Chief Executive.
• Internal Audit recommendations. Executive management is responsible for ensuring that recommendations made by the Global Internal Audit function are implemented within an appropriate and agreed timetable. Confirmation to this effect must be provided to Global Internal Audit.
• Reputational risk. Policies to guide subsidiary companies and management at all levels in the conduct of business to safeguard the Group’s reputation are established by the Board and its committees, subsidiary company boards and their committees and senior management. Reputational risks can arise from a variety of causes including environmental, social and governance issues, as a consequence of operational risk events and as a result of employees acting in a manner inconsistent with HSBC Values. HSBC’s reputation depends upon the way in which it conducts its business and may be affected by the way in which clients, to which it provides financial services, conduct their business or use financial products and services.
Role of GAC and GRC
On behalf of the Board, the GAC has responsibility for oversight of risk management and internal controls over financial reporting and the GRC has responsibility for oversight of risk management and internal controls, other than over financial reporting.
During the year, the GRC and the GAC have kept under review the effectiveness of this system of internal control and have reported regularly to the Board. In carrying out their reviews, the GRC and the GAC receive regular business and operational risk assessments, regular
reports from the Group Chief Risk Officer and the Group Head of Internal Audit; reports on the annual reviews of the internal control framework of HSBC Holdings which cover all internal controls, both financial and non-financial; half yearly-confirmations to the GAC from audit and risk committees of principal subsidiary companies regarding whether their financial statements have been prepared in accordance with Group policies, present fairly the state of affairs of the relevant principal subsidiary, are prepared on a going concern basis; and confirm if there have been any material losses, contingencies or uncertainties caused by weaknesses in internal controls; internal audit reports; external audit reports; prudential reviews; and regulatory reports. The GRC monitors the status of top and emerging risks and considers whether the mitigating actions put in place are appropriate. In addition, when unexpected losses have arisen or when incidents have occurred which indicate gaps in the control framework or in adherence to Group policies, the GRC and the GAC review special reports, prepared at the instigation of management, which analyse the cause of the issue, the lessons learned and the actions proposed by management to address the issue.
Effectiveness of internal controls
The Directors, through the GRC and the GAC, have conducted an annual review of the effectiveness of our system of risk management and internal control covering all material controls, including financial, operational and compliance controls, risk management systems, the adequacy of resources, qualifications and experience of staff of the accounting and financial reporting function and the risk function, and their training programmes and budget. The review does not extend to joint ventures or associates. The annual review of the effectiveness of our system of risk management and internal control was conducted with reference to COSO principles functioning as evidenced by specified entity level controls. A report on the effectiveness of each entity level control and regular risk and control reporting was escalated to the GRC and GAC from certain key management committees.
The GRC and the GAC have received confirmation that executive management has taken or is taking the necessary actions to remedy any failings or weaknesses identified through the operation of our framework of controls.
Going concern The financial statements are prepared on a going concern basis, as the Directors are satisfied that the Group and parent company have the resources to continue in business for the foreseeable future.
In making this assessment, the Directors have considered a wide range of information relating to present and future conditions, including future projections of profitability, cash flows and capital resources.
HSBC’s principal activities, business and operating models, strategic direction and top and emerging risks are described in the ‘Strategic Report’; a financial

HSBC HOLDINGS PLC
291
Str
ateg
ic R
epo
rt
Fi
nan
cial
Rev
iew
Co
rpo
rate
Go
vern
ance
Fin
anci
al S
tate
men
ts
S
har
eho
lder
Info
rmat
ion
summary, including a review of the consolidated income statement and consolidated balance sheet, is provided in the ‘Financial Review’ section; HSBC’s objectives, policies and processes for managing credit, liquidity and market risk are described in the ‘Risk’ section; and HSBC’s approach to capital management and allocation is described in the ‘Capital’ section.
Employees At 31 December 2014 we had a total workforce of 266,000 full-time and part-time employees compared with 263,000 at the end of 2013 and 270,000 at the end of 2012. Our main centres of employment are the UK with approximately 48,000 employees, India 32,000, Hong Kong 30,000, Brazil 21,000, mainland China 21,000, Mexico 17,000, the US 15,000 and France 9,000.
In the context of the current global financial services operating environment, a high performance and values-led work force is critical. We encourage open and honest communication in decision making. Employment issues and financial, economic, regulatory and competitive factors affecting HSBC’s performance are regularly shared with our employees.
Reward
Our approach to reward is meritocratic and market competitive, underpinned by an ethical and values based performance culture which aligns the interests of our employees, shareholders, regulators and customers.
Employee relations
We negotiate and consult with recognised unions as appropriate. The five highest concentrations of union membership are in Argentina, Brazil, mainland China, Malta and Mexico. It is our policy to maintain well-developed communications and consultation programmes with all employee representative bodies and there have been no material disruptions to our operations from labour disputes during the past five years.
Diversity and inclusion
HSBC is committed to building a values-driven high performance culture where all employees are valued, respected and where their opinions count. We remain committed to meritocracy, which requires a diverse and inclusive culture where employees believe that their views are heard, their concerns are attended to and they work in an environment where bias, discrimination and harassment on any matter, including gender, age, ethnicity, religion, sexuality and disability are not tolerated and where advancement is based on objective criteria. Our inclusive culture helps us respond to our diverse customer base, while developing and retaining a secure supply of skilled, committed employees. Our culture will be strengthened by employing the best people and optimising their ideas, abilities and differences.
Oversight of our diversity and inclusion agenda and related activities resides with executives on the Group Diversity Committee, complemented by the Group People Committee and local People/Diversity Committees.
Employee development
The development of employees in both developed and emerging markets is essential to the future strength of our business. We have implemented a systematic approach to identifying, developing and deploying talented employees to ensure an appropriate supply of high calibre individuals with the values, skills and experience for current and future senior management positions.
In 2014, we continued to build global consistency across our learning curricula and to improve the relevance and quality of learning programmes. We have endeavoured to achieve a standard of excellence focusing on leadership, values and technical capability.
Employment of disabled persons
We believe in providing equal opportunities for all employees. The employment of disabled persons is included in this commitment and the recruitment, training, career development and promotion of disabled persons is based on the aptitudes and abilities of the individual. Should employees become disabled during their employment with us, efforts are made to continue their employment and, if necessary, appropriate training and reasonable equipment and facilities are provided.
Health and safety
HSBC is committed to providing a safe and healthy environment for our employees, customers and visitors and pro-actively managing the health and safety risks associated with our business. Our objectives include compliance with health and safety laws in the countries in which we operate, identifying, removing, reducing or controlling material health and safety risks, reducing the likelihood of fires, dangerous occurrences and accidents to employees, customers and visitors.
The Corporate Real Estate department within HSBC has overall responsibility for health and safety and has set global health and safety policies and standards for use wherever in the world HSBC operates. Achieving these policies and standards is the responsibility of the country Chief Operating Officer.
In terms of physical and geopolitical risk, Global Security and Fraud Risk provide regular security risk assessments to assist management in judging the level of terrorist and violent criminal threat. Regional Security and Fraud Risk functions conduct biannual security reviews of all Group critical buildings to ensure measures to protect our staff, buildings, assets and information are appropriate to the level of threat.
HSBC remains committed to the effective management of health and safety and protecting employees, customers and visitors to HSBC.

Report of the Directors: Corporate Governance (continued) Employees / Other disclosures / Annual General Meeting
HSBC HOLDINGS PLC
292
Employee health and safety 2014 2013 2012Number of employee workplace
fatalities 21 – – Accidents involving more than
3 days’ absence per 100,000 employees 96 101 58
All accident rate per 100,000 employees 3882 355 375
1 Non-HSBC staff working on HSBC related activity. 2 Reflects higher reporting rate.
Remuneration policy
The quality and commitment of our employees is fundamental to our success and accordingly the Board aims to attract, retain and motivate the very best people. As trust and relationships are vital in our business our goal is to recruit those who are committed to making a long-term career with the organisation.
HSBC’s reward strategy supports this objective through balancing both short-term and sustainable performance. Our reward strategy aims to reward success, not failure, and be properly aligned with our risk framework and related outcomes. In order to ensure alignment between remuneration and our business strategy, individual remuneration is determined through assessment of performance delivered against both annual and long-term objectives summarised in performance scorecards as well as adherence to the HSBC Values of being ‘open, connected and dependable’ and acting with ‘courageous integrity’. Altogether, performance is judged, not only on what is achieved over the short and long term, but also on how it is achieved, as the latter contributes to the sustainability of the organisation.
The financial and non-financial measures incorporated in the annual and long-term scorecards are carefully considered to ensure alignment with the long-term strategy of the Group. Further information on the Group’s approach to remuneration is given on page 300.
Employee share plans
Share options and discretionary awards of shares granted under HSBC share plans align the interests of employees with those of shareholders. The tables on the following pages set out the particulars of outstanding options, including those held by employees working
under employment contracts that are regarded as ‘continuous contracts’ for the purposes of the Hong Kong Employment Ordinance. The options were granted at nil consideration. No options have been granted to substantial shareholders, suppliers of goods or services, or in excess of the individual limit for each share plan. No options were cancelled by HSBC during the year.
A summary for each plan of the total number of the options which were granted, exercised or lapsed during 2014 is shown in the following tables. Further details required to be disclosed pursuant to Chapter 17 of the Rules Governing the Listing of Securities on The Stock Exchange of Hong Kong Limited are available on our website at www.hsbc.com/investor-relations/governance/ share-plans and on the website of The Stock Exchange of Hong Kong Limited at www.hkex.com.hk or can be obtained upon request from the Group Company Secretary, 8 Canada Square, London E14 5HQ. Particulars of options held by Directors of HSBC Holdings are set out on page 321. Note 6 on the Financial Statements gives details on share-based payments, including discretionary awards of shares granted under HSBC share plans.
All-employee share plans
All-employee share option plans have operated within the Group and eligible employees have been granted options to acquire HSBC Holdings ordinary shares. Options under the plans are usually exercisable after three or five years. The exercise of options may be advanced to an earlier date in certain circumstances, for example on retirement, and may be extended in certain circumstances, for example on the death of a participant, the executors of the participant’s estate may exercise options up to six months beyond the normal exercise period. The middle market closing price for HSBC Holdings ordinary shares quoted on the London Stock Exchange, as derived from the Daily Official List on 22 September 2014, the day before options were granted in 2014, was £6.58. There will be no further grants under the HSBC Holdings Savings-Related Share Option Plan: International. A new international all-employee share purchase plan was launched in the third quarter of 2013. The all-employee share option plans will terminate on 27 May 2015 unless the Directors resolve to terminate the plans at an earlier date.

HSBC HOLDINGS PLC
293
Str
ateg
ic R
epo
rt
Fi
nan
cial
Rev
iew
Co
rpo
rate
Go
vern
ance
Fin
anci
al S
tate
men
ts
S
har
eho
lder
Info
rmat
ion
HSBC Holdings All-employee Share Option Plans HSBC Holdings ordinary shares
Dates of awards Exercise price Exercisable At Granted Exercised1 Lapsed At from to from to from to 1 Jan 2014 during year during year during year 31 Dec 2014
Savings-Related Share Option Plan 30 Apr
2008 23 Sep
2014 (£)
3.3116(£)
5.9397 1 Aug 2013
1 May 2020 53,950,886 28,688,703 25,097,425 3,798,209 53,743,955
Savings-Related Share Option Plan: International 30 Apr
2008 24 Apr
2012 (£)
3.3116(£)
5.9397 1 Aug 2013
1 Feb 2018 10,022,450 – 5,625,183 683,208 3,714,059
30 Apr 2008
24 Apr 2012
(US$)4.8876
(US$) 11.8824
1 Aug 2013
1 Feb 2018 3,997,069 – 1,528,838 600,903 1,867,328
30 Apr 2008
24 Apr 2012
(€)3.6361
(€) 7.5571
1 Aug 2013
1 Feb 2018 1,574,652 – 935,177 67,973 571,502
30 Apr 2008
24 Apr 2012
(HK$)37.8797
(HK$) 92.5881
1 Aug 2013
1 Feb 2018 24,215,341 – 17,206,998 539,561 6,468,782
1 The weighted average closing price of the shares immediately before the dates on which options were exercised was £6.36.
Discretionary Share Option Plans
There have been no grants of discretionary share options under employee share plans since 30 September 2005. HSBC Holdings ordinary shares
Dates of awards Exercise price (£) Exercisable At Exercised Lapsed Atfrom to from to from to 1 Jan 2014 during year during year 31 Dec 2014
HSBC Holdings Group Share Option Plan1,2 30 Apr
200420 Apr
2005 7.2181 7.537930 Apr
200720 Apr
2015 55,025,868 1,434 48,650,452 6,373,982
HSBC Share Plan1 30 Sep
2005 7.991130 Sep
200830 Sep
2015 86,046 – – 86,046
1 The HSBC Holdings Group Share Option Plan expired on 26 May 2005 and the HSBC Share Plan expired on 27 May 2011. No options have been granted under the Plan since that date.
2 The weighted average closing price of the shares immediately before the dates on which options were exercised was £6.09.
Other disclosures Further information about share capital, Directors’ interests, dividends and shareholders, and employee diversity is set out in the Appendix to this section on page 294.
Annual General Meeting All Directors listed on pages 264 to 268 attended the Annual General Meeting in 2014, with the exception of Heidi Miller and Phillip Ameen who were appointed Directors on 1 September 2014 and 1 January 2015 respectively.
Our Annual General Meeting in 2015 will be held at the Queen Elizabeth II Conference Centre, Broad Sanctuary, Westminster, London SW1P 3EE on Friday 24 April 2015 at 11.00am.
An informal meeting of shareholders will be held at 1 Queen’s Road Central, Hong Kong on Monday 20 April 2015 at 4.30pm. A live webcast of the Annual General Meeting will be available on www.hsbc.com. A recording of the proceedings will be available shortly after the conclusion of the Annual General Meeting until 22 May 2015 on www.hsbc.com.
On behalf of the Board D J Flint Group Chairman HSBC Holdings plc Registered number 617987 23 February 2015

Report of the Directors: Corporate Governance (continued) Appendix to Corporate Governance
HSBC HOLDINGS PLC
294
Appendix to Corporate Governance – Other disclosures Share capital
Issued share capital
The nominal value of HSBC Holdings’ issued share capital paid up at 31 December 2014 was US$9,608,951,630 divided into 19,217,874,260 ordinary shares of US$0.50 each, 1,450,000 non-cumulative preference shares of US$0.01 each and 1 non-cumulative preference share of £0.01.
The percentage of the nominal value of HSBC Holdings’ total issued share capital paid up at 31 December 2014 represented by the ordinary shares of US$0.50 each, non-cumulative preference shares of US$0.01 each and the non-cumulative preference share of £0.01 was approximately 99.9998%, 0.0002%, and 0%, respectively.
Rights and obligations attaching to shares
The rights and obligations attaching to each class of shares in our share capital are set out in our Articles of Association subject to certain rights and obligations that attach to each class of preference share as determined by the Board prior to allotment of the relevant preference shares. Set out below is a summary of the rights and obligations attaching to each class of shares with respect to voting, dividends, capital and, in the case of the preference shares, redemption.
To be registered, a transfer of shares must be in relation to shares which are fully paid up and on which we have no lien and to one class of shares denominated in the same currency. The transfer must be in favour of a single transferee or no more than four joint transferees and it must be duly stamped (if required). The transfer must be delivered to our registered office or our Registrars accompanied by the certificate to which it relates or such other evidence that proves the title of the transferor.
If a shareholder or any person appearing to be interested in our shares has been sent a notice under section 793 of the Companies Act 2006 (which confers upon public companies the power to require information from any person whom we know or have reasonable cause to believe to be interested in the shares) and has failed in relation to any shares (the ‘default shares’) to supply the information requested within the period set out in the notice, then the member, unless the Board otherwise determines, is not entitled to be present at or to vote the default shares at any general meeting or to exercise any other right conferred by being a shareholder. If the default shares represent at least 0.25% in nominal value of the issued shares of that class, unless the Board otherwise determines, any dividend shall be withheld by the Company without interest, no election may be made for any scrip dividend alternative, and no transfer of any shares held by the member will be registered except in limited circumstances.
Ordinary shares
Subject to the Companies Act 2006 and the Articles of Association HSBC Holdings may, by ordinary resolution, declare dividends to be paid to the holders of ordinary shares, though no dividend shall exceed the amount recommended by the Board. The Board may pay interim dividends as appears to the Board to be justified by the profits available for distribution. All dividends shall be apportioned and paid proportionately to the percentage of the nominal amount paid up on the shares during any portion or portions of the period in respect of which the dividend is paid, but if any share is issued on terms providing that it shall rank for dividend as from a particular date, it shall rank for dividend accordingly. Subject to the Articles of Association, the Board may, with the prior authority of an ordinary resolution passed by the shareholders and subject to such terms and conditions as the Board may determine, offer to any holders of ordinary shares the right to elect to receive ordinary shares of the same or a different currency, credited as fully paid, instead of cash in any currency in respect of the whole (or some part, to be determined by the Board) of any dividend specified by the ordinary resolution. At the 2012 Annual General Meeting shareholders gave authority to the Directors to offer a scrip dividend alternative until the earlier of the conclusion of the Annual General Meeting in 2017 or 24 May 2017. Further information on the policy adopted by the Board for paying interim dividends on the ordinary shares can be found on page 458.
Preference shares
There are three classes of preference shares in the share capital of HSBC Holdings, non-cumulative preference shares of US$0.01 each (the ‘dollar preference shares’), non-cumulative preference shares of £0.01 each (the ‘sterling preference shares’) and non-cumulative preference shares of €0.01 (the ‘euro preference shares’). The Dollar Preference Shares in issue are Series A dollar preference shares and the sterling preference share in issue is a Series A sterling preference share. There are no euro preference shares in issue.
Dollar Preference Shares
Holders of the dollar preference shares are only entitled to attend and vote at general meetings if any dividend payable on the relevant preference shares in respect of such period as the Board shall determine prior to allotment thereof is not paid in full or in such other circumstances, and upon and subject to such terms, as the Board may determine prior to allotment of the relevant preference shares. In the case of the dollar preference shares in issue at 23 February 2015 the relevant period determined by the Board is four consecutive dividend payment dates. Whenever holders of the dollar

HSBC HOLDINGS PLC
295
Str
ateg
ic R
epo
rt
Fi
nan
cial
Rev
iew
Co
rpo
rate
Go
vern
ance
Fin
anci
al S
tate
men
ts
S
har
eho
lder
Info
rmat
ion
preference shares are entitled to vote on a resolution at a general meeting, on a show of hands every such holder who is present in person or by proxy shall have one vote and on a poll every such holder who is present in person or by proxy shall have one vote per preference share held by him or her or such number of votes per share as the Board shall determine prior to allotment of such share.
Subject to the Articles of Association, holders of the dollar preference shares have the right to a non-cumulative preferential dividend at such rate, on such dates and on such other terms and conditions as may be determined by the Board prior to allotment thereof in priority to the payment of any dividend to the holders of ordinary shares and any other class of shares of HSBC Holdings in issue (other than (i) the other preference shares in issue and any other shares expressed to rank pari passu therewith as regards income; and (ii) any shares which by their terms rank in priority to the relevant preference shares as regards income). A dividend of US$62 per annum is payable on each dollar preference share in issue at 23 February 2015. The dividend is paid at the rate of US$15.50 per quarter at the sole and absolute discretion of the Board.
The dollar preference shares carry no rights to participate in the profits or assets of HSBC Holdings other than as set out in the Articles of Association and subject to the Companies Act 2006, do not confer any right to participate in any offer or invitation by way of rights or otherwise to subscribe for additional shares in HSBC Holdings, do not confer any right of conversion and do not confer any right to participate in any issue of bonus shares or shares issued by way of capitalisation of reserves.
Subject to the relevant insolvency laws and the Articles of Association of HSBC Holdings, holders of the dollar preference shares have the right in a winding up of HSBC Holdings to receive out of the assets of HSBC Holdings available for distribution to its shareholders, in priority to any payment to the holders of the ordinary shares and any other class of shares of HSBC Holdings in issue (other than (i) the other relevant preference shares and any other shares expressed to rank pari passu there with as regards repayment of capital; and (ii) any shares which by their terms rank in priority to the relevant preference shares as regards repayment of capital), a sum equal to any unpaid dividend on the dollar preference shares which is payable as a dividend in accordance with or pursuant to the Articles of Association and the amount paid up or credited as paid up on the dollar preference shares together with such premium (if any) as may be determined by the Board prior to allotment thereof. In the case of the dollar preference shares in issue at 23 February 2015, the premium is US$999.99 per dollar preference share.
The dollar preference shares may be redeemed in accordance with the Articles of Association and the terms on which dollar preference shares were issued and allotted. In the case of the dollar preference shares in issue at 23 February 2015, HSBC Holdings may redeem such shares in whole at any time on or after 16 December 2010, subject to the prior consent of the PRA.
Sterling Preference Shares
The sterling preference shares carry the same rights and obligations under the Articles of Association as the dollar preference shares, save in respect of certain rights and obligations that attach to sterling preference shares to be determined by the Board prior to allotment of the relevant preference shares and the timing and payment of proceeds from the redemption of each class of share. The one sterling preference share in issue at 23 February 2015 carries the same rights and obligations as the dollar preference shares in issue at 23 February 2015 to the extent described in the section above save as follows:
1 the holder of the sterling preference share is not entitled to attend or vote at general meetings;
2 the sterling preference share may be redeemed in whole on any date as may be determined by the Board; and
3 the exceptions to the circumstances in which a dividend will not be declared or paid do not apply.
A dividend of £0.04 per annum is payable on the sterling preference share in issue at 23 February 2015. The dividend is paid at the rate of £0.01 per quarter at the sole and absolute discretion of the Board.
Euro Preference Shares
The euro preference shares carry the same rights and obligations under the Articles of Association as the dollar preference shares, save in respect of certain rights and obligations that attach to euro preference shares which are to be determined by the Board prior to allotment of the relevant preference shares and the timing and payment of proceeds from the redemption of each class of share.

Report of the Directors: Corporate Governance (continued) Appendix to Corporate Governance
HSBC HOLDINGS PLC
296
Share capital during 2014
The following events occurred during the year in relation to the ordinary share capital of HSBC Holdings:
Scrip dividends HSBC Holdings
ordinary shares issued Aggregate
nominal value Market value per share Issued in lieu of on number US$ US$ £
Fourth interim dividend for 2013 30 April 2014 184,047,509 92,023,755 9.9254 5.9788First interim dividend for 2014 10 July 2014 27,302,240 13,651,120 10.3980 6.1996Second interim dividend for 2014 9 October 2014 34,787,645 17,393,823 10.6850 6.4478Third interim dividend for 2014 10 December 2014 22,338,589 11,169,295 10.1178 6.2750
All-Employee share plans
Number Aggregate
nominal value Exercise price US$ from to
HSBC Holdings savings-related share option plans HSBC ordinary shares issued in £ 30,722,608 15,361,304 £ 3.3116 5.9397HSBC ordinary shares issued in HK$ 17,206,998 8,603,499 HK$ 37.8797 92.5881HSBC ordinary shares issued in US$ 1,528,838 764,419 US$ 4.8876 11.8824HSBC ordinary shares issued in € 935,177 467,589 € 3.6361 7.5571Options over HSBC ordinary shares lapsed 5,689,854 2,844,927 Options over HSBC ordinary shares granted in response to
approximately 24,000 applications from HSBC employees in the UK on 23 September 2014 28,688,703 14,344,352
HSBC International Employee Share Purchase Plan 6,470 3,235 £ 5.9290 6.5770
Plan d’Epargne HSBC ordinary shares issued for the benefit of non-UK
resident employees of HSBC France and its subsidiaries 1,763,449 881,725 € 6.7073
Discretionary share incentive plans
HSBC Holdingsordinary shares
Aggregate nominal value Exercise price
Options
issued US$ from (£) to (£) lapsedOptions exercised under: The HSBC Holdings Group Share Option Plan 1,434 717 7.2181 7.5379 48,650,452 HSBC share plans
HSBC Holdingsordinary shares
Aggregate nominal value Market value per share
issued US$ from (£) to (£)Vesting of awards under the HSBC Share Plan and
HSBC Share Plan 2011 67,226,264 33,613,132 5.9180 6.6040
Authorities to allot and to purchase shares
At the Annual General Meeting in 2014, shareholders renewed the general authority for the Directors to allot new shares up to 12,576,146,960 ordinary shares, 15,000,000 non-cumulative preference shares of £0.01 each, 15,000,000 non-cumulative preference shares of US$0.01 each and 15,000,000 non-cumulative preference shares of €0.01 each. Within this, the Directors have authority to allot up to a maximum of 943,211,022 ordinary shares wholly for cash to persons other than existing shareholders. Shareholders also renewed the authority for the Directors to make market purchases of up to 1,886,422,044 ordinary shares. The Directors have not exercised this authority.
In addition, shareholders gave authority for the Directors to grant rights to subscribe for, or to convert any security into no more than 4,500,000,000 ordinary shares in relation to any issue by HSBC Holdings or any member of the Group of contingent convertible securities that automatically convert into or are exchanged for ordinary shares in HSBC Holdings in prescribed circumstances. Further details about the issue of contingent convertible securities can be found in Note 35 on the Financial Statements.
Other than as described in the table above headed ‘Share capital during 2014’, the Directors did not allot any shares during 2014.

HSBC HOLDINGS PLC
297
Str
ateg
ic R
epo
rt
Fi
nan
cial
Rev
iew
Co
rpo
rate
Go
vern
ance
Fin
anci
al S
tate
men
ts
S
har
eho
lder
Info
rmat
ion
Treasury shares
In accordance with the terms of a waiver granted by the Hong Kong Stock Exchange on 19 December 2005, HSBC Holdings will comply with the applicable law and regulation in the UK in relation to the holding of any shares in treasury and with the conditions of the waiver in connection with any shares it may hold in treasury. Pursuant to Chapter 6 of the UK Companies Act 2006 no shares are currently held in treasury.
Directors’ interests
Pursuant to the requirements of the UK Listing Rules and according to the register of Directors’ interests maintained by HSBC Holdings pursuant to section 352 of the Securities and Futures Ordinance of Hong Kong, the Directors of HSBC Holdings at 31 December 2014 had the following interests, all beneficial unless otherwise stated, in the shares and loan capital of HSBC Holdings and its associated corporations:
Directors’ interests – shares and loan capital At 31 December 2014
At 1 January 2014
Beneficial owner
Child under 18 or spouse
Jointly with another person Trustee
Total interests1
HSBC Holdings ordinary shares Safra Catz3 – 20,045 – – – 20,045Lord Evans of Weardale 1,495 5,519 – – – 5,519Joachim Faber 10,605 24,105 – – – 24,105Rona Fairhead 21,858 – 76,524 – 76,524Douglas Flint 392,664 400,748 – – – 400,748Stuart Gulliver 2,730,477 2,434,303 176,885 – – 2,611,188Sam Laidlaw 35,123 35,352 – – 1,4162 36,768John Lipsky3 15,525 15,820 – – – 15,820Rachel Lomax – 15,500 – – – 15,500Iain Mackay 65,130 79,933 – – – 79,933Heidi Miller3 – 3,575 – – – 3,575 Marc Moses 400,753 480,423 – – – 480,423 Sir Simon Robertson 9,912 22,981 – – – 22,981 Jonathan Symonds – 15,940 4,613 – – 20,553
RMBm RMBm RMBm RMBm RMBm RMBmHSBC Bank 2.875% Notes 2015 Joachim Faber4 5.1 – – – – 5.1
1 Executive Directors’ other interests in HSBC Holdings ordinary shares arising from the HSBC Holdings savings-related share option plans, the HSBC Share Plan and the HSBC Share Plan 2011 are set out in the Scheme interests in the Directors’ Remuneration Report on page 320. At 31 December 2014, the aggregate interests under the Securities and Futures Ordinance of Hong Kong in HSBC Holdings ordinary shares, including interests arising through employee share plans were: Douglas Flint – 405,683; Stuart Gulliver – 5,175,003; Marc Moses – 1,775,461; and Iain Mackay – 1,086,284. Each Director’s total interests represents less than 0.03% of the shares in issue.
2 Non-beneficial. 3 Safra Catz has an interest in 4,009, John Lipsky has an interest in 3,164 and Heidi Miller has an interest in 715 listed American Depositary Shares
(‘ADS’), which are categorised as equity derivatives under Part XV of the Securities and Futures Ordinance of Hong Kong. Each ADS represents five HSBC Holdings ordinary shares.
4 Non-beneficial interest in renminbi (‘RMB’) 1.2m 2.875% Notes 2015.
No Directors held any short position as defined in the Securities and Futures Ordinance of Hong Kong in the shares and loan capital of HSBC Holdings and its associated corporations. Save as stated above, none of the Directors had an interest in any shares or debentures of HSBC Holdings or any associated corporation at the beginning or at the end of the year, and none of the Directors or members of their immediate families were awarded or exercised any right to subscribe for any shares or debentures in any HSBC corporation during the year.
Since the end of the year, the aggregate interests of the following Director has increased by the number of HSBC Holdings ordinary shares shown against his name:
HSBC Holdings ordinary shares
Douglas Flint (beneficial owner) 251
1 The acquisition of shares in the HSBC Holdings UK Share Incentive Plan through regular monthly contributions.
There have been no other changes in the share and loan capital interests of the Directors from 31 December 2014 to the date of this report. Any subsequent changes up to the last practicable date before the publication of the Notice of Annual General Meeting will be set out in the notes to that notice.
At 31 December 2014, non-executive Directors and senior management (being executive Directors and Group Managing Directors of HSBC Holdings) held, in aggregate, beneficial interests in 17,531,530 HSBC Holdings ordinary shares (0.09% of the issued ordinary shares).

Report of the Directors: Corporate Governance (continued) Appendix to Corporate Governance
HSBC HOLDINGS PLC
298
At 31 December 2014, executive Directors and senior management held, in aggregate, options to subscribe for 28,288 of HSBC Holdings ordinary shares under the HSBC Holdings savings-related share option plans and HSBC Holdings Group Share Option Plan. These options are exercisable between 2015 and 2020 at prices ranging from £4.4621 to £5.1887 per ordinary share.
Dividends and shareholders
Dividends for 2014
First, second and third interim dividends for 2014, each of US$0.10 per ordinary share, were paid on 10 July 2014, 9 October 2014 and 10 December 2014 respectively. Note 9 on the Financial Statements gives more information on the dividends declared in 2014. On 23 February 2015, the Directors declared a fourth interim dividend for 2014 of US$0.20 per ordinary share in lieu of a final dividend, which will be payable on 30 April 2015 in cash in US dollars, or in sterling or Hong Kong dollars at exchange rates to be determined on 20 April 2015, with a scrip dividend alternative. As the fourth interim dividend for 2014 was declared after 31 December 2014 it has not been included in the balance sheet of HSBC as a debt. The reserves available for distribution at 31 December 2014 were US$48,883m.
A quarterly dividend of US$15.50 per 6.20% non-cumulative US dollar preference share, Series A (‘Series A dollar preference share’), (equivalent to a dividend of US$0.3875 per Series A American Depositary Share, each of which represents one-fortieth of a Series A dollar preference share), was paid on 17 March, 16 June, 15 September and 15 December 2014.
Dividends for 2015
Quarterly dividends of US$15.50 per Series A dollar preference share (equivalent to a dividend of US$0.3875 per Series A American Depositary Share, each of which represents one-fortieth of a Series A dollar preference share) and £0.01 per Series A sterling preference share were declared on 9 February 2015 for payment on 16 March 2015.
Communication with shareholders
Communication with shareholders is given high priority. The Board has adopted a shareholder communication policy which is available on www.hsbc.com. Extensive information about our activities is provided to shareholders in the Annual Report and Accounts, the Strategic Report and the Interim Report which are available on www.hsbc.com. There is regular dialogue with institutional investors and enquiries from individuals on matters relating to their shareholdings and our business are welcomed and are dealt with in an informative and timely manner. All shareholders are encouraged to attend the Annual General Meeting or the informal meeting of shareholders held in Hong Kong to discuss our progress. Shareholders may send enquiries to the Board in writing to the Group Company Secretary, HSBC Holdings plc, 8 Canada Square, London E14 5HQ or by sending an email to [email protected].
Shareholders may require the Directors to call a general meeting, other than an annual general meeting as provided by the UK Companies Act 2006. Requests to call a general meeting may be made by members representing at least 5% of the paid-up capital of the Company as carries the right of voting at general meetings of HSBC Holdings (excluding any paid-up capital held as treasury shares). A request must state the general nature of the business to be dealt with at the meeting and may include the text of a resolution that may properly be moved and is intended to be moved at the meeting. A resolution may properly be moved at a meeting unless it would, if passed, be ineffective (whether by reason of inconsistency with any enactment or the Company’s constitution or otherwise); it is defamatory of any person; or it is frivolous or vexatious. A request may be in hard copy form or in electronic form and must be authenticated by the person or persons making it. A request may be made in writing to the postal address referred to in the paragraph above or by sending an email to [email protected]. At any meeting convened on such request no business shall be transacted except that stated by the requisition or proposed by the Board.
Notifiable interests in share capital
At 31 December 2014, we had received the following disclosures (which have not been subsequently changed) of major holdings of voting rights pursuant to the requirements of Rule 5 of the FCA Disclosure Rules and Transparency Rules:
• Legal & General Group Plc gave notice on 10 July 2013 that on 9 July 2013 its holding of HSBC Holdings ordinary shares fell below 3.00% of the total voting rights at that date; and
• BlackRock, Inc. gave notice on 9 December 2009 that on 7 December 2009 it had the following: an indirect interest in HSBC Holdings ordinary shares of 1,142,439,457; qualifying financial instruments with 705,100 voting rights that may be acquired if the instruments are exercised or converted; and financial instruments with similar economic effect to qualifying financial instruments which refer to 234,880 voting rights, each representing 6.56%, 0.0041% and 0.0013%, respectively, of the total voting rights at that date.
At 31 December 2014, according to the register maintained by HSBC Holdings pursuant to section 336 of the Securities and Futures Ordinance of Hong Kong:
• JPMorgan Chase & Co. gave notice on 21 November 2014 that on 18 November 2014 it had the following interests in HSBC Holdings ordinary shares: a long position of 937,591,714 shares; a short position of 99,085,113 shares; and a

HSBC HOLDINGS PLC
299
Str
ateg
ic R
epo
rt
Fi
nan
cial
Rev
iew
Co
rpo
rate
Go
vern
ance
Fin
anci
al S
tate
men
ts
S
har
eho
lder
Info
rmat
ion
lending pool of 527,117,024 shares, each representing 4.88%, 0.51% and 2.74%, respectively, of the ordinary shares in issue at that date; and
• BlackRock, Inc. gave notice on 28 October 2014 that on 24 October 2014 it had the following interests in HSBC Holdings ordinary shares: a long position of 1,238,135,870 shares and a short position of 4,572,291 shares, each representing 6.45% and 0.02%, respectively, of the ordinary shares in issue at that date.
In compliance with the Rules Governing the Listing of Securities on The Stock Exchange of Hong Kong Limited at least 25% of the total issued share capital has been held by the public at all times during 2014 and up to the date of this report.
Dealings in HSBC Holdings listed securities
Except for dealings as intermediaries by HSBC Bank and The Hongkong and Shanghai Banking Corporation, which are members of a European Economic Area exchange, neither HSBC Holdings nor any of its subsidiaries have purchased, sold or redeemed any of its securities listed on The Stock Exchange of Hong Kong Limited during the year ended 31 December 2014.

Directors’ Remuneration Report Annual Statement
HSBC HOLDINGS PLC
300
Directors’ Remuneration Report Page App1
Annual Statement from the Group Remuneration Committee Chairman 300
Our remuneration strategy and key decisions for 2014 300
Major decisions on Directors’ remuneration 302Future regulatory change 302
Directors’ remuneration policy 303
Downward override policy 304Differences in policy applied to employees
generally 304Material factors taken into account when
setting pay policy 305Adjustments, malus and clawback 306Remuneration policy – non-executive Directors 306Service contracts 306Other directorships 307
Annual report on remuneration 307Remuneration Committee 307Group variable pay pool 309Single figure of remuneration 311Remuneration scenarios and outcomes 313Awards under the GPSP 314Determining executive Directors’ annual
performance 315Total pension entitlements 318Payments to past Directors 318Exit payments made in year 318Scheme interests awarded during 2014 318Summary of performance 319CEO remuneration 319Directors’ interests in shares 320Shareholder context 322Implementation of remuneration policy in
2015 322Annual bonus scorecards 323
Additional disclosures 324Employee compensation and benefits 324Emoluments of senior management 324Emoluments of five highest paid employees 325Remuneration of eight highest paid senior
executives 325Pillar 3 remuneration disclosures 326
1 Appendix to Directors’ Remuneration Report.
Annual Statement from the Group Remuneration Committee Chairman Dear Shareholder,
I am very pleased to present the Remuneration Report for 2014. In this report we provide details of the HSBC remuneration policy, what we paid our Directors in 2014 and why.
This is the first year in which our remuneration policy, which was approved at last year’s Annual General Meeting, has been implemented. I hope this report will give you an understanding of how the Group Remuneration Committee (the ‘Committee’) implemented the policy in 2014 and, more importantly, the link between the performance and pay of our executives and the long-term interests of our shareholders.
The report is divided into three sections: my letter to you as Chairman of the Committee, a summary of our remuneration policy, and an annual report on what we paid our Directors for the year ended 31 December 2014. Additional remuneration-related disclosures are provided in the appendix to this report.
Our remuneration strategy and key decisions for 2014
Our remuneration strategy is designed to reward competitively the achievement of long-term sustainable performance and attract and motivate the very best people who are committed to a long-term career with the Group in the long-term interests of our shareholders.
The Committee believes that it is important that what we pay our people is aligned to our business strategy. Performance should be judged not only on what is achieved over the short and long-term but also, importantly, on how it is achieved, as we believe the latter contributes to the long-term sustainability of the business.
In 2014, new regulatory requirements were introduced under the EU’s Capital Requirements Directive (‘CRD’) IV. The consequential changes to the remuneration rules of the Prudential Regulation Authority (‘PRA’) have influenced how we pay our senior executives and those of our employees identified by the PRA as having a material impact on the institution’s risk profile, being what are termed Material Risk Takers (‘MRTs’).
From 2014, CRD IV introduced a cap on variable pay requiring banks in the EU, including HSBC, to restrict variable pay awards of MRTs, if approved by shareholders, to 200% of fixed pay. This authority was sought and given by shareholders at last year’s Annual General Meeting.
The CRD IV requirements present challenges for HSBC in ensuring that the total compensation package for our employees in all of the markets in which we operate

HSBC HOLDINGS PLC
301
Str
ateg
ic R
epo
rt
Fi
nan
cial
Rev
iew
Co
rpo
rate
Go
vern
ance
Fin
anci
al S
tate
men
ts
S
har
eho
lder
Info
rmat
ion
around the world remains competitive, in particular, relative to other banks not subject to these requirements.
As a consequence, we introduced fixed pay allowances for our executive Directors and other MRTs to rebalance the fixed and variable components of their total compensation. The Committee believes that the introduction of fixed pay allowances as a component of remuneration was essential to ensure the total compensation package for our employees remains competitive. HSBC must continue to retain and attract talent in key non-EU markets where our international peers and their domestic competitors do not have to comply with the CRD IV pay cap. As required by CRD IV, fixed pay allowances are not linked to the achievement of any performance conditions and we comply with the current guidelines which have been issued by the regulators. Our executive Directors and senior executives receive this allowance in shares which are subject to a retention period in order to maintain a close alignment with the long-term interests of our shareholders.
In July 2014, the PRA introduced a new requirement for firms to ensure that clawback (i.e. a firm’s ability to recoup paid and/or vested awards) can be applied to variable pay awards granted on or after 1 January 2015 for a period of at least seven years from the date of award. This requirement is in addition to a firm’s ability
to apply malus (i.e. reduction or cancellation of unvested awards prior to the vesting of such awards) in certain circumstances.
To comply with the new PRA requirement, the Committee has established a clawback policy which will apply to all awards we grant to MRTs on or after 1 January 2015. More details of the circumstances in which ‘malus’ and ‘clawback’ can be applied is provided later in this report.
The Committee has also adopted a policy enabling it to exercise its discretion to reduce variable pay awards for executive Directors and other senior executives when it believes there has been insufficient yearly progress in developing an effective anti-money laundering and sanctions compliance programme.
In 2014, there were a number of legal and regulatory costs for legacy events, including penalties arising from the investigation of certain behaviour within the foreign exchange markets. These were fully reflected in the level of profits used by the Committee to determine the incentive pool, and resulted in a US$600m adjustment to the pool. Additionally, there were a number of actions taken, including discretion applied to reduce variable pay proposed for 2014 for Group employees by US$22m, including members of senior management. More details are provided later in this report.
Overall performance summary/business context
HSBC Holdings plc • In 2014, the Group maintained a strong balance sheet and robust capital position. Excluding the effect of currency translation, loans
and advances grew by US$28bn and customer accounts increased by US$47bn, with a ratio of customer advances to customer accounts of 72%.
• Profit before tax fell on a reported basis compared with 2013, primarily reflecting lower gains from disposals and reclassifications in 2014 and the effect of other significant items, which included provisions for fines, settlements and UK customer redress of US$3.7bn. On an adjusted basis, excluding the effect of significant items and currency translation, profit before tax was broadly unchanged from 2013.
• Adjusted profit before tax was up in three out of five regions. • CMB reported a record profit in 2014. • Revenue on an adjusted basis was broadly unchanged from 2013. This reflected growth in CMB offset by a fall in revenue in GB&M,
together with lower revenue in RBWM and GPB reflecting the remodelling of these businesses. • Net interest margin for the Group stabilised during 2014. • Loan impairment charges were lower, reflecting the changes to our portfolio since 2011. • The reported cost efficiency ratio increased from 59.6% in 2013 to 67.3% in 2014, and on an adjusted basis it increased to 61.1%
in 2014 from 57.7%, principally reflecting higher operating expenses due to an increase in Regulatory Programmes and Compliance costs, inflationary pressures, continued investment in strategic initiatives, and a rise in the bank levy. These factors were partly offset by sustainable cost savings in the year of US$1.3bn.
• The return on average ordinary shareholders’ equity was 7.3%, down from 9.2% in 2013, primarily reflecting lower gains from disposals and reclassifications, together with higher operating expenses, including provisions for fines, settlements and UK customer redress.
• Dividends in respect of 2014 increased from US$0.49 per ordinary share in 2013 to US$0.50 per ordinary share. • Our capital position strengthened in 2014 with our CRD IV transitional CET1 ratio increasing to 10.9% from 10.8% in 2013. RBWM • Lower reported profit before tax was principally driven by lower
revenue from the continued run-off of our US CML portfolio and higher operating expenses in our Principal RBWM business.
CMB• CMB reported an increase in profit before tax reflecting higher
revenue performance in our home markets of Hong Kong and the UK, together with lower LICs, mainly in Europe and Latin America.
GB&M • GB&M reported lower profit before tax, mainly reflecting an
increase in significant items, notably settlements and provisions in connection with foreign exchange investigations, together with lower revenue in part reflecting an adjustment following the introduction of the FFVA and lower Foreign Exchange revenue.
GPB• Lower profit before tax on an adjusted basis, mainly reflected a
managed reduction in client assets as we continued to reposition the business. Despite a reduction in client assets, we attracted positive net new money of US$14bn in areas that we have targeted for growth.

Directors’ Remuneration Report (continued) Annual Statement / Directors’ remuneration policy
HSBC HOLDINGS PLC
302
Major decisions on Directors’ remuneration
The Group Chief Risk Officer, Marc Moses, was appointed an executive Director with effect from 1 January 2014, reflecting the criticality of the Risk function to HSBC, his leadership of that function and his personal contribution to the Group. His remuneration has therefore been brought into line with the executive Directors’ remuneration policy.
Following consultation with shareholders, the Group Chairman, Douglas Flint, became eligible under the policy to receive a one-time award under the Group Performance Share Plan (‘GPSP’). The Committee has subsequently decided that it will not grant a GPSP award to the Group Chairman for 2014. Instead, it has decided to review the base salary of the Group Chairman as part of any future policy change that is proposed to shareholders.
The Committee has concluded that there will be no increase to the base salary of executive Directors in 2015. In light of the feedback received from some of our shareholders, the Committee will review the level of cash pension allowances for executive Directors as part of any future policy change.
The Committee has exercised its discretion to reduce the executive Directors’ overall variable pay from that which would be justified simply from application of the scorecard weightings. This adjustment is justified in the context of the overall financial results and the legal, compliance and regulatory issues impacting the Group, particularly those related to historical events, including
but not limited to foreign exchange. Further details are set out in this report.
Future regulatory change
Looking ahead to 2015/2016, further significant regulatory changes to executive remuneration are expected from the recent PRA and Financial Conduct Authority consultation on ‘Strengthening the alignment of risk and reward: new remuneration rules’. In addition, the European Banking Authority is expected to issue for consultation remuneration guidelines which include criteria under which allowances can be treated as fixed remuneration.
The number and volume of regulatory changes that have been and are being proposed in connection with remuneration are, in the Committee’s view, excessive and are hindering our ability to communicate with any certainty to our current employees and potential employees the remuneration policies and structures that would apply to them. Regulatory uncertainty and complexity is contributing to a general misunderstanding about how our remuneration policies work and the impact of those policies on employee performance.
The Committee will consider the effect of these various changes as well as shareholder feedback on our policy. In light of these factors, it is possible that we will need to make changes to our remuneration policy in 2016.
Sir Simon Robertson Chairman of the Group Remuneration Committee 23 February 2015

HSBC HOLDINGS PLC
303
Str
ateg
ic R
epo
rt
Fi
nan
cial
Rev
iew
Co
rpo
rate
Go
vern
ance
Fin
anci
al S
tate
men
ts
S
har
eho
lder
Info
rmat
ion
Directors’ remuneration policy The following section sets out a summary of HSBC’s remuneration policy for our executive and non-executive Directors approved at the Annual General Meeting on 23 May 2014. The full policy is available in last year’s Directors’ Remuneration Report in the Annual Report and Accounts 2013, a copy of which can be obtained by visiting the following website: http://www.hsbc.com/ investor-relations/financial-and-regulatory-reports.
The quality and long-term commitment of all of our employees is fundamental to our success. We therefore aim to attract, retain and motivate the very best people who are committed to maintaining a long-term
career with the Group, and who will perform their role in the long-term interests of shareholders.
The key elements of our remuneration policy, fixed pay, benefits and variable pay consisting of the annual incentive and GPSP are shown below. These elements support the achievement of our strategic objectives through balancing reward for both short-term and long-term sustainable performance. Our strategy is designed to reward only success, and to align employees’ remuneration with our risk framework and risk outcomes. For our most senior employees, the greater part of their reward is deferred and thereby subject to malus, that is, unvested awards can be reduced or cancelled if warranted by events. In addition, as outlined in the Chairman’s statement, the variable pay awards made from 1 January 2015 will be subject to clawback.
Remuneration policy – executive Directors
Base salary Fixed pay allowance Pension Benefits
FIXE
D P
AY
• Paid in cash on a monthly basis.
• Benchmarked on an annual basis against relevant comparator group.
• Base salary increases for each executive Director will not exceed more than 15% of base salary levels in our 2013 Directors’ Remuneration Report during the term of this policy.
• Granted in immediately vested shares.
• Shares issued are subject to a retention period (20% released in the March immediately following the end of the financial year, 80% released after a period of 5 years from the date of the first release).
• Reflects the role, skills, and experience of the Directors and the maintenance of a competitive total remuneration package for the retention of key talent.
• Not subject to malus or clawback.
• Cash allowance in lieu of pension of up to 50% of base salary.
• To attract and retain key talent by being market competitive.
BEN
EFIT
S
• To take account of local market practice and include the provision of medical insurance, income protection insurance, health assessment, life assurance, club membership, tax assistance, use of company car (including any tax due on the benefit) and travel assistance.
• Stuart Gulliver is also provided with an accommodation and car benefit in Hong Kong. Any tax due on this benefit is borne by HSBC.
• Additional benefits may also be provided where an executive is relocated or spends a substantial proportion of their time in more than one jurisdiction based on business needs.
Purpose and link to strategy Annual incentive GPSP
VARI
ABLE
PAY
• To drive and reward performance consistent with strategy and align to shareholder interests.
• Adherence to HSBC Values is a prerequisite to be considered for any variable pay.
• Deferral provides an incentive for a longer-term commitment and the ability to apply malus.
• Performance targets are set taking into account the economic environment, the Group’s strategic priorities and risk appetite.
• Maximum is 200% of fixed pay.
• Delivered in the form of cash and shares. A minimum of 50% of awards will be made in shares.
• Measured against an annual scorecard, based on targets set for financial and non-financial measures. The scorecards vary by individual.
• A minimum of 60% of the total award will be deferred and vest over a period of three years or such other period as determined by the Committee.
• Maximum is 67% of fixed pay (1/3 of maximum variable pay opportunity of 200% of fixed pay).
• The Committee can exercise its discretion to vary the award if it considers that it does not reflect the overall position and performance of the Company.
• Delivered in shares. • Award levels are determined by considering
performance up to the end of the financial year against enduring performance measures set out in the long-term performance scorecard.
• The award vests after a five-year period. On vesting, the shares must be retained for the duration of the participant’s employment.
• For leavers not deemed to be good leavers, the unvested awards will be cancelled, and the vested shares will be released in three equal instalments on or around each anniversary of the date of cessation of employment.
• Maximum is 133% of fixed pay (2/3 of the maximum total variable pay opportunity of 200% of fixed pay).
• The Committee can exercise its discretion to vary the award if it considers that it does not reflect the overall position and performance of the Company.

Directors’ Remuneration Report (continued) Directors’ remuneration policy
HSBC HOLDINGS PLC
304
The following chart provides an overview of the release profile of target performance total compensation for the
Group Chief Executive Officer based on the above policy.
Release profile for target total compensation
1 Shares arising from GPSP awards must be retained and cannot be sold for the duration of the participant’s employment. For leavers deemed
to be good leavers, the retention period applicable to their vested shares will end upon cessation of employment. For leavers not deemed to be good leavers, their vested shares will be released in three equal instalments on or around each anniversary of the date of cessation of employment.
The Committee will apply the above policy for executive Directors in 2015. In the event that regulatory requirements require changes to be made to the terms of any fixed or variable remuneration outside this policy, the Committee will make the changes necessary to ensure regulatory compliance.
Downward override policy
Based on the recommendations received from the independent monitor, the Committee introduced a downward override policy in 2014, to set the circumstances in which it will make a downward adjustment to any variable pay determination for the executive Directors and other senior executives.
Under this policy, the criteria used to determine the downward adjustment will include:
• insufficient yearly progress in developing an effective AML and sanctions compliance programme; or
• non-compliance with the US DPA and other relevant orders.
The Committee will factor in the Financial System Vulnerabilities Committee’s recommendations in deciding the application and degree of any such downward override to reduce variable pay awards.
Differences in policy applied to employees generally
The mix of fixed and variable pay granted to an employee is commensurate with the individual’s role and experience and local market factors.
Fixed pay allowances are granted to MRTs or individuals identified as having a material impact on the institution’s risk profile based on the qualitative and quantitative criteria set out in the EU Regulatory Technical Standard 604/2014. The fixed pay allowance can also be granted to such other individuals where it is considered a rebalancing of the fixed and variable pay components of their remuneration would be appropriate.
The criteria used for determining fixed pay allowances include the role undertaken, skills, experience, technical expertise, market compensation for the role and other remuneration that the employee may receive in the year.
Group Managing Directors and Group General Managers will receive the fixed pay allowance in shares with the same release profile as the executive Directors. All other employees will receive the fixed pay allowance in cash when it is below a specified threshold. Where the fixed pay allowance is above the specified threshold, all of it will be received in shares that vest immediately. Any shares delivered (net of shares sold to cover any income
2014 2015 2016 2017 2018 2019 2020 Later of2020 or
retirement
Base salary
Pension
Fixed pay allowance
GPSP1
Annual incentive
Fixed pay allowance
26%
38%41%44%47%
66%
100%
26%
12%3%
3%3%
34%
19%

HSBC HOLDINGS PLC
305
Str
ateg
ic R
epo
rt
Fi
nan
cial
Rev
iew
Co
rpo
rate
Go
vern
ance
Fin
anci
al S
tate
men
ts
S
har
eho
lder
Info
rmat
ion
tax and social security) as part of the fixed pay allowance would be subject to a retention period. 40% of the shares are released in March following the end of the relevant financial year in which the shares were granted. The remaining 60% are released in three equal annual tranches on or around each anniversary of the initial release.
Group Managing Directors participate in both the annual incentive and the GPSP. Group General Managers participate in the annual incentive and may receive other long-term awards. Other employees across the Group are eligible to participate in annual incentive arrangements.
Elements of remuneration
Executive Directors
Group Managing Directors
Group General Managers
Other MRTs
Other Employees
Base salary Fixed pay allowance Annual incentive GPSP/long-term awards – –Benefits and pension
Material factors taken into account when setting pay policy
The Committee takes into account a variety of factors when determining the remuneration policy for Directors.
INT
ER
NA
L FA
CT
OR
S
Funding
• Annual incentive and GPSP awards are funded from a single annual variable pay pool. • Funding of the Group’s annual variable pay pool is determined in the context of Group profitability, capital
strength, shareholder returns, the distribution of profits between capital, dividends and variable pay, risk appetite statement, market competitiveness, and overall affordability.
• Details of the calculation of this year’s variable pay pool can be found on page 309.
Pay and employment conditions within the Group
• HSBC considers pay across the Group when determining remuneration levels for its executive Directors. In considering individual awards, a comparison of the pay and employment conditions of our employees and senior executives is considered by the Committee.
• The Committee invites the Head of Group Performance and Reward to present proposals for remuneration for the wider employee population and to consult on the extent to which the different elements of remuneration are provided to other employees.
• Feedback from employee engagement surveys and HSBC Exchange meetings are taken into account in determining the Group’s remuneration policy.
EX
TE
RN
AL
FAC
TO
RS
Regulation • There is still a wide divergence in local regulations governing remuneration structures globally. This presents significant challenges to HSBC, which operates worldwide.
• In order to deliver long-term sustainable performance, it is important to have market-competitive remuneration which is broadly equivalent across geographical boundaries in order to attract, motivate and retain talented and committed employees around the world.
• We aim to ensure that our remuneration policy is aligned with regulatory practices and the interests of shareholders.
• HSBC is fully compliant with the FSB, FCA, PRA and HKMA guidance and rules on remuneration which apply at the date of this report.
Comparator group • The Committee considers market data for executive Directors’ remuneration packages from a defined remuneration comparator group.
• This group consists of ten global financial services companies, namely Australia and New Zealand Banking Group Limited (‘ANZ’), Banco Santander, Bank of America, Barclays, BNP Paribas, Citigroup, Deutsche Bank, JPMorgan Chase & Co, Standard Chartered and UBS. These companies were selected on the basis of their broadly similar business coverage, size and international scope, and are subject to annual review for continuing relevance. ANZ is an additional firm added to the group as part of the Committee’s 2014 review.
• The Committee can also review other companies where relevant in determining the remuneration policy.
Shareholder views • The Chairman of the Committee, the Head of Group Performance and Reward and the Group Company Secretary meet with key institutional shareholders and other representative bodies. We consider these types of meetings important to gather views on our current and developing remuneration practices to ensure that our reward strategy continues to be aligned with the long-term interests of our shareholders.

Directors’ Remuneration Report (continued) Directors’ remuneration policy / Annual report on remuneration
HSBC HOLDINGS PLC
306
Adjustment, malus and clawback
In order to reward genuine performance, individual awards are made on the basis of a risk-adjusted view of both financial and non-financial performance. The Committee has exclusive discretion to apply the malus and clawback policies that it has adopted, enabling it to take the following actions, taking into consideration an
individual’s proximity to, and responsibility for, the event in question. Where practicable, an adjustment will be made to current year variable pay, before the application of malus, then clawback.
This policy is in line with the PRA regulatory requirements.
Type of action
Type of variable pay award affected Circumstances where it may apply (including, but not limited to):
Adjustment Current year variable pay
• Detrimental conduct or conduct which brings the business into disrepute, such as in 2014 relating to the investigation of certain behaviour within the Foreign Exchange markets.
• Involvement in Group-wide events resulting in significant operational losses, including events which have caused or have the potential to cause significant harm to HSBC.
• Non-compliance with HSBC Values and other mandatory requirements. • For specified individuals, insufficient yearly progress in developing an effective AML and
sanctions compliance programme or non-compliance with the DPA and other relevant orders.
Malus Unvested deferred awards granted in prior years
• Detrimental conduct or conduct which brings the business into disrepute. • Past performance being materially worse than originally reported. • Restatement, correction or amendment of any financial statements. • Improper or inadequate risk management.
Clawback1 Vested or paid awards • Participation in or responsibility for conduct which results in significant losses. • Failing to meet appropriate standards of fitness and propriety. • Reasonable evidence of misconduct or material error that would justify, or would have
justified, summary termination of a contract of employment. • HSBC or a business unit suffers a material failure of risk management within the context
of Group risk management standards, policies and procedures.
1 Clawback is only applicable to variable pay awards granted to MRTs on or after 1 January 2015. These include, but are not limited to, the awards made in relation to the 2014 performance year.
Remuneration policy – non-executive Directors
Non-executive Directors are not employees and receive a fee for their services as Directors. In addition, it is common practice for non-executive Directors to be reimbursed expenses incurred in performing their role and any related tax. They are not eligible to receive a base salary, fixed pay allowance, benefits, pension or any variable pay.
The fee levels payable reflect the time commitment and responsibilities required of a non-executive Director of HSBC Holdings. Fees are determined by reference to other UK companies and banks in the FTSE 30, and to the fees paid by other non-UK international banks.
The Board reviews each component of the fees periodically to assess whether, individually and in aggregate, they remain competitive and appropriate in light of changes in roles, responsibilities, and/or the time commitment required for the non-executive Directors and to ensure that individuals of the appropriate calibre are retained or can be appointed. The Board (excluding the non-executive Directors) may approve changes to the fees within the ranges prescribed in the remuneration policy. The Board may also introduce any new component
of fee for non-executive Directors subject to the principles, parameters and other requirements set out in the remuneration policy.
The Philanthropic and Community Investment Oversight Committee, a new non-executive Board committee, was established on 5 December 2014. In line with its authority under the remuneration policy, the Board approved the following fee levels for this committee: chairman – £25,000 per annum; member – £15,000 per annum.
No other change has been made or is proposed to the fees of non-executive Directors during the term of this policy. The fees payable to non-executive Directors are set out in last year’s Directors’ Remuneration Report in the Annual Report and Accounts 2013.
Service contracts
Executive Directors
Our policy is to employ executive Directors on service agreements with 12 months’ notice period. Consistent with the best interests of the Group, the Committee will seek to minimise termination payments. Directors may be eligible for a payment in relation to statutory rights.

HSBC HOLDINGS PLC
307
Str
ateg
ic R
epo
rt
Fi
nan
cial
Rev
iew
Co
rpo
rate
Go
vern
ance
Fin
anci
al S
tate
men
ts
S
har
eho
lder
Info
rmat
ion
Service contracts Contract date
(rolling) Notice period (Director & HSBC)
Director Douglas Flint 14 February 2011 12 monthsStuart Gulliver 10 February 2011 12 monthsIain Mackay 4 February 2011 12 monthsMarc Moses 27 November 2014 12 months
Other than as set out under ‘Directors’ remuneration policy’ and ‘Policy on payments for loss of office’ in the Directors’ Remuneration Report in the Annual Report and Accounts 2013, there are no further obligations which could give rise to remuneration payments or payments for loss of office.
Non-executive Directors
Non-executive Directors are appointed for fixed terms not exceeding three years, which may be renewed subject to their re-election by shareholders at annual general meetings. Non-executive Directors do not have a service contract, but are bound by letters of appointment issued for and on behalf of HSBC Holdings plc. Other than as set out in ‘Remuneration policy – non-executive Directors’ in the Directors’ Remuneration Report in the Annual Report and Accounts 2013, there are no obligations in the non-executive Directors’ letters of appointment which could give rise to remuneration payments or payments for loss of office. Non-executive Directors’ current terms of appointment will expire as follows:
• in 2015, Joachim Faber, Rona Fairhead, John Lipsky, Rachel Lomax and Sir Simon Robertson;
• in 2017, Kathleen Casey, Safra Catz, Laura Cha, Lord Evans of Weardale, Sam Laidlaw and Jonathan Symonds; and
• in 2018, Heidi Miller and Phillip Ameen1.
1 Appointed with effect from 1 January 2015.
Other directorships
Executive Directors may accept appointments as non-executive directors of companies which are not part of HSBC if so authorised by either the Board or the Nomination Committee.
When considering a request to accept a non-executive appointment, the Board or the Nomination Committee will take into account, amongst other things, the expected time commitment associated with the proposed appointment. The time commitment for
Directors’ external appointments is also routinely reviewed to ensure that these external appointments will not compromise the Directors’ commitment to HSBC.
In accordance with the requirements of CRD IV, Directors who are approved by the PRA to take up certain roles on the Board are subject to the following limits on the number of directorships which they may hold:
• one executive directorship with two non-executive directorships; or
• four non-executive directorships.
With the consent of the PRA one additional non-executive directorship may be held.
Any remuneration receivable in respect of an external appointment of an executive Director is normally paid to the Group, unless otherwise approved by the Nomination Committee or the Board.
Annual report on remuneration Remuneration Committee
Role
Within the authority delegated by the Board, the Committee is responsible for approving the Group’s remuneration policy. The Committee also determines the remuneration of executive Directors, senior employees, employees in positions of significant influence and employees whose activities have or could have a material impact on our risk profile and, in doing so, takes into account the pay and conditions across the Group. No executive Directors are involved in deciding their own remuneration.
Membership
The members of the Group Remuneration Committee during 2014 were Sir Simon Robertson (Chairman), Sam Laidlaw, John Lipsky (appointed 23 May 2014), Jonathan Symonds (appointed 14 April 2014 but stepped down from this Committee on 1 September 2014 to become Chairman of the Group Audit Committee), Renato Fassbind (resigned as a Director on 1 September 2014), and John Coombe (retired as a Director on 23 May 2014).
Activities
The Committee met 11 times during 2014. The following is a summary of the Committee’s key activities during 2014.

Directors’ Remuneration Report (continued) Annual report on remuneration
HSBC HOLDINGS PLC
308
Details of the Committee’s key activities
Month Activities Month Activities January • 2013 performance year pay review matters
• Design of new remuneration policy • New shareholding guidelines • Governance matters
July • Feedback from the 2014 Annual General Meeting • 2014 performance year pay review matters • Update on notable events • Matters regarding Group-wide incentives • Employee share plan matters • Governance matters
February • 2013 performance year pay review matters • 2014 GPSP and Annual Scorecards for executive
Directors • Design of new remuneration policy • Matters regarding Group-wide incentives
framework • Employee share plan matters • New shareholding guidelines • Regulatory submissions and disclosures • Governance matters
September • 2014 performance year pay review matters • Review of PRA/FCA consultation on alignment
between risk and reward
October • Shareholder feedback on remuneration matters • Update on PRA/FCA consultation on alignment
between risk and reward
March • Provision of response to the monitor’s report • 2013 performance year pay review matters • Review of PRA consultation on clawback rules • Update on notable events • Matters regarding retirement benefit
arrangements and incentive plans • Regulatory submissions and disclosures
November • Update on EBA’s report and opinion on fixed pay allowances
• 2014 Risk Appetite Statement review and Remuneration Code risk assessment
• 2014 proposed Group variable pay spend and methodology
• Approval of clawback policy • Update on notable events • Regulatory submissions and disclosures • Independent review of HSBC Reward Strategy
against the HKMA remuneration guidelines April • New remuneration policy matters
• Preparation for the 2014 Annual General Meeting• Matters regarding retirement benefit
arrangements and incentive plans • Regulatory submissions and disclosures
December • Risk appetite framework and Financial Crime Compliance updates
• Inputs from the Group Risk Committee, Financial System Vulnerabilities Committee, and Conduct & Values Committee
• 2014 performance year pay review matters • 2015 GPSP and Annual Scorecards for executive
Directors • Update on notable events • Regulatory submissions and disclosures • Employee share plan matters • Governance matters
May • Matters regarding implementation of new remuneration policy
• Preparation for the 2014 Annual General Meeting• 2014 performance year pay review matters • Employee share plan matters • Governance matters

HSBC HOLDINGS PLC
309
Str
ateg
ic R
epo
rt
Fi
nan
cial
Rev
iew
Co
rpo
rate
Go
vern
ance
Fin
anci
al S
tate
men
ts
S
har
eho
lder
Info
rmat
ion
Advisers In 2014, the Committee did not engage any external adviser, and will only seek specific legal and/or remuneration advice independently as and when it considers this to be necessary.
During the year, the Group Chief Executive provided regular briefings to the Committee. In addition, the Committee received advice from the Group Head of Human Resources and Corporate Sustainability, Ann Almeida, the Head of Group Performance and Reward, Alexander Lowen, the Group Chief Risk Officer, Marc Moses, and the Global Head of Financial Crime Compliance and Group Money Laundering Reporting
Officer, Robert Werner, as part of their executive role as employees of HSBC. The Committee also received advice and feedback from the Group Risk Committee, Financial System Vulnerabilities Committee and Conduct & Values Committee on risk and compliance-related matters relevant to remuneration, and the implementation of the downward override policy.
Group variable pay pool (Unaudited) Variable pay pool determination
The Committee considers many factors in determining the Group’s variable pay pool funding.
Variable pay pool determination
Performance and risk appetite statement
• The variable pay pool takes into account the performance of the Group which is considered within the context of our risk appetite statement. This helps to ensure that the variable pay pool is shaped by risk considerations and any Group-wide notable events.
• The risk appetite statement describes and measures the amount and types of risk that HSBC is prepared to take in executing its strategy. It shapes the integrated approach to business, risk and capital management and supports achievement of the Group’s objectives. The Group Chief Risk Officer regularly updates the Committee on the Group’s performance against the risk appetite statement.
• The Committee uses these updates when considering remuneration to ensure that return, risk and remuneration are aligned.
Counter-cyclical funding methodology
• We use a counter-cyclical funding methodology which is categorised by both a floor and a ceiling and the payout ratio reduces as performance increases to avoid pro-cyclicality risk.
• The floor recognises that competitive protection is typically required irrespective of performance levels.
• The ceiling recognises that at higher levels of performance it is possible to limit reward as it is not necessary to continue to increase the variable pay pool, thereby limiting the risk of inappropriate behaviour to drive financial performance.
Distribution of profits • In addition, our funding methodology considers the relationship between capital, dividends and variable pay to ensure that the distribution of post-tax profits between these three elements is considered appropriate (see next page for the 2014, 2013 and target split).
Commerciality and affordability
• Finally, the commercial requirement to remain competitive in the market and overall affordability are considered. Both the annual incentive and GPSP are funded from a single annual variable pay pool from which individual awards are considered. Funding of the Group’s annual variable pay pool is determined in the context of Group profitability, capital strength, and shareholder returns. This approach ensures that performance-related awards for individual global businesses, global functions, geographical regions and levels of staff are considered in a holistic fashion.
• Market competiveness is one of the inputs in the determination of the variable pay pool. This allows us to address any gaps to market identified when comparing total reward with our global peers. This recognises the challenges which arise from being headquartered in the UK and hereby having to apply more stringent reward practices than those applied in markets outside the EU. Factors which influence our competitive market position in Asia, Latin America and the US in attracting and retaining talent are the discounts applied on their pay by employees arising from regulations covering a variable pay cap, higher and longer deferrals, malus and now clawback.
• This year’s variable pay pool was established by reference to the Group’s reported profit before tax,which is adjusted to exclude movements in the fair value of own debt attributable to credit spread, the gains and losses from disposals, and debit valuation adjustment. Reported profit before tax includes the costs of fines, penalties and other items of redress.
• Taking into account all of the above, the Committee decided that in light of performance, the competitive market environment , risk inputs, and other factors, the adjusted pre-tax pre-variable pay profit payout ratio for 2014 would be 16% (15% in 2013). The higher payout ratio reflects stronger performance in Asia and the Middle East, and an increased emphasis on risk and control functions.

Directors’ Remuneration Report (continued) Annual report on remuneration
HSBC HOLDINGS PLC
310
Variable pay pool outcome (US$m) (Unaudited)
Group Global Banking
and Markets 2014 2013 2014 2013
Variable compensation incentive pool as a % of pre-tax profit (pre-variable pay)1 16% 15% 15% 13%
% of variable pay pool deferred2 14% 18% 25% 30%
1 The 2014 Group pre-tax pre-variable pay profit calculation as described on the previous page.
2 The percentage of variable pay deferred for 2014 MRT population is 50%.
Pro forma post-tax profits allocation (Unaudited)
On a pro-forma basis, attributable post-tax profits (excluding the movements in the fair value of own debt and before pay distributions) were allocated in the proportions shown in the chart below. The Group’s target policy is for the vast majority of post-tax profit to be allocated to capital and to shareholders.
Relative importance of spend on pay (Unaudited)
The chart below provides a breakdown of total staff pay relative to the amount paid out in dividends.
1 Dividends per ordinary share in respect of that year. For 2014, this includes the first, second and third interim dividends paid in 2014 of US$5.8bn (gross of scrip) and a fourth interim dividend of US$3.8bn.
2 Employee compensation and benefits in 2014 includes fixed pay, benefits and variable pay as outlined on page 303. Employee compensation and benefits in 2013 totalled US$19,196m which included an accounting gain arising from a change in the basis of delivering ill-health benefits in the UK of US$430m. Excluding this accounting gain, 2013 employee compensation and benefits totalled US$19,626m.
1 Inclusive of dividends to holders of other equity instruments and net of scrip issuance based on an assumption of scrip take up for the fourth quarter of 2014 of 20%. Dividends per ordinary share declared in respect of 2014 were US$0.50, an increase of 2% compared with 2013.
2 Total variable pay pool net of tax and portion to be delivered by the award of HSBC shares.
-7%
-16%
3,660
1,120
3,920
1,327
Group Global Banking and Markets
2014 2013
9,600
20,366
9,200
19,626
2014 2013
4%
US$m
4%
(430)
Ordinary dividends1 Employee compensationand benefits2
19,196
Retainedearnings/
capital32% Dividends1
53%
Variable pay2
15%
2014Retainedearnings/
capital53%
Dividends1
35%
Variable pay2
12%
2013Retainedearnings/
capital45%
Dividends1
40%
Variable pay2
15%
Target

HSBC HOLDINGS PLC
311
Str
ateg
ic R
epo
rt
Fi
nan
cial
Rev
iew
Co
rpo
rate
Go
vern
ance
Fin
anci
al S
tate
men
ts
S
har
eho
lder
Info
rmat
ion
Single figure of remuneration
Executive Directors (Audited)
Douglas Flint Stuart Gulliver Iain Mackay Marc Moses 2014 2013 2014 2013 2014 2013 2014 2013
£000 £000 £000 £000 £000 £000 £000 £000
Fixed pay Base salary 1,500 1,500 1,250 1,250 700 700 700 –Fixed pay allowance – – 1,700 – 950 – 950 –Pension 750 750 625 625 350 350 350 –
2,250 2,250 3,575 1,875 2,000 1,050 2,000 –Variable pay
Annual incentive – – 1,290 1,833 867 1,074 1,033 –GPSP – – 2,112 3,667 1,131 2,148 1,131 –
3,402 5,500 1,998 3,222 2,164 –
Total fixed and variable pay 2,250 2,250 6,977 7,375 3,998 4,272 4,164 –
Benefits 136 48 589 591 43 33 6 –Non-taxable benefits 105 102 53 67 28 53 33 –Notional return on deferred cash 41 27 – – 11 7 36 –
Total single figure of remuneration
2,532 2,427 7,619 8,033 4,080 4,365 4,239 –
Notes to the single figure of remuneration (Audited)
Marc Moses was appointed an executive Director with effect from 1 January 2014, so his 2013 figures have not been disclosed.
Base salary • Salary paid in year for executive Directors. No fees were paid to executive Directors.
Fixed pay allowance • Fixed pay allowance granted in immediately vested shares in the year for executive Directors. • The shares are subject to a retention period. 20% released in the March immediately following the end of the financial year.
80% released after a period of five years from the date of the first release. • Dividends will be paid on the vested shares held during the retention period.
Pension • The amounts consist of an allowance of 50% of annual base salary in lieu of personal pension arrangements. • No other benefits were received by the executive Directors from the Group pension plans.
Benefits • All taxable benefits (gross value before payment of tax). Benefits include provision of medical insurance, accommodation and car,
club membership, tax gross-up for accommodation and car benefit, and car allowance. • Non-taxable benefits include the provision of life assurance and other insurance cover. • The values of the significant benefits in the above table were as follows:
Douglas Flint Stuart Gulliver Iain Mackay Marc Moses 2014 2013 2014 2013 2014 2013 2014 2013
£000 £000 £000 £000 £000 £000 £000 £000
Car benefit (UK and Hong Kong) 701 –2 881 79 –2 –2 –2 –Hong Kong bank-owned
accommodation3 – – 246 229 – – – – Tax expense on car benefit and
Hong Kong bank-owned accommodation 581 –2 2391 266 –2 –2 –2 –
Insurance benefit (non-taxable) 80 78 –2 54 –2 –2 –2 –
1 The UK car benefit provided for Douglas Flint and Stuart Gulliver in 2014 has not changed from 2013. The valuation of the car benefit has increased as they are no longer deemed pool cars for UK tax purposes, and include driver wages, fuel and all associated costs.
2 The car benefit and tax on car benefit for Douglas Flint in 2013, Marc Moses in 2014 and Iain Mackay is not included in the above table as it was not significant. The insurance benefit for Stuart Gulliver and Marc Moses in 2014 and Iain Mackay is not included in the above table as it was not significant.
3 Based on the current market rental value of the bank-owned property, as estimated by an external lease service provider, plus utility costs, rates, the taxable value of furniture and taking into account the business use of the property, the taxable value of the accommodation is considered to be 70% of the total of these amounts.
Annual incentive • Annual incentive awarded (including deferred amounts) as a result of achievement of performance measures for the relevant financial
year. 60% of the award is deferred. 50% of both the deferred and non-deferred component of the award is payable in cash and the remaining 50% in shares, subject to a six month retention period on vesting.
• The deferred element of the 2014 award pays out over a period of three years, subject to service and malus conditions: 33% vests on or around the first and second anniversary of grant and 34% on or around the third anniversary of grant. For the 2014 award the

Directors’ Remuneration Report (continued) Annual report on remuneration
HSBC HOLDINGS PLC
312
performance measures and the outcomes of the performance conditions can be found on pages 315-317. Outcomes for the 2013 award can be found in the Directors’ Remuneration Report in the Annual Report and Accounts 2013.
• The deferred share awards also include a right to receive dividend equivalents. Dividend equivalents on deferred share awards are delivered in the form of additional shares, in the same time and in the same manner and in such proportion as the original deferred award that vests. The expected value of these dividend equivalents is included in the value of deferred share awards.
Illustration of annual incentives (Unaudited)
GPSP • GPSP awarded as a result of achievement of sustainable long-term performance. Figures shown reflect the face value of awards
granted in 2014 and 2013 respectively. • Award levels are determined by considering performance against enduring performance measures set out in the long-term
performance scorecard. There are no post-grant performance conditions. • The award is subject to a five-year cliff vesting period during which the Committee has the authority to cancel all or part of the award.
On vesting, the shares (net of tax) must be retained for the duration of the participant’s employment. • For the 2014 award the outcomes of the performance conditions can be found in the section titled ‘Awards under the GPSP’ on
page 314. Outcomes for the 2013 award can be found in the Directors’ Remuneration Report in the Annual Report and Accounts 2013. • The GPSP awards also include a right to receive dividend equivalents for the period between the grant and the vesting date. Dividend
equivalents on the GPSP awards will be delivered when the GPSP awards vest. There was no vesting of historical GPSP awards in 2014. The expected value of these dividend equivalents are included in the value of GPSP awards.
Illustration of GPSP (Unaudited)
Awards subject to malus and clawback provisions at the discretion of the Remuneration Committee
Award levelbased on 2014performance
2014 2015 2016 2017 2018 and beyond
6-month retention
Non-deferred portion
Deferred portion40%
60%
Performance period
50% paid in shares released after six months
6 months 1 year 1 year
Award madein March 2015, 50% paid in cash immediately
3-year vesting period
Mar Sep Mar Mar Mar
33% vests on oraround the first anniversary of grant and subject to 6-month retention
34% vests on or around the third anniversary of grant and subject to 6-month retention
33% vests on or around the second anniversary of grant and subject to 6-month retention
Performance period
Value of GPSP award fluctuates up or down based on share price performance
Award levelbased on 2014and long-term sustainable performance
Although sharesare fully vested, executive Directors must retain the shares for durationof employment
2014 2015 2016 2017 2018 2019 2020Historical to and beyond
Award made in March 2015
Award vests fully after five years in March 2020
Awards subject to malus and clawback provisions at the discretion of the Remuneration Committee
Vesting awardssubject to retention5-year vesting period
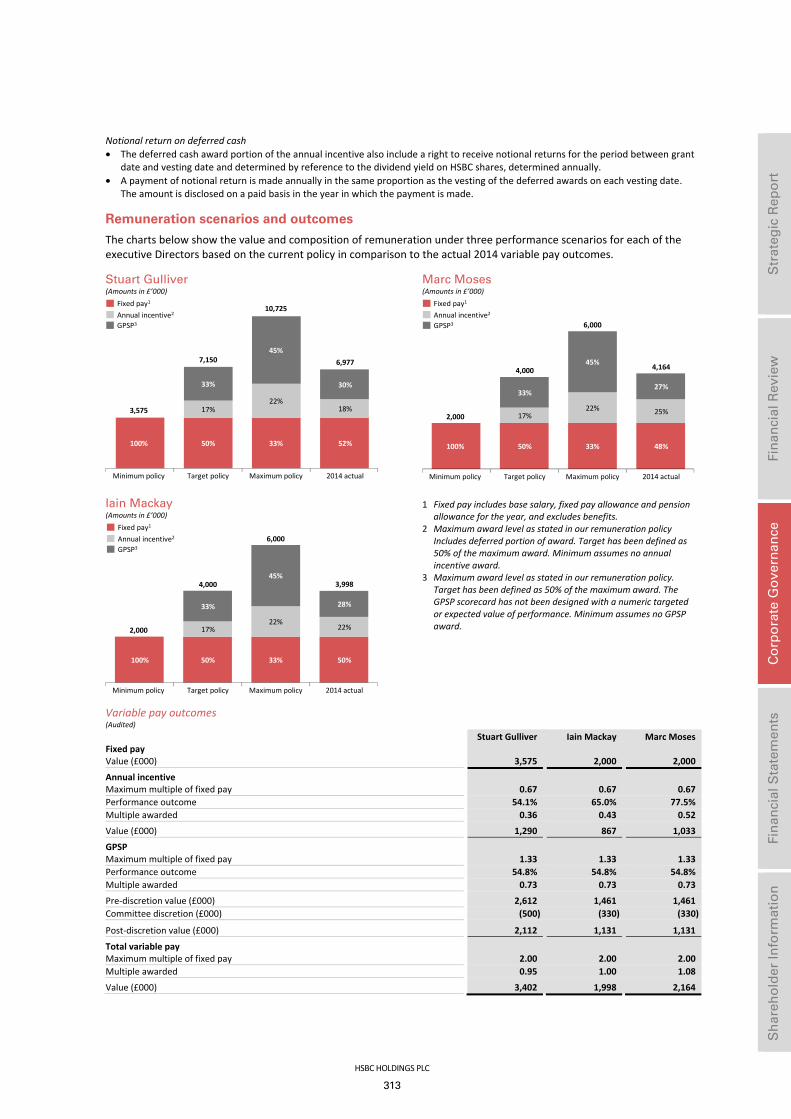
HSBC HOLDINGS PLC
313
Str
ateg
ic R
epo
rt
Fi
nan
cial
Rev
iew
Co
rpo
rate
Go
vern
ance
Fin
anci
al S
tate
men
ts
S
har
eho
lder
Info
rmat
ion
Notional return on deferred cash • The deferred cash award portion of the annual incentive also include a right to receive notional returns for the period between grant
date and vesting date and determined by reference to the dividend yield on HSBC shares, determined annually. • A payment of notional return is made annually in the same proportion as the vesting of the deferred awards on each vesting date.
The amount is disclosed on a paid basis in the year in which the payment is made.
Remuneration scenarios and outcomes
The charts below show the value and composition of remuneration under three performance scenarios for each of the executive Directors based on the current policy in comparison to the actual 2014 variable pay outcomes.
Stuart Gulliver (Amounts in £’000)
Iain Mackay (Amounts in £’000)
Marc Moses (Amounts in £’000)
1 Fixed pay includes base salary, fixed pay allowance and pension
allowance for the year, and excludes benefits. 2 Maximum award level as stated in our remuneration policy
Includes deferred portion of award. Target has been defined as 50% of the maximum award. Minimum assumes no annual incentive award.
3 Maximum award level as stated in our remuneration policy. Target has been defined as 50% of the maximum award. The GPSP scorecard has not been designed with a numeric targeted or expected value of performance. Minimum assumes no GPSP award.
Variable pay outcomes (Audited)
Stuart Gulliver Iain Mackay Marc Moses Fixed pay Value (£000) 3,575 2,000 2,000
Annual incentive Maximum multiple of fixed pay 0.67 0.67 0.67Performance outcome 54.1% 65.0% 77.5%Multiple awarded 0.36 0.43 0.52
Value (£000) 1,290 867 1,033
GPSP Maximum multiple of fixed pay 1.33 1.33 1.33Performance outcome 54.8% 54.8% 54.8%Multiple awarded 0.73 0.73 0.73
Pre-discretion value (£000) 2,612 1,461 1,461Committee discretion (£000) (500) (330) (330)
Post-discretion value (£000) 2,112 1,131 1,131
Total variable pay Maximum multiple of fixed pay 2.00 2.00 2.00Multiple awarded 0.95 1.00 1.08
Value (£000) 3,402 1,998 2,164
100% 50% 33% 52%
17%22%
18%
33%
45%
30%
3,575
7,150
10,725
6,977
Fixed pay1
Annual incentive2
GPSP3
Minimum policy Target policy Maximum policy 2014 actual
100% 50% 33% 50%
17%22%
22%
33%
45%
28%
2,000
4,000
6,000
3,998
Minimum policy Target policy Maximum policy 2014 actual
Fixed pay1
Annual incentive2
GPSP3
100% 50% 33% 48%
17%22% 25%
33%
45%
27%
2,000
4,000
6,000
4,164
Minimum policy Target policy Maximum policy 2014 actual
Fixed pay1
Annual incentive2
GPSP3

Directors’ Remuneration Report (continued) Annual report on remuneration
HSBC HOLDINGS PLC
314
Awards under the GPSP (Audited)
Awards in respect of 2014 were assessed against the 2014 long-term scorecard published in the Annual Report and Accounts 2013 and reproduced below.
The performance assessment under the 2014 long-term scorecard took into account achievements under both financial and non-financial objectives, both of which
were set within the context of the risk appetite and strategic direction agreed by the Board.
Notwithstanding the detail or extent of performance delivery against the objectives, an individual’s eligibility for a GPSP award requires confirmation of adherence to HSBC Values which acts in effect as a gateway to GPSP participation, which was assessed to have been met for all executive Directors. A summary of the assessment and rationale for the conclusions is set out below.
Annual assessment – GPSP
Weighting
Long-term target range
Actual 2014 performance Assessment Outcome
Measure Capital strength (%)1 15% >10 11.1 100% 15.0%Progressive dividend payout (%)2 15% 40-60 72.5 100% 15.0%Return on equity (%)3 15% 12-15 7.2 0% –Cost efficiency ratio
– Jaws4 7.5% Positive jaws1 (14.7) 0% –– Cost efficiency ratio (%)3 7.5% Mid-50s 67.8 0% –
Financial 60% 30.0%
Strategy execution 20% Judgement n/a 67% 13.3%Risk and compliance 15% Judgement n/a 50% 7.5%People 5% Judgement n/a 80% 4.0%
Non-financial 40% 24.8%
Total performance outcome 100% 54.8%
1 Capital strength is defined as common equity tier 1 capital (CRD IV end point basis). 2 Payout ratio reflects dividends in respect of the year. 3 Return on equity and cost efficiency ratio excludes from the return the impact of fair value movements on own debt designated at fair value
resulting from changes in credit spreads. 4 Revenue growth (excluding the impact of fair value movements on own debt designated at fair value resulting from changes in credit spreads)
less operating expense growth.
Financial (60% weighting – achieved 30%)
Capital strength (assessment: 100%): The Committee took particular note in 2014 of the Group’s position against prospective capital and liquidity standards given the publication of important fresh regulatory proposals on total loss-absorbing capacity (‘TLAC’), net stable funding and leverage. The Group’s ability and capacity to meet these standards will have important ramifications for its business model, the prospective returns available and, therefore, the Group’s dividend paying capacity.
The Committee also took note of the outcome of stress tests conducted by the EBA and the PRA, which provided independent evidence of the Group’s resilience to economic downturn and sectoral weaknesses in framing its judgements on capital strength and dividend policy. The Committee noted positively the outcome of these stress tests which placed the Group favourably amongst its peers in terms of its capacity to absorb and recover from adverse circumstances.
The strength of the capital position was therefore considered favourably, with additional note taken of the improvement in the year-end common equity tier 1 ratio and the increase in the estimated end point position under CRD IV.
Progressive dividend payout (assessment: 100%): The projected capacity to maintain a progressive dividend policy was also noted favourably, which was underpinned by the Group’s strong capital position, its distributable reserves, its cash position, and its planning
assumptions around future performances. The progressive development of the Group’s dividend was achieved notwithstanding economic weakness in parts of the external environment, demonstrating the benefits of the Group’s diversified business model.
Return on equity (assessment: 0%): The Group did not achieve previously set aspiration of 12-15%. While having made good progress towards reducing legacy positions and having de-risked the business where necessary, Group performance remains below its stated target. Business model changes consequent upon new regulatory requirements and enhanced risk controls to reduce the possibility of future customer redress and conduct issues were considered to be essential elements to take the Group to where it needed to be for sustainable financial performance. In the interim, the Committee noted the necessary structural changes which are likely to constrain the overall return of equity and mask the benefits coming from new business and from market share improvement in some areas. Additionally, the Group’s performance continues to be exposed in the near term to uncertainties from an evolving regulatory reform agenda (including the Group’s target capital ratios), contingent legal risks from notable legacy matters and continued significant customer redress costs. While acknowledging the commendable efforts being made to meet an ROE target of 12-15% against increased capital requirements both at a global and at a local level, it was decided not to make any award under this opportunity.

HSBC HOLDINGS PLC
315
Str
ateg
ic R
epo
rt
Fi
nan
cial
Rev
iew
Co
rpo
rate
Go
vern
ance
Fin
anci
al S
tate
men
ts
S
har
eho
lder
Info
rmat
ion
Cost efficiency ratio (assessment: 0%): Based on the 2014 development of the Group’s operating expenses, it was judged that no reward should be made under the cost efficiency ratio element of the scorecard. It was noted that the strengthening of Regulatory and Financial Crime Compliance resources and capabilities was a material element in the level of higher costs. It was also recognised that this situation is not likely to diminish in the medium term.
Non-financial (40% weighting – achieved 24.8%)
Strategy execution (assessment: 67%): The Board reviewed progress achieved by management in 2014 to deliver the strategic priorities including organic growth, implementation of Global Standards and driving further efficiency gains through streamlining processes and procedures.
Against a backdrop of weaker than expected economic growth in a number of important markets, and with financial market activity and liquidity further constrained by the industry reshaping in response to regulatory changes, the Group was nevertheless able to demonstrate underlying growth in a number of its global businesses and maintain market position in key products. The Committee recognised that the Board had emphasised a cautious approach to risk appetite during 2014 in light of uncertain economic conditions.
Management demonstrated further progress towards the implementation of Global Standards, acknowledging that material further work is required to achieve full roll-out.
With regard to streamlining, the Group delivered over US$1bn of sustainable savings but these were outweighed by incremental costs in support of growth initiatives and to implement regulatory change, enhance risk controls and implement Global Standards. In light of this, management launched new initiatives to improve efficiency across global businesses and functions which will continue into 2015.
Risk and compliance (assessment: 50%): The Committee received input from the Group Risk Committee, the Conduct & Values Committee and the Financial System Vulnerability Committee on evidence of progress being made to minimise the long-term impact of regulatory and compliance issues on the Group’s reputation. The Committee was satisfied that based on feedback received it was clear that this remains a top priority within the organisation and progress was made in 2014. The Committee took particular notice of work on restructuring the Group Compliance function, investment in greater compliance capabilities, the establishment of enterprise-wide risk assessment programmes, the roll-out of enhanced training and continued strengthening of governance oversight. The Committee also noted the disappointing incidence of further fines and penalties received in 2014, albeit in relation to matters occurring in prior periods, and the consequential extension of work to prevent recurrence.
People (assessment: 80%): The Committee reviewed progress made in talent development, succession
planning, diversity and attrition in some areas. The Committee recognised continued progress, including the successful initiation of a mentoring programme between non-executive directors and senior executives below Board level.
This performance assessment resulted in an overall score of 54.8%.
Notwithstanding this, the Committee subsequently used their discretion to reduce the executive Directors’ GPSP awards by the following amounts:
GPSP adjustment
GPSP
adjustment
Adjustmentas a percentageof variable pay
£000 %Director Stuart Gulliver 500 13%Iain Mackay 330 14%Marc Moses 330 13%
For Stuart Gulliver and Marc Moses, the adjustments were considered appropriate based on the weight of legal, compliance and regulatory issues affecting the Group, even those related to historical events, including but not limited to foreign exchange. For Iain Mackay, the adjustment is considered appropriate by the Committee in the context of overall year-on-year Group-wide profitability, incentive pool funding and market remuneration benchmarks.
In 2013, the Committee also used their discretion to reduce Stuart Gulliver’s overall variable pay by 18.5%.
Determining executive Directors’ annual performance (Audited)
The annual incentive award made to executive Directors in respect of 2014 reflected the Committee’s assessment of the extent to which they had achieved personal and corporate objectives set within their performance scorecard as agreed by the Board at the beginning of the year. This measurement took into account performance against both the financial and non-financial measures which had been set to reflect the risk appetite and strategic priorities determined by the Board to be appropriate for 2014. In addition, in accordance with the downward override policy, the Committee also consulted the Financial System Vulnerabilities Committee and took into consideration the feedback received from this committee in relation to progress on enhancing AML and sanctions compliance as well as progress in meeting the Group obligations under the DPA and other relevant orders.
In order for any award of annual incentive to be made under the above performance scorecard, the Committee had to satisfy itself the executive Directors had personally met and shown leadership in promoting HSBC Values. This overriding test assessed behaviour around HSBC Values of being ‘open, connected and dependable’ and acting with ‘courageous integrity’, which was assessed to have been met for all executive Directors.

Directors’ Remuneration Report (continued) Annual report on remuneration
HSBC HOLDINGS PLC
316
Notwithstanding regulatory difficulties, overall the executive Directors performed well in the context of a challenging market environment.
A summary of each executive Director’s assessment against specific performance measures is provided in the following tables.
Stuart Gulliver
Annual assessment Weighting Target6 Performance Assessment OutcomeMeasure Pre-tax profit (US$bn)1 17.5% 21.6 18.6 86% 15.1%Return on equity (%)2 10% 9.8 7.2 0% –Cost efficiency ratio (%)
– Jaws3 8.75% 5.6 (14.7) 0% –– Cost efficiency ratio (%)2 8.75% 58.5 67.8 0% –
Dividends (%)4 10% 57.1 72.5 100% 10.0%Capital strength (%)5 5% 10.9 11.1 100% 5.0%
Financial 60% 30.1%
Strategy execution 20% Judgement n/a 70% 14.0%Risk and compliance 20% Judgement n/a 50% 10.0%
Non-financial 40% 24.0%
Promoting HSBC Values Over-riding test Met
Total 100% 54.1%
1 Group’s reported profit before tax adjusted to exclude movements in the fair value of own debt attributable to credit spread, the gains and losses from disposals, and debit valuation adjustment (2013 does not include debit valuation adjustment).
2 Return on equity and cost efficiency ratio excludes from the return the impact of fair value movements on own debt designated at fair value resulting from changes in credit spreads.
3 Revenue growth (excluding the impact of fair value movements on own debt designated at fair value resulting from changes in credit spreads) less operating expense growth.
4 Payout ratio reflects dividends in respect of the year. 5 Capital strength is defined as common equity tier 1 capital (CRD IV end point basis). 6 Based on prior year 2013.
Strategy execution (assessment: 70%): The Board reviewed progress achieved in 2014 to deliver the strategic priorities including organic growth, implementation of Global Standards, and driving further efficiency gains through streamlining processes and procedures.
The Committee noted favourably that underlying revenue reflected progress in execution against priority initiatives, including growing market share in selected trade corridors and maintaining market position in key products.
The Committee noted progress in the Global Standards programme throughout 2014 in moving from design to execution phase, the continuation of disposals and closures of non-core businesses and shareholdings (75 transactions since 2011). In addition, the global businesses are implementing operating procedures to assure the delivery of global AML and sanctions policies approved earlier in the year. The Committee noted continuing investment to strengthen financial crime compliance expertise and build strategic infrastructure for customer due diligence, transaction monitoring and sanctions screening. As a consequence, the Committee was advised the Group had been able to deliver on its 2014 milestones.
The Committee noted favourably that the Group had achieved sustainable savings in excess of US$1bn in the
year through business simplification and re-engineering. The Committee noted that costs during 2014 had increased by being affected by significant items and a rise in regulatory and financial crime compliance costs, inflationary pressures, continued investment in strategic initiatives, and a rise in the bank levy. The Committee was advised the Group had launched new initiatives to further improve efficiency across global businesses and key functions which will continue into 2015.
Risk and compliance (assessment: 50%): This measure increased in weighting to 20% from 15% in 2013 to underscore the Group’s commitment to these areas. The Committee reviewed the Group’s progress in increasing and enhancing Group Compliance headcount, the roll out of the ‘Driving a values-led high performance culture’ programme, the implementation of measures to address conduct risk (e.g., product range reviews and associated product exits, changes to retail banking incentive arrangements) and the continued strengthening of governance oversight. The outcome has been affected by the incidence, scale and reputational damage incurred from continuing customer redress and regulatory fines and penalties incurred in 2014.
This performance assessment resulted in an overall score of 54.1%.

HSBC HOLDINGS PLC
317
Str
ateg
ic R
epo
rt
Fi
nan
cial
Rev
iew
Co
rpo
rate
Go
vern
ance
Fin
anci
al S
tate
men
ts
S
har
eho
lder
Info
rmat
ion
Iain Mackay
Annual assessment Weighting Target Performance Assessment OutcomeMeasure Grow both business and dividends 15% Judgement n/a 85% 13.0%Risk and compliance including Global Standards 50% Judgement n/a 75% 37.5%Streamline processes and procedures 25% Judgement n/a 45% 11.0%
Strategic priorities 90% 61.5%
People 10% Judgement n/a 35% 3.5%
Promoting HSBC Values Over-riding test Met
Total 100% 65.0%
Grow both business and dividends (assessment: 85%): The Committee recognised the contribution of the Finance function in supporting the development, implementation and monitoring of business cases in support of organic growth and the substantial improvement in clarity in analysts and investors presentations which had attracted favourable comment from analysts and shareholders.
Risk and compliance including Global Standards (assessment: 75%): The Committee noted substantial progress in a number of areas. Risk and compliance metrics, and implementation of new cost and resource monitoring processes for Global Standards programmes were both fully met during the year.
Streamline processes and procedures (assessment: 45%): The Committee recognised the substantial
commitment to, and achievement of, the exacting stress testing programmes across the Group. It was further noted that costs were higher than target, while the target for sustainable saves had not been met fully. Similarly, while progress was being made in re-engineering the global Finance function, a number of initiatives were still in progress.
People (assessment: 35%): The progress made in performance management and reward differentiation for the global Finance function and further work to be done in increasing employee diversity and cost restructuring were noted.
This performance assessment resulted in an overall score of 65%.
Marc Moses
Annual assessment Weighting Target Performance Assessment OutcomeMeasure Grow both business and dividends 20% Judgement n/a 90% 18.0%Risk and compliance including Global Standards 50% Judgement n/a 75% 37.5%Streamline processes and procedures 20% Judgement n/a 70% 14.0%
Strategic priorities 90% 69.5%
People 10% Judgement n/a 80% 8.0%
Promoting HSBC Values Over-riding test Met
Total 100% 77.5%
Grow both business and dividends (assessment: 90%): The Committee recognised the use of risk appetite statements to enable a sustainable business, and the provision of resources to support business growth (e.g., risk analytics and enhancements to risk processes to enable improvements in quality of credit portfolio).
Risk and compliance including Global Standards (assessment: 75%): The Committee noted the progress towards implementing Global Standards, compliance with regulatory requirements, and de-risking the organisation. This was evidenced by the roll-out of the AML and sanctions compliance plan, the development of the operational risk transformation roadmap and the successful execution of the PRA and EBA stress tests.
Streamline processes and procedures (assessment: 70%): The Committee recognised these objectives have been largely met, supported by the management of business performance, delivery of key streamlining initiatives, and re-engineering of Financial Crime Compliance systems. Work towards the Global Risk data strategy programme to support PRA data requirements, which included enhancements to the Risk data infrastructure, was further noted.
People (assessment: 80%): The execution of the pay and performance plans, as well as the learning and development plans which were part of a comprehensive people strategy for the Global Risk function were noted.
This performance assessment resulted in an overall score of 77.5%.
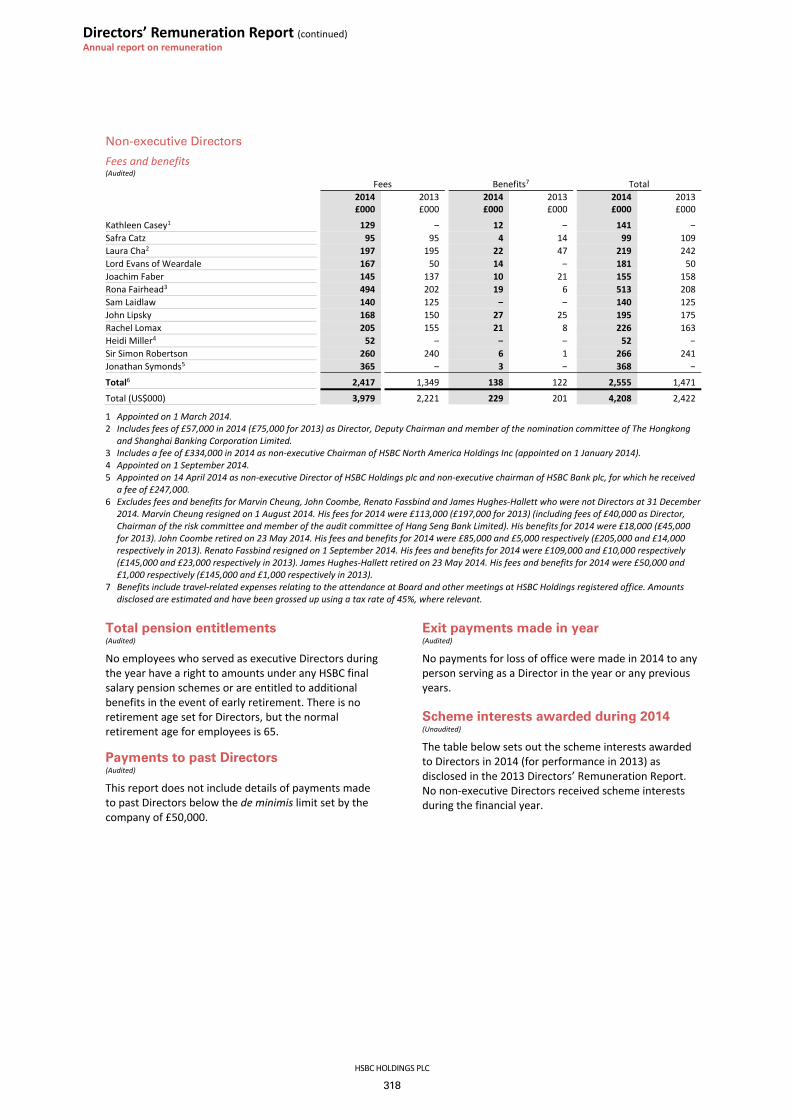
Directors’ Remuneration Report (continued) Annual report on remuneration
HSBC HOLDINGS PLC
318
Non-executive Directors Fees and benefits (Audited) Fees Benefits7 Total 2014 2013 2014 2013 2014 2013 £000 £000 £000 £000 £000 £000
Kathleen Casey1 129 – 12 – 141 –Safra Catz 95 95 4 14 99 109Laura Cha2 197 195 22 47 219 242Lord Evans of Weardale 167 50 14 – 181 50Joachim Faber 145 137 10 21 155 158Rona Fairhead3 494 202 19 6 513 208Sam Laidlaw 140 125 – – 140 125John Lipsky 168 150 27 25 195 175Rachel Lomax 205 155 21 8 226 163Heidi Miller4 52 – – – 52 –Sir Simon Robertson 260 240 6 1 266 241Jonathan Symonds5 365 – 3 – 368 –
Total6 2,417 1,349 138 122 2,555 1,471
Total (US$000) 3,979 2,221 229 201 4,208 2,422
1 Appointed on 1 March 2014. 2 Includes fees of £57,000 in 2014 (£75,000 for 2013) as Director, Deputy Chairman and member of the nomination committee of The Hongkong
and Shanghai Banking Corporation Limited. 3 Includes a fee of £334,000 in 2014 as non-executive Chairman of HSBC North America Holdings Inc (appointed on 1 January 2014). 4 Appointed on 1 September 2014. 5 Appointed on 14 April 2014 as non-executive Director of HSBC Holdings plc and non-executive chairman of HSBC Bank plc, for which he received
a fee of £247,000. 6 Excludes fees and benefits for Marvin Cheung, John Coombe, Renato Fassbind and James Hughes-Hallett who were not Directors at 31 December
2014. Marvin Cheung resigned on 1 August 2014. His fees for 2014 were £113,000 (£197,000 for 2013) (including fees of £40,000 as Director, Chairman of the risk committee and member of the audit committee of Hang Seng Bank Limited). His benefits for 2014 were £18,000 (£45,000 for 2013). John Coombe retired on 23 May 2014. His fees and benefits for 2014 were £85,000 and £5,000 respectively (£205,000 and £14,000 respectively in 2013). Renato Fassbind resigned on 1 September 2014. His fees and benefits for 2014 were £109,000 and £10,000 respectively (£145,000 and £23,000 respectively in 2013). James Hughes-Hallett retired on 23 May 2014. His fees and benefits for 2014 were £50,000 and £1,000 respectively (£145,000 and £1,000 respectively in 2013).
7 Benefits include travel-related expenses relating to the attendance at Board and other meetings at HSBC Holdings registered office. Amounts disclosed are estimated and have been grossed up using a tax rate of 45%, where relevant.
Total pension entitlements (Audited)
No employees who served as executive Directors during the year have a right to amounts under any HSBC final salary pension schemes or are entitled to additional benefits in the event of early retirement. There is no retirement age set for Directors, but the normal retirement age for employees is 65.
Payments to past Directors (Audited)
This report does not include details of payments made to past Directors below the de minimis limit set by the company of £50,000.
Exit payments made in year (Audited)
No payments for loss of office were made in 2014 to any person serving as a Director in the year or any previous years.
Scheme interests awarded during 2014 (Unaudited)
The table below sets out the scheme interests awarded to Directors in 2014 (for performance in 2013) as disclosed in the 2013 Directors’ Remuneration Report. No non-executive Directors received scheme interests during the financial year.

HSBC HOLDINGS PLC
319
Str
ateg
ic R
epo
rt
Fi
nan
cial
Rev
iew
Co
rpo
rate
Go
vern
ance
Fin
anci
al S
tate
men
ts
S
har
eho
lder
Info
rmat
ion
Scheme awards in 2014 (Unaudited)
Type of interest awarded
Basis on which award made
Dates of award
Face value awarded1
£000
Percentage receivable for minimum performance2
Number of shares awarded
Share price on date of grant1
End of performance period
Stuart Gulliver Deferred cash Annual incentive 2013 10 Mar 2014 550 0% n/a n/a 31 Dec 2013Stuart Gulliver Restricted shares Annual incentive 2013 10 Mar 2014 550 0% 88,766 £6.196 31 Dec 2013Stuart Gulliver Restricted shares GPSP 2013 10 Mar 2014 3,667 0% 591,779 £6.196 31 Dec 2013
Iain Mackay Deferred cash Annual incentive 2013 10 Mar 2014 322 0% n/a n/a 31 Dec 2013Iain Mackay Restricted shares Annual incentive 2013 10 Mar 2014 322 0% 51,997 £6.196 31 Dec 2013Iain Mackay Restricted shares GPSP 2013 10 Mar 2014 2,147 0% 346,647 £6.196 31 Dec 2013
Marc Moses Deferred cash Annual incentive 2013 10 Mar 2014 322 0% n/a n/a 31 Dec 2013Marc Moses Restricted shares Annual incentive 2013 10 Mar 2014 322 0% 51,992 £6.196 31 Dec 2013Marc Moses Restricted shares GPSP 2013 10 Mar 2014 2,147 0% 346,613 £6.196 31 Dec 2013
GPSP awards made based on performance up to the financial year-end preceding the grant date with no further performance conditions after grant. Vesting occurs five years after grant date and is normally subject to the Director remaining an employee on the vesting date. Any shares (net of tax) which the director becomes entitled to on the vesting date are subject to a retention requirement.
The above table does not include details of shares issued as part of the Fixed Pay Allowances, as those shares vest immediately and are not subject to any service or performance conditions.
1 Share price used is the closing mid-market price on the last working day preceding the date of grant. 2 Awards determined based on performance achieved during the period to 31 December 2013. The overall award level could have been 0% of the
maximum opportunity if minimum performance was achieved for the period to 31 December 2013. After grant, awards are subject to service condition and malus provisions.
Summary of performance (Unaudited)
HSBC TSR and FTSE100 Index The graph shows the TSR performance against the FTSE 100 Index for the six-year period ended 31 December 2014. The FTSE 100 Index has been chosen as this is a recognised broad equity market index of which HSBC Holdings is a member.
Source: Datastream
CEO remuneration (Unaudited)
Historical CEO remuneration
The table below summarises the CEO’s single figure remuneration over the past six years together with the outcomes of the respective annual incentive and long-term incentive awards.
Single figure of remuneration
Annual incentive maximum2
Annual incentive paid2
Long-term incentive maximum4
Long-term incentive paid4
(£000) (% of fixed pay)3 (% of maximum) (% of fixed pay)3 (% of maximum)
2014 Stuart Gulliver 7,619 67% 54.1% 133% 44.3%2013 Stuart Gulliver 8,033 300% 49.0% 600% 49.0%2012 Stuart Gulliver 7,532 300% 52.0% 600% 40.0%2011 Stuart Gulliver 8,047 300% 57.5% 600% 50.0%20101 Michael Geoghegan 7,932 400% 81.6% 700% 19.1%20091 Michael Geoghegan 7,580 400% 93.5% 700% 25.4%
1 The GPSP was introduced in 2011. Prior to this, values shown relate to awards of Performance Shares under the HSBC Share Plan. Under this plan Performance Share awards vest three years after grant subject to performance conditions of total shareholder return, economic profit and earnings per share, and an over-riding ‘sustained improvement’ judgement by the committee.
2 The 2012 annual incentive figure for Stuart Gulliver used for this table includes 60% of the annual incentive disclosed in the 2012 Directors’ Remuneration Report which was deferred for five years. The vesting of these awards is subject to service condition and satisfactory completion of the DPA. The DPA condition ends on or around the fifth anniversary of the award date unless the DPA is extended or otherwise continues beyond that date, in which case the awards will vest on or around the date on which the DPA expires and otherwise ceases to operate.
3 For 2014, fixed pay includes base salary, fixed pay allowance and pension allowance for the year, and excludes benefits. For 2013 and earlier, fixed pay includes base salary only.
4 Long-term incentive awards are shown in the year where the performance period is deemed to be substantially completed. For performance share awards this is at the end of the third financial year following the date of grant (Performance Share awards shown in 2010 therefore relate to awards granted in 2008). For GPSP awards this is at the end of the financial year preceding the date of grant (GPSP awards shown in 2011 to 2014 therefore relate to awards granted in 2012 to 2015).
80%
100%
120%
140%
160%
180%
200%
Dec 2008 Dec 2009 Dec 2010 Dec 2011 Dec 2012 Dec 2013 Dec 2014
HSBC FTSE 100

Directors’ Remuneration Report (continued) Annual report on remuneration
HSBC HOLDINGS PLC
320
Comparison of Group CEO and all-employee pay
The following table compares the changes in Group CEO pay to changes in employee pay between 2013 and 2014:
Percentage change in remuneration
Base
salary Benefits3 Annual
incentive4
Group CEO1 0.0% (0.3%) (29.6%)Employee group2 4.4% 5.7% (5.3%)
1 Group CEO received an FPA of £1.7 million with effect from 1 January 2014 based on the new remuneration policy approved by shareholders. Further details on the FPA are provided in the remuneration policy section for executive Directors.
2 Employee group consists of all employees globally, based on costs included in wages and salaries disclosed in financial reports (excluding FPA) and staff numbers (full-time equivalents averaged over the financial year).
3 Employee group consists of UK employees only (full-time equivalents averaged over the financial year) as it was deemed the most appropriate comparison for the Group CEO given varying local requirements.
4 Employee group consists of all employees globally, based on annual incentive pool less GPSP as disclosed in financial reports and staff numbers (full-time equivalents at the financial year-end).
Directors’ interests in shares (Audited)
Guidelines
To ensure appropriate alignment with our shareholders, we have shareholding guidelines expressed as a number of shares for executive Directors, non-executive Directors, and Group Managing Directors. The Committee considers that share ownership by senior executives and non-executive Directors helps align their interests with those of shareholders. The numbers of shares they are required to hold are set out in the table below.
Individuals are given five years from 2014 or (if later) their appointment as executive Director, non-executive Director, or Group Managing Director to build up the recommended levels of shareholding.
HSBC operates an anti-hedging policy for all employees. As part of this all employees are required to certify each year that they have not entered into any personal hedging strategies in relation to their holdings of HSBC shares.
The Committee monitors compliance with the share ownership guidelines annually. The Committee has full discretion in determining any penalties in cases of non-compliance, which could include a reduction of future awards of GPSP and/or an increase in the proportion of the annual variable pay that is deferred into shares.
The shareholdings of all persons who were Directors in 2014 (including the shareholdings of their connected persons) at 31 December 2014 or at the time of their retirement are set out below.
Share options (Audited) Exercisable At 1 Jan Exercised At 31 Dec Date of award Exercise price From1 until 2014 in year 2014
Douglas Flint 24 Apr 2012 4.4621 1 Aug 2015 1 Feb 2016 2,016 – 2,016Douglas Flint 23 Sep 2014 5.1887 1 Nov 2019 1 May 2020 – – 2,919Iain Mackay 23 Sep 2014 5.1887 1 Nov 2017 1 May 2018 – – 3,469
1 May be advanced to an earlier date in certain circumstances, e.g. retirement.
The HSBC Holdings savings-related share option plans are all-employee share plans under which eligible employees may be granted options to acquire HSBC Holdings ordinary shares. Employees may make contributions of up to £500 (or equivalent) each month over a period of three or five years which may be used on or around the third or fifth anniversary of the commencement of the relevant savings contract, at the employee’s election, to exercise the options. The plans help align the interests of employees with the creation of shareholder value. The options were awarded for nil consideration and are exercisable at a 20% discount to the average market value of the ordinary shares on the
five business days immediately preceding the invitation date. There are no performance criteria conditional upon which the outstanding options are exercisable and there have been no variations to the terms and conditions since the awards were made. The market value per ordinary share at 31 December 2014 was £6.09. The highest and lowest market values per ordinary share during the year were £6.81 and £5.89. Market value is the mid-market price derived from the London Stock Exchange Daily Official List on the relevant date. Under the Securities and Futures Ordinance of Hong Kong, the options are categorised as unlisted physically settled equity derivatives.

HSBC HOLDINGS PLC
321
Str
ateg
ic R
epo
rt
Fi
nan
cial
Rev
iew
Co
rpo
rate
Go
vern
ance
Fin
anci
al S
tate
men
ts
S
har
eho
lder
Info
rmat
ion
Shares (Audited) At 31 December 2014 or date of retirement Scheme interests
Shares awarded
subject to deferral
Shareholding requirement (number of shares)1
Total share interests
(number of shares)
Share options2
without performance conditions3
with performance conditions
Executive Directors Douglas Flint 400,000 400,748 4,935 – –Stuart Gulliver 750,000 2,611,188 – 2,476,808 87,007Iain Mackay 450,000 79,933 3,469 942,732 60,150Marc Moses 450,000 480,423 – 1,216,599 58,439Group Managing Directors4 250,000 n/a n/a n/a n/a Non-executive Directors5 Safra Catz 15,000 20,045 n/a n/a n/aJohn Coombe6 15,000 23,845 n/a n/a n/aLord Evans of Weardale 15,000 5,519 n/a n/a n/aJoachim Faber 15,000 24,105 n/a n/a n/aRona Fairhead 15,000 76,524 n/a n/a n/aSam Laidlaw 15,000 36,768 n/a n/a n/aJohn Lipsky 15,000 15,820 n/a n/a n/aRachel Lomax 15,000 15,500 n/a n/a n/aHeidi Miller7 15,000 3,575 n/a n/a n/aSir Simon Robertson 15,000 22,981 n/a n/a n/aJonathan Symonds8 15,000 20,553 n/a n/a n/a
1 The current shareholding requirement does not count unvested share based incentives. 2 All share options are unexercised. 3 Includes GPSP awards which are made following an assessment of performance over the relevant period ending on 31 December immediately
before the grant date but are subject to a five-year vesting period. 4 All of the Group Managing Directors are expected to meet their minimum shareholding requirement by 2019 or within five years of the date of
their appointment, whichever is later. 5 Those who were non-executive Directors in 2014 but are not in the list above did not hold any shares as at 31 December 2014, or at the date of
their retirement, directly or through any connected persons. 6 John Coombe retired as a Director on 23 May 2014. 7 Appointed on 1 September 2014. 8 Appointed on 14 April 2014.

Directors’ Remuneration Report (continued) Annual report on remuneration
HSBC HOLDINGS PLC
322
Shareholder context (Unaudited)
The table below shows the outcome of the remuneration-related votes at the Annual General Meeting of HSBC Holdings plc held on 23 May 2014. Number of
votes cast For Against Withheld
Advisory vote on 2013 Remuneration Report 9,744,121,154 8,180,579,271(83.95%)
1,563,541,883 (16.05%)
205,528,859
Binding vote on the Remuneration Policy 9,781,954,191 7,762,051,505(79.35%)
2,019,902,686 (20.65%)
167,509,544
Implementation of remuneration policy in 2015 (Unaudited)
The table below summarises how each element of pay will be implemented in 2015.
1 This approach applies to all executive Directors with the exception of the Group Chairman, Douglas Flint, who is not eligible for a fixed pay allowance or variable pay awards.
Purpose and link to strategy
Operation and planned changes to policy
Fixed pay Base salary Base salary levels will remain unchanged from their 2014 levels as follows:
Douglas Flint: £1,500,000 Stuart Gulliver: £1,250,000 Iain Mackay: £700,000 Marc Moses: £700,000
Fixed pay allowance1 Fixed pay allowances will remain unchanged from their 2014 levels as follows: Douglas Flint: Nil Stuart Gulliver: £1,700,000 Iain Mackay: £950,000 Marc Moses: £950,000
Pension Pension Allowance to apply in 2015 as a percentage of base salary will remain unchanged as follows:
Douglas Flint: 50% Stuart Gulliver: 50% Iain Mackay: 50% Marc Moses: 50%
Benefits Benefits No changes are proposed to the benefits package for 2015.
Variable pay1 Annual incentive No changes are proposed to the annual incentive.
GPSP No changes are proposed to the GPSP.

HSBC HOLDINGS PLC
323
Str
ateg
ic R
epo
rt
Fi
nan
cial
Rev
iew
Co
rpo
rate
Go
vern
ance
Fin
anci
al S
tate
men
ts
S
har
eho
lder
Info
rmat
ion
Annual bonus scorecards
The measures and weightings of the performance measures to apply to the 2015 annual incentive for Stuart Gulliver, Iain Mackay and Marc Moses are given below. Douglas Flint is not included as he is not eligible for an annual incentive award.
The Committee is of the opinion that the performance targets for the annual incentive are commercially sensitive and that it would be detrimental to the interests of the company to disclose them before the start of the financial year. Subject to commercial sensitivity, the targets will be disclosed after the end of the relevant financial year in that year’s remuneration report.
2015 annual incentive scorecards
Stuart Gulliver Iain Mackay Marc Moses
Measures Weighting Functional measures
linked to WeightingFunctional measures
linked to Weighting
Profit before tax1 15% Grow both business and
dividends 15% Grow both business and
dividends 20%
Return on equity 15% Global Standards including
risk and compliance 50% Global Standards including
risk and compliance 50%
Jaws2 15% Streamline processes and
procedures 25% Streamline processes and
procedures 20%
Grow dividends3 15%
Financial 60% Strategic priorities 90% Strategic priorities 90%
Strategy execution 15% People 10% People 10% Global Standards including
risk and compliance 25%
Non-financial 40% People 10% People 10%
Promoting HSBC Values Over-riding
test Promoting HSBC Values Over-riding
test Promoting HSBC Values Over-riding test
Total 100% Total 100% Total 100%
2015 Group GPSP scorecard Measure Long-term target range Weighting
Return on equity >10% 20%Jaws2 Positive adjusted jaws 20%Grow dividends3 Progressive 20%
Financial 60%
Strategy execution Judgement 15%Global standards including risk and compliance Judgement 25%
Non-financial 40%
Total 100%
1 Profit before tax, as defined for the Group variable pay pool. 2 Revenue growth less operating expense, on an adjusted basis. 3 Dividend per ordinary share (USD) in respect of the year, measured year on year; consistent with the growth of the overall profitability of the
Group, predicated on the continued ability to meet with regulatory capital requirements.

Directors’ Remuneration Report (continued) Appendix
HSBC HOLDINGS PLC
324
Appendix to Directors’ Remuneration Report Additional disclosures This appendix provides disclosures required under the Hong Kong Ordinances, Hong Kong Listing Rules, Project Merlin agreement, Financial Conduct Authority’s Prudential Sourcebook for Banks and the US Securities and Exchange Commission Form 20-F disclosures.
Employee compensation and benefits
Emoluments of Directors (Unaudited)
Set out below are details of emoluments paid to executive Directors for the year ended 31 December 2014. Douglas Flint Stuart Gulliver Iain Mackay Marc Moses £000 £000 £000 £000
Basic salaries, allowances and benefits in kind 2,491 4,217 2,071 2,039Pension contributions – – – –Performance-related pay paid or receivable – 3,402 1,998 2,164Inducements to join paid or receivable – – – –Compensation for loss of office – – – –
Total 2,491 7,619 4,069 4,203
Total (US$000) 4,101 12,545 6,700 6,922
Total 2013 (US$000) 3,752 12,558 6,813 –
The aggregate amount of Directors emoluments (including both executive Directors and non-executive Directors) for the year ended 2014 was US$34,475,463. No payments were made in respect of pensions and loss of office. Marc Moses was appointed an executive Director with effect from 1 January 2014, therefore his 2013 figures have not been disclosed.
Emoluments of senior management (Unaudited)
Set out below are details of emoluments paid to senior management (being executive Directors and Group Managing Directors of HSBC Holdings) for the year ended 31 December 2014 or for the period of appointment as a Director or Group Managing Director.
Emoluments of senior management Senior
management £000
Basic salaries, allowances and benefits in kind 32,237Pension contributions 433Performance-related pay paid or receivable 23,749Inducements to join paid or receivable –Compensation for loss of office –
Total 56,419
Total (US$000) 92,893
The aggregate emoluments of senior management for the year ended 31 December 2014 was US$92,892,912. The emoluments of senior management were within the following bands:
Number of senior
management
£0 – £1,000,000 1£1,000,001 – £2,000,000 1£2,000,001 – £3,000,000 7£3,000,001 – £4,000,000 3£4,000,001 – £5,000,000 3£6,000,001 – £7,000,000 1£7,000,001 – £8,000,000 1
The aggregate amount set aside or accrued to provide pension, retirement or similar benefits for executive Directors and senior management for the year ended 31 December 2014 was US$713,715.

HSBC HOLDINGS PLC
325
Str
ateg
ic R
epo
rt
Fi
nan
cial
Rev
iew
Co
rpo
rate
Go
vern
ance
Fin
anci
al S
tate
men
ts
S
har
eho
lder
Info
rmat
ion
Emoluments of five highest paid employees (Unaudited)
Set out below are details of remuneration paid to the five individuals whose emoluments were the highest in HSBC (including two executive Directors and two Group Managing Directors of HSBC Holdings), for the year ended 31 December 2014.
Emoluments of the five highest paid employees
5 highest paidemployees
£000
Basic salaries, allowances and benefits in kind 14,945Pension contributions 128Performance-related pay paid or receivable 11,690Inducements to join paid or receivable –Compensation for loss of office –
Total 26,763
Total (US$000) 44,066
The emoluments of the five highest paid employees were within the following bands: Number of
5 highest paid employees
£4,000,001 – £4,100,000 1£4,200,001 – £4,300,000 1£4,700,001 – £4,800,000 1£6,000,001 – £6,100,000 1£7,600,001 – £7,700,000 1
Remuneration of eight highest paid senior executives (Unaudited)
Set out below are details of the remuneration of the eight highest paid senior executives (including members of the GMB, but not Directors of HSBC Holdings):
Employee 1 2 3 4 5 6 7 8 £000 £000 £000 £000 £000 £000 £000 £000
Fixed Cash based 650 606 650 668 741 650 765 561Shares-based 3,016 1,549 904 726 617 710 376 434
Total fixed 3,666 2,155 1,554 1,394 1,358 1,360 1,141 995
Annual incentive1 Cash 421 345 283 265 224 223 224 199Non-deferred shares2 421 345 283 265 224 223 224 199Deferred cash3 631 517 424 398 336 334 336 299Deferred shares3 631 517 424 398 336 334 336 299
Total annual incentive 2,104 1,724 1,414 1,326 1,120 1,114 1,120 996
GPSP Deferred shares 234 191 157 147 125 124 124 111
Total variable pay 2,338 1,915 1,571 1,473 1,245 1,238 1,244 1,107
Total remuneration 6,004 4,070 3,125 2,867 2,603 2,598 2,385 2,102
Total remuneration (US$000) 9,887 6,701 5,144 4,720 4,287 4,276 3,928 3,461
1 Annual incentive in respect of performance year 2014. 2 Awards vested, subject to a six-month retention period. 3 Awards vest over a three-year period, 33% vests on or around the first and second anniversary of grant and 34% on or around third anniversary
of grant.
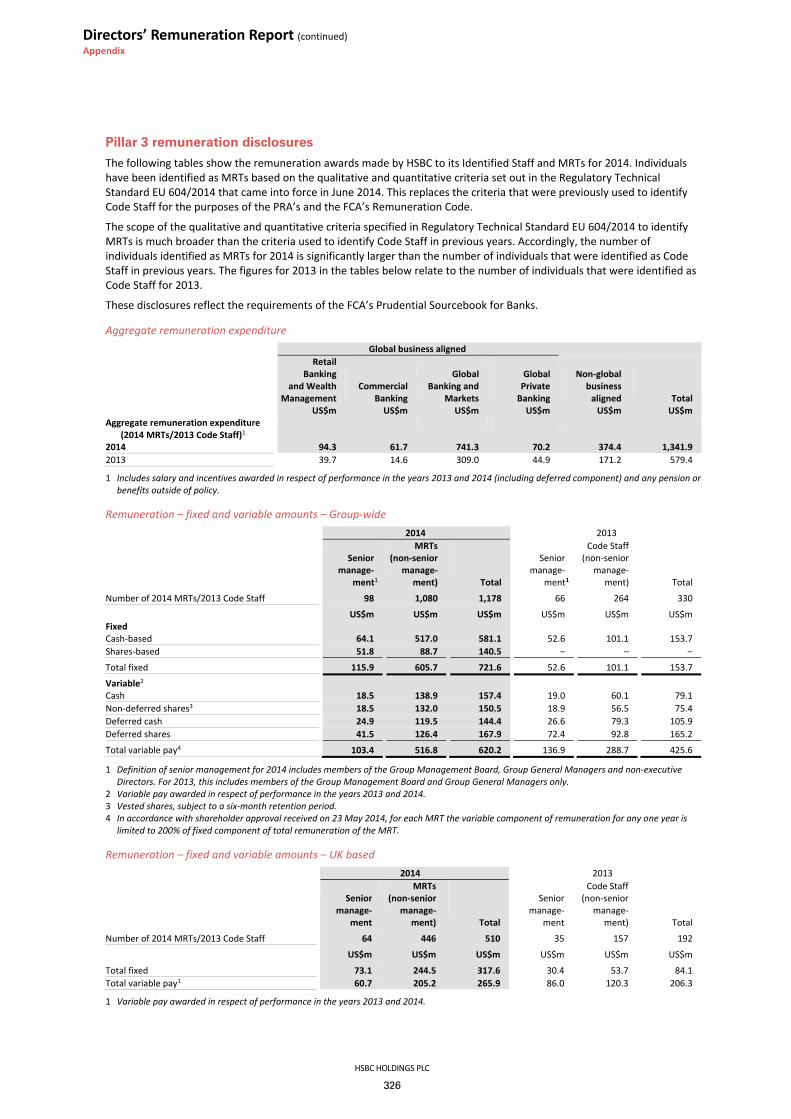
Directors’ Remuneration Report (continued) Appendix
HSBC HOLDINGS PLC
326
Pillar 3 remuneration disclosures
The following tables show the remuneration awards made by HSBC to its Identified Staff and MRTs for 2014. Individuals have been identified as MRTs based on the qualitative and quantitative criteria set out in the Regulatory Technical Standard EU 604/2014 that came into force in June 2014. This replaces the criteria that were previously used to identify Code Staff for the purposes of the PRA’s and the FCA’s Remuneration Code.
The scope of the qualitative and quantitative criteria specified in Regulatory Technical Standard EU 604/2014 to identify MRTs is much broader than the criteria used to identify Code Staff in previous years. Accordingly, the number of individuals identified as MRTs for 2014 is significantly larger than the number of individuals that were identified as Code Staff in previous years. The figures for 2013 in the tables below relate to the number of individuals that were identified as Code Staff for 2013.
These disclosures reflect the requirements of the FCA’s Prudential Sourcebook for Banks.
Aggregate remuneration expenditure Global business aligned Retail
Banking and Wealth
Management Commercial
Banking
Global Banking and
Markets
Global Private
Banking
Non-global business
aligned
Total US$m US$m US$m US$m US$m US$mAggregate remuneration expenditure
(2014 MRTs/2013 Code Staff)1
2014 94.3 61.7 741.3 70.2 374.4 1,341.92013 39.7 14.6 309.0 44.9 171.2 579.4
1 Includes salary and incentives awarded in respect of performance in the years 2013 and 2014 (including deferred component) and any pension or benefits outside of policy.
Remuneration – fixed and variable amounts – Group-wide 2014 2013
Senior manage-
ment1
MRTs(non-senior
manage- ment) Total
Senior manage-
ment1
Code Staff (non-senior
manage-ment) Total
Number of 2014 MRTs/2013 Code Staff 98 1,080 1,178 66 264 330
US$m US$m US$m US$m US$m US$mFixed Cash-based 64.1 517.0 581.1 52.6 101.1 153.7Shares-based 51.8 88.7 140.5 – – –
Total fixed 115.9 605.7 721.6 52.6 101.1 153.7
Variable2 Cash 18.5 138.9 157.4 19.0 60.1 79.1Non-deferred shares3 18.5 132.0 150.5 18.9 56.5 75.4Deferred cash 24.9 119.5 144.4 26.6 79.3 105.9Deferred shares 41.5 126.4 167.9 72.4 92.8 165.2
Total variable pay4 103.4 516.8 620.2 136.9 288.7 425.6
1 Definition of senior management for 2014 includes members of the Group Management Board, Group General Managers and non-executive Directors. For 2013, this includes members of the Group Management Board and Group General Managers only.
2 Variable pay awarded in respect of performance in the years 2013 and 2014. 3 Vested shares, subject to a six-month retention period. 4 In accordance with shareholder approval received on 23 May 2014, for each MRT the variable component of remuneration for any one year is
limited to 200% of fixed component of total remuneration of the MRT.
Remuneration – fixed and variable amounts – UK based 2014 2013
Senior manage-
ment
MRTs(non-senior
manage-ment) Total
Senior manage-
ment
Code Staff (non-senior
manage- ment) Total
Number of 2014 MRTs/2013 Code Staff 64 446 510 35 157 192
US$m US$m US$m US$m US$m US$m
Total fixed 73.1 244.5 317.6 30.4 53.7 84.1Total variable pay1 60.7 205.2 265.9 86.0 120.3 206.3
1 Variable pay awarded in respect of performance in the years 2013 and 2014.

HSBC HOLDINGS PLC
327
Str
ateg
ic R
epo
rt
Fi
nan
cial
Rev
iew
Co
rpo
rate
Go
vern
ance
Fin
anci
al S
tate
men
ts
S
har
eho
lder
Info
rmat
ion
Deferred remuneration1 2014 2013
Senior manage-
ment
MRTs(non-senior
manage- ment) Total
Senior manage-
ment
Code Staff (non-senior
manage- ment) Total
US$m US$m US$m US$m US$m US$mDeferred remuneration at 31 December Outstanding, unvested 270.2 691.8 962.0 213.4 331.7 545.1Awarded during the year 112.6 353.8 466.4 87.0 159.6 246.6Paid out2 33.9 210.3 244.2 110.7 269.9 380.6Reduced through malus3 – – – 0.4 – 0.4
1 This table provides details of actions taken during the performance years 2013 and 2014. For details of variable pay awards granted for the performance years 2013 and 2014, please refer to both the Remuneration tables above.
2 All valued as at 31 December of the relevant year, except for 2013 vested shares which are valued using share price as at day of vesting. 3 This table only discloses instances of malus for 2014 MRTs/2013 Code Staff. Malus has been applied in the year for other individuals who have
left the Group. Where practicable, an adjustment will be made to current year variable pay, before the application of malus (see page 306 for further information).
Sign-on and severance payments 2014 2013
Senior manage-
ment
MRTs(non-senior
manage- ment) Total
Senior manage-
ment
Code Staff (non-senior
manage- ment) Total
Sign-on payments Made during year (US$m) 1.9 2.6 4.5 – 3.7 3.7Number of beneficiaries 1 5 6 – 3 3
Severance payments Made during year (US$m) – 4.1 4.1 1.1 1.6 2.7Number of beneficiaries – 13 13 3 5 8Highest such award to single person (US$m) – 0.5 0.5 0.6 0.6
MRT remuneration by band1 Number of 2014 MRTs Number of 2013 Code Staff
Senior manage-
ment
MRTs(non-senior
manage- ment) Total
Senior manage-
ment
Code Staff (non-senior
manage- ment) Total
€0 – €1,000,000 29 829 858 11 139 150€1,000,001 – €1,500,000 20 150 170 19 44 63€1,500,001 – €2,000,000 10 54 64 9 33 42€2,000,001 – €2,500,000 13 23 36 6 19 25€2,500,001 – €3,000,000 10 12 22 7 16 23€3,000,001 – €3,500,000 6 7 13 4 10 14€3,500,001 – €4,000,000 3 3 6 2 1 3€4,000,001 – €4,500,000 2 1 3 3 1 4€4,500,001 – €5,000,000 2 1 3 3 – 3€5,000,001 – €6,000,000 1 – 1 – 1 1€6,000,001 – €7,000,000 – – – – – –€7,000,001 – €8,000,000 1 – 1 1 – 1€8,000,001 – €9,000,000 1 – 1 1 – 1
1 Table prepared in euros in accordance with Article 450 of the Capital Requirements Regulation, using the rates published by the European Commission for financial programming and budget for December of the reported year as published on their website.

Statement of Directors’ Responsibilities Statement
HSBC HOLDINGS PLC
328
The following statement, which should be read in conjunction with the Auditor’s statement of their responsibilities set out in their report on pages 329 to 333, is made with a view to distinguishing for shareholders the respective responsibilities of the Directors and of the Auditor in relation to the financial statements. The Directors are responsible for preparing the Annual Report and Accounts 2014 comprising the consolidated financial statements of HSBC Holdings and its subsidiaries (the ‘Group’) and holding company financial statements for HSBC Holdings (the ‘parent company’) in accordance with applicable laws and regulations. Each person who is a Director at the date of approval of this report has confirmed that, so far as he or she is aware, there is no relevant audit information of which the auditor is unaware and the Director has taken all the steps that he or she ought to have taken as a Director in order to make himself or herself aware of any relevant audit information and to establish that the auditor is aware of that information. This confirmation was given pursuant to section 418 of the Companies Act 2006 and should be interpreted in accordance with and subject to those provisions.
Company law requires the Directors to prepare Group and parent company financial statements for each financial year. The Directors are required to prepare the Group financial statements in accordance with IFRSs as endorsed by the EU and have elected to prepare the parent company financial statements on the same basis.
The Group and parent company financial statements are required by law and IFRSs as endorsed by the EU to present fairly the financial position, the performance for that period and for IFRSs purposes the cash flows of the Group and the parent company. The Companies Act 2006 provides in relation to such financial statements that references in the relevant part of that Act to financial statements giving a true and fair view are references to their achieving a fair presentation. In addition, in order to meet certain US requirements, HSBC is required to present its financial statements in accordance with IFRSs as issued by the International Accounting Standards Board (‘IASB’). Currently, there are no differences in application to HSBC between IFRSs endorsed by the EU and IFRSs issued by the IASB.
In preparing each of the Group and parent company financial statements, the Directors are required to:
• select suitable accounting policies and then apply them consistently;
• make judgements and estimates that are reasonable and prudent;
• state whether they have been prepared in accordance with IFRSs as endorsed by the EU; and
• prepare the financial statements on the going concern basis unless it is inappropriate to presume that the Group and the parent company will continue in business. Since the Directors are satisfied that the Group and parent company have the resources to continue in business for the foreseeable future, the financial statements continue to be prepared on the going concern basis.
The Directors are responsible for keeping adequate accounting records that are sufficient to show and explain the parent company’s transactions and disclose with reasonable accuracy at any time the financial position of the parent company and enable them to ensure that its financial statements comply with the Companies Act 2006. The Directors have general responsibility for taking such steps as are reasonably open to them to safeguard the assets of the Group and to prevent and detect fraud and other irregularities.
The Directors are responsible for preparing, in accordance with applicable laws and regulations, a Strategic Report, a Directors’ Report, Directors’ Remuneration Report and the Corporate Governance Report on pages 1 to 327 of this Annual Report and Accounts 2014 and for the maintenance and integrity of the Annual Report and Accounts 2014 as they appear on the Company’s website. UK legislation governing the preparation and dissemination of financial statements may differ from legislation in other jurisdictions.
Each of the Directors, the names of whom are set out in the ‘Report of the Directors: Corporate Governance’ section on pages 264 to 268 of the Annual Report and Accounts 2014, confirm that:
• to the best of their knowledge, the consolidated financial statements, which have been prepared in accordance with IFRSs as issued by the IASB and as endorsed by the EU, have been prepared in accordance with the applicable set of accounting standards and give a true and fair view of the assets, liabilities, financial position and profit or loss of the parent company and the undertakings included in the consolidation taken as a whole;
• to the best of their knowledge, the management report represented by the Report of the Directors includes a fair review of the development and performance of the business and the position of the parent company and the undertakings included in the consolidation taken as a whole, together with a description of the principal risks and uncertainties that they face; and
• they consider that the Annual Report and Accounts 2014, taken as a whole, is fair, balanced and understandable and provides the information necessary for shareholders to assess the parent company’s performance, business model and strategy.
On behalf of the Board
D J Flint, Group Chairman 23 February 2015

Independent Auditor’s Report to the Members of HSBC Holdings plc only
HSBC HOLDINGS PLC
329
Str
ateg
ic R
epo
rt
Fi
nan
cial
Rev
iew
Co
rpo
rate
Go
vern
ance
Fin
anci
al S
tate
men
ts
S
har
eho
lder
Info
rmat
ion
Opinions and conclusions arising from our audit
Our opinion on the financial statements is unmodified We have audited the financial statements of HSBC Holdings plc for the year ended 31 December 2014 set out on pages 335 to 457. In our opinion:
• the financial statements give a true and fair view of the state of the Group’s and of the parent company’s affairs as at 31 December 2014 and of the Group’s profit for the year then ended;
• the Group financial statements have been properly prepared in accordance with International Financial Reporting Standards as adopted by the European Union (‘IFRSs as adopted by the EU’);
• the parent company financial statements have been properly prepared in accordance with IFRSs as adopted by the EU and as applied in accordance with the provisions of the Companies Act 2006; and
• the financial statements have been prepared in accordance with the requirements of the Companies Act 2006 and, as regards the Group financial statements, Article 4 of the IAS Regulation.
Our assessment of risks of material misstatement
In arriving at our audit opinion above, our strategy was to increase our audit procedures in areas where we identified a higher risk of material misstatement of the financial statements.
To conduct our risk assessment, we considered the inherent risks facing the Group and the parent company, including those arising from the respective business models, and how the Group controls those risks. In doing so, we considered a number of factors including: the Group’s ability to continue as a going concern; the risk of fraud; the design and implementation of the Group’s control environment; and the risk of management override of key controls.
We revisited our risk assessment after testing the operating effectiveness of a number of the Group’s key controls including internal controls over financial reporting and specific anti-fraud controls as well as testing the basis of the going concern assumption. We also considered the inherent need for the directors to make and appropriately disclose judgements when preparing the financial statements.
As a result of this assessment, the risks of material misstatement that had the greatest effect on our audit were areas where significant judgement was required and were as follows:
The risk Our response
Impairment of loans and advances Refer to the critical accounting estimates and judgements in Note 1(k) on the Financial Statements, the Group Audit Committee Report on pages 277 to 279 and the disclosures of credit risk within the audited elements of the Risk sections of the Financial Review on pages 111 to 237.
The impairment of loans and advances is estimated by the directors through the application of judgement and use of highly subjective assumptions. Due to the significance of loans and advances (representing 41% of total assets) and the related estimation uncertainty, this is considered a key audit risk. The portfolios which give rise to the greatest uncertainty are typically those where impairments are derived from collective models, are unsecured or are subject to potential collateral shortfalls. In 2014, we continued to pay particular attention to collective impairment methodologies, focusing specifically on US mortgages, the commercial and global banking portfolios, and Brazilian personal and business loans, either due to their relative size or the potential impact of changing inputs and assumptions. We also focused on portfolios that were potentially more sensitive to developing and emerging global economic trends. In addition, we also focused on individually significant exposures that either continued to be, have become, or were at risk of being individually impaired.
Our audit procedures included the assessment of controls over the approval, recording and monitoring of loans and advances, and evaluating the methodologies, inputs and assumptions used by the Group in calculating collectively assessed impairments, and assessing the adequacy of impairment allowances for individually assessed loans and advances. We compared the Group’s assumptions for both collective and individual impairment allowances to externally available industry, financial and economic data and our own assessments in relation to key inputs. As part of this, we critically assessed the Group’s revisions to estimates and assumptions, specifically in respect of the inputs to the impairment models in the commercial and global banking portfolios and the consistency of judgement applied in the use of economic factors, loss emergence periods and the observation period for historical default rates. For a sample of exposures that were subject to an individual impairment assessment, and focusing on those with the most significant potential impact on the financial statements, we specifically challenged the Group’s assumptions on the expected future cash flows, including the value of realisable collateral based on our own understanding and available market information. We also assessed whether the financial statement disclosures appropriately reflect the Group’s exposure to credit risk, specifically considering those portfolios identified in 2014 as presenting the greatest risk.

Independent Auditor’s Report to the Members of HSBC Holdings plc only (continued) Report
HSBC HOLDINGS PLC
330
The risk Our response
Litigation, regulatory actions and customer remediation
Refer to the critical accounting estimates and judgements, and disclosures of provisions and contingent liabilities in Notes 29, 37 and 40 on the Financial Statements and the Group Audit Committee Report on pages 277 to 279.
The recognition and measurement of provisions and the measurement and disclosure of contingent liabilities in respect of litigation, regulatory actions and customer remediation (together ‘legal and regulatory matters’) require significant judgement. Due to the significance of these matters and the difficulty in assessing and measuring the quantum from any resulting obligations, this is considered a key audit risk.
In 2014, we paid particular attention to significant matters that experienced notable developments or that emerged during the period. The areas of greatest focus were customer redress programmes and foreign exchange matters in the UK, and other tax and regulatory matters in France, the US and Switzerland.
Our audit procedures included the assessment of controls over the identification, evaluation and measurement of potential obligations arising from legal and regulatory matters.
For matters identified, we considered whether an obligation exists, the appropriateness of provisioning and/or disclosure based on the facts and circumstances available. In order to assess the facts and circumstances, we obtained and assessed the relevant regulatory and litigation documents and also interviewed the Group’s internal and external legal counsel. We also critically assessed the assumptions made and key judgements applied and considered possible alternative outcomes based on our own experience and knowledge of market information.
Additionally we considered whether the Group’s disclosures of the application of judgement in estimating provisions and contingent liabilities adequately reflected the uncertainties associated with legal and regulatory matters.
The risk Our response
Valuation of financial instruments
Refer to the critical accounting estimates and judgements and disclosures of fair values in Notes 12 to 16, 18, 24 and 25 on the Financial Statements, the Group Audit Committee Report on pages 277 to 279 and the disclosures of market risk within the audited elements of the Risk sections of the Financial Review on pages 111 to 237.
The fair value of financial instruments is determined through the application of valuation techniques which often involve the exercise of judgement by the directors and the use of assumptions and estimates.
Due to the significance of financial instruments and the related estimation uncertainty, this is considered a key audit risk. At 31 December 2014, financial assets carried at fair value represented 40% of total assets and financial liabilities carried at fair value represented 25% of total liabilities.
Estimation uncertainty is particularly high for those instruments where significant valuation inputs are unobservable (i.e. Level 3 instruments). At 31 December 2014, Level 3 instruments represented 1.4% of financial assets carried at fair value and 1.3% of financial liabilities carried at fair value.
In 2014, we have continued to focus on developments in derivative fair value methodologies and specifically on the Group’s adoption of a funding fair value adjustment for the measurement of uncollateralised derivatives.
Our audit procedures included the assessment of controls over the identification, measurement and management of valuation risk, and evaluating the methodologies, inputs and assumptions used by the Group in determining fair values.
For the Group’s fair value models, we assessed the appropriateness of the models and inputs. We compared observable inputs against independent sources and externally available market data.
For a sample of instruments with significant unobservable valuation inputs, and with the assistance of our own valuation specialists, we critically assessed the assumptions and models used or re-performed an independent valuation assessment, by reference to what we considered to be available alternative methods and sensitivities to key factors.
We also evaluated the methodology and inputs used by the Group in determining its funding fair value adjustment recorded on the uncollateralised derivatives portfolio and compared that against current market practice based on our experience of comparable institutions.
Additionally, we assessed whether the financial statement disclosures of fair value risks and sensitivities appropriately reflect the Group’s exposure to valuation risk.

HSBC HOLDINGS PLC
331
Str
ateg
ic R
epo
rt
Fi
nan
cial
Rev
iew
Co
rpo
rate
Go
vern
ance
Fin
anci
al S
tate
men
ts
S
har
eho
lder
Info
rmat
ion
The risk Our response
Deferred tax assets
Refer to the critical accounting estimates and judgements and disclosures of deferred taxation in Note 8 on the Financial Statements and the Group Audit Committee Report on pages 277 to 279.
The recognition of deferred tax assets relies on the significant application of judgement by the directors in respect of assessing the probability and sufficiency of future taxable profits, future reversals of existing taxable temporary differences and ongoing tax planning strategies.
Due to the size of the Group’s recognised deferred tax assets (US$7.4bn) and the associated uncertainty surrounding recoverability, this is considered a key audit risk.
In 2014, we have continued to focus on the most significant deferred tax assets which arise in the US, Brazil and Mexico. We paid particular attention to the tax planning strategy in the US, which continues to rely on the capital support of the parent company, and to management’s forecasts of future profitability in Brazil that support the deferred tax asset.
Our audit procedures included the assessment of controls over the recognition and measurement of deferred tax assets and the assessment of assumptions used in projecting the Group’s future taxable profits in relevant jurisdictions. We also challenged the Group’s assumptions and commitment to continue to invest sufficient capital in the US by evaluating the expected tax planning strategies that will be employed and the availability of capital that collectively support the realisation of the recognised deferred tax assets.
We compared key inputs used by the Group to forecast future profits to externally available data such as economic forecasts and the Group’s own historical data and performance and assessed the sensitivity of the outcomes to reasonably possible changes in assumptions. We also used our own tax specialists to critically assess the appropriateness of the future tax planning strategies.
Additionally, we assessed whether the Group’s disclosures of the application of judgement in estimating recognised and unrecognised deferred tax asset balances appropriately reflect the Group’s deferred tax position.
The risk Our response
Goodwill impairment
Refer to the critical accounting estimates and judgements and disclosures of goodwill in Note 21 on the Financial Statements and the Group Audit Committee Report on pages 277 to 279.
Goodwill impairment testing of cash generating units (‘CGUs’) relies on estimates of value-in-use based on estimated future cash flows.
Due to the uncertainty of forecasting and discounting future cash flows and the significance of the Group’s recognised goodwill (US$19.2bn), this is deemed a significant risk.
Uncertainty is typically highest for those CGUs where headroom between value-in-use and carrying value is limited and where the value-in-use is most sensitive to estimates of future cash flows.
In 2014, we focused on CGUs that were most sensitive and reliant on future cash flow projections and, as a result of recent historical performance, were expected to have reduced headroom, particularly GPB businesses in Europe.
Our audit procedures included the assessment of controls over the Group’s process for the recognition and measurement of goodwill impairment, including the assumptions used. We also tested the key assumptions forming the Group’s value-in-use calculation, including the cash flow projections and discount rates.
We assessed the reasonableness of cash flow projections and compared key inputs, such as the discount rates and growth rates, to externally available industry, economic and financial data and the Group’s own historical data and performance. With the assistance of our own specialists, we critically assessed the assumptions and methodologies used to forecast value-in-use for those CGUs where significant goodwill was found to be sensitive to changes in those assumptions. On an overall basis, we also evaluated the aggregate values-in-use determined by the Group to its external market capitalisation.
Additionally we considered whether the Group’s disclosures of the application of judgement in estimating CGU cash flows and the sensitivity of the results of those estimates adequately reflect the risks associated with goodwill impairment.

Independent Auditor’s Report to the Members of HSBC Holdings plc only (continued) Report
HSBC HOLDINGS PLC
332
The risk Our response
Interests in associates
Refer to the critical accounting estimates and judgements and disclosures of interests in associates in Note 20 on the Financial Statements and the Group Audit Committee Report on pages 277 to 279.
The majority of HSBC’s interests in associates relate to its 19.03% interest in Bank of Communications Co., Limited (‘BoCom’), which is listed on the Hong Kong and Shanghai stock exchanges.
Under the equity method of accounting for associates, these interests are initially stated at cost, and are adjusted thereafter for the post-acquisition change in HSBC’s share of the net assets of the associate less any impairment provisions.
BoCom’s market value has been below its carrying amount for a sustained period, and therefore its current carrying amount (US$14.6bn) continues to rely on the Group’s significant judgement in determining BoCom’s recoverable amount based on its value-in-use.
The projected future cash flows and discount rates used by the Group in determining BoCom’s value-in-use are subject to estimation uncertainty and sensitivity. Therefore, we consider this a key audit risk.
Our audit procedures included the assessment of the Group’s methodology and calculation of BoCom’s value-in-use. We evaluated the reasonableness of cash flow projections against BoCom’s most recent financial performance and considered the appropriateness of key inputs such as long-term growth rates used to extrapolate these cash flows, the discount rate, the risk-weighted assets to total assets ratio and the loan impairment charge to gross loans ratio and compared these to available industry, economic and financial data, and to consensus market forecasts.
We met with BoCom’s management to understand current business performance and expectations and whether they were properly reflected in the Group’s own assumptions. We also compared the results of the value-in-use calculations to market available price/earnings multiples for BoCom and other listed banks in mainland China and assessed the Group’s analysis of the difference between the market value and the value-in-use of its interest in BoCom. This assessment included consideration of the valuation methodologies and assumptions used by other market participants.
Additionally, we considered whether the Group’s disclosures of the application of judgement in estimating the recoverable amount and the sensitivity of the results of those estimates adequately reflect the risks associated with impairment of interests in associates.
Our application of materiality and an overview of the scope of our audit
The materiality for the Group financial statements as a whole was set at US$930m, determined with reference to a benchmark of Group profit before tax, normalised to exclude fair value movements on long-term debt attributable to credit spread (‘own credit spread’), which we believe to be one of the principal considerations for members of the company in assessing financial performance. Materiality represents 5.0% of Group profit before tax and 5.1% after adjustment to exclude own credit spread.
We report to the Group Audit Committee any corrected or uncorrected identified misstatements exceeding US$45m, in addition to other identified misstatements that warranted reporting on qualitative grounds.
Our approach to scoping components was: for some regions, we instructed the regional audit team to conduct and report to us on a full scope regional audit and specified certain components within those regions that should be subject to a full scope audit overseen by the relevant regional audit team; within other regions, we directly instructed component audit teams to conduct and report to us full scope audits. Accordingly, we instructed or specified full scope audits at 23 components across all five regions as follows:
• Europe (7 components)
• Asia (8 components)
• Middle East and North Africa (1 component)
• North America (4 components)
• Latin America (3 components)
These audits covered 82% of total Group operating income; 78% of total profits and losses that made up Group profit before tax; and 88% of total Group assets. The segment disclosures in Note 11 set out the individual significance of each region.
We approved materiality for those full scope audits that we directly instructed, ranging from US$50m to US$750m having regard to the mix of size and risk profile of the Group across the components.
The Group audit team visited locations in Europe, Asia, North America and Latin America and teams from components in each region attended a Group audit planning meeting. The Group audit team also held regular telephone meetings with the regional audit teams and other component auditors. In addition, regional audit teams visited locations of key components within their regions.

HSBC HOLDINGS PLC
333
Str
ateg
ic R
epo
rt
Fi
nan
cial
Rev
iew
Co
rpo
rate
Go
vern
ance
Fin
anci
al S
tate
men
ts
S
har
eho
lder
Info
rmat
ion
Our separate opinion in relation to IFRSs as issued by the International Accounting Standards Board is unmodified
As explained in Note 1(a) on the Group financial statements, in addition to complying with its legal obligation to apply IFRSs as adopted by the EU, the Group has also applied IFRSs as issued by the IASB.
In our opinion, the Group financial statements comply with IFRSs as issued by the IASB.
Our opinion on other matters prescribed by the Companies Act 2006 is unmodified
In our opinion:
• the part of the Directors’ Remuneration Report to be audited has been properly prepared in accordance with the Companies Act 2006; and
• the information given in the Strategic Report and Directors’ Report for the financial year for which the financial statements are prepared is consistent with the financial statements.
We have nothing to report in respect of matters on which we are required to report by exception
Under International Standards on Auditing (UK and Ireland) we are required to report to you if, based on the knowledge we acquired during our audit, we have identified other information in the annual report that contains a material inconsistency with either that knowledge or the financial statements, a material misstatement of fact, or that is otherwise misleading.
In particular, we are required to report to you if:
• we have identified material inconsistencies between the knowledge we acquired during our audit and the directors’ statement that they consider that the annual report and financial statements taken as a whole is fair, balanced and understandable and provides the information necessary for shareholders to assess the Group’s performance, business model and strategy; or
• the Corporate Governance section of the Annual Report and Accounts describing the work of the Group Audit Committee does not appropriately address matters communicated by us to the Group Audit Committee.
Under the Companies Act 2006 we are required to report to you if, in our opinion:
• adequate accounting records have not been kept by the parent company, or returns adequate for our audit have not been received from branches not visited by us; or
• the parent company financial statements and the part of the Directors’ Remuneration Report to be audited are not in agreement with the accounting records and returns; or
• certain disclosures of directors’ remuneration specified by law are not made; or • we have not received all the information and explanations we require for our audit. Under the Listing Rules we are required to review:
• the Directors’ statement, set out on pages 290 and 291, in relation to going concern; and • the part of the Corporate Governance Statement relating to the company’s compliance with the ten provisions of the
2012 UK Corporate Governance Code specified for our review. We have nothing to report in respect of the above responsibilities.
Scope of report and responsibilities
As explained more fully in the Directors’ Responsibilities Statement set out on page 328, the Directors are responsible for the preparation of the financial statements and for being satisfied that they give a true and fair view.
A description of the scope of an audit of financial statements is provided on the Financial Reporting Council’s website at http://www.frc.org.uk/auditscopeukprivate.
This report is made solely to the company’s members, as a body and is subject to important explanations and disclaimers regarding our responsibilities, published on our website at http://www.kpmg.com/uk/auditscopeukco2014b, which are incorporated into this report as if set out in full and should be read to provide an understanding of the purpose of this report, the work we have undertaken and the basis of our opinions. Guy Bainbridge (Senior Statutory Auditor) for and on behalf of KPMG Audit Plc, Statutory Auditor Chartered Accountants 15 Canada Square London E14 5GL 23 February 2015

Financial Statements Consolidated income statement
HSBC HOLDINGS PLC
334
Financial Statements Consolidated income statement 335Consolidated statement of comprehensive income 336
Consolidated balance sheet 337
Consolidated statement of cash flows 338
Consolidated statement of changes in equity 339
HSBC Holdings balance sheet 341
HSBC Holdings statement of cash flows 342
HSBC Holdings statement of changes in equity 343
Notes on the Financial Statements 1 Basis of preparation 345
2 Net income/(expense) from financial instruments designated at fair value 354
3 Net insurance premium income 354
4 Net insurance claims and benefits paid and movement in liabilities to policyholders 355
5 Operating profit 356
6 Employee compensation and benefits 356
7 Auditors’ remuneration 364
8 Tax 365
9 Dividends 370
10 Earnings per share 371
11 Segmental analysis 371
12 Trading assets 377
13 Fair values of financial instruments carried at fair value 378
14 Fair values of financial instruments not carried at fair value 390
15 Financial assets designated at fair value 392
16 Derivatives 394
17 Non-trading reverse repurchase and repurchase agreements 398
18 Financial investments 399
19 Assets charged as security for liabilities, assets transferred and collateral accepted as security for assets 401
20 Interests in associates and joint ventures 403
21 Goodwill and intangible assets 407
22 Investments in subsidiaries 413
23 Prepayments, accrued income and other assets 416
24 Trading liabilities 417
25 Financial liabilities designated at fair value 417
26 Debt securities in issue 418
27 Accruals, deferred income and other liabilities 418
28 Liabilities under insurance contracts 419
29 Provisions 420
30 Subordinated liabilities 423
31 Maturity analysis of assets, liabilities and off-balance sheet commitments 426
32 Offsetting of financial assets and financial liabilities 434
33 Foreign exchange exposures 435
34 Non-controlling interests 436
35 Called up share capital and other equity instruments 437
36 Notes on the statement of cash flows 439
37 Contingent liabilities, contractual commitments and guarantees 441
38 Lease commitments 442
39 Structured entities 443
40 Legal proceedings and regulatory matters 446
41 Related party transactions 455
42 Events after the balance sheet date 457

HSBC HOLDINGS PLC
335
Str
ateg
ic R
epo
rt
Fi
nan
cial
Rev
iew
Co
rpo
rate
Go
vern
ance
Fin
anci
al S
tate
men
ts
S
har
eho
lder
Info
rmat
ion
Consolidated income statement for the year ended 31 December 2014 2014 2013 2012 Notes US$m US$m US$m
Interest income 50,955 51,192 56,702 Interest expense (16,250) (15,653) (19,030)
Net interest income 34,705 35,539 37,672
Fee income 19,545 19,973 20,149 Fee expense (3,588) (3,539) (3,719)
Net fee income 15,957 16,434 16,430
Trading income excluding net interest income 4,853 6,643 4,408 Net interest income on trading activities 1,907 2,047 2,683
Net trading income 6,760 8,690 7,091
Changes in fair value of long-term debt issued and related derivatives 508 (1,228) (4,327)Net income from other financial instruments designated at fair value 1,965 1,996 2,101
Net income/(expense) from financial instruments designated at fair value 2 2,473 768 (2,226)
Gains less losses from financial investments 1,335 2,012 1,189 Dividend income 311 322 221 Net insurance premium income 3 11,921 11,940 13,044 Gains on disposal of US branch network, US cards business and Ping An
Insurance (Group) Company of China, Ltd – – 7,024 Other operating income 1,131 2,632 2,100
Total operating income 74,593 78,337 82,545
Net insurance claims and benefits paid and movement in liabilities to policyholders 4 (13,345) (13,692) (14,215)
Net operating income before loan impairment charges and other credit risk provisions 61,248 64,645 68,330
Loan impairment charges and other credit risk provisions 5 (3,851) (5,849) (8,311)
Net operating income 57,397 58,796 60,019
Employee compensation and benefits 6 (20,366) (19,196) (20,491)General and administrative expenses (18,565) (17,065) (19,983)Depreciation and impairment of property, plant and equipment (1,382) (1,364) (1,484)Amortisation and impairment of intangible assets 21 (936) (931) (969)
Total operating expenses (41,249) (38,556) (42,927)
Operating profit 5 16,148 20,240 17,092
Share of profit in associates and joint ventures 20 2,532 2,325 3,557
Profit before tax 18,680 22,565 20,649
Tax expense 8 (3,975) (4,765) (5,315)
Profit for the year 14,705 17,800 15,334
Profit attributable to shareholders of the parent company 13,688 16,204 14,027 Profit attributable to non-controlling interests 1,017 1,596 1,307
US$ US$ US$
Basic earnings per ordinary share 10 0.69 0.84 0.74 Diluted earnings per ordinary share 10 0.69 0.84 0.74
The accompanying notes on pages 345 to 457 form an integral part of these financial statements1.
For footnote, see page 344.

Financial Statements (continued) Consolidated statement of comprehensive income / Consolidated balance sheet
HSBC HOLDINGS PLC
336
Consolidated statement of comprehensive income for the year ended 31 December 2014
2014 2013 2012 US$m US$m US$m
Profit for the year 14,705 17,800 15,334
Other comprehensive income/(expense)
Items that will be reclassified subsequently to profit or loss when specific conditions are met: Available-for-sale investments2 2,972 (1,718) 5,070
– fair value gains/(losses) 4,794 (1,787) 6,396 – fair value gains reclassified to the income statement (1,672) (1,277) (1,872)– amounts reclassified to the income statement in respect of impairment
losses 374 286 1,002 – income taxes (524) 1,060 (456)
Cash flow hedges 188 (128) 109 – fair value gains 1,512 776 552 – fair value gains reclassified to the income statement (1,244) (894) (423)– income taxes (80) (10) (20)
Share of other comprehensive income/(expense) of associates and joint ventures 80 (71) 533 – share for the year 78 (35) 311– reclassified to income statement on disposal 2 (36) 222
Exchange differences (8,903) (1,372) 1,017 – foreign exchange gains reclassified to income statement on disposal of a
foreign operation (21) (290) (1,128)– other exchange differences (8,917) (1,154) 2,145 – Income tax attributable to exchange differences 35 72 –
Items that will not be reclassified subsequently to profit or loss:
Remeasurement of defined benefit asset/liability 1,985 (458) (195)– before income taxes 2,419 (601) (391)– income taxes (434) 143 196
Other comprehensive income for the year, net of tax (3,678) (3,747) 6,534
Total comprehensive income for the year 11,027 14,053 21,868
Attributable to: – shareholders of the parent company 9,245 12,644 20,455 – non-controlling interests 1,782 1,409 1,413
Total comprehensive income for the year 11,027 14,053 21,868
The accompanying notes on pages 345 to 457 form an integral part of these financial statements1.
For footnote, see page 344.

HSBC HOLDINGS PLC
337
Str
ateg
ic R
epo
rt
Fi
nan
cial
Rev
iew
Co
rpo
rate
Go
vern
ance
Fin
anci
al S
tate
men
ts
S
har
eho
lder
Info
rmat
ion
Consolidated balance sheet at 31 December 2014 2014 2013 Notes US$m US$mAssets
Cash and balances at central banks 129,957 166,599 Items in the course of collection from other banks 4,927 6,021Hong Kong Government certificates of indebtedness 27,674 25,220 Trading assets 12 304,193 303,192 Financial assets designated at fair value 15 29,037 38,430 Derivatives 16 345,008 282,265 Loans and advances to banks3 112,149 120,046Loans and advances to customers3 974,660 992,089Reverse repurchase agreements – non-trading 17 161,713 179,690Financial investments 18 415,467 425,925 Prepayments, accrued income and other assets 23 75,176 76,842Current tax assets 1,309 985Interests in associates and joint ventures 20 18,181 16,640 Goodwill and intangible assets 21 27,577 29,918 Deferred tax assets 8 7,111 7,456
Total assets at 31 December 2,634,139 2,671,318 Liabilities and equity
Liabilities Hong Kong currency notes in circulation 27,674 25,220 Deposits by banks3 77,426 86,507Customer accounts3 1,350,642 1,361,297Repurchase agreements – non-trading 17 107,432 164,220Items in the course of transmission to other banks 5,990 6,910Trading liabilities 24 190,572 207,025 Financial liabilities designated at fair value 25 76,153 89,084 Derivatives 16 340,669 274,284Debt securities in issue 26 95,947 104,080 Accruals, deferred income and other liabilities 27 53,396 52,341Current tax liabilities 1,213 607 Liabilities under insurance contracts 28 73,861 74,181 Provisions 29 4,998 5,217 Deferred tax liabilities 8 1,524 910 Subordinated liabilities 30 26,664 28,976
Total liabilities at 31 December 2,434,161 2,480,859 Equity Called up share capital 35 9,609 9,415 Share premium account 11,918 11,135 Other equity instruments 11,532 5,851 Other reserves 20,244 26,742 Retained earnings 137,144 128,728
Total shareholders’ equity 190,447 181,871 Non-controlling interests 34 9,531 8,588
Total equity at 31 December 199,978 190,459
Total liabilities and equity at 31 December 2,634,139 2,671,318
The accompanying notes on pages 345 to 457 form an integral part of these financial statements1.
For footnote, see page 344.
D J Flint, Group Chairman

Financial Statements (continued) Consolidated statement of cash flows / Consolidated statement of changes in equity
HSBC HOLDINGS PLC
338
Consolidated statement of cash flows for the year ended 31 December 2014
2014 2013 2012 Notes US$m US$m US$m
Cash flows from operating activities
Profit before tax 18,680 22,565 20,649
Adjustments for: – net gain from investing activities (1,928) (1,458) (2,094)– share of profits in associates and joint ventures (2,532) (2,325) (3,557)– (gain)/loss on disposal of associates, joint ventures, subsidiaries and
businesses 9 (1,173) (7,024)– other non-cash items included in profit before tax 36 11,262 11,995 19,778– change in operating assets 36 25,877 (148,899) (116,521)– change in operating liabilities 36 (93,814) 164,757 89,070– elimination of exchange differences4 24,571 4,479 (3,626)– dividends received from associates 757 694 489– contributions paid to defined benefit plans (681) (962) (733)– tax paid (3,573) (4,696) (5,587)
Net cash generated from/(used in) operating activities (21,372) 44,977 (9,156) Cash flows from investing activities
Purchase of financial investments (384,199) (363,979) (342,974)Proceeds from the sale and maturity of financial investments 382,837 342,539 329,926Purchase of property, plant and equipment (1,477) (1,952) (1,318)Proceeds from the sale of property, plant and equipment 88 441 241Net cash inflow/(outflow) from disposal of customer and loan portfolios (1,035) 6,518 –Net purchase of intangible assets (903) (834) (1,008)Net cash inflow from disposal of US branch network and US cards business – – 20,905Proceeds from disposal of Ping An – 7,413 1,954Net cash inflow/(outflow) from disposal of other subsidiaries, businesses,
associates and joint ventures (242) 3,295 (269)Net cash outflow from acquisition of or increase in stake of associates (30) (26) (1,804)
Net cash generated from/(used in) investing activities (4,961) (6,585) 5,653 Cash flows from financing activities
Issue of ordinary share capital 267 297 594Net sales/(purchases) of own shares for market-making and investment
purposes (96) (32) (25)Issue of other equity instruments 5,681 – –Redemption of preference shares (234) – –Subordinated loan capital issued 3,500 1,989 37Subordinated loan capital repaid (3,163) (1,662) (1,754)Net cash inflow/(outflow) from change in stake in subsidiaries – – (14)Dividends paid to shareholders of the parent company (6,611) (6,414) (5,925)Dividends paid to non-controlling interests (639) (586) (572)Dividends paid to holders of other equity instruments (573) (573) (573)
Net cash used in financing activities (1,868) (6,981) (8,232) Net increase/(decrease) in cash and cash equivalents (28,201) 31,411 (11,735)
Cash and cash equivalents at 1 January 346,281 315,308 325,449Exchange differences in respect of cash and cash equivalents (16,779) (438) 1,594
Cash and cash equivalents at 31 December 36 301,301 346,281 315,308
The accompanying notes on pages 345 to 457 form an integral part of these financial statements1.
For footnote, see page 344.

S
har
eho
lder
Info
rmat
ion
Fin
anci
al S
tate
men
ts
Co
rpo
rate
Go
vern
ance
Fin
anci
al R
evie
w
Str
ateg
ic R
epo
rt
HSBC HOLDINGS PLC
339
Consolidated statement of changes in equity For the year ended 31 December 2014
O
ther
rese
rves
Ca
lled
up
sh
are
ca
pita
l
Shar
e
prem
ium
Oth
er
eq
uity
inst
ru-
m
ents
11 R
etai
ned
ea
rnin
gs5,
6
Avai
labl
e-
for-
sale
fair
valu
e
rese
rve
Ca
sh fl
ow
hedg
ing
re
serv
e
Fo
reig
n
exch
ange
rese
rve
M
erge
r
rese
rve5,
7
Tota
l
shar
e-
hold
ers’
equi
ty
Non
- c
ontr
ollin
g
inte
rest
s
Tota
l
equi
ty
US$
mU
S$m
US$
mU
S$m
US$
mU
S$m
US$
mU
S$m
US$
mU
S$m
US$
m
At 1
Janu
ary
2014
9,41
511
,135
5,85
112
8,72
897
(121
)(5
42)
27,3
0818
1,87
18,
588
190,
459
Prof
it fo
r the
yea
r −
−−
13,6
88−
−−
−13
,688
1,01
714
,705
Oth
er c
ompr
ehen
sive
inco
me
(net
of t
ax)
−−
−2,
066
2,02
518
9(8
,723
)−
(4,4
43)
765
(3,6
78)
– a
vaila
ble-
for-
sale
inve
stm
ents
−
−−
−2,
025
−−
−2,
025
947
2,97
2–
cas
h flo
w h
edge
s −
−−
−−
189
−−
189
(1)
188
– re
mea
sure
men
t of d
efin
ed b
enef
it as
set/
liabi
lity
−
−−
1,98
6−
−−
−1,
986
(1)
1,98
5–
shar
e of
oth
er c
ompr
ehen
sive
inco
me
of
asso
ciat
es a
nd jo
int v
entu
res
−−
−80
−
−−
− 80
−80
– e
xcha
nge
diffe
renc
es
−−
−−
−−
(8,7
23)
−(8
,723
)(1
80)
(8,9
03)
Tota
l com
preh
ensiv
e in
com
e fo
r the
yea
r −
−−
15,7
542,
025
189
(8,7
23)
−9,
245
1,78
211
,027
Shar
es is
sued
und
er e
mpl
oyee
rem
uner
atio
n an
d sh
are
plan
s 60
91
7 −
(710
) −
− −
− 26
7 −
267
Shar
es is
sued
in li
eu o
f div
iden
ds a
nd a
mou
nts
arisi
ng th
ereo
n
134
(134
)−
2,70
9 −
− −
− 2,
709
− 2,
709
Capi
tal s
ecur
ities
issu
ed−
−5,
681
−−
−−
−5,
681
−5,
681
Divi
dend
s to
shar
ehol
ders
8−
−−
(9,8
93)
−−
−−
(9,8
93)
(712
)(1
0,60
5)Co
st o
f sha
re-b
ased
pay
men
t arr
ange
men
ts
−−
−73
2−
−−
−73
2−
732
Oth
er m
ovem
ents
−
−−
(176
)21
(10)
−−
(165
)(1
27)
(292
)
At 3
1 De
cem
ber 2
014
9,60
911
,918
11,5
3213
7,14
42,
143
58(9
,265
)27
,308
190,
447
9,53
119
9,97
8
At 1
Janu
ary
2013
9,23
810
,084
5,85
112
0,34
71,
649
1375
227
,308
175,
242
7,88
718
3,12
9
Prof
it fo
r the
yea
r −
−−
16,2
04−
−−
−16
,204
1,59
617
,800
Oth
er c
ompr
ehen
sive
inco
me
(net
of t
ax)
−−
−(5
61)
(1,5
77)
(128
)(1
,294
)−
(3,5
60)
(187
)(3
,747
)–
ava
ilabl
e-fo
r-sa
le in
vest
men
ts
−−
−−
(1,5
77)
−−
−(1
,577
)(1
41)
(1,7
18)
– c
ash
flow
hed
ges
−−
−−
−(1
28)
−−
(128
)−
(128
)–
rem
easu
rem
ent o
f def
ined
ben
efit
asse
t/lia
bilit
y
−−
−(4
90)
−−
−−
(490
)32
(458
)–
shar
e of
oth
er c
ompr
ehen
sive
inco
me
of
asso
ciat
es a
nd jo
int v
entu
res
−−
−(7
1)
−−
−−
(71)
−(7
1)–
exc
hang
e di
ffere
nces
−
−−
−−
−(1
,294
)−
(1,2
94)
(78)
(1,3
72)
Tota
l com
preh
ensiv
e in
com
e fo
r the
yea
r −
−−
15,6
43(1
,577
)(1
28)
(1,2
94)
−12
,644
1,40
914
,053
Shar
es is
sued
und
er e
mpl
oyee
rem
uner
atio
n an
d sh
are
plan
s 60
1,
168
− (9
31)
− −
− −
297
− 29
7 Sh
ares
issu
ed in
lieu
of d
ivid
ends
and
am
ount
s ar
ising
ther
eon
11
7 (1
17)
− 2,
523
− −
− −
2,52
3 −
2,52
3 Di
vide
nds t
o sh
areh
olde
rs8
−−
−(9
,510
)−
−−
−(9
,510
)(7
18)
(10,
228)
Cost
of s
hare
-bas
ed p
aym
ent a
rran
gem
ents
−
−−
630
−−
−−
630
−63
0O
ther
mov
emen
ts
−−
−26
25(6
)−
−45
1055
At 3
1 De
cem
ber 2
013
9,41
511
,135
5,85
112
8,72
897
(121
)(5
42)
27,3
0818
1,87
18,
588
190,
459

Financial Statements (continued) Consolidated statement of changes in equity / HSBC Holdings balance sheet
HSBC HOLDINGS PLC
340
O
ther
rese
rves
Ca
lled
up
sh
are
ca
pita
l
Shar
e
prem
ium
Oth
er
eq
uity
inst
ru-
m
ents
Reta
ined
earn
ings
5,6
Avai
labl
e-
fo
r-sa
le
fa
ir va
lue
re
serv
e
Cash
flow
he
dgin
g
rese
rve
Fo
reig
n
exch
ange
rese
rve
M
erge
r
rese
rve5,
7
Tota
l
shar
e-
hold
ers’
equi
ty
Non
-
cont
rolli
ng
inte
rest
s
Tota
l
equi
ty
US$
mU
S$m
US$
mU
S$m
US$
m
US$
mU
S$m
US$
mU
S$m
US$
mU
S$m
At 1
Janu
ary
2012
8,93
48,
457
5,85
111
1,86
8 (3
,361
) (9
5)(2
37)
27,3
0815
8,72
5 7,
368
166,
093
Prof
it fo
r the
yea
r –
––
14,0
27
– –
––
14,0
27
1,30
7 15
,334
O
ther
com
preh
ensiv
e in
com
e (n
et o
f tax
) –
––
321
5,01
0
108
989
–6,
428
106
6,53
4 –
ava
ilabl
e-fo
r-sa
le in
vest
men
ts
––
––
5,01
0
––
–5,
010
60
5,07
0 –
cas
h flo
w h
edge
s –
––
––
108
––
108
1 10
9 –
rem
easu
rem
ent o
f def
ined
ben
efit
asse
t/lia
bilit
y
––
–(2
12)
– –
––
(212
)17
(1
95)
– sh
are
of o
ther
com
preh
ensiv
e in
com
e of
ass
ocia
tes
and
join
t ven
ture
s –
––
533
– –
––
533
–53
3–
exc
hang
e di
ffere
nces
–
––
––
–98
9 –
989
28
1,01
7
Tota
l com
preh
ensiv
e in
com
e fo
r the
yea
r –
––
14,3
48
5,01
0
108
989
–20
,455
1,
413
21,8
68
Shar
es is
sued
und
er e
mpl
oyee
rem
uner
atio
n an
d
shar
e pl
ans
119
1,81
2 –
(1,3
37)
– –
– –
594
– 59
4 Sh
ares
issu
ed in
lieu
of d
ivid
ends
and
am
ount
s aris
ing
ther
eon
18
5 (1
85)
– 2,
429
–
– –
– 2,
429
– 2,
429
Divi
dend
s to
shar
ehol
ders
8–
––
(8,0
42)
– –
––
(8,0
42)
(707
)(8
,749
)Co
st o
f sha
re-b
ased
pay
men
t arr
ange
men
ts
––
–98
8 –
––
–98
8 –
988
Oth
er m
ovem
ents
–
––
93–
––
–93
(187
)(9
4)
At 3
1 De
cem
ber 2
012
9,23
8 10
,084
5,
851
120,
347
1,64
9
13
752
27,3
08
175,
242
7,88
7 18
3,12
9
The
acco
mpa
nyin
g no
tes o
n pa
ges 3
45 to
457
form
an
inte
gral
par
t of t
hese
fina
ncia
l sta
tem
ents
1 .
For f
ootn
ote,
see
page
344
.

HSBC HOLDINGS PLC
341
Str
ateg
ic R
epo
rt
Fi
nan
cial
Rev
iew
Co
rpo
rate
Go
vern
ance
Fin
anci
al S
tate
men
ts
S
har
eho
lder
Info
rmat
ion
HSBC Holdings balance sheet at 31 December 2014
2014 2013 Notes US$m US$mAssets
Cash at bank and in hand: – balances with HSBC undertakings 249 407
Derivatives 16 2,771 2,789 Loans and advances to HSBC undertakings 43,910 53,344 Financial investments in HSBC undertakings 4,073 1,210 Prepayments, accrued income and other assets 125 133Current tax assets 472 245 Investments in subsidiaries 22 96,264 92,695 Deferred tax assets 8 – 13
Total assets at 31 December 147,864 150,836 Liabilities and equity
Liabilities Amounts owed to HSBC undertakings 2,892 11,685 Financial liabilities designated at fair value 25 18,679 21,027 Derivatives 16 1,169 704 Debt securities in issue 26 1,009 2,791 Accruals, deferred income and other liabilities 1,398 1,327 Current tax liabilities – 48 Deferred tax liabilities 8 17 –Subordinated liabilities 30 17,255 14,167
Total liabilities 42,419 51,749
Equity Called up share capital 35 9,609 9,415 Share premium account 11,918 11,135 Other equity instruments 11,476 5,828 Other reserves 37,456 37,303 Retained earnings 34,986 35,406
Total equity 105,445 99,087
Total liabilities and equity at 31 December 147,864 150,836
The accompanying notes on pages 345 to 457 form an integral part of these financial statements1.
For footnote, see page 344.
D J Flint, Group Chairman

Financial Statements (continued) HSBC Holdings statement of cash flows / statement of changes in equity
HSBC HOLDINGS PLC
342
HSBC Holdings statement of cash flows for the year ended 31 December 2014
2014 2013 Notes US$m US$mCash flows from operating activities Profit before tax 6,228 17,725
Adjustments for: – non-cash items included in profit before tax 36 52 74 – change in operating assets 36 1,854 (10,795)– change in operating liabilities 36 (9,914) (1,061)– tax received 133 156
Net cash generated from/(used in) operating activities (1,647) 6,099 Cash flows from investing activities Net cash outflow from acquisition of or increase in stake of subsidiaries (1,603) (665)Repayment of capital from subsidiaries 3,505 –
Net cash used in investing activities 1,902 (665) Cash flows from financing activities Issue of ordinary share capital 924 1,192 Issue of other equity instruments 5,635 –Sales of own shares to meet share awards and share option awards – 44 Subordinated loan capital issued 3,500 1,989 Subordinated loan capital repaid (1,654) (1,618)Debt securities repaid (1,634) –Dividends paid on ordinary shares (6,611) (6,414)Dividends paid to holders of other equity instruments (573) (573)
Net cash generated from/(used in) financing activities (413) (5,380) Net increase in cash and cash equivalents (158) 54
Cash and cash equivalents at 1 January 407 353
Cash and cash equivalents at 31 December 36 249 407
The accompanying notes on pages 345 to 457 form an integral part of these financial statements1.
For footnote, see page 344.
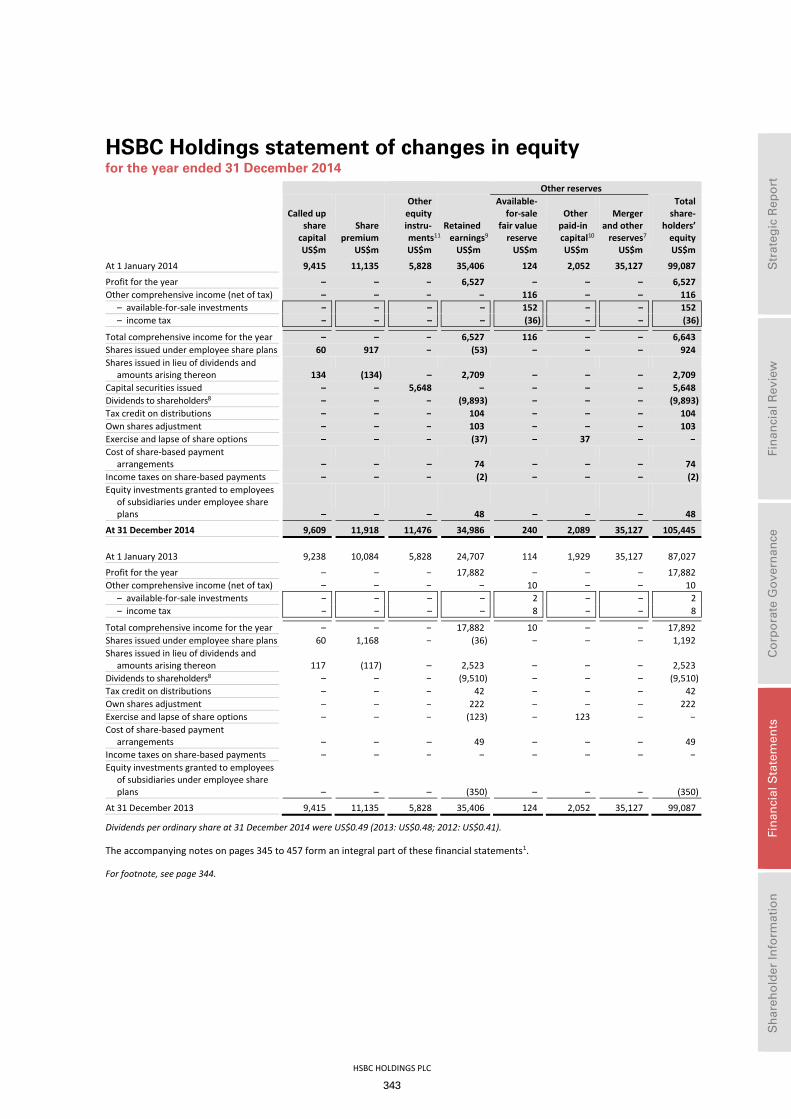
HSBC HOLDINGS PLC
343
Str
ateg
ic R
epo
rt
Fi
nan
cial
Rev
iew
Co
rpo
rate
Go
vern
ance
Fin
anci
al S
tate
men
ts
S
har
eho
lder
Info
rmat
ion
HSBC Holdings statement of changes in equity for the year ended 31 December 2014
Other reserves Called up share capital
Share premium
Other equity instru- ments1
Retained 1 earnings9
Available- for-sale fair value reserve
Other paid-in capital10
Merger and other reserves7
Total share- holders’ equity
US$m US$m US$m US$m US$m US$m US$m US$m
At 1 January 2014 9,415 11,135 5,828 35,406 124 2,052 35,127 99,087
Profit for the year – – – 6,527 – – – 6,527Other comprehensive income (net of tax) – – – – 116 – – 116
– available-for-sale investments – – – – 152 – – 152– income tax – – – – (36) – – (36)
Total comprehensive income for the year – – – 6,527 116 – – 6,643Shares issued under employee share plans 60 917 – (53) – – – 924Shares issued in lieu of dividends and
amounts arising thereon 134 (134) – 2,709 – – – 2,709 Capital securities issued – – 5,648 – – – – 5,648Dividends to shareholders8 – – – (9,893) – – – (9,893)Tax credit on distributions – – – 104 – – – 104Own shares adjustment – – – 103 – – – 103Exercise and lapse of share options – – – (37) – 37 – –Cost of share-based payment
arrangements – – – 74 – – – 74 Income taxes on share-based payments – – – (2) – – – (2)Equity investments granted to employees
of subsidiaries under employee share plans – – – 48 – – – 48
At 31 December 2014 9,609 11,918 11,476 34,986 240 2,089 35,127 105,445
At 1 January 2013 9,238 10,084 5,828 24,707 114 1,929 35,127 87,027
Profit for the year – – – 17,882 – – – 17,882Other comprehensive income (net of tax) – – – – 10 – – 10
– available-for-sale investments – – – – 2 – – 2– income tax – – – – 8 – – 8
Total comprehensive income for the year – – – 17,882 10 – – 17,892Shares issued under employee share plans 60 1,168 – (36) – – – 1,192Shares issued in lieu of dividends and
amounts arising thereon 117 (117) – 2,523 – – – 2,523 Dividends to shareholders8 – – – (9,510) – – – (9,510)Tax credit on distributions – – – 42 – – – 42Own shares adjustment – – – 222 – – – 222Exercise and lapse of share options – – – (123) – 123 – –Cost of share-based payment
arrangements – – – 49 – – – 49 Income taxes on share-based payments – – – – – – – –Equity investments granted to employees
of subsidiaries under employee share plans – – – (350) – – – (350)
At 31 December 2013 9,415 11,135 5,828 35,406 124 2,052 35,127 99,087
Dividends per ordinary share at 31 December 2014 were US$0.49 (2013: US$0.48; 2012: US$0.41).
The accompanying notes on pages 345 to 457 form an integral part of these financial statements1.
For footnote, see page 344.

Financial Statements (continued) Footnotes
HSBC HOLDINGS PLC
344
Footnotes to the Financial Statements
1 The audited sections of ‘Risk’ on pages 111 to 237 and the audited sections of ‘Capital’ on pages 238 to 262 are also an integral part of these financial statements.
2 Available-for-sale investments include nil in respect of the investment in Ping An classified as ‘Assets held for sale’ (2013: nil; 2012: US$: 737m).
3 From 1 January 2014, non-trading reverse repos and repos are presented as separate lines in the balance sheet. Previously, non-trading reverse repos were included within ‘Loans and advances to banks’ and ‘Loans and advances to customers’ and non-trading repos were included within ‘Deposits by banks’ and ‘Customer accounts’. Comparative data have been re-presented accordingly. Non-trading reverse repos and repos have been presented as separate lines in the balance sheet to align disclosure with market practice and provide more meaninful information in relation to loans and advances. The extent to which reverse repos and repos represent loans to/from customers and banks is set out in Note 17 on the Financial Statements.
4 Adjustment to bring changes between opening and closing balance sheet amounts to average rates. This is not done on a line-by-line basis, as details cannot be determined without unreasonable expense.
5 Cumulative goodwill amounting to US$5,138m has been charged against reserves in respect of acquisitions of subsidiaries prior to 1 January 1998, including US$3,469m charged against the merger reserve arising on the acquisition of HSBC Bank plc. The balance of US$1,669m has been charged against retained earnings.
6 Retained earnings include 85,337,430 (US$641m) of own shares held within HSBC’s Insurance business, retirement funds for the benefit of policyholders or beneficiaries within employee trusts for the settlement of shares expected to be delivered under employee share schemes or bonus plans, and the market-making activities in Global Markets (2013: 85,997,271 (US$915m); 2012: 86,394,826 (US$874m)).
7 Statutory share premium relief under Section 131 of the Companies Act 1985 (the ‘Act’) was taken in respect of the acquisition of HSBC Bank plc in 1992, HSBC France in 2000 and HSBC Finance Corporation in 2003 and the shares issued were recorded at their nominal value only. In HSBC’s consolidated financial statements the fair value differences of US$8,290m in respect of HSBC France and US$12,768m in respect of HSBC Finance Corporation were recognised in the merger reserve. The merger reserve created on the acquisition of HSBC Finance Corporation subsequently became attached to HSBC Overseas Holdings (UK) Limited (‘HOHU’), following a number of intra-group reorganisations. During 2009, pursuant to Section 131 of the Companies Act 1985, statutory share premium relief was taken in respect of the rights issue and US$15,796m was recognised in the merger reserve. The merger reserve includes the deduction of US$614m in respect of costs relating to the rights issue, of which US$149m was subsequently transferred to the income statement. Of this US$149m, US$121m was a loss arising from accounting for the agreement with the underwriters as a contingent forward contract. The merger reserve excludes the loss of US$344m on a forward foreign exchange contract associated with hedging the proceeds of the rights issue.
8 Including distributions paid on preference shares and capital securities classified as equity under IFRSs. 9 Retained earnings include 179,419 (US$3m) (2013: 330,030 (US$5m)) of own shares held to fund employee share plans. 10 Other paid-in capital arises from the exercise and lapse of share options granted to employees of HSBC Holdings subsidiaries. 11 During September 2014, HSBC Holdings issued US$2,250m, US$1,500m and €1,500m of Perpetual Subordinated Contingent
Convertible Capital Securities, on which there were US$13m of external issuance costs and US$33m of intra-group issuance costs which are classified as equity under IFRSs.

Notes on the Financial Statements 1 – Basis of preparation
HSBC HOLDINGS PLC
345
Str
ateg
ic R
epo
rt
Fi
nan
cial
Rev
iew
Co
rpo
rate
Go
vern
ance
Fin
anci
al S
tate
men
ts
S
har
eho
lder
Info
rmat
ion
1 Basis of preparation and significant accounting policies
(a) Compliance with International Financial Reporting Standards
International Financial Reporting Standards (‘IFRSs’) comprise accounting standards issued or adopted by the International Accounting Standards Board (‘IASB’) and interpretations issued or adopted by the IFRS Interpretations Committee (‘IFRS IC’).
The consolidated financial statements of HSBC and the separate financial statements of HSBC Holdings have been prepared in accordance with IFRSs as issued by the IASB and as endorsed by the EU. EU-endorsed IFRSs could differ from IFRSs as issued by the IASB if, at any point in time, new or amended IFRSs were not to be endorsed by the EU.
At 31 December 2014, there were no unendorsed standards effective for the year ended 31 December 2014 affecting these consolidated and separate financial statements, and there was no difference between IFRSs endorsed by the EU and IFRSs issued by the IASB in terms of their application to HSBC. Accordingly, HSBC’s financial statements for the year ended 31 December 2014 are prepared in accordance with IFRSs as issued by the IASB.
Standards adopted during the year ended 31 December 2014
There were no new standards applied during the year ended 31 December 2014.
On 1 January 2014, HSBC applied ‘Offsetting Financial Assets and Financial Liabilities (Amendments to IAS 32)’, which clarified the requirements for offsetting financial instruments and addressed inconsistencies in current practice when applying the offsetting criteria in IAS 32 ‘Financial Instruments: Presentation’. The amendments were applied retrospectively and did not have a material effect on HSBC’s financial statements.
During 2014, HSBC adopted a number of interpretations and amendments to standards which had an insignificant effect on the consolidated financial statements of HSBC and the separate financial statements of HSBC Holdings.
(b) Differences between IFRSs and Hong Kong Financial Reporting Standards
There are no significant differences between IFRSs and Hong Kong Financial Reporting Standards in terms of their application to HSBC and consequently there would be no significant differences had the financial statements been prepared in accordance with Hong Kong Financial Reporting Standards. The Notes on the Financial Statements, taken together with the Report of the Directors, include the aggregate of all disclosures necessary to satisfy IFRSs and Hong Kong reporting requirements.
(c) Future accounting developments
In addition to the projects to complete financial instrument accounting, discussed below, the IASB is working on projects on insurance and lease accounting which could represent significant changes to accounting requirements in the future.
Standards and amendments issued by the IASB and endorsed by the EU but effective after 31 December 2014
During 2014, the EU endorsed the amendments issued by IASB through the Annual Improvements to IFRSs 2010-2012 Cycle and the 2011-2013 Cycle, and a narrow-scope amendment to IAS 19 ‘Employee Benefits’. HSBC has not early applied any of the amendments effective after 31 December 2014 and it expects they will have an immaterial effect, when applied, on the consolidated financial statements of HSBC and the separate financial statements of HSBC Holdings.
Standards and amendments issued by the IASB but not endorsed by the EU
In May 2014, the IASB issued IFRS 15 ‘Revenue from Contracts with Customers’. The standard is effective for annual periods beginning on or after 1 January 2017 with early application permitted. IFRS 15 provides a principles-based approach for revenue recognition, and introduces the concept of recognising revenue for obligations as they are satisfied. The standard should be applied retrospectively, with certain practical expedients available. HSBC is currently assessing the impact of this standard but it is not practicable to quantify the effect as at the date of the publication of these financial statements.
In July 2014, the IASB issued IFRS 9 ‘Financial Instruments’, which is the comprehensive standard to replace IAS 39 ‘Financial Instruments: Recognition and Measurement’, and includes requirements for classification and measurement of financial assets and liabilities, impairment of financial assets and hedge accounting.
Classification and measurement
The classification and measurement of financial assets will depend on the entity’s business model for their management and their contractual cash flow characteristics and result in financial assets being measured at amortised cost, fair value through other comprehensive income (‘FVOCI’) or fair value through profit or loss. In many instances, the classification and measurement outcomes will be similar to IAS 39, although differences will arise, for

Notes on the Financial Statements (continued) 1 – Basis of preparation
HSBC HOLDINGS PLC
346
example, since IFRS 9 does not apply embedded derivative accounting to financial assets, and equity securities will be measured at fair value through profit or loss or, in limited circumstances, at fair value through other comprehensive income. The combined effect of the application of the business model and the contractual cash flow characteristics tests may result in some differences in the population of financial assets measured at amortised cost or fair value compared with IAS 39. The classification of financial liabilities is essentially unchanged, except that, for certain liabilities measured at fair value, gains or losses relating to changes in the entity’s own credit risk are to be included in other comprehensive income.
Impairment
The impairment requirements apply to financial assets measured at amortised cost and FVOCI, and lease receivables and certain loan commitments and financial guarantee contracts. At initial recognition, allowance (or provision in the case of commitments and guarantees) is required for expected credit losses (‘ECL’) resulting from default events that are possible within the next 12 months (‘12 month ECL’). In the event of a significant increase in credit risk, allowance (or provision) is required for ECL resulting from all possible default events over the expected life of the financial instrument (‘lifetime ECL’).
The assessment of whether credit risk has increased significantly since initial recognition is performed for each reporting period by considering the change in the risk of default occurring over the remaining life of the financial instrument, rather than by considering an increase in ECL.
The assessment of credit risk, and the estimation of ECL, are required to be unbiased and probability-weighted, and should incorporate all available information which is relevant to the assessment, including information about past events, current conditions and reasonable and supportable forecasts of future events and economic conditions at the reporting date. In addition, the estimation of ECL should take into account the time value of money. As a result, the recognition and measurement of impairment is intended to be more forward-looking than under IAS 39 and the resulting impairment charge will tend to be more volatile. It will also tend to result in an increase in the total level of impairment allowances, since all financial assets will be assessed for at least 12-month ECL and the population of financial assets to which lifetime ECL applies is likely to be larger than the population for which there is objective evidence of impairment in accordance with IAS 39.
Hedge accounting
The general hedge accounting requirements aim to simplify hedge accounting, creating a stronger link with risk management strategy and permitting hedge accounting to be applied to a greater variety of hedging instruments and risks. The standard does not explicitly address macro hedge accounting strategies, which are being considered in a separate project. To remove the risk of any conflict between existing macro hedge accounting practice and the new general hedge accounting requirements, IFRS 9 includes an accounting policy choice to remain with IAS 39 hedge accounting.
Transition
The classification and measurement and impairment requirements are applied retrospectively by adjusting the opening balance sheet at the date of initial application, with no requirement to restate comparative periods. Hedge accounting is generally applied prospectively from that date.
The mandatory application date for the standard as a whole is 1 January 2018, but it is possible to apply the revised presentation for certain liabilities measured at fair value from an earlier date. HSBC intends to revise the presentation of fair value gains and losses relating to the entity’s own credit risk on certain liabilities as soon as permitted by EU law. If this presentation was applied at 31 December 2014, the effect would be to increase profit before tax with the opposite effect on other comprehensive income based on the change in fair value attributable to changes in HSBC’s credit risk for the year, with no effect on net assets. Further information on change in fair value attributable to changes in credit risk, including HSBC’s credit risk, is disclosed in Note 25.
HSBC is assessing the impact that the rest of IFRS 9 will have on the financial statements through a Group-wide project which has been in place since 2012, but due to the complexity of the classification and measurement, impairment, and hedge accounting requirements and their inter-relationships, it is not possible at this stage to quantify the potential effect.
(d) Changes to the presentation of the Financial Statements and Notes on the Financial Statements
In order to make the financial statements and notes thereon easier to understand, HSBC has changed the location and the wording used to describe certain accounting policies within the notes, removed certain immaterial disclosures and changed the order of certain sections. In applying materiality to financial statement disclosures, we consider both the amount and nature of each item. The main changes to the presentation of the financial statements and notes thereon in 2014 are as follows:

HSBC HOLDINGS PLC
347
Str
ateg
ic R
epo
rt
Fi
nan
cial
Rev
iew
Co
rpo
rate
Go
vern
ance
Fin
anci
al S
tate
men
ts
S
har
eho
lder
Info
rmat
ion
• Consolidated balance sheet and Consolidated statement of changes in equity: rationalised certain line items disclosure to focus on material information.
• Credit risk: changed the order and presentation of certain disclosures to remove duplication and focus on material information.
• In 2013, the financial statements included Note 2 ‘Summary of significant accounting policies’. In 2014, the accounting policies have been placed, whenever possible, within the relevant Notes on the Financial Statements, and the changes in wording are intended to more clearly set out the accounting policies. These changes in the wording do not represent changes in accounting policies.
• Critical accounting policies: replaced ‘Critical accounting policies’ with ‘Critical accounting estimates and judgements’ and placed them within the relevant notes alongside the significant accounting policy to which they relate. The new approach meets the reporting requirements of IAS 1 ‘Presentation of Financial Statements’ and of the US Securities and Exchange Commission.
• Note 6 ‘Employee compensation and benefits’: rationalised to remove duplication and focus on material information.
• Note 38 ‘Lease commitments’: rationalised to focus on material information. • In 2013, the financial statements included Note 13 Analysis of financial assets and liabilities by measurement basis
and Note 23 ‘Property, Plant and equipment’. In 2014, separate notes for these areas have been removed and relevant information incorporated into other notes.
• In 2013, the financial statements included Note 20 ‘Transfers of financial assets’ and Note 36 Assets charged as security for liabilities and collateral accepted as security for assets. In 2014, the relevant information for these areas has been included in a single Note 19 ‘Assets charged as security for liabilities, assets transferred and collateral accepted as security for assets’.
From 1 January 2014, HSBC has chosen to present non-trading reverse repos and repos separately on the face of the balance sheet. These items are classified for accounting purposes as loans and receivables or financial liabilities measured at amortised cost. Previously, they were presented on an aggregate basis together with other loans or deposits measured at amortised cost under the following headings in the consolidated balance sheet: ‘Loans and advances to banks’, ‘Loans and advances to customers’, ‘Deposits by banks’ and ‘Customer accounts’. The separate presentation aligns disclosure of reverse repos and repos with market practice and provides more meaningful information in relation to loans and advances. Further explanation is provided in Note 17.
From 1 January 2014, the geographical region ‘Asia’ replaced the geographical regions previously reported as ‘Hong Kong’ and ‘Rest of Asia-Pacific’. This better aligns with internal information used to manage the business. Comparative data have been re-presented. Further explanation is provided in Note 11.
(e) Presentation of information
Disclosures under IFRS 4 ‘Insurance Contracts’ and IFRS 7 ‘Financial Instruments: Disclosures’ concerning the nature and extent of risks relating to insurance contracts and financial instruments have been included in the audited sections of the ‘Report of the Directors: Risk’ on pages 111 to 237.
Capital disclosures under IAS 1 ‘Presentation of Financial Statements’ have been included in the audited sections of ‘Report of the Directors: Capital’ on pages 238 to 262.
Disclosures relating to HSBC’s securitisation activities and structured products have been included in the audited section of ‘Report of the Directors: Risk’ on pages 111 to 237.
In accordance with HSBC’s policy to provide disclosures that help investors and other stakeholders understand the Group’s performance, financial position and changes thereto, the information provided in the Notes on the Financial Statements and the Report of the Directors goes beyond the minimum levels required by accounting standards, statutory and regulatory requirements and listing rules. In particular, HSBC provides additional disclosures having regard to the recommendations of the Enhanced Disclosures Task Force (‘EDTF’) report ‘Enhancing the Risk Disclosures of Banks’ issued in October 2012. The report aims to help financial institutions identify areas that investors had highlighted needed better and more transparent information about banks’ risks, and how these risks relate to performance measurement and reporting. In addition, HSBC follows the British Bankers’ Association Code for Financial Reporting Disclosure (‘the BBA Code’). The BBA Code aims to increase the quality and comparability of UK banks’ disclosures and sets out five disclosure principles together with supporting guidance. In line with the principles of the BBA Code, HSBC assesses good practice recommendations issued from time to time by relevant regulators and standard setters and will assess the applicability and relevance of such guidance, enhancing disclosures where appropriate.
In publishing the parent company financial statements together with the Group financial statements, HSBC Holdings has taken advantage of the exemption in section 408(3) of the Companies Act 2006 not to present its individual income statement and related notes.

Notes on the Financial Statements (continued) 1 – Basis of preparation
HSBC HOLDINGS PLC
348
HSBC’s consolidated financial statements are presented in US dollars because the US dollar and currencies linked to it form the major currency bloc in which HSBC transacts and funds its business. The US dollar is also HSBC Holdings’ functional currency because the US dollar and currencies linked to it are the most significant currencies relevant to the underlying transactions, events and conditions of its subsidiaries, as well as representing a significant proportion of its funds generated from financing activities.
(f) Critical accounting estimates and judgements
The preparation of financial information requires the use of estimates and judgements about future conditions. In view of the inherent uncertainties and the high level of subjectivity involved in the recognition or measurement of items listed below, it is possible that the outcomes in the next financial year could differ from those on which management’s estimates are based, resulting in materially different conclusions from those reached by management for the purposes of the 2014 Financial Statements. Management’s selection of HSBC’s accounting policies which contain critical estimates and judgements is listed below; it reflects the materiality of the items to which the policies are applied and the high degree of judgement and estimation uncertainty involved:
• Impairment of loans and advances: Note 1(k);
• Deferred tax assets: Note 8;
• Valuation of financial instruments: Note 13;
• Impairment of interests in associates: Note 20;
• Goodwill impairment: Note 21;
• Provisions: Note 29.
(g) Going concern
The financial statements are prepared on a going concern basis, as the Directors are satisfied that the Group and parent company have the resources to continue in business for the foreseeable future. In making this assessment, the Directors have considered a wide range of information relating to present and future conditions, including future projections of profitability, cash flows and capital resources.
(h) Consolidation and related disclosures
HSBC controls and consequently consolidates an entity when it is exposed, or has rights, to variable returns from its involvement with the entity and has the ability to affect those returns through its power over the entity. Control is initially assessed based on consideration of all facts and circumstances, and is subsequently reassessed when there are significant changes to the initial setup.
Where an entity is governed by voting rights, HSBC would consolidate when it holds, directly or indirectly, the necessary voting rights to pass resolutions by the governing body. In all other cases, the assessment of control is more complex and requires judgement of other factors, including having exposure to variability of returns, power over the relevant activities or holding the power as agent or principal.
Business combinations are accounted for using the acquisition method. The cost of an acquisition is measured at the fair value of the consideration, including contingent consideration, given at the date of exchange. Acquisition-related costs are recognised as an expense in the income statement in the period in which they are incurred. The acquired identifiable assets, liabilities and contingent liabilities are generally measured at their fair values at the date of acquisition. Goodwill is measured as the excess of the aggregate of the consideration transferred, the amount of non-controlling interest and the fair value of HSBC’s previously held equity interest, if any, over the net of the amounts of the identifiable assets acquired and the liabilities assumed. The amount of non-controlling interest is measured either at fair value or at the non-controlling interest’s proportionate share of the acquiree’s identifiable net assets. For acquisitions achieved in stages, the previously held equity interest is remeasured at the acquisition-date fair value with the resulting gain or loss recognised in the income statement.
All intra-HSBC transactions are eliminated on consolidation.
The consolidated financial statements of HSBC also include the attributable share of the results and reserves of joint ventures and associates, based on either financial statements made up to 31 December or pro-rated amounts adjusted for any material transactions or events occurred between the date of financial statements available and 31 December.
(i) Foreign currencies
Transactions in foreign currencies are recorded in the functional currency at the rate of exchange prevailing on the date of the transaction. Monetary assets and liabilities denominated in foreign currencies are translated into the functional currency at the rate of exchange at the balance sheet date. Any resulting exchange differences are included in the income statement. Non-monetary assets and liabilities that are measured at historical cost in a foreign

HSBC HOLDINGS PLC
349
Str
ateg
ic R
epo
rt
Fi
nan
cial
Rev
iew
Co
rpo
rate
Go
vern
ance
Fin
anci
al S
tate
men
ts
S
har
eho
lder
Info
rmat
ion
currency are translated into the functional currency using the rate of exchange at the date of the initial transaction. Non-monetary assets and liabilities measured at fair value in a foreign currency are translated into the functional currency using the rate of exchange at the date the fair value was determined. Any foreign exchange component of a gain or loss on a non-monetary item is recognised either in other comprehensive income or in the income statement depending where the gain or loss on the underlying non-monetary item is recognised.
In the consolidated financial statements, the assets and liabilities of branches, subsidiaries, joint ventures and associates whose functional currency is not US dollars, are translated into the Group’s presentation currency at the rate of exchange at the balance sheet date, while their results are translated into US dollars at the average rates of exchange for the reporting period. Exchange differences arising from the retranslation of opening foreign currency net assets, and the retranslation of the results for the reporting period from the average rate to the exchange rate at the period end, are recognised in other comprehensive income. Exchange differences on a monetary item that is part of a net investment in a foreign operation are recognised in the income statement of the separate financial statements and in other comprehensive income in consolidated financial statements. On disposal of a foreign operation, exchange differences previously recognised in other comprehensive income are reclassified to the income statement as a reclassification adjustment.
(j) Loans and advances to banks and customers
These include loans and advances originated by HSBC, not classified as held for trading or designated at fair value. They are recognised when cash is advanced to a borrower and are derecognised when either the borrower repays its obligations, or the loans are sold, or substantially all the risks and rewards of ownership are transferred. They are initially recorded at fair value plus any directly attributable transaction costs and are subsequently measured at amortised cost using the effective interest method, less impairment allowance.
Loans and advances are reclassified to ‘Assets held for sale’ when they meet the criteria presented in Note 23; however, their measurement continues to be in accordance with this policy.
HSBC may commit to underwrite loans on fixed contractual terms for specified periods of time. Where the loan arising from the lending commitment is expected to be held for trading, the commitment to lend is recorded as a derivative. On drawdown, the loan is classified as held for trading. Where HSBC intends to hold the loan, a provision on the loan commitment is only recorded where it is probable that HSBC will incur a loss. On inception of the loan, the loan to be held is recorded at its fair value and subsequently measured at amortised cost. For certain transactions, such as leveraged finance and syndicated lending activities, the cash advanced may not be the best evidence of the fair value of the loan. For these loans, where the initial fair value is lower than the cash amount advanced, the difference is charged to the income statement in other operating income. The write-down will be recovered over the life of the loan, through the recognition of interest income, unless the loan becomes impaired.
(k) Impairment of loans and advances and available-for-sale financial assets
Critical accounting estimates and judgements
Impairment of loans and advances Loan impairment allowances represent management’s best estimate of losses incurred in the loan portfolios at the balance sheet date. Management is required to exercise judgement in making assumptions and estimates when calculating loan impairment allowances on both individually and collectively assessed loans and advances. The largest concentration of collectively assessed loan impairment allowances are in North America, where they were US$2.4bn, representing 38% (2013: US$3.8bn; 47%) of the Group’s total collectively assessed loan impairment allowances and 19% (2013:25%) of the Group’s total impairment allowances. Of the North American collective impairment allowances approximately 71% (2013: 79%) related to the US CML portfolio. Collective impairment allowances are subject to estimation uncertainty, in part because it is not practicable to identify losses on an individual loan basis due to the large number of individually insignificant loans in the portfolio. The estimation methods include the use of statistical analyses of historical information, supplemented with significant management judgement, to assess whether current economic and credit conditions are such that the actual level of incurred losses is likely to be greater or less than historical experience. Where changes in economic, regulatory or behavioural conditions result in the most recent trends in portfolio risk factors being not fully reflected in the statistical models, risk factors are taken into account by adjusting the impairment allowances derived solely from historical loss experience. Risk factors include loan portfolio growth, product mix, unemployment rates, bankruptcy trends, geographical concentrations, loan product features, economic conditions such as national and local trends in housing markets, the level of interest rates, portfolio seasoning, account management policies and practices, changes in laws and regulations, and other influences on customer payment patterns. Different factors are applied in different regions and countries to reflect local economic conditions, laws and regulations. The methodology and the assumptions used in calculating impairment losses are reviewed regularly in the light of differences between loss estimates and actual loss experience. For example, roll rates, loss rates and the expected timing of future recoveries are regularly benchmarked against actual outcomes to ensure they remain appropriate. For individually assessed loans, judgement is required in determining whether there is objective evidence that a loss event has occurred and, if so, the measurement of the impairment allowance. In determining whether there is objective evidence that a

Notes on the Financial Statements (continued) 1 – Basis of preparation
HSBC HOLDINGS PLC
350
loss event has occurred, judgement is exercised in evaluating all relevant information on indicators of impairment, including the consideration of whether payments are contractually past-due and the consideration of other factors indicating deterioration in the financial condition and outlook of borrowers affecting their ability to pay. A higher level of judgement is required for loans to borrowers showing signs of financial difficulty in market sectors experiencing economic stress, particularly where the likelihood of repayment is affected by the prospects for refinancing or the sale of a specified asset. For those loans where objective evidence of impairment exists, management determine the size of the allowance required based on a range of factors such as the realisable value of security, the likely dividend available on liquidation or bankruptcy, the viability of the customer’s business model and the capacity to trade successfully out of financial difficulties and generate sufficient cash flow to service debt obligations. HSBC might provide loan forbearance to borrowers experiencing financial difficulties by agreeing to modify the contractual payment terms of loans in order to improve the management of customer relationships, maximise collection opportunities or avoid default or repossession. Where forbearance activities are significant, higher levels of judgement and estimation uncertainty are involved in determining their effects on loan impairment allowances. Judgements are involved in differentiating the credit risk characteristics of forbearance cases, including those which return to performing status following renegotiation. Where collectively assessed loan portfolios include significant levels of loan forbearance, portfolios are segmented to reflect their specific credit risk characteristics, and estimates are made of the incurred losses inherent within each forbearance portfolio segment. Forbearance activities take place in both retail and wholesale loan portfolios, but our largest concentration is in the US, in HSBC Finance’s CML portfolio. The exercise of judgement requires the use of assumptions which are highly subjective and very sensitive to the risk factors, in particular to changes in economic and credit conditions across a large number of geographical areas. Many of the factors have a high degree of interdependency and there is no single factor to which our loan impairment allowances as a whole are sensitive, though they are particularly sensitive to general economic and credit conditions in North America. For example, a 10% increase in impairment allowances on collectively assessed loans and advances in North America would have increased loan impairment allowances by US$0.2bn at 31 December 2014 (2013: US$0.4bn).
Impairment of loans and advances
Losses for impaired loans are recognised when there is objective evidence that impairment of a loan or portfolio of loans has occurred. Impairment allowances that are calculated on individual loans or on groups of loans assessed collectively, are recorded as charges to the income statement and are recorded against the carrying amount of impaired loans on the balance sheet. Losses which may arise from future events are not recognised.
Individually assessed loans and advances
The factors considered in determining whether a loan is individually significant for the purposes of assessing impairment include the size of the loan, the number of loans in the portfolio, and the importance of the individual loan relationship, and how this is managed. Loans that meet these criteria will be individually assessed for impairment, except when volumes of defaults and losses are sufficient to justify treatment under a collective assessment methodology (see below).
Loans considered as individually significant are typically to corporate and commercial customers, are for larger amounts and are managed on an individual basis. For these loans, HSBC considers on a case-by-case basis at each balance sheet date whether there is any objective evidence that a loan is impaired. The criteria used to make this assessment include:
– known cash flow difficulties experienced by the borrower; – contractual payments of either principal or interest being past due for more than 90 days; – the probability that the borrower will enter bankruptcy or other financial realisation; – a concession granted to the borrower for economic or legal reasons relating to the borrower’s financial difficulty
that results in forgiveness or postponement of principal, interest or fees, where the concession is not insignificant; and
– there has been deterioration in the financial condition or outlook of the borrower such that its ability to repay is considered doubtful.
For loans where objective evidence of impairment exists, impairment losses are determined considering the following factors:
– HSBC’s aggregate exposure to the customer; – the viability of the customer’s business model and their capacity to trade successfully out of financial difficulties
and generate sufficient cash flow to service debt obligations; – the amount and timing of expected receipts and recoveries; – the likely dividend available on liquidation or bankruptcy; – the extent of other creditors’ commitments ranking ahead of, or pari passu with, HSBC and the likelihood of other
creditors continuing to support the company; – the complexity of determining the aggregate amount and ranking of all creditor claims and the extent to which
legal and insurance uncertainties are evident; – the realisable value of security (or other credit mitigants) and likelihood of successful repossession; – the likely costs of obtaining and selling collateral as part of foreclosure; – the ability of the borrower to obtain, and make payments in, the currency of the loan if not denominated in local
currency; and

HSBC HOLDINGS PLC
351
Str
ateg
ic R
epo
rt
Fi
nan
cial
Rev
iew
Co
rpo
rate
Go
vern
ance
Fin
anci
al S
tate
men
ts
S
har
eho
lder
Info
rmat
ion
– when available, the secondary market price of the debt.
The determination of the realisable value of security is based on the market value at the time the impairment assessment is performed. The value is not adjusted for expected future changes in market prices, though adjustments are made to reflect local conditions such as forced sale discounts.
Impairment losses are calculated by discounting the expected future cash flows of a loan, which includes expected future receipts of contractual interest, at the loan’s original effective interest rate and comparing the resultant present value with the loan’s current carrying amount. The impairment allowances on individually significant accounts are reviewed at least quarterly and more regularly when circumstances require.
Collectively assessed loans and advances
Impairment is assessed collectively to cover losses which have been incurred but have not yet been identified on loans subject to individual assessment or for homogeneous groups of loans that are not considered individually significant. Retail lending portfolios are generally assessed for impairment collectively as the portfolios are generally large homogeneous loan pools.
Incurred but not yet identified impairment
Individually assessed loans for which no evidence of impairment has been specifically identified on an individual basis are grouped together according to their credit risk characteristics for a collective impairment assessment. These credit risk characteristics may include country of origination, type of business involved, type of products offered, security obtained or other relevant factors. This assessment captures impairment losses that HSBC has incurred as a result of events occurring before the balance sheet date, which HSBC is not able to identify on an individual loan basis, and that can be reliably estimated. When information becomes available which identifies losses on individual loans within the group, those loans are removed from the group and assessed individually.
The collective impairment allowance is determined after taking into account:
– historical loss experience in portfolios of similar credit risk characteristics (for example, by industry sector, loan grade or product);
– the estimated period between impairment occurring and the loss being identified and evidenced by the establishment of an appropriate allowance against the individual loan; and
– management’s judgement as to whether current economic and credit conditions are such that the actual level of inherent losses at the balance sheet date is likely to be greater or less than that suggested by historical experience.
The period between a loss occurring and its identification is estimated by management for each identified portfolio based on economic and market conditions, customer behaviour, portfolio management information, credit management techniques and collection and recovery experiences in the market. As it is assessed empirically on a periodic basis, the estimated period may vary over time as these factors change.
Homogeneous groups of loans and advances
Statistical methods are used to determine collective impairment losses for homogeneous groups of loans not considered individually significant. Losses in these groups of loans are recorded individually when individual loans are removed from the group and written off. The methods that are used to calculate collective allowances are:
– When appropriate empirical information is available, HSBC utilises roll-rate methodology, which employs statistical analyses of historical data and experience of delinquency and default to reliably estimate the amount of the loans that will eventually be written off as a result of the events occurring before the balance sheet date but which HSBC is not able to identify individually. Individual loans are grouped using ranges of past due days; statistical analysis is then used to estimate the likelihood that loans in each range will progress through the various stages of delinquency and become irrecoverable. Additionally, individual loans are segmented based on their credit characteristics as described above. In applying this methodology, adjustments are made to estimate the periods of time between a loss event occurring and its discovery, for example through a missed payment, (known as the emergence period) and the period of time between discovery and write-off (known as the outcome period). Current economic conditions are also evaluated when calculating the appropriate level of allowance required to cover inherent loss. In certain highly developed markets, sophisticated models also take into account behavioural and account management trends as revealed in, for example, bankruptcy and rescheduling statistics.
– When the portfolio size is small or when information is insufficient or not reliable enough to adopt a roll-rate methodology, HSBC adopts a basic formulaic approach based on historical loss rate experience, or a discounted cash flow model. Where a basic formulaic approach is undertaken, the period between a loss event occurring and its identification is explicitly estimated by local management, and is typically between six and twelve months.
The inherent loss within each portfolio is assessed on the basis of statistical models using historical data observations, which are updated periodically to reflect recent portfolio and economic trends. When the most recent trends arising from changes in economic, regulatory or behavioural conditions are not fully reflected in the statistical models, they

Notes on the Financial Statements (continued) 1 – Basis of preparation
HSBC HOLDINGS PLC
352
are taken into account by adjusting the impairment allowances derived from the statistical models to reflect these changes as at the balance sheet date.
Write-off of loans and advances Loans (and the related impairment allowance accounts) are normally written off, either partially or in full, when there is no realistic prospect of recovery. Where loans are secured, this is generally after receipt of any proceeds from the realisation of security. In circumstances where the net realisable value of any collateral has been determined and there is no reasonable expectation of further recovery, write-off may be earlier.
Reversals of impairment If the amount of an impairment loss decreases in a subsequent period, and the decrease can be related objectively to an event occurring after the impairment was recognised, the excess is written back by reducing the loan impairment allowance account accordingly. The write-back is recognised in the income statement.
Assets acquired in exchange for loans Non-financial assets acquired in exchange for loans as part of an orderly realisation are recorded as ‘Assets held for sale’ and reported in ‘Other assets’ if those assets are classified as held for sale. The asset acquired is recorded at the lower of its fair value less costs to sell and the carrying amount of the loan (net of impairment allowance) at the date of exchange. No depreciation is charged in respect of assets held for sale. Impairments and reversal of previous impairments are recognised in the income statement in ‘Other operating income’, together with any realised gains or losses on disposal.
Renegotiated loans Loans subject to collective impairment assessment whose terms have been renegotiated are no longer considered past due, but are treated as up to date loans for measurement purposes once a minimum number of payments required have been received. They are segregated from other parts of the loan portfolio for the purposes of collective impairment assessment, to reflect their risk profile. Loans subject to individual impairment assessment, whose terms have been renegotiated, are subject to ongoing review to determine whether they remain impaired. The carrying amounts of loans that have been classified as renegotiated retain this classification until maturity or derecognition.
A loan that is renegotiated is derecognised if the existing agreement is cancelled and a new agreement made on substantially different terms or if the terms of an existing agreement are modified such that the renegotiated loan is substantially a different financial instrument. Any new agreements arising due to derecognition events will continue to be disclosed as renegotiated loans and are assessed for impairment as above.
Impairment of available-for-sale financial assets
Available-for-sale financial assets are assessed at each balance sheet date for objective evidence of impairment. If such evidence exists as a result of one or more events that occurred after the initial recognition of the financial asset (a ‘loss event’) and that loss event has an impact which can be reliably measured on the estimated future cash flows of the financial asset an impairment loss is recognised.
If the available-for-sale financial asset is impaired, the difference between its acquisition cost (net of any principal repayments and amortisation) and its current fair value, less any previous impairment loss recognised in the income statement, is recognised in the income statement.
Impairment losses are recognised in the income statement within ‘Loan impairment charges and other credit risk provisions’ for debt instruments and within ‘Gains less losses from financial investments’ for equities. The impairment methodologies for available-for-sale financial assets are set out in more detail below:
– Available-for-sale debt securities. In assessing objective evidence of impairment at the reporting date, HSBC considers all available evidence, including observable data or information about events specifically relating to the securities which may result in a shortfall in the recovery of future cash flows. Financial difficulties of the issuer, as well as other factors such as information about the issuers’ liquidity, business and financial risk exposures, levels of and trends in default for similar financial assets, national and local economic trends and conditions, and the fair value of collateral and guarantees may be considered individually, or in combination, to determine if there is objective evidence of impairment.
In addition, the performance of underlying collateral and the extent and depth of market price declines is relevant when assessing objective evidence of impairment of available-for-sale ABSs. The primary indicators of potential impairment are considered to be adverse fair value movements and the disappearance of an active market for a security, while changes in credit ratings are of secondary importance.
– Available-for-sale equity securities. Objective evidence of impairment may include specific information about the issuer as detailed above, but may also include information about significant changes in technology, markets, economics or the law that provides evidence that the cost of the equity securities may not be recovered.

HSBC HOLDINGS PLC
353
Str
ateg
ic R
epo
rt
Fi
nan
cial
Rev
iew
Co
rpo
rate
Go
vern
ance
Fin
anci
al S
tate
men
ts
S
har
eho
lder
Info
rmat
ion
A significant or prolonged decline in the fair value of the equity below its cost is also objective evidence of impairment. In assessing whether it is significant, the decline in fair value is evaluated against the original cost of the asset at initial recognition. In assessing whether it is prolonged, the decline is evaluated against the continuous period in which the fair value of the asset has been below its original cost at initial recognition.
Once an impairment loss has been recognised, the subsequent accounting treatment for changes in the fair value of that asset differs depending on the type of asset:
– for an available-for-sale debt security, a subsequent decline in the fair value of the instrument is recognised in the income statement when there is further objective evidence of impairment as a result of further decreases in the estimated future cash flows of the financial asset. Where there is no further objective evidence of impairment, the decline in the fair value of the financial asset is recognised in other comprehensive income. If the fair value of a debt security increases in a subsequent period, and the increase can be objectively related to an event occurring after the impairment loss was recognised in the income statement, or the instrument is no longer impaired, the impairment loss is reversed through the income statement;
– for an available-for-sale equity security, all subsequent increases in the fair value of the instrument are treated as a revaluation and are recognised in other comprehensive income. Impairment losses recognised on the equity security are not reversed through the income statement. Subsequent decreases in the fair value of the available-for-sale equity security are recognised in the income statement to the extent that further cumulative impairment losses have been incurred.
(l) Funding fair value adjustment
In line with evolving market practice HSBC revised its estimation methodology for valuing the uncollateralised derivative portfolios by introducing a funding fair value adjustment (‘FFVA’). The FFVA adjustment reflects the estimated present value of the future market funding cost or benefit associated with funding uncollateralised derivative exposure at rates other than the Overnight Index Swap (‘OIS’) rate, which is the benchmark rate used for valuing collateralised derivatives. The impact of FFVA adoption in 2014 was a US$263m reduction in net trading income, reflecting the incorporation of a funding spread over Libor. Further details have been provided in Note 13 to the Financial Statements.
(m) Operating income
Interest income and expense
Interest income and expense for all financial instruments except for those classified as held for trading or designated at fair value (except for debt securities issued by HSBC and derivatives managed in conjunction with those debt securities) are recognised in ‘Interest income’ and ‘Interest expense’ in the income statement using the effective interest method. The effective interest rate is the rate that exactly discounts estimated future cash receipts or payments through the expected life of the financial instrument or, where appropriate, a shorter period, to the net carrying amount of the financial asset or financial liability.
Interest on impaired financial assets is recognised using the rate of interest used to discount the future cash flows for the purpose of measuring the impairment loss.
Non-interest income and expense
Fee income is earned from a diverse range of services provided by HSBC to its customers. Fee income is accounted for as follows: – income earned on the execution of a significant act is recognised as revenue when the act is completed (for
example, fees arising from negotiating or participating in the negotiation of a transaction for a third party, such as an arrangement for the acquisition of shares or other securities);
– income earned from the provision of services is recognised as revenue as the services are provided (for example, asset management, portfolio and other management advisory and service fees); and
– income which forms an integral part of the effective interest rate of a financial instrument is recognised as an adjustment to the effective interest rate (for example, certain loan commitment fees) and recorded in ‘Interest income’.
Net trading income comprises all gains and losses from changes in the fair value of financial assets and financial liabilities held for trading, together with the related interest income, expense and dividends. Dividend income is recognised when the right to receive payment is established. This is the ex-dividend date for listed equity securities, and usually the date when shareholders have approved the dividend for unlisted equity securities. The accounting policies for net income/(expense) from financial instruments designated at fair value and for net insurance premium income are disclosed in Note 2 and Note 3.
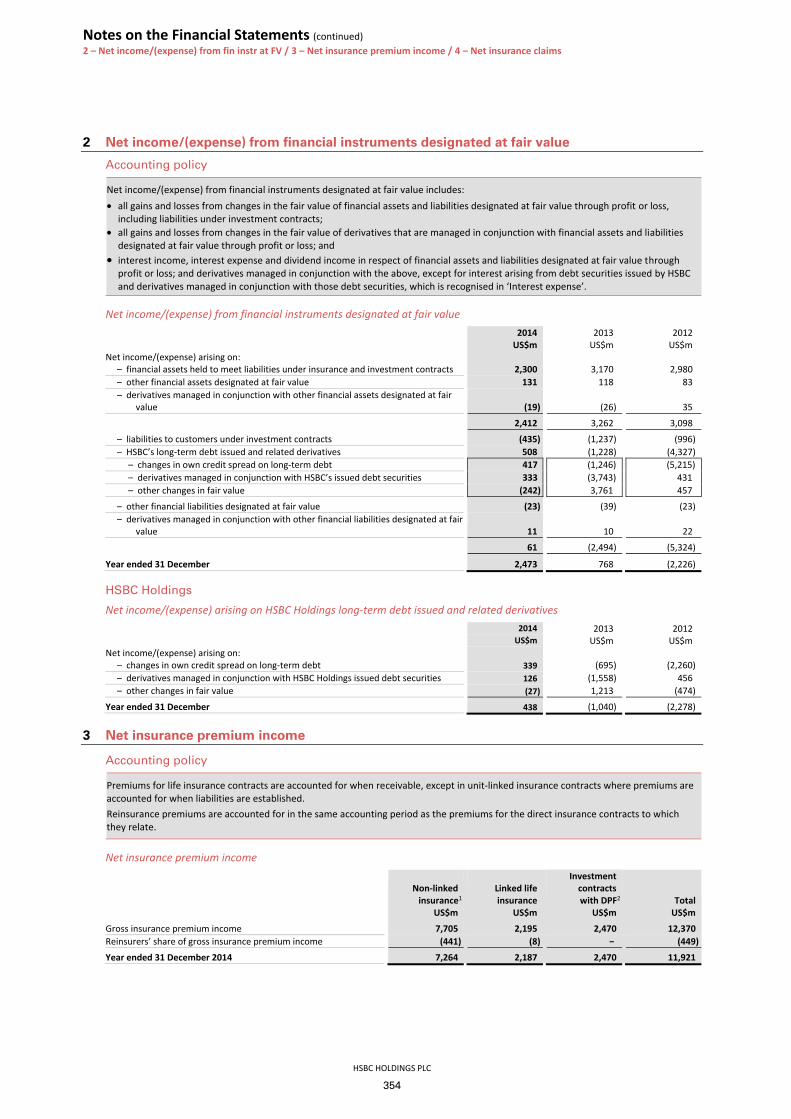
Notes on the Financial Statements (continued) 2 – Net income/(expense) from fin instr at FV / 3 – Net insurance premium income / 4 – Net insurance claims
HSBC HOLDINGS PLC
354
2 Net income/(expense) from financial instruments designated at fair value
Accounting policy
Net income/(expense) from financial instruments designated at fair value includes: • all gains and losses from changes in the fair value of financial assets and liabilities designated at fair value through profit or loss,
including liabilities under investment contracts; • all gains and losses from changes in the fair value of derivatives that are managed in conjunction with financial assets and liabilities
designated at fair value through profit or loss; and • interest income, interest expense and dividend income in respect of financial assets and liabilities designated at fair value through
profit or loss; and derivatives managed in conjunction with the above, except for interest arising from debt securities issued by HSBC and derivatives managed in conjunction with those debt securities, which is recognised in ‘Interest expense’.
Net income/(expense) from financial instruments designated at fair value 2014 2013 2012 US$m US$m US$mNet income/(expense) arising on:
– financial assets held to meet liabilities under insurance and investment contracts 2,300 3,170 2,980– other financial assets designated at fair value 131 118 83– derivatives managed in conjunction with other financial assets designated at fair
value (19) (26) 35
2,412 3,262 3,098
– liabilities to customers under investment contracts (435) (1,237) (996)– HSBC’s long-term debt issued and related derivatives 508 (1,228) (4,327)
– changes in own credit spread on long-term debt 417 (1,246) (5,215)– derivatives managed in conjunction with HSBC’s issued debt securities 333 (3,743) 431– other changes in fair value (242) 3,761 457
– other financial liabilities designated at fair value (23) (39) (23)– derivatives managed in conjunction with other financial liabilities designated at fair
value 11 10 22
61 (2,494) (5,324)
Year ended 31 December 2,473 768 (2,226)
HSBC Holdings
Net income/(expense) arising on HSBC Holdings long-term debt issued and related derivatives 2014 2013 2012 US$m US$m US$mNet income/(expense) arising on:
– changes in own credit spread on long-term debt 339 (695) (2,260)– derivatives managed in conjunction with HSBC Holdings issued debt securities 126 (1,558) 456– other changes in fair value (27) 1,213 (474)
Year ended 31 December 438 (1,040) (2,278)
3 Net insurance premium income
Accounting policy
Premiums for life insurance contracts are accounted for when receivable, except in unit-linked insurance contracts where premiums are accounted for when liabilities are established. Reinsurance premiums are accounted for in the same accounting period as the premiums for the direct insurance contracts to which they relate.
Net insurance premium income
Non-linked insurance1
Linked life insurance
Investment contracts with DPF2 Total
US$m US$m US$m US$m
Gross insurance premium income 7,705 2,195 2,470 12,370 Reinsurers’ share of gross insurance premium income (441) (8) (449)
Year ended 31 December 2014 7,264 2,187 2,470 11,921

HSBC HOLDINGS PLC
355
Str
ateg
ic R
epo
rt
Fi
nan
cial
Rev
iew
Co
rpo
rate
Go
vern
ance
Fin
anci
al S
tate
men
ts
S
har
eho
lder
Info
rmat
ion
Non-linked insurance1
Linked life insurance
Investment contracts with DPF2 Total
US$m US$m US$m US$m
Gross insurance premium income 7,002 3,012 2,384 12,398Reinsurers’ share of gross insurance premium income (450) (8) – (458)
Year ended 31 December 2013 6,552 3,004 2,384 11,940
Gross insurance premium income 7,578 3,325 2,699 13,602Reinsurers’ share of gross insurance premium income (550) (8) – (558)
Year ended 31 December 2012 7,028 3,317 2,699 13,044
1 Includes non-life insurance. 2 Discretionary participation features.
4 Net insurance claims and benefits paid and movement in liabilities to policyholders
Accounting policy
Gross insurance claims for life insurance contracts reflect the total cost of claims arising during the year, including claim handling costs and any policyholder bonuses allocated in anticipation of a bonus declaration. Maturity claims are recognised when due for payment. Surrenders are recognised when paid or at an earlier date on which, following notification, the policy ceases to be included within the calculation of the related insurance liabilities. Death claims are recognised when notified. Reinsurance recoveries are accounted for in the same period as the related claim. Net insurance claims and benefits paid and movement in liabilities to policyholders
Non-linked insurance1
Linked life insurance
Investment contracts with DPF2 Total
US$m US$m US$m US$m
Gross claims and benefits paid and movement in liabilities 7,770 2,765 3,188 13,723– claims, benefits and surrenders paid 3,575 1,499 2,215 7,289– movement in liabilities 4,195 1,266 973 6,434
Reinsurers’ share of claims and benefits paid and movement in liabilities (411) 33 – (378)
– claims, benefits and surrenders paid (176) (88) – (264)– movement in liabilities (235) 121 – (114)
Year ended 31 December 2014 7,359 2,798 3,188 13,345 Gross claims and benefits paid and movement in liabilities 6,892 3,379 3,677 13,948
– claims, benefits and surrenders paid 3,014 1,976 2,308 7,298– movement in liabilities 3,878 1,403 1,369 6,650
Reinsurers’ share of claims and benefits paid and movement in liabilities (367) 111 – (256)– claims, benefits and surrenders paid (164) (426) – (590)– movement in liabilities (203) 537 – 334
Year ended 31 December 2013 6,525 3,490 3,677 13,692 Gross claims and benefits paid and movement in liabilities 6,900 3,984 3,645 14,529
– claims, benefits and surrenders paid 1,905 1,810 2,525 6,240– movement in liabilities 4,995 2,174 1,120 8,289
Reinsurers’ share of claims and benefits paid and movement in liabilities (537) 223 – (314)– claims, benefits and surrenders paid (217) (681) – (898)– movement in liabilities (320) 904 – 584
Year ended 31 December 2012 6,363 4,207 3,645 14,215
1 Includes non-life insurance. 2 Discretionary participation features.

Notes on the Financial Statements (continued) 5 – Operating profit / 6 – Employee compensation and benefits
HSBC HOLDINGS PLC
356
5 Operating profit
Operating profit is stated after the following items of income, expense, gains and losses, and loan impairment charges and other credit risk provisions: 2014 2013 2012 US$m US$m US$mIncome Interest recognised on impaired financial assets 1,137 1,261 1,261Fees earned on financial assets or liabilities not held for trading nor designated at
fair value, other than fees included in effective interest rate calculations on these types of assets and liabilities 9,438 9,799 10,042
Fees earned on trust and other fiduciary activities where HSBC holds or invests assets on behalf of its customers 3,253 3,176 2,897
Income from listed investments 6,726 5,432 5,850Income from unlisted investments 5,874 6,860 7,677 Expense Interest on financial instruments, excluding interest on financial liabilities
held for trading or designated at fair value (15,322) (14,610) (17,625)Fees payable on financial assets or liabilities not held for trading nor designated at
fair value, other than fees included in effective interest rate calculations on these types of assets and liabilities (1,427) (1,396) (1,501)
Fees payable relating to trust and other fiduciary activities where HSBC holds or invests assets on behalf of its customers (185) (171) (170)
Payments under lease and sublease agreements (1,548) (1,425) (1,166)– minimum lease payments (1,199) (1,098) (1,149)– contingent rents and sublease payments (349) (327) (17)
UK bank levy (1,066) (916) (472) Gains/(losses) Impairment of available-for-sale equity securities (373) (175) (420)Gains/(losses) recognised on assets held for sale 220 (729) 485Gains on disposal of HSBC Bank (Panama) S.A. – 1,107 –(Losses)/gains arising from dilution of interest in Industrial Bank and other associates
and joint ventures (32) 1,051 –
Loan impairment charges and other credit risk provisions (3,851) (5,849) (8,311)– net impairment charge on loans and advances (4,055) (6,048) (8,160)– release/(impairment) of available-for-sale debt securities 319 211 (99)– impairment in respect of other credit risk provisions (115) (12) (52)
6 Employee compensation and benefits
2014 2013 2012 US$m US$m US$m
Wages and salaries 17,477 16,879 17,780Social security costs 1,666 1,594 1,633Post-employment benefits 1,223 723 1,078
Year ended 31 December 20,366 19,196 20,491 Average number of persons employed by HSBC during the year 2014 2013 2012
Europe 74,024 75,334 77,204Asia 116,492 114,216 116,779Middle East and North Africa 8,616 9,181 8,645North America 21,983 22,568 27,396Latin America 43,652 47,496 54,162
Year ended 31 December 264,767 268,795 284,186

HSBC HOLDINGS PLC
357
Str
ateg
ic R
epo
rt
Fi
nan
cial
Rev
iew
Co
rpo
rate
Go
vern
ance
Fin
anci
al S
tate
men
ts
S
har
eho
lder
Info
rmat
ion
Reconciliation of total incentive awards granted to incentive awards in employee compensation and benefits 2014 2013 2012 US$m US$m US$m
Total incentive awards approved and granted for the current year1 3,660 3,920 3,689Less: deferred bonuses awarded for the current year, expected to be recognised
in future periods (359) (436) (355)
Total incentives awarded and recognised in the current year 3,301 3,484 3,334Current year charges for deferred bonuses from previous years 425 427 671Other (114) (164) (28)
Total incentive awards for the current year included in employee compensation and benefits 3,612 3,747 3,977
1 This represents the amount of the Group variable pay pool that has been approved and granted. The total amount of Group variable pay pool approved by the Group Remuneration Committee is disclosed in the Directors’ Remuneration Report on page 310.
Income statement charge: deferred bonuses
Current year
bonus pool Prior year
bonus pools Total US$m US$m US$m2014 Charge recognised in 2014 245 425 670
– deferred share awards 147 373 520– deferred cash awards 98 52 150
Charge expected to be recognised in 2015 or later 359 381 740– deferred share awards 250 334 584 – deferred cash awards 109 47 156
2013 Charge recognised in 2013 269 427 696
– deferred share awards 188 354 542– deferred cash awards 81 73 154
Charge expected to be recognised in 2014 or later 436 306 742– deferred share awards 356 259 615– deferred cash awards 80 47 127
2012 Charge recognised in 2012 277 671 948
– deferred share awards 224 613 837– deferred cash awards 53 58 111
Charge expected to be recognised in 2013 or later 355 376 731– deferred share awards 315 335 650– deferred cash awards 40 41 81
Share-based payments
Accounting policy
HSBC enters into both equity-settled and cash-settled share-based payment arrangements with its employees as compensation for services provided by employees. The cost of equity-settled share-based payment arrangements with employees is measured by reference to the fair value of equity instruments on the date they are granted and recognised as an expense on a straight-line basis over the vesting period, with a corresponding credit to ‘Retained earnings’.
For cash-settled share-based payment arrangements, the services acquired and liability incurred are measured at the fair value of the liability and recognised as the employees render service. Until settlement, the fair value of the liability is re-measured, with changes in fair value recognised in the income statement.
Fair value is determined by using appropriate valuation models. Vesting conditions include service conditions and performance conditions; any other features of the arrangement are non-vesting conditions. Market performance conditions and non-vesting conditions are taken into account when estimating the fair value of the award at the date of grant. Vesting conditions, other than market performance conditions, are not taken into account in the initial estimate of the fair value at the grant date. They are taken into account by adjusting the number of equity instruments included in the measurement of the transaction.
A cancellation that occurs during the vesting period is treated as an acceleration of vesting, and recognised immediately for the amount that would otherwise have been recognised for services over the vesting period.
Where HSBC Holdings enters into share-based payment arrangements involving employees of subsidiaries for which the subsidiaries are re-charged, the difference between the cost of the share-based payment arrangement and the fair value of the equity instruments expected to be issued to satisfy those arrangements is recognised as an adjustment to ‘Investment in subsidiaries’ over the vesting period.

Notes on the Financial Statements (continued) 6 – Employee compensation and benefits
HSBC HOLDINGS PLC
358
‘Wages and salaries’ include the effect of share-based payments arrangements, of which US$732m are equity settled (2013: US$630m; 2012: US$988m), as follows:
2014 2013 2012 US$m US$m US$m
Restricted share awards 738 599 912Savings-related and other share award option plans 36 63 96
Year ended 31 December 774 662 1,008
HSBC share awards
Award Policy Purpose
Restricted share awards (including Annual incentive awards delivered in shares) and GPSP
• An assessment of performance over the relevant period ending on 31 December is used to determine the amount of the award to be granted.
• Deferred awards generally require employees to remain in employment over the vesting period and are not subject to performance conditions after the grant date.
• Deferred Annual incentive awards generally vest over a period of three years and GPSP awards vest after five years.
• Vested shares may be subject to a retention requirement (restriction) post-vesting. GPSP awards are retained until cessation of employment.
• Awards granted from 2010 onwards are subject to malus provision prior to vesting.
• To drive and reward performance consistent with strategy and align to shareholder interests.
• Deferral provides an incentive for a longer-term commitment and the ability to apply malus.
Movement on HSBC share awards 2014 2013 Number
(000s) Number
(000s)
Restricted share awards outstanding at 1 January 116,932 165,589Additions during the year 82,871 59,261Released in the year (78,224) (99,820)Forfeited in the year (5,096) (8,098)
Restricted share awards outstanding at 31 December 116,483 116,932
Weighted average fair value of awards granted (US$) 10.18 10.95
HSBC share option plans
Main plans Policy Purpose
Savings-related share option plans
• Two plans: the UK plan and the International Plan. The last grant of options under the International Plan was in 2012.
• From 2014, eligible employees save up to £500 per month (or for International options granted prior to 2013, the equivalent of £250 in US dollars, Hong Kong dollars or Euros), with the option to use the savings to acquire shares.
• Exercisable within six months following either the third or fifth anniversaries of the commencement of a three-year or five-year contract, respectively, (or for International options granted prior to 2013, three months following the first anniversary of the commencement of a one-year savings contract).
• The exercise price is set at a 20% (2013: 20%) discount to the market value immediately preceding the date of invitation (except for the one-year options granted under the US sub-plan prior to 2013 where a 15% discount was applied).
• To align the interests of all employees with the creation of shareholder value.
HSBC Holdings Group share option plan
• Plan ceased in May 2005. • Exercisable between third and tenth anniversaries of the date of
grant.
• Long-term incentive plan between 2000 and 2005 during which certain HSBC employees were awarded share options.

HSBC HOLDINGS PLC
359
Str
ateg
ic R
epo
rt
Fi
nan
cial
Rev
iew
Co
rpo
rate
Go
vern
ance
Fin
anci
al S
tate
men
ts
S
har
eho
lder
Info
rmat
ion
Calculation of fair values
The fair values of share options are calculated using a Black-Scholes model. The fair value of a share award is based on the share price at the date of the grant.
Movement on HSBC share option plans
Savings-related share option plans HSBC Holdings Group share option
plan Number
(000s) WAEP1
£ Number
(000s) WAEP1
£
Outstanding at 1 January 2014 93,760 4.04 55,026 7.23Granted during the year2 28,689 5.19 – –Exercised during the year3 (50,393) 3.48 (1) 7.22Expired during the year (5,690) 4.81 (48,651) 7.22
Outstanding at 31 December 2014 66,366 4.89 6,374 7.29Weighted average remaining contractual life (years) 2.66 0.30 Outstanding at 1 January 2013 112,752 4.04 87,173 6.94Granted during the year2 8,679 5.47 – –Exercised during the year3 (17,968) 4.56 (17,595) 6.21Expired during the year (9,703) 4.47 (14,552) 4.21
Outstanding at 31 December 2013 93,760 4.04 55,026 7.23
Weighted average remaining contractual life (years) 1.80 0.45
1 Weighted average exercise price. 2 The weighted average fair value of options granted during the year was US$1.90 (2013: US$2.98). 3 The weighted average share price at the date the options were exercised was US$9.91 (2013: US$10.86) and US$9.49 (2013: US$10.93) for the
savings-related share option plans and HSBC Holdings Group share option plan, respectively.
Post-employment benefit plans
Accounting policy
HSBC operates a number of pension and other post-employment benefit plans throughout the world. These plans include both defined benefit and defined contribution plans and various other post-employment benefits such as post-employment healthcare. Payments to defined contribution plans and state-managed retirement benefit plans, where HSBC’s obligations under the plans are equivalent to a defined contribution plan, are charged as an expense as the employees render service. The defined benefit pension costs and the present value of defined benefit obligations are calculated at the reporting date by the schemes’ actuaries using the Projected Unit Credit Method. The net charge to the income statement mainly comprises the service cost and the net interest on the net defined benefit asset or liability and is presented in operating expenses. The past service cost, which is charged immediately to the income statement, is the change in the present value of the defined benefit obligation for employee service in prior periods resulting from a plan amendment (the introduction or withdrawal of, or changes to, a defined benefit plan) or curtailment (a significant reduction by the entity in the number of employees covered by a plan). A settlement is a transaction that eliminates all further legal and constructive obligations for part or all of the benefits provided under a defined benefit plan, other than a payment of benefits to, or on behalf of, employees that is set out in the terms of the plan and included in the actuarial assumptions. Re-measurements of the net defined benefit asset or liability, which comprise actuarial gains and losses, return on plan assets (excluding interest) and the effect of the asset ceiling (if any, excluding interest), are recognised immediately in other comprehensive income. Actuarial gains and losses comprise experience adjustments (the effects of differences between the previous actuarial assumptions and what has actually occurred), as well as the effects of changes in actuarial assumptions. The net defined benefit asset or liability represents the present value of defined benefit obligations reduced by the fair value of plan assets. Any net defined benefit surplus is limited to the present value of available refunds and reductions in future contributions to the plan. The cost of obligations arising from other post-employment defined benefit plans, such as defined benefit health-care plans, are accounted for on the same basis as defined benefit pension plans.

Notes on the Financial Statements (continued) 6 – Employee compensation and benefits
HSBC HOLDINGS PLC
360
Income statement charge 2014 2013 2012 US$m US$m US$m
Defined benefit pension plans 469 54 427 Defined contribution pension plans 687 597 599
Pension plans 1,156 651 1,026
Defined benefit and contribution healthcare plans 67 72 52
Year ended 31 December 1,223 723 1,078
Net assets/(liabilities) recognised on the balance sheet in respect of defined benefit plans
Fair value of plan assets
Present value of defined benefit obligations
Effect of limit on plan surpluses Total
US$m US$m US$m US$m Defined benefit pension plans 44,824 (42,062) (17) 2,745Defined benefit healthcare plans 179 (1,104) – (925)
At 31 December 2014 45,003 (43,166) (17) 1,820Total employee benefit liabilities (within ‘Accruals, deferred income
and other liabilities’) (3,208)Total employee benefit assets (within ‘Prepayments, accrued
income and other assets’) 5,028 Defined benefit pension plans 40,622 (40,467) (30) 125Defined benefit healthcare plans 190 (1,106) – (916)
At 31 December 2013 40,812 41,573 (30) (791)Total employee benefit liabilities (within ‘Accruals, deferred income
and other liabilities’) (2,931)Total employee benefit assets (within ‘Prepayments, accrued
income and other assets’) 2,140
Cumulative actuarial gains/(losses) recognised in other comprehensive income 2014 2013 2012 US$m US$m US$m
At 1 January (4,445) (3,844) (3,453)
HSBC Bank (UK) Pension Scheme 2,764 (1,524) 208 Other plans (274) 796 (440)Healthcare plans (88) 143 (154)Change in the effect of limit on plan surpluses 17 (16) (5)
Total actuarial gains/(losses) recognised in other comprehensive income 2,419 (601) (391)
At 31 December (2,026) (4,445) (3,844)
HSBC pension plans 2014 2013 2012 % % %Percentage of HSBC employees:
– enrolled in defined contribution plans 66 64 62– enrolled in defined benefit plans 22 23 23
– covered by HSBC pension plans 88 87 85
The Group operates a number of pension plans throughout the world. Some are defined benefit plans, of which the largest is the HSBC Bank (UK) Pension Scheme (‘the principal plan’). The Pension Risk section on page 200 and the Appendix to Risk on page 236 contain details about the characteristics and risks and amount, timing and uncertainty of future cash flows and policies and practices associated with the principal plan.
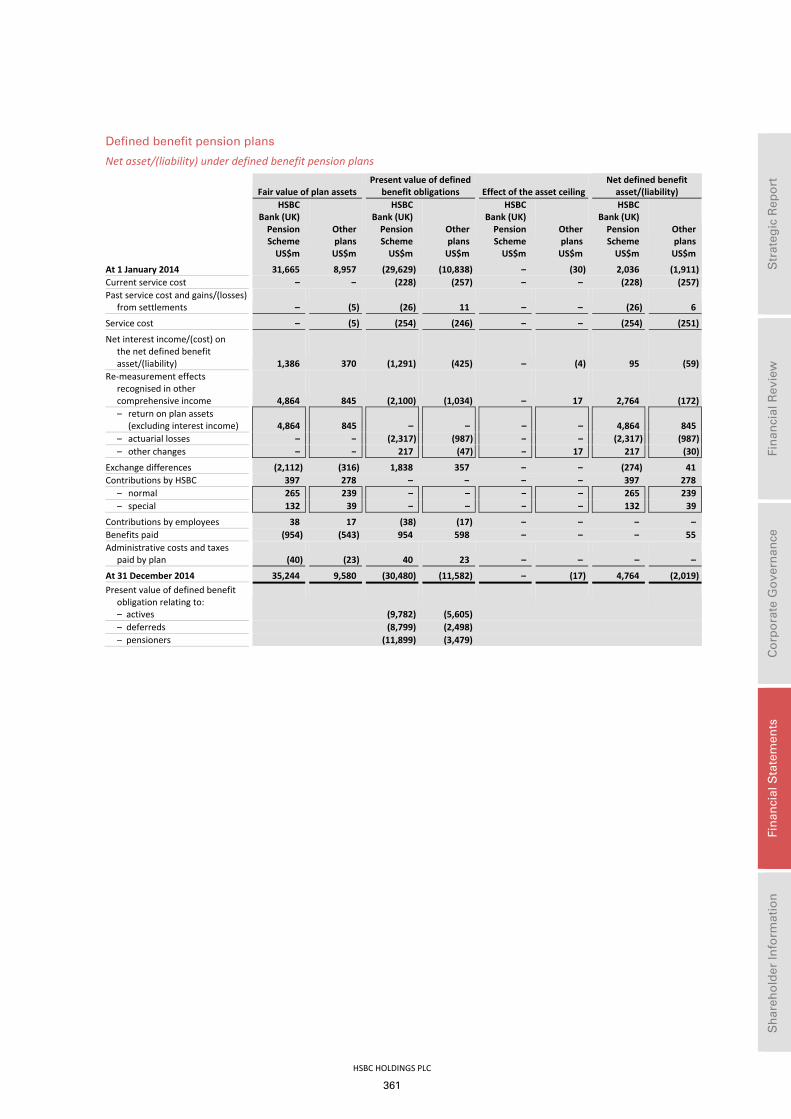
HSBC HOLDINGS PLC
361
Str
ateg
ic R
epo
rt
Fi
nan
cial
Rev
iew
Co
rpo
rate
Go
vern
ance
Fin
anci
al S
tate
men
ts
S
har
eho
lder
Info
rmat
ion
Defined benefit pension plans
Net asset/(liability) under defined benefit pension plans
Fair value of plan assets Present value of defined
benefit obligations Effect of the asset ceiling Net defined benefit
asset/(liability) HSBC
Bank (UK) Pension Scheme
Other plans
HSBC Bank (UK) Pension Scheme
Other plans
HSBC Bank (UK) Pension Scheme
Other plans
HSBC Bank (UK) Pension Scheme
Other plans
US$m US$m US$m US$m US$m US$m US$m US$m
At 1 January 2014 31,665 8,957 (29,629) (10,838) – (30) 2,036 (1,911)Current service cost – – (228) (257) – – (228) (257)Past service cost and gains/(losses)
from settlements – (5) (26) 11 – – (26) 6
Service cost – (5) (254) (246) – – (254) (251)
Net interest income/(cost) on the net defined benefit asset/(liability) 1,386 370 (1,291) (425) – (4) 95 (59)
Re-measurement effects recognised in other comprehensive income 4,864 845 (2,100) (1,034) – 17 2,764 (172)– return on plan assets
(excluding interest income)
4,864 845 – – – – 4,864 845 – actuarial losses – – (2,317) (987) – – (2,317) (987)– other changes – – 217 (47) – 17 217 (30)
Exchange differences (2,112) (316) 1,838 357 – – (274) 41Contributions by HSBC 397 278 – – – – 397 278
– normal 265 239 – – – – 265 239– special 132 39 – – – – 132 39
Contributions by employees 38 17 (38) (17) – – – –Benefits paid (954) (543) 954 598 – – – 55Administrative costs and taxes
paid by plan (40) (23) 40 23 – – – –
At 31 December 2014 35,244 9,580 (30,480) (11,582) – (17) 4,764 (2,019)Present value of defined benefit
obligation relating to: – actives (9,782) (5,605) – deferreds (8,799) (2,498) – pensioners (11,899) (3,479)

Notes on the Financial Statements (continued) 6 – Employee compensation and benefits
HSBC HOLDINGS PLC
362
Net asset/(liability) under defined benefit pension plans (continued)
Fair value of plan assets Present value of defined
benefit obligations Effect of the asset ceiling Net defined benefit
asset/(liability) HSBC
Bank (UK) Pension Scheme
Other plans
HSBC Bank (UK) Pension Scheme
Other plans
HSBC Bank (UK) Pension Scheme
Other plans
HSBC Bank (UK) Pension Scheme
Other plans
US$m US$m US$m US$m US$m US$m US$m US$m
At 1 January 2013 29,092 9,015 (26,475) (11,581) – (19) 2,617 (2,585)Current service cost – – (259) (249) – – (259) (249)Past service cost and gains/(losses)
from settlements1 – (3) 438 (41) – – 438 (44)
Service cost – (3) 179 (290) – – 179 (293)
Net interest income/(cost) on the net defined benefit asset/(liability) 1,260 156 (1,127) (229) – – 133 (73)
Re-measurement effects recognised in other comprehensive income 817 21 (2,341) 775 – (16) (1,524) 780 – return on plan assets
(excluding interest income)
817 21 – – – – 817 21 – actuarial gains/(losses) – – (2,453) 829 – – (2,453) 829– other changes – – 112 (54) – (16) 112 (70)
Exchange differences 766 (59) (740) 23 – 5 26 (31)Contributions by HSBC 605 336 – – – – 605 336
– normal 399 274 – – – – 399 274– special 206 62 – – – – 206 62
Contributions by employees 38 17 (38) (17) – – – –Benefits paid (876) (513) 876 452 – – – (61)Administrative costs and taxes
paid by plan (37) (13) 37 13 – – – – Disposals – – – 16 – – – 16
At 31 December 2013 31,665 8,957 (29,629) (10,838) – (30) 2,036 (1,911)
Present value of defined benefit obligation relating to: – actives (8,896) (5,465) – deferreds (8,358) (2,144) – pensioners (12,375) (3,229)
1 HSBC announced to employees in the UK that the future service accrual for active members of the Defined Benefit Section (‘DBS’) of the principal plan would cease with effect from 30 June 2015 and that all active members of the DBS will become member of the Defined Contribution Section from 1 July 2015. This resulted in a reduction in the defined benefit obligation of the Scheme and a corresponding gain of US$430m in 2013, recorded in ‘Past service cost and (gains)/losses on settlements’ in the table above.
HSBC expects to make US$530m of contributions to defined benefit pension plans during 2015. Benefits expected to be paid from the plans to retirees over each of the next five years, and in aggregate for the five years thereafter, are as follows:
Benefits expected to be paid from plans 2015 2016 2017 2018 2019 2020-2024 US$m US$m US$m US$m US$m US$m
HSBC Bank (UK) Pension Scheme1 970 999 1,029 1,060 1,091 5,968Other plans1 566 576 595 605 643 3,366
1 The duration of the defined benefit obligation is 19.8 years for the HSBC Bank (UK) Pension Scheme under the disclosure assumptions adopted (2013: 19.5 years) and 14.2 years for all other plans combined (2013: 13.7 years).

HSBC HOLDINGS PLC
363
Str
ateg
ic R
epo
rt
Fi
nan
cial
Rev
iew
Co
rpo
rate
Go
vern
ance
Fin
anci
al S
tate
men
ts
S
har
eho
lder
Info
rmat
ion
Fair value of plan assets by asset classes 31 December 2014 31 December 2013
Value
Quotedmarket price
in activemarket
No quotedmarket price
in activemarket
Thereof HSBC1 Value
Quoted market price
in active market
No quoted market price
in active market
Thereof HSBC1
US$m US$m US$m US$m US$m US$m US$m US$mHSBC Bank (UK) Pension Scheme Fair value of plan assets 35,244 31,355 3,889 930 31,665 26,520 5,145 2,827
– equities 5,502 4,557 945 – 4,655 3,667 988 –– bonds 22,965 22,965 – – 17,708 17,708 – –– derivatives 1,369 52 1,317 930 2,827 – 2,827 2,827– other 5,408 3,781 1,627 – 6,475 5,145 1,330 –
Other plans Fair value of plan assets 9,580 6,390 3,190 (13) 8,957 7,731 1,226 574
– equities 2,534 1,778 756 11 2,854 2,789 65 14– bonds 6,376 4,109 2,267 7 4,892 4,409 483 9– derivatives (100) (8) (92) (107) 399 – 399 399– other 770 511 259 76 812 533 279 152
1 The fair value of plan assets includes derivatives entered into with HSBC Bank plc as detailed in Note 41.
Post-employment defined benefit plans’ principal actuarial financial assumptions
HSBC determines the discount rates to be applied to its obligations in consultation with the plans’ local actuaries, on the basis of current average yields of high quality (AA-rated or equivalent) debt instruments, with maturities consistent with those of the defined benefit obligations.
Key actuarial assumptions for the principal plan
Discount rate
Inflation rate
Rate of increase for pensions
Rate of pay increase
Interest credit rate
% % % % %UK At 31 December 2014 3.70 3.20 3.00 3.70 n/aAt 31 December 2013 4.45 3.60 3.30 4.10 n/aAt 31 December 2012 4.50 3.10 2.90 3.60 n/a
Mortality tables and average life expectancy at age 65 for the principal plan Mortality
table Life expectancy at age 65 for
a male member currently: Life expectancy at age 65 fora female member currently:
Aged 65 Aged 45 Aged 65 Aged 45UK At 31 December 2014 SAPS S11 23.6 25.2 25.0 26.9At 31 December 2013 SAPS S11 23.6 25.2 24.9 26.8
1 Self-administered Pension Scheme (‘SAPS’) with Continuous Mortality Investigation 2014 improvements (2013: 2013 improvements) and a 1.25% long-term allowance improvement. Light table with 1.01 rating for male pensioners and 1.02 rating for female pensioners.
Actuarial assumption sensitivities
The effect of changes in key assumptions on the principal plan HSBC Bank (UK) Pension Scheme 2014 2013 US$m US$mDiscount rate
Change in pension obligation at year-end from a 25bps increase (1,420) (1,352)Change in pension obligation at year-end from a 25bps decrease 1,523 1,450Change in 2015 pension cost from a 25bps increase (75) (83)Change in 2015 pension cost from a 25bps decrease 73 79
Rate of inflation Change in pension obligation at year-end from a 25bps increase 1,026 994Change in pension obligation at year-end from a 25bps decrease (1,184) (1,137)Change in 2015 pension cost from a 25bps increase 44 53Change in 2015 pension cost from a 25bps decrease (48) (68)
Rate of increase for pensions in payment and deferred pensions Change in pension obligation at year-end from a 25bps increase 1,188 1,301Change in pension obligation at year-end from a 25bps decrease (1,127) (1,225)Change in 2015 pension cost from a 25bps increase 50 66Change in 2015 pension cost from a 25bps decrease (45) (64)

Notes on the Financial Statements (continued) 7 – Auditors’ remuneration / 8 – Tax
HSBC HOLDINGS PLC
364
HSBC Bank (UK) Pension Scheme 2014 2013 US$m US$m
Rate of pay increase Change in pension obligation at year-end from a 25bps increase 237 212Change in pension obligation at year-end from a 25bps decrease (232) (205)Change in 2015 pension cost from a 25bps increase 12 15Change in 2015 pension cost from a 25bps decrease (11) (15)
Mortality Change in pension obligation from each additional year of longevity assumed 768 712
HSBC Holdings
Employee compensation and benefit expense in respect of HSBC Holdings’ employees in 2014 amounted to US$681m (2013: US$542m). The average number of persons employed by HSBC Holdings during 2014 was 2,070 (2013: 1,525).
Employees of HSBC Holdings who are members of defined benefit pension plans are principally members of either the HSBC Bank (UK) Pension Scheme or the HSBC International Staff Retirement Benefits Scheme. HSBC Holdings pays contributions to such plans for its own employees in accordance with the schedules of contributions determined by the Trustees of the plan and recognises these contributions as an expense as they fall due.
Directors’ emoluments
The aggregate emoluments of the Directors of HSBC Holdings, computed in accordance with the Companies Act 2006 and the Large and Medium-sized Companies and Groups (Accounts and Reports) Regulations 2008 were: 2014 2013 2012 US$000 US$000 US$000
Fees 4,567 4,027 5,435Salaries and other emoluments 17,812 9,488 10,316Annual incentives 4,426 7,357 13,983
Year ended 31 December 26,805 20,872 29,734
Vesting of long-term incentive awards – – 5,733
In addition, there were payments under retirement benefit agreements with former Directors of US$1,269,160 (2013: US$1,198,744). The provision at 31 December 2014 in respect of unfunded pension obligations to former Directors amounted to US$19,419,524 (2013: US$19,729,103).
During the year, aggregate contributions to pension schemes in respect of Directors were nil (2013: nil).
The salary and other emoluments figure includes fixed pay allowances. Discretionary annual incentives for Directors are based on a combination of individual and corporate performance and are determined by the Group Remuneration Committee. Details of Directors’ remuneration, share options and awards under the HSBC Share Plan and HSBC Share Plan 2011 are included in the ‘Directors’ Remuneration Report’ on page 300 to 327.
7 Auditors’ remuneration
2014 2013 2012 US$m US$m US$m
Audit fees payable to KPMG1 40.6 43.4 47.2 Audit fees payable to non-KPMG entities 1.2 1.1 1.4
Year ended 31 December 41.8 44.5 48.6
1 Fees payable to KPMG for HSBC Holdings’ statutory audit and audit of HSBC’s subsidiaries, pursuant to legislation and includes fees payable for the current year. Excluded from the 2014 audit fees payable to KPMG is a net release of accruals of US$2.5 million relating to prior years and fees related to the transition of the audit to PwC of US$1.3 million.
The following fees were payable by HSBC to the Group’s principal auditor, KPMG Audit Plc and its associates (together ‘KPMG’):

HSBC HOLDINGS PLC
365
Str
ateg
ic R
epo
rt
Fi
nan
cial
Rev
iew
Co
rpo
rate
Go
vern
ance
Fin
anci
al S
tate
men
ts
S
har
eho
lder
Info
rmat
ion
Fees payable by HSBC to KPMG 2014 2013 2012 US$m US$m US$m
Fees for HSBC Holdings’ statutory audit1 13.4 12.9 13.2 – relating to current year 13.4 12.6 12.8 – relating to prior year – 0.3 0.4
Fees for other services provided to HSBC 62.5 67.5 67.3 Audit of HSBC’s subsidiaries2 27.2 30.5 34.0 Audit-related assurance services3 22.6 27.4 23.6 Taxation-related services:
– taxation compliance services 1.5 1.3 2.1 – taxation advisory services 0.8 1.3 1.3
Other assurance services 0.7 0.5 1.1 Other non-audit services4 9.7 6.5 5.2
Year ended 31 December 75.9 80.4 80.5
1 Fees payable to KPMG for the statutory audit of the consolidated financial statements of HSBC and the separate financial statements of HSBC Holdings. They include amounts payable for services relating to the consolidation returns of HSBC Holdings’ subsidiaries which are clearly identifiable as being in support of the Group audit opinion. Excluded from the 2014 fees is US$0.3m related to prior year and fees related to the transition of the audit to PwC of US$1.3m.
2 Fees payable for the statutory audit of the financial statements of HSBC’s subsidiaries. Excluded from the 2014 fees is a net release of accruals of US$2.8m relating to prior years.
3 Including services for assurance and other services that relate to statutory and regulatory filings, including comfort letters and interim reviews. 4 Including valuation and actuarial services, translation services, ad-hoc accounting advice, review of financial models, advice on IT security and
business continuity, corporate finance transactions and performing agreed-upon IT testing procedures.
No fees were payable by HSBC to KPMG for the following types of services: internal audit services, services related to litigation, recruitment and remuneration.
Fees payable by HSBC’s associated pension schemes to KPMG 2014 2013 2012 US$000 US$000 US$000
Audit of HSBC’s associated pension schemes 322 379 256 Audit related assurance services 5 5 –
Year ended 31 December 327 384 256
No fees were payable by HSBC’s associated pension schemes to KPMG for the following types of services: audit related assurance services, internal audit services, other assurance services, services related to corporate finance transactions, valuation and actuarial services, litigation, recruitment and remuneration, and information technology.
In addition to the above, KPMG estimate they have been paid fees of US$3.6m (2013: US$5.3m; 2012: US$3.3m) by parties other than HSBC but where HSBC is connected with the contracting party and may therefore be involved in appointing KPMG. These fees arise from services such as auditing mutual funds managed by HSBC and reviewing the financial position of corporate concerns which borrow from HSBC.
Fees payable to KPMG for non-audit services for HSBC Holdings are not disclosed separately because such fees are disclosed on a consolidated basis for the HSBC Group.
8 Tax
Accounting policy
Income tax comprises current tax and deferred tax. Income tax is recognised in the income statement except to the extent that it relates to items recognised in other comprehensive income or directly in equity, in which case it is recognised in the same statement in which the related item appears. Current tax is the tax expected to be payable on the taxable profit for the year, calculated using tax rates enacted or substantively enacted by the balance sheet date, and any adjustment to tax payable in respect of previous years. HSBC provides for potential current tax liabilities that may arise on the basis of the amounts expected to be paid to the tax authorities. Current tax assets and liabilities are offset when HSBC intends to settle on a net basis and the legal right to offset exists. Deferred tax is recognised on temporary differences between the carrying amounts of assets and liabilities in the balance sheet and the amounts attributed to such assets and liabilities for tax purposes. Deferred tax liabilities are generally recognised for all taxable temporary differences and deferred tax assets are recognised to the extent that it is probable that future taxable profits will be available against which deductible temporary differences can be utilised. Deferred tax is calculated using the tax rates expected to apply in the periods in which the assets will be realised or the liabilities settled, based on tax rates and laws enacted, or substantively enacted, by the balance sheet date. Deferred tax assets and liabilities are offset when they arise in the same tax reporting group and relate to income taxes levied by the same taxation authority, and when HSBC has a legal right to offset.

Notes on the Financial Statements (continued) 8 – Tax
HSBC HOLDINGS PLC
366
Deferred tax relating to actuarial gains and losses on post-employment benefits is recognised in other comprehensive income. Deferred tax relating to share-based payment transactions is recognised directly in equity to the extent that the amount of the estimated future tax deduction exceeds the amount of the related cumulative remuneration expense. Deferred tax relating to fair value re-measurements of available-for-sale investments and cash flow hedging instruments is charged or credited directly to other comprehensive income and is subsequently recognised in the income statement when the deferred fair value gain or loss is recognised in the income statement.
Critical accounting estimates and judgements
Deferred tax assets The recognition of a deferred tax asset relies on an assessment of the probability and sufficiency of future taxable profits, future reversals of existing taxable temporary differences and ongoing tax planning strategies. In absence of a history of taxable profits, the most significant judgements relate to expected future profitability and to the applicability of tax planning strategies, including corporate reorganisations. Our US operations have a history of tax losses, but profitability is expected to improve. Tax planning strategies support the recognition of deferred tax assets in the US, with retention of capital in the US operations being a significant factor in recognising the deferred tax assets. Given the recent occurrence of tax losses, the recognition of deferred tax assets in Brazil takes into consideration both the reliance placed on management's projection of income and on the use of strategies, such as corporate reorganisations and other initiatives, to improve the profitability of our Brazilian banking operations from a tax perspective.
Tax expense 2014 2013 2012 US$m US$m US$mCurrent tax UK corporation tax 69 (8) 250
– for this year 54 103 60– adjustments in respect of prior years 15 (111) 190
Overseas tax1 3,881 3,949 5,560– for this year 4,423 3,947 5,421– adjustments in respect of prior years (542) 2 139
3,950 3,941 5,810
Deferred tax 25 824 (495)– origination and reversal of temporary differences (477) 739 (269)– effect of changes in tax rates 83 93 66– adjustments in respect of prior years 419 (8) (292)
Year ended 31 December 3,975 4,765 5,315
1 Overseas tax included Hong Kong profits tax of US$1,135m (2013: US$1,133m; 2012: US$1,049m). The Hong Kong tax rate applying to the profits of subsidiaries assessable in Hong Kong was 16.5% (2013: 16.5%; 2012: 16.5%). Other overseas subsidiaries and overseas branches provided for taxation at the appropriate rates in the countries in which they operate.
Tax reconciliation
The tax charged to the income statement differs from the tax charge that would apply if all profits had been taxed at the UK corporation tax rate as follows: 2014 2013 2012 US$m % US$m % US$m %
Profit before tax 18,680 22,565 20,649
Tax expense Tax at 21.5% (2013: 23.25%; 2012: 24.5%) 4,016 21.5 5,246 23.25 5,057 24.5Effect of differently taxed overseas profits 33 0.2 (177) (0.8) (57) (0.3)Adjustments in respect of prior period liabilities (108) (0.6) (117) (0.5) 37 0.2Deferred tax temporary differences not recognised/
(previously not recognised) (154) (0.8) 332 1.5
374 1.8 Effect of profits in associates and joint ventures (547) (2.9) (543) (2.4) (872) (4.3)Tax effect of disposal of Ping An – – (111) (0.5) (204) (1.0)Tax effect of reclassification of Industrial Bank – – (317) (1.4) – –Non-taxable income and gains (668) (3.5) (871) (3.9) (542) (2.6)Permanent disallowables 969 5.1 647 2.9 1,092 5.3Change in tax rates 22 0.1 93 0.4 78 0.4Local taxes and overseas withholding taxes 434 2.3 551 2.4 581 2.8Other items (22) (0.1) 32 0.1 (229) (1.1)
Year ended 31 December 3,975 21.3 4,765 21.1 5,315 25.7

HSBC HOLDINGS PLC
367
Str
ateg
ic R
epo
rt
Fi
nan
cial
Rev
iew
Co
rpo
rate
Go
vern
ance
Fin
anci
al S
tate
men
ts
S
har
eho
lder
Info
rmat
ion
The effective tax rate for the year was 21.3% compared with 21.1% for 2013. The effective tax rate for the year reflected the recurring benefits from tax exempt income from government bonds and equities held by a number of Group entities and recognition of the Group’s share of post-tax profits of associates and joint ventures within our pre-tax income, together with a current tax credit for prior periods offset in part by non-tax-deductible settlements and provision in connection with foreign exchange investigations. The effective tax rate in 2013 was lower because of benefits from non-taxable gains offset in part by a write-down of deferred tax assets.
The main rate of corporation tax in the UK reduced from 23% to 21% on 1 April 2014 and will be further reduced to 20% on 1 April 2015. The reduction in the corporate tax rate to 20% was enacted through the 2013 Finance Act on 17 July 2013. It is not expected that the future rate reduction will have a significant effect on the Group.
The Group’s legal entities are subject to routine review and audit by tax authorities in the territories in which the Group operates. Where the ultimate tax treatment is uncertain, the Group provides for potential tax liabilities that may arise on the basis of the amounts expected to be paid to the tax authorities. The amounts ultimately paid may differ materially from the amounts provided depending on the ultimate resolution of such matters.
Deferred taxation
The table overleaf shows the gross deferred tax assets and liabilities recognised in the balance sheet and the related amounts recognised in the income statement, other comprehensive income and directly in equity.
The amounts presented in the balance sheet are different from the amounts disclosed in the table overleaf as they are presented after offsetting asset and liability balances where HSBC has the legal right to set-off and intends to settle on a net basis. The net deferred tax assets totalled US$5.6bn at 31 December 2014 (2013: US$6.5bn). The main items to note are:
US
The net deferred tax asset relating to HSBC’s operations in the US was US$4.1bn (2013: US$4.4bn). The deferred tax assets included in this total reflected the carry forward of tax losses and tax credits of US$0.9bn (2013: US$0.7bn), deductible temporary differences in respect of loan impairment allowances of US$0.8bn (2013: US$1.2bn) and other temporary differences of US$2.4bn (2013: US$2.5bn).
Deductions for loan impairments for US tax purposes generally occur when the impaired loan is charged off, or if earlier, when the impaired loan is sold. The tax deduction is often in the period subsequent to that in which the impairment is recognised for accounting purposes. As a result, the amount of the associated deferred tax asset should generally move in line with the impairment allowance balance.
On the evidence available, including historical levels of profitability, management projections of future income and HSBC Holdings’ commitment to continue to retain sufficient capital in North America to recover the deferred tax asset, it is expected that there will be sufficient taxable income generated by the business to realise these assets.
Management projections of profits from the US operations currently indicate that tax losses and tax credits will be fully recovered by 2017. The current level of the deferred tax asset in respect of loan impairment allowances and other deductible temporary differences is projected to reduce over the next four years.
As there has been a recent history of losses in HSBC’s US operations, management’s analysis of the recognition of these deferred tax assets significantly discounts any future expected profits from the US operations and relies on capital support from HSBC Holdings, including tax planning strategies in relation to such support. The principal strategy involves generating future taxable profits through the retention of capital in the US in excess of normal regulatory requirements in order to reduce deductible funding expenses or otherwise deploy such capital to increase levels of taxable income. As financial performance in our US operations improves it is expected that projected future profits from US operations will be relied on in the evaluation of the recognition of the deferred tax asset in future periods as the sustainability of the improving financial performance is demonstrated.
Brazil
The net deferred tax asset relating to HSBC’s operations in Brazil was US$1.3bn (2013: US$1.0bn). The deferred tax assets included in this total reflected the carry forward of tax losses of US$0.3bn (2013: US$0.1bn), deductible temporary differences in respect of loan impairment allowances of US$0.7bn (2013: US$0.7bn) and other temporary differences of US$0.3bn (2013: US$0.2bn).
Deductions for loan impairments for Brazilian tax purposes generally occur when the impaired loan is charged off, often in the period subsequent to that in which the impairment is recognised for accounting purposes. As a result, the amount of the associated deferred tax asset should generally move in line with the impairment allowance balance.
Management projections of profits from the Brazilian banking operations currently indicate that the tax losses and other temporary differences will be substantially recovered within the next five to eight years. Loan impairment deductions are recognised for tax purposes typically within two to three years of the accounting recognition.

Notes on the Financial Statements (continued) 8 – Tax
HSBC HOLDINGS PLC
368
Mexico
The net deferred tax asset relating to HSBC’s operations in Mexico was US$0.5bn (2013: US$0.5bn). The deferred tax assets included in this total related primarily to deductible temporary differences in respect of accounting provisions for impaired loans.
Management’s analysis of the recognition of these deferred tax assets relies on the primary strategy of selling certain loan portfolios, the losses on which are deductible for tax in Mexico when sold. Any such deductions for tax would lead to the reversal of the carried forward loan impairment provision recognised for deferred tax purposes. The deferred tax balances are carried forward to future years without expiry.
In September 2013, the Mexican Government proposed a number of tax reforms that were approved by the Chamber of Senate in October 2013 and published in the Official Gazette in December 2013. The tax reforms included a new basis of tax deduction for loan impairment charges that will allow banks to recognise tax deductions as and when loans are written off the balance sheet. The reforms also brought in transitional rules to allow banks to continue to claim any unclaimed deductions as at 31 December 2013. On 4 July 2014, the Mexican Government issued rule I.3.22.5 of the Miscellaneous Tax Resolution that clarified the treatment of the transitional rules, but had no impact on the deferred tax assets held in our operations in Mexico.
On the evidence available, including historical and projected levels of loan portfolio growth, loan impairment rates and profitability, it is expected that the business will realise these assets over the next five years.
There were no material carried forward tax losses or tax credits recognised within the Group’s deferred tax assets in Mexico.
UK
The net deferred tax liability relating to HSBC’s operations in the UK was US$0.4bn (2013: asset of US$0.4bn). The deferred tax liabilities included in this total related primarily to retirement benefits.
There were no material carried forward tax losses or tax credits recognised within the Group’s deferred tax assets in the UK.
Unrecognised deferred tax
The amount of temporary differences, unused tax losses and tax credits for which no deferred tax asset is recognised in the balance sheet was US$22.6bn (2013: US$22.0bn). These amounts included unused state losses arising in our US operations of US$14.1bn (2013: US$17.3bn).
Of the total amounts unrecognised, US$4.2bn (2013: US$5.0bn) had no expiry date, US$0.9bn (2013: US$1.0bn) was scheduled to expire within 10 years and the remaining will expire after 10 years.
Deferred tax is not recognised in respect of the Group’s investments in subsidiaries and branches where remittance or other realisation is not probable, and for those associates and interests in joint ventures where it has been determined that no additional tax will arise. No amount is disclosed for the unrecognised deferred tax or the 2014 and 2013 temporary differences associated with such investments as it is impracticable to determine the amount of income taxes that would be payable when any temporary differences reverse. Deferred tax of US$132m (2013: US$20m) has, however, been provided in respect of distributable reserves of associates that, on distribution, would attract withholding tax.
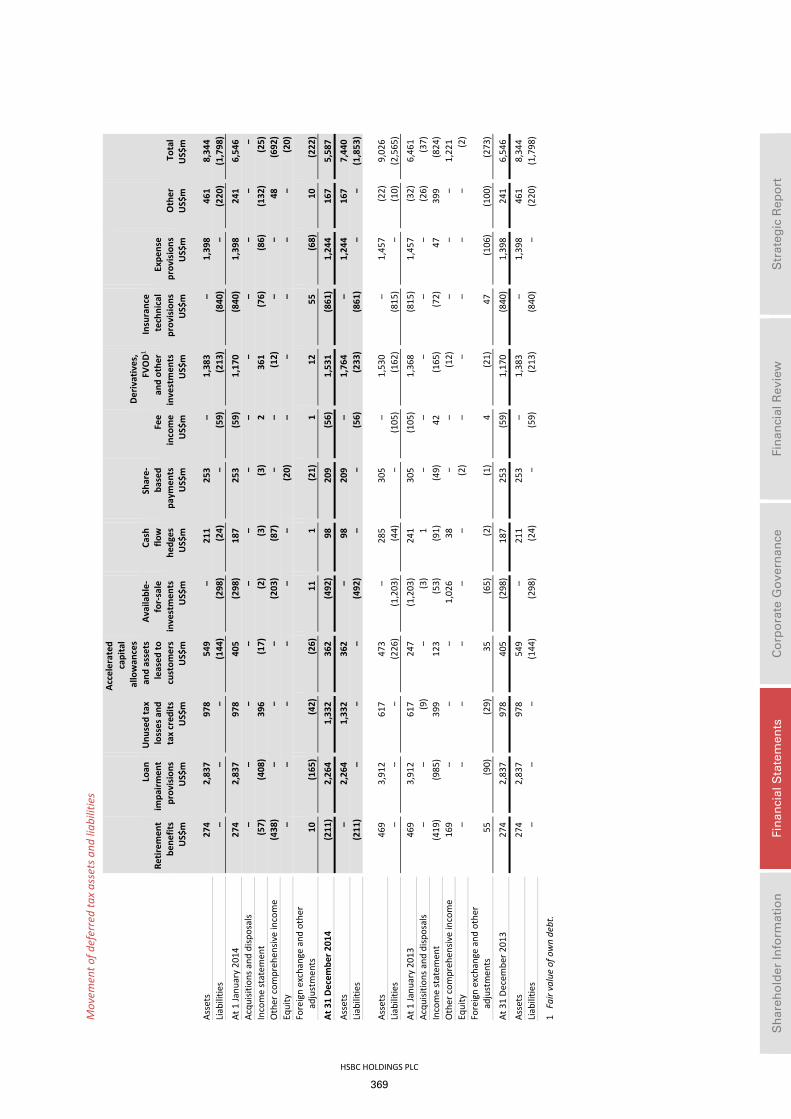
HSBC HOLDINGS PLC
369
Sh
areh
old
er In
form
atio
n
Fi
nan
cial
Sta
tem
ents
C
orp
ora
te G
ove
rnan
ce
Fi
nan
cial
Rev
iew
S
trat
egic
Rep
ort
Mov
emen
t of d
efer
red
tax
asse
ts a
nd li
abili
ties
Retir
emen
t be
nefit
s
Loan
impa
irmen
tpr
ovis
ions
Unu
sed
tax
loss
es a
ndta
x cr
edits
Acce
lera
ted
capi
tal
allo
wan
ces
and
asse
tsle
ased
tocu
stom
ers
Avai
labl
e-fo
r-sa
lein
vest
men
ts
Cash
flow
hedg
es
Shar
e-
base
d pa
ymen
ts
Fee
inco
me
Der
ivat
ives
, F
VOD
1
and
othe
rin
vest
men
ts
Insu
ranc
ete
chni
cal
prov
isio
ns
Expe
nse
prov
isio
ns
Oth
er
Tota
l
US$
m
US$
mU
S$m
US$
mU
S$m
US$
mU
S$m
U
S$m
US$
mU
S$m
US$
mU
S$m
US$
m
Asse
ts
274
2,83
797
854
9–
211
253
–1,
383
–1,
398
461
8,34
4Li
abili
ties
– –
–(1
44)
(298
)(2
4)–
(59)
(213
)(8
40)
–(2
20)
(1,7
98)
At 1
Janu
ary
2014
274
2,83
797
840
5(2
98)
187
253
(59)
1,17
0(8
40)
1,39
824
16,
546
Acqu
isitio
ns a
nd d
ispos
als
– –
––
––
– –
––
––
–In
com
e st
atem
ent
(57)
(4
08)
396
(17)
(2)
(3)
(3)
236
1(7
6)(8
6)(1
32)
(25)
O
ther
com
preh
ensiv
e in
com
e (4
38)
––
–(2
03)
(87)
– –
(12)
––
48(6
92)
Equi
ty
– –
––
––
(20)
–
––
––
(20)
Fo
reig
n ex
chan
ge a
nd o
ther
ad
just
men
ts
10
(165
)(4
2)(2
6)11
1
(21)
1
12
55
(68)
10
(222
)
At 3
1 De
cem
ber 2
014
(211
) 2,
264
1,33
236
2(4
92)
9820
9 (5
6)1,
531
(861
)1,
244
167
5,58
7
Asse
ts
– 2,
264
1,33
236
2–
9820
9 –
1,76
4–
1,24
416
77,
440
Liab
ilitie
s (2
11)
––
–(4
92)
––
(56)
(233
)(8
61)
––
(1,8
53)
As
sets
46
9 3,
912
617
473
–28
530
5 –
1,53
0–
1,45
7(2
2)9,
026
Liab
ilitie
s –
––
(226
)(1
,203
)(4
4)–
(105
)(1
62)
(815
)–
(10)
(2,5
65)
At 1
Janu
ary
2013
469
3,91
261
724
7(1
,203
)24
130
5 (1
05)
1,36
8(8
15)
1,45
7(3
2)6,
461
Acqu
isitio
ns a
nd d
ispos
als
– –
(9)
–(3
)1
– –
––
–(2
6)(3
7)
Inco
me
stat
emen
t (4
19)
(985
)39
912
3(5
3)(9
1)(4
9)
42(1
65)
(72)
4739
9(8
24)
Oth
er c
ompr
ehen
sive
inco
me
169
––
–1,
026
38–
–(1
2)–
––
1,22
1Eq
uity
–
––
––
–(2
) –
––
––
(2)
Fore
ign
exch
ange
and
oth
er
adju
stm
ents
55
(9
0)(2
9)35
(6
5)(2
)(1
) 4
(21)
47
(106
)(1
00)
(273
)
At 3
1 De
cem
ber 2
013
274
2,83
797
840
5(2
98)
187
253
(59)
1,17
0(8
40)
1,39
824
16,
546
Asse
ts
274
2,83
797
854
9–
211
253
–1,
383
–1,
398
461
8,34
4Li
abili
ties
– –
–(1
44)
(298
)(2
4)–
(59)
(213
)(8
40)
–(2
20)
(1,7
98)
1 Fa
ir va
lue
of o
wn
debt
.

Notes on the Financial Statements (continued) 9 – Dividends / 10 – Earnings per share / 11 – Segmental analysis
HSBC HOLDINGS PLC
370
HSBC Holdings
Movement of deferred tax assets
Acceleratedcapital
allowances
Available-for-sale
investments Other
Investments
Share- based
payments
Other short- term timing differences Total
US$m US$m US$m US$m US$m US$m
At 1 January 2014 2 (23) 19 11 4 13Income statement – – 3 2 1 6Other comprehensive income – (36) – – – (36)
At 31 December 2014 2 (59) 22 13 5 (17) At 1 January 2013 2 (31) 31 12 – 14Income statement – – (12) (1) 4 (9)Other comprehensive income – 8 – – – 8
At 31 December 2013 2 (23) 19 11 4 13
The amount of unused tax losses for which no deferred tax asset is recognised in the balance sheet was US$3,760m (2013: US$3,405m) of which US$10m (2013: US$9m) relate to capital losses. On the evidence available, including historical levels of profitability and management projections of future income, it is expected that there will be not sufficient taxable income generated by the business to recover the tax losses carried forward by HSBC Holdings. The losses have no expiry date.
9 Dividends
Dividends to shareholders of the parent company 2014 2013 2012
Per share US$
Total US$m
Settled in scrip US$m
Per share US$
Total US$m
Settled in scrip US$m
Per share US$
Total US$m
Settled in scrip US$m
Dividends paid on ordinary shares In respect of previous year:
– fourth interim dividend 0.19 3,582 1,827 0.18 3,339 540 0.14 2,535 259In respect of current year:
– first interim dividend 0.10 1,906 284 0.10 1,861 167 0.09 1,633 748– second interim dividend 0.10 1,914 372 0.10 1,864 952 0.09 1,646 783– third interim dividend 0.10 1,918 226 0.10 1,873 864 0.09 1,655 639
Total 0.49 9,320 2,709 0.48 8,937 2,523 0.41 7,469 2,429Total dividends on preference shares
classified as equity (paid quarterly)
62.00 90 62.00 90 62.00 90
Total coupons on capital securities classified as equity 2014 2013 2012 First Per security Total Per security Total Per security Total
call date US$ US$m US$ US$m US$ US$m
Perpetual subordinated capital securities1 – US$2,200m Apr 2013 2.032 179 2.032 179 2.032 179– US$3,800m Dec 2015 2.000 304 2.000 304 2.000 304
Total 483 483 483
1 Coupons are paid quarterly on the perpetual subordinated capital securities.
The Directors declared after the end of the year a fourth interim dividend in respect of the financial year ended 31 December 2014 of US$0.20 per ordinary share, a distribution of approximately US$3,844m. The fourth interim dividend will be payable on 30 April 2015 to holders of record on 6 March 2015 on the Principal Register in the UK, the Hong Kong or the Bermuda Overseas Branch registers. No liability is recorded in the financial statements in respect of the fourth interim dividend for 2014.
On 15 January 2015, HSBC paid a coupon on the perpetual subordinated capital securities of US$0.508 per security, a distribution of US$45m. No liability was recorded in the balance sheet at 31 December 2014 in respect of this coupon payment.
In September 2014, HSBC issued three contingent convertible securities as set out on page 438 which are classified as equity under IFRSs. Coupons are paid semi-annually on the contingent convertible securities and none fell due in 2014. On 20 January 2015, HSBC paid a coupon on one of the contingent convertible securities of US$28.125 per security, a distribution of US$28m. No liability was recorded in the balance sheet at 31 December 2014 in respect of this coupon payment.

HSBC HOLDINGS PLC
371
Str
ateg
ic R
epo
rt
Fi
nan
cial
Rev
iew
Co
rpo
rate
Go
vern
ance
Fin
anci
al S
tate
men
ts
S
har
eho
lder
Info
rmat
ion
The reserves available for distribution at 31 December 2014 were US$48,883m.
10 Earnings per share
‘Basic earnings per ordinary share’ is calculated by dividing the profit attributable to ordinary shareholders of the parent company by the weighted average number of ordinary shares outstanding, excluding own shares held. ‘Diluted earnings per ordinary share’ is calculated by dividing the basic earnings, which require no adjustment for the effects of dilutive potential ordinary shares, by the weighted average number of ordinary shares outstanding, excluding own shares held, plus the weighted average number of ordinary shares that would be issued on conversion of dilutive potential ordinary shares.
Profit attributable to the ordinary shareholders of the parent company 2014 2013 2012 US$m US$m US$m
Profit attributable to shareholders of the parent company 13,688 16,204 14,027Dividend payable on preference shares classified as equity (90) (90) (90)Coupon payable on capital securities classified as equity (483) (483) (483)
Year ended 31 December 13,115 15,631 13,454
Basic and diluted earnings per share 2014 2013 2012 Profit US$m
Number of shares (millions)
Per share US$
Profit US$m
Number of shares (millions)
Per share US$
Profit US$m
Number of shares (millions)
Per share US$
Basic1 13,115 18,960 0.69 15,631 18,530 0.84 13,454 18,125 0.74Effect of dilutive potential ordinary shares – 96 – – 124 – – 146 –
Diluted1 13,115 19,056 0.69 15,631 18,654 0.84 13,454 18,271 0.74
1 Weighted average number of ordinary shares outstanding (basic) or assuming dilution (diluted).
The weighted average number of dilutive potential ordinary shares excluded 6m employee share options that were anti-dilutive (2013: 60m; 2012: 103m).
11 Segmental analysis
Accounting policy
HSBC has a matrix management structure. HSBC’s chief operating decision-maker is the Group Management Board (‘GMB’) which operates as a general management committee under the direct authority of the Board. The GMB regularly reviews operating activity on a number of bases, including by geographical region and by global business. HSBC considers that geographical operating segments represent the most appropriate information for the users of the financial statements to best evaluate the nature and financial effects of the business activities in which HSBC engages, and the economic environments in which it operates. This reflects the importance of geographical factors on business strategy and performance, the allocation of capital resources, and the role of geographical regional management in executing strategy. As a result, HSBC’s operating segments are considered to be geographical regions. Geographical information is classified by the location of the principal operations of the subsidiary or, for The Hongkong and Shanghai Banking Corporation, HSBC Bank, HSBC Bank Middle East and HSBC Bank USA, by the location of the branch responsible for reporting the results or providing funding. Measurement of segmental assets, liabilities, income and expenses is in accordance with the Group’s accounting policies. Segmental income and expenses include transfers between segments and these transfers are conducted at arm’s length. Shared costs are included in segments on the basis of the actual recharges made. The expense of the UK bank levy is included in the Europe geographical region as HSBC regards the levy as a cost of carrying on business and being headquartered in the UK.
Products and services
HSBC provides a comprehensive range of banking and related financial services to its customers in its five geographical regions. The products and services offered to customers are organised by global business.
• Retail Banking and Wealth Management (‘RBWM’) offers a broad range of products and services to meet the personal banking and wealth management needs of individual customers. Typically, customer offerings include personal banking products (current and savings accounts, mortgages and personal loans, credit cards, debit cards and local and international payment services) and wealth management services (insurance and investment products, global asset management services and financial planning services).
• Commercial Banking (‘CMB’) offers a broad range of products and services to serve the needs of our commercial customers, including small and medium-sized enterprises, mid-market enterprises and corporates. These include credit and lending, international trade and receivables finance, treasury management and liquidity solutions (payments and cash management and commercial cards), commercial insurance and investments. CMB also offers its customers access to products and services offered by other global businesses, for example Global Banking & Markets (‘GB&M’),

Notes on the Financial Statements (continued) 11 – Segmental analysis
HSBC HOLDINGS PLC
372
which include foreign exchange products, raising capital on debt and equity markets and advisory services.
• GB&M provides tailored financial solutions to major government, corporate and institutional clients and private investors worldwide. The client-focused business lines deliver a full range of banking capabilities including financing, advisory and transaction services, a markets business that provides services in credit, rates, foreign exchange, equities, money markets and securities services, and principal investment activities.
• Global Private Banking (‘GPB’) provides a range of services to high net worth individuals and families with complex and international needs within the Group’s priority markets.
Change in operating segments
HSBC’s operating segments are Europe, Asia, Middle East and North Africa (‘MENA’), North America and Latin America. Previously, HSBC’s operating segments were reported as Europe, Hong Kong, Rest of Asia-Pacific, Middle East and North Africa, North America and Latin America. Hong Kong and Rest of Asia-Pacific are no longer regarded as separate reportable operating segments, having considered the geographical financial information presented to the chief operating decision maker. From 1 January 2014, they have been replaced by a new operating segment, ‘Asia’, which better aligns with internal management information used for evaluation when making business decisions and resource allocations. The chief operating decision-maker continues to be the GMB and the basis for measuring segmental results has not changed. Comparative financial information has been re-presented accordingly.
There has been no change in the underlying business operations comprising the Asia segment. Reported net operating income in Asia for the year to 31 December 2014 was US$23,677m (31 December 2013: US$24,432m; 31 December 2012: US$25,332m). This was US$713m lower (31 December 2013: US$749m lower; 31 December 2012: US$674m lower) than would be calculated by adding net operating income reported for Hong Kong and Rest of Asia-Pacific on an individual basis. The reduction in net operating income is offset by an equal decrease in operating expenses. The difference relates to shared service recharges and business activity undertaken between the two regions which form revenue or expense on an individual basis, but are eliminated as ‘intra-segment’ activity when reported as Asia. There is no difference between profit before tax reported for Asia and that which would be calculated by adding the profit before tax of Hong Kong and Rest of Asia-Pacific on an individual basis.
Profit/(loss) for the year
Europe Asia MENA
North America
Latin America
Intra- HSBC items
Total
US$m US$m US$m US$m US$m US$m US$m2014 Net interest income 10,611 12,273 1,519 5,015 5,310 (23) 34,705Net fee income 6,042 5,910 650 1,940 1,415 15,957Net trading income 2,534 2,622 314 411 856 23 6,760Other income 2,384 2,872 65 786 691 (2,972) 3,826
Net operating income1 21,571 23,677 2,548 8,152 8,272 (2,972) 61,248
Loan impairment (charges)/recoveries and other credit risk provisions (764) (647) 6 (322) (2,124) (3,851)
Net operating income 20,807 23,030 2,554 7,830 6,148 (2,972) 57,397
Employee compensation and benefits (8,191) (5,862) (676) (3,072) (2,565) (20,366)General and administrative expenses (11,076) (3,959) (500) (3,108) (2,894) 2,972 (18,565)Depreciation and impairment of
property, plant and equipment (543) (389) (28) (180) (242) (1,382)Amortisation and impairment of
intangible assets (407) (217) (12) (69) (231) (936)
Total operating expenses (20,217) (10,427) (1,216) (6,429) (5,932) 2,972 (41,249)
Operating profit 590 12,603 1,338 1,401 216 16,148
Share of profit in associates and joint ventures 6 2,022 488 16 2,532
Profit before tax 596 14,625 1,826 1,417 216 18,680
Tax expense (853) (2,542) (339) (195) (46) (3,975)
Profit/(loss) for the year (257) 12,083 1,487 1,222 170 14,705

HSBC HOLDINGS PLC
373
Str
ateg
ic R
epo
rt
Fi
nan
cial
Rev
iew
Co
rpo
rate
Go
vern
ance
Fin
anci
al S
tate
men
ts
S
har
eho
lder
Info
rmat
ion
Profit/(loss) for the year (continued)
Europe Asia MENA
North America
Latin America
Intra- HSBC items
Total
US$m US$m US$m US$m US$m US$m US$m2013 Net interest income 10,693 11,432 1,486 5,742 6,186 – 35,539Net fee income 6,032 5,936 622 2,143 1,701 – 16,434Net trading income 4,423 2,026 357 948 936 – 8,690Other income/(expense) (181) 5,038 38 (30) 1,745 (2,628) 3,982
Net operating income1 20,967 24,432 2,503 8,803 10,568 (2,628) 64,645
Loan impairment (charges)/recoveries and other credit risk provisions (1,530) (498) 42 (1,197) (2,666) – (5,849)
Net operating income 19,437 23,934 2,545 7,606 7,902 (2,628) 58,796
Employee compensation and benefits (7,175) (5,666) (634) (3,098) (2,623) – (19,196)General and administrative expenses (9,479) (3,660) (607) (3,051) (2,896) 2,628 (17,065)Depreciation and impairment of property,
plant and equipment (559) (392) (35) (176) (202) – (1,364)Amortisation and impairment of intangible
assets (400) (218) (13) (91) (209) – (931)
Total operating expenses (17,613) (9,936) (1,289) (6,416) (5,930) 2,628 (38,556)
Operating profit 1,824 13,998 1,256 1,190 1,972 – 20,240
Share of profit in associates and joint ventures 1 1,855 438 31 – – 2,325
Profit before tax 1,825 15,853 1,694 1,221 1,972 – 22,565
Tax expense (1,279) (2,170) (328) (313) (675) – (4,765)
Profit for the year 546 13,683 1,366 908 1,297 – 17,800 2012 Net interest income 10,394 10,707 1,470 8,117 6,984 – 37,672Net fee income 6,169 5,418 595 2,513 1,735 – 16,430Net trading income 2,707 2,516 390 507 971 – 7,091Gains on disposal of US branch network,
US cards business and Ping An – 3,012 – 4,012 – – 7,024 Other income/(expense) (1,662) 3,679 (25) (456) 1,261 (2,684) 113
Net operating income1 17,608 25,332 2,430 14,693 10,951 (2,684) 68,330
Loan impairment charges and other credit risk provisions (1,921) (510) (286) (3,457) (2,137) – (8,311)
Net operating income 15,687 24,822 2,144 11,236 8,814 (2,684) 60,019
Employee compensation and benefits (8,070) (5,712) (652) (3,243) (2,814) – (20,491)General and administrative expenses (10,059) (3,619) (459) (5,413) (3,117) 2,684 (19,983)Depreciation and impairment of property,
plant and equipment (597) (427) (44) (195) (221) – (1,484)Amortisation and impairment of intangible
assets (369) (222) (11) (89) (278) – (969)
Total operating expenses (19,095) (9,980) (1,166) (8,940) (6,430) 2,684 (42,927)
Operating profit/(loss) (3,408) 14,842 978 2,296 2,384 – 17,092
Share of profit/(loss) in associates and joint ventures (6) 3,188 372 3 – – 3,557
Profit/(loss) before tax (3,414) 18,030 1,350 2,299 2,384 – 20,649
Tax expense (173) (2,711) (254) (1,313) (864) – (5,315)
Profit/(loss) for the year (3,587) 15,319 1,096 986 1,520 – 15,334
1 Net operating income before loan impairment charges and other credit risk provisions, also referred to as revenue.

Notes on the Financial Statements (continued) 11 – Segmental analysis
HSBC HOLDINGS PLC
374
Other information about the profit/(loss) for the year
Europe Asia MENA
North America
Latin America
Intra- HSBC items
Total
US$m US$m US$m US$m US$m US$m US$m2014 Net operating income1 21,571 23,677 2,548 8,152 8,272 (2,972) 61,248
– external 20,450 22,071 2,524 7,937 8,266 – 61,248– inter-segment 1,121 1,606 24 215 6 (2,972) –
Profit for the year includes the following significant non-cash items: Depreciation, amortisation and
impairment 950 606 40 182 473 – 2,251 Loan impairment losses gross of
recoveries and other credit risk provisions 1,066 800 37 437 2,466 – 4,806
Impairment of financial investments (256) 286 – 14 10 – 54Changes in fair value of long-term debt
and related derivatives 614 (4) (3) (99) – – 508 Restructuring costs 117 7 2 28 57 – 211 2013 Net operating income1 20,967 24,432 2,503 8,803 10,568 (2,628) 64,645
– external 20,108 22,853 2,497 8,569 10,618 – 64,645 – inter-segment 859 1,579 6 234 (50) (2,628) –
Profit for the year includes the following significant non-cash items: Depreciation, amortisation and
impairment 957 610 48 303 412 – 2,330 Loan impairment losses gross of
recoveries and other credit risk provisions 2,165 665 45 1,321 2,949 – 7,145
Impairment of financial investments (61) 4 – 15 6 – (36)Changes in fair value of long-term debt
and related derivatives (936) (1) (3) (288) – – (1,228)Restructuring costs 211 79 3 100 42 – 435 2012 Net operating income1 17,608 25,332 2,430 14,693 10,951 (2,684) 68,330
– external 16,405 23,893 2,455 14,566 11,011 – 68,330– inter-segment 1,203 1,439 (25) 127 (60) (2,684) –
Profit for the year includes the following significant non-cash items: Depreciation, amortisation and
impairment 966 649 55 363 499 – 2,532 Loan impairment losses gross of
recoveries and other credit risk provisions 2,329 691 361 3,587 2,489 – 9,457
Impairment of financial investments 420 62 1 32 4 – 519Changes in fair value of long-term debt
and related derivatives (3,091) (4) (13) (1,219) – – (4,327)Restructuring costs 292 128 27 219 94 – 760
1 Net operating income before loan impairment charges and other credit risk provisions, also referred to as revenue.

HSBC HOLDINGS PLC
375
Str
ateg
ic R
epo
rt
Fi
nan
cial
Rev
iew
Co
rpo
rate
Go
vern
ance
Fin
anci
al S
tate
men
ts
S
har
eho
lder
Info
rmat
ion
Balance sheet information
Europe Asia MENA
North America
Latin America
Intra- HSBC items
Total
US$m US$m US$m US$m US$m US$m US$mAt 31 December 2014 Loans and advances to customers 409,733 362,955 29,063 129,787 43,122 – 974,660Interests in associates and joint ventures 175 14,958 2,955 83 10 – 18,181Total assets 1,290,926 878,723 62,417 436,859 115,354 (150,140) 2,634,139Customer accounts 545,959 577,491 39,720 138,884 48,588 – 1,350,642Total liabilities 1,223,371 807,998 52,569 398,356 102,007 (150,140) 2,434,161
Capital expenditure incurred1 1,168 637 25 208 348 – 2,386 At 31 December 2013 Loans and advances to customers 456,110 336,897 27,211 127,953 43,918 – 992,089Interests in associates and joint ventures 169 13,822 2,575 74 – – 16,640Total assets 1,392,959 831,791 60,810 432,035 113,999 (160,276) 2,671,318Customer accounts 581,933 548,483 38,683 140,809 51,389 – 1,361,297Total liabilities 1,326,537 770,938 50,706 393,635 99,319 (160,276) 2,480,859
Capital expenditure incurred1 907 1,236 32 265 385 – 2,825 At 31 December 2012 Loans and advances to customers 436,141 310,665 28,086 134,475 53,605 – 962,972Interests in associates and joint ventures 178 15,309 2,262 85 – – 17,834Total assets 1,389,240 804,709 62,605 490,247 131,277 (185,540) 2,692,538Customer accounts 535,215 529,754 39,583 141,700 65,144 – 1,311,396Total liabilities 1,327,487 749,561 53,498 450,480 113,923 (185,540) 2,509,409
Capital expenditure incurred1 925 544 102 248 458 – 2,277
1 Expenditure incurred on property, plant and equipment and other intangible assets. Excludes assets acquired as part of business combinations and goodwill.
Other financial information
Net operating income by global business
RBWM CMB GB&M GPB Other1
Intra- HSBC items
Total
US$m US$m US$m US$m US$m US$m US$m2014 Net operating income2 24,594 16,303 17,778 2,377 6,365 (6,169) 61,248
– external 22,692 16,879 20,055 1,980 (358) – 61,248– internal 1,902 (576) (2,277) 397 6,723 (6,169) –
2013 Net operating income2 26,740 16,365 19,176 2,439 5,651 (5,726) 64,645
– external 25,038 17,241 20,767 1,955 (356) – 64,645– internal 1,702 (876) (1,591) 484 6,007 (5,726) –
2012 Net operating income2 33,861 16,551 18,273 3,172 2,332 (5,859) 68,330
– external 31,980 17,295 20,410 2,413 (3,768) – 68,330– internal 1,881 (744) (2,137) 759 6,100 (5,859) –
1 The main items reported in the ‘Other’ category are certain property activities, unallocated investment activities, centrally held investment companies, movements in fair value of own debt and HSBC’s holding company and financing operations. The ‘Other’ category also includes gains and losses on the disposal of certain significant subsidiaries or business units.
2 Net operating income before loan impairment charges and other credit risk provisions, also referred to as revenue.

Notes on the Financial Statements (continued) 11 – Segmental analysis / 12 – Trading assets
HSBC HOLDINGS PLC
376
Information by country 2014 2013 2012
External net operating income1,2
Non- current assets3
External net operating income1,2
Non- current assets3
External net operating income1,2
Non- current assets3
US$m US$m US$m US$m US$m US$m
UK 14,392 8,671 13,347 17,481 9,149 18,391Hong Kong 12,656 12,376 12,031 12,170 11,307 11,657USA 5,736 5,685 6,121 4,189 11,779 6,718France 2,538 10,301 3,111 11,565 2,881 11,074Brazil 4,817 1,403 5,364 1,715 6,395 2,017Other countries 21,109 28,273 24,671 27,879 26,819 30,078
61 248Year ended/at 31 December 61,248 66,709 64,645 74,999 68,330 79,935
1 External net operating income is attributed to countries on the basis of the location of the branch responsible for reporting the results or advancing the funds.
2 Net operating income before loan impairment charges and other credit risk provisions, also referred to as revenue. 3 Non-current assets consist of property, plant and equipment, goodwill, other intangible assets, interests in associates and joint ventures and
certain other assets expected to be recovered more than 12 months after the reporting period.
Financial information presented on our previous geographical operating segments
Europe Hong Kong
Rest of Asia- Pacific MENA
North America
Latin America
Intra- HSBC items
Total US$m US$m US$m US$m US$m US$m US$m US$mNet operating income1
2014 Net operating income 21,571 13,844 10,546 2,548 8,152 8,272 (3,685) 61,248
– external 20,450 12,656 9,415 2,524 7,937 8,266 – 61,248– inter-segment 1,121 1,188 1,131 24 215 6 (3,685) –
2013 Net operating income 20,967 13,203 11,978 2,503 8,803 10,568 (3,377) 64,645
– external 20,108 12,031 10,822 2,497 8,569 10,618 – 64,645– inter-segment 859 1,172 1,156 6 234 (50) (3,377) –
2012 Net operating income 17,608 12,422 13,584 2,430 14,693 10,951 (3,358) 68,330
– external 16,405 11,307 12,586 2,455 14,566 11,011 – 68,330– inter-segment 1,203 1,115 998 (25) 127 (60) (3,358) –
Profit/(loss) before tax
Year to: 31 December 2014 596 8,142 6,483 1,826 1,417 216 – 18,68031 December 2013 1,825 8,089 7,764 1,694 1,221 1,972 – 22,56531 December 2012 (3,414) 7,582 10,448 1,350 2,299 2,384 – 20,649
Balance sheet information
At 31 December 2014 Total assets 1,290,926 587,534 359,757 62,417 436,859 115,354 (218,708) 2,634,139Total liabilities 1,223,371 556,388 320,178 52,569 398,356 102,007 (218,708) 2,434,161 At 31 December 2013 Total assets 1,392,959 555,413 335,937 60,810 432,035 113,999 (219,835) 2,671,318Total liabilities 1,326,537 523,579 306,918 50,706 393,635 99,319 (219,835) 2,480,859 At 31 December 2012 Total assets 1,389,240 518,334 342,269 62,605 490,247 131,277 (241,434) 2,692,538Total liabilities 1,327,487 496,640 308,815 53,498 450,480 113,923 (241,343) 2,509,409
1 Net operating income before loan impairment charges and other credit risk provisions.

HSBC HOLDINGS PLC
377
Str
ateg
ic R
epo
rt
Fi
nan
cial
Rev
iew
Co
rpo
rate
Go
vern
ance
Fin
anci
al S
tate
men
ts
S
har
eho
lder
Info
rmat
ion
12 Trading assets
Accounting policy
Financial assets are classified as held for trading if they have been acquired principally for the purpose of selling in the near term, or form part of a portfolio of identified financial instruments that are managed together and for which there is evidence of a recent pattern of short-term profit-taking. They are recognised on trade date, when HSBC enters into contractual arrangements with counterparties, and are normally derecognised when sold. They are initially measured at fair value, with transaction costs taken to the income statement. Subsequent changes in their fair values are recognised in the income statement in ‘Net trading income’. For trading assets, the interest is shown in ‘Net trading income’.
Trading assets 2014 2013 US$m US$mTrading assets:
– not subject to repledge or resale by counterparties 247,586 201,492– which may be repledged or resold by counterparties 56,607 101,700
At 31 December 304,193 303,192
Treasury and other eligible bills 16,170 21,584Debt securities 141,532 141,644Equity securities 75,249 63,891
Trading securities at fair value 232,951 227,119Loans and advances to banks1 27,581 27,885Loans and advances to customers1 43,661 48,188
At 31 December 304,193 303,192
1 Loans and advances to banks and customers include reverse repos, settlement accounts, stock borrowing and other amounts.
Trading securities valued at fair value1 2014 2013 US$m US$m
US Treasury and US Government agencies2 25,880 23,450UK Government 9,280 11,591Hong Kong Government 6,946 5,909Other government 78,774 86,714Asset-backed securities3 3,494 2,736Corporate debt and other securities 33,328 32,828Equity securities 75,249 63,891
At 31 December 232,951 227,119
1 Included within these figures are debt securities issued by banks and other financial institutions of US$22,399m (2013: US$22,989m), of which US$2,949m (2013: US$3,973m) are guaranteed by various governments.
2 Includes securities that are supported by an explicit guarantee issued by the US Government. 3 Excludes asset-backed securities included under US Treasury and US Government agencies.
Trading securities listed on a recognised exchange and unlisted
Treasury and other eligible bills
Debt securities
Equity securities
Total
US$m US$m US$m US$mFair value
Listed1 1,311 98,028 74,542 173,881Unlisted2 14,859 43,504 707 59,070
At 31 December 2014 16,170 141,532 75,249 232,951 Fair value
Listed1 194 85,821 62,724 148,739Unlisted2 21,390 55,823 1,167 78,380
At 31 December 2013 21,584 141,644 63,891 227,119
1 Included within listed investments are US$5,956m (2013: US$3,836m) of securities listed in Hong Kong. 2 Unlisted treasury and other eligible bills primarily comprise treasury bills not listed on an exchange but for which there is a liquid market.

Notes on the Financial Statements (continued) 13 – Fair values of financial instruments carried at fair value
HSBC HOLDINGS PLC
378
13 Fair values of financial instruments carried at fair value
Accounting policy
All financial instruments are recognised initially at fair value. Fair value is the price that would be received to sell an asset or paid to transfer a liability in an orderly transaction between market participants at the measurement date. The fair value of a financial instrument on initial recognition is generally its transaction price (that is, the fair value of the consideration given or received). However, sometimes the fair value will be based on other observable current market transactions in the same instrument, without modification or repackaging, or on a valuation technique whose variables include only data from observable markets, such as interest rate yield curves, option volatilities and currency rates. When such evidence exists, HSBC recognises a trading gain or loss at inception (‘day 1 gain or loss’), being the difference between the transaction price and the fair value. When significant unobservable parameters are used, the entire day 1 gain or loss is deferred and is recognised in the income statement over the life of the transaction until the transaction matures, is closed out, the valuation inputs become observable or HSBC enters into an offsetting transaction. The fair value of financial instruments is generally measured on an individual basis. However, in cases where HSBC manages a group of financial assets and liabilities according to its net market or credit risk exposure, HSBC measures the fair value of the group of financial instruments on a net basis but presents the underlying financial assets and liabilities separately in the financial statements, unless they satisfy the IFRS offsetting criteria as described in Note 32.
Critical accounting estimates and judgements
Valuation of financial instruments The best evidence of fair value is a quoted price in an actively traded principal market. The fair values of financial instruments that are quoted in active markets are based on bid prices for assets held and offer prices for liabilities issued. Where a financial instrument has a quoted price in an active market, the fair value of the total holding of the financial instrument is calculated as the product of the number of units and quoted price. The judgement as to whether a market is active may include, but is not restricted to, the consideration of factors such as the magnitude and frequency of trading activity, the availability of prices and the size of bid/offer spreads. The bid/offer spread represents the difference in prices at which a market participant would be willing to buy compared with the price at which they would be willing to sell. Valuation techniques may incorporate assumptions about factors that other market participants would use in their valuations, including: • the likelihood and expected timing of future cash flows on the instrument. Judgement may be required to assess the counterparty’s
ability to service the instrument in accordance with its contractual terms. Future cash flows may be sensitive to changes in market rates;
• selecting an appropriate discount rate for the instrument. Judgement is required to assess what a market participant would regard as the appropriate spread of the rate for an instrument over the appropriate risk-free rate;
• judgement to determine what model to use to calculate fair value in areas where the choice of valuation model is particularly subjective, for example, when valuing complex derivative products.
A range of valuation techniques is employed, dependent on the instrument type and available market data. Most valuation techniques are based upon discounted cash flow analyses, in which expected future cash flows are calculated and discounted to present value using a discounting curve. Prior to considering credit risk, the expected future cash flows may be known, as would be the case for the fixed leg of an interest rate swap, or may be uncertain and require projection, as would be the case for the floating leg of an interest rate swap. ‘Projection’ utilises market forward curves, if available. In option models, the probability of different potential future outcomes must be considered. In addition, the value of some products is dependent on more than one market factor, and in these cases it will typically be necessary to consider how movements in one market factor may affect the other market factors. The model inputs necessary to perform such calculations include interest rate yield curves, exchange rates, volatilities, correlations, prepayment and default rates. For interest rate derivatives with collateralised counterparties and in significant currencies, HSBC uses a discounting curve that reflects the overnight interest rate (‘OIS’).
The majority of valuation techniques employ only observable market data. However, certain financial instruments are valued on the basis of valuation techniques that feature one or more significant market inputs that are unobservable, and for them the measurement of fair value is more judgemental. An instrument in its entirety is classified as valued using significant unobservable inputs if, in the opinion of management, a significant proportion of the instrument’s inception profit or greater than 5% of the instrument’s valuation is driven by unobservable inputs. ‘Unobservable’ in this context means that there is little or no current market data available from which to determine the price at which an arm’s length transaction would be likely to occur. It generally does not mean that there is no data available at all upon which to base a determination of fair value (consensus pricing data may, for example, be used).
Control framework
Fair values are subject to a control framework designed to ensure that they are either determined or validated by a function independent of the risk-taker.
For all financial instruments where fair values are determined by reference to externally quoted prices or observable pricing inputs to models, independent price determination or validation is utilised. In inactive markets HSBC will source alternative market information to validate the financial instrument’s fair value, with greater weight given to information that is considered to be more relevant and reliable. The factors that are considered in this regard are, inter alia:
• the extent to which prices may be expected to represent genuine traded or tradeable prices; • the degree of similarity between financial instruments; • the degree of consistency between different sources; • the process followed by the pricing provider to derive the data;

HSBC HOLDINGS PLC
379
Str
ateg
ic R
epo
rt
Fi
nan
cial
Rev
iew
Co
rpo
rate
Go
vern
ance
Fin
anci
al S
tate
men
ts
S
har
eho
lder
Info
rmat
ion
• the elapsed time between the date to which the market data relates and the balance sheet date; and • the manner in which the data was sourced.
For fair values determined using valuation models, the control framework may include, as applicable, development or validation by independent support functions of (i) the logic within valuation models; (ii) the inputs to those models; (iii) any adjustments required outside the valuation models; and (iv) where possible, model outputs. Valuation models are subject to a process of due diligence and calibration before becoming operational and are calibrated against external market data on an ongoing basis.
Changes in fair value are generally subject to a profit and loss analysis process. This process disaggregates changes in fair value into three high level categories; (i) portfolio changes, such as new transactions or maturing transactions, (ii) market movements, such as changes in foreign exchange rates or equity prices, and (iii) other, such as changes in fair value adjustments (see further below).
The majority of financial instruments measured at fair value are in GB&M. GB&M’s fair value governance structure is illustrated below as an example:
Financial liabilities measured at fair value
In certain circumstances, HSBC records its own debt in issue at fair value, based on quoted prices in an active market for the specific instrument concerned, where available. An example of this is where own debt in issue is hedged with interest rate derivatives. When quoted market prices are unavailable, the own debt in issue is valued using valuation techniques, the inputs for which are either based upon quoted prices in an inactive market for the instrument, or are estimated by comparison with quoted prices in an active market for similar instruments. In both cases, the fair value includes the effect of applying the credit spread which is appropriate to HSBC’s liabilities. The change in fair value of issued debt securities attributable to the Group’s own credit spread is computed as follows: for each security at each reporting date, an externally verifiable price is obtained or a price is derived using credit spreads for similar securities for the same issuer. Then, using discounted cash flow, each security is valued using a Libor-based discount curve. The difference in the valuations is attributable to the Group’s own credit spread. This methodology is applied consistently across all securities.
Structured notes issued and certain other hybrid instrument liabilities are included within trading liabilities and are measured at fair value. The credit spread applied to these instruments is derived from the spreads at which HSBC issues structured notes.
Gains and losses arising from changes in the credit spread of liabilities issued by HSBC reverse over the contractual life of the debt, provided that the debt is not repaid at a premium or a discount.
Group Finance Director
Finance Valuation Committees Valuation CommitteeReview Group
Responsible for fair value:
• Establishing accountingpolicies for fair value
• Establishing procedures governing valuation
• Ensuring compliance with all relevant accounting standards
Consist of valuation experts
from several independent
support functions
(product control, market risk
management, quantitative
risk and valuation group
and finance), in addition
to senior management
Provides
results
Overseen byand report
all valuationsconsidered
to havematerial
subjectivity
Chaired by Global Head of Product Control,Global Markets
Consists of Heads of Global Markets, Finance
and Risk functions

Notes on the Financial Statements (continued) 13 – Fair values of financial instruments carried at fair value
HSBC HOLDINGS PLC
380
Fair value hierarchy
Fair values of financial assets and liabilities are determined according to the following hierarchy:
• Level 1 – valuation technique using quoted market price: financial instruments with quoted prices for identical instruments in active markets that HSBC can access at the measurement date.
• Level 2 – valuation technique using observable inputs: financial instruments with quoted prices for similar instruments in active markets or quoted prices for identical or similar instruments in inactive markets and financial instruments valued using models where all significant inputs are observable.
• Level 3 – valuation technique with significant unobservable inputs: financial instruments valued using valuation techniques where one or more significant inputs are unobservable.
The following table sets out the financial instruments by fair value hierarchy.
Financial instruments carried at fair value and bases of valuation Valuation techniques
Quotedmarket
priceLevel 1
Usingobservable
inputsLevel 2
With significant unobservable
inputs Level 3 Total
US$m US$m US$m US$mRecurring fair value measurements at 31 December 2014 Assets
Trading assets 180,446 117,279 6,468 304,193Financial assets designated at fair value 23,697 4,614 726 29,037Derivatives 4,366 337,718 2,924 345,008Financial investments: available for sale 241,464 131,264 4,988 377,716
Liabilities Trading liabilities 62,385 122,048 6,139 190,572Financial liabilities designated at fair value 3,792 72,361 – 76,153Derivatives 4,649 334,113 1,907 340,669
Recurring fair value measurements at 31 December 2013 Assets
Trading assets 182,721 115,124 5,347 303,192Financial assets designated at fair value 30,173 7,649 608 38,430Derivatives 2,539 277,224 2,502 282,265Financial investments: available for sale 262,836 130,760 7,245 400,841
Liabilities Trading liabilities 88,935 110,576 7,514 207,025Financial liabilities designated at fair value 10,482 78,602 – 89,084Derivatives 4,508 267,441 2,335 274,284
The increase in Level 2 derivative balances reflects the overall increase in derivative balances and is discussed in Note 16. There were no other significant movements during 2014.
Transfers between Level 1 and Level 2 fair values Assets Liabilities
Available for sale
Held for trading
Designated at fair value through profit or loss Derivatives
Held for trading
Designated at fair value through profit or loss
Derivatives US$m US$m US$m US$m US$m US$m US$mAt 31 December 2014 Transfers from Level 1 to Level 2 2,702 18,149 – – 22,964 – –Transfers from Level 2 to Level 1 – – – – – – –
Transfers between levels of the fair value hierarchy are deemed to occur at the end of each semi-annual reporting period. Transfers from Level 1 to Level 2 mainly reflect the reclassification of settlement balances and cash collateral following reassessment of the application of levelling criteria to these balances.

HSBC HOLDINGS PLC
381
Str
ateg
ic R
epo
rt
Fi
nan
cial
Rev
iew
Co
rpo
rate
Go
vern
ance
Fin
anci
al S
tate
men
ts
S
har
eho
lder
Info
rmat
ion
Fair value adjustments
Fair value adjustments are adopted when HSBC considers that there are additional factors that would be considered by a market participant which are not incorporated within the valuation model. HSBC classifies fair value adjustments as either ‘risk-related’ or ‘model-related’. The majority of these adjustments relate to GB&M.
Movements in the level of fair value adjustments do not necessarily result in the recognition of profits or losses within the income statement. For example, as models are enhanced, fair value adjustments may no longer be required. Similarly, fair value adjustments will decrease when the related positions are unwound, but this may not result in profit or loss.
Global Banking and Markets fair value adjustments 2014 2013 US$m US$m
Type of adjustment Risk-related 1,958 1,565
– bid-offer 539 561– uncertainty 357 343– credit valuation adjustment 871 1,274– debit valuation adjustment (270) (616)– funding fair value adjustment 460 –– other 1 3
Model-related 57 202– model limitation 52 199– other 5 3
Inception profit (Day 1 P&L reserves) (Note 16) 114 167
At 31 December 2,129 1,934
The largest change in recurring fair value adjustments was a decline of US$403m in respect of the credit valuation adjustment, as a result of both reduced derivative counterparty exposures and general narrowing of credit default swap (‘CDS’) spreads. Narrowing HSBC credit default swap spreads similarly contributed to a reduction in the debit valuation adjustment (‘DVA’) of US$346m.
Funding fair value adjustment (‘FFVA’) reflects the potential future cost or benefit of funding the uncollateralised derivative portfolio at rates other than overnight (‘OIS’) rates. The impact of FFVA adoption in 2014 was a US$263m reduction in net trading income, reflecting the incorporation of a funding spread over Libor. FFVA is measured from an OIS base, and the total FFVA balance of US$460m also reflects the difference between OIS and Libor which had been previously reflected in the fair value of the uncollateralised derivative portfolio.
Risk-related adjustments
Bid-offer
IFRS 13 requires use of the price within the bid-offer spread that is most representative of fair value. Valuation models will typically generate mid-market values. The bid-offer adjustment reflects the extent to which bid-offer costs would be incurred if substantially all residual net portfolio market risks were closed using available hedging instruments or by disposing of or unwinding the position.
Uncertainty
Certain model inputs may be less readily determinable from market data, and/or the choice of model itself may be more subjective. In these circumstances, there exists a range of possible values that the financial instrument or market parameter may assume and an adjustment may be necessary to reflect the likelihood that in estimating the fair value of the financial instrument, market participants would adopt more conservative values for uncertain parameters and/or model assumptions than those used in the valuation model.
Credit valuation adjustment
The CVA is an adjustment to the valuation of OTC derivative contracts to reflect within fair value the possibility that the counterparty may default and that HSBC may not receive the full market value of the transactions (see below).
Debit valuation adjustment
The DVA is an adjustment to the valuation of OTC derivative contracts to reflect within fair value the possibility that HSBC may default, and that HSBC may not pay full market value of the transactions (see below).

Notes on the Financial Statements (continued) 13 – Fair values of financial instruments carried at fair value
HSBC HOLDINGS PLC
382
Funding fair value adjustment
The funding fair value adjustment is calculated by applying future market funding spreads to the expected future funding exposure of any uncollateralised component of the OTC derivative portfolio. This includes the uncollateralised component of collateralised derivatives in addition to derivatives that are fully uncollateralised. The expected future funding exposure is calculated by a simulation methodology, where available. The expected future funding exposure is adjusted for events that may terminate the exposure such as the default of HSBC or the counterparty. The funding fair value adjustment and debit valuation adjustment are calculated independently.
Model-related adjustments
Model limitation
Models used for portfolio valuation purposes may be based upon a simplifying set of assumptions that do not capture all material market characteristics. Additionally, markets evolve, and models that were adequate in the past may require development to capture all material market characteristics in current market conditions. In these circumstances, model limitation adjustments are adopted. As model development progresses, model limitations are addressed within the valuation models and a model limitation adjustment is no longer needed.
Inception profit (Day 1 P&L reserves)
Inception profit adjustments are adopted when the fair value estimated by a valuation model is based on one or more significant unobservable inputs. The accounting for inception profit adjustments is discussed on page 378. An analysis of the movement in the deferred Day 1 P&L reserve is provided on page 395.
Credit valuation adjustment/debit valuation adjustment methodology
HSBC calculates a separate CVA and DVA for each HSBC legal entity, and within each entity for each counterparty to which the entity has exposure. HSBC calculates the CVA by applying the probability of default (‘PD’) of the counterparty, conditional on the non-default of HSBC, to HSBC’s expected positive exposure to the counterparty and multiplying the result by the loss expected in the event of default. Conversely, HSBC calculates the DVA by applying the PD of HSBC, conditional on the non-default of the counterparty, to the expected positive exposure of the counterparty to HSBC and multiplying the result by the loss expected in the event of default. Both calculations are performed over the life of the potential exposure.
For most products HSBC uses a simulation methodology to calculate the expected positive exposure to a counterparty. This incorporates a range of potential exposures across the portfolio of transactions with the counterparty over the life of the portfolio. The simulation methodology includes credit mitigants such as counterparty netting agreements and collateral agreements with the counterparty. A standard loss given default (‘LGD’) assumption of 60% is generally adopted for developed market exposures, and 75% for emerging market exposures. Alternative LGD assumptions may be adopted when both the nature of the exposure and the available data support this.
For certain types of exotic derivatives where the products are not currently supported by the simulation, or for derivative exposures in smaller trading locations where the simulation tool is not yet available, HSBC adopts alternative methodologies. These may involve mapping to the results for similar products from the simulation tool or, where the mapping approach is not appropriate, using a simplified methodology which generally follows the same principles as the simulation methodology. The calculation is applied at a trade level, with more limited recognition of credit mitigants such as netting or collateral agreements than is used in the simulation methodology.
The methodologies do not, in general, account for ‘wrong-way risk’. Wrong-way risk arises when the underlying value of the derivative prior to any CVA is positively correlated to the probability of default by the counterparty. When there is significant wrong-way risk, a trade-specific approach is applied to reflect the wrong-way risk within the valuation.
With the exception of certain central clearing parties, we include all third-party counterparties in the CVA and DVA calculations and do not net these adjustments across Group entities. We review and refine the CVA and DVA methodologies on an ongoing basis.
Valuation of uncollateralised derivatives
Historically, HSBC has valued uncollateralised derivatives by discounting expected future cash flows at a benchmark interest rate, typically Libor or its equivalent. In line with evolving industry practice, HSBC changed this approach in the second half of 2014. HSBC now views the OIS curve as the base discounting curve for all derivatives, both collateralised and uncollateralised, and has adopted an FFVA to reflect the funding of uncollateralised derivative exposure at rates other than OIS. The impact of adopting the funding fair value adjustment was a reduction in trading revenues of US$263m. This is an area in which a full industry consensus has not yet emerged. HSBC will continue to monitor industry evolution and refine the calculation methodology as necessary.

HSBC HOLDINGS PLC
383
Str
ateg
ic R
epo
rt
Fi
nan
cial
Rev
iew
Co
rpo
rate
Go
vern
ance
Fin
anci
al S
tate
men
ts
S
har
eho
lder
Info
rmat
ion
Fair value valuation bases
Financial instruments measured at fair value using a valuation technique with significant unobservable inputs – Level 3 Assets Liabilities
Available for sale
Held for trading
At fair value1
Deriv- atives Total
Held for trading
At fair value1
Deriv- atives
Total
US$m US$m US$m US$m US$m US$m US$m US$m US$m
Private equity including strategic investments 3,120 164 432 – 3,716 47 – – 47
Asset-backed securities 1,462 616 – – 2,078 – – – –Loans held for securitisation – 39 – – 39 – – – –Structured notes – 2 – – 2 6,092 – – 6,092Derivatives with monolines – – – 239 239 – – 1 1Other derivatives – – – 2,685 2,685 – – 1,906 1,906Other portfolios 406 5,647 294 – 6,347 – – – –
26At 31 December 2014 4,988 6,468 726 2,924 15,106 6,139 – 1,907 8,046 Private equity including strategic
investments 3,729 103 420 – 4,252 – – – – Asset-backed securities 1,677 643 – – 2,320 – – – –Loans held for securitisation – 83 – – 83 – – – –Structured notes – 14 – – 14 7,514 – – 7,514Derivatives with monolines – – – 320 320 – – – –Other derivatives – – – 2,182 2,182 – – 2,335 2,335Other portfolios 1,839 4,504 188 – 6,531 – – – –
At 31 December 2013 7,245 5,347 608 2,502 15,702 7,514 – 2,335 9,849
1 Designated at fair value through profit or loss.
Level 3 instruments are present in both ongoing and legacy businesses. Loans held for securitisation, derivatives with monolines, certain ‘other derivatives’ and predominantly all Level 3 asset-backed securities are legacy. HSBC has the capability to hold these positions.
Private equity including strategic investments
HSBC’s private equity and strategic investments are generally classified as available for sale and are not traded in active markets. In the absence of an active market, an investment’s fair value is estimated on the basis of an analysis of the investee’s financial position and results, risk profile, prospects and other factors, as well as by reference to market valuations for similar entities quoted in an active market, or the price at which similar companies have changed ownership.
Asset-backed securities
While quoted market prices are generally used to determine the fair value of these securities, valuation models are used to substantiate the reliability of the limited market data available and to identify whether any adjustments to quoted market prices are required. For ABSs including residential MBSs, the valuation uses an industry standard model and the assumptions relating to prepayment speeds, default rates and loss severity based on collateral type, and performance, as appropriate. The valuations output is benchmarked for consistency against observable data for securities of a similar nature.
Loans, including leveraged finance and loans held for securitisation
Loans held at fair value are valued from broker quotes and/or market data consensus providers when available. In the absence of an observable market, the fair value is determined using alternative valuation techniques. These techniques include discounted cash flow models, which incorporate assumptions regarding an appropriate credit spread for the loan, derived from other market instruments issued by the same or comparable entities.
Structured notes
The fair value of structured notes valued using a valuation technique with significant unobservable inputs is derived from the fair value of the underlying debt security, and the fair value of the embedded derivative is determined as described in the paragraph below on derivatives.
Level 3 structured notes principally comprise equity-linked notes which are issued by HSBC and provide the counterparty with a return that is linked to the performance of certain equity securities, and other portfolios. The notes are classified as Level 3 due to the unobservability of parameters such as long-dated equity volatilities and correlations between equity prices, between equity prices and interest rates and between interest rates and foreign exchange rates.

Notes on the Financial Statements (continued) 13 – Fair values of financial instruments carried at fair value
HSBC HOLDINGS PLC
384
Derivatives
OTC (i.e. non-exchange traded) derivatives are valued using valuation models. Valuation models calculate the present value of expected future cash flows, based upon ‘no-arbitrage’ principles. For many vanilla derivative products, such as interest rate swaps and European options, the modelling approaches used are standard across the industry. For more complex derivative products, there may be some differences in market practice. Inputs to valuation models are determined from observable market data wherever possible, including prices available from exchanges, dealers, brokers or providers of consensus pricing. Certain inputs may not be observable in the market directly, but can be determined from observable prices via model calibration procedures or estimated from historical data or other sources. Examples of inputs that may be unobservable include volatility surfaces, in whole or in part, for less commonly traded option products, and correlations between market factors such as foreign exchange rates, interest rates and equity prices.
Derivative products valued using valuation techniques with significant unobservable inputs included certain types of correlation products, such as foreign exchange basket options, equity basket options, foreign exchange interest rate hybrid transactions and long-dated option transactions. Examples of the latter are equity options, interest rate and foreign exchange options and certain credit derivatives. Credit derivatives include certain tranched CDS transactions.
Reconciliation of fair value measurements in Level 3 of the fair value hierarchy
The following table provides a reconciliation of the movement between opening and closing balances of Level 3 financial instruments, measured at fair value using a valuation technique with significant unobservable inputs:
Movement in Level 3 financial instruments Assets Liabilities
Available for sale
Held for trading
Designated at fair value throughprofit or loss Derivatives
Held for trading
Designated at fair value through profit or loss Derivatives
US$m US$m US$m US$m US$m US$m US$mAt 1 January 2014 7,245 5,347 608 2,502 7,514 – 2,335Total gains/(losses) recognised in profit
or loss 174 194 56 959 (25) – (5)– trading income excluding net interest
income – 194 – 959 (25) – (5)– net income/(expense) from other
financial instruments designated at fair value – – 56 – – – –
– gains less losses from financial investments 198
– loan impairment charges and other credit risk provisions (24)
Total gains/(losses) recognised in other comprehensive income1 126 (178) (16) (126) (123) – 54– available-for-sale investments:
fair value gains/(losses) 208 – – – – – –– cash flow hedges: fair value
gains/(losses) – – – (9) – – 34– exchange differences (82) (178) (16) (117) (123) – 20
Purchases 1,505 705 273 – (31) – –New issuances – – – – 2,067 – –Sales (1,237) (481) (149) – – – –Settlements (1,255) (49) (78) 27 (1,655) – (69)Transfers out (3,027) (112) – (544) (1,918) – (527)Transfers in 1,457 1,042 32 106 310 – 119At 31 December 2014 4,988 6,468 726 2,924 6,139 – 1,907

HSBC HOLDINGS PLC
385
Str
ateg
ic R
epo
rt
Fi
nan
cial
Rev
iew
Co
rpo
rate
Go
vern
ance
Fin
anci
al S
tate
men
ts
S
har
eho
lder
Info
rmat
ion
Assets Liabilities
Available for sale
Held for trading
Designated at fair value through profit or loss Derivatives
Held for trading
Designated at fair value through profit or loss Derivatives
US$m US$m US$m US$m US$m US$m US$mUnrealised gains/(losses) recognised in
profit or loss relating to assets and liabilities held at 31 December 2014 (24) 1 46 946 (122) – 134 – trading income excluding net interest
income – 1 – 946 (122) – 134 – net income/(expense) from other
financial instruments designated at fair value – – 46 – – – –
– loan impairment charges and other credit risk provisions (24) – – – – – –
At 1 January 2013 8,511 4,378 413 3,059 7,470 – 3,005Total gains/(losses) recognised in profit
or loss (52) 343 36 (205) (747) – 393 – trading income/(expense) excluding
net interest income – 343 – (205) (747) – 393 – net income from other financial
instruments designated at fair value – – 36 – – – – – gains less losses from financial
investments (66) – – – – – – – loan impairment charges and
other credit risk provisions 14 – – – – – –
Total gains/(losses) recognised in other comprehensive income1 487 20 – (7) 9 – 57 – available-for-sale investments:
fair value gains 568 – – – – – – – cash flow hedges: fair value losses – – – (11) – – –– exchange differences (81) 20 – 4 9 – 57
Purchases 1,838 1,293 56 – (482) – –New issuances – – – – 3,161 – –Sales (766) (1,821) (4) – (14) – –Settlements (756) (473) (27) (311) (1,150) – (1,004)Transfers out (3,121) (385) (68) (171) (1,051) – (160)Transfers in 1,104 1,992 202 137 318 – 44
At 31 December 2013 7,245 5,347 608 2,502 7,514 – 2,335
Unrealised gains/(losses) recognised in profit or loss relating to assets and liabilities held at 31 December 2013 (166) 362 41 (297) (401) – 72 – trading income excluding net interest
income – 362 – (297) (401) – 72 – net income from other financial
instruments designated at fair value – – 41 – – – – – loan impairment charges and
other credit risk provisions (166) – – – – – –
1 Included in ‘Available-for-sale investments: fair value gains/(losses)’ and ‘Exchange differences’ in the consolidated statement of comprehensive income.
Purchases and sales of Level 3 available-for-sale assets predominantly reflect ABS activity, particularly in the securities investment conduits. Transfers out of Level 3 available-for-sale securities reflect increased confidence in the pricing of certain emerging markets corporate debt, in addition to improved price discovery of some ABSs. Transfers into Level 3 largely relate to other ABSs where price discovery has deteriorated. New issuances of trading liabilities reflect structured note issuances, mainly equity-linked notes. Transfers out of Level 3 trading liabilities principally relate to equity linked notes as certain model inputs became observable. Transfers into Level 3 trading assets primarily relate to loans in the process of syndication.

Notes on the Financial Statements (continued) 13 – Fair values of financial instruments carried at fair value
HSBC HOLDINGS PLC
386
Effect of changes in significant unobservable assumptions to reasonably possible alternatives
The following table shows the sensitivity of Level 3 fair values to reasonably possible alternative assumptions:
Sensitivity of fair values to reasonably possible alternative assumptions
Reflected in profit or loss
Reflected in other comprehensive income
Favourable
changes Unfavourable
changes Favourable
changes Unfavourable changes
US$m US$m US$m US$m
Derivatives, trading assets and trading liabilities1 296 (276) – –Financial assets and liabilities designated at fair value 37 (47) – –Financial investments: available for sale 51 (67) 270 (350)
At 31 December 2014 384 (390) 270 (350) Derivatives, trading assets and trading liabilities1 350 (285) – –Financial assets and liabilities designated at fair value 32 (51) – –Financial investments: available for sale – – 434 (673)
At 31 December 2013 382 (336) 434 (673)
1 Derivatives, trading assets and trading liabilities are presented as one category to reflect the manner in which these financial instruments are risk-managed.
The reduction in the effect of both favourable and unfavourable changes in significant unobservable inputs in relation to derivatives, trading assets and trading liabilities predominantly reflects greater certainty in some emerging market foreign exchange volatility, as markets have developed. The reduction in the effect of both favourable and unfavourable changes in significant unobservable inputs in relation to available-for-sale assets during the period primarily reflects a decrease in the Level 3 balances.
Sensitivity of fair values to reasonably possible alternative assumptions by Level 3 instrument type
Reflected in profit or loss Reflected in other
comprehensive income
Favourable
changes Unfavourable
changes Favourable
changes Unfavourable changes
US$m US$m US$m US$m
Private equity including strategic investments 77 (110) 172 (255)Asset-backed securities 49 (22) 60 (55)Loans held for securitisation 1 (1) – –Structured notes 14 (9) – –Derivatives with monolines 11 (11) – –Other derivatives 129 (155) – –Other portfolios 103 (82) 38 (40)
At 31 December 2014 384 (390) 270 (350) Private equity including strategic investments 31 (61) 226 (436)Asset-backed securities 60 (27) 113 (99)Loans held for securitisation 3 (3) – –Structured notes 16 (9) – –Derivatives with monolines 25 (16) – –Other derivatives 212 (164) – –Other portfolios 35 (56) 95 (138)
At 31 December 2013 382 (336) 434 (673)
Favourable and unfavourable changes are determined on the basis of sensitivity analysis. The sensitivity analysis aims to measure a range of fair values consistent with the application of a 95% confidence interval. Methodologies take account of the nature of the valuation technique employed, as well as the availability and reliability of observable proxy and historical data. When the available data is not amenable to statistical analysis, the quantification of uncertainty is judgemental, but remains guided by the 95% confidence interval.
When the fair value of a financial instrument is affected by more than one unobservable assumption, the above table reflects the most favourable or the most unfavourable change from varying the assumptions individually.
Key unobservable inputs to Level 3 financial instruments
The table below lists key unobservable inputs to Level 3 financial instruments, and provides the range of those inputs as at 31 December 2014. The core range of inputs is the estimated range within which 90% of the inputs fall. A further description of the categories of key unobservable inputs is given below.

Shar
ehol
der
Info
rmat
ion
Fina
ncia
l Sta
tem
ents
G
over
nanc
e O
pera
ting
& F
inan
cial
Rev
iew
Ove
rvie
w
HSBC HOLDINGS PLC
387
Qua
ntita
tive
info
rmat
ion
abou
t sig
nific
ant u
nobs
erva
ble
inpu
ts in
Lev
el 3
val
uatio
ns
Fair
valu
eKe
y un
obse
rvab
le
Asse
tsLi
abili
ties
Valu
atio
n te
chni
que
inpu
tsFu
ll ra
nge
of in
puts
Core
rang
e of
inpu
ts
U
S$m
US$
mLo
wer
Hig
her
Low
erH
ighe
r
Priv
ate
equi
ty in
clud
ing
stra
tegi
c in
vest
men
ts
3,71
647
See
note
s on
page
388
See
note
s on
page
388
n/a
n/a
n/a
n/a
Asse
t-ba
cked
secu
ritie
s 2,
078
––
CLO
/CDO
1
1,12
2–
Mod
el –
Disc
ount
ed c
ash
flow
Pr
epay
men
t rat
e
1%6%
1%6%
Mar
ket p
roxy
Bi
d qu
otes
0
100
5485
Oth
er A
BSs
95
6–
Loan
s hel
d fo
r sec
uriti
satio
n 39
–
Stru
ctur
ed n
otes
2
6,09
2–
equi
ty-li
nked
not
es
–
4,74
4M
odel
–O
ptio
n m
odel
Eq
uity
vol
atili
ty
0.2%
65%
18%
38%
Mod
el –
Opt
ion
mod
elEq
uity
cor
rela
tion
27
%92
%44
%79
%–
fund
-link
ed n
otes
–56
2M
odel
–O
ptio
n m
odel
Fu
nd v
olat
ility
6%
8%6%
8%–
FX-li
nked
not
es
2
477
Mod
el –
Opt
ion
mod
el
FX v
olat
ility
2%
70%
4%16
%–
othe
r
–30
9
Deriv
ativ
es w
ith m
onol
ines
23
91
Mod
el –
Disc
ount
ed c
ash
flow
Cred
it sp
read
3%
5%4%
4%
Oth
er d
eriv
ativ
es
2,68
51,
906
Inte
rest
rate
der
ivat
ives
:
– se
curit
isatio
n sw
aps
44
91,
023
Mod
el –
Disc
ount
ed c
ash
flow
Pr
epay
men
t rat
e
0%50
%6%
18%
– lo
ng-d
ated
swap
tions
1,04
415
2M
odel
–O
ptio
n m
odel
IR v
olat
ility
2%
59%
16%
36%
– ot
her
75
515
1
FX d
eriv
ativ
es:
–
FX o
ptio
ns
89
95M
odel
–O
ptio
n m
odel
FX v
olat
ility
0.
1%70
%4%
14%
– ot
her
7
7
Equi
ty d
eriv
ativ
es:
–
long
-dat
ed si
ngle
stoc
k op
tions
192
256
Mod
el –
Opt
ion
mod
el
Equi
ty v
olat
ility
9%
65%
16%
40%
– ot
her
34
162
Cred
it de
rivat
ives
:
– ot
her
11
560
Oth
er p
ortf
olio
s 6,
347
––
stru
ctur
ed c
ertif
icat
es
4,
420
–M
odel
–Di
scou
nted
cas
h flo
w
Cred
it vo
latil
ity
0.8%
3%0.
8%3%
– EM
cor
pora
te d
ebt
37
2–
Mar
ket p
roxy
Cr
edit
spre
ad
1%4%
1%3%
Mar
ket p
roxy
Bi
d qu
otes
58
131
106
130
– ot
her2
1,
555
–
At 3
1 De
cem
ber 2
014
15,1
068,
046
1 Co
llate
ralis
ed lo
an o
blig
atio
n/co
llate
ralis
ed d
ebt o
blig
atio
n.
2 In
clud
es a
rang
e of
smal
ler a
sset
hol
ding
s.
S
har
eho
lder
Info
rmat
ion
Fin
anci
al S
tate
men
ts
Co
rpo
rate
Go
vern
ance
Fin
anci
al R
evie
w
Str
ateg
ic R
epo
rt

Notes on the Financial Statements (continued) 13 – Fair values of financial instruments carried at fair value
HSBC HOLDINGS PLC
388
Private equity including strategic investments
HSBC’s private equity and strategic investments are generally classified as available for sale and are not traded in active markets. In the absence of an active market, an investment’s fair value is estimated on the basis of an analysis of the investee’s financial position and results, risk profile, prospects and other factors, as well as by reference to market valuations for similar entities quoted in an active market, or the price at which similar companies have changed ownership. Given the bespoke nature of the analysis in respect of each holding, it is not practical to quote a range of key unobservable inputs.
Prepayment rates
Prepayment rates are a measure of the anticipated future speed at which a loan portfolio will be repaid in advance of the due date. Prepayment rates are an important input into modelled values of ABSs. A modelled price may be used where insufficient observable market prices exist to enable a market price to be determined directly. Prepayment rates are also an important input into the valuation of derivatives linked to securitisations. For example, so-called securitisation swaps have a notional value that is linked to the size of the outstanding loan portfolio in a securitisation, which may fall as prepayments occur. Prepayment rates vary according to the nature of the loan portfolio, and expectations of future market conditions. For example, current prepayment rates in US residential MBSs would generally be expected to rise as the US economy improves. Prepayment rates may be estimated using a variety of evidence, such as prepayment rates implied from proxy observable security prices, current or historical prepayment rates and macro-economic modelling.
Market proxy
Market proxy pricing may be used for an instrument for which specific market pricing is not available, but evidence is available in respect of instruments that have some characteristics in common. In some cases it might be possible to identify a specific proxy, but more generally evidence across a wider range of instruments will be used to understand the factors that influence current market pricing and the manner of that influence. For example, in the collateralised loan obligation market it may be possible to establish that A-rated securities exhibit prices in a range, and to isolate key factors that influence position within the range. Applying this to a specific A-rated security within HSBC’s portfolio allows assignment of a price.
The range of prices used as inputs into a market proxy pricing methodology may therefore be wide. This range is not indicative of the uncertainty associated with the price derived for an individual security.
Volatility
Volatility is a measure of the anticipated future variability of a market price. Volatility tends to increase in stressed market conditions, and decrease in calmer market conditions. Volatility is an important input in the pricing of options. In general, the higher the volatility, the more expensive the option will be. This reflects both the higher probability of an increased return from the option and the potentially higher costs that HSBC may incur in hedging the risks associated with the option. If option prices become more expensive, this will increase the value of HSBC’s long option positions (i.e. the positions in which HSBC has purchased options), while HSBC’s short option positions (i.e. the positions in which HSBC has sold options) will suffer losses.
Volatility varies by underlying reference market price, and by strike and maturity of the option. Volatility also varies over time. As a result, it is difficult to make general statements regarding volatility levels. For example, while it is generally the case that foreign exchange volatilities are lower than equity volatilities, there may be examples in particular currency pairs or for particular equities where this is not the case.
Certain volatilities, typically those of a longer-dated nature, are unobservable. The unobservable volatility is then estimated from observable data. For example, longer-dated volatilities may be extrapolated from shorter-dated volatilities. The range of unobservable volatilities quoted in the table on page 387 reflects the wide variation in volatility inputs by reference market price. For example, foreign exchange volatilities for a pegged currency may be very low, whereas for non-managed currencies the foreign exchange volatility may be higher. As a further example, volatilities for deep-in-the-money or deep-out-of-the-money equity options may be significantly higher than at-the-money options. The core range is significantly narrower than the full range because these examples with extreme volatilities occur relatively rarely within the HSBC portfolio. For any single unobservable volatility, the uncertainty in the volatility determination is significantly less than the range quoted above.
Correlation
Correlation is a measure of the inter-relationship between two market prices and is expressed as a number between minus one and one. A positive correlation implies that the two market prices tend to move in the same direction, with a correlation of one implying that they always move in the same direction. A negative correlation implies that the two market prices tend to move in opposite directions, with a correlation of minus one implying that the two market prices always move in opposite directions. Correlation is used to value more complex instruments where the payout is dependent upon more than one market price. For example, an equity basket option has a payout that is dependent upon the performance of a basket of single stocks, and the correlation between the price movements of those stocks will be an

HSBC HOLDINGS PLC
389
Str
ateg
ic R
epo
rt
Fi
nan
cial
Rev
iew
Co
rpo
rate
Go
vern
ance
Fin
anci
al S
tate
men
ts
S
har
eho
lder
Info
rmat
ion
input to the valuation. This is referred to as equity-equity correlation. There is a wide range of instruments for which correlation is an input, and consequently a wide range of both same-asset correlations (e.g. equity-equity correlation) and cross-asset correlations (e.g. foreign exchange rate-interest rate correlation) used. In general, the range of same-asset correlations will be narrower than the range of cross-asset correlations.
Correlation may be unobservable. Unobservable correlations may be estimated based upon a range of evidence, including consensus pricing services, HSBC trade prices, proxy correlations and examination of historical price relationships.
The range of unobservable correlations quoted in the table reflects the wide variation in correlation inputs by market price pair. For any single unobservable correlation, the uncertainty in the correlation determination is likely to be less than the range quoted above.
Credit spread
Credit spread is the premium over a benchmark interest rate required by the market to accept lower credit quality. In a discounted cash flow model, the credit spread increases the discount factors applied to future cash flows, thereby reducing the value of an asset. Credit spreads may be implied from market prices. Credit spreads may not be observable in more illiquid markets.
Inter-relationships between key unobservable inputs
Key unobservable inputs to Level 3 financial instruments may not be independent of each other. As described above, market variables may be correlated. This correlation typically reflects the manner in which different markets tend to react to macroeconomic or other events. For example, improving economic conditions may lead to a ‘risk on’ market, in which prices of risky assets such as equities and high yield bonds rise, while ‘safe haven’ assets such as gold and US Treasuries decline. Furthermore, the effect of changing market variables upon the HSBC portfolio will depend on HSBC’s net risk position in respect of each variable. For example, increasing high-yield bond prices will benefit long high-yield bond positions, but the value of any credit derivative protection held against these bonds will fall.
HSBC Holdings
The following table provides an analysis of the basis for valuing financial assets and financial liabilities measured at fair value in the financial statements:
Basis of valuing HSBC Holdings’ financial assets and liabilities measured at fair value 2014 2013 US$m US$mValuation technique using observable inputs: Level 2 Assets at 31 December
Derivatives 2,771 2,789Available for sale 4,073 1,210
Liabilities at 31 December Designated at fair value 18,679 21,027Derivatives 1,169 704

Notes on the Financial Statements (continued) 14 – Fair values of financial instruments not carried at fair value
HSBC HOLDINGS PLC
390
14 Fair values of financial instruments not carried at fair value
Fair values of financial instruments not carried at fair value and bases of valuation Fair value Valuation techniques
Carrying amount
Quoted market
price Level 1
Using observable
inputs Level 2
With significant
unobservable inputs
Level 3 Total US$m US$m US$m US$m US$mAssets and liabilities not held for sale
at 31 December 2014 Assets
Loans and advances to banks1 112,149 – 109,087 3,046 112,133Loans and advances to customers1 974,660 – 13,598 959,239 972,837Reverse repurchase agreements – non-trading1 161,713 – 160,600 1,123 161,723Financial investments: debt securities 37,751 1,418 37,671 74 39,163
Liabilities Deposits by banks1 77,426 – 77,300 98 77,398Customer accounts1 1,350,642 – 1,336,865 13,730 1,350,595Repurchase agreements – non-trading1 107,432 – 107,432 – 107,432Debt securities in issue 95,947 146 94,325 1,932 96,403Subordinated liabilities 26,664 – 28,806 1,248 30,054
Assets and liabilities not held for sale
at 31 December 2013 Assets
Loans and advances to banks1 120,046 – 111,297 8,727 120,024Loans and advances to customers1 992,089 – 10,762 971,520 982,282Reverse repurchase agreements – non-trading1 179,690 – 178,516 1,166 179,682Financial investments: debt securities 25,084 1,432 23,960 25 25,417
Liabilities Deposits by banks1 86,507 – 86,440 51 86,491Customer accounts1 1,361,297 – 1,346,343 14,576 1,360,919Repurchase agreements – non-trading1 164,220 – 164,173 47 164,220Debt securities in issue 104,080 166 101,551 2,941 104,658Subordinated liabilities 28,976 – 29,704 1,309 31,013
1 From 1 January 2014, non-trading reverse repos and repos are presented as separate lines in the balance sheet. Previously, non-trading reverse repos were included within ‘Loans and advances to banks’ and ‘Loans and advances to customers’ and non-trading repos were included within ‘Deposits by banks’ and ‘Customer accounts’. Comparative data have been re-presented accordingly. Non-trading reverse repos and repos have been presented as separate lines in the balance sheet to align disclosure with market practice and provide more meaningful information in relation to loans and advances.
Fair values are determined according to the hierarchy set out in Note 13.
Other financial instruments not carried at fair value are typically short-term in nature and reprice to current market rates frequently. Accordingly, their carrying amount is a reasonable approximation of fair value. This includes cash and balances at central banks, items in the course of collection/transmission from/to other banks, Hong Kong Government certificates of indebtedness and Hong Kong currency notes in circulation, all of which are measured at amortised cost.
Carrying amount and fair value of loans and advances to customers by industry sector Carrying amount at 31 December Not impaired Impaired Total US$m US$m US$m2014 Loans and advances to customers 954,710 19,950 974,660
– personal 377,154 11,800 388,954– corporate and commercial 527,168 8,016 535,184– financial 50,388 134 50,522
2013 Loans and advances to customers 967,181 24,908 992,089
– personal 390,018 14,108 404,126– corporate and commercial 527,483 10,439 537,922– financial 49,680 361 50,041
Loans and advances to customers are classified as not impaired or impaired in accordance with the criteria described on page 137.

HSBC HOLDINGS PLC
391
Str
ateg
ic R
epo
rt
Fi
nan
cial
Rev
iew
Co
rpo
rate
Go
vern
ance
Fin
anci
al S
tate
men
ts
S
har
eho
lder
Info
rmat
ion
Fair value at 31 December Not impaired Impaired Total US$m US$m US$m2014 Loans and advances to customers 954,347 18,490 972,837
– personal 375,615 10,721 386,336– corporate and commercial 528,361 7,642 536,003– financial 50,371 127 50,498
2013 Loans and advances to customers 957,695 24,587 982,282
– personal 379,353 13,774 393,127– corporate and commercial 529,029 10,340 539,369– financial 49,313 473 49,786
Analysis of loans and advances to customers by geographical segment 2014 2013 Carrying amount Fair value Carrying amount Fair value US$m US$m US$m US$mLoans and advances to customers Europe 409,733 413,373 456,110 453,331Asia 362,955 361,412 336,897 335,132Middle East and North Africa 29,063 28,658 27,211 26,891North America 129,787 126,232 127,953 122,823Latin America 43,122 43,162 43,918 44,105
At 31 December 974,660 972,837 992,089 982,282
Valuation
The fair value measurement is HSBC’s estimate of the price that would be received to sell an asset or paid to transfer a liability in an orderly transaction between market participants at the measurement date. It does not reflect the economic benefits and costs that HSBC expects to flow from the instruments’ cash flows over their expected future lives. Other reporting entities may use different valuation methodologies and assumptions in determining fair values for which no observable market prices are available.
Fair values of the following assets and liabilities are estimated for the purpose of disclosure as described below:
Loans and advances to banks and customers
The fair value of loans and advances is based on observable market transactions, where available. In the absence of observable market transactions, fair value is estimated using valuation models that incorporate a range of input assumptions. These assumptions may include value estimates from third-party brokers which reflect over-the-counter trading activity, forward looking discounted cash flow models using assumptions which HSBC believes are consistent with those which would be used by market participants in valuing such loans, and trading inputs from other market participants which include observed primary and secondary trades.
Loans are grouped, as far as possible, into homogeneous groups and stratified by loans with similar characteristics to improve the accuracy of estimated valuation outputs. The stratification of a loan book considers all material factors including vintage, origination period, estimates of future interest rates, prepayment speeds, delinquency rates, loan-to-value ratios, the quality of collateral, default probability, and internal credit risk ratings.
The fair value of a loan reflects both loan impairments at the balance sheet date and estimates of market participants’ expectations of credit losses over the life of the loans, and the fair value effect of repricing between origination and the balance sheet date.
The fair value of loans and advances to customers in North America is lower than the carrying amount, primarily in the US, reflecting the market conditions at the balance sheet date. This is due to the challenging economic conditions during the past number of years, including house price depreciation, rising unemployment, changes in consumer behaviour, changes in discount rates and the lack of financing options available to support the purchase of loans and advances. The relative fair values have increased during 2014 largely due to improved conditions in the housing industry driven by increased property values and, to a lesser extent, lower required market yields and increased investor demand for these types of loans and advances.
The fair value of loans and advances to customers in Europe has improved relative to the carrying amount, primarily in the UK mortgage market where increased competition and central bank policies to stimulate lending have reduced interest rates and increased fair values accordingly.

Notes on the Financial Statements (continued) 15 – Financial assets designated at fair value
HSBC HOLDINGS PLC
392
Financial investments
The fair values of listed financial investments are determined using bid market prices. The fair values of unlisted financial investments are determined using valuation techniques that take into consideration the prices and future earnings streams of equivalent quoted securities.
Deposits by banks and customer accounts
Fair values are estimated using discounted cash flows, applying current rates offered for deposits of similar remaining maturities. The fair value of a deposit repayable on demand is approximated by its carrying value.
Debt securities in issue and subordinated liabilities
Fair values are determined using quoted market prices at the balance sheet date where available, or by reference to quoted market prices for similar instruments.
Repurchase and reverse repurchase agreements – non-trading
Fair values are estimated by using discounted cash flows, applying current rates. Fair values approximate carrying amounts as their balances are generally short dated.
HSBC Holdings
The methods used by HSBC Holdings to determine fair values of financial instruments for the purpose of measurement and disclosure are described above.
Fair values of HSBC Holdings’ financial instruments not carried at fair value on the balance sheet 2014 2013
Carrying
amount Fair
value1Carrying
amount Fair value1
US$m US$m US$m US$mAssets at 31 December Loans and advances to HSBC undertakings 43,910 45,091 53,344 55,332
Liabilities at 31 December Amounts owed to HSBC undertakings 2,892 2,906 11,685 11,868 Debt securities in issue 1,009 1,357 2,791 3,124 Subordinated liabilities 17,255 20,501 14,167 16,633
1 Fair values were determined using valuation techniques with observable inputs (Level 2).
15 Financial assets designated at fair value
Accounting policy
Financial instruments, other than those held for trading, are classified in this category if they meet one or more of the criteria set out below, and are so designated irrevocably at inception. HSBC may designate financial instruments at fair value when the designation:
• eliminates or significantly reduces measurement or recognition inconsistencies that would otherwise arise from measuring financial instruments, or recognising gains and losses on different bases from related positions. Under this criterion, the main class of financial assets designated by HSBC are financial assets under unit-linked insurance and unit-linked investment contracts. Liabilities to customers under linked contracts are determined based on the fair value of the assets held in the linked funds. If no fair value designation was made for the related assets, the assets would be classified as available for sale, with changes in fair value recorded in other comprehensive income. The related financial assets and liabilities are managed and reported to management on a fair value basis. Designation at fair value of the financial assets and related liabilities allows the changes in fair values to be recorded in the income statement and presented in the same line;
• applies to groups of financial instruments that are managed, and their performance evaluated, on a fair value basis in accordance with a documented risk management or investment strategy, and where information about the groups of financial instruments is reported to management on that basis. For example, certain financial assets are held to meet liabilities under non-linked insurance contracts. HSBC has documented risk management and investment strategies designed to manage and monitor market risk of those assets on net basis, after considering non-linked liabilities. Fair value measurement is also consistent with the regulatory reporting requirements under the appropriate regulations for those insurance operations;
• relates to financial instruments containing one or more non-closely related embedded derivatives.
Designated financial assets are recognised at fair value when HSBC enters into contracts with counterparties, which is generally on trade date, and are normally derecognised when sold. Subsequent changes in fair values are recognised in the income statement in ‘Net income from financial instruments designated at fair value’.

HSBC HOLDINGS PLC
393
Str
ateg
ic R
epo
rt
Fi
nan
cial
Rev
iew
Co
rpo
rate
Go
vern
ance
Fin
anci
al S
tate
men
ts
S
har
eho
lder
Info
rmat
ion
2014 2013 US$m US$mFinancial assets designated at fair value:
– not subject to repledge or resale by counterparties 28,357 38,062– which may be repledged or resold by counterparties 680 368
At 31 December 29,037 38,430
Treasury and other eligible bills 56 50Debt securities 8,891 12,589Equity securities 20,006 25,711
Securities designated at fair value 28,953 38,350Loans and advances to banks and customers 84 80
At 31 December 29,037 38,430
Securities designated at fair value1 2014 2013 US$m US$m
Fair value US Treasury and US Government agencies2 8 34 UK Government 140 534 Hong Kong Government 40 113 Other government 4,088 4,097 Asset-backed securities3 18 140 Corporate debt and other securities 4,653 7,721 Equities 20,006 25,711
At 31 December 28,953 38,350
1 Included within these figures are debt securities issued by banks and other financial institutions of US$1,388m (2013: US$4,419m), of which US$24m (2013: US$92m) are guaranteed by various governments.
2 Include securities that are supported by an explicit guarantee issued by the US Government. 3 Exclude ABSs included under US Treasury and US Government agencies.
Securities listed on a recognised exchange and unlisted
Treasury and other eligible bills
Debt securities
Equity securities
Total US$m US$m US$m US$mFair value
Listed1 5 2,731 13,837 16,573Unlisted 51 6,160 6,169 12,380
At 31 December 2014 56 8,891 20,006 28,953 Fair value
Listed1 2,773 18,235 21,008Unlisted 50 9,816 7,476 17,342
At 31 December 2013 50 12,589 25,711 38,350
1 Included within listed investments are US$1,361m of investments listed on a recognised exchange in Hong Kong (2013: US$1,148m).

Notes on the Financial Statements (continued) 16 – Derivatives
HSBC HOLDINGS PLC
394
16 Derivatives
Accounting policy
Derivatives Derivatives are financial instruments that derive their value from the price of underlying items such as equities, bonds, interest rates, foreign exchange, credit spreads, commodities and equity or other indices. Derivatives are recognised initially, and are subsequently measured, at fair value. Fair values of derivatives are obtained either from quoted market prices or by using valuation techniques. Embedded derivatives are bifurcated from the host contract when their economic characteristics and risks are not clearly and closely related to those of the host non-derivative contract, their contractual terms would otherwise meet the definition of a stand-alone derivative and the combined contract is not held for trading or designated at fair value. The bifurcated embedded derivatives are measured at fair value with changes therein recognised in the income statement. Derivatives are classified as assets when their fair value is positive, or as liabilities when their fair value is negative. Derivative assets and liabilities arising from different transactions are only offset for accounting purposes if the offsetting criteria presented in Note 32 are met. Gains and losses from changes in the fair value of derivatives, including the contractual interest, that do not qualify for hedge accounting are reported in ‘Net trading income’. Gains and losses for derivatives managed in conjunction with financial instruments designated at fair value are reported in ‘Net income from financial instruments designated at fair value’ together with the gains and losses on the economically hedged items. Where the derivatives are managed with debt securities issued by HSBC that are designated at fair value, the contractual interest is shown in ‘Interest expense’ together with the interest payable on the issued debt. Hedge accounting When derivatives are designated as hedges, HSBC classifies them as either: (i) hedges of the change in fair value of recognised assets or liabilities or firm commitments (‘fair value hedges’); (ii) hedges of the variability in highly probable future cash flows attributable to a recognised asset or liability, or a forecast transaction (‘cash flow hedges’); or (iii) a hedge of a net investment in a foreign operation (‘net investment hedges’). At the inception of a hedging relationship, HSBC documents the relationship between the hedging instruments and the hedged items, its risk management objective and its strategy for undertaking the hedge. HSBC requires a documented assessment, both at hedge inception and on an ongoing basis, of whether or not the hedging instruments are highly effective in offsetting the changes attributable to the hedged risks in the fair values or cash flows of the hedged items.
Fair value hedge Changes in the fair value of derivatives that are designated and qualify as fair value hedging instruments are recorded in the income statement, along with changes in the fair value of the hedged assets, liabilities or group that contain the hedged risk. If a hedging relationship no longer meets the criteria for hedge accounting, the hedge accounting is discontinued; the cumulative adjustment to the carrying amount of the hedged item is amortised to the income statement on a recalculated effective interest rate over the residual period to maturity, unless the hedged item has been derecognised, in which case it is recognised in the income statement immediately.
Cash flow hedge The effective portion of changes in the fair value of derivatives that are designated and qualify as cash flow hedges is recognised in other comprehensive income; the ineffective portion of the change in fair value is recognised immediately in the income statement. The accumulated gains and losses recognised in other comprehensive income are reclassified to the income statement in the periods in which the hedged item affects profit or loss. In hedges of forecasted transactions that result in recognition of a non-financial asset or liability, previous gains and losses recognised in other comprehensive income are included in the initial measurement of the asset or liability. When a hedging relationship is discontinued, any cumulative gain or loss recognised in other comprehensive income remains in equity until the forecast transaction is recognised in the income statement. When a forecast transaction is no longer expected to occur, the cumulative gain or loss previously recognised in other comprehensive income is immediately reclassified to the income statement.
Net investment hedge Hedges of net investments in foreign operations are accounted for in a similar way to cash flow hedges. A gain or loss on the effective portion of the hedging instrument is recognised in other comprehensive income; the residual change in fair value is recognised immediately in the income statement. Gains and losses previously recognised in other comprehensive income are reclassified to the income statement on the disposal, or part disposal, of the foreign operation.
Hedge effectiveness testing To qualify for hedge accounting, HSBC requires that at the inception of the hedge and throughout its life each hedge must be expected to be highly effective, both prospectively and retrospectively, on an ongoing basis. The documentation of each hedging relationship sets out how the effectiveness of the hedge is assessed and the method adopted by an entity to assess hedge effectiveness will depend on its risk management strategy. For prospective effectiveness, the hedging instrument must be expected to be highly effective in offsetting changes in fair value or cash flows attributable to the hedged risk during the period for which the hedge is designated, with the effectiveness range being defined as 80% to 125%. Hedge ineffectiveness is recognised in the income statement in ‘Net trading income’.
Derivatives that do not qualify for hedge accounting Non-qualifying hedges are derivatives entered into as economic hedges of assets and liabilities for which hedge accounting was not applied.

HSBC HOLDINGS PLC
395
Str
ateg
ic R
epo
rt
Fi
nan
cial
Rev
iew
Co
rpo
rate
Go
vern
ance
Fin
anci
al S
tate
men
ts
S
har
eho
lder
Info
rmat
ion
Fair values of derivatives by product contract type held by HSBC Assets Liabilities Trading Hedging Total Trading Hedging Total US$m US$m US$m US$m US$m US$m
Foreign exchange 95,584 1,728 97,312 95,187 572 95,759Interest rate 471,379 1,864 473,243 463,456 4,696 468,152Equities 11,694 – 11,694 13,654 – 13,654Credit 9,340 – 9,340 10,061 – 10,061Commodity and other 3,884 – 3,884 3,508 – 3,508
Gross total fair values 591,881 3,592 595,473 585,866 5,268 591,134
Offset (250,465) (250,465)
At 31 December 2014 345,008 340,669 Foreign exchange 78,652 2,262 80,914 75,350 448 75,798Interest rate 456,282 2,294 458,576 448,434 4,097 452,531Equities 18,389 – 18,389 22,573 – 22,573Credit 9,092 – 9,092 8,926 – 8,926Commodity and other 2,624 – 2,624 1,786 – 1,786
Gross total fair values 565,039 4,556 569,595 557,069 4,545 561,614
Offset (287,330) (287,330)
At 31 December 2013 282,265 274,284
Derivative assets increased during 2014, driven by yield curve movements and increased market volatility in foreign exchange. The decline in equity derivative assets and liabilities reflects the inclusion of variation margin on cash-settled exchange-traded equity derivatives within gross fair value rather than ‘offsetting’. This change has no impact upon total derivatives assets.
Fair values of derivatives by product contract type held by HSBC Holdings with subsidiaries Assets Liabilities Trading Hedging Total Trading Hedging Total US$m US$m US$m US$m US$m US$m
Foreign exchange 680 – 680 1,066 103 1,169Interest rate 1,607 484 2,091 – – –
At 31 December 2014 2,287 484 2,771 1,066 103 1,169 Foreign exchange 1,774 45 1,819 471 – 471Interest rate 955 15 970 233 – 233
At 31 December 2013 2,729 60 2,789 704 – 704
Use of derivatives
HSBC transacts derivatives for three primary purposes: to create risk management solutions for clients, to manage the portfolio risks arising from client business and to manage and hedge HSBC’s own risks.
HSBC’s derivative activities give rise to significant open positions in portfolios of derivatives. These positions are managed constantly to ensure that they remain within acceptable risk levels. When entering into derivative transactions, HSBC employs the same credit risk management framework to assess and approve potential credit exposures that it uses for traditional lending.
Trading derivatives
Most of HSBC’s derivative transactions relate to sales and trading activities. Sales activities include the structuring and marketing of derivative products to customers to enable them to take, transfer, modify or reduce current or expected risks. Trading activities include market-making and risk management. Market-making entails quoting bid and offer prices to other market participants for the purpose of generating revenues based on spread and volume. Risk management activity is undertaken to manage the risk arising from client transactions, with the principal purpose of retaining client margin.
Other derivatives classified as held for trading include non-qualifying hedging derivatives, ineffective hedging derivatives and the components of hedging derivatives that are excluded from assessing hedge effectiveness.
Substantially all of HSBC Holdings’ derivatives entered into with HSBC undertakings are managed in conjunction with financial liabilities designated at fair value.

Notes on the Financial Statements (continued) 16 – Derivatives
HSBC HOLDINGS PLC
396
The notional contract amounts of derivatives held for trading purposes indicate the nominal value of transactions outstanding at the balance sheet date; they do not represent amounts at risk.
Notional contract amounts of derivatives held for trading purposes by product type HSBC HSBC Holdings 2014 2013 2014 2013 US$m US$m US$m US$m
Foreign exchange 5,548,075 5,264,978 15,595 17,280Interest rate 22,047,278 27,056,367 8,650 10,304Equities 568,932 589,903 – –Credit 550,197 678,256 – –Commodity and other 77,565 77,842 – –
At 31 December 28,792,047 33,667,346 24,245 27,584 The decline in interest rate derivatives notionals during the year reflects participation in industry-wide ‘portfolio compression’ exercises.
Credit derivatives
HSBC trades credit derivatives through its principal dealing operations and acts as a principal counterparty to a broad range of users, structuring transactions to produce risk management products for its customers, or making markets in certain products. Risk is typically controlled through entering into offsetting credit derivative contracts with other counterparties.
HSBC manages the credit risk arising on buying and selling credit derivative protection by including the related credit exposures within its overall credit limit structure for the relevant counterparty. Trading of credit derivatives is restricted to a small number of offices within the major centres which have the control infrastructure and market skills to manage effectively the credit risk inherent in the products.
Credit derivatives are also deployed to a limited extent for the risk management of the Group’s loan portfolios. The notional contract amount of credit derivatives of US$550bn (2013: US$678bn) consisted of protection bought of US$272bn (2013: US$339bn) and protection sold of US$278bn (2013: US$339bn). The credit derivative business operates within the market risk management framework described on page 222.
Derivatives valued using models with unobservable inputs
The difference between the fair value at initial recognition (the transaction price) and the value that would have been derived had valuation techniques used for subsequent measurement been applied at initial recognition, less subsequent releases, is as follows:
Unamortised balance of derivatives valued using models with significant unobservable inputs 2014 2013 US$m US$m
Unamortised balance at 1 January 167 181Deferral on new transactions 177 206Recognised in the income statement during the period: (234) (221)
– amortisation (114) (105)– subsequent to unobservable inputs becoming observable (13) (39)– maturity, termination or offsetting derivative (107) (77)– risk hedged – –
Exchange differences 4 1
Unamortised balance at 31 December1 114 167
1 This amount is yet to be recognised in the consolidated income statement.
Hedge accounting derivatives
HSBC uses derivatives (principally interest rate swaps) for hedging purposes in the management of its own asset and liability portfolios and structural positions. This enables HSBC to optimise the overall cost to the Group of accessing debt capital markets, and to mitigate the market risk which would otherwise arise from structural imbalances in the maturity and other profiles of its assets and liabilities.
The notional contract amounts of derivatives held for hedge accounting purposes indicate the nominal value of transactions outstanding at the balance sheet date; they do not represent amounts at risk.

HSBC HOLDINGS PLC
397
Str
ateg
ic R
epo
rt
Fi
nan
cial
Rev
iew
Co
rpo
rate
Go
vern
ance
Fin
anci
al S
tate
men
ts
S
har
eho
lder
Info
rmat
ion
Notional contract amounts of derivatives held for hedge accounting purposes by product type HSBC HSBC Holdings 2014 2013 2014 2013
Cash flow hedge
Fair valuehedge
Cash flow hedge
Fair valuehedge
Fair value hedge
Fair value hedge
US$m US$m US$m US$m US$m US$m
Foreign exchange 25,340 – 25,799 226 1,120 1,120Interest rate 190,902 90,338 201,197 90,354 5,477 1,977
At 31 December 216,242 90,338 226,996 90,580 6,597 3,097
Fair value hedges
HSBC’s fair value hedges principally consist of interest rate swaps that are used to protect against changes in the fair value of fixed-rate long-term financial instruments due to movements in market interest rates.
Fair value of derivatives designated as fair value hedges 2014 2013 Assets Liabilities Assets Liabilities US$m US$m US$m US$mHSBC Foreign exchange – – 5 –Interest rate 387 4,012 1,163 2,889
At 31 December 387 4,012 1,168 2,889 HSBC Holdings Foreign exchange – 103 45 –Interest rate 484 – 15 –
At 31 December 484 103 60 – Gains or losses arising from fair value hedges 2014 2013 2012 US$m US$m US$mHSBC Gains/(losses): – on hedging instruments (2,542) 1,997 (898) – on the hedged items attributable to the hedged risk 2,561 (1,932) 871
Year ended 31 December 19 65 (27) HSBC Holdings Gains/(losses): – on hedging instruments 423 14 – – on the hedged items attributable to the hedged risk (422) (21) –
Year ended 31 December 1 (7) –
The gains and losses on ineffective portions of fair value hedges are recognised immediately in ‘Net trading income’.
Cash flow hedges
HSBC’s cash flow hedges consist principally of interest rate swaps, futures and cross-currency swaps that are used to protect against exposures to variability in future interest cash flows on non-trading assets and liabilities which bear interest at variable rates or which are expected to be re-funded or reinvested in the future. The amounts and timing of future cash flows, representing both principal and interest flows, are projected for each portfolio of financial assets and liabilities on the basis of their contractual terms and other relevant factors, including estimates of prepayments and defaults. The aggregate principal balances and interest cash flows across all portfolios over time form the basis for identifying gains and losses on the effective portions of derivatives designated as cash flow hedges of forecast transactions.
Fair value of derivatives designated as cash flow hedges 2014 2013 Assets Liabilities Assets Liabilities US$m US$m US$m US$m
Foreign exchange 1,673 572 2,257 439Interest rate 1,477 684 1,131 1,208
At 31 December 3,150 1,256 3,388 1,647

Notes on the Financial Statements (continued) 17 – Non-trading reverse repos and repos / 18 – Financial investments
HSBC HOLDINGS PLC
398
Forecast principal balances on which interest cash flows are expected to arise
3 months or less
More than 3 months but less than 1 year
5 years or less but more than 1 year
More than 5 years
US$m US$m US$m US$mNet cash inflows/(outflows) exposure
Assets 131,694 122,728 79,529 959Liabilities (60,814) (46,582) (36,371) (8,169)
At 31 December 2014 70,880 76,146 43,158 (7,210) Net cash inflows/(outflows) exposure
Assets 135,857 124,670 89,405 2,156Liabilities (60,402) (46,990) (38,406) (10,221)
At 31 December 2013 75,455 77,680 50,999 (8,065) This table reflects the interest rate repricing profile of the underlying hedged items.
The gains and losses on ineffective portions of derivatives designated as cash flow hedges are recognised immediately in ‘Net trading income’. During the year to 31 December 2014 a gain of US$34m (2013: gain of US$22m; 2012: gain of US$35m) was recognised due to hedge ineffectiveness.
Hedges of net investments in foreign operations
The Group applies hedge accounting in respect of certain consolidated net investments. Hedging is undertaken using forward foreign exchange contracts or by financing with currency borrowings.
At 31 December 2014, the fair values of outstanding financial instruments designated as hedges of net investments in foreign operations were assets of US$55m (2013: US$4m), liabilities of US$1m (2013: US$23m) and notional contract values of US$3,525m (2013: US$2,840m).
Ineffectiveness recognised in ‘Net trading income’ in the year ended 31 December 2014 was nil (2013 and 2012: nil).
17 Non-trading reverse repurchase and repurchase agreements
Accounting policy
When securities are sold subject to a commitment to repurchase them at a predetermined price (‘repos’), they remain on the balance sheet and a liability is recorded in respect of the consideration received. Securities purchased under commitments to resell (‘reverse repos’) are not recognised on the balance sheet and an asset is recorded in respect of the initial consideration paid. Non trading repos and reverse repos are measured at amortised cost. The difference between the sale and repurchase price or between the purchase and resale price is treated as interest and recognised in net interest income over the life of the agreement.
Non-trading repos and reverse repos are presented as separate lines in the balance sheet. This separate presentation was adopted with effect from 1 January 2014 and comparatives are re-presented accordingly. Previously, non-trading reverse repos were included within ‘Loans and advances to banks’ and ‘Loans and advances to customers’ and non-trading repos were included within ‘Deposits by banks’ and ‘Customer accounts’.
The extent to which non-trading reverse repos and repos represent amounts with customers and banks is set out below. 2014 2013 US$m US$mAssets
Banks 95,403 91,475Customers 66,310 88,215
At 31 December 161,713 179,690
Liabilities Banks 27,876 42,705Customers 79,556 121,515
At 31 December 107,432 164,220

HSBC HOLDINGS PLC
399
Str
ateg
ic R
epo
rt
Fi
nan
cial
Rev
iew
Co
rpo
rate
Go
vern
ance
Fin
anci
al S
tate
men
ts
S
har
eho
lder
Info
rmat
ion
18 Financial investments
Accounting policy
Treasury bills, debt securities and equity securities intended to be held on a continuing basis, other than those designated at fair value, are classified as available for sale or held to maturity. They are recognised on trade date when HSBC enters into contractual arrangements to purchase those instruments, and are normally derecognised when either the securities are sold or redeemed.
(i) Available-for-sale financial assets are initially measured at fair value plus direct and incremental transaction costs. They are subsequently remeasured at fair value, and changes therein are recognised in other comprehensive income until they are either sold or become impaired. When available-for-sale financial assets are sold, cumulative gains or losses previously recognised in other comprehensive income are recognised in the income statement as ‘Gains less losses from financial investments’. Interest income is recognised over a debt security’s expected life. Premiums and/or discounts arising on the purchase of dated debt securities are included in the interest recognised. Dividends from equity assets are recognised in the income statement when the right to receive payment is established.
(ii) Held-to-maturity investments are non-derivative financial assets with fixed or determinable payments and fixed maturities that HSBC positively intends and is able to hold to maturity. Held-to-maturity investments are initially recorded at fair value plus any directly attributable transaction costs, and are subsequently measured at amortised cost, less any impairment losses.
The accounting policy relating to impairments of available-for-sale securities is presented in Note 1(k).
Available-for-sale financial assets are reclassified to held to maturity if there is a change in intention or ability to hold those assets to maturity due to a change in the way those assets are managed. The fair value on reclassification becomes the new amortised cost and the assets are subsequently carried at amortised cost rather than fair value.
Financial investments 2014 2013 US$m US$mFinancial investments:
– not subject to repledge or resale by counterparties 380,419 394,207 – which may be repledged or resold by counterparties 35,048 31,718
At 31 December 415,467 425,925
Carrying amount and fair value of financial investments 2014 2013 Carrying
amount Fair
value Carrying
amount Fair value
US$m US$m US$m US$m
Treasury and other eligible bills 81,517 81,517 78,111 78,111– available for sale 81,517 81,517 78,111 78,111
Debt securities1 323,256 324,668 338,674 339,007– available for sale 285,505 285,505 313,590 313,590– held to maturity 37,751 39,163 25,084 25,417
Equity securities 10,694 10,694 9,140 9,140– available for sale 10,694 10,694 9,140 9,140
At 31 December 415,467 416,879 425,925 426,258
1 During the year US$11,043m of available-for-sale debt securities were reclassified to held-to-maturity debt securities.
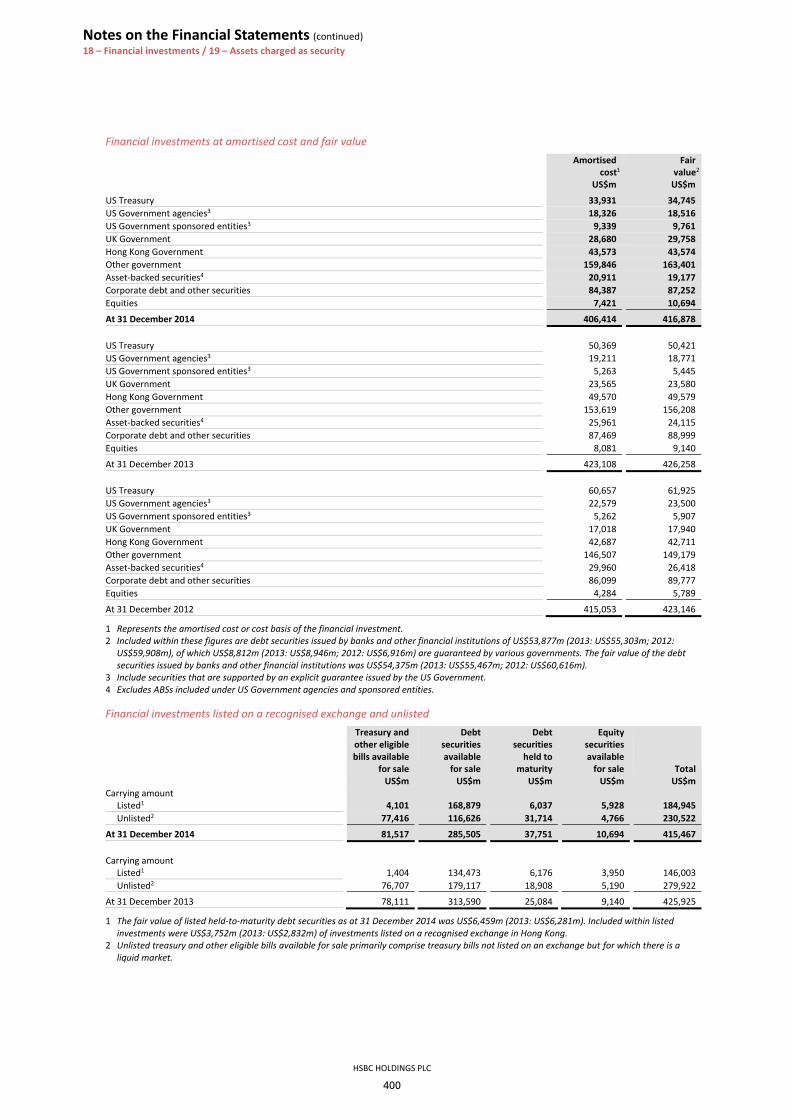
Notes on the Financial Statements (continued) 18 – Financial investments / 19 – Assets charged as security
HSBC HOLDINGS PLC
400
Financial investments at amortised cost and fair value
Amortised
cost1 Fair value2
US$m US$m
US Treasury 33,931 34,745US Government agencies3 18,326 18,516US Government sponsored entities3 9,339 9,761UK Government 28,680 29,758Hong Kong Government 43,573 43,574Other government 159,846 163,401Asset-backed securities4 20,911 19,177Corporate debt and other securities 84,387 87,252Equities 7,421 10,694
At 31 December 2014 406,414 416,878 US Treasury 50,369 50,421US Government agencies3 19,211 18,771US Government sponsored entities3 5,263 5,445UK Government 23,565 23,580Hong Kong Government 49,570 49,579Other government 153,619 156,208Asset-backed securities4 25,961 24,115Corporate debt and other securities 87,469 88,999Equities 8,081 9,140
At 31 December 2013 423,108 426,258 US Treasury 60,657 61,925US Government agencies3 22,579 23,500US Government sponsored entities3 5,262 5,907UK Government 17,018 17,940Hong Kong Government 42,687 42,711Other government 146,507 149,179Asset-backed securities4 29,960 26,418Corporate debt and other securities 86,099 89,777Equities 4,284 5,789
At 31 December 2012 415,053 423,146
1 Represents the amortised cost or cost basis of the financial investment. 2 Included within these figures are debt securities issued by banks and other financial institutions of US$53,877m (2013: US$55,303m; 2012:
US$59,908m), of which US$8,812m (2013: US$8,946m; 2012: US$6,916m) are guaranteed by various governments. The fair value of the debt securities issued by banks and other financial institutions was US$54,375m (2013: US$55,467m; 2012: US$60,616m).
3 Include securities that are supported by an explicit guarantee issued by the US Government. 4 Excludes ABSs included under US Government agencies and sponsored entities.
Financial investments listed on a recognised exchange and unlisted
Treasury and other eligible bills available for sale
Debt securities available for sale
Debt securities held to maturity
Equity securities available for sale
Total US$m US$m US$m US$m US$mCarrying amount
Listed1 4,101 168,879 6,037 5,928 184,945Unlisted2 77,416 116,626 31,714 4,766 230,522
At 31 December 2014 81,517 285,505 37,751 10,694 415,467 Carrying amount
Listed1 1,404 134,473 6,176 3,950 146,003Unlisted2 76,707 179,117 18,908 5,190 279,922
At 31 December 2013 78,111 313,590 25,084 9,140 425,925
1 The fair value of listed held-to-maturity debt securities as at 31 December 2014 was US$6,459m (2013: US$6,281m). Included within listed investments were US$3,752m (2013: US$2,832m) of investments listed on a recognised exchange in Hong Kong.
2 Unlisted treasury and other eligible bills available for sale primarily comprise treasury bills not listed on an exchange but for which there is a liquid market.

HSBC HOLDINGS PLC
401
Str
ateg
ic R
epo
rt
Fi
nan
cial
Rev
iew
Co
rpo
rate
Go
vern
ance
Fin
anci
al S
tate
men
ts
S
har
eho
lder
Info
rmat
ion
Maturities of investments in debt securities at their carrying amount
1 year or less 5 years or less but over 1 year
10 years or less but over 5 years Over 10 years Total
US$m US$m US$m US$m US$m
Available for sale 68,344 134,815 44,938 37,408 285,505 Held to maturity 1,396 9,622 7,087 19,646 37,751
At 31 December 2014 69,740 144,437 52,025 57,054 323,256 Available for sale 78,222 146,200 44,556 44,612 313,590 Held to maturity 2,993 8,380 6,442 7,269 25,084
At 31 December 2013 81,215 154,580 50,998 51,881 338,674
Contractual maturities and weighted average yields of investment debt securities
Within one year After one year but within five years
After five years but within ten years After ten years
Amount Yield Amount Yield Amount Yield Amount Yield US$m % US$m % US$m % US$m %Available for sale
US Treasury 4,136 0.8 20,273 1.0 3,961 2.5 1,490 4.1US Government agencies – – 9 4.2 44 3.9 9,704 2.6US Government-sponsored agencies – – 1,939 3.2 1,393 3.3 1,138 3.3UK Government 281 2.2 12,389 1.0 12,541 1.7 – –Hong Kong Government 350 0.4 953 1.0 – – – –Other governments 46,946 2.2 65,497 2.7 12,806 2.9 2,864 2.4Asset-backed securities 688 1.3 1,172 1.4 4,003 1.4 15,036 1.1Corporate debt and other securities 16,392 2.3 30,687 2.1 7,048 2.7 6,459 3.3
Total amortised cost at 31 December 2014 68,793 132,919 41,796 36,691
Total carrying value 68,344 134,815 44,938 37,408
Held to maturity US Treasury – – 75 4.8 44 4.8 115 4.2US Government agencies – – 1 7.6 50 2.6 8,506 2.4US Government-sponsored agencies – – 92 1.4 406 2.9 4,370 3.1Hong Kong Government 1 0.5 37 1.3 20 1.8 2 1.2Other governments 95 4.1 278 4.8 202 5.2 722 4.9Asset-backed securities – – – – – – 11 6.4Corporate debt and other securities 1,300 3.5 9,139 3.6 6,365 4.0 5,920 4.1
Total amortised cost at 31 December 2014 1,396 9,622 7,087 19,646
Total carrying value 1,396 9,622 7,087 19,646
The maturity distributions of ABSs are presented in the above table on the basis of contractual maturity dates. The weighted average yield for each range of maturities is calculated by dividing the annualised interest income for the year ended 31 December 2014 by the book amount of available-for-sale debt securities at that date. The yields do not include the effect of related derivatives.
19 Assets charged as security for liabilities, assets transferred and collateral accepted as security for assets
Financial assets pledged to secure liabilities 2014 2013 US$m US$m
Treasury bills and other eligible securities 5,170 6,387 Loans and advances to banks 17,294 17,733 Loans and advances to customers 77,960 87,894 Debt securities 138,991 190,095 Equity shares 11,373 8,816 Other 6,079 1,035
Assets pledged at 31 December 256,867 311,960
The table above shows assets where a charge has been granted to secure liabilities on a legal and contractual basis. The amount of such assets may be greater than the book value of assets utilised as collateral for funding purposes or to cover liabilities. This is the case for securitisations and covered bonds where the amount of liabilities issued, plus any mandatory over-collateralisation, is less than the book value of financial assets available for funding or collateral purposes in the relevant pool of assets. This is also the case where financial assets are placed with a custodian or settlement agent which has a floating charge over all the financial assets placed to secure any liabilities under settlement accounts.

Notes on the Financial Statements (continued) 19 – Assets charged as security / 20 – Interests in associates and joint ventures
HSBC HOLDINGS PLC
402
These transactions are conducted under terms that are usual and customary to collateralised transactions including, where relevant, standard securities lending and repurchase agreements.
Assets transferred
Accounting policy
Derecognition of financial assets Financial assets are derecognised when the contractual rights to receive cash flows from the assets has expired; or when HSBC has transferred its contractual right to receive the cash flows of the financial assets, and either: • substantially all the risks and rewards of ownership have been transferred; or • HSBC has neither retained nor transferred substantially all the risks and rewards, but has not retained control.
HSBC enters into transactions in the normal course of business by which it transfers financial assets to third parties. Depending on the circumstances, these transfers may either result in these financial assets being derecognised or continuing to be recognised.
The financial assets shown above include amounts transferred to third parties that do not qualify for derecognition, notably debt securities held by counterparties as collateral under repurchase agreements and equity securities lent under securities lending agreements. As the substance of these transactions is secured borrowings, the asset collateral continues to be recognised in full and the related liability reflecting the Group’s obligation to repurchase the transferred assets for a fixed price at a future date is recognised on the balance sheet. As a result of these transactions, the Group is unable to use, sell or pledge the transferred assets for the duration of the transaction. The Group remains exposed to interest rate risk and credit risk on these pledged instruments. The counterparty’s recourse is not limited to the transferred assets.
Transferred financial assets not qualifying for full derecognition and associated financial liabilities
Carrying amount ofassets before transfer
Carrying amount of transferred assets
Carrying amount of associated liabilities
Fair value of transferred assets
Fair value of associated liabilities
Net position
US$m US$m US$m US$m US$m US$mAt 31 December 2014 Repurchase agreements 78,541 79,141 Securities lending agreements 13,177 10,643 Other sales (recourse to transferred asset only) 3,775 4,049 4,007 4,018 (11)Securitisations recognised to the extent of
continuing involvement 17,427 11 5 11 5 6 At 31 December 2013 Repurchase agreements 125,508 126,175 Securities lending agreements 9,175 8,884 Other sales (recourse to transferred asset only) 6,707 7,019 6,827 6,707 120Securitisations recognised to the extent of
continuing involvement 17,427 16 8 16 8 8
Collateral accepted as security for assets
The fair value of assets accepted as collateral in relation to reverse repo and securities borrowing that HSBC is permitted to sell or repledge in the absence of default is US$269,019m (2013: US$259,617m). The fair value of any such collateral that has been sold or repledged was US$163,342m (2013: US$186,013m). HSBC is obliged to return equivalent securities.
These transactions are conducted under terms that are usual and customary to standard securities borrowing and reverse repurchase agreements.

HSBC HOLDINGS PLC
403
Str
ateg
ic R
epo
rt
Fi
nan
cial
Rev
iew
Co
rpo
rate
Go
vern
ance
Fin
anci
al S
tate
men
ts
S
har
eho
lder
Info
rmat
ion
20 Interests in associates and joint ventures
Accounting policy
Investments in which HSBC, together with one or more parties, has joint control of an arrangement set up to undertake an economic activity are classified as joint ventures. HSBC classifies investments in entities over which it has significant influence, and that are neither subsidiaries (Note 22) nor joint ventures, as associates. Investments in associates and interests in joint ventures are recognised using the equity method. Under this method, such investments are initially stated at cost, including attributable goodwill, and are adjusted thereafter for the post-acquisition change in HSBC’s share of net assets. Goodwill arises on the acquisition of interests in joint ventures and associates when the cost of investment exceeds HSBC’s share of the net fair value of the associate’s or joint venture’s identifiable assets and liabilities. An investment in an associate is tested for impairment when there is an indication that the investment may be impaired. Goodwill on acquisitions of interests in joint ventures and associates is not tested separately for impairment.
Profits on transactions between HSBC and its associates and joint ventures are eliminated to the extent of HSBC’s interest in the respective associates or joint ventures. Losses are also eliminated to the extent of HSBC’s interest in the associates or joint ventures unless the transaction provides evidence of an impairment of the asset transferred.
Critical accounting estimates and judgements
Impairment of interests in associates Impairment testing involves significant judgement in determining the value in use, and in particular estimating the present values of cash flows expected to arise from continuing to hold the investment. The most significant judgements relate to the impairment testing of our investment in Bank of Communications (‘BoCom’). Key assumptions used in estimating BoCom’s value in use, the sensitivity of the value in use calculation to different assumptions and a sensitivity analysis that shows the changes in key assumptions that would reduce the excess of value in use over the carrying amount (the ‘headroom’) to nil are described in the Note below.
Associates
At 31 December 2014, the carrying amount of HSBC’s interests in associates was US$17,940m (2013: US$16,417m).
Principal associates of HSBC 2014 2013
Carrying
amount Fair
value1Carrying
amount Fair value1
US$m US$m US$m US$mListed
Bank of Communications Co., Limited 14,590 13,140 13,412 9,954 The Saudi British Bank 2,811 6,220 2,437 4,693
At 31 December 17,401 19,360 15,849 14,647
1 Principal associates are listed on recognised stock exchanges. The fair values are based on the quoted market prices of the shares held (Level 1 in the fair value hierarchy).
At 31 December 2014
Country of incorporation and principalplace of business
Principal activity
HSBC’s interest in equity capital
Issued equity capital
Bank of Communications Co., Limited PRC1 Banking services 19.03% RMB74,263mThe Saudi British Bank Saudi Arabia Banking services 40.00% SR10,000m
1 People’s Republic of China.
Details of all HSBC associates and joint ventures, as required under Section 409 of the Companies Act 2006, will be annexed to the next Annual Return of HSBC Holdings filed with the UK Registrar of Companies.
HSBC had US$14,590m (2013: US$13,412m) of interests in associates listed in Hong Kong.
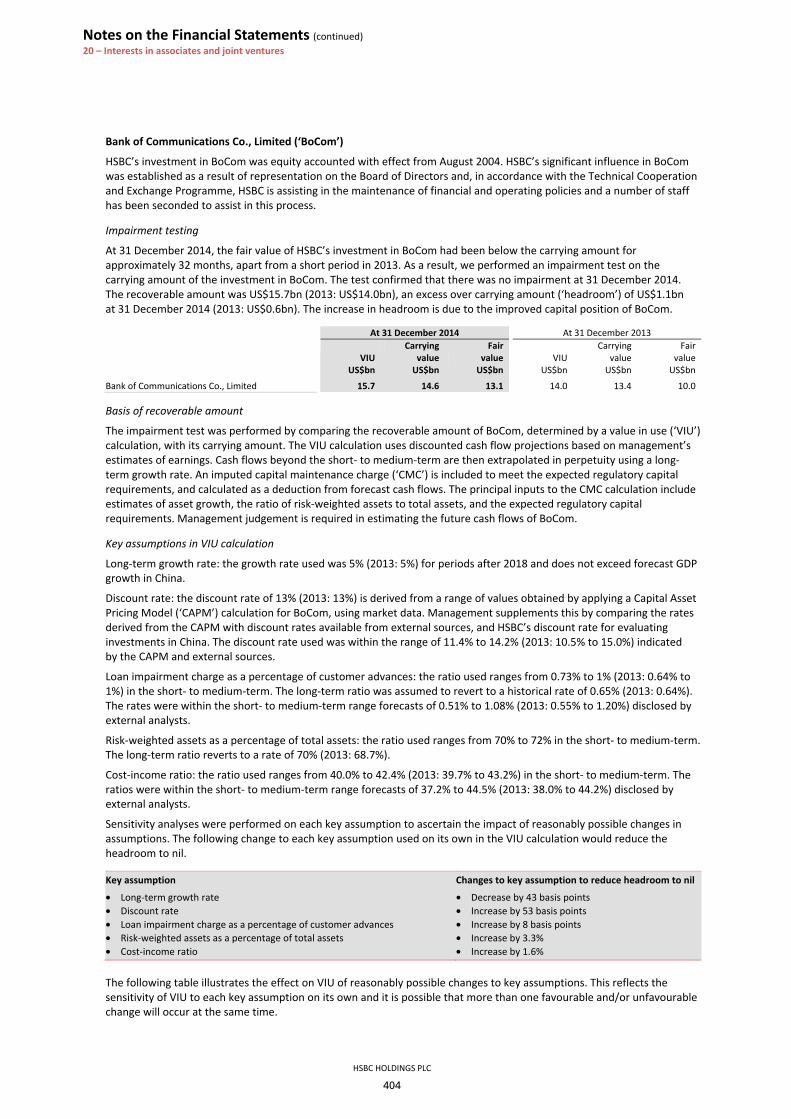
Notes on the Financial Statements (continued) 20 – Interests in associates and joint ventures
HSBC HOLDINGS PLC
404
Bank of Communications Co., Limited (‘BoCom’)
HSBC’s investment in BoCom was equity accounted with effect from August 2004. HSBC’s significant influence in BoCom was established as a result of representation on the Board of Directors and, in accordance with the Technical Cooperation and Exchange Programme, HSBC is assisting in the maintenance of financial and operating policies and a number of staff has been seconded to assist in this process.
Impairment testing
At 31 December 2014, the fair value of HSBC’s investment in BoCom had been below the carrying amount for approximately 32 months, apart from a short period in 2013. As a result, we performed an impairment test on the carrying amount of the investment in BoCom. The test confirmed that there was no impairment at 31 December 2014. The recoverable amount was US$15.7bn (2013: US$14.0bn), an excess over carrying amount (‘headroom’) of US$1.1bn at 31 December 2014 (2013: US$0.6bn). The increase in headroom is due to the improved capital position of BoCom.
At 31 December 2014 At 31 December 2013
VIU
Carrying value
Fair value VIU
Carrying value
Fair value
US$bn US$bn US$bn US$bn US$bn US$bn
Bank of Communications Co., Limited 15.7 14.6 13.1 14.0 13.4 10.0
Basis of recoverable amount
The impairment test was performed by comparing the recoverable amount of BoCom, determined by a value in use (‘VIU’) calculation, with its carrying amount. The VIU calculation uses discounted cash flow projections based on management’s estimates of earnings. Cash flows beyond the short- to medium-term are then extrapolated in perpetuity using a long-term growth rate. An imputed capital maintenance charge (‘CMC’) is included to meet the expected regulatory capital requirements, and calculated as a deduction from forecast cash flows. The principal inputs to the CMC calculation include estimates of asset growth, the ratio of risk-weighted assets to total assets, and the expected regulatory capital requirements. Management judgement is required in estimating the future cash flows of BoCom.
Key assumptions in VIU calculation
Long-term growth rate: the growth rate used was 5% (2013: 5%) for periods after 2018 and does not exceed forecast GDP growth in China.
Discount rate: the discount rate of 13% (2013: 13%) is derived from a range of values obtained by applying a Capital Asset Pricing Model (‘CAPM’) calculation for BoCom, using market data. Management supplements this by comparing the rates derived from the CAPM with discount rates available from external sources, and HSBC’s discount rate for evaluating investments in China. The discount rate used was within the range of 11.4% to 14.2% (2013: 10.5% to 15.0%) indicated by the CAPM and external sources.
Loan impairment charge as a percentage of customer advances: the ratio used ranges from 0.73% to 1% (2013: 0.64% to 1%) in the short- to medium-term. The long-term ratio was assumed to revert to a historical rate of 0.65% (2013: 0.64%). The rates were within the short- to medium-term range forecasts of 0.51% to 1.08% (2013: 0.55% to 1.20%) disclosed by external analysts.
Risk-weighted assets as a percentage of total assets: the ratio used ranges from 70% to 72% in the short- to medium-term. The long-term ratio reverts to a rate of 70% (2013: 68.7%).
Cost-income ratio: the ratio used ranges from 40.0% to 42.4% (2013: 39.7% to 43.2%) in the short- to medium-term. The ratios were within the short- to medium-term range forecasts of 37.2% to 44.5% (2013: 38.0% to 44.2%) disclosed by external analysts.
Sensitivity analyses were performed on each key assumption to ascertain the impact of reasonably possible changes in assumptions. The following change to each key assumption used on its own in the VIU calculation would reduce the headroom to nil.
Key assumption Changes to key assumption to reduce headroom to nil
• Long-term growth rate • Discount rate • Loan impairment charge as a percentage of customer advances • Risk-weighted assets as a percentage of total assets • Cost-income ratio
• Decrease by 43 basis points • Increase by 53 basis points • Increase by 8 basis points • Increase by 3.3% • Increase by 1.6%
The following table illustrates the effect on VIU of reasonably possible changes to key assumptions. This reflects the sensitivity of VIU to each key assumption on its own and it is possible that more than one favourable and/or unfavourable change will occur at the same time.

HSBC HOLDINGS PLC
405
Str
ateg
ic R
epo
rt
Fi
nan
cial
Rev
iew
Co
rpo
rate
Go
vern
ance
Fin
anci
al S
tate
men
ts
S
har
eho
lder
Info
rmat
ion
Favourable change Current model Unfavourable change US$bn US$bn US$bn US$bn US$bnAt 31 December 2014 Carrying amount: US$14.6bn Long-term growth rate +50bp +100bp 5% -50bp -100bp
VIU 17.0 18.6 15.7 14.5 13.4Increase/(decrease) in VIU 1.3 2.9 (1.2) (2.3)
Discount rate -50bp -100bp 13% +50bp +100bpVIU 16.8 18.1 15.7 14.7 13.9Increase/(decrease) in VIU 1.1 2.4 (1.0) (1.8)
Loan impairment charge as a percentage of customer advances 0.65% throughout
2014-18: 0.73% – 1% 2019 onwards: 0.65%
1% from 2014-182019 onwards: 0.65%
VIU 16.2 15.7 14.9 Increase/(decrease) in VIU 0.5 (0.8)
Risk-weighted assets as a percentage of total assets -100bp -200bp 2014-18: 70% – 72%
2019 onwards: 70.0% +100bp +200bp
VIU 16.0 16.3 15.7 15.4 15.1Increase/(decrease) in VIU 0.3 0.6 (0.3) (0.6)
Cost income ratio -50bp -100bp 2014-18: 40.0% – 42.4% 2019 onwards: 42.4%
+50bp +100bp
VIU 16.0 16.3 15.7 15.4 15.1Increase/(decrease) in VIU 0.3 0.6 (0.3) (0.6)
At 31 December 2013 Carrying amount: US$13.4bn Long-term growth rate +50bp +100bp 5% -50bp -100bp
VIU 15.4 16.9 14.0 12.9 11.8Increase/(decrease) in VIU 1.4 2.9 (1.1) (2.2)
Discount rate -50bp -100bp 13% +50bp +100bpVIU 15.6 17.3 14.0 12.7 11.6Increase/(decrease) in VIU 1.6 3.3 (1.3) (2.4)
Loan impairment charge as a percentage of customer advances 0.64% throughout
2013-18: 0.64% – 1.00% 2019 onwards: 0.64% 1% from 2014-18
VIU 14.8 14.0 13.5 Increase/(decrease) in VIU 0.8 (0.5)
Risk-weighted assets as a percentage of total assets -100bp -200bp 68.7% throughout +100bp +200bpVIU 14.4 14.7 14.0 13.7 13.4Increase/(decrease) in VIU 0.4 0.7 (0.3) (0.6)
Cost income ratio -50bp -100bp 2013-18: 39.7% – 43.2% 2019 onwards: 43.2%
+50bp +100bp
VIU 14.3 14.7 14.0 13.7 13.4Increase/(decrease) in VIU 0.3 0.7 (0.3) (0.6)
Selected financial information of BoCom
The statutory accounting reference date of BoCom is 31 December. For the year ended 31 December 2014, HSBC included the associate’s results on the basis of financial statements made up for the 12 months to 30 September 2014, taking into account changes in the subsequent period from 1 October 2014 to 31 December 2014 that would have materially affected the results.
At 30 September 2014 2013 US$m US$mSelected balance sheet information of BoCom Cash and balances at central banks 150,306 142,209Loans and advances to banks and other financial institutions 79,960 88,049Loans and advances to customers 547,706 516,161Other financial assets 178,883 165,521Other assets 45,140 34,392
Total assets 1,001,995 946,332
Deposits by banks and other financial institutions 209,935 170,916Customer accounts 663,745 667,588Other financial liabilities 28,860 20,564Other liabilities 25,361 19,655
Total liabilities 927,901 878,723
Total equity 74,094 67,609

Notes on the Financial Statements (continued) 20 – Interests in associates and joint ventures / 21 – Goodwill and intangible assets
HSBC HOLDINGS PLC
406
At 30 September 2014 2013 US$m US$mReconciliation of BoCom’s total shareholders’ equity to the carrying amount in
HSBC’s consolidated financial statements as at 31 December
HSBC’s share of total shareholders’ equity 14,040 12,810Add: Goodwill and other intangible assets 550 602
Carrying amount 14,590 13,412 For the 12 months ended
30 September 2014 2013 US$m US$mSelected income statement information of BoCom Net interest income 22,030 20,768Net fee and commission income 4,792 4,010Loan impairment charges (3,509) (2,811)Depreciation and amortisation (920) (809)Tax expense (3,102) (2,823)Profit for the year 10,626 10,099Other comprehensive income 217 (375)Total comprehensive income 10,843 9,724Dividends received from BoCom 597 549
Summarised aggregate financial information in respect of all associates excluding BoCom 2014 2013 US$m US$m
Carrying amount 3,350 3,005
HSBC’s share of: – total assets 20,099 21,007– total liabilities 16,837 18,056– revenues 801 927– profit or loss from continuing operations 519 408– other comprehensive income 2 9– total comprehensive income 521 417
Joint ventures
At 31 December 2014, the carrying amount of HSBC’s interests in joint ventures was US$241m (2013: US$223m).
Associates and joint ventures
For the year ended 31 December 2014, HSBC’s share of associates and joint ventures’ tax on profit was US$600m (2013: US$556m), which is included within ‘Share of profit in associates and joint ventures’ in the income statement.
Movements in interests in associates and joint ventures 2014 2013 US$m US$m
At 1 January 16,640 17,834Additions 30 26Disposals (133) (3,148)Share of results 2,532 2,325Dividends (757) (694)Exchange differences (212) 396Share of other comprehensive income/(expense) of associates and joint ventures 78 (35)Other movements 3 (64)
At 31 December1 18,181 16,640
1 Includes goodwill of US$621m (2013: US$608m).

HSBC HOLDINGS PLC
407
Str
ateg
ic R
epo
rt
Fi
nan
cial
Rev
iew
Co
rpo
rate
Go
vern
ance
Fin
anci
al S
tate
men
ts
S
har
eho
lder
Info
rmat
ion
21 Goodwill and intangible assets
2014 2013US$m US$m
Goodwill 19,169 21,179Present value of in-force long-term insurance business 5,307 5,335Other intangible assets 3,101 3,404
At 31 December 27,577 29,918
Goodwill
Accounting policy
Goodwill arises on the acquisition of subsidiaries, when the aggregate of the fair value of the consideration transferred, the amount of any non-controlling interest and the fair value of any previously held equity interest in the acquiree exceed the amount of the identifiable assets and liabilities acquired. If the amount of the identifiable assets and liabilities acquired is greater, the difference is recognised immediately in the income statement. Goodwill is allocated to cash-generating units (‘CGU’s) for the purpose of impairment testing, which is undertaken at the lowest level at which goodwill is monitored for internal management purposes. HSBC’s CGU’s are based on geographical regions subdivided by global business. Impairment testing is performed at least annually, or whenever there is an indication of impairment, by comparing the recoverable amount of a CGU with its carrying amount. The carrying amount of a CGU is based on its assets and liabilities, including attributable goodwill. The recoverable amount of a CGU is the higher of its fair value less cost to sell and its value in use. VIU is the present value of the expected future CGU cash flows. If the recoverable amount is less than the carrying value, an impairment loss is charged to the income statement. Goodwill is carried on balance sheet at cost less accumulated impairment losses. At the date of disposal of a business, attributable goodwill is included in HSBC’s share of net assets in the calculation of the gain or loss on disposal. Goodwill is included in a disposal group if the disposal group is a CGU to which goodwill has been allocated or it is an operation within such a CGU. The amount of goodwill included in a disposal group is measured on the basis of the relative values of the operation disposed of and the portion of the CGU retained.
Critical accounting estimates and judgements
Goodwill impairment The review of goodwill for impairment reflects management’s best estimate of the future cash flows of the CGUs and the rates used to discount these cash flows, both of which are subject to uncertain factors as follows: • the future cash flows of the CGUs are sensitive to the cash flows projected for the periods for which detailed forecasts are available
and to assumptions regarding the long-term pattern of sustainable cash flows thereafter. Forecasts are compared with actual performance and verifiable economic data, but they reflect management’s view of future business prospects at the time of the assessment; and
• the rates used to discount future expected cash flows can have a significant effect on their valuation and are based on the costs of capital assigned to individual CGUs. The cost of capital percentage is generally derived from a Capital Asset Pricing Model, which incorporates inputs reflecting a number of financial and economic variables, including the risk-free interest rate in the country concerned and a premium for the risk of the business being evaluated. These variables are subject to fluctuations in external market rates and economic conditions beyond management’s control, are subject to uncertainty and require the exercise of significant judgement.
A decline in a CGU’s expected cash flows and/or an increase in its cost of capital reduces the CGU’s estimated recoverable amount. If this is lower than the carrying value of the CGU, a charge for impairment of goodwill is recognised in our income statement for the year. The accuracy of forecast cash flows is subject to a high degree of uncertainty in volatile market conditions. In such market conditions, management retests goodwill for impairment more frequently than annually to ensure that the assumptions on which the cash flow forecasts are based continue to reflect current market conditions and management’s best estimate of future business prospects. During 2014, no impairment of goodwill was identified (2013: nil). In addition to the annual impairment test which was performed as at 1 July 2014, management reviewed the current and expected performance of the CGUs as at 31 December 2014 and determined that there was no indication of impairment of the goodwill allocated to them.

Notes on the Financial Statements (continued) 21 – Goodwill and intangible assets
HSBC HOLDINGS PLC
408
Reconciliation of goodwill
Europe Asia MENA North
America Latin America Total
US$m US$m US$m US$m US$m US$mGross amount At 1 January 2014 14,977 1,016 55 7,861 3,241 27,150 Disposals (168) (168)Exchange differences (1,594) (30) (1) 1 (240) (1,864)Reclassified to held for sale (8) 24 16 Other 23 (47) (18) (42)
At 31 December 2014 13,207 1,009 54 7,815 3,007 25,092
Accumulated impairment losses At 1 January 2014 (5,971) (5,971)Exchange differences 1 1 Other 47 47
At 31 December 2014 (5,923) (5,923)
Net carrying amount at 31 December 2014 13,207 1,009 54 1,892 3,007 19,169
Gross amount At 1 January 2013 14,660 1,134 60 8,339 3,646 27,839 Disposals – – – – (1) (1)Exchange differences 596 (129) (5) (2) (132) 328 Reclassified to held for sale1 (611) – – – (272) (883)Reinstated from held for sale 332 – – – – 332 Other – 11 – (476) – (465)
At 31 December 2013 14,977 1,016 55 7,861 3,241 27,150
Accumulated impairment losses At 1 January 2013 – – – (6,449) – (6,449)Exchange differences – – – 2 – 2 Other – – – 476 – 476
At 31 December 2013 – – – (5,971) – (5,971)
Net carrying amount at 31 December 2013 14,977 1,016 55 1,890 3,241 21,179
1 During 2013, goodwill in Europe amounting to US$611m was reclassified to assets held for sale following the decision to sell the private banking operations of HSBC Private Bank Holdings (Suisse) S.A. in Monaco. On transfer to held for sale, a write down of the disposal group by US$279m was recorded and allocated to goodwill. Following the later decision to retain the operations, the reclassification of the assets and liabilities out of held for sale resulted in the reinstatement of the remaining goodwill.
Impairment testing
Timing of impairment testing
HSBC’s impairment test in respect of goodwill allocated to each ‘CGU’ is performed as at 1 July each year.
Basis of the recoverable amount
The recoverable amount of all CGUs to which goodwill has been allocated was equal to its VIU at each respective testing date for 2013 and 2014.
For each significant CGU, the VIU is calculated by discounting management’s cash flow projections for the CGU. The discount rate used is based on the cost of capital HSBC allocates to investments in the countries within which the CGU operates. The long-term growth rate is used to extrapolate the cash flows in perpetuity because of the long-term perspective within the Group of the business units making up the CGUs. For the goodwill impairment test conducted at 1 July 2014, management’s cash flow projections until the end of 2018 were used.

HSBC HOLDINGS PLC
409
Str
ateg
ic R
epo
rt
Fi
nan
cial
Rev
iew
Co
rpo
rate
Go
vern
ance
Fin
anci
al S
tate
men
ts
S
har
eho
lder
Info
rmat
ion
Key assumptions in VIU calculation Nominal
Goodwill at 1 July
Discount rate
growth rate beyond initial cash flow projections
US$m % %Cash-generating unit Retail Banking and Wealth Management – Europe 4,298 9.1 4.5Commercial Banking – Europe 3,214 10.1 4.2Global Private Banking – Europe 3,808 7.1 3.4Global Banking and Markets – Europe 3,296 11.0 4.2Retail Banking and Wealth Management – Latin America 1,762 12.8 7.9
2014 16,378 Cash-generating unit Retail Banking and Wealth Management – Europe 4,135 8.0 3.9Commercial Banking – Europe 3,062 10.0 3.8Global Private Banking – Europe 3,607 7.3 3.0Global Banking and Markets – Europe 3,101 9.9 3.7Retail Banking and Wealth Management – Latin America 1,812 11.2 8.6
2013 15,717
At 1 July 2014, aggregate goodwill of US$4,526m (1 July 2013: US$4,550m) had been allocated to CGUs that were not considered individually significant. The Group’s CGUs do not carry on their balance sheets any significant intangible assets with indefinite useful lives, other than goodwill.
Nominal long-term growth rate: this growth rate reflects GDP and inflation for the countries within which the CGU operates. The rates are based on IMF forecast growth rates as these rates are regarded as the most relevant estimate of likely future trends. The rates used for 2013 and 2014 do not exceed the long-term growth rate for the countries within which the CGU operates.
Discount rate: the discount rate used to discount the cash flows is based on the cost of capital assigned to each CGU, which is derived using a CAPM. The CAPM depends on inputs reflecting a number of financial and economic variables including the risk-free rate and a premium to reflect the inherent risk of the business being evaluated. These variables are based on the market’s assessment of the economic variables and management’s judgement. For the 1 July 2014 test, the methodology used to determine the discount rate for each CGU was refined to more accurately reflect the rates of inflation for the countries within which the CGU operates. In addition, for the purposes of testing goodwill for impairment, management supplements this process by comparing the discount rates derived using the internally generated CAPM with cost of capital rates produced by external sources. HSBC uses externally-sourced cost of capital rates where, in management’s judgement, those rates reflect more accurately the current market and economic conditions. For 2013 and 2014, internal costs of capital rates were consistent with externally-sourced rates.
Management’s judgement in estimating the cash flows of a CGU: the cash flow projections for each CGU are based on plans approved by the GMB. The key assumptions in addition to the discount rate and nominal long-term growth rate for each significant CGU are discussed below.
Global Private Banking – Europe: the cash flow forecast for GPB – Europe primarily reflects the repositioning of the business that is underway to concentrate on clients aligned with the Group’s priorities. Revenues in GPB – Europe are predominately generated through HSBC’s client relationships and the key assumption in the cash flow forecast is the level of assets under management and profitability therein following the strategic repositioning. The cash flow forecast includes increased profitability in GPB – Europe which is dependent on management achieving the planned strategic repositioning, in the context of the external environment.
At 1 July 2014, GPB – Europe had an excess of recoverable amount over carrying amount (‘headroom’) of US$1.8bn.
The following changes to the key assumptions in the value in use calculation would be necessary in order to reduce headroom to nil:
Key assumption Change to key assumption to reduce headroom to nil Discount rate Increase by 90 basis points Long-term growth rate Decrease by 102 basis points Cash flow projection Decrease by 19.7%
The following table illustrates the effect on VIU of reasonably possible changes to key assumptions. This reflects the sensitivity of VIU to each key assumption on its own and it is possible that more than one favourable and/or unfavourable change will occur at the same time.

Notes on the Financial Statements (continued) 21 – Goodwill and intangible assets
HSBC HOLDINGS PLC
410
Favourable change
Current model
Unfavourable change
US$bn US$bn US$bnAt 1 July 2014 Carrying amount of CGU: US$7.3bn
Excess of recoverable amount over carrying amount: $1.8bn Long-term growth rate +100bp 3.4% -100bp
VIU 12.2 9.1 7.4Increase/(decrease) in VIU 3.1 (1.7)
Discount rate -100bp 7.1% +100bpVIU 12.5 9.1 7.2Increase/(decrease) in VIU 3.4 (1.9)
Forecast cash flow +20% 378 -20%VIU 10.9 9.1 7.3Increase/(decrease) in VIU 1.8 (1.8)
Retail Banking and Wealth Management – Europe and Commercial Banking – Europe: the assumptions included in the cash flow projections for RBWM – Europe and CMB – Europe reflect the economic environment and financial outlook of the European countries within these two CGUs. Key assumptions include the level of interest rates, nominal GDP growth, competitors’ positions within the market and the level and change in unemployment rates. While current economic conditions in Europe continue to be challenging, management’s cash flow projections are based primarily on these prevailing conditions. Risks include slower than expected growth and an uncertain regulatory environment. RBWM – Europe is sensitive to further customer remediation and regulatory actions. Based on the conditions at the balance sheet date, management determined that a reasonably possible change in any of the key assumptions described above would not cause an impairment to be recognised in respect of RBWM – Europe or CMB – Europe.
Global Banking and Markets – Europe: the key assumption included in the cash flow projection for GB&M – Europe is that European markets will continue to recover. Accordingly, recovery in European revenues is assumed to continue over the projection period to 2018. Interest rate fluctuations would put further pressure on European markets revenue recovery. Our ability to achieve the forecast cash flows for GB&M – Europe could be adversely impacted by regulatory change during the forecast period including but not limited to the extent that the recommendations set out in the final report by the Independent Commission on Banking are implemented. Based on the conditions at the balance sheet date, management determined that a reasonably possible change in any of the key assumptions described above would not cause an impairment to be recognised in respect of GB&M – Europe.
Retail Banking and Wealth Management – Latin America: the assumptions included in the cash flow projections for RBWM – Latin America reflect the economic environment and financial outlook of the countries within this CGU, with Brazil and Mexico being the two largest. Key assumptions include growth in lending and deposit volumes and the credit quality of the loan portfolios. Potential challenges include unfavourable economic conditions restricting client demand and competitor pricing constraining margins. Based on the conditions at the balance sheet date, management determined that a reasonably possible change in any of the key assumptions described above would not cause an impairment to be recognised in respect of RBWM – Latin America.
Intangible assets
Accounting policy
Intangible assets are recognised, and those that are acquired in a business combination are distinguished from goodwill, when they are separable or arise from contractual or other legal rights, and their fair value can be measured reliably. Intangible assets include the present value of in-force long-term insurance business and long-term investment contracts with discretionary participating features (‘PVIF’), computer software, trade names, mortgage servicing rights, customer lists, core deposit relationships, credit card customer relationships and merchant or other loan relationships. Computer software includes both purchased and internally generated software. The cost of internally generated software comprises all directly attributable costs necessary to create, produce and prepare the software to be capable of operating in the manner intended by management. Costs incurred in the ongoing maintenance of software are expensed immediately as incurred. Intangible assets are subject to impairment review if there are events or changes in circumstances that indicate that the carrying amount may not be recoverable. Where: • intangible assets have an indefinite useful life, or are not yet ready for use, they are tested for impairment annually. An intangible
asset recognised during the current period is tested before the end of the current year; and where • intangible assets have a finite useful life, except for PVIF, they are stated at cost less amortisation and accumulated impairment losses
and are amortised over their estimated useful lives. Estimated useful life is the lower of legal duration and expected useful life. The amortisation of mortgage servicing rights is included within ‘Net fee income’.

HSBC HOLDINGS PLC
411
Str
ateg
ic R
epo
rt
Fi
nan
cial
Rev
iew
Co
rpo
rate
Go
vern
ance
Fin
anci
al S
tate
men
ts
S
har
eho
lder
Info
rmat
ion
Intangible assets with finite useful lives are amortised, generally on a straight-line basis, over their useful lives as follows: Trade names 10 years Mortgage servicing rights generally between 5 and 12 years Internally generated software between 3 and 5 years Purchased software between 3 and 5 years Customer/merchant relationships generally between 3 and 10 years Other generally 10 years
Present value of in-force long-term insurance business The value placed on insurance contracts that are classified as long-term insurance business or long-term investment contracts with discretionary participating features (‘DPF’) and are in force at the balance sheet date is recognised as an asset. The asset represents the present value of the equity holders’ interest in the issuing insurance companies’ profits expected to emerge from these contracts written at the balance sheet date. The PVIF is determined by discounting the equity holders’ interest in future profits expected to emerge from business currently in force using appropriate assumptions in assessing factors such as future mortality, lapse rates and levels of expenses, and a risk discount rate that reflects the risk premium attributable to the respective contracts. The PVIF incorporates allowances for both non-market risk and the value of financial options and guarantees. The PVIF asset is presented gross of attributable tax in the balance sheet and movements in the PVIF asset are included in ‘Other operating income’ on a gross of tax basis.
Present value of in-force long-term insurance business
Our life insurance business is accounted for using the embedded value approach which, inter alia, provides a risk and valuation framework. The PVIF asset at 31 December 2014 was US$5.3bn (2013: US$5.3bn).
Movements in PVIF 2014 2013 US$m US$m
PVIF at 1 January 5,335 4,847
Value of new business written during the year1 870 924 Movements arising from in-force business:
– expected return (545) (505)– experience variances2 62 (20)– changes in operating assumptions (69) 186
Investment return variances (34) 42 Changes in investment assumptions (75) (120)Other adjustments 52 18
Change in PVIF of long-term insurance business 261 525
Transfer of assets classified as held for sale3 (122) –Exchange differences and other (167) (37)
PVIF at 31 December 5,307 5,335
1 Value of new business written during the year is the present value of the projected stream of profits from the business. 2 Experience variances include the effect of the difference between demographic, expense and persistency assumptions used in the previous PVIF
calculation and actual experience observed during the year to the extent this affects profits on future business. 3 Relates to the UK Pensions business which was classified as held for sale in the first half of the year. See page 191 for further details.
In the PVIF calculation, expected cash flows are projected after adjusting for a variety of assumptions made by each insurance operation to reflect local market conditions and management’s judgement of future trends, and after applying risk margins to reflect any uncertainty in the underlying assumptions. The main assumptions relate to economic and non-economic assumptions and policyholder behaviour. Variations in actual experience and changes to assumptions can contribute to volatility in the results of the insurance business.
The key drivers of the movement in the value of the PVIF asset are the expected cash flows from:
• new business adjusted for anticipated maturities and assumptions relating to policyholder behaviour (‘value of new business written during the year’);
• unwind of the discount rate less the reversal of expected cash flows for the period (‘expected return’);
• changes in non-economic operating assumptions such as mortality or lapse rates (‘change in operating assumptions’);
• the effects of changes in projected future cash flows associated with operating assumption experience variances compared with those assumed at the start of the period (‘experience variances’);
• changes related to future investment returns (‘changes in investment assumptions’); and
• the effect of actual investment experience on existing assets compared with the assumptions at the start of the period (‘investment return variances’).
The valuation of the PVIF asset includes explicit risk margins for non-economic risks in the projection assumptions and explicit allowances for financial options and guarantees using stochastic methods. Risk discount rates are set on an active basis with reference to market risk-free yields.
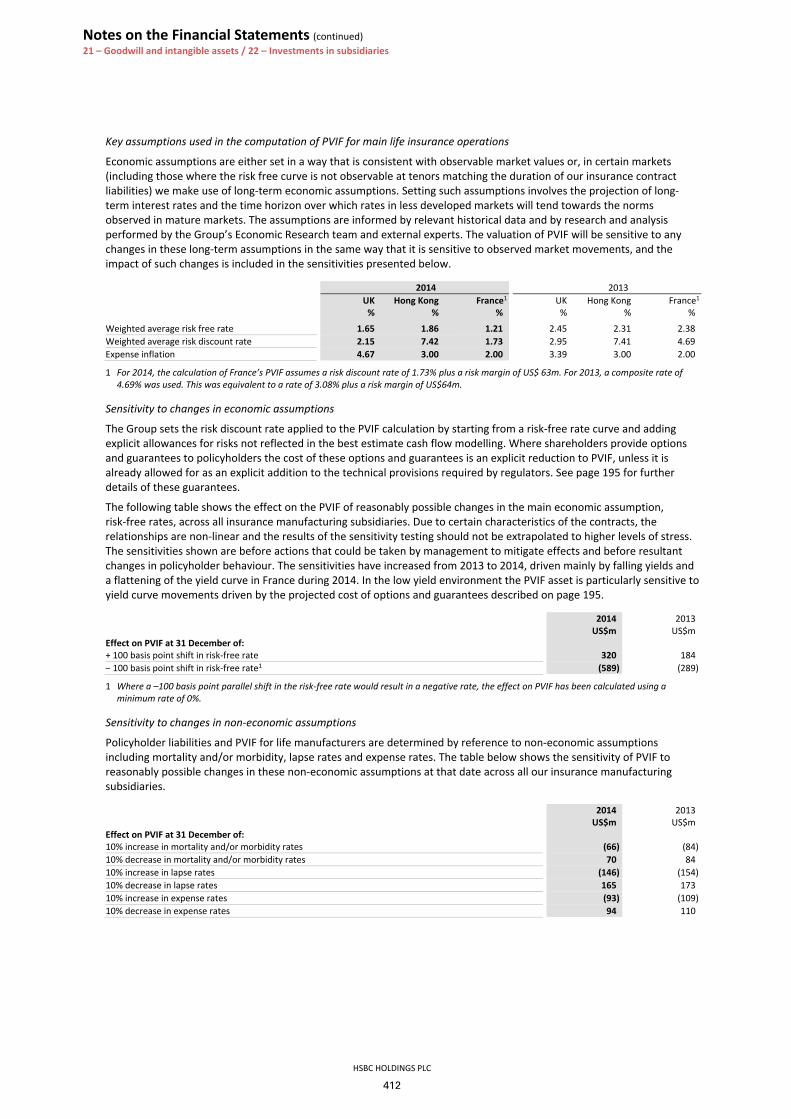
Notes on the Financial Statements (continued) 21 – Goodwill and intangible assets / 22 – Investments in subsidiaries
HSBC HOLDINGS PLC
412
Key assumptions used in the computation of PVIF for main life insurance operations
Economic assumptions are either set in a way that is consistent with observable market values or, in certain markets (including those where the risk free curve is not observable at tenors matching the duration of our insurance contract liabilities) we make use of long-term economic assumptions. Setting such assumptions involves the projection of long-term interest rates and the time horizon over which rates in less developed markets will tend towards the norms observed in mature markets. The assumptions are informed by relevant historical data and by research and analysis performed by the Group’s Economic Research team and external experts. The valuation of PVIF will be sensitive to any changes in these long-term assumptions in the same way that it is sensitive to observed market movements, and the impact of such changes is included in the sensitivities presented below.
2014 2013 UK Hong Kong France1 UK Hong Kong France1
% % % % % %
Weighted average risk free rate 1.65 1.86 1.21 2.45 2.31 2.38Weighted average risk discount rate 2.15 7.42 1.73 2.95 7.41 4.69Expense inflation 4.67 3.00 2.00 3.39 3.00 2.00
1 For 2014, the calculation of France’s PVIF assumes a risk discount rate of 1.73% plus a risk margin of US$ 63m. For 2013, a composite rate of 4.69% was used. This was equivalent to a rate of 3.08% plus a risk margin of US$64m.
Sensitivity to changes in economic assumptions
The Group sets the risk discount rate applied to the PVIF calculation by starting from a risk-free rate curve and adding explicit allowances for risks not reflected in the best estimate cash flow modelling. Where shareholders provide options and guarantees to policyholders the cost of these options and guarantees is an explicit reduction to PVIF, unless it is already allowed for as an explicit addition to the technical provisions required by regulators. See page 195 for further details of these guarantees.
The following table shows the effect on the PVIF of reasonably possible changes in the main economic assumption, risk-free rates, across all insurance manufacturing subsidiaries. Due to certain characteristics of the contracts, the relationships are non-linear and the results of the sensitivity testing should not be extrapolated to higher levels of stress. The sensitivities shown are before actions that could be taken by management to mitigate effects and before resultant changes in policyholder behaviour. The sensitivities have increased from 2013 to 2014, driven mainly by falling yields and a flattening of the yield curve in France during 2014. In the low yield environment the PVIF asset is particularly sensitive to yield curve movements driven by the projected cost of options and guarantees described on page 195.
2014 2013 US$m US$mEffect on PVIF at 31 December of: + 100 basis point shift in risk-free rate 320 184 – 100 basis point shift in risk-free rate1 (589) (289)
1 Where a –100 basis point parallel shift in the risk-free rate would result in a negative rate, the effect on PVIF has been calculated using a minimum rate of 0%.
Sensitivity to changes in non-economic assumptions
Policyholder liabilities and PVIF for life manufacturers are determined by reference to non-economic assumptions including mortality and/or morbidity, lapse rates and expense rates. The table below shows the sensitivity of PVIF to reasonably possible changes in these non-economic assumptions at that date across all our insurance manufacturing subsidiaries.
2014 2013 US$m US$mEffect on PVIF at 31 December of: 10% increase in mortality and/or morbidity rates (66) (84)10% decrease in mortality and/or morbidity rates 70 8410% increase in lapse rates (146) (154)10% decrease in lapse rates 165 17310% increase in expense rates (93) (109)10% decrease in expense rates 94 110

HSBC HOLDINGS PLC
413
Str
ateg
ic R
epo
rt
Fi
nan
cial
Rev
iew
Co
rpo
rate
Go
vern
ance
Fin
anci
al S
tate
men
ts
S
har
eho
lder
Info
rmat
ion
Other intangible assets
Movement of intangible assets excluding goodwill and the PVIF
Internallygenerated
software Other Total US$m US$m US$mCost At 1 January 2014 5,999 2,975 8,974 Additions 732 177 909 Disposals (35) (80) (115)Amount written off (24) (53) (77)Other changes (259) (156) (415)
163At 31 December 2014 6,413 2,863 9,276
Accumulated amortisation At 1 January 2014 (3,809) (1,761) (5,570)Charge for the year1 (677) (261) (938)Impairment (11) (54) (65)Disposals 32 77 109 Amount written off 24 53 77 Other changes 155 57 212
At 31 December 2014 (4,286) (1,889) (6,175)
Net carrying amount at 31 December 2014 2,127 974 3,101 Cost At 1 January 2013 5,703 3,345 9,048 Additions 731 142 873 Disposals (117) (196) (313)Amount written off (57) (47) (104)Other changes (261) (269) (530)
At 31 December 2013 5,999 2,975 8,974
Accumulated amortisation At 1 January 2013 (3,469) (1,963) (5,432)Charge for the year1 (675) (179) (854)Impairment (39) (4) (43)Disposals 111 167 278 Amount written off 57 47 104 Other changes 206 171 377
At 31 December 2013 (3,809) (1,761) (5,570)
Net carrying amount at 31 December 2013 2,190 1,214 3,404
1 The amortisation charge for the year is recognised within the income statement under ‘Amortisation and impairment of intangible assets’, with the exception of the amortisation of mortgage servicing rights which is recognised in ‘Net fee income’. The revaluation net of amortisation charge for mortgage servicing rights was US$67m in 2014 (2013: credit of US$34m).
22 Investments in subsidiaries
Accounting policy
HSBC classifies investments in entities which it controls as subsidiaries. HSBC consolidation policy is described in Note 1(h). Subsidiaries which are structured entities are covered in Note 39.
HSBC Holdings’ investments in subsidiaries are stated at cost less impairment losses. Impairment losses recognised in prior periods are reversed through the income statement if there has been a change in the estimates used to determine the investment’s recoverable amount since the last impairment loss was recognised.

Notes on the Financial Statements (continued) 22 – Investments in subsidiaries
HSBC HOLDINGS PLC
414
Principal subsidiaries of HSBC Holdings At 31 December 2014
Country of incorporation or registration
HSBC’sinterest in
equity capital%
Issued equity capital
Share class
Europe HSBC Asset Finance (UK) Limited England 100 £265m Ordinary £1HSBC Bank A.S. Turkey 100 TRL652m
A–Common TRL1 B–Common TRL1
HSBC Bank plc England 100 £797m
Ordinary £1 Preferred Ordinary £1 Series 2 Third Dollar Preference US$0.01 Third Dollar Preference US$0.01
HSBC France France 99.99 €337m Shares €5.00HSBC Private Banking Holdings (Suisse) SA Switzerland 100 CHF1,363m Ordinary CHF1,000HSBC Trinkaus & Burkhardt AG Germany 80.65 €75.4m Shares of no par value Asia Hang Seng Bank Limited1 Hong Kong 62.14 HK$9, 658m Ordinary no par valueHSBC Bank Australia Limited Australia 100 A$811m Ordinary no par valueHSBC Bank (China) Company Limited PRC5 100 RMB15,400m Ordinary CNY1.00HSBC Bank Malaysia Berhad Malaysia 100 RM115m Ordinary RM0.50HSBC Bank (Taiwan) Limited Taiwan 100 TWD34,800m Ordinary TWD10.00HSBC Life (International) Limited Bermuda 100 HK$4,178m Ordinary HK$1.00The Hongkong and Shanghai Banking Corporation Limited Hong Kong 100 HK$96,052m
Ordinary no par value CIP2 US$1.00 CRP3 US$1.00 NIP4 US$1.00
Middle East and North Africa HSBC Bank Middle East Limited Jersey 100 US$931m
Ordinary US$1.00 CRP3 US$1.00
HSBC Bank Egypt S.A.E. Egypt 94.53 EGP2,796m Ordinary EGP84.00 North America
HSBC Bank Canada Canada 100 C$1,225m Common shares of no par value
HSBC Bank USA, N.A. USA 100 US$2m Common US$100HSBC Finance Corporation USA 100 –6 Common US$0.01HSBC Securities (USA) Inc. USA 100 –6 Common US$0.05 Latin America HSBC Bank Argentina S.A. Argentina 99.99 ARS1,244m
Ordinary–A ARS1.00 Ordinary–B ARS1.00
HSBC Bank Brasil S.A. – Banco Múltiplo Brazil 100 BRL6,402m Shares of no par valueHSBC Mexico, S.A., Institución de Banca Múltiple,
Grupo Financiero HSBC Mexico 99.99 MXN5,681m Ordinary MXN2.00
1 Listed in Hong Kong. 4 Non-cumulative Irredeemable Preference shares. 2 Cumulative Irredeemable Preference shares. 5 People’s Republic of China.3 Cumulative Redeemable Preference shares. 6 Issued equity capital is less than US$1m.
Details of the debt, subordinated debt and preference shares issued by the principal subsidiaries to parties external to the Group are included in the Notes 26 ‘Debt securities in issue’, 30 ‘Subordinated liabilities’ and 34 ‘Non-controlling interests’, respectively.
All the above subsidiaries are included in the HSBC consolidated financial statements.

HSBC HOLDINGS PLC
415
Str
ateg
ic R
epo
rt
Fi
nan
cial
Rev
iew
Co
rpo
rate
Go
vern
ance
Fin
anci
al S
tate
men
ts
S
har
eho
lder
Info
rmat
ion
Details of all HSBC subsidiaries, as required under Section 409 of the Companies Act 2006, will be annexed to the next Annual Return of HSBC Holdings filed with the UK Registrar of Companies.
The principal countries of operation are the same as the countries of incorporation except for HSBC Bank Middle East Limited, which operates mainly in the Middle East and North Africa, and HSBC Life (International) Limited, which operates mainly in Hong Kong.
HSBC is structured as a network of regional banks and locally incorporated regulated banking entities. Each bank is separately capitalised in accordance with applicable prudential requirements and maintains a capital buffer consistent with the Group’s risk appetite for the relevant country or region. Our capital management process culminates in the annual Group capital plan, which is approved by the Board. HSBC Holdings is the primary provider of equity capital to its subsidiaries and also provides them with non-equity capital where necessary. These investments are substantially funded by HSBC Holdings’ issuance of equity and non-equity capital and by profit retention. As part of its capital management process, HSBC Holdings seeks to maintain a balance between the composition of its capital and its investment in subsidiaries. Subject to the above, there is no current or foreseen impediment to HSBC Holdings’ ability to provide such investments. The ability of subsidiaries to pay dividends or advance monies to HSBC Holdings depends on, among other things, their respective local regulatory capital and banking requirements, statutory reserves, and financial and operating performance. During 2014 and 2013, none of the Group’s subsidiaries experienced significant restrictions on paying dividends or repaying loans and advances. Also, there are no foreseen restrictions envisaged by our subsidiaries on paying dividends or repaying loans and advances.
The amount of guarantees by HSBC Holdings in favour of other HSBC Group entities is set out in Note 37.
Structured entities consolidated by HSBC where HSBC owns less than 50% of the voting rights Carrying value of total
consolidated assets Nature of SPE 2014 2013 US$bn US$bn
Solitaire Funding Ltd 9.0 10.2 Securities investment conduitMazarin Funding Limited 3.9 7.4 Securities investment conduitBarion Funding Limited 2.0 3.8 Securities investment conduitMalachite Funding Limited 1.4 3.0 Securities investment conduitHSBC Home Equity Loan Corporation I 1.9 2.1 Securitisation HSBC Home Equity Loan Corporation II 0.9 1.6 Securitisation Regency Assets Limited 11.0 13.5 Conduit Bryant Park Funding LLC – 0.4 Conduit
In addition to the above, HSBC consolidates a number of individually insignificant structured entities with total assets of US$22.9bn (2013: US$26.1bn). For further details, see Note 39.
In each of the above cases, HSBC controls and consolidates an entity when it is exposed, or has rights, to variable returns from its involvement with the entity and has the ability to affect those returns through its power over the entity.
Subsidiaries with significant non-controlling interests 2014 2013Hang Seng Bank Limited Proportion of ownership interests and voting rights held by non-controlling interests 37.86% 37.86%Place of business Hong Kong Hong Kong US$m US$m
Profit attributable to non-controlling interests 760 1,332Accumulated non-controlling interests of the subsidiary 5,765 4,591Dividends paid to non-controlling interests 513 495Summarised financial information:
– total assets 160,769 145,380– total liabilities 144,642 133,253– net operating income before loan impairment 3,687 4,876– profit for the year 2,007 3,517– total comprehensive income for the year 4,460 3,145

Notes on the Financial Statements (continued) 23 – Prepayments, accrued income and other assets / 24 – Trading liabilities / 25 – Financial liabilities at FV
HSBC HOLDINGS PLC
416
23 Prepayments, accrued income and other assets
Accounting policy
Assets held for sale Assets and liabilities of disposal groups and non-current assets are classified as held for sale when their carrying amounts will be recovered principally through sale rather than through continuing use. Held-for-sale assets are generally measured at the lower of their carrying amount and fair value less cost to sell, except for those assets and liabilities that are not within the scope of the measurement requirements of IFRS 5 ‘Non-current Assets Held for Sale and Discontinued Operations’. Immediately before the initial classification as held for sale, the carrying amounts of the relevant assets and liabilities are measured in accordance with applicable IFRSs. On subsequent remeasurement of a disposal group, the carrying amounts of any assets and liabilities that are not within the scope of the measurement requirements of IFRS 5, but are included in a disposal group classified as held for sale, are remeasured under applicable IFRSs before the fair value less costs to sell of the disposal group is determined.
Property, plant and equipment Land and buildings are stated at historical cost, or fair value at the date of transition to IFRSs (‘deemed cost’), less impairment losses and depreciation over their estimated useful lives, as follows: • freehold land is not depreciated; • freehold buildings are depreciated at the greater of 2% per annum on a straight-line basis or over their remaining useful lives; and • leasehold land and buildings are depreciated over the shorter of their unexpired terms of the leases or their remaining useful lives. Equipment, fixtures and fittings (including equipment on operating leases where HSBC is the lessor) are stated at cost less impairment losses and depreciation over their useful lives, which are generally between 5 years and 20 years. Property, plant and equipment is subject to an impairment review if their carrying amount may not be recoverable. HSBC holds certain properties as investments to earn rentals or for capital appreciation, or both, and those investment properties are included on balance sheet at fair value.
Prepayments, accrued income and other assets 2014 2013 US$m US$m
Prepayments and accrued income 10,554 11,006Assets held for sale 7,647 4,050Bullion 15,726 22,929Endorsements and acceptances 10,775 11,624Reinsurers’ share of liabilities under insurance contracts (Note 28) 1,032 1,408Employee benefit assets (Note 6) 5,028 2,140Other accounts 13,882 12,838Property, plant and equipment 10,532 10,847
At 31 December 75,176 76,842
Prepayments, accrued income and other assets include US$40,622m (2013: US$37,635m) of financial assets, the majority of which are measured at amortised cost.
Property, plant and equipment – selected information 2014 2013 US$m US$m
Cost or fair value 21,831 21,927Accumulated depreciation and impairment 11,299 11,080
Net carrying amount at 31 December 10,532 10,847
Additions at cost 1,477 1,980Disposals at net book value 69 267
Property, plant and equipment1: Land and buildings 5,234 5,661– freehold 1,769 2,062– long leasehold 1,252 1,266– medium and short leasehold 2,213 2,333
Investment properties2 2,236 1,945
1 Includes nil freehold (2013: nil), US$1,306m long leasehold (2013: US$1,309m), US$2,638m medium leasehold (2013: US$2,472m) and nil short leasehold (2013: US$2m) in Hong Kong.
2 Investment properties are valued on a market value basis as at 31 December each year by independent professional valuers who have recent experience in the location and type of properties. Investment properties in Hong Kong, the Macau Special Administrative Region and mainland China, which represent more than 74% by value of HSBC’s investment properties subject to revaluation, were valued by DTZ Debenham Tie Leung Limited whose valuers are members of the Hong Kong Institute of Surveyors. Properties in other countries, which represent 26% by value of HSBC’s investment properties, were valued by different independent professionally qualified valuers.
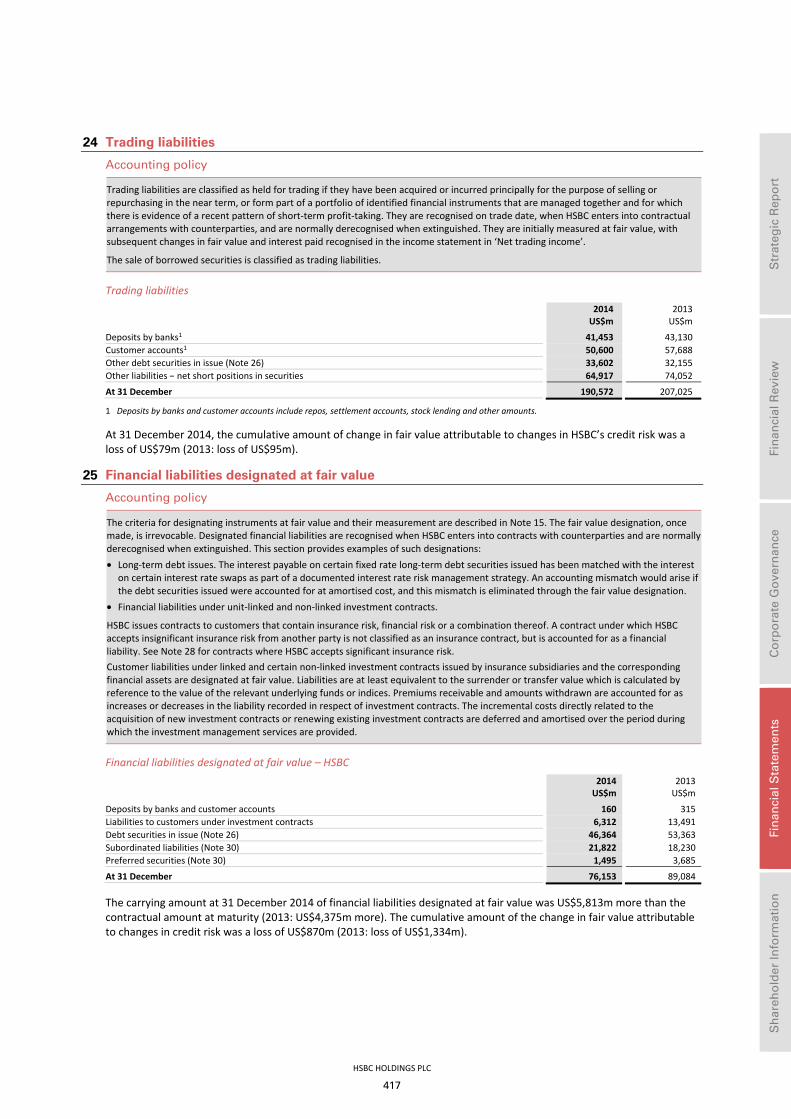
HSBC HOLDINGS PLC
417
Str
ateg
ic R
epo
rt
Fi
nan
cial
Rev
iew
Co
rpo
rate
Go
vern
ance
Fin
anci
al S
tate
men
ts
S
har
eho
lder
Info
rmat
ion
24 Trading liabilities
Accounting policy
Trading liabilities are classified as held for trading if they have been acquired or incurred principally for the purpose of selling or repurchasing in the near term, or form part of a portfolio of identified financial instruments that are managed together and for which there is evidence of a recent pattern of short-term profit-taking. They are recognised on trade date, when HSBC enters into contractual arrangements with counterparties, and are normally derecognised when extinguished. They are initially measured at fair value, with subsequent changes in fair value and interest paid recognised in the income statement in ‘Net trading income’.
The sale of borrowed securities is classified as trading liabilities.
Trading liabilities 2014
US$m 2013
US$m
Deposits by banks1 41,453 43,130Customer accounts1 50,600 57,688Other debt securities in issue (Note 26) 33,602 32,155Other liabilities – net short positions in securities 64,917 74,052
At 31 December 190,572 207,025
1 Deposits by banks and customer accounts include repos, settlement accounts, stock lending and other amounts.
At 31 December 2014, the cumulative amount of change in fair value attributable to changes in HSBC’s credit risk was a loss of US$79m (2013: loss of US$95m).
25 Financial liabilities designated at fair value
Accounting policy
The criteria for designating instruments at fair value and their measurement are described in Note 15. The fair value designation, once made, is irrevocable. Designated financial liabilities are recognised when HSBC enters into contracts with counterparties and are normally derecognised when extinguished. This section provides examples of such designations: • Long-term debt issues. The interest payable on certain fixed rate long-term debt securities issued has been matched with the interest
on certain interest rate swaps as part of a documented interest rate risk management strategy. An accounting mismatch would arise if the debt securities issued were accounted for at amortised cost, and this mismatch is eliminated through the fair value designation.
• Financial liabilities under unit-linked and non-linked investment contracts.
HSBC issues contracts to customers that contain insurance risk, financial risk or a combination thereof. A contract under which HSBC accepts insignificant insurance risk from another party is not classified as an insurance contract, but is accounted for as a financial liability. See Note 28 for contracts where HSBC accepts significant insurance risk. Customer liabilities under linked and certain non-linked investment contracts issued by insurance subsidiaries and the corresponding financial assets are designated at fair value. Liabilities are at least equivalent to the surrender or transfer value which is calculated by reference to the value of the relevant underlying funds or indices. Premiums receivable and amounts withdrawn are accounted for as increases or decreases in the liability recorded in respect of investment contracts. The incremental costs directly related to the acquisition of new investment contracts or renewing existing investment contracts are deferred and amortised over the period during which the investment management services are provided.
Financial liabilities designated at fair value – HSBC 2014 2013 US$m US$m
Deposits by banks and customer accounts 160 315 Liabilities to customers under investment contracts 6,312 13,491 Debt securities in issue (Note 26) 46,364 53,363 Subordinated liabilities (Note 30) 21,822 18,230 Preferred securities (Note 30) 1,495 3,685
At 31 December 76,153 89,084
The carrying amount at 31 December 2014 of financial liabilities designated at fair value was US$5,813m more than the contractual amount at maturity (2013: US$4,375m more). The cumulative amount of the change in fair value attributable to changes in credit risk was a loss of US$870m (2013: loss of US$1,334m).

Notes on the Financial Statements (continued) 26 – Debt securities in issue / 27 – Accruals, deferred income and other liabilities / 28 – Liabilities under insurance contracts
HSBC HOLDINGS PLC
418
Financial liabilities designated at fair value – HSBC Holdings 2014 2013 US$m US$m
Debt securities in issue (Note 26): – owed to third parties 8,185 8,106
Subordinated liabilities (Note 30): – owed to third parties 9,513 9,760 – owed to HSBC undertakings 981 3,161
At 31 December 18,679 21,027
The carrying amount at 31 December 2014 of financial liabilities designated at fair value was US$2,694m more than the contractual amount at maturity (2013: US$2,309m more). The cumulative amount of the change in fair value attributable to changes in credit risk was a loss of US$520m (2013: loss of US$859m).
26 Debt securities in issue
Accounting policy
Financial liabilities for debt securities issued are recognised when HSBC enters into contractual arrangements with counterparties and initially measured at fair value, which is normally the consideration received, net of directly attributable transaction costs incurred. Subsequent measurement of financial liabilities, other than those measured at fair value through profit or loss and financial guarantees, is at amortised cost, using the effective interest method to amortise the difference between proceeds received, net of directly attributable transaction costs incurred, and the redemption amount over the expected life of the instrument.
Debt securities in issue – HSBC 2014 2013 US$m US$m
Bonds and medium-term notes 132,539 146,116Other debt securities in issue 43,374 43,482
175,913 189,598Of which debt securities in issue reported as: – trading liabilities (Note 24) (33,602) (32,155)– financial liabilities designated at fair value (Note 25) (46,364) (53,363)
At 31 December 95,947 104,080
Debt securities in issue – HSBC Holdings 2014 2013 US$m US$m
Debt securities 9,194 10,897Of which debt securities in issue reported as: – financial liabilities designated at fair value (Note 25) (8,185) (8,106)
At 31 December 1,009 2,791
27 Accruals, deferred income and other liabilities
2014 2013 US$m US$m
Liabilities of disposal groups held for sale 6,934 2,804Accruals and deferred income 15,075 16,185Amounts due to investors in funds consolidated by HSBC 782 1,008Obligations under finance leases 67 252Endorsements and acceptances 10,760 11,614Employee benefit liabilities (Note 6) 3,208 2,931Other liabilities 16,570 17,547
At 31 December 53,396 52,341
Accruals, deferred income and other liabilities include US$43,840m (2013: US$46,258m) of financial liabilities, the majority of which are measured at amortised cost.

HSBC HOLDINGS PLC
419
Str
ateg
ic R
epo
rt
Fi
nan
cial
Rev
iew
Co
rpo
rate
Go
vern
ance
Fin
anci
al S
tate
men
ts
S
har
eho
lder
Info
rmat
ion
28 Liabilities under insurance contracts
Accounting policy
HSBC issues contracts to customers that contain insurance risk, financial risk or a combination thereof. A contract under which HSBC accepts significant insurance risk from another party by agreeing to compensate that party on the occurrence of a specified uncertain future event, is classified as an insurance contract. An insurance contract may also transfer financial risk, but is accounted for as an insurance contract if the insurance risk is significant.
Liabilities under insurance contracts
Liabilities under non-linked life insurance contracts are calculated by each life insurance operation based on local actuarial principles. Liabilities under unit-linked life insurance contracts are at least equivalent to the surrender or transfer value which is calculated by reference to the value of the relevant underlying funds or indices. A liability adequacy test is carried out on insurance liabilities to ensure that the carrying amount of the liabilities is sufficient in the light of current estimates of future cash flows. When performing the liability adequacy test, all contractual cash flows are discounted and compared with the carrying value of the liability. When a shortfall is identified it is charged immediately to the income statement.
Future profit participation on insurance contracts with DPF
Where contracts provide discretionary profit participation benefits to policyholders, liabilities for these contracts include provisions for the future discretionary benefits to policyholders. These provisions reflect actual performance of the investment portfolio to date and management expectation of the future performance of the assets backing the contracts, as well as other experience factors such as mortality, lapses and operational efficiency, where appropriate. This benefit may arise from the contractual terms, regulation, or past distribution policy.
Investment contracts with DPF
While investment contracts with DPF are financial instruments, they continue to be treated as insurance contracts as permitted by IFRS 4. The Group therefore recognises the premiums for those contracts as revenue and recognises as an expense the resulting increase in the carrying amount of the liability. In the case of net unrealised investment gains on these contracts, whose discretionary benefits principally reflect the actual performance of the investment portfolio, the corresponding increase in the liabilities is recognised in either the income statement or other comprehensive income, following the treatment of the unrealised gains on the relevant assets. In the case of net unrealised losses, a deferred participating asset is recognised only to the extent that its recoverability is highly probable. Movements in the liabilities arising from realised gains and losses on relevant assets are recognised in the income statement.
Liabilities under insurance contracts
Gross Reinsurers’
share Net US$m US$m US$m
Non-linked insurance contracts1 At 1 January 2014 33,950 (1,118) 32,832Claims and benefits paid (3,575) 175 (3,400)Increase in liabilities to policyholders 7,764 (409) 7,355Disposals/transfers to held-for-sale (589) 527 (62)Exchange differences and other movements (577) 53 (524)
At 31 December 2014 36,973 (772) 36,201 Investment contracts with discretionary participation features At 1 January 2014 26,427 – 26,427Claims and benefits paid (2,175) – (2,175)Increase in liabilities to policyholders 3,188 – 3,188Exchange differences and other movements2 (2,372) – (2,372)
At 31 December 2014 25,068 – 25,068 Linked life insurance contracts At 1 January 2014 13,804 (290) 13,514Claims and benefits paid (1,499) 88 (1,411)Increase in liabilities to policyholders 2,762 33 2,795Disposals/transfers to held-for-sale (2,547) 74 (2,473)Exchange differences and other movements3 (700) (165) (865)
At 31 December 2014 11,820 (260) 11,560
Total liabilities to policyholders at 31 December 2014 73,861 (1,032) 72,829

Notes on the Financial Statements (continued) 29 – Provisions
HSBC HOLDINGS PLC
420
Gross
Reinsurers’ share Net
US$m US$m US$m
Non-linked insurance contracts1 At 1 January 2013 30,765 (952) 29,813Claims and benefits paid (3,014) 164 (2,850)Increase in liabilities to policyholders 6,892 (367) 6,525Disposals/transfers to held-for-sale (52) 13 (39)Exchange differences and other movements (641) 24 (617)
At 31 December 2013 33,950 (1,118) 32,832 Investment contracts with discretionary participation features At 1 January 2013 24,374 – 24,374Claims and benefits paid (2,308) – (2,308)Increase in liabilities to policyholders 3,677 – 3,677Exchange differences and other movements2 684 – 684
At 31 December 2013 26,427 – 26,427 Linked life insurance contracts At 1 January 2013 13,056 (455) 12,601Claims and benefits paid (1,976) 426 (1,550)Increase in liabilities to policyholders 3,379 111 3,490Exchange differences and other movements3 (655) (372) (1,027)
At 31 December 2013 13,804 (290) 13,514
Total liabilities to policyholders at 31 December 2013 74,181 (1,408) 72,773
1 Includes liabilities under non-life insurance contracts. 2 Includes movement in liabilities relating to discretionary profit participation benefits due to policyholders arising from net unrealised investment
gains recognised in other comprehensive income. 3 Includes amounts arising under reinsurance agreements.
The increase in liabilities to policyholders represents the aggregate of all events giving rise to additional liabilities to policyholders in the year. The key factors contributing to the movement in liabilities to policyholders include death claims, surrenders, lapses, liabilities to policyholders created at the initial inception of the policies, the declaration of bonuses and other amounts attributable to policyholders.
29 Provisions
Accounting policy
Provisions are recognised when it is probable that an outflow of economic benefits will be required to settle a present legal or constructive obligation, which has arisen as a result of past events and for which a reliable estimate can be made.
Critical accounting estimates and judgements
Provisions Judgement is involved in determining whether a present obligation exists and in estimating the probability, timing and amount of any outflows. Professional expert advice is taken on the assessment of litigation, property (including onerous contracts) and similar obligations.
Provisions for legal proceedings and regulatory matters typically require a higher degree of judgement than other types of provisions. When matters are at an early stage, accounting judgements can be difficult because of the high degree of uncertainty associated with determining whether a present obligation exists, and estimating the probability and amount of any outflows that may arise. As matters progress, management and legal advisers evaluate on an ongoing basis whether provisions should be recognised, revising previous judgements and estimates as appropriate. At more advanced stages, it is typically easier to make judgements and estimates around a better defined set of possible outcomes. However, the amount provisioned can remain very sensitive to the assumptions used. There could be a wide range of possible outcomes for any pending legal proceedings, investigations or inquiries. As a result, it is often not practicable to quantify a range of possible outcomes for individual matters. It is also not practicable to meaningfully quantify ranges of potential outcomes in aggregate for these types of provisions because of the diverse nature and circumstances of such matters and the wide range of uncertainties involved.
Provisions for customer remediation also require significant levels of estimation and judgement. The amounts of provisions recognised depend on a number of different assumptions, for example, the volume of inbound complaints, the projected period of inbound complaint volumes, the decay rate of complaint volumes, the population identified as systemically mis-sold and the number of policies per customer complaint.

HSBC HOLDINGS PLC
421
Str
ateg
ic R
epo
rt
Fi
nan
cial
Rev
iew
Co
rpo
rate
Go
vern
ance
Fin
anci
al S
tate
men
ts
S
har
eho
lder
Info
rmat
ion
Provisions
Restructuring
costs Contractual
commitments
Legalproceedings
and regulatorymatters
Customerremediation
Other provisions Total
US$m US$m US$m US$m US$m US$m
At 1 January 2014 271 177 1,832 2,382 555 5,217Additional provisions/increase in
provisions 147 136 1,752 1,440 154 3,629 Provisions utilised (143) (2) (1,109) (1,769) (112) (3,135)Amounts reversed (43) (46) (281) (184) (66) (620)Unwinding of discounts – 1 43 10 11 65Exchange differences and other
movements (35) (32) (53) (48) 10 (158)
At 31 December 2014 197 234 2,184 1,831 552 4,998 At 1 January 2013 251 301 1,667 2,387 646 5,252 Additional provisions/increase in
provisions 179 57 1,209 1,536 230 3,211 Provisions utilised (111) (5) (709) (1,487) (167) (2,479)Amounts reversed (65) (66) (340) (94) (126) (691)Unwinding of discounts – – 38 7 13 58 Exchange differences and other
movements 17 (110) (33) 33 (41) (134)
At 31 December 2013 271 177 1,832 2,382 555 5,217
Further details of legal proceedings and regulatory matters are set out in Note 40, including the provisions made on foreign exchange rate investigations and litigation. Legal proceedings include civil court, arbitration or tribunal proceedings brought against HSBC companies (whether by way of claim or counterclaim) or civil disputes that may, if not settled, result in court, arbitration or tribunal proceedings. Regulatory matters refer to investigations, reviews and other actions carried out by, or in response to the actions of, regulators or law enforcement agencies in connection with alleged wrongdoing by HSBC.
Customer remediation refers to activities carried out by HSBC to compensate customers for losses or damages associated with a failure to comply with regulations or to treat customers fairly. Customer remediation is initiated by HSBC in response to customer complaints and/or industry developments in sales practices, and is not necessarily initiated by regulatory action.
Payment protection insurance
At 31 December 2014, a provision of US$1,079m (31 December 2013: US$946m) was held relating to the estimated liability for redress in respect of the possible mis-selling of payment protection insurance (‘PPI’) policies in previous years. An increase in provisions of US$960m was recognised during the year, primarily reflecting an increase in inbound complaints by claims management companies compared to previous forecasts. The current projected trend of inbound complaint volumes implies that the redress programme will be complete by the first quarter of 2018. However, this timing is subject to uncertainty as the trend may change over time based on actual experience.
Cumulative provisions made since the Judicial Review ruling in the first half of 2011 amounted to US$4.2bn of which US$3.2bn had been paid as at 31 December 2014.
The estimated liability for redress is calculated on the basis of total premiums paid by the customer plus simple interest of 8% per annum (or the rate inherent in the related loan product where higher). The basis for calculating the redress liability is the same for single premium and regular premium policies. Future estimated redress levels are based on historically observed redress per policy.
A total of approximately 5.4m PPI policies have been sold by HSBC since 2000, generating estimated revenues of US$4.3bn at 2014 average exchange rates. The gross written premiums on these polices was approximately US$5.6bn at 2014 average exchange rates. At 31 December 2014, the estimated total complaints expected to be received was 1.9m, representing 36% of total policies sold. It is estimated that contact will be made with regard to 2.3m policies, representing 42% of total policies sold. This estimate includes inbound complaints as well as HSBC’s proactive contact exercise on certain policies (‘outbound contact’).
The following table details the cumulative number of complaints received at 31 December 2014 and the number of claims expected in the future:
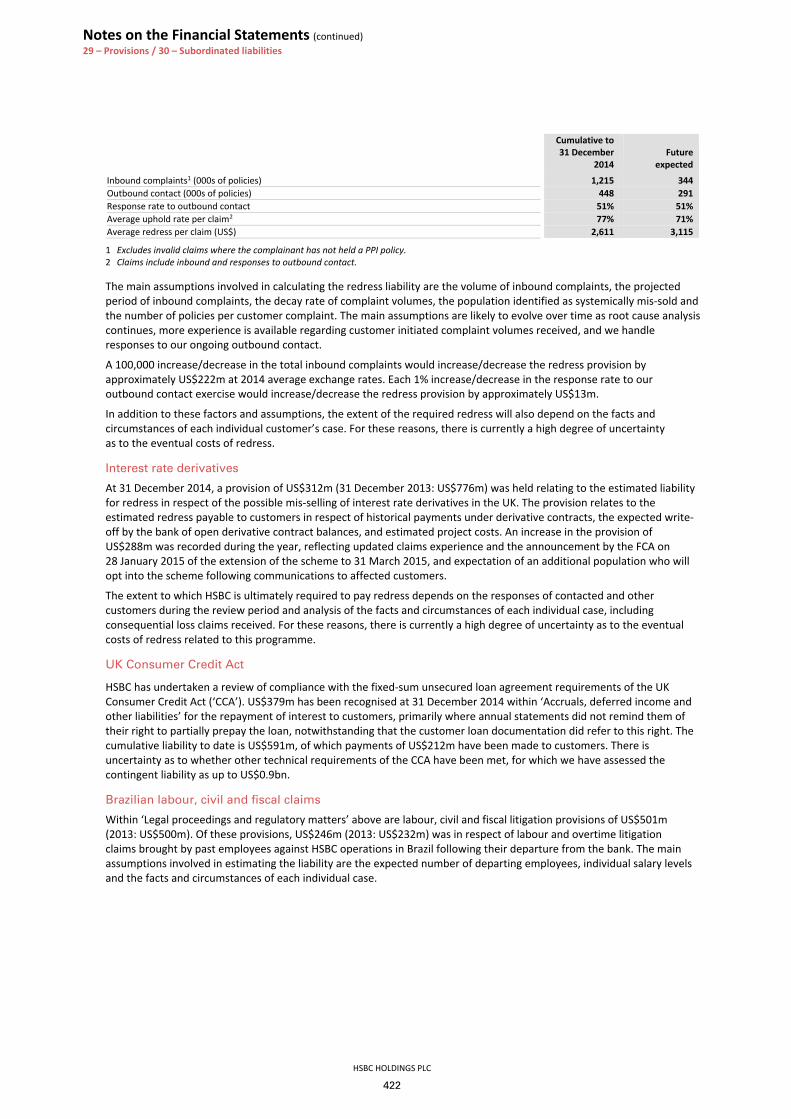
Notes on the Financial Statements (continued) 29 – Provisions / 30 – Subordinated liabilities
HSBC HOLDINGS PLC
422
Cumulative to 31 December 2014
Future expected
Inbound complaints1 (000s of policies) 1,215 344Outbound contact (000s of policies) 448 291Response rate to outbound contact 51% 51%Average uphold rate per claim2 77% 71%Average redress per claim (US$) 2,611 3,115
1 Excludes invalid claims where the complainant has not held a PPI policy. 2 Claims include inbound and responses to outbound contact.
The main assumptions involved in calculating the redress liability are the volume of inbound complaints, the projected period of inbound complaints, the decay rate of complaint volumes, the population identified as systemically mis-sold and the number of policies per customer complaint. The main assumptions are likely to evolve over time as root cause analysis continues, more experience is available regarding customer initiated complaint volumes received, and we handle responses to our ongoing outbound contact.
A 100,000 increase/decrease in the total inbound complaints would increase/decrease the redress provision by approximately US$222m at 2014 average exchange rates. Each 1% increase/decrease in the response rate to our outbound contact exercise would increase/decrease the redress provision by approximately US$13m.
In addition to these factors and assumptions, the extent of the required redress will also depend on the facts and circumstances of each individual customer’s case. For these reasons, there is currently a high degree of uncertainty as to the eventual costs of redress.
Interest rate derivatives
At 31 December 2014, a provision of US$312m (31 December 2013: US$776m) was held relating to the estimated liability for redress in respect of the possible mis-selling of interest rate derivatives in the UK. The provision relates to the estimated redress payable to customers in respect of historical payments under derivative contracts, the expected write-off by the bank of open derivative contract balances, and estimated project costs. An increase in the provision of US$288m was recorded during the year, reflecting updated claims experience and the announcement by the FCA on 28 January 2015 of the extension of the scheme to 31 March 2015, and expectation of an additional population who will opt into the scheme following communications to affected customers.
The extent to which HSBC is ultimately required to pay redress depends on the responses of contacted and other customers during the review period and analysis of the facts and circumstances of each individual case, including consequential loss claims received. For these reasons, there is currently a high degree of uncertainty as to the eventual costs of redress related to this programme.
UK Consumer Credit Act
HSBC has undertaken a review of compliance with the fixed-sum unsecured loan agreement requirements of the UK Consumer Credit Act (‘CCA’). US$379m has been recognised at 31 December 2014 within ‘Accruals, deferred income and other liabilities’ for the repayment of interest to customers, primarily where annual statements did not remind them of their right to partially prepay the loan, notwithstanding that the customer loan documentation did refer to this right. The cumulative liability to date is US$591m, of which payments of US$212m have been made to customers. There is uncertainty as to whether other technical requirements of the CCA have been met, for which we have assessed the contingent liability as up to US$0.9bn.
Brazilian labour, civil and fiscal claims
Within ‘Legal proceedings and regulatory matters’ above are labour, civil and fiscal litigation provisions of US$501m (2013: US$500m). Of these provisions, US$246m (2013: US$232m) was in respect of labour and overtime litigation claims brought by past employees against HSBC operations in Brazil following their departure from the bank. The main assumptions involved in estimating the liability are the expected number of departing employees, individual salary levels and the facts and circumstances of each individual case.

HSBC HOLDINGS PLC
423
Str
ateg
ic R
epo
rt
Fi
nan
cial
Rev
iew
Co
rpo
rate
Go
vern
ance
Fin
anci
al S
tate
men
ts
S
har
eho
lder
Info
rmat
ion
30 Subordinated liabilities
HSBC 2014 2013 US$m US$mSubordinated liabilities
At amortised cost 26,664 28,976– subordinated liabilities 22,355 24,573– preferred securities 4,309 4,403
Designated at fair value (Note 25) 23,317 21,915– subordinated liabilities 21,822 18,230– preferred securities 1,495 3,685
At 31 December 49,981 50,891
Subordinated liabilities HSBC Holdings 25,277 22,308Other HSBC 24,704 28,583
At 31 December 49,981 50,891
HSBC’s subordinated liabilities
Subordinated liabilities rank behind senior obligations and generally count towards the capital base of HSBC. Where applicable, capital securities may be called and redeemed by HSBC subject to prior notification to the PRA and, where relevant, the consent of the local banking regulator. If not redeemed at the first call date, coupons payable may step-up or become floating rate based on interbank rates.
Interest rates on the floating rate capital securities are generally related to interbank offered rates. On the remaining capital securities, interest is payable at fixed rates of up to 10.176%.
The balance sheet amounts disclosed below are presented on an IFRSs basis and do not reflect the amount that the instruments contribute to regulatory capital due to the inclusion of issuance costs, regulatory amortisation and regulatory eligibility limits prescribed in the grandfathering provisions under CRD IV.
HSBC’s subordinated liabilities in issue
First call
dateMaturity
date 2014
US$m 2013
US$m Additional tier 1 capital securities guaranteed by HSBC Holdings plc1 €1,400m 5.3687% non-cumulative step-up perpetual preferred securities2 Mar 2014 – 2,022£500m 8.208% non-cumulative step-up perpetual preferred securities Jun 2015 779 825€750m 5.13% non-cumulative step-up perpetual preferred securities Mar 2016 979 1,129
US$900m 10.176% non-cumulative step-up perpetual preferred securities,
series 2 Jun 2030 891 891
2,649 4,867
Additional tier 1 capital securities guaranteed by HSBC Bank plc1 £300m 5.862% non-cumulative step-up perpetual preferred securities Apr 2020 515 534£700m 5.844% non-cumulative step-up perpetual preferred securities Nov 2031 1,091 1,157
1,606 1,691
Tier 2 securities issued by HSBC Bank plc £500m 4.75% callable subordinated notes3 Sep 2015 Sep 2020 802 866£350m 5.00% callable subordinated notes4 Mar 2018 Mar 2023 605 635£300m 6.50% subordinated notes – Jul 2023 466 494£350m 5.375% callable subordinated step-up notes5 Nov 2025 Nov 2030 620 602£500m 5.375% subordinated notes – Aug 2033 905 884£225m 6.25% subordinated notes – Jan 2041 349 370£600m 4.75% subordinated notes – Mar 2046 924 980€500m Callable subordinated floating rate notes6 Sep 2015 Sep 2020 588 655US$300m 7.65% subordinated notes – May 2025 400 380US$750m Undated floating rate primary capital notes Jun 1990 750 751US$500m Undated floating rate primary capital notes Sep 1990 500 499US$300m Undated floating rate primary capital notes, series 3 Jun 1992 300 299
7,209 7,415

Notes on the Financial Statements (continued) 30 – Subordinated liabilities
HSBC HOLDINGS PLC
424
First call
dateMaturity
date 2014
US$m 2013
US$m
Tier 2 securities issued by The Hongkong and Shanghai Banking Corporation Ltd US$400m Primary capital undated floating rate notes Aug 1990 403 404US$400m Primary capital undated floating rate notes (second series) Dec 1990 401 402US$400m Primary capital undated floating rate notes (third series) Jul 1991 400 400 1,204 1,206
Tier 2 securities issued by HSBC Bank Australia Limited AUD200m Callable subordinated floating rate notes Nov 2015 Nov 2020 164 179 164 179
Tier 2 securities issued by HSBC Bank Malaysia Berhad MYR500m 4.35% subordinated bonds Jun 2017 Jun 2022 143 152MYR500m 5.05% subordinated bonds Nov 2022 Nov 2027 144 154 287 306
Tier 2 securities issued by HSBC USA Inc. US$200m 7.808% capital securities Dec 2006 Dec 2026 200 200US$200m 8.38% capital securities May 2007 May 2027 200 200US$150m 9.50% subordinated debt7 – Apr 2014 – 151US$150m 7.75% Capital Trust pass through securities Nov 2006 Nov 2026 150 150US$750m 5.00% subordinated notes – Sep 2020 738 746US$250m 7.20% subordinated debentures – Jul 2097 216 215 Other subordinated liabilities each less than US$150m 297 299 1,801 1,961
Tier 2 securities issued by HSBC Bank USA, N.A. US$1,000m 4.625% subordinated notes7 – Apr 2014 – 1,000US$500m 6.00% subordinated notes – Aug 2017 508 513US$1,250m 4.875% subordinated notes – Aug 2020 1,210 1,262US$1,000m 5.875% subordinated notes – Nov 2034 1,245 1,081US$750m 5.625% subordinated notes – Aug 2035 934 811US$700m 7.00% subordinated notes – Jan 2039 676 696 4,573 5,363
Tier 2 securities issued by HSBC Finance Corporation US$1,000m 5.911% trust preferred securities8 Nov 2015 Nov 2035 998 996US$2,939m 6.676% senior subordinated notes9 – Jan 2021 2,185 2,182 3,183 3,178
Tier 2 securities issued by HSBC Bank Brazil S.A. BRL383m Subordinated certificates of deposit – Feb 2015 144 162BRL500m Subordinated floating rate certificates of deposit – Dec 2016 188 212 Other subordinated liabilities each less than US$150m10 81 224 413 598
Tier 2 securities issued by HSBC Bank Canada CAD400m 4.80% subordinated debentures Apr 2017 Apr 2022 367 403CAD200m 4.94% subordinated debentures Mar 2016 Mar 2021 172 188CAD39m Floating rate debentures Oct 1996 Nov 2083 34 37 573 628
Securities issued by HSBC Mexico, S.A. MXN1,818m Non-convertible subordinated obligations11 Sep 2013 Sep 2018 124 138MXN2,273m Non-convertible subordinated obligations11 Dec 2013 Dec 2018 154 173US$300m Non-convertible subordinated obligations11,12 Jun 2014 Jun 2019 240 240 518 551
Securities issued by other HSBC subsidiaries Other subordinated liabilities each less than US$200m11 524 640
Total of subordinated liabilities issued by HSBC subsidiaries 24,704 28,583
1 See paragraph below, ‘Guaranteed by HSBC Holdings or HSBC Bank’. 2 In March 2014, HSBC called and redeemed the €1,400m 5.3687% non-cumulative step-up perpetual preferred securities at par. 3 The interest rate payable after September 2015 is the sum of the three-month sterling Libor plus 0.82%. 4 The interest rate payable after March 2018 is the sum of the gross redemption yield of the then prevailing five-year UK gilt plus 1.80%. 5 The interest rate payable after November 2025 is the sum of the three-month sterling Libor plus 1.50%. 6 The interest margin increases by 0.5% from September 2015. 7 In April 2014, HSBC redeemed the $1,000m 4.625% subordinated notes and the 9.5% subordinated debt security at par. 8 The distributions change in November 2015 to three-month dollar Libor plus 1.926%. 9 Approximately 25% of the senior subordinated notes are held by HSBC Holdings. 10 Some securities included here are ineligible for inclusion in the capital base of HSBC in accordance with guidance in PRA’s GENPRU as applied in
2013 and CRD IV rules as applied in 2014. 11 These securities are ineligible for inclusion in the capital base of HSBC in accordance with guidance in PRA’s GENPRU as applied in 2013 and
CRD IV rules as applied in 2014. 12 Approximately US$60m of the subordinated obligations are held by HSBC Holdings.

HSBC HOLDINGS PLC
425
Str
ateg
ic R
epo
rt
Fi
nan
cial
Rev
iew
Co
rpo
rate
Go
vern
ance
Fin
anci
al S
tate
men
ts
S
har
eho
lder
Info
rmat
ion
HSBC Holdings 2014 2013 US$m US$mSubordinated liabilities:
– at amortised cost 17,255 14,167 – designated at fair value (Note 25) 10,494 12,921
At 31 December 27,749 27,088
HSBC Holdings’ subordinated liabilities
First call
date Maturity
date 2014
US$m 2013
US$m Tier 2 securities issued by HSBC Holdings plc
Amounts owed to third parties US$488m 7.625% subordinated notes1 – May 2032 538 554US$222m 7.35% subordinated notes1 – Nov 2032 278 278US$2,000m 6.5% subordinated notes1 – May 2036 2,029 2,029US$2,500m 6.5% subordinated notes1 – Sep 2037 3,278 3,039US$1,500m 6.8% subordinated notes1 – Jun 2038 1,487 1,487US$2,000m 4.25% subordinated notes2,5 – Mar 2024 2,069 –US$1,500m 5.25% subordinated notes2,5 – Mar 2044 1,735 –£900m 6.375% callable subordinated notes1,3 Oct 2017 Oct 2022 1,558 1,672£650m 5.75% subordinated notes2 – Dec 2027 1,176 1,158£650m 6.75% subordinated notes2 – Sep 2028 1,005 1,066£750m 7.0% subordinated notes2 – Apr 2038 1,217 1,288£900m 6.0% subordinated notes2 – Mar 2040 1,379 1,464€1,600m 6.25% subordinated notes2 – Mar 2018 1,950 2,210€1,750m 6.0% subordinated notes2 – Jun 2019 2,623 2,884€700m 3.625% callable subordinated notes1,4 Jun 2015 Jun 2020 878 1,007€1,500m 3.375% callable subordinated notes1,2,5 Jan 2019 Jan 2024 1,898 2,075
25,098 22,211 Amounts owed to HSBC undertakings €1,400m 5.3687% fixed/floating subordinated notes6 Mar 2014 Dec 2043 – 2,024£500m 8.208% subordinated step-up cumulative notes Jun 2015 Jun 2040 779 825€750m 5.13% fixed/floating subordinated notes Mar 2016 Dec 2044 981 1,137US$900m 10.176% subordinated step-up cumulative notes Jun 2030 Jun 2040 891 891
2,651 4,877
At 31 December 27,749 27,088
1 Amounts owed to third parties represent securities included in the capital base of HSBC as tier 2 securities in accordance with the grandfathering provisions under CRD IV rules.
2 These securities are included in the capital base of HSBC as fully CRD IV compliant tier 2 securities on an end point basis. 3 The interest rate payable after October 2017 is the sum of the three-month sterling Libor plus 1.3%. 4 The interest rate payable after June 2015 is the sum of the three-month Euribor plus 0.93%. 5 These subordinated notes are measured at amortised cost in HSBC Holdings, where the interest rate risk is hedged using a fair value hedge,
while they are measured at fair value in the Group. 6 In March 2014, HSBC Holdings called and redeemed the €1,400m 5.3687% fixed/floating subordinated notes at par.
Additional tier 1 capital securities
Additional tier 1 capital securities are included in HSBC’s capital base as tier 1 capital and are perpetual subordinated securities on which investors are entitled, subject to certain conditions, to receive distributions which are non-cumulative. Such securities do not generally carry voting rights but rank above ordinary shares for coupon payments and in the event of a winding-up. The eligibility criteria for tier 1 securities changed on the introduction of CRD IV rules on 1 January 2014. For further guidance on the criteria for additional tier 1 securities, see note 35. Instruments issued before CRD IV comes into effect which do not meet the identifying criteria in full are eligible as regulatory capital subject to grandfathering limits and progressive phase-out. Capital securities that have been issued during 2014 are recognised as fully CRD IV compliant additional tier 1 capital securities on an end point basis and are accounted for as equity and detailed in Note 35.
Guaranteed by HSBC Holdings or HSBC Bank
The six capital securities guaranteed on a subordinated basis by HSBC Holdings or HSBC Bank are non-cumulative step-up perpetual preferred securities issued by Jersey limited partnerships. The proceeds of the issues were on-lent to the respective guarantors by the limited partnerships in the form of subordinated notes. These preferred securities qualify as additional tier 1 capital for HSBC under CRD IV by virtue of application of grandfathering provisions and the two capital securities guaranteed by HSBC Bank also qualify as additional tier 1 capital for HSBC Bank (on a solo and a consolidated basis) under CRD IV by virtue of application of grandfathering provisions.

Notes on the Financial Statements (continued) 30 – Subordinated liabilities / 31 – Maturity analysis
HSBC HOLDINGS PLC
426
These preferred securities, together with the guarantee, are intended to provide investors with economic rights equivalent to the rights that they would have had if they had purchased non-cumulative perpetual preference shares of the relevant issuer. There are limitations on the payment of distributions if such payments are prohibited under UK banking regulations or other requirements, if a payment would cause a breach of HSBC’s capital adequacy requirements or if HSBC Holdings or HSBC Bank have insufficient distributable reserves (as defined).
HSBC Holdings and HSBC Bank have individually covenanted that if prevented under certain circumstances from paying distributions on the preferred securities in full, they will not pay dividends or other distributions in respect of their ordinary shares, or effect repurchases or redemptions of their ordinary shares, until the distribution on the preferred securities has been paid in full.
With respect to preferred securities guaranteed by HSBC Holdings – if (i) HSBC’s total capital ratio falls below the regulatory minimum ratio required, or (ii) the Directors expect, in view of the deteriorating financial condition of HSBC Holdings, that (i) will occur in the near term, then the preferred securities will be substituted by preference shares of HSBC Holdings which have economic terms which are in all material respects equivalent to those of the preferred securities and the guarantee taken together.
With respect to preferred securities guaranteed by HSBC Bank – if (i) any of the two issues of preferred securities are outstanding in April 2049 or November 2048, respectively, or (ii) the total capital ratio of HSBC Bank on a solo and consolidated basis falls below the regulatory minimum ratio required, or (iii) in view of the deteriorating financial condition of HSBC Bank, the Directors expect (ii) to occur in the near term, then the preferred securities will be substituted by preference shares of HSBC Bank having economic terms which are in all material respects equivalent to those of the preferred securities and the guarantee taken together.
Tier 2 capital securities
These capital securities are included within HSBC’s capital base as tier 2 capital under CRD IV by virtue of application of grandfathering provisions (with the exception of identified HSBC Holding securities which are compliant with CRD IV end point rules). Tier 2 capital securities are either perpetual subordinated securities or dated securities on which there is an obligation to pay coupons. In accordance with CRD IV, the capital contribution of all tier 2 securities is amortised for regulatory purposes in their final five years before maturity.
31 Maturity analysis of assets, liabilities and off-balance sheet commitments
The table on page 427 provides an analysis of consolidated total assets, liabilities and off-balance sheet commitments by residual contractual maturity at the balance sheet date. Asset and liability balances are included in the maturity analysis as follows:
• except for reverse repos, repos and debt securities in issue, trading assets and liabilities (including trading derivatives) are included in the ‘Due not more than 1 month’ time bucket, and not by contractual maturity because trading balances are typically held for short periods of time;
• financial assets and liabilities with no contractual maturity (such as equity securities) are included in the ‘Due over 5 years’ time bucket. Undated or perpetual instruments are classified based on the contractual notice period which the counterparty of the instrument is entitled to give. Where there is no contractual notice period, undated or perpetual contracts are included in the ‘Due over 5 years’ time bucket;
• non-financial assets and liabilities with no contractual maturity (such as property, plant and equipment, goodwill and intangible assets, current and deferred tax assets and liabilities and retirement benefit liabilities) are included in the ‘Due over 5 years’ time bucket;
• financial instruments included within assets and liabilities of disposal groups held for sale are classified on the basis of the contractual maturity of the underlying instruments and not on the basis of the disposal transaction; and
• liabilities under insurance contracts are included in the ‘Due over 5 years’ time bucket. Liabilities under investment contracts are classified in accordance with their contractual maturity. Undated investment contracts are classified based on the contractual notice period investors are entitled to give. Where there is no contractual notice period, undated contracts are included in the ‘Due over 5 years’ time bucket.
Loan and other credit-related commitments are classified on the basis of the earliest date they can be drawn down.

HSBC HOLDINGS PLC
427
Sh
areh
old
er In
form
atio
n
Fi
nan
cial
Sta
tem
ents
C
orp
ora
te G
ove
rnan
ce
Fi
nan
cial
Rev
iew
S
trat
egic
Rep
ort
HS
BC
Mat
urity
ana
lysis
of a
sset
s and
liab
ilitie
s At
31
Dece
mbe
r 201
4
Du
e no
t
mor
e th
an
1 m
onth
Due
ove
r
1 m
onth
bu
t not
m
ore
than
3
mon
ths
Due
ove
r
3 m
onth
s
but n
ot
mor
e th
an
6 m
onth
s
Due
ove
r
6 m
onth
s
but n
ot
mor
e th
an
9 m
onth
s
Due
ove
r
9 m
onth
s
but n
ot
mor
e th
an
1 ye
ar
Due
ove
r
1 ye
ar
but n
ot
mor
e th
an
2 ye
ars
Due
ove
r
2 ye
ars
bu
t not
m
ore
than
5
year
s
Due
ove
r
5 ye
ars
To
tal
US$
mU
S$m
US$
mU
S$m
US$
mU
S$m
US$
mU
S$m
US$
mFi
nanc
ial a
sset
s Ca
sh a
nd b
alan
ces a
t cen
tral
ban
ks
129,
957
−−
−−
−−
−12
9,95
7Ite
ms i
n th
e co
urse
of c
olle
ctio
n fr
om o
ther
ban
ks
4,92
7−
−−
−−
−−
4,92
7Ho
ng K
ong
Gov
ernm
ent c
ertif
icat
es o
f ind
ebte
dnes
s 27
,674
−−
−−
−−
−27
,674
Trad
ing
asse
ts
303,
463
−−
−−
−73
0−
304,
193
– re
vers
e re
pos
567
−−
−−
−73
0−
1,29
7–
oth
er tr
adin
g as
sets
30
2,89
6−
−−
−−
−−
302,
896
Fina
ncia
l ass
ets d
esig
nate
d at
fair
valu
e
244
399
417
346
208
1,82
54,
634
20,9
6429
,037
Deriv
ativ
es
341,
558
5646
322
032
1,00
31,
033
643
345,
008
– tr
adin
g
341,
416
−−
−−
−−
−34
1,41
6–
non
-tra
ding
14
256
463
220
321,
003
1,03
364
33,
592
Loan
s and
adv
ance
s to
bank
s173
,758
17,6
495,
682
1,93
41,
850
7,37
11,
981
1,92
411
2,14
9Lo
ans a
nd a
dvan
ces t
o cu
stom
ers1
203,
130
76,2
3655
,018
35,3
4737
,674
91,3
0018
7,72
828
8,22
797
4,66
0–
per
sona
l 42
,170
9,67
38,
911
7,48
68,
672
27,3
0554
,439
230,
298
388,
954
– c
orpo
rate
and
com
mer
cial
146,
250
61,8
0941
,924
23,7
2023
,697
56,3
9812
4,79
656
,590
535,
184
– fi
nanc
ial
14,7
104,
754
4,18
34,
141
5,30
57,
597
8,49
31,
339
50,5
22
Reve
rse
repu
rcha
se a
gree
men
ts –
non
-tra
ding
1 11
6,00
230
,490
9,07
62,
230
582
868
2,46
5−
161,
713
Fina
ncia
l inv
estm
ents
28
,237
50,4
4541
,503
14,5
7717
,011
48,3
9296
,891
118,
411
415,
467
Accr
ued
inco
me
and
othe
r fin
anci
al a
sset
s 17
,870
7,57
22,
415
605
327
748
1,28
29,
803
40,6
22
Fina
ncia
l ass
ets a
t 31
Dece
mbe
r201
4 1,
246,
820
182,
847
114,
574
55,2
5957
,684
151,
507
296,
744
439,
972
2,54
5,40
7
Non
-fina
ncia
l ass
ets
−−
−−
−−
−88
,732
88,7
32
Tota
l ass
ets a
t 31
Dec
embe
r 201
4 1,
246,
820
182,
847
114,
574
55,2
5957
,684
151,
507
296,
744
528,
704
2,63
4,13
9

HSBC HOLDINGS PLC
428
Notes on the Financial Statements (continued) 31 – Maturity analysis
Mat
urity
ana
lysis
of a
sset
s and
liab
ilitie
s (c
ontin
ued)
At 3
1 De
cem
ber 2
014
Du
e no
t
mor
e th
an
1 m
onth
Due
over
1 m
onth
but n
ot
m
ore
than
3 m
onth
s
Due
over
3 m
onth
s
but n
ot
m
ore
than
6 m
onth
s
Due
over
6 m
onth
s
but n
ot
m
ore
than
9 m
onth
s
Due
over
9 m
onth
s
but n
ot
m
ore
than
1 ye
ar
Due
over
1 ye
ar
bu
t not
mor
e th
an
2
year
s
Due
over
2 ye
ars
bu
t not
mor
e th
an
5
year
s
D
ue
over
5 ye
ars
To
tal
US$
mU
S$m
US$
mU
S$m
US$
mU
S$m
US$
mU
S$m
US$
mFi
nanc
ial l
iabi
litie
sHo
ng K
ong
curr
ency
not
es in
circ
ulat
ion
27
,674
27
,674
De
posit
s by
bank
s1
66,8
29
2,89
0 2,
539
511
810
621
2,96
3 26
3 77
,426
Cust
omer
acc
ount
s1,2
1,21
6,57
4 57
,127
32
,925
15
,023
13
,586
9,
278
5,81
9 31
0 1,
350,
642
–
per
sona
l 57
2,45
9 28
,580
16
,728
10
,609
9,
625
7,22
0 3,
967
125
649,
313
–
cor
pora
te a
nd c
omm
erci
al
465,
990
21,8
41
10,6
88
3,71
6 2,
894
1,61
5 1,
316
150
508,
210
–
fina
ncia
l 17
8,12
5 6,
706
5,50
9 69
8 1,
067
443
536
35
193,
119
Repu
rcha
se a
gree
men
ts –
non-
trad
ing1
95,2
43
5,02
9 4,
054
1,39
2 71
4 1,
000
107,
432
Ite
ms i
n th
e co
urse
of t
rans
miss
ion
to o
ther
ban
ks
5,99
0 5,
990
Tr
adin
g lia
bilit
ies
155,
604
2,04
1 2,
636
1,43
9 2,
918
5,74
4 9,
603
10,5
87
190,
572
–
repo
s 74
6 90
9 22
4 26
4 1,
249
406
3,79
8
– d
ebt s
ecur
ities
in is
sue
1,68
6 1,
132
2,41
2 1,
175
1,66
9 5,
338
9,60
3 10
,587
33
,602
–
oth
er tr
adin
g lia
bilit
ies
153,
172
153,
172
Fina
ncia
l lia
bilit
ies d
esig
nate
d at
fair
valu
e
981
912
4,26
4 97
2 1,
557
8,50
0 15
,037
43
,930
76
,153
–
deb
t sec
uriti
es in
issu
e: c
over
ed b
onds
20
5 2,
705
2,94
2 5,
852
–
deb
t sec
uriti
es in
issu
e: o
ther
wise
secu
red
–
deb
t sec
uriti
es in
issu
e: u
nsec
ured
94
2 86
8 4,
242
742
1,40
9 8,
500
9,57
6 14
,233
40
,512
–
subo
rdin
ated
liab
ilitie
s and
pre
ferr
ed se
curit
ies
36
18
2,62
3 20
,640
23
,317
–
oth
er
39
8 22
25
13
0 13
3 6,
115
6,47
2
Deriv
ativ
es
335,
802
23
86
223
54
621
1,12
1 2,
739
340,
669
–
trad
ing
33
5,40
0 33
5,40
0
– n
on-t
radi
ng
402
23
86
223
54
621
1,12
1 2,
739
5,26
9
Debt
secu
ritie
s in
issue
14
,741
15
,424
13
,027
7,
854
6,05
0 14
,209
19
,481
5,
161
95,9
47
– c
over
ed b
onds
–
–81
81
–
oth
erw
ise se
cure
d 8,
807
1,06
3 60
28
3 27
2 91
2 1,
562
1,00
8 13
,967
–
uns
ecur
ed
5,93
4 14
,361
12
,967
7,
571
5,77
8 13
,297
17
,838
4,
153
81,8
99
Accr
uals
and
othe
r fin
anci
al li
abili
ties
21,0
84
9,19
8 3,
069
1,22
1 1,
820
1,56
8 2,
225
3,65
5 43
,840
Su
bord
inat
ed li
abili
ties
150
3 16
7 11
3 3,
607
22,6
24
26,6
64
Tota
l fin
anci
al li
abili
ties a
t 31
Dece
mbe
r 201
4 1,
940,
522
92,7
94
62,6
00
28,6
38
27,6
76
40,6
54
59,8
56
90,2
69
2,34
3,00
9
Non
-fina
ncia
l lia
bilit
ies
––
––
––
–91
,152
91
,152
Tota
l lia
bilit
ies a
t 31
Dece
mbe
r 201
4 1,
940,
522
92,7
94
62,6
00
28,6
38
27,6
76
40,6
54
59,8
56
181,
421
2,43
4,16
1

HSBC HOLDINGS PLC
429
Sh
areh
old
er In
form
atio
n
Fi
nan
cial
Sta
tem
ents
C
orp
ora
te G
ove
rnan
ce
Fi
nan
cial
Rev
iew
S
trat
egic
Rep
ort
At 3
1 De
cem
ber 2
013
Due
not
mor
e th
an
1 m
onth
Due
over
1 m
onth
bu
t not
m
ore
than
3
mon
ths
Due
over
3 m
onth
s bu
t not
m
ore
than
3
mon
ths
Due
over
6 m
onth
s bu
t not
m
ore
than
9
mon
ths
Due
over
9 m
onth
s bu
t not
m
ore
than
1
year
Due
over
1 ye
ar
but n
ot
mor
e th
an
2 ye
ars
Due
over
2 ye
ars
but n
ot
mor
e th
an
5 ye
ars
Due
over
5
year
s To
tal
US$
mU
S$m
US$
mU
S$m
US$
mU
S$m
US$
mU
S$m
US$
mFi
nanc
ial a
sset
s Ca
sh a
nd b
alan
ces a
t cen
tral
ban
ks
166,
599
––
––
––
–16
6,59
9Ite
ms i
n th
e co
urse
of c
olle
ctio
n fr
om o
ther
ban
ks
6,02
1–
––
––
––
6,02
1Ho
ng K
ong
Gov
ernm
ent c
ertif
icat
es o
f ind
ebte
dnes
s 25
,220
––
––
––
–25
,220
Trad
ing
asse
ts
296,
396
3,09
81,
536
2,06
210
0−
−−
303,
192
– re
vers
e re
pos
3,32
43,
098
1,53
62,
062
100
−−
−10
,120
– o
ther
trad
ing
asse
ts
293,
072
––
––
––
–29
3,07
2
Fina
ncia
l ass
ets d
esig
nate
d at
fair
valu
e
1,92
925
449
442
632
82,
145
2,81
930
,035
38,4
30De
rivat
ives
27
7,74
748
8838
955
271
61,
486
1,23
928
2,26
5–
trad
ing
27
7,70
9–
––
––
––
277,
709
– n
on-t
radi
ng
3848
8838
955
271
61,
486
1,23
94,
556
Loan
s and
adv
ance
s to
bank
s176
,551
22,1
075,
397
1,42
91,
290
6,12
92,
779
4,36
412
0,04
6
Loan
s and
adv
ance
s to
cust
omer
s1 23
0,73
673
,463
56,0
5329
,273
32,1
9487
,942
182,
525
299,
903
992,
089
– p
erso
nal
43,8
058,
929
8,56
16,
603
7,57
826
,915
58,6
1124
3,12
440
4,12
6–
cor
pora
te a
nd c
omm
erci
al
171,
713
60,8
2743
,723
19,5
0521
,093
53,1
8311
3,89
753
,981
537,
922
– fi
nanc
ial
15,2
183,
707
3,76
93,
165
3,52
37,
844
10,0
172,
798
50,0
41
Reve
rse
repu
rcha
se a
gree
men
ts –
non
-tra
ding
13
4,24
235
,329
5,28
71,
239
2,07
21,
136
385
–17
9,69
0Fi
nanc
ial i
nves
tmen
ts
34,3
3148
,053
35,8
7722
,353
18,8
1650
,711
105,
340
110,
444
425,
925
Accr
ued
inco
me
and
othe
r fin
anci
al a
sset
s 18
,719
7,68
42,
467
1,36
970
01,
133
1,02
74,
536
37,6
35
Tota
l fin
anci
al a
sset
s at 3
1 De
cem
ber 2
013
1,26
8,49
119
0,03
610
7,19
958
,540
56,0
5214
9,91
229
6,36
145
0,52
12,
577,
112
Non
-fina
ncia
l ass
ets
––
––
––
–94
,206
94,2
06
Tota
l ass
ets a
t 31
Dece
mbe
r201
3 1,
268,
491
190,
036
107,
199
58,5
4056
,052
149,
912
296,
361
544,
727
2,67
1,31
8

HSBC HOLDINGS PLC
430
Notes on the Financial Statements (continued) 31 – Maturity analysis
Mat
urity
ana
lysis
of a
sset
s and
liab
ilitie
s (co
ntin
ued)
At
31
Dece
mbe
r 201
3
Du
e no
t
mor
e th
an
1 m
onth
Due
over
1 m
onth
but n
ot
m
ore
than
3 m
onth
s
Due
over
3 m
onth
s
but n
ot
m
ore
than
6 m
onth
s
Due
over
6 m
onth
s
but n
ot
m
ore
than
9 m
onth
s
Due
over
9 m
onth
s
but n
ot
m
ore
than
1 ye
ar
Due
over
1 ye
ar
bu
t not
mor
e th
an
2
year
s
Due
over
2 ye
ars
bu
t not
mor
e th
an
5
year
s
Du
e
over
5 ye
ars
To
tal
US$
mU
S$m
US$
mU
S$m
US$
mU
S$m
US$
mU
S$m
US$
mFi
nanc
ial l
iabi
litie
sHo
ng K
ong
curr
ency
not
es in
circ
ulat
ion
25
,220
––
––
––
–25
,220
Depo
sits b
y ba
nks1
76,2
983,
931
1,79
685
831
873
71,
922
647
86,5
07
Cust
omer
acc
ount
s1,2
1,22
9,69
460
,683
26,9
4013
,704
15,3
848,
717
5,93
723
81,
361,
297
– p
erso
nal
572,
514
33,9
5616
,953
10,5
4410
,520
6,09
35,
138
5965
5,77
7–
cor
pora
te a
nd c
omm
erci
al
494,
612
18,0
843,
414
1,71
71,
786
1,64
367
414
052
2,07
0–
fina
ncia
l 16
2,56
88,
643
6,57
31,
443
3,07
898
112
539
183,
450
Repu
rcha
se a
gree
men
ts –
non-
trad
ing
136,
137
13,0
586,
583
3,71
14,
231
––
500
164,
220
Item
s in
the
cour
se o
f tra
nsm
issio
n to
oth
er b
anks
6,
910
––
––
––
–6,
910
Trad
ing
liabi
litie
s 16
1,23
111
,405
4,88
62,
844
3,65
36,
323
7,97
98,
704
207,
025
– re
pos
2,56
59,
763
2,71
51,
012
1,27
987
–17
,421
– d
ebt s
ecur
ities
in is
sue
1,21
71,
642
2,17
11,
832
2,37
46,
236
7,97
98,
704
32,1
55–
oth
er tr
adin
g lia
bilit
ies
157,
449
––
––
––
–15
7,44
9
Fina
ncia
l lia
bilit
ies d
esig
nate
d at
fair
valu
e
4,90
715
792
2,26
668
9,34
821
,544
50,7
0289
,084
– d
ebt s
ecur
ities
in is
sue:
cov
ered
bon
ds
1,26
823
02,
841
3,25
77,
596
– d
ebt s
ecur
ities
in is
sue:
oth
erw
ise se
cure
d
– d
ebt s
ecur
ities
in is
sue:
uns
ecur
ed
3,51
15
4594
511
8,87
618
,117
14,2
5645
,766
– su
bord
inat
ed li
abili
ties a
nd p
refe
rred
secu
ritie
s 12
121
21,7
7321
,915
– o
ther
1,
396
3147
5357
221
586
11,4
1613
,807
Deriv
ativ
es
269,
816
3395
8461
563
1,97
81,
654
274,
284
– tr
adin
g
269,
739
––
––
––
–26
9,73
9–
non
-tra
ding
77
3395
8461
563
1,97
81,
654
4,54
5
Debt
secu
ritie
s in
issue
20
,739
8,28
015
,734
7,44
28,
106
18,5
5219
,850
5,37
710
4,08
0–
cov
ered
bon
ds
692
98–
oth
erw
ise se
cure
d 10
,450
1,05
167
51,
260
764
1,85
72,
313
1,01
319
,383
– u
nsec
ured
10
,289
7,22
915
,059
6,18
27,
342
16,6
8917
,445
4,36
484
,599
Accr
uals
and
othe
r fin
anci
al li
abili
ties
25,2
6710
,475
3,27
81,
280
1,59
91,
831
1,59
293
646
,258
Subo
rdin
ated
liab
ilitie
s 21
281,
171
144
61,
435
3,40
622
,765
28,9
76
Tota
l fin
anci
al li
abili
ties a
t 31
Dece
mbe
r 201
3 1,
956,
240
108,
050
60,5
7532
,333
33,4
2647
,506
64,2
0891
,523
2,39
3,86
1
Non
-fina
ncia
l lia
bilit
ies
––
––
––
–86
,998
86,9
98
Tota
l lia
bilit
ies a
t 31
Dece
mbe
r201
3 1,
956,
240
108,
050
60,5
7532
,333
33,4
2647
,506
64,2
0817
8,52
12,
480,
859
1 Se
e fo
otno
te 3
on
page
344
. 2
Incl
udes
US$
342,
927m
(201
3: U
S$35
5,98
0m) i
nsur
ed b
y gu
aran
tee
sche
mes
.

HSBC HOLDINGS PLC
431
Sh
areh
old
er In
form
atio
n
Fi
nan
cial
Sta
tem
ents
C
orp
ora
te G
ove
rnan
ce
Fi
nan
cial
Rev
iew
S
trat
egic
Rep
ort
Mat
urity
ana
lysis
of o
ff-ba
lanc
e sh
eet c
omm
itmen
ts re
ceiv
ed
D
ue n
ot
mor
e th
an
1 m
onth
Due
over
1
mon
th
but n
ot
mor
e th
an
3 m
onth
s
Due
over
3
mon
ths
bu
t not
m
ore
than
6
mon
ths
Due
over
6
mon
ths
bu
t not
m
ore
than
9
mon
ths
Due
over
9
mon
ths
bu
t not
m
ore
than
1
year
Due
over
1
year
bu
t not
m
ore
than
2
year
s
Due
over
2
year
s
but n
ot
mor
e th
an
5 ye
ars
Du
e ov
er
5 ye
ars
To
tal
US$
mU
S$m
US$
mU
S$m
US$
mU
S$m
US$
mU
S$m
US$
m
At 3
1 De
cem
ber 2
014
Loan
and
oth
er c
redi
t-re
late
d co
mm
itmen
ts
3,31
3 4,
312
607
8,23
2 At
31
Dece
mbe
r 201
3Lo
an a
nd o
ther
cre
dit-
rela
ted
com
mitm
ents
95
395
3 M
atur
ity a
naly
sis o
f off-
bala
nce
shee
t com
mitm
ents
giv
en
D
ue n
ot
mor
e th
an
1 m
onth
Due
over
1
mon
th
but n
ot
mor
e th
an
3 m
onth
s
Due
over
3
mon
ths
bu
t not
m
ore
than
6
mon
ths
Due
over
6
mon
ths
bu
t not
m
ore
than
9
mon
ths
Due
over
9
mon
ths
bu
t not
m
ore
than
1
year
Due
over
1
year
bu
t not
m
ore
than
2
year
s
Due
over
2
year
s
but n
ot
mor
e th
an
5 ye
ars
Du
e ov
er
5 ye
ars
To
tal
US$
mU
S$m
US$
mU
S$m
US$
mU
S$m
US$
mU
S$m
US$
m
At 3
1 De
cem
ber 2
014
Loan
and
oth
er c
redi
t-re
late
d co
mm
itmen
ts
455,
319
52,3
98
8,91
9 14
,163
41
,500
13
,979
48
,333
16
,769
65
1,38
0
Of w
hich
: –
per
sona
l 17
9,08
8 15
,784
45
2 30
5 14
,036
1,
432
1,00
3 95
5 21
3,05
5
– c
orpo
rate
and
com
mer
cial
23
9,64
6 34
,657
7,
595
12,5
56
23,5
19
9,92
6 36
,918
12
,185
37
7,00
2
– fi
nanc
ial
36,5
85
1,95
7 87
2 1,
302
3,94
5 2,
621
10,4
12
3,62
9 61
,323
At
31
Dece
mbe
r 201
3Lo
an a
nd o
ther
cre
dit-
rela
ted
com
mitm
ents
40
4,59
8 45
,255
18
,770
16
,927
20
,242
13
,320
46
,652
21
,839
58
7,60
3
Of w
hich
: –
per
sona
l 14
8,54
1 14
,700
45
4 10
,683
12
,131
1,
273
704
6,46
9 19
4,95
5
– c
orpo
rate
and
com
mer
cial
22
5,33
3 29
,191
17
,794
5,
662
4,87
9 9,
009
41,8
51
12,0
96
345,
815
–
fina
ncia
l 30
,724
1,
364
522
582
3,23
2 3,
038
4,09
7 3,
274
46,8
33

Notes on the Financial Statements (continued) 31 – Maturity analysis
HSBC HOLDINGS PLC
432
HS
BC
Ho
ldin
gs
Mat
urity
ana
lysis
of a
sset
s, li
abili
ties a
nd o
ff-ba
lanc
e sh
eet c
omm
itmen
ts
Due
not
m
ore
than
1
mon
th
Due
over
1 m
onth
bu
t not
m
ore
than
3
mon
ths
Due
over
3 m
onth
s bu
t not
m
ore
than
6
mon
ths
Due
over
6 m
onth
s bu
t not
m
ore
than
9
mon
ths
Due
over
9 m
onth
s bu
t not
m
ore
than
1
year
Due
over
1 ye
ar
but n
ot
mor
e th
an
2 ye
ars
Due
over
2 ye
ars
but n
ot
mor
e th
an
5 ye
ars
Due
ove
r 5
year
s To
tal
US$
mU
S$m
US$
mU
S$m
US$
mU
S$m
US$
mU
S$m
US$
mFi
nanc
ial a
sset
s Ca
sh a
t ban
k an
d in
han
d:–
bal
ance
s with
HSB
C un
dert
akin
gs
249
––
––
––
–24
9De
rivat
ives
2,
287
––
––
–12
735
72,
771
– tr
adin
g 2,
287
––
––
––
–2,
287
– n
on-t
radi
ng–
––
––
–12
735
748
4Lo
ans a
nd a
dvan
ces t
o HS
BC u
nder
taki
ngs
7,00
785
87,
676
–14
––
28,3
5543
,910
Fina
ncia
l inv
estm
ents
in H
SBC
unde
rtak
ings
26
6–
––
––
4,04
14,
073
Accr
ued
inco
me
and
othe
r fin
anci
al a
sset
s 8
––
––
––
–8
Tota
l fin
anci
al a
sset
s at 3
1 De
cem
ber 2
014
9,57
786
47,
676
–14
–12
732
,753
51,0
11
Non
-fina
ncia
l ass
ets
––
––
––
–96
,853
96,8
53
Tota
l ass
ets a
t 31
Dec
embe
r 201
4 9,
577
864
7,67
6–
14–
127
129,
606
147,
864
Fina
ncia
l lia
bilit
ies
Amou
nts o
wed
to H
SBC
unde
rtak
ings
2,
423
–32
–1
436
––
2,89
2Fi
nanc
ial l
iabi
litie
s des
igna
ted
at fa
ir va
lue
–
––
––
1,11
02,
623
14,9
4618
,679
– d
ebt s
ecur
ities
in is
sue
––
––
–1,
110
–7,
075
8,18
5–
subo
rdin
ated
liab
ilitie
s and
pre
ferr
ed se
curit
ies
––
––
––
2,62
37,
871
10,4
94De
rivat
ives
1,
066
––
––
–10
3–
1,16
9–
trad
ing
1,06
6–
––
––
––
1,06
6–
non
-tra
ding
––
––
––
103
–10
3De
bt se
curit
ies i
n iss
ue
––
––
––
–1,
009
1,00
9Ac
crua
ls an
d ot
her f
inan
cial
liab
ilitie
s 92
420
813
721
––
––
1,29
0Su
bord
inat
ed li
abili
ties
––
––
––
1,95
115
,304
17,2
55
Tota
l fin
anci
al li
abili
ties a
t 31
Dece
mbe
r 201
4 4,
413
208
169
211
1,54
64,
677
31,2
5942
,294
Non
-fina
ncia
l lia
bilit
ies
––
––
––
–12
512
5
Tota
l lia
bilit
ies a
t 31
Dece
mbe
r 201
4 4,
413
208
169
211
1,54
64,
677
31,3
8442
,419
Off
-bal
ance
shee
t com
mitm
ents
giv
en
Und
raw
n fo
rmal
stan
dby
faci
litie
s, c
redi
t lin
es a
nd o
ther
com
mitm
ents
to le
nd
16
– –
– –
– –
– 16

Sh
areh
old
er In
form
atio
n
Fi
nan
cial
Sta
tem
ents
C
orp
ora
te G
ove
rnan
ce
Fi
nan
cial
Rev
iew
S
trat
egic
Rep
ort
HSBC HOLDINGS PLC
433
Due
not
mor
e th
an
1 m
onth
Due
over
1 m
onth
bu
t not
m
ore
than
3
mon
ths
Due
over
3 m
onth
s bu
t not
m
ore
than
6
mon
ths
Due
over
6 m
onth
s bu
t not
m
ore
than
9
mon
ths
Due
over
9 m
onth
s bu
t not
m
ore
than
1
year
Due
over
1 ye
ar
but n
ot
mor
e th
an
2 ye
ars
Due
over
2 ye
ars
but n
ot
mor
e th
an
5 ye
ars
Due
over
5
year
s To
tal
U
S$m
US$
mU
S$m
US$
mU
S$m
US$
mU
S$m
US$
mU
S$m
Fina
ncia
l ass
ets
Cash
at b
ank
and
in h
and:
– b
alan
ces w
ith H
SBC
unde
rtak
ings
40
7–
––
––
––
407
Deriv
ativ
es
2,72
9–
––
––
–60
2,78
9–
trad
ing
2,72
9–
––
––
––
2,72
9–
non
-tra
ding
––
––
––
–60
60Lo
ans a
nd a
dvan
ces t
o HS
BC u
nder
taki
ngs
8,39
44,
374
7,59
514
16–
–32
,951
53,3
44Fi
nanc
ial i
nves
tmen
ts i
n HS
BC u
nder
taki
ngs
23–
8–
––
330
849
1,21
0Ac
crue
d in
com
e an
d ot
her f
inan
cial
ass
ets
10–
––
––
––
10
Tota
l fin
anci
al a
sset
s at 3
1 De
cem
ber 2
013
11,5
634,
374
7,60
314
16–
330
33,8
6057
,760
Non
-fina
ncia
l ass
ets
––
––
––
–93
,076
93,0
76
Tota
l ass
ets a
t 31
Dece
mbe
r 201
3 11
,563
4,37
47,
603
1416
–33
012
6,93
615
0,83
6 Fi
nanc
ial l
iabi
litie
sAm
ount
s ow
ed to
HSB
C un
dert
akin
gs
3,77
012
2,23
4–
1–
463
5,20
511
,685
Fina
ncia
l lia
bilit
ies d
esig
nate
d at
fair
valu
e
––
––
––
1,28
319
,744
21,0
27–
deb
t sec
uriti
es in
issu
e –
––
––
–1,
283
6,82
38,
106
– su
bord
inat
ed li
abili
ties a
nd p
refe
rred
secu
ritie
s –
––
––
––
12,9
2112
,921
Deriv
ativ
es
704
––
––
––
–70
4–
trad
ing
704
––
––
––
–70
4–
non
-tra
ding
––
––
––
––
–De
bt se
curit
ies i
n iss
ue
––
1,72
1–
––
–1,
070
2,79
1Ac
crua
ls an
d ot
her f
inan
cial
liab
ilitie
s 77
710
926
122
––
––
1,16
9Su
bord
inat
ed li
abili
ties
––
––
––
2,21
011
,957
14,1
67
Tota
l fin
anci
al li
abili
ties a
t 31
Dece
mbe
r 201
3 5,
251
121
4,21
622
1–
3,95
637
,976
51,5
43
Non
-fina
ncia
l lia
bilit
ies
––
––
––
–20
620
6
Tota
l lia
bilit
ies a
t 31
Dece
mbe
r 201
3 5,
251
121
4,21
622
1–
3,95
638
,182
51,7
49 O
ff-ba
lanc
e sh
eet c
omm
itmen
ts g
iven
U
ndra
wn
form
al st
andb
y fa
cilit
ies,
cre
dit l
ines
and
oth
er c
omm
itmen
ts
to le
nd
1,24
5 –
– –
– –
– –
1,24
5

Notes on the Financial Statements (continued) 32 – Offsetting of financial assets and financial liabilities / 33 – Foreign exchange exposure
HSBC HOLDINGS PLC
434
32 Offsetting of financial assets and financial liabilities
Accounting policy
Financial assets and financial liabilities are offset and the net amount is reported in the balance sheet when there is a legally enforceable right to offset the recognised amounts and there is an intention to settle on a net basis, or realise the asset and settle the liability simultaneously (‘the offset criteria’).
Financial assets subject to offsetting, enforceable master netting arrangements and similar agreements
Gross
amounts ofrecognised
financialassets
Grossamounts
offset in thebalance
sheet
Amountspresented
in thebalance
sheet
Amounts not set off in the balance sheet
Financial
instruments1
Cash collateral
received Net
amount US$m US$m US$m US$m US$m US$m Derivatives2 (Note 16) 595,473 (250,465) 345,008 (271,040) (42,260) 31,708
Reverse repos, stock borrowing and similar agreements3 259,655 (88,676) 170,979 (166,958) (249) 3,772 Classified as: – trading assets 9,656 (390) 9,266 (9,256) – 10– non-trading assets 249,999 (88,286) 161,713 (157,702) (249) 3,762
Loans and advances to customers at amortised cost4 101,220 (37,527) 63,693 (55,989) (310) 7,394
At 31 December 2014 956,348 (376,668) 579,680 (493,987) (42,819) 42,874 Derivatives2 (Note 16) 569,595 (287,330) 282,265 (215,957) (36,387) 29,921
Reverse repos, stock borrowing and similar agreements3 288,903 (88,775) 200,128 (197,287) (57) 2,784 Classified as: – trading assets 39,008 (18,570) 20,438 (20,438) – –– non-trading assets 249,895 (70,205) 179,690 (176,849) (57) 2,784
Loans and advances to customersat amortised cost4 192,437 (92,654) 99,783 (89,419) – 10,364
At 31 December 2013 1,050,935 (468,759) 582,176 (502,663) (36,444) 43,069
1 Including non-cash collateral. 2 Including amounts that are both subject to and not subject to enforceable master netting agreements and similar agreements. 3 For the amount of reverse repos, stock borrowing and similar agreements recognised in the balance sheet, see the ‘Funding sources and uses’
table on page 168. In the analysis above, the US$9,266m (31 December 2013: US$20,438m) of trading assets presented in the balance sheet comprised US$1,297m of reverse repos (31 December 2013: US$10,120m) and US$7,969m of stock borrowing (31 December 2013: US$10,318m).
4 At 31 December 2014, the total amount of loans and advances to customers at amortised cost was US$974,660m (31 December 2013: US$992,089m) of which US$63,693m (31 December 2013: US$99,783m) was subject to offsetting. For the amount of loans and advances to customers at amortised cost recognised in the balance sheet, see the ‘Funding sources and uses’ table on page 168.

HSBC HOLDINGS PLC
435
Str
ateg
ic R
epo
rt
Fi
nan
cial
Rev
iew
Co
rpo
rate
Go
vern
ance
Fin
anci
al S
tate
men
ts
S
har
eho
lder
Info
rmat
ion
Financial liabilities subject to offsetting, enforceable master netting arrangements and similar agreements
Gross
amounts ofrecognised
financialliabilities
Grossamounts
offset in thebalance
sheet
Amountspresented
in thebalance
sheet
Amounts not set off in the balance sheet
Financial
instruments1
Cash collateral
pledged Net
amount US$m US$m US$m US$m US$m US$m
Derivatives2 (Note 16) 591,134 (250,465) 340,669 (272,815) (40,291) 27,563 Repos, stock lending and similar
agreements3 211,938 (88,676) 123,262 (121,722) (105) 1,435 Classified as: – trading liabilities 16,220 (390) 15,830 (15,828) – 2 – non-trading liabilities 195,718 (88,286) 107,432 (105,894) (105) 1,433
Customer accounts at amortised cost4 107,088 (37,527) 69,561 (55,989) – 13,572
At 31 December 2014 910,160 (376,668) 533,492 (450,526) (40,396) 42,570 Derivatives2 (Note 16) 561,614 (287,330) 274,284 (216,596) (29,093) 28,595 Repos, stock lending and similar
agreements3 282,634 (88,775) 193,859 (193,354) (81) 424 Classified as: – trading liabilities 48,209 (18,570) 29,639 (29,625) – 14 – non-trading liabilities 234,425 (70,205) 164,220 (163,729) (81) 410
Customer accounts at amortised cost4 195,153 (92,654) 102,499 (89,394) – 13,105
At 31 December 2013 1,039,401 (468,759) 570,642 (499,344) (29,174) 42,124
1 Including non-cash collateral. 2 Including amounts that are both subject to and not subject to enforceable master netting agreements and similar agreements. 3 For the amount of repos, stock lending and similar agreements recognised in the balance sheet, see the ‘Funding sources and uses’ table on
page 168. In the analysis above, the US$15,830m (31 December 2013: US$29,639m) of trading liabilities presented in the balance sheet comprised US$3,798m of repos (31 December 2013: US$17,421m) and US$12,032m of stock lending (31 December 2013: US$12,218m).
4 At 31 December 2014, the total amount of customer accounts at amortised cost was US$1,350,642m (31 December 2013: US$1,361,297m) of which US$69,561m (31 December 2013: US$102,499m) was subject to offsetting. For the amount of customer accounts at amortised cost recognised in the balance sheet, see the ‘Funding sources and uses’ table on page 168.
The ‘Amounts not set off in the balance sheet’ for derivatives and reverse repurchase/repurchase, stock borrowing/ lending and similar agreements include transactions where:
• the counterparty has an offsetting exposure with HSBC and a master netting or similar arrangement is in place with a right of set off only in the event of default, insolvency or bankruptcy, or the offset criteria are otherwise not satisfied; and
• cash and non-cash collateral received/pledged in respect of the transactions described above.
For loans and advances to customers and Customer accounts at amortised cost the amounts included in the table above typically relate to transactions entered into with corporate and commercial customers for working capital management purposes. The ‘Amounts not set off in the balance sheet’ relate to transactions where the customer has an offsetting exposure with HSBC and an agreement is in place with the right of offset but the offset criteria are otherwise not satisfied. For risk management purposes, the net amounts of such exposures are subject to limits which are monitored and the relevant customer agreements are subject to review and updated, as necessary, to ensure the legal right of offset remains appropriate.
33 Foreign exchange exposures
Structural foreign exchange exposures
HSBC’s structural foreign exchange exposures are represented by the net asset value of its foreign exchange equity and subordinated debt investments in subsidiaries, branches, joint ventures and associates with non-US dollar functional currencies. Gains or losses on structural foreign exchange exposures are recognised in other comprehensive income. HSBC’s management of its structural foreign exchange exposures is discussed on page 181.

Notes on the Financial Statements (continued) 34 – Non-controlling interests / 35 – Share capital and other equity instruments
HSBC HOLDINGS PLC
436
Net structural foreign exchange exposures 2014 2013 US$m US$mCurrency of structural exposure Pound sterling1 30,071 28,403Chinese renminbi 24,578 20,932Hong Kong dollars 24,028 18,974Euros 20,378 22,014Mexican pesos 5,249 5,932Brazilian real 4,910 5,581Canadian dollars 4,187 4,372Indian rupees 3,466 3,222Saudi riyals 2,910 2,531Malaysian ringgit 2,219 2,194UAE dirhams 2,199 3,069Swiss francs 1,864 1,940Taiwanese dollars 1,721 1,527Australian dollars 1,516 1,515Turkish lira 1,366 1,533Korean won 1,360 1,373Indonesian rupiah 1,352 1,244Singapore dollars 1,185 849Argentine pesos 1,059 1,067Egyptian pounds 868 739Others, each less than US$700m 5,918 6,157
At 31 December 142,404 135,168
1 During 2014, we entered into a forward foreign exchange contract amounting to US$1.6bn in order to manage our sterling structural foreign exchange exposure.
Shareholders’ equity would decrease by US$2,522m (2013: US$2,521m) if euro and sterling foreign currency exchange rates weakened by 5% relative to the US dollar.
34 Non-controlling interests 2014 2013 US$m US$m
Non-controlling interests attributable to holders of ordinary shares in subsidiaries 7,104 5,900Preferred securities issued by subsidiaries 2,427 2,688
9 31At 31 December 9,531 8,588
Preferred securities issued by subsidiaries
Preferred securities are securities for which there is no obligation to pay a dividend and, if the dividend is not paid, it may not be cumulative. Such securities do not generally carry voting rights but rank higher than ordinary shares for dividend payments and in the event of a winding-up. These securities have no stated maturity date but may be called and redeemed by the issuer, subject to prior notification to the PRA and, where relevant, the consent of the local banking regulator. Dividends on floating rate preferred securities are generally related to interbank offer rates.
Included in the capital base of HSBC are non-cumulative preferred securities classified as additional tier 1 capital and cumulative preferred securities classified as tier 2 capital in accordance with CRD IV rules, by virtue of the application of grandfathering provisions.
Preferred securities issued by HSBC’s subsidiaries
First call
date 2014
US$m 2013
US$m HSBC USA Inc. US$150m
Depositary shares each representing 25% interest in a share of adjustable-rate cumulative preferred stock, series D Jul 1999 150 150
US$150m Cumulative preferred stock Oct 2007 150 150US$518m Floating rate non-cumulative preferred stock, series F Apr 2010 518 518US$374m Floating rate non-cumulative preferred stock, series G Jan 2011 374 374US$374m 6.50% non-cumulative preferred stock, series H Jul 2011 374 374
HSBC Finance Corporation. US$575m 6.36% non-cumulative preferred stock, series B Jun 2010 559 559
HSBC Bank Canada CAD175m Non-cumulative redeemable class 1 preferred shares, series C Jun 2010 151 164CAD175m Non-cumulative class 1 preferred shares, series D Dec 2010 151 164CAD250m1 Non-cumulative 5 year rate reset class 1 preferred shares, series E Jun 2014 – 235
At 31 December 2,427 2,688
1 In June 2014, HSBC redeemed its non-cumulative 5 year reset class 1 preferred shares series E for US$234m.
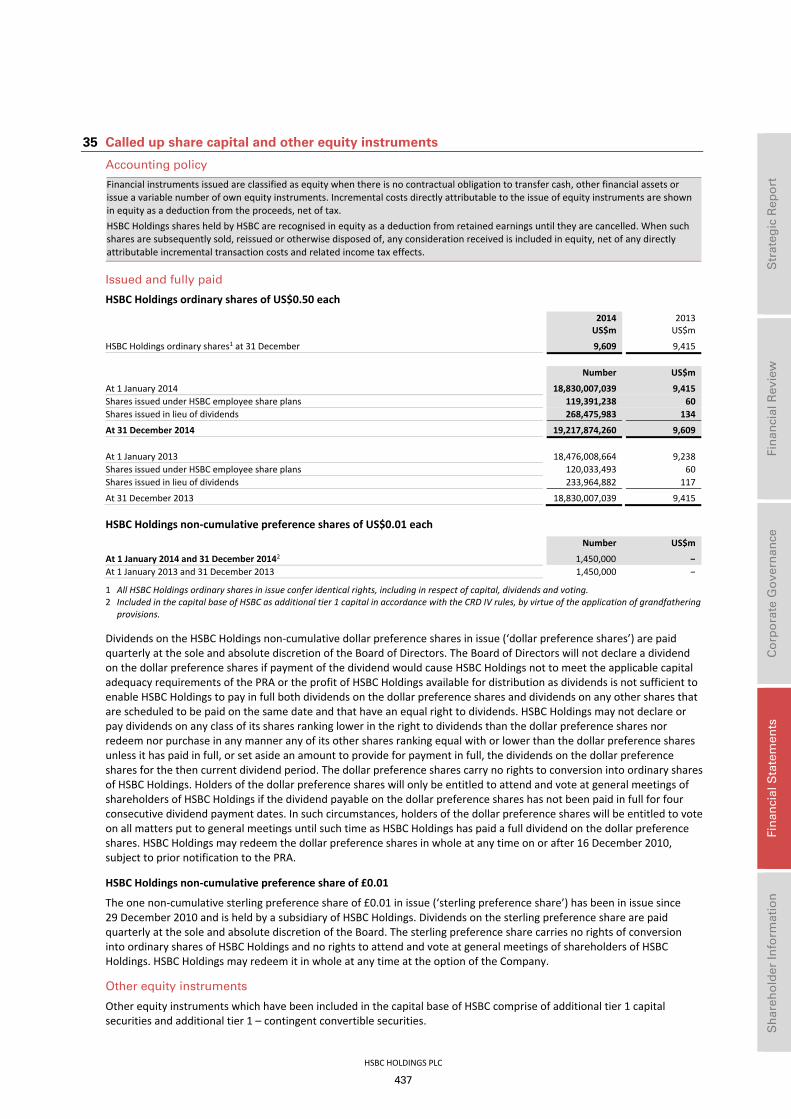
HSBC HOLDINGS PLC
437
Str
ateg
ic R
epo
rt
Fi
nan
cial
Rev
iew
Co
rpo
rate
Go
vern
ance
Fin
anci
al S
tate
men
ts
S
har
eho
lder
Info
rmat
ion
35 Called up share capital and other equity instruments
Accounting policy
Financial instruments issued are classified as equity when there is no contractual obligation to transfer cash, other financial assets or issue a variable number of own equity instruments. Incremental costs directly attributable to the issue of equity instruments are shown in equity as a deduction from the proceeds, net of tax. HSBC Holdings shares held by HSBC are recognised in equity as a deduction from retained earnings until they are cancelled. When such shares are subsequently sold, reissued or otherwise disposed of, any consideration received is included in equity, net of any directly attributable incremental transaction costs and related income tax effects.
Issued and fully paid
HSBC Holdings ordinary shares of US$0.50 each 2014 2013 US$m US$m
HSBC Holdings ordinary shares1 at 31 December 9,609 9,415 Number US$m
At 1 January 2014 18,830,007,039 9,415Shares issued under HSBC employee share plans 119,391,238 60Shares issued in lieu of dividends 268,475,983 134
At 31 December 2014 19,217,874,260 9,609 At 1 January 2013 18,476,008,664 9,238Shares issued under HSBC employee share plans 120,033,493 60Shares issued in lieu of dividends 233,964,882 117
At 31 December 2013 18,830,007,039 9,415
HSBC Holdings non-cumulative preference shares of US$0.01 each Number US$m
At 1 January 2014 and 31 December 20142 1,450,000 –At 1 January 2013 and 31 December 2013 1,450,000 –
1 All HSBC Holdings ordinary shares in issue confer identical rights, including in respect of capital, dividends and voting. 2 Included in the capital base of HSBC as additional tier 1 capital in accordance with the CRD IV rules, by virtue of the application of grandfathering
provisions.
Dividends on the HSBC Holdings non-cumulative dollar preference shares in issue (‘dollar preference shares’) are paid quarterly at the sole and absolute discretion of the Board of Directors. The Board of Directors will not declare a dividend on the dollar preference shares if payment of the dividend would cause HSBC Holdings not to meet the applicable capital adequacy requirements of the PRA or the profit of HSBC Holdings available for distribution as dividends is not sufficient to enable HSBC Holdings to pay in full both dividends on the dollar preference shares and dividends on any other shares that are scheduled to be paid on the same date and that have an equal right to dividends. HSBC Holdings may not declare or pay dividends on any class of its shares ranking lower in the right to dividends than the dollar preference shares nor redeem nor purchase in any manner any of its other shares ranking equal with or lower than the dollar preference shares unless it has paid in full, or set aside an amount to provide for payment in full, the dividends on the dollar preference shares for the then current dividend period. The dollar preference shares carry no rights to conversion into ordinary shares of HSBC Holdings. Holders of the dollar preference shares will only be entitled to attend and vote at general meetings of shareholders of HSBC Holdings if the dividend payable on the dollar preference shares has not been paid in full for four consecutive dividend payment dates. In such circumstances, holders of the dollar preference shares will be entitled to vote on all matters put to general meetings until such time as HSBC Holdings has paid a full dividend on the dollar preference shares. HSBC Holdings may redeem the dollar preference shares in whole at any time on or after 16 December 2010, subject to prior notification to the PRA.
HSBC Holdings non-cumulative preference share of £0.01
The one non-cumulative sterling preference share of £0.01 in issue (‘sterling preference share’) has been in issue since 29 December 2010 and is held by a subsidiary of HSBC Holdings. Dividends on the sterling preference share are paid quarterly at the sole and absolute discretion of the Board. The sterling preference share carries no rights of conversion into ordinary shares of HSBC Holdings and no rights to attend and vote at general meetings of shareholders of HSBC Holdings. HSBC Holdings may redeem it in whole at any time at the option of the Company.
Other equity instruments
Other equity instruments which have been included in the capital base of HSBC comprise of additional tier 1 capital securities and additional tier 1 – contingent convertible securities.

Notes on the Financial Statements (continued) 35 – Called up share capital / 36 – Notes on the statement of cash flows
HSBC HOLDINGS PLC
438
Additional tier 1 capital securities
Additional tier 1 capital securities are perpetual subordinated securities on which coupon payments may be deferred at the discretion of HSBC Holdings. While any coupon payments are unpaid or deferred, HSBC Holdings will not declare, pay dividends or make distributions or similar periodic payments in respect of, or repurchase, redeem or otherwise acquire any securities of lower or equal rank. Such securities do not generally carry voting rights but rank higher than ordinary shares for coupon payments and in the event of a winding-up. These securities have been included in the capital base of HSBC in accordance with CRD IV rules by virtue of the application of grandfathering provisions.
At HSBC Holdings’ discretion, and subject to certain conditions being satisfied, the capital securities may be exchanged on any coupon payment date for non-cumulative preference shares to be issued by HSBC Holdings and ranking pari passu with the dollar and sterling preference shares in issue. The preference shares would be issued at a nominal value of US$0.01 per share and a premium of US$24.99 per share, with both such amounts being subscribed and fully paid. These securities may be called and redeemed by HSBC subject to prior notification to the PRA.
HSBC’s additional tier 1 capital securities in issue which are accounted for in equity
First call
date2014
US$m 2013
US$m
US$2,200m 8.125% perpetual subordinated capital securities Apr 2013 2,133 2,133US$3,800m 8.00% perpetual subordinated capital securities, Series 2 Dec 2015 3,718 3,718
At 31 December 5,851 5,851
Additional tier 1 capital – contingent convertible securities
During 2014, HSBC issued new contingent convertible securities that are included in HSBC’s capital base as fully CRD IV compliant additional tier 1 capital securities on an end point basis. The net proceeds of the issuances will be used for general corporate purposes and to further strengthen the capital base pursuant to requirements under CRD IV. These securities bear a fixed rate of interest until their initial call dates. After the initial call dates, in the event they are not redeemed, the securities will bear interest at rates which are fixed periodically in advance for five year periods based on prevailing market rates. Interest on the contingent convertible securities will be due and payable only at the sole discretion of HSBC, and HSBC has sole and absolute discretion at all times and for any reason to cancel (in whole or in part) any interest payment that would otherwise be payable on any interest payment date. There are limitations on the payment of distributions if such payments are prohibited under UK banking regulations, or other requirements, if HSBC Holdings has insufficient reserves available for distribution or if HSBC fails to satisfy the solvency condition as defined in the securities’ terms.
The contingent convertible securities are undated and are repayable, at the option of HSBC, in whole at the initial call date, or on any fifth anniversary after the initial call date. In addition, the securities are repayable at the option of HSBC in whole for certain regulatory or tax reasons. Any repayments require the prior consent of the PRA. These securities rank pari passu with HSBC’s dollar and sterling preference shares and are therefore ahead of ordinary shares. The contingent convertible securities will be converted into ordinary shares of HSBC, at a pre-determined price, should HSBC’s consolidated, end-point CET1 ratio fall below 7.0%. Therefore, per the terms of the securities, on bail-in the securities will convert into ordinary shares at a conversion price of £2.70 subject to certain anti-dilution and foreign exchange adjustments and will rank pari passu with the fully paid ordinary shares in issue.
HSBC’s additional tier 1 capital – contingent convertible securities in issue which are accounted for in equity
First call
date2014
US$m 2013
US$m
US$2,250m 6.375% perpetual subordinated contingent convertible securities Sep 2024 2,244 –US$1,500m 5.625% perpetual subordinated contingent convertible securities Jan 2020 1,494 –€1,500m 5.25% perpetual subordinated contingent convertible securities Sep 2022 1,943 –
At 31 December 5,681 –
Shares under option
For details of the options outstanding to subscribe for HSBC Holdings ordinary shares under the HSBC Holdings Group Share Option Plan, the HSBC Share Plan and HSBC Holdings savings-related share option plans, see Note 6.

HSBC HOLDINGS PLC
439
Str
ateg
ic R
epo
rt
Fi
nan
cial
Rev
iew
Co
rpo
rate
Go
vern
ance
Fin
anci
al S
tate
men
ts
S
har
eho
lder
Info
rmat
ion
Aggregate options outstanding under these plans
Number of HSBC Holdings
ordinary shares Period of exercise Exercise price
31 December 2014 63,918,042 2014 to 2020 £3.3116 – 7.9911 6,468,782 2014 to 2018 HK$37.8797 – 63.9864 571,502 2014 to 2018 €3.6361 – 6.0657 1,867,328 2014 to 2018 US$4.8876 – 8.2094
31 December 2013 119,085,250 2013 to 2019 £3.3116 – 7.9911 24,215,341 2013 to 2018 HK$37.8797 –92.5881 1,574,652 2013 to 2018 €3.6361 – 7.5571 3,997,069 2013 to 2018 US$4.8876 – 11.8824
31 December 2012 159,703,771 2013 to 2018 £3.3116 – 7.9911 31,637,840 2013 to 2018 HK$37.8797 – 94.5057 2,180,263 2013 to 2018 €3.6361 – 9.5912 6,488,894 2013 to 2018 US$4.8876 – 12.0958
Maximum obligation to deliver HSBC Holdings ordinary shares
At 31 December 2014, the maximum obligation to deliver HSBC Holdings ordinary shares under all of the above option arrangements, together with GPSP awards and restricted share awards granted under the HSBC Share Plan and/or the HSBC Share Plan 2011, was 193,154,512 (2013: 265,534,885). The total number of shares at 31 December 2014 held by employee benefit trusts that may be used to satisfy such obligations to deliver HSBC Holdings ordinary shares was 7,943,191 (2013: 12,068,136).
36 Notes on the statement of cash flows
Other non-cash items included in profit before tax HSBC HSBC Holdings 2014 2013 2012 2014 2013 US$m US$m US$m US$m US$m
Depreciation, amortisation and impairment 2,251 2,330 2,531 39 35(Gains)/losses arising from dilution of interests in associates 32 (1,051) – – –Revaluations on investment property (120) (113) (72) – –Share-based payment expense 732 630 988 74 49Loan impairment losses gross of recoveries and other credit
risk provisions 5,125 7,356 9,358 – –Provisions 3,074 2,578 5,732 – –Impairment/(release of impairment) of financial investments 54 (36) 519 – –Charge/(credit) for defined benefit plans 535 121 476 – –Accretion of discounts and amortisation of premiums (421) 180 246 (62) (10)
Year ended 31 December 11,262 11,995 19,778 51 74
Change in operating assets HSBC HSBC Holdings 2014 2013 2012 2014 2013 US$m US$m US$m US$m US$m
Change in loans to HSBC undertakings – – – 1,364 (11,669)Change in net trading securities and net derivatives (18,498) (24,870) (36,829) 483 923Change in loans and advances to banks 5,147 (4,739) 1,174 – –Change in loans and advances to customers 12,666 (46,551) (79,388) – –Change in reverse repurchase agreements – non-trading 18,900 (70,403) 6,678 – –Change in financial assets designated at fair value 3,269 (4,922) (2,698) – –Change in other assets 4,393 2,586 (5,458) 7 (49)
Year ended 31 December 25,877 (148,899) (116,521) 1,854 (10,795)
Change in operating liabilities HSBC HSBC Holdings 2014 2013 2012 2014 2013 US$m US$m US$m US$m US$m
Change in deposits by banks (9,081) (7,781) 274 – –Change in customer accounts (8,362) 57,365 92,238 – –Change in repurchase agreements – non-trading (56,788) 123,653 (7,834) – –Change in debt securities in issue (8,133) (15,381) (11,552) (149) 98Change in financial liabilities designated at fair value (10,734) 994 2,549 (694) (550)Change in other liabilities (716) 5,907 13,395 (9,071) (609)
Year ended 31 December (93,814) 164,757 89,070 (9,914) (1,061)

Notes on the Financial Statements (continued) 36 – Notes on the statement of cash flows / 37 – Contingent liabilities, contractual commitments and guarantees
HSBC HOLDINGS PLC
440
Cash and cash equivalents
Accounting policy
Cash and cash equivalents include highly liquid investments that are readily convertible to known amounts of cash and which are subject to an insignificant risk of change in value. Such investments are normally those with less than three months’ maturity from the date of acquisition.
Cash and cash equivalents HSBC HSBC Holdings 2014 2013 2012 2014 2013 US$m US$m US$m US$m US$m
Cash at bank with HSBC undertakings – – – 249 407Cash and balances at central banks 129,957 166,599 141,532 – –Items in the course of collection from other banks 4,927 6,021 7,303 – –Loans and advances to banks of one month or less 89,285 96,584 119,400 – –Reverse repurchase agreements with banks of one month
or less 68,930 68,007 28,832 – – Treasury bills, other bills and certificates of deposit less than
three months 14,192 15,980 25,379 – – Less: items in the course of transmission to other banks (5,990) (6,910) (7,138) – –
At 31 December 301,301 346,281 315,308 249 407
1 Measured at amortised cost from 2013.
Interest and dividends HSBC HSBC Holdings 2014 2013 2012 2014 2013 US$m US$m US$m US$m US$m
Interest paid (15,633) (17,262) (18,412) (2,463) (2,705)Interest received 51,522 50,823 61,112 1,945 1,986Dividends received 1,199 1,133 766 9,077 20,925
The amount of cash and cash equivalents not available for use by HSBC at 31 December 2014 was US$43,738m (2013: US$38,019m), of which US$29,883m (2013: US$21,811m) related to mandatory deposits at central banks.
Disposal of subsidiaries and businesses
During 2014, we completed the disposals of HSBC Bank Middle East Limited’s banking business in Jordan and operations in Pakistan. This resulted in a net US$303m outflow of cash and cash equivalents which is included under ‘Cash flow from investing activities’ in the Consolidated statement of cash flows on page 338.
In October 2013, we completed the disposal of HSBC Bank (Panama) S.A., receiving total cash consideration of US$2,210m which is included under ‘Cash flow from investing activities’ in the Consolidated statement of cash flows on page 338.
The effect of disposals of subsidiaries and businesses in 2012 is tabulated below.
2012
US cardsbusiness
US branchnetwork
Other disposals Total
US$m US$m US$m US$mTotal assets excluding cash and cash equivalents 28,007 2,166 7,302 37,475Total liabilities 161 13,206 8,463 21,830
Aggregate net assets at date of disposal, excluding cash and cash equivalents 27,846 (11,040) (1,161) 15,645
Non-controlling interests disposed – – (81) (81)Gain on disposal including costs to sell 3,148 864 355 4,367Add back: costs to sell 72 15 56 143
Selling price 31,066 (10,161) (831) 20,074
Satisfied by: Cash and cash equivalents received/(paid) as consideration 31,066 (10,091) (542) 20,433Cash and cash equivalents sold – (70) (321) (391)
Cash consideration received/(paid) up to 31 December 2012 31,066 (10,161) (863) 20,042Cash still to be received at 31 December 2012 – – 32 32
Total cash consideration 31,066 (10,161) (831) 20,074

HSBC HOLDINGS PLC
441
Str
ateg
ic R
epo
rt
Fi
nan
cial
Rev
iew
Co
rpo
rate
Go
vern
ance
Fin
anci
al S
tate
men
ts
S
har
eho
lder
Info
rmat
ion
37 Contingent liabilities, contractual commitments and guarantees
Accounting policy
Contingent liabilities Contingent liabilities, which include certain guarantees and letters of credit pledged as collateral security and contingent liabilities related to legal proceedings or regulatory matters (see Note 40), are possible obligations that arise from past events whose existence will be confirmed only by the occurrence, or non-occurrence, of one or more uncertain future events not wholly within the control of HSBC; or are present obligations that have arisen from past events but are not recognised because it is not probable that settlement will require the outflow of economic benefits, or because the amount of the obligations cannot be reliably measured. Contingent liabilities are not recognised in the financial statements but are disclosed unless the probability of settlement is remote.
Financial guarantee contracts Liabilities under financial guarantee contracts which are not classified as insurance contracts are recorded initially at their fair value, which is generally the fee received or present value of the fee receivable. Subsequently, financial guarantee liabilities are measured at the higher of the initial fair value, less cumulative amortisation, and the best estimate of the expenditure required to settle the obligations. HSBC Holdings has issued financial guarantees and similar contracts to other Group entities. HSBC elects to account for certain guarantees as insurance contracts in HSBC Holdings’ financial statements, in which case they are measured and recognised as insurance liabilities. This election is made on a contract by contract basis, and is irrevocable.
Contingent liabilities, contractual commitments and guarantees HSBC HSBC Holdings 2014 2013 2014 2013 US$m US$m US$m US$mGuarantees and contingent liabilities
Guarantees 86,385 84,554 52,023 52,836Other contingent liabilities 346 182 – –
At 31 December 86,731 84,736 52,023 52,836
Commitments Documentary credits and short-term trade-related transactions 12,082 12,154 – –Forward asset purchases and forward forward deposits placed 823 1,005 – –Undrawn formal standby facilities, credit lines and other
commitments to lend 638,475 574,444 16 1,245
At 31 December 651,380 587,603 16 1,245
The above table discloses the nominal principal amounts of commitments, guarantees and other contingent liabilities. Contingent liabilities arising from legal proceedings, regulatory and other matters against Group companies are disclosed in Notes 29 and 40. Nominal principal amounts represent the amounts at risk should the contracts be fully drawn upon and clients default. As a significant portion of guarantees and commitments is expected to expire without being drawn upon, the total of the nominal principal amounts is not indicative of future liquidity requirements.
Social Security tax claims in Brazil
In April 2008, a final judicial decision was issued in favour of HSBC insurance and leasing companies in Brazil, clarifying that the Profit participation contribution (‘PIS’) and the Social security financing contribution (‘COFINS’) should only be levied on the revenues from the sale of goods and services and not on income derived from insurance premiums and financial revenue. The resulting reduction of the tax basis and the offsetting of tax credits was made by HSBC at that time, in accordance with this decision, but later challenged by the Brazilian tax authority claiming that the basis of those taxes should include all revenues from the corporate activity of the tax payer. With the enactment of a new law in force from 1 January 2015, the tax base for PIS and COFINS has been expanded to include all revenue from corporate activity, including insurance and financing income; therefore, any possible obligation for HSBC to pay any additional taxes only relates to tax years up to the end of 2014. These tax assessments are in various stages of the administrative process. Based on the facts currently known, it is not practicable for HSBC to predict the timing of the resolution of these matters.

Notes on the Financial Statements (continued) 38 – Lease commitments / 39 – Structured entities
HSBC HOLDINGS PLC
442
Guarantees 2014 2013
Guaranteesin favour of
third parties
Guarantees byHSBC Holdings
in favour ofother
Group entities
Guarantees in favour of
third parties
Guarantees byHSBC Holdings
in favour ofother
Group entities US$m US$m US$m US$mGuarantee type Financial guarantees1 30,406 36,800 31,224 36,800Credit-related guarantees2 16,672 15,223 15,076 16,036Other guarantees 39,307 – 38,254 –
At 31 December 86,385 52,023 84,554 52,836
1 Financial guarantees are contracts that require HSBC to make specified payments to reimburse the holder for a loss incurred because a specified debtor fails to make payment when due.
2 Credit-related guarantees are contracts that have similar features to financial guarantee contracts but fail to meet the definition of a financial guarantee contract under IAS 39.
The amounts disclosed in the above table are nominal principal amounts and reflect HSBC’s maximum exposure under a large number of individual guarantee undertakings. The risks and exposures arising from guarantees are captured and managed in accordance with HSBC’s overall credit risk management policies and procedures. Approximately half of the above guarantees have a term of less than one year. Guarantees with terms of more than one year are subject to HSBC’s annual credit review process.
Financial Services Compensation Scheme
The Financial Services Compensation Scheme (‘FSCS’) has provided compensation to consumers following the collapse of a number of deposit takers. The compensation paid out to consumers is currently funded through loans from the Bank of England and HM Treasury which at 31 December 2014 stood at approximately £16bn (US$24.9bn).
In order to repay the loan principal which is not expected to be recovered, the FSCS levies participating financial institutions. In January 2015, the FSCS announced that the expected levy on participating financial institutions for Scheme Year 2015/2016 would be £347m (US$541m) (2014/2015: £399m (US$660m)).
The ultimate FSCS levy to the industry as a result of the collapses cannot currently be estimated reliably as it is dependent on various uncertain factors including the potential recoveries of assets by the FSCS and changes in the level of protected deposits and the population of FSCS members at the time.
Capital commitments
In addition to the commitments disclosed on page 441, at 31 December 2014 HSBC had US$656m (2013: US$401m) of capital commitments contracted but not provided for and US$101m (2013: US$112m) of capital commitments authorised but not contracted for.
Associates
HSBC’s share of associates’ contingent liabilities amounted to US$47,593m at 31 December 2014 (2013: US$46,574m). No matters arose where HSBC was severally liable.
38 Lease commitments
Accounting policy
Agreements which transfer substantially all the risks and rewards incidental to the ownership of assets are classified as finance leases. As a lessor under finance leases, HSBC presents the amounts due under the leases, after deduction of unearned charges, in ‘Loans and advances to banks’ or ‘Loans and advances to customers’. As a lessee under finance leases, HSBC presents the leased assets in ‘Property, plant and equipment’ with the corresponding liability included in ‘Other liabilities’. A finance lease asset and its corresponding liability are recognised initially at the fair value of the asset or, if lower, the present value of the minimum lease payments. All other leases are classified as operating leases. As lessor, HSBC presents assets subject to operating leases in ‘Property, plant and equipment’. Impairment losses are recognised to the extent that carrying values are not fully recoverable. As a lessee, leased assets are not recognised on the balance sheet. Finance income or charges on the finance lease are recognised in ‘Net interest income’ over the lease periods so as to give a constant rate of return. Rentals payable or receivable under operating leases are spread on a straight-line basis over the lease periods and are recognised in ‘General and administrative expenses’ or in ‘Other operating income’.
Operating lease commitments
At 31 December 2014, future minimum lease payments under non-cancellable operating leases for land, buildings and equipment were US$5,372m (2013 US$5,496m).

HSBC HOLDINGS PLC
443
Str
ateg
ic R
epo
rt
Fi
nan
cial
Rev
iew
Co
rpo
rate
Go
vern
ance
Fin
anci
al S
tate
men
ts
S
har
eho
lder
Info
rmat
ion
Finance lease receivables
HSBC leases a variety of assets to third parties under finance leases, including transport assets (such as aircraft), property and general plant and machinery. At the end of lease terms, assets may be sold to third parties or leased for further terms. Rentals are calculated to recover the cost of assets less their residual value, and earn finance income.
2014 2013
Total future minimum payments
Unearned finance income
Present value
Total future minimum payments
Unearned finance income
Present value
US$m US$m US$m US$m US$m US$mLease receivables:
– no later than one year 3,383 (374) 3,009 3,370 (360) 3,010– later than one year and no later
than five years 8,089 (980) 7,109 7,933 (990) 6,943
– later than five years 5,013 (744) 4,269 5,064 (856) 4,208
At 31 December 16,485 (2,098) 14,387 16,367 (2,206) 14,161
39 Structured entities
Accounting policy
A structured entity is an entity that has been designed so that voting or similar rights are not the dominant factor in deciding who controls the entity, for example when any voting rights relate to administrative tasks only, and key activities are directed by contractual arrangements. Structured entities often have restricted activities and a narrow and well defined objective. Structured entities are assessed for consolidation in accordance with the accounting policy set out in Note 1(h).
HSBC is involved with structured entities, mainly through securitisation of financial assets, conduits and investment funds.
HSBC arrangements that involve structured entities are authorised centrally when they are established to ensure appropriate purpose and governance. The activities of structured entities administered by HSBC are closely monitored by senior management. HSBC has involvement with both consolidated and unconsolidated structured entities, which may be established by HSBC or by a third party, as detailed below.
Consolidated structured entities
Total assets of HSBC’s consolidated structured entities, split by entity type
Conduits Securitisations
HSBC managed funds Other
Total US$bn US$bn US$bn US$bn US$bnAt 31 December 2014 27.2 7.9 11.2 6.7 53.0At 31 December 2013 38.9 7.1 13.9 8.2 68.1
Conduits
HSBC has established and manages two types of conduits: securities investment conduits (‘SIC’s) and multi-seller conduits. These entities have been designed so that voting or similar rights are not the dominant factor in deciding who has control; in such cases, the relevant activities are directed by means of contractual arrangement. The conduits are consolidated as HSBC is exposed or has the right to variable returns from its involvement with the entity and has the ability to affect its returns through its power over the entity.
Securities investment conduits
Solitaire, HSBC’s principal SIC, purchases highly rated ABSs to facilitate tailored investment opportunities. At 31 December 2014, Solitaire held US$8.0bn of ABSs (2013: US$9.0bn). These are included within the disclosures of ABSs ‘held through consolidated structured entities’ on page 162. HSBC’s other SICs, Mazarin, Barion and Malachite, evolved from the restructuring of HSBC’s structured investment vehicles in 2008.
• Solitaire – Solitaire is currently funded entirely by commercial paper ‘CP’ issued to HSBC. Although HSBC continues to provide a liquidity facility, Solitaire has no need to draw on it so long as HSBC purchases the CP issued, which it intends to do for the foreseeable future. At 31 December 2014, HSBC held US$9.5bn of CP (2013: US$11.0bn).
• Mazarin – HSBC is exposed to the par value of Mazarin’s assets through the provision of a liquidity facility equal to the lesser of the amortised cost of issued senior debt and the amortised cost of non-defaulted assets. At 31 December 2014, this amounted to US$3.9bn (2013: US$7.4bn). First loss protection is provided through the capital notes issued by Mazarin, which are substantially all held by third parties.
At 31 December 2014, HSBC held 1.2% of Mazarin’s capital notes (2013: 1.3%) with a par value of US$10m (2013: US$17m) and a carrying amount of US$1.4m (2013: US$0.3m).

Notes on the Financial Statements (continued) 39 – Structured entities
HSBC HOLDINGS PLC
444
• Barion and Malachite – HSBC’s primary exposure to these SICs is represented by the amortised cost of the debt required to support the non-cash assets of the vehicles. At 31 December 2014, this amounted to US$3.0bn (2013: US$6.3bn). First loss protection is provided through the capital notes issued by these vehicles, which are substantially all held by third parties.
At 31 December 2014, HSBC held 9.9% of the capital notes (2013: 3.8%) issued by these vehicles with a par value of US$54.8m (2013: US$37m) and a carrying amount of US$10.1m (2013: US$3.3m).
Multi-seller conduits
These vehicles were established for the purpose of providing access to flexible market-based sources of finance for HSBC’s clients. HSBC bears risk equal to transaction-specific liquidity facilities offered to the multi-seller conduits amounting to US$15.4bn at 31 December 2014 (2013: US$15.7bn). First loss protection is provided by the originator of the assets, and not by HSBC, through transaction-specific credit enhancements. A layer of secondary loss protection is provided by HSBC in the form of programme-wide enhancement facilities.
Securitisations
HSBC uses structured entities to securitise customer loans and advances that it has originated in order to diversify its sources of funding for asset origination and capital efficiency purposes. The loans and advances are transferred by HSBC to the structured entities for cash or synthetically through credit default swaps, and the structured entities issue debt securities to investors.
HSBC managed funds
HSBC has established a number of money market and non-money market funds. Where it is deemed to be acting as principal rather than agent in its role as investment manager, HSBC controls and hence consolidates these funds.
Other
HSBC has also entered into a number of transactions in the normal course of business which include asset and structured finance transactions where it has control of the structured entity. In addition, HSBC is deemed to control a number of third-party managed funds through its involvement as a principal in the funds.
Unconsolidated structured entities
The term ‘unconsolidated structured entities’ refers to all structured entities that are not controlled by HSBC. HSBC enters into transactions with unconsolidated structured entities in the normal course of business to facilitate customer transactions and for specific investment opportunities.
The table below shows the total assets of unconsolidated structured entities in which HSBC had an interest at the reporting date and its maximum exposure to loss in relation to those interests.
Nature and risks associated with HSBC interests in unconsolidated structured entities
Securitisations
HSBC managed funds
Non-HSBC managed funds Other
Total US$bn US$bn US$bn US$bn US$bnAt 31 December 2014 Total assets of the entities 11.0 308.5 2,899.9 32.8 3,252.2
HSBC’s interest – assets Trading assets – 0.1 0.1 4.6 4.8Financial assets designated at fair value – 5.2 2.3 – 7.5Derivatives – – – 1.3 1.3Loans and advances to banks – – – 0.1 0.1Loans and advances to customers 0.8 – – 1.5 2.3Financial investments – 2.5 5.9 0.1 8.5Other assets – – – 0.1 0.1
Total assets in relation to HSBC’s interests in the unconsolidated structured entities
0.8 7.8 8.3 7.7 24.6
HSBC’s interest – liabilities Other liabilities – – – 0.1 0.1
Total liabilities in relation to HSBC’s interests in the unconsolidated structured entities
– – – 0.1 0.1
HSBC’s maximum exposure 0.8 7.8 8.3 11.1 28.0
Total income from HSBC interests1 – 0.1 0.3 0.4 0.8

HSBC HOLDINGS PLC
445
Str
ateg
ic R
epo
rt
Fi
nan
cial
Rev
iew
Co
rpo
rate
Go
vern
ance
Fin
anci
al S
tate
men
ts
S
har
eho
lder
Info
rmat
ion
Securitisations
HSBC managed funds
Non-HSBC managed funds Other
Total US$bn US$bn US$bn US$bn US$bnAt 31 December 2013 Total assets of the entities 9.6 290.3 2,843.3 26.7 3,169.9
HSBC’s interest – assets Trading assets – 0.1 0.2 3.8 4.1Financial assets designated at fair value – 5.1 1.4 – 6.5Derivatives – – – 1.2 1.2Loans and advances to customers 0.9 – – 1.5 2.4Financial investments – 2.3 5.4 0.1 7.8Other assets – 0.1 – – 0.1
Total assets in relation to HSBC’s interests in the unconsolidated structured entities
0.9 7.6 7.0 6.6 22.1
HSBC’s interest – liabilities Trading liabilities – – – 0.1 0.1
Total liabilities in relation to HSBC’s interests in the unconsolidated structured entities
– – – 0.1 0.1
HSBC’s maximum exposure 1.0 7.6 7.0 10.6 26.2
Total income from HSBC interests1 – 0.1 0.3 0.3 0.7
1 Income includes recurring and non-recurring fees, interest, dividends, gains or losses on the re-measurement or derecognition of interests in structured entities, any mark-to-market gains/losses on a net basis and gains or losses from the transfer of assets and liabilities to the structured entity.
The maximum exposure to loss from HSBC’s interests in unconsolidated structured entities represents the maximum loss that HSBC could incur as a result of HSBC’s involvement with unconsolidated structured entities regardless of the probability of the loss being incurred.
• For commitments and guarantees, and written credit default swaps, the maximum exposure to loss is the notional amount of potential future losses.
• For retained and purchased investments in and loans to unconsolidated structured entities, the maximum exposure to loss is the carrying value of these interests at the balance sheet reporting date.
The maximum exposure to loss is stated gross of the effects of hedging and collateral arrangements entered into to mitigate HSBC’s exposure to loss.
Securitisations
HSBC has interests in unconsolidated securitisation vehicles through holding notes issued by these entities. In addition, HSBC has investments in asset-backed securities issued by third party structured entities as set out on page 162.
HSBC managed funds
HSBC establishes and manages money market funds and non-money market investment funds to provide customers with investment opportunities. Further information on ‘Funds under management’ is provided on page 106.
HSBC, as fund manager, may be entitled to receive management and performance fees based on the assets under management. HSBC may also retain units in these funds.
Non-HSBC managed funds
HSBC purchases and holds units of third-party managed funds in order to facilitate both business and customer needs.
In addition, HSBC enters into derivative contracts to facilitate risk management solutions for non-HSBC managed funds. At 31 December 2014, the fair value of HSBC’s derivative exposures to non-HSBC managed funds was US$6.5bn. Note 16 sets out information in respect of derivatives entered into by HSBC.
Other
HSBC has established structured entities in the normal course of business such as structured credit transactions for customers, to provide finance to public and private sector infrastructure projects, and for asset and structured finance transactions.
HSBC sponsored structured entities
Accounting policy
HSBC is considered to sponsor another entity if, in addition to ongoing involvement with the entity, it had a key role in establishing that entity or in bringing together the relevant counterparties so that the transaction, which is the purpose of the entity, could occur. HSBC is generally not considered a sponsor if the only involvement with the entity is merely administrative in nature.

Notes on the Financial Statements (continued) 40 – Legal proceedings and regulatory matters
HSBC HOLDINGS PLC
446
The amount of assets transferred to and income received from such sponsored entities during 2014 and 2013 was not significant.
40 Legal proceedings and regulatory matters
HSBC is party to legal proceedings and regulatory matters in a number of jurisdictions arising out of its normal business operations. Apart from the matters described below, HSBC considers that none of these matters are material. The recognition of provisions is determined in accordance with the accounting policies set out in Note 29. While the outcome of legal proceedings and regulatory matters is inherently uncertain, management believes that, based on the information available to it, appropriate provisions have been made in respect of these matters as at 31 December 2014 (see Note 29). Where an individual provision is material, the fact that a provision has been made is stated and quantified. Any provision recognised does not constitute an admission of wrongdoing or legal liability. It is not practicable to provide an aggregate estimate of potential liability for our legal proceedings and regulatory matters as a class of contingent liabilities.
Securities litigation
As a result of an August 2002 restatement of previously reported consolidated financial statements and other corporate events, including the 2002 settlement with 46 states and the District of Columbia relating to real estate lending practices, Household International and certain former officers were named as defendants in a class action lawsuit, Jaffe v. Household International, Inc., et al., filed in August 2002 in the US District Court for the Northern District of Illinois (the ‘Illinois District Court’). The complaint asserted claims under the US Securities Exchange Act and alleged that the defendants knowingly or recklessly made false and misleading statements of material fact relating to Household International’s Consumer Lending operations, including collections, sales and lending practices, some of which ultimately led to the 2002 state settlement agreement, and facts relating to accounting practices evidenced by the restatement. Ultimately, a class was certified on behalf of all persons who acquired and disposed of Household International common stock between July 1999 and October 2002.
A jury trial concluded in April 2009, which was decided partly in favour of the plaintiffs. Various legal challenges to the verdict were raised in post-trial briefing.
In December 2011, following the submission of claim forms by class members, the court-appointed claims administrator to the Illinois District Court reported that the total number of claims that generated an allowed loss was 45,921, and that the aggregate amount of these claims was approximately US$2.2bn. The defendants filed legal challenges regarding the presumption of reliance as to the class and compliance with the claim form requirements, which the Illinois District Court, in September 2012, rejected for the most part. The Illinois District Court directed further proceedings before a court-appointed Special Master to address certain claims submission issues.
In October 2013, the Illinois District Court denied the defendants’ additional post-trial motions for judgement as a matter of law or, in the alternative, for a new trial, and granted plaintiffs’ motions for a partial final judgement and awarded pre-judgement interest at the prime rate, compounded annually. Subsequently, in October 2013, the Illinois District Court entered a partial final judgement against the defendants in the amount of approximately US$2.5bn (including pre-judgement interest). In addition to the partial judgement that has been entered, there also remain approximately US$625m in claims, prior to imposition of pre-judgement interest, that still are subject to objections that have not yet been ruled upon by the Illinois District Court.
The defendants filed a Notice of Appeal of the partial final judgement, and oral argument was heard by the US Court of Appeals for the Seventh Circuit (the ‘Court of Appeals’) in May 2014. We await a decision from the Court of Appeals. The defendants have also filed a supersedeas bond in the approximate amount of the partial final judgement (US$2.5bn) in order to stay execution on the judgement pending appeal. Despite the jury verdict, the various rulings of the Illinois District Court, and the partial final judgement, we continue to believe that we have meritorious grounds for relief on appeal.
The timing and outcome of the ultimate resolution of this matter is uncertain. Given the complexity and uncertainties associated with the actual determination of damages, including the outcome of any appeals, there is a wide range of possible outcomes. If the Court of Appeals rejects or only partially accepts our arguments, the amount of damages, based upon that partial final judgement, and other pending claims and the application of pre-judgement interest on those pending claims, may lie in a range from a relatively insignificant amount to an amount up to or exceeding US$3.6bn. Once a judgement is entered (such as the approximately US$2.5bn partial final judgement entered in October 2013), post-judgement interest accrues on the judgement at a rate equal to the weekly average of the one-year constant maturity treasury yield as published by the Federal Reserve System. A provision has been made based on management’s best estimate of probable outflows.

HSBC HOLDINGS PLC
447
Str
ateg
ic R
epo
rt
Fi
nan
cial
Rev
iew
Co
rpo
rate
Go
vern
ance
Fin
anci
al S
tate
men
ts
S
har
eho
lder
Info
rmat
ion
Bernard L. Madoff Investment Securities LLC
Bernard L. Madoff (‘Madoff’) was arrested in December 2008, and ultimately pleaded guilty to running a Ponzi scheme. He has acknowledged, in essence, that while purporting to invest his customers’ money in securities, he in fact never invested in securities and used other customers’ money to fulfil requests to return investments. His firm, Bernard L. Madoff Investment Securities LLC (‘Madoff Securities’), is being liquidated by a trustee (the ‘Trustee’).
Various non-US HSBC companies provided custodial, administration and similar services to a number of funds incorporated outside the US whose assets were invested with Madoff Securities. Based on information provided by Madoff Securities, as at 30 November 2008, the purported aggregate value of these funds was US$8.4bn, an amount that includes fictitious profits reported by Madoff. Based on information available to HSBC, we have estimated that the funds’ actual transfers to Madoff Securities minus their actual withdrawals from Madoff Securities during the time that HSBC serviced the funds totalled approximately US$4bn. Various HSBC companies have been named as defendants in lawsuits arising out of Madoff Securities’ fraud.
US/UK Litigation: The Trustee has brought suits against various HSBC companies in the US Bankruptcy Court and in the English High Court. The Trustee’s US actions included common law claims, alleging that HSBC aided and abetted Madoff’s fraud and breach of fiduciary duty. Those claims were dismissed on grounds of lack of standing. The Trustee’s remaining US claims seek recovery of prepetition transfers pursuant to US bankruptcy law. The amount of these remaining claims has not been pleaded or determined as against HSBC.
Alpha Prime Fund Ltd (‘Alpha Prime’) and Senator Fund SPC, co-defendants in the Trustee’s US actions, have brought cross-claims against HSBC. These funds have also sued HSBC in Luxembourg (discussed below).
The Trustee’s English action seeks recovery of unspecified transfers from Madoff Securities to or through HSBC. HSBC has not yet been served with the Trustee’s English action. The Trustee’s deadline for serving the claim has been extended through the third quarter of 2015.
Fairfield Sentry Limited, Fairfield Sigma Limited and Fairfield Lambda Limited (collectively, ‘Fairfield’), funds whose assets were invested with Madoff Securities, commenced multiple suits in the US and the British Virgin Islands (the ‘BVI’) against fund shareholders, including various HSBC companies that acted as nominees for HSBC clients, seeking restitution of payments made in connection with share redemptions. The US actions brought by Fairfield are stayed pending the outcome of the Fairfield cases in the BVI (discussed below).
In September 2013, the US Court of Appeals for the Second Circuit affirmed the dismissal of purported class action claims against HSBC and others brought by investors in three Madoff-invested funds on grounds of forum non conveniens. The plaintiffs’ petitions for certiorari to the US Supreme Court were filed in December 2014. The Supreme Court’s decision on whether to grant certiorari review is expected in the first half of 2015.
In December 2014, three new Madoff-related actions were filed. The first is a purported class action brought by direct investors in Madoff Securities who were holding their investments as of December 2008, asserting various common law claims and seeking to recover damages lost to Madoff Securities’ fraud on account of HSBC’s purported knowledge and alleged furtherance of the fraud. The other two actions were filed by SPV Optimal SUS Ltd (‘SPV Optimal’), the purported assignee of the Madoff Securities-invested company, Optimal Strategic US Equity Ltd. One of these actions was filed in New York state court and the other in US federal district court. In January 2015, SPV Optimal dismissed its federal lawsuit against HSBC. The state court action against HSBC remains pending.
BVI Litigation: Beginning in October 2009, the Fairfield funds, whose assets were directly or indirectly invested with Madoff Securities, commenced multiple suits in the BVI against numerous fund shareholders, including various HSBC companies that acted as nominees for clients of HSBC’s private banking business and other clients who invested in the Fairfield funds. The Fairfield funds are seeking restitution of redemption payments made by the funds to defendants on the grounds that they were mistakenly based on inflated net asset values. In April 2014, the UK Privy Council issued a ruling on two preliminary issues in favour of other defendants in the BVI actions, and issued its order in October 2014. There is also a pending motion brought by other defendants before the BVI court challenging the Fairfield liquidator’s authorisation to pursue its claims in the US. The BVI court has adjourned the hearing on that pending motion until March 2015.
Bermuda Litigation: In January 2009, Kingate Global Fund Limited and Kingate Euro Fund Limited (collectively, ‘Kingate’), funds whose assets were directly or indirectly invested with Madoff Securities, commenced an action in Bermuda against HSBC Bank Bermuda Limited for recovery of funds held in Kingate’s accounts, fees and dividends. This action is currently pending, but is not expected to move forward until there is a resolution as to the Trustee’s separate US actions against Kingate and HSBC Bank Bermuda Limited.
Thema Fund Limited (‘Thema’) and Hermes International Fund Limited (‘Hermes’), funds invested with Madoff Securities, each also brought three actions in Bermuda in 2009. The first set of actions were brought against HSBC Institutional Trust Services (Bermuda) Limited and seek recovery of funds in frozen accounts held at HSBC. The second set of actions asserts liability against HSBC Institutional Trust Services (Bermuda) Limited in relation to claims for mistake, recovery of fees and damages for breach of contract. The third set of actions seeks return of fees from HSBC Bank Bermuda Limited and HSBC

Notes on the Financial Statements (continued) 40 – Legal proceedings and regulatory matters
HSBC HOLDINGS PLC
448
Securities Services (Bermuda). There has been little progress in these actions for several years, although in January 2015, Thema and Hermes served notice of intent to proceed in respect of the second set of actions referred to above.
Cayman Islands Litigation: In February 2013, Primeo Fund, a Cayman Islands-based fund invested in Madoff Securities, brought an action against the fund administrator, Bank of Bermuda (Cayman), and the fund custodian, HSBC Securities Services (Luxembourg) (‘HSSL’), alleging breaches of contract. Primeo Fund claims damages from defendants to compensate it for alleged losses, including loss of profit and any liability to the Trustee. Trial has been postponed to January 2016.
Luxembourg Litigation: In April 2009, Herald Fund SPC (‘Herald’) (in official liquidation since July 2013) commenced action against HSSL before the Luxembourg District Court seeking restitution of all cash and securities Herald purportedly lost because of Madoff Securities’ fraud, or in the alternative, money damages in the same amount. In March 2013, the Luxembourg District Court dismissed Herald’s restitution claim for the return of the securities. Herald’s restitution claim for return of the cash and claim for money damages were reserved. Herald appealed this judgement in May 2013. Judgement on the issue of a judicial bond is expected to be rendered in May 2015. Proceedings on the reserved restitution claim were suspended pending resolution of the appeal.
In October 2009, Alpha Prime sued HSSL before the Luxembourg District Court, alleging breach of contract and negligence in the appointment of Madoff Securities as a sub-custodian of Alpha Prime’s assets. Alpha Prime was ordered to provide a judicial bond. Alpha Prime requested a stay of these proceedings pending its negotiations with the Trustee in the US proceedings. The matter has been temporarily suspended.
In March 2010, Herald (Lux) SICAV (‘Herald (Lux)’) (in official liquidation since April 2009) brought an action against HSSL before the Luxembourg District Court seeking restitution of securities, or the cash equivalent, or money damages in the alternative. Herald (Lux) has also requested the restitution of fees paid to HSSL as custodian and service agent of the fund. The last preliminary hearing is scheduled to take place in March 2015.
In December 2014, Senator Fund SPC commenced an action against HSSL before the Luxembourg District Court, seeking the restitution of securities held as of the latest net asset value statement from November 2008, or in the alternative, money damages. The first preliminary hearing is scheduled to take place in February 2015.
HSSL has been sued in various actions by shareholders in the Primeo Select Fund, Herald, Herald (Lux), and Hermes funds. These actions are in different stages, most of which have been dismissed, suspended or postponed.
Ireland Litigation: In November 2013, Defender Limited, a fund invested with Madoff securities, commenced an action against HSBC Institutional Trust Services (Ireland) Limited (‘HTIE’), alleging breach of the custodian agreement and claiming damages and indemnification for claims against Defender Limited for fund losses. The action also includes four non-HSBC parties, who served as directors and investment managers to Defender Limited.
In July 2013 and December 2013, settlements were reached in respect of claims filed against HTIE in the Irish High Court by Thema International Fund plc (‘Thema International’) and Alternative Advantage Plc (‘AA’), respectively. Five actions by individual Thema International shareholders remain pending.
In December 2014, a new proceeding against HTIE and HSBC Securities Services (Ireland) Limited was brought by SPV Optimal, alleging breach of the custodian agreement and claiming damages and indemnification for fund losses.
There are many factors that may affect the range of possible outcomes, and the resulting financial impact, of the various Madoff-related proceedings described above, including but not limited to the multiple jurisdictions in which the proceedings have been brought and the number of different plaintiffs and defendants in such proceedings. For these reasons, amongst others, it is not practicable at this time for HSBC to estimate reliably the aggregate liabilities, or ranges of liabilities, that might arise as a result of all claims in the various Madoff-related proceedings, but they could be significant.
US mortgage-related investigations
In April 2011, following completion of a broad horizontal review of industry residential mortgage foreclosure practices, HSBC Bank USA N.A. (‘HSBC Bank USA’) entered into a consent cease-and-desist order with the Office of the Comptroller of the Currency (the ‘OCC’). HSBC Finance Corporation (‘HSBC Finance’) and HSBC North America Holdings Inc. (‘HNAH’) also entered into a similar consent order with the Federal Reserve Board (the ‘FRB’) (together with the OCC order, the ‘Servicing Consent Orders’). The Servicing Consent Orders require prescribed actions to address the deficiencies noted in the joint examination and described in the consent orders. HSBC Bank USA, HSBC Finance and HNAH continue to work with the OCC and the FRB to align their processes with the requirements of the consent orders and are implementing operational changes as required.
Pursuant to the Servicing Consent Orders, an independent consultant was retained to conduct an independent review of foreclosures pending or completed between January 2009 and December 2010 (the ‘Independent Foreclosure Review’) to determine if any borrower was financially injured as a result of an error in the foreclosure process. In February 2013, HSBC Bank USA entered into an agreement with the OCC, and HSBC Finance and HNAH entered into an agreement with the FRB (together, the ‘IFR Settlement Agreements’), pursuant to which the Independent Foreclosure Review was replaced by a broader framework under which HSBC and 12 other participating servicers agreed to provide, in the aggregate, over

HSBC HOLDINGS PLC
449
Str
ateg
ic R
epo
rt
Fi
nan
cial
Rev
iew
Co
rpo
rate
Go
vern
ance
Fin
anci
al S
tate
men
ts
S
har
eho
lder
Info
rmat
ion
US$9.3bn in cash payments and other assistance to help eligible borrowers. Pursuant to the IFR Settlement Agreements, HNAH made a cash payment of US$96m into a fund used to make payments to borrowers that were in active foreclosure during 2009 and 2010, and in addition, is providing other assistance (e.g. loan modifications) to help eligible borrowers. Borrowers who receive compensation will not be required to execute a release or waiver of rights and will not be precluded from pursuing litigation concerning foreclosure or other mortgage servicing practices. For participating servicers, including HSBC Bank USA and HSBC Finance, fulfilment of the terms of the IFR Settlement Agreements will satisfy the Independent Foreclosure Review requirements of the Servicing Consent Orders, including the wind-down of the Independent Foreclosure Review.
The Servicing Consent Orders do not preclude additional enforcement actions against HSBC Bank USA, HSBC Finance or HNAH by bank regulatory, governmental or law enforcement agencies, such as the US Department of Justice (the ‘DoJ’) or state Attorneys General, which could include the imposition of civil money penalties and other sanctions relating to the activities that are the subject of the Servicing Consent Orders. Pursuant to the IFR Settlement Agreement with the OCC, however, the OCC has agreed that it will not assess civil money penalties or initiate any further enforcement action with respect to past mortgage servicing and foreclosure-related practices addressed in the Servicing Consent Orders, provided the terms of the IFR Settlement Agreements are fulfilled. The OCC’s agreement not to assess civil money penalties is further conditioned on HNAH making payments or providing borrower assistance pursuant to any agreement that may be entered into with the DoJ in connection with the servicing of residential mortgage loans. The FRB has agreed that any assessment of civil money penalties by the FRB will reflect a number of adjustments, including amounts expended in consumer relief and payments made pursuant to any agreement that may be entered into with the DoJ in connection with the servicing of residential mortgage loans. The IFR Settlement Agreements do not preclude private litigation concerning these practices.
Separate from the Servicing Consent Orders and the settlements related to the Independent Foreclosure Review discussed above, in February 2012, five of the largest US mortgage servicers (not including any HSBC companies) reached a settlement with the DoJ, the US Department of Housing and Urban Development and state Attorneys General of 49 states with respect to foreclosure and other mortgage servicing practices. Following the February 2012 settlement, these government agencies initiated discussions with other mortgage industry servicers, including HSBC, HSBC Bank USA, HSBC Finance and HNAH have had discussions with US bank regulators and other governmental agencies regarding a potential resolution. Any such settlement, however, may not completely preclude other enforcement actions by state or federal agencies, bank regulators or law enforcement bodies related to foreclosure and other mortgage servicing practices, including, but not limited to, matters relating to the securitisation of mortgages for investors. These practices have in the past resulted in private litigation, and such a settlement would not preclude further private litigation concerning these practices.
US mortgage securitisation activity and litigation
HSBC Bank USA has been involved as a sponsor/seller of loans used to facilitate whole loan securitisations underwritten by HSBC Securities (USA) Inc. (‘HSI’). From 2005 to 2007, HSBC Bank USA purchased and sold US$24bn of such loans to HSI which were subsequently securitised and sold by HSI to third parties. The outstanding principal balance on these loans was approximately US$5.7bn as at 31 December 2014.
Participants in the US mortgage securitisation market that purchased and repackaged whole loans have been the subject of lawsuits and governmental and regulatory investigations and inquiries, which have been directed at groups within the US mortgage market such as servicers, originators, underwriters, trustees or sponsors of securitisations, and at particular participants within these groups. As the industry’s residential mortgage foreclosure issues continue, HSBC Bank USA has taken title to an increasing number of foreclosed homes as trustee on behalf of various securitisation trusts. As nominal record owner of these properties, HSBC Bank USA has been sued by municipalities and tenants alleging various violations of law, including laws regarding property upkeep and tenants’ rights. While HSBC believes and continues to maintain that the obligations at issue and any related liabilities are properly those of the servicer of each trust, HSBC continues to receive significant adverse publicity in connection with these and similar matters, including foreclosures that are serviced by others in the name of ‘HSBC, as trustee’.
Between June and December 2014, a number of lawsuits were filed in state and federal court in New York against HSBC Bank USA as trustee of over 250 mortgage securitisation trusts. These lawsuits are brought derivatively on behalf of the trusts by a class of investors including, amongst others, BlackRock and PIMCO funds. Similar lawsuits were filed simultaneously against other non-HSBC financial institutions that served as mortgage securitisation pool trustees. The complaints against HSBC Bank USA allege that the trusts have sustained losses in collateral value of over US$34bn. The lawsuits seek unspecified damages resulting from alleged breaches of the US Trust Indenture Act, breach of fiduciary duties, negligence, breach of contract and breach of the common law duty of trust. HSBC filed a motion to dismiss three of these lawsuits in January 2015.
Various HSBC companies have also been named as defendants in a number of actions in connection with residential mortgage-backed securities (‘RMBS’) offerings, which generally allege that the offering documents for securities issued by securitisation trusts contained material misstatements and omissions, including statements regarding the underwriting standards governing the underlying mortgage loans. In September 2011, an action was filed by the Federal Housing

Notes on the Financial Statements (continued) 40 – Legal proceedings and regulatory matters
HSBC HOLDINGS PLC
450
Finance Agency (‘FHFA’), acting in its capacity as conservator for the Federal National Mortgage Association (‘Fannie Mae’) and the Federal Home Loan Mortgage Corporation (‘Freddie Mac’) in the US District Court for the Southern District of New York (the ‘New York District Court’) against HSBC Bank USA, HNAH, HSI and HSI Asset Securitization (‘HASCO’), as well as five former and current officers and directors of HASCO. FHFA sought money damages or rescission of mortgage-backed securities purchased by Fannie Mae and Freddie Mac that were either underwritten or sponsored by HSBC companies. As announced in September 2014, this matter was resolved between the parties by final settlement requiring HSBC to pay a total of US$550m to FHFA.
HSBC Bank USA, HSBC Finance and Decision One Mortgage Company LLC (an indirect subsidiary of HSBC Finance) have been named as defendants in various mortgage loan repurchase actions brought by trustees of securitisation trusts. In the aggregate, these actions seek to have the HSBC defendants repurchase mortgage loans, or pay compensatory damages in lieu of repurchase totalling at least US$1bn. Motions to dismiss have been filed and are fully briefed and pending in two of these actions.
Since 2010, various HSBC entities have received subpoenas and requests for information from US authorities seeking the production of documents and information regarding HSBC’s involvement, and the involvement of its affiliates, in particular private-label RMBS transactions as an issuer, sponsor, underwriter, depositor, trustee, custodian or servicer. HSBC continues to cooperate with these US authorities. In November 2014, HNAH, on behalf of itself and various subsidiaries including, but not limited to, HSBC Bank USA, HASCO, HSI, HSI Asset Loan Obligation, HSBC Mortgage Corporation (USA), HSBC Finance and Decision One Mortgage Company LLC, received a subpoena from the US Attorney’s Office for the District of Colorado, pursuant to the Financial Industry Reform, Recovery and Enforcement Act, concerning the origination, financing, purchase, securitisation and servicing of subprime and non-subprime residential mortgages. This matter is at an early stage and HSBC is cooperating fully.
Based on the facts currently known, it is not practicable at this time for HSBC to predict the resolution of these matters, including the timing or any possible impact on HSBC.
HSBC expects the focus on mortgage securitisations to continue. As a result, HSBC companies may be subject to additional claims, litigation and governmental or regulatory scrutiny relating to its participation in the US mortgage securitisation market, either as a member of a group or individually.
Anti-money laundering and sanctions-related matters
In October 2010, HSBC Bank USA entered into a consent cease-and-desist order with the OCC, and HNAH entered into a consent cease-and-desist order with the FRB (the ‘Orders’). These Orders required improvements to establish an effective compliance risk management programme across HSBC’s US businesses, including risk management related to US Bank Secrecy Act (the ‘BSA’) and anti-money laundering (‘AML’) compliance. Steps continue to be taken to address the requirements of the Orders.
In December 2012, HSBC Holdings plc (‘HSBC Holdings’), HNAH and HSBC Bank USA entered into agreements with US and UK government agencies regarding past inadequate compliance with the BSA, AML and sanctions laws. Among those agreements, HSBC Holdings and HSBC Bank USA entered into a five-year deferred prosecution agreement with the DoJ, the US Attorney’s Office for the Eastern District of New York, and the US Attorney’s Office for the Northern District of West Virginia (the ‘US DPA’); HSBC Holdings entered into a two-year deferred prosecution agreement with the New York County District Attorney (the ‘DANY DPA’); and HSBC Holdings consented to a cease-and-desist order and HSBC Holdings and HNAH consented to a civil money penalty order with the FRB. In addition, HSBC Bank USA entered into a civil money penalty order with FinCEN and a separate civil money penalty order with the OCC. HSBC Holdings also entered into an agreement with the Office of Foreign Assets Control (‘OFAC’) regarding historical transactions involving parties subject to OFAC sanctions and an undertaking with the UK Financial Conduct Authority (the ‘FCA’) to comply with certain forward-looking AML and sanctions-related obligations.
Under these agreements, HSBC Holdings and HSBC Bank USA made payments totalling US$1.9bn to US authorities and are continuing to comply with ongoing obligations. In July 2013, the US District Court for the Eastern District of New York approved the US DPA and retained authority to oversee implementation of that agreement. Under the agreements with the DoJ, FCA, and FRB, an independent monitor (who is, for FCA purposes, a ‘skilled person’ under Section 166 of the Financial Services and Markets Act) is evaluating and regularly assessing the effectiveness of HSBC’s AML and sanctions compliance function and HSBC’s progress in implementing its remedial obligations under the agreements.
HSBC Holdings has fulfilled all of the requirements imposed by the DANY DPA, which expired by its terms at the end of the two-year period of that agreement in December 2014. If HSBC Holdings and HSBC Bank USA fulfil all of the requirements imposed by the US DPA, the DoJ charges against those entities will be dismissed at the end of the five-year period of that agreement. The DoJ may prosecute HSBC Holdings or HSBC Bank USA in relation to any matters that are the subject of the US DPA if HSBC Holdings or HSBC Bank USA breaches the terms of the US DPA.
HSBC Bank USA also entered into a separate consent order with the OCC, requiring it to correct the circumstances and conditions as noted in the OCC’s then most recent report of examination, and imposing certain restrictions on HSBC Bank USA directly or indirectly acquiring control of, or holding an interest in, any new financial subsidiary, or commencing a
HSBC HOLDINGS PLC
451
Str
ateg
ic R
epo
rt
Fi
nan
cial
Rev
iew
Co
rpo
rate
Go
vern
ance
Fin
anci
al S
tate
men
ts
S
har
eho
lder
Info
rmat
ion
new activity in its existing financial subsidiary, unless it receives prior approval from the OCC. HSBC Bank USA also entered into a separate consent order with the OCC requiring it to adopt an enterprise-wide compliance programme.
These settlements with US and UK authorities have led to private litigation, and do not preclude further private litigation related to HSBC’s compliance with applicable BSA, AML and sanctions laws or other regulatory or law enforcement actions for BSA, AML, sanctions or other matters not covered by the various agreements.
In May 2014, a shareholder derivative action was filed by a shareholder of HSBC Holdings purportedly on behalf of HSBC Holdings, HSBC Bank USA, HNAH and HSBC USA Inc. (the ‘Nominal Corporate Defendants’) in New York State Supreme Court against certain current and former directors and officers of those HSBC companies (the ‘Individual Defendants’). The complaint alleges that the Individual Defendants breached their fiduciary duties to the Nominal Corporate Defendants and caused a waste of corporate assets by allegedly permitting and/or causing the conduct underlying the US DPA. In October 2014, the Nominal Corporate Defendants moved to dismiss the action, and the Individual Defendants who had been served also responded to the complaint. Plaintiff filed an amended complaint in February 2015.
In July 2014, a claim was filed in the Ontario Superior Court of Justice against HSBC Holdings and a former employee purportedly on behalf of a class of persons who purchased HSBC common shares and ADSs between July 2006 and July 2012. The complaint, which seeks monetary damages of up to CA$20bn, alleges that the defendants made statutory and common law misrepresentations in documents released by HSBC Holdings and its wholly owned subsidiary, HSBC Bank Canada, relating to HSBC’s compliance with BSA, AML, sanctions and other laws.
In November 2014, a complaint was filed in the US District Court for the Eastern District of New York on behalf of representatives of US persons killed or injured in Iraq between April 2004 and November 2011. The complaint was filed against HSBC Holdings, HSBC Bank plc, HSBC Bank USA and HSBC Bank Middle East, as well as other non-HSBC banks and the Islamic Republic of Iran (together, the ‘Defendants’). The plaintiffs allege that defendants conspired to violate the US Anti-Terrorism Act, by altering or falsifying payment messages involving Iran, Iranian parties and Iranian banks for transactions processed through the US. Defendants’ motion to dismiss is due to be filed in March 2015.
These private lawsuits are at an early stage. Based on the facts currently known, it is not practicable at this time for HSBC to predict the resolution of these private lawsuits, including the timing or any possible impact on HSBC.
Tax and broker-dealer investigations
HSBC continues to cooperate in ongoing investigations by the DoJ and the US Internal Revenue Service regarding whether certain HSBC companies and employees acted appropriately in relation to certain customers who had US tax reporting obligations. In connection with these investigations, HSBC Private Bank (Suisse) SA (‘HSBC Swiss Private Bank’), with due regard for Swiss law, has produced records and other documents to the DoJ. In August 2013, the DoJ informed HSBC Swiss Private Bank that it was not eligible for the ‘Program for Non-Prosecution Agreements or Non-Target Letters for Swiss Banks’ since a formal investigation had previously been authorised. The DoJ has requested additional information from HSBC Swiss Private Bank and other Swiss banks regarding the transfer of assets to and from US person-related accounts and employees who serviced those accounts. HSBC Swiss Private Bank is preparing this data, in a manner consistent with Swiss law.
Other HSBC companies have received subpoenas and requests for information from US and other authorities, including with respect to US-based clients of an HSBC company in India.
In November 2014, HSBC Swiss Private Bank reached a final settlement with the SEC relating to cross-border brokerage and advisory services provided by HSBC Swiss Private Bank and its predecessor entities to US resident clients between 2003 and 2011.
In addition, various tax administration, regulatory and law enforcement authorities around the world, including in Belgium, France, Argentina, Switzerland and India, are conducting investigations and reviews of HSBC Swiss Private Bank in connection with allegations of tax evasion or tax fraud, money laundering and unlawful cross-border banking solicitation. HSBC Swiss Private Bank has been placed under formal criminal examination by magistrates in both Belgium and France. In February 2015, HSBC was informed that the French magistrates are of the view that they have completed their investigation with respect to HSBC Swiss Private Bank and have referred the matter to the public prosecutor for a recommendation on any potential charges to be brought, whilst reserving the right to continue investigating other conduct at HSBC. In addition, in November 2014, the Argentine tax authority filed a complaint alleging an unlawful association between HSBC Swiss Private Bank, HSBC Bank Argentina, HSBC Bank USA and certain current and former HSBC officers, which allegedly enabled HSBC customers to evade Argentine tax obligations. In February 2015, a public prosecutor in Switzerland commenced an investigation of HSBC Swiss Private Bank, and the Indian tax authority issued a summons and request for information to an HSBC company in India.
With respect to each of these ongoing matters, HSBC is cooperating with the relevant authorities. Based on the facts currently known, there is a high degree of uncertainty as to the terms on which they will be resolved and the timing of such resolutions, including the amounts of fines, penalties and/or forfeitures imposed on HSBC, which could be significant.

Notes on the Financial Statements (continued) 40 – Legal proceedings and regulatory matters
HSBC HOLDINGS PLC
452
In light of the recent media attention regarding these matters, it is possible that other tax administration, regulatory or law enforcement authorities will also initiate or enlarge similar investigations or regulatory proceedings.
London interbank offered rates, European interbank offered rates and other benchmark interest rate investigations and litigation
Various regulators and competition and law enforcement authorities around the world, including in the UK, the US, the EU, Switzerland and elsewhere, are conducting investigations and reviews related to certain past submissions made by panel banks and the processes for making submissions in connection with the setting of London interbank offered rates (‘Libor’), European interbank offered rates (‘Euribor’) and other benchmark interest rates. As certain HSBC companies are members of such panels, HSBC has been the subject of regulatory demands for information and is cooperating with those investigations and reviews.
In December 2013, the European Commission (the ‘Commission’) announced that it had imposed fines on eight financial institutions under its cartel settlement procedure for their participation in illegal activity related to euro interest rate derivatives and/or yen interest rate derivatives. Although HSBC was not one of the financial institutions fined, the Commission announced that it had opened proceedings against HSBC in connection with its Euribor-related investigation of euro interest rate derivatives only. This investigation will continue under the standard Commission cartel procedure. In May 2014, HSBC received a Statement of Objections from the Commission, alleging anti-competitive practices in connection with the pricing of euro interest rate derivatives. The Statement of Objections sets out the Commission’s preliminary views and does not prejudge the final outcome of its investigation. HSBC responded partially to the Commission’s Statement of Objections in November 2014, and will have the opportunity to complete its response on a date to be decided by the Commission, once various procedural issues are resolved.
Based on the facts currently known, with respect to each of these ongoing investigations, there is a high degree of uncertainty as to the terms on which they will be resolved and the timing of such resolution, including the amounts of fines and/or penalties, which could be significant.
In addition, HSBC and other US dollar Libor panel banks have been named as defendants in a number of private lawsuits filed in the US with respect to the setting of US dollar Libor. The complaints assert claims under various US laws, including US antitrust and racketeering laws, the US Commodity Exchange Act (‘CEA’), and state law. The lawsuits include individual and putative class actions, most of which have been transferred and/or consolidated for pre-trial purposes before the New York District Court.
In March 2013, the New York District Court overseeing the consolidated proceedings related to US dollar Libor issued a decision in the six oldest actions, dismissing the plaintiffs’ federal and state antitrust claims, racketeering claims, and unjust enrichment claims in their entirety, but allowing certain of their CEA claims that were not barred by the applicable statute of limitations to proceed. Some of those plaintiffs appealed the New York District Court’s decision to the US Court of Appeals for the Second Circuit, which later dismissed those appeals. In January 2015, the US Supreme Court reversed the Court of Appeals’ decision and remanded the case to the Court of Appeals for consideration of the merits of the plaintiffs’ appeal.
Other plaintiffs sought to file amended complaints in the New York District Court to assert additional allegations. In June 2014, the New York District Court issued a decision that, amongst other things, denied the plaintiffs’ request for leave to amend their complaints to assert additional theories of Libor manipulation against HSBC and certain non-HSBC banks, but granted leave to assert such manipulation claims against two other banks; and granted defendants’ motion to dismiss certain additional claims under the CEA as barred by the applicable statute of limitations. Proceedings with respect to all other actions in the consolidated proceedings were stayed pending this decision. The stay was lifted in September 2014. Amended complaints were filed in previously stayed non-class actions in October 2014; and amended complaints were filed in several of the previously stayed class actions in November 2014. Motions to dismiss were filed in November 2014 and January 2015, respectively, and remain pending.
Separately, HSBC and other panel banks have also been named as defendants in a putative class action filed in the New York District Court on behalf of persons who transacted in euroyen futures and options contracts related to the euroyen Tokyo interbank offered rate (‘Tibor’). The complaint alleges, amongst other things, misconduct related to euroyen Tibor, although HSBC is not a member of the Japanese Bankers Association’s euroyen Tibor panel, as well as Japanese yen Libor, in violation of US antitrust laws, the CEA, and state law. In March 2014, the New York District Court issued an opinion dismissing the plaintiffs’ claims under US antitrust law and state law, but sustaining their claims under the CEA. In June 2014, the plaintiffs moved for leave to file a third amended complaint. HSBC has opposed that motion, which remains pending.
In November 2013, HSBC and other panel banks were also named as defendants in a putative class action filed in the New York District Court on behalf of persons who transacted in euro futures contracts and other financial instruments related to Euribor. The complaint alleges, amongst other things, misconduct related to Euribor in violation of US antitrust laws, the CEA and state law. The plaintiffs filed a second and later third amended complaint in May 2014 and October 2014, respectively. HSBC intends to respond to the third amended complaint once a court-ordered stay expires, currently set for May 2015.

HSBC HOLDINGS PLC
453
Str
ateg
ic R
epo
rt
Fi
nan
cial
Rev
iew
Co
rpo
rate
Go
vern
ance
Fin
anci
al S
tate
men
ts
S
har
eho
lder
Info
rmat
ion
In September and October 2014, HSBC Bank plc and other panel banks were named as defendants in a number of putative class actions that were filed and consolidated in the New York District Court on behalf of persons who transacted in interest rate derivative transactions or purchased or sold financial instruments that were either tied to USD ISDAfix rates or were executed shortly before, during, or after the time of the daily ISDAfix setting window. The complaint alleges, amongst other things, misconduct related to these activities in violation of US antitrust laws, the CEA and state law. In October 2014, the plaintiffs filed a consolidated amended complaint. A motion to dismiss that complaint was filed in December 2014 and remains pending. In February 2015, plaintiffs filed a second consolidated amended complaint replacing HSBC Bank plc with HSBC Bank USA.
Based on the facts currently known, it is not practicable at this time for HSBC to predict the resolution of these private lawsuits, including the timing or any possible impact on HSBC.
Foreign exchange rate investigations and litigation
Various regulators and competition and law enforcement authorities around the world, including in the UK, the US, the EU and elsewhere, are conducting investigations and reviews into a number of firms, including HSBC, related to trading on the foreign exchange markets.
In November 2014, HSBC Bank plc entered into regulatory settlements with the FCA and the US Commodity Futures Trading Commission (‘CFTC’) in connection with their respective investigations of HSBC’s trading and other conduct involving foreign exchange benchmark rates. Under the terms of those settlements, HSBC Bank plc agreed to pay a financial penalty of £216m (US$336m) to the FCA and a civil monetary penalty of US$275m to the CFTC, and to undertake various remedial actions.
In December 2014, the Hong Kong Monetary Authority (‘HKMA’) announced the completion of its investigation into the foreign exchange trading operations of The Hongkong and Shanghai Banking Corporation Limited (‘HBAP’). The investigation found no evidence of market manipulation by HBAP and no monetary penalty was imposed. HBAP was required to implement various remedial actions.
The remaining investigations and reviews in the UK, the US and elsewhere are ongoing. Based on the facts currently known there is a high degree of uncertainty as to the terms on which they will be resolved and the timing of such resolutions, including the amounts of fines and/or penalties, which could be significant. As at 31 December 2014, HSBC has recognised a provision in the amount of US$550m in respect of these matters.
In addition, in late 2013 and early 2014, HSBC Holdings, HSBC Bank plc, HNAH and HSBC Bank USA were named as defendants, amongst other banks, in various putative class actions filed in the New York District Court. In March 2014, the plaintiffs filed a consolidated amended complaint alleging, amongst other things, that defendants conspired to manipulate the WM/ Reuters foreign exchange benchmark rates by sharing customers’ confidential order flow information, thereby injuring plaintiffs and others by forcing them to pay artificial and non-competitive prices for products based on these foreign currency rates (‘the Consolidated Action’). Separate putative class actions were also brought on behalf of non-US plaintiffs (the ‘Foreign Actions’). Defendants moved to dismiss all actions. In January 2015, the court denied defendants’ motion to dismiss as to the Consolidated Action, but granted defendants’ motion to dismiss as to the Foreign Actions.
Based on the facts currently known, it is not practicable at this time for HSBC to predict the resolution of these private lawsuits, including the timing or any possible impact on HSBC.
Precious metals fix-related litigation and investigations
Since March 2014, numerous putative class actions have been filed in the US District Courts for the Southern District of New York, the District of New Jersey and the Northern District of California naming HSBC Bank USA, HSBC Bank plc, HSI and other members of The London Gold Market Fixing Limited as defendants. The complaints allege that, from January 2004 to the present, defendants conspired to manipulate the price of gold and gold derivatives during the afternoon London gold fix in order to reap profits on proprietary trades. These actions have been assigned to and consolidated in the New York District Court. An amended consolidated class action complaint was filed in December 2014, and HSBC’s response was filed in February 2015.
Since July 2014, putative class actions were filed in the US District Court for the Southern District of New York and the Eastern District of New York naming HSBC Holdings, HNAH, HSBC Bank USA, HSBC USA Inc. and other members of The London Silver Market Fixing Ltd as defendants. The complaints allege that, from January 2007 to the present, defendants conspired to manipulate the price of physical silver and silver derivatives for their collective benefit in violation of US antitrust laws and the CEA. These actions have been assigned to and consolidated in the New York District Court. An amended consolidated class action complaint was filed in January 2015, and HSBC’s response is due in March 2015.
Between late 2014 and early 2015, numerous putative class actions were filed in the New York District Court naming HSBC Bank USA and other members of The London Platinum and Palladium Fixing Company Limited as defendants. The complaints allege that, from January 2007 to the present, defendants conspired to manipulate the price of physical Platinum Group Metals (‘PGM’) and PGM-based financial products for their collective benefit in violation of US antitrust laws and the CEA.

Notes on the Financial Statements (continued) 40 – Legal proceedings and regulatory matters / 41 – Related party transactions
HSBC HOLDINGS PLC
454
In November 2014, the DoJ issued a document request to HSBC Holdings, seeking the voluntary production of certain documents relating to a criminal antitrust investigation that the DoJ is conducting in relation to precious metals. In January 2015, the CFTC issued a subpoena to HSBC Bank USA, seeking the production of certain documents related to HSBC Bank USA’s precious metals trading operations. HSBC is cooperating with the US authorities in their respective investigations.
These matters are at an early stage. Based on the facts currently known, it is not practicable at this time for HSBC to predict the resolution of these matters, including the timing or any possible impact on HSBC.
Credit default swap regulatory investigation and litigation
In July 2013, HSBC received a Statement of Objections from the Commission relating to its ongoing investigation of alleged anti-competitive activity by a number of market participants in the credit derivatives market between 2006 and 2009. The Statement of Objections sets out the Commission’s preliminary views and does not prejudge the final outcome of its investigation. HSBC has submitted a response and attended an oral hearing in May 2014. Following the oral hearing, the Commission decided to conduct a further investigation phase before deciding whether or how to proceed with the case. HSBC is cooperating with this further investigation. Based on the facts currently known, it is not practicable at this time for HSBC to predict the resolution of this matter, including the timing or any possible impact on HSBC.
In addition, HSBC Bank USA, HSBC Holdings and HSBC Bank plc have been named as defendants, amongst others, in numerous putative class actions filed in the New York District Court and the Illinois District Court. These class actions allege that the defendants, which include ISDA, Markit and several other financial institutions, conspired to restrain trade in violation of US antitrust laws by, amongst other things, restricting access to credit default swap pricing exchanges and blocking new entrants into the exchange market, with the purpose and effect of artificially inflating the bid/ask spread paid to buy and sell credit default swaps in the US. The plaintiffs in these suits purport to represent a class of all persons who purchased credit default swaps from or sold credit default swaps to defendants primarily in the US.
In October 2013, these cases were consolidated in the New York District Court. An amended consolidated complaint was filed in January 2014, naming HSBC Bank USA and HSBC Bank plc as defendants, amongst other non-HSBC defendants. Following the filing of defendants’ initial motions to dismiss in March 2014, plaintiffs filed a second amended consolidated complaint, which defendants also moved to dismiss. In September 2014, the court granted in part and denied in part the defendants’ motion to dismiss. Discovery is in process.
Based on the facts currently known, it is not practicable at this time for HSBC to predict the resolution of these private lawsuits, including the timing or any possible impact on HSBC.
Economic plans: HSBC Bank Brasil S.A.
In the mid-1980s and early 1990s, certain economic plans were introduced by the government of Brazil to reduce escalating inflation. The implementation of these plans adversely impacted savings account holders, thousands of which consequently commenced legal proceedings against financial institutions in Brazil, including HSBC Bank Brasil S.A. (‘HSBC Brazil’), alleging, amongst other things, that savings account balances were adjusted by a different price index than that contractually agreed, which caused them a loss of income. Certain of these cases have reached the Brazilian Supreme Court (the ‘Supreme Court’). The Supreme Court has suspended all cases pending before lower courts until it delivers a final judgement on the constitutionality of the changes resulting from the economic plans. It is anticipated that the outcome of the Supreme Court’s final judgement will set a precedent for all cases pending before the lower courts. Separately, the Brazilian Superior Civil Court (the ‘Superior Civil Court’) is considering matters relating to, amongst other things, contractual and punitive interest rates to be applied to calculate any loss of income.
There is a high degree of uncertainty as to the terms on which the proceedings in the Supreme Court and Superior Civil Court will be resolved and the timing of such resolutions, including the amount of losses that HSBC Brazil may be liable to pay in the event of an unfavourable judgement. Such losses may lie in a range from a relatively insignificant amount to an amount up to US$800m, although the upper end of this range is considered unlikely.
Regulatory Review of Consumer ‘Enhancement Services Products’
HSBC Finance, through its legacy Cards and Retail Services business, offered or participated in the marketing, distribution, or servicing of products, such as identity theft protection and credit monitoring products, that were ancillary to the provision of credit to the consumer. HSBC Finance ceased offering these products by May 2012. The offering and administration of these and other enhancement services products, such as debt protection products, has been the subject of enforcement actions against other institutions by regulators, including the Consumer Financial Protection Bureau, the OCC, and the Federal Deposit Insurance Corporation. Such enforcement actions have resulted in orders to pay restitution to customers and the assessment of penalties in substantial amounts. We have made restitution to certain customers in connection with certain enhancement services products, and we continue to cooperate with our regulators in connection with their ongoing review. In light of the actions that regulators have taken in relation to other non-HSBC credit card issuers regarding their enhancement services products, one or more regulators may order us to pay additional restitution to customers and/or impose civil money penalties or other relief arising from the prior offering and administration of such enhancement services products by HSBC Finance. There is a high degree of uncertainty as to the terms on which this

HSBC HOLDINGS PLC
455
Str
ateg
ic R
epo
rt
Fi
nan
cial
Rev
iew
Co
rpo
rate
Go
vern
ance
Fin
anci
al S
tate
men
ts
S
har
eho
lder
Info
rmat
ion
matter will be resolved and the timing of such resolution, including the amount of any additional remediation which may lie in a range from zero to an amount up to US$500m.
41 Related party transactions
Related parties of the Group and HSBC Holdings include subsidiaries, associates, joint ventures, post-employment benefit plans for HSBC employees, Key Management Personnel, close family members of Key Management Personnel and entities which are controlled or jointly controlled by Key Management Personnel or their close family members.
Key Management Personnel are defined as those persons having authority and responsibility for planning, directing and controlling the activities of HSBC Holdings, being the Directors and Group Managing Directors of HSBC Holdings.
Compensation of Key Management Personnel HSBC 2014 2013 2012 US$m US$m US$m
Short-term employee benefits 41 38 37 Post-employment benefits 1 2 1 Other long-term employee benefits 7 10 10 Share-based payments 54 35 43
Year ended 31 December 103 85 91
Transactions, arrangements and agreements involving related parties
Particulars of advances (loans and quasi-loans), credits and guarantees entered into by subsidiaries of HSBC Holdings during 2014 with Directors, disclosed pursuant to section 413 of the Companies Act 2006, are shown below:
2014 2013 US$m US$m
Advances and credits at 31 December 5 7
Particulars of transactions with related parties, disclosed pursuant to the requirements of IAS 24, are shown below. The disclosure of the year-end balance and the highest amounts outstanding during the year in the table below is considered to be the most meaningful information to represent the amount of the transactions and the amount of outstanding balances during the year.
2014 2013
Balance at 31 December
Highest amounts outstanding during year
Balance at 31 December
Highest amounts outstanding during year
US$m US$m US$m US$mKey Management Personnel1 Advances and credits 194 227 146 171Guarantees – – – 8
1 Includes Key Management Personnel, close family members of Key Management Personnel and entities which are controlled or jointly controlled by Key Management Personnel or their close family members.
Some of the transactions were connected transactions, as defined by the Rules Governing The Listing of Securities on The Stock Exchange of Hong Kong Limited but were exempt from any disclosure requirements under the provisions of those rules. The above transactions were made in the ordinary course of business and on substantially the same terms, including interest rates and security, as for comparable transactions with persons of a similar standing or, where applicable, with other employees. The transactions did not involve more than the normal risk of repayment or present other unfavourable features.
Shareholdings, options and other securities of Key Management Personnel
2014
(000s) 2013 (000s)
Number of options held over HSBC Holdings ordinary shares under employee share plans 28 225Number of HSBC Holdings ordinary shares held beneficially and non-beneficially 17,533 14,704Number of HSBC Bank 2.875% Notes 2015 held beneficially and non-beneficially 5 5
At 31 December 17,566 14,934
Transactions with other related parties of HSBC
Associates and joint ventures
The Group provides certain banking and financial services to associates and joint ventures, including loans, overdrafts, interest and non-interest bearing deposits and current accounts. Details of the interests in associates and joint ventures

Notes on the Financial Statements (continued) 41 – Related party transactions / 42 – Events after the balance sheet date
HSBC HOLDINGS PLC
456
are given in Note 20. Transactions and balances during the year with associates and joint ventures were as follows:
2014 2013
Highest balance during the year1
Balance at 31 December1
Highest balance during the year1
Balance at 31 December1
US$m US$m US$m US$mAmounts due from joint ventures:
– subordinated – – 1 –– unsubordinated 205 205 300 300
Amounts due from associates: – subordinated 58 – – –– unsubordinated 5,451 4,273 4,884 4,084
At 31 December 5,714 4,478 5,185 4,384 Amounts due to joint ventures – – 7 7 Amounts due to associates 650 162 1,178 290
At 31 December 650 162 1,185 297 Commitments 17 – 70 17
1 The disclosure of the year-end balance and the highest balance during the year is considered the most meaningful information to represent transactions during the year.
The above outstanding balances arose from the ordinary course of business and on substantially the same terms, including interest rates and security, as for comparable transactions with third-party counterparties.
Post-employment benefit plans
At 31 December 2014, US$4.5bn (2013: US$5.2bn) of HSBC post-employment benefit plan assets were under management by HSBC companies. Fees of US$12m (2013: US$23m) were earned by HSBC companies for these management services provided to its post-employment benefit plans. HSBC’s post-employment benefit plans had placed deposits of US$223m (2013: US$620m) with its banking subsidiaries, on which interest payable to the schemes amounted to US$6m (2013: US$1m). The above outstanding balances arose from the ordinary course of business and on substantially the same terms, including interest rates and security, as for comparable transactions with third-party counterparties.
HSBC Bank (UK) Pension Scheme entered into swap transactions with HSBC as part of the management of the inflation and interest rate sensitivity of its liabilities. At 31 December 2014, the gross notional value of the swaps was US$24bn (2013: US$38bn), the swaps had a positive fair value of US$0.9bn (2013: positive fair value of US$2.8bn) to the scheme and HSBC had delivered collateral of US$2.0bn (2013: US$3.8bn) to the scheme in respect of these swaps, on which HSBC earned US$5m of interest (2013: US$33m). All swaps were executed at prevailing market rates and within standard market bid/offer spreads. Over the year, the Scheme reduced its level of swap transactions with HSBC.
The International Staff Retirement Benefit Scheme entered into swap transactions with HSBC to manage the inflation and interest rate sensitivity of the liabilities and selected assets. At 31 December 2014, the gross notional value of the swaps was US$1.9bn (2013: US$1.8bn) and the swaps had a net negative fair value of US$107m to the scheme (2013: US$399m positive). All swaps were executed at prevailing market rates and within standard market bid/offer spreads.
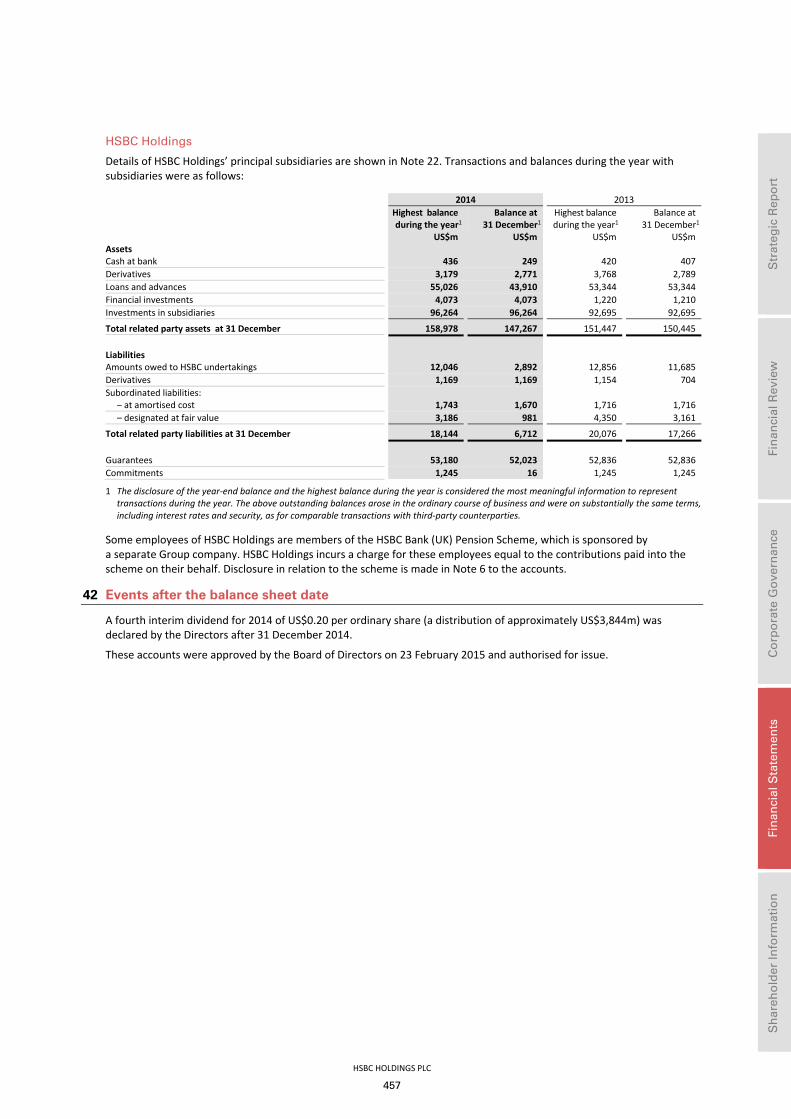
HSBC HOLDINGS PLC
457
Str
ateg
ic R
epo
rt
Fi
nan
cial
Rev
iew
Co
rpo
rate
Go
vern
ance
Fin
anci
al S
tate
men
ts
S
har
eho
lder
Info
rmat
ion
HSBC Holdings
Details of HSBC Holdings’ principal subsidiaries are shown in Note 22. Transactions and balances during the year with subsidiaries were as follows:
2014 2013
Highest balance
during the year1Balance at
31 December1Highest balance during the year1
Balance at 31 December1
US$m US$m US$m US$mAssets Cash at bank 436 249 420 407 Derivatives 3,179 2,771 3,768 2,789 Loans and advances 55,026 43,910 53,344 53,344 Financial investments 4,073 4,073 1,220 1,210 Investments in subsidiaries 96,264 96,264 92,695 92,695
Total related party assets at 31 December 158,978 147,267 151,447 150,445 Liabilities Amounts owed to HSBC undertakings 12,046 2,892 12,856 11,685 Derivatives 1,169 1,169 1,154 704 Subordinated liabilities:
– at amortised cost 1,743 1,670 1,716 1,716 – designated at fair value 3,186 981 4,350 3,161
Total related party liabilities at 31 December 18,144 6,712 20,076 17,266 Guarantees 53,180 52,023 52,836 52,836 Commitments 1,245 16 1,245 1,245
1 The disclosure of the year-end balance and the highest balance during the year is considered the most meaningful information to represent transactions during the year. The above outstanding balances arose in the ordinary course of business and were on substantially the same terms, including interest rates and security, as for comparable transactions with third-party counterparties.
Some employees of HSBC Holdings are members of the HSBC Bank (UK) Pension Scheme, which is sponsored by a separate Group company. HSBC Holdings incurs a charge for these employees equal to the contributions paid into the scheme on their behalf. Disclosure in relation to the scheme is made in Note 6 to the accounts.
42 Events after the balance sheet date
A fourth interim dividend for 2014 of US$0.20 per ordinary share (a distribution of approximately US$3,844m) was declared by the Directors after 31 December 2014.
These accounts were approved by the Board of Directors on 23 February 2015 and authorised for issue.

Shareholder information Interim dividends / Shareholder profile / 2014 AGM
HSBC HOLDINGS PLC
458
Shareholder information
Fourth interim dividend for 2014 458
Interim dividends for 2015 458
Shareholder profile 458
2014 Annual General Meeting 459
Interim Management Statements and Interim Results 459
Shareholder enquiries and communications 460
Stock symbols 461
Investor relations 461
Where more information about HSBC is available 461
Simplified structure chart 462
Taxation of shares and dividends 463
Abbreviations 466
Glossary and Index 470
Fourth interim dividend for 2014 The Directors have declared a fourth interim dividend for 2014 of US$0.20 per ordinary share. Information on the scrip dividend scheme and currencies in which shareholders may elect to have the cash dividend paid will be sent to shareholders on or about 20 March 2015. The timetable for the dividend is: Announcement 23 February 2015ADSs quoted ex-dividend in New York 4 March 2015Shares quoted ex-dividend in London, Hong Kong, Paris and Bermuda 5 March 2015Record date – London, Hong Kong, New York, Paris, Bermuda1 6 March 2015Mailing of Annual Report and Accounts 2014 and/or Strategic Report 2014, Notice of Annual General Meeting and dividend
documentation 20 March 2015 Final date for receipt by registrars of forms of election, Investor Centre electronic instructions and revocations of standing
instructions for scrip dividends 16 April 2015 Exchange rate determined for payment of dividends in sterling and Hong Kong dollars 20 April 2015Payment date: dividend warrants, new share certificates or transaction advices and notional tax vouchers mailed and
shares credited to stock accounts in CREST 30 April 2015
1 Removals to and from the Overseas Branch register of shareholders in Hong Kong will not be permitted on this date.
Interim dividends for 2015 The Board has adopted a policy of paying quarterly interim dividends on the ordinary shares. Under this policy it is intended to have a pattern of three equal interim dividends with a variable fourth interim dividend. It is envisaged that the first interim dividend in respect of 2015 will be US$0.10 per ordinary share.
Dividends are declared in US dollars and, at the election of the shareholder, paid in cash in one of, or in a combination of, US dollars, sterling and Hong Kong dollars, or, subject to the Board’s determination that a scrip dividend is to be offered in respect of that dividend, may be satisfied in whole or in part by the issue of new shares in lieu of a cash dividend.
Shareholder profile At 31 December 2014 the share register recorded the following details:
Number of
shareholders Total ordinary
shares held
1 - 100 37,254 1,086,273101 - 400 28,970 7,109,335401 - 500 7,269 3,294,206501 - 1,000 30,675 22,589,4471,001 - 5,000 70,515 166,806,8645,001 - 10,000 18,455 130,271,17410,001 - 20,000 10,964 152,651,12620,001 - 50,000 6,616 203,096,92350,001 - 200,000 3,229 296,665,889200,001 - 500,000 713 223,855,824500,001 and above 1,092 18,010,447,199
Total 215,752 19,217,874,260

HSBC HOLDINGS PLC
459
Str
ateg
ic R
epo
rt
Fi
nan
cial
Rev
iew
Co
rpo
rate
Go
vern
ance
Fin
anci
al S
tate
men
ts
S
har
eho
lder
Info
rmat
ion
2014 Annual General Meeting All resolutions considered at the 2014 Annual General Meeting held at 11.00am on 23 May 2014 at The Barbican Centre, London EC2 were passed on a poll as follows: VotesResolution For1 % Against % Total %2 Withheld3
1 To receive the Annual Report and Accounts 2013
9,757,667,883 98.77 121,991,215 1.23 9,879,659,098 51.81 67,631,467
2 To approve the Directors’ remuneration policy
7,762,051,505 79.35 2,019,902,686 20.65 9,781,954,191 51.29 167,509,544
3 To approve the Directors’Remuneration Report
8,180,579,271 83.95 1,563,541,883 16.05 9,744,121,154 51.10 205,528,859
4 To approve the variable pay cap 9,722,737,304 98.01 197,867,631 1.99 9,920,604,935 52.06 29,824,3655 To elect or re-elect the following
as Directors:
(a) Kathleen Casey 9,919,351,912 99.90 9,703,995 0.10 9,929,055,907 52.07 22,579,886 (b) Safra Catz 9,907,586,080 99.79 21,027,161 0.21 9,928,613,241 52.06 22,549,669 (c) Laura Cha 9,780,982,617 99.65 34,767,318 0.35 9,815,749,935 51.47 134,402,361 (d) Marvin Cheung 9,896,844,476 99.68 32,093,388 0.32 9,928,937,864 52.07 22,444,096 (e) Sir Jonathan Evans
(now Lord Evans of Weardale) 9,919,562,434 99.90 9,445,023 0.10 9,929,007,457
52.07
22,647,584
(f) Joachim Faber 9,777,856,091 99.57 41,751,739 0.43 9,819,607,830 51.49 130,404,838 (g) Rona Fairhead 9,850,526,539 99.23 75,986,608 0.77 9,926,513,147 52.05 23,410,104 (h) Renato Fassbind 8,877,803,961 89.45 1,047,345,520 10.55 9,925,149,481 52.05 26,491,483 (i) Douglas Flint 9,648,640,713 97.44 253,257,525 2.56 9,901,898,238 51.92 49,764,237 (j) Stuart Gulliver 9,901,917,449 99.73 27,013,216 0.27 9,928,930,665 52.07 22,318,409 (k) Sam Laidlaw 9,905,841,880 99.76 23,398,827 0.24 9,929,240,707 52.07 22,425,383 (l) John Lipsky 9,916,726,269 99.88 11,952,583 0.12 9,928,678,852 52.06 22,478,974 (m) Rachel Lomax 9,907,427,658 99.78 21,476,877 0.22 9,928,904,535 52.07 22,307,009 (n) Iain Mackay 9,896,296,230 99.67 32,591,433 0.33 9,928,887,663 52.06 22,328,752 (o) Marc Moses 9,903,345,079 99.76 24,023,003 0.24 9,927,368,082 52.06 22,605,039 (p) Sir Simon Robertson 8,879,523,428 89.43 1,049,218,853 10.57 9,928,742,281 52.06 22,459,665 (q) Jonathan Symonds 9,909,069,564 99.80 19,845,278 0.20 9,928,914,842 52.07 22,747,741
6 To reappoint KPMG Audit Plc as auditor to the Company
9,858,281,428 99.29 70,691,207 0.71 9,928,972,635 52.07 22,181,297
7 To authorise the Group Audit Committee to determine the auditor’s remuneration
9,899,311,128 99.70 30,047,667 0.30 9,929,358,795 52.07 22,178,082 8 To authorise the Directors to allot
shares
8,960,671,117 90.89 898,368,702 9.11 9,859,039,819 51.70 92,477,179 9 To disapply pre-emption rights 9,782,952,816 98.97 101,914,263 1.03 9,884,867,079 51.83 66,129,918
10 To authorise the Directors to allot repurchased shares
9,397,626,368 95.18 475,964,720 4.82 9,873,591,088 51.77 77,459,228
11 To authorise the Company to purchase its own ordinary shares
9,785,002,326 99.58 41,076,933 0.42 9,826,079,259 51.53 123,932,000
12 To authorise the Directors to allot equity securities in relation to Contingent Convertible Securities
9,558,599,010 97.49 246,293,361 2.51 9,804,892,371 51.41 142,376,638 13 To disapply pre-emption rights in
relation to the issue of Contingent Convertible Securities
8,915,406,730 89.85 1,007,452,174 10.15 9,922,858,904 52.03 25,542,467 14 To approve general meetings (other
than annual general meetings) being called on a minimum of 14 clear days’ notice
8,798,744,951 88.64 1,127,707,377 11.36 9,926,452,328 52.05 23,437,179
1 Includes discretionary votes. 2 Percentage of Issued Share Capital voted. 3 A ‘vote withheld’ is not a vote in law and is not counted in the calculation of the votes ‘For’ and ‘Against’ the resolution.
Interim Management Statements and Interim Results Interim Management Statements are expected to be issued on or around 5 May 2015 and 2 November 2015. The Interim Results for the six months to 30 June 2015 are expected to be issued on 3 August 2015.

Shareholder information (continued) Shareholder enquiries / Stock symbols / Investor relations / Information on HSBC
HSBC HOLDINGS PLC
460
Shareholder enquiries and communications Enquiries
Any enquiries relating to shareholdings on the share register, for example transfers of shares, change of name or address, lost share certificates or dividend cheques, should be sent to the Registrars at the address given below. The Registrars offer an online facility, Investor Centre, which enables shareholders to manage their shareholding electronically. Principal Register: Hong Kong Overseas Branch Register: Bermuda Overseas Branch Register:
Computershare Investor Services PLC The Pavilions Bridgwater Road Bristol BS99 6ZZ United Kingdom Telephone: 44 (0) 870 702 0137 Email via website: www.investorcentre.co.uk/contactus
Computershare Hong Kong Investor Services Limited Rooms 1712-1716, 17th Floor Hopewell Centre 183 Queen’s Road East Hong Kong Telephone: 852 2862 8555 Email: [email protected]
Investors Relations Team HSBC Bank Bermuda Limited 6 Front Street Hamilton HM 11 Bermuda Telephone: 1 441 299 6737 Email: [email protected]
Investor Centre: www.investorcentre.co.uk
Investor Centre:www.investorcentre.com/hk
Investor Centre: www.investorcentre.com/bm
Any enquiries relating to ADSs should be sent to the depositary: The Bank of New York Mellon Depositary Receipts PO Box 43006 Providence, RI 02940-3006 USA Telephone (US): 1 877 283 5786 Telephone (International): 1 201 680 6825 Email: [email protected] Website: www.bnymellon.com/shareowner
Any enquiries relating to shares held through Euroclear France, the settlement and central depositary system for NYSE Euronext Paris, should be sent to the paying agent: HSBC France 103, avenue des Champs Elysées 75419 Paris Cedex 08 France Telephone: 33 1 40 70 22 56 Email: [email protected] Website: www.hsbc.fr
If you have been nominated to receive general shareholder communications directly from HSBC Holdings, it is important to remember that your main contact for all matters relating to your investment remains the registered shareholder, or perhaps custodian or broker, who administers the investment on your behalf. Therefore any changes or queries relating to your personal details and holding (including any administration thereof) must continue to be directed to your existing contact at your investment manager or custodian. HSBC Holdings cannot guarantee dealing with matters directed to it in error.
Further copies of this Annual Report and Accounts 2014 may be obtained by writing to the following departments: For those in Europe, the Middle East and Africa:
For those in Asia-Pacific: For those in the Americas:
Global Communications HSBC Holdings plc 8 Canada Square London E14 5HQ United Kingdom
Communications (Asia)The Hongkong and Shanghai Banking Corporation Limited 1 Queen’s Road Central Hong Kong
Global Publishing Services HSBC – North America SC1 Level, 452 Fifth Avenue New York, NY 10018 USA

HSBC HOLDINGS PLC
461
Str
ateg
ic R
epo
rt
Fi
nan
cial
Rev
iew
Co
rpo
rate
Go
vern
ance
Fin
anci
al S
tate
men
ts
S
har
eho
lder
Info
rmat
ion
Electronic communications
Shareholders may at any time choose to receive corporate communications in printed form or to receive notifications of their availability on HSBC’s website. To receive future notifications of the availability of a corporate communication on HSBC’s website by email, or revoke or amend an instruction to receive such notifications by email, go to www.hsbc.com/ecomms. If you provide an email address to receive electronic communications from HSBC, we will also send notifications of your dividend entitlements by email. If you received a notification of the availability of this document on HSBC’s website and would like to receive a printed copy or, if you would like to receive future corporate communications in printed form, please write or send an email (quoting your shareholder reference number) to the appropriate Registrars at the address given above. Printed copies will be provided without charge.
Chinese translation
A Chinese translation of this Annual Report and Accounts 2014 is available upon request after 20 March 2015 from the Registrars: Computershare Hong Kong Investor Services LimitedRooms 1712-1716, 17th Floor Hopewell Centre 183 Queen’s Road East Hong Kong
Computershare Investor Services PLC The Pavilions Bridgwater Road Bristol BS99 6ZZ United Kingdom
Please also contact the Registrars if you wish to receive Chinese translations of future documents or if you have received a Chinese translation of this document and do not wish to receive such translations in future.
Stock symbols HSBC Holdings ordinary shares trade under the following stock symbols:
London Stock Exchange HSBA Euronext Paris HSB Hong Kong Stock Exchange 5 Bermuda Stock Exchange HSBC.BH New York Stock Exchange (ADS) HSBC
Investor relations Enquiries relating to HSBC’s strategy or operations may be directed to: Senior Manager Investor Relations HSBC Holdings plc 8 Canada Square London E14 5HQ United Kingdom
SVP Investor RelationsHSBC North America Holdings Inc. 26525 N Riverwoods Boulevard, Suite 100 Mettawa, Illinois 60045 USA
Head of Investor Relations, Asia The Hongkong and Shanghai Banking Corporation Limited 1 Queen’s Road Central Hong Kong
Telephone: 44 (0) 20 7991 3643 1 224 880 8008 852 2822 4908 Email: [email protected] [email protected] [email protected]
Where more information about HSBC is available This Annual Report and Accounts 2014, and other information on HSBC, may be viewed on HSBC’s website: www.hsbc.com.
Reports, statements and information that HSBC Holdings files with the Securities and Exchange Commission are available at www.sec.gov. Investors can also request hard copies of these documents upon payment of a duplicating fee by writing to the SEC at the Office of Investor Education and Advocacy, 100 F Street N.E., Washington, DC 20549-0123 or by emailing [email protected]. Investors should call the Commission at (202) 551 8090 if they require further assistance. Investors may also obtain the reports and other information that HSBC Holdings files at www.nyse.com (telephone number (1) 212 656 3000).
HM Treasury has transposed the requirements set out under CRD IV and issued the Capital Requirements Country-by-Country Reporting Regulations 2013, effective 1 January 2014. The legislation will require HSBC Holdings to publish additional information, in respect of the year ended 31 December 2014, by 31 December 2015. This information will be available at the time on HSBC’s website: www.hsbc.com.

Shareholder information Organisation chart / Taxation of shares and dividends
HSBC HOLDINGS PLC
462
99.9
9%
Sim
plifi
ed S
truc
ture
Cha
rt o
f HSB
C H
oldi
ngs
plc
80.6
5%
99.9
9%
94.5
3%
62.1
4%
The
Hon
gkon
g an
dSh
angh
ai B
anki
ngC
orpo
ratio
n Li
mite
d
Han
g S
eng
Bank
Lim
ited
HS
BC B
ank
Egy
pt
S.A.
E.H
SBC
Asi
a H
oldi
ngs
(UK
) Ltd
HSB
C B
ank
Mid
dle
East
Ltd
HS
BC B
ank
Mal
aysi
a Be
rhad
HS
BC H
oldi
ngs
BV
HSB
C F
inan
ce
(Net
herla
nds)
HS
BC B
ank
Arge
ntin
a S.
A.
HSB
C B
ank
Bras
il S.
A. -
Banc
o M
últip
lo
HS
BC L
atin
Am
eric
a H
oldi
ngs
(UK)
Lim
ited
HSB
C O
vers
eas
Hol
ding
s (U
K) L
td
HSB
C F
inan
ce
Cor
pora
tion
HS
BC B
ank
Aus
tralia
Ltd
HSB
C
Inve
stm
ents
(N
orth
Am
eric
a)
Inc.
HSB
C N
orth
A
mer
ica
Hol
ding
s In
c.
HSB
C B
ank
plc
HSB
C P
rivat
e B
anki
ng H
oldi
ngs
(Sui
sse)
S.A
.
HSB
C G
erm
any
Hol
ding
s G
mbH
HSB
C T
rinka
us &
B
urkh
ardt
AG
HS
BC A
sset
Fi
nanc
e (U
K) L
td
HSB
C B
ank
A.S
.
HS
BC F
ranc
e
HS
BC B
ank
Can
ada
HSB
C B
ank
USA
, N
.A.
HSB
C H
oldi
ngs
plc
HSB
C S
ecur
ities
(U
SA)
Inc.
HSB
C M
éxic
o S
.A.,
Inst
ituci
ón
de B
anca
M
últip
le, G
rupo
Fi
nanc
iero
HSB
C
HS
BC B
ank
(Chi
na) C
ompa
ny
Lim
ited
HS
BC A
sia
Hol
ding
s BV
HSB
C M
iddl
e E
ast H
oldi
ngs
BV
HSB
C L
ife
(Inte
rnat
iona
l) Lt
dH
SBC
Ban
k (T
aiw
an) L
imite
dH
SBC
Ban
k (V
ietn
am) L
imite
d
99.9
9%
•Th
is sim
plifi
ed G
roup
stru
ctur
e of
prin
cipa
l sub
sidia
ries i
s at 3
1 De
cem
ber 2
014.
•
Not
all
inte
rmed
iate
hol
ding
com
pani
es a
re sh
own.
•
Unl
ess s
how
n ot
herw
ise, a
ll su
bsid
iarie
s are
who
lly o
wne
d.

HSBC HOLDINGS PLC
463
Str
ateg
ic R
epo
rt
Fi
nan
cial
Rev
iew
Co
rpo
rate
Go
vern
ance
Fin
anci
al S
tate
men
ts
S
har
eho
lder
Info
rmat
ion
Taxation of shares and dividends Taxation – UK residents
The following is a summary, under current law, of certain UK tax considerations that are likely to be material to the ownership and disposition of HSBC Holdings ordinary shares. The summary does not purport to be a comprehensive description of all the tax considerations that may be relevant to a holder of shares. In particular, the summary deals principally with shareholders who are resident solely in the UK for UK tax purposes and only with holders who hold the shares as investments and who are the beneficial owners of the shares, and does not address the tax treatment of certain classes of holders such as dealers in securities. Holders and prospective purchasers should consult their own advisers regarding the tax consequences of an investment in shares in light of their particular circumstances, including the effect of any national, state or local laws.
Taxation of dividends
Currently no tax is withheld from dividends paid by HSBC Holdings. However, dividends are paid with an associated tax credit which is available for set-off by certain shareholders against any liability they may have to UK income tax. Currently, the associated tax credit is equivalent to 10% of the combined cash dividend and tax credit, i.e. one-ninth of the cash dividend.
For individual shareholders who are resident in the UK for taxation purposes and liable to UK income tax at the basic rate, no further UK income tax liability arises on the receipt of a dividend from HSBC Holdings. Individual shareholders who are liable to UK income tax at the higher rate or additional rate are taxed on the combined amount of the dividend and the tax credit at the dividend upper rate (currently 32.5%) and the dividend additional rate (currently 37.5%), respectively. The tax credit is available for set-off against the dividend upper rate and the dividend additional rate liability. Individual UK resident shareholders are not entitled to any tax credit repayment.
Although non-UK resident shareholders are generally not entitled to any repayment of the tax credit in respect of any UK dividend received, some such shareholders may be so entitled under the provisions of a double taxation agreement between their country of residence and the UK. However, in most cases no amount of the tax credit is, in practice, repayable.
Information on the taxation consequences of the HSBC Holdings scrip dividends offered in lieu of the 2013 fourth interim dividend and the first, second and third interim dividends for 2014 was set out in the Secretary’s letters to shareholders of 25 March, 5 June, 3 September and 5 November 2014. In no case was the difference between the cash dividend foregone and the market value of the scrip dividend in excess of 15% of the market value. Accordingly, the amount of the dividend
income chargeable to tax, and, the acquisition price of the HSBC Holdings ordinary shares for UK capital gains tax purposes, was the cash dividend foregone.
Taxation of capital gains
The computation of the capital gains tax liability arising on disposals of shares in HSBC Holdings by shareholders subject to UK tax on capital gains can be complex, partly depending on whether, for example, the shares were purchased since April 1991, acquired in 1991 in exchange for shares in The Hongkong and Shanghai Banking Corporation Limited, or acquired subsequent to 1991 in exchange for shares in other companies.
For capital gains tax purposes, the acquisition cost for ordinary shares is adjusted to take account of subsequent rights and capitalisation issues. Any capital gain arising on a disposal by a UK company may also be adjusted to take account of indexation allowance. If in doubt, shareholders are recommended to consult their professional advisers.
Stamp duty and stamp duty reserve tax
Transfers of shares by a written instrument of transfer generally will be subject to UK stamp duty at the rate of 0.5% of the consideration paid for the transfer, and such stamp duty is generally payable by the transferee.
An agreement to transfer shares, or any interest therein, normally will give rise to a charge to stamp duty reserve tax at the rate of 0.5% of the consideration. However, provided an instrument of transfer of the shares is executed pursuant to the agreement and duly stamped before the date on which the stamp duty reserve tax becomes payable, under the current practice of UK HM Revenue and Customs (‘HMRC’) it will not be necessary to pay the stamp duty reserve tax, nor to apply for such tax to be cancelled. Stamp duty reserve tax is generally payable by the transferee.
Paperless transfers of shares within CREST, the UK’s paperless share transfer system, are liable to stamp duty reserve tax at the rate of 0.5% of the consideration. In CREST transactions, the tax is calculated and payment made automatically. Deposits of shares into CREST generally will not be subject to stamp duty reserve tax, unless the transfer into CREST is itself for consideration. Following the case HSBC pursued before the European Court of Justice (Case C-569/07 HSBC Holdings plc and Vidacos Nominees Ltd v The Commissioners for HM Revenue & Customs) and a subsequent case in relation to depositary receipts, HMRC now accepts that the charge to stamp duty reserve tax at 1.5% on the issue of shares to a depositary receipt issuer or a clearance service is prohibited.
Taxation – US residents
The following is a summary, under current law, of the principal UK tax and US federal income tax considerations that are likely to be material to the ownership and disposition of shares or American

Shareholder information (continued) Taxation of shares and dividends
HSBC HOLDINGS PLC
464
Depositary Shares (‘ADS’s) by a holder that is a resident of the US for US federal income tax purposes (a ‘US holder’) and who is not resident in the UK for UK tax purposes.
The summary does not purport to be a comprehensive description of all of the tax considerations that may be relevant to a holder of shares or ADSs. In particular, the summary deals only with US holders that hold shares or ADSs as capital assets, and does not address the tax treatment of holders that are subject to special tax rules, such as banks, tax-exempt entities, insurance companies, dealers in securities or currencies, persons that hold shares or ADSs as part of an integrated investment (including a ‘straddle’) comprised of a share or ADS and one or more other positions, and persons that own, directly or indirectly, 10% or more of the voting stock of HSBC Holdings. This discussion is based on laws, treaties, judicial decisions and regulatory interpretations in effect on the date hereof, all of which are subject to change.
Holders and prospective purchasers should consult their own advisers regarding the tax consequences of an investment in shares or ADSs in light of their particular circumstances, including the effect of any national, state or local laws.
Any US federal tax advice included in this Annual Report and Accounts is for informational purposes only; it was not intended or written to be used, and cannot be used, for the purpose of avoiding US federal tax penalties.
Taxation of dividends
Currently no tax is withheld from dividends paid by HSBC Holdings. For US tax purposes, a US holder must include cash dividends paid on the shares or ADSs in ordinary income on the date that such holder or the ADS depositary receives them, translating dividends paid in UK pounds sterling into US dollars using the exchange rate in effect on the date of receipt. A US holder that elects to receive shares in lieu of a cash dividend must include in ordinary income the fair market value of such shares on the dividend payment date, and the tax basis of those shares will equal such fair market value.
Subject to certain exceptions for positions that are held for less than 61 days or are hedged, and subject to a foreign corporation being considered a ‘qualified foreign corporation’ (which includes not being classified for US federal income tax purposes as a passive foreign investment company), certain dividends (‘qualified dividends’) received by an individual US holder generally will be subject to US taxation at preferential rates. Based on the company’s audited financial statements and relevant market and shareholder data, HSBC Holdings does not anticipate being classified as a passive foreign investment company. Accordingly, dividends paid on the shares or ADSs generally should be treated as qualified dividends.
Taxation of capital gains
Gains realised by a US holder on the sale or other disposition of shares or ADSs normally will not be subject to UK taxation unless at the time of the sale or other disposition the holder carries on a trade, profession or vocation in the UK through a branch or agency or permanent establishment and the shares or ADSs are or have been used, held or acquired for the purposes of such trade, profession, vocation, branch or agency or permanent establishment. Such gains will be included in income for US tax purposes, and will be long-term capital gains if the shares or ADSs were held for more than one year. A long-term capital gain realised by an individual US holder generally will be subject to US tax at preferential rates.
Inheritance tax
Shares or ADSs held by an individual whose domicile is determined to be the US for the purposes of the United States-United Kingdom Double Taxation Convention relating to estate and gift taxes (the ‘Estate Tax Treaty’) and who is not for such purposes a national of the UK will not, provided any US federal estate or gift tax chargeable has been paid, be subject to UK inheritance tax on the individual’s death or on a lifetime transfer of shares or ADSs except in certain cases where the shares or ADSs (i) are comprised in a settlement (unless, at the time of the settlement, the settlor was domiciled in the US and was not a national of the UK), (ii) is part of the business property of a UK permanent establishment of an enterprise, or (iii) pertains to a UK fixed base of an individual used for the performance of independent personal services. In such cases, the Estate Tax Treaty generally provides a credit against US federal tax liability for the amount of any tax paid in the UK in a case where the shares or ADSs are subject to both UK inheritance tax and to US federal estate or gift tax.
Stamp duty and stamp duty reserve tax – ADSs
If shares are transferred to a clearance service or American Depositary Receipt (‘ADR’) issuer (which will include a transfer of shares to the Depositary) under the current HMRC practice UK stamp duty and/or stamp duty reserve tax will be payable. The stamp duty or stamp duty reserve tax is generally payable on the consideration for the transfer and is payable at the aggregate rate of 1.5%.
The amount of stamp duty reserve tax payable on such a transfer will be reduced by any stamp duty paid in connection with the same transfer.
No stamp duty will be payable on the transfer of, or agreement to transfer, an ADS, provided that the ADR and any separate instrument of transfer or written agreement to transfer remain at all times outside the UK, and provided further that any such transfer or written agreement to transfer is not executed in the UK. No stamp duty reserve tax will be payable on a transfer of, or agreement to transfer, an ADS effected by the transfer of an ADR.

HSBC HOLDINGS PLC
465
Str
ateg
ic R
epo
rt
Fi
nan
cial
Rev
iew
Co
rpo
rate
Go
vern
ance
Fin
anci
al S
tate
men
ts
S
har
eho
lder
Info
rmat
ion
US backup withholding tax and information reporting
Distributions made on shares or ADSs and proceeds from the sale of shares or ADSs that are paid within the US, or through certain financial intermediaries to US holders, are subject to information reporting and may be subject to a US ‘backup’ withholding tax unless, in general, the US holder complies with certain certification procedures or is a corporation or other person exempt from such
withholding. Holders that are not US persons generally are not subject to information reporting or backup withholding tax, but may be required to comply with applicable certification procedures to establish that they are not US persons in order to avoid the application of such information reporting requirements or backup withholding tax to payments received within the US or through certain financial intermediaries.

Shareholder information (continued) Abbreviations
HSBC HOLDINGS PLC
466
Abbreviations Abbreviation Brief description
A A$ Australian dollar ABCP Asset-backed commercial paperABS1 Asset-backed securityACF Advances to core fundingADR American Depositary ReceiptADS American Depositary ShareAED United Arab Emirates dirhamAIEA Average interest-earning assetsALCM Asset, Liability and Capital ManagementALCO Asset and Liability Management CommitteeAML Anti-money launderingARM1 Adjustable-rate mortgageARS Argentine peso
B Basel Committee Basel Committee on Banking SupervisionBasel II1 2006 Basel Capital AccordBasel III1 Basel Committee’s reforms to strengthen global capital and liquidity rules BBA British Bankers’ AssociationBoCom Bank of Communications Co., Limited, one of China’s largest banks Bps1 Basis points. One basis point is equal to one-hundredth of a percentage point BRRD1 Bank Recovery and Resolution Directive (EU)BRL Brazilian real BSA Bank Secrecy Act (US)BSM Balance Sheet Management
C C$ Canadian dollar CAPM Capital Asset Pricing ModelCCA Consumer Credit Act (UK)CCB1 Capital conservation bufferCCR1 Counterparty credit riskCCyB1 Countercyclical capital buffer CD Certificate of depositCDO1 Collateralised debt obligationCDS1 Credit default swapCET11 Common equity tier 1CGU Cash-generating unitCHF Swiss franc CMB Commercial Banking, a global businessCML1 Consumer and Mortgage Lending (US)CNY Chinese yuan COSO 2013 Committee of the Sponsors of the Treadway Commission (US)CP1 Commercial paperCPB1 Capital planning bufferCPI Consumer price indexCRD1 Capital Requirements DirectiveCRR1 Customer risk ratingCRR/CRD IV Capital Requirements Regulation and DirectiveCRS Card and Retail ServicesCVA1 Credit valuation adjustment
D DANY DPA Two-year deferred prosecution agreement with the New York County District Attorney (US) Dodd-Frank Dodd-Frank Wall Street Reform and Consumer Protection Act (US)DoJ Department of Justice (US)DPA Deferred Prosecution Agreement (US) DPF Discretionary participation feature of insurance and investment contracts DVA1 Debit valuation adjustment

HSBC HOLDINGS PLC
467
Str
ateg
ic R
epo
rt
Fi
nan
cial
Rev
iew
Co
rpo
rate
Go
vern
ance
Fin
anci
al S
tate
men
ts
S
har
eho
lder
Info
rmat
ion
Abbreviation Brief description
E EAD1 Exposure at defaultEBA European Banking AuthorityECB European Central BankEDTF Enhanced Disclosure Task ForceEGP Egyptian pound EL1 Expected loss EMIR European Market Infrastructure Regulation (EU)EU European Union Euribor European Interbank Offered Rate
F Fannie Mae Federal National Mortgage Association (US)FCA Financial Conduct Authority (UK)FCA Direction Undertaking originally with the FSA to comply with certain forward-looking obligations with respect to
AML and sanctions requirements FFVA Funding fair value adjustment estimation methodology on derivative contracts First Direct A division of HSBC Bank plcFPC Financial Policy Committee (UK)FRB Federal Reserve Board (US)Freddie Mac Federal Home Loan Mortgage Corporation (US)FSA Financial Services Authority (UK)FSB Financial Stability BoardFSC Forest Stewardship CouncilFSVC Financial System Vulnerabilities CommitteeFTE Full-time equivalent staffFTSE Financial Times – Stock Exchange indexFuM Funds under management
G GAAP Generally accepted accounting principlesGAC Group Audit CommitteeGB&M Global Banking and Markets, a global businessGDP Gross domestic productGENPRU PRA’s rules, as set out in the General Prudential SourcebookGLBA Gramm-Leach-Bliley Act (US)GMB Group Management BoardGPB Global Private Banking, a global businessGPSP Group Performance Share PlanGRC Group Risk CommitteeGroup HSBC Holdings together with its subsidiary undertakingsG-SIB1 Global systemically important bankG-SII Global systemically important institution
H Hang Seng Bank Hang Seng Bank Limited, one of Hong Kong’s largest banksHK$ Hong Kong dollar HNAH HSBC North America Holdings Inc. Hong Kong Hong Kong Special Administrative Region of the People’s Republic of China HSBC HSBC Holdings together with its subsidiary undertakingsHSBC Bank HSBC Bank plc HSBC Bank Middle East HSBC Bank Middle East LimitedHSBC Bank USA HSBC Bank USA, N.A., HSBC’s retail bank in the USHSBC Canada The sub-group, HSBC Bank Canada, HSBC Trust Company Canada, HSBC Mortgage Corporation Canada
and HSBC Securities Canada, consolidated for liquidity purposes HSBC Finance HSBC Finance Corporation, the US consumer finance company (formerly Household International, Inc.)HSBC France HSBC’s French banking subsidiary, formerly CCF S.A.HSBC Holdings HSBC Holdings plc, the parent company of HSBC

Shareholder information (continued) Abbreviations
HSBC HOLDINGS PLC
468
Abbreviation Brief description
HSBC Premier HSBC’s premium personal global banking serviceHSBC Private Bank (Suisse) HSBC Private Bank (Suisse) SA, HSBC’s private bank in SwitzerlandHSBC USA The sub-group, HSBC USA Inc (the holding company of HSBC Bank USA) and HSBC Bank USA,
consolidated for liquidity purposes HSI HSBC Securities (USA) Inc.HSSL HSBC Securities Services (Luxembourg)
I IAS International Accounting StandardsIASB International Accounting Standards BoardICB Independent Commission on Banking (UK)IFRSs International Financial Reporting StandardsIndustrial Bank Industrial Bank Co. Limited, a national joint-stock bank in mainland China in which Hang Seng Bank
Limited has a shareholding IRB1 Internal ratings-basedISDA International Swaps and Derivatives Association
K KPMG KPMG Audit Plc and its affiliates
L LCR Liquidity coverage ratioLFRF Liquidity and funding risk management frameworkLGD1 Loss given default Libor London Interbank Offer RateLIC Loan impairment charge and other credit risk provisionLMU Loan Management Unit, part of Wholesale Credit and Market RiskLTV1 Loan-to-value ratio
M Madoff Securities Bernard L Madoff Investment Securities LLCMainland China People’s Republic of China excluding Hong KongMarkets HSBC’s treasury and capital markets services in Global Banking and Markets Mazarin Mazarin Funding Limited, an asset-backed CP conduitMBS US mortgage-backed securityMENA Middle East and North AfricaMME Mid-market enterpriseMonoline1 Monoline insurance companyMSCI Morgan Stanley Capital International indexMTN Medium-term notesMXN Mexican peso
N NII Net interest incomeNSFR Net stable funding ratioNYSE New York Stock Exchange
O OCC Office of the Comptroller of the Currency (US)OIS Overnight index swapORMF Operational risk management frameworkOTC1 Over-the-counter
P PD1 Probability of defaultPEFC Programme for the Endorsement of Forest CertificationPerformance Shares1 Awards of HSBC Holdings ordinary shares under employee share plans that are subject to corporate
performance conditions Ping An Ping An Insurance (Group) Company of China, Ltd, the second-largest life insurer in the PRC PPI Payment protection insurance productPRA Prudential Regulation Authority (UK)

HSBC HOLDINGS PLC
469
Str
ateg
ic R
epo
rt
Fi
nan
cial
Rev
iew
Co
rpo
rate
Go
vern
ance
Fin
anci
al S
tate
men
ts
S
har
eho
lder
Info
rmat
ion
Abbreviation Brief description
PRC People’s Republic of ChinaPremier HSBC Premier, HSBC’s premium personal global banking servicePVIF Present value of in-force long-term insurance business and long-term investment contracts with DPFPwC PricewaterhouseCoopers LLP and its network of firms
Q QIS Quantitative Impact Study
R RBWM Retail Banking and Wealth Management, a global businessRepo1 Sale and repurchase transactionRestricted Shares Awards of Restricted Shares define the number of HSBC Holdings ordinary shares to which the employee
will become entitled, generally between one and three years from the date of the award, and normally subject to the individual remaining in employment
Reverse repo Security purchased under commitments to sellRisk Management Meeting A meeting of the Group Management Board providing oversight of enterprise-wide management of all
risks RM Malaysian ringgit RMB Renminbi RMBS Residential mortgage-backed securitiesRMs Relationship managersRNIV Risk not in Var RoRWA Return on average risk-weighted assetsROTE Return on tangible equityRPI Retail price index (UK)RSPO Roundtable on Sustainable Palm OilRTS Regulatory Technical Standards RWA1 Risk-weighted assets
S SE Structured entity SEC Securities and Exchange Commission (US)SIC Securities investment conduitSME Small and medium-sized enterpriseSolitaire Solitaire Funding Limited, a special purpose entity managed by HSBCSPE1 Special purpose entitySRB1 Systemic Risk Buffer
T The Hongkong and Shanghai
Banking Corporation The Hongkong and Shanghai Banking Corporation Limited, the founding member of HSBC
TLAC1 Total loss absorbing capacity TRL Turkish lira TSA Transition Servicing Agreement – relating to the sale of the CRS business in the US TSR Total shareholder return
U UAE United Arab EmiratesUK United Kingdom US$ United States dollarUS United States of AmericaUS DPA Five-year deferred prosecution agreement with the Department of Justice and others (US) US run-off portfolio Includes our CML, vehicle finance and Taxpayer Financial Services businesses and insurance,
commercial, corporate and treasury activities in HSBC Finance on an IFRSs management basis
V VaR1 Value at risk Visa Visa Inc. VIU Value in use
1 Full definition included in Glossary on page 470.

Shareholder information (continued) Glossary
HSBC HOLDINGS PLC
470
Glossary Term Definition
A Adjustable-rate mortgages (‘ARM’s) Mortgage loans in the US on which the interest rate is periodically changed based on a reference price. These are
included within ‘affordability mortgages’. Affordability mortgages Mortgage loans where the customer’s monthly payments are set out at a low initial rate, either variable or fixed,
before resetting to a higher rate once the introductory period is over. Agency exposures Exposures to near or quasi-government agencies including public sector entities fully owned by government
carrying out non-commercial activities, provincial and local government authorities, development banks and funds set up by government.
Alt-A A US description for loans regarded as lower risk than sub-prime, but with higher risk characteristics than lending under normal criteria.
Arrears Customers are said to be in arrears (or in a state of delinquency) when they are behind in fulfilling their obligations, with the result that an outstanding loan is unpaid or overdue. When a customer is in arrears, the total outstanding loans on which payments are overdue are described as delinquent.
Asset-backed securities (‘ABS’s)
Securities that represent an interest in an underlying pool of referenced assets. The referenced pool can comprise any assets which attract a set of associated cash flows but are commonly pools of residential or commercial mortgages.
B Back-testing A statistical technique used to monitor and assess the accuracy of a model, and how that model would have
performed had it been applied in the past. Bail-inable debt Bail-in refers to imposition of losses at the point of non viability (but before insolvency) on bank liabilities (bail-
inable debt) that are not exposed to losses while the institution remains a viable, going concern. Whether by way of write-down or conversion into equity, this has the effect of recapitalising the bank (although it does not provide any new funding).
Bank levy A levy that applies to UK banks, building societies and the UK operations of foreign banks from 1 January 2011. The amount payable is based on a percentage of the group’s consolidated liabilities and equity as at 31 December after deducting certain items the most material of which are those related to insured deposit balances, tier 1 capital, insurance liabilities, high quality liquid assets and items subject to a legally enforceable net settlement agreement.
Bank Recovery and Resolution Directive (‘BRRD’)
A European legislative package issued by the European Commission and adopted by EU Member States. This directive was finalised in July 2014 with the majority of provisions coming into effect 1 January 2015. This introduces a common EU framework for how authorities should intervene to address banks which are failing or are likely to fail. The framework includes early intervention and measures designed to prevent failure and in the event of bank failure for authorities to ensure an orderly resolution.
Basel II The capital adequacy framework issued by the Basel Committee on Banking Supervision in June 2006 in the form of the ‘International Convergence of Capital Measurement and Capital Standards’, amended by subsequent changes to the capital requirements for market risk and re-securitisations, commonly known as Basel 2.5, which took effect from 31 December 2011.
Basel III In December 2010, the Basel Committee issued ‘Basel III rules: a global regulatory framework for more resilient banks and banking systems’ and ‘International framework for liquidity risk measurement, standards and monitoring’. Together these documents present the Basel Committee’s reforms to strengthen global capital and liquidity rules with the goal of promoting a more resilient banking sector. In June 2011, the Basel Committee issued a revision to the former document setting out the finalised capital treatment for counterparty credit risk in bilateral trades.
Basis point (‘bps’) One hundredth of a per cent (0.01%), so 100 basis points is 1%. For example, this is used in quoting movements in interest rates or yields on securities.
C Capital conservation buffer
(‘CCB’) A capital buffer prescribed by regulators under Basel III and designed to ensure banks build up capital buffers
outside periods of stress which can be drawn down as losses are incurred. Should a bank’s capital levels fall within the capital conservation buffer range, capital distributions will be constrained by the regulators.
Capital planning buffer (‘CPB’)
A capital buffer, prescribed by the PRA under Basel II, and designed to ensure banks build up capital buffers outside periods of stress which can be drawn down as losses are incurred. Should a bank’s capital levels fall within the capital planning buffer range, a period of heightened regulatory interaction would be triggered.
Capital requirements directive (‘CRD’)
A capital adequacy legislative package issued by the European Commission and adopted by EU member states. The first CRD legislative package gave effect to the Basel II proposals in the EU and came into force on 20 July 2006. CRD II, which came into force on 31 December 2010, subsequently updated the requirements for capital instruments, large exposure, liquidity risk and securitisation. A further CRD III amendment, updated market risk capital and additional securitisation requirements, and came into force on 31 December 2011.
CRD IV package comprises a recast Capital Requirements Directive and a new Capital Requirements Regulation. The package implements the Basel III capital proposals together with transitional arrangements for some of its requirements. CRD IV came into force on 1 January 2014.
Capital securities Capital securities include perpetual subordinated capital securities and contingent convertible capital securities. Central counterparty (‘CCP’) An intermediary between a buyer and a seller (generally a clearing house). Clawback Remuneration already paid to an individual, which has to be returned to an organisation under certain
circumstances. Collateralised debt obligation (‘CDO’) A security issued by a third-party which references ABSs and/or certain other related assets purchased by the
issuer. CDOs may feature exposure to sub-prime mortgage assets through the underlying assets.

HSBC HOLDINGS PLC
471
Str
ateg
ic R
epo
rt
Fi
nan
cial
Rev
iew
Co
rpo
rate
Go
vern
ance
Fin
anci
al S
tate
men
ts
S
har
eho
lder
Info
rmat
ion
Term Definition
Collectively assessed impairment
Impairment assessment on a collective basis for homogeneous groups of loans that are not considered individually significant and to cover losses which have been incurred but have not yet been identified on loans subject to individual assessment.
Commercial paper (‘CP’) An unsecured, short-term debt instrument issued by a corporation, typically for the financing of accounts receivable, inventories and meeting short-term liabilities. The debt is usually issued at a discount, reflecting prevailing market interest rates.
Commercial real estate Any real estate, comprising buildings or land, intended to generate a profit, either from capital gain or rental income.
Common equity tier 1 capital (‘CET1’)
The highest quality form of regulatory capital under Basel III that comprises common shares issued and related share premium, retained earnings and other reserves excluding the cash flow hedging reserve, less specified regulatory adjustments.
CET 1 ratio A Basel III measure, of CET 1 capital expressed as percentage of total risk exposure amount. Common reporting
(‘COREP’) Harmonised European reporting framework established in the Capital Requirements Directives, to be mandated by
the European Banking Authority. Compliance risk The risk that the Group fails to observe the letter and spirit of all relevant laws, codes, rules, regulations and
standards of good market practice, and incurs fines and penalties and suffers damage to its business as a consequence.
Comprehensive Capital Analysis and Review (‘CCAR’)
CCAR is an annual exercise by the Federal Reserve to ensure that institutions have robust, forward-looking capital planning processes that account for their unique risks and sufficient capital to continue operations throughout times of economic and financial stress.
Conduits HSBC sponsors and manages multi-seller conduits and ‘SIC’s. The multi-seller conduits hold interests in diversified pools of third-party assets such as vehicle loans, trade receivables and credit card receivables funded through the issuance of short-dated commercial paper and supported by a liquidity facility. The SICs hold predominantly asset-backed securities referencing such items as commercial and residential mortgages, vehicle loans and credit card receivables funded through the issuance of both long-term and short-term debt.
Constant currency A non-GAAP financial measure that adjusts for the year-on-year effects of foreign currency translation differences by comparing reported results for the reported period with reported results for comparative period retranslated at exchange rates for the reported period. The foreign currency translation differences reflect the movements of the US dollar against most major currencies during the reported period.
Constant net asset value fund (‘CNAV’) A fund that prices its assets on an amortised cost basis, subject to the amortised book value of the portfolio remaining within 50 basis points of its market value.
Consumer and Mortgage Lending (‘CML’)
In the US, the CML portfolio consists of our Consumer Lending and Mortgage Services businesses, which are in run-off.
The Consumer Lending business offered secured and unsecured loan products, such as first and second lien mortgage loans, open-ended home equity loans and personal non-credit card loans through branch locations and direct mail. The majority of the mortgage lending products were for refinancing and debt consolidation rather than home purchases. In the first quarter of 2009, we discontinued all originations by our Consumer Lending business.
Prior to the first quarter of 2007, when we ceased loan purchase activity, the Mortgage Services business purchased non-conforming first and second lien real estate secured loans from unaffiliated third parties. The business also included the operations of Decision One Mortgage Company (‘Decision One’), which historically originated mortgage loans sourced by independent mortgage brokers and sold these to secondary market purchasers. Decision One ceased originations in September 2007.
Contractual maturities The date on which the final payment (principal or interest) of any financial instrument is due to be paid, at which point all the remaining outstanding principal and interest have been repaid.
Core tier 1 capital The highest quality form of regulatory capital, under Basel II, that comprises total shareholders’ equity and related non-controlling interests, less goodwill and intangible assets and certain other regulatory adjustments.
Core tier 1 capital ratio A Basel II measure, of core tier 1 capital expressed as a percentage of the total risk-weighted assets. Countercyclical capital buffer
(‘CCyB’) A capital buffer prescribed by regulators under Basel III which aims to ensure that capital requirements take
account of the macro-financial environment in which banks operate. This will provide the banking sector with additional capital to protect it against potential future losses, when excess credit growth in the financial system as a whole is associated with an increase in system-wide risk.
Counterparty credit risk (‘CCR’)
Counterparty credit risk, in both the trading and non-trading books, is the risk that the counterparty to a transaction may default before completing the satisfactory settlement of the transaction.
Credit default swap (‘CDS’) A derivative contract whereby a buyer pays a fee to a seller in return for receiving a payment in the event of a defined credit event (e.g. bankruptcy, payment default on a reference asset or assets, or downgrades by a rating agency) on an underlying obligation (which may or may not be held by the buyer).
Credit enhancements Facilities used to enhance the creditworthiness of financial obligations and cover losses due to asset default.
Credit risk Risk of financial loss if a customer or counterparty fails to meet an obligation under a contract. It arises mainly from direct lending, trade finance and leasing business, but also from products such as guarantees, derivatives and debt securities.
Credit risk mitigation A technique to reduce the credit risk associated with an exposure by application of credit risk mitigants such as collateral, guarantee and credit protection.
Credit risk spread The premium over the benchmark or risk-free rate required by the market to accept a lower credit quality. The yield spread between securities with the same coupon rate and maturity structure but with different associated credit risks. The yield spread rises as the credit rating worsens.
Credit spread risk The risk that movements in credit spreads will affect the value of financial instruments. Credit valuation adjustment
(‘CVA’) An adjustment to the valuation of OTC derivative contracts to reflect the creditworthiness of OTC derivative
counterparties. Customer deposits Money deposited by account holders. Such funds are recorded as liabilities.

Shareholder information (continued) Glossary
HSBC HOLDINGS PLC
472
Term Definition
Customer remediation Activities carried out by HSBC to compensate customers for losses or damages associated with a failure to comply with regulations. Customer remediation is initiated by HSBC in response to customer complaints, and not specifically initiated by regulatory action.
Customer risk rating (‘CRR’) A scale of 23 grades measuring obligor PD. CVA risk capital charge A capital charge under CRDIV to cover the risk of mark-to-market losses on expected counterparty risk to
derivatives.
D Debit valuation adjustment (‘DVA’) An adjustment made by an entity to the valuation of OTC derivative liabilities to reflect within fair value the entity’s
own credit risk. Debt restructuring A restructuring by which the terms and provisions of outstanding debt agreements are changed. This is often done
in order to improve cash flow and the ability of the borrower to repay the debt. It can involve altering the repayment schedule as well as debt or interest charge reduction.
Debt securities Financial assets on the Group’s balance sheet representing certificates of indebtedness of credit institutions, public bodies or other undertakings, excluding those issued by central banks.
Debt securities in issue Transferable certificates of indebtedness of the Group to the bearer of the certificates. These are liabilities of the Group and include certificates of deposits.
Deed-in-lieu An arrangement in which a borrower surrenders the deed for a property to the lender without going through foreclosure proceedings and is subsequently released from any further obligations on the loan.
Defined benefit obligation The present value of expected future payments required to settle the obligations of a defined benefit plan resulting from employee service.
Deposits by banks All deposits received from domestic and foreign banks, excluding deposits or liabilities in the form of debt securities or for which transferable certificates have been issued.
Down-shock Term given to the effect on our future net interest income of an incremental parallel fall in all yield curves worldwide at the beginning of each quarter during the 12 months from 1 January 2015, assuming no management response. An equivalent rise in yield curves is referred to as an up-shock.
E Economic capital The internally calculated capital requirement which is deemed necessary by HSBC to support the risks to which it is
exposed. Economic profit The difference between the return on financial capital invested by shareholders and the cost of that capital.
Economic profit may be expressed as a whole number or as a percentage. Economic Value of Equity
(‘EVE’) sensitivity Considers all re-pricing mismatches in the current balance sheet and calculates the change in market value that
would result from a set of defined interest rate shocks. Encumbered assets Assets on our balance sheet which have been pledged as collateral against an existing liability. Enhanced Variable Net Asset
Value Fund (‘ENAV’) A fund that prices its assets on a fair value basis. Consequently, process may change from one day to the next.
Equator Principles The Equator Principles are used by financial institutions to reduce the potential impact of large projects, which they finance, on people or on the environment.
Equity risk The risk arising from positions, either long or short, in equities or equity-based instruments, which create exposure to a change in the market price of the equities or equity instruments.
Eurozone The 18 European Union countries using the euro as their common currency. The 18 countries are Austria, Belgium, Cyprus, Estonia, Finland, France, Germany, Greece, Ireland, Italy, Latvia, Luxembourg, Malta, Netherlands, Portugal, Slovakia, Slovenia and Spain.
Expected loss (‘EL’) A regulatory calculation of the amount expected to be lost on an exposure using a 12-month time horizon and downturn loss estimates. EL is calculated by multiplying the PD (a percentage) by the EAD (an amount) and LGD (a percentage).
Exposure A claim, contingent claim or position which carries a risk of financial loss. Exposure at default (‘EAD’) The amount expected to be outstanding after any credit risk mitigation, if and when the counterparty defaults. EAD
reflects drawn balances as well as allowance for undrawn amounts of commitments and contingent exposures.
F Fair value adjustment An adjustment to the fair value of a financial instrument which is determined using a valuation technique (level 2
and level 3) to include additional factors that would be considered by a market participant that are not incorporated within the valuation model.
Fiduciary risk The risk to the Group of breaching its fiduciary duties where it acts in a fiduciary capacity as trustee, investment manager or as mandated by law or regulation.
Financial Conduct Authority (‘FCA’) The Financial Conduct Authority regulates the conduct of financial firms and, for certain firms, prudential standards in the UK. It has a strategic objective to ensure that the relevant markets function well.
Financial Policy Committee (‘FPC’) The Financial Policy Committee, at the Bank of England, is charged with a primary objective of identifying, monitoring and taking action to remove or reduce systemic risks with a view to protecting and enhancing the resilience of the UK financial system. The FPC has a secondary objective to support the economic policy of the UK Government.
Financial Reporting (‘FINREP’)
Harmonised European financial reporting framework, proposed by the European Union, which will be used to obtain a comprehensive view of a firm’s risk profile.
First lien A security interest granted over an item of property to secure the repayment of a debt that places its holder first in line to collect repayment from the sale of the underlying collateral in the event of a default on the debt.
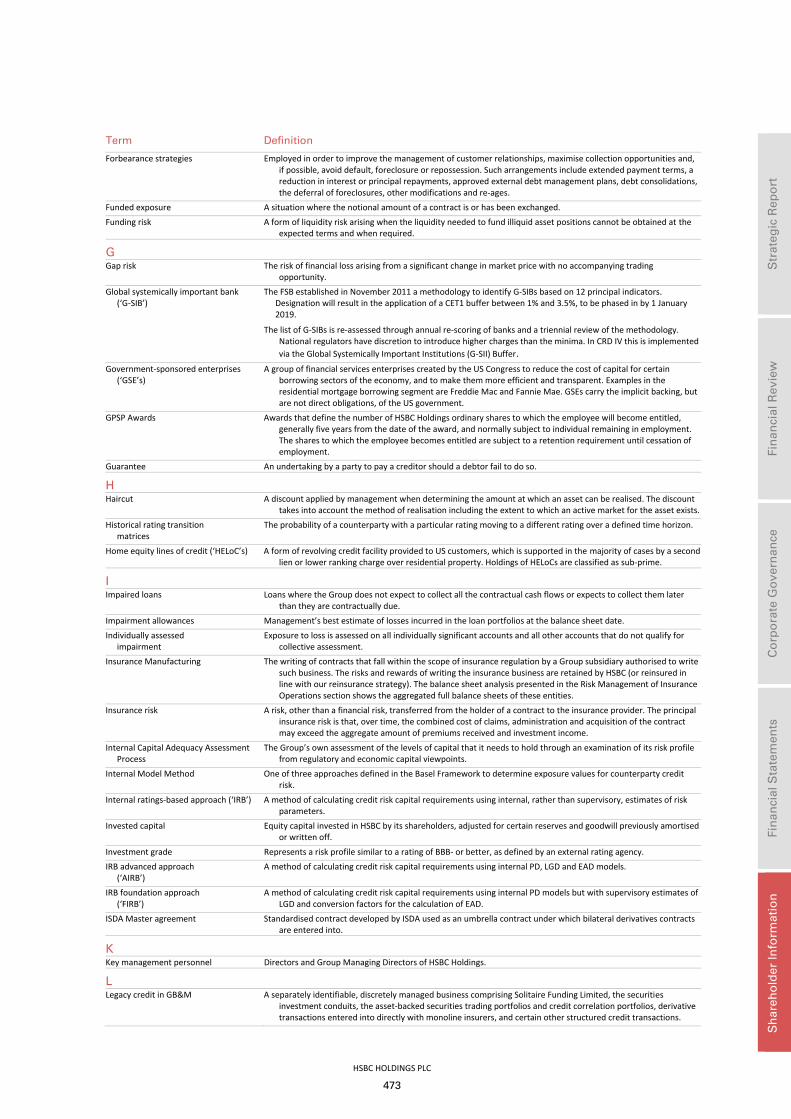
HSBC HOLDINGS PLC
473
Str
ateg
ic R
epo
rt
Fi
nan
cial
Rev
iew
Co
rpo
rate
Go
vern
ance
Fin
anci
al S
tate
men
ts
S
har
eho
lder
Info
rmat
ion
Term Definition
Forbearance strategies Employed in order to improve the management of customer relationships, maximise collection opportunities and, if possible, avoid default, foreclosure or repossession. Such arrangements include extended payment terms, a reduction in interest or principal repayments, approved external debt management plans, debt consolidations, the deferral of foreclosures, other modifications and re-ages.
Funded exposure A situation where the notional amount of a contract is or has been exchanged. Funding risk A form of liquidity risk arising when the liquidity needed to fund illiquid asset positions cannot be obtained at the
expected terms and when required.
G Gap risk The risk of financial loss arising from a significant change in market price with no accompanying trading
opportunity. Global systemically important bank
(‘G-SIB’) The FSB established in November 2011 a methodology to identify G-SIBs based on 12 principal indicators.
Designation will result in the application of a CET1 buffer between 1% and 3.5%, to be phased in by 1 January 2019.
The list of G-SIBs is re-assessed through annual re-scoring of banks and a triennial review of the methodology. National regulators have discretion to introduce higher charges than the minima. In CRD IV this is implemented via the Global Systemically Important Institutions (G-SII) Buffer.
Government-sponsored enterprises (‘GSE’s)
A group of financial services enterprises created by the US Congress to reduce the cost of capital for certain borrowing sectors of the economy, and to make them more efficient and transparent. Examples in the residential mortgage borrowing segment are Freddie Mac and Fannie Mae. GSEs carry the implicit backing, but are not direct obligations, of the US government.
GPSP Awards Awards that define the number of HSBC Holdings ordinary shares to which the employee will become entitled, generally five years from the date of the award, and normally subject to individual remaining in employment. The shares to which the employee becomes entitled are subject to a retention requirement until cessation of employment.
Guarantee An undertaking by a party to pay a creditor should a debtor fail to do so.
H Haircut A discount applied by management when determining the amount at which an asset can be realised. The discount
takes into account the method of realisation including the extent to which an active market for the asset exists.Historical rating transition
matrices The probability of a counterparty with a particular rating moving to a different rating over a defined time horizon.
Home equity lines of credit (‘HELoC’s) A form of revolving credit facility provided to US customers, which is supported in the majority of cases by a second lien or lower ranking charge over residential property. Holdings of HELoCs are classified as sub-prime.
I Impaired loans Loans where the Group does not expect to collect all the contractual cash flows or expects to collect them later
than they are contractually due. Impairment allowances Management’s best estimate of losses incurred in the loan portfolios at the balance sheet date. Individually assessed
impairment Exposure to loss is assessed on all individually significant accounts and all other accounts that do not qualify for
collective assessment. Insurance Manufacturing The writing of contracts that fall within the scope of insurance regulation by a Group subsidiary authorised to write
such business. The risks and rewards of writing the insurance business are retained by HSBC (or reinsured in line with our reinsurance strategy). The balance sheet analysis presented in the Risk Management of Insurance Operations section shows the aggregated full balance sheets of these entities.
Insurance risk A risk, other than a financial risk, transferred from the holder of a contract to the insurance provider. The principal insurance risk is that, over time, the combined cost of claims, administration and acquisition of the contract may exceed the aggregate amount of premiums received and investment income.
Internal Capital Adequacy Assessment Process
The Group’s own assessment of the levels of capital that it needs to hold through an examination of its risk profile from regulatory and economic capital viewpoints.
Internal Model Method One of three approaches defined in the Basel Framework to determine exposure values for counterparty credit risk.
Internal ratings-based approach (‘IRB’) A method of calculating credit risk capital requirements using internal, rather than supervisory, estimates of risk parameters.
Invested capital Equity capital invested in HSBC by its shareholders, adjusted for certain reserves and goodwill previously amortised or written off.
Investment grade Represents a risk profile similar to a rating of BBB- or better, as defined by an external rating agency. IRB advanced approach
(‘AIRB’) A method of calculating credit risk capital requirements using internal PD, LGD and EAD models.
IRB foundation approach (‘FIRB’)
A method of calculating credit risk capital requirements using internal PD models but with supervisory estimates of LGD and conversion factors for the calculation of EAD.
ISDA Master agreement Standardised contract developed by ISDA used as an umbrella contract under which bilateral derivatives contracts are entered into.
K Key management personnel Directors and Group Managing Directors of HSBC Holdings.
L Legacy credit in GB&M A separately identifiable, discretely managed business comprising Solitaire Funding Limited, the securities
investment conduits, the asset-backed securities trading portfolios and credit correlation portfolios, derivative transactions entered into directly with monoline insurers, and certain other structured credit transactions.

Shareholder information (continued) Glossary
HSBC HOLDINGS PLC
474
Term Definition
Legal proceedings Civil court, arbitration or tribunal proceedings brought against HSBC companies (whether by way of claim or counterclaim) or civil disputes that may, if not settled, result in court, arbitration or tribunal proceedings.
Legal risk The risk of financial loss, sanction and/or reputational damage resulting from contractual risk (the risk that the rights and/or obligations of a Group member within a contractual relationship are defective); dispute risk (the risk due to an adverse dispute environment or the management of potential or actual disputes); legislative risk (the risk that a Group member fails to adhere to laws of the jurisdiction in which it operates); and non-contractual rights risk (the risk that a Group member’s assets are not properly owned or are infringed by others or the infringement by a Group member of another party’s rights).
Level 1 – quoted market price Financial instruments with quoted prices for identical instruments in active markets. Level 2 – valuation technique using
observable inputs Financial instruments with quoted prices for similar instruments in active markets or quoted prices for identical or
similar instruments in inactive markets and financial instruments valued using models where all significant inputs are observable.
Level 3 – valuation technique with significant unobservable inputs
Financial instruments valued using valuation techniques where one or more significant inputs are unobservable.
Leveraged finance Funding provided for entities with higher than average indebtedness, which typically arises from sub-investment grade acquisitions or event-driven financing.
Leverage ratio A measure, prescribed by regulators under Basel III, which is the ratio of tier 1 capital to total exposures. Total exposures include on-balance sheet items, off-balance sheet items and derivatives, and should generally follow the accounting measure of exposure. This supplementary measure to the risk-based capital requirements is intended to constrain the build-up of excess leverage in the banking sector.
Liquidity coverage ratio (‘LCR’)
The ratio of the stock of high quality liquid assets to expected net cash outflows over the following 30 days. High quality liquid assets should be unencumbered, liquid in markets during a time of stress and, ideally, be central bank eligible. The Basel III rules require this ratio to be at least 100% with effect from 2015. The LCR is still subject to an observation period and review to address any unintended consequences.
Liquidity enhancement Liquidity enhancement makes funds available if required for reasons other than asset default, e.g. to ensure timely repayment of maturing commercial paper.
Liquidity risk The risk that HSBC does not have sufficient financial resources to meet its obligations as they fall due, or will have to do so at an excessive cost. This risk arises from mismatches in the timing of cash flows.
Loan modification An account management action that results in a change to the original terms and conditions of a loan either temporarily or permanently without resetting its delinquency status, except in case of a ‘modification re-age’ where delinquency status is also reset to up-to-date. Account modifications may include revisions to one or more terms of the loan including, but not limited to, a change in interest rate, extension of the amortisation period, reduction in payment amount and partial forgiveness or deferment of principal.
Loan re-age An account management action that results in the resetting of the contractual delinquency status of an account to up-to-date upon fulfilment of certain requirements which indicate that payments are expected to be made in accordance with the contractual terms.
Loans past due Loans on which repayments are overdue. Loan to value ratio (‘LTV’) A mathematical calculation that expresses the amount of the loan as a percentage of the value of security. A high
LTV indicates that there is less cushion to protect the lender against house price falls or increases in the loan if repayments are not made and interest is added to the outstanding loan balance.
Loss given default (‘LGD’) The estimated ratio (percentage) of the loss on an exposure to the amount outstanding at default (EAD) upon default of a counterparty.
Loss severity The realised amount of losses incurred (including ancillary amounts owed) when a loan is foreclosed or disposed of through the arrangement with the borrower. The loss severity is represented as a percentage of the outstanding loan balance.
M Malus An arrangement that permits an organisation to prevent vesting of all or part of the amount of a deferred
remuneration award in relation to risk outcomes or performance.
Market risk The risk that movements in market risk factors, including foreign exchange rates and commodity prices, interest rates, credit spreads and equity prices will reduce income or portfolio values.
Medium term notes (‘MTN’s) Issued by corporates across a range of maturities. Under MTN Programmes notes are offered on a regular and continuous basis to investors.
Mortgage-backed securities (‘MBS’s) Securities that represent interests in groups of mortgages, which may be on residential or commercial properties. Investors in these securities have the right to cash received from future mortgage payments (interest and/or principal). When the MBS references mortgages with different risk profiles, the MBS is classified according to the highest risk class.
Mortgage-related assets Referenced to underlying mortgages. Mortgage vintage The year a mortgage was originated.
N Negative equity mortgages Equity is the value of the asset less the outstanding balance on the loan. Negative equity arises when the value of
the property purchased is below the balance outstanding on the loan. Net asset value per share Total shareholders’ equity, less non-cumulative preference shares and capital securities, divided by the number of
ordinary shares in issue. Net interest income The amount of interest received or receivable on assets net of interest paid or payable on liabilities. Net interest income sensitivity Considers all pricing mismatches in the current balance sheet, with suitable assumptions for balance sheet growth
in the future, and calculates the change in net interest income that would result from a set of defined interest rate shocks.

HSBC HOLDINGS PLC
475
Str
ateg
ic R
epo
rt
Fi
nan
cial
Rev
iew
Co
rpo
rate
Go
vern
ance
Fin
anci
al S
tate
men
ts
S
har
eho
lder
Info
rmat
ion
Term Definition
Net principal exposure The gross principal amount of a financial asset after taking account of credit protection purchased but excluding the effect of any counterparty credit valuation adjustment to that protection. It includes assets that benefit from monoline protection, except where this protection is purchased with a CDS.
Net stable funding ratio (‘NSFR’) The ratio of available stable funding to required stable funding over a one year time horizon, assuming a stressed scenario. Available stable funding would include items such as equity capital, preferred stock with a maturity of over one year and liabilities with an assessed maturity of over one year. The Basel III rules require this ratio to be over 100% with effect from 2018. The NSFR is still subject to an observation period and review to address any unintended consequences.
Non-conforming mortgages US mortgages that do not meet normal lending criteria. Examples include mortgages where the expected level of documentation is not provided (such as with income self-certification), or where poor credit history increases the risk and results in pricing at a higher than normal lending rate.
Non-trading portfolios Portfolios that comprise positions that primarily arise from the interest rate management of our retail and commercial banking assets and liabilities, financial investments designated as available for sale and held to maturity, and exposures arising from our insurance operations.
Non-trading risk The market risk arising from non-trading portfolios.
O Offset mortgages A flexible type of mortgage where a borrower’s savings balance(s) held at the same institution can be used to
offset the mortgage balance outstanding. The borrower pays interest on the net balance which is calculated by subtracting the credit balance(s) from the debit balance. As part of the offset mortgage a total facility limit is agreed and the borrower may redraw up to a pre-agreed limit.
Overnight Index Swap (‘OIS’) discounting
A method of valuing collateralised interest rate derivatives which uses a discount curve that reflects the overnight interest rate typically earned or paid in respect of collateral received.
Operational risk The risk of loss resulting from inadequate or failed internal processes, people and systems or from external events, including legal risk.
Over-the-counter (‘OTC’) A bilateral transaction (e.g. derivatives) that is not exchange traded and that is valued using valuation models.
P Pension risk The risk that contributions from Group companies and members fail to generate sufficient funds to meet the cost
of accruing benefits for the future service of active members, and the risk that the performance of assets held in pension funds is insufficient to cover existing pension liabilities.
Performance shares Awards of HSBC Holdings ordinary shares under employee share plans that are subject to the achievement of corporate performance conditions.
Personal lending See ‘Retail loans’. PRA standard rules The method prescribed by the PRA for calculating market risk capital requirements in the absence of VaR model
approval. Prime A US description for mortgages granted to the most creditworthy category of borrowers. Private equity investments Equity securities in operating companies not quoted on a public exchange, often involving the investment of
capital in private companies or the acquisition of a public company that results in its delisting. Probability of default (‘PD’) The probability that an obligor will default within one year. Profit participation contribution (‘PIS’) A federal tax which is imposed monthly on gross revenue earned by legal entities in Brazil. It is a mandatory
employer contribution to an employee savings initiative. Prudential Regulation Authority
(‘PRA’) The Prudential Regulation Authority in the UK is responsible for prudential regulation and supervision of banks,
building societies, credit unions, insurers and major investment firms.
R Refi rate The refi (or refinancing) rate is set by the European Central Bank (‘ECB’) and is the price banks pay to borrow from
ECB. Regulatory capital The capital which HSBC holds, determined in accordance with rules established by the PRA for the consolidated
Group and by local regulators for individual Group companies. Regulatory matters Investigations, reviews and other actions carried out by, or in response to the actions of, regulators or law
enforcement agencies in connection with alleged wrongdoing by HSBC. Renegotiated loans Loans for which the contractual payment terms have been changed because of significant concerns about the
borrower’s ability to meet the contractual payments when due. Repo/reverse repo
(or sale and repurchase agreement) A short-term funding agreement that allows a borrower to create a collateralised loan by selling a financial asset
to a lender. As part of the agreement the borrower commits to repurchase the security at a date in the future repaying the proceeds of the loan. For the party on the other end of the transaction (buying the security and agreeing to sell in the future) it is reverse repurchase agreement or a reverse repo.
Reputational risk The risk that illegal, unethical or inappropriate behaviour by the Group itself, members of staff or clients or representatives of the Group will damage HSBC’s reputation, leading, potentially, to a loss of business, fines or penalties.
Restricted Shares Awards that define the number of HSBC Holdings ordinary shares to which the employee will become entitled, generally between one and three years from the date of the award, and normally subject to the individual remaining in employment. The shares to which the employee becomes entitled may be subject to retention requirement.
Retail loans Money lent to individuals rather than institutions. This includes both secured and unsecured loans such as mortgages and credit card balances.
Return on equity Profit attributable to ordinary shareholders of the parent company divided by average ordinary shareholders’ equity.

Shareholder information (continued) Glossary
HSBC HOLDINGS PLC
476
Term Definition
Risk appetite The aggregate level and types of risk a firm is willing to assume within its risk capacity to achieve its strategic objectives and business plan.
Risk capacity The maximum level of risk the firm can assume before breaching constraints determined by regulatory capital and liquidity needs and its obligations, also from a conduct perspective, to depositors, policyholders, other customers and shareholders.
Risk-weighted assets (‘RWA’s)
Calculated by assigning a degree of risk expressed as a percentage (risk weight) to an exposure value in accordance with the applicable Standardised or IRB approach rules.
Run-off portfolios Legacy credit in GB&M, the US CML portfolio and other US run-off portfolios, including the treasury services related to the US CML businesses and commercial operations in run-off. Origination of new business in the run-off portfolios has been discontinued and balances are being managed down through attrition and sale.
S Sale and repurchase agreement See repo above.
Second lien A security interest granted over an item of property to secure the repayment of a debt that is issued against the same collateral as a first lien but that is subordinate to it. In the case of default, repayment for this debt will only be received after the first lien has been repaid.
Securitisation A transaction or scheme whereby the credit risk associated with an exposure, or pool of exposures, is tranched and where payments to investors in the transaction or scheme are dependent upon the performance of the exposure or pool of exposures. A traditional securitisation involves the transfer of the exposures being securitised to an SE which issues securities. In a synthetic securitisation, the tranching is achieved by the use of credit derivatives and the exposures are not removed from the balance sheet of the originator.
Securitisation swap An interest rate or cross currency swap with notional linked to the size of the outstanding asset portfolio in a securitisation. Securitisation swaps are typically executed by securitisation vehicles to hedge interest rate risk arising from mismatches between the interest rate risk profile of the asset portfolio and that of the securities issued by the vehicle.
Short sale In relation to credit risk management, a ‘short sale’ is an arrangement in which a bank permits the borrower to sell the property for less than the amount outstanding under a loan agreement. The proceeds are used to reduce the outstanding loan balance and the borrower is subsequently released from any further obligations on the loan.
Single-issuer liquidity facility A liquidity or stand-by line provided to a corporate customer which is different from a similar line provided to a conduit funding vehicle.
Six filters An internal measure designed to improve capital deployment across the Group. Five of the filters examine the strategic relevance of each business in each country, in terms of connectivity and economic development, and the current returns, in terms of profitability, cost efficiency and liquidity. The sixth filter requires adherence to global risk standards.
Social security financing contribution (‘COFINS’)
A federal tax imposed monthly on gross revenue earned by legal entities in Brazil. It is a contribution to finance the social security system.
Sovereign exposures Exposures to governments, ministries, departments of governments, embassies, consulates and exposures on account of cash balances and deposits with central banks.
Special Purpose Entity (‘SPE’) A corporation, trust or other non-bank entity, established for a narrowly defined purpose, including for carrying on securitisation activities. The structure of the SPE and its activities are intended to isolate its obligations from those of the originator and the holders of the beneficial interests in the securitisation.
Structured entities (‘SE’s)
An entity that has been designed so that voting or similar rights are not the dominant factor in deciding who controls the entity, such as when voting rights relate to administrative tasks only and the relevant activities are directed by means of contractual arrangements.
Standardised approach (‘STD’)
In relation to credit risk, a method for calculating credit risk capital requirements using External Credit Assessment Institutions (‘ECAI’) ratings and supervisory risk weights. In relation to operational risk, a method of calculating the operational capital requirement by the application of a supervisory defined percentage charge to the gross income of eight specified business lines.
Stressed VaR A market risk measure based on potential market movements for a continuous one-year period of stress for a trading portfolio
Structured finance/notes An instrument whose return is linked to the level of a specified index or the level of a specified asset. The return on a structured note can be linked to equities, interest rates, foreign exchange, commodities or credit. Structured notes may or may not offer full or partial capital protection in the event of a decline in the underlying index or asset.
Student loan-related assets Securities with collateral relating to student loans. Subordinated liabilities Liabilities which rank after the claims of other creditors of the issuer in the event of insolvency or liquidation. Sub-prime A US description for customers with high credit risk, for example those who have limited credit histories, modest
incomes, high debt-to-income ratios, high loan-to-value ratios (for real estate secured products) or have experienced credit problems caused by occasional delinquencies, prior charge-offs, bankruptcy or other credit-related problems.
Sustainability risk The risk that the environmental and social effects of providing financial services outweigh the economic benefits. Sustainable cost savings Permanent cost reductions at a given level of business activity. Sustainable cost savings exclude cost avoidance
and revenue and loan impairment charge benefits as these do not represent operational expense reductions. Cost savings resulting from business disposals are not classified as sustainable.

HSBC HOLDINGS PLC
477
Str
ateg
ic R
epo
rt
Fi
nan
cial
Rev
iew
Co
rpo
rate
Go
vern
ance
Fin
anci
al S
tate
men
ts
S
har
eho
lder
Info
rmat
ion
Term Definition
Systemic Risk Buffer (‘SRB’) A capital buffer prescribed in the EU under CRD IV, to address risks in the financial sector as a whole, or one or more sub-sectors, to be deployed as necessary by each EU member state with a view to mitigate structural macro-prudential risk. In the UK this was transposed in January 2015 and is to be applied to ring-fenced banks and building societies over a certain threshold.
Systems risk The risk of failure or other deficiency in the automated platforms that support the Group’s daily execution and the systems infrastructure on which they reside, including data centres, networks and distributed computers.
T Tier 1 capital A component of regulatory capital, comprising common equity tier 1 and additional tier 1. Additional tier 1 capital
includes eligible non-common equity capital securities and any related share premium. Under Basel II, Tier 1 capital comprises of core tier 1 and other tier 1 capital. Other tier 1 capital includes
qualifying capital instruments such as non-cumulative perpetual preference shares and hybrid capital securities.
Tier 2 capital A component of regulatory capital, comprising eligible capital securities and any related share premium. Under Basel II, Tier 2 capital comprises of qualifying subordinated loan capital, related non-controlling interests,
allowable collective impairment allowances and unrealised gains arising on the fair valuation of equity instruments held as available-for-sale. Tier 2 capital also includes reserves arising from the revaluation of properties.
Total Loss Absorbing Capacity (‘TLAC’)
A proposal by the FSB and not yet finalised for global systemically important banks to have a sufficient amount of specific types of liabilities which can be used to absorb losses and recapitalise a bank in resolution. These proposals are intended to facilitate an orderly resolution that minimises any impact on financial stability, ensures the continuity of critical functions, and avoids exposing taxpayers to loss.
Trading portfolios Positions arising from market-making and warehousing of customer-derived positions.
Trading risk Market risk arising from trading portfolios. Troubled debt restructuring A US description for restructuring a debt whereby the creditor for economic or legal reasons related to a debtor’s
financial difficulties grants a concession to the debtor that it would not otherwise consider.
U Unencumbered assets Assets on our balance sheet which have not been pledged as collateral against an existing liability.
Unfunded exposures An exposure where the notional amount of a contract has not been exchanged.
Up-shock See down-shock. US government agency and
US government sponsored enterprises mortgage-related assets
Securities that are guaranteed by US government agencies such as Ginnie Mae, or by US government sponsored entities including Fannie Mae and Freddie Mac.
V Value-at-risk
(‘VaR’) A measure of the loss that could occur on risk positions as a result of adverse movements in market risk factors
(e.g. rates, prices, volatilities) over a specified time horizon and to a given level of confidence.
W Wholesale loans Money lent to sovereign borrowers, banks, non-bank financial institutions and corporate entities.
Write-down/write-off When a financial asset is written down or written off, a customer balance is partially or fully removed, respectively, from the balance sheet. Loans (and related impairment allowance accounts) are normally written off, either partially or in full, when there is no realistic prospect of recovery. Where loans are secured, this is generally after receipt of any proceeds from the realisation of security. In circumstances where the net realisable value of any collateral has been determined and there is no reasonable expectation of further recovery, write-off may be earlier.
Wrong-way risk An adverse correlation between the counterparty’s PD and the mark-to-market value of the underlying transaction.

Shareholder information (continued) Index
HSBC HOLDINGS PLC
478
Index A Abbreviations 466 Accounting
developments (future) 345 estimates and judgements 349, 366, 378, 403, 407, 420 policies (critical) 62 policies 345, 354, 355, 357, 359, 365, 371, 377, 378, 392, 394, 398, 399, 402, 403, 407, 410, 413, 416, 417, 418, 419, 420, 434, 437, 440, 441, 442, 443, 445
Accounts approval 457 basis of preparation 63, 345 consolidation and related disclosures 348 presentation of information 347
Accruals, deferred income and other liabilities 418 Acquisitions and disposals 41, 241, 244, 260 Actuarial assumptions 363 Adjusted performance 29, 40 Advances to core funding ratio 165, 169, 216 Ageing analysis 136 Annual General Meeting293, 459 Anniversary (150th) 6,8 Anti-money laundering and sanctions 450 Areas of special interest 124 Asia 84
adjusted performance 87 balance sheet data 89, 375 collateral 147 constant currency/reported reconciliation 158 country business highlights 86 customer accounts 82 economic background 84 financial overview 85 impaired loans 137 lending 131, 132, 160 loan impairment charges/allowances 141, 142 mortgage loans 156 operating expenses 88 personal lending 151 principal operations 84 profit 84, 89, 374 profit/(loss) by country 85, 86 renegotiated loans 139, 140 reverse repos 151 risk-weighted assets 240 staff numbers 84 wholesale lending 144, 145
Asset-backed securities 214 Assets
average balance sheet 46 by country 376 by geographical region 78, 82, 89, 94, 99, 104, 375 by global business 63, 82, 89, 94, 99, 104 charged as security 401 constant currency/reported reconciliation 59 customer accounts 61 deferred tax 331, 365, 366, 367, 368 encumbered/unencumbered 171, 220, 472 financial accounting/regulatory reconciliation 249 five years 57 held for sale 349, 352, 416 held in custody and under administration 106 intangible 407, 410, 413 liquid assets of principal operating entities 166 maturity analysis 426 movement in 2014 58 other 416 risk-weighted 31, 62, 63, 78, 239-244, 476 total 30, 57, 59, 76, 82, 89, 94, 99, 104, 337, 341, 427 trading 377 transferred (accounting policy) 402
Associates and joint ventures 403 accounting policy 403 Bank of Communications 404 contingent liabilities 442 critical accounting estimates and judgements 403
interests in 332, 406 reported/adjusted reconciliation 44 share of profit in 30, 55 transactions with other related parties 456
Auditor arrangements 279 remuneration 364 report 329
B Back-testing 177, 224, 470 Balance sheet
average 46 consolidated 57, 337 constant currency/reported reconciliation 59 data 57, 76, 82, 89, 94, 99, 104 HSBC Holdings 341 insurance manufacturing subsidiaries 191 linkages 179 movement in 2014 30, 58 regulatory 248
Balance Sheet Management 181, 227 Bancassurance 190 Banking standards 5 Basel 31, 123, 164, 218, 239, 251, 470 Behaviouralisation 181, 218, 226 Board of Directors 270
balance and independence 272 changes 6 committees 15, 276 information and support 272 meetings 271 powers 271
Brand 32 Brazilian labour claims 422 Brazilian social security claims 441 Buffers (capital) 239, 252 Business model 12
C Capital 239
generation 245, 258 management 257 measurement and allocation 258 movement in regulatory capital in 2014 245 overview 239 ratios 31, 239, 471 regulatory 245, 247 resources 57 risks to capital 257 strength 3, 31 structure 245
Carbon dioxide emissions 38 Cash and cash equivalents 440
accounting policy 440 Cash flow
consolidated statement 338 Hedges 397 HSBC Holdings 342 notes 439 payable by contractual maturities 173
Cautionary statement regarding forward-looking statements 2 Chairman’s Committee 15, 288 Chinese translation 461 Client assets 73 Climate business 37 Collateral and credit enhancements 146, 150, 156, 171, 213
management 220 Commercial Banking 16, 17, 22, 67 Commercial real estate 145 Committees (Board) 276 Communication with shareholders 298, 460 Compliance risk 115, 189 Concentration of exposure 132 Conduct & Values committee 15, 286 Conduits 443 Consent orders 120 Constant currency 41 Consumer Credit Act 422 Contents inside front cover

HSBC HOLDINGS PLC
479
Str
ateg
ic R
epo
rt
Fi
nan
cial
Rev
iew
Co
rpo
rate
Go
vern
ance
Fin
anci
al S
tate
men
ts
S
har
eho
lder
Info
rmat
ion
Contingent liabilities, contractual commitments and guarantees 441 accounting policy 441
Contractual maturity of financial liabilities 173 Corporate governance 263
codes report 275 Cost efficiency ratio 3, 28, 55, 79, 84, 91, 96, 101 Counterparty credit risk 243 Country business highlights 80, 86, 92 Credit default swap regulatory investigation 454 Credit exposure 130, 149 Credit quality 207
classifications 207 Credit risk 129, 206, 258, 260
in 2014 129 insurance 196 management thereof 206 policies and practices 206 risk-weighted assets 240
Credit valuation adjustment 382 Critical accounting estimates and judgements 349, 366, 378, 403,
407, 420 Cross-border exposures 169 Customer accounts 30, 61, 82, 89, 94, 99, 104 Customers 16, 17, 18 Customer deposit markets 164 Customer lending and deposit (combined) 60 Customers service and satisfaction 17
D Dealings in HSBC Holdings plc shares 299 Debit valuation adjustment 382 Debt securities in issue 418
accounting policy 418 Defined terms inside front cover Deposits
combined view 60 core 216 average balances and average rates 46
Derivatives 149, 382, 394, 422 accounting policy 394
Directors 270 appointments and re-election 271 benefits 318 biographies 264 conflicts of interest 274 emoluments 324, 364 executive 270 exit payments 318 fees 318 induction 273 interests 297, 320 loss of office 318 non-executive 270 other directorships 307 pensions 318 performance evaluation 274 relations with shareholders 274 remuneration (executive) 34, 300, 303, 311, 313 remuneration (non-executive) 306 responsibilities (statement of) 328 service contracts 306 training and development 273 variable pay 303, 309, 310
Disclosure philosophy 107 Disposal gains / groups 41 Disposals 440 Dispute risk 122 Diversity and inclusion 19, 291 Dividends 298, 370, 458
income 353 payout ratio 32 per share 3, 45
Donations 38
E Earnings per share 29, 45, 371 Economic background
Asia 84 Europe 79 Latin America 101
Middle East and North Africa 91 North America 96
Economic contribution 33 Economic plans: HSBC Bank Brazil 454 Employees
compensation and benefits 356 development 19, 291 disabled 291 diversity and inclusion 19, 291 engagement 21, 288 gender balance 20 health, welfare and safety 20, 291 highest paid 325 material risk takers 327 numbers 1, 18, 54, 79, 84, 91, 96, 101 profile of leadership 19 relations 291 remuneration policy 34, 292 reward 291 risk 112 share plans 292 sign-on and severance 327 volunteering 37 whistleblowing 20
Encumbered assets 171, 220, 472 Enhanced Disclosure Task Force 108 Enquiries (from shareholders) 460 Equity
constant currency/reported reconciliation 59 movement in 2014 59
Equity securities 179, 226 Europe 79
adjusted performance 81 balance sheet data 82, 375 collateral 147 constant currency/reported reconciliation 158 country business highlights 80 customer accounts 61 economic background 79 financial overview 79 impaired loans 137 lending 131, 132, 160 loan impairment charges/allowances 141, 142 mortgage loans 156 operating expenses 81 personal lending 151 principal operations 79 profit/(loss) 79, 82, 374 profit/(loss) by country 80 regulatory update 254 profit/(loss) by country 80 renegotiated loans 139, 140 reverse repos 151 risk-weighted assets 240 staff numbers 79 wholesale lending 144, 145
Eurozone 126 Events after the balance sheet date 457 Executive risk 122
F Fair value
accounting policy 378 adjustments 381 control framework 378 reconciliation 384 valuation bases 383
Fee income (net) 48, 353 Fiduciary risk 115, 200 Filters (six) 12 Financial assets 392
accounting policy 392, 402 designated at fair value 181 not qualifying for de-recognition 402
Financial crime compliance and regulatory compliance 124 Financial guarantee contracts 442
accounting policy 441 Financial instruments 378, 390
accounting policy (fair value) 378

Shareholder information (continued) Index
HSBC HOLDINGS PLC
480
accounting policy (valuation) 354 at fair value 330 credit quality 133, 207 critical accounting estimates and judgements (valuation) 378 net income from 50, 354 not at fair value 390 past due but not impaired 136
Financial investments 60, 399 accounting policy 399 gains less losses from 51
Financial liabilities designated at fair value 181, 379, 417 accounting policy 417 contractual maturities 173
Financial overview 79, 85, 91, 96, 101 Financial risks (insurance) 194 Financial Services Compensation Scheme 442 Financial System Vulnerabilities Committee 15, 282 Financial statements 334
changes to presentation 346 Five-year comparison 45, 57, 157, 159 Fixed pay 39, 40, 303, 311 Footnotes 39, 109, 202, 256, 344 Forbearance 139, 208, 350 Foreclosures 208, 449 Foreign currencies/exchange
accounting policy 348 exposures 435 investigations and litigation 453 rates 57 translation differences 41
Funding fair value adjustments 353 Funding sources (diversity) 168, 215 Funds transfer pricing 219 Funds under management 106
G Geographical regions 13,78 Global businesses 16, 63 Global Banking and Markets 16, 17, 22, 70, 381 Global functions 13 Global People Survey 19 Global Private Banking 4, 16, 18, 22, 72, 124 Glossary 470 Going concern 290, 348 Goodwill 407
accounting policy 407 critical accounting estimates and judgements 407 impairment 331
Governance 15, 27 Group Audit Committee 15, 277, 290 Group CEO
annual performance 316 biography 264 bonus scorecard 264 interests in shares 320 remuneration 313 remuneration history 319 responsibilities 270 review 7
Group Chairman biography 264 interest in shares 320 letter 263 responsibilities 270 statement 4
Group Chief Risk Officer annual performance 317 biography 267 bonus scorecard 323 interests in shares 320 remuneration 311, 313
Group Company Secretary biography 268 role 272
Group Finance Director annual performance 317 biography 267 bonus scorecard 323 interests in shares 320
remuneration 311, 313 Group Management Board 15, 276 Group Remuneration Committee 15, 284, 300, 307 Group Risk Committee 15, 280, 290 Growth priorities 66, 68, 71, 74 Guarantees 442
H Health and safety 291 Held for sale assets 349, 352
accounting policy 416 Highlights 3 HSBC Finance
foreclosures 153 loan modifications 154
HSBC Holdings plc balance sheet 341 cash flow 174, 221, 342 credit risk 161 deferred tax 370 Directors’ emoluments 364 dividends 370 employee compensation 364 financial assets and liabilities 389 financial instruments not at fair value 392 foreign exchange VaR 183 liquidity and funding 174 market risk 183 maturity analysis of assets and liabilities 432 net income from financial instruments 354 operating model 13 related parties 457 repricing gap maturities 185 share capital 439 statement of changes in equity 343 structural foreign exchange exposures 435 subordinated liabilities 425
Human rights 38
I Impairment
accounting policy 350 allowances 142, 159 assessment 212 available-for-sale financial assets 352 charges 29, 53, 141, 159 constant currency/reported reconciliation 158 critical accounting estimates and judgements 349 goodwill 407 impaired loans 137, 329 methodologies 213 movement by industry and geographical region 142 reported/adjusted reconciliation 44
Income statement (consolidated) 45, 335 Information on HSBC (availability thereof) 461 Insurance 190
accounting policy 354, 355 asset and liability matching 191 balance sheet of manufacturing subsidiaries 193 bancassurance model 190 claims incurred (net) and movements in liabilities to policyholders 53,
355 in 2014 191 net earned premiums 51 premium income 354 PVIF business 52 reinsurers’ share of liabilities 197 risk 116, 117, 194, 198
Intangible assets 410 accounting policy 410 movements 413
Interest income/expense (net) 46, 353 accounting policy 354 average balance sheet 46 sensitivities 181, 184
Interest rate derivatives 422 Interim management statements 459 Interim results 459 Internal control 288 Internet crime 123

HSBC HOLDINGS PLC
481
Str
ateg
ic R
epo
rt
Fi
nan
cial
Rev
iew
Co
rpo
rate
Go
vern
ance
Fin
anci
al S
tate
men
ts
S
har
eho
lder
Info
rmat
ion
IFRSs and Hong Kong Financial Reporting Standards comparison 345 Investment criteria 12 Investment properties 416 Investor relations 461
J Joint ventures 403, 406, 456
K Key management personnel 455 Key performance indicators 29, 30, 31, 32
L Latin America 101
adjusted performance 102 balance sheet data 104, 375 collateral 147 constant currency/reported reconciliation 158 country business highlights 102 customer accounts 61 economic background 101 financial overview 101 impaired loans 137 lending 131, 132, 160 loan impairment charges/allowances 141, 142 mortgage loans 156 operating expenses 103 personal lending 151 principal operations 101 profit 101, 104, 374 profit/(loss) by country 102 renegotiated loans 139, 140 reverse repos 151 risk-weighted assets 240 staff numbers 101 wholesale lending 144, 145
Lease commitments 442 accounting policy 442
Legal proceedings and regulatory matters 330, 446 risk 229
Lending – combined view 60 Leveraged finance transactions 383, 474 Leverage ratio 251, 255, 261 Liabilities
average balance sheet 46 by geographical region 375 constant currency/reported reconciliation 59 deferred tax 367 financial accounting/regulatory reconciliations 249 five years 57 maturity analysis 426 movement in 2014 58 of disposal groups 418 other 418 retirement benefits 359 subordinated 423, 476 total 57, 59, 337, 341, 427 trading 417 under insurance contracts 28, 419
Libor, Euribor and other rates investigations 452 Liquidity and funding 163, 215
assets 166 behaviouralisation 218 description 164 funds transfer pricing 219 in 2014 164 insurance 197 management of risk 114, 165 net contractual cash flows 166 policies and procedures 215 primary sources of funding 168 regulation 164
Loans and advances accounting policy 349 by country 160 by geographical region 131 by industry over 5 years 157 collateral 146, 150, 156, 171, 213 concentration of exposure 132
credit quality of 133 delinquency in the US 153 impairment 137, 141 past due but not impaired 136 renegotiated 138 to banks 291 to customers 30, 132 write-off 212
Loans Management Unit 213
M Madoff 447 Market capitalisation 1, 33 Market risk 114, 175, 221, 259
balance sheet linkages 179 description 176 governance 222 in 2014 176 insurance 194 measures 223 risk-weighting assets 244 sensitivity analysis 181
Material risk takers 300, 327 Maturity analysis of assets and liabilities 426 Maximum exposure to credit risk 130 Middle East and North Africa 91
adjusted performance 92 balance sheet data 94, 375 collateral 147 constant currency/reported reconciliation 158 country business highlights 92 customer accounts 61 economic background 91 financial overview 91 impaired loans 137 lending 131, 132, 160 loan impairment charges/allowances 141, 142 mortgage loans 156 operating expenses 93 personal lending 151 principal operations 91 profit 91, 94, 374 profit/(loss) by country 92 renegotiated loans 139, 140 risk-weighted assets 240 staff numbers 91 wholesale lending 144, 145
Model risk 25, 122, 223 Monitor 27 Mortgages
lending 152 mortgage-backed securities 214, 474 US mortgage-related investigations 449
N Nomination Committee 15, 284 Non-controlling interests 436 Non-GAAP measures 40 Non-interest income 353 Non-trading portfolios 178, 221, 225 North America 96
adjusted performance 97 balance sheet data 99, 375 collateral 147 constant currency/reported reconciliation 158 country business highlights 97 customer accounts 61 delinquency trends in the US 153 economic background 96 financial overview 96 impaired loans 137 lending 131, 132, 160 loan impairment charges/allowances 141, 142 mortgage lending 156 operating expenses 98 personal lending 151 principal operations 96 profit 96, 99, 374 profit/(loss) by country 97 renegotiated loans 139, 140

Shareholder information (continued) Index
HSBC HOLDINGS PLC
482
reverse repos 151 risk-weighted assets 240 staff numbers 96 wholesale lending 144
O Offsetting 130, 434
accounting policy 434 Oil and gas prices 125 Operating expenses 30, 42, 54
by geographical region 81, 88, 93, 96, 103 by global business 65, 68, 71, 73, 75 reported/adjusted reconciliation 44
Operating income 52, 353, 375, 376 Operating profit 356 Operational risk 115, 186, 259
in 2014 187 losses/incidents 188
Ordinary shares 294 Organisation 13 Organisational structure chart 462 Other 75 Outlook 6
P Paper use 37 Payment protection insurance 421 Pension plans 200, 237
accounting policy 359 defined benefit plans 183, 361 for directors 318 risk 116, 200
People risk 122 Performance 1, 5, 64
adjusted 29, 40, 65, 67, 70, 73, 75, 87, 92, 97, 102 reported 29, 64, 67, 70, 73, 75
Perpetual subordinated capital securities 370 Personal lending 151 Philanthropic and Community Investment Oversight Committee 15, 288 Pillar I, II and III 253, 258, 259, 260, 326 Ping An 77 Post-employment benefit plans 359, 456
accounting policy 359 Precious metals fix-related litigation and investigations 454 Preference shares 294, 437 Preferred securities 57 Prepayment, accrued income and other assets 416
accounting policy 416 Products and services 16, 371 Profit before tax 3, 28, 63, 76
by country 80, 85, 86, 92, 97, 102 by geographical region 44, 78, 79, 82, 84, 85, 89, 94, 96, 99, 101, 102,
104 by global business 44, 64, 65, 67, 70, 72, 73, 75, 76, 82, 89, 94, 99, 104consolidated 45 reported/adjusted reconciliation 44
Profit for the year 28, 335, 372 Property plant and equipment 107, 416
accounting policy 416 Provisions 420
accounting policy 420 critical accounting estimates and judgements 420
Purpose 1 PVIF 52, 411
R Ratios
advances to core funding 165, 169, 216 capital 239 capital strength 3, 31 common equity tier 1 31 core tier 1 (CET 1) 471 cost efficiency 3, 28, 55, 79, 84, 91, 96, 101, 104 customer advances to deposits 30 dividend payout 32 dividends per share 3 earnings per share 29, 45, 371 leverage 31, 251, 255, 261 return on average ordinary shareholders’ equity 3 return on average total assets 30
return on risk-weighted assets 32, 79, 84, 91, 96, 101 return on tangible equity 29 stressed coverage 165, 216
Reconciliation of reported and adjusted items 44 Reconciliation of RoRWA 62 Recovery and resolution 14, 255 Regulatory
balance sheet 248 capital 239, 258 capital buffers 252 CRD IV 470 developments 252 landscape 5 reconciliation to financial accounting 248 review of consumer enhancement services products 455 risk 119, 120 stress tests 125, 254, 257 structured banking reform 14, 255 systemically important banks 15, 252, 473 UK update 254
Related party transactions 455 Remuneration
adjustment, malus & clawback 306 benefits 311 bonus scorecards 323 business context 301 committee 284, 300 committee members 284, 307 Directors 73 exit factors 318 fixed pay 39, 40, 303, 311 GPSP 314 in 2014 318 in 2015/16 302, 322 letter 300 Pillar 3 remuneration policy 326 policy 35, 303, 304, 305, 306 report 307 reward strategy 34, 300 scenarios 313 single figure 311 variable pay 34, 309
Renegotiated loans 138, 154, 208 Renewable energy 37 Representations and warranties 162 Repricing gap 185 Repurchase and reverse repurchase agreements 48, 151, 219, 398
accounting policy 398 Reputational risk 115, 199 Resolution strategy 14 Retail Banking and Wealth Management 16, 22, 64
principal RBWM business 63 Revenue 29, 42
by country 81, 87, 92, 97, 102 by geographical region 81, 87, 92, 97, 102 by global business 65, 67, 70, 73, 75
Ring-fencing (UK) 14 Risk 111
appetite 25, 27, 205 banking risks 114 committee 16, 276, 280 compliance 115, 189 conduct of business 121 contingent liquidity 167 counterparty 150, 243, 261, 471 credit 114, 129, 196, 206 credit spread 178, 226 cross-currency 221 data management 123 de-peg 225 dispute 122 economic outlook 118 eurozone 126 execution 122 factors 113 fiduciary 115, 200 financial (insurance) 116, 194

HSBC HOLDINGS PLC
483
Str
ateg
ic R
epo
rt
Fi
nan
cial
Rev
iew
Co
rpo
rate
Go
vern
ance
Fin
anci
al S
tate
men
ts
S
har
eho
lder
Info
rmat
ion
foreign exchange 183 gap risk 225 geopolitical 118 governance 111, 204 in 2014 21 information security 123 insurance operations 116, 117, 190, 198 interest rate 181, 226 internet crime 123 investigations 120 legal 229 liquidity and funding 114, 197 management 24, 112, 117, 215 market 114 model 25, 122, 223 oil and gas prices 125 operational 115 overview 21 people 122 pension 116, 200 policies and practices 204 profile 111, 117 refinance 214 regulatory 119, 120 reputational 115, 199 Russia 126 security and fraud 187, 230 stress testing 117 sustainability 116, 201 systems 231 third party 124 top and emerging 22, 111, 118 vendor 190, 231
Risk-weighted assets 31, 62, 260, 476 adjusted reconciliation 62 by geographical region 78 by global businesses 63 developments 254 five year trend 57 movement in 2014 239-244 run-off portfolios 32 targets 257
RoRWA (reconciliation of measures) 62, 79, 84 Russia 126
S Sale and repurchase agreements 398, 476
accounting policy 398 Securities litigation 446 Securitisation
exposures 161, 214, 445 litigation 449
Security and fraud risk 187, 230 Segmental analysis 371
accounting policy 371 Senior management
biographies 268 emoluments 324
Sensitivities to non-economic assumptions (insurance) 198 Share-based payments 357
accounting policy 357 Share capital 294, 437
accounting policy 437 five year trend 57 in 2014 296 notifiable interests 298 rights and obligations 294 treasury shares 297
Share information 33
Share options 321, 359 Share plans
for directors 297, 320 for employees 292, 296
Shareholder (communications with) 460 numbers 1 profile 458
Significant items (other) 42, 47, 49, 51, 52, 54 Sources of funds 168 Standards (Global) 26, 27 Statement of changes in equity 339 Statement of comprehensive income 336 Stock symbols 461 Strategy 1, 11, 26, 64, 67, 70, 72 Streamlining 27 Stress testing 117, 125, 216, 224 Stressed coverage ratios 165, 216 Structural banking reform 14, 255 Structural foreign exchange exposure 181, 226, 435 Structured entities 415, 443, 476
accounting policy 443 Subordinated loan capital 57 Subsidiaries 413, 440
accounting policy 413 Sustainable savings 32 Sustainability 9, 36
committee 286 risk 116, 201
Systemically important banks 15, 255, 473 Systems risk 231, 477
T Targets 32 Tax 365
accounting policy 365 collected for government 33 critical accounting estimates and judgements 366 deferred tax 331, 365, 366, 367, 368 expense 56 of shares and dividends 463 paid 33 paid by region and country 106 reconciliation 366 tax and broker-dealer investigations 451
Three lines of defence 112, 186 Tier 1 capital 258, 425, 438, 477 Total loss absorbing capacity 256 Total shareholder return 33, 319 Trading assets 377
accounting policy 377 Trading income (net) 49, 353 Trading liabilities 417
accounting policy 417 Trading portfolios 176, 221, 225
U Unobservable inputs 386
V Value at risk 176, 178, 223 Value creation 9 Values (HSBC) 10, 19 Vendor risk management 231 Volunteering 37
W Whistleblowing 20, 287 Wholesale funding 169, 218 Wholesale lending 144

HSBC HOLDINGS PLC
484
HSBC HOLDINGS PLC Incorporated in England on 1 January 1959 with limited
liability under the UK Companies Act Registered in England: number 617987
REGISTERED OFFICE AND GROUP HEAD OFFICE 8 Canada Square
London E14 5HQ United Kingdom Telephone: 44 020 7991 8888 Facsimile: 44 020 7992 4880 Web: www.hsbc.com
REGISTRARS Principal Register
Computershare Investor Services PLC The Pavilions Bridgwater Road Bristol BS99 6ZZ United Kingdom Telephone: 44 0870 702 0137 Email: via website Web: www.investorcentre.co.uk/contactus
Hong Kong Overseas Branch Register
Computershare Hong Kong Investor Services Limited
Rooms 1712-1716, 17th floor Hopewell Centre 183 Queen’s Road East Hong Kong Telephone: 852 2862 8555
Email: [email protected] Web: www.computershare.com/hk/investors Bermuda Overseas Branch Register
Investor Relations Team HSBC Bank Bermuda Limited 6 Front Street Hamilton HM11 Bermuda Telephone: 1 441 299 6737 Email: [email protected] Web: www.computershare.com/investor/bm
ADR Depositary The Bank of New York Mellon Depositary Receipts PO Box 43006 Providence, RI 02940-3006 USA Telephone (US): 1 877 283 5786
Telephone (International): 1 201 680 6825 Email: [email protected] Web: www.bnymellon.com/shareowner Paying Agent (France)
HSBC France 103 avenue des Champs Elysées 75419 Paris Cedex 08 France Telephone: 33 1 40 70 22 56 Email: ost-agence-des-titres-hsbc-reims.hbfr- [email protected]
Web: www.hsbc.fr
STOCKBROKERS Goldman Sachs International
Peterborough Court 133 Fleet Street London EC4A 2BB United Kingdom
Credit Suisse Securities (Europe) Limited
1 Cabot Square London E14 4QT United Kingdom
HSBC Bank plc
8 Canada Square London E14 5HQ United Kingdom

t
This document comprises the Annual Report and Accounts 2014 for HSBC Holdings plc and its subsidiaries. It contains the Strategic Report, the Report of the Directors, the Directors’ Remuneration Report and the Financial Statements, together with the Independent Auditor’s Report thereon, as required by the UK Companies Act 2006 (Strategic Report and Directors’ Report) Regulations 2013. The Strategic Report on pages 1 to 39, the Report of the Directors on pages 40 to 299 and the Directors’ Remuneration Report on pages 300 to 327 have each been drawn up in accordance with the requirements of English law, and liability in respect thereof is also governed by English law.
Additional information, including commentary on 2013 compared with 2012, may be found in the Form 20-F filed with the US Securities and Exchange Commission (‘SEC’) and available on www.hsbc.com and www.sec.gov.
Certain defined terms
Unless the context requires otherwise, ‘HSBC Holdings’ means HSBC Holdings plc and ‘HSBC’, the ‘Group’, ‘we’, ‘us’ and ‘our’ refer to HSBC Holdings together with its subsidiaries. Within this document the Hong Kong Special Administrative Region of the People’s Republic of China is referred to as ‘Hong Kong’. When used in the terms ‘shareholders’ equity’ and ‘total shareholders’ equity’, ‘shareholders’ means holders of HSBC Holdings ordinary shares and those preference shares and capital securities issued by HSBC Holdings classified as equity. The abbreviations ‘US$m’ and ‘US$bn’ represent millions and billions (thousands of millions) of US dollars, respectively.
Financial statements
The consolidated financial statements of HSBC and the separate financial statements of HSBC Holdings have been prepared in accordance with International Financial Reporting Standards (‘IFRSs’) as issued by the International Accounting Standards Board (‘IASB’) and as endorsed by the European Union (‘EU’). EU endorsed IFRSs could differ from IFRSs as issued by the IASB if, at any point in time, new or amended IFRSs were not to be endorsed by the EU. At 31 December 2014, there were no unendorsed standards effective for the year ended 31 December 2014 affecting these consolidated and separate financial statements, and there was no difference between IFRSs endorsed by the EU and IFRSs issued by the IASB in terms of their application to HSBC. Accordingly, HSBC’s financial statements for the year ended 31 December 2014 are prepared in accordance with IFRSs as issued by the IASB.
We use the US dollar as our presentation currency because the US dollar and currencies linked to it form the major currency bloc in which we transact and fund our business. Unless otherwise stated, the information presented in this document has been prepared in accordance with IFRSs.
When reference to ‘adjusted’ is made in tables or commentaries, the comparative information has been expressed at constant currency (see page 40), the impact of fair value movements in respect of credit spread charges on HSBC’s own debt has been eliminated and the effects of other significant items have been adjusted as reconciled on page 44. Adjusted return on risk-weighted assets is defined and reconciled on page 62.
Financial Statements 328 Statement of Directors’ Responsibilities 329 Independent Auditor’s Report 334 Financial Statements 345 Notes on the Financial Statements
Shareholder Information 458 Shareholder information 466 Abbreviations 470 Glossary 478 Index
Strategic Report 1 Overview 2 Cautionary statement regarding forward-looking statements 3 Highlights 4 Group Chairman’s Statement 7 Group Chief Executive’s Review 9 Strategic objectives 12 Business model 26 Strategic priorities 28 Outcomes
Report of the Directors Financial Review
40 Financial summary 63 Global businesses 78 Geographical regions 106 Other information 111 Risk 238 Capital
Corporate Governance
263 Corporate Governance Report 264 Biographies of Directors and senior management 270 Board of Directors 276 Board committees 288 Internal control 290 Going concern 291 Employees
Directors’ Remuneration Report 300 Directors’ Remuneration Report
© Copyright HSBC Holdings plc 2015 All rights reserved
No part of this publication may be reproduced, stored in a retrieval system, or transmitted, in any form or by any means, electronic, mechanical, photocopying, recording, or otherwise, without the prior written permission of HSBC Holdings plc.
Published by Group Finance, HSBC Holdings plc, London
Cover designed by Black Sun Plc, London; text pages designed by Black Sun Plc and Group Finance, HSBC Holdings plc, London
Printed by DG3 Asia Limited, Hong Kong, on Revive 100 White Offset paper using vegetable oil-based inks. Made in Austria, the paper comprises 100% de-inked post-consumer waste. Pulps used are totally chlorine-free.
The FSC® logo identifies products which contain wood from well-managed forests certified in accordance with the rules of the Forest Stewardship Council®.
Photography Cover: (top) HSBC Archives; (bottom) Matthew Mawson Group Chairman and Group Chief Executive by George Brooks
GPS 15011902

Connecting customers toopportunities for 150 years
HSBC Holdings plc8 Canada SquareLondon E14 5HQUnited KingdomTelephone: 44 020 7991 8888www.hsbc.com
H
SB
C H
old
ing
s plc
An
nu
al Rep
ort an
d A
ccou
nts 2014
HSBC Holdings plc Annual Report and Accounts 2014
HSBC: then and nowIt is 150 years since HSBC was founded in Hong Kong to finance trade between Asia and Europe. Much has changed since then, as our cover photos demonstrate. The top photo shows Hong Kong harbour, with the HSBC office (extreme left) a few years after it was established in 1865. The bottom image shows the harbour today, with the HSBC building sixth from left (partially hidden).
Hong Kong has been transformed both physically and economically, from trading outpost to international financial centre. HSBC has mirrored Hong Kong’s rise to global prominence, growing from
a small regional trading bank into one of the world’s largest banking and financial services organisations today.
HSBC’s Hong Kong office is still at 1 Queen’s Road Central, as it was in 1865. The current HSBC building is the fourth to occupy the site, but the values on which the bank was founded remain the same. HSBC still aims to be where the growth is, connecting customers to opportunities, enabling businesses to thrive and economies to prosper, and helping people to fulfil their hopes and realise their ambitions.
We are proud to have served our customers with distinction for 150 years.

HSBC HOLDINGS PLC
(WEBSITE ONLY) EMPLOYEE SHARE PLANS
31 December 2014

Employee Share Plans
HSBC HOLDINGS PLC
1
In accordance with the terms of a waiver granted by the Hong Kong Stock Exchange on 24 December 2010, full details of options under Employee Share Plans required pursuant to Listing Rules 17.07 and 17.09 are disclosed below. These disclosures are also available on the Hong Kong Stock Exchange’s website at www.hkex.com.hk and can be obtained upon request from the Group Company Secretary, 8 Canada Square, London E14 5HQ.
Employee share plans
Share options and discretionary awards of shares are granted under HSBC share plans to help align the interests of employees with those of shareholders.
Set out on pages 2 to 4 are particulars of outstanding share options, including those held by employees working under employment contracts that are regarded as ‘continuous contracts’ for the purposes of the Hong Kong Employment Ordinance. The options were granted at nil consideration. No options have been granted to substantial shareholders, suppliers of goods or services, or in excess of the individual limit for each share plan. No options were cancelled by HSBC during the year.
Employee share plans are subject to the following limits on the number of HSBC Holdings ordinary shares that may be subscribed for. In any 10-year period not more than 10% of HSBC Holdings ordinary shares in issue from time to time (approximately 1,922 million HSBC Holdings ordinary shares at 23 February 2015) may be issued or committed to be issued under the HSBC Share Plan 2011 and all other employee share plans operated by HSBC Holdings. In any 10-year period not more than 5% of HSBC Holdings ordinary shares in issue from time to time (approximately 961 million HSBC Holdings ordinary shares on 23 February 2015) may be issued or committed to be issued under the HSBC Share Plan 2011 and all other discretionary share plans adopted by HSBC Holdings. The number of HSBC Holdings ordinary shares which may be issued upon exercise of all options under the HSBC Share Plan 2011 and options granted under any other employee share plan operated by HSBC Holdings must not exceed 1,781,741,789 HSBC Holdings ordinary shares. Under the HSBC Holdings savings-related share option plans, the HSBC Share Plan and HSBC Holdings Group Share Option Plan there were options outstanding over 72,825,654 HSBC Holdings ordinary shares at 31 December 2014 (0.38% of the issued ordinary shares). The number of shares which may be issued upon exercise of options under the HSBC Share Plan 2011 and options granted under any other employee share plan operated by HSBC Holdings outstanding at any one time must not exceed 30% of the shares in issue from time to time. No further options may be granted under any such plan if this will result in the limit being exceeded. Particulars of options over HSBC Holdings shares held by Directors of HSBC Holdings are set out on page 320 of the Directors’ Remuneration Report in the Annual Report and Accounts 2014.
The effect on earnings per share of granting share options and share awards which are satisfied by the issue of new shares is shown in diluted earnings per share on the face of the consolidated income statement, with further details disclosed in the Earnings per share Note 10 on the Financial Statements in the Annual Report and Accounts 2014.
All-employee share plans
The HSBC Holdings Savings-Related Share Option Plan and the HSBC Holdings Savings-Related Share Option Plan: International are all-employee share option plans under which eligible employees have been granted options to acquire HSBC Holdings ordinary shares. There will be no further grant of options under the HSBC Holdings Savings-Related Share Option Plan: International; the final grant was in 2012. A new international all-employee share purchase plan was launched in the third quarter of 2013.
For options granted under the HSBC Holdings Savings-Related Option Plan, employees may make contributions of up to £500 each month over a period of three or five years which may be used within six months following the third or fifth anniversary of the commencement of the relevant savings contract, at the employee’s election, to exercise the options. Alternatively, the employee may elect to have the savings, plus (where applicable) any interest or bonus, repaid in cash. In the case of redundancy, retirement on grounds of injury or ill health, retirement, the transfer of the employing business to another party, or a change of control of the employing company, options may be exercised before completion of the relevant savings contract. In certain circumstances, the exercise period of options awarded under the all-employee share option plans may be extended, for example, on the death of a participant, the executors may exercise the option up to six months beyond the normal exercise period.
The terms set out in the preceding paragraph also applied to options granted up to April 2012 under the HSBC Holdings Savings-Related Share Option Plan: International with the exception that contributions were capped at the equivalent of £250. In addition, employees granted options under the HSBC Holdings Savings-Related Share Option Plan: International could elect to make monthly contributions over a period of one year which were exercisable within three months following the first anniversary of the commencement of the savings contract.
Under the HSBC Holdings Savings-Related Share Option Plan and the HSBC Holdings Savings-Related Share Option Plan: International the option exercise price is determined by reference to the average market value of HSBC Holdings ordinary shares on the five business days immediately preceding the invitation date, then applying a discount of 20% (for details on each plan see tables on pages 2 to 3 for further information) (except for the one-year options granted under the US sub-plan where a 15% discount has applied). Where applicable, the US dollar, Hong Kong dollar and euro exercise prices were converted from the sterling exercise price at the applicable exchange rate on the working day preceding the relevant

Employee Share Plans (continued)
HSBC HOLDINGS PLC
2
invitation date. The closing price per HSBC Holdings ordinary share on 22 September 2014, the day before options were granted in 2014 under the HSBC Holdings Savings-Related Share Option Plan was £6.58.
There will be no further grants under the HSBC Holdings Savings-Related Share Option Plan: International. A new international all employee share purchase plan was launched in the third quarter of 2013. The HSBC Holdings Savings-Related Share Option Plan and the HSBC Holdings Savings-Related Share Option Plan: International will terminate on 27 May 2015 unless the Directors resolve to terminate the plans at an earlier date.
HSBC Holdings Savings-Related Share Option Plan
HSBC Holdings ordinary shares
Date of award Exercise price (£)
At 1 Jan 2014
Granted during
year
Exercised during
year1
Lapsed during
year
At 31 Dec
2014
Exercisable
from until 30 Apr 2008 5.9397 1 Aug 2013 1 Feb 2014 76,623 – 46,621 30,002 –
29 Apr 2009 3.3116 1 Aug 2014 1 Feb 2015 22,639,846 – 21,808,763 204,048 627,035
21 Apr 2010 5.4573 1 Aug 2013 1 Feb 2014 210,336 – 147,385 62,951 –
21 Apr 2010 5.4573 1 Aug 2015 1 Feb 2016 1,268,403 – 44,806 65,067 1,158,530
20 Apr 2011 5.0971 1 Aug 2014 1 Feb 2015 2,870,885 – 2,522,957 123,499 224,429
20 Apr 2011 5.0971 1 Aug 2016 1 Feb 2017 1,438,431 – 39,203 90,802 1,308,426
24 Apr 2012 4.4621 1 Aug 2015 1 Feb 2016 13,491,512 – 426,112 1,035,080 12,030,320
24 Apr 2012 4.4621 1 Aug 2017 1 Feb 2018 3,518,307 – 44,214 246,579 3,227,514
20 Sep 2013 5.4738 1 Nov 2016 1 May 2017 6,477,354 – 15,472 1,127,476 5,334,406
20 Sep 2013 5.4738 1 Nov 2018 1 May 2019 1,959,189 – 1,892 318,266 1,639,031
23 Sep 2014 5.1887 1 Nov 2017 1 May 2018 – 18,553,870 – 367,085 18,186,785
23 Sep 2014 5.1887 1 Nov 2019 1 May 2020 – 10,134,833 – 127,354 10,007,479
53,950,886 28,688,703 25,097,425 3,798,209 53,743,955
1 The weighted average closing price of the shares immediately before the dates on which options were exercised was £6.36.
HSBC Holdings Savings-Related Share Option Plan: International
HSBC Holdings ordinary shares
Date of award
Exercise Price (£)
At 1 Jan 2014
Exercised during
year1
Lapsed during
year
At 31 Dec
2014 Exercisable
from until 30 Apr 2008 5.9397 1 Aug 2013 1 Feb 2014 53,915 21,930 31,985 –
29 Apr 2009 3.3116 1 Aug 2014 1 Feb 2015 5,521,719 4,985,327 150,469 385,923
21 Apr 2010 5.4573 1 Aug 2013 1 Feb 2014 151,634 93,490 58,144 –
21 Apr 2010 5.4573 1 Aug 2015 1 Feb 2016 218,919 1,094 14,895 202,930
20 Apr 2011 5.0971 1 Aug 2014 1 Feb 2015 685,034 485,431 110,080 89,523
20 Apr 2011 5.0971 1 Aug 2016 1 Feb 2017 186,806 – 34,153 152,653
24 Apr 2012 4.4621 1 Aug 2015 1 Feb 2016 2,669,788 36,791 244,637 2,388,360
24 Apr 2012 4.4621 1 Aug 2017 1 Feb 2018 534,635 1,120 38,845 494,670
10,022,450 5,625,183 683,208 3,714,059

Employee Share Plans (continued)
HSBC HOLDINGS PLC
3
HSBC Holdings Savings-Related Share Option Plan: International (continued)
HSBC Holdings ordinary shares
Date of award
Exercise price (US$)
At 1 Jan 2014
Exercised during
year1
Lapsed during
year
At 31 Dec
2014
Exercisable
from until 30 Apr 2008 11.8824 1 Aug 2013 1 Feb 2014 43,932 – 43,932 –
29 Apr 2009 4.8876 1 Aug 2014 1 Feb 2015 1,497,456 1,222,861 98,833 175,762
21 Apr 2010 8.1232 1 Aug 2013 1 Feb 2014 216,423 59,605 156,818 –
21 Apr 2010 8.1232 1 Aug 2015 1 Feb 2016 129,756 – 14,291 115,465
20 Apr 2011 8.2094 1 Aug 2014 1 Feb 2015 447,961 228,821 73,723 145,417
20 Apr 2011 8.2094 1 Aug 2016 1 Feb 2017 111,396 – 13,979 97,417
24 Apr 2012 7.1456 1 Aug 2015 1 Feb 2016 1,261,942 14,404 142,080 1,105,458
24 Apr 2012 7.1456 1 Aug 2017 1 Feb 2018 288,203 3,147 57,247 227,809
(€) 3,997,069 1,528,838 600,903 1,867,328
(€) 30 Apr 2008 7.5571 1 Aug 2013 1 Feb 2014 8,329 – 8,329 –
29 Apr 2009 3.6361 1 Aug 2014 1 Feb 2015 843,087 795,030 4,755 43,302
21 Apr 2010 6.0657 1 Aug 2013 1 Feb 2014 15,417 10,363 5,054 –
21 Apr 2010 6.0657 1 Aug 2015 1 Feb 2016 37,852 – 3,287 34,565
20 Apr 2011 5.7974 1 Aug 2014 1 Feb 2015 151,415 125,770 7,364 18,281
20 Apr 2011 5.7974 1 Aug 2016 1 Feb 2017 44,841 – 3,008 41,833
24 Apr 2012 5.3532 1 Aug 2015 1 Feb 2016 384,509 3,828 27,400 353,281
24 Apr 2012 5.3532 31 Aug 2017 1 Feb 2018 89,202 186 8,776 80,240
(HK$) 1,574,652 935,177 67,973 571,502
30 Apr 2008 92.5881 1 Aug 2013 1 Feb 2014 13,316 – 13,316 –
29 Apr 2009 37.8797 1 Aug 2014 1 Feb 2015 17,205,856 16,783,784 148,192 273,880
21 Apr 2010 62.9770 1 Aug 2013 1 Feb 2014 82,670 58,016 24,654 –
21 Apr 2010 62.9770 1 Aug 2015 1 Feb 2016 220,985 2,565 18,103 200,317
20 Apr 2011 63.9864 1 Aug 2014 1 Feb 2015 384,366 305,638 8,983 69,745
20 Apr 2011 63.9864 1 Aug 2016 1 Feb 2017 162,426 1,770 10,119 150,537
24 Apr 2012 55.4701 1 Aug 2015 1 Feb 2016 5,466,147 52,198 261,533 5,152,416
24 Apr 2012 55.4701 1 Aug 2017 1 Feb 2018 679,575 3,027 54,661 621,887
24,215,341 17,206,998 539,561 6,468,782
1 The weighted average closing price of the shares immediately before the dates on which options were exercised was £6.36.
Discretionary Share Plans
Note 6 on the Financial Statements in the Annual Report and Accounts 2014 gives detail on share-based payments, including discretionary awards granted under HSBC’s share plans.
Restricted Share awards may be granted on a discretionary basis to senior executives and are the delivery mechanism for the Group’s bonus deferral policy. A conditional award of a Restricted Share defines the number of shares to which the employee will become entitled, generally up to three years from the date of the award, and normally subject to the individual remaining in employment. In some cases the employee’s entitlement depends upon the satisfaction of a performance condition.
The Group Performance Share Plan (‘GPSP’) and fixed pay allowances are incorporated in the HSBC Share Plan 2011. See page 303 of the Annual Report and Accounts 2014 for further details.
The maximum value of awards or options that may be granted to an employee in any one year under the HSBC Share Plan 2011 is 600% of the employee’s annual salary. For the purpose of the limit, any Restricted Share awards made on or shortly after the commencement of employment or in substitution for all or any part of any bonus to which the employee would otherwise have been entitled, are excluded.
Since September 2005, no discretionary share options have been granted. There are no performance conditions that remain to be satisfied for the exercise of outstanding discretionary share options. Options are generally exercisable between the third and the tenth anniversary of the date of grant.
The exercise price of options granted under the HSBC Share Plan, and the HSBC Holdings Group Share Option Plan, is the higher of the average market value of the ordinary shares on the five business days prior to the grant of the option or the market value of the ordinary shares on the date of grant of the option, or the nominal value of a share.

Employee Share Plans (continued)
HSBC HOLDINGS PLC
4
Discretionary Share Option Plans
Date of award Exercise price (£)
Exercisable
HSBC Holdings ordinary shares
At 1 Jan 2014
Exercised during year
Lapsed during year
At 31 Dec 2014 from until
HSBC Holdings Group Share Option Plan1,2
30 Apr 2004 7.2181 30 Apr 2007 30 Apr 2014 48,256,628 1,434 48,255,194 –
27 Aug 2004 7.5379 27 Aug 2007 27 Aug 2014 281,651 – 281,651 –
20 Apr 2005 7.2869 20 Apr 2008 20 Apr 2015 6,487,589 – 113,607 6,373,982
55,025,868 1,434 48,650,452 6,373,982
HSBC Share Plan
30 Sep 2005 7.9911 30 Sep 2008 30 Sep 2015 86,046 – – 86,046
1 The HSBC Holdings Group Share Option Plan expired on 26 May 2005 and the HSBC Share Plan expired on 27 May 2011. No options have been granted
under the HSBC Share Plan 2011. 2 The weighted average closing price of the shares immediately before the dates on which options were exercised was £6.09.