Connecting Brazil to the world: A path to inclusive growth
104
McKinsey Global Institute Connecting Brazil to the world: A path to inclusive growth May 2014
-
Upload
khangminh22 -
Category
Documents
-
view
2 -
download
0
Transcript of Connecting Brazil to the world: A path to inclusive growth

McKinsey Global Institute
Connecting B
razil to the world: A
path to inclusive growth
McK
insey Global Institute
Connecting Brazil to the world: A path to inclusive growth
May 2014

Copyright © McKinsey & Company 2014
The McKinsey Global Institute
The McKinsey Global Institute (MGI), the business and economics research arm of McKinsey & Company, was established in 1990 to develop a deeper understanding of the evolving global economy. Our goal is to provide leaders in the commercial, public, and social sectors with the facts and insights on which to base management and policy decisions.
MGI research combines the disciplines of economics and management, employing the analytical tools of economics with the insights of business leaders. Our “micro-to-macro” methodology examines microeconomic industry trends to better understand the broad macroeconomic forces affecting business strategy and public policy. MGI’s in-depth reports have covered more than 20 countries and 30 industries. Current research focuses on six themes: productivity and growth; natural resources; labor markets; the evolution of global financial markets; the economic impact of technology and innovation; and urbanization. Recent reports have assessed job creation, resource productivity, cities of the future, the economic impact of the Internet, and the future of manufacturing.
MGI is led by three McKinsey & Company directors: Richard Dobbs, James Manyika, and Jonathan Woetzel. Michael Chui, Susan Lund, and Jaana Remes serve as MGI partners. Project teams are led by the MGI partners and a group of senior fellows, and include consultants from McKinsey & Company’s offices around the world. These teams draw on McKinsey & Company’s global network of partners and industry and management experts. In addition, leading economists, including Nobel laureates, act as research advisers.
The partners of McKinsey & Company fund MGI’s research; it is not commissioned by any business, government, or other institution. For further information about MGI and to download reports, please visit www.mckinsey.com/mgi.

McKinsey Global Institute
Connecting Brazil to the world: A path to inclusive growth
Heinz-Peter ElstrodtJames ManyikaJaana RemesPatricia EllenCésar Martins
May 2014

Preface
As Brazil steps into the international spotlight as host of the 2014 World Cup and the 2016 Olympics, it is also celebrating a quarter century of democracy and political stability. The nation’s official poverty rate has been cut by half since 2003. Its rich resource endowments ensure that Brazil will remain one of the world’s leading exporters of commodities for years to come.
But after a decade of rapid growth and falling poverty rates, the economy has been losing momentum. Millions who are striving to attain a real middle-class life remain frustrated by weak income growth and the high price of consumer goods. To raise their living standards, Brazil needs to find a new formula for accelerating growth.
Building deeper connections with the rest of the global economy could provide the opening to do just that. This will involve shifting the focus from protecting local industries to strengthening their competitiveness in global markets—a shift that will challenge Brazilian companies to evolve. The imperative to become more connected is not solely a question of trade and finance, however. Brazil also needs to tap into advanced skills, knowledge, technology, talent, and best practices from around the world. Focusing on innovation could allow Brazil to develop new strengths in higher-value-added products and services, eventually becoming a more diversified and resilient economy.
This report builds on a large body of MGI research on productivity, competitiveness, natural resources, and the evolving interconnections in the global economy. The research was led by Jaana Remes, an MGI partner; Heinz-Peter Elstrodt, a director based in McKinsey’s São Paulo office; and Patricia Ellen, a McKinsey partner in the Rio de Janeiro office; along with James Manyika, a director of MGI. César Martins led the project team, which consisted of Beatriz Federico, Guilherme Jardim, and Henrique Weaver.
We are grateful to Lisa Renaud for her editorial support and to other members of the MGI team—including Tim Beacom, Marisa Carder, Deadra Henderson, Julie Philpot, Gabriela Ramirez, and Rebeca Robboy—for their contributions. Thanks also go to our MGI research colleagues, including Eduardo Doryan Jara, Sebastian Jauch, Susan Lund, Anu Madgavkar, Jan Mischke, Moira Pierce, David Poulter, Fraser Thompson, Frederic Wagner, Amber Yang, and all the other McKinsey colleagues who supported our research.
We would also like to thank members of the São Paulo office who supported the team throughout the research, including Georges Almeida, Vicente Assis, Julia Broide, Nicola Calicchio, Florence Cheung, Andre Coutinho, Roberto Fantoni, Arlindo Eira Filho, Marcus Frank, Antônio Novas Garcia, Ricardo Giamattey, João Guillaumon, Svein Harald, William Jones, Fernanda Mayol, Pedro Maffei, Bruno Silva, Thomas Troiano, Aris Tsikouras, and Thiago Vasconcelos.

We benefited from the perspectives of our distinguished academic advisers, including Martin N. Baily, the Bernard L. Schwartz Chair in Economic Policy Development at the Brookings Institution; and Richard Cooper, Maurits C. Boas professor of international economics at Harvard University. We also extend our sincere thanks to the Brazilian economists and business leaders who generously shared their time, expertise, and guidance.
This report contributes to MGI’s mission to help business and policy leaders understand the forces transforming the global economy, identify strategic locations, and prepare for the next wave of growth. As with all MGI research, this report is independent and has not been commissioned or sponsored in any way by any business, government, or other institution. We welcome your comments on the research at [email protected].
Richard Dobbs Director, McKinsey Global Institute London
James Manyika Director, McKinsey Global Institute San Francisco
Jonathan Woetzel Director, McKinsey Global Institute Shanghai
May 2014


Brazil in the global economy today . . .
7thamong world’s largest economies by GDP
… but 95th in GDP per capita
7thin global FDI inflows
… but 30th in outflows
Share in global non-oil resource exports rose
from 5% in 2002 to 9% in 2012
Ranked 43rdin MGI’s Connectedness Index
Ranked 124th by World Bank for ease of trading across borders
Ranked 114th by World Economic Forum for quality of infrastructure
. . . and the opportunity it could realize through greater global connections
Up to 1.25% potential boost to annual GDP growth


Contents
Executive summary 1
1. Confronting Brazil’s productivity challenge 17
2. Understanding Brazil’s opportunities in global markets 35
3. Broadening Brazil’s global connections to jumpstart innovation 61
4. How Brazil can connect and grow 71
Bibliography 87

Executive summary
Just a few short years ago, Brazil was brimming with optimism, as rising global demand for resources led to an export and consumption boom. Thanks to an expansion of the social safety net and falling unemployment, the official poverty rate was cut in half. When GDP growth hit 7.5 percent in 2010, it seemed that finally the “sleeping giant” was wide awake.
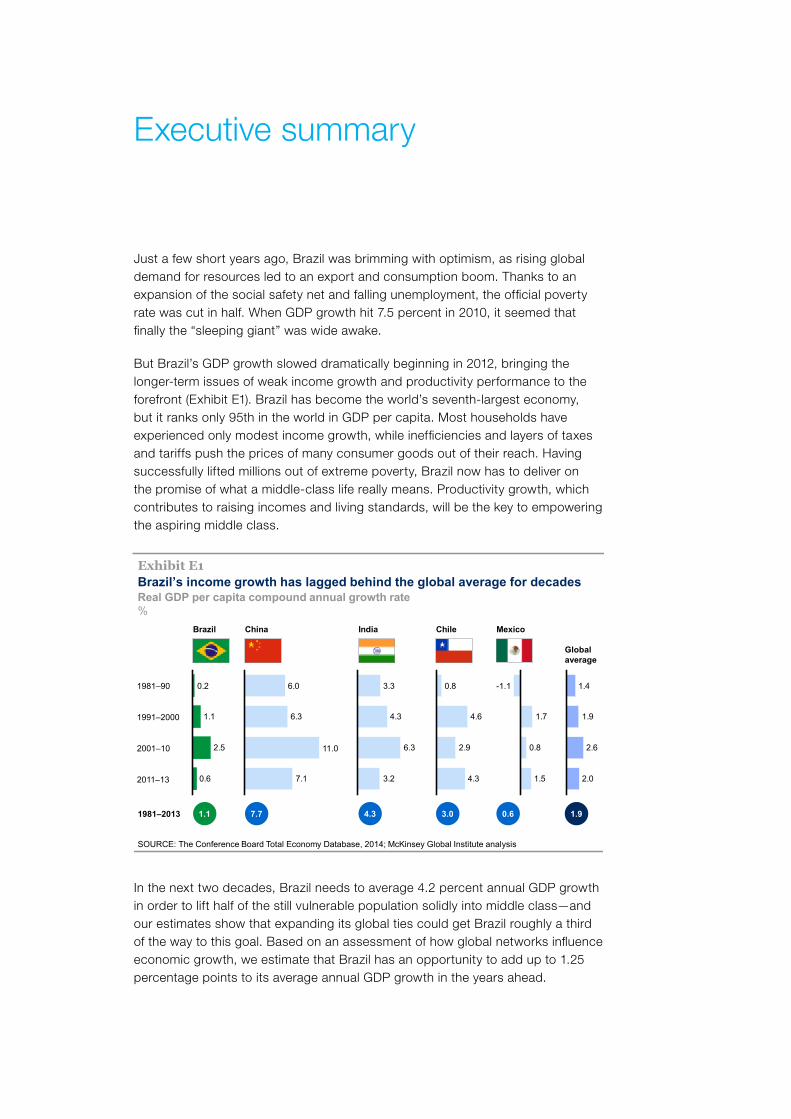
But Brazil’s GDP growth slowed dramatically beginning in 2012, bringing the longer-term issues of weak income growth and productivity performance to the forefront (Exhibit E1). Brazil has become the world’s seventh-largest economy, but it ranks only 95th in the world in GDP per capita. Most households have experienced only modest income growth, while inefficiencies and layers of taxes and tariffs push the prices of many consumer goods out of their reach. Having successfully lifted millions out of extreme poverty, Brazil now has to deliver on the promise of what a middle-class life really means. Productivity growth, which contributes to raising incomes and living standards, will be the key to empowering the aspiring middle class.
Exhibit E1
Real GDP per capita compound annual growth rate%
Brazil’s income growth has lagged behind the global average for decades
SOURCE: The Conference Board Total Economy Database, 2014; McKinsey Global Institute analysis
0.6
2.5
1.1
0.21981–90
1991–2000
2011–13
2001–10
7.1
6.3
6.0
11.0
3.2
6.3
4.3
3.3
4.3
2.9
4.6
0.8
1.5
0.8
1.7
-1.1
2.0
2.6
1.9
1.4
Brazil China India Chile Mexico
Global average
1981–2013 1.1 7.7 4.3 3.0 0.6 1.9
In the next two decades, Brazil needs to average 4.2 percent annual GDP growth in order to lift half of the still vulnerable population solidly into middle class—and our estimates show that expanding its global ties could get Brazil roughly a third of the way to this goal. Based on an assessment of how global networks influence economic growth, we estimate that Brazil has an opportunity to add up to 1.25 percentage points to its average annual GDP growth in the years ahead.

2 Executive summary
Deeper integration into global markets and networks could provide competitive pressures that spur Brazilian companies to innovate, invest, and modernize. For decades, Brazil’s economic policy has focused on protecting local industries and drawing on the strength of its vast and expanding domestic market. But its inward focus has come at a cost to international competitiveness. As Brazil prepares to welcome the world to two major global events, this is an opportune moment to reconsider that inward focus.
This year also marks a half century since the beginning of a period of military dictatorship—and a quarter century since dictatorship gave way to democratic elections. Brazil finds itself at another turning point today, facing a choice between maintaining the isolation of the past or embracing the opportunities that are emerging in a more deeply interconnected and knowledge-intensive global economy.
Seizing these opportunities will require addressing some of the country’s long-standing and homemade barriers to growth, from infrastructure shortfalls to a byzantine tax and regulatory structure. But it will also involve looking to the future by reorienting trade policy toward key markets and finding more effective ways to harness natural resource wealth for investment. Brazil can take a new approach to its growth policies by following the blueprint it has already established in successfully opening its agriculture sector and building a globally competitive aerospace firm. It can also foster a culture of entrepreneurship and innovation to provide the economy with a much-needed jolt of dynamism. Today Brazil needs a new catalyst for growth that can deliver broad-based prosperity to the vast majority of its citizens—and that catalyst could be found beyond its borders.
The tailwinds that lifted Brazil’s economy are slowing
Brazil has made great strides in economic development. The most striking achievement has been a dramatic reduction in the official poverty rate, driven in large part by the Bolsa Familia program. Yet there is growing concern about the country’s ability to sustain growth over the long term, as the trends that lifted the economy over the past decade are losing steam.
A commodities boom fueled much of Brazil’s recent GDP growth; the country’s share of global non-oil resource exports rose from 5 percent in 2002 to 9 percent in 2012.1 Today commodity prices remain high compared with their historic averages, but the exceptional surge in both demand and prices has leveled off. Brazil will benefit from its resource endowments for decades to come, but it cannot count on a continued boom. It could, however, make more effective use of future gains by investing in the foundations of growth and making adjacent industries more competitive.
Both private and government consumption have been on the rise, but much of it has been fueled by debt and taxes. Household debt has grown from 20 percent of income in 2005 to 43 percent of income in 2012, and high real interest rates (averaging 145 percent on credit cards) make this a heavy burden for consumers. On the government side, federal expenses increased from 15.7 percent of GDP in 2002 to 18.9 percent in 2013. But it will be difficult to continue increasing
1 UN Comtrade via World Integrated Trade Solution (WITS).

3Connecting Brazil to the world: A path to inclusive growthMcKinsey Global Institute
public spending through further taxes and debt. Taxes have already climbed from 29 percent of GDP in 1995 to 36 percent in 2013, the highest level among Brazil’s emerging market peers, and issuing additional debt would be costly. As a share of GDP, Brazil’s gross debt is less than a third that of Japan, one of the world’s most indebted nations—but its debt service costs are almost 15 times as high.
Resource exports and credit-fueled consumption have not translated into higher investment or productivity. Between 2000 and 2011, Brazil’s overall investment rate averaged 18 percent of GDP, below that of other developing economies such as Chile (23 percent) or Mexico (25 percent), and much below those of China (42 percent) and India (31 percent). Infrastructure spending continues to lag behind the global average, while high interest rates and the complexity of obtaining reasonable long-term financing (especially for small and medium-sized enterprises) have discouraged many businesses from investing in machinery, equipment, and technology that could boost efficiency. A strong currency—the flip side of success in exporting commodities—has made manufactured goods less competitive in foreign markets, further discouraging investment.
Productivity gains are the key to broad-based income growth that can translate into wider prosperity. But Brazil’s productivity has been almost stagnant since 2000; today it is just over half the level achieved in Mexico. Brazil can create new momentum by taking action on some longstanding issues:
� Lower the “Brazil cost.” In the World Bank’s 2014 Doing Business index, Brazil ranks 116th out of 189 countries in terms of its regulatory burden. It fares even worse in the taxation category, where it ranks 159th in the world. It takes businesses a staggering 2,600 hours each year to prepare and declare taxes (vs. 318 hours in China and 259 hours in Indonesia). The costs to businesses are eventually passed on to consumers in the form of high prices and reduced purchasing power.
� Continue to reduce the informal sector. Smaller and less efficient firms operating in the gray market can gain cost advantages over more productive and law-abiding firms by ignoring quality and safety regulations or avoiding taxes. They also lack incentives to invest and achieve economies of scale. The informal sector is decreasing in size, but it still represents a continuing drag on productivity and calls for vigilant and ongoing enforcement.2
� Expand infrastructure. Brazil’s investment in overall infrastructure has fallen from 5.4 percent of GDP in the 1970s to only 2.1 percent in the 2000s, while transportation infrastructure as a share of GDP has fallen steadily for decades from around 2 percent in the 1970s to less than 0.5 percent in the 2000s.3 The nation’s rail network is limited, and only 14 percent of its roads are paved. Lines of trucks waiting to load or unload cargo at Brazil’s shipping ports can stretch for miles.
� Build human capital. Brazil has reached 95 percent enrollment in primary education but still trails other developing economies in educational attainment—and quality is a serious concern. Brazil ranked 57th in the 2012 Programme for International Student Assessment (PISA) testing of 15-year-
2 How Brazil can grow, McKinsey Global Institute, December 2006.
3 Brazil infrastructure: Paving the way, Morgan Stanley Blue Paper, Morgan Stanley Research Global, May 2010.

4 Executive summary
olds in 65 countries around the world. Only half of Brazilian students who enter high school go on to graduate.4 A greater focus on education and vocational training will be crucial to Brazil’s competitiveness and its ability to build more sophisticated industries.
Between 1990 and 2012, rising numbers of workers contributed 1.8 percent a year to Brazil’s GDP growth. But the lift from the demographic dividend is tapering down as birth rates have declined and population is aging. In the next two decades, the expansion of the labor force is likely to contribute only 0.6 percent to average annual GDP growth—about a third of what it contributed over the past two decades. Unless it takes steps to boost productivity and become more competitive, Brazil’s growth could decline to 1.8 percent a year. At the same time, Brazil’s pension system is very generous by international standards,5 and the fiscal pressure of maintaining these spending commitments will only increase in the years ahead.
Adopting a new growth agenda is vital to the economic empowerment of Brazil’s citizens
Brazil needs to solidify its recent progress in poverty reduction and build a better life for the aspiring middle class. Even after its citizens rise above the official poverty line, they face an ongoing struggle to meet basic household needs. The high price of consumer goods is diminishing their purchasing power and has led millions of households into debt.
Recent MGI research exploring this issue in India offers a framework that is also relevant in Brazil. It proposes a new and more holistic measurement of poverty called the Empowerment Line, which estimates the minimum economic cost for a household to fulfill its basic needs.6 Our initial estimate of the MGI Empowerment Line in Brazil (which takes into account the price of housing, food, transportation, education, and other basics) finds that it would take approximately R$19–R$27 in income per person per day (or R$1,900–R$2,700 per family per month) to attain an acceptable standard of living with a measure of economic security.7 Our preliminary research indicates that approximately 50 to 70 percent of Brazil’s population remains either poor or vulnerable to slipping back into poverty (Exhibit E2).
Social transfer programs alone cannot solve this challenge. Brazil will need to take steps to unleash faster growth in GDP per capita, create better-quality jobs, and raise purchasing power by lowering the price of consumer goods. Without a demographic lift, favorable terms of trade for resources, and credit-fueled
4 School census 2007, National Institute of Educational Research (INEP), Ministry of Education.
5 Brazil: Selected issues paper, International Monetary Fund, IMF Country Report number 12/192, July 2012.
6 From poverty to empowerment: India’s imperative for jobs, growth, and effective basic services, McKinsey Global Institute, February 2014.
7 Roughly US$8–$12 per person per day, or US$800–$1,200 per family per month. Assumes average family size of 3.33, according to IBGE. There are multiple assessments of the vulnerability of the population rising from poverty. See Francisco H. G. Ferreira et al., Economic mobility and the rise of the Latin American middle class, World Bank, November 2012, which finds that the risk of falling back below the poverty line in Latin America is significantly reduced only when incomes rise above the threshold of $10 per capita per day.

5Connecting Brazil to the world: A path to inclusive growthMcKinsey Global Institute
consumption to drive its economy, Brazil’s productivity performance becomes the best line of defense for ensuring that the current stagnation does not become a long-term phenomenon.
If productivity growth maintains its current trajectory, GDP per capita will grow only 1.2 percent per year, far short of what is needed for most households to attain a better life. But if Brazil can achieve an average of 4.2 percent GDP growth in the next two decades, it can cut the share of population below the empowerment line by half. Doing so will require tripling the current rate of productivity growth; this could reduce population below empowerment to the range of 25 to 40 percent of the population (Exhibit E3).
1,8006000
2,400200 4000
3
7
6
5
4
2
2,800 >3,0001,200 2,600
1
1,4001,000 2,000 2,2001,600800
Monthly income per capitaR$
% of individuals
Some 50 to 70 percent of the population falls below Brazil's estimated Empowerment Line
SOURCE: Instituto Brasileiro de Geografia e Estatística (IBGE); McKinsey Global Institute analysis
Exhibit E2
Brazilian distribution of per capita income, smoothed estimation based on IBGE data
Estimated Empowerment Line ranges from R$560 to R$800 of per capita monthly income, which would place roughly 50–70% of the population below the Empowerment Line
Above Empowerment Line
Likely below Empowerment Line
Very likely below Empowerment Line
To lift half of the still-vulnerable population solidly into middle class, Brazil needs to step up productivity
SOURCE: The Conference Board Total Economy Database 2013; McKinsey Global Institute analysis
1 Driven by additional workers joining the workforce due to demographics; employment rate assumed constant at 2012 level.
Annual real GDP growth rates%
Exhibit E3
4.22.4
1.81.2
0.6
GDP growth targetAdditional labor productivity growth required, 2012–33
Business as usual GDP growth
Average labor productivity growth, 1990–2012
Expected growth from increased labor inputs, 2012–331
xxx
xxx
+1.2
+3.6

6 Executive summary
The limited income growth of the expanding middle class is Brazil’s greatest challenge—and its biggest untapped opportunity. Moving the bottom half of the pyramid to the “belly” of the middle class would build on the momentum of poverty reduction and create a source of sustainable and inclusive growth for the future.
Deepening Brazil’s participation in global markets and global networks can provide the catalyst Brazil needs
Even as it has grown to become one of the world’s largest economies, Brazil maintains relatively limited ties to the rest of the world beyond its resource exports. As new trade routes form, firms are racing to claim market share. Brazil, which needs a new catalyst for growth, cannot afford to be left behind.
To meet its goals for sustainable and inclusive growth, Brazil needs to continue looking for external opportunities. It has already benefited from rising resource demand, but there are other ways to ride the wave of global demand growth. In addition to entering new markets, Brazil can benefit from embracing the performance pressures that come with international competition. These effectively challenge local firms to evolve and become more efficient by, for example, implementing lean processes, investing in R&D, or integrating the latest technology. Global exposure also makes cheaper and more modern inputs available, and it enables companies to absorb more of the world’s rapidly expanding flows of innovation, technology, research, and ideas.8
The global economy is increasingly characterized by an intricate web of connections that go far beyond the trade of goods. Flows of finance and services such as IT and business process outsourcing are expanding. Increasing numbers of tourists, students, and workers are crossing borders and exchanging ideas—and in the realm of digital communications, the concept of borders has all but disappeared. These evolving networks are redrawing the global economic landscape.
Recent MGI research finds that countries that are centrally connected within the various types of global networks can gain up to 40 percent more GDP growth from them than the least connected countries. But this same research ranks Brazil only 43rd in the world for “connectedness” (Exhibit E4).9 Not only is there ample room for improvement, but pursuing greater openness and engagement in all types of cross-border exchanges could yield large opportunities for productivity enhancements and economic growth.
8 There is extensive literature on the relationship between competitiveness, trade openness, and productivity. See, for example, Richard E. Baldwin, On the growth effects of import competition, National Bureau of Economic Research working paper number 4045, April 1992; Philippa Dee et al., The impact of trade liberalisation on jobs and growth, OECD trade policy working paper number 107, January 2011; and Otaviano Canuto, Matheus Cavallari, and Jose Guilherme Reis, Brazilian exports: Climbing down a competitiveness cliff, World Bank policy research working paper number 6302, January 2013.
9 Global flows in a digital age: How trade, finance, people, and data connect the world economy, McKinsey Global Institute, April 2014.

7Connecting Brazil to the world: A path to inclusive growthMcKinsey Global Institute
MGI Connectedness IndexSelected countries, 20121
Rank of participation by flow as measured by flow intensity and share of world total
Exhibit E4
SOURCE: Comtrade; IHS Economics & Country Risk; World Trade Organization; Telegeography; World Development Indicators, World Bank; McKinsey Global Institute analysis
Rank Country Goods Services FinancialPeople(2010)
Data andcommunication
(2013)
1 Germany 3 5 7 5 2
2 Hong Kong, China 1 4 3 14 (not available)
3 United States 8 9 5 1 7
4 Singapore 2 3 4 18 5
9 Russia 19 30 16 2 21
17 Australia 32 34 14 11 30
18 Malaysia 10 23 34 26 32
20 South Korea 7 14 25 58 34
25 China 5 21 6 93 33
27 Mexico 17 67 22 13 48
30 India 27 13 26 47 64
41 Chile 42 54 20 95 36
43 Brazil 39 40 18 115 38
47 Argentina 55 60 53 59 40
49 South Africa 43 50 49 56 73
56 Indonesia 31 49 39 113 65
1 Index calculations use migrants data for people flows and cross-border Internet traffic for data and communication flows.
Economy
Developed
Emerging
Connectivity Index Rank
1–10
11–25
26–50
51+
Estimating the economic potential of greater global connectedness is, of course, an inexact science. This is in part because some of the steps required to deepen Brazil’s connections with the global economy (such as infrastructure improvements) would also result in domestic productivity gains. But based on an assessment of how global networks influence economic growth, we estimate that Brazil has an opportunity to add up to 1.25 percentage points to its average annual GDP growth. In order for Brazil to cut the share of population below the empowerment line by half, it needs to generate 4.2 percent average annual GDP growth over the next two decades. Greater global connections could help Brazil get approximately one-third of the way toward this goal.

8 Executive summary
By reMovInG BarrIers and eMBracInG coMpeTITIon, BrazIl could Increase ITs share of GloBal Trade
From 2005 to 2012, Brazil’s commodities exports increased from $11 billion to $64 billion—but over the same period, a trade surplus of $20 billion in manufactured goods turned into a trade deficit of $45 billion (Exhibit E5). As the commodities boom caused the real to appreciate sharply, Brazilian goods have become less cost competitive in global markets. Brazil’s exports are equivalent to 13 percent of GDP, far below India (24 percent) or Mexico (33 percent).
While Brazil’s commodity exports have increased, its net exports of manufactured goods have declined sharply since 2005$ billion
SOURCE: World Trade Organization; McKinsey Global Institute analysis
1 Non-industrialized products, according to external commerce ministry.2 Industrialized products, according to external commerce ministry.
Net commodity exports1 Net industrialized2 products exports
08 09
64
07
73
31
51
06
26
18
2012
141187
11
5
1004 05032002
1
10
1620
08
-53
-43
-23
04
-31
2012
-45
1107 0906032002 05
14
1
10
+29% p.a.
Exhibit E5
Brazil can assume a bigger role in global markets by addressing some of the barriers that have constrained trade growth. The World Bank ranks Brazil only 124th in the world for ease of trading across borders—and it notes that the cost of exporting a container from Brazil is $2,215, more than double the Organisation for Economic Co-operation and Development (OECD) country average.10 This is mainly due to poor road and rail infrastructure combined with cumbersome procedures and inadequate capacity at Brazil’s ports.
Demand for imports is constrained because tariffs inflate the cost of goods to Brazilian consumers. In 2011, Brazil’s mean tariff rate was 7.8 percent, higher than its BRIC counterparts of Russia, India, China, and most of the developed world.11 In addition, high federal and state taxes are applied to most products, including vehicles. As a result of all the various taxes levied, a Brazilian consumer will pay around 150 percent more than a US consumer to purchase a Toyota Corolla, even though it is produced locally. After releasing its PlayStation 4 in 2013 with a
10 Doing business 2014: Understanding regulations for small and medium-size enterprises, World Bank, 2013.
11 The rate is the average weighted mean tariff rate of all products; World Bank (China, 4 percent; Russia, 5 percent; Europe and the United States, 1 to 2 percent).

9Connecting Brazil to the world: A path to inclusive growthMcKinsey Global Institute
Brazilian price tag of $1,700, Sony explained that almost 50 percent of that cost was a result of taxes.12
Brazil has undertaken some trade liberalization, mainly after 1990, but reform has been uneven; some sectors remain heavily protected and taxed, while others have been more exposed to global market forces. Comparing sectors shows that openness to global competition has been more effective in boosting sector productivity.
The heavily protected automotive industry is a case in point. Brazil is the world’s seventh-largest producer of automobiles, but it ranks 21st in automotive exports. Only 15 percent of vehicles manufactured in Brazil are exported—and a disproportionate share goes to Argentina, its Mercosur trading partner. High automobile import tariffs have encouraged foreign carmakers to establish production within Brazil and create local jobs, but this approach has not helped Brazil integrate into global value chains. Brazil’s automotive industry now lags behind the productivity of peers such as Mexico, which has developed world-class assembly plants and rapidly gained global market share. Mexican auto plants churn out twice as many vehicles per worker as Brazilian plants, even though a much higher share of their output consists of mid-size and large vehicles, while Brazil’s plants typically produce 85 percent of small cars.13
This performance stands in sharp contrast to Brazil’s success in cultivating an aerospace industry. Embraer was created in 1969 as a state-owned company, and the government ensured its early growth by providing production contracts and imposing import tariffs. But in the case of aerospace, it also took concerted steps to develop specialized talent and to create R&D infrastructure for continuous innovation. Eventually the government reduced its direct involvement, and in 1994 the company was privatized. Since then, Embraer has gone head-to-head with global competitors for international contracts—and has thrived as a result. Today the company has offices, subsidiaries, and joint ventures around the world. Brazil has lifted import tariffs on aircraft components, allowing Embraer to source from global suppliers.
Brazil’s agriculture sector, too, has grown more productive since it was gradually opened. Beginning in the early 1990s, Brazil began eliminating price controls and marketing boards that regulated production of certain crops; it also reduced export tariffs and import restrictions. This caused an initial wave of disruption, but the sector eventually reconfigured and emerged in stronger form. Brazilian farmers and agribusinesses took steps to boost their efficiency, generating positive spillover effects. Production of tractors and other agricultural equipment, for example, has quadrupled in the past three decades, and exports of these machines have increased 24-fold since 1970. Today the yields for Brazil’s main crops are on a par with those of developed economies, thanks in part to a strong tradition of R&D in agriculture. Again, reducing direct market intervention and developing R&D muscle has paid off in higher productivity and increased exports.
12 Sony press release, October 2013.
13 Mexico’s auto plants produce 53 cars per worker per year vs. 27 in Brazil, even though 85 percent of the cars produced in Brazil are small vs. 54 percent in Mexico. Associação Nacional dos Fabricantes de Veículos Automotores (ANFAVEA); Instituto Nacional de Estadística y Geografía (INEGI), Mexico; and Organisation Internationale des Constructeurs d’Automobiles (OICA).

10 Executive summary
BrazIl aTTracTs sIGnIfIcanT fdI, BuT IT could harness GreaTer flows of venTure capITal and lonG-TerM fInancInG
With high volumes of inward foreign direct investment (FDI) and cross-border lending, Brazil is more closely linked to global capital markets than to other types of global networks. It ranks seventh among all countries in attracting FDI, with an annual average of some $57 billion in inflows from 2008 to 2012. Investment has flowed into commodity sectors such as mining and oil, but the lion’s share has gone to manufacturing for Brazil’s domestic market. FDI has brought in new technologies, innovation, and best practices developed in other countries, but it has not translated into significant exports in the same sectors.
Brazil can deepen the benefits of FDI and widen access to global financing. Foreign multinationals already have an exceptionally large existing presence in Brazil.14 They can be important catalysts for productivity growth and global expansion among their local suppliers. Executives tend to prefer to move to locations where multinationals are already present, and with improved infrastructure and business climate, Brazil can build on its current base to attract additional competitive manufacturing and service firms. But Brazil should reconsider its approach to realizing the benefits multinationals can bring. As the auto industry example illustrates, the protection afforded by high tariffs on imports has raised domestic prices without making local production (even by multinationals) globally competitive. The lessons learned from Embraer and the agriculture sector suggest that Brazil can become a more successful base of production for multinationals by investing in local expertise and R&D while relying on competitive pressures from global markets to encourage productivity.
Inward FDI could also be channeled to more innovative sectors. Today there is a growing trend toward cross-border flows of venture capital, and improving mechanisms that connect Brazilian entrepreneurs with foreign investors could propel growth. In addition, further developing Brazil’s capital markets could attract global investment to meet the economy’s long-term financing needs, particularly in infrastructure.
wIThIn Traded servIces, BrazIl has a unIque opporTunITy To capTure a GreaTer share of GloBal TourIsM
Brazil has a lower participation in the global trade of services than most of its peers. Service exports represent 1.8 percent of Brazil’s GDP, below the Latin American average of 4.1 percent and far below India’s 8 percent. Language barriers are one constraint: not only is Brazil the only Portuguese-speaking nation in Latin America, but one global survey ranked Brazil 38th out of 60 countries for English-language fluency.15 To increase its ability to do business globally, Brazil will need to expand foreign-language skills.
Within traded services, the most immediate opportunity is growing Brazil’s tourism industry. Since 1999, the country has lost 38 percent of its share of South America’s inbound tourism and 30 percent of its share of world inbound tourism.
14 São Paulo ranks sixth in the world for its number of large foreign subsidiaries, the top city among all emerging markets. Urban world: The shifting global business landscape, McKinsey Global Institute, October 2013.
15 English Proficiency Index, Education First, 2013.

11Connecting Brazil to the world: A path to inclusive growthMcKinsey Global Institute
However, the World Cup and the Olympics are about to provide a once-in-a-lifetime boost in global visibility and media coverage, and it will be crucial for Brazil to sustain that momentum. The government can play a coordinating role and make targeted infrastructure investments, following the successful templates that have been set by other destinations such as Mexico and Dubai. Regaining just the share of world tourism it has lost since 1999 could add 0.25 percentage points to Brazil’s annual GDP growth through 2030.
TappInG InTo dIGITal and people flows could sTrenGThen BrazIl’s capacITy for InnovaTIon and enTrepreneurshIp
Brazil is increasingly relying on exports of raw primary goods rather than moving up the value chain with exports of more sophisticated, skill-intensive products. This is cause for concern, since research has shown that producing and exporting more sophisticated goods is correlated with economic growth.16 To create higher-quality jobs and increase productivity over the long term, Brazil needs to promote entrepreneurship and innovation. Digital and people flows represent valuable exchanges of ideas, innovation, and skills, and policy makers and business leaders must consider how to harness their potential to push the boundaries of innovation.
Global flows of data and communication are becoming critical to productivity and growth. As more of our world is transformed into digital form, new online platforms have emerged for e-commerce, file sharing, collaboration, and finance. There is growing trade in digital goods, and digital tracking is transforming the way physical goods are traded. Individuals, small firms, and entrepreneurs now have lower barriers to participating directly in the global economy. Brazil cannot afford to miss out on these trends.
Brazil is rapidly becoming a digital nation, which offers a solid starting point. Its online population has quadrupled over the past decade, and today almost 50 percent of Brazilians have regular Internet access. There are more than 60 million Facebook users in Brazil, which is more than 30 percent of the population. Perhaps the next global social media company will be founded in Brazil (and not by a Brazilian who moved to San Francisco, as Instagram co-founder Mike Krieger did).
But Brazil is not highly connected to international data flows, which underpin the cross-border exchange of goods, services, capital, and people. Its international data traffic per inhabitant is only 5 percent of what flows through Germany, the global leader. Yet the intensity of domestic use shows that Brazil has the potential to play a bigger role in the digital economy.
Global talent and knowledge pools are increasingly connected through digital networks. Digital technologies have made it possible to collaborate remotely on new scientific theories and innovations, but Brazilian scholars have produced relatively few academic articles with foreign coauthors. International student
16 See, for example, Ricardo Hausmann, Jason Hwang, and Dani Rodrik, “What you export matters,” Journal of Economic Growth, volume 12, issue 1, 2007; Ricardo Hausmann and Cesar Hidalgo et al., The atlas of economic complexity: Mapping paths to complexity, MIT Press, 2011; and Rahul Anand, Saurabh Mishra, and Nikola Spatafora, Structural transformation and the sophistication of production, IMF working paper number 12/59, February 2012.

12 Executive summary
exchanges are an important mechanism for initiating this kind of collaboration, as well as building personal business relationships and acquiring advanced skills. Since 1999, the number of Brazilian students studying abroad has almost doubled. Programs such as Ciência sem Fronteiras (Science Without Borders) can continue to build this trend and promote innovation.
Skilled migrants have been critical to the growth of some of the world’s leading hubs of technology and innovation, from Silicon Valley to Ireland, India, and Taiwan. Already a leader in the life sciences, Israel is now building capabilities in the emerging field of neurotechnology, in part by attracting leading international scientists.
Brazil can do more to attract the best foreign talent. Although it is a nation with an immigrant heritage, only 0.5 percent of Brazil’s workforce is foreign born, down from more than 5 percent in the early 1900s. But according to the Ministry of Labor and Employment, the number of temporary work permits increased 137 percent over the three years to 2012. These immigrants tend to be highly qualified managers and supervisors, and an increasing share of them have master’s degrees or PhDs. Brazil could grow these numbers in a way that contributes to its long-term growth and productivity by adopting a more comprehensive skills-based approach to immigration. Meeting industry’s needs for college-educated workers today can also facilitate the transfer of skills to their companies and colleagues—thus building capabilities for the future.
How Brazil can connect, compete, and thrive
Our research points to seven major priorities that could allow Brazil to restore growth, become more competitive, and sustain broad-based prosperity.
1. Shift the focus of economic development to investment. Resource windfalls and rising debt will no longer be able to sustain consumption-led growth. For the middle class to make real income gains, Brazil has to expand the productive capacity of the economy by investing in infrastructure, machinery, and skills. This requires boosting domestic savings and making it more attractive for companies and individuals to invest—by simplifying unnecessary red tape, more closely integrating states into a single domestic market, and creating incentives for capital and R&D investments. Brazil will continue to benefit from its rich resource endowments and could draw on them for building a more diversified and resilient base for long-term growth.
2. Reorient trade policy to achieve closer integration with major markets. In recent years, Brazil has increasingly focused on establishing international trade partnerships with other developing economies and strengthening the Mercosur trade bloc. But its emphasis on forging “South-South” agreements is not likely to open up large markets for high-value trade in the near term. Pursuing agreements with larger and more developed markets would allow Brazil to increase trade volumes, integrate more fully into the production networks of multinationals, and increase its access to leading-edge technology and processes. Brazil has spent a decade negotiating with the European Union (EU) on an agreement that is still not finalized, and no talks are under way with the United States. Policy makers will need to re-evaluate

13Connecting Brazil to the world: A path to inclusive growthMcKinsey Global Institute
the trade barriers that prevent Brazil from connecting with the most potentially valuable markets.
3. Redesign growth policies to compete in a more global and knowledge-intensive economy. Government subsidies for certain industries now total almost 6 percent of GDP. Subsidies, import tariffs, local content requirements, “Buy Brazilian” procurement rules, and similar policies have introduced distortions and disincentives for companies to modernize. Brazil will need to rationalize this system and shift the focus from protecting incumbents to building competitiveness. A more effective pro-growth policy requires assessing its current competitive strengths and determining which industries are best positioned to move up the value chain and create positive spillover effects in related industries. Brazil’s key advantages include not just its rich resources but a large consumer market as well as diverse and well-developed manufacturing and industrial sectors. Policy makers will need to cultivate distinctive skills to make non-resource industries competitive, and make sure the necessary foundation of physical, regulatory, and financial infrastructure is in place for growth. To create an ecosystem that encourages innovation, Brazil can become more connected to global flows of data and knowledge as well as boost its R&D investment, which is currently below the world average for upper-middle-income countries. A focus on higher-value-added products and services can help Brazil’s economy become more modern, diversified, and resilient.
4. Build 21st-century infrastructure that integrates Brazil’s economy and connects it to the world. One of the most important opportunities to improve Brazil’s global competitiveness and increase trade connections lies with addressing its transportation network. Brazil needs a long-term, integrated national infrastructure plan that is insulated from shifting political agendas. One option to consider is an independent oversight body that could prioritize the most important projects while considering how overall systems should work together. Brazil will need to explore new funding models and focus on efficiency and execution to attract a greater share of private investment. Projects in Brazil are constantly interrupted for various reasons, but this issue can be controlled by establishing clear and appropriate procedures for challenges and setting strict time limits for resolution. The infrastructure planning process should also consider strategies for maximizing and refurbishing existing assets, which may offer a better return on investment than new construction.
5. Improve competitiveness by lowering the “Brazil cost.” Brazil has erected too many homemade barriers to growth, and its business environment needs serious reform to match the ease of doing business offered by other countries. Transparency is a key element; where trading procedures and payment requirements are clear, for example, customs brokers and trade consultants are less necessary. Brazil could also benefit from revisiting its tax structure—not only to reconsider taxation levels through the lens of global competition but also to simplify its convoluted, multilayered tax code. Gradually removing steep import tariffs on certain products (such as auto parts and vehicles) could allow Brazil to find new growth markets for its products. These tariffs are not applied consistently across all products and sectors, and a careful review is needed to ensure that Brazil opens the most relevant and competitive industry sectors.

14 Executive summary
6. Make the public sector more productive. When Brazilians took to the streets in the summer of 2013, they were expressing widespread frustration with the poor quality of public services they receive in return for their taxes. Citizens are demanding better performance from their schools, transit systems, and the public health system. One critical step toward achieving that is implementing more robust and flexible systems for managing government workers at all levels. Rethinking the public sector’s overall incentive structure can shift the focus from following procedures to achieving clearly defined results. Few of Brazil’s government departments have gone fully digital, so there is ample room to make large gains in efficiency by integrating technology solutions.
7. Focus on education and training to develop human capital. Brazil needs a skilled and productive workforce that can continuously deliver products that keep pace with a fast-changing marketplace and incorporate the latest generations of technology. While the country has made great strides in expanding primary education, there is still a long way to go in terms of reducing dropout rates, improving learning outcomes, and expanding secondary and tertiary education. The private sector can play a role in expanding training programs and apprenticeships; it can also partner with local education providers to design curricula targeted to the workforce skills that are in demand. A greater emphasis on developing human capital would have the double benefit of making Brazil’s industries more competitive while also creating better career pathways and widening economic opportunity for all Brazilians.

15Connecting Brazil to the world: A path to inclusive growthMcKinsey Global Institute
* * *
Brazil’s economic development has reached an inflection point. With extreme poverty in decline, the next challenge will be delivering higher living standards for the entire population. Now that the drivers of its recent economic growth are running out of steam, Brazil will have to accelerate productivity growth—and building deeper connections with the rest of the global economy could provide the opening to do just that. The task of “connecting Brazil” has multiple dimensions. At its most basic level, it is about dismantling barriers to increase the movement of goods. But it also entails becoming more deeply immersed in the world’s flows of ideas, innovation, and people. To shake off its current stagnation, Brazil needs a broader and more integrated vision that looks across markets and across the world.


As democracy has taken root over the past 25 years, Brazil has made significant strides in its political, economic, and social development. The nation’s most striking achievement has been reducing its official poverty rate by more than 50 percent. Inequality has fallen, thanks to an expansion of the social safety net, rising employment, and the growing entry of businesses into the formal sector of the economy. Millions have been lifted out of extreme poverty, and their aspirations for a better life are rising.
In the international arena, Brazil became a major player in the global commodities trade, and so many free-spending Brazilians visited the United States that the head of the US Travel Association dubbed them “walking stimulus packages.”17 Just a few years ago, investors and the international press regarded Brazil as the most attractive opportunity among the BRIC countries. When GDP growth hit 7.5 percent in 2010, it seemed to confirm that Brazil was on the cusp of becoming an economic powerhouse. Finally, it seemed, the “sleeping giant” was wide awake.
But Brazil’s GDP growth began slowing dramatically in 2012. An expanding labor force, credit-fueled consumption, and high commodity prices provided much of the economy’s momentum in the recent past, but these forces are beginning to stall. Brazil now confronts the more fundamental issue of long-term weakness in income growth (Exhibit 1). For all of its progress since the 1990s, Brazil has failed to match the global average on this front, let alone to achieve the kind of impressive gains posted by other rapidly transforming emerging economies.
Exhibit 1
Real GDP per capita compound annual growth rate%
Brazil’s income growth has lagged behind the global average for decades
SOURCE: The Conference Board Total Economy Database, 2014; McKinsey Global Institute analysis
0.6
2.5
1.1
0.21981–90
1991–2000
2011–13
2001–10
7.1
6.3
6.0
11.0
3.2
6.3
4.3
3.3
4.3
2.9
4.6
0.8
1.5
0.8
1.7
-1.1
2.0
2.6
1.9
1.4
Brazil China India Chile Mexico
Global average
1981–2013 1.1 7.7 4.3 3.0 0.6 1.9
17 US Travel Association press release, April 9, 2012. See also “Where Brazilians go to splurge,” New York Times Magazine, May 2, 2014; and John Lyons and Paulo Trevisani, “Brazilians, the real spenders,” Wall Street Journal, December 21, 2011.
1. Confronting Brazil’s productivity challenge

18 1. Confronting Brazil’s productivity challenge
As of 2012, Brazil had become the world’s seventh-largest economy—but it ranked only 95th in the world in GDP per capita.18 Most households have experienced only modest income growth, while layers of taxes and tariffs push the prices of consumer goods out of their reach. Many of those who escaped from extreme poverty have only a tenuous grip on a middle-class life. The challenge of solidifying their gains and expanding economic opportunity remains as urgent as ever. Productivity growth, which contributes to raising incomes and living standards, will be the key to empowering the poor and the middle class by creating better-quality jobs and unlocking more of their purchasing power.
For decades, Brazil’s economic policy has drawn on the strength of its vast and expanding domestic market and employed active government intervention and protection of local industries. But this inward focus has taken a toll on Brazil’s competitiveness. As the rest of the global economy grows more interconnected, that cost is becoming more evident. Today Brazil needs a new catalyst for growth—one that can deliver broad-based and sustainable prosperity to the vast majority of its citizens.
Brazil has achieved important development milestones
The choices facing policy makers today can be best understood in the context of the country’s economic history, starting with Brazil’s postwar push to expand and modernize what was then an agrarian economy. The government implemented a policy of import-substituting industrialization, grounded in the view that economic development had to come from within and that state-led intervention was needed to build key sectors.
An elaborate system of trade regulation was put in place, including tariffs, import restrictions, export caps, and varying exchange rates for certain goods, while local industries received subsidies and favorable tax provisions. BNDES, the Brazilian Development Bank, was established in 1952 to provide long-term financing for major industrial and infrastructure projects. Through the decades, its financial backing has been used to foster “national champions” (see Box 1, “BNDES: Brazil’s giant of lending”). The state-owned oil company Petrobras was founded in 1953; it held a monopoly on oil exploration and development for more than four decades, and it remains partially state-owned today. The legacy of government intervention and inward-oriented policies is still present in the Brazilian economy.19 Despite many policy changes, some protectionist measures designed to nurture fledgling industries decades ago remain in force today.
18 IHS Economics and Country Risk data.
19 Edmar Lisboa Bacha and Regis Bonelli, Accounting for Brazil’s growth experience— 1940–2002, IPEA working paper number 1018, May 2004.
19Connecting Brazil to the world: A path to inclusive growthMcKinsey Global Institute
Box 1. Bndes: Brazil’s giant of lending
Brazil’s National Bank for Economic and Social Development, or BNDES, is one of the largest development banks in the world. Its operations are funded by transfers from the National Treasury and the FAT (a workers assistance fund derived from mandatory payroll contributions) as well as its own returns on credit operations. Its lending has increased sharply since 2007. In 2012, its disbursements totaled $80 billion, far exceeding the $53 billion disbursed by the World Bank.1 It also holds positions in Brazilian companies through its equity investment arm, BNDESPAR, whose holdings are approximately double those of other large development banks such as KDB (Korea) and KfW (Germany).2
For decades, BNDES has been one of the government’s key instruments for implementing industrial and infrastructure policies. In the absence of well-developed capital markets, it is the major source of long-term financing to the private sector. But the central role of BNDES has not been without its critics. Some have argued that its support of “national champions” through the provision of heavily subsidized loans has had distorting effects by conferring cost advantages on large incumbent firms.3 Its loans may also be contingent on local content restrictions that can have the effect of protecting less competitive local players. A recent OECD report noted that the sheer size of BNDES (with loan stock equivalent to more than 6 percent of Brazil’s GDP) may crowd out private lenders and inhibit capital market development. It states that some two-thirds of lending by BNDES goes to large firms that are well-positioned to obtain credit elsewhere, and it urged a shift in the focus of BNDES toward infrastructure financing and lending to innovative small and medium-sized enterprises.4
1 BNDES annual report 2012, BNDES (Brazilian Development Bank); Annual report 2012, World Bank.
2 Sérgio G. Lazzarini et al., What do development banks do? Evidence from Brazil, 2002–2009, Harvard Business School working paper 12–047, December 2011.
3 Mansueto Almeida, “O papel do BNDES no financiamento do desenvolvimento: novos e velhos desafios,” in A agenda de competitividade do Brasil, Regis Bonelli, ed., FGV Editora, 2011. See also “Qual o efeito do BNDES?” Revista Época Negócios, June 2013.
4 OECD economic surveys: Brazil 2013, OECD, October 2013.

20 1. Confronting Brazil’s productivity challenge
Brazil’s import-substitution policies spurred a wave of rapid industrialization in the postwar decades. The share of agriculture in the country’s economy declined steadily, while industries such as energy, chemicals, automobiles, steel, heavy construction, and machinery expanded. The shift of labor from low-productivity sectors to more modern, technologically advanced sectors produced strong economic growth and productivity gains.20
After the military seized power in 1964, the regime introduced measures aimed at attracting investment, reforming the foreign-exchange system, promoting exports, and building infrastructure. The result was remarkable GDP growth during what has been dubbed Brazil’s “economic miracle” (Exhibit 2). But without a comparable focus on human capital development and access to education, inequality deepened. Large and often inefficient state-owned companies dominated certain sectors, stifling competition. The economic miracle eventually crumbled under the weight of soaring inflation and mounting debt, and in the 1970s, Brazil was hit hard by a series of oil shocks. By 1982, growing foreign debt led to a crisis, and in its wake, investment dried up, inflation ran rampant, and growth plummeted. As the economy’s dynamism drained away, Brazil entered what became known as the “lost decade” of the 1980s, with GDP growth falling below 2 percent and income growth actually turning negative.21
0100200300400500600700800900
1,0001,1001,200
804020 50 201020001900 9070603010
x
x
Global
x
x
Brazilx
Brazil outpaced the global average in per capita GDP for most of the 20th century, with strong gains from 1968 to 1980
Exhibit 2
GDP per capita, 1990 purchasing power parity ($)Index: 100 = 1900
SOURCE: Angus Maddison, Historical statistics for the world economy: 1–2008 AD; McKinsey Global Institute analysis
Compound annual growth rate (%)
Import substituting and postwar growth
Economic Miracle
Lost Decade
Stabilization and growth
1.5%
3.6%
4.8%
0%1.6%
Military takes over government
End of military dictatorship
First democratic election in 20 years
Stabilization—inflation drops from 2,500% to 20%
90
Military leadership gave way to democracy in the late 1980s, and the country conducted its first democratic election in two decades. With governance growing more stable, Brazil began opening several sectors to external markets, privatizing some of its leading state-owned companies (such as the steel giant Siderbras), and allowing greater foreign investment. But when initial attempts to reform and
20 Sergio Firpo and Renan Pieri, Structural change, productivity growth, and trade policy in Brazil, São Paulo School of Economics working paper number 8/2013, August 2013.
21 Edmar Bacha and Regis Bonelli, Accounting for the rise and fall of post–World War II Brazil’s growth, 2012.

21Connecting Brazil to the world: A path to inclusive growthMcKinsey Global Institute
stimulate the economy floundered in the early 1990s, chronic inflation turned into hyperinflation. Stories abounded of shopkeepers raising the price of goods every morning and again in the afternoon.
The turning point came in 1994 when the Plano Real successfully stabilized the economy. As it took effect, inflation fell from 2,477 percent in 1993 to 22 percent in 1995. The ongoing process of privatization was intensified and improved the performance of sectors such as telecommunications, energy, and mining. Partial trade liberalization contributed to restoring modest productivity growth; Brazilian firms not only adopted more efficient processes to compete with imports, but were able to source imported raw materials, parts, and components.22 However, another international debt crisis engulfed Brazil in 1999, causing a sharp but brief recession and prompting the devaluation of the real.
Beginning in 2003, Brazil turned its focus to reducing extreme poverty and inequality with the introduction of the Bolsa Familia program, which offers cash assistance to poor families if their children are vaccinated and attending school. Today it reaches some 14 million families, or approximately 50 million people. Its impact has been dramatic: World Bank data show that the share of Brazil’s population living on less than $2 per day has been nearly cut in half, falling from 20.6 percent in 2003 to 10.8 percent in 2012. One report found that every real invested in Bolsa Familia generated 1.78 reals in economic growth.23 Income inequality declined, with the country’s Gini index decreasing, from 0.59 in 2002 to 0.52 in 2012, although poverty remains more heavily concentrated in certain regions (Exhibit 3).24 More businesses that had been operating informally moved into the formal sector of the economy, and as a result, formal employment has risen from 45 percent of jobs in 2002 to 57 percent today.25
As poverty receded, millions of new consumers began to wield their spending power for the first time, especially in Brazil’s megacities and mid-sized urban areas, which generate the majority of its GDP growth.26 The discovery of massive offshore oil reserves in 2007 added to this sense of optimism, and Brazil intensified its focus on exporting energy, raw materials, and agricultural products to meet rising global demand.
22 Regis Bonelli, The productivity performance of Brazil, report for the United Nations Industrial Development Organization (UNIDO), November 2005.
23 Marcelo Côrtes Neri, Fabio Monteiro Vaz, and Pedro Herculano Guimarães Ferreira de Souza, “Efeitos macroeconômicos do programa Bolsa Família: Uma análise comparativa das transferências sociais,” in Programa Bolsa Família: Uma década de inclusão e cidadania, Instituto de Pesquisa Econômica Aplicada (IPEA), 2013.
24 The Gini index measures the extent to which the distribution of income or consumption expenditure among individuals or households within an economy deviates from a perfectly equal distribution.
25 Data from Instituto Brasileiro de Geografia e Estatística (IBGE).
26 See Stimulating competitive cities: The key to Brazilian growth, McKinsey & Company, March 2012; Urban world: Cities and the rise of the consuming class, McKinsey Global Institute, June 2012; and Winning the $30 trillion decathlon: Going for gold in emerging markets, McKinsey & Company, August 2012.

22 1. Confronting Brazil’s productivity challenge
Poverty has fallen across Brazil, but it remains heavily concentrated in the North and Northeast regions
Exhibit 3
Population below poverty line1
% of population in the state
SOURCE: Instituto de Pesquisa Econômica Aplicada (IPEA); McKinsey Global Institute analysis
2002 2012
1 Official regional poverty line defined by IPEA. Roughly $4 per day per person.
<5% 5–10% 10–20% 20–30% 30–40% 40–50% 50–60% >60%
Brazil was increasingly viewed as a rising economic power. When the 2008 global financial crisis struck, it remained relatively insulated from the worst disruptive effects and bounced back quickly. As advanced economies struggled through a deep recession and a weak recovery, foreign investors once again began to eye Brazil and its large, growing consumer market. From 2006 to 2012, foreign direct investment rose from $19 billion to $76 billion (a level equal to almost 40 percent of the FDI inflows attracted by the United States). Economic reform has continued, but unevenly. Brazil still applies trade barriers and heavily regulates its private sector, and some manufacturing segments remain dominated by a small number of producers. Its export growth over the past decade has lagged significantly behind that of China and India.27
Brazil’s real GDP growth peaked in 2010, but since then the country’s outlook has grown murkier. Growth virtually ground to a halt in 2012, hitting 1 percent before stabilizing at 2.3 percent in 2013. This decline has prompted a degree of retrenchment in economic liberalization. In 2011, for instance, the government raised import duties on imported vehicles by 30 percentage points, and in 2012, import tariffs were hiked on 100 imported goods. These moves prompted the European Union to file a formal complaint against Brazil with the World Trade Organization.28
27 Otaviano Canuto, Matheus Cavallari, and Jose Guilherme Reis, Brazilian exports: Climbing down a competitiveness cliff, World Bank policy research working paper number 6302, January 2013.
28 See Matthew Dalton and Jeffrey Lewis, “EU files WTO complaint against Brazil,” Wall Street Journal, December 19, 2013.

23Connecting Brazil to the world: A path to inclusive growthMcKinsey Global Institute
Recent trends that lifted the economy are stalling
Since 2000, Brazil’s economy has benefited from favorable tailwinds: a worldwide commodities boom that pushed up the value of its main exports and a broad expansion of credit that fueled rising consumption. In addition, while Brazil has enjoyed a demographic dividend as the working-age population grew in recent decades, this lift is rapidly declining (see the discussion later in this chapter). The potential lift from these factors is projected to dry up in the coming years, putting additional pressure on Brazil’s growth prospects.
Neither surging exports of natural resources nor credit-fueled consumption translated into a higher investment rate that could sustain real gains in productivity and income. Between 2000 and 2011, Brazil’s overall investment rate was equivalent to 18 percent of GDP, well behind other developing economies such as Chile (23 percent), Mexico (25 percent), and China (42 percent).29 High interest rates and a lack of diversified sources of long-term financing discouraged businesses from making capital investments in machinery, equipment, and technology that could boost efficiency.
The lIfT GeneraTed By The coMModITIes BooM has reached a plaTeau
A commodities boom drove much of Brazil’s investment and GDP growth during the past decade. After 2000, global resource demand soared as GDP growth took off in China and other emerging Asian economies; prices across most commodities climbed sharply in response.30 Brazil has vast reserves of minerals and oil in addition to rich agricultural land and was able to capitalize on these trends. As commodity prices rose, Brazil also benefited from inflows of foreign capital that allowed domestic demand to grow much faster than GDP.
Brazil’s share of global non-oil resource exports rose from 5 percent in 2002 to 9 percent in 2012.31 From 2005 to 2012 alone, its exports of primary resources increased from $11 billion to $64 billion. China, with its enormous appetite for iron ore, minerals, and agricultural products, has become Brazil’s top trading partner, accounting for almost 17 percent of Brazil’s exports in 2012.32
More recently, commodity prices have leveled off, due in large part to slower growth in China and other emerging markets. Even though resource prices remain high compared to their historic averages, it is unlikely that rapid growth in both demand and prices will continue. And despite the strong economic boost they provided, resources have been a two-edged sword for Brazil’s long-term growth. Greater dependence on commodity exports has increased the country’s vulnerability to notoriously volatile swings in prices. Any slowdown in China now has an impact on Brazil. At the same time, rising prices of Brazil’s resource exports led to appreciation of the real, reducing the cost competitiveness of the country’s manufacturing exports—a common phenomenon across resource-
29 IMF Data and Statistics Database.
30 Resource revolution: Tracking global commodity markets, McKinsey Global Institute, September 2013.
31 UN Comtrade via World Integrated Trade Solution (WITS).
32 Ibid.

24 1. Confronting Brazil’s productivity challenge
driven economies.33 As we will discuss in greater detail in Chapter 2, Brazil’s share of global exports of manufactured goods declined by 16 percent over this period.
The deBT-fueled expansIon of consuMpTIon Is reachInG ITs lIMIT
Brazil’s recent GDP growth model has relied heavily on government and private consumption rather than investment (Exhibit 4).
Consumption, both public and private, has been a large driver of growth in Brazil, a trend that has intensified since 2008
Exhibit 4
Share of GDP growth by component%
63 62 59 59 4835
2212 12 13 19
14
1826 29
4027
49
7-11
30-2 -1
MexicoChileBrazil RussiaIndia China
SOURCE: Economist Intelligence Unit Database, McKinsey Global Institute analysis
Peer group, 2002–12 Brazil
5873
20
2423
9
-60
2008–122002–08
NOTE: Numbers may not sum due to rounding.
Privateconsumption
Grossinvestment
Netexports
Governmentconsumption
Growing private consumption has been fueled by greater consumer access to credit (Exhibit 5). Mortgage debt has grown rapidly, from 15 percent of total household borrowing in 2005 to 28 percent in 2012. As recently as the 1990s, credit card use was rare; store customers were more likely to write checks for their purchases. But credit cards are now widely issued and widely accepted. A recent survey found that 75 percent of Brazilians use some sort of credit or debit card; these represented 26.4 percent of family consumption in 2012, for an increase of more than 50 percent in just five years.34 Consumers frequently rely on credit for purchases of apparel and electronics (Exhibit 6).
Households have now become highly leveraged. Since 2005, household debt has grown from 20 percent to 43 percent of income (Exhibit 5). While this is lower than household debt levels in most advanced economies, it represents a heavy burden to consumers due to Brazil’s extremely high lending rates. In fact, the average credit card rate in Brazil is 145 percent.35
33 Reverse the curse: Maximizing the potential of resource-driven economies, McKinsey Global Institute, December 2013.
34 Mercado e meios eletrônicos de pagamento, Ano VI–população e comércio, Brazilian Association of Credit Cards and Services (ABECS), April 2013.
35 Viewswire Economist Intelligence Unit.

25Connecting Brazil to the world: A path to inclusive growthMcKinsey Global Institute
From 2005 to 2012, household debt has more than doubled as a share of income
SOURCE: Banco Central do Brasil; McKinsey Global Institute analysis
1 Debt refers to July figures, net of mortgage. Income is 12-month cumulative. 2 Main loans are payroll credit, auto financing, and credit cards.NOTE: Numbers may not sum due to rounding.
Exhibit 5
Debt level/household income1
%
5 6 8 10 12
1720
2327
2830
3131
433Mortgage
Other loans2
xxx
43
xxx
201220112006 2009
3841
27
20
34
20102007
32
2008
24
2005
+23
+9
Many Brazilian consumers rely on credit, particularly in categories such as apparel and electronics
Exhibit 6
20
19
3
7
19
20
24
38
France
Russia
United States
Brazil
South Africa
India
Mexico
China
SOURCE: McKinsey & Company, How half the world shops: Apparel in Brazil, China, and India, November 2007; McKinsey Global Institute analysis
“I buy more at a store that offers credit.”% that agree or strongly agree
Categories consumers buy on credit in Brazil% of sales
26
25
43
59
65
Food andbeverage
Cosmetics
Apparel
Furniture
Electronics

26 1. Confronting Brazil’s productivity challenge
The government’s share of consumption growth has also risen sharply, with federal expenses increasing from 15.7 percent of GDP in 2002 to 18.9 percent in 2013. Some 60 percent of this rise has been due to a rise in social expenditure and transfers, pensions, education, and health.36 This increase in public spending was mainly financed through taxes and debt. Taxes have climbed from 29 percent to 36 percent of GDP, the highest level among Brazil’s emerging market peers (Exhibit 7). Brazil’s public spending on pensions as a share of GDP is high by global standards, and the resulting fiscal pressure will increase as the population ages. But there is rising political opposition to further increases in the tax rate.
Exhibit 7
Taxes% of GDP
Brazil’s tax burden is extremely high by international standards
SOURCE: The Heritage Foundation; The Wall Street Journal; Banco Mundial; Instituto Brasileiro de Planejamento de Impostos; McKinsey Global Institute analysis
1 A considerable amount of collection is done not through taxation but through national companies, and these numbers are not captured in the present analysis (for example, no tax levying on Pemex, with all income reverted to government).
NOTE: Numbers may not sum due to rounding.
0.5
0.8
6.1
Total tax levels are higher than peers ... … and have been growing steadily since 1995
710
1718
27
36
Chile Mexico1China IndiaRussiaBrazil
19.323.7 25.4
9.09.0
8.2
1.9
1995
1.428.9
2005
36.3
Federal
County
1.4
State
2013
34.1
Total increasePercentage points
One option for maintaining government spending without further tax increases would be to issue additional debt, but the cost of doing so is high. Although it has lower gross debt than many advanced economies, Brazil faces sharply higher interest rates that exacerbate its debt burden (Exhibit 8). As a share of GDP, Brazil’s debt is less than a third of Japan’s, but its debt service costs are almost 15 times as high. In March 2014, Standard & Poor’s downgraded Brazil’s debt to a rating of BBB–. The capacity for an expansion of public spending to fuel Brazil’s growth is becoming increasingly limited.
36 Mansueto Almeida, Setor Público e Consumo: o que mostram os números? Blog do Mansueto Almeida, July 8, 2013.

27Connecting Brazil to the world: A path to inclusive growthMcKinsey Global Institute
Brazil's high interest rates drive up its public debt service costsExhibit 8
SOURCE: World economic outlook: Transitions and trends, IMF, October 2013; central banks; Economist Intelligence Unit; McKinsey Global Institute analysis
China
Chile 12
Russia 12
Japan 238
India 67
44
68
26
Brazil
103
Mexico
United States 0.2
0.9
5.3
1.2
2.1
5.8
0.6
0.4
Although Brazil’s government debt is lower than that of developed economies …
… its debt service costs are much higher, since its interest rates are among the highest in the world
Gross government debt, 2012% of GDP
Interest expenses, 2012% of GDP
Money market rate, 2012Annual rate, %
0.2
8.5
8.0
4.8
4.6
7.3
5.0
Consumer prices, 2012Annual % change
2.1
5.4
9.7
4.1
2.6
5.1
3.0
0.2 0.0
To sustain broad-based growth, Brazil must boost productivity
Today Brazil finds itself in need of a new catalyst for growth to replace the dwindling sources of the past decade—one that can deliver real gains in prosperity for the vast majority of Brazil’s citizens. As economic growth slowed and inflation edged up to almost 6 percent in 2013, consumer distress over rising prices and the poor quality of public services flared into large-scale protests. To meet citizens’ rising demand for higher living standards, Brazil needs to address the fundamental issue of long-term weakness in productivity growth.
Two factors contribute to a country’s GDP: the size of its labor force as well as the productivity of that labor force (or the average output produced by each worker). Sixty percent of Brazil’s recent growth was driven by demographics, while only 40 percent was due to gains in productivity (Exhibit 9). Between 1990 and 2012, rising numbers of workers contributed 1.8 percent a year to Brazil’s GDP growth. Not only did the country experience relatively high population growth, with a rising share of the population of working age, but more women entered the labor force.37 Today the economy has almost reached full employment; in fact, unemployment reached 4.3 percent at the end of 2013, the lowest recorded level in more than 20 years.
37 Women accounted for approximately 31 percent of Brazil’s labor force in 1981 and for 45 percent of the labor force by 2011, according to PNAD/IBGE.

28 1. Confronting Brazil’s productivity challenge
In contrast, Brazil’s labor productivity has grown by only 1.2 percent a year since 1990. Brazil’s lackluster productivity performance is a long-standing phenomenon (Exhibit 10). Unlike Chile and China, Brazil has not made any rapid leaps forward in efficiency and productivity—which is especially striking in an era marked by huge technology breakthroughs. Despite its broad macroeconomic gains, Brazil must overcome some fundamental issues—such as its economic insulation, business environment, infrastructure shortfalls, and a shortage of workforce skills—to accelerate productivity growth (see Box 2, “Barriers to Brazil’s productivity”).
Exhibit 9Productivity has not been the primary driver of Brazil’s GDP growth
SOURCE: The Conference Board Total Economy Database 2013; McKinsey Global Institute analysis
1 Higher labor input reflects increased population and changes in participation and employment rates.2 Labor productivity growth is measured as real GDP per employee.NOTE: Numbers may not sum due to rounding.
Contribution of labor inputs and productivity increases to GDP growth, 1990–2012Compound annual growth rate, %
1.22.6
4.4
8.4
1.1
2.0 1.8
2.7
2.1
0.9
0.8
Russia
3.0
-0.5
0.7
BrazilMexico
2.7
Chile
9.3
6.6
India China
5.3
Productivity growth2
Labor input1
Brazil’s labor productivity has grown by 1.7 percent annually since 1950, lagging behind gains made by emerging market peers
SOURCE: The Conference Board; McKinsey Global Institute analysis1 Data for Russia and India available only from 1980 and 1960, respectively.
Labor productivity1
$ thousand per worker (2013 prices, converted to purchasing power parity)
40
5
30
20
25
10
35
15
020001950 70 2013908060
Exhibit 10
Chile
Russia
Mexico
Brazil
China
India

29Connecting Brazil to the world: A path to inclusive growthMcKinsey Global Institute
Box 2. Barriers to Brazil’s productivity
The factors behind Brazil’s weak productivity performance have been extensively diagnosed in multiple studies, including our own.1 Yet they remain deeply entrenched, and addressing them will be a crucial part of improving Brazil’s global competitiveness.
High taxes and tariffs, heavy compliance costs, regulatory red tape, and a slow-moving bureaucracy add up to what is known as the “Brazil cost.” In the World Bank’s 2014 Doing Business index, Brazil ranks 116th out of 189 countries in terms of its regulatory burden (behind peers such as Colombia, in 42nd place, and Mexico, in 53rd place). The country fares even worse in the taxation category, where it ranks 159th in the world. Not only are taxation levels high, but the byzantine and multilayered tax code creates high compliance costs. The Doing Business index finds that it takes businesses a staggering 2,600 hours each year to prepare and declare taxes (vs. 318 hours in China and 259 hours in Indonesia). Business leaders who responded to a recent survey by CNI, Brazil’s National Confederation of Industry, stated that excessive regulations are harming their ability to be competitive. In fact, 79 percent responded that the bureaucratic barriers prevent export growth.2 The costs to businesses are eventually passed on to consumers in the form of high prices.
The “Brazil cost” also creates a direct barrier to productivity growth by discouraging small businesses from entering the formal economy. Smaller and less efficient firms operating in the gray market can gain cost advantages over more productive and law-abiding firms by ignoring quality and safety regulations or
1 How Brazil can grow, McKinsey Global Institute, December 2006; and Productivity—the key to an accelerated development path for Brazil, McKinsey Global Institute, March 1998. See also Victor Gomes, Samuel Pessoa, and Fernando A Veloso, “Evolução da produtividade total dos fatores na economia Brasileira: Uma análise comparativa,” in Pesquisa e Planejamento Econômico, volume 33, number 2, 2003; and Lee Alston et al., The political economy of productivity in Brazil, Inter-American Development Bank publication number 5338, March 2010.
2 Entraves às exportações brasileiras, National Confederation of Industry Brazil (CNI), 2014 (available for download at http://www.portaldaindustria.com.br/cni/publicacoes-e-estatisticas/publicacoes/2014/04/1,36461/entraves-as-exportacoes-brasileiras.html).
avoiding taxes.3 They also lack incentives to invest and to achieve economies of scale, as growth might attract the attention of authorities. The informal sector appears to be decreasing in size; one study found that it accounted for 21 percent of Brazil’s GDP in 2003 and 17 percent in 2012.4 Another found that the shadow economy accounts for 39 percent of GDP but asserts that this is down from 41 percent in 2006.5 Statistics currently show that formal employment has risen from 45 percent of jobs in 2002 to 57 percent today.6 Although the shadow economy is receding, it still represents a large and continuing drag on productivity, particularly in sectors such as retail, and calls for vigilant and ongoing enforcement.
Millions of Brazilians can attest to the inadequacy of the nation’s infrastructure; these gaps manifest themselves in the form of daily delays and inconveniences. Today’s lack of capacity is the result of many years of deferring this issue. Between 2000 and 2011, Brazil invested the equivalent of 2.2 percent of its GDP in infrastructure (including telecommunication, sanitation, transportation, and energy), well below the world average of 3.8 percent.7
Inadequate ports, airports, railways, and roads slow the efficient movement of people and goods. Two-thirds of all cargo is transported by truck in Brazil, but only 14 percent of the nation’s roads are paved.8 Brazil’s railway network is quite small, extending for only 29,000 kilometers (vs. 226,000 km in the United States, a country of similar size), which offers little alternative to trucking on congested roads. Brazil’s shipping ports are operating at or close to capacity, and lines of trucks waiting to load or unload cargo can stretch for miles. Inspected cargo takes an average of 5.5 days to be
3 Joe Capp, Heinz-Peter Elstrodt, and William B. Jones Jr., “Reining in Brazil’s informal economy,” McKinsey Quarterly, number 1, 2005.
4 The shadow economy index, ETCO (Brazilian Institute for Ethics in Competition) in partnership with FGV.
5 Friedrich Schneider, Andreas Buehn, and Claudio E. Montenegro, Shadow economies all over the world: New estimates for 162 countries from 1999 to 2007, World Bank policy research paper number 5356, July 2010.
6 Síntese de indicadores sociais: uma análise das condições de vida da população brasileira, Instituto Brasileiro de Geografia e Estatística, 2013.
7 Brazil infrastructure: Paving the way, Morgan Stanley Blue Paper, Morgan Stanley Research Global, May 2010.
8 World Bank indicators.
30 1. Confronting Brazil’s productivity challenge
Box 2. Barriers to Brazil’s productivity (continued)
released in Brazil vs. 2.2 days in the United States. Air transport is critical for mobility within such a large country and is also key to connecting Brazil to the rest of the world. The number of domestic and international passengers carried grew by 12 percent annually during the past decade, and in preparation for the World Cup, several major airports have undergone renovations and expansions through public-private partnerships. However, INFRAERO, Brazil’s aerospace agency, estimates that the country will have to double its airport capacity by 2030, which would require even greater investment.
Brazil’s telecommunications infrastructure has been improving; the country now has 1.25 cellphone subscriptions per capita, more than many developed economies. But cellphone service remains costly and inconsistent. Internet connectivity has been improving as mobile networks continue to be built out, but speeds are slower than in developed economies.
In terms of energy infrastructure, Brazil’s power plants and electricity grid are straining to meet demand. The cost of electricity is $174 per megawatt hour in Brazil vs. $115 per MWh in Mexico, and taxes represent more than one-third of electricity costs. In an attempt to reduce these costs, the government lowered the maximum allowed rates, but this move put the energy sector under serious financial pressure.9 Meanwhile, consumption has risen to peak levels, new projects are facing slowdowns, and low rainfall levels have strained hydropower generation. As a result, price hikes have been announced for 2015, and rationing may be necessary.10 The uncertainty of Brazil’s energy supply was cited by Standard & Poor’s as a factor in its recent downgrade of Brazil’s credit rating.
Human capital development is another long-term challenge. In 1960, the average worker had only
9 Eduardo Rodrigues, “Três dos cinco conselheiros da CCEE apresentam renúncia,” Economia & Negócios, April 23, 2014.
10 Ata da 140ª reunião, Ministério de Minas e Energia, February 13, 2014.
two years of formal schooling. By 2010, the average had risen to almost six years.11 While this is a solid increase, it still leaves Brazil well behind other developing economies, including Latin American peers with lower GDP per capita (such as Bolivia, where the average worker has approximately eight years of schooling). This gap in educational attainment leaves workers less prepared with the skills they need to be productive in their current roles; it also limits the growth of more sophisticated industries that rely on workers with technical skills or English-language proficiency. In recent decades, Brazil has achieved 95 percent enrollment in primary education. The next step will be to reduce the number of dropouts and achieve universal enrollment in secondary school. The latest literacy assessment showed that more than half of Brazilian students still struggle to read and write by the end of primary school and that after completing high school, only 10 percent of students were proficient in mathematics. The official rate of functional illiteracy is 27 percent, but experts suggest that the problem may be even more widespread.12
Only 12 percent of Brazilians ages 25 to 64 have college degrees (vs. the OECD average of 32 percent).13 But the general trend is rising: PROUNI (the University for All program), created in 2004, and the FIES (Student Financing Fund), established in 2010, have increased access to scholarships and support for low-income students, and enrollment in higher education more than doubled between 2000 and 2011, from almost three million to almost seven million students. In addition, only 14 percent of students in Brazil are enrolled in some form of technical education, while the share in Chile is 37 percent. A greater focus on education and training will determine Brazil’s ability to compete in the global knowledge economy over the long term.
11 Data from Robert Barro and Jong-Wha Lee in Desenvolvimento econômico, uma perspectiva Brasileira, Fernando Veloso et al., eds. Elsevier, 2013.
12 Indicador de Analfabetismo Funcional, 2011 data.
13 Education at a glance 2013: Brazil, OECD, 2013.

31Connecting Brazil to the world: A path to inclusive growthMcKinsey Global Institute
Yet Brazil’s labor force will soon cease to expand as the population ages. The lift from the demographic dividend is tapering down as birth rates have declined and the population is aging. It will be difficult for Brazil to reap further growth by adding workers, and the contribution of the labor force to future GDP growth is likely to decline to approximately 0.6 percent annually—about a third of what it contributed over the past two decades.
If Brazil can no longer count on demographic trends, favorable terms of trade for resources, and credit-fueled consumption to drive its economic growth, its productivity performance emerges as a pivotal issue for the continued economic empowerment of the poor and the middle class. Beyond their role in overall economic expansion, productivity gains are the key to improving living standards, and Brazil’s underperformance on this front has gone hand-in-hand with weak income growth. As mentioned earlier, productivity growth has been almost stagnant since 2000; today Brazil’s productivity is just over half the level achieved in Mexico.38 If these trends continue on their current trajectory, growth in GDP per capita will be only 1.2 percent per year, rising from $10,200 to only $12,900 over the next two decades.
Although government transfer programs have successfully reduced poverty, Brazil has made only modest income gains. Its GDP per capita has grown by a sluggish rate of 1.6 percent a year since 1990. This explains why, despite the huge potential of Brazil’s large and expanding consuming class, domestic demand has yet to jumpstart a virtuous cycle of sustained economic growth. Debt-fueled consumer demand is not sustainable unless it is accompanied by the economic value created by higher productivity, which in turn enables raises in real wages. Additionally, if most consumers can afford only lower-priced products and services, Brazilian companies are discouraged from moving up the value chain and producing more sophisticated, high-end products.39
To solidify the gains made in poverty reduction over the past two decades, the country will need to catalyze growth in a way that can empower its new middle class, deliver a better standard of living, and put domestic consumption on a more sustainable footing (see Box 3, “Empowering Brazil’s aspiring middle class”).
38 According to the Conference Board, labor productivity per employed person was $19,821 for Brazil and $36,042 for Mexico (in 2013 US dollars).
39 How Brazil can grow, McKinsey Global Institute, December 2006.

32 1. Confronting Brazil’s productivity challenge
Box 3. empowering Brazil’s aspiring middle class
Brazil has made impressive strides in eradicating extreme poverty, and today it faces the challenge of solidifying those gains. Even after its citizens rise above the official poverty line, they face an ongoing struggle to meet basic household needs. They aspire to attain a true middle-class life that could include some conveniences and comforts—including products such as electronics and branded clothing—but these items are often frustratingly out of reach. Import duties, high taxes, a heavy regulatory burden, and an inefficient transportation network inflate the price of everyday necessities and consumer durables alike, eating into the average household’s purchasing power and pushing millions into debt. Roughly 70 million people rely on social transfer programs for part of their income, and any future changes in public-sector spending could allow them to slip back into more desperate circumstances.
Recent MGI research exploring this issue in India offers a framework that is also relevant in Brazil. It proposes a new and more holistic measurement of poverty called the Empowerment Line, which estimates the minimum economic cost for a household to fulfill eight basic needs: food, energy, housing, drinking water, sanitation, health care, education, and social security. The Empowerment Line is higher than the national poverty line; while the government counts only 22 percent of India’s population as poor, MGI research finds that 56 percent of India’s population lacks the means to achieve a minimum acceptable quality of life.1
There are multiple assessments of the vulnerability of the population rising from poverty. A recent World Bank study of the Latin American middle class, for example, found that the risk of falling back below the poverty line is significantly reduced only when incomes rise above the threshold of $10 per capita per day.2 Our initial rough estimate of the MGI Empowerment Line in the Brazilian context yields a similar range: we estimate that it would take approximately R$19–R$27 in income per person per day (or R$1,900–R$2,700 per family per month) to meet the fundamental needs that constitute a more empowered life with a measure of economic security.3
The limited income growth of the expanding middle class is perhaps Brazil’s greatest challenge—and its biggest untapped opportunity. One estimate puts Brazil’s middle class at 108 million strong, but its true economic potential has yet to be unlocked.4 Empowering this segment would build on the momentum of poverty reduction and create a source of sustainable and inclusive growth for the future.
1 From poverty to empowerment: India’s imperative for jobs, growth, and effective basic services, McKinsey Global Institute, February 2014.
2 Francisco H. G. Ferreira et al., Economic mobility and the rise of the Latin American middle class, World Bank, November 2012.
3 Roughly US$8–$12 per person per day, or US$800–$1,200 per family per month.
4 According to research by Serasa Experian with Data Popular.

33Connecting Brazil to the world: A path to inclusive growthMcKinsey Global Institute
If Brazil can achieve an average of 4.2 percent GDP growth through the next two decades, it could cut the share of population below the empowerment line by half—but to do so, it must triple the rate of productivity growth (Exhibit 11). This poses a real challenge, but major gains are within reach if Brazil can build the fundamentals at home and take advantage of new growth markets abroad.
To lift half of the still-vulnerable population solidly into middle class, Brazil needs to step up productivity
SOURCE: The Conference Board Total Economy Database 2013; McKinsey Global Institute analysis
1 Driven by additional workers joining the workforce due to demographics; employment rate assumed constant at 2012 level.
Annual real GDP growth rates%
Exhibit 11
4.22.4
1.81.2
0.6
GDP growth targetAdditional labor productivity growth required, 2012–33
Business as usual GDP growth
Average labor productivity growth, 1990–2012
Expected growth from increased labor inputs, 2012–331
xxx
xxx
+1.2
+3.6
* * *
With its recent drivers of growth reaching their limits, Brazil’s economy has been losing steam. Today policy makers face the difficult task of designing a new and more sustainable growth model. In order to lift incomes and living standards in the years ahead, Brazil will have to embrace reforms that can unlock investment and jumpstart its stagnant productivity. As Chapters 2 and 3 will discuss, deeper integration into global markets and value chains could provide new avenues for growth—and the attendant competitive pressures could spur Brazil’s industries toward greater productivity and efficiency.


Despite its recent slowdown, Brazil has a major opportunity at hand to jumpstart its momentum. The rise of emerging economies around the world combined with the ongoing recovery of advanced economies from the Great Recession is once again fueling global demand—and by taking steps to increase its role in global networks, Brazil can ride this wave of growth.
To capitalize on this opportunity, Brazil will need to take decisive steps to address the homegrown obstacles discussed in Chapter 1: inadequate infrastructure, a heavy tax and regulatory burden, and a shortage of workforce skills. These issues are not new, but today their effect is amplified by the fact that Brazil has not formed the type of connections to the global economy that can enhance long-term growth. Even its domestic market is not well integrated, as Brazil is a huge country with a poor internal transportation network. This fragmentation, along with a high cost of doing business that contributes to the size of the informal sector, prevents enterprises from realizing economies of scale.
Even as it has grown to become the seventh-largest economy in the world, Brazil maintains relatively limited international ties. Recent MGI research ranks Brazil only 43rd in the world for “connectedness”—and this result has important implications, as countries with more extensive connections to global networks were found to experience faster economic growth.40 (See Box 4, “A new way of looking at global flows.”)
40 “Connectedness” is a concept that expresses the number of relationships a country establishes with the rest of the world as well as the extent of those relationships. This effect has been most widely studied in terms of traded goods, but connectedness has multiple dimensions, including participation in global flows of services, finance, people, and data and communications.
2. Understanding Brazil’s opportunities in global markets

36 2. Understanding Brazil’s opportunities in global markets
Box 4. A new way of looking at global flows
Recent MGI research has shown that global flows of goods, finance, and services reached $26 trillion, or 36 percent of global GDP, in 2012—more than 50 percent larger than they were relative to the size of the world economy 20 years ago. Global flows contribute between 15 and 25 percent of global GDP growth (or about $250 billion to $450 billion a year). If the twin forces of rising prosperity and the spread of the Internet and digital technologies continue, these flows could triple in the next decade. Those countries that are most centrally connected within flow networks can gain up to 40 percent more GDP growth from flows than the least connected countries.1
The rise of emerging economies is fundamentally reshaping global networks. Consider flows of traded goods, which were once dominated by developed economies. In 1990, almost 70 percent of all goods trade took place between developed economies. In 2012, these flows accounted for only 37 percent
1 For in-depth analysis of the evolution, growth potential, and economic impact of these global flows, see Global flows in a digital age: How trade, finance, people, and data connect the world economy, McKinsey Global Institute, April 2014.
of world trade, as emerging economies assumed greater roles as both exporters and importers. Emerging economies now contribute 40 percent of global exports, and 16 percent of those go to other emerging economies, giving rise to so-called “South-South” trade. Brazil has played a role in this trend by, for example, increasing its exports of raw materials to China, but it has bypassed opportunities for greater trade in other types of goods and services.
Brazil ranks only 43rd in the recent MGI Connectedness Index, which measures 131 countries across all five types of inflows and outflows (adjusted for country size). It places below other major emerging economies such as India, China, Russia, and Mexico (Exhibit 12). Although it ranks relatively high in financial flows (at 18th place), it places 39th for flows of goods, 40th for services, and 38th for data and communications. Its worst showing is in people flows, a category in which it ranks 115th.
MGI Connectedness IndexSelected countries, 20121
Rank of participation by flow as measured by flow intensity and share of world total
Exhibit 12
SOURCE: Comtrade; IHS Economics & Country Risk; World Trade Organization; Telegeography; World Development Indicators, World Bank; McKinsey Global Institute analysis
Rank Country Goods Services FinancialPeople(2010)
Data andcommunication
(2013)
1 Germany 3 5 7 5 2
2 Hong Kong, China 1 4 3 14 (not available)
3 United States 8 9 5 1 7
4 Singapore 2 3 4 18 5
9 Russia 19 30 16 2 21
17 Australia 32 34 14 11 30
18 Malaysia 10 23 34 26 32
20 South Korea 7 14 25 58 34
25 China 5 21 6 93 33
27 Mexico 17 67 22 13 48
30 India 27 13 26 47 64
41 Chile 42 54 20 95 36
43 Brazil 39 40 18 115 38
47 Argentina 55 60 53 59 40
49 South Africa 43 50 49 56 73
56 Indonesia 31 49 39 113 65
1 Index calculations use migrants data for people flows and cross-border Internet traffic for data and communication flows.
Economy
Developed
Emerging
Connectivity Index Rank
1–10
11–25
26–50
51+

37Connecting Brazil to the world: A path to inclusive growthMcKinsey Global Institute
While Brazil has traditionally focused inward and erected barriers, it may want to re-evaluate this approach in a more complex and interconnected global economy. With high tariffs shielding multiple domestic industries from international competition, many Brazilian companies have lacked a more urgent imperative to become more efficient by, for example, implementing lean processes, investing in R&D, or integrating the latest technology. Removing trade barriers and subsidies would effectively challenge them to evolve. In addition to exposing them to competitive pressures, it would enable them to access the best inputs and absorb more of the world’s rapidly expanding flows of innovation, technology, research, and ideas.41
The concept of connectedness extends beyond the trade of goods. Flows of finance and services such as IT and business process outsourcing are also expanding, and increasing numbers of tourists travel around the globe each year. Although Brazil performs well in terms of its ability to attract foreign investment from companies eager to sell to its large domestic market, it has been less successful in the global trade of services, due in part to language barriers. Tourism, in particular, is a major avenue for potential growth, and Brazil can take advantage of its natural landscapes and cultural appeal to take its place as a leading destination for global travelers.
Brazil’s goods trade is increasingly dominated by commodities
With the proliferation of global supply chains, the flow of goods around the world has soared. International trade in goods (including intermediate goods, finished goods, and commodities) stood at $5.9 trillion, or 19 percent relative to global GDP, in 2002, but by 2012, it had risen to $17.8 trillion, or 24 percent of global GDP. Over the decade to 2012, global trade in goods has grown by an average of 11.7 percent annually.42
As the opportunities associated with international trade have increased, Brazil’s resource exports have risen sharply. However, the country has not captured significant market share across a variety of non-resource products, nor has it fully integrated into global production chains. Its levels of both exports and imports remain considerably lower than those of its international peers (Exhibit 13). Brazil’s exports are equivalent to 13 percent of GDP, far below the levels in, say, India (24 percent) or Mexico (33 percent).
With its abundant oil and mineral reserves and rich agricultural land, Brazil is a major global supplier of commodities ranging from iron ore, crude oil, and gold
41 There is extensive literature on the relationship between competitiveness, trade openness, and productivity. See, for example, Richard E. Baldwin, On the growth effects of import competition, NBER working paper number 4045, April 1992; Susan Stone and Ben Shepherd, Dynamic gains from trade: The role of intermediate inputs and equipment imports, OECD trade policy working paper number 110, April 2011; and Philippa Dee et al., The impact of trade liberalisation on jobs and growth, OECD trade policy working paper number 107, January 2011. For more on how these issues apply in Brazil, see Otaviano Canuto, Matheus Cavallari, and Jose Guilherme Reis, Brazilian exports: Climbing down a competitiveness cliff, World Bank policy research working paper number 6302, January 2013.
42 Global flows in a digital age: How trade, finance, people, and data connect the world economy, McKinsey Global Institute, April 2014.

38 2. Understanding Brazil’s opportunities in global markets
to soybeans, sugar, and other agricultural products.43 From 2005 to 2012, the country’s commodities exports increased from $11 billion to $64 billion—but a different story was playing out in the manufacturing sector (Exhibit 14). Brazil enjoyed a trade surplus of $20 billion in manufactured goods in 2005. By 2012, that surplus had not only evaporated but turned into a trade deficit of $45 billion. Brazil’s share of global exports of manufactured goods declined by 16 percent over this period.
Brazil is relatively disconnected from global trade flows
SOURCE: World Bank Indicators; McKinsey Global Institute analysis
1 Iron ore, crude petroleum and petroleum oils, soya beans and oil, cane sugar, meat, and coffee represented almost 50% of Brazil’s export value in 2012.
Exhibit 13
Exports of goods and services Imports of goods and services
14
32
22
27
34
34
13
24
29
31
33
34
Mexico
Chile
Brazil1
India
Russia
China
% of GDP, 2012
While Brazil’s commodity exports have increased, its net exports of manufactured goods have declined sharply since 2005$ billion
SOURCE: World Trade Organization; McKinsey Global Institute analysis
1 Non-industrialized products, according to external commerce ministry.2 Industrialized products, according to external commerce ministry.
Net commodity exports1 Net industrialized2 products exports
08 09
64
07
73
31
51
06
26
18
2012
141187
11
5
1004 05032002
1
10
1620
08
-53
-43
-23
04
-31
2012
-45
1107 0906032002 05
14
1
10
+29% p.a.
Exhibit 14
43 Until 1960, coffee alone represented more than 50 percent of Brazil’s total exports, but today Brazil’s exports have diversified into a wide range of commodities. See Boris Fausto, A concise history of Brazil, Cambridge University Press, 1999, and Ricardo Hausmann and Cesar Hidalgo et al., The atlas of economic complexity: Mapping paths to complexity, MIT Press, 2011.

39Connecting Brazil to the world: A path to inclusive growthMcKinsey Global Institute
Commodities exports alone have not been sufficient to guarantee Brazil a position in world trade that is commensurate with its size. Although Brazil represents 3.5 percent of world GDP, it accounts for only 1.4 percent of total global exports. This gap has been widening: Brazil’s share of global GDP grew by 1.6 percentage points over the past decade, while its share of world trade grew by only 0.5 percentage points.
As the commodities boom caused the real to appreciate sharply, Brazilian industrialized goods have become less cost competitive in global markets. Brazil is increasingly relying on exports of raw primary goods rather than moving up the value chain with exports of more sophisticated, knowledge-intensive products, which affect the number and the quality of domestic jobs associated with exports.44 This trend offers cause for concern, since academic research has shown that producing and exporting more sophisticated goods is correlated with economic growth.45 Recent MGI research showed also that on a global level, knowledge-intensive flows (goods or services with a significant R&D component or made by highly specialized labor) are growing faster than capital-, labor-, or resource-intensive flows.46
Brazil is blessed with abundant natural resources. If they are well managed, the country can draw on these assets to build infrastructure, a better-educated workforce, and deeper knowledge and expertise—all of which will provide a more diversified and resilient economic base. In fact, Brazil faces an imperative to invest in long-term growth in order to avoid the “resource curse” (see Box 5, “From resource wealth to long-term prosperity”). Given that commodity exports create upward pressure on local currency, the export competitiveness of other industries often suffers. This is particularly costly if Brazil’s main trading partners are other developing economies with labor-intensive manufacturing industries (a topic that is further discussed in Chapter 4). For Brazil to diversify its exports, it will be critical to compensate for this cost disadvantage by developing distinctive skills and capabilities, including in industries adjacent to commodities.
44 David Kupfer et al., Different partners, different patterns: Trade and labour market dynamics in Brazil’s post-liberalisation period, OECD trade policy paper number 149, April 2013.
45 See, for example, Ricardo Hausmann, Jason Hwang, and Dani Rodrik, “What you export matters,” Journal of Economic Growth, volume 12, issue 1, March 2007; Ricardo Hausmann and Cesar Hidalgo et al., The atlas of economic complexity: Mapping paths to complexity, MIT Press, 2011; and Rahul Anand, Saurabh Mishra, and Nikola Spatafora, Structural transformation and the sophistication of production, IMF working paper number 12/59, February 2012.
46 Global flows in a digital age: How trade, finance, people, and data connect the world economy, McKinsey Global Institute, April 2014.

40 2. Understanding Brazil’s opportunities in global markets
Box 5. from resource wealth to long-term prosperity
Brazil is now firmly established as a major player in the global commodities trade. It is the world’s top exporter of sugar and ethanol and the world’s second-largest exporter of iron ore. It is also near the top of the list in a wide range of other commodities, from soybeans, coffee, beef, and poultry to gold and bauxite. And as the recently discovered “subsalt” offshore reserves are developed, the International Energy Agency forecasts that Brazil will triple its oil production and become the world’s sixth-largest oil producer by 2035.1 Its natural resource endowments will continue to be an enormous boon to Brazil in the decades ahead.
Commodity exports can present developing economies with windfalls, but translating that wealth into sustainable, broad-based prosperity is a major policy challenge. Previous MGI research has shown that almost 80 percent of resource-driven countries have below-average levels of per capita GDP growth. Since 1995, more than half of these countries have failed to match the global average per capita growth rate.2 Resource booms generate a wave of investment and revenue, but they can worsen existing infrastructure bottlenecks, pose temptations for corruption, and usher in volatility. They can also allow governments to become complacent about deteriorating long-term fundamentals across the broader economy.3
Resource exports frequently lead to exchange-rate appreciation that causes domestic inflation and makes manufacturing and other sectors less cost competitive in global terms (the infamous “Dutch disease”). Brazil has already experienced some of these effects, but unlike many other resource-rich economies, it has the key advantages of a large consumer market as well as diverse and well-developed manufacturing and industrial sectors. Policy makers will need to navigate the terms-of-trade challenges carefully and cultivate distinctive skills to make non-resource industries competitive.
Brazil can build on its comparative advantage by focusing on products that add value to its commodities (by, for example, turning wood into furniture). It could also develop adjacent industries that supply equipment or technology (such as manufacturing tractors to support agribusinesses). The key will be identifying the most promising opportunities and removing the barriers to realizing them.
In some cases, Brazil is already pursuing this strategy by imposing local content requirements on companies operating within the resource sector, creating demand for locally produced equipment and machinery. But Brazil’s requirements are high by international standards. Local content rules intended to foster a local shipbuilding industry, for instance, have caused delays in offshore oil development.4
1 World Energy Outlook 2013, International Energy Agency.
2 Reverse the curse: Maximizing the potential of resource-driven economies, McKinsey Global Institute, December 2013. See also Jeffrey D. Sachs and Andrew M. Warner, Natural resource abundance and economic growth, Harvard University, November 1997, which found similar results from 1970 to 1990.
3 Beyond the boom: Australia’s productivity imperative, McKinsey Global Institute, August 2012.
4 When the Libra subsalt mega-field was auctioned, bidders were required to source all platforms and production equipment (such as pipelines, production lines, support vessels, and undersea equipment) from Brazilian manufacturers. See speech from President Dilma Rousseff on October 21, 2013; and Simon Romero, “Petrobras, once symbol of Brazil’s oil hopes, strives to regain lost swagger,” New York Times, March 26, 2013.

41Connecting Brazil to the world: A path to inclusive growthMcKinsey Global Institute
Box 5. from resource wealth to long-term prosperity (continued)
While these policies can be effective development tools for resource-rich economies, they have to be deployed cautiously and monitored for unintended consequences.
The growth generated by resource exports during the past decade allowed Brazil to undertake greater government spending, including social transfer programs that have produced real gains in poverty reduction. The largest share of Brazil’s oil and mining royalties goes to state and local governments, however, and one study found that the resulting rise in municipal spending did not produce commensurate gains in housing, transportation, education, health, and other social outcomes.5 And despite the capital flowing into Brazil’s energy sector, the country’s overall investment rate has remained well below that of other developing economies since 2000. To become more productive and competitive, Brazil will need to shift its focus to investment.
Sovereign wealth funds (SWFs) are used by governments in many other oil- and gas-exporting countries—from Norway and Canada to Abu Dhabi and Azerbaijan—as vehicles for saving and investing their resource revenue. Brazil established the Fundo Soberano do Brasil in 2008. It is relatively small, with roughly one-eighth of the assets held by Malaysia’s SWF, although it may grow in the future.6 Most countries fund their SWFs with central bank reserves derived from the consistent budget and trade surpluses that oil or gas exports produce and use their SWFs for national priorities such as meeting future pension liabilities or building infrastructure. In keeping with their long-term investment horizons, more than half of all SWFs around the world invested in infrastructure in 2013.7 The Gulf Cooperation Council states, for example, are investing heavily in road and rail projects to build a new logistics network for the region.8 But Brazil has used its SWF as a fiscal tool rather than as a vehicle for this type of long-term investment.9
In Brazil, BNDES, the national development bank, is the dominant funding source for infrastructure. To date, however, the country has taken only partial steps toward meeting its enormous infrastructure needs. As Brazil develops its new offshore oil fields in the years ahead, it will have an opportunity to make real inroads in infrastructure and other critical areas such as education. To derive lasting returns from its natural resource wealth, Brazil will need to take a coordinated planning approach and ensure that these investments become more productive.
5 Francesco Caselli and Guy Michaels, Do oil windfalls improve living standards? Evidence from Brazil, NBER working paper number 15550, December 2009.
6 Sovereign Wealth Fund Institute rankings.
7 Julia Goodall, Amy Bensted, and Graeme Terry, “Sovereign wealth funds investing in infrastructure,” Preqin, November 2013.
8 “Qatar rail and transport projects at $30 billion, second largest in Gulf,” Gulf Times, October 15, 2013; Camilla Hall, “World Cup spending kicks off with $8.2 billion Doha metro contracts,” Financial Times, June 12, 2013; and Mary Sophia, “The Gulf’s great train journey,” Gulf Business, April 26, 2014.
9 Arnaldo Galvao, “Brazil taps into sovereign fund to meet 2012 fiscal target,” Bloomberg News, January 3, 2013.

42 2. Understanding Brazil’s opportunities in global markets
a nuMBer of hurdles, IncludInG hIGh cosTs and TarIffs, have lIMITed Trade GrowTh
The World Bank ranks Brazil only 124th in the world for ease of trading across borders.47 Exhibit 15 shows the cost of exporting a container from Brazil is $2,215—almost twice the average cost for other Latin American countries ($1,283) and more than double the OECD country average ($1,070). The cost of exporting a container from Mexico, by contrast, is $1,450, while Chile comes in under the OECD average at $980. Approximately 50 percent of the cost in Brazil is attributed to inland transportation, while an additional 30 percent goes toward document preparation and customs clearance.
500
990
2,215
725
SOURCE: Doing business 2014, World Bank; McKinsey Global Institute analysis
980
320
210
450
1,450
200
900
350
95
140
385
6201,170
225
400
545
Total
Documentsand customsclearance
Inlandtransport
Other
1,385
750
2,615
480
Total cost
It is more expensive to export from Brazil than from peer countriesExhibit 15
Average cost per container1
$
1 Costs for a 20-foot container. Includes costs for documents, administrative fees for customs clearance and technical control, customs broker fees, terminal handling charges, and inland transport. Does not include tariffs or trade taxes.
Russia Brazil Mexico India Chile China
Average OECD 1,070 Average Latin America 1,283
The high cost of transporting goods to Brazil’s ports is due in part to the country’s large size, but it also points to the poor state of road and rail infrastructure. Only 14 percent of Brazil’s roads are paved,48 and bottlenecks are common on the busiest routes. Railroads have limited capacity and coverage, and ports are often slow to process shipments due to cumbersome bureaucratic procedures and inadequate capacity. Brazil’s investment in transportation infrastructure as a share of GDP has fallen steadily for decades from around 2 percent in the 1970s to less than 0.5 percent in the 2000s.49 The cost of document preparation and customs clearance is directly related to Brazil’s unwieldy regulatory approach—and it is twice as high as those costs in Chile and Mexico. It is common practice for Brazilian companies to try to expedite the process by hiring specialized customs agents, or despachantes, which adds an additional layer of expense.
Demand for imports is constrained because tariffs, established to protect domestic industries, inflate the cost of goods to Brazilian consumers. Brazil’s mean tariff rate was 7.8 percent in 2011, the highest of any BRIC economy.50
47 Doing business 2013: Smarter regulations for small and medium-size enterprises, World Bank, 2013. The ease of trading across borders metric considers the time and cost required to complete every official procedure for exporting and importing goods.
48 World development indicators, World Bank, 2011.
49 Brazil infrastructure: Paving the way, Morgan Stanley Blue Paper, Morgan Stanley Research Global, May 2010.
50 The rate is the average weighted mean tariff rate of all products; World Bank.

43Connecting Brazil to the world: A path to inclusive growthMcKinsey Global Institute
As a member of Mercosur (the South American trading bloc), Brazil commits to keeping its tariff rate in line with that of other members, but exceptions can be made for 100 chosen products. Brazil’s 100 exceptions include cellphones, telecommunications equipment, computers and computer printers, and certain chemicals and pharmaceuticals.
In addition to tariffs, high federal and state taxes are applied to imports. After releasing its PlayStation 4 in 2013 with a Brazilian price tag of $1,700, Sony explained that almost 50 percent of that cost was a result of taxes.51 In 2011, the government imposed a 30 percentage point increase on the base price on foreign vehicles that do not meet local content requirements. Import tariffs also remove the element of price competition that could make locally produced goods more affordable. As a result of all the various taxes levied, a Brazilian consumer will pay around 150 percent more than a US consumer to purchase a Toyota Corolla, even though it is produced locally; similar discrepancies exist for a wide range of products (Exhibit 16). Adding to the cost of consumer goods directly harms the purchasing power of the average Brazilian household and limits the role that collective domestic demand can play as a self-reinforcing source of growth.
21,658
15,450
37,636
400
956
1,717
125154
236
SOURCE: Company and retail websites; McKinsey Global Institute analysis
Exhibit 16High production costs, tariffs, and taxes drive up the price of many consumer goods in Brazil
1 Exchange rate used = R$2.33.NOTE: Not to scale.
Price comparison$1
United States BrazilArgentina
Toyota Corolla Sony PlayStation 4 Nike Shox NZ EU
+144% +329% +89%
Taxes, inefficiencies, and high production costs also make Brazilian exports less competitive in global markets. Import tariffs on machinery, equipment, and parts used in production for export add yet another layer of costs.
Brazil has capitalized on rising global demand for raw materials by establishing close commercial ties with China, which supplanted the United States as the country’s largest trading partner in 2009. In addition, being part of Mercosur, Brazil has focused on cultivating more “South-South” trade with other emerging economies, even though these countries collectively account for a smaller share of world trade. Its most recent trade agreements have been with Israel, India, Cuba, the South African Customs Union,52 and Egypt, all through Mercosur, but
51 Sony press release, “O preço do PS4 no Brasil, um exercício nada simples,” October 2013.
52 Members are Botswana, Lesotho, Namibia, South Africa, and Swaziland.

44 2. Understanding Brazil’s opportunities in global markets
trade volumes in those agreements are relatively small. By contrast, one recent study estimated that completing free trade agreements with the European Union and the United States would boost Brazil’s foreign trade by 18 percent, or some $86 billion annually.53 However, Brazil’s trade negotiations with the EU have extended for more than a decade without producing a final agreement, and no talks are under way with the United States.
These issues can be overcome through concerted efforts by the government. Broad tax and regulatory reform and better enforcement could streamline the flow of trade and increase the competitiveness of Brazil’s exports. This will entail looking at tariffs, customs procedures, cargo handling costs, and the general adequacy of the country’s logistics infrastructure. It will also involve prioritizing commercial agreements to foster Brazil’s truly competitive segments and focusing on trade partners that represent the highest potential value and volume to these sectors. Chapter 4 will discuss some of these solutions in greater detail.
Comparing sectors reveals the positive effects of a more market-based approach
Twenty years of McKinsey Global Institute research has shown that when a sector is exposed to the world’s best practices, it is forced to increase its own productivity.54 Brazil has undertaken some trade liberalization since the 1990s, but it has not fully embraced an open approach in all sectors. Some are heavily protected and taxed, while others have been more exposed to global markets. As a result, it is possible to see how the effects of greater global competition have played out at a microeconomic level. The case studies of specific industries below reveal the interplay of connectedness and competitiveness.
BrazIl’s heavIly proTecTed auToMoTIve IndusTry laGs BehInd In producTIvITy
The automotive industry is a prime example of Brazil’s use of a protectionist approach: high tariffs on imports and subsidies for domestic production have been used to encourage global carmakers to establish production plants within Brazil. This strategy has been successful in expanding local production, as several carmakers have installed production facilities in the country, generating a large number of jobs and reducing dependency on imports. But Brazil’s automotive industry has been protected for some six decades and has not become a competitive global exporter.
Taxes applied to cars in Brazil are extremely high by global standards (Exhibit 17). This is true for both finished vehicles and for parts and components. In fact, in 2012, three of the four highest import tariffs were applied to goods in this industry (Exhibit 18). This discourages local manufacturers from tapping into global supply chains to buy from the most competitive international supplier—and taxes add to the final cost to Brazilian consumers. Although the Toyota Corolla is produced in
53 See Vera Thorstensen and Lucas Ferraz, O Brasil e os novos acordos preferenciais de comércio: O peso das barreiras tarifárias e não tarifárias, Institute of Industrial Development Studies (IEDI), number 617, March 2014.
54 Martin Neil Baily and Robert M. Solow, “International productivity comparisons built from the firm level,” Journal of Economic Perspectives, volume 15, number 3, Summer 2001.

45Connecting Brazil to the world: A path to inclusive growthMcKinsey Global Institute
Brazil, Brazilian consumers pay more than twice as much as US consumers and approximately 75 percent more than Argentine consumers for the same car.
Taxes account for a large share of car prices to consumersShare of taxes in total car price to consumer, 20131
%
SOURCE: Associação Nacional dos Fabricantes de Veículos Automotores annual report, 2014; McKinsey Global Institute analysis
1 Considering locally produced vehicles.
Exhibit 17
5.7
9.1
16.016.416.7
30.4
GermanyFranceUnited KingdomBrazil United StatesJapan
Automotive, transportation equipment, and auto parts are among the sectors facing the highest import taxes in Brazil
Exhibit 18
Average import tariff, 2012%
35
26
19
13
15
15
10
7
7
11
3
10
12
11
15
14
14
15
12
10
14
15
14
9
12
3
33
50
12
27
13
11
20
Elaborate fuel
Non-durable consumer goods
Machinery for capital goods
Basic food
Basic fuel
Elaborate inputs
Basic inputs
Passenger vehicles
Capital goods (except transportation)
Processed food
Durable consumer goods
Auto parts
Transportation equipment
Semi-durable consumer goods
24
40
28
15
25
21
22
Most favored nation tariff PIS/COFINS1
SOURCE: Frischtak and Moreira, in Propostas para o governo 2015/2018, Elsevier, 2013; McKinsey Global Institute analysis
1 PIS (Social Integration Program) and COFINS (Contribution for the Financing of Social Security).NOTE: Numbers may not sum due to rounding.
The productivity of Brazil’s automotive industry now lags behind that of key global peers. Mexican auto plants produce twice as many vehicles per worker as Brazilian plants, even though they produce a much higher share of mid-size and large vehicles (Exhibit 19). With the North American Free Trade Agreement (NAFTA) connecting it to lucrative markets next door, Mexico, by contrast, has been rapidly gaining in manufacturing capabilities and global market share. Its

46 2. Understanding Brazil’s opportunities in global markets
ten largest assembly plants increased their output from 1.1 million vehicles in 1994 to nearly 2.9 million vehicles in 2012, an annual increase of 5.5 percent. Mexico’s trade surplus in cars and parts in the first half of 2013 was 80 percent higher than that of petroleum. Its auto assembly plants are considered to be world class. On average, their productivity is 80 percent of the US average, and several outperform the average US plant. Mexico is poised to reap growing benefits from its thriving auto clusters, which have tight links to global value chains.55
The Brazilian automotive industry is less productive than its Mexican and US counterparts
1 Vehicle production data from OICA. Considers both cars and commercial vehicles.2 Estimated. Employees under category NAICS 3361 for United States and Mexico. ANFAVEA data for Brazil. Excludes
employees in auto parts.3 Average vehicles produced is lower in Brazil than in Mexico and the United States, despite the fact that in Brazil, cars are
smaller (only 15% are medium and large cars, vs. 46% in Mexico and 71% in the United States).4 Mexico data are from 2011.SOURCE: Associação Nacional dos Fabricantes de Veículos Automotores (ANFAVEA); Organisation Internationale des
Constructeurs d’Automobiles (OICA); US Bureau of Labor Statistics; Instituto Nacional de Estadística y Geografía (Mexico); McKinsey Global Institute analysis
Exhibit 19
Automotive industry productivity and exports for selected countries, 20131
3,712
11,046
2,681Mexico4
Brazil
United States 178
51
136
62
53
27
Vehicles produced1
Thousand
Manufacturing employees2
Thousand
Average vehicles produced per employee3
Share of vehicles exported%
15
71
25
Rather than liberalizing its automotive sector over time, Brazil has stepped up its intervention. In response to growing Asian imports, Brazil raised the IPI (the country’s value-add-based transaction tax) on vehicles imported from outside Mercosur by 30 percentage points in late 2011. An April 2012 law grants tax credits to auto manufacturers that meet multiple requirements regarding the number of production steps occurring within Brazil and increased domestic investment in R&D and product development.
These steps have encouraged Asian carmakers to establish production within Brazil, but they have not improved Brazil’s integration into global markets and value chains. Brazil is the world’s seventh-largest producer of automobiles,56 but this is primarily due to the size of its domestic market. While the country ranks second in global agricultural exports and fifth in global aircraft exports (industries that are discussed in further detail below), it ranks 21st in automotive exports.57 Only 15 percent of vehicles manufactured in Brazil are exported—and a disproportionate share goes to Argentina (Exhibit 20). Given that Argentina is imposing new import quotas, Brazil’s lack of diversification in trading partners is a vulnerability.
55 A tale of two Mexicos: Growth and prosperity in a two-speed economy, McKinsey Global Institute, March 2014.
56 International Organization of Motor Vehicle Manufacturers (OICA).
57 UN Comtrade (via World Integrated Trade Solution, World Bank).
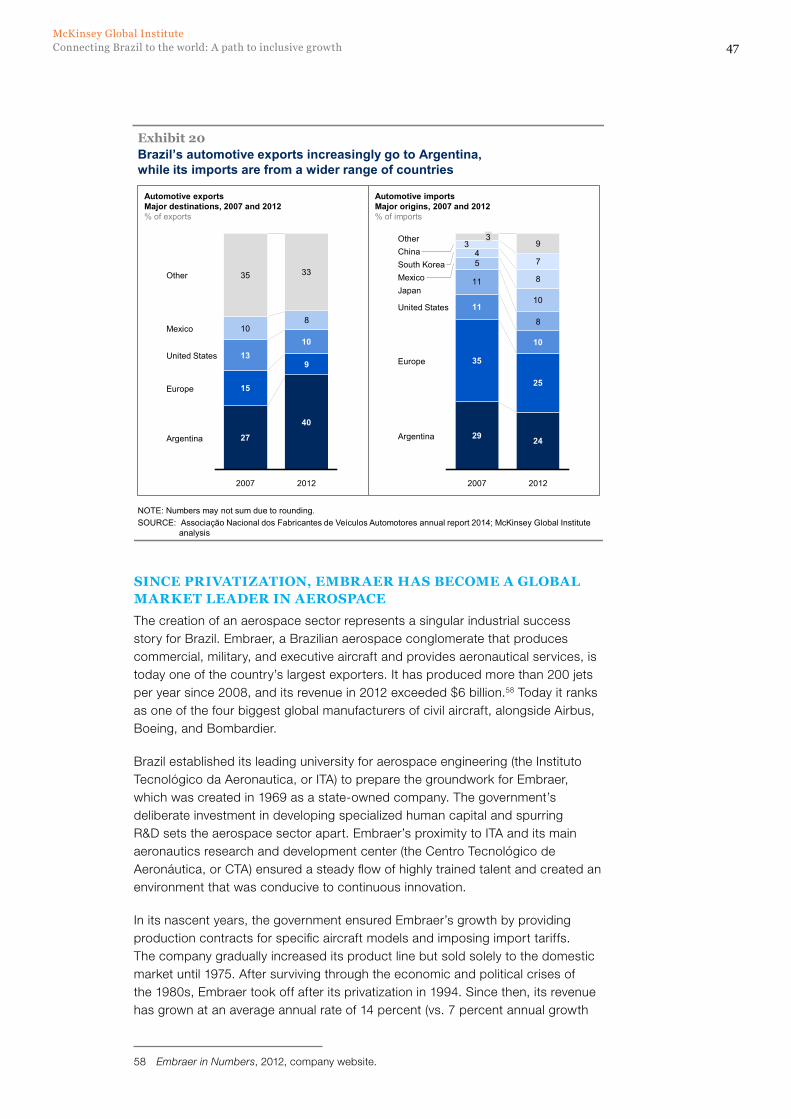
47Connecting Brazil to the world: A path to inclusive growthMcKinsey Global Institute
Brazil’s automotive exports increasingly go to Argentina, while its imports are from a wider range of countries
SOURCE: Associação Nacional dos Fabricantes de Veículos Automotores annual report 2014; McKinsey Global Institute analysis
NOTE: Numbers may not sum due to rounding.
Exhibit 20
Automotive exportsMajor destinations, 2007 and 2012% of exports
Automotive importsMajor origins, 2007 and 2012% of imports
29 24
35
25
11
10
11
8
5
10
4
8
7
3 93
Argentina
Europe
JapanMexicoSouth Korea
United States
ChinaOther
20122007
27
40
15
913
1010
8
35 33
United States
Other
Argentina
2012
Europe
Mexico
2007
sInce prIvaTIzaTIon, eMBraer has BecoMe a GloBal MarKeT leader In aerospace
The creation of an aerospace sector represents a singular industrial success story for Brazil. Embraer, a Brazilian aerospace conglomerate that produces commercial, military, and executive aircraft and provides aeronautical services, is today one of the country’s largest exporters. It has produced more than 200 jets per year since 2008, and its revenue in 2012 exceeded $6 billion.58 Today it ranks as one of the four biggest global manufacturers of civil aircraft, alongside Airbus, Boeing, and Bombardier.
Brazil established its leading university for aerospace engineering (the Instituto Tecnológico da Aeronautica, or ITA) to prepare the groundwork for Embraer, which was created in 1969 as a state-owned company. The government’s deliberate investment in developing specialized human capital and spurring R&D sets the aerospace sector apart. Embraer’s proximity to ITA and its main aeronautics research and development center (the Centro Tecnológico de Aeronáutica, or CTA) ensured a steady flow of highly trained talent and created an environment that was conducive to continuous innovation.
In its nascent years, the government ensured Embraer’s growth by providing production contracts for specific aircraft models and imposing import tariffs. The company gradually increased its product line but sold solely to the domestic market until 1975. After surviving through the economic and political crises of the 1980s, Embraer took off after its privatization in 1994. Since then, its revenue has grown at an average annual rate of 14 percent (vs. 7 percent annual growth
58 Embraer in Numbers, 2012, company website.
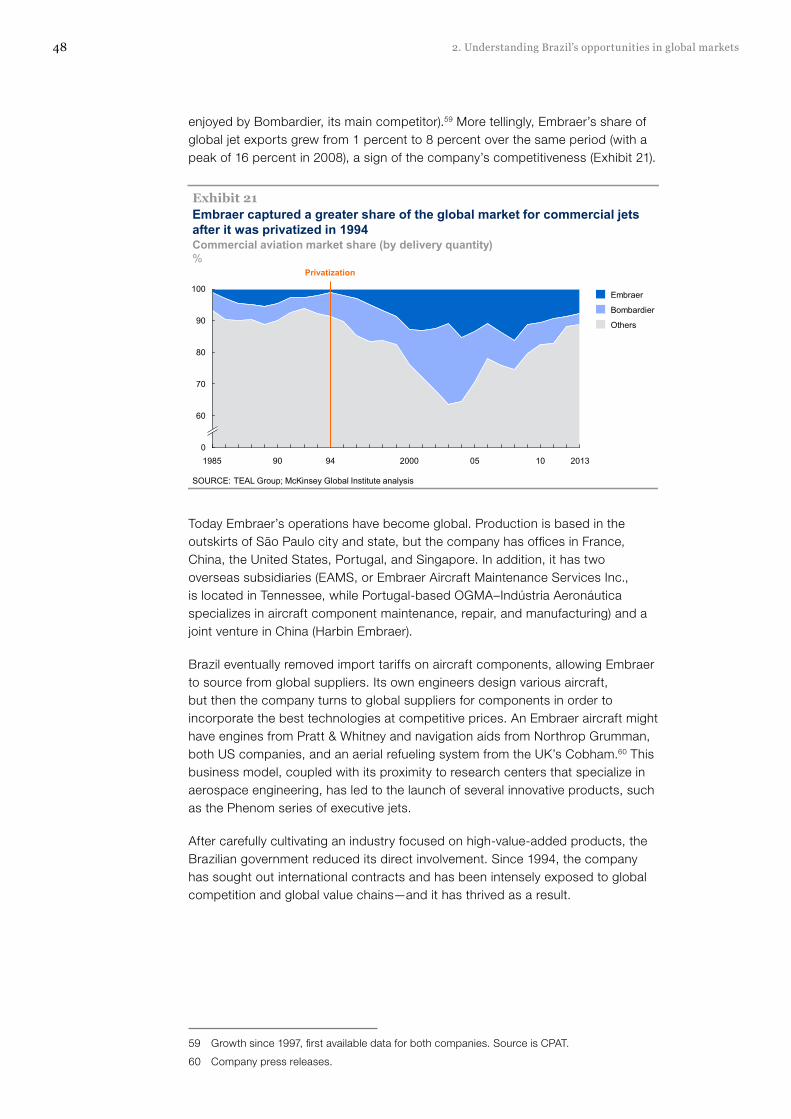
48 2. Understanding Brazil’s opportunities in global markets
enjoyed by Bombardier, its main competitor).59 More tellingly, Embraer’s share of global jet exports grew from 1 percent to 8 percent over the same period (with a peak of 16 percent in 2008), a sign of the company’s competitiveness (Exhibit 21).
Embraer captured a greater share of the global market for commercial jets after it was privatized in 1994
SOURCE: TEAL Group; McKinsey Global Institute analysis
Exhibit 21
Commercial aviation market share (by delivery quantity)%
90
100
80
0
70
60
100590 94 2000 20131985
Embraer
Bombardier
Others
Privatization
Today Embraer’s operations have become global. Production is based in the outskirts of São Paulo city and state, but the company has offices in France, China, the United States, Portugal, and Singapore. In addition, it has two overseas subsidiaries (EAMS, or Embraer Aircraft Maintenance Services Inc., is located in Tennessee, while Portugal-based OGMA–Indústria Aeronáutica specializes in aircraft component maintenance, repair, and manufacturing) and a joint venture in China (Harbin Embraer).
Brazil eventually removed import tariffs on aircraft components, allowing Embraer to source from global suppliers. Its own engineers design various aircraft, but then the company turns to global suppliers for components in order to incorporate the best technologies at competitive prices. An Embraer aircraft might have engines from Pratt & Whitney and navigation aids from Northrop Grumman, both US companies, and an aerial refueling system from the UK’s Cobham.60 This business model, coupled with its proximity to research centers that specialize in aerospace engineering, has led to the launch of several innovative products, such as the Phenom series of executive jets.
After carefully cultivating an industry focused on high-value-added products, the Brazilian government reduced its direct involvement. Since 1994, the company has sought out international contracts and has been intensely exposed to global competition and global value chains—and it has thrived as a result.
59 Growth since 1997, first available data for both companies. Source is CPAT.
60 Company press releases.

49Connecting Brazil to the world: A path to inclusive growthMcKinsey Global Institute
BrazIl’s aGrIculTure secTor has Grown More producTIve sInce The reMoval of Trade BarrIers and prIce conTrols
For decades, Brazil pursued policies that were meant to shift capital and labor from agriculture to industry. To that end, agricultural products were subject to price controls, and taxes were kept low on imports of processed food. As a result, Brazil’s agriculture industry posted only modest yield increases from the 1960s through the 1980s, and these gains only slightly exceeded increases in harvested area (Exhibit 22).
200 4.0
0
1.5
150
2.0
1.0
100
50
0
2.5
3.0
3.5
0.5
90 2000 2013100596701968 858075
Exhibit 22Brazil’s agricultural yields have grown steadily since the sector was liberalized and opened to trade
SOURCE: Lopes, Lopes, and Rocha, in A agenda de competitividade do Brasil, Instituto Brasileiro de Economia, da Fundação Getúlio Vargas, 2011; McKinsey Global Institute analysis
Grain yield, productivity, and events in selected yearsAreaMillion hectares
ProductionMillion tons
YieldKilograms per hectareOpening
of trade
▪ Ban on exports▪ Cheap credit offers to rural producers▪ Government buys from local producers▪ Subsidized production▪ Embrapa results push productivity
toward the end of period▪ Modest increase in productivity
▪ End of market intervention▪ Free trade market▪ Commodity price boom▪ Strong productivity increase
KandirLaw
92
Beginning in the early 1990s, however, the industry underwent a pronounced change. The government eliminated price controls and marketing boards that regulated the production of products such as coffee, wheat, alcohol, and sugar. A slight reduction in the protection afforded to the industrial sector eliminated some of the artificial advantages industry enjoyed over agriculture, and the government also outlined a long-term strategy to gradually remove state intervention in agricultural exports, prices, and purchasing.61 The Kandir Law decreased taxes on exports, and in 1996, Brazil entered the Mercosur trading bloc, which allowed Brazilian producers to connect with food-processing companies in Argentina and Uruguay.
When Brazil began dismantling trade barriers after 1994, much of its focus was on agricultural products. Import tariffs were reduced to less than 10 percent for wheat and corn and were removed entirely for beans and cotton. The removal of import barriers initially caused a wave of disruption (cotton production practically
61 Mauro de Rezende Lopes, Ignez G. V. Lopes, and Daniela de Paula Rocha, “As políticas de competitividade na agricultura brasileira,” in A agenda de competitividade do Brasil, Regis Bonelli, ed., Instituto Brasileiro de Economia, da Fundação Getúlio Vargas, 2011.

50 2. Understanding Brazil’s opportunities in global markets
disappeared in southern and southeastern Brazil), but the sector eventually reconfigured and emerged in stronger form. Cotton production began evolving to a more modern process, using technologically advanced machines, for example. What began as a threat became a boost to competitiveness.62
Grain production grew from 83 million tons in 1999 to 148 million tons in 2010, for an annual growth rate of 6 percent. In the same period, total harvested area grew only 2.3 percent per year, which implies an annual yield improvement of 3.7 percent.63 Today the yields for Brazil’s main crops are on a par with those of developed economies (Exhibit 23).
Exhibit 23Brazil matches the yields of more developed economies in its key crops
SOURCE: FAOstat; McKinsey Global Institute analysis
2.3
2.6
3.6
5.0Corn
Sugarcane
Cotton
Soybeans
Wheat
74.3
3.1
2.7
2.3
7.7
75.4
3.6
1.6
2.9
5.2
85.5
Yield rates for selected productsTons per hectare
Total harvested area for selected cropsThousand hectares
52 90 76
Brazil United States European Union
Some of these productivity gains are due to advances in technology and research in biotech and production processes. Brazil has a strong and longstanding culture of R&D in agriculture. In 1973, the government created Embrapa (the Brazilian Agricultural Research Corporation) to develop new crops and processes suitable to the country’s varied ecosystems. It is part of the National Agricultural Research System (SNPA), which also includes federal public institutions, state universities, private companies, and foundations that collaborate to further scientific research. The Agronomic Institute in Campinas (IAC) has also fueled Brazil’s scientific advances in agribusiness.
Embrapa has established international research partnerships, including bilateral technical cooperation agreements with numerous institutions and multilateral agreements with international organizations. Its LABEX program develops cutting-edge research in the United States, France, England, the Netherlands, and South Korea; it also has an office in Ghana to share scientific knowledge and technology with African countries. More recently, it has established partnerships with Panama and Venezuela to improve agricultural production across Latin America.
62 Mauro de Rezende Lopes, Ignez G. V. Lopes, and Daniela de Paula Rocha, “As políticas de competitividade na agricultura brasileira,” in A agenda de competitividade do Brasil, Regis Bonelli, ed., Instituto Brasileiro de Economia, da Fundação Getúlio Vargas, 2011.
63 Conab (Brazilian National Agriculture Regulator).

51Connecting Brazil to the world: A path to inclusive growthMcKinsey Global Institute
The removal of protection, support, and subsidies initially caused distress for Brazilian farmers and agribusinesses. But they eventually responded by taking steps to boost their efficiency and productivity—and their improved performance generated positive spillover effects in other industries, including fertilizer production, food processing, and retail. As Brazilian agriculture has incorporated greater use of modern machinery, production of tractors and other agricultural equipment has quadrupled in the past three decades. Brazil, previously an importer, has become an exporter of these machines—in fact, its exports of these products have increased 24-fold since 1970. Brazilian manufacturers now produce tractors that can harvest wider areas and with greater power than ever before.64 This is an example of capitalizing on Brazil’s comparative advantage in resources to build capabilities in adjacent industries, an area of potential broader opportunity.
Brazil’s large domestic market attracts FDI, but the country could do more to harness the benefits of global capital
With high volumes of inward FDI and cross-border lending, Brazil is more closely linked to global capital markets than to other types of global networks. Cross-border lending and deposit flows have grown at an annual rate of 16 percent since 2002. Loans drove most of this growth, and by 2012, they accounted for 40 percent of the country’s total international financial flows.
Brazil ranks seventh among all countries for FDI inflows (attracting an annual average of some $57 billion in inflows from 2008 to 2012), but only 30th in outflows (with an annual average of just $10 billion during the same period; Exhibit 24). Investment has flowed into commodity sectors such as mining and petroleum, but the lion’s share of FDI inflows has gone to manufacturing for Brazil’s domestic market.
Brazil’s large population and expanding middle class continue to represent a very attractive market opportunity for global companies. A long legacy of import-substitution policies and tariffs has encouraged multinationals to invest in local production rather than importing to reach these customers. Local technology and performance standards (ranging over time from TV standards to fuel efficiency) and local content requirements have provided further incentives for multinationals to expand their footprints in Brazil.
Inward FDI has brought in new technologies, innovation, and best practices developed in other countries and provided employee and managerial training.65 In March 2014, for instance, Volkswagen announced plans to invest more than $4 billion to develop new vehicles and technologies in its Brazilian operations. However, with the exception of metal products, which are resource intensive, these FDI inflows into manufacturing have not translated into significant exports in
64 ANFAVEA (Brazilian National Association of Vehicles Manufacturers), and Mauro de Rezende Lopes, Ignez G. V. Lopes, and Daniela de Paula Rocha, “Desempenho da agropecuária: produtividade, competitividade e crescimento,” in A agenda de competitividade do Brasil, Regis Bonelli, ed., Instituto Brasileiro de Economia, da Fundação Getúlio Vargas, 2011.
65 See New horizons: Multinational company investment in developing economies, McKinsey Global Institute, October 2003.

52 2. Understanding Brazil’s opportunities in global markets
the same sectors and thus should not necessarily be interpreted as an indication of strong global competitiveness (Exhibit 25).
19
21
33
57
240
253
52
Chile
India
China
Mexico
Russia
Brazil
United States
10
12
13
14
53
91
375
Russia
India
China
Brazil
Mexico
United States
Chile
Brazil is among the top ten countries with the highest inflows of foreign direct investment, but it has minimal outflows
SOURCE: IMF Balance of Payments; McKinsey Global Institute analysis
Exhibit 24
Average FDI 2008–12$ billion
Position in world ranking
FDI inflows FDI outflows
1
3
7
8
15
19
20
1
5
10
25
27
28
30
Exhibit 25A large share of Brazil’s FDI inflows goes to industries that do not export a significant part of production
SOURCE: FDI markets; Dealogic; Empresa de Pesquisa Energética (EPE); CNI/Ipeadata; Associação Nacional dos Fabricantes de Veículos Automotores (ANFAVEA); Brasscom; Itaú Unibanco; Balanço Energético Nacional, Ministério de Minas e Energia; McKinsey Global Institute analysis
4
5
7
9
10
11
19Metal products
Communications
Automotive
35Other
Metals mining
Coal, oil, andnatural gas
Financial services
Food and tobacco
1 IT used as proxy.2 In terms of volume.3 Itaú Unibanco used as proxy.4 Mining used as proxy.NOTE: Numbers may not sum due to rounding.
Foreign direct investment, inflowsAverage, 2008–12%; $ billion
Largest FDI recipient industries
% of total FDI% of production exported
16
25
58
100
Manufac-turing
Services TotalEnergy and mining
$5725
15
01
20–602
53
0–254
65

53Connecting Brazil to the world: A path to inclusive growthMcKinsey Global Institute
Beyond FDI, Brazil’s openness to financial flows has been a mixed blessing. Inflows into Brazilian bonds grew sharply in the aftermath of the Great Recession as central banks in the United States, the United Kingdom, and Japan embarked on quantitative easing, and interest rates in those countries fell to historic lows.66 Total inflows into bonds were negative between 2000 and 2006 but grew to $15 billion between 2007 and 2012. Wary about the possible damaging effects if flows of “hot money” suddenly reversed, as they did in the 1980s, Brazil imposed several post-crisis capital controls. The government later unwound some of these measures in 2013 as there was an acceleration of withdrawals from Brazil.
Brazil can broaden and deepen the benefits of FDI and access to global financing. Foreign multinationals already have an exceptionally large presence in the country.67 They can be important catalysts for productivity growth among their local suppliers and can propel the most competitive among them to greater global sales. Global company executives tend to prefer to move to locations where multinationals are already present, and with improved infrastructure and business climate, Brazil can build on its current base to attract additional competitive manufacturing and service firms. Although inward FDI has traditionally been directed to Brazil’s manufacturing and energy sectors, there is potential to realize its benefits in other parts of the economy. But Brazil should reconsider its approach to attracting foreign investors to realize more of the benefits they can bring. As the auto industry example illustrates, the protection afforded by high tariffs on imports has raised domestic prices without making local production (even by multinationals) globally competitive. The lessons learned from Embraer and the agriculture sector suggest that Brazil can become a more successful base of production for multinationals by investing in local expertise and R&D while relying on competitive pressures from global markets to encourage productivity.
In addition, further developing Brazil’s capital markets could attract global investment to meet the economy’s long-term financing needs, particularly in infrastructure.68 McKinsey research suggests that Brazil’s infrastructure needs range from $2.4 trillion to $4 trillion until 2030; external financing will be necessary to begin to bridge all the gaps. There is also a growing trend toward cross-border flows of venture capital, and creating mechanisms to connect Brazilian entrepreneurs with foreign investors could propel growth in more innovative sectors.
66 QE and ultra-low interest rates: Distributional effects and risks, McKinsey Global Institute, November 2013.
67 São Paulo ranks sixth in the world for its number of large foreign subsidiaries, the top city among all emerging markets. Urban world: The shifting global business landscape, McKinsey Global Institute, October 2013.
68 Long-term finance and economic growth, Group of Thirty, February 2013.

54 2. Understanding Brazil’s opportunities in global markets
Within traded services, Brazil could attract a greater share of global tourism
Brazil is blessed with dynamic cities, a rich musical heritage, world-class beaches, and rare ecosystems. Despite this abundance of attractions, however, it has not established itself as a top international tourist destination. In 2012, it attracted 5.7 million international visitors (some 30 percent of whom were from Argentina). Mexico, by contrast, attracted 22.6 million visitors.69 Although Mexico clearly enjoys the advantage of proximity to the United States, its government took active steps to build tourism infrastructure and sustain a marketing plan through broad, coordinated public-sector efforts. It has created thriving resort destinations by using zoning rules to encourage development of the full range of businesses needed to support tourism.70 Similarly, Dubai has undertaken several initiatives to boost tourism as part of the government’s strategy to become less reliant on the oil sector (see Box 6, “Dubai: Becoming a gateway to the world”).
69 UN World Tourism Organization.
70 How to compete and grow: A sector guide to policy, McKinsey Global Institute, March 2010.
Box 6. dubai: Becoming a gateway to the world
Located on the southeast coast of the Persian Gulf and enjoying year-round sun, Dubai has taken steps to transform itself into the leading tourist destination in the United Arab Emirates; travel and tourism contributed 31 percent of its GDP in 2011. It has positioned itself as a high-end destination with luxury hotels and designer stores (and it has furthered its reputation among wealthy consumers with a Shopping Festival and tax-free shopping). The number of hotels rose from around 250 in 1999 to more than 330 in 2010. But Dubai has also become the region’s business hub. Business travelers account for about 25 percent of total arrivals, and Dubai hosts trade events and conferences throughout the year. International arrivals to Dubai have increased rapidly, with visits from Europe to Dubai rising by 205 percent between 1999 and 2009.1
Federal and local governments took active steps to build this outcome, investing in comprehensive tourism infrastructure to form a pillar of the economy. The Dubai Department of Tourism and Commerce Marketing (DTCM) oversees international marketing campaigns and is in charge of regulating the tourism industry. It has created a new tourism identity and brand, with both TV and Internet campaigns. The United Arab Emirates has also introduced a multiple-entry visa for business travelers, property investors, and cruise passengers,
1 Travel and tourism in the United Arab Emirates, Euromonitor International, October 2013; and Passport: City travel briefing—Dubai, Euromonitor International, July 2011.
and it now requires tourism companies to operate on a standard software platform to enable better tracking of their activities.
Perhaps most important, major investment in the country’s infrastructure provided the foundation for dynamic growth. Dubai International Airport is undergoing a $7.8 billion expansion plan that is expected to accommodate 90 million passengers a year by 2018. Government support to national airlines Emirates Airlines and Etihad Airways has helped to sustain this growth, and Emirates is increasingly challenging European airlines for market share on major routes between Europe and the Middle East, Asia, and Africa. In addition, Dubai has invested in urban transit. Its metro network improves city traffic and makes it easier for tourists to visit the city. In 2010 and 2011 alone, nine metro stations were opened.2
Dubai is only one among many governments that have been proactive in their efforts to boost the growth of tourism. Becoming an attractive destination for global travelers requires a wide range of facilities, from comprehensive airport and road infrastructure to a critical mass of fragmented hotel and restaurant businesses. Evidence from the most successful tourism destinations shows the importance of government efforts to align visitor expectations with the available range of services.
2 Ibid.

55Connecting Brazil to the world: A path to inclusive growthMcKinsey Global Institute
Today Brazil’s tourism industry supports more than two million jobs—and there is potential for many more.71 Tourism-related activities are particularly attractive because they are labor intensive and can be an important source of modern sector job growth.72 Yet Brazil’s share of the global market has been eroding: since 1999, it has lost 38 percent of its share of South America’s inbound tourism and 30 percent of its share of world inbound tourism (Exhibit 26). The tourism industry, which directly drove 4.4 percent of Brazil’s GDP in 2005, now accounts for only 3.5 percent of GDP.
35
0
30
25
20
2005 10
Share of South American tourism
20121999
0.5
0.8
0.7
0
0.6
10
Share of world tourism
201220051999
Brazil’s share of world and South American inbound tourism has eroded
SOURCE: World Economic Forum, Travel & tourism competitiveness report; McKinsey Global Institute analysis
Exhibit 26
%
-38%-30%
NOTE: Not to scale.
If Brazil could regain just the share of world tourism it has lost since 1999, it could potentially add 0.25 percentage points to annual GDP growth through 2030. To reverse the decline, Brazil needs to address three problems that discourage international tourists from visiting: inadequate tourism infrastructure, high costs, and a reputation for crime and violence. In addition, Brazil’s low level of English language proficiency (on a par with Mexico, China, and Russia) may be a contributing factor that inhibits the flow of both inbound and outbound tourism (see Box 7, “Overcoming language barriers,” which discusses this issue as it affects broader trade in services).
71 World Travel and Tourism Council and IPEA estimates for 2010.
72 How to compete and grow: Sector guide to policy, McKinsey Global Institute, March 2010.

56 2. Understanding Brazil’s opportunities in global markets
Box 7. overcoming language barriers
Brazil’s participation in the global trade of services is lower than most of its peers. Service imports (defined as travel, transportation, information services, royalties and license fees, financial services, and others) represent 3.6 percent of Brazil’s GDP, while the average for Latin America is 4.1 percent. Similarly, service exports represent 1.8 percent of Brazil’s GDP, below the Latin American average of 2.4 percent. By contrast, in India, services constitute around 7 percent of imports as a share of GDP and 8 percent of exports.
Language barriers are one constraint that affects Brazil’s ability to trade services globally. Not only is Brazil the only Portuguese-speaking nation in Latin America, but the population’s English-language proficiency is lagging—and that is a growing limitation as English emerges as the predominant language of international business. One global survey ranked Brazil 38th out of 60 countries for English-language fluency, which puts it in the “low proficiency” category.1
Brazil will need a sustained and long-term educational focus on teaching key foreign languages in order to increase its ability to do business globally. It is already taking some encouraging steps: the Brazilian Ministry of Education has established an “English Without Borders” program for college students, and the nonprofit Institute of International Education has launched an initiative to send more than 1,000 Brazilian teachers each year to the United States for intensive English-language and teacher training.2 CNA language schools recently attracted wide media attention for its innovative program that connects Brazilian students with retirement home residents in the United States. Using video chat technology, this program has not only allowed students to practice their language skills, but has also formed some extraordinary interpersonal connections between cultures and across generations.3
1 English Proficiency Index, Education First, 2013.
2 Institute of International Education press release, January 15, 2013.
3 Tim Nudd, “Perfect match: Brazilian kids learn English by video chatting with lonely elderly Americans,” Adweek, May 7, 2014.

57Connecting Brazil to the world: A path to inclusive growthMcKinsey Global Institute
As discussed elsewhere in this report, Brazil’s infrastructure challenges include aging facilities and inadequate capacity. Those issues are evident in Brazil’s airports, which are straining to accommodate current levels of tourist activity. According to INFRAERO, Brazil’s civil aviation administration institute, seven of the 16 airports in Brazil’s main cities were operating at 85 percent of capacity in 2013—and three (São Paulo, Brasília, and Mato Grosso) were operating over the maximum recommended capacity.73 Furthermore, Brazil’s network of road and rail connections between cities remains underdeveloped. The country’s ground transport infrastructure ranks 129th internationally, according to the World Economic Forum’s Travel and Tourism Competitiveness Report 2013.74
High prices for airfares, accommodations, meals, ground transportation, and activities are another deterrent to visitors. One recent industry survey found that Rio’s hotel rates are the fifth highest in the world among urban areas, even surpassing room rates in New York, Hong Kong, and Paris; São Paulo ranked as the 15th most expensive city for hotel stays.75 This reflects low productivity, high cumulative taxes, and the strong real, which has made Brazil an expensive choice for international tourists paying their way with foreign currency.
Safety and security concerns have also kept visitors away. The World Economic Forum report ranks Brazil 73rd in this category, in line with countries that have much lower GDP per capita, such as Jordan (72nd), India (74th), and Botswana (75th).
Brazilians themselves, however, are becoming more mobile. International departures from Brazil increased 13 percent per year from 2002 to 2010.76 With rising average incomes and greater access to credit, Brazilians are now able to travel abroad more frequently. Most outward travel from Brazil is bound for the United States, Argentina, and Portugal; together, these three countries are the destinations for almost 60 percent of Brazilian tourists. The United States and Argentina are popular with Brazilian shoppers, who visit these countries in order to purchase products (especially electronics) at a fraction of the prices they would pay at home. Portugal is more accessible due to the bond of a common language.
Accounting for both inbound and outbound travel, Brazil remains relatively isolated from the rest of the world, however. The number of passengers flying in and out of Brazil is on the rise, but it remains relatively low in comparison to other countries. Brazil’s inbound yearly seat capacity in 2012 was 64 passengers for every 1,000 inhabitants, just over 40 percent of Mexico’s capacity and only 7 percent of the level in Australia, another country that is located far from many key global tourism markets (Exhibit 27). São Paulo, for example, is the world’s
73 INFRAERO, accessed through article by g1.com, published February 4, 2014 and accessed on March 10, 2014.
74 Jennifer Blanke and Thea Chiesa, eds., Travel and tourism competitiveness report 2013, Country Highlights, World Economic Forum.
75 Hogg Robinson Group, biannual hotel survey for the first half of 2012.
76 World development indicators, World Bank, 2011. International outbound tourists are the number of departures that people make from their country of usual residence to any other country for any purpose other than a remunerated activity in the country visited. The data on outbound tourists refer to the number of departures, not to the number of people traveling. Thus a person who makes several trips from a country during a given period is counted each time as a new departure.

58 2. Understanding Brazil’s opportunities in global markets
seventh-largest city, but its airport is only the 43rd busiest in the world in terms of passenger traffic.77
Exhibit 27The flow of airline passengers traveling in and out of Brazil is low by international standards
SOURCE: United Nations Conference on Trade and Development, UNCTADstat; Anuário do transporte aéreo; Infraero; McKinsey Global Institute analysis
Inbound yearly seat capacity per 1,000 inhabitants, 2012
642242
94154
261
369
862
ChinaBrazil IndiaMexico RussiaUnited States ChileAustralia
Brazil is about to receive a once-in-a-lifetime boost in global visibility and media coverage as it hosts the World Cup and the Olympics, and it will be crucial to seize these opportunities to build momentum. South Africa, for example, successfully used the 2010 World Cup as a springboard for dramatic growth in its tourism industry. South Africa hosted 7 million visitors in 2009; after the event, it hosted 8.3 million visitors in 2011 and 9.2 million in 2012.78
77 2012 world airport traffic report, Airports Council International, 2013.
78 Tourism, 2009, report number 03-51-02, Statistics South Africa, 2010, and Tourism, 2012, report number 03-51-02, Statistics South Africa, 2012.

59Connecting Brazil to the world: A path to inclusive growthMcKinsey Global Institute
* * *
Deeper integration into global markets and value chains could provide competitive pressures that spur Brazilian companies to improve operations and invest in efficiency—ultimately leading to the kind of broad-based productivity gains that raise incomes and living standards. The imperative to become more connected is not solely a question of trade and finance, however. Brazil also needs to tap into advanced skills, knowledge, technology, talent, and best practices from around the world. The next chapter explores how global digital networks and people flows can contribute to building a culture of entrepreneurship and innovation in Brazil.


The global economy is increasingly characterized by an intricate web of interconnections. In addition to the flows of goods, services, and capital discussed in Chapter 2, digital and people flows represent valuable exchanges of ideas, innovation, and skills. More exposure abroad increases a country’s ability to attract talent from around the globe and to adopt best practices developed elsewhere.
Global talent and knowledge pools are increasingly connected through digital networks that are becoming critical to productivity and growth. As more of our world is transformed into digital form, new online platforms have emerged for e-commerce, file sharing, collaboration, and finance. There is growing trade in digital goods, and digital tracking is transforming the way physical goods are traded. Individuals, small firms, and entrepreneurs now have lower barriers to participating directly in the global economy. Brazil is quickly becoming a digital nation and has avidly embraced social media. It does not currently take full advantage of participating in cross-border flows of data and communication that can drive business, innovation, and research collaboration. But the intensity of domestic use shows that Brazil has the potential to play a bigger role in the digital economy.
Just as exposure to global competition and practices fuels productivity and growth within industries, the migration of foreign workers and the exchange of international students place a country more fully in the world’s flow of ideas and innovation. More exposure abroad increases a country’s ability to attract talent and skills from around the globe and to adopt best practices developed elsewhere. Although Brazil is a nation with an immigrant heritage, only 0.5 percent of its workforce is foreign born, down from more than 5 percent in the early 1900s.79
Policy makers have traditionally focused on mitigating the risks of openness, but today government and business leaders could also consider how to harness the potential of global flows to increase productivity and push the boundaries of innovation. Brazil is becoming a supplier of primary commodities, but it has an opportunity to take a different path. Focusing on innovation could allow Brazil to develop new strengths in higher-value-added products and services—and eventually become a more diversified and resilient economy. Given that Brazil’s education system and R&D spending are currently lagging, acquiring foreign knowledge and technology could be the fastest way to catch up.80
In a more intricately connected global economy, deeper integration can offer greater rewards than ever before—and nations, companies, and people who do
79 Global flows in a digital age: How trade, finance, people, and data connect the world economy, McKinsey Global Institute, April 2014.
80 Alberto Rodriguez, Carl Dahlman, and Jamil Salmi, Knowledge and innovation for competitiveness in Brazil, World Bank, 2008.
3. Broadening Brazil’s global connections to jumpstart innovation

62 3. Broadening Brazil’s global connections to jumpstart innovation
not participate in these expanding networks risk being left behind. This chapter will examine Brazil’s links with these global networks and identify areas in which it could reap benefits from building broader and deeper connections to the rest of the world.
Tapping into global flows of data and information could increase commerce, research, and collaboration
Global flows of data and communication have grown exponentially as people and companies around the world use digital and mobile technologies to share ideas, collaborate, and communicate—and they are likely to become even more important over time.
Domestic use of the Internet is a precursor to participating in global digital networks, both in terms of building the right infrastructure and developing a baseline of technology skills. Internet adoption in Brazil is in line with countries at similar stages of development, such as China, Mexico, and Russia, although not as widespread as in advanced economies. According to the International Telecommunications Union, Brazil’s online population has quadrupled over the past decade; today almost 50 percent of Brazilians have regular Internet access either at home, work, school, or in Internet cafes (Exhibit 28). Almost 50 percent of Brazilian households have a computer, and almost 38 percent have Internet access.
Exhibit 28Brazil’s Internet penetration almost quadrupled in a decade, bringing it in line with usage rates in peer countries
SOURCE: International Telecommunication Union, UN; McKinsey Global Institute analysis
49.8
45.0
40.7
39.2
33.8
30.9
28.2
21.0
19.1
13.2
x
2005
2010
2012
2008
2007
2004
2003
2006
2011
2009
81.0
53.349.8
42.338.4
12.6
RussiaBrazilIndia China United States
Mexico
Individuals using the Internet in Brazil
%
Individuals using the Internet, 2012
36.6
Average = 46
Household Internet penetration has been hampered by high prices (of both devices and paid Internet service) and gaps in coverage. In a survey conducted in 2012 by CETIC (Brazil’s Center for Information and Communication Technologies), 63 percent of people without a computer at home stated that they cannot afford

63Connecting Brazil to the world: A path to inclusive growthMcKinsey Global Institute
one. The high price of consumer electronics in Brazil, mostly due to trade tariffs and taxes, is a factor. Of households with computers but without Internet access, 44 percent cite the cost in their lack of Internet service at home. Additionally, 25 percent of people state that there is no Internet coverage where they live, highlighting the fact that networks are not yet universal.
Despite these issues, Brazilians find ways to go online at more affordable prices. Twenty percent of Internet users still frequent Internet cafes (although their use has dropped by half since 2008). One-third use the Internet at work, and 15 percent go online at school. The growth of smartphones and the mobile Internet is striking. In the 2008 survey, virtually no one mentioned a smartphone as a means of accessing the Internet; by 2012, more than 21 percent of Brazilians surveyed cited it as one of their main means of going online. The expansion of 3G networks is creating a leapfrog development favoring the mobile Internet, especially in urban areas.
Once they go online, Brazilians are avid users of social networks. Facebook has more than 60 million users in Brazil, which is more than 30 percent of the population—an extraordinarily high share given that just under 50 percent of the population has any Internet access at all. McKinsey’s iConsumer survey showed that social network use is intense across all income segments, well ahead of other international markets.
Brazil’s affinity for the Internet has not yet translated into a high degree of connectedness to international data flows, however. These flows matter since they reflect more than simply interpersonal communication and the consumption of digital content; they also enable and underpin the cross-border exchange of goods, services, capital, and people. But Brazil has only a sixth of the international data traffic per inhabitant that flows through the United States or Spain, and 5 percent of the level that flows through Germany, the global leader. In fact, Brazil lags behind South American peers such as Chile and Argentina in this regard (Exhibit 29). It is, however, in line with Mexico, and it outperforms other major emerging economies such as China, India, and South Africa.
Nevertheless, Brazil is becoming more immersed in the international flow of data, which has posted a compound annual growth rate of 72 percent over the decade from 2002 to 2012. This positive growth trend, coupled with the intensity of domestic use, shows that Brazil has the potential to play a significant role in a more digital global economy. In April 2014, Brazil established a new Internet framework by passing the Marco Civil da Internet, which attracted worldwide notice by enshrining the principles of net neutrality, freedom of expression, and user privacy. But it also seeks to apply Brazilian law to international service providers operating in Brazil. (A provision specifying that international companies storing data on Brazilians had to store it on servers physically located in Brazil was dropped in the final legislation.) It remains to be seen how the differences between this new “Internet bill of rights” and the approach taken in other countries may affect Brazil’s future participation in the worldwide Web.
In addition to accelerating the exchange of research and ideas, digital technologies make it possible to collaborate remotely on new scientific research and innovations. Although there has been an increase in Brazil’s share of the world’s article publication (from 1.5 percent in 2000 to 2.7 percent in 200881),
81 UNESCO science report, 2010.

64 3. Broadening Brazil’s global connections to jumpstart innovation
its participation in international research collaborations lags behind that of other leading countries. Brazilian scholars have produced relatively few academic articles with foreign coauthors (12 articles with coauthors from countries per 100,000 residents, which is behind Mexico but ahead of China and India) (Exhibit 30). Brazil also accounts for only 0.4 percent of the world’s patents, leading to relatively few overseas patent registrations (450 applications for overseas patent registrations in 2012 vs. almost 1,800 from India and 4,800 from China, for example).
Exhibit 29
2.87
Chile
9.08
Brazil
0.38
1.39
China
1.51
Russia
6.96
Mexico
United States
India 0.09
1,216
3,006
1,065
28,503
1,677
5,178
4,116
Brazil’s international data traffic is relatively low but growing rapidly
SOURCE: Telegeography; McKinsey Global Institute analysis
International data traffic, 2012Megabits per second
Per 100,000 inhabitants Total
Compound annual growth rate, 2002–12%
50
85
88
72
64
68
83
Brazilian scholars publish relatively few articles with international coauthors
SOURCE: Thomson Innovation; McKinsey Global Institute analysis
Exhibit 30
Articles coauthored with other countries’ authors per 100,000 inhabitants, 2012
25
121618
5762
Chile China IndiaRussiaUnited States BrazilMexico
Brazil’s limited international digital traffic reflects its lower levels of trade and the large share of the population without Internet connectivity. Yet the digital threads connecting the various regions of Brazil and connecting Brazil to the world will continue to grow at a rapid clip, opening up new areas for productivity and innovation. Brazil’s large and growing consumer market provides opportunities for incubating startup companies. Perhaps the next global social media company

65Connecting Brazil to the world: A path to inclusive growthMcKinsey Global Institute
will be founded in Brazil (and not by a Brazilian who moved to San Francisco, as Instagram co-founder Mike Krieger did). Perhaps most important, having a digitally literate population allows companies to incorporate technology solutions in new ways, from employee tools and customer communications and marketing to business process solutions that can improve the productivity of even the smallest family businesses.
People flows enhance skills, innovation, and business relationships
The world is increasingly mobile, and the migration of workers across borders can have important benefits for transferring skills and building international relationships that can lead to business deals. There are economic benefits to be realized from people flows—both emigration and immigration.
Even if they do not eventually return, emigrants working abroad tend to become channels for remittances, skills, technology, and ideas.82 Studies have shown that international networks of emigrants can contribute to developing new industries and generating new patents at home.83
In 2012, Brazil granted just over 73,000 work permits to foreigners. This number represents an increase of 137 percent over the previous three years.84 According to the Ministry of Labor and Employment, these immigrants tend to be highly qualified managers and supervisors, and the majority specialize in engineering, technology and IT, oil and gas, and construction and infrastructure. An increasing share of these foreign workers have master’s degrees or PhDs.
The ministry also reports that from 2011 to 2012, the number of temporary visas granted to workers from Portugal increased by 81 percent and that those granted to workers from Spain rose by 53 percent. (There was also a 24 percent increase in workers from China.) Brazil grants permanent residency to those who invest at specified levels; the number of Portuguese investors who immigrated to Brazil also doubled from 2011 to 2012. This type of “North-South” migration was uncommon in the past, but it has increased since the 2008 financial crisis and the subsequent Eurozone crisis as increasing numbers of workers from developed economies are willing to move to emerging economies for better career prospects.85
Although immigration is growing, the number of foreign workers in Brazil remains very low. Brazil could do more to increase these numbers in a way that contributes to its long-term growth and productivity. The current system favors applicants with existing employment offers, but Brazil could adopt a more comprehensive skills-based approach that takes a broader look at the needs of high-priority sectors.
82 Michael A. Clemens, What do we know about skilled migration and development? Migration Policy Institute policy brief number 3, September 2013.
83 AnnaLee Saxenian, “Transnational communities and the evolution of global production networks: The cases of Taiwan, China, and India,” Industry and Innovation, volume 9, issue 3, 2002; and William R. Kerr, “Ethnic scientific communities and international technology diffusion,” The Review of Economics and Statistics, volume 90, number 3, August 2008.
84 Ministry of Labor and Employment statistics.
85 World migration report 2013, International Organization for Migration, 2013.

66 3. Broadening Brazil’s global connections to jumpstart innovation
A number of countries apply this kind of lens to portions of their immigration policies. Like Brazil, Australia is a nation of immigrants. But its government has continued to place a high priority on the role immigrants can play in the economy, and today some 25 percent of its workforce is foreign born. Australia has increasingly moved toward a skill-based admission system to fit with its economic priorities and has also taken steps to grant permanent residence to international students when they complete their studies in Australia.86
Meeting industry’s needs for college-educated and highly specialized workers today can also facilitate the transfer of skills to their companies and colleagues—thus building capabilities for the future. This could have a positive effect on Brazil’s capacity for innovation. One study in the United States, for example, found that every 1 percentage point rise in the share of immigrant college graduates in the population increases patents per capita by 6 percent.87 In addition, research has found that flows of high-skilled migrants between countries and other types of cultural ties facilitate cross-border venture capital deals.88 This implies that building deeper ties with the rest of the world could help Brazil’s entrepreneurships connect to global sources of startup capital.
People flows also include the exchange of international students. Like flows of migrant workers, student exchanges build personal connections and the transfer of skills over time. They also set the stage for future research collaborations.
Today it is more common for Brazilian students to travel and study abroad. The number of students in tertiary education studying in a foreign country almost doubled from 16,500 in 1999 to 30,700 in 2012 (Exhibit 31).
A growing number of students are participating in the government’s Ciência sem Fronteiras (Science Without Borders) program. Launched in 2011, it aims to promote innovation and competitiveness by sponsoring Brazilian students in exchange programs in foreign universities. Moreover, the program seeks to attract researchers from abroad who want to settle in Brazil or establish partnerships with Brazilian researchers in priority areas. A joint effort of the Brazilian Ministry of Science, Technology, and Innovation and the Ministry of Education, the initiative aims to provide up to 101,000 scholarships until 2015. As of January 2014, almost 46,000 scholarships had been granted, of which 36,000, or approximately 78 percent, were for undergraduate students. Most of the scholarships were in engineering, biology and biotechnology, and other natural sciences.
Students with international education experiences return with much more than degrees. They bring back language skills and experience operating in different cultures—attributes that make them more attractive candidates for both Brazilian and international multinationals. They establish personal and professional connections within international business and professional networks. Equally important, they raise Brazil’s profile around the world.
86 Thomas Liebig, The labour market integration of immigrants in Australia, OECD social, employment, and immigration working paper number 49, February 2007.
87 Jennifer Hunt and Marjolaine Gauthier-Loiselle, How much does immigration boost innovation? NBER working paper number 14312, September 2008. See also William R. Kerr, US high-skilled immigration, innovation, and entrepreneurship: Empirical approaches and evidence, NBER working paper number 19377, August 2013.
88 Sonal Pandya and David Leblang, Deal or no deal: The growth of international venture capital investment, University of Virginia, November 2011.

67Connecting Brazil to the world: A path to inclusive growthMcKinsey Global Institute
A steady increase in the number of students studying abroad will contribute to connecting Brazil
1 Ciência Sem Fronteiras (Science Without Borders).2 Researchers from other countries who receive scholarships to study in Brazil.SOURCE: Ciências sem Fronteiras Control Panel; McKinsey Global Institute analysis
The number of tertiary-level students studying abroad has been increasing since 1999 ...
... and is expected to continue rising due to government incentive programs1
Exhibit 31
International flows of Brazilian students at the tertiary levelThousand students
International scholarships offered to students since program launch (December 2011)Number of scholarships
5
25
20
15
10
35
30
020101999 20122005
6002,808
6,463
36,250
DoctorateUnder-graduate
Post doctorate
Researchers into Brazil2
With the right global connections, local industry clusters can become hubs of innovation and growth
Entrepreneurs are vital to spurring innovation, incorporating new technologies, and responding to changing international markets. The barriers to entry are falling for individuals and small businesses to participate directly in a more digitally connected global economy, and creating a robust startup culture can capitalize on this trend. When deep pools of technical and entrepreneurial talent form and investment flows into R&D, innovative industry clusters can take root and grow—and experiences from around the globe have demonstrated the importance of international connections to this process.
Skilled migrants have been critical to the growth of some of the world’s leading technology hubs. In fact, recent research has found that one-quarter of all US high-tech startups have an immigrant founder, and almost half (48 percent) of the top US venture capital–funded companies had at least one immigrant founder.89 From its earliest days, Silicon Valley has drawn depth and a steady stream of new ideas from the international students who come to study in the region’s leading research universities (Stanford University, the University of California at Berkeley, and others) and then stay on to work in the high-tech industry. Today the region is a magnet for the world’s top engineering and IT talent. Similarly in Ireland, Israel, and India, skilled migrants have played a key role in the growth of local software clusters.90 In addition, India and Ireland have experienced the phenomenon of “brain gain,” in which citizens who lived or worked abroad eventually returned
89 Vivek Wadhwa, AnnaLee Saxenian, and F. Daniel Siciliano, America’s new immigrant entrepreneurs: Then and now, October 2012, Ewing Marion Kauffman Foundation, October 2012. Stuart Anderson, Immigrant founders and key personnel in America’s top 50 venture-funded companies, National Foundation of American Policy policy brief, December 2011.
90 Ashish Arora and Alfonso Gambardella, From underdogs to tigers: The rise and growth of the software industry in Brazil, China, India, Ireland, and Israel, Oxford University Press, 2006.

68 3. Broadening Brazil’s global connections to jumpstart innovation
home, bringing with them internationally acquired education, skills, and personal contacts.
The other crucial building block is increased investment in research institutions, especially those that feed into strategically important sectors. Both public- and private-sector R&D funding can provide the support needed to develop and commercialize emerging technologies and solutions, yet access to global expertise and talent matters. The world’s largest semiconductor foundry, TSMC, was founded in 1987 with technology that was spun off from the Industrial Technology Research Institute (ITRI), a publicly funded Taiwanese research institute. The Taiwanese government, through the Taiwanese Development Fund, was a major investor in TSMC early on, together with foreign investors such as Philips.91 The company’s first CEO, Morris Chang, spent 25 years with Texas Instruments in the United States, gaining experience that he brought back to Taiwan to lead TSMC. He is credited with introducing TSMC’s revolutionary foundry business model, which enabled Taiwan to grow into arguably the world’s leading semiconductor hub today.92
Once a cluster begins to form around a research hub, additional companies and suppliers may follow, creating an agglomeration economy. The United States has multiple examples of thriving local industry clusters far beyond Silicon Valley, including biotech in Massachusetts, clean tech in Colorado, polymers in Ohio, and auto manufacturing in South Carolina.93 By focusing on talent development, R&D support, and ensuring the availability of startup capital, Israel, for example, has built a renowned life sciences industry with a growing global presence (see Box 8, “Israel: Building a world-class life sciences cluster”). Developing economies have also succeeded in building highly competitive industry clusters, such as Bangalore’s IT services cluster or Mexico’s automotive cluster in Puebla and an aerospace cluster in Queretaro.
* * *
As Brazil prepares to welcome the world to two major global events, it is an opportune moment to weigh the state of its connections with the rest of the global economy. In addition to reconsidering how it participates in global trade and global capital markets, Brazil can actively seek out more of the world’s ideas, research, and best practices. The shift toward digital networks means that companies, entrepreneurs, and individuals have a greater ability to participate directly in global commerce and communication than ever before. Encouraging greater digital connectivity and a freer flow of workers and students can only increase Brazil’s dynamism. The following chapter will discuss some of the steps Brazil can take to capture these opportunities and develop a new agenda for growth and competitiveness.
91 TSMC became a publicly traded company in 1994, and Philips sold its shares in 2008.
92 How to compete and grow: A sector guide to policy, McKinsey Global Institute, March 2010.
93 Bruce Katz and Mark Muro, The new “cluster moment”: How regional innovation clusters can foster the next economy, Metropolitan Policy Program at Brookings, September 2010.

69Connecting Brazil to the world: A path to inclusive growthMcKinsey Global Institute
Box 8. Israel: Building a world-class life sciences cluster
Israel has a strong tradition of putting science and technology at the forefront of its economic development. It has built an enviable base of human capital, including a large pool of scientists and engineers, many of them immigrants from Russia and elsewhere. It invests 4 to 5 percent of its GDP on R&D each year, the highest rate in the world.1 Not only have major multinationals in technology and biomedicine established operations in Israel, but the country has its own flourishing high-tech startup culture. In 2008, it attracted more than twice the venture capital per citizen than the United States,2 and it has a larger number of companies listed on the NASDAQ than any country outside the United States.
One of Israel’s biggest success stories has been its creation of a world-renowned life sciences cluster, fueled by policy measures such as R&D grants and tax benefits. The country has more than 1,000 life science companies, and some 80 new ventures are formed each year.3 A key anchor of the cluster is Teva Pharmaceutical Industries, the largest generic drug manufacturer in the world, as well as numerous medical device companies.
To stay at the forefront of the life sciences and to attempt to capture market share in an emerging field, Israel recently launched an initiative to become a world leader in neurotechnology, building on its existing strengths in computer science, nanotechnology, and brain research.4 To promote R&D in this area, Israel has created major research centers and a cross-ministry forum in charge of large R&D investments (TELEM). It has also taken steps to attract leading international scientists, and in 2013, the country hosted its first international brain technology conference. R&D investment is tax deductible for projects approved by the Office of the Chief Scientist, which also provides funding for basic research.5
The private sector has played an important role in developing the industry. Israel’s technology incubator was originally government funded, but since being privatized, it has expanded to dozens of science parks across the country to provide infrastructure, finance, and administrative support for the first years of a company’s life in exchange for an equity stake.6 As a result of this and other initiatives, Israel has the highest concentration of startups per capita in the world—and international collaboration and partnerships continue to fuel its growth.7
1 OECD Science and Technology Indicators.
2 Dan Senor and Saul Singer, Start-up nation: The story of Israel’s economic miracle, Twelve, 2009.
3 Invest in Israel (Israel’s Investment Promotion Center).
4 Meeting the mind: The neurotechnology revolution, McKinsey & Company, January 2011.
5 Such as the new Edmond and Lily Safra Center for Brain Sciences in the Hebrew University and the Leslie and Susan Gonda (Goldschmied) Multidisciplinary Brain Research Center at Bar-Ilan University.
6 Israeli incubators program.
7 Zack Miller, “Behind Israel’s startup success is a mountain of international collaboration,” Forbes, December 23, 2013.


Brazil has reached a critical juncture in its economic development. Now that millions have been lifted out of extreme poverty, today’s challenge is to ensure that those struggling for a foothold in the middle class have an opportunity to enjoy more robust income growth and higher living standards. Brazil has already reaped most of the gains from an expanding labor force—and in the years ahead, it will need to focus on enhancing productivity and meeting the rising expectations of its citizens.
It is unlikely that the inward-focused policies of the past will be sufficient to achieve these goals. Brazil will need the competitive pressures and the new sources of growth that are available through integrating more fully into global markets and into the production networks of multinationals. The interconnections in the world economy are changing rapidly, and as new trade routes form, firms are racing to gain a strong starting position and seize market share. This is a crucial moment for Brazil to consider what it will take to ride the current wave of global growth.
Estimating the economic potential of greater global connectedness is, of course, an inexact science. This is in part because some of the steps required to deepen Brazil’s connections with the global economy (such as infrastructure improvements) would also result in domestic productivity gains. But based on an assessment of global connections and their impact on economic growth, we believe that Brazil has an opportunity to boost its average GDP growth by up to 1.25 percent annually.94 For Brazil to cut the the share of population below empowerment line by half, it needs to generate 4.2 percent average annual GDP growth over the next two decades—and this estimate shows that greater global connectedness could help Brazil get approximately one-third of the way toward this goal.
Brazil is starting with a major advantage in the form of a strong and sophisticated business community. While the country has fared poorly in international competitiveness rankings, closer analysis reveals a sharp divergence in the performance of the public sector vs. the private sector. Brazil tends to fall short in the aspects of competitiveness that fall within the government sphere, but its business sector performs relatively well in categories such as professional management, sophistication of processes, and the extent of marketing.95 Thanks to innovations in clean energy, Brazil is poised to claim a growing share of the world’s biofuels trade in the decades ahead.96 Its banking sector has developed a
94 This model was developed as part of MGI’s recent research on the economic value of global flows.
95 Pablo Haberer and Nicola Calicchio, “Leveraging Brazil’s business environment for increased competitiveness,” in The Brazil competitiveness report 2009, Irene Mia et al., eds., World Economic Forum, 2009.
96 The International Energy Agency’s World energy outlook 2013 projects that Brazil will account for 40 percent of global trade in biofuels by 2035.
4. How Brazil can connect and grow

72 4. How Brazil can connect and grow
highly efficient electronic payment system, and there is a growing wave of high-tech startups.
The success stories of Brazil’s dynamic aerospace and agriculture sectors, described earlier in this report, suggest that the combination of exposure to global competition, Brazil’s strong business capabilities, and targeted public-sector support for R&D and talent development can be a powerful formula for growth. This model can form the basis for a new, proactive growth policy—one that steers away from relying on protectionism and moves toward building targeted capabilities that prepare local companies to be globally competitive.
Our research on Brazil’s economic performance points to seven major imperatives for restoring growth and sustaining broad-based prosperity. This chapter outlines a new growth agenda for Brazil that is premised on opening the door to global markets, the bracing effects of competition, and the world’s flow of information, ideas, and best practices.
1. Shift the focus of economic development to investment
Consumption was the key to much of Brazil’s recent growth, and it has largely been fueled by rising debt and windfall gains from the commodities boom. But this formula is unlikely to sustain future growth and allow Brazil to reach the next level of economic development. For the middle class to make real income gains, Brazil has to expand the productive capacity of the economy by investing more of its current income in infrastructure, machinery, and skills. As we have discussed, Brazil’s abundant natural resources could be managed as assets for building a more diversified and resilient base for long-term growth.
Despite the boom between 2000 and 2011, Brazil’s overall investment rate was equivalent to 18 percent of GDP, well behind other developing economies such as Chile (23 percent), Mexico (25 percent), and China (42 percent).97 Brazil’s infrastructure investment has lagged behind the global average by more than 40 percent (2.2 percent of GDP invested in infrastructure vs. 3.8 globally). High interest rates and underdeveloped long-term credit markets have discouraged businesses from making capital investments that could improve efficiency.
Changing this dynamic will require raising domestic savings and the share of public expenditure that goes toward investment. The country’s pension system, in particular, requires a high level of current public expenditures and, according to some research, may discourage many households from saving.98 To encourage private-sector investment, the government can simplify unnecessary red tape, more closely integrate states into a single domestic market, and create targeted incentives. BNDES is the major source of long-term financing for business and infrastructure, but Brazil could benefit from deepening its credit markets and encouraging a greater role for a wider range of private lenders.
97 IMF Data and Statistics Database.
98 Jens Arnold, Raising investment in Brazil, OECD Economics Department working paper number 900, October 2011.

73Connecting Brazil to the world: A path to inclusive growthMcKinsey Global Institute
2. Reorient trade policy to achieve closer integration with major markets
In recent years, Brazil has increasingly focused on establishing international trade partnerships with other developing economies and strengthening the Mercosur trade bloc. In fact, the establishment of Mercosur was one the few major advances in trade cooperation achieved since 1990—and it already shows signs of weakening due to growing protectionism among member states and the introduction of new members that take an interventionist approach to economic policy.99 Mercosur’s most recent trade agreements have been with Egypt (2010), Israel and India (2009), the Southern Africa Customs Union (2008), and Cuba (2006). Among these, India is the largest market for Brazil, importing just over $3.1 billion worth of Brazilian products in 2013, followed by Egypt at $2.2 billion. By contrast, Brazil exports approximately $46 billion worth of products to China every year and $25 billion worth to the United States.
While forward looking, this emphasis on forging “South-South” agreements with other developing economies is not likely to open up large markets for high-value trade in the near term. Brazil’s resource exports tend to reduce the cost-competitiveness of its more labor-intensive goods, particularly in low-income economies. Pursuing agreements with larger and more developed markets would allow Brazil to access larger global trade markets, integrate more fully into the production networks of multinationals, and increase the country’s access to leading-edge technology and processes. Brazil is attempting to finalize an agreement with the European Union, but the negotiations have been ongoing for more than a decade. Meanwhile, no talks are under way with the United States. China increased its share of imports from Brazil, but this trade relationship is largely focused on commodities (Exhibit 32).
Exhibit 32Brazil has not been able to increase exports to the United States or Europe, but has gained market in China thanks to commodities
SOURCE: World Economic Outlook, International Monetary Fund, October 2012; The Observatory of Economic Complexity; McKinsey Global Institute analysis
0
0.5
1.0
1.5
2.0
2.5
3.0
1020001994 05 2012
European Union
China
United States
Imports share%
99 Claudio Frischtak and Moricio Mesquita Moreira, “Política Industrial e comercial para um mundo em transformação: uma agenda para 2015,” in Propostas para o governo 2015/2018, Fabio Giambiagi and Claudio Porto, eds., Elsevier, 2013.

74 4. How Brazil can connect and grow
Brazil faces certain inherent disadvantages because of its distance from the large end-use markets of the United States, Europe, and China, and because of the terms-of-trade disadvantage from its resource exports. Yet these barriers are not insurmountable, as long as Brazil can compensate for them with distinctive capabilities or competitive advantages. Instead of erecting a complex set of trade barriers, Brazil can make a concerted effort to connect more closely to the most dynamic hubs of world production and trade.
Exhibit 33 contrasts Brazil with other countries that have successfully tied their domestic manufacturing industries into global value chains and international markets; this process involved removing trade barriers for intermediate goods (with the exception of South Korea) and for finished goods (with the exception of Indonesia). These countries, with the exception of Brazil and India, have trade agreements that allow goods to flow between participants in key value chains. In addition, Mexico has benefited immensely from accessing the US and Canadian markets through the NAFTA agreement (see Box 9, “Capitalizing on opportunities in global markets: Two Latin American success stories”).100 Policy makers will need to consider strategies for building Brazil’s ties with the most potentially valuable markets.
13
27
4
7
14
17
14
7
33
15
8
14
Indonesia
South Korea
India
Brazil
China
Mexico
13
6
8
3
6
8
12
7
6
6
11
10
Brazil imposes high tariffs on capital and intermediate goods
SOURCE: Baumann and Kume, in O futuro da indústria no Brasil: desindustrialização em debate, Civilização Brasileira, 2013; McKinsey Global Institute analysis
Exhibit 33
2000 2010
Average tariff%
Intermediate goods
Capital goods
100 Renato Baumann and Honório Kume, “Novos padrões de comércio e políticas tarifárias no Brasil,” in O futuro da indústria no Brasil: desindustrialização em debate, E. Bacha and M. B. Bolle, eds., Civilização Brasileira, 2013.

75Connecting Brazil to the world: A path to inclusive growthMcKinsey Global Institute
Box 9. capitalizing on opportunities in global markets: Two latin american success stories
Mexico and Chile, which have explicitly sought to integrate their economies with leading global markets, provide useful comparison cases for Brazil. These two examples illustrate how Brazil could deepen its global connections and build on them as a lever for increasing productivity.
Since the 1980s, Mexico has steadily opened up to foreign trade and investment; today it trades under favored tariff terms with 45 countries through 13 bilateral and multilateral agreements. The most important of these is the 1994 NAFTA treaty with the United States and Canada; more recently, in February 2014, Mexico entered into the Pacific Alliance with Chile, Colombia, and Peru. Trade (imports and exports combined) as a share of GDP has risen from 39 percent in 1990 to 65 percent in 2011. This outstrips China (58 percent), India (56 percent), and the United States (32 percent), while Brazil lags far behind at 27 percent.
Mexico’s exports to the United States have risen six-fold under NAFTA and today account for 78 percent of total exports. Three-quarters of this flow consists of manufactured goods, and autos and automotive parts have been responsible for one-third of the growth. The United States, in turn, is still the largest exporter to Mexico, followed by China, which accounts for 15 percent of Mexican imports.
Despite significant progress in opening up to international trade, Mexico continues to protect a number of domestic industries with import tariffs and non-tariff barriers outside of NAFTA, similar to the approach taken in Brazil. Tariffs for goods from China, a most favored nation partner, today average 15 percent—a huge decline from the 300 to 350 percent level before China entered the World Trade Organization in 2001—but remain higher in certain sectors such as textiles (where tariffs of about 30 percent are imposed). Mexico has also restricted imports through non-tariff barriers, such as rigorous customs procedures and anti-dumping laws. The World Economic Forum ranks Mexico 94th out of 144 countries on trade tariffs and 74th for burden of customs procedures.
The remaining import barriers reflect continuing concerns that imports from lower-cost regions could displace products made in Mexico, causing the loss of local jobs—and indeed, the manufacturing segments facing rising competition from Chinese imports have posted large declines in employment. But many Mexican companies have shown that they can be competitive not just in the domestic market but globally as well, and as the government continues to remove protectionist measures, businesses in other sectors will be challenged to compete more effectively.1
1 A tale of two Mexicos: Growth and prosperity in a two-speed economy, McKinsey Global Institute, March 2014.

76 4. How Brazil can connect and grow
Box 9. capitalizing on opportunities in global markets: Two latin american success stories (continued)
Mexico’s GDP and income growth have been anemic since the 1980s as a result of repeated economic shocks and the rise of China. (Even though NAFTA expanded Mexico’s access to the US market, China has supplanted Mexico as the top supplier of goods to the United States.) One of the major factors behind Mexico’s disappointing performance is its large share of small, traditional enterprises with low productivity. This structural issue underscores the importance of trade agreements in spurring the development of more modern and innovative export-oriented industries that have been instrumental in maintaining modest levels of growth in recent years.2
Chile, too, has developed successful trade partnerships with more advanced economies and has prospered as a result. Its economy is heavily reliant on international trade, and its goods (notably copper) are exported to markets in Asia, the European Union, the United States, and Latin America. Chile’s top trade partners are the United States, Japan, Germany, and Brazil itself.
Chile prides itself on openness. It has signed more free trade agreements than any other nation; in 2008, it had agreements with more than 90 percent of its trade partners, including Australia, Canada, China, the European Union, India, Japan, Mexico, South Korea, and the United States. Concluded after nearly a decade of negotiations, the 2002 Chile–US Free Trade Agreement was the first such pact between the United States and a South American nation.
Furthermore, the World Economic Forum ranks Chile’s trade infrastructure (including market access, customs administration, transportation and communications infrastructure, and business environment) above that of all other Latin American countries—and even that of the United States. In fact, Chile ranks second globally in term of markets access, behind only Singapore. It became the OECD’s 31st member, and the first in South America, in 2010. Its GDP per capita is more than 50 percent higher than Brazil’s, and a recent study ranked Chile number 1 in Latin America and 19th in the world in terms of e-readiness and attractiveness to investors from 2008 to 2012.3 In short, Chile has made use of its position in international trade networks to modernize its economy and adopt the standards of more advanced and competitive markets. The country has managed to reap the benefits of copper and other resource exports while simultaneously diversifying its economy; as a result, it has weathered recent downturns in prices and demand.
2 A tale of two Mexicos: Growth and prosperity in a two-speed economy, McKinsey Global Institute, March 2014.
3 Business Environment Rankings, Economist Intelligence Unit.

77Connecting Brazil to the world: A path to inclusive growthMcKinsey Global Institute
3. Redesign growth policies to compete in a more global and knowledge-intensive economy
Historically, Brazil’s support for industries has taken the form of subsidies, which total almost 6 percent of GDP today. But while subsidies and import tariffs were typically put in place to nurture fledgling industries, many have outlived their usefulness—and they have introduced distortions, corruption, and disincentives for companies to modernize. High local content requirements and “Buy Brazilian” procurement rules are often part of auctions for infrastructure and development projects.101 These policies can also put the government, rather than the market, in the position of choosing “winners.”
Brazil will need to rationalize this system and shift the focus from favoring incumbents to promoting competitiveness for the 21st century.102 A more effective approach to industrial policy would focus on building a foundation for growth. Government support can play a role in fostering innovative and competitive local industries, but subsidies and tariffs are not the only tools in the tool kit. Policy makers can make sure the required infrastructure is in place; ensure that small and medium-sized enterprises (SMEs) have access to credit; provide funding and incentives for research; build a pipeline for talent and skills development; and streamline cumbersome regulations. This effort can begin by working with the private sector to identify and remove barriers to growth.103
Brazil will have to make careful strategic choices about where to focus its efforts and resources. It will be important to assess its current competitive strengths and determine which industries are best positioned to move up the value chain and create positive spillover effects on productivity in related industries. This will call for an intensive policy debate and a candid assessment of Brazil’s existing comparative advantages. There may be opportunities to build on its resource wealth and existing industries by expanding into related value chains and focusing on products that add value to Brazil’s commodities. And it will be important to take a clear-eyed look at the economic potential of these choices, including job creation, direct and indirect economic growth impact, and exports. But a general focus on higher-value-added products and services can help Brazil’s economy become more modern, diversified, and resilient.
Faced with challenges such as rising labor and input costs, many Brazilian companies have placed less emphasis on investing in R&D and innovation.104 But the global economy is growing more knowledge intensive, and Brazil’s public and private sectors can work together to build an ecosystem that encourages the innovation needed to thrive in this new environment. Two key elements of
101 To give just two examples, developers of the Libra offshore oil field were required to use Brazilian-made platforms, pipelines, and vessels. The upcoming auction to build a 4G network in the 700 MHz band is set to require bidders to source 65 to 70 percent of the goods for the project from Brazilian manufacturers.
102 Philippe Aghion, Julian Boulanger, and Elie Cohen, Rethinking industrial policy, Bruegel policy brief, issue number 2011/04, June 2011.
103 How to compete and grow: A sector guide to policy, McKinsey Global Institute, March 2010; and Dani Rodrik, “Industrial development: Some stylized facts and policy directions,” in Industrial development for the 21st century: Sustainable development perspectives, United Nations Department of Economic and Social Affairs, 2007.
104 Sandra Polónia Rios and José Tavares de Araujo Jr., Desempenho industrial e vantagens comparativas reveladas, Breves CINDES, number 69, July 2013.

78 4. How Brazil can connect and grow
this process will involve becoming more connected to global flows of data and knowledge along with boosting Brazil’s R&D investment, which is currently below the world average for upper-middle-income countries (Exhibit 34). It is also critical to ensure that the framework for intellectual property protection increases the efficiency of patent applications and litigation resolutions, while making effective trade-offs to allow for follow-on innovations.
1 Upper-middle-income group aggregate. Upper-middle-income economies are those in which 2012 GNI per capita was between $4,086 and $12,615.
Brazil outperforms Mexico in R&D investment, but remains below the world average
SOURCE: World Bank Indicators; McKinsey Global Institute analysis
1.29
2.20
0.42
0.48
1.16
1.16
1.76
2.83
Upper middle income1
Mexico
Brazil
China
World average
United States
Chile
Russia
Exhibit 34
R&D expenditure, 2010% of GDP
Multiple levers can spur mature industries to innovate, as the cases of Brazil’s food processing, paper and pulp, and cosmetics industries show. In food processing, updated standards and regulations (including the higher quality standards demanded in export markets) forced companies to become more productive and sophisticated. The paper and pulp industry was motivated by the imperative to preserve natural resources and forests, which forced companies to invest in research and move toward more sustainable practices. The main stimulus for innovation in the cosmetics industry came from meeting the expectations of Brazil’s highly demanding consumer market, which has propelled companies such as Natura to international success.105
Policy makers can encourage the growth of entrepreneurship by increasing access to capital for startups and establishing business incubators and training programs. In a recent survey, 15 percent of Brazilian entrepreneurs cited access to capital as the main hurdle to growth. Creating startup funds and mechanisms to connect them with investors could propel growth and job creation.
Specialized industry clusters have proved to be highly effective engines of innovation, export growth, and skills development. Brazil has several nascent industry clusters with potential to grow, including burgeoning biotech clusters in São Paulo and in Belo Horizonte that build on Brazil’s strengths in agribusiness and biofuels. These locations have natural synergies with the biotech industry. São Paulo is home to the Butantan Institute, which supplies vaccines to Brazil’s
105 Sandra Polónia Rios and José Tavares de Araujo Jr., Desempenho industrial e vantagens comparativas reveladas, Breves CINDES, number 69, July 2013.
79Connecting Brazil to the world: A path to inclusive growthMcKinsey Global Institute
national immunization program. Home to the University of Minas Gerais, which is known for science and technology, Belo Horizonte is also the location of the Biominas Foundation, which promotes the industry and serves as an incubator. These clusters have given rise to hundreds of small companies, some of which are focused on developing cutting-edge medicines and some of which are developing new agricultural technologies.106 The government has taken steps to put a regulatory and patent framework into place and has invested in research programs and startup funds. While biotech is still a fledgling industry in Brazil, some of these companies are already exporters of both goods and contract services.
Another promising cluster is Porto Digital (Digital Harbor), a technology park that is home to dozens of small software firms. It is located in Recife, where the Universidade Federal do Pernambuco has a highly regarded information technology program. Local firms have begun to export IT solutions globally, and Recife has also attracted the operations of IBM, Nokia, Motorola, Microsoft, and other multinationals (see Box 10, “Acting locally, thinking globally”). This concentration has attracted a notable pool of programming talent to the area, and Porto Digital’s business incubator programs have given birth to multiple startups.107
Research partnerships are an ingredient that can help new industries thrive. In fact, the success of Embraer was due to the proximity and collaboration of industry and academia. But one study found that academia and the private sector remain segregated in Brazil. Encouraging entrepreneurial scientists and engineers to straddle both worlds could lead to greater collaboration and spillover effects.108
106 The biotechnology market in Brazil, US Commercial Service, February 2012.
107 Porto Digital website; see also Anna Heim, “Why Brazil’s most innovative institution comes from Recife,” The Next Web blog, May 22, 2011.
108 Alberto Rodríguez, Carl Dahlman, and Jamil Salmi, Knowledge and innovation for competitiveness in Brazil, The World Bank, 2008.
Box 10. acting locally, thinking globally
Some states and cities have begun to take the lead in forging innovative global partnerships on their own. This strategy could be tailored to each region’s needs and could be accomplished quickly.
In November 2013, for example, the state of Pernambuco signed an agreement with the German state of Brandenburg to develop the creative economy and foster innovation. This five-year initiative seeks to encourage collaboration between small and medium-sized companies in both states; develop local economic clusters; and facilitate the exchange of visiting students. It also intends to focus on building tourism and exchanging best practices in preserving and promoting each city’s cultural heritage.
São Paulo signed a similar cooperation agreement with France focused on sustainable development, housing, urban mobility, and sanitation. It encompasses more than 50 joint initiatives, such as the construction of a railway to connect the state’s capital to Guarulhos airport, the creation of a working group for cleanup of the Tietê and Pinheiros rivers, and the application of new technologies to mitigate the risk of natural disasters and to promote sustainable, affordable housing.
These types of direct relationships can increase flows of people, information, and innovation—and they show how local leaders can play a role in deepening Brazil’s connections with the world.

80 4. How Brazil can connect and grow
4. Build 21st-century infrastructure that integrates Brazil’s economy and connects it to the world
Perhaps the most important opportunity to improve Brazil’s global competitiveness and increase trade connections lies with addressing its transportation network. This is an issue of growing urgency, as the World Economic Forum now ranks Brazil 114th in the world (below Cambodia, Ethiopia, and Uganda) for the quality of overall infrastructure.109
To get to the next level of economic development, Brazil first needs to build strong foundational systems. The PAC (Programa de Aceleração do Crescimento) growth acceleration program is a clear signal that the government has made infrastructure a national priority, and now the focus needs to turn to achieving better execution and faster results. Even flagship projects with high public visibility suffer from poor planning. The World Cup and the Olympics were initially viewed as opportunities to undertake revolutionary projects, but Brazil eventually abandoned its biggest ambitions and has been racing simply to finish the stadiums on time.
Today major infrastructure projects in Brazil are not sufficiently connected to the existing logistics network or face severe bottlenecks. Some ports, for example, lack dedicated freight rail connections. Part of the freight rail line servicing the Port of Santos, for example, passes through the city of São Paulo, using the same track as urban passenger trains. This generates highly complex interchanges that slow cargo transport and delay commuters. Some wind power plants in the Northeast do not have enough transmission lines to deliver all the power they generate to the grid.
To address these gaps and avoid similar issues in the future, it is important to create a long-term, integrated national infrastructure plan and insulate it from shifting political agendas. One option to consider is an independent oversight body that could prioritize the most important projects while considering how overall systems should work together. The most effective planning processes take a systematic portfolio approach—one that considers how each project fits into broader policy priorities and what the network effects will be. Taking a broader perspective can have major impact. Chile, for example, has created an Infrastructure Master Plan. Its National Public Investment System evaluates proposed projects using standard forms, procedures, and metrics, including cost-benefit analyses that consider factors such as opportunity cost. Final approval rests with Chile’s finance ministry, which allocates funding based on a combination of these cost-benefit analyses and national goals.110
The infrastructure planning process should consider strategies for maximizing existing assets, which may offer a better return on investment than new construction. An example is President Costa e Silva Bridge (the Rio-Niterói Bridge across Guanabara Bay). In 2009, a relatively simple project added an additional lane by taking advantage of unused portions of the bridge, thus increasing its capacity by 15 percent and alleviating traffic without building an entirely new
109 The global competitiveness report 2013–2014, World Economic Forum, 2013.
110 Infrastructure productivity: How to save $1 trillion a year, McKinsey Global Institute, January 2013.

81Connecting Brazil to the world: A path to inclusive growthMcKinsey Global Institute
bridge. A focus on maintenance and refurbishment can extend the lifespan of existing assets.
Delays and cost overruns are ubiquitous in infrastructure projects, but a new approach that incorporates greater accountability and tighter management of the delivery and execution stages can protect the public interest and produce large efficiencies. Based on nearly 40 capital productivity studies from 1994 to 2012, previous MGI research has found that it is possible to reduce typical delivery costs in infrastructure projects by almost 30 percent.111 This can start even before ground is broken on a project by speeding the approval process. Considering multiple design simulations and materials choices in the early project planning and design stages can minimize costly change orders that delay construction; new big data tools can help with this process. Design-to-value and design-to-cost approaches in the engineering process can lower costs, as can a more strategic approach to sourcing and procurement. Agreements with contractors can be tightened, and accountability for delays and quality issues can be enforced.
Projects in Brazil are constantly interrupted, for reasons ranging from sustainability and environmental issues to problems in controlling spending and budget. Environmental licensing, in particular, is a prolonged, multi-stage process that creates opportunities for disputes to be reopened multiple times, generating uncertainty and delays.112 While the causes for delay may be valid concerns, the mechanisms for resolving disputes are extremely complex—and projects often have to clear multiple reviews at the federal and state levels, regulatory bodies, audits, lawsuits, and contract renegotiations. Establishing clear and appropriate procedures and setting strict time limits for resolution can prevent projects from becoming paralyzed by challenges.
Finally, Brazil will need to explore new funding models in order to meet its enormous infrastructure needs in the years ahead. Approximately 75 percent of total investments made in the past four years relied on public funding, but this ratio will be difficult to sustain (Exhibit 35). In fact, the government is signaling that it will not be able to undertake all the necessary investments in the coming years. While investment by BNDES grew by 20 percent annually from 2005 to 2011, revenue growth from PIS/PASEP, one of the taxes that serves as a major source of its funding, grew by only 15 percent. Brazil will have to create mechanisms to attract a greater share of private investment if it intends to close the infrastructure gap.
One strategy for attracting private investors would be to provide guarantees regarding the stability of contracts, taxes, and regulation and regarding the government’s commitment to complete any related works on time. In 2003, for example, the World Bank estimated that some water infrastructure projects in Brazil incurred a “risk premium” of 5 percent due to uncertainties about future decisions on water concessions. This factor alone can result in an increase of up to 20 percent on the price of the water to the end user.113
111 Infrastructure productivity: How to save $1 trillion a year, McKinsey Global Institute, January 2013.
112 OECD economic surveys: Brazil 2011, OECD, October 2011.
113 J. Luis Guasch, Jean-Jacques Laffont, and Stephane Straub, Renegotiation of concession contracts in Latin America, World Bank policy research working paper number 3011, April 2003.

82 4. How Brazil can connect and grow
To attract private investment, Brazil needs to make private concessions more attractive by offering reassurance and value for investors, analyzing the possible returns and adjusting them to the level of risk in each project. This will involve analyzing projects from an investor’s point of view—an exercise that can actually impose greater cost discipline and regulatory certainty. Chile, for example, allows foreign companies investing above a certain level to opt in to a program that provides long-term guarantees of tax and regulatory stability in exchange for a higher tax rate.114
Exhibit 35The public sector is the major funding source for infrastructure, even when private investors are involved
SOURCE: Company websites; Banco Nacional de Desenvolvimento Econômico e Social (BNDES); McKinsey Global Institute analysis
1 Public funds include BNDES financing. 2 Estimated investment for initial phase.NOTE: Numbers may not sum due to rounding.
Example concessionsTotal investment%; R$ billion
80
64
80
62
61
75
20
36
20
38
39
25
Brasília airport
0.4
2.4Viracopos airport2
S. G. Amaranteairport
1.3
São PauloMetro expansion
FortalezaMetro expansion
3.6Salvador/L. FreitasMetro expansion
9.6
2.5
100% =
Private sources
Public sources1
5. Improve competitiveness by lowering the “Brazil cost”
High taxes and tariffs, heavy compliance costs, regulatory red tape, and a slow-moving bureaucracy are so deeply entrenched in the business landscape that they have been dubbed the “Brazil cost.” Brazil’s business environment needs serious reform to match the ease of doing business offered by other countries.
Addressing these regulatory and tax barriers would represent a major step toward becoming more globally competitive, expanding trade, and attracting investment. Transparency is a key element; easy access to documentation requirements and tariff schedules, for example, can reduce transaction costs for importing and exporting. Where trading procedures and payment requirements are clear, customs brokers and trade consultants are less necessary.
The World Bank finds that 78 percent of all countries publish their documentation requirements for trade online and that 88 percent post tariff schedules. But even where this information is accessible in Brazil, it is not always up to date or sufficiently detailed. Lack of clarity in these two areas creates considerable
114 Infrastructure investment policy blueprint, World Economic Forum, 2014.

83Connecting Brazil to the world: A path to inclusive growthMcKinsey Global Institute
frustration and delays for importers and exporters. These areas could be improved relatively quickly and inexpensively: initiatives such as providing training for exporting firms, clarifying and publicizing the rules, and holding regular meetings with exporters on the clearance process can make a difference.
Brazil could also benefit from revisiting its tax structure—not only to reconsider the level of taxation through the lens of global competition but also to simplify what has become a byzantine, multilayered tax code. State and city taxes on goods and services vary widely across Brazil, which adds to the difficulty of scaling up across the country (especially for foreign companies that are unfamiliar with these rules). Even taxes that are refundable are difficult for companies to claim. Harmonizing these taxes and streamlining procedures could help to reduce high compliance costs.
As discussed in previous chapters, Brazil has a long history of imposing steep import tariffs on certain products (such as auto parts and vehicles) to shield domestic industries from external competition. These tariffs are not applied consistently across all products and sectors, and a careful review is needed to ensure that Brazil opens the most relevant and competitive industry sectors. Addressing these barriers in a rational and systematic way could allow Brazil to assume a greater role in global value chains and find new growth markets for its products.
6. Make the public sector more productive
When Brazilians took to the streets in the summer of 2013, they were expressing widespread frustration with the poor quality of public services they receive in return for their taxes. Citizens are demanding better performance from their schools, transit systems, and the public health system. To meet these rising expectations, Brazil will need a concerted push for greater public-sector productivity.
Government agencies, like most organizations, can be resistant to change, but it is possible to transform their performance. One critical step is implementing more robust and flexible systems for managing government workers at all levels. This may involve rethinking the public-sector overall incentive structure to establish rewards for high performers and consequences for a failure to deliver. This can shift the focus from following procedures to achieving clearly defined results.115
New technology tools can play a major role in streamlining day-to-day functioning and processes. They can also bring transparency to areas such as government procurement or the degree of “customer satisfaction” that a unit delivers in its interactions with the public. Web-based services, e-government initiatives, and greater automation can reduce wait times and provide citizens with better information and service at lower cost.116 They can also allow the public a greater voice in how services are delivered. Few of Brazil’s government departments
115 Toward a culture of consequences: Performance-based accountability systems for public services, Rand Corporation, August 2010.
116 Better for less: Improving public-sector performance on a tight budget, McKinsey & Company, July 2011. See also Open data: Unlocking innovation and performance with liquid information, McKinsey Global Institute, October 2013.
84 4. How Brazil can connect and grow
have gone fully digital, so there is ample room to make large gains in efficiency by integrating technology solutions.
7. Focus on education and training to develop human capital
Brazil needs a skilled and productive workforce that can match the capabilities of peer countries, continuously deliver products that meet new pockets of demand in a fast-changing global marketplace, and incorporate the latest generations of technology.117
Brazil’s National Education Plan for 2011–2020 laid out multiple goals for expanding primary and secondary education as well as access to preschool. The country has already made great progress in achieving 95 percent enrollment in primary education. But there is still a long way to go in terms of reducing dropout rates and improving learning outcomes so that workers are prepared with the skills they need to be productive. Only 13 percent of Brazilians have college degrees (vs. the OECD average of 39 percent). Boosting this share and emphasizing the quality of research and instruction in STEM fields (science, technology, engineering, and mathematics) can spark the growth of more sophisticated industries.
It is indeed possible for a developing nation to build an excellent education system. Decades ago, South Korea was one of the poorest nations in the world, but it built a world-class education system in stages. After an initial focus on building schools and raising enrollment and graduation rates, the emphasis shifted to improving the quality of education through teacher training and, more recently, to investing in technology and allowing schools greater operating autonomy. By making this effort a national priority, South Korea now ranks among the top five countries globally on various parameters of educational outcomes—and the country has become a highly competitive exporter of cutting-edge products.118 For Brazil to reach the next stage of educational development, it will need to focus on improving and standardizing teacher training.
Brazil’s private sector can play a role by expanding training programs and apprenticeships; it can also partner with local education providers to design curricula targeted to the workforce skills that are in greatest demand. A greater emphasis on developing human capital would have the double benefit of making Brazil’s industries more competitive while also creating better career pathways and widening economic opportunity for all.119
117 How to compete and grow: A sector guide to policy, McKinsey Global Institute, March 2010.
118 Beyond Korean style: Shaping a new growth formula, McKinsey Global Institute, April 2013.
119 See Education to employment: Designing a system that works, McKinsey Center for Government, December 2012; and Education for employment: Realizing Arab youth potential, International Finance Corporation and the Islamic Development Bank, April 2011.

85Connecting Brazil to the world: A path to inclusive growthMcKinsey Global Institute
* * *
As new markets open, this is the moment for leading Brazilian players to expand globally and for Brazil to absorb a greater flow of the world’s ideas and innovations. Seizing these opportunities will require addressing some of the country’s fundamentals and reconsidering the policies of the past. But it will also involve looking to the markets of the future and creating a culture of entrepreneurship and innovation that can provide the economy with a much-needed jolt of dynamism. Deeper global connections can jumpstart Brazil’s stalled productivity growth, restoring the economy’s momentum and delivering more broad-based prosperity.


Aghion, Philippe, Julian Boulanger, and Elie Cohen, Rethinking industrial policy, Bruegel policy brief issue number 2011/04, June 2011.
Almeida, Mansueto, “O papel do BNDES no financiamento do desenvolvimento: novos e velhos desafios,” in A agenda de competitividade do Brasil, Regis Bonelli, ed., FGV Editora, 2011.
Almeida, Mansueto, Setor Público e Consumo: o que mostram os números? Blog do Mansueto Almeida, July 8, 2013.
Alston, Lee, Bernardo Mueller, Marcus André Melo, and Carlos Pereira, The political economy of productivity in Brazil, Inter-American Development Bank publication number 5338, March 2010.
Anand, Rahul, Saurabh Mishra, and Nikola Spatafora, Structural transformation and the sophistication of production, IMF working paper number 12/59, February 2012.
Anderson, Stuart, Immigrant founders and key personnel in America’s top 50 venture-funded companies, National Foundation of American Policy policy brief, December 2011.
Arnold, Jens, Raising investment in Brazil, OECD Economics Department working paper number 900, October 2011.
Arora, Ashish, and Alfonso Gambardella, From underdogs to tigers: The rise and growth of the software industry in Brazil, China, India, Ireland, and Israel, Oxford University Press, 2006.
Bacha, Edmar Lisboa, and Regis Bonelli, Accounting for Brazil’s growth experience—1940–2002, IPEA working paper number 1018, May 2004.
Bacha, Edmar Lisboa, and Regis Bonelli, Accounting for the rise and fall of post–World War II Brazil’s growth, 2012.
Baldwin, Richard E., On the growth effects of import competition, NBER working paper number 4045, April 1992.
Baumann, Renato, and Honório Kume, “Novos padrões de comércio e políticas tarifárias no Brasil,” in O futuro da indústria no Brasil: desindustrialização em debate, E. Bacha and M. B. Bolle, eds., Civilização Brasileira, 2013.
Blanke, Jennifer, and Thea Chiesa, eds., Travel and tourism competitiveness report 2013, Country Highlights, World Economic Forum.
BNDES (Brazilian Development Bank), BNDES annual report 2012.
Bibliography

88 Bibliography
Bonelli, Regis, The productivity performance of Brazil, report for the United Nations Industrial Development Organization (UNIDO), November 2005.
Brazilian Association of Credit Card Companies and Services (ABECS), Mercado e meios eletrônicos de pagamento. Ano VI–população e comércio, April 2013.
Canuto, Otaviano, Matheus Cavallari, and Jose Guilherme Reis, Brazilian exports: Climbing down a competitiveness cliff, World Bank policy research working paper number 6302, January 2013.
Capp, Joe, Heinz-Peter Elstrodt, and William B. Jones Jr., “Reining in Brazil’s informal economy,” McKinsey Quarterly, number 1, 2005.
Caselli, Francesco, and Guy Michaels, Do oil windfalls improve living standards? Evidence from Brazil, NBER working paper number 15550, December 2009.
Clemens, Michael A., What do we know about skilled migration and development? Migration Policy Institute policy brief number 3, September 2013.
De Rezende Lopes, Mauro, Ignez G. V. Lopes, and Daniela de Paula Rocha, “As políticas de competitividade na agricultura brasileira,” in A agenda de competitividade do Brasil, Regis Bonelli, ed., Instituto Brasileiro de Economia, da Fundação Getúlio Vargas, 2011.
De Rezende Lopes, Mauro Ignez G. V. Lopes, and Daniela de Paula Rocha, “Desempenho da agropecuária: produtividade, competitividade e crescimento,” in A agenda de competitividade do Brasil, Regis Bonelli, ed., Instituto Brasileiro de Economia, da Fundação Getúlio Vargas, 2011.
Dee, Philippa, Joseph Francois, Miriam Manchin, Hanna Norberg, Hildegunn Kyvik Nordås, and Frank van Tongeren, The impact of trade liberalisation on jobs and growth, OECD trade policy working paper number 107, January 2011.
Education at a glance 2013: Brazil, OECD, 2013.
Entraves às exportações brasileiras, National Confederation of Industry Brazil (CNI), 2014.
Fausto, Boris, A concise history of Brazil, Cambridge University Press, 1999
Ferreira, Francisco H. G., Julian Messina, Jamele Rigolini, Luis-Felipe López-Calva, Maria Ana Lugo, and Renos Vakis, Economic mobility and the rise of the Latin American middle class, World Bank, November 2012.
Firpo, Sergio, and Renan Pieri, Structural change, productivity growth, and trade policy in Brazil, São Paulo School of Economics working paper number 8/2013, August 2013.
Frischtak, Claudio, and Moricio Mesquita Moreira, “Política Industrial e comercial para um mundo em transformação: uma agenda para 2015,” in Propostas para o governo 2015/2018, Fabio Giambiagi and Claudio Porto, eds., Elsevier, 2013.
Gomes, Victor, Samuel Pessoa, and Fernando A Veloso, “Evolução da produtividade total dos fatores na economia Brasileira: Uma análise comparative,” in Pesquisa e Planejamento Econômico, volume 33, number 2, 2003.

89Connecting Brazil to the world: A path to inclusive growthMcKinsey Global Institute
Goodall, Julia, Amy Bensted, and Graeme Terry, “Sovereign wealth funds investing in infrastructure,” Preqin, November 2013.
Group of Thirty, Long-term finance and economic growth, February 2013.
Guasch, J. Luis, Jean-Jacques Laffont, and Stephane Straub, Renegotiation of concession contracts in Latin America, World Bank policy research working paper number 3011, April 2003.
Haberer, Pablo, and Nicola Calicchio, “Leveraging Brazil’s business environment for increased competitiveness,” in The Brazil competitiveness report 2009, Irene Mia, Emilio Lozoya Austin, Carlos Arruda, and Marina Silva Araújo, eds., World Economic Forum, 2009.
Hausmann, Ricardo, César Hidalgo, Sebastian Bustos, Michele Coscia, Alexander Simoes, and Muhammed A. Yildirim, The atlas of economic complexity: Mapping paths to complexity, MIT Press, 2011.
Hausmann, Ricardo, Jason Hwang, and Dani Rodrik, “What you export matters,” Journal of Economic Growth, volume 12, issue 1, March 2007.
Heim, Anna, “Why Brazil’s most innovative institution comes from Recife,” The Next Web blog, May 22, 2011.
Hunt, Jennifer, and Marjolaine Gauthier-Loiselle, How much does immigration boost innovation? NBER working paper number 14312, September 2008.
International Energy Agency, World Energy Outlook 2013.
International Finance Corporation and the Islamic Development Bank, Education for employment: Realizing Arab youth potential, April 2011.
International Monetary Fund, Brazil: Selected issues paper, International Monetary Fund, IMF Country Report number 12/192, July 2012.
International Organization for Migration, World migration report 2013, 2013.
Katz, Bruce, and Mark Muro, The new “cluster moment”: How regional innovation clusters can foster the next economy, Metropolitan Policy Program at Brookings, September 2010.
Kerr, William R., “Ethnic scientific communities and international technology diffusion,” The Review of Economics and Statistics, volume 90, number 3, August 2008.
Kerr, William R., US high-skilled immigration, innovation, and entrepreneurship: Empirical approaches and evidence, NBER working paper number 19377, August 2013.
Kupfer, David, Marta Castilho, Esther Dweck, and Marcelo Nicoll, Different partners, different patterns: Trade and labour market dynamics in Brazil’s post-liberalisation period, OECD trade policy paper number 149, April 2013.
90 Bibliography
Lazzarini, Sérgio G., Aldo Musacchio, Rodrigo Bandeira-de-Mello, and Rosilene Marcon, What do development banks do? Evidence from Brazil, 2002–2009, Harvard Business School working paper 12–047, December 2011.
Liebig, Thomas, The labour market integration of immigrants in Australia, OECD social, employment, and immigration working paper number 49, February 2007.
McKinsey & Company, Better for less: Improving public-sector performance on a tight budget, July 2011.
McKinsey & Company, Meeting the mind: The neurotechnology revolution, January 2011.
McKinsey & Company, Stimulating competitive cities: The key to Brazilian growth, March 2012.
McKinsey & Company, Urban world: Cities and the rise of the consuming class, June 2012.
McKinsey & Company, Winning the $30 trillion decathlon: Going for gold in emerging markets, August 2012.
McKinsey Center for Government, Education to employment: Designing a system that works, December 2012.
McKinsey Global Institute, Beyond the boom: Australia’s productivity imperative, August 2012.
McKinsey Global Institute, Beyond Korean style: Shaping a new growth formula, April 2013.
McKinsey Global Institute, From poverty to empowerment: India’s imperative for jobs, growth, and effective basic services, February 2014.
McKinsey Global Institute, Global flows in a digital age: How trade, finance, people, and data connect the world economy, April 2014.
McKinsey Global Institute, How Brazil can grow, December 2006.
McKinsey Global Institute, How to compete and grow: A sector guide to policy, March 2010.
McKinsey Global Institute, Infrastructure productivity: How to save $1 trillion a year, January 2013.
McKinsey Global Institute, New horizons: Multinational company investment in developing economies, October 2003.
McKinsey Global Institute, Productivity—the key to an accelerated development path for Brazil, March 1998.
McKinsey Global Institute, Resource revolution: Tracking global commodity markets, September 2013.
McKinsey Global Institute, Reverse the curse: Maximizing the potential of resource-driven economies, December 2013.

91Connecting Brazil to the world: A path to inclusive growthMcKinsey Global Institute
McKinsey Global Institute, A tale of two Mexicos: Growth and prosperity in a two-speed economy, March 2014.
McKinsey Global Institute, Urban world: The shifting global business landscape, October 2013.
Ministério de Minas e Energia, Ata da 140ª reunião, February 13, 2014.
Morgan Stanley Research Global, Brazil infrastructure: Paving the way, Morgan Stanley Blue Paper, May 2010.
Neil Baily, Martin, and Robert M. Solow, “International productivity comparisons built from the firm level,” Journal of Economic Perspectives, volume 15, number 3, Summer 2001.
Neri, Marcelo Côrtes, Fabio Monteiro Vaz, and Pedro Herculano Guimarães Ferreira de Souza, “Efeitos macroeconômicos do programa Bolsa Família: Uma análise comparative das transferências sociais,” in Programa Bolsa Família: Uma década de inclusão e cidadania, Instituto de Pesquisa Econômica Aplicada (IPEA), 2013.
OECD economic surveys: Brazil 2011, OECD, October 2011.
OECD economic surveys: Brazil 2013, OECD, October 2013.
Pandya, Sonal, and David Leblang, Deal or no deal: The growth of international venture capital investment, University of Virginia, November 2011.
Rand Corporation, Toward a culture of consequences: Performance-based accountability systems for public services, August 2010.
Revista Época Negócios, “Qual o efeito do BNDES?” June 2013.
Rios, Sandra Polónia, and José Tavares de Araujo Jr., “Desempenho industrial e vantagens comparativas reveladas,” Breves CINDES, number 69, July 2013.
Rodriguez, Alberto, Carl Dahlman, and Jamil Salmi, Knowledge and innovation for competitiveness in Brazil, World Bank, 2008.
Rodrigues, Eduardo, “Três dos cinco conselheiros da CCEE apresentam renúncia,” Economia & Negócios, April 23, 2014.
Rodrik, Dani, “Industrial development: Some stylized facts and policy directions,” in Industrial development for the 21st century: Sustainable development perspectives, United Nations Department of Economic and Social Affairs, 2007.
Sachs, Jeffrey D., and Andrew M. Warner, Natural resource abundance and economic growth, Harvard University, November 1997.
Saxenian, AnnaLee, “Transnational communities and the evolution of global production networks: The cases of Taiwan, China, and India,” Industry and Innovation, volume 9, issue 3, 2002.
Schneider, Friedrich, Andreas Buehn, and Claudio E. Montenegro, Shadow economies all over the world: New estimates for 162 countries from 1999 to 2007, World Bank policy research paper number 5356, July 2010.

92 Bibliography
Senor, Dan, and Saul Singer, Start-up Nation: The story of Israel’s economic miracle, Twelve, 2009.
Stone, Susan, and Ben Shepherd, Dynamic gains from trade: The role of intermediate inputs and equipment imports, OECD trade policy working paper number 110, April 2011.
Thorstensen, Vera, and Lucas Ferraz, O Brasil e os novos acordos preferenciais de comércio: O peso das barreiras tarifárias e não rarifárias, IEDI, number 617, March 2014.
2012 world airport traffic report, Airports Council International, 2013.
UNESCO science report 2010.
US Commercial Service, The biotechnology market in Brazil, February 2012.
Veloso, Fernando et al., eds., Desenvolvimento econômico, uma perspectiva Brasileira, Elsevier, 2013.
Wadhwa, Vivek, AnnaLee Saxenian, and F. Daniel Siciliano, America’s new immigrant entrepreneurs: Then and now, October 2012, Ewing Marion Kauffman Foundation, October 2012.
World Bank, Annual report 2012.
World Bank, Doing business 2013: Smarter regulations for small and medium-size enterprises, 2013.
World Bank, Doing business 2014: Understanding regulations for small and medium-size enterprises, 2013.
World Bank, World development indicators, 2011.
World Economic Forum, Infrastructure investment policy blueprint, February 2014.
World Economic Forum, The global competitiveness report 2013–2014, 2013.

www.mckinsey.com/mgi
E-book versions of selected MGI reports are available at MGI’s website, Amazon’s Kindle bookstore, and Apple’s iBookstore.
Download and listen to MGI podcasts on iTunes or at www.mckinsey.com/mgi/publications/multimedia/
Global flows in a digital age: How trade, finance, people, and data connect the world economy (April 2014)
The movement of goods, services, finance, and people has reached previously unimagined levels. Global flows are creating new degrees of connectedness among economies—and playing an ever-larger role in determining how nations grow and compete.
A tale of two Mexicos: Growth and prosperity in a two-speed economy (March 2014)
A modern, fast-growing, highly productive economy and a traditional, low-productivity one are pulling in opposite directions, reducing GDP growth, and progress in living standards.
Reverse the curse: Maximizing the potential of resource-driven economies (December 2013)
In 20 years, almost half of the world’s countries could depend on their resource endowments for growth. These economies have a huge opportunity to transform their prospects, and a new model could help governments capture the coming resource windfall instead of squandering it.
From poverty to empowerment: India’s imperative for jobs, growth, and effective basic services (February 2014)
India has made encouraging progress in reducing its official poverty rate. But the nation has an opportunity to help more than half a billion people attain better living standards.
McKinsey Insights app
Explore insights from across McKinsey, MGI, and the McKinsey Quarterly—all delivered seamlessly to your mobile devices. Broaden your knowledge and widen your perspective with our latest thinking on the challenging issues facing senior leaders around the world, spanning all industries, functions, and geographies. Available for both Apple and Android.
Related MGI and McKinsey research

@McKinsey_MGI
McKinseyGlobalInstitute
McKinsey Global Institute May 2014Copyright © McKinsey & Companywww.mckinsey.com/mgi