
Conder, J. A., and D. A. Wiens, Shallow seismicity and tectonics of the central and northern Lau...
9
Shallow seismicity and tectonics of the central and northern Lau Basin James A. Conder a, ⁎, Douglas A. Wiens b,1 a Department of Geology, Southern Illinois University, 1259 Lincoln Dr., MC 4324, Carbondale, IL, 62901, United States b Department of Earth and Planetary Sciences, One Brookings Dr., Campus Box 1169, Washington University, St. Louis, MO, 63230, United States abstract article info Article history: Received 1 October 2010 Received in revised form 15 February 2011 Accepted 18 February 2011 Editor: P. Shearer Keywords: Lau basin crustal seismicity backarc tectonics T-waves The Lau basin is an active backarc comprising several spreading centers and microplates rapidly evolving in time. As such, crustal earthquakes within the Lau Basin derive from intrabasin tectonic, volcanic, and hydrothermal sources. Because of high mantle attenuation, small earthquakes from the basin are seldom recorded on land seismographs and it has been difficult to study the pattern of crustal seismicity. However, the 1994 LABATTS ocean bottom seismograph experiment in the Lau basin recorded more than 100,000 local T- and body phases allowing for a detailed examination of basin seismotectonics. Nearly 1000 events are located within the basin proper, with another 2000 associated with the forearc and the aseismic front. We identify two previously undocumented tectonic features, a triple junction in the northwestern basin and a nanoplate in the central Lau basin. The single most seismically active feature within the Lau basin is the Lau extensional transform zone (LETZ) just north of the Central Lau Spreading Center. Significant seismicity also occurs near the northern extension of the Eastern Lau Spreading Center and along a southeast extension of the LETZ delineating the boundary of a previously unknown nanoplate. Swarm activity is common in the backarc basin and dominates regions associated with actively reorganizing tectonics. We see no evidence of deformation along the southern boundary of the Niuafo'ou microplate, where 4.5 cm/yr of strain is predicted. It is possible that the plate boundary extends eastward from the Fonualei rift (FR) tip towards the trench creating a Niuatoputapu–Tonga plate division rather than westward implied by the currently accepted Niuafo'ou–Tonga plate system, but more data are necessary from the FR to test that hypothesis. Instead, we suggest that the Niuafo'ou–Tonga pole is ~ 1.5° further north than previously proposed, reducing the predicted strain in this region to b 2 cm/yr. © 2011 Elsevier B.V. All rights reserved. 1. Introduction The Lau backarc basin between Fiji and Tonga has been opening for the past 5–6 Ma in a wedge shaped pattern (Taylor et al., 1996). As a type example of an active backarc basin, considerable attention has been given to understanding how deformation is accommodated and distributed throughout the Lau basin (e.g., Hamburger and Isacks 1988; Isacks et al., 1968; Pelletier and Louat 1989). With a basin scale inversion of seafloor magnetization, Taylor et al. (1996) demonstrated ‘typical’ seafloor spreading in the backarc and showed that deforma- tion is largely accommodated through a set of evolving microplates bounded by spreading centers and other localized boundaries. This set of boundaries forms a complex and rapidly changing system relative to other mid-ocean ridges with multiple propagating rifts and tectonically reorienting structures making up several microplates. Many of the earthquakes previously thought to indicate diffuse deformation could now be identified with tectonic boundaries and spreading centers. A three-plate kinematic model of basin opening outlines the principal mode of deformation accommodating the extension (Zellmer and Taylor, 2001 — hereafter Z&T). The three-plate model comprises the Australian plate to the west of the spreading centers, the Niuafo'ou plate positioned between the Peggy Ridge and the Fonualei rift (FR), and the Tonga plate to the south and east of the Niuafo'ou plate (Fig. 1). This three-plate model credibly matches observed earthquake slip vector orientations and spreading rates determined by magnetic anomalies along the Lau spreading system. However, the nature of some microplate boundaries were not constrained by available geophysical observations and were either inferred or left to further study. For instance, there must be at least one microplate north of the Niuafo'ou plate, but geometry and kinematics are largely uncon- strained. Also, as noted by Z&T, there is no obvious indication of where the southern boundary of the Niuafo'ou plate extends between the southern tip of the Fonualei rift and spreading system to the west (Fig. 1). Based on statistical consistency of plate boundary data (rates and azimuths), they determined that the boundary connects the Fonualei rift tip to the Central Lau Spreading Center (CLSC)–Eastern Lau Spreading Center (ELSC) overlapping discontinuity. However, despite the fact that this boundary must accommodate over 4.5 cm/yr of strain, there is no clear indication in bathymetry, seafloor Earth and Planetary Science Letters 304 (2011) 538–546 ⁎ Corresponding author. Tel.: + 1 618 453 7352; fax: + 1 618 453 7393. E-mail addresses: [email protected] (J.A. Conder), [email protected] (D.A. Wiens). 1 Tel.: +1 314 935 6517; fax: +1 314 935 7361. 0012-821X/$ – see front matter © 2011 Elsevier B.V. All rights reserved. doi:10.1016/j.epsl.2011.02.032 Contents lists available at ScienceDirect Earth and Planetary Science Letters journal homepage: www.elsevier.com/locate/epsl
Transcript of Conder, J. A., and D. A. Wiens, Shallow seismicity and tectonics of the central and northern Lau...

Earth and Planetary Science Letters 304 (2011) 538–546
Contents lists available at ScienceDirect
Earth and Planetary Science Letters
j ourna l homepage: www.e lsev ie r.com/ locate /eps l
Shallow seismicity and tectonics of the central and northern Lau Basin
James A. Conder a,⁎, Douglas A. Wiens b,1
a Department of Geology, Southern Illinois University, 1259 Lincoln Dr., MC 4324, Carbondale, IL, 62901, United Statesb Department of Earth and Planetary Sciences, One Brookings Dr., Campus Box 1169, Washington University, St. Louis, MO, 63230, United States
⁎ Corresponding author. Tel.: +1 618 453 7352; fax:E-mail addresses: [email protected] (J.A. Conder),
1 Tel.: +1 314 935 6517; fax: +1 314 935 7361.
0012-821X/$ – see front matter © 2011 Elsevier B.V. Adoi:10.1016/j.epsl.2011.02.032
a b s t r a c t
a r t i c l e i n f oArticle history:Received 1 October 2010Received in revised form 15 February 2011Accepted 18 February 2011
Editor: P. Shearer
Keywords:Lau basincrustal seismicitybackarc tectonicsT-waves
The Lau basin is an active backarc comprising several spreading centers and microplates rapidly evolving intime. As such, crustal earthquakes within the Lau Basin derive from intrabasin tectonic, volcanic, andhydrothermal sources. Because of high mantle attenuation, small earthquakes from the basin are seldomrecorded on land seismographs and it has been difficult to study the pattern of crustal seismicity. However,the 1994 LABATTS ocean bottom seismograph experiment in the Lau basin recorded more than 100,000 localT- and body phases allowing for a detailed examination of basin seismotectonics. Nearly 1000 events arelocated within the basin proper, with another 2000 associated with the forearc and the aseismic front. Weidentify two previously undocumented tectonic features, a triple junction in the northwestern basin and ananoplate in the central Lau basin. The single most seismically active feature within the Lau basin is the Lauextensional transform zone (LETZ) just north of the Central Lau Spreading Center. Significant seismicity alsooccurs near the northern extension of the Eastern Lau Spreading Center and along a southeast extension of theLETZ delineating the boundary of a previously unknown nanoplate. Swarm activity is common in the backarcbasin and dominates regions associated with actively reorganizing tectonics. We see no evidence ofdeformation along the southern boundary of the Niuafo'ou microplate, where 4.5 cm/yr of strain is predicted.It is possible that the plate boundary extends eastward from the Fonualei rift (FR) tip towards the trenchcreating a Niuatoputapu–Tonga plate division rather than westward implied by the currently acceptedNiuafo'ou–Tonga plate system, but more data are necessary from the FR to test that hypothesis. Instead, wesuggest that the Niuafo'ou–Tonga pole is ~1.5° further north than previously proposed, reducing the predictedstrain in this region to b2 cm/yr.
+1 618 453 [email protected] (D.A. Wiens).
ll rights reserved.
© 2011 Elsevier B.V. All rights reserved.
1. Introduction
The Lau backarc basin between Fiji and Tonga has been opening forthe past 5–6 Ma in a wedge shaped pattern (Taylor et al., 1996). As atype example of an active backarc basin, considerable attention hasbeen given to understanding how deformation is accommodated anddistributed throughout the Lau basin (e.g., Hamburger and Isacks1988; Isacks et al., 1968; Pelletier and Louat 1989). With a basin scaleinversion of seafloormagnetization, Taylor et al. (1996) demonstrated‘typical’ seafloor spreading in the backarc and showed that deforma-tion is largely accommodated through a set of evolving microplatesbounded by spreading centers and other localized boundaries. This setof boundaries forms a complex and rapidly changing system relativeto other mid-ocean ridges with multiple propagating rifts andtectonically reorienting structures making up several microplates.Many of the earthquakes previously thought to indicate diffusedeformation could now be identified with tectonic boundaries andspreading centers. A three-plate kinematic model of basin opening
outlines the principal mode of deformation accommodating theextension (Zellmer and Taylor, 2001— hereafter Z&T). The three-platemodel comprises the Australian plate to the west of the spreadingcenters, the Niuafo'ou plate positioned between the Peggy Ridge andthe Fonualei rift (FR), and the Tonga plate to the south and east of theNiuafo'ou plate (Fig. 1).
This three-plate model credibly matches observed earthquake slipvector orientations and spreading rates determined by magneticanomalies along the Lau spreading system. However, the nature ofsome microplate boundaries were not constrained by availablegeophysical observations and were either inferred or left to furtherstudy. For instance, there must be at least one microplate north of theNiuafo'ou plate, but geometry and kinematics are largely uncon-strained. Also, as noted by Z&T, there is no obvious indication of wherethe southern boundary of the Niuafo'ou plate extends between thesouthern tip of the Fonualei rift and spreading system to the west(Fig. 1). Based on statistical consistency of plate boundary data (ratesand azimuths), they determined that the boundary connects theFonualei rift tip to the Central Lau Spreading Center (CLSC)–EasternLau Spreading Center (ELSC) overlapping discontinuity. However,despite the fact that this boundary must accommodate over 4.5 cm/yrof strain, there is no clear indication in bathymetry, seafloor

Fig. 1. Bathymetry, major tectonic features, and experiment layout in Lau basin. Colorbar denotes depth in kilometers. Dark lines show well defined plate boundaries. Grayarrows show spreading directions for various spreading axes. Labels are as follows:NWLSC=Northwest Lau Spreading Center, CLSC=Central Lau Spreading Center,ELSC=Eastern Lau Spreading Center, LETZ=Lau extensional transform zone,MTJ=Mangatolu triple junction, FR=Fonualei rift, and WM=West Mata underseavolcano. Black triangles show volcanic centers active in the last couple of decades.Circles (ocean bottom) and squares (land) are seismographs used in this paper. A–N–Tdesignations are plate geometry of Zellmer and Taylor (2001), where A=Australia,T=Tonga, and N=Niuafo'ou. Dotted line is hypothesized boundary between the Tongaand Niuafo'ou microplates.
1750 1800 1850 1900 1950 2000 2050 2100 2150 2200 2250
W18H
W18Z
W15H
W15Z
W20H
W20Z
D14H
D14Z
W13H
W13Z
D03H
D03Zday 288 hour 20
P S TP S T
seconds
Fig. 2. Seismograms showing P, S, and T arrivals. Sesimograms are vertical andhydrophone channels for two events spaced less than 5 min apart located near thenorthern terminus of the ELSC. Stations are ordered by distance from epicenter. Clearbody waves are only observed at the stations closest to the epicenter.
539J.A. Conder, D.A. Wiens / Earth and Planetary Science Letters 304 (2011) 538–546
reflectivity, seafloor magnetization, or known seismicity. It is ap-parent that this geologically young basin is still evolving, makingsome of these characteristics difficult to extract. Thus, despite theattention over the past few decades to detailing Lau backarc tectonics,there remain fundamental gaps in our understanding of the geometryand kinematics of deformation associated with Lau backarc opening.
A potentially valuable geophysical dataset that could improve ourunderstanding of Laumicroplate tectonics and intrabasin deformationis the shallow seismicity associated with accommodation of tectonicstrain. Spatial patterns of crustal and uppermost mantle earthquakescan delineate localizations of active tectonic strain, while momenttensors and spatio-temporal patterns will illuminate the nature of thetectonic deformation. Previous studies relied primarily on teleseismicarrivals (e.g., Pelletier et al., 1998) and seismograph deployments onthe Fijian and Tongan islands (Hamburger and Isacks, 1988). How-ever, the unusually high seismic attenuation in the mantle beneaththe basin (Roth et al., 1999) prevents seismic P and S waves from allbut the largest events (Mb≥4.5) from being recorded at epicentraldistances of even the nearby islands thereby restricting the amount ofpossible information to be gleaned regarding the frequency anddistribution of seismic deformation in the basin. For example, whilethe 1993–1995 SPASE array, spanning a number of islands in both Fijiand Tonga (Wiens et al., 1995) produced excellent records of deepsubduction events and hundreds of forearc events, only ~30 shallowbasin events could be located. In contrast, a three week deployment of
nine ocean bottom seismographs (OBSs) near the Peggy Ridge in 1984detected hundreds of nearby earthquakes (Eguchi et al., 1989).
A useful phase for locating and studying shallow seismicity usingOBSs is the T-phase — hydroacoustic energy traveling in the watercolumn. T-wave energy is not susceptible to the local high crust andmantle attenuation and, T-waves also lose energy more slowlythrough geometrical spreading than spherically spreading bodywaves. As T-phases can give easily observable arrivals well beyondwhere body arrivals are discernible (Fig. 2), many small earthquakesmay be identified that would otherwise go undetected. Hydroacousticsensors or OBSs recording T-phases propagating in the SOFAR channelhave proven able to monitor small earthquakes associated withtectonics, volcanism, and hydrothermal activity (Dziak et al., 2004;Fox et al., 2001; Smith et al., 2003).
In this paper, we examine the seismotectonics of the central andnorthern Lau basin using seismicity found from T and body phasesrecorded from the LABATTS OBS array augmented with data recordedfrom the simultaneously running SPASE array on the Tongan islandsand the Fijian island of Lakemba (Wiens et al., 1995). Tens of thou-sands of clear T and body wave arrivals are used to locate micro-earthquakes and examine microseismic patterns to infer straindistribution within the basin. Our results demonstrate a previouslyundiscovered nanoplate in the central basin and a previouslyunknown triple junction in the northwestern basin. Further, theseismicity illuminates tectonic behavior of other microplate bound-aries in both the northern and central portions of the basin.
2. Data and methods
2.1. Instrumentation and data
The ocean bottom seismograph deployment comprised thirty 4-component instruments — each having a 3-component 1 Hz sensorand differential pressure gage (Crawford et al., 2003). The OBSsrecorded continuously at 32 samples per second for 3 months withabout half the OBSs (marked ‘W’ in Fig. 1) recording at 128 Hz for thefirst 2 weeks for benefit of the airgunning component of theexperiment. One instrument was not recovered and a few instru-ments failed early in the experiment (not included in Fig. 1). We alsoinclude data from six broadband land stations from the SPASE arraythat were simultaneously recording on the Tongan and Lau islands(Wiens et al., 1995).

1 2 3 4 5 6 7 8
0
5
10
15
km/s
dept
h (k
m) CL
TR
TF
PP
Fig. 3. P and S velocity models used for event location. Crustal velocities from Crawfordet al. (2003). Four different models are CL: Central Lau, TR: Tonga ridge (islandstations), TF: Tonga forearc, and PP: Pacific plate.
540 J.A. Conder, D.A. Wiens / Earth and Planetary Science Letters 304 (2011) 538–546
2.2. Automated arrival time determination
Hundreds to sometimes thousands of body wave and T phasearrivals are visible for each day of data recorded. To process the largenumber of arrivals, we do a first pass of picking arrivals via automatedmethods. P-waves are determined by a simple short term average-long term average (STA/LTA) algorithm applied to the vertical channeldata streams. Electronic spiking is sometimes an issue, so prior torunning the STA/LTA algorithm, we despike the traces using astatistical method (Hojstrup, 1993) that leaves the waveformsunchanged.
Automating arrival picks of the T-waves proves less straightfor-ward because of the non-impulsive nature, rendering STA/LTAalgorithms largely useless. Observed T-waves also tend to be high-frequency as well as non-impulsive (Fig. 2), so precise travel-timepicks are somewhat ambiguous. However, because T-phases travel farmore slowly than body phases, a larger error in the arrival picks can betolerated before problematically influencing calculated hypocenterlocations. To effectively automate initial T-picking, we apply a 4 Hzhighpass Butterworth filter to the hydrophone records and form anenvelope using a Hilbert transform of the bandpassed waveforms. Totake advantage of the shape of the non-impulsive T-wave forms, weintegrate a twelve second window of the resultant envelope of thehydrophone data trace. Arrivals are triggered when this integration islarger than three times the median of the corresponding envelope ofan hour of the data trace. Because the T-arrivals are non-impulsive,arrival picks are assumed to be at the peak of the sliding integration ofthe windowed envelope.
After building the initial event and associated T-wave arrival timelists, we manually screen the picks for each event for consistency,accuracy, and the possible addition of missed P and S arrivals. Parrivals are picked as first arrivals in the 4 Hz highpassed data and Sare picked on the first large excursion on the horizontals after the Parrival. The most common errors encountered in the automated pickswere S-waves misattributed as P-waves and false identification ofboth P and T because of often noisy data. More false phaseidentifications could have been eliminated using a higher threshold,but at the cost of increasing false negatives. As our auto-associationalgorithm (grouping picks into events) is reasonably robust atelimination of false identifications but missed events cannot beremedied, we are willing to accept some false identifications. Manualscreening and editing of arrival picks further tighten the resultantpatterns and more than double the number of located events byimproving the signal to noise ratio in the arrival time list.
2.3. Association and location
Using the arrival times, we locate each event with a standardweighted least-squares algorithm using the 1D velocity modelsdetermined across the array from airgun analysis (Crawford et al.,2003). Four different models are used depending on location of thestation and/or event: Central Lau (CL), Tonga Ridge (TR), TongaForearc (TF), and Pacific Plate (PP) (Fig. 3). Island stations use the TRmodel with a 20 km thick crust. We solve for depth if eight or morebody wave arrivals are identified, otherwise we fix the depth at 5 km.For the T-waves, we assume a water velocity of 1490 m/s (Dunn,2009). Body wave travel times and derivatives are found using lookuptables generated by the TTbox routines (Knapmeyer, 2004). P, S, and Tarrivals are given standard uncertainties of 1, 2, and 4 s respectivelyfor weighting. For hypocenter-station pairs where the path traversesregions with different velocity models, we find body wave traveltimes and derivatives by averaging the two models.
We locate and associate events with arrival picks in a single step.After sorting picks by time, an initial pick is grouped with subsequentpicks within a given timewindow. The timewindow for P is 60 s, the Swindow is 1.85 times the P window, and the T window is 300 s. A
starting location is chosen near the station of the first pick in thegroup, and a best fitting location is then iterated for this group of picksusing a weighted least squares scheme. Successive iterationsdynamically downweight outliers to reduce their influence on thelocation (Willeman, 2001). If at least eight picks, including the firstpick, are consistent (misfits less than the assigned standarduncertainties), those consistent picks are associated as an event. Ifeither of these conditions are not met, no association is made and thealgorithm moves to the next earliest unassociated pick and repeatsthe process. Because of station geometry, we test two differentstarting locations, one north of the first arrival station and one southand discard the one with the higher sum of squares misfit.
2.4. Event magnitudes
To get ameasure of the size of the observed events, we determine aT-wave magnitudes of events with four or more associated T-wavesand compare the distribution with that expected from the PDEcatalog. We take the amplitude of a smoothed Hilbert envelope (Yangand Forsyth, 2003) and correct for cylindrical spreading. The assignedlocal scale magnitude is the log of the corrected amplitude. Thedistribution of events have a b-value of 1.2 while PDE basin eventsfrom 2000 to 2010 exhibit a b-value of 1.1. Adjusting the localmagnitudes with a DC shift to match the expected rate from PDEsuggests that the recorded events typically range in magnitude from~2.8 to 4.5. No PDE events were recorded during the LABATTSdeployment for direct comparison of waveforms, but 4.5 is areasonable upper end as it is approaching the threshold of detectionfor PDE. We note that T-wave magnitudes are dependent on factorssuch as coupling to the seafloor, local topography, and even focalmechanism (Dziak, 2001; Park et al., 2001), so individual magnitudeshave significant uncertainty to them. However, using P-waves (wherefour ormore are available) rather than T-waves gives a similar b-value(1.1) and likely range of magnitudes.
2.5. Event clustering
Events clustered in time and location are apparent in the data. Tosystematically identify and examine the character of seismic eventclusters, we use single-link clustering analysis (SLC) (Davis andFrohlich, 1991) applied to the resultant event catalog. SLC connectsgroups by making links between events that are closest to each otherin some sense. All events that can be connected along a series of linkssmaller than a given threshold are considered a distinct cluster. SLC isespecially helpful in aiding interpretation where multiple swarmsignals or high degrees of background seismicity are present. Forclustered seismicity, the important parameter is a coupling of spaceand time. For our SLC analysis, we use a time constant of 2 days/km

541J.A. Conder, D.A. Wiens / Earth and Planetary Science Letters 304 (2011) 538–546
and a space–time distance threshold of 10 km (Davis and Frohlich,1991).
3. Results
We locate nearly 3000 events in the backarc-arc–forearc systemwith about one-third of those in the backarc and two-thirds along theforearc and forearc ridge (Fig. 4). Differences between forearc andbackarc seismicity are apparent with even a cursory glance. Seismicityin the forearc is more widely distributed, while seismicity in thebackarc is less diffuse and more tightly restricted to plate boundaries.Backarc activity is also prone to occurring in swarms, while forearcactivity exhibits negligible swarm-like behavior.
Backarc arrivals are dominated by T-waves while forearc arrivalstend to be dominated by body waves. This difference arises from acombination of factors. First, shallower hypocenters in the backarctend to excite more hydroacoustic energy. Second, while propagationof T-waves is largely uninhibited through the backarc basin,propagation is inhibited by the forearc ridge — particularly south ofVava'u. Third, the aforementioned mantle attenuation beneath thebasin tends to preclude bodywave arrivals on basin stations, but thereis far less attenuation beneath the forearc, so body waves are moreeasily observable on forearc and outer rise stations, as well as theisland stations.
With the higher proportion of body waves, there is better controlon depth for forearc events than in the backarc. To avoid slabseismicity, events with a confidence ellipsoid reaching the slab surface(Gudmundsson and Sambridge, 1998) or deeper are removed fromthis analysis. The high amount of seismicity along the forearc is notunexpected as forearcs in general exhibit deformation associated with
−178 −177 −176 −175 −174 −173−22
−21
−20
−19
−18
−17
−16
−15
M4M3M2
EL
SC
NWLS
C MTJ
FR
LETZ
CLSC
Tong
an Is
land
s
Vol
cani
c ar
c
Fig. 4. Shallow basin seismicity. Epicenters found in this study west of the Tonga trench(thin black line) are shown as gray circles. Size is scaled to Tmagnitude adjusted to bestmatch PDE body wave magnitudes for Lau. Magnitude scale is bottom left. Coloredgroups are event clusters of eight or more found by single-link-clustering analysis.Event clusters are spaced closely in both time and space. Clusters are associated withthe northern termini of the Fonualei rift and Eastern Lau Spreading Center. Sevenclusters are found in the LETZ, with two comprising more than seventy events each.
subduction between the trench and aseismic front (Igarashi et al.,2001).
3.1. Location quality assessment
Uncertainties in hypocenter location are evaluated by the twosigma confidence ellipses determined by the covariance matrix of theweighted least squares formulation. Two sigma uncertainties inlocation are typically 5–10 km near the CLSC and ETZ and expand to15–30 km in the extremities of the basin.
While the arraywas successfully designed formantle structure anddeep earthquake studies of the Tonga region (e.g., Conder and Wiens,2006; Koper et al., 1998), the linear geometry can pose ambiguity inearthquake epicenter determination beyond formal uncertainties.Because of the geometry,most arrivalswill be observed along themainline with a few arrivals registering on off-line stations. This results inoff-line stations having a disproportionate data importance attachedto their arrivals in the locating algorithm, meaning that erroneouspicks on off-axis stations are more problematic for causing spuriouslocations and are also more difficult to easily discern by correlationwith other stations. The biggest potential problem is that of ‘mirroring’across the line as a particular location on one side of the linewill fit thearrival data for the line stations just aswell as a hypocenter south of theline.
To limit these problematic issues, a few different approaches aremade in examination of arrival picks. Off-axis station pairs D005 withW007 and W006 with D009 are cross-checked for arrival picks wherepossible, but this cross-checking is limited as D009 stopped recordingafter 4 weeks andW007 had continual quality control problems due toelectronic noise — particularly on the vertical channel. Events thatappear to be deeper than a few of 10 s of kilometers (trench andsubduction events) are removed when identified and when picks aretoo ambiguous on off-line stations to make a reasonable determination.
The CLSC ridge tip is probably the most subject to mirror problemsof any tectonic feature in the basin. The mirror site for the southernsegment of the CLSC is the LETZ, allowing for the possibility of leakagefrom the LETZ overprinting the CLSC tip. For this reason, we imposed aspecific check in this region allowing only events where final locationsfrom both starting locations were south of the line, meaning thatarrivals at stations D003 and/or D005must force the locations south ofthe line rather than simply allow it. As the trend of the resultantepicenters tend to follow the spreading segment rather than a SSWtrend that would likely be derived from mirroring events from theETZ, these appear to be robust, with the attached caveat.
The band of events between 18.5° and 19.5°S (CLSC to nELSC)appear to be systematically shifted eastward 5–10 km. This shift doesnot appear to come from any timing or location problems from therecording stations. As epicentral locations from T-waves denotewhere energy enters the water column, this may be an instance wherenearby topographic features are acting as primary radiators ratherthan ‘true’ epicentral locations.
4. Discussion
Both spatial and temporal patterns are apparent in the seismicity.In the backarc, most events are associated with boundaries of theseveral microplates within the basin. Many of the patterns we seesupport prior work delineating tectonics of the basin (Pelletier et al.,1998; Taylor et al., 1996; Zellmer and Taylor, 2001). At the same time,the seismicity presented here provides new information that furthersand revises this prior work. A detailed examination of spatial andtemporal trends in shallow basin seismicity are reported in Sec-tions 4.1–4.3. Because of the large number of small earthquakes andthe less than optimal station distribution, a few individual earth-quakes may be poorly located despite their good formal uncertainties.Therefore, we focus on interpreting seismicity patterns rather than

542 J.A. Conder, D.A. Wiens / Earth and Planetary Science Letters 304 (2011) 538–546
individual isolated hypocenters. For ease of discussion, we divide thebasin into northern and central portions roughly along 16°S.
4.1. Central basin
The three-plate model of Z&T applies to the basin south of ~16°S,the part with the best constrained seafloor magnetization as well asgreatest coverage of bathymetry and sidescan sonar. The primaryboundaries in this region include the ELSC, CLSC, FR, and PR. The threespreading centers are all propagating southward, albeit at differentrates (Pelletier et al., 1998), and the PR has recently evolved from atransform fault to an extensional transform zone (Taylor et al., 1996).As well as having different strain rates and morphologies, each ofthese boundaries exhibits a different character in seismicity.
4.1.1. Swarm activityWhile absent in the forearc, swarm activity is not unusual in the
central backarc basin. Single-link clustering shows several groupsassociated with specific tectonic features, such as the northernterminus of the Easter Lau Spreading Center (nELSC), the extensionaltransform zone (ETZ) and, the northern terminus of the Fonualei rift(nFR) (Fig. 4). Only one cluster we describe here is a possibleaftershock sequence (on the CLSC), with the rest appearing as swarmactivity— events clustered in time and spacewith no clearmainshock.Earthquake swarms described in the literature are typically linked tovolcanic (Dziak and Fox, 1999; Tolstoy et al., 2006) or hydrothermalprocesses (Tolstoy et al., 2008;Wilcock et al., 2002). No swarms foundhere can be easily attributed to either of these driving mechanisms asthey lie far from known hydrothermal sites and tend to be in locationswith likely reduced magmatic activity (e.g., near segment ends).However, each of these features are associated with young, evolving,or ephemeral tectonics. For example, the nELSC has been activelyretreating with advancement of the CLSC rift where twelve locatedevents occurred within a five hour period (Fig. 5). Swarm activitydominates the Peggy Ridge extensional transform region where thesouthern portion of the transform is manifesting as an extensionalreorganization of the prior PR strike–slip transform fault. In contrast,
0
5
10
# ev
ents nFR
0
10
20
# ev
ents CLNPcorner
0
10
20
# ev
ents nELSC
260 280 300 320 3400
5
10
15
# ev
ents
julian day
sCLSC
Fig. 5. Histograms of events in time. Panels show events within each region of clustersmarked in Fig. 4. Excepted are clusters from the ETZ which are treated separately later.Clustering dominates over steady release in each of these regions.
the northernmost portion has not reoriented into an extensionalregime and does not exhibit time clustering behavior in seismicity(Fig. 4).
4.1.2. ELSCMost of the seismicity associated with the ELSC is found at the
northern terminus,(nELSC), which has events recorded in the CMTand PDE catalogs. CMTs near the nELSC are predominantly strike–slip,consistent with bookshelf faulting at the step over between the CLSCand ELSC (Wetzel et al., 1993). As the ELSC retreats with CLSCpropagation (Parson et al., 1990), this portion of the ridge can beviewed as a dying rift in that the locus of spreading is moving from theELSC to the CLSC. However, it is not quite that simple, in that ananoplate abutting the CLSC and ELSC exhibits somemotion along theELSC extension (see 4.1.6). Other than at the northern terminus, onlythree events are unambiguously identified as occurring along thelength of the ELSC. These three are identified solely by T-waves, withtwo coming from virtually the same location within 4 min of eachother.
The ELSC exhibits an excess degree of hydrothermal ventingrelative to the global spreading rate trend. Baker et al. (2006) andMartinez et al. (2006) suggest that the excess hydrothermal activityderives from increased tectonic faulting with decreased magmasupply. Such amodel suggests that small earthquakes will concentrateon the northernmost, magma-starved section of the ELSC, and thereshould be few earthquakes on the southern, magmatically robustsection. Moreover, it depends on localized faulting to accommodatedeformation that would have been accommodated by magmaticintrusion to enhance permeability. Despite the less than 20 kmproximity to a hydrothermal site for each of three located events, theyare likely tectonic rather than related to hydrothermal activity as thevent sites are outside the two sigma confidence ellipses.
The dearth of events suggests that ELSC seismicity tends to besmall and/or infrequent. Recordings from an active source OBS arrayin 2009 shows that there is considerable seismic activity associatedwith the ELSC as measured by events per hour (Conder et al., 2009),but the small magnitudes require an OBS array tightly focused onthe ELSC to adequately record and locate the events, consistent witha model of deformation accommodated primarily by magmaticextension.
4.1.3. CLSC/propagatorThe Central Lau Spreading Center extends from ~18°S to ~19° 25′S
where it is propagating southward at the expense of the ELSC (Parsonet al., 1990). The CLSC shows seismicity along its length, with 47located events, appearing to be the most seismically active spreadingcenter in the basin. This may be due to sampling bias as the onlyspreading center that directly crosses the main line of the OBS array,allowing for a lower detection threshold than necessary for otherspreading centerswithin the basin.With the southernmost tip activelypropagating, there is likely a difference in the mode of tectonicdeformation between the tip and the rest of the spreading center. Ofthe 47 located CLSC events, 39 lie south of 18° 54′S towards the ridgetip rather than the segment center. CLSC seismicity exhibits someclustered activity. Over half of the recorded events occurred over aseven day period (Fig. 5) containing a possible aftershock sequencegiving it a slightly different character from the other clusters.
Unlike other tectonically evolving features in the basin, thepropagating rift may not exhibit swarm activity. The difference maylie in mode of tectonic evolution. Abyssal hill morphology of the CLSCpropagating rift is consistent with other propagating rifts thatpropagate in discrete jumps rather than through gradual processes(Wilson, 1990). This difference suggests that the propagating rift maybe viewed as in a ‘meta-stable’ state and therefore may not spawnswarm activity like other actively evolving tectonic features.

543J.A. Conder, D.A. Wiens / Earth and Planetary Science Letters 304 (2011) 538–546
4.1.4. Fonualei riftAlthough the ridge axes do not generally exhibit as much seis-
micity as other crustal boundaries, clear seismicity is located along theFonualei rift. We find more events associated with the northernterminus of the FR near the Mangatolu triple junction (MTJ) than withthe rift tip despite CMT and PDE catalogs listing many more eventsnear the rift tip than near the northern end. The northern terminusleft-steps towards the MTJ in the form of a small overlapping spread-ing center (OSC) (Fig. 4), likely indicating an evolving plate boundaryin this region (Perram and Macdonald, 1994; Ruellan et al., 1994).Likewise, single link clustering shows most of the activity near theterminus occurs in one swarm on the eastern flank of the OSC (Fig. 4),consistent with the evolving portions of the ridge respondingseismically in a more time-dependent manner. The propagating tipat the southern end of the ridge may behave without swarm activity,like the CLSC propagator. However, the FR tip does not show anabyssal hill morphology similar to the CLSC andmay be propagating ina more gradual fashion. As the tip has far more recorded seismicityfrom regional and global catalogs than the northern terminus, thedearth of events there lends credence to the possibility that it alsoexhibits swarm-like activity, but with the LABATTS deployment in aninopportune recording window.
10
ents PR
4.1.5. Lau extensional transform zoneThe single-most seismically active feature in the basin is the Lau
extensional transform zone (ETZ). The high rate of seismicity wasrecognized in the 1980s by Eguchi et al. (1989), who recorded morethan ten events per day along the ETZ with a thirty day, small apertureOBS deployment centered on the ETZ. We locate more than 600 eventsalong the Peggy Ridge (PR) and ETZ (Figs. 4 and 6). In addition, stationD005, near thenorthern endof the ETZwas triggered by the autopickingalgorithms far more times than any other station, implying hundreds, ifnot thousands, of nearby events that we were unable to locate with the
Fig. 6. Event density along Peggy Ridge (PR), extensional transform zone (ETZ), andcentral Lau nanoplate. More than 600 events were located along this feature. The twosigma confidence ellipses for each event are summed as Gaussian distributions. Colorscale is density in log units. Event density is variable along the zone. Eguchi et al. (1989)found seven discrete loci of events, marked A–F, and what they termed ‘isolatedactivity’ east of the ETZ. Events from Eguchi et al. are marked as crosses. While theyfound more seismicity in regions A–C, we see far more activity further to the south andnorth. Blue ellipses mark regions of histograms shown in Fig. 7. For consistency with theprevious work, we label the three southern groups ‘e’, ‘f’, and ‘g’.
other instruments. S–P times show that these events are consistentwithbeing derived from the ETZ. In separating out the southern eventsassociated with the more extensional part of the ETZ from the moredistinct PR transform in the northwest, we see thatmuch of that activityin the southern section comes in a few energetic swarms, while eventsfrom the northwest part of the zone along the PR transform are steadierin their frequency of occurrence (Fig. 7).
Eguchi et al. (1989) grouped clusters of seismicity within the zoneinto six sections (A–F). As the LABATTS array is spread across the basin,we donot have the same resolution to tightly constrain the seismicity tothe Eguchi clusters along the ETZ. However, the density of events alongthe ETZ, as evaluated by summing confidence ellipses of each event as a2DGaussian distribution, has a ‘bumpiness’ that is consistentwith thesediscrete event clusters, albeit with some small shifts (Fig. 6). Intrigu-ingly, we observe far less activity along Eguchi segments A–C (between17° and 17° 30′S) and more near E–F (between 17° 35′ and 18°S),opposite in overall trend from the previous study, further demonstrat-ing the non-steady state behavior of ETZ seismicity. The seismicity ineach of the high density sections comes in punctuated swarms. The twohigh density sections equivalent to Eguchi E–F, are dominated byclusters of events in time, each lasting for roughly a day or two induration. Curiously, swarms in these two clusters are often 1 day apartin either direction (Fig. 7), hinting of possible stress interaction betweenadjacent segments.
4.1.6. NanoplateSeismicity delineates a nanoplate (~1 order of magnitude smaller
than other microplates) in the central basin bounded by the CLSCpropagating rift to the west and by the CLSC/ELSC bookshelf faultingzone (Wetzel et al., 1993) to the south (Fig. 8). The nanoplate is
0
5
# ev
0
5
# ev
ents sPR
0
50
# ev
ents ETZe
0
50
# ev
ents ETZf
260 280 300 320 3400
5
10
15
# ev
ents
julian day
ETZg
Fig. 7. Histograms of LETZ events. Five panels show regions within five ellipses markedin Fig. 6. PR and sPR are along the Peggy Ridge transform, while e, f, and g are wellwithin the extensional part of the zone. Horizontal axis denotes julian day of theexperiment, and vertical axis is binned number of events per day. Note different scales.PR and sPR have 56 and 15 located events, while e, f, and g have 172, 276, and 43respectively. The southern groups are much more prone to swarm activity than thenorthern end of the transform. Event activity along PR and sPR are steadier in timewhere there has been little recent change in plate boundary geometry, while thesouthern groups tend to come in punctuated clusters. While coming from different loci,swarms are observed in each of the tree groups near days 270, 280, and 290, suggestingthat swarms may trigger other swarms on adjacent segments.
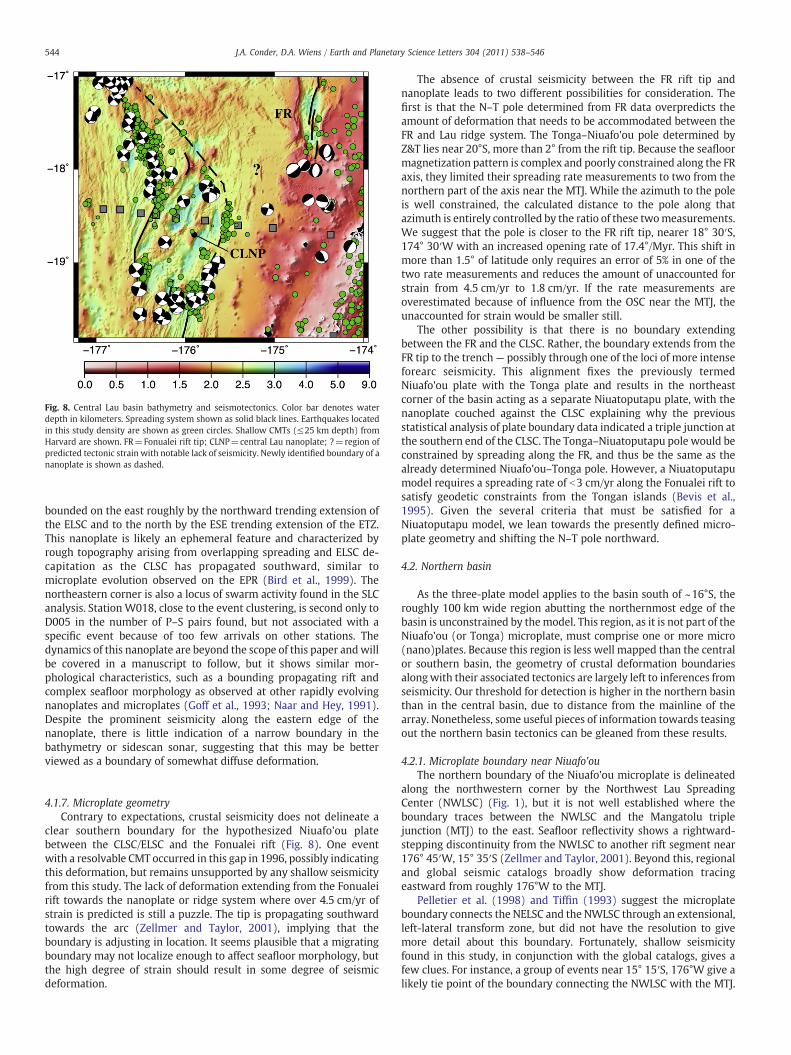
Fig. 8. Central Lau basin bathymetry and seismotectonics. Color bar denotes waterdepth in kilometers. Spreading system shown as solid black lines. Earthquakes locatedin this study density are shown as green circles. Shallow CMTs (≤25 km depth) fromHarvard are shown. FR=Fonualei rift tip; CLNP=central Lau nanoplate; ?=region ofpredicted tectonic strain with notable lack of seismicity. Newly identified boundary of ananoplate is shown as dashed.
544 J.A. Conder, D.A. Wiens / Earth and Planetary Science Letters 304 (2011) 538–546
bounded on the east roughly by the northward trending extension ofthe ELSC and to the north by the ESE trending extension of the ETZ.This nanoplate is likely an ephemeral feature and characterized byrough topography arising from overlapping spreading and ELSC de-capitation as the CLSC has propagated southward, similar tomicroplate evolution observed on the EPR (Bird et al., 1999). Thenortheastern corner is also a locus of swarm activity found in the SLCanalysis. Station W018, close to the event clustering, is second only toD005 in the number of P–S pairs found, but not associated with aspecific event because of too few arrivals on other stations. Thedynamics of this nanoplate are beyond the scope of this paper andwillbe covered in a manuscript to follow, but it shows similar mor-phological characteristics, such as a bounding propagating rift andcomplex seafloor morphology as observed at other rapidly evolvingnanoplates and microplates (Goff et al., 1993; Naar and Hey, 1991).Despite the prominent seismicity along the eastern edge of thenanoplate, there is little indication of a narrow boundary in thebathymetry or sidescan sonar, suggesting that this may be betterviewed as a boundary of somewhat diffuse deformation.
4.1.7. Microplate geometryContrary to expectations, crustal seismicity does not delineate a
clear southern boundary for the hypothesized Niuafo'ou platebetween the CLSC/ELSC and the Fonualei rift (Fig. 8). One eventwith a resolvable CMT occurred in this gap in 1996, possibly indicatingthis deformation, but remains unsupported by any shallow seismicityfrom this study. The lack of deformation extending from the Fonualeirift towards the nanoplate or ridge system where over 4.5 cm/yr ofstrain is predicted is still a puzzle. The tip is propagating southwardtowards the arc (Zellmer and Taylor, 2001), implying that theboundary is adjusting in location. It seems plausible that a migratingboundary may not localize enough to affect seafloor morphology, butthe high degree of strain should result in some degree of seismicdeformation.
The absence of crustal seismicity between the FR rift tip andnanoplate leads to two different possibilities for consideration. Thefirst is that the N–T pole determined from FR data overpredicts theamount of deformation that needs to be accommodated between theFR and Lau ridge system. The Tonga–Niuafo'ou pole determined byZ&T lies near 20°S, more than 2° from the rift tip. Because the seafloormagnetization pattern is complex and poorly constrained along the FRaxis, they limited their spreading rate measurements to two from thenorthern part of the axis near the MTJ. While the azimuth to the poleis well constrained, the calculated distance to the pole along thatazimuth is entirely controlled by the ratio of these twomeasurements.We suggest that the pole is closer to the FR rift tip, nearer 18° 30′S,174° 30′W with an increased opening rate of 17.4°/Myr. This shift inmore than 1.5° of latitude only requires an error of 5% in one of thetwo rate measurements and reduces the amount of unaccounted forstrain from 4.5 cm/yr to 1.8 cm/yr. If the rate measurements areoverestimated because of influence from the OSC near the MTJ, theunaccounted for strain would be smaller still.
The other possibility is that there is no boundary extendingbetween the FR and the CLSC. Rather, the boundary extends from theFR tip to the trench— possibly through one of the loci of more intenseforearc seismicity. This alignment fixes the previously termedNiuafo'ou plate with the Tonga plate and results in the northeastcorner of the basin acting as a separate Niuatoputapu plate, with thenanoplate couched against the CLSC explaining why the previousstatistical analysis of plate boundary data indicated a triple junction atthe southern end of the CLSC. The Tonga–Niuatoputapu pole would beconstrained by spreading along the FR, and thus be the same as thealready determined Niuafo'ou–Tonga pole. However, a Niuatoputapumodel requires a spreading rate of b3 cm/yr along the Fonualei rift tosatisfy geodetic constraints from the Tongan islands (Bevis et al.,1995). Given the several criteria that must be satisfied for aNiuatoputapu model, we lean towards the presently defined micro-plate geometry and shifting the N–T pole northward.
4.2. Northern basin
As the three-plate model applies to the basin south of ~16°S, theroughly 100 km wide region abutting the northernmost edge of thebasin is unconstrained by themodel. This region, as it is not part of theNiuafo'ou (or Tonga) microplate, must comprise one or more micro(nano)plates. Because this region is less well mapped than the centralor southern basin, the geometry of crustal deformation boundariesalong with their associated tectonics are largely left to inferences fromseismicity. Our threshold for detection is higher in the northern basinthan in the central basin, due to distance from the mainline of thearray. Nonetheless, some useful pieces of information towards teasingout the northern basin tectonics can be gleaned from these results.
4.2.1. Microplate boundary near Niuafo'ouThe northern boundary of the Niuafo'ou microplate is delineated
along the northwestern corner by the Northwest Lau SpreadingCenter (NWLSC) (Fig. 1), but it is not well established where theboundary traces between the NWLSC and the Mangatolu triplejunction (MTJ) to the east. Seafloor reflectivity shows a rightward-stepping discontinuity from the NWLSC to another rift segment near176° 45′W, 15° 35′S (Zellmer and Taylor, 2001). Beyond this, regionaland global seismic catalogs broadly show deformation tracingeastward from roughly 176°W to the MTJ.
Pelletier et al. (1998) and Tiffin (1993) suggest the microplateboundary connects the NELSC and the NWLSC through an extensional,left-lateral transform zone, but did not have the resolution to givemore detail about this boundary. Fortunately, shallow seismicityfound in this study, in conjunction with the global catalogs, gives afew clues. For instance, a group of events near 15° 15′S, 176°W give alikely tie point of the boundary connecting the NWLSC with the MTJ.

545J.A. Conder, D.A. Wiens / Earth and Planetary Science Letters 304 (2011) 538–546
These events trend ESE suggesting a right-stepping fault towards theisland of Niuafo'ou (Fig. 9). Near Niuafo'ou, the boundary turnsnortheast for about 50 km before turning southeast towards theMangatolu triple junction (Fig. 9), overall consistent with thesuggested left-lateral zone of extension, although difficult to discernin the bathymetry.
4.2.2. Northwest Lau triple junctionShallow seismicity exhibits a well-defined line of seismicity extend-
ing NNW from the southernmost segment of the NWLSC (Fig. 9), ratherthan right-stepping towards the next segment. Recently collectedbathymetry and reflectivity confirm the location of the right-steppedsegment with a connecting non-transform discontinuity (Martinez andTaylor, 2006). This pattern of right-stepping axis geometry coupledwithleft-stepping earthquake epicenters suggests that this is a triple junctionof a ridge — fault — non-transform discontinuity variety. For the givengeometry, the newly found fault must be right lateral with a strain ratesimilar to the non-transform discontinuity to satisfy closure. Triplejunction stability analysis (Cox and Hart, 1991) shows that this triplejunction is likely stable, but shortening the ridge segment with time.
4.2.3. Network of small platesAn implication of the existence of this northwest Lau triple junction
is that there must be at least two tectonic plates in the northern basinand hints at the likelihood of a greater number of micro (or nano)
Fig. 9. Northern Lau basin. Top panel shows bathymetry and earthquakes. Symbols aresame as Figs. 1 and 8. Bottom panel shows microplate boundaries in northern basin(dashed) as proposed on the basis of seismicity recorded locally and teleseismically.Given the observed patterns of seismicity, there is reasonable likelihood that thenorthern basin will be divided further with more detailed geophysical mapping of theregion.
plates in the northern basin as has been previously supposed. It ispossible that the northern basin between the northwest Lau triplejunction and the MTJ to the east is not limited to one microplate, butpartitioned into several. The shallow earthquakes trend northwardnear 175° 05′W in a region with a significant number of eventsrecorded teleseismically (Fig. 9). It is possible that these events arederiving from the boundary of a nanoplate abutting the NELSC andMTJ. Given the trends in recorded seismicity elsewhere in the northernbasin, it seems reasonable that another small plate or two remain to beidentified, but will require more detailed geophysical mapping.
4.3. Arc volcanoes
More than a dozen different submarine volcanoes in the Tonganarc are known to have historical eruptions, including five in the lastdecade (Venzke et al., 2002). Of note, West Mata, in the northeasternbasin, is a RIDGE2000 rapid response site (RIDGE2000 Science Plan,2011) since discovery of active eruptions in 2008 (Merle et al., 2009).Underwater and island volcanoes can emit seismic waves duringepisodes of magmatism (e.g., Dziak and Fox, 1999). While volcanicevents are notably few in the present dataset, a handful of earth-quakes are closely located with specific arc volcanoes, such as MetisShoal at 19° 12′S which erupted in 1995 and an unnamed seamount at18° 20′S which erupted in 2001 (Venzke et al., 2002), possiblyindicating precursors to these eruptions. Other volcanic signals, suchas magmatic tremor, are possibly recorded in the LABATTS data onindividual stations, such as stationW006 near the northern end of thevolcanic line and W007 in the northwest basin (Fig. 1), both of whichshow a considerable degree of nonimpulsive signal, sometimes lastinghours or longer. However, without independent confirmation fromadditional stations their connection to volcanic processes remainsspeculative and must wait further deployments for comparison.
5. Conclusions
Shallow basin seismicity often excites T-waves which are regularlyseen at greater epicentral distances than body waves. With thesearrivals, nearly a thousand shallow microseismic events are found inthe backarc basin during the three month LABATTS OBS deployment.Notable loci of activity are observed, including a previously unrecog-nized triple junction in the northwest basin, a nanoplate in the centralbasin, and the ETZ, the most seismically active basin feature withmore than 600 located events in the three month period.
The observed patterns of shallow seismicity build on and revisepreviously understood tectonics of the basin. The northern basin likelycomprises a network of small tectonic plates. A newly found triplejunction in the northwestern basin is part of this network (Fig. 9), butmore detailed systematic geophysical mapping is necessary in thenorthernmost basin to fully constrain their geometries and kinemat-ics. A nanoplate is found in the central basin, bounded by the CLSC tothe west, the ELSC/CLSC non-transform discontinuity to the south andthe southeast extension of the Peggy Ridge transform to the north(Fig. 9).
Even with the greater fidelity provided by the ocean bottomseismograph experiment, there is still no indication of plate boundarydeformation connecting the Fonualei rift to the Lau ridge system. Toaccount for the lack of observed deformation, we suggest a revisedNiuafo'ou–Tonga pole that predicts b2 cm/yr of strain in this region.Geodetic constraints coupled with improved spreading rate data fromthe Fonualei rift can test this possibility.
The abundance of swarm activity in the basin is unlikely to bedriven by magmatic or hydrothermal activity. Rather, they appear tobe associated with regions exhibiting active reorganization or othertime-dependent tectonics. Actively changing plate boundaries dom-inated by swarm activity include the ETZ, the northern termini of theELSC and FR, and nearly the entire perimeter of the CLNP, while more

546 J.A. Conder, D.A. Wiens / Earth and Planetary Science Letters 304 (2011) 538–546
stable features show little time dependence at least at this multi-monthly scale.
Acknowledgements
We thank Dylan Matthieu and Simon Heath for their work intransferring and reformatting the data. Thanks to Fernando Martinezfor sharing shipboard geophysical data near the NWLSC prior topublication. Brian Taylor and an anonymous reviewer providedthoughtful critical comments that greatly improved the quality ofthe manuscript. This work was funded by NSF grants OCE-0825424and OCE-0426408.
References
Baker, E.T., Resing, J.A., Walker, S.L., Martinez, F., Taylor, B., Nakamura, K.-I., 2006.Abundant hydrothermal venting along melt-rich and melt-free ridge segments inthe Lau back-arc basin. Geophys. Res. Lett. 33.
Bevis, M., Taylor, F., Schutz, B., Recy, J., Isacks, B., Helu, S., Singh, R., Kendrick, E., Stowell,J., Taylor, B., Calmant, S., 1995. Geodetic observations of very rapid convergence andback-arc extension at the Tonga arc. Nature 374, 249–251.
Bird, R., Tebbens, S., Kleinrock, M., Naar, D., 1999. Episodic triple-junction migration byrift propagation and microplates. Geology 27, 911–914.
Conder, J., Wiens, D., 2006. Seismic structure beneath the Tonga arc and Lau back-arcbasin determined from joint Vp, Vp/Vs tomography. Geochem. Geophys. Geosyst. 7,Q03018.
Conder, J.A., Dunn, R., Godfrey, K., 2009. Preliminary examination of microearthquakeactivity along the Eastern Lau Spreading Center and southern Lau Basin. EOS, TransAGU 90, Abstract OS13A-1161.
Cox, A., Hart, B.R., 1991. Plate Tectonics: How It Works. Wiley-Blackwell.Crawford, W., Hildebrand, J., Dorman, L., Webb, S., Wiens, D., 2003. Tonga Ridge and Lau
Basin crustal structure from seismic refraction data. J. Geophys. Res. 108, 2195.Davis, S., Frohlich, C., 1991. Single-link cluster analysis, synthetic earthquake catalogs,
and aftershock identification. Geophys. J. Int. 104, 289–306.Dunn, R., 2009. Crustal Accretion andMantle Processes along the Subduction Influenced
Eastern Lau Spreading Center. L-SCAN, Project.Dziak, R.P., 2001. Empirical relationship of T-wave energy and fault parameters of
northeast Pacific Ocean earthquakes. Geophys. Res. Lett. 28, 2537–2540.Dziak, R.P., Fox, C.G., 1999. The January 1998 earthquake swarm at axial volcano, Juan
de Fuca ridge: hydroacoustic evidence of seafloor volcanic activity. Geophys. Res.Lett. 26, 3429–3432.
Dziak, R.P., Smith, D.K., Bohnenstiehl, D.R., Fox, C.G., Desbruyeres, D., Matsumoto, H.,Tolstoy, M., Fornari, D.J., 2004. Evidence of a recent magma dike intrusion at theslow spreading Lucky Strike segment, Mid-Atlantic Ridge. J. Geophys. Res. B SolidEarth 109, 1–15.
Eguchi, T., Fujinawa, Y., Ukawa, M., 1989. Microearthquakes and tectonics in an activeback-arc basin; the Lau Basin. Phys. Earth Planet. Int. 56, 210–229.
Fox, C., Matsumoto, H., Lau, T., 2001. Monitoring Pacific Ocean seismicity from anautonomous hydrophone array. J. Geophys. Res. 106, 4183–4206.
Goff, J., Fornari, D., Cochran, J., Keeley, C., Malinverno, A., 1993. Wilkes transform systemand nannoplate. Geology 21, 623–626.
Gudmundsson, O., Sambridge, M., 1998. A regionalized upper mantle (RUM) seismicmodel. J. Geophys. Res. 103, 7121–7136.
Hamburger, M.W., Isacks, B.L., 1988. Diffuse back-arc deformation in the southwesternPacific. Nature 332, 599–604.
Hojstrup, J., 1993. A statistical data screening procedure. Meas. Sci. Technol. 4, 153–157.Igarashi, T., Matsuzawa, T., Umino, N., Hasegawa, A., 2001. Spatial distribution of focal
mechanisms for interplate and intraplate earthquakes associated with thesubducting Pacific plate beneath the northeastern Japan arc: a triple-planed deepseismic zone. J. Geophys. Res. 106, 2177–2191.
Isacks, B.L., Sykes, L.R., Oliver, J., 1968. Distribution in time of small deep and shallowearthquakes in the Fiji–Tonga region. Spec. Pap. Geol. Soc. Am. 101, 315.
Knapmeyer, M., 2004. TTbox: a Matlab toolbox for the computation of 1D teleseismictravel times. Seis. Res. Lett. 75, 726–733.
Koper, K.D., Wiens, D.A., Dorman, L.M., Hildebrand, J.A., Webb, S.C., 1998. Modeling theTonga Slab; can travel time data resolve a metastable olivine wedge? J. Geophys.Res. 103, 30,079–30,100.
Martinez, F., Taylor, B., 2006. Modes of crustal accretion in back-arc basins: inferencesfrom the Lau basin. In: Christie, Fisher, Lee, Givens (Eds.), Back-Arc SpreadingSystems — Geological, Biological, Chemical, and Physical Interactions: AGUMonogr., 166, pp. 5–30.
Martinez, F., Taylor, B., Baker, E.T., Resing, J.A., Walker, S.L., 2006. Opposing trends incrustal thickness and spreading rate along the back-arc Eastern Lau SpreadingCenter: implications for controls on ridge morphology, faulting, and hydrothermalactivity. Earth Planet. Sci. Lett. 245, 655–672.
Merle, S.R., J.A., Embley, R.W., Collasius, T.R., J.A., Embley, R.W., Collasius, T., 2009.Northeast Lau Basin Response Cruise (NELRC) R/V Thomas G. Thompson ExpeditionTN-234, Cruise Report.
Naar, D.F., Hey, R.N., 1991. Tectonic evolution of the Easter microplate. J. Geophys. Res.96, 7961–7993.
Park, M., Odom, R.I., Soukup, D.J., 2001. Modal scattering a key to understanding oceanicT-waves. Geophys. Res. Lett. 28, 3401–3404.
Parson, L., Pearce, J., Murton, B., Hodkinson, R., 1990. Role of ridge jumps and ridgepropagation in the tectonic evolution of the Lau back-arc basin, Southwest Pacific.Geology 18, 470–473.
Pelletier, B., Louat, R., 1989. Seismotectonics and present-day relative plate motions inthe Tonga–Lau and Kermadec–Havre region. Tectonophysics 165, 237–250.
Pelletier, B., Calmant, S., Pillet, R., 1998. Current tectonics of the Tonga–New Hebridesregion. Earth Planet. Sci. Lett. 164, 263–276.
Perram, L., Macdonald, K., 1994. An overlapping propagating spreading center at 87 30′W on the Galapagos spreading center. Earth Planet. Sci. Lett. 121, 195–211.
RIDGE2000 Science Plan, http://www.ridge2000.org/science/info/science_plan.php,accessed, January, 2011.
Roth, E.G., Wiens, D.A., Dorman, L.M., Hildebrand, J., Webb, S.C., 1999. Seismicattenuation tomography of the Tonga–Fiji region using phase pair methods.J. Geophys. Res. 104, 4795–4810.
Ruellan, E., Huchon, P., Auzende, J., Gracia, E., 1994. Propagating rift and overlappingspreading center in the north Fiji basin. Mar. Geol. 116, 37–56.
Smith, D., Escartin, J., Cannat, M., Tolstoy, M., Fox, C., Bohnenstiehl, D., Bazin, S., 2003.Spatial and temporal distribution of seismicity along the northern Mid-AtlanticRidge, (15 degrees–35 degrees N). J. Geophys. Res. 108.
Taylor, B., Zellmer, K., Martinez, F., Goodliffe, A., 1996. Sea-floor spreading in the Lauback-arc basin. Earth Planet. Sci. Lett. 144, 35–40.
Tiffin, D., 1993. Tectonic and structural features of the Pacific Indo-Australian plateboundary in the north Fiji–Lau basin regions, Southwest Pacific. Geo-Mar. Lett. 13,126–131.
Tolstoy, M., Cowen, J., Baker, E., Fornari, D., Rubin, K., Shank, T., Waldhauser, F.,Bohnenstiehl, D., Forsyth, D., Holmes, R., Love, B., Perfit, M., Weekly, R., Soule, S.,Glazer, B., 2006. A sea-floor spreading event captured by seismometers. Science314 (5807), 1920–1922.
Tolstoy, M., Waldhauser, F., Bohnenstiehl, D., Weekly, R., Kim, W., 2008. Seismicidentification of along-axis hydrothermal flow on the East Pacific Rise. Nature 451(7175), 181–U187.
Venzke, E., Wunderman, R.W., McClelland, L., Simkin, T., Luhr, J., Siebert, L., Mayberry,G., Sennert, S., 2010. Global Volcanism, 1968 to the Present, Global VolcanismProgram Digital Information Series. Smithsonian Institution. http://www.volcano.si.edu/. accessed.
Wetzel, L.R., Wiens, D.A., Kleinrock, M.C., 1993. Evidence from earthquakes forbookshelf faulting at large non-transform ridge offsets. Nature 362, 235–237.
Wiens, D.A., Shore, P.J., McGuire, J.J., Roth, E., 1995. The Southwest Pacific SeismicExperiment. IRIS Newslett. 14, 1–4.
Wilcock, W.S.D., Archer, S.D., Purdy, G.M., 2002. Microearthquakes on the Endeavoursegment of the Juan de Fuca Ridge. J. Geophys. Res. B Solid Earth 107.
Willeman, R., 2001. Criteria for evaluating alternative hypocentres, analysis paper. Int.Seismological Center.
Wilson, D., 1990. Kinematics of overlapping rift propagation with cyclic rift failure.Earth Planet. Sci. Lett. 96, 384–392.
Yang, Y., Forsyth, D., 2003. Improving epicentral and magnitude estimation ofearthquakes from T phases by considering the excitation function. BSSA 93,2106–2122.
Zellmer, K.E., Taylor, B., 2001. A three-plate kinematic model for Lau Basin opening.Geochem. Geophys. Geosys. 2.


![Erratum to “Thermodynamic equilibrium conditions for mass varying particle structures”[Phys. Lett. B 684 (2010) 96]](https://static.fdokumen.com/doc/165x107/634093fc874853545a0976bc/erratum-to-thermodynamic-equilibrium-conditions-for-mass-varying-particle-structuresphys.jpg)