Citizenship and recovery: two intertwined concepts for civic-recovery
Upload
independentCategory
view
0download
0
Prishtina, November 2014
Concepts of Citizenship among schools students in Kosovo
| Survey Report |

ConceptsofCitizenshipamongschoolsstudentsinKosovo
|SurveyReport|
Prishtina,November2014

2
Author of the report: Petrit Tahiri
Contributors to the data analysis and report writing
Shemsi Luta
Beatrice Bürgler
Kai Felkendorff
Hatixhe Ismajli
Bahtie Gërbeshi
Jehona Rrustemi
This report was prepared under the project "Concepts of Citizenship among school students in Kosovo" that is implemented by Kosovo Education Center (KEC) in cooperation with the University of Education in Zurich funded by the Swiss Agency for Development and Cooperation (SDC) in Kosovo. The content of this report is the sole responsibility of the author and in no circumstances may be attributed to implementing and donor organizations.

3
Table of contents
ACKNOWLEDGMENTS ...................................................................................... 5
1. INTRODUCTION .............................................................................................. 7
2. METHODOLOGY ............................................................................................ 10
3. DEMOGRAPHICS ............................................................................................ 11
4. KNOWLEDGE ON CITIZENSHIP .......................................................... 12
5. PARTICIPATION AND CIVIC ACTIVITIES ........................................ 17
6. BELIEFS, VALUES AND ATTITUDES ................................................... 28
6.1. Beliefs and perceptions for fundamental human rights and freedoms .. 29
6.2. Trust in institutions ....................................................................................... 31
6.3. Perceptions about symbols, cultural values and country ......................... 32
6.4. Perceptions about functioning of the political system, life opportunities
and chances, and preferences to live in Kosovo .............................................. 37
7. ROLE OF SCHOOLS ON EDC ................................................................... 41
8. RECOMMENDATIONS AND CONCLUSION .................................... 43

4

5
ACKNOWLEDGMENTS
This report was developed thanks to the contribution of numerous associates involved in the survey. Firstly, we express our gratitude to associates from the University of Education in Zurich (PHZH): Mrs. Beatrice Burgler and Mr. Kai Felkendorff for the project idea and entire coordination. Then, we express our gratitude to associates from the University of Prishtina - Faculty of Education, Mrs. Hatixhe Ismaili, Mrs. Bahtie Gërbeshi and Ms. Jehona Rrustemi for their contribution to this survey. Special thanks to Ms. Saranda Cana and Mr. Viktor Popović from the Swiss Agency for Development and Cooperation in Kosovo for their help and contribution to the implementation of the project. In particular we express our gratitude to the Swiss Agency for Development and Cooperation in Kosovo (SDC) for financial support to the project.
For the help and contribution in defining the sampling and methodology we hereby express our gratitude to Mr. Nait Vranezi and Mr. Yusuf Thaçi.
For the hard work performed in 171 schools we express our gratitude to surveyors: Mrs. Blerta Qela, Mr. Nebojsa Simic and Ms. Aleksandra Savić. Also, we express our gratitude to the Ministry of Education, Science and Technology, Municipal Education Departments, school principals who have helped throughout the process of data collection.
For overseeing the process of designing the database and data entry, we express our gratitude to Mr. Christian Schendera from Education University of Zurich (PHZH).
We highly appreciate Mr. Naim Kadolli and Mrs. Vlora Zenuni for data entry of 1,700 questionnaires in the database.
For assistance in data analysis and report writing, we express our gratitude to Mr. Shemsi Luta.
Ultimately we express our gratitude to the teachers and students for the valuable contribution they gave to this survey.
Petrit Tahiri
Project coordinator

6

7
1. INTRODUCTION Theories of social change have proven that technological, socio-political and economic developments lead to social change. Even in Kosovo, ever since the war, significant changes are ongoing in all spheres of life. Comprehensive reforms, often well adapted to regional and global changes, found their reflection in the education system. Education reforms which are being implemented at all levels, require new approaches and serious professional preparation. Changes and reforms in education are reflected in the New Curriculum Framework of Kosovo, in which among others is said: "Education in Kosovo aims at developing knowledge, skills, attitudes and values required by a democratic society. This enables young people to be active and responsible citizens, to constructively cope with differences and challenges and respect their own rights and the rights of others"1.
In societies in transition, focusing on Education for Democratic Citizenship (EDC) is of special significance because it represents change and social development processes, which affects the growth opportunities for active involvement of citizens in social processes.
Kosovo Curriculum Framework supports fundamental values of active citizenship, which are consistent with the goals of Education for Democratic Citizenship and education for human rights, as defined in the Council of Europe Charter on Education for Democratic Citizenship and Education for Human Rights2. These values do not just focus on providing students with knowledge and skills, but also empowering them to take action to protect and promote human rights, democracy and the rule of law.
The subject "Civic Education", which is taught at different levels of education, contributes to providing students with different knowledge in the field of Education for Democratic Citizenship. Contents of classes of the civic education subject affect cognitive, affective and psychomotor development of students and form the basic skills: critical thinking, creative thinking, problem solving, reasoning skills and moral reflections. Also, through this subject, students also build specific skills related to social behavior, which are: the skills
1 http://www.masht-gov.net/advCms/documents/Korniza_e_kurrikules11.pdf (10 November 2014) 2 http://www.coe.int/t/dg4/education/edc/Source/Charter/Charterpocket_EN.pdf (10 November 2014)

8
to actively participate in the classroom, to cooperate and work together, to communicate and debate, negotiate and to make compromises, intercultural skills, skills to prevent and resolve conflicts, to exercise personal rights without violating the rights of others, to take democratic responsibility, etc.
However, an important role in promoting Education for Democratic Citizenship has been played by various international agencies, universities, civil society organizations and other governmental and non-governmental mechanisms. Their contribution is mainly based on different projects aimed at promoting EDC through various activities in formal and informal education, awareness campaigns, training events, etc. Various projects and activities have contributed to raising awareness not only in educational community but also in the public at large regarding the role and significance of Education for Democratic Citizenship for the overall development of society. In this context, the project "Concepts of citizenship among school students in Kosovo" has been implemented in Kosovo since 2009. The project is implemented by Kosovo Education Center (KEC), University of Education in Zurich (PHZH) and some professors of the Faculty of Education from the University of Prishtina. The purpose of this survey project is the recognition and understanding of the perceptions of students about the basic concepts of citizenship. The first phase of the pilot survey was conducted during 2009 - 2010. During the pilot phase, the survey was conducted in four schools in the Municipality of Prishtina. The findings from this phase are summarized in a report3. The second phase of the project began in October 2011. The survey was conducted in 171 primary and lower secondary schools in Kosovo.
For survey purposes, the standardized questionnaire from the "International Civic and Citizenship Education Study"4 has been used, adapted to the needs of our survey. The survey included a total of 1,700 eighth grade students.
Report at hand is a summary of the main findings of the survey. Otherwise, we think that the amount of information and data that we have available are very relevant and useful and can be used for further studies.
The findings of the survey have been categorized in the four main areas: 1. Knowledge of citizenship; 2. Participation and civic activities; 3. The beliefs, values and attitudes, and 4. The role of schools with EDC. The report
3 http://kec-ks.org/dokumente.html 4 http://iccs.acer.edu.au/

9
concludes with some recommendations for relevant institutions and mechanisms.
Since the survey includes a large number of respondents/students, we consider that its findings are representative of all primary schools in Kosovo level. As such, they reflect the perceptions of students of all social, ethnic, religious, gender, etc.
Data analysis argues that the concepts of citizenship knowledge help students to support the social changes taking place in recent years in Kosovo.
We hope that findings of this survey will not only contribute to the development of democratic processes in school and society, but also the commitment of all stakeholders in the promotion of democratic values and principles. Also, we encourage all students and researchers to use the results of this survey for the publication of scientific papers related to Education for Democratic Citizenship and civic activism generally.

10
2. METHODOLOGY The survey was conducted through standardized questionnaires prepared by the "International Civic and Citizenship Education Study". Surveys were conducted with children aged 15 years, respectively eighth grade students. The survey was conducted in 34 municipalities of Kosovo in total 171 schools. The sample was made based on information from the Ministry of Education, Science and Technology on the number of eight graders during the school year 2012/2013. The selection of schools was done considering the geographical criteria, fair representation of rural and urban areas based on the census.
To ensure representation of more schools, it was decided that in each school to select an eighth grade classroom, while 10 students were selected per classroom to take part in the survey. Selection of classrooms was done based on the following criteria: first school, first classroom; second school, middle classroom; while the third school, the last classroom. This cycle was used in all schools involved.
Selection of students was done based on the classroom register, respecting the principle of random sampling and based on the selection criteria according to which the total number of students per class is divided by 10, thus students were selected based on results gained after division (e.g. in the classroom of 30 students, 30 is divided by 10, resulting to 3, which means that every third student has participated in the survey).
The survey was conducted during classes or after school hours. Questionnaires were distributed to all students selected to participate in the survey, providing enough time to complete them. Questionnaires were collected in the way to ensure anonymity.

11
3. DEMOGRAPHICS
The following data reflect the perceptions of 1,700 students who participated in the survey. Figure 1 shows the gender composition of participants in survey.
Figure 1. Gender structure of respondents
Figure 2 shows the participation of students in survey in spatial (zoning) context, i.e. the proportion of students from rural and urban areas.
Figure 2. Zonal distribution of the sample
To ensure community participation in this survey in proportion to the ethnic structure of Kosovo, we have also conducted survey in 20 schools in municipalities with mixed ethnic structure of the population (see Figure 3).
52.6
47.4
Female Male
49%51%
Urban Rural

12
Figure 3. Ethnic composition of respondents
4. KNOWLEDGE ON CITIZENSHIP
To see the perceptions of students and the level of knowledge on the concepts of citizenship, a series of questions were used in this survey within certain sections. Below we will present children's perceptions about these issues: state-religion relation; active citizenship; government responsibilities; views on politics and political stakeholders etc.
Regarding questions related to being a good/active citizen, students generally showed similar views. Responses to this section are presented in Figure 4.1 and Figure 4.2. However, it is worth noting that in cases where there was a major difference, we noted that the determining factor is ethnicity, gender and geography, e.g. the statement "Being patriotic and loyal to the country in which we live", note that the determining factor for the difference in response is ethnicity.
This session shows an interesting trend of responses. When asked how important it is to challenge the government's positions that are in contrary to the public interest, 38.9% said that it is very important, 41.7% said that is important, while 19.4% said that it is not important or not at all important.
87.0
7.41.4 2.0 1.6 .5
.010.020.030.040.050.060.070.080.090.0
100.0
Albanian Serbian Bosnian Turkish RAE Others

13
This shows that among these children, conformist views are on active citizenship.
Figure 4.1 The views of students to some conclusions on active citizenship
Figure 4.2 The views of students to some statements on active citizenship
To the statement "separation should exist between religion and the state", 56.5% answered with "Disagree" and "Strongly Disagree". Figure 5 shows
77.7
46.7
75.5 74.9
19.3
39.7
20.3 20.8
2.411.2
3.5 3.0.5 2.4 .8 1.2.0
10.0
20.0
30.0
40.0
50.0
60.0
70.0
80.0
90.0
Always obeying the law
Voting in every election
Working hard Learning about the country’s history
Very important Quite important Not very important Not important at all
56.8 56.8
71.1
38.935.9 34.5
22.8
41.7
6.2 7.5 4.6
15.3
1.1 1.3 1.5 4.1
.0
10.0
20.0
30.0
40.0
50.0
60.0
70.0
80.0
Serving in the army to protect the
country
Taking part in activities promoting
human rights
Being patriotic and loyal to the country that you are living in
Challenging a government position that violates public
interest
Very important Quite important Not very important Not important at all

14
students' responses based on gender criteria. It is obvious that women were more likely to deny this statement.
Figure 5. Separation should exist between religion and the state
The statement "an adult is a good citizen if participating in activities that benefit the local community" 17.6% of students responded with "less important" (15.1%) and "not important" (2.5%). In this case we found relatively strong ties between educational level of the parents of these students and the answers given, where we noticed that the higher the education level of the parents resulted with the lower percentage of students who given a negative response to this question.
Interesting answers were provided to the following statement "an adult is good citizen, if engaged in political discussions". The findings regarding this question suggest that 43.6% of students consider engaging in political discussions as one of the characteristics of a citizen good as "less important" (36.7%) and "not important" (6.9%). From further survey of the factors that may have influenced these results we found a significant correlation between the answers provided and the level of interest of the parents of these students in political and social issues. Thus, the intertwining of data we observed show that the lower the interest of parents to political and social issues, the higher the percentage of students who have answered "less important" and "not important".
17.7%
23.9%
38.9%
19.5%19.6%
26.1%
36.8%
17.5%
.0%
10.0%
20.0%
30.0%
40.0%
50.0%
Strongly agree Agree Disagree Strongly disagree
Female Male

15
Regarding knowledge and perspectives of students about the responsibilities of government and views on politics, survey results show a relatively high level of knowledge. In order to have a more detailed and specific overview about the situation in this respect, below we present some statistics and detailed analysis, trying to highlight some factors and circumstances that may have influenced response from the surveyed students. Some of the major questions used for measuring the level of knowledge of students about the responsibilities of government and their political views are as follows:
Provide basic health care for all statement received most answers of "it should definitely be the government's responsibility" (72%) and "Maybe it should be the responsibility of the government" (20%). However, 8% of students involved in the survey, think that the provision of basic health care for all should not be the responsibility of the government.
Figure 6. Government should provide basic health care for all
Provide free basic education for all - out of 1,676 students who answered this question, 94% of them said that this should be the responsibility of government, which shows high knowledge on their part over this issue. However, 6% or 101 students think that the provision of basic education for all is not the responsibility of the government.
Regarding students' views about politics and political actors in Kosovo, the vast majority of them think that power is concentrated in a small number of
72%
20%
6% 2%Definitely should be the government’s responsibility
Probably should be the government’s responsibility
Probably should not be the government’s responsibility

16
people and politicians quickly forget the needs of the voters who voted them. So, for that matter, 81.4% of students who think that a small number of people have too much power, while the others have very little, (see Figure 7.1), and 88.2% of respondents said that politicians quickly forget the needs of the voters who voted them. (see Figure 7.2)
Figure 7.1 A small number of people have more political power in Kosovo, while others
very little
Figure 7.2 Politicians quickly forget the needs of the voters who voted them
43.2
38.2
14.4
4.3
.0 10.0 20.0 30.0 40.0 50.0
Strongly agree
Agree
Disagree
Strongly disagree
62.4
25.8
8.9
2.9
.0 10.0 20.0 30.0 40.0 50.0 60.0 70.0
Strongly agree
Agree
Disagree
Strongly disagree
17
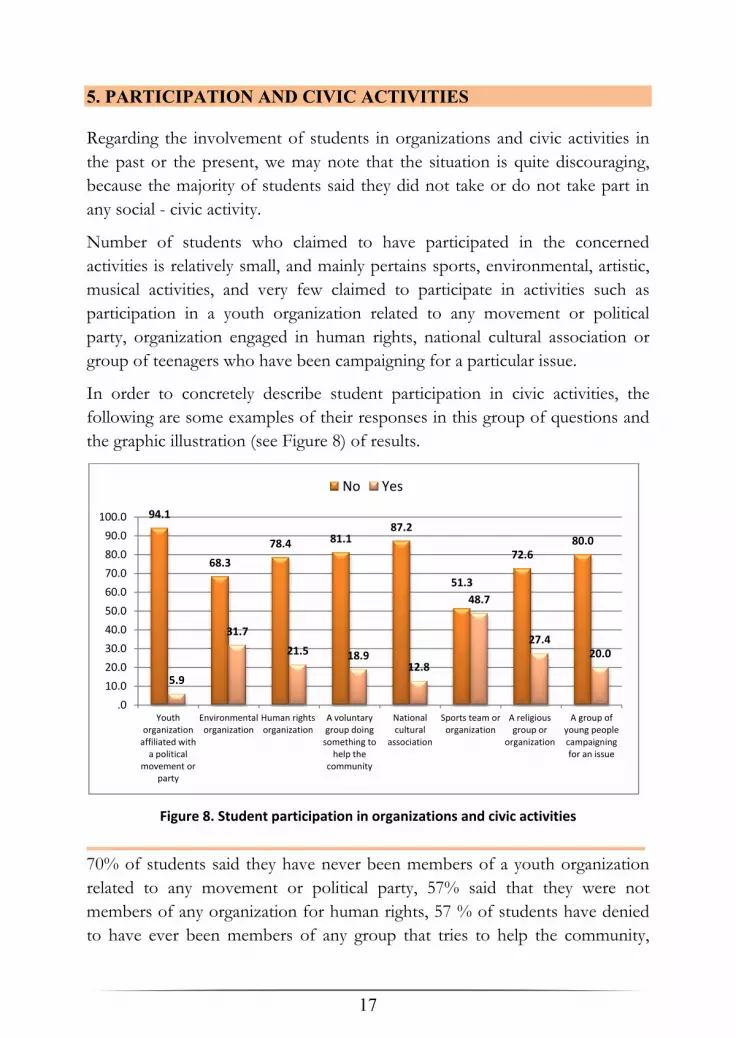
5. PARTICIPATION AND CIVIC ACTIVITIES Regarding the involvement of students in organizations and civic activities in the past or the present, we may note that the situation is quite discouraging, because the majority of students said they did not take or do not take part in any social - civic activity.
Number of students who claimed to have participated in the concerned activities is relatively small, and mainly pertains sports, environmental, artistic, musical activities, and very few claimed to participate in activities such as participation in a youth organization related to any movement or political party, organization engaged in human rights, national cultural association or group of teenagers who have been campaigning for a particular issue.
In order to concretely describe student participation in civic activities, the following are some examples of their responses in this group of questions and the graphic illustration (see Figure 8) of results.
Figure 8. Student participation in organizations and civic activities
70% of students said they have never been members of a youth organization related to any movement or political party, 57% said that they were not members of any organization for human rights, 57 % of students have denied to have ever been members of any group that tries to help the community,
94.1
68.3
78.4 81.187.2
51.3
72.680.0
5.9
31.7
21.5 18.912.8
48.7
27.420.0
.0
10.0
20.0
30.0
40.0
50.0
60.0
70.0
80.0
90.0
100.0
Youth organization
affiliated with a political
movement or party
Environmental organization
Human rights organization
A voluntary group doing
something to help the
community
National cultural
association
Sports team or organization
A religious group or
organization
A group of young people campaigning for an issue
No Yes

18
while 56% of them have stated that they have never ever been part of a group of young people campaigning for a particular issue.
From further analysis we see that most of those who have been engaged in various civic activities come from urban areas, where out of the 12 specific questions on organizations and groups that they have been part of, 11 are dominated by students from urban areas, except in a case that has to do with participation in group or religious organization where positive answers dominate from students from rural areas. Another significant correlation regarding the participation of students in different groups or organizations is found between the level of participation and gender, where in general we see a higher participation of male students, where out of the 12 questions, males have a higher percentage in 8 of them.
Figure 9. Student participation in organizations and civic activities
Organizations or groups with high percentage of participation of female students are groups/teams working on the school newspaper, environmental organizations, organizations and human rights, music, art or drama organizations.
95.6
%
92.6
%
78.0
%
81.2
%
66.1
%
70.6
%
77.2
%
80.1
%
82.6
%
79.6
%
59.3
%
69.5
%
75.8
%
69.3
%
81.5
%
78.3
%
4.4%
7.4%
22.0
%
18.8
%
33.9
%
29.4
%
22.7
%
19.9
%
17.4
%
20.4
%
40.7
%
30.5
%
24.2
%
30.7
%
18.5
%
21.7
%0%
10%
20%
30%
40%
50%
60%
70%
80%
90%
100%
Female Male Female Male Female Male Female Male Female Male Female Male Female Male Female Male
Youth organization
affiliated with a political
movement or party
Group/team working on the
school newsletter
Environmental organization
Human rights organization
A voluntary group doing
something to help the
community
Art, music or drama
organization
A religious group or
organization
A group of young people
campaigning for an issue
No Yes

19
While the question of how often do you participate in these activities, the vast majority responded that they participate in these activities several times a month and almost never, and only a relatively small number of them said that they participate in these activities regularly. Answers to this question were illustrated in Figure 10.
Figure 10. How often do you participate in these activities
Starting from the premise that a precondition for a man to participate in any activity is that he might be interested in it, analyzing the question of how much students are interested in politics, 50.6% of students responded to this question with 'fully agree' and 'partially agree'. In this case, we found a clear correlation between the answers to this question and the answers to the question whether their parents are interested in political and social issues, while statistics show that higher the percentage of those who said their parents are 'interested' and 'very much' interested in politics and social issues, the higher the percentage who said they 'partially' and 'fully agree' that they are interested in politics. Regarding gender composition in relation to these responses, the analysis shows that more male students are interested in politics than females.
8%
19%
39%
34%
Almost every day (4 or more days per week)…..
Some days (1 to 3 days per week)
Several times per month
Almost never

20
Figure 11. Are your parents interested in political and social issues?
In their responses about their interest to participate in discussions and activities about the problems of school, students have shown a willingness and relatively high interest, whereby statistical analysis indicate that on average 91.2% of students agree somewhat or completely with the statement that they are interested to participate in discussions that deal with school problems.
From the results of data analysis we understand that in most cases, about the events in domestic (Kosovo) and international politics, students more often discuss with their peers, and rarely with teachers and very rarely with parents. Figure 12 presents the level of participation of students in discussion about the events in Kosovo and international politics.
Father Mother Father Mother Father Mother Father Mother
Very interested Quite interested Not very interested Not interested at all
Are your parents interested in political and social issues?
26.8% 30.4%12.7% 17.5% 13.1% 13.4% 11.1% 12.0%
33.9%35.6%
39.4%43.8%
26.2% 30.8%17.8% 19.3%
17.8% 12.4%26.2%
23.5%
29.3%29.1%
24.4%28.6%
21.5% 21.6% 21.7% 15.2%31.4% 26.7%
46.7% 40.1%
Strongly agree Agree Disagree Strongly disagree

21
Figure 12. The level of participation in discussions about the events in Kosovo and international
Going deeper into the data analysis we found a clear relationship between students who responded with 'often' or 'always' discuss political events with parents or other adults in the family and those who have said that their parents are very concerned about political and social issues.
Also, a significant correlation was observed between students who said that they discuss political events with teachers and students who responded to 'fully agree' that they learned at school to discuss political issues. Also data analysis shows a strong correlation between students who said that they discuss more often political issues with peers and those who said they often spend their time sitting with peers after school or during evenings.
To measure the engagement level in civic life that these students are expected to have in the future, we used some questions that pertain to fundamental issues of civic behaviour. The following figure shows the results from the data collected through these questions in general and in particular for some specific questions.
25.2%38.2%
12.8%22.1% 29.1% 36.0%
34.2%
37.2%
27.4%
32.1%27.3%
29.8%
25.5%
17.2%
32.2%
29.0% 26.3%22.0%
10.4%4.7%
19.1%11.7% 12.3% 8.9%
4.7% 2.6%8.5% 5.1% 5.0% 3.2%
0%
10%
20%
30%
40%
50%
60%
70%
80%
90%
100%
National International National International National International
With people of your own age With parents or other adult family members
With teachers
Never Rarely Sometimes Often Always

22
Figure 13. Engagement in civic activities in the future
As one of the basic rights or duties of modern citizenship, the right to vote or civic duty of the free vote, in this case in voting for municipal elections, it is expected that in the future it will be used by the majority of surveyed students,
22.2
9.7
9.1
33.9
33.6
56.6
75.1
23.7
19.7
52.9
61.8
35.6
14.0
15.1
32.0
37.2
30.4
20.7
37.4
30.1
33.7
27.7
28.8
38.2
40.5
20.4
21.9
8.2
3.0
26.4
33.5
9.1
6.1
13.4
38.1
35.4
13.8
7.4
4.8
1.2
12.5
16.7
4.4
4.4
.0 10.0 20.0 30.0 40.0 50.0 60.0 70.0 80.0
Join an organization for a political or social cause
Occupy public buildings as a form of protest
Block traffic as a form of protest
Participate in a peaceful protest march or rally
Collect signatures for a petition
Collect money for a social cause
Volunteer time to help people in the community
Join a trade union
Join a political party
Vote in national elections
Vote in local elections
I will certainly not do this I will probably not do this
I will probably do this I will certainly do this

23
about 85,5% of them, but we have 10,5% of those who stated they will not vote. From a more detailed analysis we found a significant relationship between students who stated they will not vote in municipal elections and their ethnic background. Almost the same situation is observed with regard to the willingness of students to vote in national elections in the future, with the difference being that for this level there is a higher percentage of those who responded that they will not vote. Figure 14 shows percentage of students that would turn out in elections.
Figure 14. Level of willingness to vote in municipal and national elections, per ethnic background
In both cases, in relation to the question about municipal as well as national elections, we observe a relationship between the given responses and education level of students’ parents, where we find that students whose parents have a university degree constitute a lower percentage in responses that state that they
64.4%55.6%
38.7%28.2%
41.7%
30.4%
67.6%61.8%
16.7%16.7%
41.2%37.5%
66.7%66.7%
80.0%
25.0%
26.8%
33.1%
38.7%
43.5%16.7%
17.4%
20.6%32.4%
33.3%33.3%
35.3%
25.0%
33.3%33.3%
20.0%
50.0%
5.2% 7.6%
15.3%24.2%
12.5%
21.7%
5.9%2.9%
16.7%
17.6%
18.8%
3.6% 3.7% 7.3% 4.0%
29.2%30.4%
5.9% 2.9%
50.0%
33.3%
5.9%
18.8%25.0%
0%
10%
20%
30%
40%
50%
60%
70%
80%
90%
100%
L N L N L N L N L N L N L N L N
Albanian Serbian Bosnian Turkish Gorani Roma Ashkali Egyptian
I will certainly do this I will probably do this I will probably not do this I will certainly not do this N = National L = Local

24
will not vote as compared to those whose parents have lower levels of education achievement.
Becoming a member in a political party: Out of 1665 students who answered this question 49,8% of them expressed ambitions that they will become members of political parties in the future. From data analysis and based on horizontal distribution of students we find that students of urban areas are less predisposed to become members of political parties than students of rural areas. Regarding gender aspect, we find that male students constitute a significantly higher percentage of those who expressed their interest to become members of political parties.
Figure 15. Level of interest to become a member of a political party, per area and gender
Join trade unions: From the statistical analysis we find an average willingness of students who are expected to join trade unions in the future, where we have 61,1% of students who responded that they certainly or likely will do so. Based on the comparison and tabulation of data we find that a higher percentage of those that responded positively to this question include students who had participated in various organisations before, which are related to a political party or movement, organizations that are engaged in human rights issues,
.0%
5.0%
10.0%
15.0%
20.0%
25.0%
30.0%
35.0%
40.0%
Urban Rural Female Male
19.7% 19.7%
15.0%
24.8%
31.2%29.0% 29.6% 30.6%31.3%
35.7% 36.5%
30.2%
17.8%15.6%
18.9%
14.4%
I will certainly do this I will probably do this I will probably not do this I will certainly not do this

25
voluntary groups that assist community, national cultural associations, youth groups that are engaged in campaigns for certain issues, etc.
Volunteer to assist people in my community: 95,8% of students responded that they would volunteer to assist people in their community. In this issue too, we find a strong relationship between students who responded positively and students who were members of various organisations and groups before that were engaged in political, social, human rights, etc., activities.
Raise funds for social issues: Here too, we find a high frequency of students who stated that they would raise funds for social issues, where 87,1% of students gave a positive response on the question. From data analysis we find a relationship between students who gave these responses and those that stated that they had participated in various groups and organisations engaged in political and social activities.
Collect signatures for a petition; For this civic activity, we have a less balanced level, where 70,8% of students stated that would do this, but there are also 29,2% of them who stated they would not do it. Among those who responded positively on this question, we find a relationship between students who in the past participated in voluntary groups that try to assist community.
Regarding using the right to protest and the way how these students would protest, we find that the willingness to protest for certain issues is average, therefore we don’t have a high percentage of those who would protest, even though those who expressed the will to protest constitute the majority of those who responded. Regarding the forms and methods students would select to protest, we find that they mainly prefer peaceful and civilized forms of protest, but we also have a number of those who stated that they would be willing to use more radical forms of protest. Figures below show in numbers the level of willingness of students to protest and forms of protest they would select.

26
Figure 16.1 Attend protests, marches or peaceful meetings
From data tabulations we find a slight relationship between students who stated that they would attend peaceful protests and those who had participated in groups or organisations that are engaged in political and social activities.
Figure 16.2 Block traffic as a sign of protest
33.8%43.2%
33.4% 38.1% 33.5% 36.3% 32.9% 35.6% 32.2% 39.9%
31.5%32.4%
31.3%33.5%
30.3%38.5%
31.1%34.1%
31.9%31.5%
20.7%17.6%
20.8%18.8%
21.6%14.6%
21.0% 17.2% 21.4%17.2%
14.0% 6.8% 14.5% 9.6% 14.5% 10.6% 14.9% 13.1% 14.4% 11.3%
0%
10%20%30%40%50%
60%70%80%90%
100%
No Yes No Yes No Yes No Yes No Yes
Youth organization affiliated with a
political movement or party
Human rights organization
A voluntary group doing something to
help the community
A religious group or organization
A group of young people
campaigning for an issue
Participate in a peaceful protest march or rally
I will certainly do this I will probably do this I will probably not do this I will certainly not do this
8.6%19.2%
8.9% 8.4% 8.3% 11.5% 7.8% 11.0% 7.9% 12.0%15.3%
17.8%
14.9% 17.2% 15.5% 15.0% 14.8% 16.9% 15.7% 15.0%
41.1%35.6%
40.6% 39.8% 40.5% 41.0% 41.5% 38.3% 40.7% 41.9%
34.9% 27.4% 35.7% 34.5% 35.8% 32.6% 35.8% 33.8% 35.8% 31.2%
0%10%20%30%40%50%60%70%80%90%
100%
No Yes No Yes No Yes No Yes No Yes
Youth organization affiliated with a
political movement or party
Human rights organization
A voluntary group doing something to
help the community
A religious group or organization
A group of young people
campaigning for an issue
Block traffic as a form of protest
I will certainly do this I will probably do this I will probably not do this I will certainly not do this

27
Figure 16.3 Occupy a public facility in sign of protest
Referring to students who stated that they would select more radical forms of protest such as blocking traffic or occupying a public facility in sign of protest, we find a stronger relationship between those who stated that they would do this and students who had participated before or participate currently in youth organisations related to a political party or movement. Regarding gender aspect, we observe this willingness more among male than female students.
9.2%22.2%
9.0% 9.4% 9.2% 9.5% 8.5% 11.6% 9.3% 9.1%
14.2%
11.1%
12.7% 17.7% 13.3% 16.3% 14.1% 13.1% 13.4% 15.2%
39.2%37.5%
39.2%36.6% 38.9% 38.0% 37.9% 41.4% 37.8%
43.5%
37.4%29.2%
39.1% 36.2% 38.6% 36.2% 39.6% 33.9% 39.6% 32.2%
0%
10%
20%
30%
40%
50%
60%
70%
80%
90%
100%
No Yes No Yes No Yes No Yes No Yes
Youth organization affiliated with a
political movement or party
Human rights organization
A voluntary group doing something to
help the community
A religious group or organization
A group of young people
campaigning for an issue
Occupy public buildings as a form of protest
I will certainly do this I will probably do this I will probably not do this I will certainly not do this

28
6. BELIEFS, VALUES AND ATTITUDES
In this section, our main focus as to understand what are the values students believe in, what are students’ perceptions on values of democracy and citizenship, what was the level of their interest for these values and what were their perceptions and attitudes for democracy and citizenship, equal rights in society, and their perceptions for the state and its institutions. Also, here, through data tabulation, we tried to find and present certain contexts that might be determining factors in provision of certain responses.
First, we will start with presentation of some research results on students’ religious background that participated in the study, which is an issue that is of great importance for students’ perceptions and attitudes on certain issues.
Figure 17. Religious background
In Figure 17, we see that 88% of students stated they are Muslims, 4% are Catholic, 7% Orthodox and 1% others. Regarding practicing of religion by students, we can state that a relatively high percentage of them said that they practice religion quite often. Here we observe that 25,3% practice religion at least once a week, while 39,7% say that they practice religion every day.
Considering that there is a high frequency of students who stated that they practice religion at least once a week or every day, we made a comparison and cross-tabulated data and we found that those who state that they practice
88%
4%7% 1%
Muslim
Catholic
Orthodox
Other

29
religion at least once a week or every day, the majority of them are from rural areas and are males. Meanwhile, female students make the majority of those who state that they practice religion every day. In Figure 18 we have presented the level of practicing religion by students in general and gender and area distribution in practicing religion.
Figure 18. Level of practicing religion by students, per area, gender and religious background
6.1. Beliefs and perceptions for fundamental human rights and freedoms
Research statistics and analyses show that students in general demonstrated high awareness on core issues related to human rights and freedoms and adequate perceptions about them, where in most cases we found a high percentage of those who demonstrated sufficient knowledge about these issues. But, in some cases and on some issues, there is a significant percentage of them which cannot be disregarded, who responded differently. While on one hand, on statements such as: everyone has the right to express his/her opinion freely; everyone must respect social and political rights; all children and
0%
10%
20%
30%
40%
50%
60%
70%
80%
90%
100%
Urban Rural Female Male Muslim Catholic Orthodox No religion
Area Gender Religion
7.0% 4.3% 6.6% 4.7% 5.5% 6.0%
100.0%
8.2%4.6%
6.9% 5.7% 5.9%18.1%
12.1%9.2%
11.3%10.0% 10.1%
3.1%
20.7%12.8%
11.8%11.9%
12.8% 11.0%
10.8%
31.9%25.9%
24.6%18.8% 32.4%
25.6%
32.3%
19.8%33.8%
45.5% 44.4%34.5%
42.0%53.8%
3.4%
Never Less than once a year At least once a year
At least once a month At least once a week Every day (daily)

30
youth must have free access to education; all citizens have the right to elect their political leaders freely; minimum wage must be guaranteed for all – there is a high percentage of those who stated that they agree with these statements, and the percentage of those who don’t agree with these statements is insignificant.
On the other hand, vast majority of students provided positive responses on issues dealing with politics and nepotism, independence of media from government control, monopoly over media, interethnic tolerance, citizens’ freedom to criticize government, independence of the judiciary from politics, etc., there is a significant percentage of those who provided other responses on these issues.
Figure 19. Beliefs and perceptions of students about fundamental rights and freedoms
Political leaders must not be allowed to offer jobs in government to their family members; As is seen in Figure 19, 68,7% of students stated that they agree with this statement, but on the other hand there were 31,3% of students
83.8
32.841.4
68.1 68.1 64.3
49.8 48.3 52.8 54.8
11.7
54.5
17.1
14.8
35.9
42.1
26.5 26.5 30.0
38.7 37.134.0 28.0
16.9
36.1
26.3
1.1
22.6
12.84.4 4.4 4.2
8.5 10.4 11.211.2
45.5
6.4
41.2
8.8 3.71.0 1.0 1.5
3.0 4.3 2.1 5.9
25.8
3.015.4
0%
10%
20%
30%
40%
50%
60%
70%
80%
90%
100%
Everyone should always have the right
to express their opinions
freely
Political leaders
should not be allowed to
give government jobs to their
family members
The media should be
independent from
government control
All children and youth
should have free access to
education
All children and youth
should have free access to
education
All ethnic groups living in a country should be tolerant
towards each other
Political parties should have rules to
support women to become political leaders
People should always be
free to criticize the government
publicly
Courts and judges should
not be influenced by
politicians
Newspapers should be
forbidden to publish
articles that might offend community
groups (ethnic,
religious, national groups)
Wealthy people should
have more influence on government than others
Political protest
should never be violent
Majority decisions
should always be respected, even if they
violate human rights
Strongly agree Agree Disagree Strongly disagree

31
who said that they don’t agree with it. From data cross-tabulations we observe that students from rural areas constitute a slightly higher percentage compared to those from urban areas on this issue.
Media must be independent from government control; 16,5% of surveyed students stated that they don’t agree with this statement.
No company or government must be allowed to have ownership over all country newspapers; Despite the fact that the vast majority responded to this question with “agree” and “fully agree” who constitute 79,1% of surveyed students, there are also 20,9% of them who disagree.
All children and youth must have free access to education; On this issue, 94,6% of students responded that they agree or fully agree, while those who disagree or fully disagree are 5,4%.
People must always be free to publicly criticize government; In this case too 85,4% of students stated that they agree that people must be free to criticize government publicly, but there are 14,6% of them who stated that they disagree.
Newspapers must be banned from publishing articles that might offend certain (ethnic, religious, national) communities; 82,9% of students agree that newspapers must be banned from publishing articles that might offend certain communities, while 17,1% disagree that publication of such articles must be banned.
6.2. Trust in institutions
When talking about trust in institutions, data analysis indicates that students’ perceptions and their trust in institutions are relatively high, where we observe that for each question about their trust on various institutions, the majority of the students responded that they trust them fully or at least partially. With exception of trust in political parties, where we have a lower percentage of those who expressed trust in them.
In this regard, we can state that schools enjoy most trust, then Kosovo Security Forces, KFOR, and Kosovo Police, while there is lower trust for political parties, press, radio and Kosovo’s Parliament.

32
Figure 20 shows the level of trust that certain institutions enjoy among these students.
Figure 20. Level of trust in institutions
6.3. Perceptions about symbols, cultural values and country
Generally speaking, students’ perceptions and assessments about symbols, cultural values and country are relatively high, considering that almost all
35.1
43.3
56.9
66.1
34.0
28.0
27.4
22.3
59.5
69.4
44.9
79.0
39.4
39.1
58.0
73.1
42.2
39.4
26.5
21.5
42.9
43.9
42.6
34.2
26.6
19.6
33.2
15.7
36.5
38.1
27.3
17.5
19.0
15.2
13.1
9.8
20.3
24.1
24.2
28.1
9.8
7.8
14.5
4.2
17.7
18.2
11.4
6.5
3.6
2.1
3.4
2.6
2.8
4.1
5.8
15.4
4.2
3.2
7.4
1.2
6.4
4.6
3.4
2.9
0% 20% 40% 60% 80% 100%
The national government in Prishtina
The municipal assembly or the municipality itself
Courts of justice
The police
Television
Radio
The printed press
Political parties
The United Nations
KFOR
EULEX
Schools
The Parliament of Kosovo
The people who live in Kosovo
The European Union
The Kosovo Security Force
Completely Quite a lot A little Not at all

33
questions pertaining to state symbols, cultural values and perceptions about the country (Kosovo) received responses through which students expressed positive perceptions and high assessments in general.
Thus, 97,3% of students agreed with the statement that Kosovo’s cultural heritage must be preserved, and 94,5% of them stated that they are proud they live in Kosovo.
Figure 21. Perceptions about symbols, cultural values and country
In questions that aimed to measure how important is Kosovo’s flag and anthem for students, what is their assessment whether to what extent the flag represents their community, what is the level of respect that Kosovo enjoys among students, we can state that we received relatively high agreement and
46.0
61.6
85.2
82.0
85.3
77.2
77.4
80.0
33.9
26.7
12.1
12.6
7.2
12.6
11.4
11.0
14.7
8.8
2.1
3.7
4.6
6.1
7.1
5.3
5.4
2.8
.6
1.7
2.8
4.1
4.0
3.8
.0 10.020.030.040.050.060.070.080.090.0
We should stop internationals from influencing Kosovo
We should always be alert and stop threats from other states to Kosovo’s political independence.
Kosovo cultural heritage should be preserved
I am proud to live in Kosovo
I have great respect for Kosovo
The national anthem of Kosovo is important to me
The flag of Kosovo represents my community
The flag of Kosovo is important to me
Strongly disagree Disagree Agree Strongly agree

34
assessments, since for almost all the questions there are about 90% of students who provided high assessments and demonstrated positive perceptions.
But, almost in each question related to the topics mentioned above, there is a percentage of students who expressed disagreement and negative perceptions about the flag, anthem and level of respect they have for Kosovo. (Figure 21)
From data cross-tabulation and analysis, we found a significant relationship among those who did not agree that Kosovo’s flag and anthem is important for them and who disagreed that they have respect for Kosovo with students who belong to ethnic minorities, and statistics show that students who provided such responses are at a higher rate from Serb ethnic background, and to a lesser degree those of Bosniak, Roma and Ashkali backgrounds.
Also from cross-tabulation of data and statistical analyses, we found a significant relationship between students who responded in that way and those who stated that they were not born in Kosovo. To present this in a visual and concrete form, below we show Figures that represent perceptions from students of various ethnic backgrounds on above-mentioned issues.
Figure 22.1. Perceptions about symbols, cultural values and country
88.6%
21.5%
62.5% 58.8%50.0%
31.3%
100.0% 100.0%
9.1%
43.8%
16.7% 26.5%33.3%
50.0%
1.5%
23.1%
16.7%11.8% 18.8%
.8%
11.6%4.2% 2.9%
16.7%
0%
10%
20%
30%
40%
50%
60%
70%
80%
90%
100%
Albanian Serbian Bosnian Turkish Gorani Roma Ashkali Egyptian
I am proud to live in Kosovo
Strongly agree Agree Disagree Strongly disagree

35
Figure 22.2. Perceptions about symbols, cultural values and country
Figure 22.3. Perceptions about symbols, cultural values and country
.0%
20.0%
40.0%
60.0%
80.0%
100.0%
Alb
ania
n
Serb
ian
Bosn
ian
Turk
ish
Gor
ani
Rom
a
Ash
kali
Egyp
tian
Kosovo cultural heritage should be preserved
90.8%
41.9%54.2% 58.8%
50.0% 52.9%
80.0% 75.0%
8.5%
37.9%
37.5%35.3% 50.0%
35.3%
.5%
15.3%
8.3% 2.9%5.9% 20.0% 25.0%
.1%4.8% 2.9% 5.9%
Strongly agree Agree Disagree Strongly disagree
0%
10%
20%
30%
40%
50%
60%
70%
80%
90%
100%
Albanian Serbian Bosnian Turkish Gorani Roma Ashkali Egyptian
I have great respect for Kosovo
93.4%
8.0%
54.2%
79.4%
50.0% 47.1%
80.0% 75.0%
5.1%
19.2%
29.2%
17.6%
33.3% 35.3%
20.0% 25.0%
.8%
44.8%
12.5%
2.9%
11.8%
.7%
28.0%
4.2%16.7%
5.9%
Strongly agree Agree Disagree Strongly disagree

36
Figure 22.4. Perceptions about symbols, cultural values and country
Figure 22.5. Perceptions about symbols, cultural values and country
87.2%
6.5%
58.3%
79.4%
50.0%
35.3%
100.0%
80.0%
10.0%
14.5%
25.0%
17.6%
33.3%
29.4%
20.0%
1.6%
41.9%
12.5%
2.9%
16.7%
35.3%
1.1%
37.1%
4.2%
0%
10%
20%
30%
40%
50%
60%
70%
80%
90%
100%
Albanian Serbian Bosnian Turkish Gorani Roma Ashkali Egyptian
The flag of Kosovo is important to me
Strongly agree Agree Disagree Strongly disagree
0%
10%
20%
30%
40%
50%
60%
70%
80%
90%
100%
Albanian Serbian Bosnian Turkish Gorani Roma Ashkali Egyptian
The flag of Kosovo represents my community
84.7%
10.5%
45.8%58.8%
50.0%41.2%
60.0%
100.0%
10.6%
9.7%
37.5%
38.2%
33.3%
5.9%
3.4%
45.2%
12.5%
2.9%16.7%
23.5%
40.0%
1.2%
34.7%
4.2%
29.4%
Strongly agree Agree Disagree Strongly disagree

37
6.4. Perceptions about functioning of the political system, life opportunities and chances, and preferences to live in Kosovo
Regarding perceptions on functioning of the political system in Kosovo, 69,1% of students agree that political system in Kosovo functions well, while 30,9% of them do not agree with this. Out of those who did not agree that political system in Kosovo functions well, we observe that a high percentage of them come from urban areas as opposed to rural areas. Also, responses to the statement are almost similar for both genders and almost among all students of all ethnic backgrounds. Figure 23 shows perceptions of students on functioning of political system in Kosovo, per area.
Figure 23. Political system in Kosovo functions well
When talking about students’ preferences to live in Kosovo or another country, we can state that preferences to live in Kosovo were not that high, since there were 34,5% of students who did not agree that they would prefer to live in Kosovo forever. Also, we have 24% of students who don’t agree that Kosovo in general is a good place to live. From data cross-tabulation we observe that student who think in this way, in a higher rate come from urban areas, ethnic distribution is similar, and there is higher rate of males. The following Figure 24 shows the situation described above.
.0%
5.0%
10.0%
15.0%
20.0%
25.0%
30.0%
35.0%
40.0%
45.0%
50.0%
Strongly agree
Agree Disagree Strongly disagree
17.8%
46.8%
26.8%
8.6%
23.8%
49.7%
21.3%
5.2%
Urban
Rural

38
Figure 24. Perspectives about living in Kosovo
Regarding perceptions of students on life opportunities and chances, analysed from general, gender or ethnic perspective, we found some results that are both interesting and challenging and to some extent contradictory. Thus, 95,8% of students included in the research agree that males and female must have equal opportunities to participate in the government, and 95,2% of students that responded agreed that males and females must have equal rights in every aspect, while gender distribution of these responses is almost the same among males and females. But, in other questions, such as: Females must stay out of politics; Males must have more rights to get jobs than females, when jobs are scarce; Males and females must be paid the same when they work in same jobs; Males are more qualified than females to be political leaders, there is a completely different situation, where 22,9% of students agreed that females must stay out of politics. What is even more interesting here, such a response was provided by 15,5% of female students.
16.2
%
13.9
%
12.4
%
17.9
%
37.0
%
46.8
%
41.3
%
42.3
%
21.5
%
17.1
%
18.0
% 20.7
%
35.3
%
32.9
% 35.6
%
32.8
%
35.0
% 38.5
%
39.8
%
33.6
%
17.8
%
12.9
%
14.5
%
16.2
%
27.3
% 30.5
%
29.9
%
27.8
%
9.9%
7.4% 8.
6%
8.7%
.0%
5.0%
10.0%
15.0%
20.0%
25.0%
30.0%
35.0%
40.0%
45.0%
50.0%
Urban Rural Female Male Urban Rural Female Male
Area Gender Area Gender
I would prefer to live permanently in another country
Generally speaking, Kosovo is a better country to live in than most other countries
Strongly agree Agree Disagree Strongly disagree

39
That male must have more rights to get jobs than females, when job openings are scarce, 42,2% of students fully or partially agreed. It is interesting that 34% of female students fully or partially agreed with the statement.
On whether males and females must be paid equally when they work in the same jobs, 3,5% of female students expressed full or partial disagreement.
Meanwhile, the perception that males are more qualified than females to be political leaders is shared by 50% of students included in the research, and 42,3% of female students agreed with the statement.
Figure 25.1. Equal opportunities
.0%
5.0%
10.0%
15.0%
20.0%
25.0%
30.0%
35.0%
40.0%
45.0%
50.0%
Female Male Urban Rural Female Male Urban Rural
Gender Area Gender Area
Women should stay out of politics Men are better qualified to be political leaders than women
6.5%
13.5
%
8.9% 10
.9%
17.5
%
31.4
%
24.2
%
24.3
%
9.0%
17.5
%
13.6
%
12.4
%
24.8
%
26.9
%
25.5
%
26.1
%
38.7
%
37.6
%
38.1
%
38.1
%
32.8
%
25.9
%
27.9
% 31.0
%
45.8
%
31.5
%
39.3
%
38.6
%
24.9
%
15.8
%
22.5
%
18.6
%
Strongly agree Agree Disagree Strongly disagree

40
Figure 25.2. Equal opportunities
From perspective of ethnic background, perceptions on life opportunities and chances for education, employment and political participation in Kosovo, we can state that they are quite positive.
All ethnic groups must have equal opportunities for good education in Kosovo; 97% of students expressed full or partial agreement with this, while 3% stated that they don’t agree. Here it was interesting to observe that disagreement with this statement was expressed by 18,7% of students of Serb ethnic background, 8,3% of students of Bosniak ethnic background, and 6,3% of students of Roma ethnic background, while percentage of Albanian students who didn’t agree with the statement is 1,6%.
All ethnic groups must have equal opportunities to find good jobs in Kosovo; on this issue, there is a high level of agreement, where 96,2% of students responded that they agree with the statement. From 3,8% of those who didn’t agree, we observe a higher participation rate of students of Serb, Bosniak and Egyptian background.
14.2
% 27.4
%
19.1
%
22.0
%
86.5
%
75.9
%
81.5
%
81.4
%
19.8
%
23.3
%
21.2
%
22.0
%
9.9% 15
.2%
12.8
%
12.3
%
28.7
%
28.8
%
28.9
%
28.5
%
2.4% 6.
4%
3.8%
4.7%
37.4
%
20.5
% 30.8
%
27.5
%
1.1% 2.6%
1.9%
1.7%
.0%
10.0%
20.0%
30.0%
40.0%
50.0%
60.0%
70.0%
80.0%
90.0%
100.0%
Female Male Urban Rural Female Male Urban Rural
Gender Area Gender Area
When there are not many jobs available, men should have more right to a job than women
Men and women should get equal pay when they are doing the same jobs
Strongly agree Agree Disagree Strongly disagree

41
7. ROLE OF SCHOOLS ON EDUCATION FOR DEMOCRATIC CITIZENSHIP
We understood best from research results that the role of schools on equipping students with knowledge, development of perceptions and encouraging civic engagement is large, where students’ responses on questions dealing with this issue made us understand that schools are institutions of vital importance for students’ civic education.
Through data analysis, we observe a very high percentage of students who stated that they learned the majority of their knowledge and basic civic education at school, and from the results we understand that schools have a decisive role on Education for Democratic Citizenship (EDC) and encouraging civic activism (see Figure 26).
Figure 26. Role of schools on EDC
Regarding teachers’ engagement for civic education of students, based on the results from the field data, we observe that a relatively high percentage of
76.8 75.383.7
57.471.5
63.0
78.3
19.2 19.413.5
33.1
20.524.9
16.2
3.2 4.1 2.17.4 5.9 8.6
4.0
.8 1.3 .7 2.2 2.1 3.5 1.5
0%
10%
20%
30%
40%
50%
60%
70%
80%
90%
100%
In school, I have learned to
understand people who
have different ideas
In school, I have learned that
children’s rights are guaranteed
by law
In school, I have learned to work
together in groups with
other students
In school, I have learned to
contribute to solve problems
in the community
In school, I have learned to be a
patriotic and loyal citizen of
my country
In school, I have learned that
religious tolerance is
very important
In school, I have learned about the traditions and culture of
my country
Strongly agree Agree Disagree Strongly disagree

42
students stated that teacher never or rarely encourage them to express their opinions or discuss various issues.
Also a high percentage of students stated that teachers never or rarely give them the opportunity to openly express their disagreement with their teachers.
Figure 27. Teachers’ role on EDC
All responses from the School and Curriculum session make us understand that the room dedicated to Education for Democratic Citizenship is not sufficient and is limited only to Civic Education course.
12.4
21.8
13.5 15.416.7
22.5
14.3
21.2
36.1
26.521.2
35.534.829.1
51.0
27.8
.0
10.0
20.0
30.0
40.0
50.0
60.0
Students are able to disagree openly with
their teachers
Teacher encourage students to make up
their own minds
Teachers encourage students to express their
opinions
Teachers encourage students to discuss the
issues with people having different opinions
Never Rarely Sometimes Often

43
8. RECOMMENDATIONS AND CONCLUSION
Based on research findings and results from data analysis, we understand that additional interventions and engagements are required in several fields by relevant stakeholders. In this context, our recommendations include the following:
1. Based on research findings and in line with goals of pre-university education in Kosovo (subparagraph 1.3 of the Curriculum Framework) and with “Society and environment” area of the Curriculum Framework. We recommend revision of curriculum and textbooks of “Civic Education” course and enriching it with new content. Also, we recommend enriching other courses and textbooks with content on Education for Democratic Citizenship.
2. In addition to revision and supplementing textbooks of Civic Education and other textbooks, there should be training for teachers, and organisation of other activities through which teachers will be encouraged to use alternative resources.
3. In addition to trainings for in-service teachers, we recommend that current or new programmes at the Faculty of Education include content that would contribute to equipping new teachers with sufficient knowledge about citizenship concepts in general and Education for Democratic Citizenship in particular.
4. Considering research results with regard to civic engagement of youth, we recommend to all relevant institutions to supplement the legal framework on recognition and incentivizing voluntary work. Also, we recommend to all relevant institutions and Civil Society Organisations to spread their activities for incentives and capacity building for civic activism in entire territory of Kosovo, and in rural areas in particular.
5. Considering the media role on information distribution and on informal education in general, we recommend that written as well as broadcast media pay more attention to promotion of active citizenship through various shows and stories of educative and civic nature.

44
6. Research of this nature that is conducted in various countries are
periodical, and we recommend to responsible institutions and donors that after a 5 year period (in 2017-2018) another cycle of this study takes place, whose data would provide information for the social progress in Kosovo through comparative method.
Lastly, we must state that through this research we understood differences and various and contradictory opinions on certain issues, and in the majority of cases, ethnic, gender or social background was the determinant of those differences. Therefore, given this, we ask for engagement and firmness that education in general and Education for Democratic Citizenship in particular are based on principles and methods that would assist in development of personality of students-citizens, who above all, will be educated to respect one another, respect human rights, express their opinion freely, to be participants in various social organisations, and engage for equality among people irrespective of their gender, political affiliation, social or religious background.

Funded by:Swiss Agency for Development and Cooperation (SDC) in Kosovo
Copyright © 2022 FDOKUMEN