
Computational Studies of Air-Mist Spray Cooling in ... - MDPI
27
energies Article Computational Studies of Air-Mist Spray Cooling in Continuous Casting Vitalis Anisiuba, Haibo Ma, Armin Silaen and Chenn Zhou * Citation: Anisiuba, V.; Ma, H.; Silaen, A.; Zhou, C. Computational Studies of Air-Mist Spray Cooling in Continuous Casting. Energies 2021, 14, 7339. https://doi.org/10.3390/ en14217339 Academic Editors: Eusebio Valero and Javier de Vicente Received: 12 October 2021 Accepted: 2 November 2021 Published: 4 November 2021 Publisher’s Note: MDPI stays neutral with regard to jurisdictional claims in published maps and institutional affil- iations. Copyright: © 2021 by the authors. Licensee MDPI, Basel, Switzerland. This article is an open access article distributed under the terms and conditions of the Creative Commons Attribution (CC BY) license (https:// creativecommons.org/licenses/by/ 4.0/). Center for Innovation through Visualization and Simulation (CIVS), Purdue University Northwest, Hammond, IN 46323, USA; [email protected] (V.A.); [email protected] (H.M.); [email protected] (A.S.) * Correspondence: [email protected] Abstract: Due to the significant reduction in water droplet size caused by the strong air-water interaction in the spray nozzle, air-mist spray is one of the promising technologies for achieving high-rate heat transfer. This study numerically analyzed air-mist spray produced by a flat-fan atomizer using three-dimensional computational fluid dynamics simulations, and a multivariable linear regression was used to develop a correlation to predict the heat transfer coefficient using the casting operating conditions such as air-pressure, water flow rate, casting speed, and standoff distance. A four-step simulation approach was used to simulate the air-mist spray cooling capturing the turbulence and mixing of the two fluids in the nozzle, droplet formation, droplet transport and impingement heat transfer. Validations were made on the droplet size and on the VOF-DPM model which were in good agreement with experimental results. A 33% increase in air pressure increases the lumped HTC by 3.09 ± 2.07% depending on the other casting parameters while an 85% increase in water flow rate reduces the lumped HTC by 4.61 ± 2.57%. For casting speed, a 6.5% decrease in casting speed results in a 1.78 ± 1.42% increase in the lumped HTC. The results from this study would provide useful information in the continuous casting operations and optimization. Keywords: air-mist spray; atomization; continuous casting; impingement cooling; heat transfer coefficient 1. Introduction Secondary cooling is critical in the continuous casting process, which was introduced in the late 1950s and is now used to produce more than 90% of the steel in the world [1,2]. In 2009, global crude steel production exceeded 1220 million tons, with continuously cast steel accounting for 92 percent of total output. [3] As a result, given that spray cooling is critical to this process, its importance in this, as well as many other applications in which it participates, is obvious. At around 1473 K (1200 ◦ C), a solidified shell in steel CC exits the mold or primary cooling system and enters a containment-spray cooling arrangement known as the secondary cooling system, which is made of closely spaced support rolls, between which nozzles are interspaced to achieve a spray cooling pattern that ensures the strand solidifies completely through its thickness before it reaches the system exit. Spray cooling accounts for approximately 60% of the heat extracted through the secondary cooling system of CC machines (i.e., direct spray impingement, roll contact, radiation, and convection to draining water) [4] but this contribution can be much larger in its upper zones [5,6]. In secondary cooling zones, the solidified shell is subjected to large temperature changes on its surface, which can result in complex phase transformation and residual stress inside the slab. As a result, uniform rapid heat removal from the slab is desired, while slab cracking and deformation are avoided. The mechanisms of spray cooling during the continuous casting process are complex, but certain fundamental phenomena, such as atomization of water droplets through spray nozzles, droplet wall impingement and heat transfer, and evaporation of water droplets during or after the impinging heat transfer, have Energies 2021, 14, 7339. https://doi.org/10.3390/en14217339 https://www.mdpi.com/journal/energies
-
Upload
khangminh22 -
Category
Documents
-
view
4 -
download
0
Transcript of Computational Studies of Air-Mist Spray Cooling in ... - MDPI
energies
Article
Computational Studies of Air-Mist Spray Cooling inContinuous Casting
Vitalis Anisiuba, Haibo Ma, Armin Silaen and Chenn Zhou *
Citation: Anisiuba, V.; Ma, H.; Silaen,
A.; Zhou, C. Computational Studies
of Air-Mist Spray Cooling in
Continuous Casting. Energies 2021, 14,
7339. https://doi.org/10.3390/
en14217339
Academic Editors: Eusebio Valero
and Javier de Vicente
Received: 12 October 2021
Accepted: 2 November 2021
Published: 4 November 2021
Publisher’s Note: MDPI stays neutral
with regard to jurisdictional claims in
published maps and institutional affil-
iations.
Copyright: © 2021 by the authors.
Licensee MDPI, Basel, Switzerland.
This article is an open access article
distributed under the terms and
conditions of the Creative Commons
Attribution (CC BY) license (https://
creativecommons.org/licenses/by/
4.0/).
Center for Innovation through Visualization and Simulation (CIVS), Purdue University Northwest,Hammond, IN 46323, USA; [email protected] (V.A.); [email protected] (H.M.); [email protected] (A.S.)* Correspondence: [email protected]
Abstract: Due to the significant reduction in water droplet size caused by the strong air-waterinteraction in the spray nozzle, air-mist spray is one of the promising technologies for achievinghigh-rate heat transfer. This study numerically analyzed air-mist spray produced by a flat-fanatomizer using three-dimensional computational fluid dynamics simulations, and a multivariablelinear regression was used to develop a correlation to predict the heat transfer coefficient usingthe casting operating conditions such as air-pressure, water flow rate, casting speed, and standoffdistance. A four-step simulation approach was used to simulate the air-mist spray cooling capturingthe turbulence and mixing of the two fluids in the nozzle, droplet formation, droplet transport andimpingement heat transfer. Validations were made on the droplet size and on the VOF-DPM modelwhich were in good agreement with experimental results. A 33% increase in air pressure increasesthe lumped HTC by 3.09 ± 2.07% depending on the other casting parameters while an 85% increasein water flow rate reduces the lumped HTC by 4.61 ± 2.57%. For casting speed, a 6.5% decreasein casting speed results in a 1.78 ± 1.42% increase in the lumped HTC. The results from this studywould provide useful information in the continuous casting operations and optimization.
Keywords: air-mist spray; atomization; continuous casting; impingement cooling; heat transfercoefficient
1. Introduction
Secondary cooling is critical in the continuous casting process, which was introducedin the late 1950s and is now used to produce more than 90% of the steel in the world [1,2].In 2009, global crude steel production exceeded 1220 million tons, with continuously caststeel accounting for 92 percent of total output. [3] As a result, given that spray cooling iscritical to this process, its importance in this, as well as many other applications in whichit participates, is obvious. At around 1473 K (1200 C), a solidified shell in steel CC exitsthe mold or primary cooling system and enters a containment-spray cooling arrangementknown as the secondary cooling system, which is made of closely spaced support rolls,between which nozzles are interspaced to achieve a spray cooling pattern that ensuresthe strand solidifies completely through its thickness before it reaches the system exit.Spray cooling accounts for approximately 60% of the heat extracted through the secondarycooling system of CC machines (i.e., direct spray impingement, roll contact, radiation, andconvection to draining water) [4] but this contribution can be much larger in its upperzones [5,6].
In secondary cooling zones, the solidified shell is subjected to large temperaturechanges on its surface, which can result in complex phase transformation and residualstress inside the slab. As a result, uniform rapid heat removal from the slab is desired,while slab cracking and deformation are avoided. The mechanisms of spray cooling duringthe continuous casting process are complex, but certain fundamental phenomena, such asatomization of water droplets through spray nozzles, droplet wall impingement and heattransfer, and evaporation of water droplets during or after the impinging heat transfer, have
Energies 2021, 14, 7339. https://doi.org/10.3390/en14217339 https://www.mdpi.com/journal/energies
Energies 2021, 14, 7339 2 of 27
been identified by researchers over the past decades. These topics are further subdividedinto two major categories: spray and impinging heat transfer. [7]. Many experimentalprocedures for measuring the heat transfer coefficient (HTC) across the slab surface as oneof the parameters to quantify heat transfer rate [8–12] have been developed. UnderstandingHTC distribution on slab surfaces is critical because it is a transitional parameter betweenspray cooling and solidification. The HTC can be viewed as the result of spray cooling,but it also serves as a predictor of liquid steel solidification. Understanding the HTCdistribution gives you a unique perspective on spray adjustment and slab quality control.However, measuring HTC directly on the slab surface is nearly impossible because theslab is constantly moving, has an average temperature of more than 1000 K, and theliquid steel inside the solid shell is dynamically solidifying [7]. HTC is also a localizedparameter whose value is affected by both spray characteristics and slab surface conditions,namely water flow rate, air pressure, standoff distance, nozzle to nozzle distance, andslab temperature [13]. As a result, a massive number of experiments would be required togenerate correlations for each type of nozzle at different operating conditions.
Many studies [14–18] on the air mist spray cooling process above the Leidenfrost tem-perature have been conducted to estimate the heat transfer coefficient, but they are frequentlyinapplicable to cooling situations that differ from the experimental conditions. A specificclass of heat transfer coefficient models assumes the heat transfer coefficient as a functionof the water flux w (L min−1 m−2), droplet diameter d (m), and jet velocity v. (m s−1),
h = f(d, v)wb (1)
Although it was reported in [15,16] that the jet velocity does not influence the spraycooling heat transfer significantly.
A steady state method based on induction heating was developed for measuringthe local heat flux q under practical air-mist cooling conditions, generated with differentpneumatic nozzles, and the following expression was obtained [19]:
− q = 0.307w0.319u0.317z,v T0.144
w d−0.03630 (2)
The author also developed a correlation to predict the heat transfer coefficient as:
h = 379.93w0.318u0.330z,v T−0.895
w d−0.02430 (3)
When the wall temperature Tw is between 723 K and 1453 K, which corresponds to thefilm boiling regime, it has been demonstrated that q increases with increasing drop velocity,water impact flux, slab surface temperature, and drop diameter, and that q decreases withdecreasing drop diameter [20]. The impacting droplets of water spray will only come intotouch with the surface for a brief amount of time during the film boiling regime; yet, theheat transfer that results is significant [21]. Convection in the layer of vapor beneath thedroplet-surface contact is one of the heat transfer mechanisms that occur at the contactpoint between the two droplets. The heat transmission from the surface of the drops isaccompanied by radiative heat transfer from the surface and convection heat transfer fromflowing air on the surfaces. Due to the droplet-surface interactions, the heat transfer is alsoinfluenced by the material characteristics and roughness of the surface. For steel surfaces,it was discovered in a study [22] that the surface heat flux maintains within the range of0.5 MW/m2 even when the film boiling regime is employed. The heat flux at the onsetof transition boiling regime, i.e., at the minimal film boiling heat flux, was also reportedin [23], and it was found to be in the range of 0.43 MW/m2 with a steel surface at 500 C asan initial temperature.
The key physics in dispersed multiphase flows are in the mass, momentum, andenergy coupling between the phases. In dispersed multiphase flows, the evolution ofthe interface between the phases is considered of secondary importance. Processes suchas droplet or bubble break-up and agglomeration do indeed alter the interface between
Energies 2021, 14, 7339 3 of 27
the phases. However, in the context of dispersed multiphase flows, one accounts for theinterface between the dispersed and carrier phases in terms of particle-size spectra withoutconsidering the detailed evolution of the interface [24]. Particle-laden turbulent flowscan be broadly categorized into dilute and dense regimes, depending on the dispersedphase volume fraction [25]. In dilute flows, the particle motion is primarily dominatedby the fluid drag and lift forces, and inter-particle collisions are negligible. On the otherhand, in dense flows the particle motion is controlled by collisions or continuous contact.The fractional volume occupied by the dispersed phase (Φv) and the mass loading (Φm),defined as the ratio of mass of the dispersed to carrier phase, are two critical parametersthat determine the level of interaction between the phases. When Φv and Φm are small, thedominant effect is that of the turbulent carrier flow on the dynamics of the dispersed phase(i.e., one-way coupled). When the mass of the dispersed phase is comparable with that ofthe carrier phase, the back influence of the dispersed phase on the carrier-phase dynamicscannot be ignored (i.e., two-way coupled). Finally, when Φv increases, interactions betweenparticles (such as collision, agglomeration, and break-up) become important, and thisregime is described as four-way coupled [26,27]. One of the key features of particledistribution in turbulent flows is the phenomenon of preferential accumulation [28–30]. Itis now well accepted that even in isotropic turbulence, particle distribution is not uniform.Heavier-than-fluid particles tend to accumulate in regions of high strain rate and avoidregions of intense vorticity. In contrast, lighter-than-fluid particles (or bubbles) tend tocongregate in vortical regions. Furthermore, when the particle Reynolds number increasesabove a few hundred, the effect of vortex shedding introduces a stochastic component tointerphase coupling.
The motion of inertial particle pairs can differ substantially depending upon whetherthe two particles have the same (monodisperse) or different (bidisperse) inertia. Thedispersion of spray drops in a gas is important in order to bring about efficient massand heat transfer between liquid and gas phases. Particle accelerations play a key rolein the relative motion of bidisperse particles and the authors in [31] found that reducingFroude number (Fr) leads to an enhancement of the accelerations but a suppression oftheir intermittency while for monodisperse case, decreasing the Fr leads to a uniformsuppression of the inertial particle relative velocities in all directions [32,33]. Particle inertiacan be characterized by the Stokes number, St = τp/τη, where τp is the particle responsetime, τη is the flow time scale, and can also be expressed as St = (1/18)[(ρp − ρf)/ρf ](d/η)2
where η is the kolmogorov scale, d is the particle diameter, єis the mean turbulent kineticenergy dissipation rate, ρp and ρf are the particle and fluid density. The effect of gravityon the flow can be characterized by the Froude number, Fr = aη/g = є3/4/(ν1/4g), whereaη = uη/τη is the Kolmogorov acceleration [31,32]. It has been found that bidispersityalone enhances the particle relative velocities, and these relative velocities are furtherenhanced by gravity [34–37]. For Stokes numbers St > 1, the effect of Reynolds number Rλ
on the accelerations is enhanced by gravity, since settling causes the particle accelerations tobe affected by a larger range of flow scales. Gravity not only leads to finite settling velocitiesfor inertial particles, but it also modifies the way the particles interact with the turbulentflow [29,38]. In the presence of gravity, the particles fall through the flow, and the timescaleof particle relative velocity is reduced compared to the case without gravity [33]. In theregime Fr << 1 and St ≥ O(1), gravity significantly enhances the particle displacement overthe time span due to the fast settling of the particles [31,34]. However, when |∆St| << 1,gravity suppresses the relative dispersion as the settling velocity contribution is small,and gravity suppresses the nonlocal contribution to the particle dynamics [31,34]. ForFr = ∞, increasing St monotonically decreases the particle accelerations due to the effect ofpreferential sampling, whereby the inertial particles avoid strongly vortical regions wherethere is rapid fluid acceleration, and due to the filtering effect, whereby with increasing St,the particles become sluggish and have a modulated response to the fluid accelerationsalong their trajectory [39,40]. DNS was used by [41] to study the dispersion of bidisperseparticles with and without gravity and found that the differential settling velocities of the
Energies 2021, 14, 7339 4 of 27
particles leads to faster relative dispersion of bidisperse particles as compared to thosedispersing in the absence of gravity.
Basically, air-water mist is a suspension of very small droplets of water in an air jetthat is created as a result of liquid shearing and then atomization caused by pressuredair jet impingement on the margin of the liquid opening. For quenching metal platesin research and development, air-atomized spray is becoming increasingly popular dueto its ability to extract more heat from the plate in a shorter period of time [42]. It ispossible for air-mist atomizers to shatter a liquid jet or sheet into ligaments and thendroplets by utilizing the kinetic energy of a flowing airstream [43]. Since the late 1970s,there has been a lot of discussion on air-mist heat extraction studies. When comparedto spray—hydraulic—nozzles, the wide range of cooling conditions [44,45], from mild tointense, as well as the low proclivity to clogging, have been underlined as advantagesof air-mist—pneumatic—nozzles. This is owing to the huge turndown ratio (the ratiobetween the minimum and maximum water flow) and the controllability of the air/watervolumetric ratios [21], both of which are important factors. Furthermore, it was assertedthat air-mist nozzles, rather than hydraulic nozzles, resulted in fewer longitudinal cracksthan hydraulic nozzles because they reduced changes in slab surface temperature [46]. Inexperiments with the same water flow rate, mist cooling was found to have a higher heattransfer coefficient than spray cooling [45,46], as would be expected given that mist coolinginvolves the application of a pressure that modifies the characteristics of water droplets,resulting in more intense mist cooling. Fine droplets are produced by air mist nozzles, andevaporation is the primary source of their cooling effect. This type of nozzle has a widerange of controllability, and the intensity of the cooling can be changed by varying theair and water pressures [47]. It is possible for them to deliver spray droplets within theirown generated gas flow fields at high velocities when compared to conventional hydraulicsystems. Furthermore, the drop size produced by them is often significantly smaller thanthat produced by basic hydraulic atomizers [48]. Air mist nozzles with flat jets, such as theone employed in this study, have been effectively used for secondary cooling purposes incontinuous steel casting production for more than fifteen years. [49,50] It has been reportedthat the heat transfer coefficient is directly proportional to both the droplet diameter and theinitial collision velocity, and that this is indicative of the significant relationship between theheat-transfer process and the droplet-deformation behavior during impact [51]. Accordingto consensus [51,52], the Weber number linked with the normal-collision velocity is themost accurate way to characterize the impact or deformation mode of the drops.
When air pressure is increased in the range of 200 to 400 kPa, it is hypothesized thatthe effect on heat extraction is due to the effect on the droplet size and velocity, with thehypothesis being that small droplets with high momentum are better suited to penetratethe vapor layer and reach the hot surface when compared to drops produced by hydraulicnozzles. However, the authors [53] asserted that the effect of air pressure decreased aswater impact flux increased, such that sprays and air-mists produced cooling results thatwere comparable; their study included water impact flux ranging from 0.68 to 2.72 L/m2sand included sprays and air-mists produced cooling results that were similar. On the otherhand, the researchers at [54] and [55] found that for a given water impact flow (in the rangeof 0.2 to 16 L/m2s), the heat transfer coefficient increases as the air nozzle pressure increases.In their study, the scientists found that increasing the air flow rate to the water flow rateratio results in finer and quicker droplets that contact the surface more quickly. It has beendiscovered in other studies [54,56–58] using air-mist nozzles that an increase in air pressureat a constant water flow rate causes an increase in boiling convection heat flux as a resultof changes in spray parameters; however, no correlations between these parameters andheat transfer coefficient have been established. It should be noted that the drop size andvelocity utilized to interpret the heat transfer results in the investigations [15,17,59] weremeasured in the absence of a hot surface and were therefore different from one another.A decrease in the volume (and number) of droplets with sufficient inertia was observedwith an increase in water flow rate while maintaining constant air pressure. The diameter
Energies 2021, 14, 7339 5 of 27
of the drops generated became larger and their velocities became smaller in general asthe water flow rate increased at constant air pressure. It was asserted that drops witha median diameter between 100 and 200 µm were ideal, and that drop diameter wasthe second most relevant mist parameter on heat extraction after water impact flux [54]following drop diameter. For efficient heat extraction, the authors asserted that largerdroplets would only partially evaporate and leave a large portion of liquid on the surface,whereas smaller drops would be unable to penetrate the vapor layer and reach the surface.They recommended a compromise between droplet diameter and droplet velocity in orderto achieve efficient heat extraction on the surface. When it comes to heat transfer aboveleidenfrost temperature, that is, when it comes to within the film boiling regime, it wasdiscovered in [56] that the parameter controlling heat transfer intensity was the kineticenergy of droplets, which was shown to be affected by air pressure. Furthermore, accordingto another study [18], heat transmission is regulated not only by water impact flow butalso by droplet diameter and droplet velocity, all of which are major factors.
Since the introduction of the continuous casting process, various enhancements havebeen made to the secondary cooling area of the furnace. Using computational fluiddynamics (CFD) to build an accurate model that correlates varying nozzle settings withthe heat transfer coefficient (HTC) over the surface of the slabs, the spray cooling controlwill be improved in the secondary cooling phase of the reactor. There are currently nomodels that can do this for air-mist spray cooling, and in order to obtain the correlation,the nozzles must be sent out for experimental testing, which can take several weeks tocomplete. If a model could produce the same results in a fraction of the time, this would bea huge breakthrough because it would reduce the amount of time spent waiting for theresults and eliminate the need to outsource the testing of the nozzles.
Some critical characteristics, such as casting speed and standoff distance, are notincluded in the correlations presented thus far. Changing the casting speed can changethe droplet residence time on the steel surface, resulting in an increase or decrease inthe amount of energy transferred [60]. A direct correlation between casting velocity andheat transfer coefficient was suggested [47], stating that the motion of the hot surfaceaffected the flow of liquid on it as well as the generation of vapor in front and behind theimpinging jet. However, no evidence for this claim was offered. Their conclusion wasthat the cooling intensity does not remain constant when the casting speed is changed.When CC is modelled for design or control purposes, they discovered that the velocity ofmotion of the cooled surface is still another variable that must be considered. Reducedorifice-to-surface distance (standoff distance) increased the magnitude of volumetric flux,which has been reported in comparative work between steel and aluminum [61]. Thishas been shown to hasten the onset of the rapid cooling stages of the quench while alsoimproving overall cooling efficacy. The investigation of the influence of nozzle-to-surfacedistance on heat transfer during spray cooling of brass and Inconel [62] revealed that asthe nozzle-to-surface distance increases, the heat transfer coefficient decreases more slowly,with the rate of decrease being determined mostly by the water flux of the spraying system.Therefore, it is required to construct a more thorough and general HTC correlation in orderto incorporate these events into the model.
One possibility is to use a numerical method to quantify HTC on the slab surfacein a localized area. CFD has developed into a strong tool and has achieved widespreadacceptance for its ability to solve complex fluid flow and heat transfer problems in areasonable amount of time, thanks to the advancements in high-performance comput-ing technology. Despite this, only a few good numerical models of spray cooling andsolidification during secondary cooling have been recorded, owing to the intricate physicalphenomena involved. Development of a complete numerical model that can be utilized toforecast spray pattern and associated heat transfer during the secondary cooling processis crucial [63].
A new methodology for numerically modeling air mist spray cooling and developingHTC correlation for continuous steel casting is proposed in this study. A four-step 3-D CFD
Energies 2021, 14, 7339 6 of 27
simulation approach is used to model droplet formation, transport, and impingement heattransfer with an air mist spray cooling. To create a database for HTC correlation, variouscasting conditions are simulated. To predict lumped HTC at different casting conditions, amultivariable regression analysis was used to generate a simple mathematical correlation.This would aid in dynamic control and parameter optimization for continuous casting.
2. Methodology
Since the densities and dynamic viscosities of the two fluids of concern, air and water,are 0.00123 and 0.0178, respectively, it is assumed that they are incompressible. For a varietyof reasons, a four-step simulation technique was adopted. It is first necessary to createa simulation of internal flow in the nozzle, in order to accurately depict the mixing andturbulence phenomena that occur between air and water within the nozzle. The sprayingsystem co. flat fan nozzle with a spray angle of 900 is employed in this simulation. For thisreason, a very tiny cell size is chosen to capture the majority of the phenomena occurringbetween the point of jet exit from the nozzle and the impingement and cooling of thesteel slab, which results in a very long computational time to run just once for the nozzle-to-surface distance. Furthermore, the VOF to DPM approach in ANYSYS (ANSYS Inc.,Pittsburgh, PA, USA) Fluent was tested by running the entire spray domain at once and wasfound to be successful in converting the liquid phase into droplets; however, the numberof droplets produced was very small and the computational time was too high, leading tothe use of an alternative method of droplets size distribution (Nukiyama-Tanasawa) [64] togenerate the droplets in STAR CCM+ (Siemens Digital Industries Software, Plano, TX, USA)CFD software to generate the droplets.
Illustration of the simulation approach and the most critical physics in the spraycooling process is shown in Figure 1. For modeling the development and breakup ofjets [65–68], the Eulerian-Eulerian technique has gained popularity numerically. As a resultof the tight interaction between the liquid jet and the surrounding air, this method canbe time-consuming and mathematically complex. When the region of interest is locatedfurther downstream, many scholars have chosen for the Eulerian-Lagrangian technique asan alternative strategy. When the primary and secondary breakups are ignored, the initialspray characteristics are defined at the breakup length, at which point the liquid jet hasentirely broken down into droplets [69]. Due to its lower processing cost when compared tothe Eulerian-Eulerian technique, the Eulerian-Lagrangian method is used. The entrainmentof air caused by the high-speed water spray is represented in the Eulerian frame, whereaswater droplets are considered as discrete phases and tracked in the Lagrangian frame,respectively.
2.1. Continuous Phase (Air)
The motion of the air phase was described in a Eulerian frame of reference accordingto the following equations.
Continuity equation:∂ρair
∂t+∇.·(ρairuair) = 0 (4)
where ρair is the air density, and uair is the air velocity.Momentum equation:
∂
∂t(ρairuair) +∇·
(ρairu
2air
)= −∇P +∇(µair∇·uair) + ρairg + Sair−drop (5)
where Sair-drop is the source-term coupling the momentum of the air with that of the dropsaccording to the following expression:
Si =π
6ρvcell∑
.η
(ρout
dropuouti
(dout
drop
)3)− ρin
dropuini
(din
drop
)3(6)
Energies 2021, 14, 7339 7 of 27
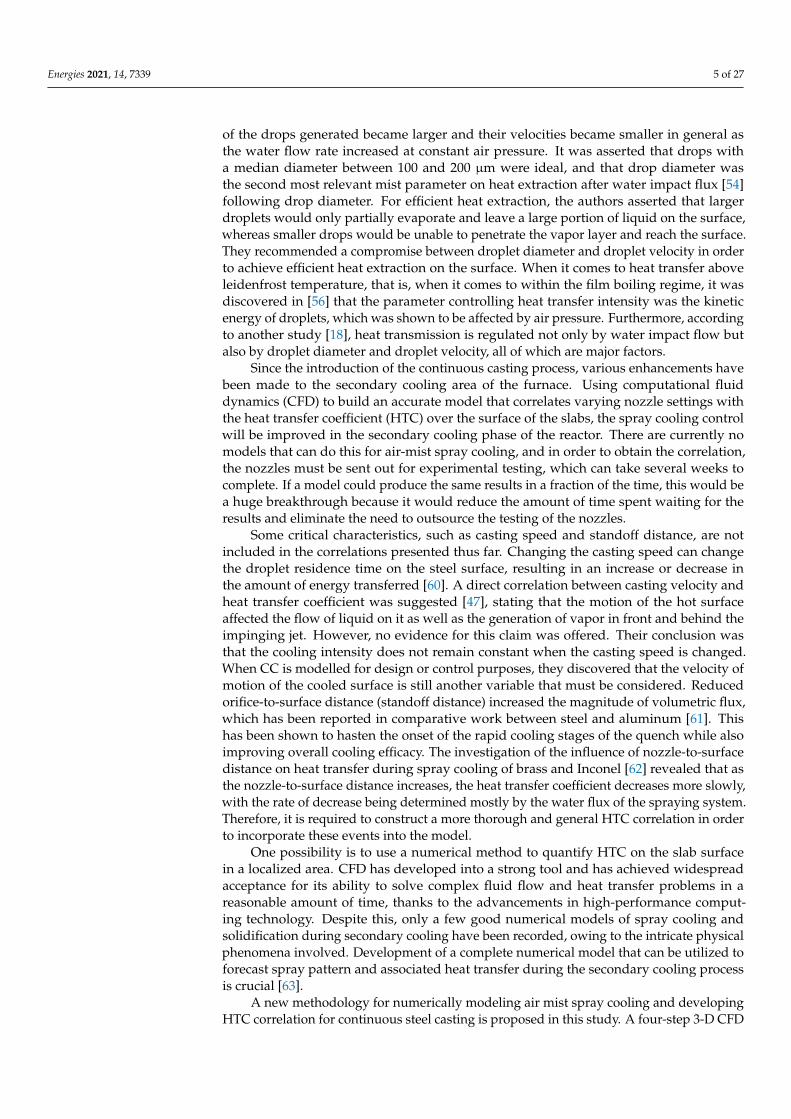
which establishes, according to the particle source in cell model [70], that the momentumtransferred between the air and the drops in a given cell of the fixed Eulerian grid is equalto the change in the momentum of all the drops, g, passing through it over the Langrangiantime-step.
Energies 2021, 14, x FOR PEER REVIEW 6 of 27
multivariable regression analysis was used to generate a simple mathematical correlation. This would aid in dynamic control and parameter optimization for continuous casting.
2. Methodology Since the densities and dynamic viscosities of the two fluids of concern, air and water,
are 0.00123 and 0.0178, respectively, it is assumed that they are incompressible. For a va-riety of reasons, a four-step simulation technique was adopted. It is first necessary to cre-ate a simulation of internal flow in the nozzle, in order to accurately depict the mixing and turbulence phenomena that occur between air and water within the nozzle. The spraying system co. flat fan nozzle with a spray angle of 900 is employed in this simulation. For this reason, a very tiny cell size is chosen to capture the majority of the phenomena occurring between the point of jet exit from the nozzle and the impingement and cooling of the steel slab, which results in a very long computational time to run just once for the nozzle-to-surface distance. Furthermore, the VOF to DPM approach in ANYSYS (ANSYS Inc., Pitts-burgh, PA, USA) Fluent was tested by running the entire spray domain at once and was found to be successful in converting the liquid phase into droplets; however, the number of droplets produced was very small and the computational time was too high, leading to the use of an alternative method of droplets size distribution (Nukiyama-Tanasawa) [64] to generate the droplets in STAR CCM+ (Siemens Digital Industries Software, Plano, TX, USA) CFD software to generate the droplets.
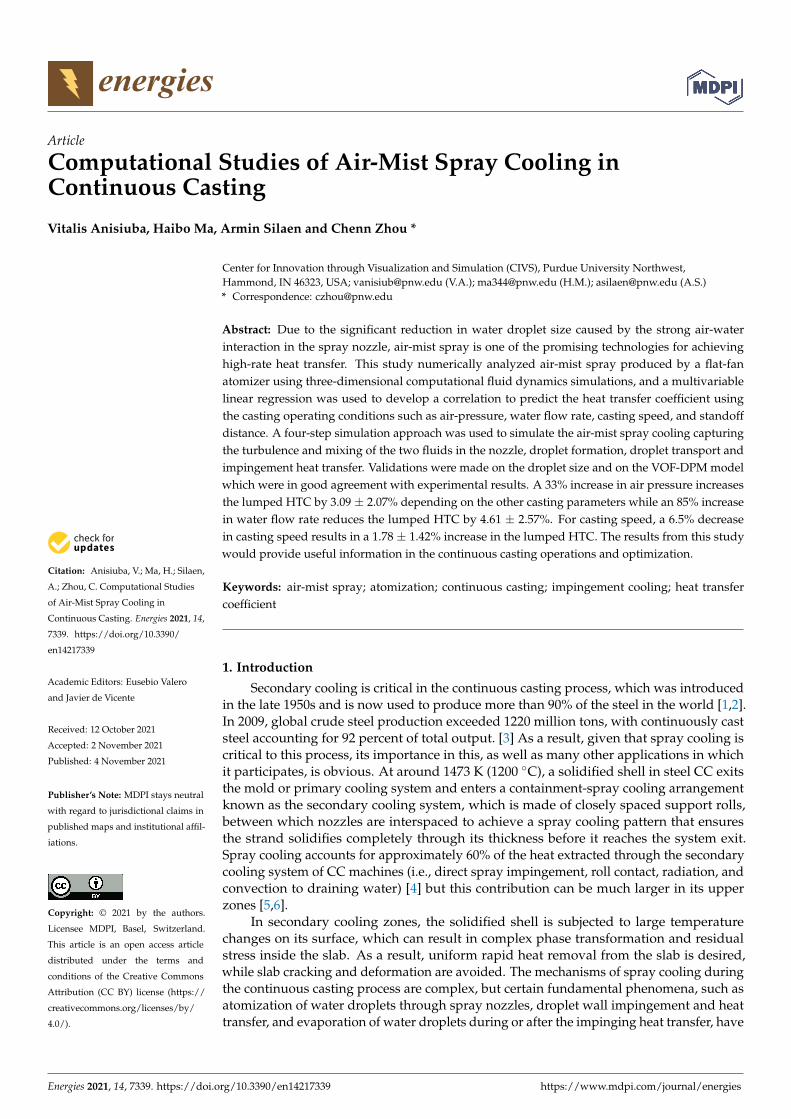
Illustration of the simulation approach and the most critical physics in the spray cooling process is shown in Figure 1. For modeling the development and breakup of jets [65–68], the Eulerian-Eulerian technique has gained popularity numerically. As a result of the tight inter-action between the liquid jet and the surrounding air, this method can be time-consuming and mathematically complex. When the region of interest is located further downstream, many scholars have chosen for the Eulerian-Lagrangian technique as an alternative strategy. When the primary and secondary breakups are ignored, the initial spray characteristics are defined at the breakup length, at which point the liquid jet has entirely broken down into droplets [69]. Due to its lower processing cost when compared to the Eulerian-Eulerian technique, the Eu-lerian-Lagrangian method is used. The entrainment of air caused by the high-speed water spray is represented in the Eulerian frame, whereas water droplets are considered as discrete phases and tracked in the Lagrangian frame, respectively.
Figure 1. Simulation methodology, physics and CFD models of spray cooling. http://www.spray-imaging.com/spray-description.html (accessed on 10 June 2021).
The majority of impinging jets used in industry produce turbulent flow as a result ofthe development of vortices along the sides of the jet, which is analogous to the Kelvin-Helmholtz instability. Accurately anticipating the presence of turbulence is extremelydifficult, and it is not always possible. In accordance with the extensive comparisons madeby [71], Menter’s Shear Stress Transport (SST) model [72] is one of the most suited turbu-lence models for predicting impinging jet flow in terms of accuracy while not requiringexcessive processing capacity. The SST model combines the k–ω model near the wall,which requires a finely spaced mesh near the wall to generate accurate results, and thek–e model farther from the wall in order to take advantage of the strengths of each modelin order to maximize the accuracy of the results.
2.2. Multiphase Flows
The precise identification of interface dynamics, which allows flow regimes to beestablished and associated inter-phase transfer processes to be quantified, is critical to thenumerical simulation of multiphase flows. This is the foundation of numerical simulationof multiphase flows. Interpenetrating-continua technique, also known as the two-fluidmethod [73], is used to describe phenomena occurring at the interface between separatingphases. Direct interface tracking methods, on the other hand, are used to directly mimictopology and dynamics of the interface [74]. (ITM). Each point in the mixture is occu-pied simultaneously (in variable proportions) by both phases in the averaged two-fluidformalism, therefore distinct conservation equations are required for each field in theformalism. For predicting specific kinds of multiphase flows, the volume of fluid (VOF)approach is one of the most often applied Eulerian-based ITMs [74–77], and it is shown tobe effective. The VOF approach relies on the definition of the liquid volume-fraction field
Energies 2021, 14, 7339 8 of 27
or the volumetric proportion occupied by one of the phases within volume V. This fluidproperty is conventionally denoted (in a discrete from) by Fij and defined by:
Fij =1
vcell Vχ(x, t)dV (7)
where χ is a composition field. Equation (7), therefore, represents the evolution of theliquid volume-fraction, identifying flow regions containing pure liquid (where Fij = 1) frompure gas flow regions (where Fij = 0). Interfacial cells are such that 0 < Fij < 1.
2.3. Atomization
To put it simply, atomization is the act of breaking up a continuous liquid into hun-dreds or thousands of droplets, resulting in an increase in the surface area of the liquid.Therefore, atomization improves the efficiency of all processes related with surface phe-nomena as a result of its effect on their efficiency. Droplets are created physically as aresult of two sequential breakup processes, namely, the breakup of the liquid sheet and thebreakage of the ligaments. This is determined by the hydrodynamics within the atomizerand the disintegration of the liquid sheet, and it is classically represented by the size andvelocity distributions of the droplets within the spray stream. Combined, the two breakupprocesses are referred to as primary breakup, as opposed to secondary breakup, in whichthe droplets formed as a result of the primary breakup process further break up into smallerdroplets as a result of aerodynamic instabilities or droplet-droplet collisions (see Figure 1).It is well-known that the main split is a well-studied process, and the relevant hypotheseshave been extensively tested in recent decades [78–82].
Depending on the operating flow conditions of the atomizer, the liquid jet is subjectedto various instabilities including capillary, helical, Kelvin–Helmholtz (KH) instability, etc.and different mechanisms of breakup of the liquid core and ligaments have been identifiedin the earlier works. Some researchers conducted experimental studies and proposedempirical correlations to evaluate the primary breakup length for air-blast nozzles [83–87].In this study, the breakup length was estimated as [83]:
LDl
= 0.66We−0.4g Re0.6
l (8)
2.4. Droplet Coalescence and Breakup
The droplet coalescence model is based on the O’Rourke method [88], which involvesstochastic collision estimation. The WAVE breakup model is used to account for dropletbreakup caused by the relative velocity between the droplet and the surrounding air.The model assumes that a droplet’s breakup time and resulting child droplet size aredetermined by the fastest-growing Kelvin-Helmholtz instability:
drparent
dt=
ΛΩ(rparent − rchild
)3.726B1rparent
(9)
2.5. Droplet Motion and Convective Heat Transfer
The Lagrangian method was used to model the motion of the drops. Their motionequation, which followed Newton’s law, took into account aerodynamic drag and gravityforce and was expressed as follows:
dudrop
dt=
3µdropCDRedrop
4ρdropd2drop
(uair − u drop
)+
g(ρdrop − ρair
)ρdrop
(10)
The air-droplet interaction is represented by the drag force term, and the dragcoefficient, CD, can be calculated using the piecewise function in [89]. Other aerodynamic
Energies 2021, 14, 7339 9 of 27
forces that could affect droplet motion (namely the pressure gradient, virtual mass, andthe Basset term) were ignored because they are on the order of the gas-droplet densityratio, [73], which is 10−3 in this case. Furthermore, the Saffman lift and Magnus forces wereignored because the drops are not in a high-shear region of the flow field for the majorityof the flow field; [73] this was justified because the motion of the drops in the vicinity ofthe impact plane was not analyzed in the current article. Droplet trajectories are computedseparately at specific intervals during the continuous phase iterations. The trajectory ofthe drops was computed from the change of their position-vector components with timeas follows:
dxdrop
dt= udrop (11)
Air-droplet interaction is modeled via the drag force term, which is added to themomentum equation of air as a source.
Droplet temperature changes during the spray cooling process are computed from thefollowing energy balance equation of a droplet:
mdropcpdTdrop
dt = πd2droph
(T∞ − Tdrop
)+
dmdropdt hfg + πd2
dropεdropσSB
(T4
R − T4drop
)(12)
The convective heat transfer coefficient h can be obtained by the Ranz-Marshallmodel [90]. The rate of droplet vaporization is governed by the concentration differencebetween the surface of droplet and the airstream, and the corresponding mass change rateof the droplet can be calculated from the following:
dmdrop
dt= πd2
dropkc(Cs −C∞) (13)
The coefficient kc in Equation (6) can be obtained from the Sherwood number correlationwith the similar form as Equation (8):
Shdrop =kcddrop
Dvapour= 2.0 + 0.6Re0.5
dropSc0.33 (14)
2.6. Droplet-Wall Impingement Model
The wall jet model developed by Naber and Reitz [91] considers three differentoutcomes, namely stick, reflect, and wall jet, depending on the properties of each individualincoming droplet. In the stick mode, after impingement, the droplet remains in contactwith the wall and continues to vaporize. The normal velocity component of a droplet ischanged to the opposite sign in the reflect mode, while the magnitude of both the normaland tangential velocity components remains constant. The model treats the impingementof a continuous stream of closely spaced droplets as an inviscid liquid jet emitted fromthe stagnation point on the solid surface in the wall jet mode. The analytical solutionfor an axisymmetric impingement uses the following empirical function for the liquid jetwith a height of H as a function of the angle at which the droplet leaves the horizontalimpingement:
H(Ψ) = Hπeβ(1− Ψπ ) (15)
The probability that a droplet leaves the impingement point at an angle between Ψand Ψ + ∆Ψ is given by integrating the expression for H(Ψ):
Ψ = −πβ
ln[1− P
(1− e−β
)](16)
Energies 2021, 14, 7339 10 of 27
The expression for β is given as:
sin(∅) =eβ − 1
(eβ − 1)(
1 +(πβ
)2) (17)
2.7. Impingement Heat Transfer Model
Although droplet is assumed to be spherical throughout its lifetime, droplets maydeform and remain in direct contact with the solid surface for a brief period of timefollowing an impingement. Based on pure heat conduction, the amount of heat exchangedbetween the droplet and the solid shell can be calculated as:
ddt
(mdropcpTdrop
)=
kdropAcond
sslab
(Tslab − Tdrop
)(18)
The expression in [51] is used to calculate the effective droplet-wall contact area, Acond.Throughout the continuous casting process, the slab temperature is higher than the Leiden-frost temperature [92]. Droplet vaporization is applied to predict the vaporization fromthe discrete phase droplet and is initiated when the temperature of the droplet reaches thevaporization temperature and continues until the droplet reaches the boiling point or untilthe droplets volatile fraction is completely consumed. Considering the high temperature ofthe slab, it is assumed that the vaporization rates would be high and so the effect of theconvective flow of the evaporating material from the droplet surface to the bult gas phasebecomes important. To this effect, the convective/diffusion-controlled model of [93,94]was used to model the droplet vaporization.
2.8. Slab Movement
In order to model the moving effect of the slab relative to the nozzle, two sets ofreference frames were used in the simulations: the stationary reference frame and themoving reference frame. The whole set of governing equations for air and droplets issolved with reference to the stationary reference frame, but the energy equation for theslab in the computational domain is defined with reference to the moving reference frame,as shown below:
∂∂t
(ρsteelhsteel +
|u|2rρsteel2
)+∇.
[ur
(ρsteelhsteel +
u2rρsteel
2
)]= ∇.
[ksteel∇T +
=τur
](19)
The relative velocity, ur b etween the two reference frames is defined as:
ur = ustationary − umoving (20)
2.9. Simulation Approach2.9.1. Section 1 (Internal Flow in the Nozzle)
In order to splat against the surface of a deflector, the water enters at an angle of90 degrees with respect to the air flow. Splashes are further separated and accelerated asthey travel along a mixing chamber toward the exit due to shear forces exerted by the airstream as they pass through it. In order to describe the internal flow in the nozzle, the VOFapproach was employed since it has a conservative formulation and allows for the directcalculation of a solution without discontinuities [74,95]. It is utilized as a marker function inthis method to determine how much secondary phase (liquid) is present. Since both phaseshave the same velocity field, the interface kinematic boundary condition is immediatelysatisfied. Through the use of a Dirac’s delta function, the normal stress jump condition ofsurface tension is introduced as a source term into the momentum equation [95]. The CSFmodel has been used to simulate the surface tension’s normal stress jump condition. In this
Energies 2021, 14, 7339 11 of 27
study, surface tension is viewed as a three-dimensional continuous influence across theinterface, rather than as a boundary condition at the interface.
Among the numerous schemes available in Fluent for face flow calculation in VOF,the Euler Implicit has been selected as the steady solution. It is important to note that thisapproach applies the same interpolation treatment to all cells, regardless of whether theycontain one or multiple phases. The term gravitational force has been introduced as a newsource term. It is possible to combine the Standard k-x formulation near the wall with amodified k-e model in the far field using the k- SST model [96]. In this case, the Reynoldsnumbers for the water entrance nozzle were computed as 14,425, and the k- SST was usedto calculate internal flow at both the inner and outer layers because it is more accurateand requires less computation time. Due to its approach, the model is valid throughoutthe near-wall zone as long as the mesh resolution is enough, and so no specific near-wallmodeling is necessary, which saves time and money. The mathematical model was solvedusing the commercial CFD code Fluent V.2020.R1, which is available for purchase online.The SIMPLE method [97] was employed to handle the pressure–velocity coupling problem.
2.9.2. Section 2 (Flow Development)
This entails developing the flow outside the nozzle and determining the liquid’sbreakup length, or the point at which droplets begin to form: the primary breakup of theliquid jet near the atomizer exit and the subsequent secondary breakup of the arbitraryshaped liquid ligaments, as well as the large droplets generated from the primary breakupfurther downstream. The primary phase of breakup occurs near the nozzle’s tip. Thecavitation bubbles formed inside the nozzle, in essence, cause primary breakup, forcingthe liquid to disintegrate into ligaments and large droplets. Using the empirical correlationfor air blast nozzle, the primary breakup length was estimated. In this case, the Reynoldsand Weber numbers were calculated at a fixed reference point near the nozzle outlet tip,and the corresponding empirical correlation was used to calculate the breakup length. TheVOF method was used to develop the flow from the nozzle outlet to the breakup length.
2.9.3. Section 3 (Droplets Generation)
At the primary breakup point, droplets begin to form. The droplets travel away fromthe nozzle, and the gas-liquid interface becomes unstable due to the velocity differenceat the shear layer of the liquid jet, to the point where viscous forces do not dampenthe instabilities. Secondary breakup occurs when the instability overcomes the surfacetension forces and disintegrates the liquid. The velocity profile at breakup length wasextracted and used as one of the injection data for the droplet distribution to generatethe droplets. The Nukiyama-Tanasawa (NT) droplet distribution method was used, andbecause it is not available in the ANSYS Fluent software, the STAR CCM+ software wasused. The VOF—DPM approach in ANSYS Fluent used an explicit solver with a time stepof 1 × 10⁻⁵s and 7.5 million cells in the mesh, resulting in a very long computation time ofabout sixty hours and yet could not produce sufficient droplets. The NT approach, on theother hand, used an implicit solver with a time step of 1 × 10⁻³ s and 0.25 million cells inthe mesh to generate a large number of droplets in less than an hour for the same conditionthat was used in ANSYS Fluent. According to the STAR CCM+ manual, the methodnecessitates some parameters for the NT equation. The droplet sauter mean diameterwas extracted from the nozzle catalogue for cool-cast nozzle [48] for each air pressure andwater flow rate and was used to estimate the input for the NT equation described in theliterature review section to generate the input data required for the droplet generationusing the NT droplet distribution. The best fit was provided by alpha and beta values of1.2 and 1.1, respectively. For the VOF-to-DPM transition model to be effective and produceaccurate results, mesh sensitivity study is necessary to produce accurate result. The cellsize used was different for each case since the droplet sizes differ at different air pressureor water flow rate. However, since the droplet sizes differ at different casting condition.The principle in [98] was applied in which the mesh size was chosen such that the DPM
Energies 2021, 14, 7339 12 of 27
volume fraction is less than 10%. The maximum droplet size from the droplets size datathat was estimated using N-T equation was used to estimate the cell size.
Spray cooling is accomplished through the use of a large number of droplets, each ofwhich is traced using the Langrangian method. In the current study, the effect of turbulencemodulation caused by interaction between spray drops and gas was modeled using themethod described by [99]. The WAVE model was used for secondary droplet breakupbecause it is designed for high-speed injections with weber numbers greater than 100.In this case, mass is accumulated from the parent drop at a rate determined by break uptime until the shed mass equals 5% of the initial parcel mass. At this point, a new parcelwith a new radius is created. With the exception of radius and velocity, the new parcel hasthe same properties as the parent parcel. The momentum of the parent parcel is adjustedso that momentum is conserved, and the new parcel is given a component of velocityrandomly selected in the plane orthogonal to the direction vector of the parent parcel. Themagnitude of the velocity of the new parcel is the same as the parent parcel.
2.9.4. Section 4 (Impingement and Cooling)
The input parameter was air and droplet data from Section 3’s outlet. The overall heattransfer is explained in [21] as having three different components. The droplet impingementwas simulated using the wall jet model, and the cooling of the steel slab was simulatedusing the boiling and evaporation model. The air jet is thought to thin the liquid film viashear forces, sweep away the vapor, and reduce the vapor partial pressure above the liquidfilm, thereby increasing evaporation [12].
Using the Section 3 results, an injection file was created. Fifty continuous phaseiterations were performed between two discrete phase iterations prior to impingement,while 300 continuous phase iterations were performed between two discrete phase iterationsfollowing droplet impingement on the slab surface. The discrete phase was simulatedwith particle radiation interaction, two-way coupling, stochastic collision, coalescence, andbreakup models. The software package used to run all the cases was ANSYS Fluent 2020R1,with each case taking approximately 48 h to converge using 128 processors.
3. Computational Domain and Boundary Conditions3.1. Nozzle Internal Region
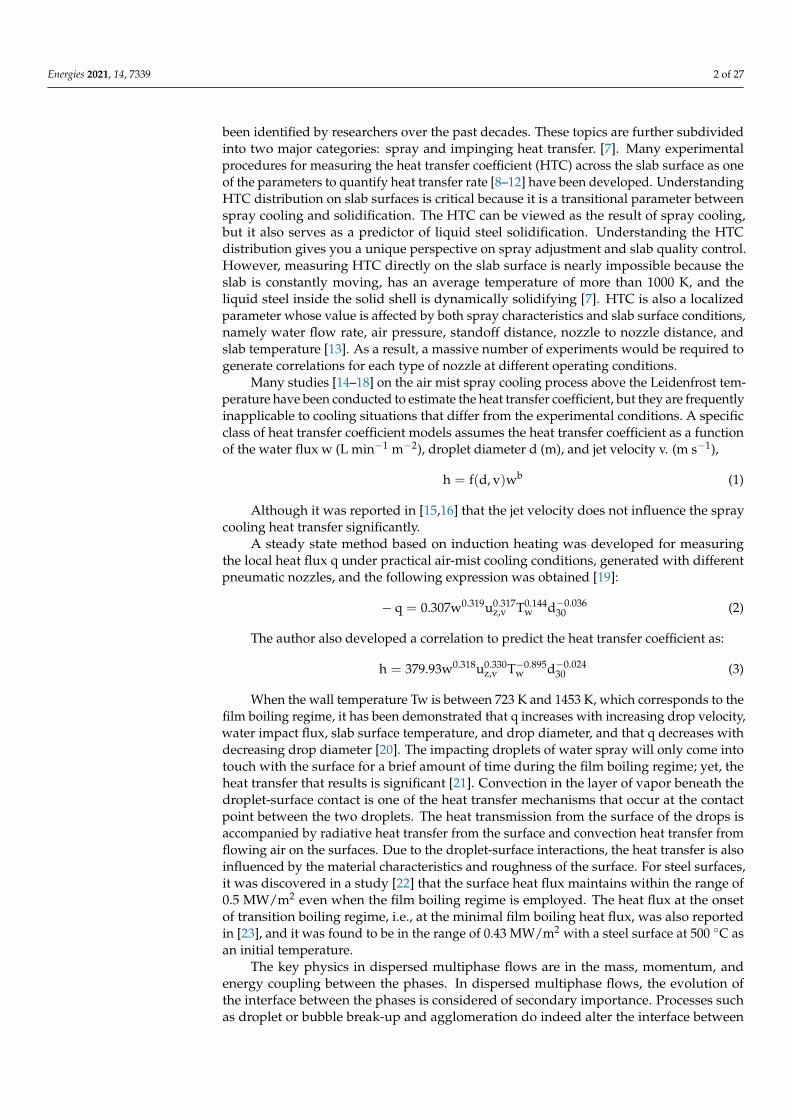
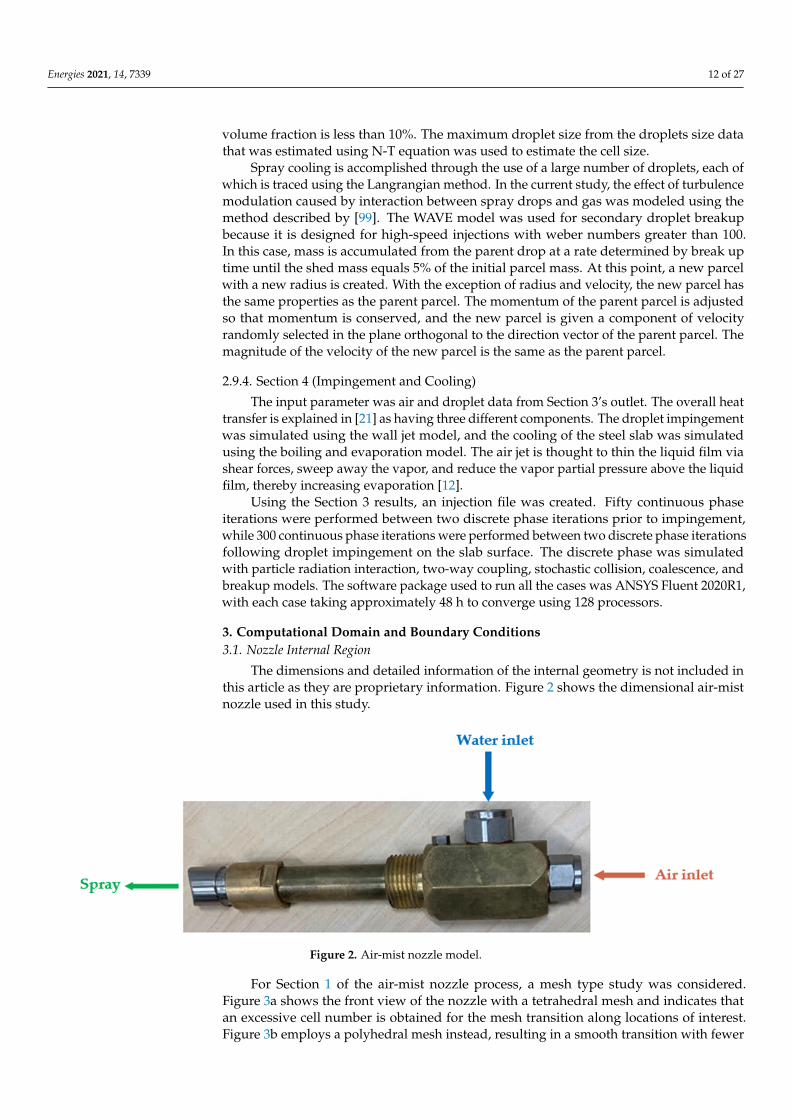
The dimensions and detailed information of the internal geometry is not included inthis article as they are proprietary information. Figure 2 shows the dimensional air-mistnozzle used in this study.
Energies 2021, 14, x FOR PEER REVIEW 12 of 27
that momentum is conserved, and the new parcel is given a component of velocity ran-domly selected in the plane orthogonal to the direction vector of the parent parcel. The magnitude of the velocity of the new parcel is the same as the parent parcel.
2.9.4. Section 4 (Impingement and Cooling) The input parameter was air and droplet data from Section 3’s outlet. The overall
heat transfer is explained in [21] as having three different components. The droplet im-pingement was simulated using the wall jet model, and the cooling of the steel slab was simulated using the boiling and evaporation model. The air jet is thought to thin the liquid film via shear forces, sweep away the vapor, and reduce the vapor partial pressure above the liquid film, thereby increasing evaporation [12].
Using the Section 3 results, an injection file was created. Fifty continuous phase iter-ations were performed between two discrete phase iterations prior to impingement, while 300 continuous phase iterations were performed between two discrete phase iterations following droplet impingement on the slab surface. The discrete phase was simulated with particle radiation interaction, two-way coupling, stochastic collision, coalescence, and breakup models. The software package used to run all the cases was ANSYS Fluent 2020R1, with each case taking approximately 48 h to converge using 128 processors.
3. Computational Domain and Boundary Conditions 3.1. Nozzle Internal Region
The dimensions and detailed information of the internal geometry is not included in this article as they are proprietary information. Figure 2 shows the dimensional air-mist nozzle used in this study.
Figure 2. Air-mist nozzle model.
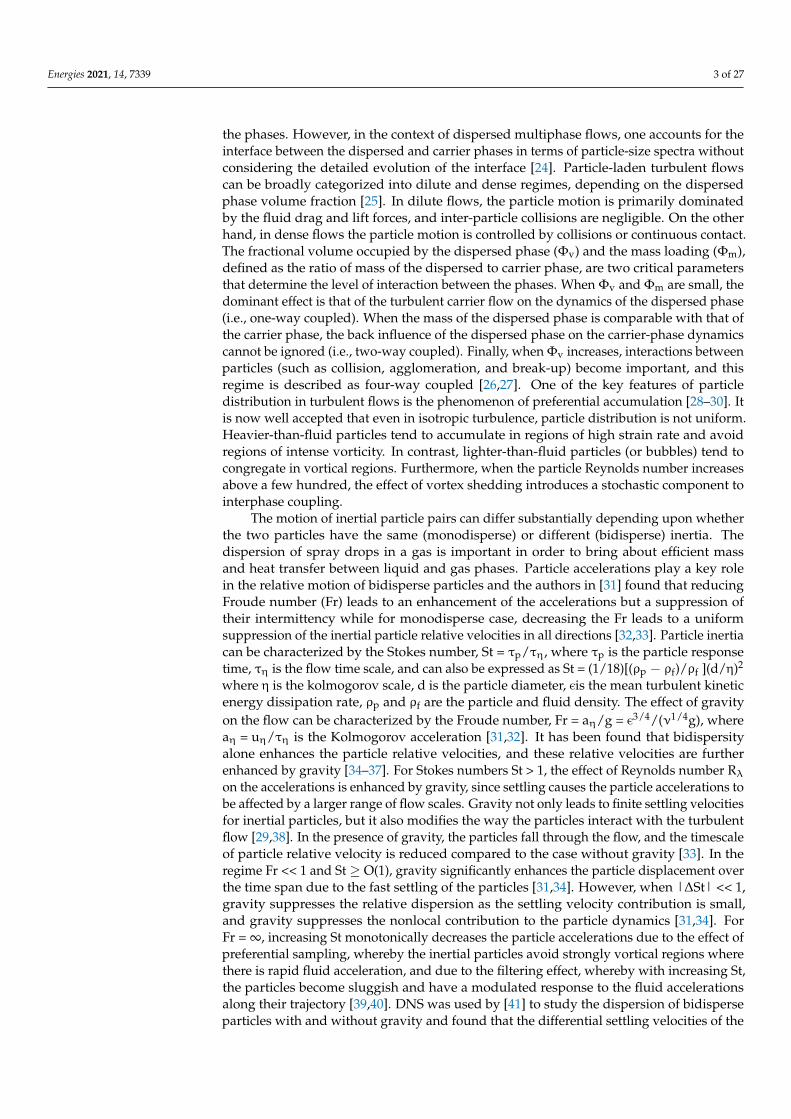
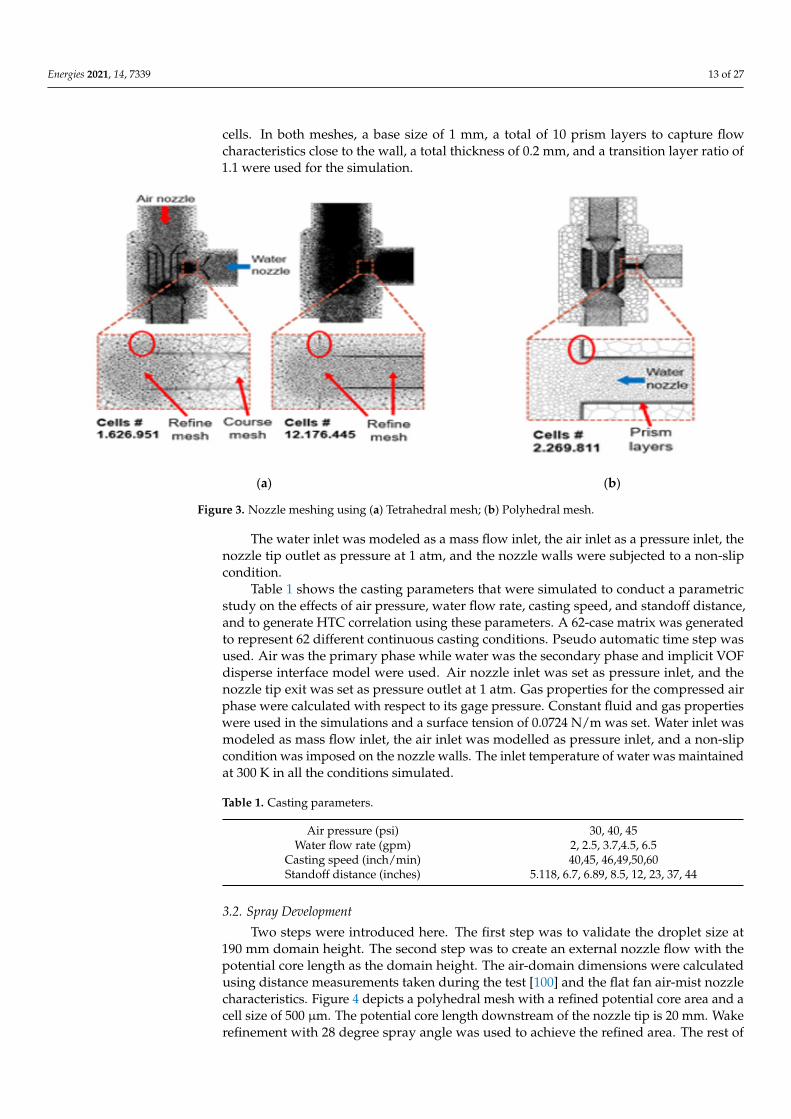
For Section 1 of the air-mist nozzle process, a mesh type study was considered. Figure 3a shows the front view of the nozzle with a tetrahedral mesh and indicates that an exces-sive cell number is obtained for the mesh transition along locations of interest. Figure 3b employs a polyhedral mesh instead, resulting in a smooth transition with fewer cells. In both meshes, a base size of 1 mm, a total of 10 prism layers to capture flow characteristics close to the wall, a total thickness of 0.2 mm, and a transition layer ratio of 1.1 were used for the simulation.
Figure 2. Air-mist nozzle model.
For Section 1 of the air-mist nozzle process, a mesh type study was considered.Figure 3a shows the front view of the nozzle with a tetrahedral mesh and indicates thatan excessive cell number is obtained for the mesh transition along locations of interest.Figure 3b employs a polyhedral mesh instead, resulting in a smooth transition with fewer
Energies 2021, 14, 7339 13 of 27
cells. In both meshes, a base size of 1 mm, a total of 10 prism layers to capture flowcharacteristics close to the wall, a total thickness of 0.2 mm, and a transition layer ratio of1.1 were used for the simulation.
Energies 2021, 14, x FOR PEER REVIEW 13 of 27
(a) (b)
Figure 3. Nozzle meshing using (a) Tetrahedral mesh; (b) Polyhedral mesh.
The water inlet was modeled as a mass flow inlet, the air inlet as a pressure inlet, the nozzle tip outlet as pressure at 1 atm, and the nozzle walls were subjected to a non-slip condition.
Table 1 shows the casting parameters that were simulated to conduct a parametric study on the effects of air pressure, water flow rate, casting speed, and standoff distance, and to generate HTC correlation using these parameters. A 62-case matrix was generated to represent 62 different continuous casting conditions. Pseudo automatic time step was used. Air was the primary phase while water was the secondary phase and implicit VOF disperse interface model were used. Air nozzle inlet was set as pressure inlet, and the nozzle tip exit was set as pressure outlet at 1 atm. Gas properties for the compressed air phase were calculated with respect to its gage pressure. Constant fluid and gas properties were used in the simulations and a surface tension of 0.0724 N/m was set. Water inlet was modeled as mass flow inlet, the air inlet was modelled as pressure inlet, and a non-slip condition was imposed on the nozzle walls. The inlet temperature of water was main-tained at 300 K in all the conditions simulated.
Table 1. Casting parameters.
Air pressure (psi) 30, 40, 45 Water flow rate (gpm) 2, 2.5, 3.7,4.5, 6.5
Casting speed (inch/min) 40,45, 46,49,50,60 Standoff distance (inches) 5.118, 6.7, 6.89, 8.5, 12, 23, 37, 44
3.2. Spray Development Two steps were introduced here. The first step was to validate the droplet size at 190
mm domain height. The second step was to create an external nozzle flow with the poten-tial core length as the domain height. The air-domain dimensions were calculated using distance measurements taken during the test [100] and the flat fan air-mist nozzle charac-teristics. Figure 4 depicts a polyhedral mesh with a refined potential core area and a cell size of 500 µm. The potential core length downstream of the nozzle tip is 20 mm. Wake refinement with 28 degree spray angle was used to achieve the refined area. The rest of cells size are 3 mm with growth factor of 1. The monitor plane is at 190 mm to replicate the condition in the measurement for validation of the droplet size.
Figure 3. Nozzle meshing using (a) Tetrahedral mesh; (b) Polyhedral mesh.
The water inlet was modeled as a mass flow inlet, the air inlet as a pressure inlet, thenozzle tip outlet as pressure at 1 atm, and the nozzle walls were subjected to a non-slipcondition.
Table 1 shows the casting parameters that were simulated to conduct a parametricstudy on the effects of air pressure, water flow rate, casting speed, and standoff distance,and to generate HTC correlation using these parameters. A 62-case matrix was generatedto represent 62 different continuous casting conditions. Pseudo automatic time step wasused. Air was the primary phase while water was the secondary phase and implicit VOFdisperse interface model were used. Air nozzle inlet was set as pressure inlet, and thenozzle tip exit was set as pressure outlet at 1 atm. Gas properties for the compressed airphase were calculated with respect to its gage pressure. Constant fluid and gas propertieswere used in the simulations and a surface tension of 0.0724 N/m was set. Water inlet wasmodeled as mass flow inlet, the air inlet was modelled as pressure inlet, and a non-slipcondition was imposed on the nozzle walls. The inlet temperature of water was maintainedat 300 K in all the conditions simulated.
Table 1. Casting parameters.
Air pressure (psi) 30, 40, 45Water flow rate (gpm) 2, 2.5, 3.7,4.5, 6.5
Casting speed (inch/min) 40,45, 46,49,50,60Standoff distance (inches) 5.118, 6.7, 6.89, 8.5, 12, 23, 37, 44
3.2. Spray Development
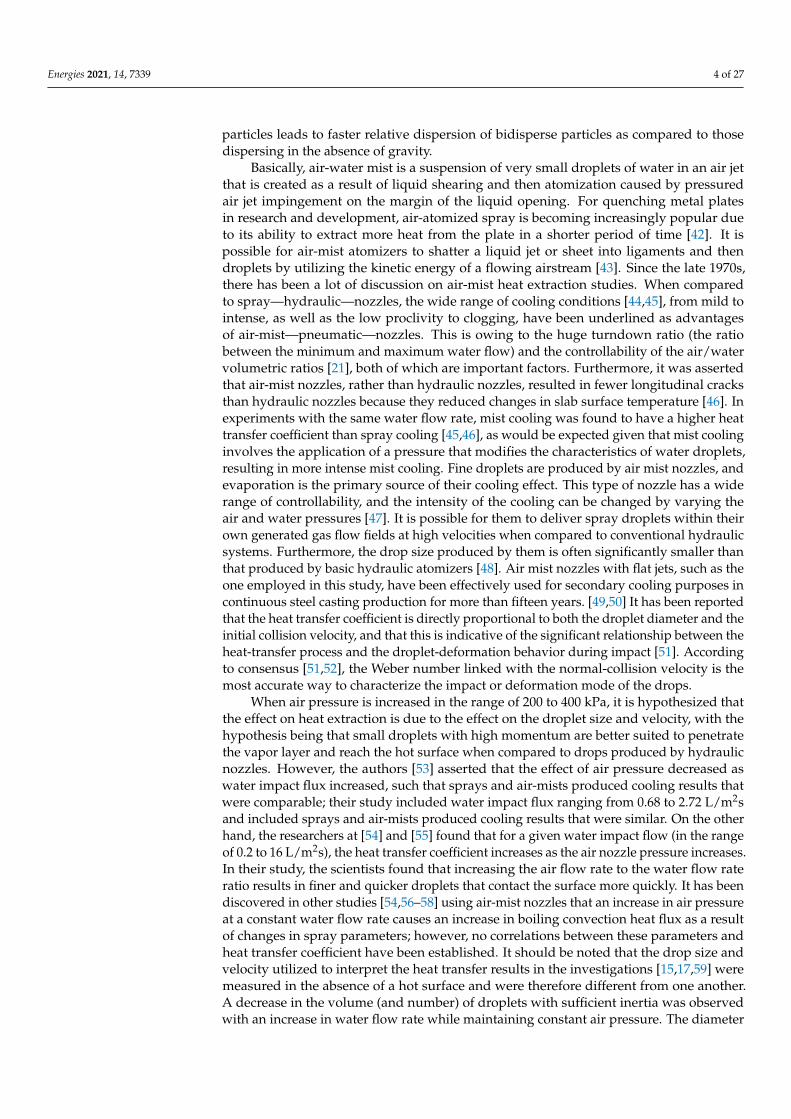
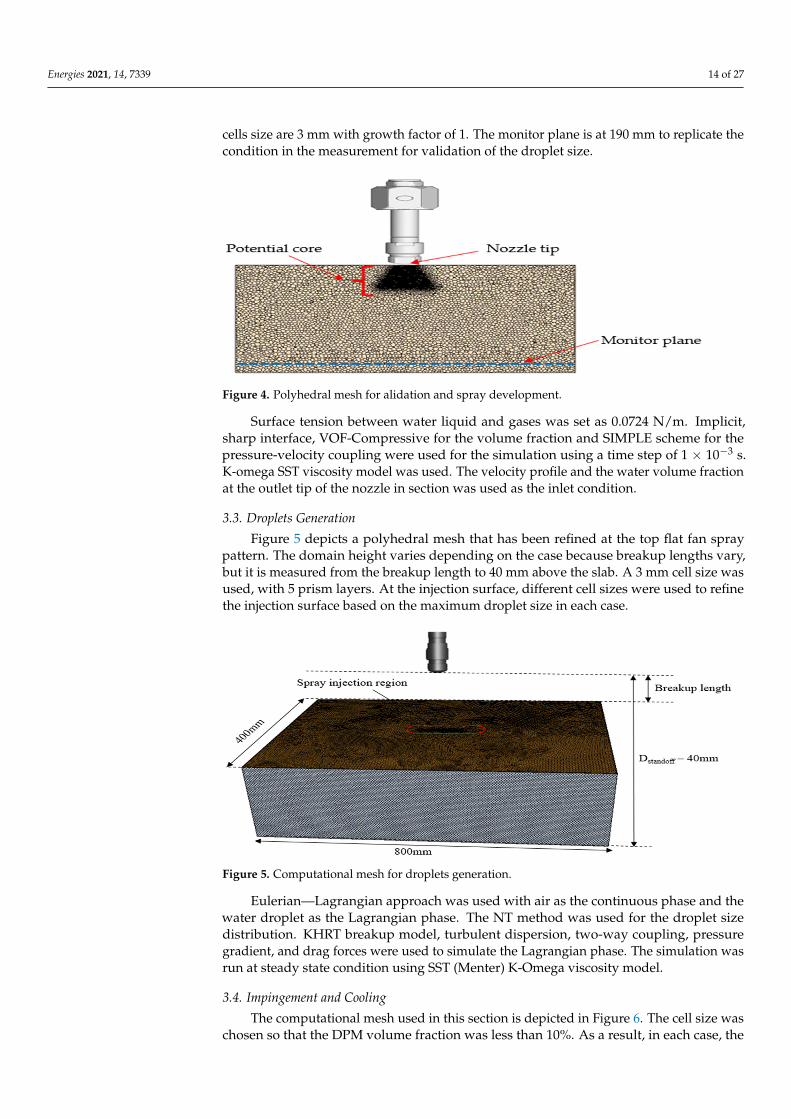
Two steps were introduced here. The first step was to validate the droplet size at190 mm domain height. The second step was to create an external nozzle flow with thepotential core length as the domain height. The air-domain dimensions were calculatedusing distance measurements taken during the test [100] and the flat fan air-mist nozzlecharacteristics. Figure 4 depicts a polyhedral mesh with a refined potential core area and acell size of 500 µm. The potential core length downstream of the nozzle tip is 20 mm. Wakerefinement with 28 degree spray angle was used to achieve the refined area. The rest of
Energies 2021, 14, 7339 14 of 27
cells size are 3 mm with growth factor of 1. The monitor plane is at 190 mm to replicate thecondition in the measurement for validation of the droplet size.
Energies 2021, 14, x FOR PEER REVIEW 14 of 27
Figure 4. Polyhedral mesh for alidation and spray development.
Surface tension between water liquid and gases was set as 0.0724 N/m. Implicit, sharp interface, VOF-Compressive for the volume fraction and SIMPLE scheme for the pressure-velocity coupling were used for the simulation using a time step of 1 × 10⁻³ s. K-omega SST viscosity model was used. The velocity profile and the water volume fraction at the outlet tip of the nozzle in section was used as the inlet condition.
3.3. Droplets Generation Figure 5 depicts a polyhedral mesh that has been refined at the top flat fan spray
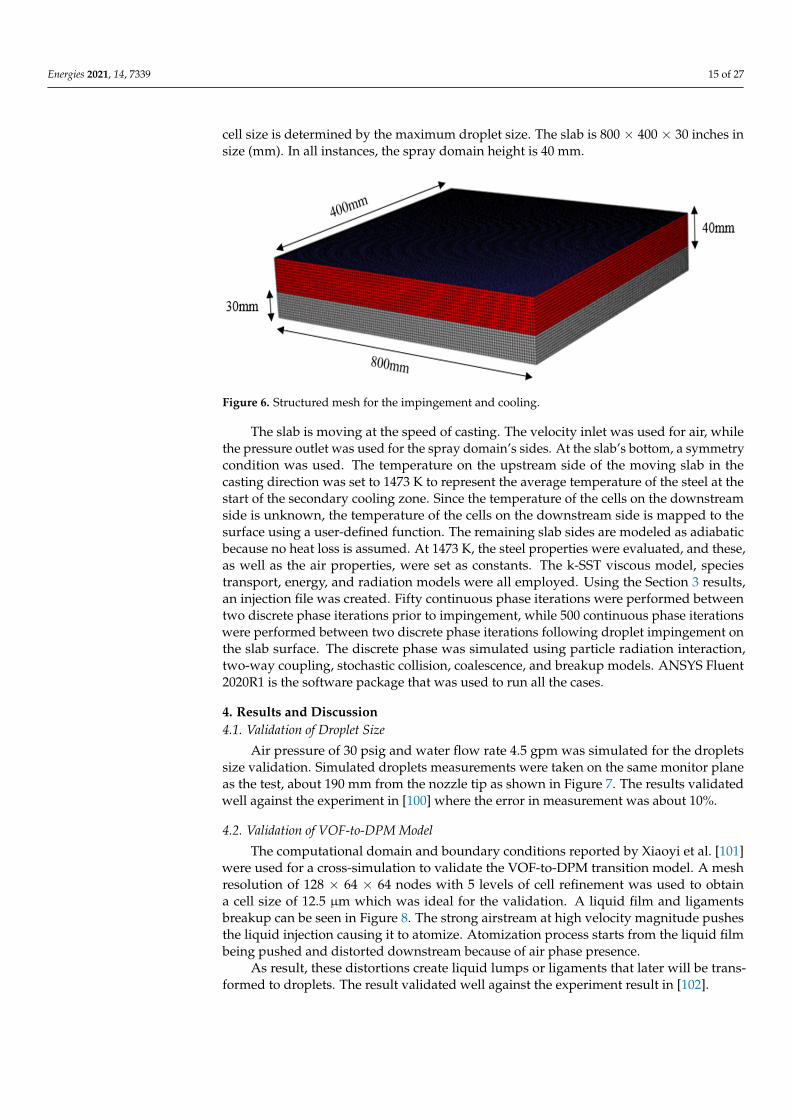
pattern. The domain height varies depending on the case because breakup lengths vary, but it is measured from the breakup length to 40 mm above the slab. A 3 mm cell size was used, with 5 prism layers. At the injection surface, different cell sizes were used to refine the injection surface based on the maximum droplet size in each case.
Figure 5. Computational mesh for droplets generation.
Eulerian—Lagrangian approach was used with air as the continuous phase and the water droplet as the Lagrangian phase. The NT method was used for the droplet size dis-tribution. KHRT breakup model, turbulent dispersion, two-way coupling, pressure gra-dient, and drag forces were used to simulate the Lagrangian phase. The simulation was run at steady state condition using SST (Menter) K-Omega viscosity model.
3.4. Impingement and Cooling The computational mesh used in this section is depicted in Figure 6. The cell size was
chosen so that the DPM volume fraction was less than 10%. As a result, in each case, the cell size is determined by the maximum droplet size. The slab is 800 × 400 × 30 inches in size (mm). In all instances, the spray domain height is 40 mm.
Figure 4. Polyhedral mesh for alidation and spray development.
Surface tension between water liquid and gases was set as 0.0724 N/m. Implicit,sharp interface, VOF-Compressive for the volume fraction and SIMPLE scheme for thepressure-velocity coupling were used for the simulation using a time step of 1 × 10⁻³ s.K-omega SST viscosity model was used. The velocity profile and the water volume fractionat the outlet tip of the nozzle in section was used as the inlet condition.
3.3. Droplets Generation
Figure 5 depicts a polyhedral mesh that has been refined at the top flat fan spraypattern. The domain height varies depending on the case because breakup lengths vary,but it is measured from the breakup length to 40 mm above the slab. A 3 mm cell size wasused, with 5 prism layers. At the injection surface, different cell sizes were used to refinethe injection surface based on the maximum droplet size in each case.
Energies 2021, 14, x FOR PEER REVIEW 14 of 27
Figure 4. Polyhedral mesh for alidation and spray development.
Surface tension between water liquid and gases was set as 0.0724 N/m. Implicit, sharp interface, VOF-Compressive for the volume fraction and SIMPLE scheme for the pressure-velocity coupling were used for the simulation using a time step of 1 × 10⁻³ s. K-omega SST viscosity model was used. The velocity profile and the water volume fraction at the outlet tip of the nozzle in section was used as the inlet condition.
3.3. Droplets Generation Figure 5 depicts a polyhedral mesh that has been refined at the top flat fan spray
pattern. The domain height varies depending on the case because breakup lengths vary, but it is measured from the breakup length to 40 mm above the slab. A 3 mm cell size was used, with 5 prism layers. At the injection surface, different cell sizes were used to refine the injection surface based on the maximum droplet size in each case.
Figure 5. Computational mesh for droplets generation.
Eulerian—Lagrangian approach was used with air as the continuous phase and the water droplet as the Lagrangian phase. The NT method was used for the droplet size dis-tribution. KHRT breakup model, turbulent dispersion, two-way coupling, pressure gra-dient, and drag forces were used to simulate the Lagrangian phase. The simulation was run at steady state condition using SST (Menter) K-Omega viscosity model.
3.4. Impingement and Cooling The computational mesh used in this section is depicted in Figure 6. The cell size was
chosen so that the DPM volume fraction was less than 10%. As a result, in each case, the cell size is determined by the maximum droplet size. The slab is 800 × 400 × 30 inches in size (mm). In all instances, the spray domain height is 40 mm.
Figure 5. Computational mesh for droplets generation.
Eulerian—Lagrangian approach was used with air as the continuous phase and thewater droplet as the Lagrangian phase. The NT method was used for the droplet sizedistribution. KHRT breakup model, turbulent dispersion, two-way coupling, pressuregradient, and drag forces were used to simulate the Lagrangian phase. The simulation wasrun at steady state condition using SST (Menter) K-Omega viscosity model.
3.4. Impingement and Cooling
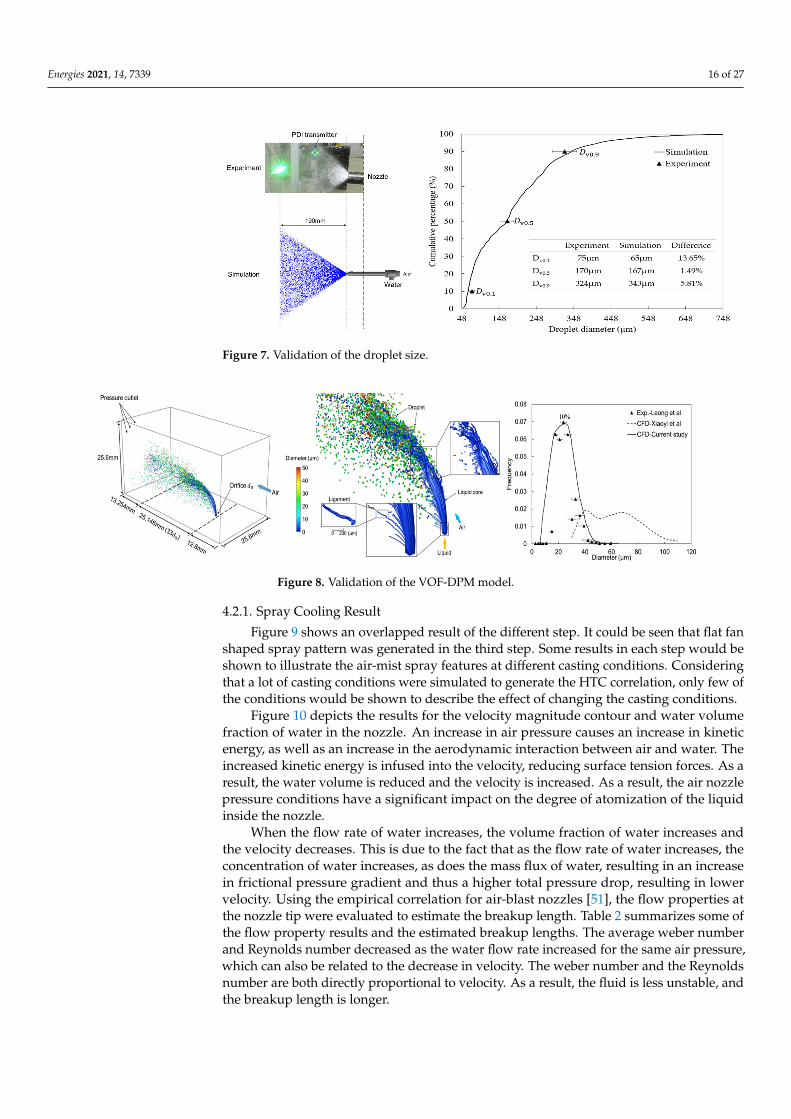
The computational mesh used in this section is depicted in Figure 6. The cell size waschosen so that the DPM volume fraction was less than 10%. As a result, in each case, the
Energies 2021, 14, 7339 15 of 27
cell size is determined by the maximum droplet size. The slab is 800 × 400 × 30 inches insize (mm). In all instances, the spray domain height is 40 mm.
Energies 2021, 14, x FOR PEER REVIEW 15 of 27
Figure 6. Structured mesh for the impingement and cooling.
The slab is moving at the speed of casting. The velocity inlet was used for air, while the pressure outlet was used for the spray domain’s sides. At the slab’s bottom, a sym-metry condition was used. The temperature on the upstream side of the moving slab in the casting direction was set to 1473 K to represent the average temperature of the steel at the start of the secondary cooling zone. Since the temperature of the cells on the down-stream side is unknown, the temperature of the cells on the downstream side is mapped to the surface using a user-defined function. The remaining slab sides are modeled as ad-iabatic because no heat loss is assumed. At 1473 K, the steel properties were evaluated, and these, as well as the air properties, were set as constants. The k-SST viscous model, species transport, energy, and radiation models were all employed. Using the Section 3 results, an injection file was created. Fifty continuous phase iterations were performed between two discrete phase iterations prior to impingement, while 500 continuous phase iterations were performed between two discrete phase iterations following droplet im-pingement on the slab surface. The discrete phase was simulated using particle radiation interaction, two-way coupling, stochastic collision, coalescence, and breakup models. AN-SYS Fluent 2020R1 is the software package that was used to run all the cases.
4. Results and Discussion 4.1. Validation of Droplet Size
Air pressure of 30 psig and water flow rate 4.5 gpm was simulated for the droplets size validation. Simulated droplets measurements were taken on the same monitor plane as the test, about 190 mm from the nozzle tip as shown in Figure 7. The results validated well against the experiment in [100] where the error in measurement was about 10%.
Figure 7. Validation of the droplet size.
Figure 6. Structured mesh for the impingement and cooling.
The slab is moving at the speed of casting. The velocity inlet was used for air, whilethe pressure outlet was used for the spray domain’s sides. At the slab’s bottom, a symmetrycondition was used. The temperature on the upstream side of the moving slab in thecasting direction was set to 1473 K to represent the average temperature of the steel at thestart of the secondary cooling zone. Since the temperature of the cells on the downstreamside is unknown, the temperature of the cells on the downstream side is mapped to thesurface using a user-defined function. The remaining slab sides are modeled as adiabaticbecause no heat loss is assumed. At 1473 K, the steel properties were evaluated, and these,as well as the air properties, were set as constants. The k-SST viscous model, speciestransport, energy, and radiation models were all employed. Using the Section 3 results,an injection file was created. Fifty continuous phase iterations were performed betweentwo discrete phase iterations prior to impingement, while 500 continuous phase iterationswere performed between two discrete phase iterations following droplet impingement onthe slab surface. The discrete phase was simulated using particle radiation interaction,two-way coupling, stochastic collision, coalescence, and breakup models. ANSYS Fluent2020R1 is the software package that was used to run all the cases.
4. Results and Discussion4.1. Validation of Droplet Size
Air pressure of 30 psig and water flow rate 4.5 gpm was simulated for the dropletssize validation. Simulated droplets measurements were taken on the same monitor planeas the test, about 190 mm from the nozzle tip as shown in Figure 7. The results validatedwell against the experiment in [100] where the error in measurement was about 10%.
4.2. Validation of VOF-to-DPM Model
The computational domain and boundary conditions reported by Xiaoyi et al. [101]were used for a cross-simulation to validate the VOF-to-DPM transition model. A meshresolution of 128 × 64 × 64 nodes with 5 levels of cell refinement was used to obtaina cell size of 12.5 µm which was ideal for the validation. A liquid film and ligamentsbreakup can be seen in Figure 8. The strong airstream at high velocity magnitude pushesthe liquid injection causing it to atomize. Atomization process starts from the liquid filmbeing pushed and distorted downstream because of air phase presence.
As result, these distortions create liquid lumps or ligaments that later will be trans-formed to droplets. The result validated well against the experiment result in [102].
Energies 2021, 14, 7339 16 of 27
Energies 2021, 14, x FOR PEER REVIEW 15 of 27
Figure 6. Structured mesh for the impingement and cooling.
The slab is moving at the speed of casting. The velocity inlet was used for air, while the pressure outlet was used for the spray domain’s sides. At the slab’s bottom, a sym-metry condition was used. The temperature on the upstream side of the moving slab in the casting direction was set to 1473 K to represent the average temperature of the steel at the start of the secondary cooling zone. Since the temperature of the cells on the down-stream side is unknown, the temperature of the cells on the downstream side is mapped to the surface using a user-defined function. The remaining slab sides are modeled as ad-iabatic because no heat loss is assumed. At 1473 K, the steel properties were evaluated, and these, as well as the air properties, were set as constants. The k-SST viscous model, species transport, energy, and radiation models were all employed. Using the Section 3 results, an injection file was created. Fifty continuous phase iterations were performed between two discrete phase iterations prior to impingement, while 500 continuous phase iterations were performed between two discrete phase iterations following droplet im-pingement on the slab surface. The discrete phase was simulated using particle radiation interaction, two-way coupling, stochastic collision, coalescence, and breakup models. AN-SYS Fluent 2020R1 is the software package that was used to run all the cases.
4. Results and Discussion 4.1. Validation of Droplet Size
Air pressure of 30 psig and water flow rate 4.5 gpm was simulated for the droplets size validation. Simulated droplets measurements were taken on the same monitor plane as the test, about 190 mm from the nozzle tip as shown in Figure 7. The results validated well against the experiment in [100] where the error in measurement was about 10%.
Figure 7. Validation of the droplet size. Figure 7. Validation of the droplet size.
Energies 2021, 14, x FOR PEER REVIEW 16 of 27
4.2. Validation of VOF-to-DPM Model The computational domain and boundary conditions reported by Xiaoyi et al. [101]
were used for a cross-simulation to validate the VOF-to-DPM transition model. A mesh resolution of 128 × 64 × 64 nodes with 5 levels of cell refinement was used to obtain a cell size of 12.5 µm which was ideal for the validation. A liquid film and ligaments breakup can be seen in Figure 8. The strong airstream at high velocity magnitude pushes the liquid injection causing it to atomize.
Atomization process starts from the liquid film being pushed and distorted down-stream because of air phase presence.
Figure 8. Validation of the VOF-DPM model.
As result, these distortions create liquid lumps or ligaments that later will be trans-formed to droplets. The result validated well against the experiment result in [102].
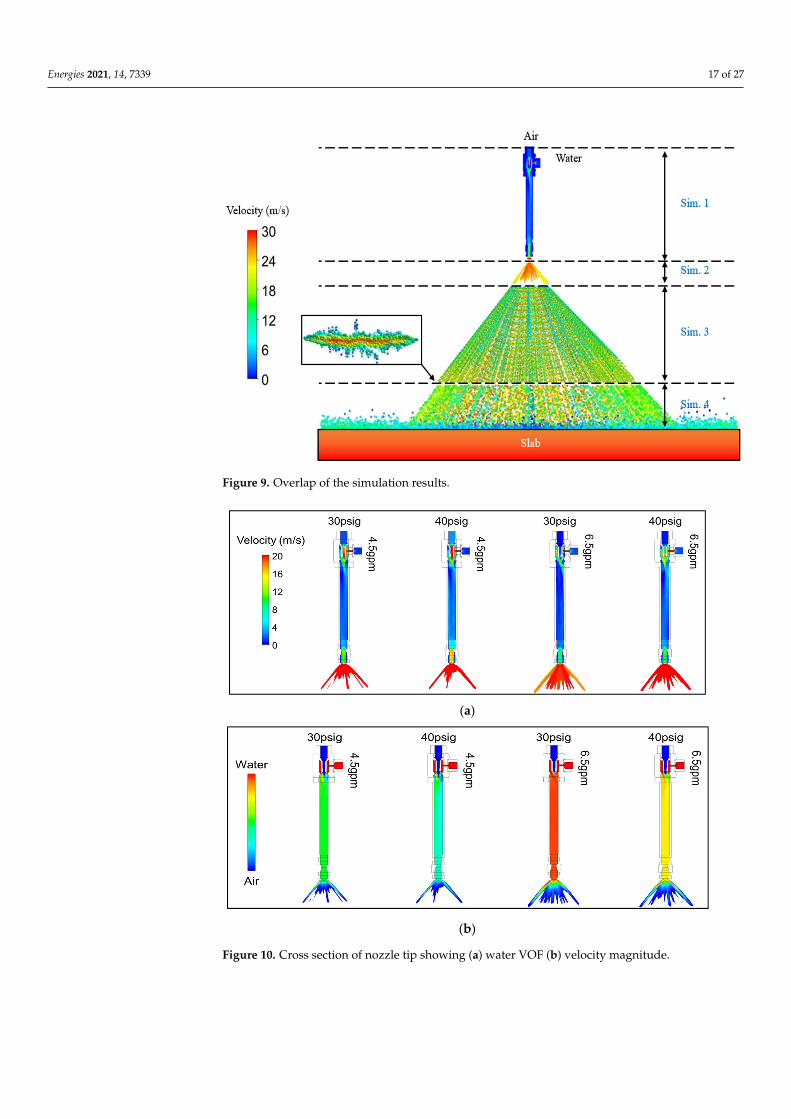
4.2.1. Spray Cooling Result Figure 9 shows an overlapped result of the different step. It could be seen that flat fan
shaped spray pattern was generated in the third step. Some results in each step would be shown to illustrate the air-mist spray features at different casting conditions. Considering that a lot of casting conditions were simulated to generate the HTC correlation, only few of the conditions would be shown to describe the effect of changing the casting conditions.
Figure 9. Overlap of the simulation results.
Figure 8. Validation of the VOF-DPM model.
4.2.1. Spray Cooling Result
Figure 9 shows an overlapped result of the different step. It could be seen that flat fanshaped spray pattern was generated in the third step. Some results in each step would beshown to illustrate the air-mist spray features at different casting conditions. Consideringthat a lot of casting conditions were simulated to generate the HTC correlation, only few ofthe conditions would be shown to describe the effect of changing the casting conditions.
Figure 10 depicts the results for the velocity magnitude contour and water volumefraction of water in the nozzle. An increase in air pressure causes an increase in kineticenergy, as well as an increase in the aerodynamic interaction between air and water. Theincreased kinetic energy is infused into the velocity, reducing surface tension forces. As aresult, the water volume is reduced and the velocity is increased. As a result, the air nozzlepressure conditions have a significant impact on the degree of atomization of the liquidinside the nozzle.
When the flow rate of water increases, the volume fraction of water increases andthe velocity decreases. This is due to the fact that as the flow rate of water increases, theconcentration of water increases, as does the mass flux of water, resulting in an increasein frictional pressure gradient and thus a higher total pressure drop, resulting in lowervelocity. Using the empirical correlation for air-blast nozzles [51], the flow properties atthe nozzle tip were evaluated to estimate the breakup length. Table 2 summarizes some ofthe flow property results and the estimated breakup lengths. The average weber numberand Reynolds number decreased as the water flow rate increased for the same air pressure,which can also be related to the decrease in velocity. The weber number and the Reynoldsnumber are both directly proportional to velocity. As a result, the fluid is less unstable, andthe breakup length is longer.
Energies 2021, 14, 7339 17 of 27
Energies 2021, 14, x FOR PEER REVIEW 16 of 27
4.2. Validation of VOF-to-DPM Model The computational domain and boundary conditions reported by Xiaoyi et al. [101]
were used for a cross-simulation to validate the VOF-to-DPM transition model. A mesh resolution of 128 × 64 × 64 nodes with 5 levels of cell refinement was used to obtain a cell size of 12.5 µm which was ideal for the validation. A liquid film and ligaments breakup can be seen in Figure 8. The strong airstream at high velocity magnitude pushes the liquid injection causing it to atomize.
Atomization process starts from the liquid film being pushed and distorted down-stream because of air phase presence.
Figure 8. Validation of the VOF-DPM model.
As result, these distortions create liquid lumps or ligaments that later will be trans-formed to droplets. The result validated well against the experiment result in [102].
4.2.1. Spray Cooling Result Figure 9 shows an overlapped result of the different step. It could be seen that flat fan
shaped spray pattern was generated in the third step. Some results in each step would be shown to illustrate the air-mist spray features at different casting conditions. Considering that a lot of casting conditions were simulated to generate the HTC correlation, only few of the conditions would be shown to describe the effect of changing the casting conditions.
Figure 9. Overlap of the simulation results. Figure 9. Overlap of the simulation results.
Energies 2021, 14, x FOR PEER REVIEW 17 of 27
Figure 10 depicts the results for the velocity magnitude contour and water volume fraction of water in the nozzle. An increase in air pressure causes an increase in kinetic energy, as well as an increase in the aerodynamic interaction between air and water. The increased kinetic energy is infused into the velocity, reducing surface tension forces. As a result, the water volume is reduced and the velocity is increased. As a result, the air nozzle pressure conditions have a significant impact on the degree of atomization of the liquid inside the nozzle.
(a)
(b)
Figure 10. Cross section of nozzle tip showing (a) water VOF (b) velocity magnitude.
When the flow rate of water increases, the volume fraction of water increases and the velocity decreases. This is due to the fact that as the flow rate of water increases, the con-centration of water increases, as does the mass flux of water, resulting in an increase in frictional pressure gradient and thus a higher total pressure drop, resulting in lower ve-locity. Using the empirical correlation for air-blast nozzles [51], the flow properties at the nozzle tip were evaluated to estimate the breakup length. Table 2 summarizes some of the flow property results and the estimated breakup lengths. The average weber number and Reynolds number decreased as the water flow rate increased for the same air pressure, which can also be related to the decrease in velocity. The weber number and the Reynolds number are both directly proportional to velocity. As a result, the fluid is less unstable, and the breakup length is longer.
Table 2. Conditions at the reference line of the nozzle.
Air Pressure (psi) Water Flow Rate
(gpm) Ave. Weber Number Ave. Reynolds Number Breakup Length
(mm) 30 2 76.079 1083.681 14.565 30 2.5 50.381 803.261 14.845
Figure 10. Cross section of nozzle tip showing (a) water VOF (b) velocity magnitude.
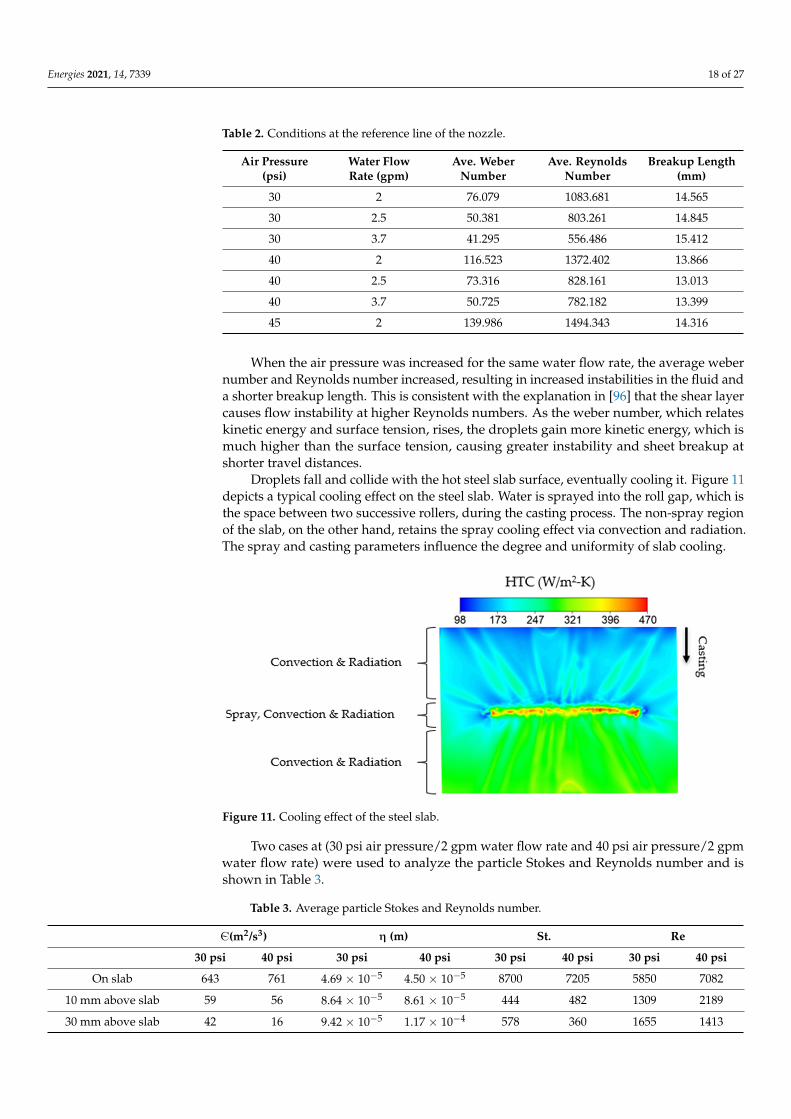
Energies 2021, 14, 7339 18 of 27
Table 2. Conditions at the reference line of the nozzle.
Air Pressure(psi)
Water FlowRate (gpm)
Ave. WeberNumber
Ave. ReynoldsNumber
Breakup Length(mm)
30 2 76.079 1083.681 14.565
30 2.5 50.381 803.261 14.845
30 3.7 41.295 556.486 15.412
40 2 116.523 1372.402 13.866
40 2.5 73.316 828.161 13.013
40 3.7 50.725 782.182 13.399
45 2 139.986 1494.343 14.316
When the air pressure was increased for the same water flow rate, the average webernumber and Reynolds number increased, resulting in increased instabilities in the fluid anda shorter breakup length. This is consistent with the explanation in [96] that the shear layercauses flow instability at higher Reynolds numbers. As the weber number, which relateskinetic energy and surface tension, rises, the droplets gain more kinetic energy, which ismuch higher than the surface tension, causing greater instability and sheet breakup atshorter travel distances.
Droplets fall and collide with the hot steel slab surface, eventually cooling it. Figure 11depicts a typical cooling effect on the steel slab. Water is sprayed into the roll gap, which isthe space between two successive rollers, during the casting process. The non-spray regionof the slab, on the other hand, retains the spray cooling effect via convection and radiation.The spray and casting parameters influence the degree and uniformity of slab cooling.
Energies 2021, 14, x FOR PEER REVIEW 18 of 27
30 3.7 41.295 556.486 15.412 40 2 116.523 1372.402 13.866 40 2.5 73.316 828.161 13.013 40 3.7 50.725 782.182 13.399 45 2 139.986 1494.343 14.316
When the air pressure was increased for the same water flow rate, the average weber number and Reynolds number increased, resulting in increased instabilities in the fluid and a shorter breakup length. This is consistent with the explanation in [96] that the shear layer causes flow instability at higher Reynolds numbers. As the weber number, which relates kinetic energy and surface tension, rises, the droplets gain more kinetic energy, which is much higher than the surface tension, causing greater instability and sheet breakup at shorter travel distances.
Droplets fall and collide with the hot steel slab surface, eventually cooling it. Figure 11 depicts a typical cooling effect on the steel slab. Water is sprayed into the roll gap, which is the space between two successive rollers, during the casting process. The non-spray region of the slab, on the other hand, retains the spray cooling effect via convection and radiation. The spray and casting parameters influence the degree and uniformity of slab cooling.
Figure 11. Cooling effect of the steel slab.
Two cases at (30 psi air pressure/2 gpm water flow rate and 40 psi air pressure/2 gpm water flow rate) were used to analyze the particle Stokes and Reynolds number and is shown in Table 3.
Table 3. Average particle Stokes and Reynolds number.
Є (m2/s3) η (m) St. Re 30 psi 40 psi 30 psi 40 psi 30 psi 40 psi 30 psi 40 psi
On slab 643 761 4.69 × 10⁻⁵ 4.50 × 10⁻⁵ 8700 7205 5850 7082 10 mm above slab 59 56 8.64 × 10⁻⁵ 8.61 × 10⁻⁵ 444 482 1309 2189 30 mm above slab 42 16 9.42 × 10⁻⁵ 1.17 × 10⁻⁴ 578 360 1655 1413
As stated by many researchers [7,42,43,60,66,69,103], a typical two-phase gas-liquid atomization process has the dominant forces of hydrodynamic or inertial force attributed to undulations/perturbations, aerodynamic force attributed to drag/shearing effect, vis-cous force attributed to oppose a change in liquid geometry, and surface tension forces
Figure 11. Cooling effect of the steel slab.
Two cases at (30 psi air pressure/2 gpm water flow rate and 40 psi air pressure/2 gpmwater flow rate) were used to analyze the particle Stokes and Reynolds number and isshown in Table 3.
Table 3. Average particle Stokes and Reynolds number.
Є(m2/s3) η (m) St. Re
30 psi 40 psi 30 psi 40 psi 30 psi 40 psi 30 psi 40 psi
On slab 643 761 4.69 × 10⁻⁵ 4.50 × 10⁻⁵ 8700 7205 5850 7082
10 mm above slab 59 56 8.64 × 10⁻⁵ 8.61 × 10⁻⁵ 444 482 1309 2189
30 mm above slab 42 16 9.42 × 10⁻⁵ 1.17 × 10⁻⁴ 578 360 1655 1413
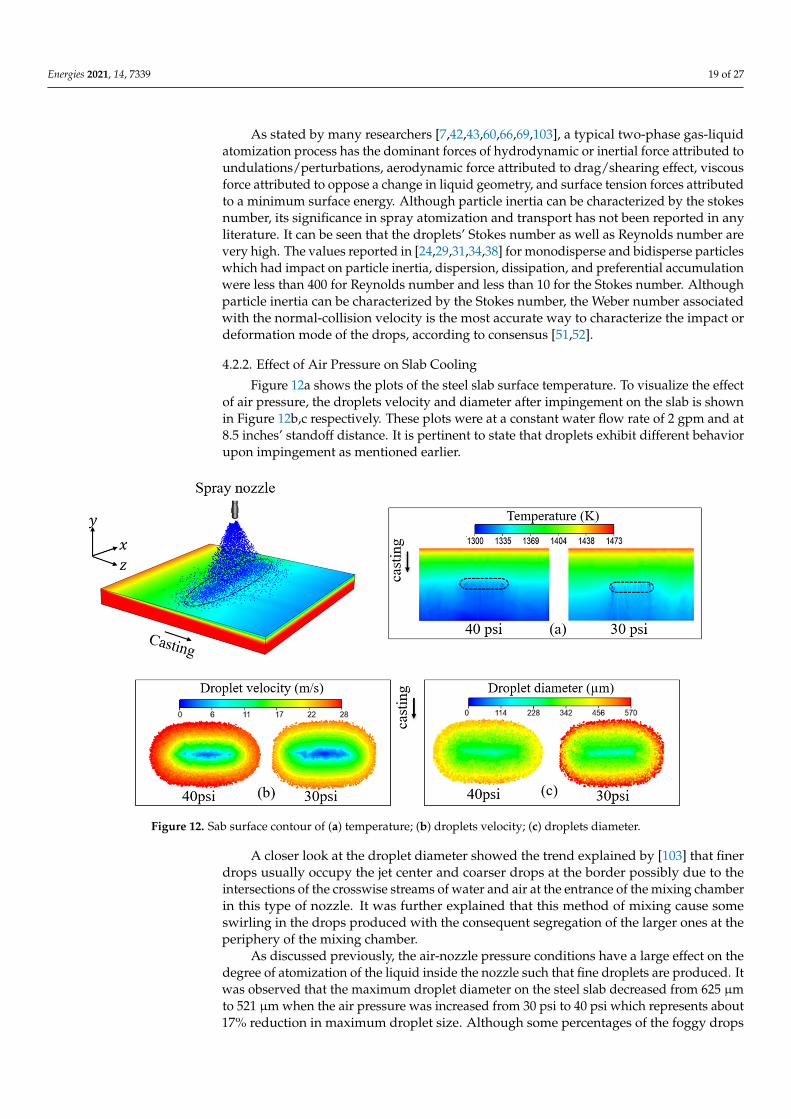
Energies 2021, 14, 7339 19 of 27
As stated by many researchers [7,42,43,60,66,69,103], a typical two-phase gas-liquidatomization process has the dominant forces of hydrodynamic or inertial force attributed toundulations/perturbations, aerodynamic force attributed to drag/shearing effect, viscousforce attributed to oppose a change in liquid geometry, and surface tension forces attributedto a minimum surface energy. Although particle inertia can be characterized by the stokesnumber, its significance in spray atomization and transport has not been reported in anyliterature. It can be seen that the droplets’ Stokes number as well as Reynolds number arevery high. The values reported in [24,29,31,34,38] for monodisperse and bidisperse particleswhich had impact on particle inertia, dispersion, dissipation, and preferential accumulationwere less than 400 for Reynolds number and less than 10 for the Stokes number. Althoughparticle inertia can be characterized by the Stokes number, the Weber number associatedwith the normal-collision velocity is the most accurate way to characterize the impact ordeformation mode of the drops, according to consensus [51,52].
4.2.2. Effect of Air Pressure on Slab Cooling
Figure 12a shows the plots of the steel slab surface temperature. To visualize the effectof air pressure, the droplets velocity and diameter after impingement on the slab is shownin Figure 12b,c respectively. These plots were at a constant water flow rate of 2 gpm and at8.5 inches’ standoff distance. It is pertinent to state that droplets exhibit different behaviorupon impingement as mentioned earlier.
Energies 2021, 14, x FOR PEER REVIEW 19 of 27
attributed to a minimum surface energy. Although particle inertia can be characterized by the stokes number, its significance in spray atomization and transport has not been re-ported in any literature. It can be seen that the droplets’ Stokes number as well as Reyn-olds number are very high. The values reported in [24,29,31,34,38] for monodisperse and bidisperse particles which had impact on particle inertia, dispersion, dissipation, and pref-erential accumulation were less than 400 for Reynolds number and less than 10 for the Stokes number. Although particle inertia can be characterized by the Stokes number, the Weber number associated with the normal-collision velocity is the most accurate way to characterize the impact or deformation mode of the drops, according to consensus [51,52]
4.2.2. Effect of Air Pressure on Slab Cooling Figure 12a shows the plots of the steel slab surface temperature. To visualize the ef-
fect of air pressure, the droplets velocity and diameter after impingement on the slab is shown in Figure 12b,c respectively. These plots were at a constant water flow rate of 2 gpm and at 8.5 inches’ standoff distance. It is pertinent to state that droplets exhibit dif-ferent behavior upon impingement as mentioned earlier.
Figure 12. Sab surface contour of (a) temperature; (b) droplets velocity; (c) droplets diameter.
A closer look at the droplet diameter showed the trend explained by [103] that finer drops usually occupy the jet center and coarser drops at the border possibly due to the intersections of the crosswise streams of water and air at the entrance of the mixing cham-ber in this type of nozzle. It was further explained that this method of mixing cause some swirling in the drops produced with the consequent segregation of the larger ones at the periphery of the mixing chamber.
As discussed previously, the air-nozzle pressure conditions have a large effect on the degree of atomization of the liquid inside the nozzle such that fine droplets are produced. It was observed that the maximum droplet diameter on the steel slab decreased from 625 µm to 521 µm when the air pressure was increased from 30 psi to 40 psi which represents about 17% reduction in maximum droplet size. Although some percentages of the foggy drops are blown away by the free stream air or are evaporated before reaching the steel slab, very significant number of fine drops do reach the slab at high speed. As the small droplets have large surface area to volume ratio, they will extract more heat. The visuali-zation done by [20] revealed that interactions of the droplets with the surface are more
Figure 12. Sab surface contour of (a) temperature; (b) droplets velocity; (c) droplets diameter.
A closer look at the droplet diameter showed the trend explained by [103] that finerdrops usually occupy the jet center and coarser drops at the border possibly due to theintersections of the crosswise streams of water and air at the entrance of the mixing chamberin this type of nozzle. It was further explained that this method of mixing cause someswirling in the drops produced with the consequent segregation of the larger ones at theperiphery of the mixing chamber.
As discussed previously, the air-nozzle pressure conditions have a large effect on thedegree of atomization of the liquid inside the nozzle such that fine droplets are produced. Itwas observed that the maximum droplet diameter on the steel slab decreased from 625 µmto 521 µm when the air pressure was increased from 30 psi to 40 psi which represents about17% reduction in maximum droplet size. Although some percentages of the foggy drops
Energies 2021, 14, 7339 20 of 27
are blown away by the free stream air or are evaporated before reaching the steel slab, verysignificant number of fine drops do reach the slab at high speed. As the small dropletshave large surface area to volume ratio, they will extract more heat. The visualizationdone by [20] revealed that interactions of the droplets with the surface are more intense athigher air nozzle pressure which suggests that a very rapid evaporation must occur. Anincrease in air pressure from 30 psi to 40 psi resulted in an increase in HTC as there is higherheat removal. This is because the increase in air pressure increased the droplet velocityand reduced the droplet size thus, the droplets have higher momentum to penetrate thevapor layer formed above the slab surface due to leidenfrost effect and higher kineticenergy which is a key parameter governing the higher heat extraction above the leidenfrosttemperature as opined by [56]. This effect agrees with the reports of [12,21,99,103]. Table 4shows the averaged properties of the droplets on the steel slab.
Table 4. Average droplets properties on the slab at 2 gpm water flow rate.
Droplets Properties Unit 30 psi Air 40 psi Air
Droplets coverage area m2 0.0623 0.0867
Droplets weber number - 1522 1660
Sauter mean diameter µm 439 381
Droplets concentration Kg/m3 0.9854 0.4278
Droplets volume fraction - 9.87 × 10⁻⁴ 4.29 × 10⁻⁴
Droplets Number density Number/m3 4.85 × 10⁷ 2.29 × 10⁷
Evaluation of the droplets properties on the slab surface showed that the dropletsconcentration on the slab decreases at higher air pressure as smaller droplets produced byincreasing the air pressure could be carried away by the entrained free stream air or couldevaporate before reaching the slab. For the condition evaluated in Table 3, there was about57% reduction in the droplet concentration on the slab when the air pressure was increasedfrom 30 psi to 40 psi. The space covered by the impinging and reflected droplets has anelliptical shape and its area was calculated where it was seen that increasing the air pressurefrom 30 psi to 40 psi resulted in about 39% increase in the droplets coverage area on thesteel slab. It was generally agreed in [51,52,91] that the one factor governing the impactand deformation mode of the drops is the ratio of the inertial to surface tension forces ofthe drops given by the weber number associated with the normal collision velocity of thedrops. The results shown in Table 3 also supports that increasing the air pressure from30 psi to 40 psi at a constant water flow rate of 2 gpm increases the average droplets webernumber on the steel slab by 9.1%. The droplets-to-droplets collision rate as well as thedroplets number density, that is, the number of droplet particles per unit cell volume werefound to both decrease as the air pressure increases. The uniformity of the spray coolingobtained by evaluating the standard deviation in the localized heat transfer coefficientshowed that increase in air pressure results in more uniform cooling of the slab.
4.2.3. Effect of Water Flow Rate
An increase in the water flow rate from 2 gpm to 3.7 gpm results in lower cooling.As presented by [100], an increase in water flow rate at constant pressure imposes largerresistance on the air in the nozzle flow due to reduction in the cross-sectional area availablefor its flow and from the greater irreversible work it has to do for atomizing and acceleratingan increasing amount of water. This result in ineffective atomization producing largerdroplets size and lower velocity. This lower velocity limits the droplet—slab contact as thedroplet momentum is lower and inadequate to penetrate the vapor layer above the slabsurface. This is in tandem with the report in [21,100,103].
As reported by [101], increase in water flow rate at constant air pressure generallywould decrease the spray cooling effectiveness because the droplets upon impinging the
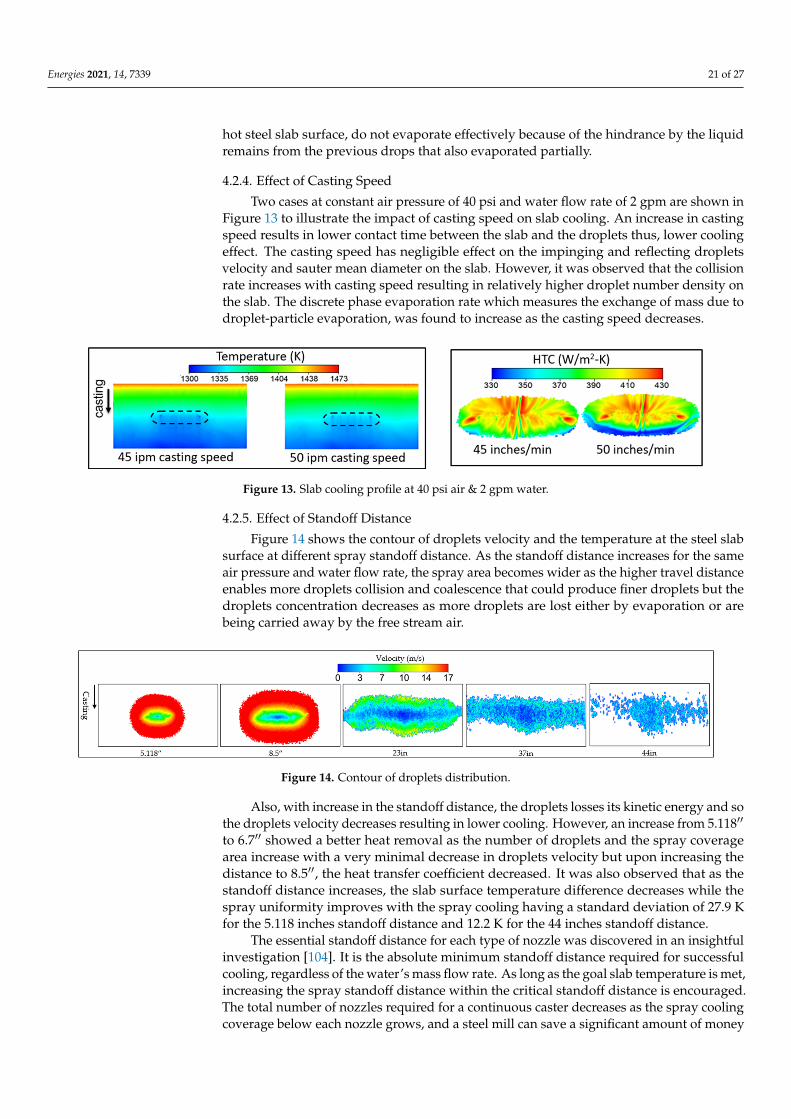
Energies 2021, 14, 7339 21 of 27
hot steel slab surface, do not evaporate effectively because of the hindrance by the liquidremains from the previous drops that also evaporated partially.
4.2.4. Effect of Casting Speed
Two cases at constant air pressure of 40 psi and water flow rate of 2 gpm are shown inFigure 13 to illustrate the impact of casting speed on slab cooling. An increase in castingspeed results in lower contact time between the slab and the droplets thus, lower coolingeffect. The casting speed has negligible effect on the impinging and reflecting dropletsvelocity and sauter mean diameter on the slab. However, it was observed that the collisionrate increases with casting speed resulting in relatively higher droplet number density onthe slab. The discrete phase evaporation rate which measures the exchange of mass due todroplet-particle evaporation, was found to increase as the casting speed decreases.
Energies 2021, 14, x FOR PEER REVIEW 21 of 27
4.2.4. Effect of Casting Speed Two cases at constant air pressure of 40 psi and water flow rate of 2 gpm are shown
in Figure 13 to illustrate the impact of casting speed on slab cooling. An increase in casting speed results in lower contact time between the slab and the droplets thus, lower cooling effect. The casting speed has negligible effect on the impinging and reflecting droplets velocity and sauter mean diameter on the slab. However, it was observed that the collision rate increases with casting speed resulting in relatively higher droplet number density on the slab. The discrete phase evaporation rate which measures the exchange of mass due to droplet-particle evaporation, was found to increase as the casting speed decreases.
Figure 13. slab cooling profile at 40 psi air & 2 gpm water.
4.2.5. Effect of Standoff Distance Figure 14 shows the contour of droplets velocity and the temperature at the steel slab
surface at different spray standoff distance. As the standoff distance increases for the same air pressure and water flow rate, the spray area becomes wider as the higher travel dis-tance enables more droplets collision and coalescence that could produce finer droplets but the droplets concentration decreases as more droplets are lost either by evaporation or are being carried away by the free stream air.
Figure 14. Contour of droplets distribution.
Also, with increase in the standoff distance, the droplets losses its kinetic energy and so the droplets velocity decreases resulting in lower cooling. However, an increase from 5.118″ to 6.7″ showed a better heat removal as the number of droplets and the spray cov-erage area increase with a very minimal decrease in droplets velocity but upon increasing the distance to 8.5″, the heat transfer coefficient decreased. It was also observed that as the standoff distance increases, the slab surface temperature difference decreases while the spray uniformity improves with the spray cooling having a standard deviation of 27.9 K for the 5.118 inches standoff distance and 12.2 K for the 44 inches standoff distance.
The essential standoff distance for each type of nozzle was discovered in an insightful investigation [104]. It is the absolute minimum standoff distance required for successful cool-ing, regardless of the water’s mass flow rate. As long as the goal slab temperature is met, in-creasing the spray standoff distance within the critical standoff distance is encouraged. The total number of nozzles required for a continuous caster decreases as the spray cooling cover-age below each nozzle grows, and a steel mill can save a significant amount of money on noz-zles as a result. When a spray nozzle is put at a distance greater than the crucial standoff dis-tance, however, the cooling effect is barely evident. Droplet size decreases considerably at a
Figure 13. Slab cooling profile at 40 psi air & 2 gpm water.
4.2.5. Effect of Standoff Distance
Figure 14 shows the contour of droplets velocity and the temperature at the steel slabsurface at different spray standoff distance. As the standoff distance increases for the sameair pressure and water flow rate, the spray area becomes wider as the higher travel distanceenables more droplets collision and coalescence that could produce finer droplets but thedroplets concentration decreases as more droplets are lost either by evaporation or arebeing carried away by the free stream air.
Energies 2021, 14, x FOR PEER REVIEW 21 of 27
4.2.4. Effect of Casting Speed Two cases at constant air pressure of 40 psi and water flow rate of 2 gpm are shown
in Figure 13 to illustrate the impact of casting speed on slab cooling. An increase in casting speed results in lower contact time between the slab and the droplets thus, lower cooling effect. The casting speed has negligible effect on the impinging and reflecting droplets velocity and sauter mean diameter on the slab. However, it was observed that the collision rate increases with casting speed resulting in relatively higher droplet number density on the slab. The discrete phase evaporation rate which measures the exchange of mass due to droplet-particle evaporation, was found to increase as the casting speed decreases.
Figure 13. slab cooling profile at 40 psi air & 2 gpm water.
4.2.5. Effect of Standoff Distance Figure 14 shows the contour of droplets velocity and the temperature at the steel slab
surface at different spray standoff distance. As the standoff distance increases for the same air pressure and water flow rate, the spray area becomes wider as the higher travel dis-tance enables more droplets collision and coalescence that could produce finer droplets but the droplets concentration decreases as more droplets are lost either by evaporation or are being carried away by the free stream air.
Figure 14. Contour of droplets distribution.
Also, with increase in the standoff distance, the droplets losses its kinetic energy and so the droplets velocity decreases resulting in lower cooling. However, an increase from 5.118″ to 6.7″ showed a better heat removal as the number of droplets and the spray cov-erage area increase with a very minimal decrease in droplets velocity but upon increasing the distance to 8.5″, the heat transfer coefficient decreased. It was also observed that as the standoff distance increases, the slab surface temperature difference decreases while the spray uniformity improves with the spray cooling having a standard deviation of 27.9 K for the 5.118 inches standoff distance and 12.2 K for the 44 inches standoff distance.
The essential standoff distance for each type of nozzle was discovered in an insightful investigation [104]. It is the absolute minimum standoff distance required for successful cool-ing, regardless of the water’s mass flow rate. As long as the goal slab temperature is met, in-creasing the spray standoff distance within the critical standoff distance is encouraged. The total number of nozzles required for a continuous caster decreases as the spray cooling cover-age below each nozzle grows, and a steel mill can save a significant amount of money on noz-zles as a result. When a spray nozzle is put at a distance greater than the crucial standoff dis-tance, however, the cooling effect is barely evident. Droplet size decreases considerably at a
Figure 14. Contour of droplets distribution.
Also, with increase in the standoff distance, the droplets losses its kinetic energy and sothe droplets velocity decreases resulting in lower cooling. However, an increase from 5.118′′
to 6.7′′ showed a better heat removal as the number of droplets and the spray coveragearea increase with a very minimal decrease in droplets velocity but upon increasing thedistance to 8.5′′, the heat transfer coefficient decreased. It was also observed that as thestandoff distance increases, the slab surface temperature difference decreases while thespray uniformity improves with the spray cooling having a standard deviation of 27.9 Kfor the 5.118 inches standoff distance and 12.2 K for the 44 inches standoff distance.
The essential standoff distance for each type of nozzle was discovered in an insightfulinvestigation [104]. It is the absolute minimum standoff distance required for successfulcooling, regardless of the water’s mass flow rate. As long as the goal slab temperature is met,increasing the spray standoff distance within the critical standoff distance is encouraged.The total number of nozzles required for a continuous caster decreases as the spray coolingcoverage below each nozzle grows, and a steel mill can save a significant amount of money
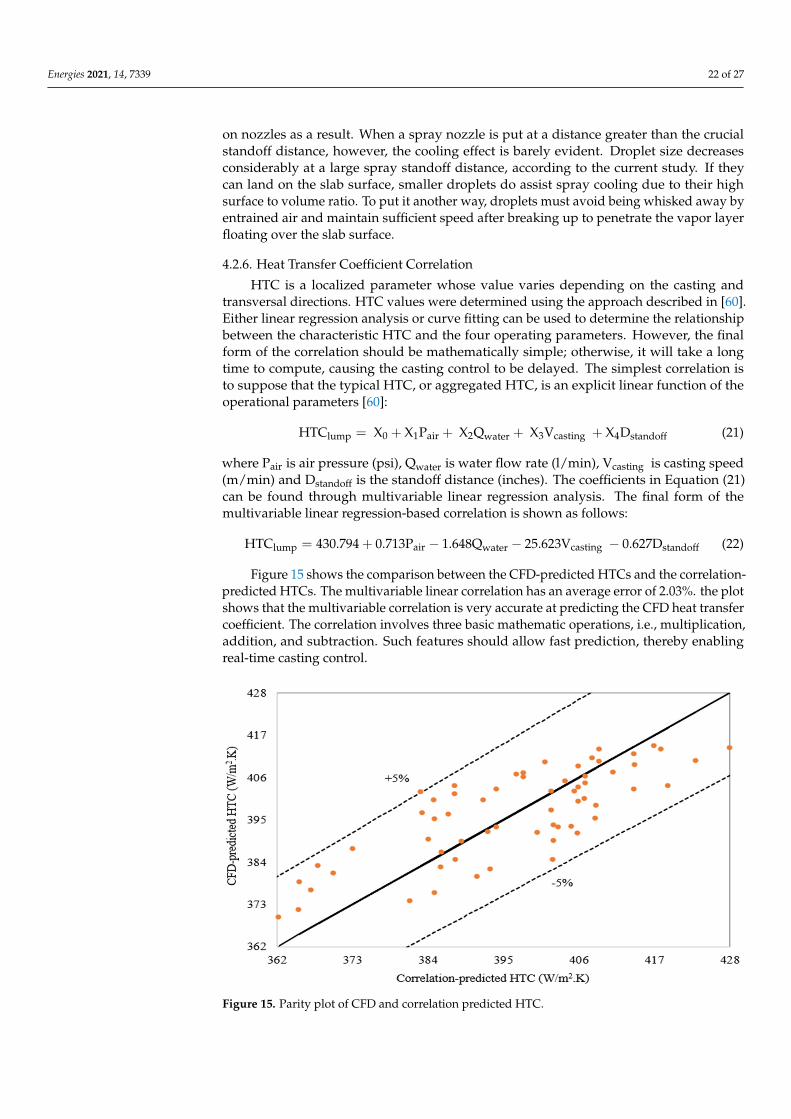
Energies 2021, 14, 7339 22 of 27
on nozzles as a result. When a spray nozzle is put at a distance greater than the crucialstandoff distance, however, the cooling effect is barely evident. Droplet size decreasesconsiderably at a large spray standoff distance, according to the current study. If theycan land on the slab surface, smaller droplets do assist spray cooling due to their highsurface to volume ratio. To put it another way, droplets must avoid being whisked away byentrained air and maintain sufficient speed after breaking up to penetrate the vapor layerfloating over the slab surface.
4.2.6. Heat Transfer Coefficient Correlation
HTC is a localized parameter whose value varies depending on the casting andtransversal directions. HTC values were determined using the approach described in [60].Either linear regression analysis or curve fitting can be used to determine the relationshipbetween the characteristic HTC and the four operating parameters. However, the finalform of the correlation should be mathematically simple; otherwise, it will take a longtime to compute, causing the casting control to be delayed. The simplest correlation isto suppose that the typical HTC, or aggregated HTC, is an explicit linear function of theoperational parameters [60]:
HTClump = X0 + X1Pair + X2Qwater + X3Vcasting + X4Dstandoff (21)
where Pair is air pressure (psi), Qwater is water flow rate (l/min), Vcasting is casting speed(m/min) and Dstandoff is the standoff distance (inches). The coefficients in Equation (21)can be found through multivariable linear regression analysis. The final form of themultivariable linear regression-based correlation is shown as follows:
HTClump = 430.794 + 0.713Pair − 1.648Qwater − 25.623Vcasting − 0.627Dstandoff (22)
Figure 15 shows the comparison between the CFD-predicted HTCs and the correlation-predicted HTCs. The multivariable linear correlation has an average error of 2.03%. the plotshows that the multivariable correlation is very accurate at predicting the CFD heat transfercoefficient. The correlation involves three basic mathematic operations, i.e., multiplication,addition, and subtraction. Such features should allow fast prediction, thereby enablingreal-time casting control.
Energies 2021, 14, x FOR PEER REVIEW 22 of 27
large spray standoff distance, according to the current study. If they can land on the slab sur-face, smaller droplets do assist spray cooling due to their high surface to volume ratio. To put it another way, droplets must avoid being whisked away by entrained air and maintain suffi-cient speed after breaking up to penetrate the vapor layer floating over the slab surface.
4.2.6. Heat Transfer Coefficient Correlation HTC is a localized parameter whose value varies depending on the casting and trans-
versal directions. HTC values were determined using the approach described in [60]. Ei-ther linear regression analysis or curve fitting can be used to determine the relationship between the characteristic HTC and the four operating parameters. However, the final form of the correlation should be mathematically simple; otherwise, it will take a long time to compute, causing the casting control to be delayed. The simplest correlation is to suppose that the typical HTC, or aggregated HTC, is an explicit linear function of the op-erational parameters [60]: HTC = X + X P + X Q + X V + X D (21)
where P is air pressure (psi), Q is water flow rate (l/min), V is casting speed (m/min) and D is the standoff distance (inches). The coefficients in Equation (21) can be found through multivariable linear regression analysis. The final form of the mul-tivariable linear regression-based correlation is shown as follows: HTC = 430.794 + 0.713P − 1.648Q − 25.623V − 0.627D (22)
Figure 15 shows the comparison between the CFD-predicted HTCs and the correla-tion-predicted HTCs. The multivariable linear correlation has an average error of 2.03%. the plot shows that the multivariable correlation is very accurate at predicting the CFD heat transfer coefficient. The correlation involves three basic mathematic operations, i.e., multiplication, addition, and subtraction. Such features should allow fast prediction, thereby enabling real-time casting control.
Figure 15. parity plot of CFD and correlation predicted HTC.
When spray characteristics change, the current numerical technique should considerably minimize the time it takes to build new correlations. Furthermore, demand for new types of steel products is rapidly expanding. Each type of steel necessitates a different spray cooling approach, which includes nozzle type (hydraulic or air-mist), nozzle placement, and spray
Figure 15. Parity plot of CFD and correlation predicted HTC.
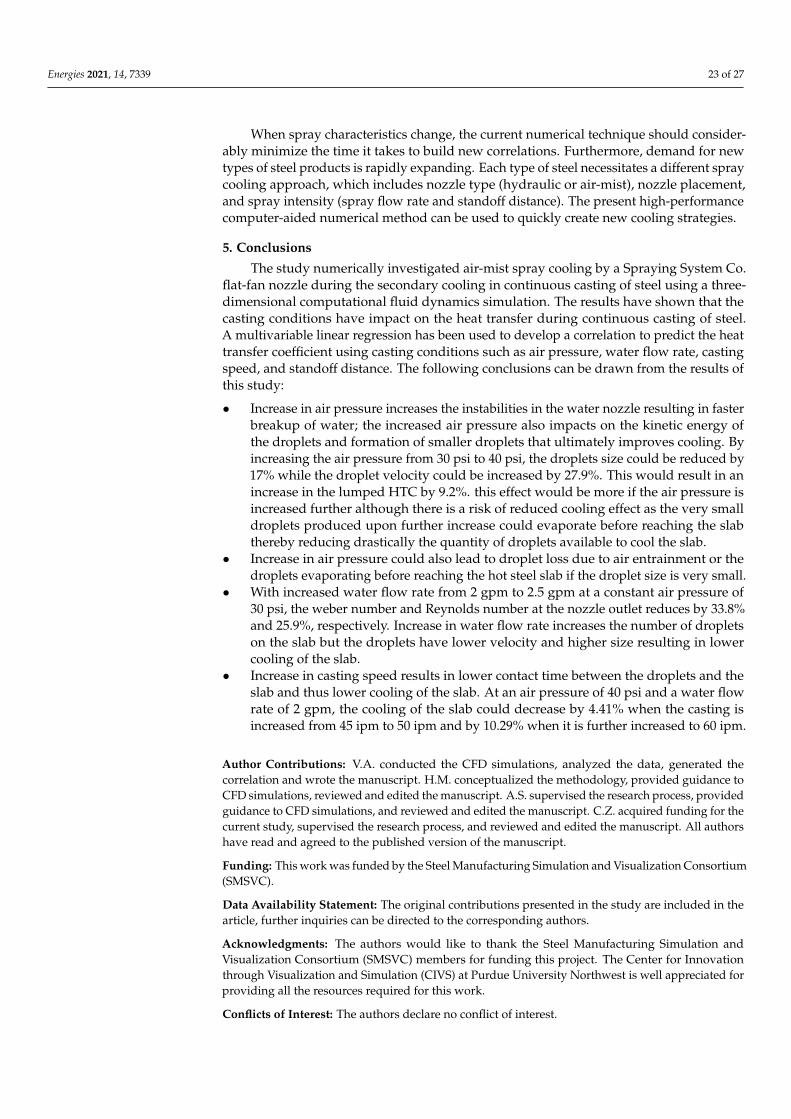
Energies 2021, 14, 7339 23 of 27
When spray characteristics change, the current numerical technique should consider-ably minimize the time it takes to build new correlations. Furthermore, demand for newtypes of steel products is rapidly expanding. Each type of steel necessitates a different spraycooling approach, which includes nozzle type (hydraulic or air-mist), nozzle placement,and spray intensity (spray flow rate and standoff distance). The present high-performancecomputer-aided numerical method can be used to quickly create new cooling strategies.
5. Conclusions
The study numerically investigated air-mist spray cooling by a Spraying System Co.flat-fan nozzle during the secondary cooling in continuous casting of steel using a three-dimensional computational fluid dynamics simulation. The results have shown that thecasting conditions have impact on the heat transfer during continuous casting of steel.A multivariable linear regression has been used to develop a correlation to predict the heattransfer coefficient using casting conditions such as air pressure, water flow rate, castingspeed, and standoff distance. The following conclusions can be drawn from the results ofthis study:
• Increase in air pressure increases the instabilities in the water nozzle resulting in fasterbreakup of water; the increased air pressure also impacts on the kinetic energy ofthe droplets and formation of smaller droplets that ultimately improves cooling. Byincreasing the air pressure from 30 psi to 40 psi, the droplets size could be reduced by17% while the droplet velocity could be increased by 27.9%. This would result in anincrease in the lumped HTC by 9.2%. this effect would be more if the air pressure isincreased further although there is a risk of reduced cooling effect as the very smalldroplets produced upon further increase could evaporate before reaching the slabthereby reducing drastically the quantity of droplets available to cool the slab.
• Increase in air pressure could also lead to droplet loss due to air entrainment or thedroplets evaporating before reaching the hot steel slab if the droplet size is very small.
• With increased water flow rate from 2 gpm to 2.5 gpm at a constant air pressure of30 psi, the weber number and Reynolds number at the nozzle outlet reduces by 33.8%and 25.9%, respectively. Increase in water flow rate increases the number of dropletson the slab but the droplets have lower velocity and higher size resulting in lowercooling of the slab.
• Increase in casting speed results in lower contact time between the droplets and theslab and thus lower cooling of the slab. At an air pressure of 40 psi and a water flowrate of 2 gpm, the cooling of the slab could decrease by 4.41% when the casting isincreased from 45 ipm to 50 ipm and by 10.29% when it is further increased to 60 ipm.
Author Contributions: V.A. conducted the CFD simulations, analyzed the data, generated thecorrelation and wrote the manuscript. H.M. conceptualized the methodology, provided guidance toCFD simulations, reviewed and edited the manuscript. A.S. supervised the research process, providedguidance to CFD simulations, and reviewed and edited the manuscript. C.Z. acquired funding for thecurrent study, supervised the research process, and reviewed and edited the manuscript. All authorshave read and agreed to the published version of the manuscript.
Funding: This work was funded by the Steel Manufacturing Simulation and Visualization Consortium(SMSVC).
Data Availability Statement: The original contributions presented in the study are included in thearticle, further inquiries can be directed to the corresponding authors.
Acknowledgments: The authors would like to thank the Steel Manufacturing Simulation andVisualization Consortium (SMSVC) members for funding this project. The Center for Innovationthrough Visualization and Simulation (CIVS) at Purdue University Northwest is well appreciated forproviding all the resources required for this work.
Conflicts of Interest: The authors declare no conflict of interest.

Energies 2021, 14, 7339 24 of 27
References1. Laitinen, E.; Neittaanmaaki, P. On Numerical Simulation of the Continuous Casting Process. J. Eng. Math. 2003, 22, 335–354.
[CrossRef]2. Thomas, B.G. Continuous Casting (metallurgy). In Yearbook of Science and Technology; McGrow-Hill Co.: New York, NY, USA, 2004.3. Stahl: World Steel Production. 2009. Available online: http://www.stahlonline.de/english/business_and_politics/economic_
and_trade_policy/steel_in_figures/start.asp (accessed on 13 February 2020).4. Sengupta, J.; Thomas, B.G.; Wells, M.A. The use of water cooling during the continuous casting of steel and aluminium. Metall.
Mater. Trans. B 2005, 36, 187–204. [CrossRef]5. Camporredondo, S.J.E.; Castillejos, E.A.H.; Acosta, G.F.A.; Gutie’rrez, M.E.P.; Herrera, G.M.A. Analysis of Thin-Slab Casting by
the Compact-Strip Process: Part I. Heat Extraction and Solidification. Metall. Mater. Trans. B 2004, 35, 541–559. [CrossRef]6. Hibbins, S.G.; Brimacombe, J.K. Characterization of heat transfer in the secondary cooling system of a continuous slab caster. ISS
Trans. 1983, 3, 77–89.7. Haibo, M.; Justina, L.; Kaile, T.; Rui, L.; Michael, L.; Armin, S.; Chenn, Q.Z. Modelling of spray cooling with a moving steel slab
during the continuous casting process. Steel Res. Int. 2019, 90, 18000393.8. Visaria, M.; Issam, M. Theoretical and experimental study of the effects of spray inclination on two-phase spray cooling and
critical heat flux. Int. J. Heat Mass Transfer 2008, 51, 2398. [CrossRef]9. Mitsutake, Y.; Monde, M.J. Analytical method of two-dimensional inverse heat conduction problem using Laplace transformation:
Effect of number of measurement point. Heat Transfer 2003, 125, 6.10. Mozumder, A.K.; Monde, M.; Woodfield, P.L.; Islam, M.A. Maximum heat flux in relation to quenching of a high temperature
surface with liquid jet impingement. Int. J. Heat Mass Transfer 2006, 49, 2877. [CrossRef]11. Moravec, R.; Blazek, K.; Horsky, J.; Graham, J.; Fiegle, S.; Dombovic, T.; Kaurich, T. Coupling of Solidification model and
Heat Transfer Coefficients to have Valuable Tool for Slab Surface Temperatures Prediction. In Proceedings of the T in METECInSteelCon, Düsseldorf, Germany, 27 June–1 July 2011.
12. Kim, J. Spray cooling heat transfer: The state of the art. Int. J. Heat Fluid Flow 2007, 28, 753–767. [CrossRef]13. Nitin, K.; Tatiana, G.R.; Peter, S.; Cam, T. A hydrodynamic model for subcooled liquid jet impingement at the Leidenfrost
condition. Int. J. Therm. Sci. 2011, 50, 993–1000.14. Müller, H.; Jeschar, R. Untersuchung des Wärmeübergangs an einer simulierten Sekundärkühlzone beim Stranggießverfahren.
Arch. Eisenhüttenwesen 1978, 44, 589–594. [CrossRef]15. Choi, K.J.; Yao, S.C. Mechanisms of film boiling heat transfer of normally impacting spray. Int. J. Heat Mass Transf. 1987, 30,
311–318. [CrossRef]16. Deb, S.; Yao, S.C. Analysis on film boiling heat transfer of impacting sprays. Int. J. Heat Mass Transf. 1989, 32, 2099–2112.
[CrossRef]17. Fujimoto, H.; Hatta, N.; Asakawa, H.; Hashimto, T. Predictable Modelling of Heat Transfer Coefficient between Spraying Water
and a Hot Surface above the Leidenfrost Temperature. ISIJ Int. 1997, 37, 492–497. [CrossRef]18. Horsky, J.; Raudensky, M.; Tseng, A.A. Heat transfer study of secondary cooling in continuous casting. In Proceedings of the
AISTech 2005, Iron & Steel Technology Conference and Exposition, Charlotte, NC, USA, 9–12 May 2005.19. Hernández, B.A.; Minchaca, M.J.I.; Castillejos, E.A.H.; Acosta, G.F.A.; Xiaoxu, Z.; Thomas, B.G. Measurement of heat flux in
dense air-mist cooling: Part II—The influence of mist characteristics on steady-state heat transfer. Exp. Therm. Fluid Sci. 2013, 44,161–173. [CrossRef]
20. Mario, E.H.L.; Esther, M.G.M.; Castillejos, E.A.H. Heat Transfer and Observation of Droplet-Surface Interactions During Air-MistCooling at CSP Secondary System Temperatures. Metall. Mater. Trans. B 2016, 47, 1409.
21. Mishra, P.C.; Nayak, S.K.; Pradhan, P.; Durga, P.G. Impingement Cooling of Hot Metal Strips in Runout Table—A Review. Interfac.Phenom. Heat Transfer 2015, 3, 117–137. [CrossRef]
22. Gradeck, M.; Kouachi, A.; Lebouche, M.; Volle, F.; Maillet, D.; Borean, J.L. Boiling curves in relation to quenching of a hightemperature moving surface with liquid jet impingement. Int. J. Heat Mass Transf. 2009, 52, 1094. [CrossRef]
23. Islam, M.A.; Monde, M.; Woodfield, P.L.; Mitsutake, Y. Jet impingement quenching phenomena for hot surfaces well above thelimiting temperature for solid–liquid contact. Int. J. Heat Mass Transf. 2008, 51, 1226. [CrossRef]
24. Balachandar, S.; Eaton, J.K. Turbulent dispersed multiphase flow. Annu. Rev. Fluid Mech. 2010, 42, 111–133. [CrossRef]25. Crowe, C.T.; Schwarzkopf, J.D.; Sommerfeld, M.; Tsuji, Y. Multiphase Flows with Droplets and Particles; CRC Press: Boca Raton, FL,
USA, 2011.26. Elghobashi, S. Particle-laden turbulent flows: Direct simulation and closure models. Appl. Sci. Res. 1991, 48, 301–314. [CrossRef]27. Elghobashi, S. On predicting particle-laden turbulent flows. Appl. Sci. Res. 1994, 52, 309–329. [CrossRef]28. Elghobashi, S.; Truesdell, G.C. Direct simulation of particle dispersion in a decaying isotropic turbulence. J. Fluid Mech. 1992, 242,
655–700. [CrossRef]29. Maxey, M.R. The gravitational settling of aerosol particles in homogeneous turbulence and random flow fields. J. Fluid Mech.
1987, 174, 441–465. [CrossRef]30. Squires, K.D.; Eaton, J.K. Preferential concentration of particles by turbulence. Phys. Fluids A 1991, 3, 1169–1179. [CrossRef]31. Momenifar, M.; Dhariwal, R.; Bragg, A.D. Influence of Reynolds number on the motion of settling, bidisperse inertial particles in
turbulence. Phys. Rev. Fluids 2019, 4, 054301. [CrossRef]
Energies 2021, 14, 7339 25 of 27
32. Bec, J.; Homann, H.; Ray, S.S. Gravity-Driven Enhancement of Heavy Particle Clustering in Turbulent Flow. Phys. Rev. Lett. 2014,112, 184501. [CrossRef]
33. Ireland, P.J.; Bragg, A.D.; Collins, L.R. The effect of Reynolds number on inertial particle dynamics in isotropic turbulence. Part 2.Simulations with gravitational effects. J. Fluid Mech. 2016, 796, 659. [CrossRef]
34. Dhariwal, R.; Bragg, A.D. Enhanced and suppressed multiscale dispersion of bidisperse inertial particles due to gravity. Phys.Rev. Fluids 2019, 4, 034302. [CrossRef]
35. Zhou, Y.; Wexler, A.S.; Wang, L.P. Modelling turbulent collision of bidisperse inertial particles. J. Fluid Mech. 2001, 433, 77.[CrossRef]
36. Chen, J.; Jin, G. Large-eddy simulation of turbulent preferential concentration and collision of bidisperse heavy particles inisotropic turbulence. Powder Technol. 2017, 314, 281. [CrossRef]
37. Kruis, F.E.; Kusters, K.A. The collision rate of particles in turbulent flow. Chem. Eng. Commun. 1997, 158, 201. [CrossRef]38. Wang, L.P.; Maxey, M.R. Settling velocity and concentration distribution of heavy particles in homogeneous isotropic turbulence.
J. Fluid Mech. 1993, 256, 27. [CrossRef]39. Bec, J.; Biferale, L.; Boffetta, G.; Celani, A.; Cencini, M.; Lanotte, A.S.; Musacchio, S.; Toschi, F. Acceleration statistics of heavy
particles in turbulence. J. Fluid Mech. 2006, 550, 349. [CrossRef]40. Ayyalasomayajula, S.; Warhaft, Z.; Collins, L.R. Modeling inertial particle acceleration statistics in isotropic turbulence. Phys. Fluids
2008, 20, 095104. [CrossRef]41. Chang, K.; Malec, B.J.; Shaw, R.A. Turbulent pair dispersion in the presence of gravity. New J. Phys. 2015, 17, 033010. [CrossRef]42. Alam, U.; Krol, J.; Specht, E.; Schmidt, J. Enhancement and Local Regulation of Metal Quenching Using Atomized Sprays.
J. ASTM Int. 2008, 5, 91–103.43. Lefebvre, A.H.; McDonell, V.G. Atomization and Sprays; CRC Press: Boca Raton, FL, USA, 2017.44. Mitsutsuka, M.; Fukuda, K. Boiling phenomena and effects of water temperature on heat transfer in the process of immersion
cooling. Tsetsu Hagane 1979, 65, 608–616. [CrossRef]45. Mitsutsuka, M.; Fukuhisa, Y.; Wake, M.; Okajima, M.; Miyashita, N.; Takeda, Y. Development of Air-atomizing Mist Nozzles and
Mist Cooling System for Continuous Casting. Trans. ISIJ 1985, 25, 1244–1250. [CrossRef]46. Jeschar, R.; Reiners, U.; Scholz, R. Heat Transfer During Water and Water-Air Spray Cooling in the Secondary Cooling Zone
of Continuous Casting Plants. In Proceedings of the 69th Steelmaking Conference, Washington, DC, USA, 6–9 April 1986;pp. 511–521.
47. Raudensky, M.; Horsky, J. Secondary cooling in continuous casting and Leidenfrost temperature effects. Ironmak. Steelmak. 2005,32, 159–164. [CrossRef]
48. Horský, J.; Raudenský, M. Measurement of heat transfer characteristics of secondary cooling in continuous casting. Metal 2005,24–26.5.
49. McGinnis, F.K.; Holman, J.P. Individual droplet heat-transfer rates for splattering on hot surfaces. Int. J. Heat Mass Transf. 1969,12, 95–108. [CrossRef]
50. Pedersen, C.O. An experimental study of the dynamic behavior and heat transfer characteristics of water droplets impingingupon a heated surface. Int. J. Heat Mass Transf. 1970, 13, 369–379. [CrossRef]
51. Araki, K.; Moriyama, A. Theory on Deformation Behaviour of a Liquid Droplet Impinging onto Hot Metal Surface. Trans. ISIJ1981, 21, 583–590. [CrossRef]
52. Wachters, L.H.J.; Westerling, N.A. The heat transfers from a hot wall to impinging mist droplets in the spheroidal state. Chem.Eng. Sci. 1966, 21, 1047–1056. [CrossRef]
53. Prinz, B.; Bamberger, M. Determination of heat transfer coefficient of air mist sprays. Mater. Sci. Technol. 1989, 5, 389–393.[CrossRef]
54. Jenkins, M.S.; Story, S.R.; Davies, R.H. Measurement and Characterisation of Air-Mist Nozzles for Spray Quenching Heat Transfer.In Proceedings of the 19th Australasian Chemical Engineering Conference, Newcastle, UK, 18–20 September 1991; pp. 161–169.
55. Puschmann, F.; Specht, E. Transient measurement of heat transfer in metal quenching with atomized sprays. Exp. Therm. Fluid Sci.2004, 28, 607–615. [CrossRef]
56. Bendig, L.; Raudensky, M.; Horsky, J. Spray parameters and heat transfer coefficients of spray nozzles for continuous casting.In Proceedings of the Seventy-Eight Steelmaking Conference, Iron and Steel Society, Nashville, TN, USA, 2–5 April 1995;pp. 391–398.
57. Montes, R.J.J.; Castillejos, E.A.H.; Acosta, G.F.A.; Gutiérrez, M.E.P.; Herrera, G.M.A. Effect of the operating conditions of air-mistsnozzles on the thermal evolution of continuously cast thin slabs. Can. Metall. Q. 2008, 47, 187–204.
58. Castillejos, E.A.H.; Acosta, G.F.A.; Herrera, M.A.; Hernández, C.I.; Gutiérrez, M.E.P. Practical productivity gains—Towards abetter understanding of air-mist cooling in thin slab continuous casting. In Proceedings of the Third International Congress ofSteelmaking, Association of Iron and Steel Technology, Charlotte, NC, USA, 9–12 May 2005; pp. 881–890.
59. Schmidt, J.; Boye, H. Influence of velocity and size of the droplets on the heat transfer in spray cooling. Chem. Eng. Technol. 2001,24, 255–260. [CrossRef]
60. Haibo, M.; Armin, S.; Chenn, Z. Numerical Development of Heat Transfer Coefficient Correlation for Spray Cooling in ContinuousCasting. Front. Mater. 2020, 7, 577265.
Energies 2021, 14, 7339 26 of 27
61. Mascarenhas, N.; Mudawar, I. Methodology for predicting spray quenching of thick-walled metal alloy tubes. Int. J. Heat MassTransfer 2012, 55, 2953–2964. [CrossRef]
62. Agnieszka, C.R.; Zbigniew, M.; Andrzej, B. The influence of selected parameters of spray cooling and thermal conductivity onheat transfer coefficient. Int. J. Therm. Sci. 2016, 110, 52–64.
63. Haibo, M.; Rui, L.; Micheal, L.; Armin, S.; Chenn, Z. Numerical Investigation of Spray Cooling at Various Operation Conditionsduring Continuous Casting of Steel. In Proceedings of the AISTech Conference, Pittsburgh, PA, USA, 6–9 May 2019.
64. Nukiyama, S.; Tansawa, Y. Experiments on the atomization of liquids in anatomized jet. Trans. Soc. Mech. Engrs. (Japan) 1939, 6,II-7, II-15.
65. Zeoli, N.; Tabbara, H.; Gu, S. CFD Modeling of Primary Breakup during Metal Powder Spray. Chem. Eng. Sci. 2011, 66, 6498–6504.[CrossRef]
66. Altimira, M.; Rivas, A.; Anton, R.; Sanchez, L.G.; Ramos, J.C. Fan-Spray Atomizers Analysis through Mathematical Modeling. InProceedings of the ILASS-Europe Conferences, Mugla, Turkey, 10–13 September 2007.
67. Koutsakis, K.; Gu, S.; Vardelle, A. Three Dimensional CFD Simulation of Liquid Copper Break up for the Liquid PrecursorSpraying. Surf. Coat. Technol. 2011, 220, 214–218. [CrossRef]
68. Kalata, W.; Brown, K.; O’Donnell, S.; Schick, R.J. Transfer Efficiency for an Oil Spray Application. In Proceedings of the 26thILASS Americas Annual Conference on Liquid Spray and Spray Systems, Portland, OR, USA, 16–19 May 2016.
69. Alkhedhair, A.; Jahn, I.; Gurgenci, H.; Guan, Z.; He, S.; Lu, Y. Numerical Simulation of Water Spray in Natural Draft Dry CoolingTowers with a New Nozzle Representation Approach. Appl. Therm. Eng. 2016, 98, 924–935. [CrossRef]
70. Crowe, C.T.; Sharma, M.P.; Stock, D.E. The Particle-Source-In Cell (PSI-CELL) Model for Gas-Droplet Flows. J. Fluids Eng. 1977,99, 325–332. [CrossRef]
71. Zuckerman, N.; Lior, N. Jet impingement heat transfer: Physics, correlations, and numerical modeling. Adv. Heat Transfer 2006,39, 565.
72. Menter, F.R. Multiscale model for turbulent flows. In Proceedings of the AIAA 24th Fluid Dynamics Confernce, Orlando, FL, USA,6–9 July 1993.
73. Ishii, M. Thermo-fluid Dynamics Theory of Two-phase Flow. Eyrolles Paris 1975, 75, 29657.74. Hirt, C.W.; Nichols, B.D. Volume of fluid (VOF) method for the dynamics of free boundaries. J. Comp. Phys. 1981, 39, 201.
[CrossRef]75. Kothe, D.B.; Mjolsness, R.C. RIPPLE: A new model for incompressible flows with free surfaces. AIAA J. 1992, 30, 2694. [CrossRef]76. Kothe, D.B.; Rider, W.J.; Mosso, S.J.; Brock, J.I.; Hochstein, J.S. Volume tracking of interfaces having surface tension in two and
three dimensions. In Proceedings of the AIAA 34th Aerospace Sciences Meeting and Exhibit, Reno, NV, USA, 15–18 January 1996.Paper 96-0859.
77. Richards, J.R.; Beris, A.N.; Lenhoff, A.M. Drop formation in liquid–liquid systems before and after jetting. Phys. Fluids 1995,7, 2617. [CrossRef]
78. Rayleigh, L. On the instability of jets. Proc. Lond. Math. Soc. 1878, 1, 4–13. [CrossRef]79. Reitz, R.D. Atomization and Other Breakup Regimes of a Liquid Jet. Ph.D. Thesis, Princeton University, Princeton, NJ, USA, 1978.80. Reitz, R.D. Modeling atomization processes in high-pressure vaporizing sprays. At. Spray Technol. 1987, 3, 309–337.81. Nijdam, J.J.; Guo, B.; Fletcher, D.F.; Langrish, T.A. Lagrangian and Eulerian models for simulating turbulent dispersion and
coalescence of droplets within a spray. Appl. Math. Model. 2006, 30, 1196–1211. [CrossRef]82. Fung, M.C.; Inthavong, K.; Yang, W.; Tu, J. CFD modeling of spray atomization for a nasal spray device. Aerosol. Sci. Technol.
2012, 46, 1219–1226. [CrossRef]83. Eroglu, H.; Chigier, N.; Farago, Z. Coaxial atomizer liquid intact lengths. Phys. Fluids A 1991, 3, 303–308. [CrossRef]84. Leroux, B.; Delabroy, O.; Lacas, F. Experimental study of coaxial atomizers scaling. Part I: Dense core zone. At. Sprays 2007, 17,
381–407. [CrossRef]85. Zhao, H.; Liu, H.F.; Tian, X.S. Influence of atomizer exit area ratio on the breakup morphology of coaxial air and round water jets.
AIChE J. 2014, 60, 2335–2345. [CrossRef]86. Engelbert, C.; Hardalupas, Y.; Whitelaw, J.H. Breakup phenomena in coaxial airblast atomizers. Proc. R. Soc. Lond. A 1995, 451,
189–229.87. Kumar, A.; Sahu, S. Liquid jet breakup unsteadiness in a coaxial air-blast atomizer. Int. J. Spray Combust. Dyn. 2018, 10, 211–230.
[CrossRef]88. O’Rourke, P.J.; Bracco, F.V. Modeling of Drop Interactions in Thick Sprays and Comparison with Experiments. Instit. Mech. Eng.
1980, 404, 80.89. Liu, A.B.; Mather, D.; Reitz, R.D. Modeling the Effects of Drop Drag and Breakup on Fuel Sprays. SAE Int. J. Eng. 1993, 102, 83–95.90. Ranz, W.E.; Marshall, W.R. Evaporation from Drops. Chem. Eng. Progress 1952, 48, 141–146.91. Naber, J.D.; Reitz, R.D. Modeling Engine Spray/Wall Impingement. SAE Int. J. Eng. 1988, 97, 118–140.92. Bernardin, J.D.; Mudawar, I. The Leidenfrost point: Experimental study and assessment of existing models. J. Heat Trans. 1999,
121, 894–903. [CrossRef]93. Miller, R.S.; Harstad, K.; Bellan, J. Evaluation of Equilibrium and Non-Equilibrium Evaporation Models for Many Droplet
Gas-Liquid Flow Simulations. Int. J. Multiphase Flow 1998, 24, 1025–1055. [CrossRef]
Energies 2021, 14, 7339 27 of 27
94. Sazhin, S.S. Advanced Models of Fuel Droplet Heating and Evaporation. Progress Energy Combust. Sci. 2006, 32, 162–214.[CrossRef]
95. Brackbill, J.U.; Kothe, D.B.; Zemach, C. A continuum method for modeling surface tension. J. Comput. Phys. 1992, 100, 335–354.[CrossRef]
96. Menter, F.R.; Kuntz, M.; Langtry, R. Ten years of experience with the SST turbulence model. Turbul. Heat Mass Transf. 2003, 4,625–632.
97. Patankar, S.V.; Spalding, D.B. A calculation procedure for heat, mass and momentum transfer in three-dimensional parabolicflows. Int. J. Heat Mass Transf. 1972, 15, 1787. [CrossRef]
98. Jadidi, M. Introduction to Multiphase Flows-Part#2 Fundamental Definitions & Choosing a Multiphase Model. Available online:https://www.researchgate.net/publication/312228367_Introduction_to_Multiphase_Flows-Part_2_Fundamental_Definitions_Choosing_a_Multiphase_Model (accessed on 4 June 2021).
99. Reitz, R.D.; Diwakar, R. Structure of high-pressure fuel sprays. SAE Paper 1987, 492–509.100. Spray Analysis and Research Services. Spray Characterization of Nozzles Used in Casting Application. Laboratory Test Report.
April 2016. Available online: https://www.sprayanalysis.com/ (accessed on 1 November 2021).101. Xiaoyi, L.; Marco, A.; Marcos, S.; Mark, S. Towards an efficient, high-fidelity methodology for liquid jet atomization computations.
In Proceedings of the 48th Aerospace Sciences Meeting, Orlando, FL, USA, 4–7 January 2010.102. Leong, M.Y.; Hautman, D.J. Near-field spray characterization of a liquid fuel jet injected into a crossflow. In Proceedings of the
ILASS Americas, 15th Annual Conference on Liquid Atomization and Spray Systems, Madison, WI, USA, 14–17 May 2002.103. Minchacha, M.J.I.; Castillejos, E.A.H.; Acosta, G.F.A. Size and velocity characteristics of droplets generated by thin steel slab
continuous casting secondary cooling air-mist nozzles. Metall. Mater. Trans. B 2011, 42, 500–515. [CrossRef]104. Yao, S.C.; Cox, T.L. Investigation into the Use of Large-Drop Sprays for Hot Strip Rolling Mills. In Proceedings of the Mechanical
Working and Steel Processing Conference, Pittsburgh, PA, USA, 25–28 October 1998; pp. 359–366.