Components of arterial systolic pressure and RR-interval oscillation spectra in a case of baroreflex...
10
ORIGINAL ARTICLE Components of arterial systolic pressure and RR-interval oscillation spectra in a case of baroreflex failure, a human open-loop model of vascular control L Guasti 1,4 , LT Mainardi 2,4 , G Baselli 2 , C Simoni 1 , M Cimpanelli 1 , SS Braga 3 , R Pedretti 3 , L Castiglioni 1 , L Maroni 1 , R Codari 1 , G Gaudio 1 , AM Grandi 1 , F Marino 1 , M Cosentino 1 and A Venco 1 1 Department of Clinical Medicine, University of Insubria, Varese, Italy; 2 Department of Biomedical Engineering, Politecnico di Milano, Milano, Italy and 3 Department of Cardiology, IRCCS Fondazione Maugeri, Tradate, Italy The baroreflex control of circulation is always operating and modulates blood pressure and heart rate oscilla- tions. Thus, the study of cardiovascular variability in humans is performed in a closed-loop model and the physiology of post-sinoaortic denervation is completely unknown in humans. We dissected for the first time the different components of systolic arterial pressure (SAP) and RR-interval spectra in a patient with ‘baroreflex failure’ (due to mixed cranial nerve neuroma) who represents a human model to investigate the cardiova- scular regulation in an open-loop condition. Interactions among cardiovascular variability signals and respiratory influences were described using the multivariate para- metric ARXAR model with the following findings: (1) rhythms unrelated to respiration were detected only at frequencies lower than classical low frequency (LF; Slow-LF, around 0.02 Hz) both in SAP an RR spectra, (2) small high-frequency (HF) modulation is present and related with respiration at rest and in tilt (but for SAP only) and (3) the Slow-LF fluctuations detected both in SAP and RR oscillate independently as the multivariate model shows no relationships between SAP and RR, and these oscillations are not phase related. Thus, we showed that in a patient with impaired baroreflex arc integrity the Slow-LF rhythms for RR have a central origin that dictates fluctuations on RR at the same rhythm but unrelated to the oscillation of SAP (which may be related with both peripheral activity and central rhythms). The synchronization in LF band is a hallmark of integrity of baroreflex arc whose impairment unmasks lower frequency rhythms in SAP and RR whose fluctua- tions oscillate independently. Journal of Human Hypertension (2010) 24, 417–426; doi:10.1038/jhh.2009.79; published online 12 November 2009 Keywords: heart rate variability; blood pressure spectral analysis; baroreflex control; baroreflex failure Introduction ‘Baroreflex failure’ is a relatively rare condition. Different possible manifestations are described, the most common pattern being hypertensive crisis, lasting minutes to hours, with profound general malaise, often accompanied by tachycardia. 1–3 Another presentation is volatile hypertension with baseline blood pressure normal to elevated between the hypertensive spells. A rare presentation is due to an increased parasympathetic tone and presents with severe bradycardia and hypotension, some- times leading to a syncope. 2,4 The peculiar physio- pathology of this syndrome is due to different degree of involvement of the baroreflex arc and in its most common presentation, the underlying lesion is due to the effect of deafferentation of the glossopha- ryngeal nerve and vagus, which convey information from sinoaortic baroreceptors. 2 The physiology of post-sinoaortic denervation is known only in part in animals and completely unknown in humans. 5,6 We studied the different components of systolic arterial pressure (SAP) and RR-interval spectra in a patient with baroreflex failure who represents a human model to investigate the cardiovascular regulation in an open-loop condition, both at resting and during stimulation by tilting. Received 28 May 2009; revised 26 July 2009; accepted 23 August 2009; published online 12 November 2009 Correspondence: Professor L Guasti, Internal Medicine, Depart- ment of Clinical Medicine, University of Insubria, Viale Borri 57, Varese 21100, Italy. E-mail: [email protected] 4 These authors contributed equally to this work. Journal of Human Hypertension (2010) 24, 417–426 & 2010 Macmillan Publishers Limited All rights reserved 0950-9240/10 $32.00 www.nature.com/jhh
-
Upload
independent -
Category
Documents
-
view
1 -
download
0
Transcript of Components of arterial systolic pressure and RR-interval oscillation spectra in a case of baroreflex...
ORIGINAL ARTICLE
Components of arterial systolic pressureand RR-interval oscillation spectra in acase of baroreflex failure, a humanopen-loop model of vascular control
L Guasti1,4, LT Mainardi2,4, G Baselli2, C Simoni1, M Cimpanelli1, SS Braga3, R Pedretti3,L Castiglioni1, L Maroni1, R Codari1, G Gaudio1, AM Grandi1, F Marino1, M Cosentino1
and A Venco1
1Department of Clinical Medicine, University of Insubria, Varese, Italy; 2Department of BiomedicalEngineering, Politecnico di Milano, Milano, Italy and 3Department of Cardiology, IRCCS Fondazione Maugeri,Tradate, Italy
The baroreflex control of circulation is always operatingand modulates blood pressure and heart rate oscilla-tions. Thus, the study of cardiovascular variability inhumans is performed in a closed-loop model and thephysiology of post-sinoaortic denervation is completelyunknown in humans. We dissected for the first time thedifferent components of systolic arterial pressure (SAP)and RR-interval spectra in a patient with ‘baroreflexfailure’ (due to mixed cranial nerve neuroma) whorepresents a human model to investigate the cardiova-scular regulation in an open-loop condition. Interactionsamong cardiovascular variability signals and respiratoryinfluences were described using the multivariate para-metric ARXAR model with the following findings:(1) rhythms unrelated to respiration were detected onlyat frequencies lower than classical low frequency (LF;Slow-LF, around 0.02 Hz) both in SAP an RR spectra,
(2) small high-frequency (HF) modulation is present andrelated with respiration at rest and in tilt (but for SAPonly) and (3) the Slow-LF fluctuations detected both inSAP and RR oscillate independently as the multivariatemodel shows no relationships between SAP and RR,and these oscillations are not phase related. Thus, weshowed that in a patient with impaired baroreflex arcintegrity the Slow-LF rhythms for RR have a centralorigin that dictates fluctuations on RR at the samerhythm but unrelated to the oscillation of SAP (whichmay be related with both peripheral activity and centralrhythms). The synchronization in LF band is a hallmarkof integrity of baroreflex arc whose impairment unmaskslower frequency rhythms in SAP and RR whose fluctua-tions oscillate independently.Journal of Human Hypertension (2010) 24, 417–426;doi:10.1038/jhh.2009.79; published online 12 November 2009
Keywords: heart rate variability; blood pressure spectral analysis; baroreflex control; baroreflex failure
Introduction
‘Baroreflex failure’ is a relatively rare condition.Different possible manifestations are described, themost common pattern being hypertensive crisis,lasting minutes to hours, with profound generalmalaise, often accompanied by tachycardia.1–3
Another presentation is volatile hypertension withbaseline blood pressure normal to elevated betweenthe hypertensive spells. A rare presentation is due to
an increased parasympathetic tone and presentswith severe bradycardia and hypotension, some-times leading to a syncope.2,4 The peculiar physio-pathology of this syndrome is due to different degreeof involvement of the baroreflex arc and in its mostcommon presentation, the underlying lesion is dueto the effect of deafferentation of the glossopha-ryngeal nerve and vagus, which convey informationfrom sinoaortic baroreceptors.2 The physiology ofpost-sinoaortic denervation is known only in partin animals and completely unknown in humans.5,6
We studied the different components of systolicarterial pressure (SAP) and RR-interval spectra in apatient with baroreflex failure who represents ahuman model to investigate the cardiovascularregulation in an open-loop condition, both at restingand during stimulation by tilting.
Received 28 May 2009; revised 26 July 2009; accepted 23 August2009; published online 12 November 2009
Correspondence: Professor L Guasti, Internal Medicine, Depart-ment of Clinical Medicine, University of Insubria, Viale Borri 57,Varese 21100, Italy.E-mail: [email protected] authors contributed equally to this work.
Journal of Human Hypertension (2010) 24, 417–426& 2010 Macmillan Publishers Limited All rights reserved 0950-9240/10 $32.00
www.nature.com/jhh

Materials and methods
PatientThe study of the various components of SAP andRR-interval oscillations was conducted at rest andduring tilting in a 67-year-old woman with knownbaroreflex failure. The clinical aspects of the casehave been already described.7 Briefly, initially herchief symptoms were hypertension crisis with meanblood pressure peaks exceeding 230/120 mm Hgwith the highest documented peak of 260/140 mm Hg and 90 beats per min. She also com-plained of several symptoms associated with thehypertensive spells, such as fatigue, malaise, irrit-ability, profuse sweating, tremulousness, dyspnoeaand abdominal pain, all of them lasting about 1 hand with a spontaneous recovery. Secondary formsof hypertension were excluded. Standard bloodpressure was repeatedly found between the normalrange and a 24-h ambulatory blood pressure mo-nitoring (Spacelabs 90207-30 with blood pressuresrecorded every 15 min; Spacelabs. Medical Inc.,Redmond, WA, USA) was performed and showedmean 24 h blood pressure of 125/68 mm Hg. Anechocardiogram showed normal parietal thicknessand function. The clinical and laboratory examina-tions excluded the presence of chronic diseases,including obesity, diabetes and heart diseases.The patient reported also swallowing impairment,mild dysphonia, cough and disruption in talking.During a few months after the first visit, the patientexperienced numerous episodes of hypertensivecrisis and repeatedly was investigated for secondaryforms of hypertension, particularly focusing on asuspected diagnosis of pheochromocytoma, withoutpositive findings.
Because the clinical pattern of hypertensive spellsand a single hypotensive episode reported by thepatient suggested a disorder of the regions relatedwith the vasomotor modulation, she was submittedto a basal and gadolinium magnetic resonanceimaging of the brain that revealed an extra-assialmass, localized in the inferior portions of thecisterna of the right ponto-cerebellar angulus. Thus,the patient was submitted to neurosurgery and thediagnosis of mixed cranial nerve neuroma (Schwan-noma) involving the glossopharyngeal nerve wasdetermined. On the basis of both the history and thefinding of anatomic involvement of the baroreflexarc, we made a presumptive diagnosis of baroreflexfailure that was confirmed by the pharmacologicalstudy of baroreflex function.8,9
Acquisition of electrocardiographic, blood pressureand respiratory signalsAfter the confirmed diagnosis of baroreflex failure,the patient was submitted to a continuous electro-cardiographic recording by means of a polygraph(Cardioline WS2000, Remco Italia, Mi, Italy) con-nected with a microcomputer and blood pressurewas obtained noninvasively by a plethysmographic
method (Finapres, Ohmeda, Japan), as previouslydescribed.10
The respiratory frequency was assessed by a nasalthermistor through a commercially available system(Healthdyne Tech 6260, Healthdyne Technology Inc.,Dublin, Ireland). The patient was studied duringfree breathing, without any controlled respiration.
We recorded 10 min of resting followed by a tiltingtest.11
Processing of physiological signalsExtraction of variability series. As previously de-scribed, QRS detection and RR-interval and respira-tion signal measurement were automaticallyperformed by the Cardioline WS2000 equipment.10
This algorithm looked for the R wave peak as areference point. Afterwards each QRS complex wasinterpolated by a parabolic curve. The R point waschosen to correspond with the maximum of theinterpolating parabola to improve the accuracy ofdetection of the peak R wave.12 The systolic bloodpressure value was automatically identified as themaximum of the parabolic curve fitting the pressuretracing. Finally, respiration amplitude was measuredin correspondence of R peak on the electrocardio-gram. The use of an interactive graphic interfaceallowed the operator to visually identify and correctpremature beats, missed beats and artefacts on RRseries. Corrections made on RR intervals determinedautomatic corrections in the SAP and respiratoryseries. In this way, a series of successive RR intervals(RR tachogram, t), a series of corresponding succes-sive SAP values (systogram, s) and a series ofrespiration amplitudes (respirogram, r) were obtained.
Processing of variability series. Interactions amongcardiovascular variability signals and respiratoryinfluences were described using the multivariateparametric ARXAR model of Figure 1. The followingrelationships are considered: (1) t and s affect each
Respiration
Sinus nodemodulation Baroreceptive
mechanisms
Vasomotionmodulation
SAPregulation
mechanical
Figure 1 Model for contemporaneous analysis of RR, systolicarterial pressure (SAP) and respiration beat-to-beat variabilityseries. See text for details.
Cardiovascular variability in baroreflex failureL Guasti et al
418
Journal of Human Hypertension

other in a closed loop; this describes the mechanicaleffect of RR on SAP and the feedback ascribed tobaroreceptive mechanisms; (2) a regression of s onits own past is considered; it lumps together allfeedbacks regulating SAP through mechanisms suchas arterial and venous compliances, arterial resi-stances, contractility and sympatho-sympathetic re-flexes; (3) respiration is seen as an exogenous inputand can affect separately t (cardiopulmonary reflexesor central drive) and s (modulation of venous return,thoracic pressure effects on afterload and barorecep-tors, etc). Finally, additional source of variability(residuals, ut and us) acting on t and s separately areincluded through all-poles model Mt and Ms.
13 In atime-domain description, both the t and s signals aredescribed as the output of prediction error models. Theforecast of t is obtained through a regression over pastsamples of s and r; the forecast of s is based on t, r and sitself as formalized by Baselli et al.14
In details, for s prediction:
sðiÞ ¼ hssð1Þsði � 1Þ þ . . .þ hssðpÞsði � pÞ þ hstð1Þt�ði � 1Þ þ hsrð0ÞrðiÞ þ . . .þ hsrðpÞrði � pÞþ usðiÞ;
where p is the model order; hss(1)yhss(p) theparameters of s autoregression; hst(1) the regressionparameter over the previous RR; hsr(0)yhsr(p) theparameters relevant to the past respiration samplesand i the temporal index.
For t prediction:
tðiÞ ¼ htsð1Þtði � 1Þ þ . . .þ htsðpÞtði � pÞ þ htrð0ÞrðiÞþ . . .þ htrðpÞrði � pÞ þ utðiÞ;
where hts(1)yhts(p) are the parameters of t regres-sion over SAP and htr(0)yhtr(p) the parametersrelevant to the past respiration samples.
The model (regression) parameters are identifiedby an iterative algorithm according to classicalgeneralized least-square method used for identifica-tion of dynamic adjustment models.15 Optimalmodel order was determined by Akaike informationcriterion. The advantage of using this model istwofold: in addition to classical spectral parameters(frequency and powers values in low frequency (LF)and high frequency (HF) bands), the application of amultivariate spectral decomposition method allowsto parcel the spectrum of each signal into partialspectra relevant to different inputs (for example the
50 100 150 200 250 300 350 400−20
0
20Ss
St
Sr
US
50 100 150 200 250 300 350 400−20
0
20
mm
Hg
50 100 150 200 250 300 350 400−20
0
20
mm
Hg
50 100 150 200 250 300 350 400−20
0
20
mm
Hg
time [# of beat]
0 0.1 0.2 0.3 0.40
100
200 PSD S
mm
Hg2
/Hz
mm
Hg2
/Hz
mm
Hg2
/Hz
mm
Hg2
/Hz
mm
Hg2
/Hz
0 0.1 0.2 0.3 0.40
100
200PSD Ss
0 0.1 0.2 0.3 0.40
10
20PSD St
PSD Sr
PSD Us
0 0.1 0.2 0.3 0.40
10
20
0 0.1 0.2 0.3 0.40
10
20
Frequency [Hz]
50 100 150 200 250 300 350 400−20
0
20S
Figure 2 Example of time-domain decomposition of systolic arterial pressure (SAP) series obtained from a normal subject at rest (left panels)and corresponding spectra (right panels). The SAP series (a) is decomposed in its components due to past-SAP values (b), RR (c), respiration(d) or other origin (e). Respiration affects the high frequency (HF) whereas most of the SAP variability is explained by its past values.
Cardiovascular variability in baroreflex failureL Guasti et al
419
Journal of Human Hypertension

r spectrum can be divided into contribute due to s, rof Mt). Different oscillating mechanisms, even ifmanifesting at similar frequencies, are separated bymodel identification and model poles classification.Moreover, after parameter identification, the im-pulse response of model blocks is known and themodel can be used to filter the series thus obtaining,for each signal, the time course of its components.14
An example obtained in a 56-year-old, nonsmoking,lean healthy woman is shown in Figure 2 (SAPvariability) and Figure 3 (RR variability). The a valuecalculated by the model in this normal case is10.41 ms/mm Hg. Finally, data of time-domain ana-lysis (mean, standard deviation (s.d.) and root-mean-square successive difference (RMSSD)) aredissected for each time-course signal components.
The authors had full access to the data and takeresponsibility for its integrity. All authors have readand agreed to the paper as written.
Results
As expected in a case of impaired baroreflex control,the ‘closed-loop’ a calculated by the model showed avery low value, both in resting and in tilting
conditions (0.51 and 0.02 ms/mm Hg, respectively)in agreement with our working hypothesis.
Resting stateFigure 4 shows the SAP time-domain variability (leftpanel) and its corresponding spectra (right panel).We observed a small component in HF, linked withrespiration through its effects on the tachogram(Figure 4, panel c). A high coherence is observed forthis component (Table 1). In addition, a Slow-LFoscillation (peak in 0.022 Hz; Table 1) related withinputs different from SAP, RR and respiration(Figure 4, panel e) was measured.
When the RR variability was dissected into theseparated parts (Figure 5), a similar respiratory-linked HF component was observed (Figure 5, panelc; high coherence in 0.27 Hz, see Table 1). A Slow-LF peak is also observed and its origin is mainlyrelated to the Mt block (ut residuals, panel d), withno contribution from SAP variability (Figure 5,panel c). Accordingly, although this Slow-LF peakis present with oscillations at the same frequency ofSAP, no constant phase relationships were detectedbetween these rhythms (very low coherence be-tween SAP and RR; see Table 1, k2¼ 0.45).
50 100 150 200 250 300 350 400
−100
0
100
ms
T
50 100 150 200 250 300 350 400
−100
0
100
Ts
Tr
ms
50 100 150 200 250 300 350 400
−100
0
100
ms
50 100 150 200 250 300 350 400
−100
0
100
Ut
ms
time [# of beat]
0 0.1 0.2 0.3 0.40
1
2
3
4x 104
x 104
x 104
x 104
ms
2 /H
zm
s 2 /
Hz
ms
2 /H
zm
s 2 /
Hz
PSD T
0 0.1 0.2 0.3 0.40
2
4PSD Ts
PSD Tr
PSD Ut
0 0.1 0.2 0.3 0.40
2
4
0 0.1 0.2 0.3 0.40
2
4
Frequency [Hz]
Figure 3 Example of time-domain decomposition of RR series obtained from a normal subject at rest (left panels) and correspondingspectra (right panels). The RR series (a) is decomposed in its components due to systolic arterial pressure (SAP) (b), respiration (c) orother origin (d), which describes independent effects on sinus node from neural modulation or any reflex mechanisms not driven by SAPor respiration. Respiration predominantly affects the high-frequency (HF) component; and the contribution of baroreflex is evident in thelow-frequency (LF) component.
Cardiovascular variability in baroreflex failureL Guasti et al
420
Journal of Human Hypertension
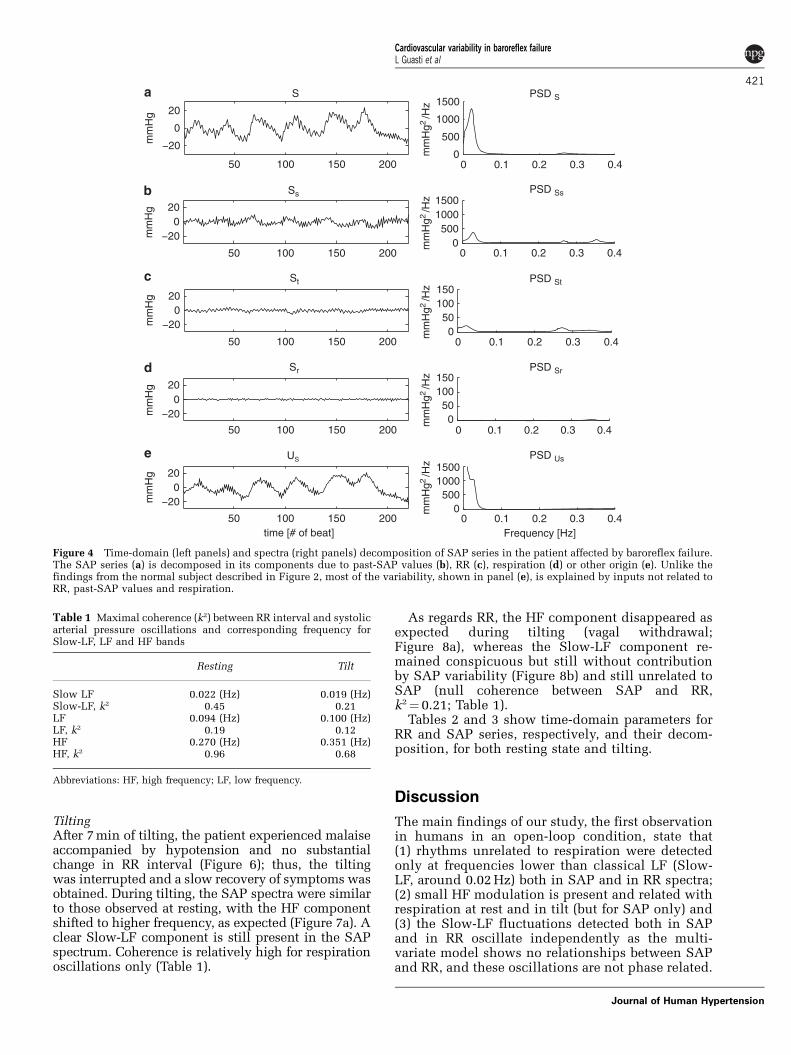
TiltingAfter 7 min of tilting, the patient experienced malaiseaccompanied by hypotension and no substantialchange in RR interval (Figure 6); thus, the tiltingwas interrupted and a slow recovery of symptoms wasobtained. During tilting, the SAP spectra were similarto those observed at resting, with the HF componentshifted to higher frequency, as expected (Figure 7a). Aclear Slow-LF component is still present in the SAPspectrum. Coherence is relatively high for respirationoscillations only (Table 1).
As regards RR, the HF component disappeared asexpected during tilting (vagal withdrawal;Figure 8a), whereas the Slow-LF component re-mained conspicuous but still without contributionby SAP variability (Figure 8b) and still unrelated toSAP (null coherence between SAP and RR,k2¼ 0.21; Table 1).
Tables 2 and 3 show time-domain parameters forRR and SAP series, respectively, and their decom-position, for both resting state and tilting.
Discussion
The main findings of our study, the first observationin humans in an open-loop condition, state that(1) rhythms unrelated to respiration were detectedonly at frequencies lower than classical LF (Slow-LF, around 0.02 Hz) both in SAP and in RR spectra;(2) small HF modulation is present and related withrespiration at rest and in tilt (but for SAP only) and(3) the Slow-LF fluctuations detected both in SAPand in RR oscillate independently as the multi-variate model shows no relationships between SAPand RR, and these oscillations are not phase related.
−20
0
20
mm
Hg
S
50 100 150 200
50 100 150 200
50 100 150 200
50 100 150 200
50 100 150 200
0 0.1 0.2 0.3 0.4
0 0.1 0.2 0.3 0.4
0 0.1 0.2 0.3 0.4
0 0.1 0.2 0.3 0.4
0 0.1 0.2 0.3 0.4
−200
20
mm
Hg
−200
20
mm
Hg
−200
20
mm
Hg
−200
20
mm
Hg
time [# of beat]
0
500
1000
1500PSD S
PSD Ss
PSD St
PSD Sr
PSD Us
0500
10001500
050
100150
050
100150
0500
10001500
Frequency [Hz]
Ss
St
Sr
US
mm
Hg2
/Hz
mm
Hg2
/Hz
mm
Hg2
/Hz
mm
Hg2
/Hz
mm
Hg2
/Hz
Figure 4 Time-domain (left panels) and spectra (right panels) decomposition of SAP series in the patient affected by baroreflex failure.The SAP series (a) is decomposed in its components due to past-SAP values (b), RR (c), respiration (d) or other origin (e). Unlike thefindings from the normal subject described in Figure 2, most of the variability, shown in panel (e), is explained by inputs not related toRR, past-SAP values and respiration.
Table 1 Maximal coherence (k2) between RR interval and systolicarterial pressure oscillations and corresponding frequency forSlow-LF, LF and HF bands
Resting Tilt
Slow LF 0.022 (Hz) 0.019 (Hz)Slow-LF, k2 0.45 0.21LF 0.094 (Hz) 0.100 (Hz)LF, k2 0.19 0.12HF 0.270 (Hz) 0.351 (Hz)HF, k2 0.96 0.68
Abbreviations: HF, high frequency; LF, low frequency.
Cardiovascular variability in baroreflex failureL Guasti et al
421
Journal of Human Hypertension

50 100 150 200−100
−50
0
50
100
ms
T
Ts
Tr
Ut
50 100 150 200−100
0
100
ms
50 100 150 200−100
0
100
ms
50 100 150 200−100
0
100
ms
time [# of beat]
0 0.1 0.40
1000
2000
3000
4000
ms2
/Hz
ms2
/Hz
ms2
/Hz
ms2
/Hz
PSD T
PSD Ts
PSD Tr
PSD Ut
0 0.1 0.2 0.3
0.2 0.3
0.40
2000
4000
0 0.1 0.2 0.3 0.40
2000
4000
0 0.1 0.2 0.3 0.40
2000
4000
Frequency [Hz]
Figure 5 Time-domain (left panels) and spectra (right panels) decomposition of RR series in the patient affected by baroreflex failure.The RR series (a) is decomposed in its components due to systolic arterial pressure (SAP) (b), respiration (c) or other origin (d). Unlike thefindings from the normal subject described in Figure 3, the absence of any influence of SAP in the low-frequency (LF) band is clearlyshown in panel b, and it is a hallmark of impaired interaction between these two signals.
5 10 15 20
5 10 15 20
0.8
0.9
1
1.1
1.2Tachogram
time (min)
r (s
ec)
0.8
50
100
150
200Systogram
time (min)
s (m
mH
g)
REST
TILT
RECOVERY
Figure 6 The figure shows the tachogram (upper panel) and the systogram (lower panel) of the complete recording at baseline andduring tilting. The absence of any RR variation in relationship with the drop of systolic blood pressure occurring during tilting is evident.
Cardiovascular variability in baroreflex failureL Guasti et al
422
Journal of Human Hypertension

In case of baroreflex failure, the loss of bufferingability is usually secondary to iatrogenic causes suchas carotid body tumour resection, neck irradiation,surgical section of glossopharyngeal nerve, carotidbypass surgery and unilateral or bilateral carotidendarterectomy.16–22 Moreover, rare reports describethis syndrome as due to degenerative neurologicaldisorders or genetic diseases.23–27 In our patient, theimpairment in baroreceptor reflex was due to aposterior fossa tumour, as already described.7
Animal studies reported that arterial baroreceptordenervation induces selective changes in the spec-trum of RR and SAP variability, suggesting that thebaroreceptor reflex exerts its major buffering effecton the very low-frequency (VLF) fluctuations.28
However, interspecies major differences were re-ported.28 Our results obtained in a patient withbaroreflex failure show in a human model of open-loop condition that the integrity of the baroreflex arcis required to maintain fluctuation in LF band atfrequencies higher than 0.03 Hz. Reduction of fasterLF oscillations has been observed in several animalstudies after sinoaortic denervation.5,29,30 Most ofthese studies evidenced that the spectrum ofvariability in a condition of post-sinoaortic denerva-
tion was concentrated in the VLF.5 In our study, thenumber of stable cycle guarantees the appropriate-ness of acquisition length, especially consideringthat spectral analysis was performed by an auto-regressive-based method whose spectral resolutiondoes not depend on the series length.
Moreover, although Slow-LF fluctuations wereobserved both in SAP and in RR spectra, when thecomponents of spectra were dissected by using themultivariate parametric model, no effect of SAPvariability was observed on the tachogram whereasRR oscillations mildly affected SAP fluctuations.Moreover, null coherence was observed between thepressure and RR series in the Slow-LF band. In linewith our results, a recent report in mice submitted toacute sinoaortic denervation showed high coher-ence between SAP and RR variabilities for the HFcomponent whereas in LF/VLF band no coherencewas observed.6
In animals, the increased blood pressure varia-bility associated with sinoaortic denervationwas reduced by ganglionic block.31 VLF in bloodpressure was related to increased plasma epine-phrine levels in sympathectomized rats and cate-cholamine infusion generated VLF fluctuations in
50 100 150 200 250−20
0
20
S
mm
Hg
50 100 150 200 250
−20
0
20
Ss
St
Sr
Us
mm
Hg
50 100 150 200 250
−20
0
20
mm
Hg
50 100 150 200 250
−20
0
20
mm
Hg
50 100 150 200 250
−20
0
20
mm
Hg
time [# of beat]
0 0.1 0.2 0.3 0.40
200
400
PSD S
PSD Ss
PSD St
PSD Sr
PSD Us
mm
Hg
2 /H
zm
mH
g 2 /
Hz
mm
Hg
2 /H
zm
mH
g 2 /
Hz
mm
Hg
2 /H
z
0
500
0 0.1 0.2 0.3 0.4
0 0.1 0.2 0.3 0.4
0
500
0 0.1 0.2 0.3 0.4 0
500
0 0.1 0.2 0.3 0.40
500
Frequency [Hz]
Figure 7 Time-domain (left panels) and spectra (right panels) decomposition of systolic arterial pressure (SAP) series in the patientaffected by baroreflex failure during tilting. The SAP series (a) is decomposed in its components due to past-SAP values (b), RR (c),respiration (d) or other origin (e).
Cardiovascular variability in baroreflex failureL Guasti et al
423
Journal of Human Hypertension

blood pressure, suggesting an adrenergic origin ofVLF.32 Possibly, the unrestrained central rhythmsobserved in our case in presence of damageof the baroreflex arc may be linked to the centralsympathetic outflow. This interpretation of ourdata is in agreement with the anatomical findingof destruction of sympathetic inhibitory centers(nucleus tractus solitarii) with sparing of centers
that exert a positive modulation on the sympathetictone described in a patient with baroreflex failuredue to central nervous system lesions.27
Concerning the slow SAP waves, it shouldbe emphasized that our model does not possess
50 100 150 200 250−100
−50
0
50
100T
ms
50 100 150 200 250−100
0
100Ts
ms
50 100 150 200 250−100
0
100Tr
ms
50 100 150 200 250−100
0
100Ut
ms
time [# of beat]
0 0.1 0.2 0.3 0.40
0.5
1
1.5
2x 104
x 104
x 104
x 104
ms2 /
Hz
ms2 /
Hz
ms2 /
Hz
ms2 /
Hz
PSD T
PSD Ts
PSD Tr
PSD Ut
0
1
2
0 0.1 0.2 0.3 0.4
0 0.1 0.2 0.3 0.4
0
1
2
0 0.1 0.2 0.3 0.40
1
2
Frequency [Hz]
Figure 8 Time-domain (left panels) and spectra (right panels) decomposition of RR series in the patient affected by baroreflex failureduring tilting. The RR series (a) is decomposed in its components due to systolic arterial pressure (SAP) (b), respiration (c) or otherorigin (d).
Table 2 Time-domain parameters for RR series and theirdecomposition
Mean (ms) s.d. (ms) RMSSD (ms)
Restt 1072 19.37 23.55ts — 7.74 11.63tr — 5.41 7.69ut — 16.46 18.06
Tiltt 932 16.39 9.55ts — 4.34 5.60tr — 2.00 1.69ut — 15.23 4.16
Abbreviations: t, tachogram RR series; ts, tachogram component dueto systogram; tr, tachogram component due to respiration; ut,tachogram component due to other origin.
Table 3 Time-domain parameters for SAP series and theirdecomposition
Mean (mm Hg) s.d. (mm Hg) RMSSD (mm Hg)
Rests 131 8.64 4.27ss — 3.28 4.54st — 1.95 2.37sr — 0.84 1.49us — 6.96 4.16
Tilts 109 5.51 4.60ss — 5.15 5.99st — 0.17 0.11sr — 2.86 4.98us — 3.29 5.16
Abbreviations: s, systogram SAP series; ss, systogram component dueto its past values; st, systogram component due to tachogram; sr,systogram component due to respiration; us, systogram componentdue to other origin.
Cardiovascular variability in baroreflex failureL Guasti et al
424
Journal of Human Hypertension

enough information to disentangle spontaneousvasomotor activity from centrally driven one, lea-ving open both hypotheses and also a mixed oneinvolving a synchronization of peripheral activity bycentral rhythms.33 The hypothesis of centralrhythms in SAP and RR oscillations has beensupported by animals and human studies, and thepresence of both supraspinal oscillators and spinalstructures has been suggested in modulating thesympathetic outflow.34–36 Because in our study theprominent component of variability observed in theSAP and RR spectra are independent, we showedthat in a patient with impaired baroreflex arcintegrity the Slow-LF rhythms for RR have a centralorigin that dictates fluctuations on RR at the samerhythm but unrelated to the oscillation of SAP.
It has to be acknowledged that, due to the rarity ofthis disease, we report the results obtained in anindividual patient and therefore our results may notapply to other forms of baroreflex failure. Moreover,the patient described here did not show potentialconfounding diseases acting on baroreflex functionsuch as metabolic or cardiac diseases and, althoughreferring for hypertensive spells, resting bloodpressure was within the normal range. As regardsthe potential effects of age on baroreflex sensitivity,significantly higher values of baroreflex responsewere reported in subjects older than our patient.37
Therefore, with the above-mentioned limitations,our study sheds a new light on the cardiovascularphysiology, showing in a human model of open-loopcondition that the rhythms unrelated to respirationin the classical LF band of SAP and RR variabilitiesdepend on the baroreflex control and that synchro-nization in this band is a hallmark of integrity ofbaroreflex arc whose impairment unmasks lowerfrequency rhythms in SAP and RR whose fluctua-tions oscillate independently.
Conflict of interest
The authors declare no conflict of interest.
References
1 Robertson D, Hollister AS, Biaggioni I, Netterville JL,Mosqueda-Garcia R, Robertson RM. The diagnosis andtreatment of baroreflex failure. N Engl J Med 1993; 329:1449–1455.
2 Ketch T, Biaggioni I, Robertson RM, Robertson D. Fourfaces of baroreflex failure. Hypertensive crisis, volatilehypertension, orthostatic tachycardia, and malignantvagotonia. Circulation 2002; 105: 2518–2523.
3 Manger WM. Baroreflex failure—a diagnostic chal-lenge. N Engl J Med 1994; 329: 1494–1495.
4 Jordan J, Shannon JR, Black BK, Costa F, Ertl AC,Furlan R et al. Malignant vagotonia due to selectivebaroreflex failure. Hypertension 1997; 30: 1072–1077.
5 Dworkin BR, Tang X, Snyder AJ, Dworkin S. Carotidand aortic baroreflexes of the rat: II. Open-loopfrequency response and the blood pressure spectrum.Am J Physiol Regul Integ Comp Physiol 2000; 279:R1922–R1933.
6 Fazan R, de Oliveira M, da Silva VJD, Joaquim LF,Montano N, Porta A et al. Frequency-dependentbaroreflex modulation of blood pressure and heart ratevariability in conscious mice. Am J Physiol Heart CircPhysiol 2005; 289: H1968–H1975.
7 Guasti L, Simoni C, Scamoni C, Sarzi Braga S, Crespi C,Cimpanelli M et al. Mixed cranial nerve neuromarevealing itself as baroreflex failure. Auton Neurosci2006; 130: 57–60.
8 Eckberg DL, Sleight P. Human Baroreflex in Health andDisease. Clarendon Press: Oxford, 1992.
9 La Rovere MT, Bigger JT, Marcus FI, Mortara A,Schwartz PJ, For the ATRAMI (Autonomic ToneReflexes After Myocardial Infarction) Investigators.Baroreflex sensitivity and heart rate variability inprediction of total cardiac mortality after myocardialinfarction. Lancet 1998; 351: 478–484.
10 Guasti L, Simoni C, Mainardi L, Crespi C, CimpanelliM, Klersy C et al. Global link between heart rate andblood pressure oscillations at rest and during mentalarousal in normotensive and hypertensive subjects.Auton Neurosci 2005; 120: 80–87.
11 Benditt DG, Ferguson DW, Grubb BP, Kapoor WN,Kugler J, Lerman BB et al. Tilt table testing forassessing syncope. ACC expert consensus document,1996. J Am Coll Cardiol 1996; 28: 263–275.
12 Baselli G, Cerutti S. Identification techniques appliedto processing of signals from cardiovascular system.Med Inf (Lond) 1985; 10: 223–235.
13 Baselli G, Porta A, Rimoldi O, Pagani M, Cerutti S.Spectral decomposition in multichannel recordingsbased on multivariate parametric identification. IEEETrans Biomed Eng 1997; 44: 1092–1101.
14 Baselli G, Porta A, Cerutti S, Caiani EG, Lucini D,Pagani M. RR-arterial pressure variability relation-ships. Auton Neurosci 2001; 90: 57–65.
15 Ljung L. System Identification: Theory for the User.Englewood Cliffs, Prentice-Hall: NY, 1999.
16 Timmers HJLM, Wieling W, Karemaker JM, LendersJWM. Denervation of carotid baro- and chemoreceptorsin humans. J Physiol 2003; 553.1: 3–11.
What is known about topicK ‘Baroreflex failure’ is a relatively rare condition.K The peculiar physiopathology of this syndrome is due to
different degree of involvement of the baroreflex arc andcommonly is due to deafferentation of the glossopharyngealnerve and vagus, which convey information from sinoaorticbaroreceptors.
K The physiology of post-sinoaortic denervation is known onlyin part in animals and completely unknown in humans.
What this study addsK The knowledge of the different components of systolic arterial
pressure (SAP) and RR-interval spectra in a patient withbaroreflex failure, a human model to investigate thecardiovascular regulation in an open-loop condition.
K Rhythms unrelated to respiration were detected only atfrequencies lower than classical low frequency (LF) (Slow-LF,around 0.02 Hz) both in SAP and in RR spectra. Small high-frequency (HF) modulation is present and related withrespiration at rest and in tilt (but for SAP only).
K The Slow-LF fluctuations detected in both SAP and RRoscillate independently as the multivariate model shows norelationships between SAP and RR, and these oscillations arenot phase related.
Cardiovascular variability in baroreflex failureL Guasti et al
425
Journal of Human Hypertension

17 Timmers HJLM, Karemaker JM, Wieling W,Marres HAM, Folgering HTM, Lenders JWM.Baroreflex and chemoreflex function after bilateralcarotid body tumour resection. J Hypertens 2003; 21:591–599.
18 Timmers HJLM, Karemaker JM, Wieling W, MarresHAM, Lenders JWM. Baroreflex control of musclesympathetic nerve activity after carotid body tumorresection. Hypertension 2003; 42: 143–149.
19 Sharabi Y, Dendi R, Holmes C, Goldstein DS. Barore-flex failure as a late sequela of neck irradiation.Hypertension 2003; 42: 110–116.
20 Towne JB, Bernhard VM. The relationship of post-operative hypertension to complications followingcarotid endarterectomy. Surgery 1980; 88: 575–580.
21 Diez Porres L, Garcia Iglesias F, Perez Martin G, GarciaPuig J, Gil Aguado A. Multiple paraganglioma: carefulwith surgery. Rev Clin Esp 2003; 203: 434–438.
22 Heusser K, Tank J, Luft FC, Jordan J. Baroreflex failure.Hypertension 2005; 45: 834–839.
23 Schuster H, Wienker TF, Toka HR, Bahring S, Jeschke E,Toka O et al. Autosomal dominant hypertension andbrachydactyly in a Turkish kindred resembles essentialhypertension. Hypertension 1996; 28: 1085–1092.
24 Jordan J, Toka HR, Heusser K, Toka O, Shannon JR,Tank J et al. Severely impaired baroreflex-buffering inpatient with monogenic hypertension and neurovas-cular contact. Circulation 2000; 102: 2611–2618.
25 Milunsky J, DeStefano AL, Huang XL, Baldwin CT,Michels VV, Jako G et al. Familiar paragangliomas:linkage to chromosome 11q23 and clinical implica-tions. Am J Med Genet 1997; 72: 66–70.
26 Phillips AM, Jardine DL, Parkin PJ, Hughes T,Ikram H. Brain stem stroke causing baroreflexfailure and paroxymal hypertension. Stroke 2000; 31:1997–2001.
27 Biaggioni I, Whetsell WO, Jobe J, Nadeau JH. Barore-flex failure in a patient with central nervous systemlesions involving the nucleus-tractus-solitarii. Hyper-tension 1994; 23: 491–495.
28 Lanfranchi PA, Somers VK. Arterial baroreflex func-tion and cardiovascular variability: interactions andimplications. Am J Physiol Regul Integr Comp Physiol2002; 283: R815–R826.
29 Cerutti C, Barres C, Paultre C. Baroreflex modulation ofblood pressure and heart rate variabilities in rats:assessment by spectral analysis. Am J Physiol HeartCirc Physiol 1994; 266: H1993–H2000.
30 Jacob HJ, Ramanathan A, Pan SG, Brody MJ, Myers GA.Spectral analysis of arterial pressure lability in ratswith sinoaortic deafferentation. Am J Physiol RegulIntegr Comp Physiol 1995; 268: R1481–R1488.
31 Dworkin BR, Dworkin S, Tang X. Carotid and aorticbaroreflexes of the rat: I. Open-loop steady-stateproperties and blood pressure variability. Am J PhysiolRegul Integr Comp Physiol 2000; 279: R1910–R1921.
32 Radaelli A, Castiglioni P, Centola M, Cesana F, BalestriG, Ferrari AU et al. Adrenergic origin of very low-frequency blood pressure oscillations in the una-nesthetized rat. Am J Physiol Heart Circ Physiol2006; 290: H357–H364.
33 Baselli G, Porta A, Pagani M. Coupling arterial wind-kessel with peripheral vasomotion: modeling theeffects on low frequency oscillations. IEEE TransBiomed Eng 2006; 53: 53–64.
34 Massimini M, Porta A, Mariotti M, Malliani A,Montano N. Heart rate variability is encoded in thespontaneous discharge of thalamic somatosensoryneurones in cat. J Physiol 2000; 526: 387–396.
35 Montano N, Lombardi F, Gnecchi Ruscone T, ContiniM, Finocchiaro ML, Baselli G et al. Spectral analysis ofsympathetic discharge, RR interval, and systolicarterial pressure in decerebrate cats. J Auton Nerv Syst1992; 40: 21–32.
36 Montano N, Porta A, Malliani A. Evidence for centralorganization of cardiovascular rhythms. Ann NY AcadSci 2001; 940: 299–306.
37 James MA, Robinson TG, Panerai RB, Potter JF. Arterialbaroreceptor-cardiac reflex sensitivity in the elderly.Hypertension 1996; 28: 953–960.
Cardiovascular variability in baroreflex failureL Guasti et al
426
Journal of Human Hypertension