Competition for Managers, Corporate Governance and Incentive Compensation
48
Competition for Managers, Corporate Governance and Incentive Compensation Viral Acharya (NYU, CEPR, NBER), Marc Gabarro (LBS) and Paolo Volpin (LBS, CEPR) May 2011 Abstract We propose a model in which firms use corporate governance as part of an optimal compensation scheme: better governance incentivizes managers to perform better and thus saves on the cost of providing pay for performance. However, when managerial talent is scarce, firms compete to attract better managers. This reduces an individual firm’s incentives to invest in corporate governance because managerial rents are determined by the manager’s reser- vation value when employed elsewhere and thus by other firms’ governance. In equilibrium, better managers end up at firms with weaker governance, and conversely, better-governed firms have lower-quality managers. Consistent with these implications, in a sample of US firms, we show that (i) better CEOs are matched to firms with weaker corporate governance and more so in industries with stronger competition for managers, and, (ii) corporate governance is more likely to change when there is CEO turnover, with governance weakening when the incoming CEO is better than the departing one. JEL classification: D82, G21, G18. Keywords: corporate governance, executive compensation, externalities. Authors’ e-mail addresses: [email protected]; [email protected]; [email protected]. Acknowledgments: We thank Yakov Amihud, Jennifer Arlen, Ramin Baghai, Lucien Bebchuk, Vidhi Chhaochharia, Martijn Cremers, Alex Edmans, Andrew Ellul, Julian Franks, Steven Kaplan, Roberta Romano, Alan Schwartz, Henri Servaes, Michael Weisbach, and participants at the 2010 AEA meetings in Atlanta, the Spring 2011 NBER Law and Economics, the 2011 NYU-Penn Law and Finance Symposium, the 2010 Yale-ECGI-Oxford Conference, and seminars at Boston College, DePaul, Emory, Georgia Tech, HEC Paris, London Business School, MIT and New York University. We are grateful for research support from the ESRC (Grant No. R060230004) and the London Business School’s Centre for Corporate Governance.
Transcript of Competition for Managers, Corporate Governance and Incentive Compensation
Competition for Managers, CorporateGovernance and Incentive Compensation
Viral Acharya (NYU, CEPR, NBER), Marc Gabarro (LBS)
and Paolo Volpin (LBS, CEPR)
May 2011
Abstract
We propose a model in which firms use corporate governance as part of anoptimal compensation scheme: better governance incentivizes managers toperform better and thus saves on the cost of providing pay for performance.However, when managerial talent is scarce, firms compete to attract bettermanagers. This reduces an individual firm’s incentives to invest in corporategovernance because managerial rents are determined by the manager’s reser-vation value when employed elsewhere and thus by other firms’ governance.In equilibrium, better managers end up at firms with weaker governance, andconversely, better-governed firms have lower-quality managers. Consistent withthese implications, in a sample of US firms, we show that (i) better CEOs arematched to firms with weaker corporate governance and more so in industrieswith stronger competition for managers, and, (ii) corporate governance is morelikely to change when there is CEO turnover, with governance weakening whenthe incoming CEO is better than the departing one.
JEL classification: D82, G21, G18.
Keywords: corporate governance, executive compensation, externalities.
Authors’ e-mail addresses: [email protected]; [email protected];[email protected].
Acknowledgments: We thank Yakov Amihud, Jennifer Arlen, Ramin Baghai, Lucien Bebchuk,Vidhi Chhaochharia, Martijn Cremers, Alex Edmans, Andrew Ellul, Julian Franks, Steven Kaplan,Roberta Romano, Alan Schwartz, Henri Servaes, Michael Weisbach, and participants at the 2010AEA meetings in Atlanta, the Spring 2011 NBER Law and Economics, the 2011 NYU-Penn Lawand Finance Symposium, the 2010 Yale-ECGI-Oxford Conference, and seminars at Boston College,DePaul, Emory, Georgia Tech, HEC Paris, London Business School, MIT and New York University.We are grateful for research support from the ESRC (Grant No. R060230004) and the LondonBusiness School’s Centre for Corporate Governance.

1 Introduction
The public outcry against the pay of investment bankers following the crisis of 2007-
08 is just the latest manifestation of the ongoing debate on executive pay that has
kept academics busy for the last twenty years. Executives receive large pay for
performance when their firm does well and they are also paid well when their firm
does poorly (for instance, in the form of severance payments and golden parachutes).
Why are executives (and other professional individuals) paid so much and, apparently,
independently of performance?
The literature has evolved into two conflicting camps. The first one, starting with
Jensen and Murphy (1990), argues that entrenchment, or poor corporate governance,
allows managers to skim profits away from the firm in the form of high pay (see also
Bertrand and Mullainathan, 2001, Bebchuk and Fried, 2004, among others). The
second camp suggests an efficient explanation: better managers can generate greater
value at larger firms and competition for scarce managerial talent forces large firms
to pay managers a lot (see Rosen, 1981, and Gabaix and Landier, 2008). In this
paper, we show that these views are not in conflict and there is in fact a natural link
between them.
We develop a model of the managerial labor market in which poor corporate gov-
ernance and entrenchment arise because of competition in the market for managerial
talent. Some firms on purpose choose lower governance and higher pay to attract
and retain better managers. The key insight is that corporate governance affects the
matching between managers and firms. Better governance may incentivize managers
to perform better for a lower pay. However, it also reduces firms’ ability to attract
the best managers.
In our model, firms can incentivize managers to choose the right action via (i) pay
for performance, that is, by rewarding them when things go well, and (ii) corporate
governance, that is, by punishing them when things go badly. When firms do not have
to compete with each other to attract top quality managers, they choose an efficient
combination of pay for performance and corporate governance that just meets the
manager’s incentive compatibility condition.
– 1 –

However, when managerial talent is scarce and firms have to compete to attract
the few top quality managers, firms depart from the optimal level of corporate gov-
ernance. This result follows from the inability of a firm to affect the rents of the top
quality managers as these managers can always find another firm to employ them.
In other words, the compensation of top-quality managers is exogenous for a given
firm. Therefore, it becomes inefficient for a firm that wants to employ a top quality
manager to set high levels of corporate governance as it would in any case have to
match the manager’s reservation wage by setting a high pay for performance. Thus,
shareholders would end up bearing the costs of implementing corporate governance
without enjoying its benefits in the form of lower executive pay.
With ex-ante identical firms and observable managerial talent, the better-quality
managers extract all the rents, which are exactly equal to the difference in profitabil-
ity between better and worse managers. Then, in equilibrium firms are indifferent
between hiring a better- and a worse-quality manager. Those that hire worse-quality
managers choose the optimal combination of corporate governance and managerial
pay. Those firms that hire better-quality managers rationally choose to underinvest
in corporate governance and pay managers more. In short, the scarcity of managerial
talent leads to managers accruing as rents all the surplus generated by their superior
talent.
The main result of the model is that, in equilibrium some firms attract better
managers by paying them more and choosing more lax governance standards; oth-
ers attract weaker managers by paying them less and choosing stricter governance
standards. If we can measure managerial talent, our main empirical prediction is
that better quality managers are matched to firms that have weaker governance and
receive higher pay. Moreover, changes in corporate governance should be associated
with CEO turnover and should depend on the quality of the new CEO relative to
the old one: governance standards should improve when the new CEO is of worse
quality than the old one and should worsen when on the contrary the new CEO is of
better quality than the old one.
We test these predictions using a dataset that combines balance-sheet data from
Compustat on unregulated firms in the United States over the period 1993 to 2007,
– 2 –

data from ExecuComp on the compensation they award their CEOs and on their
turnover, and firm-level corporate governance data from Riskmetrics. We focus on
the G-Index developed by Gompers et al. (2003) and its individual components
as our measures of outside corporate governance and find evidence in favor of our
predictions.
To show that the allocation of CEOs and firms is consistent with the matching
equilibrium predicted by the model, our cross-sectional test follows a two-stage ap-
proach. In the first stage, managerial talent is measured as the CEO fixed effect in a
regression of firm’s operating performance on several control variables. In particular,
we extract a measure of the CEO’s talent relative to other CEOs in the industry.
In the second stage, we correlate these predicted measures of managerial talent with
corporate governance, executive compensation, firm size and turnover rate. We find
that better managers are employed by larger firms, face weaker governance regimes,
are paid more, and are less likely to be replaced, results that are consistent with
the model’s predictions. We find these associations even after controlling for proxies
of CEO power (his tenure, age and whether he is externally hired), thus alleviating
the concern that CEO power is the omitted variable behind the association between
greater CEO quality and weaker firm governance. Moreover, we show that there is
a stronger negative relationship between corporate governance and CEO quality in
industries with greater competition for managers, as measured by the frequency of
external hires.
In time-series tests, we show that the changes in governance primarily happen
around CEO turnovers. Further, as predicted by the model, when the new CEO is
better than the old one, the quality of corporate governance decreases; while gov-
ernance increases if the new CEO is of worse quality than the old one. When we
examine which components of the G-Index is more correlated with changes in CEO
talent we find that the most important provisions are the ones shielding directors and
officers from legal liability and the ones restricting shareholder voting rights. These
provisions increase when the new CEOs are better than the old ones, both in a cross-
sectional setup when we compare different firms and in a time-series setting when
we consider CEO turnover. In particular, we do not find any significant relationship
between State Law and CEO quality. This latter finding alleviates concerns that the
– 3 –

G-Index is measuring anti-takeover rules outside the control of individual firms and
indicates that our findings seem to come from differences in corporate governance
arrangement that are indeed within the control of shareholders.
The evidence from these tests provides support for our theoretical starting point
that competition amongst firms for scarce managerial talent is an important deter-
minant of observed executive compensation and governance practices. The rest of
the paper is structured as follows. Section 2 discusses related literature. Section 3
presents the model. Section 4 presents the empirical evidence for our testable hy-
potheses. Section 5 discusses robustness checks and alternative explanations. Section
6 concludes.
2 Related Literature
This paper is related to a large literature on executive compensation and corporate
governance. The neoclassical view is that executive compensation is the solution
of the principal-agent problem between a set of risk-neutral investors and a risk-
averse manager (Holmstrom, 1979). In this setting, pay for performance solves the
trade-off between the need to incentivize the manager and the desire to insure him
against idiosyncratic risk. According to this view, a firm chooses low- or high-powered
compensation packages depending on the relative importance of managerial risk-
aversion and incentives. Starting with Jensen and Murphy (1990), skepticism grew
among academics on whether this view provides a satisfactory explanation for the
recent trends in executive compensation. Two alternative economic views have been
suggested to explain executive compensation trends: one, managerial rent extraction,
and second, efficient matching between managerial skills and firm characteristics.
The first explanation links executive compensation to managers’ ability to extract
rents (see Bertrand and Mullainathan, 2001, Bebchuk and Fried, 2004, Kuhnen and
Zwiebel, 2009). According to this view, weaker corporate governance allows man-
agers to skim profits from the firm, thereby leading to higher executive compensation.
Even though this is currently the most popular explanation for the high executive
pay, it begs several questions: If better corporate governance is the solution to ex-
– 4 –

cessive executive compensation, why don’t all shareholders demand better corporate
governance? Moreover, why are CEOs of well-governed firms also paid a lot? In our
model, we treat corporate governance as a choice of the firm. We show that better
corporate governance could indeed reduce managerial pay. However, when there is
an active market for scarce managerial talent, firms are forced to choose weaker cor-
porate governance and to leave rents for managers. In this respect, our contribution
is to clarify the link between corporate governance, pay for performance and scarcity
of managerial talent.
The second explanation relates the level of executive pay to exogenous hetero-
geneity in firm size. Gabaix and Landier (2008), Tervio (2008), and Edmans, Gabaix
and Landier (2009) present matching models a la Rosen (1981) in which the dif-
ferences in size across firms predict some of the well-documented empirical facts on
executive compensation. Gabaix and Landier (2008) and Tervio (2008) show that
the empirically documented positive cross-sectional correlation between firm size and
compensation may optimally arise in a setup where managerial talent has a multi-
plicative effect on firm performance and managers are compensated according to their
increase in productivity as better managers will be matched to larger firms. Similarly,
Edmans, Gabaix and Landier (2009) present a model in which both low ownership
concentration and its negative correlation with firm size arise as part of an optimal
contract.1 In a similar setup, Edmans and Gabaix (2011) show that inefficient in-
centive contracts and CEO allocation across firms arise when firms differ in terms of
risks or disutilities for managers.
Our model departs from this part of the literature because we treat firm size as
an endogenous variable. In particular, we explore the impact of the extent of real
investment on the market for managerial talent and corporate governance. We show
that investment size may be a viable way to attract better managers and thereby
1Within this framework, the recent rise in compensation can be related to changes in the typesof managerial skills required by firms. Murphy and Zabojnık (2007) argue that CEO pay has risenbecause of the increasing importance of general managerial skills relative to firm-specific abilities.Supportive evidence is provided by Frydman and Saks (2010). Cremers and Grinstein (2010) studyCEOs movements for the period between 1993 and 2005 and find that the characteristics of themarket for CEOs differs across industries. Specifically, the proportion of CEOs coming from firmsin other sectors significantly varies across industries, indicating that there is not a unique pool ofmanagers that all firms compete for, but instead many pools specific to individual industries.
– 5 –

determine the equilibrium choice of size by ex-ante identical firms. We find that
indeed firms that invest more will attract better managers but will choose worse cor-
porate governance. Conversely, firms that invest less will attract worse managers and
will choose better corporate governance. Inefficiently low choices of governance and
over-investment emerge as equilibrium outcomes because of the externality associated
with the competition for managerial talent.
Also, managers in our model can be incentivized by shareholders through a com-
bination of incentive contracts and corporate governance, where governance acts as a
substitute for compensation, as shown by Core et al. (1999) and Fahlenbrach (2009).
Fahlenbrach (2009), in particular, finds that there is more pay for performance in
firms with weaker corporate governance, as measured by less board independence,
more CEO-Chairman duality, longer CEO tenure, and less ownership by institutions.
Similarly, Chung (2008) studies the adoption of the Sarbanes-Oxley Act of 2002 and
shows that firms required to have more than 50% of outside directors (interpreted as
an improvement in shareholder governance) decreased significantly their CEO pay-
performance sensitivity relative to the control group.
Finally, this paper is also related to a growing literature on spillover and exter-
nality effects in corporate governance initiated by Hermalin and Weisbach (2006),
who provide a framework for assessing corporate governance reforms from a con-
tracting standpoint and justify the need for regulation in the presence of negative
externalities arising from governance failures. Acharya and Volpin (2010) and Dicks
(2010) formalize this argument in a model where the choice of corporate governance
in one firm is a strategic substitute for corporate governance in another firm. As in
this paper, the externality therein is due to competition for managerial talent among
firms. In a somewhat different context, Nielsen (2006) and Cheng (2011) model the
negative externalities caused by earnings manipulation across firms. Nielsen (2006)
considers a setting where governance improves publicly disclosed information about
a firm and facilitate managerial assessment in competing firms. Cheng (2011) shows
that earnings management in one firm may induce earnings management in other
firms in the presence of relative performance compensation.
– 6 –
3 Theoretical Analysis
The basic idea of our model is that firms compete for managers by choosing gover-
nance as part of an optimal incentive contract. We show below that in the presence of
competition for scarce managerial talent, in equilibrium firms are indifferent between
hiring a better manager, investing more and choosing weaker governance regime, and
hiring a worse manager, investing less and setting a stronger governance regime.
3.1 Setup of the Model
Consider an economy with a continuum of mass n of firms and a continuum of
mass m of managers. There are two types of managers, mH are high-quality, well-
established managers with a strong track-record (H-type), and mL are low-quality,
or less-experienced, managers (L-type): type H have high productivity eH = 1, while
type L have low productivity eL = e < 1. Types are observable: we consider the
case of unobservable types in the extensions. We assume that the mass of L-type
managers is greater than the mass of firms, mL > n, while the H-type managers are
not numerous enough to be hired by all firms, mH < n. In the extension, we discuss
what happens when mH ≥ n and thus there is no effective competition for managerial
talent. Managers are risk averse and have a mean-variance utility function:
U = E(w)− 1
2A V ar(w) (1)
where A ≥ 0 is the coefficient of absolute risk aversion, w ≥ 0 is the (random) total
pay received by the manager, E(w) is the mean of w and V ar(w) is the variance
of w. All firms are ex-ante identical and have to make the following decisions (the
time-line is as in Figure 1).
At t = 1, each firm’s founder hires a CEO from a pool of candidates of observable
quality e ∈ {e, 1}. Given that types are observable, each firm chooses whether to offer
a job for a L-type or for a H-type manager, by setting a compensation contract which
is a function of the manager’s type. Managers apply for one of the jobs. If a manager
is not employed at the end of this stage, he receives a reservation utility equal to
0. Similarly, a firm that does not employ any managers receives an output equal
to 0. Compensation contracts have the following general form: they include a fixed
– 7 –

payment b ≥ 0, which is paid independently of performance (the signing bonus); a
performance-related bonus p ≥ 0, which is contingent on the verifiable output X and
paid at t = 4; and a severance payment s ≥ 0, which is conditional on the manager
leaving the firm voluntarily at t = 3.2 Moreover, as part of the incentive package, at
t = 1 the firm also chooses the investment size I ≥ 0 at a cost rI (with r ≥ 1 being
the cost of capital) and the level of corporate governance g ∈ [0, 1], which comes at
a cost kIg2/2 (where k is a constant).3 The benefit of corporate governance is that
it reduces the cost of firing the manager in the future, if shareholders desire to do
so, and thus reduces managerial entrenchment. For instance, governance increases
coordination among shareholders and makes board of directors more effective and
independent. Specifically, we assume that shareholders receive a fraction g of the
surplus from renegotiation (when the replacement decision is taken at t = 3) and the
manager a fraction 1− g.
At t = 2, managers choose action Z ∈ {M,S}, where choice M generates a payoff
X = 0 for the firm and a private benefit B for the manager; while action S generates
a payoff X = Y (I) with probability e and X = 0 otherwise, and no private benefits
for the manager. The choice of action is not observable by shareholders.4
At t = 3, shareholders and managers observe a signal x ∈ {Y (I), 0} on the
expected output X. After observing this signal, the manager can choose to leave
voluntarily, in which case he is paid the severance pay s. Otherwise, he can bargain
with the firm, in which case the firm and the manager receive a fraction g and 1− gof the surplus, respectively, as explained earlier. If there is a turnover, a replacement
manager produces at t = 4 an output yT (I) = δI net of his compensation, where
δ ∈ (0, 1).
2In this, we follow Almazan and Suarez (2003), who show that severance payments are part ofan optimal incentive scheme for managers.
3This cost reflects the costs of investing in auditing and information technology to make sure thatthe board of directors can detect and replace poorly performing managers. It may also capture theindirect costs of hiring truly independent directors rather than directors who are better at advisingthe CEO on strategic decisions.
4An alternative interpretation is that the L-type managers are managers with uncertain pro-ductivity. With probability e, they are as good as H-type managers. Otherwise, they produce nooutput.
– 8 –

At t = 4, output is realized and distributed; and performance-related bonus p is
paid.
We make the following technical assumptions:
(i) k > δ: to ensure an internal solution for the choice of governance.
(ii) e ≥ 1− 12AB
: to ensure that there is a solution to the incentive problem of the
manager.
(iii) Y (I) > I, Y ′ > 0, Y ′′ < 0, limI→0 Y′(I) = ∞, limI→∞ Y
′(I) < 1: to ensure
an internal solution for the choice of investment.
(iv) The signal x at t = 3 is perfectly informative: this assumption can be relaxed
without significantly changing the results of the model.
3.2 Competition for Managers
To derive the equilibrium, we proceed by backwards induction, starting from the
replacement of the incumbent CEO at t = 3.
3.2.1 Severance Payment and Turnover
Firing the CEO generates an output δI < Y (I) (from the replacement manager).
Hence, the manager will not be fired if x = Y (I). Consider instead the case in which
x = 0. In this case, since δI > 0 there is a case for managerial turnover (as without
it both the firm and the manager receive a payoff of 0).
If s ≥ (1 − g)δI, there is a voluntary turnover and the manager leaves with the
severance pay s. If s < (1−g)δI, there is a forced turnover but the manager extracts
a compensation equal to (1−g)δI. We focus on renegotiation-proof contracts. Hence,
we restrict the choice of contracts such that s = (1− g)δI must hold in equilibrium.
The firm’s payoff if x = 0 is therefore gδI.
3.2.2 Compensation Contract and Corporate Governance
Now consider the firm’s choice of incentive contract and corporate governance at
t = 1. Given that types are observable, firms offer a menu of contracts (bi, gi, pi, Ii)
– 9 –

for each type i = {H,L}.
To solve for the optimal contracts, first we need to derive the manager’s incentive
compatibility and participation constraint. Starting with the incentive compatibil-
ity condition, if the manager chooses action Z = M , output always equals 0 and
manager’s utility equals
U(M) = bi + (1− gi)δIi +B (2)
If he chooses action Z = S, then his utility equals
U(S) = bi + (1− gi)δIi + ei [pi − (1− gi)δIi]−1
2Aei(1− ei) [pi − (1− gi)δIi]2 (3)
Hence, we can derive the incentive compatibility (IC) condition U(S) ≥ U(M) as
follows
[pi − (1− gi)δIi]−1
2A(1− ei) [pi − (1− gi)δIi]2 ≥
B
ei(4)
Provided that the (IC) constraint is satisfied, the corresponding participation con-
straint (PC) becomes
bi + (1− gi)δIi + ei[pi − (1− gi)δIi]−1
2Aei(1− ei) [pi − (1− gi)δIi]2 ≥ ui (5)
where ui is manager’s i reservation utility and will be endogenously determined so
as to clear the market for managers.
It is useful to rewrite (IC) and (PC) in terms of the net incentive contract ξi ≡[pi − (1− gi)δIi]: the IC condition becomes
ξi −1
2A(1− ei)ξ2i ≥
B
ei(6)
while the PC condition takes the form
bi + (1− gi)δIi + eiξi −1
2Aei(1− ei)ξ2i ≥ ui (7)
Then, we can solve the second order equation in ξi to find the incentive-compatible
contract
ξi =
{1−√
1−2AB 1−ee
A(1−e) ≡ ξ(e) if i = L
B if i = H(8)
Because of the definition of ξi, the IC condition becomes:
pi ≥ (1− gi)δIi + ξi. (9)
– 10 –

In a competitive equilibrium, each firm must solve for the optimal contracts for each
type of managers, taking as given the behavior of other firms, that is, taking as given
uL and uH . Then, uL and uH are determined so as to clear the market for managers.
Since there are more L managers than firms, there is no effective competition for
them, so we already know that uL = 0.
Analyzing the optimal incentive contracts conditional on the manager’s type, we
can derive the following result:
Lemma 1: The optimal contract for a L− type manager is:
(bL, pL, sL, gL, IL) =
(0, (1− δ
k)δIL + ξ(e), (1− δ
k)δIL,
δ
k, Y ′−1
(δ +
r
e− δ2
2ke
))with associated profit for the firm equal to e [Y (IL)− δIL − ξ(e)] + δ2
2kIL − rIL.
The optimal contract for a H − type manager depends on uH :
(i) If uH ≤ (1− δk)δY ′−1
(δ + r − δ2
2k
)+B, the optimal incentive contract is
(bH , pH , sH , gH , IH) =
(0, (1− δ
k)δIH +B, (1− δ
k)δIH ,
δ
k, Y ′−1
(δ + r − δ2
2k
))with associated profit equal to Y (IH)− δIH −B + δ2
2kIH − rIH .
(ii) If uH > (1− δk)δY ′−1
(δ + r − δ2
2k
)+B, the optimal incentive contract is
(bH , pH , sH , gH , IH) =(uH − pH , pH , δIH , 0, Y ′−1 (r)
)with pH ∈ [δY ′−1 (r) +B, uH ] and associated profit Y (Y ′−1 (r))− uH .
Proof: See Appendix A.
Intuitively, when a manager’s outside option is low (which is always the case for
L-type managers and is true for H types only when uH is sufficiently small), firms
only need to satisfy the incentive compatibility condition. Hence, they can choose
the bonus bi = 0 and the pay for performance pi so that to satisfy the incentive com-
patibility condition with equality: pi=(1− gi)δIi + ξi. Given this incentive contract,
firms can choose governance g(i) and investment I(i) to maximize expected profits.
This implies that g(i) = δ/k and I(i) = Y ′−1(δ + r
ei− δ2
2kei
).
– 11 –

When instead the manager’s outside option is high (which happens only for H-
type managers when uH is sufficiently high), the participation constraint is strictly
binding while the incentive compatibility condition is not. Hence, pay for perfor-
mance is chosen to satisfy the incentive compatibility condition, pH ∈ [δIH +B, uH ],
while the bonus bH will make sure that the participation constraint is met with equal-
ity, bH = uH − pH . Because in this case the manager is paid an exogenously deter-
mined rent uH , firms have no incentives to invest in corporate governance. Therefore,
the firm chooses gH = 0. Precisely because of this sub-optimal choice of governance,
the firm chooses a sub-optimal level of investment IH : IH = Y ′−1 (r). Notice that
firms hiring a H-type in this case are overinvesting because they do not internalize
that managers extract some of the marginal value of investing through their compen-
sation. They fail to do so because they take executive compensation uH as given.
It follows from Lemma 1 that firms strictly prefer to hire a H − type manager if
uH < Y (IH)− e [Y (IL)− δIL − ξ(e)] +
(r − δ2
2k
)IL (10)
where IH = Y ′−1 (r) and IL = Y ′−1(δ + r
e− δ2
2ke
); they strictly prefer to hire a
L− type manager if
uH > Y (IH)− e [Y (IL)− δIL − ξ(e)] +
(r − δ2
2k
)IL (11)
Given that there are fewer H − type managers than firms, competition among firms
will drive their reservation utility uH up to the point where H − type managers
appropriate all the excess value they generate. Hence, firms must be indifferent
between hiring a H or a L manager. Therefore,
uH = Y (IH)− e [Y (IL)− δIL − ξ(e)] +
(r − δ2
2k
)IL. (12)
For this to be an equilibrium, we need to check that there is no profitable deviation.
Increasing the total compensation bH + pH for H − type managers above uH would
not be profitable because the firm will attract the H − type managers but pay them
so much that it will be better off hiring a L − type manager. Decreasing the total
compensation for H − type managers below uH would not be profitable because the
firm will attract none of the H−type managers but will still be able to hire a L−type
– 12 –

manager, obtaining the same expected profits. Therefore, we can conclude with the
following result:
Proposition 1 (Competition for managerial talent) A mass mH of firms hire
the H − type manager and offer the contract
(b, p, s, g, I) = (uH − pH , pH , δI∗H , 0, I∗H)
where pH ∈ [δY ′−1 (r) +B, uH ] and I∗H ≡ Y ′−1 (r); The remaining n−mH firms hire
L− type managers and offer the contract
(b, p, s, g, I) =
(0, (1− δ
k)δI∗L + ξ(e), (1− δ
k)δI∗L,
δ
k, I∗L
),
where I∗L ≡ Y ′−1(δ + r
e− δ2
2ke
), ξ(e) =
1−√
1−2AB 1−ee
A(1−e) and
uH = Y (I∗H)− e [Y (I∗L)− δI∗L − ξ(e)]−δ2
2kI∗L − r (I∗H − I∗L) .
This is the key result of the model. When the quality of the manager is observ-
able, the competition among firms to employ better managers implies that the latter
ones appropriate all the additional rents they produce. Given that corporate gover-
nance is used by firms to reduce managerial rents, firms hiring H-type managers are
better off by saving the cost of investing in corporate governance. Conversely, firms
hiring L-type managers face no competition for them and can, therefore, keep man-
agerial compensation down to the incentive compatibility constraint. Thus, these
firms choose the optimal level of corporate governance.
This relation between competition for managers and corporate governance influ-
ences the choice of investment or firm size. Because firms hiring the L-type managers
choose the optimal level of governance, they fully internalize the marginal benefits
and costs of investing and choose the optimal level of investment. Conversely, firms
hiring the H-type managers choose a higher investment than optimal because, by
taking managerial compensation uH as given, they do not internalize the costs of
increasing size in terms of higher managerial compensation.
– 13 –

3.3 Extensions
In this section, we briefly discuss two extensions of the basic model. First, we consider
the case in which there is no effective competition for managers as the number of
H-type managers is greater than the number of firms. Second, we consider the case
in which there is no information on managerial quality with firms. In both cases,
there is no distortion in the choice of corporate governance and investment.
3.3.1 No competition
In this section we consider the special case in which mH ≥ n and thus there is no
effective competition for managerial talent. Given that there are enough managers of
both types, the participation constraint is redundant for both types and the incentive
compatibility condition is strictly binding. Hence:
Proposition 2 (No effective competition for managerial talent) All firms
will hire H − type manager, with the contract
(b, p, s, g, I) =
(0, (1− δ
k)δI∗ +B, (1− δ
k)δI∗,
δ
k, I∗)
where I∗ ≡ Y ′−1(δ − δ2
2k+ r)
. A fraction n/mH of the H − type manager are hired.
Proof: See Appendix A.
This solution can be considered the “constrained efficient” benchmark (that is,
efficient given the principal-agent problem) for the analysis that precedes. In par-
ticular, when comparing this benchmark to Proposition 1, we obtain that without
competition for managerial talent, the H-type managers are paid less and work in
firms with better governance and smaller size; whereas there is no difference for firms
that hire the L-type managers.
3.3.2 Unknown managerial quality
We have assumed so far that managerial quality is perfectly observable. This is an
important assumption but it can be relaxed. The results can be extended to the
– 14 –

cases in which there are only imperfect signals about the quality of managers. As
long as these signal contain some information, so that the expected productivity of
H-type managers is strictly greater than the productivity of L-type managers, the
analysis would follow similarly.
If instead, there is no information with firms about the quality of managers, the
results are quite different. In that case, since all managers are ex-ante identical
and they are more than the number of firms (mH + mL > n), there is no effective
competition for managers. Hence, the manager’s outside option is equal across types
and equal to the reservation utility from being unemployed (u = 0). The manager’s
expected profitability is then
mH
mH +mL
+mL
mH +mL
e ≡ e (13)
Adapting the analysis done before, we can show the following result:
Proposition 3 (No information about managerial talent) The optimal in-
centive contract is:
(b, p, s, g, I) =
(0, (1− δ
k)δI∗ + ξ(e), (1− δ
k)δI∗,
δ
k, I∗)
where I∗ = Y ′−1(δ + r
e− δ2
2ke
)and ξ(e) =
1−√
1−2AB 1−ee
A(1−e) .
Proof: See Appendix A.
Notice that the choice of corporate governance is (on average) higher than in the
case with known type and competition among firms for scarce managerial talent.
However, since the level of investment cannot be conditioned any more on the man-
agerial type, investment is higher than optimal if ex post the firm finds out that the
manager is a L-type and lower than optimal if the type is H.
4 Empirical Analysis
Next, we develop the two main testable implications of the model. Then, we present
the empirical methodology. Finally, we describe our data and discuss our results.
– 15 –
4.1 Empirical Predictions
The main result of the model is Proposition 1: in equilibrium some firms will attract
better managers by paying them more, choosing weaker governance standards and
larger size; others will attract worse managers by paying them less, choosing stricter
corporate standards and smaller size. Thus, provided that we can find an appropriate
measure of managerial talent, our main empirical prediction is:
Prediction 1 (Matching equilibrium): Better quality managers receive higher
pay, are matched to firms that have weaker governance standards and larger size.
The comparison between Propositions 1 and 2 highlights how the role of corporate
governance as part of an optimal compensation contract depends on the degree of
competition for managers. Specifically, our model predicts that better managers are
matched to firms that have lower corporate governance only when the competition
among firms to attract them is high. Therefore, conditionally on us finding a relevant
measure of the effective competition for managers, our model predicts:
Prediction 2 (Competition for Managers): The more intense the competition
for managers, the greater is the role of corporate governance as part of an optimal
compensation contract. Specifically, the relationship between high quality managers
and weaker governance standards should be stronger in sectors with stronger compe-
tition for managers.
4.2 Empirical methodology
To test our main empirical prediction, that is, Prediction 1, we need to develop a
measure of managerial ability (γj). For this purpose, we follow Bertrand and Schoar
(2003) and Graham, Li and Qiu (2008) and compute the (unobserved) CEO impact
on performance, where the latter is measured by return on assets.5 The idea is to
attribute to CEO ability the return on assets in excess of the value predicted by
5An alternative approach is to proxy CEO quality with observable characteristics, like presscoverage (as in Milbourn, 2003) or MBA education (Murphy and Zaboknik, 2007).
– 16 –
firm-level and time-varying control variables. More precisely, we estimate
ROAit = βXit + δt + zind + γj + εit, (14)
where ROAit stands for return on assets for firm i in period t. Xit are some time
variant firm characteristics that include size, book leverage, cash, interest coverage,
dividend earnings, Tobin’s q and governance measures. δt are time fixed effects. zind
are industry fixed effects. The parameter γj is a fixed effect for a CEO, i.e., a dummy
variable that takes value one when CEO j works in firm i and zero otherwise. This is
our measure of managerial ability as it captures the unobserved (and time invariant)
managerial effect on return on assets relative to the industry.
Thus, the crucial identification strategy for our model is that the firm could have
attracted any other manager in their industry if it wanted. Cremers and Grinstein
(2010) document that most of the managerial mobility takes place within an industry
so industry dummies constitute a natural starting point.6
We test Prediction 1 in two ways: (i) by focusing on the cross-sectional differences
across firms; and (ii) by emphasizing the time-series changes within a firm.
4.2.1 Prediction 1: Cross-sectional test
In the first approach, we use the estimated fixed effects γj as regressors in the following
specification:
Yit = βγ × γj + υjt + χt + zind + ξit, (15)
where γj are the CEO Ability coefficients estimated from regression (14). χt and
zind are time and industry dummies and υit are a set of CEO characteristics. Time
dummies should control for any time pattern while industry dummies control for the
average quality of CEOs hired in a given industry. We correct for the fact that γj are
generated regressors by weighting each observation by the inverse of the γj standard
error from the first-stage estimation.
6To control for any endogenous manager-firm matching, we repeat the estimation of γj includingfirm fixed effects instead of industry dummies. Results are qualitatively similar but some coefficientslose statistical significance. We believe that the inclusion of industry dummies is more appropriate,specially given the rather low mobility of CEOs across firms.
– 17 –
We estimate the specification above for different dependent variables Yit, that
correspond to different empirical predictions. Yit will in turn be our measures of
corporate governance, executive compensation and firm size. Our model predicts
that (i) better managers work in firms that have lower corporate governance (that is,
we expect βγ < 0 when Yit=Governanceit); (ii) better managers are paid more (that
is, βγ > 0 when Yit=Compensationit); and (iii) better managers work in larger firms
(that is, βγ > 0 when Yit=Firm Sizeit).
An additional empirical implication of our model is that poor-quality managers
should be replaced at an interim stage while better quality managers stay until the
end. We test this empirical prediction using a duration model as follows
h[t;X(t)] = F (βγ × γj + υjt + χt + zind + ξit) (16)
where h[t;X(t)] is the hazard function; defining the failure event as manager turnover.
As usual, h[t;X(t)] describes the instantaneous rate of turnover at T given that
there has been no turnover until t. As above, χt and zind are time and industry
dummies and υit are a set of CEO characteristics. The model’s prediction is a positive
correlation between CEO quality and employment length.
To sum up, we test the main prediction of the model by running a within-industry
two-stage analysis. In the first stage, we obtain individual CEO skills relative to the
other CEOs employed in the industry from specification (14). In the second stage, we
run regressions (15) and (16), to test whether these relative CEO abilities (compared
with other CEO abilities in the industry) are correlated with corporate governance,
CEO compensation, firm size and turnover, as predicted by our model.
4.2.2 Prediction 1: Time-series test
Our model highlights the role of corporate governance as part of an optimal compen-
sation contract. Therefore, changes in corporate governance should happen around
turnover, when the new compensation contract is agreed. More precisely, we should
observe a negative correlation between the change in the manager quality and the
change in firms’ governance standards. To test this prediction we estimate the fol-
– 18 –
lowing logit model:
Governance Chgit = F (βTTurnoverit + υjt + χt + zind + ξit), (17)
where Governance Chgit measure the changes in corporate governance and Turnoverit
captures the changes in managerial ability (γj). As in all the previous regressions, χt
and zind are time and industry dummies and υit are a set of CEO characteristics.
4.2.3 Prediction 2: Cross-industry test
Finally, we test whether the use of corporate governance as part of an optimal com-
pensation contract varies across sectors as a function of the degree of the competition
for managers in those sectors (Prediction 2). To do so, we repeat the estimation of
equation (15) separately for each Fama-French 49 industry,
Governanceit = βindγ × γj + υjt + χt + ξit (18)
where γj are the CEO Ability coefficients estimated from regression (14), χt are time
dummies, υit are a set of CEO characteristics and ind is a different code for each
industry. Then, we estimate the correlation between the different coefficients βindγ and
our measure of the competition for managers: the percentage of insider promotions
calculated by Cremers and Grinstein (2010). The identification assumption is that
sectors with more frictions to cross-firm mobility would be associated with both a
larger number of internal promotions and a lower degree of competition for managers.
Therefore, our model predicts a negative correlation between βindγ and the percentage
of insider promotions.
4.3 Data description
We use firm-level financial variables from Compustat: ROA is the ratio of EBITDA
(item ib) over lagged total assets (item at); Cash is cash and short-term investments
(item che) over net property, plant, and equipment at the beginning of the fiscal
year (item ppent); Interest Coverage is earnings before depreciation, interest, and
tax (item oibdp) over interest expenses (item xint); and Dividend Earnings is the
ratio of the sum of common dividends and preferred dividends (items dvc and dvp)
– 19 –

over earnings before depreciation, interest, and tax (item oibdp). We define Book
Leverage as the ratio of long and short term debt (items dltt and dlc) to the sum
of long and short term debt plus common equity (items dltt, dlc and ceq) and
Tobin’s q as the ratio of firm’s total market value (item prcc f times the absolute
value of item csho plus items at and ceq minus item txdb) over total assets (item
at). CAPX is total capital expenditures (item capx) over total assets (item at).
Accruals are the discretionary accruals calculated using the modified Jones model as
in Dechow et al. (1995). Market Cap is the firm’s total market value (item prcc f
times the absolute value of item csho plus items at and ceq minus item txdb). All
variables are winsorized at the 1 percent level.
As commonly done, we exclude financial, utilities and governmental and quasi
governmental firms (SIC codes from 6000 to 6999, from 4900 to 4999 and bigger
than 9000; respectively) both because their measure of return on assets may not be
appropriate and/or because their competition for managerial talent may be distorted.
We use the 49 Fama-French Industry classification: our final sample includes 36
different industries.
Our principal measure of firm corporate governance is the Gompers et al. (2003)
governance index, which we obtain from RiskMetrics. The G-Index ranges from 1
to 24 and one point is added for each governance provision restricting shareholders
right with respect to managers (for further details see Gompers et al. 2003).7 A
higher G-Index indicates more restrictions on shareholder rights or a greater number
of anti-takeover measures. Therefore, a higher value of the G-Index corresponds
to a lower g in our theoretical representations. Hence, all coefficient signs on the
empirical predictions using the G-Index switch sign with respect to the ones using
our theoretical g governance measure. To fill the gaps between reported values, we
follow Gompers et al. (2003) and assume that any change happens at the end of the
7The list of provisions included in the G-Index are as follows: Antigreenmail, Blank Check,Business Combination laws, Bylaw and Charter amendment limitations, Control-share Cash-outlaws, Classified Board (or Staggered Board), Compensation Plans, Director indemnification Con-tracts, Control-share Acquisition laws, Cumulative Voting, Directors Duties provisions, Fair-Priceprovisions, Golden Parachutes, Director Indemnification, Limitations on director Liability, PensionParachutes, Poison Pills, Secret Ballot, Executive Severance agreements, Silver Parachutes, SpecialMeeting limitations, Supermajority requirements, Unequal Voting rights, and Limitations on actionby Written Consent.
– 20 –

missing period.8
We obtain our measures of executive compensation from ExecuComp focusing on
the CEO as the “manager”. We measure Total Compensation as natural logarithm of
item tdc1. We define Pay for Performance as the ratio of bonuses and stock options
(the latter is the natural logarithm of the Black Scholes value of options granted:
item option awards blk value) and total compensation, measured in percentage
terms. We also use ExecuComp to define: CEO Tenure as the difference between the
current year and the year the executive became CEO (item becameceo); CEO Age
as the age of the CEO and External as a dummy variable that takes value one if the
CEO was not an executive in the firm the year before being appointed as CEO, and
zero otherwise. We also control for CEO Duality, which is a dummy variable that
takes the value 1 if the CEO is also the Chairman of the board.
Summary statistics for all the variables are reported in Table 1. Our dataset spans
the period from 1993 to 2007 as this corresponds to the RiskMetrics data availability.
Moreover, Appendix B includes details on the individual the G-Index.
4.4 Results
To show that indeed firms choose weaker governance to attract better quality man-
agers, first we need to estimate CEO fixed effects. In Table 2, we show the results
from regression (14) with several time dependent regressors (Xit) and time indepen-
dent industry fixed effects (zind). We report the regression coefficients, overall fit of
the model and some descriptive statistics of the estimated CEO fixed effects. We
report the mean, minimum, maximum and standard deviation of the estimated CEO
ability to show that CEO choice does indeed matter for firm performance.
4.4.1 Cross-sectional evidence
Table 3 presents our main empirical result. In Panel A, we show that better managers
are employed by firms with lower corporate governance (Column 1), are paid more
(Column 2) and work in bigger firms (Columns 4, and 6). We use Weighted-Least-
8We check for robustness by using linear interpolation, finding no significant change in the results.
– 21 –

Squares estimators, where the weights are the inverse of the standard deviation of
the CEO fixed effects estimated in the first stage. We control for industry/year fixed
effects, and CEO characteristics (CEO tenure, age and external dummy).
In Column 1 we consider the relation between corporate governance and manage-
rial ability. As predicted by the model, increases in managerial quality are associated
with decreases in governance. In Column 2 and 3, we report the correlations between
managerial talent (as proxied by the CEO fixed effect) and total compensation and
pay for performance. Better managers are paid more, and are paid more in the form
of flexible pay (bonuses and options). In Column 4, we also confirm that better CEOs
work in larger firms, as also argued by Gabaix and Landier (2008). In Column 5,
we show that better managers also invest more (in terms of capital expenditure), an
alternative interpretation of the parameter I in our model.
In terms of economic magnitude, Panel A implies that holding all else constant,
one standard deviation increase in CEO talent (which corresponds to an increase by
0.1794 according to Table 2) implies a 0.4 point increase in G-Index (or decrease in
governance), and a 14% increase in flexible pay.
In Panel B, we test specification (16). According to the model, better-quality
managers stay longer in their firms. Using the estimated measure of CEO quality, we
test a constant hazard rate duration model (in Columns 1 and 2) and a Cox model (in
Columns 3 and 4). Columns 1 and 3 present our baseline analysis, while in columns
2 and 4, we focus on those CEOs under 65 years of age as these CEOs are less likely
to be affected by retirement. Overall, we find support for our hypothesis in all the
specifications: one standard deviation increase in the CEO ability leads to an 15%
decrease in the hazard rate (using the specification reported in Column 1).
4.4.2 Time-series evidence
In Table 4, we sharpen the test of the key prediction of the model by looking at
changes in governance around CEO turnovers. If poor corporate governance is chosen
as part of the CEO incentive contract to attract better quality managers, we would
expect that changes in corporate governance should be more common in times when
the CEO is turned over. Moreover, we would expect governance to increase when
– 22 –
the new CEO is of lower quality than the earlier CEO; and vice-versa, governance
should decrease when the new CEO is of better quality than the older one.
Changes in governance happen in 31 percent of the observations: in 22 percent
of the cases governance worsens (as the G-Index increases) while in 9 percent of the
cases governance improves (as the G-Index decreases). There is a CEO turnover in
about 19 percent of the observations. In 8 percent of the observations, the new CEO
is of better quality than the earlier one (Turnover Up), while in 10 percent of the
cases the new CEO is of worse quality of the earlier one (Turnover Down).
In Panel A of Table 4, we conduct the main test. In Column 1, we show that
CEO turnovers are associated with a higher frequency of governance change. This is
consistent with the model’s assumption that governance is chosen as part of the CEO
incentive scheme. In Columns 2 and 3, we test whether governance increases around
turnover when the new CEO is worse than the old one and decreases when the new
CEO is better than the old one. The indicator Turnover Up is indeed positively
correlated with increases in governance in Column 2, highlighting the role of lower
corporate governance as part of the optimal compensation contract to attract high
quality managers. Column 3 reports however that the employment of worse managers
is not associated with increases in governance (as our model would predict).9
In Panel B, we restrict the sample to the observations in which there is CEO
turnover, thus excluding all observations for which there is no turnover. We confirm
the results found in Panel A: as shown in Column 1, governance worsens when the
new CEO is of better quality than the old one. There is no symmetric increase in
governance when the new CEO is worse than the old one, as shown in Column 2.
Moreover, Columns 3 to 6 show that the changes in managerial ability are associated
with changes in compensation: when better managers are employed, compensation
rises; and when worse managers are employed, compensation decreases.
Overall, these results provide evidence that better managers are paid more and
9The reason for the smaller number of observations in this table compared to the previous onesis that the G-Index is not available every year and we do not want to impose any assumptions onthe specific year in which the actual change happens. Hence, we restrict the set of observations toall and only the observations for which we have a G-Index and evaluate whether turnover happenedwithin two different observations of the G-Index.
– 23 –

are offered weaker corporate governance at the time of their hiring.
4.4.3 Components of G-index
Table 5 provides a detailed analysis of the evidence that better managers are employed
in firms with weaker corporate governance by examining individual components of the
G-Index. In Panel A, we report the correlation between CEO quality (as estimated in
Table 2) and each of the 5 sub-indexes of the G-index : Delay (measuring the ability to
delay an hostile takeover), Protection (which considers the six provisions protecting
directors and officers from legal liability or job termination), Voting (which measures
shareholder voting rights), Other (which includes miscellaneous indicators, like limits
on director duties and pension parachutes) and State Law (focusing on the six state
takeover laws: antigreenmail, business combination freeze, control share acquisition,
fair price, director duties laws and redemption rights statutes). The indicators that
are more strongly positively correlated with CEO quality are Protection, Voting and
Other. State Law is (if anything) negatively correlated with CEO quality; while
Delay is not significantly correlated with CEO quality.
In Panel B, we consider the changes in each indicator at the time of a turnover.
In particular, we focus on the whether governance decreases around turnover when
the new CEO is better than the old one using the same specification estimated in
Table 4 (Panel A, Column 4). We find that the indicators of Protection and Voting
increase significantly when the new CEO is better than the old one. Delay instead
decreases significantly in such instances; while the other indicators do not change.
The combination of the results in Panels A and B suggests that the important
provisions are the ones shielding directors and officers from legal liability and the
ones restricting shareholder voting rights. These provisions increase when the new
CEOs are better than the old ones, both in a cross-sectional setup when we com-
pare different firms and in a time-series setting when we consider CEO turnover.10
Importantly, State Law conversely is negatively correlated in the cross-sectional test
10 The results for the other indicators are not robust across specifications. Other is statisticallysignificant in the cross-section but not in the time-series test; while Delay is not significant in thecross-section but negatively correlated with CEO quality in the time-series test.
– 24 –

but not significant in the time-series test. This latter finding alleviates some of the
concerns on the use of the G-Index as a measure of corporate governance. The fact
that state law indicators are not significantly correlated with CEO quality indicates
that our findings are not driven by differences in the strength of anti-takeover rules
across states; instead they seem to come from differences in corporate governance
arrangement within the control of shareholders.
4.4.4 Cross-industry test
We now turn to study how the role of corporate governance as part of an optimal
compensation contract depends on the competition for managers, in order to test
Prediction 2. Figure 2 plots the relationship between CEO ability and corporate
governance as a function of the degree of competition for managers. Specifically,
the graph axes are as follows: the vertical axis is the coefficient of the regression of
corporate governance (G-Index ) on CEO ability for a given industry; that is, βindγ
as per equation (18). The horizontal axis is the percentage of internally promoted
CEOs in that industry, as reported by Cremers and Grinstein (2010).
Each point in the figure corresponds to a different industry. The number reported
next to each point is the number of the industry that generated that data point, coded
following the 49 Fama French industries. To ensure robust results, we only include
industries that have at least 100 observations.
As evidence supporting Prediction 2, we also plot the linear fit of all the dif-
ferent data points. The figure shows that higher competition for managers implies
a steeper relationship between corporate governance and managerial ability. This
implies a more important role of corporate governance as part of an optimal com-
pensation contract. In numbers, the correlation between the different βindγ and the
percentage of internal promotions is −0.338, which is statistically different from zero.
Weighting each data point by the inverse of the βindγ standard error or by the number
of observations in that industry does not change the results: the point estimate is
very similar and it is also statistically different from zero.
In short, this picture provides evidence that the competition for managers plays
a crucial role in the choices of corporate governance of firms that want to attract
– 25 –

highly talented managers, the key insight of our model. Indeed, firms seem to use
corporate governance as part of an optimal compensation contract more aggressively
in those industries where the competition for talent is more severe.
5 Discussion
5.1 The market for CEOs as a source of externality
The key result in our paper is that better CEOs are matched with firms with weaker
governance. The channel through which the matching happens is the competition for
talent in the market for CEOs. Specifically, the option to work for firms with weaker
governance raises the participation constraint for managers and forces other firms to
pay managers more.
In regressions reported in Table A1 in Appendix C, we show that the executive
compensation in one firm is decreasing in the quality of corporate governance in the
firm itself and of its size-matched competitors. For this purpose, we estimate the
following equation:
Compensationit = αG ×Governanceit + αE ×Outside Governanceit+
+βXit + ϕind + λt + εit(19)
where the dependent variable is total compensation, Xit are time variant firm-specific
controls that could affect compensation and λt and ϕind are time and industry dum-
mies, respectively. Our model would predict that both αG and αE should be negative.
The first prediction (αG < 0) captures the idea that corporate governance is a sub-
stitute for executive compensation. The second prediction (αE < 0) reflects the idea
that there is a positive externality in the choice of corporate governance across firms:
the firm can pay the CEO less if the outside option is worse.
To make sure that the governance channel is independent of the effect of size
uncovered by Gabaix and Landier (2008), our time variant firm-specific controls (Xit)
include the firm’s market capitalization. We also control for CEO characteristics (age,
tenure and whether the CEO is an external hire) and board composition (board size,
the fraction of independent directors and whether the CEO is also the Chairman of
the Board). We do so to make sure that our effect is not due to an unobservable
– 26 –

variable that captures the power or the influence of the CEO, as argued by Bebchuk
and Fried (2004). The inclusion of year dummies is to capture any economy-wide
time pattern in managerial compensation.
In all specifications reported in Table A1, we find that a worsening of governance
standards in the firms competing for managerial talent is associated with higher CEO
compensation (even after controlling for its own governance). Although consistent
with our story, these results should be interpreted with some caution because gov-
ernance, size and compensation are all endogenous variables and we do not have an
exogenous shock to make statements about causality.
5.2 The effect of corporate governance on performance
Throughout the paper, we argue that there is a relationship between a firm’s choice
of corporate governance and the ability of the manager it can employ, measuring the
latest as the firm performance while this manager is CEO in excess of the industry (see
equation 14). One possible concern with our approach is that corporate governance
might have a direct effect on our measure of firm performance (ROA), and our findings
may pick up this effect rather than being evidence that lower corporate governance
serves to attract better managers, as we argue.
To control for this possible alternative explanation, we add corporate governance
and executive compensation as controls in the first stage regression (equation 14).
Then, we replicate our empirical predictions using this alternative first stage. In
regressions reported in Appendix C, Table A2, we find that results improve both
in economic magnitude and in statistical significance. For instance, holding all else
constant, one standard deviation increase in CEO talent implies a 1.6 point increase
in G-Index (or decrease in governance), which is significantly different from zero at
the 1% level.
The reason for the improvement in the results under this new specification is
intuitive. As previous literature on governance has suggested, the direct effect of
corporate governance on firm performance is positive and thus not controlling for it
works against finding support for our empirical predictions; while controlling for it
strengthens our finding.
– 27 –

As a final remark, this robustness analysis may shed some light on the discussion
regarding the impact of corporate governance on some measures of firm performance,
such as ROA. When we regress ROA on time-variant firm characteristics, industry
and year dummies and our measure of corporate governance (G-Index ), we find no
significant effect of the G-Index on firm performance. However, when we add CEO
fixed effects to the previous specification, there is a positive correlation between
corporate governance and firm performance. This seems to imply that the direct
(positive) effect of corporate governance on firm performance and the (negative) im-
pact of corporate governance on the firm’s capacity to attract high quality managers
(the latter being the effect highlighted in this paper) partially offset each other. In
other words, the role of corporate governance as part of an optimal executive com-
pensation contract has likely clouded the empirical support for the prior that higher
corporate governance increases firm performance.
5.3 Compensation versus governance trade-off
A key feature of our model is the assumption that there is a trade-off each firm faces
in providing incentives to managers through pay and through stronger governance.
If the costs of designing and enforcing governance were relatively low, such trade-off
would not have much bite. Such costs are, however, at the heart of agency prob-
lems due to separation of ownership and control. Acharya and Volpin (2010) model
such costs as arising due to the dispersed nature of ownership of firms. Intuitively,
each owner does not internalize the full benefit of her investment in monitoring or
information generation and thereby incentives to govern are weak. The owners may
choose delegated monitors, e.g., Board of Directors, but this delegation involves its
own set of monitoring needs and agency problems. Conversely, if firms were finan-
cially constrained, then the costs of providing incentives through pay might become
enormously high relative to costs of governance.
While we did not fully explore in our model and empirical tests the relative costs
of pay and governance in optimal compensation arrangements, this seems to be a
fruitful avenue for further research. In particular, it would be interesting to test if
the governance externality we have highlighted is even more perverse in financially
– 28 –

constrained firms. Such firms cannot afford to raise their CEO pay in response to
weak governance of competitors, and must weaken their governance as well. This
may render these firms even more financially constrained, precipitating their exit
(or precluding their entry in the first place). Studying financially constrained firms
may thus also help investigate the full efficiency costs of firms being forced by the
managerial labor market to pick weak governance while hiring better talent.
5.4 Implications for regulation of corporate governance
Finally, it is interesting to consider implications of our model and results for regu-
lation of governance. At a direct level, it provides a rationale for why governance
standards might help. It would prevent firms from weakening governance too much
for luring better managers and thereby allow all firms to retain stronger governance
practices. In equilibrium, this would imply lower reservation wages for top manage-
ment. As discussed above, when firms are financially constrained, this can free up
pledgable cash flows, lead to greater external financing and investments, and poten-
tially even greater entry of new firms.
However, our model and results are not structurally calibrated to provide a firm
recommendation on what this level of governance standards might be. Indeed, if they
were picked to be too high, the ability of firms to use pay for providing incentives
would get curbed excessively and the governance costs might in themselves reduce
pledgable cash flows and ability to invest. Subject to this important caveat, since
weak governance in our model is an outcome of externality and coordination problem
between firms, it provides a more reasonable justification for governance regulation
than one that is based on according greater contracting powers to regulators relative
to investors.
6 Conclusion
In this paper, we theoretically explored the joint role played by corporate governance
and competition among firms to attract better managers. In our principal agent prob-
lem, there are two ways to induce the manager to make the right decision: paying
– 29 –

compensation in case of better performance and investing in corporate governance
to punish managers if things go badly. We showed that when managerial ability is
observable and managerial skills are scarce, competition among firms to hire better
managers implies that in equilibrium firms will choose lower levels of corporate gov-
ernance. Intuitively, the result follows from the fact that managerial rents cannot be
influenced by an individual firm but instead are determined by the value of managers
when employed somewhere else. Hence, if a firm chooses a high level of corporate
governance, the remuneration package will have to increase accordingly to meet the
participation constraint of the manager. It is therefore firms (and not managers)
that end up bearing the costs of higher corporate governance with little benefit.
We provided novel empirical evidence supporting our model. The observed al-
location of CEOs and firms is consistent with the model: we provided an empirical
measure of managerial talent and found it is negatively correlated with indicators of
corporate governance. Moreover, we find a stronger negative relationship between
corporate governance and CEO quality in industries with greater competition for
managers, where the latter is measured as the frequency of external hires. Finally,
in support of the assumption that compensation and governance are chosen as part
of an optimal incentive package, corporate governance changes significantly when a
new CEO is hired with better CEOs being offered weaker governance.
Our finding that corporate governance affects the matching between managers
and firms has important implications for the debate on executive pay and governance.
Specifically, while better governance may incentivize managers to perform better, it
also reduces firms’ ability to attract the best managers. These two effects offset
each other and may explain why it has proven so hard so far to find direct evidence
that corporate governance increases firm performance. A notable exception is the link
between governance and performance found in firms owned by private equity: Private
equity ownership features strong corporate governance, high pay-for-performance but
also significant CEO co-investment, and superior operating performance.11 Since
11See, for example, Jensen (1989) for theoretical argument, Kaplan (1989) for evidence on opera-tional improvements due private equity ownership in early wave of leveraged buyouts (LBOs), andAcharya, Gottschalg, Hahn and Kehoe (2010) on the LBOs during 1995 to 2005 (in the U.K. andthe Western Europe).
– 30 –

private equity funds hold concentrated stakes in firms they own and manage, they
internalize better (compared, for example, to dispersed shareholders) the benefits of
investing in costly governance. Our model and empirical results can be viewed as
providing an explanation for why there exist governance inefficiencies in firms with
dispersed shareholders that concentrated private equity investors can “arbitrage”
through their investments in active governance.
– 31 –

Appendix A: Proofs
Proof of Lemma 1: Given that there are lots of L-type managers, their participation constraintis redundant (that is, uL = 0) and the incentive compatibility condition is strictly binding for theL-type managers. Hence,
pL = (1− g)δIL + ξ(e)
and bL = 0. Hence, the founder’s problem is simply
max(gL,IL)
e [Y (IL)− (1− gL)δIL − ξ(e)] + (1− e)gLδIL − kg2L2IL − rIL
From the first order condition of this problem,
g∗L =δ
kand I∗L = Y ′−1
(δ +
r
e− δ2
2ke
)
Conversely, because of the scarcity of H-type managers, their participation constraint may or maynot be binding. The case in which the participation constraint is not binding, uH ≤ (1−gH)δIH+B,meeting the incentive compatibility condition implies also meeting the participation constraint. Insuch case, the founder’s problem is simply
max(gH ,IH)
Y (IH)− (1− gH)δIH −B − kg2H2IL − rIL
From the first order condition of this problem,
g∗H =δ
kand I∗H = Y ′−1
(δ + r − δ2
2k
)Using the expression above, the initial constraint is satisfied if uH ≤ (1− δ
k )δY ′−1(δ + r − δ2
2k
)+B.
If instead uH > (1 − δk )δY ′−1
(δ + r − δ2
2k
)+ B, the participation constraint is binding when the
incentive compatibility constraint is satisfied. In such case, bH and pH are set so that
bH + pH = uH & pH ≥ (1− gH)δIH +B
Thus, the founders problem becomes
max(gH ,IH)
Y (IH)− uH − kg2H2IL − rIL
From the first order conditions, g∗H = 0 and I∗H = Y ′−1 (r). �
Proof of Proposition 2: The firm’s profit can be written as:
Πi =
{e [Y (I)− δI]− eξ(e) + gLδI − rI − kIg2L
2 if i = L
Y (I)− δI −B + gHδI − rI − kIg2H2 if i = H
From the first order condition, notice that the optimal choice of governance is independent of themanager’s type: gL = gH = δ
k . Also notice that the profits are strictly greater with i = H. Hence,all firms hire H-types and the optimal incentive contract is:
b∗ = 0, g∗ =δ
k, p∗i = (1− δ
k)δI +B
– 32 –

while I∗ : Y ′(I∗) = δ(1− δ
2k
)+ r. �
Proof of Proposition 3: As before, the severance payment is s = (1−g)δ. If the manager choosesaction Z = M , output will always equal 0 and his utility equals
UM (M) = b+ (1− g)δI +B
If he chooses action Z = S, then his utility equals
UM (S) = b+ (1− g)δI + e [p− (1− g)δI]− 1
2Ae(1− e) [p− (1− g)δI]
2
Hence, we can derive the incentive compatibility condition UM (S) ≥ UM (M) as follows
[p− (1− g)δI]− 1
2A(1− e) [p− (1− g)δI]
2 ≥ B
e(A1)
The corresponding participation constraint is
b+ (1− g)δI + e[p− (1− g)δI]− 1
2Ae(1− e) [p− (1− g)δI]
2 ≥ 0 (A2)
Given that all managers are ex-ante equal, there is no competition for them. Since any contractoffered to a manager must give them utility equal to, at least, B > 0, to ensure they do notchoose Z = M , the participation constraint is redundant and the incentive compatibility conditionis strictly binding for both managers. Given this, we can write the incentive compatibility conditionas
ξ − 1
2A(1− e)ξ2 =
B
e
where ξ = [p− (1− g)δI]. By solving this second order equation in ξ, we find that
ξ =1−
√1− 2AB 1−e
e
A(1− e)≡ ξ(e)
This implies that:p = (1− g)δI + ξ(e)
and the associated profit is:
Πi = e [Y − δI]− eξ(e) + gδI − rI − kg2I
2
From the first order conditions, g∗ = δk & I∗ = Y ′−1
(δ(1− δ
2ek
)+ r
e
). �
– 33 –

Appendix B: G-Index
For each of component and subindex of the G-Index, the table reports mean, minimum, maximumand both within and between variation across Fama-French industries.
Mean Min Max Within Between
G-Index 9.020 1 19 7.054 110.582
Delay 2.206 0 4 1.421 9.193
Blank Check 0.868 0 1 0.112 0.773
Classified Board 0.583 0 1 0.236 2.512
Special Meeting 0.385 0 1 0.234 0.988
Written Consent 0.369 0 1 0.227 1.888
Protection 2.203 0 6 1.438 21.248
Compensation Plan 0.670 0 1 0.218 1.090
Contracts 0.101 0 1 0.089 0.702
Golden Parachutes 0.629 0 1 0.226 2.429
Indemnification 0.259 0 1 0.185 2.308
Liability 0.460 0 1 0.235 4.437
Severance 0.084 0 1 0.076 0.317
Voting 2.181 0 6 0.603 6.365
Bylaws 0.191 0 1 0.153 0.706
Charter 0.029 0 1 0.028 0.211
Cumulative Voting 0.884 0 1 0.098 1.723
Secret Ballot 0.903 0 1 0.085 0.852
Supermajority 0.346 0 1 0.214 3.798
Unequal Voting 0.017 0 1 0.017 0.102
Other 0.951 0 5 0.780 12.550
Antigreenmail 0.165 0 1 0.133 1.687
Directors’ duties 0.106 0 1 0.093 0.691
Fair Price 0.486 0 1 0.230 6.278
Pension Parachutes 0.022 0 1 0.021 0.166
Poison Pill 0.533 0 1 0.240 2.978
Silver Parachutes 0.023 0 1 0.022 0.240
State Law 1.622 0 6 1.377 21.483
Antigreenmail Law 0.130 0 1 0.109 1.374
Business Combination Law 0.875 0 1 0.106 1.144
Cash-Out Law 0.030 0 1 0.029 0.163
Directors Duties Law 0.038 0 1 0.036 0.258
Fair Price Law 0.322 0 1 0.204 4.379
Control Share Acquisition Law 0.227 0 1 0.167 2.607
– 34 –

Appendix C: Robustness Checks
Table A1. Market for CEOs as the source of corporate governance externality
In this table, we regress CEO compensation (Total Comp.) on market capitalization and measuresof corporate governance for the firm and its size-matched comparables. We use the G-Index as ourmeasure of corporate governance. In columns 1-3, regressions include industry/year fixed effects; incolumn 4, we control for year dummies and firm fixed effects. In columns 2-4, we also control forCEO characteristics (CEO Tenure, CEO Age and External). In columns 3 and 4, we control forboard composition (Board Size, Fract Indep and CEO Duality). Standard errors are reported inparentheses and are clustered at the firm level in the first line and at the year level in the secondline. *, **, or *** indicates that the coefficient is statistically significantly different from zero at the10%, 5%, or 1% level, respectively, under that clustering.
(1) (2) (3) (4)
Market Cap 0.458 0.459 0.453 0.485
(0.010)*** (0.010)*** (0.013)*** (0.029)***
(0.007)*** (0.008)*** (0.009)*** (0.030)***
Own Governance 0.023 0.023 0.018 0.001
(0.006)*** (0.006)*** (0.006)*** (0.010)
(0.002)*** (0.002)*** (0.002)*** (0.007)
Competitor Governance 0.011 0.010 0.009 0.004
(0.005)** (0.005)* (0.006) (0.005)
(0.003)*** (0.004)** (0.003)** (0.003)
Industry / Year F.E. Y Y Y N
CEO Characteristics N Y Y Y
Board Composition N N Y Y
Firm FE and Year dummies N N N Y
Observations 9,833 8,964 7,370 7,370
R-squared 0.527 0.533 0.535 0.776
– 35 –

Table A2. The effect of corporate governance on performance
In this table we regress corporate governance, firm size and different components of compensation onthe CEO ability. CEO ability is obtained in Panel A by regressing ROA on the once-lagged valuesof market capitalization, book leverage, cash holdings, interest coverage, dividend over earnings,Tobin’s q, accruals, industry and year fixed effects (as in Table 2), and with the addition of G-Indexand total compensation. All regressions in panel B include CEO Characteristics (CEO Tenure, CEOAge, External dummy), industry fixed effects and year dummies and coefficients are estimated withWeighted Least Squares to correct for estimation errors in the first stage. Standard errors arereported in parenthesis and clustered at the firm level in the first line and at the year level in thesecond line. *, **, or *** indicates that the coefficient is statistically significantly different fromzero at the 10%, 5%, or 1% level, respectively.
Panel A: First stage
Dependent Variable: ROA
L.Market Cap. -0.0086
(0.0063)
L.Book Leverage 0.0090
(0.0106)
L.Cash 0.0022
(0.0026)
L.Interest Coverage 0.0000
(0.0000)
L.Dividend Earnings -0.0010
(0.0134)
L.Tobin’s q 0.0191
(0.0065)***
L. Accruals 0.0029
(0.0210)
L. G-Index -0.0044
(0.0018)**
L. Total Comp. 0.0014
(0.0021)
Industry/ Year F.E. Y
Observations 9662
Panel B: Second stage
Dependent Variable G-Index Total Comp. Pay for Perf. Market Cap. CAPX
CEO Ability 8.396 3.222 58.593 7.610 0.040
(1.002)*** (0.307)*** (7.033)*** (0.532)*** (0.016)**
(0.837)*** (0.262)*** (3.978)*** (0.329)*** (0.006)***
Industry/ Year F.E. Y Y Y Y Y
CEO Characteristics Y Y Y Y Y
Observations 9102 9102 9102 9102 9012
R-squared 0.383 0.386 0.265 0.530 0.473
– 36 –

References
[1] Acharya, Viral, Oliver Gottschalg, Moritz Hahn and Conor Kehoe, 2010, “Cor-porate Governance and Value Creation: Evidence from Private Equity,” WorkingPaper, NYU.
[2] Acharya, Viral, and Paolo Volpin, 2010, “Corporate Governance Externalities,”Review of Finance, 14, 1-33.
[3] Almazan, Andres, and Javier Suarez, 2003, “Entrenchment and Severance Payin Optimal Governance Structures,” Journal of Finance 58, 519-547.
[4] Bebchuk, Lucian, and Jesse Fried, 2004, Pay Without Performance: The Unful-filled Promise of Executive Compensation, Harvard University Press.
[5] Bertrand, Marianne, and Sendhil Mullainathan, 2001, “Are CEOs Rewarded forLuck? The Ones Without Principals Are,” Quarterly Journal of Economics 116,901-32.
[6] Bertrand, Marianne, and Antoinette Schoar, 2003, “Managing with Style: theEffect of Managers on Firm Policies,” Quarterly Journal of Economics 118,1169-1208.
[7] Cheng, Ing-Haw, 2011, “Corporate Governance Spillovers,” unpublishedmanuscript, University of Michigan.
[8] Chung, Hae Jin, 2008, “Board Independence and CEO Incentives,” unpublishedmanuscript, New York University.
[9] Core, John E., Robert W. Holthausen, and David F. Larcker, 1999, “CorporateGovernance, Chief Executive Officer Compensation, and Firm Performance,”Journal of Financial Economics 51, 371-406.
[10] Cremers, Martijn, and Yaniv Grinstein, 2010, “The Market for CEO Talent:Implications for CEO Compensation,” Working paper, Yale University.
[11] Dicks, David, 2010, “Executive Compensation, Incentives, and the Role for Cor-porate Governance Regulation,” mimeo.
[12] Dechow, Patricia M., Richard G. Sloan, and Amy P. Sweeney, 1995, “DetectingEarnings Management” Accounting Review, 70, 193-225.
[13] Edmans, Alex, and Xavier Gabaix, 2011, “The Effect of Risk on the CEO Mar-ket, ” Review of Financial Studies, forthcoming.
[14] Edmans, Alex, Xavier Gabaix, and Augustin Landier, 2009, “A MultiplicativeModel of Optimal CEO Incentives in Market Equilibrium,” Review of FinancialStudies 22, 4881-4917.
– 37 –
[15] Fahlenbrach, Rudiger, 2009, “Shareholder Rights, Boards, and CEO Compen-sation,” Review of Finance 13, 81-113.
[16] Frydman, Carola and Raven E. Saks, 2010, “Executive Compensation: A NewView from a Long-Term Perspective, 1936-2005,” Review of Financial Studies,23, 2099-2138.
[17] Gabaix, Xavier, and Augustin Landier, 2008, “Why Has CEO Pay Increased SoMuch?,” Quarterly Journal of Economics 123, 49-100.
[18] Gompers, Paul, Joy Ishii, and Andrew Metrick, 2003, “Corporate Governanceand Equity Prices,” Quarterly Journal of Economics 118, 107-155.
[19] Graham, John, Si Li, and Jiaping Qiu, 2008, “Managerial Attributes and Exec-utive Compensation,” Working Paper, Duke University.
[20] Hermalin, Benjamin and Michael Weisbach, 1998, “Endogenously ChosenBoards of Directors and Their Monitoring of the CEO,” American EconomicReview 88, 96-118.
[21] Hermalin, Benjamin and Michaeil Weisbach, 2006, “A Framework for AssessingCorporate Governance Reform,” working paper, UC-Berkeley.
[22] Holmstrom, Bengt, 1979, “Moral Hazard and Observability,” The Bell Journalof Economics 10, 74-91.
[23] Jensen, Michael, 1989. “Eclipse of the Public Corporation,” Harvard BusinessReview, Sept.-Oct., 61-74.
[24] Jensen, Michael, and Kevin J. Murphy, 1990, “Performance Pay and Top-Management Incentives,” Journal of Political Economy 98, 225-264.
[25] Kaplan, Steven, 1989, “The Effects of Management Buyouts on Operations andValue,” Journal of Financial Economics 24, 217-254
[26] Kuhnen, Camelia M., and Jeffrey H. Zwiebel, 2009. “Executive Pay, HiddenCompensation and Managerial Entrenchment,” Working Paper.
[27] Marino, A. M., and Jan Zabojnık, 2008, “Work-related perks, agency problems,and optimal contracts,” RAND Journal of Economics 39, 565-585.
[28] Milbourn, Todd, 2003, “CEO Reputation and Stock-Based Compensation,”Journal of Financial Economics 68, 233-262.
[29] Murphy, Kevin J., and Jan Zabojnık, 2007, “Managerial Capital and the Marketfor CEOs,” Working Paper, USC.
[30] Nielsen, Anders, 2006, “Evolution of Corporate Governance, Externalities andMultiple Equilibria,” mimeo.
– 38 –

[31] Rajan, Raghuram, and Julie Wulf, 2006, “Are perks purely managerial excess?”,Journal of Financial Economics 79, 1-33.
[32] Rosen, Sherwin, 1981, “The Economics of Superstars,” American Economic Re-view 71, 845-858.
[33] Rusticus, Tjomme O., 2006, “Executive Severance Agreements,” Working Paper.
[34] Tervio, Marko, 2008, “The Difference That CEOs Make: An Assignment ModelApproach,” American Economic Review 98, 642–668.
[35] Weisbach, Michael, 1988, “Outside directors and CEO turnover, ” Journal ofFinancial Economics 20, 431-460.
[36] Yermack, David, 1996, “Higher market valuation of companies with a smallboard of directors, ” Journal of Financial Economics 40, 185-211.
– 39 –
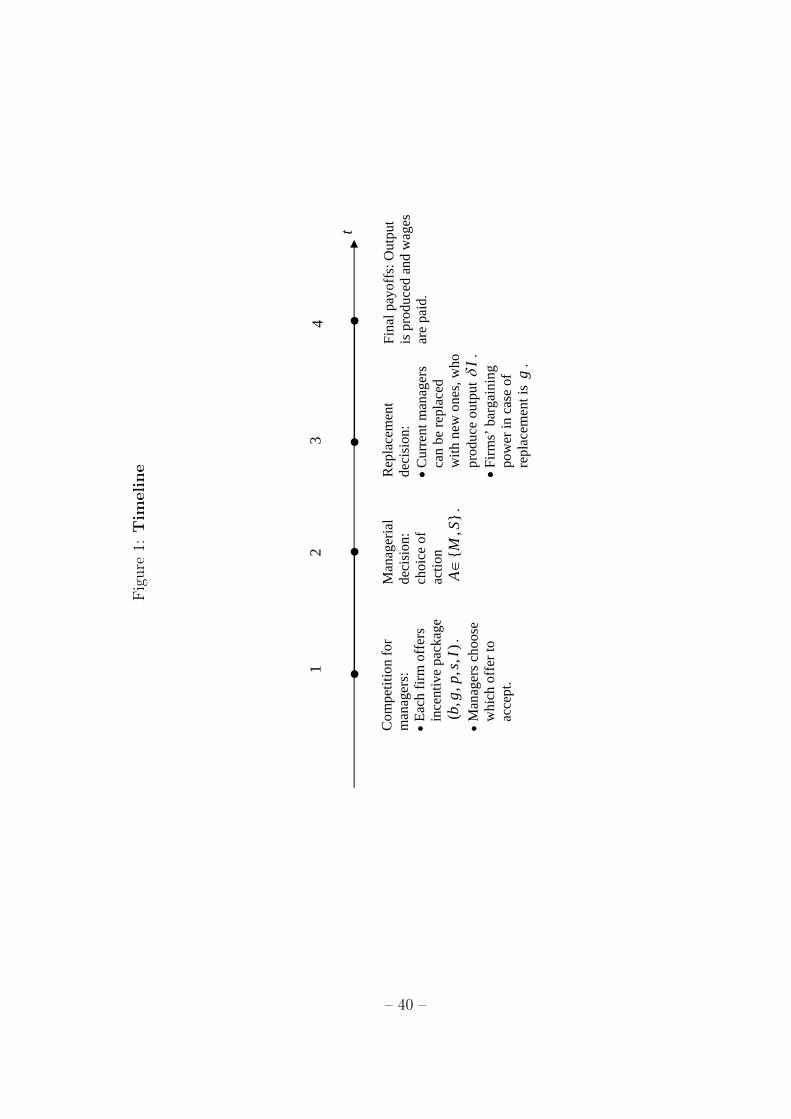
Fig
ure
1:T
imeli
ne
Com
petit
ion
for
man
ager
s:
• Ea
ch fi
rm o
ffer
s in
cent
ive
pack
age
(,
,,
,)
bg
ps
I.
• M
anag
ers c
hoos
e w
hich
off
er to
ac
cept
.
Man
ager
ial
deci
sion
: ch
oice
of
actio
n {,
}A
MS
∈.
Rep
lace
men
t de
cisi
on:
• Cur
rent
man
ager
s ca
n be
repl
aced
w
ith n
ew o
nes,
who
pr
oduc
e ou
tput
I
δ.
• Firm
s’ b
arga
inin
g po
wer
in c
ase
of
repl
acem
ent i
s g
.
Fina
l pay
offs
: Out
put
is p
rodu
ced
and
wag
es
are
paid
.
1 2
3
t
4
– 40 –

Fig
ure
2:C
om
peti
tion
for
Man
agers
Inth
isfi
gure
,w
esh
owth
ecr
oss-
ind
ust
ryd
iffer
ence
sin
the
corr
elati
on
bet
wee
nco
rpor
ate
gov
ern
an
cean
dm
an
ager
ial
ab
ilit
y.W
ees
tim
ate
regr
essi
onG−Index
=βind
γ×CEOAbility
+υjt+χt+z ind
+ξ it,
sep
ara
tely
for
each
ind
ust
ry.
Th
efi
gu
reb
elow
plo
tsth
eva
lue
of
the
esti
mate
d
coeffi
cien
ton
CEO
Ability
(βind
γ)
wit
hre
spec
tto
ou
rm
easu
reof
the
deg
ree
of
com
pet
itio
nfo
rm
an
ager
sin
that
ind
ust
ry(t
hePercentage
of
Insider
Promotions
asp
erC
rem
ers
and
Gri
nst
ein
,2010).
Th
enu
mb
ern
ext
toea
chd
ata
poin
tin
dic
ate
sth
ein
du
stry
cod
e:1
=A
gri
cult
ure
,
2=
Food
Pro
du
cts,
3=
Can
dy
&S
od
a,4
=B
eer
&L
iqu
or,
5=
Tob
acc
oP
rod
uct
s,6
=R
ecre
ati
on
,7
=E
nte
rtain
men
t,8
=P
rinti
ng
an
d
Pu
bli
shin
g,9
=C
onsu
mer
Good
s,10
=A
pp
arel
,11
=H
ealt
hca
re,
12
=M
edic
al
Equ
ipm
ent,
13
=P
harm
ace
uti
cal
Pro
duct
s,14
=C
hem
icals
,
15=
Ru
bb
eran
dP
last
icP
rod
uct
s,16
=T
exti
les,
17
=C
on
stru
ctio
nM
ate
rials
,18
=C
on
stru
ctio
n,
19
=S
teel
Work
sE
tc,
20
=F
ab
rica
ted
Pro
du
cts,
21=
Mac
hin
ery,
22=
Ele
ctri
cal
Equ
ipm
ent,
23
=A
uto
mob
iles
an
dT
ruck
s,24
=A
ircr
aft
,25
=S
hip
bu
ild
ing,
Rail
road
Equ
ipm
ent,
26
=D
efen
se,
27=
Pre
ciou
sM
etal
s,28
=N
on-M
etall
icand
Ind
ust
rial
Met
al
Min
ing,
29
=C
oal,
30
=P
etro
leu
man
dN
atu
ral
Gas,
31
=U
tili
ties
,
32=
Com
mu
nic
atio
n,
33=
Per
son
alS
ervic
es,
34
=B
usi
nes
sS
ervic
es,
35
=C
om
pu
ters
,36
=C
om
pu
ter
Soft
ware
,37
=E
lect
ron
icE
qu
ipm
ent,
38=
Mea
suri
ng
and
Con
trol
Equ
ipm
ent,
39=
Bu
sin
ess
Su
pp
lies
,40
=S
hip
pin
gC
onta
iner
s,41
=T
ran
sport
ati
on
,42
=W
hole
sale
,43
=R
etail
,
44=
Res
tau
rants
,H
otel
s,M
otel
s,45
=B
ankin
g,
46
=In
sura
nce
,47
=R
eal
Est
ate
,48
=T
rad
ing.
We
incl
ud
eon
lyin
dust
ries
wit
hm
ore
than
100
obse
rvat
ion
s.
– 41 –

Table 1: Summary Statistics
This table presents the summary statistics for the variables used in the empirical section. Returnon Assets (ROA) is the ratio of operating cash flow over lagged total assets. Book Leverage is theratio of long and short term debt to the sum of long and short term debt plus common equity.Cash is the sum of cash and short-term investments over net property, plant, and equipment atthe beginning of the fiscal year. Interest Coverage is earning before depreciation, interest, and taxover interest expenses. Dividend earnings is the sum of common dividends and preferred earningsover earning before depreciation, interest, and tax. Tobin’s q is the ratio of firm’s total marketvalue over total assets. Accruals are the discretionary accruals calculated using the modified Jonesmodel as in Dechow et al. (1995), Market Cap is the firm market capitalization. G-Index is theGompers et al. (2003) governance index. CEO Duality is a dummy variable that takes value one ifthe CEO is also the Chairman on the board, zero otherwise. Total Comp is the logarithm of CEOtotal compensation. Pay for Perf is the proportion of variable pay (bonuses and stock options) overtotal pay in percentage. CEO Tenure is the difference between the current year and the year theexecutive became CEO; CEO Age is the age of the CEO. The sample consists of 10126 firm-yearobservations that correspond to 2610 different CEOs and 1551 different firms, covering the periodfrom 1992 to 2008. CEO Age and CEO Tenure is only available for 7623 observations and directorsdata (which is needed to define Board Size, Duality and Fraction of Independent directors) is onlyavailable from 1996.
Variable Mean Std. Dev. Min Max
ROA 0.051 0.097 -0.470 0.319
Book Leverage 0.361 0.249 0 1.329
Cash 0.949 2.780 0.001 40.827
Interest Coverage 51.154 184.598 -31.232 1545.536
Dividend Earnings 0.082 0.104 -0.061 0.615
Tobin’s q 1.906 1.202 0.737 9.181
Accruals 0.005 0.065 -1.069 0.802
Market Cap. 8.071 1.516 4.474 12.272
G-Index 9.415 2.624 2 18
CEO Duality 0.653 0.175 0 1
Total Comp. 7.827 1.027 4.738 9.864
Pay for Perf 68.761 22.693 0 99.897
CAPX 0.063 0.053 0.001 0.480
Tobin’s q 1.931 1.3314 0.501 27.087
CEO Tenure 7.914 7.406 0 56
CEO Age 56.236 7.335 33 91
External 0.131 0.337 0 1
– 42 –

Table 2: Estimation of CEO Ability
In this table, we estimate CEO ability. To do so, we regress Return on Assets on a set of controlvariables and a dummy variable for each CEO-firm match. The coefficients on these dummies areour proxy for CEO ability. The dependent variable is Return on Assets and the control variablesare Market Cap, Book Leverage, Cash, Interest Coverage, Dividend earnings, Tobin’s q, Accrualsand year dummies. All explanatory variables are lagged one year. We include dummy variables thattake value 1 for a specific CEO in a given firm and zero otherwise. Standard errors are clusteredat the firm level and *, **, or *** indicates that the coefficient is statistically significantly differentfrom zero at the 10%, 5%, or 1% level, respectively. Summary statistics for the estimated CEOAbility are also reported.
Dependent Variable: ROA
L.Market Cap. -0.0062
(0.0067)
L.Book Leverage 0.0048
(0.0096)
L.Cash 0.0018
(0.0010)
L.Interest Coverage -9.91E-08
(-1.77E-05)
L.Dividend Earnings -0.0010
(0.0111)
L.Tobin’s q 0.0183
(0.0039)***
L. Accruals -0.0002
(0.0211)
Industry/ Year F.E. Y
Observations 10103
CEO-Industry effects identified 2831
CEO Ability Mean 0.0696
CEO Ability Std. Dev. 0.1794
CEO Ability Min -0.9282
CEO Ability Max 0.8645
– 43 –

Table 3: CEO Ability, Governance, Compensation & Size
In Panel A, we regress corporate governance, firm size and different components of compensationon the CEO ability obtained in Table 2. In Panel B, we estimate a constant hazard function model(in Columns 1 and 2) and a Cox model (in Columns 3 and 4) of CEO turnover. In Panel A, weuse G-Index as measure of corporate governance. Executive compensation (Total Comp) is thelogarithm of CEO total compensation and Pay for Perf is the proportion of variable pay (bonusesand stock options) over total pay in percentage. Firm size is measured as Market Cap and CAPX.CEO Ability are the coefficients on the CEO fixed effects obtained in Table 4. All regressions inPanel A include CEO Characteristics (CEO Tenure, CEO Age, External dummy), industry fixedeffects and year dummies and coefficients are estimated with Weighted Least Squares to correct forestimation errors in the first stage. In Panel B, Columns 1 and 3 use the entire sample of CEOs,while Columns 2 and 4 only include those CEOs under 65 years of age. Results are reported in termsof Hazard Rates. Regressions in Panel B include market capitalization, CEO Characteristics (CEOAge, External dummy), industry fixed effects and year dummies. Standard errors are reported inparenthesis and clustered at the firm level in the first line and at the year level in the second line. *,**, or *** indicates that the coefficient is statistically significantly different from zero at the 10%,5%, or 1% level, respectively.
Panel A: Governance, Compensation & Size
Dependent Variable G-Index Total Comp. Pay for Perf. Market Cap. CAPX
(1) (2) (3) (4) (5)
CEO Ability 2.575 2.749 75.462 5.678 0.053
(1.363)* (0.413)*** (9.530)*** (0.552)*** (0.024)**
(0.991)** (0.250)*** (6.940)*** (0.267)*** (0.012)***
Industry/ Year F.E. Y Y Y Y Y
CEO Characteristics Y Y Y Y Y
Observations 9102 9102 9102 9102 9012
R-squared 0.208 0.423 0.369 0.591 0.443
Panel B: CEO Duration Model
Model Exponential Exponential Cox Cox
Observations All Ages Age ≤ 65 All Ages Age ≤ 65
(1) (2) (3) (4)
CEO Ability 0.125 0.133 0.102 0.090
(0.078)*** (0.092)*** (0.077)*** (0.075)***
(0.072)*** (0.070)*** (0.067)*** (0.051)***
Industry/ Year F.E. Y Y Y Y
Market Cap. Y Y Y Y
CEO Characteristics Y Y Y Y
Observations 9102 8209 9102 8209
– 44 –

Table 4: CEO Turnover and Corporate GovernanceIn these table, we regress the change in corporate governance (as measured by G-Index ) on CEOturnover and and CEO Quality. We also analyze the changes in compensation around turnover.Chg is a dummy variable that takes value 1 if G-Index changes from the previous period and 0otherwise. Chg Up is a dummy variable that takes value 1 if G-Index increases from the previousperiod and 0 otherwise. Chg Down is a dummy variable that takes value 1 if G-Index decreases fromthe previous period and 0 otherwise. Turnover is a dummy variable that takes value 1 if the CEOchanges over the period since the last measurement of G-Index and 0 otherwise. Turnover Up is adummy variable that takes value 1 if the CEO changes over the period since the last measurementof G-Index and the new CEO is better than the previous one (that is, CEO quality goes up overthe period) and 0 otherwise. Turnover Down is a dummy variable that takes value 1 if the CEOchanges over the period since the last measurement of G-Index and the new CEO is worse than theprevious one (that is, CEO quality goes down over the period) and 0 otherwise. Up is a dummyvariable that takes value 1 if the current CEO is better than the previous one, 0 otherwise. InPanel A, we estimate a logit specification of the changes in corporate governance regressed on themeasures of CEO turnover defined above. In Panel B, we restrict the sample to the observationsin which there is a CEO turnover and also analyze the changes in compensation. Av Comp is theaverage total compensation for a given CEO and Av Perf is the average pay for performance fora given CEO. All regressions include industry fixed effects and year dummies. Standard errors arereported in parenthesis and clustered at the firm level in the first line and at the year level in thesecond line. *, **, or *** indicates that the coefficient is statistically significantly different fromzero at the 10%, 5%, or 1% level, respectively.
Panel A: All Observations
Dependant Variable: Chg Chg Up Chg Down
(1) (2) (3)
Turnover 0.353 -0.274 0.134
(0.072)*** (0.115)** (0.165)
(0.162)** (0.143)* (0.202)
Turnover Up 0.472
(0.186)**
(0.285)*
Turnover Down -0.319
(0.252)
(0.305)
Up -0.241 0.194
(0.120)** (0.153)
(0.189) (0.249)
Market Cap. 0.008 -0.108 0.215
(0.023) (0.026)*** (0.038)***
(0.017) (0.037)*** (0.040)***
Observations 4249 4228 4236
R-squared 0.031 0.057 0.045
– 45 –

Tab
le4
(Cont.
)
Pan
elB
:T
urn
over
On
ly
Dep
Var
iab
le:
Ch
gU
pC
hg
Dow
nA
vC
om
pA
vP
erf
Av
Com
pA
vP
erf
(1)
(2)
(3)
(4)
(5)
(6)
Tu
rnov
erU
p0.
280
0.0
93
2.2
71
(0.1
60)*
(0.0
38)*
*(0
.987)
**
(0.1
75)
(0.0
30)*
*(0
.891)
*
Tu
rnov
erD
own
-0.1
94
-0.0
93
-2.2
71
(0.2
09)
(0.0
38)*
*(0
.987)*
*
(0.2
35)
(0.0
30)*
*(0
.891)*
Mar
ket
Cap
.-0
.128
0.1
30
0.4
58
6.4
600.4
58
6.4
60
(0.0
51)*
*(0
.076)*
(0.0
13)*
**
(0.3
61)*
**
(0.0
13)*
**
(0.3
61)*
**
(0.0
53)*
*(0
.076)*
(0.0
17)*
**
(0.3
99)*
**
(0.0
17)*
**
(0.3
99)*
**
Ob
serv
atio
ns
1108
1056
1132
1132
1132
1132
R-s
qu
ared
0.0
91
0.0
77
0.6
01
0.3
090.6
01
0.3
09
– 46 –

Table 5: Individual Components of G-Index and CEO AbilityIn these tables, we show detailed results regarding the relationship between our proxy of CEO abilityand the sub-components of the G-Index. In Panel A, regressions include CEO Characteristics (CEOTenure, CEO Age, External dummy), industry fixed effects and year dummies and coefficients areestimated with Weighted Least Squares to correct for estimation errors in the first stage. We onlyreport the coefficient on CEO ability. In Panel B, we regress the change in corporate governance (asmeasured by Chg Up) on CEO turnover and changes in CEO Quality. Chg Up is a dummy variablethat takes value 1 if each sub-index of G-Index increases from the previous period and 0 otherwise.Turnover is a dummy variable that takes value 1 if the CEO changes over the period since the lastmeasurement of the sub-index of G-Index and 0 otherwise. Turnover Up is a dummy variable thattakes value 1 if the CEO changes over the period since the last measurement of the subindex ofG-Index and the new CEO is better than the previous one (that is, CEO quality goes up over theperiod) and 0 otherwise. Up is a dummy variable that takes value 1 if the current CEO is betterthan the previous one, 0 otherwise. Regressions include market capitalization, industry fixed effectsand year dummies. Standard errors are reported in parenthesis below the coefficient and clusteredat the firm level at the top and at the year level at the bottom. *, **, or *** indicates that thecoefficient is statistically significantly different from zero at the 10%, 5%, or 1% level, respectively.
Panel A: Cross-sectional evidence
Dependent Variable Delay Protection Voting Other State Law
(1) (2) (3) (4) (5)
CEO Ability 0.795 0.834 0.412 1.578 -0.846
(0.658) (0.628) (0.410) (0.480)*** (0.648)
(0.498) (0.325)** (0.148)** (0.320)*** (0.214)***
Observations 9102 9102 9102 9102 9102
R-squared 0.188 0.204 0.152 0.200 0.165
Panel B: Turnover Results
Dependant Variable: Chg Up Chg Up Chg Up Chg Up Chg Up
Delay Protection Voting Other State Law
(1) (2) (3) (4) (5)
Turnover -0.159 -0.354 -0.800 -0.481 -0.119
(0.213) (0.152)** (0.375)** (0.233)** (0.395)
(0.140) (0.156)** (0.209)*** (0.367) (0.462)
Turnover Up -0.711 0.633 1.132 0.492 -0.316
(0.350)** (0.252)** (0.576)** (0.384) (0.695)
(0.404)* (0.514) (0.299)*** (0.602) (0.937)
Up 0.273 -0.428 -0.587 -0.089 0.026
(0.188) (0.159)*** (0.347)* (0.231) (0.430)
(0.240) (0.282) (0.319)* (0.328) (0.489)
Observations 3810 3841 3662 3783 3191
– 47 –