Competition and Regulation for Inclusive Growth in Southern ...
553
Jonathan Klaaren, Simon Roberts & Imraan Valodia edited by Competition and Regulation for Inclusive Growth in Southern Africa
-
Upload
khangminh22 -
Category
Documents
-
view
3 -
download
0
Transcript of Competition and Regulation for Inclusive Growth in Southern ...

Jonathan Klaaren, Simon Roberts & Imraan Valodia
edited by
Competition and Regulation for Inclusive Growth
in Southern Africa
Competition and Regulation for Inclusive Growth in Southern Africa
Jonathan Klaaren,Simon Roberts
& Imraan Valodia
edited by
“THE BOOK IS OF A HIGH CALIBRE, it is very informative and will be useful as a guide for competition law practitioners, policymakers, economists and university students. The selection of topics is very interesting and focuses on relevant issues common to Southern African countries. One such issue is that of energy which inrecent times has become a growing concern as Southern African countries face an energy crisis which threatens economic growth and development in this region.”– Yasmin Carrim, member of the Competition Tribunal of South Africa
THE CHAPTERS COLLECTED IN THIS VOLUME address key issues of competition and economic regulation in Southern and East Africa with reference to regional valuechains and industries. The contributions locate international debates on competition and corporate power in the critical issue of inclusive growth. There is a particular focus on shaping regional energy markets in order to take into account the implications of climate change as well as the challenges of extending access to affordable energy to low income households and small businesses.
The book is a critical assessment of the efficacy of the competition and economic regulationframework. Several contributions review the impact of the competition authorities in the region and survey the impact of particular interventions in the competition and economic regulation arena. This volume thus accomplishes two hitherto-unfulfilled tasks: examining in a single framework both competition and economic regulation and taking a Southern/East African view in examining these two topics.
This book should be widely read since competition and regulation are both distinct but crucial and linked areas of knowledge for the development of the economies of the countries of Southern and East Africa. It provides specific and concrete policy recommendations while also exploring the role of regulatory control in achieving various economic growth objectives.
The book responds to the clear need in the field of competition and economic regulation to develop a body of Africa-based knowledge and literature which originates from theexperiences of countries in the region rather than an exclusive reliance on international precedent and learnings.
The book develops African case studies for both training and knowledge-sharing purposes. These issues are of interest from both an academic and practitioner/businessperson’sperspective. The contributions show these issues are particularly relevant in terms of regional economic development where countries in the region often face the same challenges of small, concentrated markets where barriers to entry are especially high and where the resources to enforce against anticompetitive conduct are limited.
ISBN 978-1-928232-80-3 www.jacana.co.za
9 7 8 1 9 2 8 2 3 2 8 0 3
Competition and Regulation for Inclusive Growth in Southern Africa.indd 1 2019/07/03 14:43

Competition and Regulation


Competition and Regulation for Inclusive Growth in Southern Africa
Edited by Jonathan Klaaren, Simon Roberts & Imraan Valodia

First published by Fanele, an imprint of Jacana Media (Pty) Ltd, in 2019
10 Orange Street Sunnyside Auckland Park 2092 South Africa +2711 628 3200 www.jacana.co.za
© Individual contributors, 2019
All rights reserved.
ISBN 978-1-928232-80-3
Cover design by Maggie DaveyLayout by Alexandra TurnerEditing by Glenda YoungeProofreading by Lara JacobSet in Bembo 11/14ptPrinted and bound by ABC PressJob No. 003537
See a complete list of Jacana titles at www.jacana.co.za

v
Contents
List of contributors . . . . . . . . . . . . . . . . . . . . . . . . . . . . . . . . . . . . . . . . . . . . . . . . . . . . . . vii
Introduction . . . . . . . . . . . . . . . . . . . . . . . . . . . . . . . . . . . . . . . . . . . . . . . . . . . . . . . . . . . . . . . .1
1. Growth and development in the cosmetics, soaps and detergents
regional value chains: South Africa and Zambia
Teboho Bosiu, Farisai Chin’anga and Mwanda Phiri . . . . . . . . . . . . . . . . . 15
2. Competition policy for the Tripartite Free Trade Area
Jonathan Klaaren and Fungai Sibanda . . . . . . . . . . . . . . . . . . . . . . . . . . . . . . . . 59
3. Fighting anticompetitive practices in the sugar industry
Angella Kachipapa . . . . . . . . . . . . . . . . . . . . . . . . . . . . . . . . . . . . . . . . . . . . . . . . . . 101
4. Regional integration in southern Africa: A platform
for electricity sustainability
Gaylor Montmasson-Clair and Bhavna Deonarain . . . . . . . . . . . . . . . . . . 123
5. How rooftop PV can enhance energy security for
households across the SADC
Shannon Knight and Noxolo Mahlalela . . . . . . . . . . . . . . . . . . . . . . . . . . . . . 173
6. Planning a country’s energy infrastructure: Emerging debates
from South Africa and their implications
Duncan Lishman, Paul Anderson and Dumakude Nxumalo . . . . . . . . 209

C o m p e t i t i o n a n d R e g u l a t i o n f o R i n C l u s i v e g R o w t h
vi
7. Household tipping points in the face of rising electricity tariffs
Angelika Goliger and Aalia Cassim . . . . . . . . . . . . . . . . . . . . . . . . . . . . . . . . . . 249
8. Cost reflective price regulation of petroleum: The case for Zambia
Deborah Bwalya and Lungisani Zulu . . . . . . . . . . . . . . . . . . . . . . . . . . . . . . . . 271
9. The effects of competition on cement prices and the productivity
of cement producers in Ethiopia
Tesfaw Wondimu Tefera and Simon Roberts . . . . . . . . . . . . . . . . . . . . . . . . . . 289
10. Cartel enforcement: Adoption of a leniency programme in Kenya
Barnabas Andiva and Edith Masereti . . . . . . . . . . . . . . . . . . . . . . . . . . . . . . . . 321
11. Overcharge estimates in the South African reinforcing bar cartel
Pamela Mondliwa and Reena Das Nair . . . . . . . . . . . . . . . . . . . . . . . . . . . . . 341
12. Competition assessment in Malawi transport sector
Competition and Fair Trading Commission, Malawi . . . . . . . . . . . . . . . . . 371
13. Spectrum policy for competition and development: A comparative
study of approaches and outcomes in Africa
Genna Robb . . . . . . . . . . . . . . . . . . . . . . . . . . . . . . . . . . . . . . . . . . . . . . . . . . . . . . . . . 395
14. Regulating for the growth of mobile financial services: A case
study of Kenya, Tanzania and Uganda
Anthea Paelo . . . . . . . . . . . . . . . . . . . . . . . . . . . . . . . . . . . . . . . . . . . . . . . . . . . . . . . . 421
15. Procedural innovation in competition law for small economies
Rory Macmillan . . . . . . . . . . . . . . . . . . . . . . . . . . . . . . . . . . . . . . . . . . . . . . . . . . . . . 449
Conclusion: Building institutions for competition enforcement and
regional integration in southern Africa
Mark Burke, Tamara Paremoer, Thando Vilakazi
and Tatenda Zengeni . . . . . . . . . . . . . . . . . . . . . . . . . . . . . . . . . . . . . . . . . . . . . . . . . 487
Index . . . . . . . . . . . . . . . . . . . . . . . . . . . . . . . . . . . . . . . . . . . . . . . . . . . . . . . . . . . . . . . . . . . . . 529

vii
List of contributors
Paul Anderson is a competition and regulatory economist at Genesis Analytics in Johannesburg, South Africa.
Barnabas Andiva has an economics background and is at the Competition Authority of Kenya in the Enforcement and Compliance Department in Nairobi.
Teboho Bosiu is an economist at the Centre for Competition, Regulation, and Economic Development at the University of Johannesburg in South Africa.
Mark Burke is the managing director at development@work and works in Johannesburg, South Africa.
Deborah Bwalya is Legal Counsel at Zambian Breweries plc in Lusaka, Zambia.
Aalia Cassim is an economist working at the National Treasury of South Africa.
Farisai Chin’anga has a background in financial management and is affiliated with the Centre for Competition, Regulation, and Economic Development at the University of Johannesburg in South Africa.

C o m p e t i t i o n a n d R e g u l a t i o n f o R i n C l u s i v e g R o w t h
viii
Reena Das Nair is a senior researcher at the Centre for Competition, Regulation, and Economic Development at the University of Johannesburg in South Africa.
Bhavna Deonarain is a researcher in sustainable growth at Trade and Industrial Policy Strategies in Pretoria, South Africa.
Angelika Goliger is an economist at Ernst & Young in Johannesburg, South Africa.
Angela Kachipapa is a Competition and Consumer Analyst at the Competition and Fair Trading Commission in Lilongwe, Malawi.
Fexter Katungwe is a senior analyst in the Competition Division at the Competition and Fair Trading Commission in Lilongwe, Malawi.
Jonathan Klaaren is a professor at the School of Law at the University of the Witwatersrand in South Africa.
Shannon Knight has a background in competition and regulatory economics, and is a data analyst at PPO Serve in Johannesburg, South Africa.
Duncan Lishman is an economist at Genesis Analytics in Johannesburg, South Africa.
Rory Macmillan is a lawyer specialised in competition, telecommunications, digital financial services, data protection, privacy and digital identity law, and is a partner in Macmillan Keck Attorneys & Solicitors.
Noxolo Mahlalela is a consultant at the Palmer Development Group in Cape Town, South Africa.

ix
L i s t o f c o n t r i b u t o r s
Edith Masereti has a financial economics background and is at the Competition Authority of Kenya in the Mergers and Acquisition Department in Nairobi.
Pamela Mondliwa is a senior researcher at the Centre for Competition, Regulation, and Economic Development at the University of Johannesburg in South Africa.
Gaylor Montmasson-Clair is a senior economist at Trade and Industrial Policy Strategies in South Africa.
Dumakude Nxumalo is an associate at Genesis Analytics in Johannesburg, South Africa.
Anthea Paelo is an economist at the Centre for Competition, Regulation, and Economic Development at the University of Johannesburg in South Africa.
Tamara Paremoer is Economic Advisor to the Commissioner at the Competition Commission of South Africa.
Mwanda Phiri is a research fellow in trade and investment at the Zambia Institute for Policy Analysis and Research in Lusaka, Zambia.
Genna Robb is an economist at Acacia Economics in Johannesburg, South Africa.
Simon Roberts is an economics professor and lead researcher at the Centre for Competition, Regulation, and Economic Development at the University of Johannesburg and an economics director at the Competition and Markets Authority of the United Kingdom.
Fungai Sibanda is an economist at Hekima Advisory in Johannesburg, South Africa.

C o m p e t i t i o n a n d R e g u l a t i o n f o R i n C l u s i v e g R o w t h
x
Tesfaw Wondimu Tefera has an M Phil in Industrial Policy from the University of Johannesburg and is a senior researcher and Acting Director of the Fertilizer and Petrochemical Industry Development Directorate at Chemical and Construction Inputs Industry Development Institute in Addis Abba, Ethiopia.
Imraan Valodia is an economist and Dean of the Faculty of Commerce, Law and Management at the University of the Witwatersrand in South Africa.
Thando Vilakazi is Executive Director of the Centre for Competition, Regulation, and Economic Development at the University of Johannesburg in South Africa.
Tatenda Zengeni is an economist at Competition and Tariff Commission in Zimbabwe, and formerly at the Centre for Competition, Regulation, and Economic Development at the University of Johannesburg in South Africa.
Lungisani Zulu is legal counsel at the Bank of Zambia in Lusaka, Zambia.

1
i n t r o d u c t i o n
Introduction
This volume locates the international debates on competition and corporate power in the critical issue of inclusive growth, which has become an important policy goal for the economies of southern and eastern Africa. As such, the concept and its implementation and development require and deserve rigorous and empirically based investigation and analysis. This volume builds on earlier research covering cartel law enforcement and the role of competition and regulation in reshaping African markets. The chapters turn to investigate the competition-related aspects of inclusive growth and value chains in the southern and eastern African region. There is a particular focus on shaping regional energy markets, considering the implications of climate change, as well as the challenges of extending access to affordable energy to low-income households and small businesses. These issues should be of interest from both an academic and a practitioner perspective. They are particularly relevant in terms of regional economic development as countries in the region often face the same challenges of small, concentrated markets where barriers to entry are especially high and the resources to enforce against anticompetitive conduct are limited. Taken together, these chapters constitute a critical assessment of the efficacy of the competition and economic regulation framework, and review the status and impact of the regional (primarily southern African) competition authorities. This work accomplishes two tasks that have not

C o m p e t i t i o n a n d R e g u l a t i o n f o R i n C l u s i v e g R o w t h
2
been covered adequately in the existing literature – examining both competition and economic regulation in a single framework and taking a southern African view on these areas of research.
This introduction previews and outlines the 15 chapters of this volume, which broadly speaking fall into three groups. Chapters 1 to 3 take up topics related to inclusive economic development and participation in regional value chains, while Chapters 4 to 8 turn to the specific but crucial sector of energy and examines regulation and infrastructure. Chapters 9 to 15 consolidate a number of studies that generally address competition and economic growth in the region. The concluding chapter focuses on institutional issues and the policy-relevant recommendations emanating from these chapters.
Chapter 1, ‘Growth and development in the cosmetics, soaps and detergents regional value chains: South Africa and Zambia’, focuses on the structures of a particular light industrial, regional value chain. As Bosiu, Chinanga and Phiri point out, current economic development theory argues that sector prioritising should not be avoided, even if the development of broad capabilities is also necessary. The need for effective regional strategies has become urgent as industrialisation has either stalled or been reversed. Indeed, this chapter makes the case that in both Zambia and South Africa, there is an opportunity for light industrialisation in these sectors based, in part, on the growing demand for consumer goods on the back of increasing incomes in the region. Currently, only about 30 per cent of this demand is being met from countries within the Southern African Development Cooperation (SADC), the lion’s share coming from South African exports. The challenges, nonetheless, are substantial. These include high input costs owing to the high cost of raw and packaging materials; barriers to accessing supermarkets; the lack of production scale; limited access to finance, particularly for packaging and advertising; skills shortages; exchange rate movements and unfavourable regulations and standards. Still, with skills and knowledge transfer between South Africa and Zambia, Zambia’s capabilities in these products can grow and it can achieve a competitive edge. One of the take-home points from this chapter is empirical evidence supporting the potential for the win–

3
i n t r o d u c t i o n
win development of a large and a small SADC economy in a regional value chain.
In Chapter 2, Klaaren and Sibanda explore the benefits that may come from explicitly including a competition element in the regional integration agenda. Their contribution, ‘Competition policy for the Tripartite Free Trade Area’ (TFTA), argues that African countries – including Zamibia, Malawi and South Africa – need to develop proactive strategies to harness the dramatic changes that have occurred in the trade architecture of the world over the first decade of the new millennium and to use these to advance the integration of the African continent (Ismail, 2016). They argue for a development integration approach rather than one of open regionalism. This would be consistent with the call by Bosiu, Chinanga and Phiri in Chapter 1 for limited protectionist measures in the soaps, detergents and cosmetics sector. In this three-pronged and pragmatic development integration approach, African countries are called on to advance their regional integration by opening of their markets to one another, while building industrial capabilities and developing cross-border infrastructure (Ismail, 2016). The current three pillars of the TFTA agreements – market access, cross-border infrastructure and regional industrial policy – mirror this approach. The TFTA, in turn, is the key bridge towards the envisaged Continental Free Trade Area (Fundira, 2016).
Drawing on recent research, the authors observe that taking competition into account strengthens the argument for regional integration. Firms seeking to increase their market power – whether through collusion or the abuse of monopoly power – are likely to be better able to do so in smaller national markets. Regional coordination in competition enforcement may be effective against cartels and other anticompetitive arrangements that have regional and international scope. Cartels, for instance, have operated across southern Africa in cement, concrete and fertiliser products. Further, the gains from regional integration are much greater when the implications of imperfect competition are considered (Roberts, Vilakazi and Simbanegavi, 2017).
In Chapter 3, ‘Fighting anticompetitive business practices in the

C o m p e t i t i o n a n d R e g u l a t i o n f o R i n C l u s i v e g R o w t h
4
Malawi sugar industry’, Kachipapa presents a study of an intervention by the domestic competition authority into sugar, an essential food commodity for households in Malawi. The sole producer of sugar, Illovo, had its monopoly power reinforced by a government ban on importing sugar from elsewhere in the region. Illovo, nonetheless, exports about 20 per cent of its sugar production into the region. On receipt of complaints in 2012, the Competition and Fair Trading Commission (CFTC) of Malawi investigated a firm called Simama Trading, which was operating as both a wholesaler and a distributor. By 2014, after investigating an agreement between Illovo and Simama Trading, the competition authority found against Simama for violating the Malawian competition law and ordered that warehousing and distribution be split. This has occurred, encouraging greater competitiveness, and new players have entered the distribution system. The regional dimension continues as before. As Kachipapa notes, there is a need for greater compliance and the capacity of the authority needs to be strengthened to enable it to enforce domestic competition laws.
Chapter 4, ‘Regional integration in southern Africa: A platform for electricity sustainability’, examines the energy landscape in southern Africa and sets up a framework for considering chapters 9-15. Montmasson-Clair and Deonarain argue that across the regional economy, a rapid transition to sustainability is underway, with energy at its core. They identify a progressive movement of regional integration taking place with numerous energy-related initiatives, principally through the Southern African Power Pool (SAPP). Simultaneously, electricity supply industries in the region are restructuring, independent power producers are emerging and individualism within the energy field is increasing. These dynamics call for a renewed approach to regional electricity integration in support of sustainable energy development and a critical analysis of regional electricity dynamics with the aim of improving regional sustainability.
Montmasson-Clair and Deonarain develop and use an electricity sustainability prism of analysis to review the performance of the SAPP region. In this analysis, three key dimensions are considered to assess

5
i n t r o d u c t i o n
electricity sustainability in the region: electricity security, electricity equity and environmental sustainability. They then analyse the existing role of regional integration in terms of electricity sustainability in the SADC region and explore the potential to improve southern Africa’s electricity sustainability through regional integration channels. This chapter has numerous public policy implications. Three are particularly relevant to this volume’s argument that competition and economic development may be fostered through attention to accelerated regional integration, inclusive of infrastructural development. First, while implementation of the regional plans and strategies are the priority, one should be cautious not to force a standardised approach (in terms of market structure and tariffs) on countries facing varied national circumstances. In this respect, calls for cost-reflective tariffs are potentially problematic if they are not associated with a dramatic improvement in the performance of entities and the elaboration of clear plans to mitigate negative impacts on low-income households and businesses. A general push towards small-scale, renewable energy-based systems would, in this respect, provide an elegant avenue to restructure the electricity supply industries in the region, circumvent tariff issues (by turning consumers into prosumers) and shift to sustainable energy solutions. Second, the SADC, through the SAPP, should pursue planned cross-border projects, with a focus on connecting Angola, Malawi and Tanzania to the regional grid and enhancing key backbone links. Third, the SAPP should pursue the deepening of the regional market. As the regional market grows and trade rises, stronger (particularly long-term) surveillance and improved financial security requirements measures (to minimise financial settlement risks) will be important.
In Chapter 5, ‘How rooftop PV can enhance energy security for households across the SADC’, Knight and Mahlalela argue for the use of small-scale embedded generation (SSEG) in the form of rooftop solar photovoltaic installations as a means to enhance energy security and sustainability in the SADC. They discuss the benefits of extending access to electricity in a region where less than a third of the total population has access to electricity. They point out that two key approaches have been

C o m p e t i t i o n a n d R e g u l a t i o n f o R i n C l u s i v e g R o w t h
6
followed internationally to develop grid-connected solar programmes: utility or third-party programmes and customer-driven programmes. In a case study of South Africa, the authors argue that the connection of SSEG systems to the national grid has proved to be complex for local municipalities. They then go on to review the policies in place in Angola, Botswana, the Democratic Republic of Congo, Madagascar, Malawi, Mauritius, Mozambique, Namibia, Seychelles, Swaziland, Tanzania, Zambia and Zimbabwe. They note that all the SADC member states have introduced specific policies to encourage renewable energy development and they believe that rooftop PV can assist in solving the energy crisis in the region. Many countries already have feed-in-tariff or net-metering policies in place. Looking at best practice, they argue that policy support is key for the future development of the PV industry, for both the private investors and governments involved, and that financial incentives, in particular, should be considered.
In Chapter 6, ‘Planning a country’s energy infrastructure: Emerging debates from South Africa and their implications’, Lishman, Anderson and Nxumalo adopt a similar method to the two previous chapters by examining in-depth issues in South Africa, albeit with relevance for the region. Emphasis is given to the need for policy-makers to maintain oversight and, where required, to guide the nature, magnitude and timing of energy infrastructure developments. In this context, governments generally develop long-term – 20 to 30 years into the future – energy plans or outlooks in an effort to guide and inform policy, and to assist in shaping the optimal mix of energy investments required. African countries that have published such plans include Angola, Kenya, Rwanda and Tanzania. In 2016/17, the South African government published for comment two long-term energy plans for the country, one modelling the overall energy mix for the country up to 2050, and the other focusing specifically on the electricity sector. The authors identify and examine key areas of the debate around long-term energy planning and argue that energy utility regulators can provide valuable guidance on these issues. Although policy formulation is typically outside their remit, regulators are sector specialists and can provide inputs and guidance, which improve
7
i n t r o d u c t i o n
the ultimate accuracy and usefulness of the modelling contained in the plans.
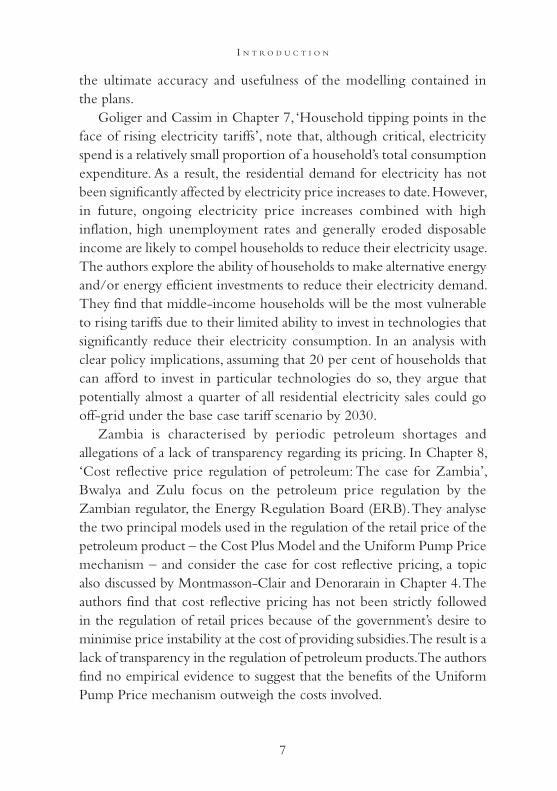
Goliger and Cassim in Chapter 7, ‘Household tipping points in the face of rising electricity tariffs’, note that, although critical, electricity spend is a relatively small proportion of a household’s total consumption expenditure. As a result, the residential demand for electricity has not been significantly affected by electricity price increases to date. However, in future, ongoing electricity price increases combined with high inflation, high unemployment rates and generally eroded disposable income are likely to compel households to reduce their electricity usage. The authors explore the ability of households to make alternative energy and/or energy efficient investments to reduce their electricity demand. They find that middle-income households will be the most vulnerable to rising tariffs due to their limited ability to invest in technologies that significantly reduce their electricity consumption. In an analysis with clear policy implications, assuming that 20 per cent of households that can afford to invest in particular technologies do so, they argue that potentially almost a quarter of all residential electricity sales could go off-grid under the base case tariff scenario by 2030.
Zambia is characterised by periodic petroleum shortages and allegations of a lack of transparency regarding its pricing. In Chapter 8, ‘Cost reflective price regulation of petroleum: The case for Zambia’, Bwalya and Zulu focus on the petroleum price regulation by the Zambian regulator, the Energy Regulation Board (ERB). They analyse the two principal models used in the regulation of the retail price of the petroleum product – the Cost Plus Model and the Uniform Pump Price mechanism – and consider the case for cost reflective pricing, a topic also discussed by Montmasson-Clair and Denorarain in Chapter 4. The authors find that cost reflective pricing has not been strictly followed in the regulation of retail prices because of the government’s desire to minimise price instability at the cost of providing subsidies. The result is a lack of transparency in the regulation of petroleum products. The authors find no empirical evidence to suggest that the benefits of the Uniform Pump Price mechanism outweigh the costs involved.

C o m p e t i t i o n a n d R e g u l a t i o n f o R i n C l u s i v e g R o w t h
8
The next set of chapters covers the broad topic of Competition and economic growth in southern and eastern Africa. The seven chapters in this section examine specific competition issues as they relate to questions of growth and development, with a focus on a number of African countries. They consider the role of authorities in addressing competition problems in markets, including those that arise from regulation, and the tools that can be employed. The issues of weak effective competition are pertinent, particularly in network industries such as transport, telecommunications and mobile money, each of which is tackled in separate chapters. Two other chapters examine the reinforcing steel and cement sectors, quantifying the impact of effective competition compared to its absence, whether due to coordinated conduct or insufficient entry.
Chapter 9, ‘The effects of competition on cement prices and the productivity of cement producers in Ethiopia’ by Tefera and Roberts, examines a sector in which cartels have been identified in jurisdictions around the world. However, the main reason for the very high prices and low levels of competition in the cement industry in Ethiopia has been the need for investment in large-scale efficient plants. This has been exacerbated by the rapidly growing demand for cement in line with the high levels of investment in infrastructure as part of the government’s development strategy. The analysis traces the role played by industrial policy in supporting rivalry and draws on detailed firm-level data to assess the effects on productivity. A key finding is the adjustment process that was necessary when a few large efficient producers brought substantially lower and more competitive prices, which meant that smaller producers, using less efficient technologies, either closed down or had to invest to upgrade. Overall prices (in US dollars) reduced by more than 50 per cent from the earlier peaks in 2011 to levels in line with competitive international markets by 2016. This chapter also highlights the importance of local transport costs and local market dynamics, given the long distances and the weight-to-value of cement.
Chapter 10 by Andiva and Masereti is entitled ‘Cartel enforcement: Adoption of a leniency programme in Kenya’. Leniency has become

9
i n t r o d u c t i o n
widely used in enforcement by competition authorities against cartel conduct where a straightforward offer of no (or a greatly reduced) penalty is made to the first member of a cartel that comes forwards to admit the conduct and fully cooperate with the prosecution of the other cartel members. Such a policy depends on there being a reasonable likelihood of detection and substantial penalties imposed on the cartel members, to induce the cooperation. The authors set out the process by which legislative changes and regulations have laid the basis for the corporate leniency policy in Kenya as an example of a young authority seeking to replicate the approaches used in more developed economies.
Mondliwa and Das Nair add to the literature on cartel overcharges and consequent damages in Chapter 11, ‘Overcharge estimates in the South African reinforcing bar cartel’. This case is especially interesting for a number of reasons. The cartel was a tight-knit group of steel producers in South Africa, where economies of scale relative to demand meant that there was not a large number of competitors. This observation applies even more to other countries in southern Africa – although the authors note that this cartel probably applied to buyers of steel across all of South Africa’s neighbours, who largely relied on imports to meet their needs, especially the landlocked countries, which have limited alternatives. The cartel was also part of multilevel collusive arrangements running from the sourcing of scrap metal – a key input – to the downstream cutting and bending of reinforcing steel for construction projects. The long-running nature of these multilevel arrangements implies that vigorous competition is unlikely to simply break out in the absence of explicit collusive arrangements. The authors analyse the mark-ups using two different models for the competitive counter-factual – the Bertrand competition model and a leader–follower model – and consider external shocks, which can confound calculations. The mark-up calculations range from 36 per cent to 43 per cent above the imputed non-collusive prices, illustrating, as many other studies have done, just how substantial the harm from cartel conduct can be.
In Chapter 12, ‘Competition assessment in Malawi’s transport sector’, Katungwe of Malawi’s Competition and Fair Trade Commission (CFTC)

C o m p e t i t i o n a n d R e g u l a t i o n f o R i n C l u s i v e g R o w t h
10
draws on a market inquiry carried out by the authority to map out the competition issues in different modes of transport for both goods and passengers. He highlights the interaction of regulation and barriers to entry in creating and sustaining poorly working markets with apparently low levels of competition. In these circumstances, which are common in developing countries, the authority has to combine advocacy and research with carefully selected enforcement actions. The efficiency and cost of transport services are critical for Malawi’s economy to ensure integrated markets within the country and for international trade, given its landlocked position. The high transport costs are partly due to high liquid fuel prices (regulated at import parity levels and due in part to transport costs, as there is no local fuel production) and the low and uneven transport volumes. The latter means that prices on one leg of a return journey, such as to a port, have to cover a disproportionate amount of the costs because the return legs are often empty. Katungwe highlights a number of concerns in markets where a single firm controls critical facilities such as bus depots. There are also indications of coordination in several markets, where pricing does not appear to be responsive to demand and supply. In addition, the Malawi case indicates that regulations are often made by, or in consultation with, incumbent providers and are likely to raise barriers to the entry of new firms, which cannot be justified.
Chapter 13 by Robb reviews the growing use of ‘market based’ mechanisms for spectrum management in telecommunications, such as spectrum auctioning, pooling, leasing and trading. These have been promoted as putting a market-related value and opportunity cost on spectrum, such that it is likely to find its way to the user who will use it most efficiently. Over the course of 20 years, spectrum auctions have evolved from a relatively simple means of price discovery into complex, multi-objective processes, which have had both great successes and radical failures. A key issue in terms of the effectiveness of market-based measures has turned out to be the extent to which they stimulate or stifle competition. Robb presents a comparative review of spectrum policy in African countries and their potential impact on levels of competition.
11
i n t r o d u c t i o n
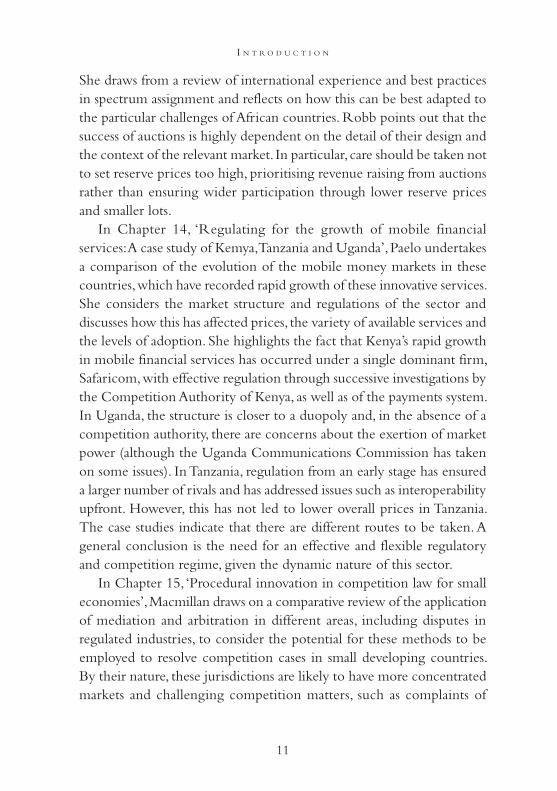
She draws from a review of international experience and best practices in spectrum assignment and reflects on how this can be best adapted to the particular challenges of African countries. Robb points out that the success of auctions is highly dependent on the detail of their design and the context of the relevant market. In particular, care should be taken not to set reserve prices too high, prioritising revenue raising from auctions rather than ensuring wider participation through lower reserve prices and smaller lots.
In Chapter 14, ‘Regulating for the growth of mobile financial services: A case study of Kemya, Tanzania and Uganda’, Paelo undertakes a comparison of the evolution of the mobile money markets in these countries, which have recorded rapid growth of these innovative services. She considers the market structure and regulations of the sector and discusses how this has affected prices, the variety of available services and the levels of adoption. She highlights the fact that Kenya’s rapid growth in mobile financial services has occurred under a single dominant firm, Safaricom, with effective regulation through successive investigations by the Competition Authority of Kenya, as well as of the payments system. In Uganda, the structure is closer to a duopoly and, in the absence of a competition authority, there are concerns about the exertion of market power (although the Uganda Communications Commission has taken on some issues). In Tanzania, regulation from an early stage has ensured a larger number of rivals and has addressed issues such as interoperability upfront. However, this has not led to lower overall prices in Tanzania. The case studies indicate that there are different routes to be taken. A general conclusion is the need for an effective and flexible regulatory and competition regime, given the dynamic nature of this sector.
In Chapter 15, ‘Procedural innovation in competition law for small economies’, Macmillan draws on a comparative review of the application of mediation and arbitration in different areas, including disputes in regulated industries, to consider the potential for these methods to be employed to resolve competition cases in small developing countries. By their nature, these jurisdictions are likely to have more concentrated markets and challenging competition matters, such as complaints of

C o m p e t i t i o n a n d R e g u l a t i o n f o R i n C l u s i v e g R o w t h
12
abuse of dominance. In effect, the competition authority may well be taking on a quasi-regulatory role in seeking to remedy a lack of competition and set expectations of dominant firm conduct. Macmillan argues that mediation and arbitration can play an important role as complements to enforcement. Companies’ incentives to agree to these measures depend on the credibility of the competition authority and its ability to enforce decisions. There is also an attraction for the parties to enter into mediation or arbitration, as a swifter resolution means greater certainty, which would enable firms to make investment decisions going forwards rather than having a long-running matter with an uncertain resolution. Examples are provided from regulatory matters that have been resolved in these ways.
The concluding chapter in this volume entitled is ‘Building institutions for competition enforcement and regional integration in southern Africa’. It highlights the important role of institutions and regulatory agencies in implementing the competition framework for southern Africa. The authors examine and reflect on the competition law enforcement record of authorities in southern Africa in the context of regional industrial development and integration, highlighting both the challenges of doing so with limited capacity and in relatively small economies with low levels of development. Meeting the goals of inclusive economic development and achieving participation in regional value chains – as outlined in the chapters of this volume – will be furthered by effective competition law enforcement and policy development.
REFERENCESFundira, T (2016) Towards a continental free trade area: Analysis of the status
of the regional trade regimes, Tralac Working Paper No. S16WP08/2016. Available at: http://www.tralac.org/images/docs/9330/s16wp082016-fundira-towards-a-cfta-analysis-of-the-status-of-the-regional-trade-regimes-20160323-fin.pdf.
Ismail, F (2016) The changing global trade architecture: Implications for Africa’s integration and development. Available at: http://www.tips.org.

13
i n t r o d u c t i o n
za/research-archive/trade-and-industry/item/3144-the-changing-global-trade-architecture-implications-for-africa-s-integration-and-development.
Roberts, S, Vilakazi, T and Simbanegavi, W (2017) Competition, regional integration and inclusive growth in Africa: A research agenda. In J Klaaren, S Roberts and I Valodia (eds) Competition Law and Economic Regulation: Addressing market power in southern Africa. Johannesburg: Wits University Press, pp. 263–287. Available at: http://oapen.org/search?identifier=634572.


15
t h e c o s m e t i c s , s o a p s a n d d e t e r g e n t s r e g i o n a L v a L u e c h a i n s
1
Growth and development in the cosmetics, soaps and detergents
regional value chains: South Africa and Zambia1
Teboho Bosiu, Farisai Chin’anga and Mwanda Phiri
INTRODUCTION
The challenge facing economies in the Southern African Development Community (SADC) is either stalled industrialisation or early deindustrialisation. These economies are typically reliant on the production and export of minerals and, as a result, the fall in commodity prices (particularly between the years 2014 and 2015) has had a significant impact on the performance of the commodity growth-driven economies. This has led to various SADC member states placing industrial development at the core of the region’s integrated development agenda. There is a growing impetus for many countries to transform the structure of their economies towards economic sectors that are more resilient to external shocks and have the greatest potential for sustainable inclusive economic growth. The growing demand for consumer goods on the back of increasing incomes in the region present opportunities for light manufacturing and increased industrialisation in the region. This study discusses the relative importance of light manufacturing as a stepping stone towards the establishment of industries in the region

C o m p e t i t i o n a n d R e g u l a t i o n f o R i n C l u s i v e g R o w t h
16
to enhance economic transformation and inclusive economic growth. It maps the cosmetics, soaps and detergents value chain in South Africa and Zambia, and analyses the competitiveness, critical success factors, growth constraints and the opportunities presented by end markets.
In terms of economic literature, structural change can be achieved by moving across sectors, from low to medium and finally high productivity sectors (inter-sectoral transition), and changes within sectors to higher value-added activities and improved productivity (intra-sectoral deepening). Both these processes are at the core of diversifying economies and, thus, policies that will effectively drive industrial development require one or both of these objectives. There has been much debate in the literature on the types of industrial policies that can facilitate structural change. While some have advocated for support of capability development packages, for example, implementing skills development programmes (Joffe et al, 1995), others have argued that industrial policies that target particular sectors or activities are more effective (McMillan et al, 2017). Rodrik (2010) adds to this debate by arguing that industrial policies and strategies targeted at supporting a broad range of activities – as opposed to specific sectors – increase the potential for structural transformation. Although structural change dynamics within an economy are linked to the level of capabilities available in that economy, policy programmes that simply support capability development have not been effective in delivering the required structural change.
For example, during the 1990s, the post-apartheid government in South Africa followed this approach and, 23 years after democracy, the structure of the South African economy is still similar to that inherited in 1994. Conversely, policies that target particular sectors or activities but do not support capability development, while seemingly effective in achieving some level of structural change, are not sustainable. For example, Zambia in the 1960s adopted an import-substitution policy that succeeded in increasing industrial output for a short period, but resulted in limited linkages in the domestic economy and reduced output, mainly as a result of a heavy reliance on imported inputs and technology and a lack of technical skills training for industrial and technological

17
t h e c o s m e t i c s , s o a p s a n d d e t e r g e n t s r e g i o n a L v a L u e c h a i n s
upgrading (Chansa et al, 2016). On the surface of it, what is required is a policy programme that targets particular activities or sectors that are to be developed, accompanied by capability development. The challenge then is to decide which sectors or activities should be supported by policy. This can be done by an assessment of the opportunities that exist, as well as the extent to which these opportunities will address the challenges that are faced.
The challenges in Zambia and South Africa
South Africa has experienced premature deindustrialisation with a significant decline in employment in manufacturing. The country’s growth has slowed down to -0.3 per cent in the first three quarters of 2018 from 1.6 per cent recorded in the first three quarters of 2017 (StatsSA, 2018). Overall unemployment in 2018 remained high at 27.5 per cent. On the other hand, Zambia, until recently, recorded impressive economic growth, averaging over 6 per cent per annum, over the past two decades. Nevertheless, the recent growth did little to provide jobs that could offer the majority of the population a reprieve from poverty. More than half of the population (approximately 54 per cent) still live below the poverty line. Zambia’s economy has not achieved the industrial development required for sustainable inclusive economic growth and employment creation. Like many other countries in the region, Zambia’s economic growth has been driven by the commodity price boom of the 2000s, which poses sustainability risks as a result of international commodity price shocks. Any downward swing in commodity prices tends to destabilise the country’s growth trajectory. As a result, growth is not sustainable and is often not inclusive in the absence of adequate redistribution policies. This is evident from the slowdown in Zambia’s economic growth following the fall in international commodity prices in 2014 and 2015. Real economic growth reduced to 2.9 per cent in 2015 from 4.7 per cent recorded in 2014 (CSO, 2016). Similarly, the recent rise in international copper prices in 2016 and 2017 coincided with an economic growth rate of 4.4 per cent in 2016 and 3.6 per cent in 2017, up from 2.9 per cent in 2015 (CSO, 2018).

C o m p e t i t i o n a n d R e g u l a t i o n f o R i n C l u s i v e g R o w t h
18
Diversifying towards other economic sectors, which are more resilient to external shocks, therefore becomes imperative and manufacturing is one such sector. Even so, Zambia’s manufacturing base remains low and South Africa’s is decreasing. As can be seen in Figure 1.1, Zambia’s once thriving manufacturing industry collapsed between 1992 and 1994 following the liberalisation of the economy and the privatisation of many state-owned enterprises that followed. The contribution of the manufacturing industry to gross domestic product (GDP) in Zambia dropped sharply from a peak of 37.2 per cent in 1992 to 10.4 per cent in 1994, denoting a structural break as the country moved from a closed to an open economy (World Bank, 2017). Since then, manufacturing’s contribution to GDP has fallen and remained flat, averaging 7.7 per cent per annum over the period 2006 to 2017. Similarly, the contribution of South Africa’s manufacturing industry to the country’s GDP has been falling since the year 1990, albeit less dramatically. The industry’s share reduced from 23.6 per cent in 1990 to 11.8 per cent in 2017, suggesting early deindustrialisation.
Figure 1.1: Manufacturing share of GDP, Zambia and South Africa 1960–2017
Source: Authors’ construction using World Bank National Accounts and OECD National Accounts Data
It is evident that, in order to create sustainable economic growth, there is a need for industrialisation. The literature suggests that industrialisation

19
t h e c o s m e t i c s , s o a p s a n d d e t e r g e n t s r e g i o n a L v a L u e c h a i n s
offers the most potential for employment creation in high productivity and higher value-addition industries (Chenery et al, 1986; Murphy et al, 1989; Hidalgo et al, 2007; Hidalgo and Hausmann, 2009; Andreoni, 2011; Andreoni and Chang, 2016; and McMillan et al, 2017). For economic growth to be sustainable and contribute to the creation of productive employment, it must be accompanied by structural transformation (Dinh et al, 2013). The growing demand for consumer goods on the back of increasing incomes in the region present opportunities for light manufacturing and industrialisation in both Zambia and South Africa.
The opportunities
In the SADC, opportunities are sought in non-commodity manufacturing, among others, to foster sectoral transitioning. There are a number of opportunities that can be leveraged for growth in the region. First, the SADC region has been experiencing rapid urbanisation, increasing populations and incomes. Demand for consumer goods is expected to grow on the back of rising incomes in the region. Although the region recorded an average GDP growth rate of 4.5 per cent (2010–2017), there are a few countries in the region that have grown at average rates above 6 per cent over that period (i.e. DRC, Mozambique and Tanzania). There is a collective interest for the SADC countries to support growth, given that the region as a whole is the main source of demand for manufactured products. This demand can be met by exports from member states. Light manufacturing (including that of consumer goods) is, therefore, an important stepping stone towards economic transformation and the development of production capabilities in the region.
Second, there is an opportunity for import substitution and export diversification in certain industries within the consumer chemicals. There is a trade deficit of US $536 million for cosmetics and US $667 million for soaps and detergents in the SADC region, presenting an opportunity for the region to meet this demand internally rather than importing finished products from elsewhere.2 Intraregional trade in soaps, detergents and cosmetics grew significantly between 2010 and 2017. Third, the consumer chemicals sector is important because it has relatively low entry barriers, so

C o m p e t i t i o n a n d R e g u l a t i o n f o R i n C l u s i v e g R o w t h
20
policy-makers can support domestic firms. Fourth, the regional trade for these consumer goods is further fuelled by the cross-border operations of retail chains. Given the multinational nature of many supermarket chains in the region, supermarkets open up a much larger regional market for suppliers to attain the necessary scale to become competitive in national, regional and, potentially, even international markets.
This chapter thus discusses the relative importance of light manufacturing as a stepping stone towards economic transformation and the establishment of industries in the region. It maps the cosmetics, soaps and detergents value chain in South Africa and Zambia, and analyses the critical factors influencing the success, growth constraints and opportunities presented by end markets. This study limited the choice of products to cover manufactured soaps and detergents, cleaning and polishing preparations, perfumes and toilet preparations as per the International Standard Industrial Classification (ISIC) Revision 3 Harmonised System (HS) four-digit classification.3 According to this nomenclature, this broadly includes products such as detergent pastes, powders and liquids, soaps, shampoos, hair conditioners and oils, toilet cleaners, dishwashing detergents, beauty products such as lotions and oils, etc. This selection was premised on three observations: one, Zambia’s trade deficit in these products suggests potential for import substitution; two, South Africa has a trade surplus (albeit one that has been declining) in these products, which suggests a flourishing industry; and, three, imports of these products in southern Africa suggests a regional demand for these goods, which can be met in part with exports from the region.
Given that one of the rationales for choosing cosmetics, soaps and detergents is to meet the increasing consumer demand within the region, a partnership between Zambia and South Africa for the development of the value chains would have a number of advantages. Globalisation has compelled SADC member countries to strive for regional cooperation and integration to withstand global competition (Blueprint Strategy and Policy, 2005). On their own, southern African countries are very small in economic terms, which limits their competitiveness in regional and global value chains. To acquire scale and competitiveness, it is necessary

21
t h e c o s m e t i c s , s o a p s a n d d e t e r g e n t s r e g i o n a L v a L u e c h a i n s
for countries with such characteristics to integrate their markets. Second, Zambia’s proximity to neighbouring countries that are further away from South Africa, present opportunities for South African investment in soaps, detergents and cosmetic production in Zambia. Further, retail expansion into mining towns and rural areas in Zambia and spending on consumer goods, which is predicted to double from 2014 levels of US $15.6 billion to US $28.2 by 2019, present opportunities for increased demand for fast-moving consumer goods. Lastly, the existing and more developed production capabilities in South Africa offer opportunities for skills and knowledge transfer between Zambia and South Africa.
This study of the cosmetics, soaps and detergents value chains employed both qualitative and quantitative methods for data collection, following the global value-chain framework of analysis as a method of understanding the linkages between the firms along the soaps and detergents/hair preparations value chains. Secondary and primary data were collected using primary and secondary sources. A small scoping exercise of the various players in the value chain was undertaken in both countries. Specifically, data were collected from chemical input suppliers, soap and detergent manufacturers, retailers (both formal supermarkets and independent retailers), key stakeholders such as the relevant industry associations, government departments and development funding agencies.
These data were augmented with available secondary data. However, there are limitations with this data. In an ideal situation, industrial output and market share should be measured through regular censuses and surveys of firms. In terms of Zambia, these are quite infrequent and, as a result, this information is not available for all firms and the industrial output does not capture all the firms in the industry. Further, in some instances, firms would not disclose accurate or, indeed, any information at all when asked questions requiring responses based on financial records, which impacts on the quality of the data and depth of the analysis. In terms of the South African data, Statistics South Africa conducts a manufacturing survey every few years and reports some data at the level of cosmetics, soaps and detergents. We note that these surveys are conducted only every 3 years, therefore, the data is not available in time

C o m p e t i t i o n a n d R e g u l a t i o n f o R i n C l u s i v e g R o w t h
22
series format. Therefore, where possible, quantitative data were collected from secondary sources, namely government central statistical offices and international organisations such as the United Nations statistical databases (Comtrade, Trade Map, etc).
The soaps, detergents and cosmetics value chains were mapped using a deductive approach. This was done by grouping data for similarities and differences, and isolating the experiences of dominant players. The study sought to identify where the core competences of the domestic, regional and international firms lie by analysing the flow of inputs – goods and services – in the production chain to determine the factors that present constraints or opportunities in the value chains using descriptive analysis. The regional point of entry for the value chains, how producers access final markets and the critical success factors in the final markets were also analysed.
CAPITALISING ON REGIONAL DEMAND
Trade data show that Zambia’s exports of manufactured soaps and detergents, cleaning and polishing preparations, perfumes and toilet preparations has been growing over the past eight years (Figure 1.2) although the country still faces a trade deficit in these products. Exports averaged US $35.6 million over the period 2010 to 2017, while imports averaged US $53.6 million, giving rise to an average trade deficit of US $18 million over the same period. This trade deficit presents opportunities for import substitution in this industry and export diversification. In contrast, South Africa’s exports are 20 times the size of Zambia’s exports, averaging US $741.2 million over the period 2010 to 2017. The country enjoys a trade surplus in these products, which averaged US $196.6 million over the reference period. Notably, the country’s exports started to decline in 2014.
The leading sources of Zambia’s imports of soaps and detergents is South Africa, accounting for 88 per cent of all product lines (Table 1.1). On the other hand, the major export market for Zambia’s soaps and detergents is the Democratic Republic of Congo (DRC), accounting for 60 per cent of all product lines. Disaggregating the soaps, detergents and

23
t h e c o s m e t i c s , s o a p s a n d d e t e r g e n t s r e g i o n a L v a L u e c h a i n s
Figure 1.2: Trade in manufactured soaps and detergents and cosmetics, Zambia and South Africa, 2010–2017 (US $’000)
Source: Authors’ construction based on World Bank WITS data
cosmetics subsectors shows that Zimbabwe and Malawi are also major export destinations for Zambia. Similarly for cosmetic products, South Africa dominates the sources of Zambia’s imports, accounting for 51 per cent all product lines. Interestingly, South Africa was equally Zambia’s major export destination for essential oils, accounting for almost 100 per cent. The region remains the major market for Zambia. In particular, the DRC, Botswana and South Africa are major importers of cosmetic products from Zambia. Other notable and interesting market destinations not featured in the table include Germany and Australia, accounting for 3.5 per cent and 0.4 per cent respectively.
South Africa’s leading export destination of soaps and detergents in 2017 was Zimbabwe (US $66.7 million), Namibia (US $60.9 million) and Botswana (US $59.3 million), while for cosmetics it was Namibia (US $85.8 million), Botswana (US $56.2 million) and Zimbabwe (US $39.4 million) (Trade Map, 2015). Disaggregating the soaps, detergents and cosmetics subsectors shows that Botswana is leading the soaps (16 per cent); Mozambique, the cleaning products (18 per cent); and Zambia, the polishes and creams (Table 1.2).
C o m p e t i t i o n a n d R e g u l a t i o n f o R i n C l u s i v e g R o w t h
24
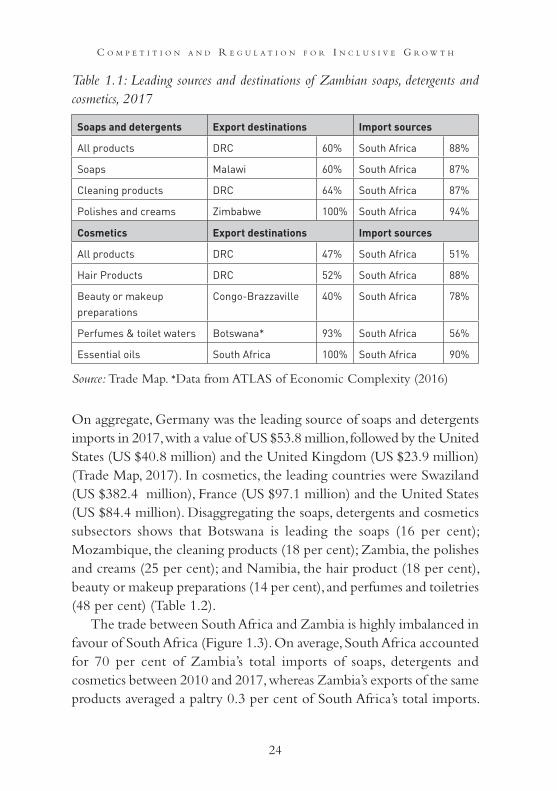
Table 1.1: Leading sources and destinations of Zambian soaps, detergents and cosmetics, 2017
Source: Trade Map. *Data from ATLAS of Economic Complexity (2016)
On aggregate, Germany was the leading source of soaps and detergents imports in 2017, with a value of US $53.8 million, followed by the United States (US $40.8 million) and the United Kingdom (US $23.9 million) (Trade Map, 2017). In cosmetics, the leading countries were Swaziland (US $382.4 million), France (US $97.1 million) and the United States (US $84.4 million). Disaggregating the soaps, detergents and cosmetics subsectors shows that Botswana is leading the soaps (16 per cent); Mozambique, the cleaning products (18 per cent); Zambia, the polishes and creams (25 per cent); and Namibia, the hair product (18 per cent), beauty or makeup preparations (14 per cent), and perfumes and toiletries (48 per cent) (Table 1.2).
The trade between South Africa and Zambia is highly imbalanced in favour of South Africa (Figure 1.3). On average, South Africa accounted for 70 per cent of Zambia’s total imports of soaps, detergents and cosmetics between 2010 and 2017, whereas Zambia’s exports of the same products averaged a paltry 0.3 per cent of South Africa’s total imports.
Soaps and detergents Export destinations Import sources
All products DRC 60% South Africa 88%
Soaps Malawi 60% South Africa 87%
Cleaning products DRC 64% South Africa 87%
Polishes and creams Zimbabwe 100% South Africa 94%
Cosmetics Export destinations Import sources
All products DRC 47% South Africa 51%
Hair Products DRC 52% South Africa 88%
Beauty or makeup preparations
Congo-Brazzaville 40% South Africa 78%
Perfumes & toilet waters Botswana* 93% South Africa 56%
Essential oils South Africa 100% South Africa 90%

25
t h e c o s m e t i c s , s o a p s a n d d e t e r g e n t s r e g i o n a L v a L u e c h a i n s
Suffice it to say, the polarity in trade simply underscores the differences in the size and maturity of the industries in the two countries.
Table 1.2: Leading sources and destinations of South African soaps, detergents and cosmetics, 2017
Source: Trade Map
Figure 1.3: Trade in manufactured soaps, detergents and cosmetics between Zambia and South Africa, 2010–2017 (US $’000)
Source: Authors’ construction based on World Bank WITS data
Soaps and detergents Export destinations Import sources
All products Zimbabwe 16% South Africa 19%
Soaps Botswana 16% South Africa 21%
Cleaning products Mozambique 18% South Africa 18%
Polishes and creams Zambia 28% South Africa 26%
Cosmetics Export destinations Import sources
All products Namibia 16% South Africa 37%
Hair Products Namibia 18% South Africa 21%
Beauty or makeup preparations
Namibia 14% South Africa 20%
Perfumes & toilet waters Namibia 48% South Africa 44%
Essential oils USA 34% South Africa 30%

C o m p e t i t i o n a n d R e g u l a t i o n f o R i n C l u s i v e g R o w t h
26
South Africa has stronger production and export capabilities, as evidenced by its deeper traction in southern Africa, compared to Zambia (Figure 1.4). For example, South Africa has been a significant source of southern Africa’s imports over the period under discussion, accounting for 36 per cent of SADC’s total imports, whereas Zambia accounted for a mere 2 per cent. This potentially leaves 62 per cent of imports of soaps, detergents, cleaning and polishing preparations, perfumes and toiletries by southern Africa from the rest of the world for possible substitution with imports from both Zambia and South Africa. To capitalise on this opportunity, however, there is a need for the transfer of skills and knowledge from South Africa to Zambia to grow the latter’s production capabilities to enable it to focus on products in which it can acquire a competitive edge.
Figure 1.4: Southern Africa’s imports of manufactured soaps, detergents and cosmetics, 2010–2017 (US $’000)
Source: Authors’ construction based on World Bank WITS data
The product categories with the greatest trade deficits are soap, organic surface-active agents (such as cleaning products) and perfumes (Table 1.3). These product categories have also exhibited the highest growth of imports. The corresponding cosmetic categories are perfumes, toiletries and beauty products (Table 1.3).

27
t h e c o s m e t i c s , s o a p s a n d d e t e r g e n t s r e g i o n a L v a L u e c h a i n s
Figure 1.5: SADC imports of soaps, detergents and cosmetics, 2010–2017 (US $’000)
Source: Trade Map
Table 1.3: SADC trade balance by selected product category, US $’millions
Source: Trade Map
SOAPS, DETERGENTS AND COSMETICS INDUSTRIES IN ZAMBIA AND SOUTH AFRICA
South Africa’s soaps, detergents and cosmetics industries are typically more developed than Zambia’s, and includes the manufacturing of soaps, synthetic organic detergents, inorganic alkaline detergents, and crude and refined glycerine from vegetable and animal fats. The main
Cosmetics (HS 33) 2015 2016 2017
Essential oils 33 42 61
Beauty or make-up preparations and skincare -58 -75 -96
Perfumes and toilet waters -92 -96 -101
Soaps, etc. HS 34 2015 2016 2017
Soap; organic surface-active products and preparations -105 -122 -149
Organic surface-active agents (excluding soap) -189 -141 -234

C o m p e t i t i o n a n d R e g u l a t i o n f o R i n C l u s i v e g R o w t h
28
product sold in South Africa is laundry care. The South African soaps and detergents subsector consists of approximately 250 companies, 49 of which are major players (FRIDGE, 2011; Who Owns Whom, 2016). There is also a big presence of contract manufacturers and a large number of small and medium producers. The soaps and detergents segment of the market is highly concentrated with an Herfindahl-Hirschman index (HHI) of 2919.4 The soaps and detergents industry (excluding cosmetics) is dominated by large international manufacturers, namely Unilever, Procter & Gamble, Johnson & Johnson and Colgate-Palmolive. Unilever continues to lead the South African detergents segment with a value market share of 51 per cent, followed by Colgate-Palmolive (Pty) Ltd, Procter & Gamble and Bliss Chemicals (Pty) Ltd, with shares of 13 per cent, 8 per cent and 7 per cent, respectively (Table 1.4).
Table 1.4: Laundry-care market shares in South Africa
Source: Euromonitor (2015)
An analysis of the performance of different Unilever brands suggests that the firm continues to benefit from the strength of its heritage brands, Omo, Skip and Sunlight. However, Procter & Gamble’s Ariel brand has made significant headway in terms of winning market share in the South African market, as has been the case in other African countries (for example Kenya). At the moment, Ariel is imported from France and even though Procter & Gamble had announced that it would build a plant in South Africa in 2013, construction of the site is yet to begin. The entry of Ariel into the market also started price wars between
Laundry Care 2015
Unilever South Africa (Pty) Ltd 50.6%
Colgate-Palmolive (Pty) Ltd 13%
Procter & Gamble Company 8%
Others 28.4%
Total 100%
29
t h e c o s m e t i c s , s o a p s a n d d e t e r g e n t s r e g i o n a L v a L u e c h a i n s
the main producers, which has been challenging for smaller firms due to the lack of economies of scale. The Competition Commission is currently investigating whether firms were pricing below cost during the price wars.
In Zambia, Trade Kings Limited is the industry leader in the manufacture of soaps and detergents and is fast becoming one of the major manufacturers, with its products being sold in nine of the countries in the region. The company’s growth has been fuelled by the success of Boom detergent paste, which has remained the company’s trade mark product since 1995. The firm’s growth has been tremendous – it grew tenfold between 1995 and 1996, from K200 000 to K2 million by the end of 1996. Production of Boom detergent paste increased by nearly 2 000 per cent from 100 tons per month in 1995 to 1 850 tons per month in 2013 (Trade Kings, 2015). Further, the firm has diversified its product line over the past 22 years into 320 products. These include various sizes of detergent powders, carbolic and medicated soaps, assorted household cleaning agents, fabric softeners, confectionery products and energy drinks, which are competing favourably against the renowned brands of Unilever, Colgate-Palmolive and Reckitt Benckiser.
Other notable local players in detergents include Epsilon Industries, which initially used to operate as a contract manufacturer for Colgate-Palmolive in Zambia. However, following Colgate-Palmolive’s decision to exit the manufacturing industry in Zambia, the company has continued to manufacture the same brand detergent paste – Dynamo – which competes directly with Trade Kings’ Boom detergent paste. The rest of the local market comprises smaller players that manufacture liquid detergents and dishwashing liquids, predominately for industrial use. These firms have focused mostly on this market, largely because it does not require huge investment in packaging and is thus less competitive. Zambia’s soaps and detergents industry is also highly saturated with popular international brands such as Omo, Sunlight, Protex, Lifebuoy, Dettol, Axion and Harpic, manufactured by Unilever, Colgate-Palmolive and Reckitt Benckiser. The two former multinationals previously operated manufacturing plants in Zambia. The liberalisation

C o m p e t i t i o n a n d R e g u l a t i o n f o R i n C l u s i v e g R o w t h
30
of Zambia’s economy in the early 1990s, however, opened the domestic manufacturing sector to competition from imports of cheaper, fast-moving consumer goods (FMCGs). As a result of the relatively higher cost of production in Zambia, many multinational companies, including Unilever and Colgate-Palmolive, relocated or closed their manufacturing plants in Zambia but retained distribution firms.
The cosmetics market in South Africa and Zambia
The cosmetics industry, which produces a wide range of skin, body and hair care products, is not as dominated by large companies as the soaps and detergents industry. Four multinationals together hold 28.8 per cent of the market, while the remainder is held by a range of other firms including domestic companies (Table 1.5).
Table 1.5: Retail market shares in South Africa
Source: Euromonitor (2015)
In South Africa, there are many firms in the cosmetics industry – the Cosmetics Toiletries and Fragrances Association of South Africa has a membership of 153. The multinationals either have production plants in the region or use third-party manufactures so they should be part and parcel of any strategy to develop the regional cosmetics industry, which is not concentrated (HHI=1031).
Although there are no available industry data in Zambia, there are a few consumer chemical firms which manufacture organic cosmetic
Cosmetics 2015
Unilever South Africa (Pty) Ltd 13.3%
Procter & Gamble Company 7.3%
Colgate-Palmolive (Pty) Ltd 5.9%
Johnson & Johnson (Pty) Ltd 2.3%
Others 71.2%
Total 100%

31
t h e c o s m e t i c s , s o a p s a n d d e t e r g e n t s r e g i o n a L v a L u e c h a i n s
products. These have generally performed well and have exhibited longevity. Vitafro and Vita Life are among the notable firms that have been manufacturing a wide range of domestic-use cosmetic products for over 20 years and have been successful in supplying the supermarket chains. They produce hair shampoos, conditioners and oils, body lotions, glycerine, aqueous creams and petroleum jelly. A few other firms manufacture a narrow range of products for both domestic and/or industrial use, however the industry is dominated by imported cosmetic products from Unilever, Colgate-Palmolive and Johnson & Johnson.
There has been a world-wide move within the cosmetic industry to use organic products, and Zambia and South Africa have not been exempt from this trend. There is an increasing market for cosmetics and skin-care products formulated from natural ingredients such as coconut, tea tree, rosemary, grapefruit and eucalyptus oils. What started as a niche market has now evolved into a mainstream trend as consumers become more concerned about the potential damaging effects of many synthetic substances and are demanding more environmentally friendly products. The growing interest in wellness products, traditionally sold through health-food stores, has spilled over into consumer preferences for natural personal care products (Center for Competitive Analysis, 2000).
According to TIPS (2008), most of the trade in essential oils occurs in the European Union (EU), the North American Free Trade Area (NAFTA), South America and East Asia, with little or insignificant trade happening in Africa and, in particular, the SADC region. While there has been an increase in the overall trade (imports and exports) in essential oils over the past two decades (from just over US $616 million in 1990 to more than US $3.6 billion in 2005), SADC’s trade has been insignificant, only about 1 per cent of the overall world trade. In contrast, the EU has been the largest trader in essential oils, importing US $536 million and exporting US $765 million in 2005 (when world imports amounted to US $1.7 billion, and exports stood at US $1.9 billion). Therefore, there are myriad opportunities for the SADC to increase its share in world trade. This line of products has already shown growth
C o m p e t i t i o n a n d R e g u l a t i o n f o R i n C l u s i v e g R o w t h
32
potential in Zambia, led by Umoyo, a wellness centre and retailer of locally manufactured and imported herbal and natural cosmetics. In Zambia, the rich availability of natural products from baobab, moringa, mongogo, marula trees and Ximenia caffra (large sourplum) trees, as well as Kalahari melon seeds and devil’s claw, which can be used in the manufacture of natural cosmetic products, provides readily available inputs for production.
MAPPING THE COSMETICS, SOAPS AND DETERGENTS VALUE CHAIN INDUSTRIES
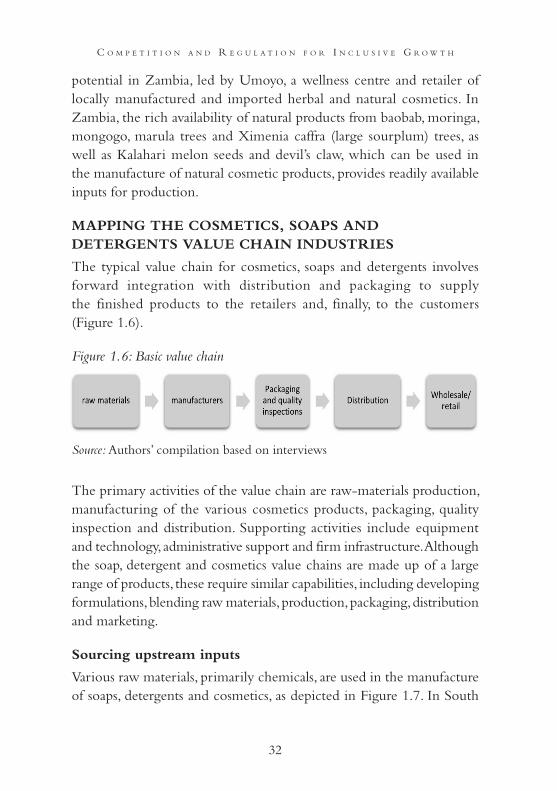
The typical value chain for cosmetics, soaps and detergents involves forward integration with distribution and packaging to supply the finished products to the retailers and, finally, to the customers (Figure 1.6).
Figure 1.6: Basic value chain
Source: Authors’ compilation based on interviews
The primary activities of the value chain are raw-materials production, manufacturing of the various cosmetics products, packaging, quality inspection and distribution. Supporting activities include equipment and technology, administrative support and firm infrastructure. Although the soap, detergent and cosmetics value chains are made up of a large range of products, these require similar capabilities, including developing formulations, blending raw materials, production, packaging, distribution and marketing.
Sourcing upstream inputs
Various raw materials, primarily chemicals, are used in the manufacture of soaps, detergents and cosmetics, as depicted in Figure 1.7. In South

33
t h e c o s m e t i c s , s o a p s a n d d e t e r g e n t s r e g i o n a L v a L u e c h a i n s
Africa, the basic chemicals sector is dominated by larger multinationals such as Sasol, AECI, Omnia and Dow Chemicals, which produce a variety of chemicals that feed into different sectors, including cosmetics, soaps and detergents. Other relatively smaller players include Akulu Marchon (Pty) Ltd, Bayer (Pty) Ltd, Clariant Southern Africa (Pty) Ltd, NCP Chlorchem (Pty) Ltd, Chemical Initiatives (Pty) Ltd and CJP Chemicals (Pty) Ltd.
However most of the firms interviewed indicated that ingredients are predominantly imported (at least 80 per cent), mainly from Germany, France, the United Kingdom and China. In soaps, for instance, some companies noted that only sodium silicate, caustic soda, petroleum jelly and sodium sulphate are available locally. Due to limitations in local production of raw ingredients, firms get exposed to exchange rate risk and high import duties. Nevertheless, South Africa has an abundance of natural ingredients, such as baobab and marula, which are used in cosmetics.
The breadth and complexity of the composition of the products vary according to the firm’s development and advancement, and inputs are sourced from various markets. In Zambia, the small firms interviewed (employing fewer than 50 employees) indicated that inputs used in the manufacture of soaps, detergents and cosmetic products are predominantly imported either through local agents (about 80 per cent) or international agents (about 20 per cent). Imported raw materials include fragrances (mainly from Switzerland), sulphuric acid, wax, colourants, sulphonic acid, hydrochloric acid, sodium lauryl ether sulphate (SLES), NP9 and caustic soda, among others. The main source countries for these raw materials include Switzerland, India, the United Kingdom and South Africa.
These small firms largely rely on agents to import inputs directly from suppliers. Firms that had previously imported directly from suppliers indicated that import taxes levied on inputs, as well as meeting the minimum import quota demanded by suppliers, were challenges. According to the Zambian Customs and Excise Tariff Guide, imports of chemicals such as sulphonic acid, hydrochloric acid, sulphates and other similar chemicals do not attract customs duty when imported in bulk,

C o m p e t i t i o n a n d R e g u l a t i o n f o R i n C l u s i v e g R o w t h
34
ie, more than 5 kilograms or 5 litres, although a standard rated value added tax is applied. The role of agents in the value chain is, therefore, quite significant for small players. These agents are able to import large quantities of various inputs duty free (due to economies of scale), which are then sold in smaller quantities to the various manufacturers. This spreads the input costs and allows firms to circumvent the direct costs associated with imports, as well as having to meet the minimum import quota demanded by suppliers. In addition, local chemical suppliers offer inputs to manufacturers on a credit basis (usually 30 days). This confers benefits such as continuity in production and offers a cash-flow buffer for periods between production and receipt of payment for sales.
Figure 1.7: Cosmetics and soaps value chain
Source: http://ukchemistrygrowth.com/Portals/3/Downloads/Importance%20of%20Chemicals.pdf

35
t h e c o s m e t i c s , s o a p s a n d d e t e r g e n t s r e g i o n a L v a L u e c h a i n s
Industry leaders exhibit similar behaviour. Trade Kings, the dominant player in Zambia’s soaps and detergents industry, similarly procures some of its inputs locally. Its scale, however, allows the company to source some chemicals directly, mainly from China, South Africa and South Korea. Because inputs are imported, all the firms in the industry are facing high input costs because of the depreciation of the kwacha, which has increased the cost of production.
Factors affecting firm competitiveness
Economies of scale
Despite the dominance of a few multinationals, the South African and Zambian soaps, detergents and cosmetics sectors include a number of small firms. However, most of these produce low volumes due to various factors such as limited production capabilities and a lack of access to markets. In Zambia, these small companies tend to have only one production plant, which often operates below its full production capacity. The reported capacity utilisation ranges between 30 per cent and 80 per cent for their main product lines but, in some instances, is lower than 30 per cent for other product lines. This indicates that production is less than optimal. Many firms struggle to expand their production because of a lack of finance for investment in new machinery and equipment, while concurrently facing challenges accessing markets through retailers. Even the companies that have sufficient machinery and equipment fail to maximise their capacity due to limited access to markets, among other issues. Almost all the small firms interviewed in South Africa and Zambia produce below their maximum capacity. This failure to meet sufficient production volumes deprives them of the benefits of economies of scale and renders them uncompetitive compared to the big multinationals.
Packaging
Packaging plays two important roles. Firstly, it ensures that products are secure, that they reach the consumer without any damage and increases

C o m p e t i t i o n a n d R e g u l a t i o n f o R i n C l u s i v e g R o w t h
36
the serviceable life of the products. Secondly, packaging plays a huge role in brand identification and appeal, and conveys useful information to the consumer, such as the ingredients in the product, directions for use, and manufacture and expiry dates. The size, quality and texture of the packaging, and its visual impact, all have a direct influence on the demand for a product and its competitiveness (Gopal and George, 2014). To stay competitive in the FMCG industry, it is imperative that firms invest in good quality, innovative packaging.
In both Zambia and South Africa, packaging companies often impose minimum quantity requirements on orders for their products, often as high as 5 000 units. Furthermore, retailers often stipulate their own packaging requirements to manufacturers before stocking their products. However, smaller firms lack the scale to invest in unique packaging designs and, as a result, use generic packaging, which is not very appealing. This is because moulds are expensive – the costs can be as high as R2 million to R10 million. So once a design has been agreed on and a mould purchased, it becomes difficult to change the design. Big multinational companies have sufficient scale to justify investments in these moulds so are able to access specialised packaging, which gives them a competitive edge.
Good packaging is one of the key criteria for supplying supermarkets. This is why many small manufacturers focus on industrial-use cleaning detergents, a market segment in which they can compete favourably owing to the low packaging demands. Nonetheless, technological innovations, such the 3D printing used for prototyping, have the potential to boost the competitiveness of smaller companies. These relatively cheaper innovations (cost as little as R15 000) can enable smaller firms to test different designs before settling on one.
Standards and regulations
In South Africa, the general self-regulatory nature of the industry makes it vulnerable to low quality products, as well as illegal imports. Notwithstanding this, companies are still required to comply with certain standards such as Good Manufacturing Practice (GMP), which they find expensive. On the other hand, firms that want to export to the European

37
t h e c o s m e t i c s , s o a p s a n d d e t e r g e n t s r e g i o n a L v a L u e c h a i n s
Union, need to acquire EU certification, which is also expensive, despite the fact that firms can claim up to 50 per cent of costs incurred in getting EU certification from the dti.
The challenges that firms face include import duties on raw materials, ad valorem tax on finished goods, product testing and biodiversity permits. Many firms are of the view that import duties on raw materials are too high and that an ad valorem tax of 5 per cent to 7 per cent is too much. However, the dti has submitted that the ad valorem tax is applied only to selected luxury products such as perfumes and toilet waters, skincare, lip and eye make-up preparations, manicures and pedicures, and skin-care powders. Despite the common practice to impose tax on luxury products, this may be costly for small manufacturers.
On the other hand, firms using natural ingredients from indigenous plants, such as baobab and marula products, need a biodiversity permit to be able to export their products. The application process for the permit is very cumbersome – the application form is long and complex, and the permit takes a long time. Retailers require products they stock to be tested, however SABS is currently unable to offer testing services. Moreover, private testing is expensive (costs as much as R40 000).
In Zambia, the acquisition of product accreditation presents additional costs for firms. For instance, to acquire a permit to supply for the first time, a company has to be inspected four times within one year, with a fifth inspection made the following year to renew the accreditation (Ziba and Phiri, 2017). For a firm to acquire certification, the Zambia Bureau of Standards (ZABS) has to carry out two intensive inspections. According to ZABS, the cost of acquiring certification is estimated to average between K20 000 and K25 000 and is premised on the turnover of the firm. Nonetheless, the majority of firms interviewed in the study possess certification for their products.
Furthermore, there appears to be a mismatch between Zambian standards and those imposed in export markets. Previous efforts to adopt various international standards and harmonise standards with COMESA (Common Market for Eastern and Southern Africa) and SADC countries have excluded standards for soaps, detergents and cosmetic

C o m p e t i t i o n a n d R e g u l a t i o n f o R i n C l u s i v e g R o w t h
38
products. Furthermore, while ZABS has international accreditation for its laboratory testing services, and Zambian standards are based mostly on international standards, ZABS is yet to be accredited to an international body for its inspections. This presents challenges of recognition of the Zambian standards in export markets and is, therefore, a barrier to exporting. In addition, this compels firms to seek accreditation by other internationally recognised standard organisations. To counter some of these challenges, ZABS has entered into a few bilateral arrangements with two countries regarding standards and the export of selected products. Particularly, ZABS has a memorandum of understanding (MoU) with Botswana on the export of groundnuts and an MoU with Namibia for various products.
Growth constraints
The cosmetics, soaps and detergents value chains face a number of constraints which limit growth. The constraints faced by both South Africa and Zambia are discussed briefly in the following sections.
Barriers to accessing supermarkets and export markets
Retail plays a huge role in the trading of soaps, detergents and cosmetic products by providing key routes to markets by linking producers and consumers, and providing an export gateway for domestic suppliers. However, firms face challenges in accessing these markets owing to the shortage of shelf space, which leads to stringent listing requirements imposed by supermarkets. These include barcoding, labelling and packaging requirements, merchandising, advertising, rebates and nationwide distribution. Small firms face challenges meeting all these requirements. Limited access to retail space also impacts negatively on exports. That is, firms that could penetrate export markets through retailers are otherwise constrained. However, export capabilities are also affected by other factors such as a lack of harmonisation of standards and certification inefficiencies. For instance, the lack of recognition of the ZABS certification is a challenge in Zambian firms that want to access export markets.

39
t h e c o s m e t i c s , s o a p s a n d d e t e r g e n t s r e g i o n a L v a L u e c h a i n s
Raw materials
A significant proportion (at least 80 per cent) of raw materials consumed by both Zambian and South African industries is imported. In South Africa, for instance, a few raw materials such as petroleum jelly and other waxes are available locally through Sasol, however firms complain that their quality is not stable. One firm noted that H&R South Africa (Pty) Ltd provides better quality petroleum jelly. In the washing powder market, some firms noted that only sodium silicate, caustic soda, petroleum jelly and sodium sulphate are available locally.
Reliance on imported raw materials exposes manufacturers to foreign exchange risk and import duties. For instance, in 2015 and 2016, the Zambian kwacha depreciated by more than 50 per cent against major currencies, effectively increasing the cost of inputs. Local firms are also purported to face high compliance fees related to inspections of inputs. Furthermore, fragmentation in payment of these fees results in the duplication of fees paid to authorities. Additionally, the cost of clearing inputs at the border is considered to be high, and the purported inefficiencies of ZABS results in delays in clearing inputs.
Access to finance
It is expensive for small entrants to manufacture their own products due to the high costs of purchasing equipment, compliance costs, setting up factories and meeting working capital requirements, among other costs. This is particularly the case for small entrants that need to meet certain minimum scale requirements for them to compete effectively with the big incumbents. Normally, funders require bankable business plans, which small firms struggle to provide. Moreover, Zambian firms cite the cost of finance as the main hindrance. For instance, interest rates on loans by Zambian commercial banks averaged 28 per cent during February 2017. Further, in most cases small firms do not have collateral and cannot measure the potential of growth of their products to get funding. The dti in South Africa provides funding to small firms through its incentives programmes, however the funds are limited and cannot service the majority of small firms.

C o m p e t i t i o n a n d R e g u l a t i o n f o R i n C l u s i v e g R o w t h
40
Despite significant commonalities indicated by the challenges discussed above, the relative size and maturity of the soap, detergent and cosmetic industries are very different in Zambia and South Africa owing to the sophistication and development of the South African industries. As a result there are certain country-specific challenges that need to be highlighted.
South Africa
Skills shortage
In South Africa, in general, there is a shortage of the necessary skills required to boost the competitiveness of the industry. For instance, the number of critical skills, such as chemists and technical assistants, are limited in the cosmetics industry. Those that are available are employed mainly by bigger companies that can offer attractive remuneration packages. Furthermore, the shortage of engineering skills, in other sectors that feed directly into the soaps and cosmetics industry, such as packaging, also has an impact. For instance, the production of moulds for the packaging industry requires critical engineering skills, which South Africa is short of. Nonetheless, there are some measures being put in place to address the issue of skills shortage. The dti is working towards developing a safety assessment Master’s programme aimed at increasing the number of toxicologists in South Africa. The Society of Cosmetic Chemists of South Africa (COSCHEM) already offers a Diploma in Cosmetic Science, which the industry regards as an advantage. Further, these programmes offer opportunities for skills and knowledge transfer between South Africa and Zambia.
Dependence of contract manufacturers on the performance of clients
On the one hand, the competitiveness of contract manufactures is dependent on the performance of their clients. For instance, large clients may produce in-house if the industry is not performing well, which negatively impacts the competitiveness of contract manufacturers. However, ie limited to clients that have manufacturing facilities. On the
41
t h e c o s m e t i c s , s o a p s a n d d e t e r g e n t s r e g i o n a L v a L u e c h a i n s
other hand, some firms use contract manufacturers as an entry strategy, ie, they first test the market before investing in production facilities. If clients decide to invest in production facilities at a later stage, this obviously impacts negatively on the contract manufacturers.
Moreover, multinationals have global raw materials agreements with certain suppliers that have an impact on the competitiveness of contract manufacturers. That is, if a particular local firm is the product manufacturer of a certain multinational, it is obliged to procure raw materials from that multinational’s global supplier, even if it is not cost effective to do so. In the case of the global supplier being located abroad, the contract manufacturer will be compelled to import unnecessarily, irrespective of the availability of raw materials locally.
Zambia
Competition from imports
Globalisation – while conferring benefits on consumers such as increased product availability, choice and competitive prices – is a game of winners and losers in which the firms with better access to factors of production triumph. Zambian industries are highly affected by competition from imports. That is, local firms face competition from imports of cheaper products from the East, owing to economies of scale that have been acquired by firms in these countries. South Africa similarly presents competition to Zambian firms because of the country’s relatively more sophisticated and developed industry. For example, the products of Unilever, Johnsons & Johnsons and Reckitt Benckiser, which possess strong brand awareness, are the major competing brands in the soaps, detergents and cosmetics industry.
Other constraints
Other challenges cited are not uniform across the board and were reported by a micro firm. These include challenges in accessing land and the high cost of electricity. The latter constraint is shared by Trade Kings, the industry leader in soaps and detergents. The new taxation system

C o m p e t i t i o n a n d R e g u l a t i o n f o R i n C l u s i v e g R o w t h
42
introduced in 2017, which imposes a fixed rate of 3 per cent levied on firms’ turnover in addition to a specified constant amount, also presents challenges for firms, particularly for micro and small firms. This specific tax means that firms whose business is cyclical are paying tax even in months in which they may not have recorded any sales.
Growth opportunities
Natural and ethnic products
There is an growing market for cosmetics and skincare products incorporating natural organic ingredients, such as coconut oil, tea tree oil, rosemary oil, grapefruit and eucalyptus, that are entirely free from synthetic ingredients. What started as a niche market has evolved into a mainstream trend as more consumers become aware of the potential damaging effects or the environmental impacts of many artificial substances used in cosmetics. The growing interest in wellness products, traditionally sold through health-food stores, has spilled over into mainstream consumer preferences for herbal personal care products (Center for Competitive Analysis, 2000).
This line of products has been growing in Zambia led by Umoyo, a wellness centre and retailer of locally manufactured and imported herbal cosmetics. The abundance of natural ingredients from local indigenous plants, such as baobab, moringa, mongogo and marula trees, as well as Kalahari melon and devil’s claw provides readily available inputs for production. South Africa also has a large number of similar indigenous plants, as well as Kigelia africana, Trichelia emetica and rooibos, that can be used in the manufacture of natural cosmetic products.
However, South African firms using natural ingredients from indigenous plants, such as baobab and marula, need a biodiversity permit to export their products. The permit application process is very cumbersome and the permit takes a long to process. Currently there is also a problem regarding the ownership of these natural resources. However, the dti is already working with the Industrial Development Corporation (IDC) to develop the natural products value chain in

43
t h e c o s m e t i c s , s o a p s a n d d e t e r g e n t s r e g i o n a L v a L u e c h a i n s
general. Moreover, baobab growers, the Cosmetic, Toiletry and Fragrance Association of South Africa (CTFA), formulators and manufacturers in South Africa are already setting up a forum to implement an online integrated system for biodiversity permit applications.
Contract manufacturing
Contract manufacturing is the term used when companies outsource some of their manufacturing activities to other firms, or when firms that lack manufacturing capabilities contract particular manufacturers to produce products on their behalf. This practice has boosted the growth and competitiveness of the soaps, detergents and cosmetics sectors, particularly in South Africa. The difficulties associated with accessing retailers tend to limit the growth and competitiveness of smaller firms. However, contract manufacturing has enabled many small players to access these markets indirectly. That is, some of the big multinationals that already have access to retailers tend to subcontract smaller firms to manufacture on their behalf. This eliminates the need for contract manufacturers to develop their own brands, which would otherwise have to compete with the established brands of the multinationals.
Getting the goods to markets
The question of access to markets has been cited as a barrier to entry and/or expansion by the manufacturers of cosmetics, soaps and detergents.5
Retailers and supermarkets in particular, are becoming an increasing important route to market for many consumer goods in southern Africa, providing an opportunity for suppliers to participate in lucrative retail value chains (Boselie, Henson and Weatherspoon, 2003).
Riding the supermarket wave
Southern African countries, including Zambia, have experienced exponential growth in the number and spread of supermarkets over the past two decades. This has been driven largely by South African supermarket chains. Ziba and Phiri (2017) attribute the wave of retail modernisation in Zambia to a number of factors, namely increased

C o m p e t i t i o n a n d R e g u l a t i o n f o R i n C l u s i v e g R o w t h
44
urbanisation, economic growth, the emergence of a middle class and changes in food consumption patterns as a result of globalisation, food marketing and advertisements.
Supermarkets play a critical role in the soaps, detergents and cosmetics value chain by addressing the issue of scale and stimulating increased and upgraded industrial production. The strategic location of super-markets in prime shopping malls across towns and cities provide firms with access to larger and broader markets, thus increasing the demand for their goods. As local firms expand their output to meet the higher demand for manufactured goods, this leads to economies of scale. In addition, a company’s integration into the supermarket value chains has the potential to compel it to improve its production capabilities by acquiring and enhancing its technology and production techniques in a bid to meet the higher quality demands and private standards of supermarkets (Ziba and Phiri, 2017). In the long run, this could trigger employment creation, and increase efficiency and industrialisation in Zambia. Further, the multinational nature of supermarket chains in the region exposes firms to a much larger regional market for FMCGs.
Zambia
The scoping survey revealed that only a few firms use supermarkets as their main route to market. The firms that had integrated successfully into the supermarket value chains reported no challenges with regard to supplying supermarkets. However, those firms that were not supplying supermarkets, reported obstacles such as the high packaging demands and their inability to meet the volumes demanded by supermarkets as a result of their limited production capabilities.
Interviews with two dominant South African supermarkets operating in Zambia revealed that soaps, detergents and cosmetics are generally imported because of the limited production capacity in Zambia. For example, it is reported that for Game Stores only 40 per cent of soaps, 40 per cent of detergents and 5 per cent of cosmetics are sourced locally. In comparison, the proportion of locally sourced cosmetic products is

45
t h e c o s m e t i c s , s o a p s a n d d e t e r g e n t s r e g i o n a L v a L u e c h a i n s
very low due to the lack of brand awareness, which is critical to the successful sale of cosmetics.
While a few local firms have successfully integrated into supermarket value chains, most are still excluded. Supermarkets reportedly face a number of challenges with local suppliers – they often fail to meet the volumes demanded by supermarkets and are not consistent with supply, largely as a result of their limited production capacity and the lack of logistical support. Good quality packaging is also an issue, which renders most local products unattractive. Related to this is the inability of some firms to meet ZABS standards. Local products are also reportedly relatively more expensive than imports, which renders them uncompetitive.
For firms to successfully integrate into supermarket value chains, they need to meet the supermarkets’ procurement criteria. Supermarkets’ criteria for the procurement of soaps, detergents and cosmetics include the cost and quality of the products, brand awareness and the capacity of the local firm to consistently supply the volumes ordered. The ability of the supplier to offer rebates on their products is also critical for some supermarkets. They also expect firms to include barcodes and key product information, such as the manufacturing and expiry dates, on their packaging and to meet the distribution costs associated with supplying the stores. Another criterion, although not binding, is having merchandisers.
Firms also face strategic barriers to entry, which could include the supermarkets’ procurement strategies such as the level at which decisions are made regarding suppliers. For most foreign supermarkets, the selection of suppliers is often at the discretion of the head office. The increasingly higher standards demanded by private companies, in addition to mandatory legal standards, are often barriers to entry owing to the associated costs. These could include barcoding, labelling and packaging requirements, merchandising, advertising, rebates and nationwide distribution, all of which have cost implications for local firms trying to enter and compete with incumbent or global suppliers. The payment period for goods, which averages between 30 and 60 days,

C o m p e t i t i o n a n d R e g u l a t i o n f o R i n C l u s i v e g R o w t h
46
is also a constraint due to the cash flow challenges for small, financially constrained businesses.
An interesting development is the increasing vertical integration of supermarkets. They are increasingly extending their operations to include the manufacture and packaging of house brands of products such as cleaning agents, toilet paper, toothpastes and other household products, including food. These products are predominately manufactured in South Africa owing to the relatively lower cost of production and existing production capabilities. This suggests opportunities in Zambia for the local manufacturing of in-house supermarkets brands through contract manufacturers, which remains relatively unexploited.
South Africa
Retail chains, including supermarkets, possess considerable buyer power in South Africa, even though there are alternative routes to market for cosmetics (see Table 1.5). In addition to this, in the cosmetics sector, branding is a major factor that contributes to the market power of a handful of large, powerful incumbent suppliers (eg, Nivea, Johnson & Johnson, Procter & Gamble, etc). Therefore, new suppliers in the cosmetics sector are faced with difficulties arising from buyer power from a vertical perspective and market power from a horizontal perspective.
New entrants struggle to enter and maintain a consistent foothold on supermarket shelves as their products typically do not sell as fast as the well-known brands. Retailers want products off the shelf as fast as possible and push suppliers to invest in merchandising. Fast-selling products, in turn, require a high marketing and advertising spend, as well as extensive brand, sales and merchandising support, which smaller players often struggle to meet. Small players find it difficult to fund merchandisers at every store to ensure that their products are well placed on shelves. This is exacerbated by the large multinationals, who are typically category managers or control how the shelf is displayed. This also makes it difficult for new, lesser known players to compete. Aesthetic packaging and labelling is also very important to drive sales,

47
t h e c o s m e t i c s , s o a p s a n d d e t e r g e n t s r e g i o n a L v a L u e c h a i n s
which is expensive for small players and new entrants. Suppliers to supermarkets like those in the SPAR Group, which
operates under a franchise model, have more opportunity to access shelf space given that individual franchise owners have the discretion to source from smaller or regionally based suppliers. Despite this, SPAR notes that small players, including those supplying private labels, often fail. Further, to participate successfully, suppliers are often forced to supply a wide range of products as retailers are reluctant to deal with a supplier that sells only one range. There have been some successes, however, in certain products for SPAR in-house brands and for certain small suppliers where branding has not yet become important. These include glycerine and aqueous creams, but new players in soaps and shampoos have been less successful, highlighting the barrier created by branding.
In South Africa, another cost that suppliers typically incur (for all products and not just cosmetics) is listing fees. From the supermarkets’ perspective, charging listing fees is standard practice, especially in the cosmetics, health and beauty sector, given the constant launching of new products. Reconfigurations of shelf space and product ranges are allegedly difficult, and this forms part of the motivation to charge listing fees. However, it appears that supermarkets make higher margins on cosmetics category relative to other products, with SPAR estimating that it makes at least 20 per cent on sales of cosmetics. Some suppliers also highlighted other difficulties in listing new products with retailers, particularly if they were small companies with new products competing with the products of large multinationals.
Suppliers further noted other trading terms that make it difficult to deal with large retailers, stating that trading terms are often skewed in favour of the retailers. These include rebates payable on the list price (which for one supplier was 13.5 per cent for Clicks and 17.5 per cent for Pick n Pay), marketing fees in certain cases (for instance, one supplier used to pay a 3 per cent marketing fee at Pick n Pay, while another had to commit to a marketing budget and advertise in Clicks’ brochures in an effort to increase market share) and transport costs to deliver to individual stores or distribution centres. In certain instances, suppliers

C o m p e t i t i o n a n d R e g u l a t i o n f o R i n C l u s i v e g R o w t h
48
are also required to participate and contribute to the costs of advertising and promotional activities of the retailer. Another concern, especially for smaller players, is the long payment periods (30–60 days). This creates cash-flow crunches for smaller suppliers who, in turn, have to pay their suppliers.
Table 1.6: Routes to market for soaps and detergents, % value in 2015
Source: Euromonitor
In Zambia, the main channel for distribution of cosmetics, soaps and detergents is, to some degree, determined by whether or not firms supply supermarkets and whether the products are for domestic or
Bleach Dishwashing Laundry care
Surface care
Grocery retailers 98.5 99.3 96 98.3
Convenience stores 1.2 0.8 0.9 1.1
Discounters 0.9 1.0 1.0 1.0
Forecourt retailers 0.2 0.3 0.5 0.3
Hypermarkets 9.4 9.3 8.8 9.0
Supermarkets 74.8 73.9 70.9 71.8
Independent small grocers 12.0 14.0 14.0 15.1
Non-grocery specialists 0.5 0 0 0
Health and beauty specialist retailers
0.5 0 0 0
Department stores 1.0 0.6 0.6 0.3
Mass merchandisers 0 0.1 0.3 0.2
Warehouse clubs 0 0 0.2 0
Non-store retailing 0 0 3.0 1.3
Home shopping 0 0 2.3 0
Internet retailing 0 0 0 0.1
Direct selling 0 0 0.7 1.2

49
t h e c o s m e t i c s , s o a p s a n d d e t e r g e n t s r e g i o n a L v a L u e c h a i n s
industrial use. For those supplying supermarkets, 50 per cent of their output is channelled through the supermarkets. Wholesalers play an important role, distributing 20 per cent of retail sales and other retailers, including independent stores, constitute 30 per cent of retail sales. For cosmetics companies that do not supply supermarkets, 90 per cent of their output is channelled through wholesale stores, while the remainder is distributed through hair salons. The main market for industrial-use detergents and cleaning agents includes hospitals, schools, parastatals, independent companies and informal traders. Here again supermarkets are an important route to market, although less than 50 per cent of total sales are distributed via this channel. The implication is that firms can target alternative markets – however, we note that for the detergents market, where economies of scale are important for cost competitiveness, firms may have to distribute using all channels, including supermarkets (Bosiu et al, 2016).
Tapping into alternative routes to markets
There are other alternative markets open to small manufacturers, which have less onerous requirements than those associated with accessing supermarkets and export markets. These include salons and spas, direct marketing, hotels and cleaning services.
Salons and spas
In South Africa and Zambia, 2 per cent and 10 per cent of cosmetics sales are distributed through salons and spas, respectively. Selling products to salons vis-à-vis supermarkets is advantageous in that there are lower advertising costs, lower volume requirements and flexible packaging guidelines. Furthermore, selling products to salons located in high-end markets tend to yield higher profit margins because these markets normally sell professional brands, which are generally regarded to be of a high quality. Successful professional brands sold exclusively to spas and salons include the Ladine hair-care range in South Africa and the Elite conditioner in Zambia.

C o m p e t i t i o n a n d R e g u l a t i o n f o R i n C l u s i v e g R o w t h
50
Direct marketing
Direct marketing refers to the direct communication of a marketing message to a prospective consumer by the seller of a product or their agent without the use of indirect media or the involvement of a middleperson (Mullin, 2002). It involves lower start-up and overheads costs compared to mass media advertising campaigns. Direct marketing agents buy products in bulk at a discount from the supplier, and the discount becomes the agent’s retail profit. For example, in South Africa, a company called Ruutos sells its products to agents at a 25 per cent discount – hence this 25 per cent is the agents’ retail profit. However, products sold through the direct marketing channel cannot be sold in supermarkets, as the supermarkets would compete with the direct agents.
Hotels, lodges and supermarket in-house brands
Hotels, lodges and bed and breakfasts are particularly important for contract manufacturers producing cosmetics, soaps and detergents. Similar to salons and spas, hotels have flexible packaging requirements and lower marketing costs. In Zambia, international hotels such as the Protea, Intercontinental, Taj Pamodzi and Southern Sun use branded toiletries manufactured in other countries. These can be substituted with locally manufactured toiletries by contract manufacturers. In addition, there are contract manufacturing opportunities to be gained from the growth of supermarket in-house brands of soaps and detergents, which could be outsourced to Zambian firms.
Cleaning services
The cleaning services market generally has lower barriers to entry due to flexible packaging requirements. For instance, 100 litres of liquid soap packaged in 20-litre containers may be ordered instead of the 750 ml bottles required by supermarkets. Marketing costs, start-up costs and volume requirements are generally lower. Zambian firms manufacturing industrial-use liquid detergents and other cleaning agents already cite this as one of their main routes to markets owing to the lower demand for quality packaging.

51
t h e c o s m e t i c s , s o a p s a n d d e t e r g e n t s r e g i o n a L v a L u e c h a i n s
CONCLUSION AND POLICY RECOMMENDATIONS
On the one hand, the size and maturity of the soaps, detergents and cosmetics industry in Zambia and South Africa are very different, South Africa having the more sophisticated and developed industry. The South African market is dominated by a few large multinationals and many smaller firms that have generally managed to penetrate the regional markets. Zambia, on the other hand, has one dominant firm in the soaps and detergents industry that has successfully penetrated regional markets.
The penetration of regional markets by some South African and Zambian firms, coupled with the trade deficit in the southern African region, present opportunities for harnessing regional industrialisation and improving intra-regional trade. Moreover, the abundance of natural ingredients in these countries, the relatively established contract manufacturing in South Africa and the tremendous growth of Trade Kings in Zambia indicate potential for increased growth of these sectors.
Notwithstanding these opportunities, the South African and Zambian industries face several challenges. Major cross-cutting challenges include high input costs owing to the high cost of raw and packaging materials; barriers to accessing supermarkets; a lack of production scale; limited access to finance, particularly for advertising; skills shortages; exchange rate movements, and unfavourable regulations and standards.
Certain inherent factors mentioned earlier present strengths that can be leveraged in the soaps, detergents and cosmetics industry in South Africa and Zambia. However, the external threats and weaknesses inherent in the industry will need to be addressed if both Zambia and South Africa are to harness the opportunities for increased growth of the industry and create sustainable inclusive economic growth. These strengths and weaknessess are summarised in Table 1.7 and Table 1.8.

C o m p e t i t i o n a n d R e g u l a t i o n f o R i n C l u s i v e g R o w t h
52
Table 1.7: Swot analysis: Zambia
Cross-cutting recommendations
• Facilitate domestic and regional market access for goods. Particularly, engage supermarkets to provide preferential market access to natural products and open up shelf space to regionally produced products/offtake commitments. Additionally, develop a regional procurement strategy for supermarkets that facilitates the entry of local products into other subsidiary supermarkets in the region.
• Establish industrial clusters that aggregate small-scale firms to meet production scale, and allow for sharing of common costs such as packaging input costs (eg, moulds) and distribution costs.
• Develop a chemical innovation centre with 3D printing and testing facilities for new products that can be shared by two or more countries in the region.
Strengths Weaknesses
• Availability of natural ingredients used in cosmetics, eg, moringa, mongogo, crocodiles,6 marula trees and Kalahari melon
• Government support for the manufacturing industry (fiscal and non-fiscal incentives)
• Low barriers to entry
• Poor local packaging capabilities
• High cost of finance
• Lack of economies of scale
• Lack of investment in brand awareness
• Lack of information about export markets
Opportunities Threats
• Manufacture of organic products
• Contract manufacture of cosmetic products for the tourism industry (hotels, lodges, B&Bs, etc) and supermarkets
• Regional demand and proximity to relatively untapped markets – DRC
• Currency volatility and depreciation
• Competition from imports (eg, from the East and South Africa)
• Barriers to accessing supermarkets and export markets
• Lack of recognition of the ZAB standards in export markets
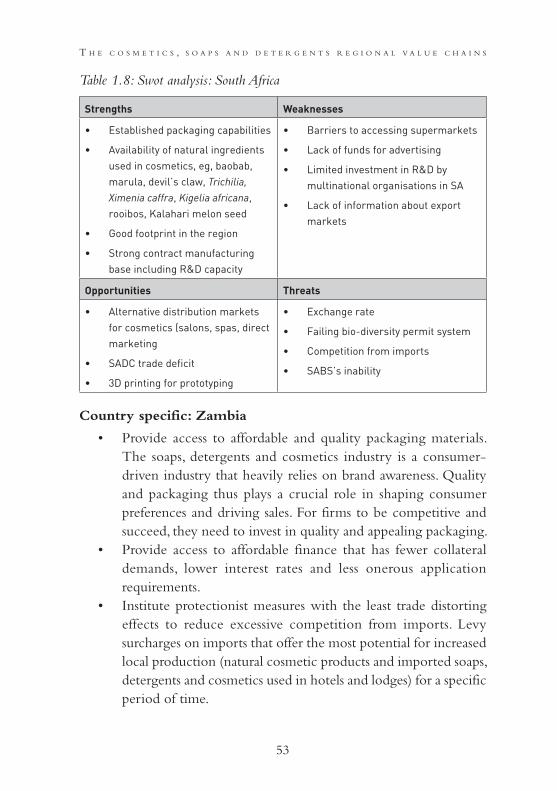
53
t h e c o s m e t i c s , s o a p s a n d d e t e r g e n t s r e g i o n a L v a L u e c h a i n s
Table 1.8: Swot analysis: South Africa
Country specific: Zambia
• Provide access to affordable and quality packaging materials. The soaps, detergents and cosmetics industry is a consumer-driven industry that heavily relies on brand awareness. Quality and packaging thus plays a crucial role in shaping consumer preferences and driving sales. For firms to be competitive and succeed, they need to invest in quality and appealing packaging.
• Provide access to affordable finance that has fewer collateral demands, lower interest rates and less onerous application requirements.
• Institute protectionist measures with the least trade distorting effects to reduce excessive competition from imports. Levy surcharges on imports that offer the most potential for increased local production (natural cosmetic products and imported soaps, detergents and cosmetics used in hotels and lodges) for a specific period of time.
Strengths Weaknesses
• Established packaging capabilities
• Availability of natural ingredients used in cosmetics, eg, baobab, marula, devil’s claw, Trichilia, Ximenia caffra, Kigelia africana, rooibos, Kalahari melon seed
• Good footprint in the region
• Strong contract manufacturing base including R&D capacity
• Barriers to accessing supermarkets
• Lack of funds for advertising
• Limited investment in R&D by multinational organisations in SA
• Lack of information about export markets
Opportunities Threats
• Alternative distribution markets for cosmetics (salons, spas, direct marketing
• SADC trade deficit
• 3D printing for prototyping
• Exchange rate
• Failing bio-diversity permit system
• Competition from imports
• SABS’s inability

C o m p e t i t i o n a n d R e g u l a t i o n f o R i n C l u s i v e g R o w t h
54
Country specific: South Africa
• Leverage the Industrial Development Corporation (IDC) shareholding of Le-Sel Research (Pty) Ltd to support entrants. Le-Sel Research is a contract manufacturer that is 70 per cent owned by the IDC. Its services include research and development, compiling product dossiers, packaging design and developing formulations. Government could subsidise access to these services to support entrants.
• Provide more funding for export missions to assist firms to penetrate regional markets.
• Engage input suppliers such as Sasol to provide competitively priced inputs and purify petroleum jelly for domestic industry. There is an industry-wide outcry about the uncompetitive pricing of input materials supplied by Sasol and the unstable quality of its petroleum jelly.
NOTES
1 This chapter draws key insights from an in-depth study undertaken as part of a series of research studies under the African Industrial Development and Integration Research Programme funded by the South African Department of Trade and Industry (the dti). This collaborative study was done by the Zambia Institute for Policy Analysis and Research and the Centre for Competition Regulation and Economic Development based at the University of Johannesburg in South Africa. 2 It’s noteworthy that imports are not necessarily bad if used as intermediate goods to improve local production and exports. Moreover we are not claiming that the region should/can be self-sufficient in everything. There are definitely other areas where the region should and will have to trade with the rest of the world. However there is simply no justification why the region should be importing other products, especially finished products that it can easily produce, such as soaps, detergents and cosmetics.3 See Trade Map for definition of Harmonized System (HS)4 As a rule of thumb, an HHI below 1 500 is indicative of a competitive market place, an HHI between 1 500 and 2 500 is moderately concentrated

55
t h e c o s m e t i c s , s o a p s a n d d e t e r g e n t s r e g i o n a L v a L u e c h a i n s
and an HHI above 2 500 is regarded as highly concentrated. 5 Firm interviews. 6 For extraction of crocodile oil, which is used for skincare.
REFERENCES
Andreoni, A and Chang, HJ (2016) Industrial policy and the future of manufacturing, Journal of Industrial and Business Economic, 43(4): 491–502.
Andreoni, A (2011) Productive capabilities indicators for industrial policy design, UNIDO Working paper series, 17/11.
Blueprint Strategy and Policy (2005) Promotion of Small and Medium Enterprises in the South African Chemicals Sector. Prepared for Chemicals Summit NEDLAC. Available at: http://www.dti.gov.za/industrial_development/docs/fridge/SME_Support_Chemicals_Final_Draft.pdf [Accessed 6 June 2019].
Boselie, D, Henson, S and Weatherspoon, D (2003) Supermarket procurement practices in developing countries: Redefining the roles of the public and private sectors, American Journal of Agricultural Economics, 85(5): 1155–1161.
Bosiu, T, Mondliwa, P, Nhundu, N, Nkhonjera, M and Sipula, M (2016) Gauteng City Region Chemicals and Plastics sector study – A strategy report for the Gauteng Department of Economic Development (GDED). Mimeo
Cebos (2017) Understanding the importance of quality standards. Available at: http://www.cebos.com/understanding-the-importance-of-quality standards/ [Accessed 29 March 2017].
Center for Competitive Analysis (2000) The Soap and other Detergents Manufacturing Industry: Trends and Characteristics. Columbia, MO: University of Missouri Outreach and Extension
Center for International Development (2017) The Atlas of Economic Complexity, Harvard University. Available at: http://atlas.cid.harvard.edu/ [Accessed 6 June 2017].
Central Statistical Office (2015) 2014 Labour Force Survey. Lusaka: CSO.Chansa, F, Mubanga, N, Mudenda, D and Ndulo, M (2016) Employment and
Industrial Policies and Strategies: International lessons for Zambia on the role of the state. Lusaka: ZIPAR
Chenery, HB, Robinson, S, Syrquin, M and Feder, S (1986) Industrialization and Growth. New York: Oxford University Press.

C o m p e t i t i o n a n d R e g u l a t i o n f o R i n C l u s i v e g R o w t h
56
Dinh, H, Kumar, P, Morris, A, Yagc, F and Fitzgerald, K (2013) Light Manufacturing in Zambia: Job creation and prosperity in a resource-based economy. Washington DC: World Bank.
FRIDGE (2011) Study to develop a strategy for the development of a viable essential oils industry in South Africa. Available at: http://inr.org.za/wp- content/uploads/2014/09/fridge-essential-oils-report-1_situation-analysis_final.pdf [Accessed 29 March 2017].
Gopal, RK and George, M (2014) Packaging, a visual art: An analysis on packaging for FMCG goods, Asia Pacific Journal of Research, 1(16): 122–132.
Hidalgo, C, Klinger, B, Barabási, A-L and Hausmann, R (2007) The product space conditions the development of nations, Science, 317: 482–487.
Hidalgo, C and Hausmann, R (2009) The building blocks of economic complexity, PNAS, 106(26): 10570–10575.
Joffe, A, Kaplan, D, Kaplinsky, R and Lewis, D (1995) Improving Manufacturing Performance in South Africa: The report of the industrial strategy project. Cape Town: UCT Press.
McMillan, M, Rodrik, D and Sepulveda, C (2017) Structural Change, Fundamentals and Growth: A framework and country studies. Washington DC: International Food Policy Research Institute.
Mullin, R (2002) Direct Marketing: A step by step guide to effective planning and targeting. London: Kogan Page Limited.
Murphy, KM, Shleifer, A and Vishny, RW (1989) Industrialization and the big push, Journal of Political Economy, 97(5): 1003–1026.
Rodrik, D (2010) The Return of Industrial Policy. Available at: https://www.project-syndicate.org/commentary/the-return-of-industrial-policy#paragraphId=b39e300346f86fa80f434005 [Accessed 9 February 2017].Technavio Research (2016) Growing demand for chemical free products to create opportunities for the global organic skincare products market through 2020, Business Wire. Available at: http://www.businesswire.com/news/home/20160817005039/en/Growing-Demand-Chemical-Free-Products-Create-Opportunities/ [Accessed 16 March 2017].
Statistics South Africa (2018) Gross Domestic Product. Statistical release P0441TIPS (2008) Trade Information Brief: Essential oils. Pretoria: TIPS.Trade Kings (2015) A Story of Success: Profile. Available at: https://tradekings.co.zm/
wp-content/uploads/2015/11/TradeKings_PROFILE.pdf [Accessed 9 February 2017].

57
t h e c o s m e t i c s , s o a p s a n d d e t e r g e n t s r e g i o n a L v a L u e c h a i n s
Wansbrough, H (ND) Soap and detergent manufacture. Unpublished.Who Owns Whom (2016) Manufacture of soap and cleaning products: Wax
and polishes. Available at: https://www.woweb.co.za/public/sasector/report_content/Pages%20from%2033541%20and%2033549%20%20Manufacture%20of%20Soap%20and%20Cleaning%20Products,%20Wax%20and%20Polishes%20-%20May%202016%20-%20Contents.pdf [Accessed 29 March 2017].
World Bank (2017) World Bank National Accounts Data and OECD National Accounts Data. Available at: http://data.worldbank.org/indicator/NV.IND.MANF.ZS?end=2015andlocations=ZMandstart=1965andview=chart [Accessed 17 March 2017].
Zambia Central Statistics Office (CSO) (2016) National Accounts: Gross Domestic Product. Available at: https://www.google.com/url?sa=t&rct=j&q=&esrc=s& source=web&cd=2&ved=2ahUKEwjsktyK1dLiAhXNTxUIHSEKCt0 QFjABegQIAxAC&url=https%3A%2F%2Fwww.zamstats.gov.zm%2Findex. php%2Fpublications%2Fcategory%2F29-national-accounts%3F download%3D834%3Afinal-national-accounts-report-2014-2015& usg=AOvVaw3VMnEfuD-hhFVQ-Y_pWtNr [Accessed 9 February 2017].
Zambia Central Statistical Office (CSO) (2018). Monthly Bulletin, Volume 182. Available at: https://www.zamstats.gov.zm/index.php/publications/category/ 59-2018 [Accessed 6 June 2019].
Ziba, F and Phiri, M (2017) The expansion of regional supermarket chains: Implications for local suppliers in Zambia, WIDER Working Paper 58/2017, UNU-WIDER, Helsinki.


59
c o m p e t i t i o n p o L i c y f o r t h e t r i p a r t i t e f r e e t r a d e a r e a
2
Competition policy for the Tripartite Free Trade Area
Jonathan Klaaren and Fungai Sibanda
INTRODUCTION
This chapter presents information and analysis of a number of issues that are relevant to the formulation of competition policy for the Tripartite Free Trade Area (TFTA),1 which could prove helpful when a state or state agency is formulating its negotiating position.
After this introduction, this chapter addresses the question of cross-border harms to competition, which a free trade area (FTA) could mitigate, before examining the issue of binding commitments and best endeavours arrangements, as well as national and supranational laws, their objectives and scope, including exemptions. Thereafter, it surveys the existing institutions (laws, enforcement agencies and courts) in place in the component economic communities to the TFTA as of January 2017. It draws on international experience and benchmarking against other FTAs to present and analyse confidentiality provisions, procedural fairness in competition law enforcement, private rights of action and dispute settlement. Finally, it examines existing institutional arrangements at national and supranational level, focusing on the effectiveness of various institutions within the proposed TFTA and also international best practice and benchmarking with special attention to the European Union.
African countries – including South Africa – need to develop proactive

C o m p e t i t i o n a n d R e g u l a t i o n f o R i n C l u s i v e g R o w t h
60
strategies to harness the dramatic changes that have occurred in the trade architecture of the world during the first decade of the new millennium and use these to advance the integration of the African continent (Ismail, 2016). We argue for a development integration approach rather than an open regionalism approach. In this three-pronged and pragmatic development integration approach, African countries are called on to advance their regional integration through a coordinated approach to opening their markets to one another, while building industrial capabilities and developing cross-border infrastructure (Ismail, 2016). Indeed, the current three pillars of the TFTA agreements – market access, cross-border infrastructure and regional industrial policy – mirror this approach. The TFTA is, in turn, the key bridge towards the envisaged Continental Free Trade Area (Fundira, 2016).
The move towards regional economic integration, as part of the overall trade liberalisation agenda, has been gaining momentum around the world over the last two decades. Africa is no exception. Whereas between 1948 and 1994, there were only 124 notifications of regional trade agreements (RTAs) with the World Trade Organisation (WTO), the cumulative number of RTAs in force reached about 423 by 1 July 2016 (since 1995), rising to 635 when inactive RTAs are included (WTO, 2016). What is more, RTAs are no longer confined to immediate neighbours but now involve countries across regions – what may be accurately termed cross-regional trade agreement. Examples include the EU-Mexico Economic Partnership Agreement, EFTA-Chile FTA (free trade area), Korea-US FTA, EFTA-SACU FTA, South Africa-MERCOSUR PTA and the SACU-India PTA.
The surge in the number of RTAs is underpinned by various phenomena, including an expansion in WTO membership, frustrations by member countries with the lack or slow pace of progress in the WTO, the growing importance of trade in services and a shift towards preferential trading regimes (WTO, 2015). The rise in cross-regional RTAs, as noted earlier, also explains the overall increase in RTAs. Once a country has entered into a free-trade agreement with its neighbours or natural trade partners (by virtue of geographic proximity), the next

61
c o m p e t i t i o n p o L i c y f o r t h e t r i p a r t i t e f r e e t r a d e a r e a
move is to enter into trade pacts with countries further afield. Moreover, globalisation – facilitated by advances in communication technologies and transportation systems – has reduced the distance between countries, enabling the easy movement of people, goods and capital, thus incentivising the conclusion of RTAs across regions and continents. As a result, about half of the RTAs signed by the end of 2011 were cross regional in nature (Van den Bossche and Zdouc, 2013).
The benefits of entering into RTAs are varied. At a theoretical level, RTAs reduce barriers to trade among member countries. Consequently, countries are able to source goods and services from low-cost areas, based on comparative advantage, thus increasing the total welfare of citizens. While increased trade appears to be a driving force behind RTAs, there are myriad other practical reasons why countries do this, including economic, political and security considerations (Whalley, 1998; Crawford and Fiorentino, 2005). For instance, smaller economies might enter into RTAs with bigger economies as a way of gaining access to larger markets, while bigger countries may use them to pursue foreign policy objectives. Other countries might use RTAs to influence subsequent multilateral negotiations, by first securing a common position at a regional level. Still others could and do use RTAs to lock-in and entrench domestic policy reforms. From a political perspective, RTAs also assist countries to promote and maintain peace, stability and security with their partners.
Economic integration takes various forms, ranging from bilateral preferential trade agreements (PTA) to regional free trade areas and monetary unions. The linear model of economic integration, as depicted in Figure 2.1, posits that countries usually start off with a preferential trade agreement, moving to a free trade agreement, then a customs union, leading to a common market, then an economic and monetary union, culminating in full economic integration. In practice, however, countries may not necessarily follow this linear model and this order. Some regional integration initiatives start with the establishment of a free trade area, while others, like the SACU, started at a customs union stage without being preceded by a PTA or an FTA.

C o m p e t i t i o n a n d R e g u l a t i o n f o R i n C l u s i v e g R o w t h
62
Figure 2.1: Linear model of economic integration
Source: Adapted from Marinov (2015)
Economic integration and trade in Africa
African economic integration has been on the agenda of the African Union (AU) since the establishment of the continental body’s predecessor, the Organisation for African Unity (OAU). AU member states signed the Abuja Treaty in June 1991.2 The objective of this treaty is to create an African economic community designed to, among other things, enhance regional and continental economic integration and expand trade for the sole purpose of fostering overall social and economic development of the member states (UNECA, 1995). There are various sub-continental regional economic blocs that have been established over the years to assist in achieving the continental economic integration objective. These are:
• the Arab Magreb Union (AMU/UMA);3 • the Community of Sahel-Saharan States (CEN-SAD);4 • the Common Market for Eastern and Southern Africa
(COMESA);5
• the East African Community (EAC);6 • the Economic Community of Central African States (ECCAS/
CEEAC)7 and the Central African Economic and Monetary Community (CEMAC);

63
c o m p e t i t i o n p o L i c y f o r t h e t r i p a r t i t e f r e e t r a d e a r e a
• the Economic Community of West African States (ECOWAS)8, including the West African Economic and Monetary Union (UEMOA) and the West African Monetary Zone (WAMZ);
• the Intergovernmental Authority on Development (IGAD)9; and • the Southern African Development Community (SADC)10
including the Southern African Customs Union (SACU).
Figure 2.2: Percentage share of RTAs by region
Source: Adapted from WTO: Regional Trade Agreements and the Multilateral Trading System
Figure 2.2 indicates that Africa as a region has been lagging behind in concluding RTAs. Out of all RTAs notified with the WTO, only 7 per cent are from the African continent. Europe has the highest percentage share, followed by the Americas and East Asia. This notwithstanding, the African continent has set itself a timetable for full integration by 2028, as depicted in Table 2.1.

C o m p e t i t i o n a n d R e g u l a t i o n f o R i n C l u s i v e g R o w t h
64
Table 2.1: Six stages of integration in relation to Abuja Treaty
Source: Adapted from the African Union Commission, Minimum Integration Programme
In a bid to pick up the pace of integration, the African Union Summit held in January 2012 in Ethiopia adopted an action plan to boost intra-Africa trade and fasttrack the establishment of a Continental Free Trade Area that will include all the 55 member states of the AU by 2017. By March 2019, 52 had signed the African Continental Free Trade Area Agreement. The AU’s strategy for economic integration is to use regional economic communities as building blocks to complete integration. In this regard, the AU also invited the regional economic communities of West Africa, East Africa, the Sahel-Sahara States and the
Stages of integration Target year
First stage: 5 years Creation and strengthening of the RECs
1999
Second stage: 8 yearsIntra-regional and inter-regional harmonisation, including gradual elimination of tariff and non-tariff barriers
2007
Third stage: 10 yearsEstablishment of free trade area (FTA) and customs union in each regional bloc
2017
Fourth stage: 2 yearsEstablishment of continental customs union and FTA
2019
Fifth stage: 4 yearsEstablishment of continental common market
2023
Sixth stage: 5 yearsEstablishment of economic and monetary union
2028

65
c o m p e t i t i o n p o L i c y f o r t h e t r i p a r t i t e f r e e t r a d e a r e a
Arab Maghreb Union to draw inspiration from and emulate the efforts of the COMESA-EAC-SADC tripartite FTA and create a second pole of integration in an endeavour to accelerate continent-wide economic integration. In this direct sense, negotiating the TFTA takes on continent- wide significance.
The COMESA-EAC-SADC11 Tripartite TFTA combines half the continent’s 54 countries, with a total population of over 600 million people and a total GDP of about US $1 trillion (SADC, 2015). The TFTA is set to assist member countries not only with increased trade but economic development as well. When the COMESA Free Trade Area was formed in 2000, trade among its member states stood at US $3.1 billion. Since then, intra-COMESA trade has grown more than seven times to about US $18.4 billion in 2012 (COMESA RIA, 2019). Similarly, over a 10-year period between 2004 and 2014 trade within SADC has grown from US $20 billion to US $72 billion while the EAC has recorded intra-regional growth in trade from US $2.6 billion to US $8.6 billion. The combined intra-trade of the three RECs grew three-fold between 2004 and 2014, from US $30 billion to US $102.6 billion (Trademark, 2015). While growing, Africa’s intra-REC trade averaged 10 per cent in 2013 compared with the rest of the world’s RECs that each had an average share of 42 per cent of trade (UNECA, 2015).
At a continental level as well, intra-Africa trade remains at relatively low levels. For instance, in 2013 it was 14 per cent, better only than Western Asia, which had an intra-regional trade of 9 per cent. At the same time, intra-regional trade in South and Central America, North America, the European Union and Asia was at 17 per cent, 49 per cent, 61 per cent and 62 per cent, respectively.
International trade and the significance of competition policy
The field of development economics has concerned itself with the impact of trade liberalisation on economic growth. While different studies may yield different results, international trade generally fosters growth through comparative advantage, economies of scale exploitation, technological spill-overs, exposure to new goods and services, as well as

C o m p e t i t i o n a n d R e g u l a t i o n f o R i n C l u s i v e g R o w t h
66
the introduction of new production and organisation methods (Gwaindepi, Musara and Dhoro, 2014). By the same token, competition is known to produce outcomes that enhance economic welfare, generally. The results of a study by Dutz and Hayri (2000), indicates a strong correlation between the effectiveness of competition policy and economic growth. What is even more pronounced is the fact that the effect of competition on economic growth goes beyond trade liberalisation. This indicates that international trade, in this case through regional integration, if combined with effective competition policy, can set member countries on a sustained growth path. On the contrary, conduct that stifles competition can distort trade, reduce economic welfare and, therefore, inhibit growth. It is for this reason that member countries should endeavour to put in place effective competition laws and policies if the gains from regional integration are to be realised in full. Anticompetitive conduct can have cross-border effects and distort trade among countries if left unchecked. An important feature of the second generation RTAs (those concluded since the establishment of the WTO in 1995) is that they go beyond regulating only trade in goods to encompass aspects such as trade in services, investment, intellectual property rights and competition policy. As shown in Figure 2.3, of all the RTAs notified with the WTO between 2000 and 2014, almost two-thirds (59 per cent) contain provisions on competition policy, 56 per cent have provisions on goods and services, 54 per cent on investment, 47 per cent on intellectual property rights and 47 per cent on government procurement provisions.
Before discussing the TFTA in its African economic context and the specifics of potential TFTA provisions, this chapter considers some of the possible harms to competition that should be prevented within a regional integration setting.
CROSS-BORDER HARMS TO COMPETITION
This section addresses some of the cross-border harms to competition that the TFTA could mitigate, through the incorporation of competition policy provisions. Competition policy consists of broad government measures aimed at regulating the behaviour of firms and market

67
c o m p e t i t i o n p o L i c y f o r t h e t r i p a r t i t e f r e e t r a d e a r e a
structures to promote, preserve and protect the competitive process. The broad suite of competition policy encompasses competition laws, which are rules and regulations enacted in pursuit of these goals. By and large, a typical competition law is intended to prohibit: (1) anticompetitive agreements; (2) abuse of a dominant position; and (3) anticompetitive mergers.
Figure 2.3: Percentage of notified RTAs by topic
Source: Adapted from WTO: Regional Trade Agreements and the Multilateral Trading System
Anticompetitive agreements can either be horizontal, ie, among firms at the same level of the production or distribution chain, such as cartel agreements, or vertical, ie, involving one or more firms at different stages of the production or distribution value chain, such as minimum resale price maintenance agreements. An abuse of a dominant position occurs when a firm takes advantage of its market power to engage in exploitative conduct such as excessive pricing or exclusionary conduct, such as price discrimination, margin squeeze, refusal to deal or predatory pricing. Anticompetitive mergers result from transactions that change the market structure and give the merging parties market power and the incentive to abuse such market power.

C o m p e t i t i o n a n d R e g u l a t i o n f o R i n C l u s i v e g R o w t h
68
As countries integrate, domestic firms get exposed to foreign competition and they may resort to collusive behaviour, abuse of dominance or seek anticompetitive mergers as a survival tactic. Such conduct can have regional or even global effects, especially where offending firms operate in multiple jurisdictions. One particular challenge that arises with regional or cross-border anticompetitive conduct is that, in most cases, national laws are unable to reach the conduct of firms committed externally but having an effect in the domestic market. For instance, the evidence needed to bust an international cartel is often located outside the borders of the economy experiencing its harmful effects. What is worse, the country from which the conduct is emanating may not have the incentive, resources or even laws to deal with it. In certain instances, as is the case with export cartels, countries may even promote the conduct explicitly or implicitly. Without bilateral or multilateral cooperation agreements on competition policy, individual countries may find it difficult, if not impossible, to curb this conduct. Adopting competition policy provisions in a regional trade agreement can assist in dealing with such anticompetitive conduct. The following section discusses some of the effects of cross-border anticompetitive conduct.
Horizontal restraints: Cross-border cartels
Cartels are regarded as the most serious and damaging form of anticompetitive conduct. A cartel is formed when competitors collude to fix prices (purchase or selling prices), restrict output, allocate markets (customers, suppliers or regions) or rig tenders. The idea behind a cartel is that, by avoiding competition, members are able to charge prices at levels higher than would obtain under conditions of competition, and thus reap super-normal profits. Collusive behaviour distorts productive and allocative efficiency. As a result, consumers are likely to suffer from higher prices, limited or no product choice and a slower rate of innovation and technological change.
Theoretically, the welfare effects of a cartel operate much the same way as would a monopolist and can be illustrated in terms of a

69
c o m p e t i t i o n p o L i c y f o r t h e t r i p a r t i t e f r e e t r a d e a r e a
standard deadweight loss model, as illustrated in Figure 2.4. Assuming a competitive market price of P1, the formation of a cartel will increases prices to P2. The amount of overcharge, that is the welfare transfer from the consumer to the cartel, is represented by the area between the pre- and the post-cartel price and quantity, which is P1TRP2. RTS represents the deadweight loss, ie, the net loss to society as a result of some consumers stopping purchases.
Figure 2.4: Welfare effects of a cartel
Source: Authors’ compilation
Cartels can be domestic, operating within a single territory, or international, in which case members operate in two or more countries. There are also export and import cartels. However, whatever the form they may take, cartels make use of similar tactics, that is, they need to coordinate their activities in order to circumvent competition and the free play of market forces (Levenstein and Suslow, 2008). As regional integration expands and deepens, so does the volume of goods and services susceptible to potential collusive behaviour. It is no wonder that, with accelerated international trade, there has also been an increase in the number of cross-border cartels exposed since the 1990s (OECD, 2003). A number of studies have been undertaken, estimating the deleterious effects of cross-border cartels on trade, especially on developing countries.

C o m p e t i t i o n a n d R e g u l a t i o n f o R i n C l u s i v e g R o w t h
70
According to UNCTAD (2003), the most blatant and egregious foreign source of non-competitive market outcomes in developing economies is private international cartels. Between 1994 and 2006, the US Department of Justice and the European Commission levied fines on international cartels amounting to about US $3 billion and US $8.2 billion, respectively (UNECA, 2015).
For developing countries with high levels of poverty and low incomes, cross-border cartels add a premium to imported products, resulting in even higher prices that are beyond the reach of the majority of citizens. The OECD estimates that, in the 1990s, developing countries imported goods worth about US $81 billion from countries where there had been a cartel in operation (OECD, 2003).
Levenstein and Suslow (2004) estimated the amount of imports of about 19 different products that were affected by cartel behaviour. They found that the total value of ‘cartel-affected’ imports by developing countries in 1997 amounted to US $51.1 billion. This figure represents 3.7 per cent of all imports by developing countries and 0.79 per cent of their combined GDP in 1997. This indicates that international cartels have an economically significant negative effect on trade with developing countries.
Anosteva (2015) used data on 170 discovered and prosecuted cartels to estimate the effect of each cartel on trade. The results also show a negative impact of cross-border cartels on trade between cartel- member countries.
An interesting study is one done by Clarke and Evenett (2003) analysing the international trade effects of an international vitamins cartel that operated between 1989 and 1999, involving producers from Belgium, Canada, France, Germany, Japan, the Netherlands, Switzerland and the United States. They found that exports from countries with a cartel member to countries with no competition law enforcement regime tended to rise in value more than in those jurisdictions with anticartel laws. This indicates that cartels tend to increase prices in countries with no competition law regime, more than in places where the cartel is likely to face an effective competition law.

71
c o m p e t i t i o n p o L i c y f o r t h e t r i p a r t i t e f r e e t r a d e a r e a
Martyniszyn (2012) makes an inference, in the context of one of South Africa’s earliest and so far longest-running cartel cases involving a US-based export cartel, American Soda Ash, that the extraterritorial application of the South African competition law led to both better supply and, most likely, lower prices of soda ash. Various other cartels with cross-border effects have been uncovered in South Africa, as shown in Table 2.2. More cartels with possible regional impact have recently been investigated (Bosiu, 2017).
Table 2.2: Cross-border cartels uncovered in South Africa
Cartelised product Main fims Countries affected
Scrap metal Cape Town Iron and Steel Works, National Scrap Metal, New Reclamation, SA Metal & Machinery Company
Namibia, South Africa
Construction Aveng Africa, Basil Read, Group Five, Murray and Roberts, Stefanutti, Wade Walker
Botswana, Burkina Faso, Malawi, South Africa, Zimbabwe
Concrete pipes and culverts
Aveng (Africa) Incl. Aveng (infraset), Rocla, Swazi Fyfe
Botswana, Mozambique, Namibia, Swaziland, Tanzania, Zambia
Cartelised product Main fims Countries affected
Cement Lafarge, AfriSam, PPC Botswana, Lesotho, Namibia, South Africa, Swaziland
Pilings Grinaker LTA (Aveng Africa), Esorfranki Construction, Rodio Geotechnics, Dura Soletanche-Bachy, Geomechanics, Diabor (Pty) Ltd
Lesotho, South Africa, Swaziland
Steel products Trident Steel (Aveng Africa), Macsteel, Highveld
Exports to Africa Overland Market, South Africa

C o m p e t i t i o n a n d R e g u l a t i o n f o R i n C l u s i v e g R o w t h
72
Source: Adapted from Table 11.1 in Vilakazi, Simbanegavi and Roberts (2017)
Export cartels
In some countries, such as the United States, Australia and India, export cartels are explicitly exempted from the application of competition law. In the European Union, Article 101 of the Treaty on the Functioning of the European Union (TFEU) provides an implicit exemption by prohibiting only agreements between undertakings, decisions by associations of undertakings and concerted practices that may affect trade between member states, and which effect the prevention, restriction or distortion of competition within the common market. By implication, conduct that has an effect outside the common market, such as export cartels that sell outside of the European Union, does not fall foul of its competition law.
The rationale for exempting or even actively promoting export cartels is that they help domestic companies penetrate foreign markets by providing economies of scale for domestic firms to compete abroad. Export cartels can also pool resources when it comes to market research and negotiating shipping rates, thus producing efficiency gains that can be passed on to consumers in the form of lower prices. It is also argued that the impact of an export cartel is felt in a foreign country in any case. However, this reasoning ignores the fact that export cartels may provide a breeding ground for domestic hard-core cartels. All that is needed for competitors to collude is interaction, sharing of information and the monitoring of truant behaviour. Larson (1970) analysed the effects of the Webb-Pomerene Act of 1918, which permits US firms in an industry to export through single sales agencies. While the intention was to assist small and medium-sized enterprises, evidence suggest that most export cartels in the United States are formed by large firms in concentrated markets. Nothing could be more telling than the further observation that
Industrial gases Air Products South Africa, Sasol Chemical Industries
Southern African region

73
c o m p e t i t i o n p o L i c y f o r t h e t r i p a r t i t e f r e e t r a d e a r e a
whenever a successful export cartel is operating, there probably exists an anticompetitive market situation and that,
… it is naive to expect association members to ignore the domestic market while they freely discuss prices and quotas for exports. The domestic market is almost always the more important market. We are left with the conclusion that the creation of an export association provides an excellent chance for large oligopolists to ‘peacefully coexist’ both at home and abroad. The existence of the association in exports provides the vehicle for controlling the domestic market (Larson, 1970).
In the end, exempting export cartels can encourage the formation of more cartels, first, by incentivising the importing country to exempt its domestic export cartels, thus leading to a proliferation of export cartels globally. Second, as noted above, export cartels can be an avenue to hard-core domestic cartels and, eventually, cross-border cartels, resulting in restricted international trade. Countries with industries that are not yet fully developed are more susceptible to suffer harm from an export cartel than countries with strong and diverse industrial economies (Kwok, 2015). Moreover an export cartel from a developed country can exert market power against its weaker competitors in developing country markets.
In our view, these findings have far-reaching implications for members of the TFTA. They underscore the importance of accelerating the adoption of competition laws by those member countries without such laws.
Cross-border mergers
Companies grow either organically or through mergers and acquisitions. However, by concentrating market power in a single entity, mergers provide an incentive to abuse such market power to the detriment of competition and consumers at large. Thus, unlike cartels and abuse of dominance, which are behavioural in nature, mergers affect competition

C o m p e t i t i o n a n d R e g u l a t i o n f o R i n C l u s i v e g R o w t h
74
by altering the structure of markets. This renders mergers a special type of competition policy consideration because they are undertaken for legitimate business purposes. Consequently, mergers can either be procompetitive or anticompetitive, hence the need for their evaluation and control. With the advent of globalisation and the reduction of trade barriers, companies are finding it easier to do business in foreign jurisdictions, not only as exporters but also establishing a physical presence through mergers, acquisitions and takeovers. Mergers and acquisitions also allow firms to enter new markets at relatively lower costs than through setting up green-fields operations. This phenomenon gives rise to cross-border mergers.
A cross-border merger occurs if one of the merging entities is based in a different country. However, a merger can have an effect in a jurisdiction other than the one in which the merging parties are based. Thus, cross-border mergers can affect competition, either due to the location of the merging parties or the effect of the merger. Breinlich, Nocke and Schutz (2012) find that cross-border merger decisions taken in isolation by national competition authorities lead to inefficient outcomes, compared to a scenario where competition policy is coordinated.
According to the OECD, the inability to prevent anticompetitive cross-border mergers may create large companies that can operate with market power throughout the world (OECD, 2014). Such companies can engage in a variety of abuses, including exclusive dealings, exclusionary conduct to keep competitors out of certain markets and exploiting consumers through high prices. Thus, preventing an anticompetitive cross-border merger may be more important than stopping an anticompetitive national merger.
There are various challenges for competition authorities when dealing with cross-border mergers, where there is no regional framework or common approach to assessing such transactions. Where there is no cooperation mechanism and harmonisations of laws, authorities in different countries may reach different, inconsistent or even conflicting decisions. The absence of relevant institutions in some instances means that a transaction that is prevented in one jurisdiction may consummate
75
c o m p e t i t i o n p o L i c y f o r t h e t r i p a r t i t e f r e e t r a d e a r e a
in a neighbouring country with no institutional notification and approval framework.
Merger evaluation timeframes tend to differ across jurisdictions, thus affecting proper planning by the merging parties. Notification of mergers in multiple jurisdictions increases transactions costs for the merging parties (Jacobsberg and Shahim, 2013).
A number of South African companies operate in two or more countries within the subregion and continent. Between 2000 and 2011, there were some 190 cross-border mergers considered by the South African competition authorities, only 23 of which were approved with conditions (UNCTAD, 2012). Despite the fact that, in reality, most cross-border mergers have been approved and a few approved with conditions, it is still beneficial to have a regional cooperation mechanism for dealing with such transactions.
The Competition Commission of South Africa (CCSA) recognised the importance of cross-jurisdictional cooperation in merger review early in its existence. In 2000, Glaxo-Wellcome PLC and SmithKline Beecham PLC notified both the CCSA and the European Union of the proposed merger. The CCSA liaised with its counterpart in the European Union and approved the merger with conditions. Similarly, the CCSA and the European Union cooperated and shared information, with the consent of the parties, during the evaluation of the AP Møller-Maersk and Royal P&O Nedlloyd NV merger in 2005.
The Walmart-Massmart case
The acquisition of the South African-owned firm, Massmart, by a US-based company, Walmart, also pointed to the need and importance of cooperation in cross-border mergers. This transaction resulted in compulsory merger notifications in six African jurisdictions, including South Africa, Tanzania, Namibia, Malawi, Swaziland and Zambia. Namibia and South Africa imposed conditions on the merger, while the other four countries approved the transaction unconditionally. While the Namibian Competition Commission (NCC) had initially proposed conditions, these conditions were successfully appealed against at the

C o m p e t i t i o n a n d R e g u l a t i o n f o R i n C l u s i v e g R o w t h
76
High Court level. The NCC then appealed the High Court ruling to Namibia’s Supreme Court of Appeal. The Supreme Court set aside the order made by the High Court, declaring the conditions imposed by the NCC in approving the merger, to be unlawful and invalid. The Supreme Court held, in addition, that the matter should revert to the Minister of Trade and Industry to proceed with the review process. In the end, the conditions were revised, taking into account the issues raised by the courts, to reflect the following:
• The merged entity must ensure that there are no retrenchments, based on the merged entity’s operational requirements in Namibia, resulting from the transaction, for a period of two years from the effective date of the transaction.
• The merged entity must honour existing labour agreements and must continue to recognise representative trade unions in Namibia to represent the bargaining units, for a period of two years from the effective date of the transaction.
• The merged entity must consult with the Minister of Trade and Industry with regard to the establishment of a programme of activities for domestic supplier development, which the merged entity must implement. The merged entity must obtain the approval of the Minister of Trade and Industry for such programme within 12 months of the date of this determination.
On the other hand, the CCSA recommended unconditional approval of the merger to the Competition Tribunal. Following interventions by the Minister of Economic Development and the unions, the Competition Tribunal and, subsequently, the Competition Appeal Court (CAC), approved the merger on several conditions:
• that there will be no retrenchments resulting from operational requirements, in South Africa, for two years;
• that preference will be given to the re-employment of 503 retrenched employees;
77
c o m p e t i t i o n p o L i c y f o r t h e t r i p a r t i t e f r e e t r a d e a r e a
• that existing labour agreements will be honoured and SACCAWU’s (the trade union’s) position will not be changed for three years; and
• that the merged entity will establish a R100 million programme aimed at the development of local South African suppliers, including small, medium and micro enterprises (SMMEs). In addition, the merged entity will establish a training programme to train local South African suppliers on how to do business with the merging entity and with Walmart.
There is no indication that the investigative bodies of the two countries liaised, cooperated or worked closely together during the investigation of the merger, although the final conditions imposed tended to converge. Other African countries could also have imposed and benefited from similar conditions as South Africa and Namibia. Further, the impact of these conditions themselves can be enhanced by coordination and cooperation mechanisms in the consistent application of competition policy and law within the region.
Such cooperation and coordination was evidenced by the CCSA and the NCC entering into a MoU in November 2015 aimed at solidifying their relations and cooperation on competition policy matters. The Walmart-Massmart case and the subsequent MoU can offer lessons on the approach and nature of competition policy to be adopted at the TFTA level.
Abuse of dominance
The creation of an internal market through regional integration opens up the domestic economy to competition from external firms. As local oligopolies and monopolies get exposed to foreign competition, their market power gets reduced. However, it is possible for trade liberalisation, even at a regional level to have the opposite effect, ie, to incentivise the abuse of dominance. This may happen when dominant firms adopt survival strategies that entrench and protect their position when faced with the threat of competition. It is also possible that smaller and less

C o m p e t i t i o n a n d R e g u l a t i o n f o R i n C l u s i v e g R o w t h
78
efficient firms exit the market due to increased competition. This leaves dominant firms to exploit the resultant economies of scale. Another possible strategy is for dominant firms to use the profits reaped in their markets to subsidise their entry into foreign markets by undercutting local companies or engaging in other predatory practices.
Vertical restraints
Vertical restraints restrict competition at different levels of the value chain. Some typical vertical restrictive practices include sole agency agreements, resale price maintenance and vertical territorial allocation. The rise of large multinationals means that industries, such as motor vehicle manufacturing, electronics, information communication technologies and others, are dominated by a few global oligopolies. These manufacturers rely on a network of distributors to sell their products, making it easy for them to enter into anticompetitive agreements such as minimum resale price maintenance, which keeps the prices of these products very high. Another common vertical restraint is exclusive dealing, which takes different forms. One arrangement could involve a manufacturer entering into an agreement with a downstream distributor in a particular country to the exclusion of other firms, thus making it difficult for these other firms to enter the market. Another variant of an exclusive dealing arrangement is where the dealer or distributor is prohibited from selling the products of the manufacturer’s competitors. Both these arrangements negatively affect trade by restricting the importation of certain products into the domestic market.
State action
State action can lead to the distortion of competition and trade through various means. Exclusivity or special rights granted to state-owned entities or private monopolies may create an unfair competitive advantage for such companies, both in the domestic market and internationally. The pursuit of the national interest, where governments actively support certain industries, can have negative effects on competition in relation to trade with other countries. This could occur, for instance, where

79
c o m p e t i t i o n p o L i c y f o r t h e t r i p a r t i t e f r e e t r a d e a r e a
government subsidises the expansion of a national champion, thus making it difficult for foreign firms to enter the domestic market and compete with such a firm, which may be charging sub-competitive prices due to state aid. Fox and Healey (2014) note that state acts can be used as a defence by private firms who engage in anticompetitive conduct – they can contend that the state has triggered or blessed their conduct.
COMMITMENTS, ARRANGEMENTS, POLICY AND LAWS
This section examines the issue of binding commitments and best endeavours arrangements, as well as national and supranational laws, their objectives and their scope, including exemptions. It surveys the existing institutions (laws, enforcement agencies and courts) in place in the component economic communities to the TFTA. It thus discusses the TFTA and competition policy in the context of African economic regionalism.
Several important questions arise when considering the place of competition law and policy within the TFTA agreement. The first is whether the TFTA should adopt or maintain national competition laws and/or adopt supranational competition laws. A second is which of the objectives of this national or supranational policy and laws should the TFTA promote. A third is what should be the scope of the TFTA competition law and policy, including exemptions. While these last two questions are more specific and are discussed in the next section, the first question is discussed here as part of the general discussion of the TFTA and competition policy in the context of African economic regionalism.
National and/or supranational laws? The SADC, the EAC and COMESA
As a starting point, it is appropriate to recognise the different levels of development of competition policy, laws and institutions in the member states of the TFTA. The fact is that there are eight countries with no
C o m p e t i t i o n a n d R e g u l a t i o n f o R i n C l u s i v e g R o w t h
80
dedicated competition law and 12 countries without a competition authority within the TFTA states. There are thus significant differences between a member state such as South Africa – a state with a national competition law and institutions – and member states such as Burundi – a state with a national competition law but no competition institutions – and the DRC, which has neither a law nor a competition authority. Of course, some competition law and policy may be housed in other economic regulators than purpose-driven competition authorities. These differences in the levels of developed laws and institutions impact on the procedural fairness, effectiveness of law and policy, and on the reasonable expectations of the TFTA agreement in competition-related provisions. Further, for those countries with laws or institutions, it is appropriate to recognise that the local context influences the content of policy and law and the nature of institutions.
Finally, it should also be recognised that national and supranational laws can often exist together in the realm of competition law and policy. For instance, eight members of COMESA, six of whom are also members of the SADC, have national competition laws and are also bound by the COMESA competition law.
The COMESA competition law is the COMESA Competition Regulations promulgated by the Council of Ministers pursuant to Article 55(3) of the COMESA Treaty. These regulations were promulgated in 2004 and also provided for a COMESA Competition Commission. This commission was formally established in 2008 but only became effective and operational in 2013. As we discuss later, there are a number of current problems and practical challenges with the implementation of these COMESA Competition Regulations. This COMESA competition law purports to be binding on member states. Indeed, the COMESA regime itself is an example – perhaps the foremost African example apart from the AEC itself – of a regional regime that understands itself in a legalised manner (Gathii, 2011:16).
Still, this formal legal position is not the end of the matter. There are different strengths to the binding nature of supranational laws over national law. Indeed, there is a whole spectrum and a broad range of

81
c o m p e t i t i o n p o L i c y f o r t h e t r i p a r t i t e f r e e t r a d e a r e a
legal strengths available here for legal interpretation. In approaching the TFTA negotiations, it may be more important to focus on several points regarding the interaction of national and supranational laws apart from the binding nature of these treaties. Two factors are particularly key: implementing institutions/regional courts and the range/flexibility of the objectives pursued.
Arguably, the existence and capacity of implementing institutions and regional courts is a more significant factor than the binding nature of the supranational law in this policy area. On this line of reasoning, one needs to examine the supranational secretariats and also the court institutions associated with the three Regional Economic Communities (RECs) at issue. Furthermore, the range and flexibility of objectives pursued by the regional regime is arguably a significant factor. The SADC and the EAC regimes are ‘flexible’ rather than legalised in terms of the influential description of the African trade regimes by James Gathii (2011).
There is no supranational institution for SADC to compare with the COMESA Competition Commission. Instead, most SADC members have national competition laws. The two exceptions are Angola and the DRC. The DRC is part of COMESA – so some competition law and policy might be sourced there – and presumably other competition law and policy is sourced from executive authority or other economic regulators rather than a parliamentary statute. As for SADC competition law, we have the SADC Protocol on Trade, which requires member states to implement measures to constrain unfair business practices and foster competition.
In terms of implementing institutions, the SADC has thus far adopted, in September 2009, a Declaration on Regional Cooperation in Competition and Consumer Policies. This derives from and complements the SADC Protocol on Trade. The 2009 declaration requires cooperation between the national competition authorities in the SADC member states. The SADC competition authorities meet annually in the SADC Competition and Consumer Law and Policy Committee (CCOPOLC).
Further, for the SADC, there is currently no regional (supranational)

C o m p e t i t i o n a n d R e g u l a t i o n f o R i n C l u s i v e g R o w t h
82
court with authority to interpret the SADC Protocol on Trade. The full story behind the suspension of the SADC Tribunal in 2011 is beyond the scope of this chapter (Alter, Gathii and Helfer, 2015:19–28).
The current suspension of the SADC Tribunal emphasises the character as a flexible rather than legalised regional economic community. Arguably, the drafting and adoption of the Protocol never settled a fundamental political question: ‘Is SADC, like many other regional integration pacts, a supranational entity whose member states have delegated powers to community institutions? Or is it an intergovernmental body whose actions were closely controlled by those states?’ (Alter et al, 2015:20–21) In legal terms, this current status means that the national judiciaries are free to interpret the SADC Protocol on Trade and its commitment to implement measures to constrain unfair business practices and foster competition in different ways.
The SADC situation is different with respect to competition law and policy from that in the two other supranational economic communities – the EAC and COMESA. Four members of the EAC currently have national competition laws and are, additionally, subject to the 2006 EAC Competition Law. Uganda is the exception, not having a national competition law. This overlapping and asymmetrical membership does not itself differ in principle from the SADC situation.
In the EAC, the East African Community Competition Act was promulgated in 2006. It was amended in 2015 to provide for an East African Community Competition Authority (EACCA), with some budget allocated. On 10 November 2016, the EACCA swore in its first five commissioners. This is a significant step towards its commencement of operations. The Authority has a mandate to curb unfair trade practices in the region and protect consumers from substandard goods.
The EAC has a regional court, the East African Court of Justice (EACJ). This regional court was launched in 2001, only two years after the re-establishment of the East African Community itself. The usual temporary seat of the EACJ has been in Arusha, although there have been temporary sittings of the court in other locations in the EAC as

83
c o m p e t i t i o n p o L i c y f o r t h e t r i p a r t i t e f r e e t r a d e a r e a
well (Gathii, 2011:269). Thus far and perhaps somewhat surprisingly, the EACJ has played a more significant role in its political and human rights decisions than in its decisions regarding the cross-border economic affairs of the EAC (Gathii, 2013:249).
In COMESA, the COMESA Competition Commission was launched in 2013. A number of TFTA member states are currently subject to national competition law and to COMESA law: Madagascar, Malawi, Mauritius, Seychelles, Swaziland, Zambia, Zimbabwe, Egypt and Ethiopia, as well as three EAC members, Kenya, Rwanda and Burundi.
In COMESA, there is a regional (supranational) court with authority to interpret the COMESA Treaty. This court has primary authority over national interpretations. As James Gathii states, ‘Article 29(2) of the Treaty for the Establishment of a Common Market for Eastern and Southern Africa (COMESA), gives primacy of the decisions of the COMESA Court of Justice over those of the member countries on questions relating to the interpretation of the treaty’ (Gathii, 2011:16). Despite this formal authority, there are, however, no decisions of the COMESA Court of Justice implementing the Competition Regulations that we are aware of. Indeed, according to a recent study of the COMESA Court of Justice, ‘it has overwhelmingly decided employment disputes between COMESA and its employees’ (Gathii, 2015:2). Indeed, ‘like other sub-regional African courts, it has not decided trade cases… [but unlike other sub-regional African courts] the court has lacked mobilized constituencies such as a regional bar association or NGOs to bring cases before the court, to lobby for court reform to make it more accessible, or to defend it when it gets into trouble with member governments’ (Gathii, 2015:3).
With respect to the overlap of national and supranational laws, in our view it is important to:
1. recognise and accept the degree of overlap between national and supranational regimes;
2. recognise and accept that supranational regimes have a useful role to play in two areas: (a) where there are true gaps in national

C o m p e t i t i o n a n d R e g u l a t i o n f o R i n C l u s i v e g R o w t h
84
regulation (such as no national competition law and/or no national competition authority) and (b) where it is appropriate to have a particular substantive focus on regional competition law enforcement, such as cross-border mergers; and
3. have a coordination mechanism for areas of enforcement overlap, including a mechanism (based on the principle in point 2) to allocate matters to appropriate authorities.
What would this mean in practice? We can look at practical implications in respect of the three substantive competition law and policy areas of abuse of dominance, cartels and merger regulation. Interestingly enough, a recent global survey of free trade agreements notes that ‘provisions relating to anticompetitive mergers are significantly less frequent in FTAs than provisions covering cartels or abuses of power’ (Laprévote, Frisch and Can, 2015:19).
With respect to merger regulation, a combination of turnover thresholds and requirements for nexus to countries can approximate the distinction between national and cross-border markets. A turnover threshold for mergers is important, but if employed on its own, would still miss the rationale for regional bodies. This phenomenon can be seen in the current practice of the EAC, where a large part of the rationale is the inclusion of Kenya and Tanzania. In addition to attention to turnover thresholds, a scorecard or a nexus requirement would be more effective and tailored, to appropriately link a merger and its competition issues to the regional framework.
The above discussion is relevant to the question of whether to adopt a ‘binding commitment’ or a ‘best endeavour’ approach when it comes to competition policy within the TFTA. This choice generally depends on factors such as the level of development of member countries; the level of institutional maturity; and the kind of enforcement model adopted. In our view, in general, where a regional competition law with a corresponding supranational agency exist, it makes sense to have binding commitments to competition policy. The supranational agency should be in a position to monitor compliance. In instances where
85
c o m p e t i t i o n p o L i c y f o r t h e t r i p a r t i t e f r e e t r a d e a r e a
member states all have competition laws and institutions that are more or less at the same level of maturity, binding commitments are favoured. Also, if competition policy is regarded as very important, with clear enforcement regimes, member states would be willing to enter into binding commitments.
There are several advantages of binding commitments:
• They can compensate for inertia at the domestic level, where there is no will or effort to implement competition law. However, in order for binding commitments to be effective, there must be sanctions for deviation from the rules, as well as a dispute-resolution mechanism.
• For developing countries, binding commitments may portray to the outside world commitment by member states to principles of fair play, thereby attracting investment.
• Binding commitments can be a catalyst for economic reform. For instance, when the Seychelles undertook economic reforms in the mid-2000s, following years of central planning, which led to a macro-economic crisis, it adopted competition policy as part of the economic reform process.
There are also some disadvantages to binding commitments.
• Binding commitments require a lot of time, effort and resources to negotiate and conclude. It is not easy to change or amend these rules.
• Binding commitments are also seen as a threat to national sovereignty.
• Binding commitments depend on a high probability of compliance, meaning that there is little use in having binding commitments on paper, yet member states have no capacity to comply.
As an alternative to binding commitments, best endeavours have the

C o m p e t i t i o n a n d R e g u l a t i o n f o R i n C l u s i v e g R o w t h
86
advantage that they are easy to negotiate, thus implying lower bureaucratic transaction costs than binding commitments. Further, for developing countries with little resources to monitor compliance, a best endeavour approach might be a preferred stop-gap measure. Binding commitment necessitate institutions that require huge capital outlays and operational costs to set up. Less developed countries might view this as a luxury in terms of priority compared with other pressing needs. Best endeavours also works when there are differences between national policies and levels of development.
Disadvantages also come with best endeavours: the reliance on the good will of members makes the best endeavour approach highly uncertain; Best endeavours may also be used as a means to resist change by countries that want to maintain their positions.
To some degree, the choice is not a stark one. As noted earlier, there are numerous gradations of binding commitments. Likewise, a best endeavours approach can itself be useful in moving towards a binding commitment.
Finally, we note an issue that may become relevant in the negotiation of the TFTA. This is the overlap between the EAC and COMESA, at the levels of law, the implementing authority and regional tribunal. At the moment, there are two overlapping supranational competition laws – the EAC Competition Law of 2006 and the COMESA Competition. Counting the EACCA as operational (in view of the recent swearing in of commissioners), there are likewise two implementing authorities – the COMESA Commission and the EAC Competition Authority. There are two apparently overlapping regional courts – the East African Court of Justice and the COMESA Tribunal.
SOME POTENTIAL FTA PROVISIONS FOR THE TFTA
This section draws on international experience and benchmarking against other FTAs to discuss potential provisions on the objectives of competition laws, as well as their scope. It further discusses some potential provisions relevant to institutional arrangements at the national level. In the same vein, it finally discusses some other matters, arguably important

87
c o m p e t i t i o n p o L i c y f o r t h e t r i p a r t i t e f r e e t r a d e a r e a
for those negotiating the TFTA to consider, including – confidentiality provisions, procedural fairness in competition law enforcement, private rights of action and dispute settlement.
FTAs and the objectives of policy and laws
Most national competition systems have an explicit list of the objectives these systems pursue. For instance, the objectives of the South African competition system are:
• to promote the efficiency, adaptability and development of the economy; to provide consumers with competitive prices and product choices;
• to promote employment and advance the social and economic welfare of South Africans;
• to expand opportunities for South African participation in world markets and recognise the role of foreign competition in the Republic;
• to ensure that small- and medium-sized enterprises have an equitable opportunity to participate in the economy;
• to promote a greater spread of ownership, in particular to increase the ownership stakes of historically disadvantaged persons;
• to detect and address conditions in the market for any particular goods or services, or any behaviour within such a market, that tends to impede, restrict or distort competition in connection with the supply or acquisition of those goods or services within the Republic; and
• to provide for consistent application of common standards and policies affecting competition within all markets and sectors of the economy.
To take these objectives as examples, it would appear that all of them could be included in the TFTA. Some, however, such as the last objective of redressing historical disadvantage, might be understood as pursued and enforced primarily at the national level.

C o m p e t i t i o n a n d R e g u l a t i o n f o R i n C l u s i v e g R o w t h
88
An important additional objective of TFTA competition law and policy – not currently explicitly included in the objectives of the South African competition law – must be to address the need for regional competition law and policy enforcement. There is significant cross-border conduct, including that of cartels, which should be the focus of regional enforcement of competition law and policy (Bosiu, 2017). There are also anticompetitive effects of cross-border mergers and the abuse of dominance that can, and should be, addressed through the TFTA. Perhaps less clear, but also significant, is the importance of the regionalisation of the public interest objective (discussed later).
As noted, the South African competition framework focuses on competition law specifically defined but has a close and direct relation to consumer welfare, even though a separate regulator enforces the South African consumer laws (Banda, Robb and Roberts, 2015) This expansive interpretation of the scope of the Competition Commission may also be noted in the SADC, where both competition (narrowly understood) and consumer welfare are within the mandate of the CCOPOLC. Other competition authorities (such as that of Kenya) in the TFTA also have a mandate including enforcement of consumer legislation, as well as competition legislation.
The question of regionalising public interest objectives may be an important one to explore. The public interest objectives included in the South African legislation are: (1) a particular industrial sector or region; (2) employment; (3) the ability of small businesses, or firms controlled or owned by historically disadvantaged persons, to become competitive; and (4) the ability of national industries to compete in international markets. Similar factors are, for instance, contained in the Kenyan competition law.
FTAs and the scope of and exemptions from policy and laws
In terms of the scope of the policy and laws, a relevant issue to address here is the coverage or exemption of the economic activity of state-owned corporations. Globally, FTAs often take one of two positions on this question, very broadly speaking. The first is inspired by NAFTA and

89
c o m p e t i t i o n p o L i c y f o r t h e t r i p a r t i t e f r e e t r a d e a r e a
is underpinned by a recognition of the regulatory role played by agencies other than competition authorities. The second is inspired by the European Union and is underpinned by the more dominant role played within the Union by competition authorities (Laprévote et al, 2015). In both approaches, the economic activity of state-owned corporations is covered. The difference between the two positions is whether (and with how much detail) a principle of competitive neutrality between state-owned enterprises and other enterprises is articulated (as in the NAFTA style) or not or only left implicit by the fact of coverage (as in the EU style). The TPP has adopted the NAFTA style of articulating the principle of competitive neutrality and elaborating on it further.
FTA provisions regarding institutional arrangements at national level
It is not the norm to have detailed provisions in FTAs regarding the institutional arrangements for enforcing competition laws. Nonetheless, as Laprevorte et al (2015) note, there are some FTAs that do take this route:
A number of FTAs to which the US (and to a lesser extent the EU) is party contain provisions regarding the institutional design of the parties’ competition regimes. Such provisions are mostly concerned with ensuring that the parties maintain an authority entrusted with enforcing competition laws. However, only very few such agreements require that these government agencies be independent or adequately funded (Laprévote et al, 2015:10).
It is appropriate to recognise the different levels of development of competition policy, laws and institutions in the member states of the TFTA. There are eight countries with no law and 12 countries with no institutions. This institutional context arguably impacts on procedural fairness and on the reasonable expectations of the TFTA agreement in competition-related provisions. Further, for those countries with competition-specific laws and competition-specific institutions, it is appropriate to recognise that the local context influences the content of policy and law and the nature of institutions.

C o m p e t i t i o n a n d R e g u l a t i o n f o R i n C l u s i v e g R o w t h
90
It may be that member countries without national competition laws will have good reasons of budget, regulatory governance and institutional design, or competition law and policy, to continue without a national competition law. This raises the possibility of a gap-filling supranational competition law. Such a law might be a model competition law. On this route, a relatively high-level model of competition law, as well as one with a relatively narrow assertion of concurrent jurisdiction, should be considered in order to integrate such a regional gap-filling law within a variety of national legal regimes.
The current institutional arrangements of South Africa and the other TFTA members are obviously relevant here. South Africa has developed three independent competition regulatory authorities to implement its competition system. The first is the Competition Commission with a single member executive, called the Commissioner. The second is the Competition Tribunal with both legal and economic experts as decision-making members of the Tribunal. However, many other SADC authorities do not have a separate quasi-judicial adjudicative body. Instead, they utilise a board structure for decision-making. The third authority is the Competition Appeal Court (CAC). This body has appellate authority over decisions of the Competition Tribunal. The decisions of the CAC can be appealed to the Constitutional Court and do not need to pass through the Supreme Court of Appeal, a route that was opened up by a recent South African parliamentary legislative amendment.
FTAs and confidentiality provisions
The matter of appropriate confidentiality provisions should be an important topic for the TFTA agreement negotiations. This issue is linked to that of competition enforcement principles, discussed earlier. Many global FTAs do include exchange of information provisions. These provisions require competition authorities to exchange information under certain circumstances These exchange of information requirements are typically limited to non-confidential and/or public information, or apply only to the extent permitted by the parties’ respective domestic laws (Laprévote et al, 2015:11).

91
c o m p e t i t i o n p o L i c y f o r t h e t r i p a r t i t e f r e e t r a d e a r e a
These provisions are important for at least two reasons. First, confidentiality provisions are significant for cross-border competition law enforcement. It is in the interests of more effective cross-border competition enforcement to maintain strict confidentiality. Indeed, such levels are arguably necessary to engender the minimum levels of trust needed among national competition authorities and to encourage sharing of actionable information. Second, the confidentiality provisions will protect the rights of TFTA nationals and firms outside their national borders.
FTAs and procedural fairness in competition law enforcement
Several other matters also potentially included at the level of detailed provisions arise when considering the appropriate level of, and provisions for, procedural fairness in competition law enforcement. Generally, the different levels of development of competition policy, laws and institutions in the member states of the TFTA impact on procedural fairness and on the reasonable expectations of the TFTA agreement in competition-related provisions.
Most global FTAs make general provision for respecting procedural fairness in competition law enforcement. This is usually done either as part of a general guarantee for all trade-related matters or, more exceptionally, in relation to specific competition-related provisions of such FTAs. As Laprévote et al noted, a limited number of NAFTA-inspired FTAs go even further in defining due process standards for enforcing competition laws (Laprévote et al, 2015:10).
One choice here, at the level of principle, is between a relatively high-level commitment to procedural fairness or to put in place detailed provisions on these matters. This principle arguably also includes whether to make provision for private rights of action, for instance, for a person to seek redress in another court or independent tribunal. Another matter is that of dispute settlement, apart from the dispute settlement of the court/tribunal of the supranational economic community. Most FTAs provide that the competition chapter will not be subject to the dispute settlement mechanisms of the agreement.

C o m p e t i t i o n a n d R e g u l a t i o n f o R i n C l u s i v e g R o w t h
92
CONCLUSION
This chapter has addressed one small part of the existing research agenda for development in Africa’s economic regions, including the region envisaged in the TFTA agreement. Understanding the place of competition laws and policies in the construction and operation of the region is, it has been argued, significant. Together with the other laws and policies directly promoting trade, investment, innovation and economic development, actions by the member states of the TFTA in the field of competition law and policy have the potential to improve the well-being of the populations governed by the TFTA.
NOTES
1 The assistance of the Competition Commission of South Africa is gratefully acknowledged. This chapter does not, however, represent any views of the commission nor its negotiating assumptions or positions.2 The Treaty Establishing the African Economic Community (came into force on 12 May 1994).3 Algeria, Libya, Mauritania, Morocco and Tunisia.4 Benin, Burkina Faso, Central African Republic, Chad, the Comoros, Côte d’Ivoire, Djibouti, Egypt, Eritrea, the Gambia, Ghana, Guinea-Bissau, Libya, Mali, Mauritania, Morocco, Niger, Nigeria, Senegal, Sierra Leone, Somalia, the Sudan, Togo and Tunisia.5 Burundi, Comoros, Democratic Republic of Congo, Djibouti, Egypt, Eritrea, Ethiopia, Kenya, Libya, Madagascar, Malawi, Mauritius, Rwanda, Seychelles, Sudan, Swaziland, Uganda, Zambia and Zimbabwe6 Burundi, Kenya, Rwanda, Uganda and Tanzania7 Gabon, Cameroon, the Central African Republic. Chad, Congo Brazzaville and Equatorial Guinea, Burundi, the Democratic Republic of Congo, Angola, São Tomé and Príncipe.8 Benin, Burkina Faso, Cabo Verde, Côte d’Ivoire, The Gambia, Ghana, Guinea, Guinea Bissau, Liberia, Mali, Niger, Nigeria, Senegal, Sierra Leone and Togo.9 Djibouti, Eritrea, Ethiopia, Kenya, Somalia, South Sudan, Sudan, and Uganda.

93
c o m p e t i t i o n p o L i c y f o r t h e t r i p a r t i t e f r e e t r a d e a r e a
10 Angola, Botswana, Democratic Republic of Congo, Lesotho, Madagascar, Malawi, Mauritius, Mozambique, Namibia, South Africa, Swaziland, Tanzania, Zambia and Zimbabwe.11 The 26 member countries of the TFTA are: Angola, Botswana, Burundi, Comoros, Democratic Republic of Congo, Djibouti, Ethiopia, Eritrea, Egypt, Kenya, Lesotho, Libya, Madagascar, Malawi, Mauritius, Mozambique, Namibia, Rwanda, Seychelles, South Africa, Swaziland, Sudan, Tanzania, Uganda, Zambia and Zimbabwe.
REFERENCES
Agnosteva D (2015) International cartels and bilateral trade: An empirical investigation. Available at: www.etsg.org/ETSG2015/Papers/017.pdf [Accessed 10 December 2018].
Alter, KJ, Gathii, JT and Helfer, LR (2015) Backlash against international courts in west, east and southern Africa: Causes and consequences, SSRN Scholarly Paper, Social Science Research Network, Rochester. Available at: http://papers.ssrn.com/abstract=2591837 [Accessed 10 December 2018].
Banda, F, Robb, G and Roberts, S (2015) Review Paper Two: The links between competition policy, regulatory policy, and trade and industrial policies, CCRED Working Paper 5/2015. Available at: http://static1.square space.com/static/52246331e4b0a46e5f1b8ce5/t/55b87b47e4b09cfa0b9 da1a9/1438153543353/CCRED+Working+Paper+5_2015_BTE+ Review+Paper+2+BandaRobbRoberts.pdf [Accessed 20 December 2017].
Bosiu, T (2017) Cartels in SA with possible regional impact, CCRED Quarterly Competition Review, 3, December: 8–12.
Breinlich, H, Nocke, V and Schutz, N (2012) Cross border price effects of mergers and acquisitions: A quantitative framework for competition policy. Available at: https://www.aeaweb.org/conference/2013/retrieve.php?pdfid=474 [Accessed 10 December 2018].
Clarke, JL and Evenett, SJ (2003) The deterrent effects of national anti-cartel laws: Evidence from the international vitamins cartel, The Antitrust Bulletin, Fall: 689–726. Available at: www.alexandria.unisg.ch/22205/1/publishedversion.pdf [Accessed 10 December 2018].
COMESA Regional Investment Agency (COMESA RIA) (2019) COMESA. Available at: http://www.comesaria.org/site/en/comesa.55.html [Accessed

C o m p e t i t i o n a n d R e g u l a t i o n f o R i n C l u s i v e g R o w t h
94
9 June 2019].Crawford, J and Fiorentino, RV (2005) The changing landscape of regional trade
agreements, WTO Discussion Paper No. 8. Available at: www.wto.org/english/res_e/booksp_e/discussion_papers8_e.pdf [Accessed 10 December 2018].
Dutz, MA and Hayri, A (2000) Does more intense competition lead to higher growth?, Policy Research Working Paper 2320, The World Bank, Washington, DC. Available at: http://documents.worldbank.org/curated/en/ 419001468739337795/pdf/multi-page.pdf [Accessed 10 December 2018].
Fox, EM and Healey, D (2014) When the state harms competition: The role for competition law, Antitrust Law Journal, 79(3): 769. Available at: http://awa2015-concurrences.nursit.com/IMG/pdf/at_journal_79i3_fox_healy.authcheckdam.pdf [Accessed 10 December 2018].
Fundira, T (2016) Towards a continental free trade area: Analysis of the status of the regional trade regimes, Working Paper No. S16WP08/2016, Trade Law Centre. Available at: http://www.tralac.org/images/docs/9330/s16wp082016-fundira-towards-a-cfta-analysis-of-the-status-of-the-regional-trade-regimes-20160323-fin.pdf [Accessed 10 December 2018].
Gathii, JT (2011) African Regional Trade Agreements as Legal Regimes. Cambridge: Cambridge University Press.
Gathii, JT (2013) Mission creep or a search for relevance: The East African Court of Justice’s human rights strategy, Duke Journal of Comparative and International Law, 24: 249.
Gathii, JT (2015) Sub-regional court or employment tribunal? The legacy and legitimacy of the COMESA Court of Justice, SSRN Scholarly Paper, Social Science Research Network, Rochester, NY. Available at: http://papers.ssrn.com/abstract=2611362 [Accessed 10 December 2018].
Gwaindepi, C, Musara, M and Dhoro, NL (2014) Relationship between international trade and economic growth: A co-integration analysis for Zimbabwe, Mediterranean Journal of Social Sciences, 5(20): 621–627. Available at: www.mcser.org/journal/index.php/mjss/article/download/3773/3698 [Accessed 10 December 2018].
Ismail, F (2016) The changing global trade architecture: Implications for Africa’s integration and development, The Commonwealth, Hot Trade Topics, 131. Available at: http://www.tips.org.za/research-archive/trade-and-industry/

95
c o m p e t i t i o n p o L i c y f o r t h e t r i p a r t i t e f r e e t r a d e a r e a
item/3144-the-changing-global-trade-architecture-implications-for-africa-s-integration-and-development [Accessed 10 December 2018].
Jacobsberg, I and Shahim, C (2013) South Africa: Cross-border mergers and competition regulations. Available at: http://www.mondaq.com/ southafr ica/x/276206/M+A+Pr ivate%20equity/CrossBorder+ Mergers+And+Competition+Regulations [Accessed 10 December 2018].
Kwok, T (2015) Export cartels: Analysing the gap in international competition law and trade, Edinburgh Student Law Review, 2(4): 140.
Laprévote, F-C, Frisch, S and Can, B (2015) Competition Policy within the Context of Free Trade Agreements. Geneva: International Centre for Trade and Sustainable Development (ICTSD). Available at: http://e15initiative.org/wp-content/uploads/2015/07/E15-Competition-Laprévote-Frisch-Can-FINAL.pdf [Accessed 10 December 2018].
Larson, DA (1970) An economic analysis of the Webb-Pomerene Act, The Journal of Law and Economics, 13(2): 461–500.
Levenstein, M and Suslow, V (2004) Contemporary international cartels and developing countries: Economic effects and implications for competition policy, Antitrust Law Journal, 3. Available at: https://pdfs.semanticscholar.org/6e08/8e38f36a5f2acd7e0a978e1a54cae257c153.pdf [Accessed 10 December 2018].
Levenstein, MC and Suslow, VY (2008) International cartels, Issues in Competition Law and Policy, 2: 1107.
Marinov, E (2015) Economic determinants of regional integration in developing countries, International Journal of Business and Management, Vol III(3): 24–25.
Martyniszyn, M (2012) Export cartels: Is it legal to target your neighbour? An analysis in light of recent case law, Journal of International Economic Law, 15(1): 181–222. Available at: http://pure.qub.ac.uk/portal/files/13701517/SSRN_id2012838_1.pdf [Accessed 10 December 2018].
OECD (2003) Issues for trade and competition in the global context, Journal of Competition Law and Policy, 5(3). Available at: http://www.keepeek.com/Digital-Asset-Management/oecd/governance/issues-for-trade-and-competition-in-the-global-context_clp-v5-art10-en#page3 [Accessed 10 December 2018].
OECD (2014) Meeting of the OECD Council at Ministerial Level, Paris, 6–7 May. International Co-operation in Competition Law Enforcement. C/

C o m p e t i t i o n a n d R e g u l a t i o n f o R i n C l u s i v e g R o w t h
96
MIN(2014)17. Available at: https://www.oecd.org/mcm/C-MIN(2014)17-ENG.pdf [Accessed 10 December 2018].
Southern African Development Community (SADC) 2015 COMESA-EAC-SADC Tripartite Free Trade Area launched, 15 June. Available at: https://www.sadc.int/news-events/news/comesa-eac-sadc-tripartite-free-trade-area-launched/ [Accessed 9 June 2019].
Trademark (2015) Africa regional trade increases, 5 March. Available at: www.trademarkea.com/news/africa-regional-trade-increases/ [Accessed 10 December 2018].
UNCTAD (2003) Can developing countries benefit from WTO negotiations on binding disciplines for hard-core cartels? New York and Geneva: United Nations. Available at: https://unctad.org/en/docs/ditcclp20033_en.pdf [Accessed 10 December 2018].
United Nations Conference on Trade and Development (UNCTAD) (2012) Cross-border anticompetitive practices: The challenges for developing countries and economies in transition. Available at: https://unctad.org/meetings/en/SessionalDocuments/ciclpd16_en.pdf
United Nations Economic Commission for Africa (UNECA) (1995) Report on regional strategy for rational location of industries in the context of the Abuja Treaty, 1995. Available at: http://repository.uneca.org/bitstream/handle/10855/3000/Bib-24781.pdf?sequence=3 [Accessed 10 December 2018].
United Nations Economic Commission for Africa (UNECA) (2015) Committee on regional cooperation and integration, Ninth session, Addis Ababa, 7–9 September. Available at: www.uneca.org/sites/default/files/uploaded-documents/ RITD/2015/CRCI-Oct2015/intra-african_trade_and_africa_regional _integration_index.pdf [Accessed 10 December 2018].
Van den Bossche, P and Zdouc, W (2013) The Law and Policy of the World Trade Organisation. Cambridge: Cambridge University Press.
Vilakazi, T, Simbanegavi, W and Roberts, S (2017) Competition, regional integration and inclusive growth in Africa: A research agenda. In J Klaaren, S Roberts and I Valodia (eds) Competition Law and Economic Regulation: Addressing market power in southern Africa. Johannesburg: Wits University Press. Available at: http://oapen.org/search?identifier=634572 [Accessed 10 December 2018].

97
c o m p e t i t i o n p o L i c y f o r t h e t r i p a r t i t e f r e e t r a d e a r e a
Whalley, J (1998) Why do countries seek regional trade agreements? In JA Frankel (ed), The Regionalisation of the World Economy. Chicago, IL: University of Chicago Press.
WTO (2015) Regional trade agreements and the multilateral trading system. Discussion Paper for the G20, September. Available at: www.g20.org/English/Documents/PastPresidency/201512/P020151225739769777672.pdf [Accessed 10 December 2017].
WTO (2016) Regional trade agreements: Facts and figures. Available at: www.wto.org/english/tratop_e/region_e/regfac_e.htm [Accessed 10 June 2017].

C o m p e t i t i o n a n d R e g u l a t i o n f o R i n C l u s i v e g R o w t h
98
APPENDIX
Region Regional economic community bloc
Member countires/states
Africa EAC Burundi, Kenya, Rwanda, Tanzania, Uganda, South Sudan
COMESA Djibouti, Eritrea, Ethiopia, Egypt, Libya, Sudan, Comoros, Madagascar, Mauritius, Seychelles, Burundi, Kenya, Malawi, Rwanda, Uganda, Swaziland, Zambia, Zimbabwe, Democratic Republic of the Congo
SADC Angola, Botswana, Democratic Republic of the Congo, Lesotho, Madagascar, Malawi, Mauritius, Mozambique, Namibia, Seychelles, South Africa, Swaziland, Tanzania, Zambia, Zimbabwe
ECOWAS Benin, Burkina Faso, Cape Verde, Gambia, Ghana, Guinea, Guinea-Bissau, Ivory Coast, Liberia, Mali, Niger, Nigeria, Senegal, Sierra Leone, Togo
ECCAS Angola, Burundi, Cameroon, Central African Republic, Republic of the Congo, Democratic Republic of the Congo, Equatorial Guinea, Gabon, São Tomé et Príncipe, Chad
European Union and Eastern Europe
European Union
Burundi, Kenya, Rwanda, Tanzania, Uganda, South Sudan
European Free Trade Association (EFTA)
Djibouti, Eritrea, Ethiopia, Egypt, Libya, Sudan, Comoros, Madagascar, Mauritius, Seychelles, Burundi, Kenya, Malawi, Rwanda, Uganda, Swaziland, Zambia, Zimbabwe, Democratic Republic of the Congo
Central European Free Trade Agreement (CEFTA)
Angola, Botswana, Democratic Republic of Congo, Lesotho, Madagascar, Malawi, Mauritius, Mozambique, Namibia, Seychelles, South Africa, Swaziland, Tanzania, Zambia, Zimbabwe

99
c o m p e t i t i o n p o L i c y f o r t h e t r i p a r t i t e f r e e t r a d e a r e a
Region Regional economic community bloc
Member countires/states
Europe-Asia
Eurasian Economic Union (EEU)
Republic of Armenia, the Republic of Belarus, the Republic of Kazakhstan, the Kyrgyz Republic, the Russian Federation
Asia Association of Southern Asian Nations (ASEAN)
Brunei, Cambodia, Indonesia, Laos, Malaysia, Myanmar, the Philippines, Singapore, Thailand, Vietnam
SAARC Afghanistan, Bangladesh, Bhutan, India, Maldives, Nepal, Pakistan, Sri Lanka
The Caribbean
Caribbean Community (CORICOM)
Antigua and Barbuda, Bahamas, Barbados, Belize, Dominica, Grenada, Guyana, Haiti, Jamaica, Montserrat, Saint Lucia, St Kitts and Nevis, St Vincent and The Grenadines, Suriname, Trinidad and Tobago, Associate members: Anguilla, Bermuda, British Virgin Island, Cayman Islands, Turks and Caicos Islands
Central, North and South America
Central American Common Market (CIAS/SICA/CACM)
Belize, Costa Rica, El Salvador, Guatemala, Honduras, Nicaragua, Panama, Dominican Republic
Pacific Alliance
Chile, Colombia, Mexico, Peru
MERCOSUR Argentina, Brazil, Paraguay, Uruguay, Venezuela
Andean Community (CAN)
Bogota, Lima, Guayaquil, Santa Cruz de la Sierra

C o m p e t i t i o n a n d R e g u l a t i o n f o R i n C l u s i v e g R o w t h
100
Region Regional economic community bloc
Member countires/states
Central, North and South America
Union of South American Nations (USAN)
Argentina, Bolivia, Brazil, Chile, Colombia, Ecuador, Guyana, Paraguay, Peru, Suriname, Uruguay, Venezuela
NAFTA Canada, Mexico, United States
Oceania PIF Australia, Cook Island, Fiji, Kiribati, Marshall Islands, Micronesia, Nauru, New Zealand, Niue, Palau, Papua New Guinea, Samoa, Solomon Islands, Tonga, Tuvalu, Vanuatu
Middle East
Arab League (AL)
Algeria, Bahrain, Comoros, Djibouti, Iraq, Jordan, Kuwait, Lebanon, Libya, Morocco, Oman, Palestine, Qatar, Saudi Arabia, Sudan, Syria, Tunisia, United Arab Emirates, Yemen
Cooperation Council for the Arab States of the Gulf (GCC)
Bahrain, Kuwait, Oman, Qatar, Saudi Arabia, United Arab Emirates

101
f i g h t i n g a n t i c o m p e t i t i v e p r a c t i c e s i n t h e s u g a r i n d u s t r y
3
Fighting anticompetitive practices in the sugar industry
Angella Kachipapa
INTRODUCTION
This chapter presents a case study on interventions made by the Competition and Fair Trading Commission (CFTC) in fighting the anticompetitive practices in the sugar industry in Malawi. Sugar is an essential food commodity for domestic household needs and forms an integral part of people’s diet. Sugar also has an economic importance as it contributes to national income worldwide. There is a clear need to ensure competitiveness in the sugar supply chain.
The CFTC conducted investigations and engaged in various advocacy programmes to promote effective competition in the market. Among other things, the CFTC aggressively engaged the Ministry of Industry and Trade on the need to review the sugar distribution system in the country. This advocacy programme was instituted following complaints received from the business community on the anticompetitive nature of the warehouse management system used by Illovo Sugar (Pty) Ltd (hereafter Illovo).
In August 2012, the CFTC received and filed a complaint from a representative of the Karonga Business Association. Karonga is a district situated in the northern region of Malawi, some 600 kilometres from the capital Lilongwe. The complaint alleged that Illovo had granted a sole dealership in sugar distribution to Simama General Dealers (hereafter

C o m p e t i t i o n a n d R e g u l a t i o n f o R i n C l u s i v e g R o w t h
102
Simama), which included sugar transportation from Dwangwa, handling at the warehouse in Karonga, wholesaling and retailing. It was further alleged that the arrangement had granted Simama control over the whole sugar distribution chain in Karonga and neighbouring districts, thereby creating a monopoly in the sugar distribution and affecting access and the wholesale prices of sugar in the district. The complaint also alleged that Simama and its affiliated enterprises had been using their control of the distribution system to prevent other enterprises from buying sugar directly from Illovo by, among other things, delaying the loading of sugar onto competitors’ trucks at the Illovo warehouse. This was allegedly done to force wholesalers to buy from Simama shops at a price that was higher than the ex-factory price but lower than the price charged by other distributors. This arrangement resulted in frequent sugar shortages but also increased the costs associated with acquiring the product.
On 13 September 2012, a similar complaint was filed with the Ministry of Industry and Trade on the same factual issues related to the distribution system of sugar in the same district. After being referred to the CFTC, the two complaints were handled together. Concerned that the allegations, if proved true, would adversely affect competition in the sugar distribution system in the relevant market, the CFTC decided to launch full investigations.
After providing an overview of the sugar industry and the competition regulatory framework in Malawi, this chapter recounts how the CFTC launched investigations against Simama for alleged monopolisation of sugar distribution. Investigations revealed that Simama had excessive control over sugar stocks and prevented other wholesalers and retailers from buying sugar directly from Illovo. The wholesalers and retailers were forced to buy sugar from Simama at a price higher than Illovo’s depot price. The CFTC faulted the Warehousing and Stock Management Agreement, which gave Simama total control of the sugar distribution chain in Karonga and surrounding districts, and led to manipulation of sugar availability. Ultimately this drove up the price of sugar in Karonga and surrounding areas.

103
f i g h t i n g a n t i c o m p e t i t i v e p r a c t i c e s i n t h e s u g a r i n d u s t r y
The arrangements are an interesting example of the importance of vertical arrangements in distribution. Dominant firms can shape markets through requirements that they impose on logistics, storage, wholesale and retail, which have wider implications for competition and participation at these levels. This chapter explains the evaluation made by the CFTC and the changes that resulted. Illovo was ordered to reform its sugar distribution system. In the new system, the role of warehouse managers has been limited to warehousing. Transportation of sugar is under a separate arrangement, which has allowed entry of new players into the sugar distribution chain.
BACKGROUND TO THE SUGAR INDUSTRY IN MALAWI
Malawi is predominantly agricultural and exports agricultural commodities to most neighbouring and international countries. Sugar was identified as one of the priority export commodities in the 2013–2018 Malawi National Export Strategy (NES). It is the second largest foreign exchange earner after tobacco and is a prioritised export for diversification and value addition in the NES. Most of the sugar produced in Malawi is sold on the domestic market and the remaining approximately 40 per cent is exported as raw sugar for refining or direct consumption.
Figure 3.1: Quantity of exported Malawi tea, sugar, tobacco and cotton from 2009–2012
Source: National Statistical Office (2012)
Qua
ntity
in ‘0
00 to
nnes
Export Quantity by Commodity300
2009 2010 2011Year
Tea
Cotton
Sugar
Tobacco
2012
250
200
150
100
50
0

C o m p e t i t i o n a n d R e g u l a t i o n f o R i n C l u s i v e g R o w t h
104
Overall, the population in Malawi consumes sugar in high quantities. Figure 3.2 depicts the human consumption of sugar against the population growth rate.
As a way to protect the market, the government imposed restrictions on the importation of sugar. At the time, there was only one sugar producing company in the country, Illovo Sugar (Malawi) Limited so these restrictions gave Illovo monopoly powers in the sugar industry. Illovo is a multinational company involved in sugar production and distribution and is listed on the Malawi Stock Exchange. Apart from Malawi, Illovo has operations in six other countries, namely Mauritius, Mozambique, South Africa, Swaziland, Tanzania and Zambia.
In Malawi, Illovo produces sugar from the Nchalo Sugar Estate in Chikwawa district, located some 80 kilometres south of the commercial city of Blantyre, and the Dwangwa Sugar Estate in Nkhotakota district, located some 306 kilometres north of the capital Lilongwe on the Northern Lake Shore in the mid-central region (Illovo Sugar Malawi Limited, 2015). According to Illovo, over half of the sugar produced is sold into the local direct consumption market and the local industrial market through the company’s chain of distribution centres situated throughout Malawi; another 30 per cent is sold into markets in the European Union (EU) and the United States of America, and the remainder is sold into regional African markets such as Kenya and Zimbabwe. Both of the Illovo factory operations produce molasses, a by-product of the sugar manufacturing process, which is currently sold as a fermentation raw material to fuel alcohol distilleries, namely the Ethanol Company (ETHCO) and Press Cane Limited, for the manufacture of ethanol.
Illovo’s headquarters are in Limbe, in the city of Blantyre, from where it coordinates its sugar production, distribution and export. Illovo has a network of distributor depots that sell sugar at factory prices throughout the country. There are five distribution centres, namely Limbe, Balaka, Lilongwe, Mzuzu and Karonga. The company pays for the transportation of sugar from the estates to all the depots and, in this regard, ensures a national or depot-delivered price of sugar across the country. The Karonga distribution centre is managed by Simama.

105
f i g h t i n g a n t i c o m p e t i t i v e p r a c t i c e s i n t h e s u g a r i n d u s t r y
Figure 3.2: Human domestic consumption of sugar in Malawi and population growth rate, 2005–2014
Source: Index Mundi and FAO (2015)
While the production and manufacturing of sugar is highly monopolised, there is competition in sugarcane farming and in the distribution of the final product all the way to the consumer and to the export market. However, as already alluded to, Illovo coordinates all these activities and is involved in most of these stages.
As of 2016, the sugar industry has impending new entrants. According to various media research reports, there are two smaller sugar mills under construction, one in Salima (central region) and the other in Nkhata Bay (northern region). However, at the time of writing, these were yet to start producing sugar and competing with Illovo.
MALAWI’S LEGAL AND REGULATORY FRAMEWORK FOR COMPETITON
The restrictions imposed by government on the importation of sugar when there was a single sugar producer in the country, created a monopoly situation. However, there are a number of players involved in the supply, distribution, wholesaling and retailing of sugar across the country. Owing to the economic importance of the commodity to

C o m p e t i t i o n a n d R e g u l a t i o n f o R i n C l u s i v e g R o w t h
106
Figure 3.3. Map of Malawi with the sugar production and distribution centres
Source: Illovo Annual Report (2015)
107
f i g h t i n g a n t i c o m p e t i t i v e p r a c t i c e s i n t h e s u g a r i n d u s t r y
the national income and its desirability within households, promoting access to the commodity for all generates efficiencies in the national economy. Furthermore, policy support through the National Adaptation Strategy (NAS) aims to enhance the competitiveness of the sugar sector by increasing sugarcane production and improving efficiency in both field and factory operations.
Malawi’s competition policy of 1997 is committed to lowering barriers to market entry, reducing restrictive business practices and protecting the consumer (Government of Malawi, 1997). In line with this, the Competition and Fair Trading Act, passed by Parliament in 1998, plays the role of regulating, monitoring, controlling and preventing acts or behaviours that are likely to adversely affect competition and fair trading in Malawi. The Act is intended to encourage competition by prohibiting anticompetitive trade practices; to establish the Competition and Fair Trading Commission to regulate and monitor monopolies and concentrations of economic power; to protect consumer welfare; to strengthen the efficiency of the production and distribution of goods and services; to secure the best possible conditions for the freedom of trade; to facilitate the expansion of the base of entrepreneurship and to provide for matters incidental thereto or connected therewith.1
Sub-section 32(1) of the Competition and Fair Trading Act states that:
Any category of agreements, decisions, and concerted practices2 which are likely to result in prevention, restriction or distortion of competition to an appreciable extent in Malawi or in any substantial part of it are declared anti-competitive trade practices and are hereby prohibited.
Sub-section 32(2) of the Act enumerates specific conduct that enterprises should refrain from engaging in. Specifically, the sub-section states that:
Subject to the provisions of sub-section (1), enterprises shall refrain from the following acts or behaviour if they limit access to

C o m p e t i t i o n a n d R e g u l a t i o n f o R i n C l u s i v e g R o w t h
108
markets or otherwise unduly restrain competition, or have or are likely to have adverse effect on trade or the economy in general— (a) predatory behaviour towards competitors including the use of cost pricing to damage, hinder or eliminate competition;...(e)imposing restrictions where or to whom or in what form or quantity goods supplied or other goods may be sold or exported.
Section 41 regulates abuse of market power. The sub-section 41(1) states that:
Any person that has dominant position of market power shall not use that power for purpose of— (a) Eliminating or damaging a competitor in that or any other market;(b) Preventing the entry of a person into that or any other market; or(c) Deterring or preventing any person from engaging in competitive conduct in that or any other market.
Section 43 prohibits enterprises from engaging in unfair trade practices. Specifically, sub-section 43(1)(g) states that:
Any person shall not, in relation to a consumer… engage inunconscionable conduct in carrying out trade in goods and services.
OBJECTIVES OF THE CFTC INTERVENTION
Following a legal review of the complaints, the CFTC decided to launch investigations into the alleged conduct to eliminate such conduct and to promote effective competition in the sugar industry. Specifically, the investigations were undertaken to: ensure adequate supply and accessibility of sugar; promote competition in order to allow effective entry into the sugar distribution market; increase efficiency and effectiveness in the relevant market; and increase awareness and uptake of competition principles by the Ministry of the Ministry and Trade and other public

109
f i g h t i n g a n t i c o m p e t i t i v e p r a c t i c e s i n t h e s u g a r i n d u s t r y
institutions, plus all the stakeholders in the sugar industry.To achieve these objectives, the CFTC brought a case against the
sugar manufacturing company, Illovo, and the distributor in question, Simama. It conducted investigations through correspondence, face-to-face interviews and desk research. Illovo and Simama were asked to respond to the allegations levelled against them by the business community in Karonga.3
To achieve positive and tangible results, the CFTC also employed an advocacy strategy through face-to-face engagement in meetings which brought together government officials, Illovo and other stakeholders. Through this initiative, the concerned parties plus other stakeholders were sensitised to the benefits of promoting competition in the relevant market. The CFTC also initiated advocacy with the relevant stakeholders in this industry such as the Ministry of Industry and Trade, as the sector regulator; Illovo as the sole manufacturer of sugar in Malawi; the distribution companies across the country and many other stakeholders and consumers.
The CFTC interviewed employees of both Simama and Illovo stationed at the sugar distribution centre in Karonga, as well as sugar wholesalers in Karonga. Further, the CFTC visited the sugar distribution centre in Lilongwe to check the system used to regulate the movement of sugar from the warehouse and record-keeping.4
FINDINGS AND ANALYSIS
In its response to the allegations, Illovo submitted that they had opened distribution centres in Lilongwe, Balaka, Limbe, Mzuzu and Karonga, and rented warehouses and hired companies (warehouse administrators) to manage the warehouses and transport sugar from the factory. It was further reported that selling is done through the Limbe office after liaison with their employees stationed at the distribution centres (distribution centre supervisors). The sugar at the distribution centres was sold at the ex-factory price in this arrangement; warehouse administrators were not allowed to sell sugar from the Illovo distribution centre but were allowed to buy and sell sugar at any place of their choice just like any other buyer.
It was emphasised that Simama is not allowed to sell sugar from

C o m p e t i t i o n a n d R e g u l a t i o n f o R i n C l u s i v e g R o w t h
110
the warehouse or to make any profit from the relationship, other than through rental, handling fees and transport payments. Illovo submitted that the arrangement was not an exclusive dealership or a dealership of any kind. In so doing, Illovo refuted all allegations on blocking or restricting other buyers from purchasing from Illovo or that they were undercutting. All in all, Illovo concluded that they were not in violation of the Competition and Fair Trading Act since Simama was not their agent but a mere warehouse administrator.
Simama submitted that it did not distribute sugar on behalf of Illovo. The company bought sugar from Illovo at the same price as everyone else and sold it to retailers through its wholesale outlets. Simama also submitted that they used their vehicles to transport the sugar they bought from Illovo. They observed that those making the allegations could be motivated by jealousy.
The information gathered by the CFTC showed that Illovo entered into agreements with companies/business persons to provide warehousing for sugar and to manage the warehouses. Under this arrangement, the warehouse administrators (as they are called) do not own the sugar kept in their warehouses, neither are they supposed to sell the sugar on behalf of Illovo. The sugar was being sold by Illovo through a system that involved buyers depositing money into an Illovo bank account and, upon verification of the deposit, the Illovo head office would issue a ‘loading authority’ (LA), which allowed buyers to collect sugar from the distribution centre of their choice. The buyers could also buy directly from Illovo mills in Nchalo and Dwangwa but at the same ex-factory price.
In addition to managing the warehouse, warehouse administrators were also responsible for transporting the sugar from Illovo mills to the warehouses. This was done to ensure that the sugar is not deviated as warehouse administrators were responsible for any loss of sugar along the way, as well as in the warehouse. This arrangement was governed by a contract (Warehouse Management and Stock Handling Agreement) between Illovo and the respective warehouse administrators. The agreement set out terms and conditions of engagement between the

111
f i g h t i n g a n t i c o m p e t i t i v e p r a c t i c e s i n t h e s u g a r i n d u s t r y
two parties. Under the terms of the agreement, warehouse administrators were not allowed to sell sugar from the warehouses rented to Illovo, but they were allowed to buy sugar from the warehouse, transport it and sell it from their own outlets off the premises.
The information gathered by the CFTC revealed a number of irregularities, some of which had a bearing on the provisions of the Competition and Fair Trading Act.
The CFTC established that there was an agreement between Illovo and Simama that governed sugar distribution in Karonga.5 The administrators, who signed the agreement with Illovo, were Illovo sugar distributors before the new system was introduced.6 The agreement did not bestow on Simama the status of an agent or dealer for Illovo.7However, it did give Simama control of the sugar from the mill at Dwangwa Sugar Estate until the sugar was dispatched to a buyer at the warehouse. Illovo deployed only one employee stationed at the warehouse; the rest were employed by the warehouse administrator.
The agreement also allowed Simama to buy sugar from Illovo and sell it from their own premises but not from the Illovo rented warehouse. Considering that the warehouse administrators had total control over the movement of sugar from the warehouse, including receiving the loading authority receipts and loading it onto buyers’ trucks, their conduct had significant influence on the decisions of sugar buyers in terms of whether they would buy from Illovo or elsewhere. Given that these buyers were potential customers to anyone who could offer lower prices than the prevailing wholesale prices, there was a great possibility that these warehouse administrators would discourage buyers from purchasing directly from Illovo.
Furthermore, they had the capability to manipulate the system so that it looked unattractive to other wholesalers – in the process establishing themselves as intermediaries between Illovo and other wholesalers. Simama sold sugar in Karonga at a price that was slightly above the ex-factory price but lower than the price charged by other wholesalers.8
In addition, the company allowed those who bought from it to collect sugar from the Illovo warehouses immediately after depositing money

C o m p e t i t i o n a n d R e g u l a t i o n f o R i n C l u s i v e g R o w t h
112
into Simama’s account or that of its affiliated company, under the name Pezani General Dealers, as long as they brought the deposit slips. The company also claimed that it offered credit facilities to some of its customers. This assertion was not corroborated in Karonga.
On the other hand, those who were buying directly from Illovo were not collecting the sugar instantly although the money was deposited directly into Illovo’s account. They had to wait for confirmation and (LA) from Illovo headquarters which, it had been established, took not less than a day. Wholesalers reported that this was a disincentive for them to buy sugar from Illovo. This problem was not unique to Karonga – wholesalers in Lilongwe complained of the same problem.
However, wholesalers in Karonga said that if they tried to buy directly from Illovo, they were openly told by staff at the distribution centre that they could not buy directly from Illovo, but that they could only buy from Simama. Warehouse administrators had a strong motivation to discourage other buyers to source sugar directly from Illovo. Since they were in charge of stock control, they could sell the sugar to other wholesalers before they paid Illovo for it.9 They could, therefore, use the money collected from the buyers to pay Illovo and pocket the difference between their selling price and the Illovo ex-factory price. They could make a profit without investing any capital or incurring handling costs.
(a) Predatory conduct – section 32(2)(a)
The CFTC also established that Illovo was renting another warehouse from Simama in Lilongwe where it was keeping stocks that could not be kept at the warehouse rented from Nationwide.10 This was confirmed by the management of Illovo. The arrangement (the renting of the warehouse) was under the same ‘terms and conditions as per the existing warehouse contract agreement for Karonga Distribution Centre’. This effectively meant that Illovo appointed Simama as another warehouse administrator for Lilongwe for the period 1 December to 31 March 2013. Illovo confirmed that Simama had at times been instructed by Illovo headquarters to sell/dispatch sugar from the warehouse rented from the company.

113
f i g h t i n g a n t i c o m p e t i t i v e p r a c t i c e s i n t h e s u g a r i n d u s t r y
However, Simama used the same warehouse for selling their own sugar and the information gathered by the CFTC showed that Simama had been selling sugar at a price lower than the ex-factory price.11 Simama’s explanation was that the sugar was bought in bulk using its bank overdraft and sometimes the sugar was sold at a price lower than the ex-factory price to attract customers so that the company could service its overdraft. Illovo confirmed that it was possible for those who bought from Illovo to sell at a price lower than the prevailing ex-factory price, particularly when there was a price adjustment. Companies could sell sugar stock at a price lower than the new ex-factory price, despite having bought the stock at the initial price before the adjustment; and sometimes Illovo would allow buyers to buy sugar at the initial price soon after the price adjustment.12
While this assertion may appear plausible, it did not make economic sense. Economically, one could only sell sugar at a price lower than the ex-factory price if one was willing to reduce the quantity of sugar to be bought after current stock finishes. This went beyond the objective of business growth. It was, therefore, possible that the sugar that Simama sold in Lilongwe was obtained under a special arrangement with Illovo. Such an arrangement would include diverting sugar meant for Karonga distribution centre to Simama’s Lilongwe warehouse. Simama’s motivation in this arrangement would be that they would be paid the full cost of transport to Karonga for consignments that were diverted to Lilongwe. Simama was, therefore, in violation of sub-section 32(2)(a) of the Competition and Fair Trading Act.
(b) Exclusive dealing arrangement – section 32(2)(c)
The CFTC examined the Provisions of the Agreement and found that sub-section 14.1.2 requires Simama General Dealers ‘not to use the Warehouse for the sale or purchase of sugar from a source other than Illovo and that so long as this agreement subsists, Simama or its associated companies shall not whether indirectly or directly sell sugar belonging to other suppliers’.13 This clause meant that Simama was barred from selling sugar from the Illovo-rented warehouse. But the CFTC established that

C o m p e t i t i o n a n d R e g u l a t i o n f o R i n C l u s i v e g R o w t h
114
wholesalers who bought sugar from Simama collected the sugar directly from the Illovo warehouse. In this case, Simama ran the business parallel to Illovo. The clause also meant that Simama could not sell sugar from any source other than Illovo. It also meant that Simama could not only sell from the Illovo-rented warehouse but also from Karonga and other parts of the country where it had business outlets. The CFTC established that for all intent and purposes, this was an exclusive dealership arrangement, which was not permitted under section 32(2)(c) of the Competition and Fair Trading Act.
(c) Restrictions on where, or what form/quantity or to whom sales should be made – section 32(2)(e)
The agreement that Illovo and Simama signed did not assign Simama as a sales agent for any specified area since the selling of sugar was done by Illovo. Therefore, the issue of geographical restriction did not apply. However, Illovo required that anyone who wanted to buy sugar through its distribution centres should buy not less than one tonne. Although this was a quantitative restriction, it was a normal business practice for manufacturers to sell to wholesalers in bulk.
(d) Unfair trade practices – section 43(1)(g)
Illovo enjoyed a monopoly in sugar production and distribution, protected by the government’s restrictions on sugar imports. Under the Import Licensing Act, sugar was a controlled commodity that required an import licensing. The government suspended the issuance of import licences for sugar, which meant that Illovo had all the latitude to act as a monopoly. It used its monopolistic powers to allow Simama to become a wholesaler to wholesalers. Since the wholesalers who bought sugar from Simama had to make profits, they were forced to sell to retailers at a higher price than they would have charged had they bought the sugar directly from Illovo.14 Simama had, therefore, brought a price-build-up, which affected consumers. Had Illovo faced effective competition, it would have been concerned about the price consumers would have to pay for its product,15 but since there was no competition, Illovo let

115
f i g h t i n g a n t i c o m p e t i t i v e p r a c t i c e s i n t h e s u g a r i n d u s t r y
Simama reap the middleperson’s margins by allowing it to operate as a wholesaler to wholesalers. Therefore, both Illovo and Simama engaged in unconscionable conduct towards consumers.
(e) Abuse of market power – section 41
The agreement that Simama signed with Illovo gave the company control over sugar distribution in Karonga. The company used this control to block other wholesalers from buying sugar directly from Illovo. Simama was, therefore, in violation of section 41 of the Competition and Fair Trading Act.16
THE DECISION OF THE CFTC
Based on the findings of the investigations, which established that the warehouse management system was anticompetitive, the CFTC issued the following orders to both Illovo and Simama:
(1) Warehouse administrators or their associates should not be allowed to engage in sugar wholesaling or retailing by Illovo; (2) Illovo should suspend its warehouse agreement and design a new agreement which was consistent with the provisions of the Competition and Fair Trading Act. The new agreement was to be notified within 30 days to the CFTC, to give Illovo an opportunity to provide justification to the CFTC why the anticompetitive provisions in the agreement should be operational; (3) Illovo should clearly mark distribution centres with their branding within 30 days; (4) Illovo should ensure they have sufficient physical presence in the distribution centre; (5) Illovo should provide information related to pricing to be published within 30 days, both on sight and in local press to ensure that wholesalers have adequate information to make informed decisions; (6) Illovo should outline procedures on how wholesalers can access sugar. The information should be clearly communicated through various informative ways and not be the sole responsibility of depot agents; within 30 days Illovo should publish the addresses, contacts and physical location of their warehouses; appropriate information should be given that these are Illovo warehouses and not the warehouse operators, within 30 days; (7) Illovo should address the delay

C o m p e t i t i o n a n d R e g u l a t i o n f o R i n C l u s i v e g R o w t h
116
in confirming cash deposits into its account and that loading authority should be expeditious issued to buyers; (8) Simama should stop with immediate effect charging wholesalers a loading fee from the warehouse, since Simama is already paid for the same by Illovo; and (9) Simama General Dealers should be issued with a Cease and Desist Order to stop predatory conduct and abusing its market power.
ADVOCACY INITIATIVES BY THE CFTC
To ensure that the decisions and recommendations of the CFTC were implemented to eliminate anticompetitive practices in the sugar distribution industry, the CFTC had to cooperate with other stakeholders in the sugar industry, particularly those involved in distribution. Through this initiative, the concerned parties, plus other stakeholders, were sensitised to the benefits of promoting competition in the sugar market.
In line with recommendations of the CFTC, Illovo restructured its sugar distribution system to isolate warehouse management from the actual transportation. In the current arrangement, implemented on 1 July 2014, the distributors undertake primary distribution only while warehouses are managed by Illovo. All the distributors (secondary distributors) purchase from the distribution centre and distribute to wholesalers and retailers.
COMPARISONS BETWEEN THE OLD AND NEW SUGAR DISTRIBUTION SYSTEMS17
Warehouse administration at the distribution centre under the old system was outsourced and run by third parties who were sugar traders. This led to dependency on traders who were administering distribution centres. Under the new system, there is in-house management of the distribution centre.
Transport under the old system was determined and controlled by transporters. Under the new system, allocation and schedules are determined and controlled by Illovo.
Sugar prices had previously been standardised and the ex-mill price was enforced to maintain a uniform price through transport subsidy.

117
f i g h t i n g a n t i c o m p e t i t i v e p r a c t i c e s i n t h e s u g a r i n d u s t r y
The transport subsidy has been removed under the new system and cost pricing has been adopted. The two price points introduced are the ex-mill price and the distribution centre price.
In terms of eligibility, access and terms, access to sugar purchase was open to all without any restrictions. The new system has extended this to include accessibility to those without licences. Additionally, trade promotions are available to all.
RESULTS AND EFFECTS
Through this enquiry, many other institutions were made aware of the benefits of competition principles, fulfilling one of the CFTC’s objectives in pursuing this investigation. Other than the concerned parties, government ministries, parastatals, the private sector, civil society and many other stakeholders were made aware of the need to incorporate competition principles in their strategic orientation. In addition to this, there were a number of other benefits to the investigation.
The first benefit is the effective distribution of sugar to all territories in the country. As a result of the CFTC’s advocacy programme, the warehouses (distribution centres) were no longer run by the distributors, but by Illovo itself. As such there is no restriction on the accessibility to sugar. This has ensured the free flow and availability of the product across the country.
The second benefit was the entry of several distribution companies and wholesalers in the secondary distribution of sugar. With these new entrants, there was vigorous competition among secondary distributors. This has resulted in maximising efficiency in the distribution of sugar with the distributors devising innovative ways to minimise their distribution costs. This has increased the accessibility of sugar in the relevant market and reduced the price build-up of sugar.
Third, implementation of the revised distribution system commenced in July 2014 and the CFTC is actively monitoring the market to gain a comprehensive understanding of this change. Market research has indicated that, overall, there is an increase in the accessibility to the product in all parts of the country. Incidences of sugar shortages have

C o m p e t i t i o n a n d R e g u l a t i o n f o R i n C l u s i v e g R o w t h
118
not been reported so far and the CFTC believes that the resolution has been very effective in solving the problem.
In conclusion, the advocated competition has substantially benefited the market because it has improved its efficiency and effectiveness. This is vital for the development of the product market and ensuring sufficient consumer welfare, but also fostering the economic development of the country.
CONCLUSIONS AND RECOMMENDATIONS
Despite market liberalisation, which was endorsed as part of the structural adjustment programmes (SAPs), the sugar market, like many other markets in the country, has not operated on the basis of effective competition. The remedies which the CFTC achieved in this case illustrate the value of opening-up markets in distribution and wholesale to wider participation and greater competitive rivary. The success in sugar highlights the need for the CFTC to address issues in other similar markets to ensure greater competition. There is a need for regular market assessment and monitoring to check these occurrences, which have adverse effects on both consumer welfare and the economy as a whole. There is still a need for the CFTC to undertake competition analysis studies in other sectors of the economy. Sometimes, private companies contravene competition principles due to a lack of awareness. This is exacerbated by the fact that many public institutions that regulate these markets are themselves not compliant with competition requirements, either because they either are not aware of the competition principles or they have their own interests which are deemed more important than competition regulations. Often, the general public also lacks awareness of the competition principles, so there is a need for intensive awareness campaigns to enlighten the public about competition issues and the associated benefits.
NOTES
1 Competition and Fair Trading Act, Cap 48:01 of Laws of Malawi.2 In South Africa, section 2 of the Competition Act of 1998 defines ‘concerted practice’ as ‘co-operative, or co-ordinated conduct between firms, achieved

119
f i g h t i n g a n t i c o m p e t i t i v e p r a c t i c e s i n t h e s u g a r i n d u s t r y
through direct or indirect contact, that replaces their independent action, but which does not amount to an agreement’.3 In the South African case of Competition Commission v Yara (South Africa)
(Pty) Ltd 2013 (6) SA 404 (SCA), it was held that the initiating of a complaint is permissible if informal or even tacit, by way of e-mail. Accordingly, if the conduct occurred in South Africa, the Competition Commission’s method of initiating a complaint would be valid.
4 Following a complaint initiation, in South Africa the Competition Commission would be conferred the requisite power through sections 47 to 49 of the Competition Act, to enter and search premises. Of particular significance is the power conferred through section 49A, to summon witnesses before the commission.5 Section 1 of the Competition Act in South Africa defines ‘vertical relationship’ as a relationship between a firm and its suppliers, its customers or both. The identification of the relationship between parties in an investigation is essential as it prescribes the type of prohibited conduct and the consequences associated with anticompetitive behaviour that is likely to arise from those types of relationships.6 Section 5(1) of the Competition Act in South Africa states that an agreement between parties in a vertical relationship is prohibited if it has the effect of substantially preventing or lessening competition in a market, unless it can be proved that the agreement gives rise to technological efficiency or other procompetitive gains, that outweigh the anticompetitive effect.7 In Federal-Mogul Aftermarket Southern Africa (Pty) Ltd v Competition
Commission and the Minister of Trade and Industry Case No. 33/CAC/ Sep03 (unreported), it was stated that an actual agreement is not required, rather a practice (form of repetitious or habitual conduct of a kind recognised by the interested parties) is sufficient.
8 In Competition Commission v South African Breweries Ltd and Others 2015 (3) SA 329 (CAC) at para 60, it was stated that to trigger the application section 5(1), the conduct must have an effect on price, output and/or quality of the product or service, which has a negative consumer effect. The focus would seem to be on the effect of the conduct. It is evident that while a direct agreement between Illovo and Simama may

C o m p e t i t i o n a n d R e g u l a t i o n f o R i n C l u s i v e g R o w t h
120
not have conferred a formal dealership power on Simama, the effect of their agreement enabled them to acquire the requisite power to exercise sufficient control over the market. Further, while there was no formal agreement between Simama and the wholesalers, there seemed to be an understanding that purchasing through them was the only way to gain access to the product, which had the anticompetitive effects outlined above. These considerations would be relevant in South Africa.
9 Ginsburg, DH (1991) in Vertical Restraints: De Facto Legality Under the Rule of Reason, Antitrust L.J 60(1):67 states that one of the firms in this instance would likely need to have market power to show an anticompetitive effect arising from a vertical agreement. A firm is deemed to be dominant in a market where the firm has a share of 45 per cent or more in a relevant market, as in Competition Commission v South African Airways (Pty) Ltd 18/CR/Mar01 [2005} ZACT 50 (28 July 2005). Illovo evidently had market power and dominance in the sugar industry and the agreement with Simama, empowered Simama to exercise this dominance indirectly.
10 Nationwide is the appointed warehouse manager in the Lilongwe District.11 In South Africa, section 8(d)(iv) of the Competition Act, prohibits dominant firms from selling goods or services below marginal cost or average variable cost, unless it can show pro-efficiency gains. 12 In Competition Commission v Media 24 Ltd CR154Oct11/013938
(unreported) at para 74, the Tribunal, in assessing the rationale behind the prohibition, stated that selling below marginal cost or average variable cost is only a temporary pleasure to consumers; in the long term, the effect is that once a competitor is eliminated from the market (as they would be unable to compete with the low prices offered by the dominant firm), there is a sharp increase in price enabling the predatory firm to recoup their losses. In other words, it is a form of foreclosure, which eliminates a competitor and enables the predatory firm to maintain a monopoly over the market.
13 In South Africa, section 8(d)(i) of the Competition Act prohibits a dominant firm from requiring or inducing a customer not to deal with a competitor. In South African, the specific inclusion of ‘inducement’ as opposed to requiring was dealt with in Competition Commission v South African Airways (Pty) Ltd 18/CR/Mar01 [2005] ZACT 50 (28 July 2005) which

121
f i g h t i n g a n t i c o m p e t i t i v e p r a c t i c e s i n t h e s u g a r i n d u s t r y
captures conduct which does not take the form of an express contractual stipulation, rather incentives are included. The inclusion of ‘inducement’ is commendable as it captures situations where there are hidden restraints on dealing with other firms.
14 Section 5(2) of the Competition Act, outright prohibits the practice of minimum resale price maintenance. In South Africa, the conduct would fall short in this respect, as in Federal-Mogul Aftermarket Southern Africa (Pty) Ltd v Competition Commission and the Minister of Trade and Industry Case No. 33/CAC/Sep03 (unreported) it was stated that from an evidentiary perspective, it is required to show that the reseller or distributor in this sense would have to know the price they were expected to resell at, failing which they would face sanctions. Interestingly enough, the conduct may still be caught under section 8(c), however the conduct above does have the effect of imposing a minimum resale price as the increased selling price would force wholesalers to resell above a certain margin to ensure a profit is made.
15 In South Africa, the conduct could fall within the excessive pricing prohibition as per section 8(a) of the Competition Act; In Mittal Steel South Africa Ltd and Others v Harmony Gold Mining Company Ltd and Another (70/CAC/Apr07) [2009] CACAC 1 (29 May 2009), it was stated that what needed to be proved is that a dominant firm had charged a price that bore no reasonable relationship to the market value of the price. In this instance, the prices charged by Simama were above the factory cost, and a seemingly unjustified middleperson expenditure that bore no reasonable relationship to the market value. In other words, the price they charged had no justification in terms of the services they were providing and had the impact of increasing the price of the product.
16 See note 17. The wholesalers had been given a disincentive to deal with Illovo directly, and would face financial repercussion or sanctions for failing to adhere to this.17 Source: Illovo Sugar Company.
REFERENCES
Competition and Fair Trading Act, Cap 48:01 of Laws of Malawi.Cooperate Citizenship (2014) Illovo Sugar Malawi socio-economic impact
C o m p e t i t i o n a n d R e g u l a t i o n f o R i n C l u s i v e g R o w t h
122
assessment, Internal management report, Corporate Citizenship, United Kingdom.
Food and Agricultural Organisation of the United Nations (FAO) (2015) Analysis of price incentives for sugar in Malawi 2005–2013, Technical Notes Series, Monitoring and Analysing Food and Agricultural Policies, FAO, Rome.
Government of Malawi (1997) Competition Policy for Malawi. Ministry of Commerce and Industry.
Government of Malawi (2012) National Export Strategy, 2013–2018, Volume 1. Ministry of Industry and Trade.
Government of Malawi (2013) Competition and Fair Trading Commission. Available at: http://www.cftc.mw/index.php/2013-12-16-09-56-37/board-decisions-over-cases/anti-competitive-business-conduct/56-anti-competitive-business-practices-by-illovo-sugar-company-and-simama-general-dealers [Accessed 15 December 2018].
Illovo Sugar Malawi Limited (2012) Annual Report 2012. Limbe, Malawi.Illovo Sugar Malawi Limited (2014) Annual Report 2014. Limbe, Malawi.Illovo Sugar Malawi Limited (2015) Annual Report 2015. Limbe, Malawi.National Statistical Office of Malawi (NSO) (2012) Statistical Year Book 2015.
Malawi: NSO.National Statistical Office (NSO) (2012). Zomba (data collected in February
2012).Nyasa Times (2013) Illovo Malawi abolishes sugar distributors’ quotas, 5 June.Pound, B and Phiri, A (2009) Taking Root: Fair trade in Malawi. Chatham, UK:
Natural Resource Institute and University of Greenwich.The Times (2015) Investors being assessed for Salima sugar project, May.

123
r e g i o n a L i n t e g r a t i o n i n s o u t h e r n a f r i c a
4
Regional integration in southern Africa: A platform for electricity
sustainability
Gaylor Montmasson-Clair and Bhavna Deonarain
INTRODUCTION1
A global transition towards sustainable models of growth and development is unfolding as a response to multiple crises of sustainability on economic, social, environmental and governance fronts. Energy systems, which are prerequisites for the smooth functioning of the economic, political and social spheres, underpinning socio-economic development are at the core of this transformation. The energy sector is also a cornerstone of the transition due to its primary role in the existing sustainability issues in many countries, from the reliance on fossil fuels and the lack of access to modern energy to the absence of energy security and the persistence of governance problems (IEA, 2015).
The energy sector in the southern African region follows such dynamics. Numerous initiatives, backed by political commitments, are shifting the region towards sustainable (energy) pathways to leverage the favourable regional endowment in renewable resources (Mutanga and Simelane, 2015). In line with the United Nations Sustainable Development Goal 7, which aims to ensure ‘access to affordable, reliable, sustainable and modern energy for all’ (United Nations, 2015), endeavours are driven primarily by the objective of ensuring energy

C o m p e t i t i o n a n d R e g u l a t i o n f o R i n C l u s i v e g R o w t h
124
access and security for all populations and businesses. This is notably characterised by an increased emphasis on new energy technologies, principally renewable energy-based and gas-based systems (Santley, Schlotterer and Eberhard, 2014; REN21, 2015). Waves of reform in the energy supply industries are also taking place in the region, with the aim of improving the efficiency of energy systems (Eberhard et al, 2011; Promethium Carbon, 2016).
At the regional level, the Southern African Development Community (SADC) has recognised the importance of regional integration as a means to address the current energy issues. This is in line with developments at the continental level and, in its Agenda 2063, the African Union identifying energy as one of the key infrastructure pillars for connecting the continent (African Union, 2015).
This is evident in the various initiatives, plans and strategies deployed in the region (Figure 4.1). After a period of regional energy integration, characterised by bilateral energy trading based on independent neighbours trying to reduce their dependency on apartheid South Africa, the Southern African Power Pool (SAPP) was established in 1995, initiating a new phase structured around the institutionalisation of a regional energy market (Vanheukelom and Bertelsmann-Scott, 2016). Under the auspices of the SADC, 14 electricity companies from 12 southern African countries are gathered under the SAPP (SAPP, 2015).2 The SAPP was founded to establish a network for national electricity generation utilities under the SADC – it provides a common market for electricity through an interconnected power grid between member countries to promote regional energy trade.
Regional energy integration, aimed at supporting energy security through integrated markets and cross-border infrastructure development, has been high on the political agenda since then, relying on cheap, abundant electricity from South Africa. Electricity trade has been viewed as an efficient way to ensure reliable and low-cost energy security, based on mutual benefits for importing and exporting members of the SAPP. Countries have either exported their excess supply of electricity or imported electricity from members, thereby eliminating the cost of

125
r e g i o n a L i n t e g r a t i o n i n s o u t h e r n a f r i c a
Figure 4.1: Timeline of regional cooperation and energy integration in SADC
Source: Authors’ composition, based on REN21 (2015)
investing in local generation capacity (Vanheukelom and Bertelsmann-Scott, 2016).
This process has been supported by the 1996 SADC Protocol on Energy, which promotes the harmonious development of national energy policies and matters of common interest for the balanced and equitable development of energy throughout the region, particularly through data and information exchange (SADC, 1996). Accordingly, the SADC’s Directorate for Infrastructure and Services has a vision to ensure the availability of sufficient, least-cost, environmentally sustainable energy services in the region.
The Regional Infrastructure Development Master Plan (RIDMP) 2012–2027 Energy Sector Plan pursues the access to ‘adequate, reliable, least cost, environmentally sustainable energy’ (SADC, 2012) to promote economic growth and poverty alleviation, while the Regional Energy Access Strategy and Action Plan (REASAP) aims to ‘harness regional energy resources to ensure, through national and regional action, that all the people of the SADC region have access to adequate, reliable,
1992Creation of the Southern
African Development Community (SADC)
2010SADC’s Regional Energy
Access Strategy and Action Plan (REASAP)
was approved
2011Renewable Energy
Strategy and Action Paln (RESAP) is in the consultation phase
1995Establishment of the
Southern African Power Pool (SAPP)
2003Regional Indicative
Strategic Development Plan (RISFP) was adopted
2012Regional Infrastructure
and Development Master Plan (RIDMP) is adopted
1996SADC Protocol
on Energy
2002Creation of the Regional
Electricity Regulators Association (RERA)
2015RISDP is revised and SADC Industrialization Strategy and Road Map is adopted
SADC Centre for Renewable Every and Energy Efficiency
(SACREEE) is approved

C o m p e t i t i o n a n d R e g u l a t i o n f o R i n C l u s i v e g R o w t h
126
least-cost, environmentally sustainable energy services’ (SADC, 2010). The Revised Regional Indicative Strategic Development Plan (RISDP) 2015–2020 further supports the development of ‘sufficient, reliable, and least-cost energy services’ (SADC, 2015), notably through greater cooperation, interconnectedness, power pooling and the connecting of national electricity grids. In addition, the 2015 Industrialisation Strategy and Roadmap 2015–2063 stresses the need to address energy security concerns to underpin the success of the industrialisation strategy.
Most recently, the SADC designed a Renewable Energy and Energy Efficiency Strategy and Action Plan (REEESAP) for the 2016–2030 period, and established the SADC Centre for Renewable Energy and Energy Efficiency (SACREEE), a Windhoek-based regional platform to promote the implementation of the REEESAP (SADC, 2016).
Notwithstanding these political commitments, regional energy integration still appears to be on the back foot. The 2007 electricity crisis in South Africa triggered a new stage for regional energy cooperation with the transition of the regional hegemon from an exporter of low-cost electricity to an importer of power. The recent drought has further put energy security to the test in the region, particularly in countries that rely on hydropower.
This situation has strengthened individualism throughout the region, with the development of numerous new power generation projects in the southern African region (both in South Africa and other countries) (SAPP, 2015) and governments focusing more on national, bilateral or sub-regional interests and initiatives than regional integration. Despite the numerous plans and strategies in place at the SADC level, regional energy integration has progressed at a slow pace, as illustrated by the weak level of interconnection between southern African countries (Mutanga and Simelane, 2015).
The demise of some national utilities, such as Eskom in South Africa, has also led to the emergence of new players in the region’s energy markets through independent power producers (IPPs) and small-scale

127
r e g i o n a L i n t e g r a t i o n i n s o u t h e r n a f r i c a
embedded generators, challenging the market position of state-owned utilities and reshuffling the cards of regional energy integration (Das Nair, Montmasson-Clair and Ryan, 2014; Montmasson-Clair and Ryan, 2014; Mutanga and Simelane, 2015; Vanheukelom and Bertelsmann-Scott, 2016).
Considered together, the sustainability transition, the rise in individualism and the emergence of new players in the sector call for a renewed approach to regional energy integration in the southern African region in support of sustainable energy development and a critical analysis of regional energy dynamics with the aim of improving energy sustainability.
Building on a conceptual framework inspired by the World Energy Council (WEC, 2013) and the International Energy Agency (IEA, 2016), three key dimensions, depicted in Figure 4.2, can be considered to assess energy sustainability in the region:
• energy security, ie, the effective management of energy supply, the reliability of the energy infrastructure and the ability to meet energy demand;
• energy equity, ie, the accessibility and affordability of energy supply across the population; and
• environmental sustainability, ie, the achievement of demand- and supply-side energy efficiencies and the development of energy supply from renewable and low-carbon technologies.
These dimensions speak to a number of factors, from energy availability (adequacy and access), and acceptability (socio-political and environmental, including resource extraction and waste production), to affordability (prices and paying ability) and efficiency (productivity in the use of energy resources) (Narula and Reddy, 2016). While these three dimensions provide a useful framework for assessing energy sustainability, a further dimension must also be considered, namely the governance of energy systems, including institutional capability. An important determinant for the delivery of energy sustainability is whether there is

C o m p e t i t i o n a n d R e g u l a t i o n f o R i n C l u s i v e g R o w t h
128
a robust, transparent and inclusive energy governance system with built in accountability and consequences.
Importantly, these dimensions complement one another and must be achieved altogether to reach energy sustainability. For example, some countries may rely on low-carbon energy sources (such as hydropower) but have (very) low electrification rates and poor resilience levels, which weakens their real performance in terms of electricity security and equity. In addition, improving access through traditional means is likely to put further strain on electricity supply due to increased demand. Relying on large-scale coal-based power generation and centralised grid extension can contribute to security of supply but is incompatible with environmental sustainability and electricity equity principles. Exclusive governance structures can, in turn jeopardise, the sustainability of energy systems altogether.
While traditional approaches tend to oppose them (eg, by framing environmental sustainability against security of supply), in reality, multiple co-benefits exist between the different dimensions of electricity sustainability. Thinking of them in an integrated fashion results in the emergence of innovative solutions. For example, renewable energy technologies, particularly small-scale systems (either grid-tied or off-grid), offer an avenue to achieve electricity security, electricity equity and environmental sustainability at the same time. Such systems provide an opportunity to roll out affordable, fit-for-purpose energy solutions, empowering consumers (to become prosumers)3 based on clean, renewable and socially acceptable energy sources.
This chapter explores the potential to improve southern Africa’s energy sustainability through regional integration, harnessing the emerging opportunities associated with new energy sources and technologies, and energy supply structures. It focuses on the electricity component of the energy picture and, as such, does not discuss issues pertaining to liquid fuels. Acknowledging that the region comprises a diversity of situations, this chapter depicts the heterogeneity of the southern African countries in its analysis.

129
r e g i o n a L i n t e g r a t i o n i n s o u t h e r n a f r i c a
Figure 4.2: The three dimensions of electricity sustainability
Source: Authors’ composition, inspired by WEC (2016) and IEA (2016)
This chapter reviews the performance of the SAPP in terms of electricity sustainability, and then goes on to analyse the role of regional institutions in the electricity sector, before exploring avenues to harness regional integration to improve electricity sustainability in southern Africa.
THE STATE OF PLAY
Electricity sustainability, which is vital to any well-functioning, inclusive, sustainable and modern economy and society, has gained increased

C o m p e t i t i o n a n d R e g u l a t i o n f o R i n C l u s i v e g R o w t h
130
attention at the regional level and progress has been made in a number of areas. Further improvements are, nevertheless, required to achieve electricity sustainability, particularly in dealing with the interplay between electricity security, electricity equity and environmental sustainability.
Electricity security: Matching supply and demand
Southern Africa’s electricity security situation, although diverse, generally looks bleak. The region has been suffering from electricity shortages, with severe implications for economic growth and social development. Over the past decade or so, Botswana, Namibia, South Africa, Tanzania, Zambia and Zimbabwe have had to resort to load shedding as a stop-gap measure to conserve energy (SADC and SARDC, 2016). Many people in these countries still have no access to modern energy services.4 The use of traditional biomass continues to be significant in the region, primarily but not only in rural areas, further accentuating the security of supply challenge.
Looking at the electricity supply–demand balance, as illustrated in Figure 4.3, the supply deficit is evident in many countries, despite the region operating a surplus of 1 507 megawatts (based on 2015/16 data). As a regional group, SAPP member countries had a net capacity of 52 760 megawatts (compared to 61 362 megawatts of installed capacity) for a peak demand (including reserve margins) of 51 253 megawatts. The region has, moreover, displayed a net surplus since 2011/12, with a peak at 3 437 megawatts in 2013/14.
By contrast, at the country level, only Angola and Mozambique display favourable positions, with a net generation capacity comfortably above their demand and reserve requirements. Mozambique’s journey to security of supply, furthermore, centred on the development of the Cahora Bassa hydroelectric dam, further illustrates the possibility to turn fortune around (see IRENA, 2012, and Cuamba et al, 2013, for details on Mozambique’s energy sector). Other countries are either in a precarious situation (such as the Democratic Republic of the Congo [DRC], Malawi, Tanzania and South Africa, although

131
r e g i o n a L i n t e g r a t i o n i n s o u t h e r n a f r i c a
the situation has recently improved for the latter) or experiencing serious supply shortfalls (Botswana, Lesotho, Namibia, Swaziland and Zimbabwe).
Figure 4.3: Installed capacity and net capacity over the peak demand and reserve requirements for SAPP countries from 2006/07 to 2015/16 (in GWh)
Source: Authors’ composition, based on data from SAPP Annual Reports
Note: Reserve margins – required to guarantee system reliability, allow for unexpected surges in the demand for power and allow for plant maintenance – are equivalent to 10.2 per cent of peak demand as per the SADC’s best practices.
Importantly, in a number of cases, the absence of security of supply is not related to the lack of generation capacity, but rather to a maintenance backlog and the poor state of the existing power plants (illustrated in Figure 4.4 by the difference between the installed and net capacities). This condition is neatly demonstrated in the DRC, where generation capacity is mostly inoperative.
This unfavourable supply picture is confirmed by the state of electricity trade in the region (Figure 4.5). Only two countries effectively (ie, continuously) export electricity in the region, namely Mozambique (from the Cahora Bassa hydroelectric power plant) to South Africa, and South Africa to the rest of the region. Some countries, such as Namibia and Zambia, are ad hoc exporters, as they rely on hydropower and

C o m p e t i t i o n a n d R e g u l a t i o n f o R i n C l u s i v e g R o w t h
132
depend on weather conditions. As discussed later, Angola, Malawi and Tanzania do not trade electricity with other SAPP members because they are not yet connected to the regional grid.
Figure 4.4: Ratios of installed capacity and net capacity over the peak demand and reserve requirements for SAPP countries from 2006/07 to 2015/16
Source: Authors’ composition, based on data from SAPP Annual Reports
Note: Reserve margins – required to guarantee system reliability, allow for unexpected surges in the demand for power and allow for plant maintenance – are equivalent to 10.2 per cent of peak demand as per the SADC’s best practices. A ratio of 1 corresponds to an exact match between peak demand (including reserve margins) and generation capacity. Ratios of 2 and 0.5, respectively, indicate that generation capacity amounts to twice and half the peak demand (including reserve margins).
Against this background, the region benefits from tremendous electricity generation potential, notably from renewable energy technologies. The southern African region enjoys a wide array of both renewable and non-renewable energy resources (UNEP and AfDB, 2017). Furthermore, these resources are spread across the region, laying the ground for regional trade.
The region hosts large deposits of coal, gas and uranium. Large reserves of coal can be found in Botswana, Mozambique, South Africa and Zimbabwe, while Mozambique, Namibia, South Africa and Tanzania are developing natural gas fields. Significant reserves of uranium also exist in the region, with mining taking place in

133
r e g i o n a L i n t e g r a t i o n i n s o u t h e r n a f r i c a
Figure 4.5: Net imports and exports from 2003/04 to 2015/16 for SAPP countries (in GWh)
Source: Authors’ composition, based on data from SAPP Annual Reports
Note: the scale differs between the two graphs because of the large amount traded by South Africa compared to other SAPP countries.
Namibia and South Africa, and exploration underway in Botswana and Zimbabwe (IEA, 2014a).
Large low-cost hydroelectric dams, especially the Inga Reservoir in the DRC and the Kariba Dam on the Zambia–Zimbabwe border, have the potential to generate up to 150 gigawatts of electricity, against the current 12 gigawatts of installed capacity. According to Karhammar (2014), the SADC has the potential to generate 1 080 terrawatt hours per year of electricity from hydroelectric dams, however, only 31 terrawatt

C o m p e t i t i o n a n d R e g u l a t i o n f o R i n C l u s i v e g R o w t h
134
hours per year is being used. With new renewable technologies, the SADC region benefits from
outstanding solar irradiation (2 500 hours of sunshine a year), translating into a generation capacity potential of 20 000 terrawatt hours annually. The potential for wind-based generation is mostly constrained to the coastal regions, but meaningful too, reaching around 800 terrawatt hours per year. Last but not least, geothermal energy (about 4 000 megawatts) can be harnessed in the countries along the Rift Valley (Tanzania, Malawi, Mozambique and Zimbabwe) (UNEP, 2012; Miketa and Merven, 2013).
Although power generation projects are underway in all member states aimed at seizing existing opportunities (totalling 30 646 megawatts for the 2017–2022 period, including 48 per cent in South Africa), this large electricity generation potential remains mostly untapped. The International Renewable Energy Agency (IRENA) estimates that only about 1 per cent of the solar and wind potential of the region has been captured so far (Miketa and Merven, 2013). Unfortunately, as discussed in later, southern African countries are adopting a national (or bilateral) rather than a regional approach to electricity security (Madakufamba, 2010). Such a stance is likely to further exacerbate the regional generation surplus while not preventing some countries from experiencing shortages.
Electricity equity: Achieving affordable access to modern electricity
The performance of the SAPP in achieving electricity equity in the region, despite some notable progress in the last two decades, remains problematic. The SAPP is the worst performing African regional power pool – only 24 per cent of residents have access to electricity, against 36 per cent in the East African Power Pool and 44 per cent in the West African Power Pool (IEA, 2014b).
Although this disappointing picture is dominated mainly by the DRC and Tanzania (which, respectively, account for 35 per cent and 21 per cent of the regional population without access to electricity),

135
r e g i o n a L i n t e g r a t i o n i n s o u t h e r n a f r i c a
this is reflected in the individual performance of most southern African countries. Indeed, Figure 4.6 shows that, despite some overall progress over the last two decades in terms of electrification, electricity access remains very limited in most countries.
Figure 4.6: Access to electricity in SAPP countries (in percentage of population) from 1992 to 2016
Source: Authors’ composition, based on data from World Bank
Furthermore, a clear divide exists between rural and urban areas. Only 5 per cent of the region’s rural residents have access to electricity in the SAPP coverage area (Figure 4.7). About 45 per cent of energy consumption in SADC countries arises from the use of solid fuel (that is, traditional biomass such as charcoal and wood) (SADC and SARDC, 2016) and the divide between the urban and rural populations is evident, except in countries where the use of solid fuels is widespread throughout the population (the DRC, Malawi, Mozambique, Tanzania, and Zambia to some extent) (Figure 4.8). The large use of traditional biomass is a key indicator of the lack of access to modern energy services, notably electricity. Only South Africa shows a favourable situation, thanks to an ambitious electrification programme rolled out since democracy in 1994. Electrification improved from around 50 per cent in 1994 to close to 90 per cent at the end of 2016, as a result of the

C o m p e t i t i o n a n d R e g u l a t i o n f o R i n C l u s i v e g R o w t h
136
government-led Integrated National Electrification Programme (INEP), which provides both grid and non-grid connections, as well as the Free Basic Electricity (FBE) policy, which provides households connected to the national grid with 50 kilowatt hours of free electricity a month (Madakufamba, 2010; Wilkinson, 2015; DoE, 2016; Le Cordeur, 2017; Montmasson-Clair, 2017).
Electricity equity is further hampered by tariffs considered to be both too low to stimulate investment and too high for most of the population (RERA, 2016). While tariffs may be higher than the average cost of generation (see Figure 4.9), additional costs, such as those relating to losses, transmission and distribution, can add US $60–100 per megawatt hours to the total cost of electricity supply. Furthermore, only Namibia and Tanzania have achieved cost-reflectivity (Creamer, 2015) and most countries are embarking on utility-scale, centralised investment programmes, therefore paving the way for further increases in other countries.
Figure 4.7: Access to electricity in SAPP countries (in percentage of rural population) from 1990 to 2012
Source: Authors’ composition, based on data from World Bank
However, electricity deficits in southern Africa, coupled with un-affordable tariffs for the poor, continue to reinforce (energy) poverty.

137
r e g i o n a L i n t e g r a t i o n i n s o u t h e r n a f r i c a
Insufficient and/or inadequate access to modern energy services limits inclusive growth. As such, without universal and affordable access to modern electricity, SADC’s socio-economic development targets are virtually unattainable.
Centralised electricity systems in southern Africa have been essentially designed to cater for the needs of industrial conglomerates and high-income groups (Scott, 2015). All SAPP countries continue to struggle with low electrification rates and/or widespread energy poverty. While a number of social tariffs and free electricity schemes target the poorest households in most countries, this situation is extremely problematic, all the more so given that electricity tariffs are already unaffordable to large groups of the population (SADC and SARDC, 2016).
Figure 4.8: Use of solid fuels in SAPP countries in 2013 (in percentage of population)
Source: Authors’ composition, based on data from the IEA
Despite a degree of progressive cost subsidisation between industrial users and the poorest consumers in the case of South Africa, the

C o m p e t i t i o n a n d R e g u l a t i o n f o R i n C l u s i v e g R o w t h
138
most vulnerable households continue to pay the highest tariffs and have access to the least advanced infrastructure. By contrast, energy-intensive users can benefit from special pricing agreements, like the aluminium-smelting company, South32 (previously BHP Billiton), in South Africa and Mozambique (TIPS, 2013). The repressiveness of this unbalanced situation, structured on centralised and vertically integrated systems, has undermined the sustainability of the region’s economic growth and energy systems, and hampered the emergence of more sustainable alternatives.
Figure 4.9: Grid electricity prices by end-use sector in selected countries in 2013
Source: IEA, 2014b
Note: The average cost of generation in southern Africa stood at US $55 per megawatt hour in 2013, materially lower than in other African regions. Electricity prices are in most countries substantially higher than the cost of generation, particularly for residential customers.
As discussed later, the introduction of renewable energy technologies, particularly small-scale systems, offers an opportunity to break this

139
r e g i o n a L i n t e g r a t i o n i n s o u t h e r n a f r i c a
deadlock through new, cost-effective and sustainable solutions to electricity security and electricity equity.
Environmental sustainability: Ensuring resilience and efficiency
The electricity sustainability performance of the region is further weakened by the poor environmental sustainability of the electricity supply industries. While the region hosts electricity systems of various sizes, structures and qualities, the lack of diversity of energy sources leads to a poor resilience. As displayed in figures 4.10 and 4.11, the region virtually relies on only two sources of electricity, namely hydropower and coal.
Countries can be divided into three groups: coal-based countries (South Africa and Botswana), hydro-based countries (Mozambique, Malawi, Angola, Lesotho, the DRC, Namibia, Zambia and Swaziland), and countries relying on a mix of hydropower and coal (Tanzania and Zimbabwe). Although other technologies are slowly emerging (gas is growing fast and solar and wind technologies are rising), they remain too small to meaningfully diversify electricity supply and improve the resilience of electricity systems at this stage. New generation projects, such as new coal-based power stations in South Africa (primarily Kusile and Medupi) and Botswana (Morupule B), are expected to entrench the current picture in coal-based countries (Eskom, NDa; Eskom, NDb; World Bank, 2017). Similarly, several projects – on the Congo (DRC), Zambezi (Zambia–Zimbabwe), Kwanza (Angola) and Ruhuhu (Tanzania) rivers – will further enhance the domination of hydropower in other countries (Miketa and Merven, 2013).
Resilience is primarily a challenge for hydropower-based countries, as illustrated by the electricity shortages triggered by the drought in 2015–2016. In the long run, the region is likely to suffer from the effects of climate change and the stronger El Niño-induced weather conditions, which have seen dam levels in most countries dropping (IEA, 2016). Zambia’s experience illustrates the erratic nature of hydroelectric power in the region. Zambia’s large hydropower initiatives supply 99 per cent of the country’s electricity. Despite the scope of resources available in

C o m p e t i t i o n a n d R e g u l a t i o n f o R i n C l u s i v e g R o w t h
140
the country, energy security has been a recent challenge, as the country continues to grapple with electricity deficits, arising from dwindling water reserves due to the recurring drought across the African continent (Miketa and Merven, 2013; Mills, 2016).
Figure 4.10: Electricity mix in 2016/17 for SAPP producers (in MW)
Source: Authors’ composition, based on data from SAPP Annual Reports
Note: For readability, South Africa’s generation capacity, which reaches 46 963 MW, including 35 721 MW from coal-fired power plants, is not fully displayed in the graph.
Resilience can, however, also be a challenge for coal-based countries. While originating from multiple causes, South Africa’s recent load-shedding crises (in 2008–2009 but also in 2014–2015) were, for example, exacerbated by poor coal-stock management (Das Nair et al, 2014).
By contrast, the reliance of the region on hydropower brings important benefits for electricity sustainability. While the socio-environmental drawbacks of large hydropower systems (such as population displacement) must be acknowledged, the low-carbon nature

141
r e g i o n a L i n t e g r a t i o n i n s o u t h e r n a f r i c a
of the water-based schemes results in most southern African countries displaying a relatively low carbon intensity (Figure 4.12). South Africa is a notable exception in this respect due to the country’s essentially coal-based electricity system.
Figure 4.11: Electricity mix in SAPP countries in 2016/17 (in percentage of total)
Source: Authors’ composition, based on data from SAPP Annual Reports
Note: Both charts must be considered independently due to the overwhelming domination of South Africa, which accounts for more than three-quarters of the region’s total generation capacity.
The low-carbon feature of the region, however, masks the deep energy inefficiency of the southern African economies, which largely perform worse than global benchmarks (Figure 4.13). A high degree of diversity, both in carbon and energy intensity,5 must, nevertheless, be noted in the region due to the differences in electricity mixes, levels of economic development and industrial structures.
The potential for energy efficiency improvement in the region therefore remains significant. A 2012 estimate by Eskom identified an energy demand savings potential in South Africa alone of 12 933 megawatts (IDC, 2013). This is significantly more than what has been achieved and is ambitioned throughout the region. According to the SAPP Secretariat, demand-side management measures in the region

C o m p e t i t i o n a n d R e g u l a t i o n f o R i n C l u s i v e g R o w t h
142
already achieved savings of 4 561 megawatts from 2009 to September 2015, including 3 461 megawatts from compact fluorescent lamp (CFL) and light-emitting diode (LED) programmes and 700 megawatts from commercial lighting energy savings. Still far from the regional potential, these savings are expected to gradually increase to about 7 000 megawatts by 2020, notably thanks to the phase out of incandescent light bulbs (effective since 31 December 2017) and improved energy efficiency in industrial and residential sectors (SADC and SARDC, 2016).
Figure 4.12: Carbon intensity per country in 2013 (in kgCO2e per 2011 PPP US $ of GDP)
Source: Authors’ composition, based on data from the World Bank
The poor state of transmission and distribution networks in the region further aggravates the inefficiency of the electricity systems (Economic Consulting Associates, 2009). While poor data on the issue make it difficult to paint a true picture of the quality of the electricity wires in the region, SAPP data, shown in Figure 4.14, provide a general idea of the situation, with several countries experiencing high transmission losses (Angola, the DRC and Lesotho, for example) and deteriorating performance.6
Low incomeWorldHigh incomeUpper middle incomeLower middle income
Countries

143
r e g i o n a L i n t e g r a t i o n i n s o u t h e r n a f r i c a
Figure 4.13: Energy intensity per country (in MJ per 2011 PPP US $ of GDP)
Source: Authors’ composition, based on data from the World Bank
Preliminary conclusions: Bringing it together
Southern African countries have historically performed poorly in terms of electricity sustainability due to strong energy supply concerns, limited access to modern energy and the lack of diversity of electricity supply. Based on the WEC (2016), which ranks countries in terms of energy sustainability (that is, not just electricity but also liquid fuels), South Africa, SAPP’s best-ranking country, stands at the 84th position (out of 125 countries ranked by the WEC). Botswana and Swaziland rank 94th and 95th, respectively, while Zimbabwe, the DRC and Malawi close the table at the 113th, 117th and 120th, respectively. The general poor performance of the region must not, however, mask regional disparities, as SADC member countries are at different developmental stages, partly explaining the variation in ranking and scores, and pockets of strong performance.
Importantly, while some countries display a relatively strong performance on one of the metrics (that is, electricity security, electricity equity or environmental sustainability), their situation is undermined by their weak performance in other dimensions. No country in the region
Low incomeWorldHigh incomeUpper middle incomeLower middle income
Countries

C o m p e t i t i o n a n d R e g u l a t i o n f o R i n C l u s i v e g R o w t h
144
Figure 4.14: Transmission losses from 2009/10 to 2015/16 for SAPP countries (in percentage of total)
Source: Authors’ composition, based on data from SAPP Annual Reports
manages to leverage the co-benefits existing between the three areas and perform well on all dimensions. As raised in the introduction, the dimensions of electricity sustainability are complementarity in nature and have the potential to reinforce one another. The challenge is not to find ways to make the three core dimensions compatible but to implement the right policies (and inclusive governance) to harness the co-benefits between them.
The region benefits from huge natural (renewable) resources, which are largely untapped. Maximising the potential of regional resources (particularly through renewable energy technologies) would lead to increased regional trade, cost savings and a substantial improvement in electricity sustainability.
Based on modelling from Miketa and Merven (2013), the SADC’s identified renewable energy potential can assist the region to achieve universal access to modern electricity while reducing costs in the long term. The share of renewable energy technologies, excluding large hydropower, in electricity production in the region could increase from the current level of 10 per cent to as high as 46 per cent by 2030. This is confirmed by a 2009 SAPP Regional Generation and Transmission Expansion Plan study (Nexant, 2009), which indicated possible cost

145
r e g i o n a L i n t e g r a t i o n i n s o u t h e r n a f r i c a
savings of up to US $48 billion (over a 2006–2025 period) providing countries coordinated better and pursued projects collectively as a region. Seizing this potential requires harnessing the benefits of regional integration in the southern African sub-continent, which is the focus of the next section.
THE ROLE OF REGIONAL INTEGRATION: STATUS QUO AND THE WAY FORWARD
The need for further progress in achieving electricity sustainability in the SADC region has been highlighted. This section analyses the existing role of regional integration in the electricity sector and explores the main channels through which it can contribute to an improvement in electricity sustainability. Three key areas, namely harmonised policies and regulatory frameworks, adequate common institutions and technical infrastructure and the development of human capabilities, are considered. Importantly, there is no need for new institutions, as regional integration can be driven through enhanced and empowered regional and domestic capacity and institutions.
Harmonising policies, frameworks and regulations
The first area of regional intervention revolves around the development and harmonisation of policies, frameworks and regulations in the energy sector. Energy policy and regulation have been progressing in the region, with 11 out of 12 SAPP countries having a national regulatory body as of April 2017,7 both clarifying and complexifying the legal and regulatory landscape.
The Regional Electricity Regulators Association of Southern Africa (RERA) was launched in 2002 to support the harmonious development of policy and regulatory frameworks in the region.8 The association took an important concrete step towards the harmonisation (ie, compatibility) of national regulatory systems with the development of regulatory guidelines, approved by the SADC Energy Ministers in April 2010 (Sichone, 2015).
The guidelines aim to ensure that efficient cross-border deals are not
C o m p e t i t i o n a n d R e g u l a t i o n f o R i n C l u s i v e g R o w t h
146
constrained by unclear or complicated processes for making regulatory decisions. They focus on large-scale/long-term transactions, which are predominant and more likely to influence investment decisions, the efficiency of electricity interconnections and electricity trade in the region.
The regulatory guidelines seek to:
• clarify how regulators carry out their powers and duties in regulating cross-border electricity transactions to minimise regulatory risks for power investors and electricity consumers;
• promote efficient and sustainable cross-border electricity transactions that are fair to selling and buying entities, are consistent with least-cost sector development, and can help to ensure security of supply; and
• promote transparency, consistency and predictability in regulatory decision-making.
While noteworthy, these guidelines have, however, no formal legal status and remain voluntary. Indeed, the RERA is primarily a forum through which national regulators share their experiences. Moreover, the guidelines are incomplete because they do not cover short-term/small transactions (less than a year and 20 megawatts of power) and the competitive market. As a result, they have had the unintended consequences of perpetuating and further entrenching the domination of long-term, bilateral transactions over the regional market (discussed later).
Indeed, the absence of a clear regulatory framework for decentralised, cross-border transactions renders such operations difficult and unpredictable. Concerns on the physical security of transmission infrastructure and contract security remain high in the region, particularly due to the absence of a regional regulatory framework. Importantly, the current framework is silent on measures to regulate pilferage of power imports meant for another country, leaving electricity importers with no control over the transmission infrastructure in other states through which their own imports pass (SADC and SARDC, 2016).

147
r e g i o n a L i n t e g r a t i o n i n s o u t h e r n a f r i c a
In addition, energy regulation is still nascent in the region and lacks capacity and skills in most countries and at the regional level. Energy policy appears fundamentally inadequate, with long-term planning being largely outdated in time and best practice, and lagging in implementation. Furthermore, regulators lack independence and remain pray to regulatory capture and political pressures.
The SADC has developed numerous regional plans and strategies in the energy space to attempt to remedy the situation, as raised in the introduction. The Regional Strategy for Increasing Energy Access (March 2010), the SADC Regional Energy Access Action Plan, the REEESAP (2016) and also the development of a Climate Change Adaptation Strategy are a few examples.
Common implementation frameworks are, furthermore, being progressively developed. The SAPP Energy Efficiency Framework, finalised in 2014/15, is one example. The framework proposes a tracking mechanism to ensure compliance and standardisation, especially in the measurement and verification of energy savings. It aims to inform how the power pool should roll out its energy efficiency programme, including the roles of the private sector and the energy service companies. It also developed a LED roll-out business case, specific programmes for CFL replacement involving 11 national utilities (SADC, 2016), and supports the development of a virtual power plant (VPP), as it seeks to augment ongoing efforts to increase electricity generation capacity to beat shortages in the region9 (SADC and SARDC, 2016). The Smart Grid Concept Paper, prepared in 2014/15 to assist individual utilities in the migration to smart grids, is another instance.
The implementation of such plans, strategies and frameworks, as illustrated in the case of the SADC strategy and action plan for energy access, remains problematic. The Regional Strategy for Increasing Energy Access was published in March 2010. It aims, at the strategic level, to harness regional energy resources to ensure, through national and regional action, that all the people of the SADC region have access to adequate, reliable, least-cost and environmentally sustainable energy services. At the operational level, the strategy has an objective to ensure that the proportion

C o m p e t i t i o n a n d R e g u l a t i o n f o R i n C l u s i v e g R o w t h
148
of people without such access is halved within 10 years for each end use and halved again in successive five-year periods until there is universal access for all end users. A SADC Regional Energy Access Action Plan was also developed at the same time (2010) to operationalise the strategy. A three-year action plan, with clear strategic objectives, activities (with responsibilities), measurable outputs and expected outcomes was also designed (SADC, 2010). There is, unfortunately, no evidence, as of September 2018, that any of the actions envisaged in the three-year plan have been implemented.
Altogether, the SADC has limited clout to fast-track implementation and ensure adopted initiatives are adequately resourced and funded. In fact, energy policy is not integrated at the regional level in any way. The region’s energy policy is more a collection of national situations than an integrated regional framework. For instance, no electricity planning takes place at the regional level, and policy and regulatory frameworks, including standards and labelling of equipment, are not harmonised.
The Market and Investment Framework for SADC Power Projects (previously known as the SADC IPP Framework), approved in June 2016, is the latest attempt of the regional body to fast-track implementation and introduce a set of harmonised legal and regulatory rules by 2022. This framework formulates ambitious targets, including the rollout of a Target Market Model Design based on unbundled electricity supply industries, the introduction of IPPs along national utilities and the development of a financial framework to develop bankable project structures, secure support from financiers and implement projects. From a legal and regulatory perspective, this framework plans to address numerous bottlenecks by:
• developing a regional licence, through regional coordination in terms of the types and content of licences, and the recognition of licences across borders;
• harmonising rules and standards for metering; • developing a cross-border dispute settlement methodology;• harmonising tariffs, particularly for transmission, and moving
towards cost-reflective tariffs;

149
r e g i o n a L i n t e g r a t i o n i n s o u t h e r n a f r i c a
• managing transmission losses at the regional level; • establishing common grid access rules for connecting to the
networks;• developing regional rules for interconnector congestion
management; • setting up a regional grid code; and • coordinating generation and transmission asset development
planning (Sichone, 2016).
As a response to low tariffs and the lack of investment in the region’s energy sector, the framework has been complemented by the political calls of SADC energy ministers to achieve cost-reflective tariffs by 2013 (initially) and by 2019 (now).
Policy implications
Going forward, the implementation of the regional plans and strategies arises as the priority for the region from a policy and regulatory perspective. The SADC and the SAPP will be instrumental in addressing sovereignty concerns and ensuring that the development of regional regulation is not limited to the lowest common denominators. The ambition of regional integration should be to harmonise frameworks upwards and with a development (rather than private sector) focus. Caution must be raised on forcing a standardised approach on countries facing varied national circumstances. The aim of the Market and Investment Framework for SADC Power Projects to roll out a Target Market Model Design is problematic, as it attempts to mainstream particular market structures and tariffs methodologies in countries, potentially depriving governments of important policy levers.
In fact, even though a regional understanding on the role of the private sector was reached at the operational level in June 2015 (SAPP, 2017), the region displays a variety of situations and approaches with regard to the unbundling of vertically integrated national utilities and the introduction of competition, through IPPs, at the generation level (Eberhard et al, 2011). Harmonisation does not signify one-size-fits-

C o m p e t i t i o n a n d R e g u l a t i o n f o R i n C l u s i v e g R o w t h
150
all solutions. A harmonisation of the regulatory frameworks does not mean that the architecture of the electricity supply industries needs to be identical in every country. While common rules are required for a regional market to operate, the role of market players, such as state-owned enterprises and IPPs as well as tariff structures, can remain different from one country to the other.
While the calls for cost-reflective tariffs is understandable from the perspective of national utilities, which need to be financially sustainable, it is potentially problematic if it is not associated with a dramatic improvement in the performance of such entities and the elaboration of clear plans to mitigate negative impacts on low-income households and businesses. A general push towards small-scale, renewable energy-based systems would, in this respect, provide an elegant avenue to restructure the electricity supply industries in the region, circumvent tariff issues (by turning consumers into prosumers) and shift to sustainable (from an economic, social, environmental and governance perspective) energy solutions.
At the same time, such a situation also calls for reviewing the role and functions of the regional institutions and regulation and, as raised by Muller (2013:2), the ‘challenges of network infrastructure provisions the twenty-first century’. Importantly, the region does not need new or additional institutions, and implementation can be driven by existing entities at the regional and national levels. In fact, the implementation difficulties experienced by previous plans and strategies warrant that the SADC, the SAPP and the RERA play a driving force in the operationalisation of a regional framework and the development of a regional acquis (SADC and SARDC, 2016). The development of a regional electricity plan, which can inform the national planning exercises in the future, is key to the success of regional integration. Similarly, establishing regulatory benchmarks are a prerequisite to any meaningful performance monitoring.
More broadly though, the past and present difficulties in delivering energy sustainability in the region suggest the need to review the forms of governance and regulation in the electricity sector in southern

151
r e g i o n a L i n t e g r a t i o n i n s o u t h e r n a f r i c a
Africa. In the case of South Africa, for example, the regulatory agency’s approach has been overtly inadequate in preventing electricity supply crises and precipitated significant tariff increases at the expense of the economy and society (Muller, 2013; Das Nair et al, 2014). Improved regulatory performance is vital for regional development. This does not, however, reside solely in the realm of regulators. In addition to regulatory entities, capable states (that is, departments, municipalities and state-owned enterprises) and empowered stakeholders are required to ensure efficient and adequate regulation. As such, the region should explore complementing the regulatory agencies with alternative models and approaches. Such options include: retaining or (re)introducing direct regulatory oversight (ideally at the regional level) as part of governmental administrative functions; creating a framework for structure regulatory processes in which stakeholders can participate and actively influence regulatory decisions; and regulating by contract, specifically achieving the benefits of private-sector provision by allowing competitive bidding for the development and operation of new infrastructure, relying on contractual provisions to enforce conditions and protect investors and the state (Muller, 2013).
Another important avenue is the creation of effective linkages between the energy and industrial development frameworks in the region, with the aim of creating regional energy value chains and building local manufacturing and service capabilities. As regional energy integration occurs in the southern African region, a regional strategy to reap industrial development benefits should be designed accordingly. Markets for energy projects, technologies and services are fragmented along national boundaries and the experience of local economies with the development of local industrial capacity (see, for example, Montmasson-Clair and Das Nair (2015), for South Africa’s experience) has shown the difficulty in sustaining industrial development in the sector. The creation of an integrated regional market for energy, rather than fragmented national markets, would enable the emergence of regional firms to manufacture the required energy technologies and service the market.

C o m p e t i t i o n a n d R e g u l a t i o n f o R i n C l u s i v e g R o w t h
152
Further reflection should be done on the possibility of designing a regional (rather than local) content strategy, therefore creating a regional market. SADC countries should consider exploring cumulation10 of local content rules for regional agreements. This would involve counting components sourced from the region as local, and thus allowing imports from the region to feed into the procurement of designated products. The creation of free movement areas for skills and competences among SADC countries would also be important in this respect.
Building common institutions and technical infrastructure
The second avenue for regional integration to assist with achieving electricity sustainability is the development of the technical infrastructure. Notable progress has been made in developing the regional electricity infrastructure since the creation of the SAPP in 1995, from the transmission networks to the trading platforms. Despite its limited role and functions, SAPP is regarded as the most advanced power pool on the African continent in terms of trading structures.
Regional trading was initially confined to bilateral contracts among member utilities, that is, fixed, long-term (generally from one to five years, but possibly longer) cooperative contracts between utilities. SAPP then operated the Short-Term Energy Market (STEM) from 2001 until 2007, when the region (that is, South Africa) ran out of surplus capacity. The STEM market catered for about 5 per cent of SADC’s energy trade. Comprising daily and hourly contracts, mainly covering off-peak periods, the STEM was a precursor to the full competitive electricity market that was successfully developed in the form of the Day-Ahead Market (DAM). The development of the DAM started in 2003 and the market went live in December 2009. Volumes of power traded on the DAM have increased materially over the seven years of existence of the market, and especially in the last biennium, as showed in Figure 4.15, demonstrating the increased maturity of the market. In 2016, SAPP introduced a Forward Physical Market and an Intra-Day Market.11

153
r e g i o n a L i n t e g r a t i o n i n s o u t h e r n a f r i c a
Figure 4.15: Total energy requested, offered and traded on the competitive market from 2009/10 to 2016/17
Source: SAPP (2018)
However, the role of regional trading mechanisms remains limited. Indeed, the quest for regional electricity sustainability in the SADC involves a delicate balance between national and regional interests. Amid acute shortages, countries have favoured the sovereign route of attempting to attain national self-sufficiency, rather than depending on imports from other countries. For example, while the coal-based Mmamabula Power Station project, located in Botswana near the South African border, was initially meant as a regional initiative, Botswana decided, in the face of electricity shortages, to build the project on its own rather than wait for the long process of regional negotiations to take place (Jindal Africa, ND). Initiated by five member states to draw power from the DRC to Angola, Botswana, Namibia and South Africa, the Westcor Power Project is another illustration of the difficulty in building regional initiatives. The project is now moribund due to various factors, including national concerns over security of supply (Mathews, 2017).
Furthermore, when turning to the region, countries tend to favour a bilateral approach, striking long-term supply agreements. As shown in Table 4.1, while the regional, competitive market accounts for an increasing share, long-term bilateral transactions still dominate the market. For example, South Africa’s Eskom and Namibia’s NamPower signed a

C o m p e t i t i o n a n d R e g u l a t i o n f o R i n C l u s i v e g R o w t h
154
five-year electricity sales agreement in March 2017. The unidirectional deal does not have a fixed payment and will depend on the energy consumed, but the agreement should see Eskom supplying NamPower with a firm capacity of 200 megawatts, as well as an additional supply dependent on transmission capacity. NamPower also has power purchase agreements with the Zimbabwe Power Corporation (a subsidiary of the Zimbabwe Electricity Supply Authority) and Zambia’s ZESCO of 80 megawatts and 50 megawatts, respectively. Similarly, Eskom already has long-term agreements in place with the Lesotho Electricity Company and the Swaziland Electricity Company, and it intends to conclude agreements with other SAPP members (Eskom, 2017; Shihepo, 2017).
Table 4.1: Share of electricity traded in the SAPP region according to trading channels
Source: Authors’ composition, based on data from SAPP Annual Reports
Regional trade has also been heavily constrained by the lack of adequate transmission infrastructure. While many more projects are underway and in the pipeline to improve the regional electricity grid (such as the connection of Malawi, Tanzania and Angola to the regional electricity grid by 2021), weak and limited electricity grid infrastructure has, indeed, limited regional integration.
Angola, Malawi and Tanzania are not yet connected to the rest of the region and the allocation of resources is not optimised. Figure 4.21 shows that, with the exception of 2016/17, electricity demand has been much larger than the supply offer on the regional market over the last few years, and highlights the potential for further regional trade, provided there is adequate planning. In addition, a share of possible transactions is not realised as a result of transmission infrastructure constraints. In other
Share of electricity traded
2013/2014 2014/2015 2015/2016 2016/2017
Regionally 1% 6% 14% 11%
Bilaterally 99% 94% 86% 89%

155
r e g i o n a L i n t e g r a t i o n i n s o u t h e r n a f r i c a
words, the maximum possible trade based on price, demand and supply at a given time (matched bids) is larger than the capacity of the network. Such matched but not traded bids can reach more than half of matched bids in the summer months of the Southern Hemisphere.
Policy implications
Going forward, the SADC, through the SAPP notably, should pursue planned cross-border projects, with a focus on connecting Angola, Malawi and Tanzania to the regional grid and enhancing key backbone links. While several projects are underway, the interconnection of the region remains limited and primarily structured around bilateral contracts.
The region should further investigate the role of super-grids, which consist of high-voltage direct current (HVDC) (or even ultra-high-voltage direct current) transmission networks. While HVDC lines are not new (the Cahora Bassa-to-Johannesburg transmission line was built from 1977–1979) (ABB, 2012), the super-grid concept suggests a network of HVDC transmission systems that are strategically designed and implemented to maximise efficiency and tap into the best available (renewable) resources (Hansen, 2016). HVDC lines may be more expensive to construct than high-voltage alternating current lines, but they generate cost savings in the long run due to high system efficiency, such as reduced transmission losses. Lower voltages of transmission or distribution lines, coupled with great distances, lead to high energy losses (RERA, 2016). In addition, super-grids are emerging in China, Brazil and India, opening opportunities for South–South cooperation and capacity building.
Complementing the development of large cross-border infrastructure, the SAPP should also pursue the deepening of the regional market. The limited but growing role of regional mechanisms (compared to bilateral deals) is promising. So far, the SAPP has been able to provide sufficient market-related conditions for regional trade to take place. For example, according to SAPP’s Annual Reports, no market abuse has been recorded over the last few years. The trading system also provides online information to market participants, answering short-term market transparency needs. As the regional market grows and trade rises, stronger,

C o m p e t i t i o n a n d R e g u l a t i o n f o R i n C l u s i v e g R o w t h
156
particularly long-term, surveillance and improved financial security requirement measures (to minimise financial settlement risks) will be important. The need for increased coordination of maintenance and planned outages of generation and transmission equipment (concentrated in summer), resulting in reduced available power being offered on the market and reduced trade volumes, is also evident.
In addition to cross-border transactions, further work is required to support the local rollout of smart and micro-/mini-grids, particularly to support rural electrification. Small-scale, localised power generation technologies (based, for instance, on solar, wind, hydropower and/or biomass systems) are effective solutions for the electrification of areas that are not financially feasible for utility-grid connection, such as rural and remote locations within the SADC (ODI, 2016). The IRENA projected that 14 terrawatt hours of rural electricity could be provided by decentralised electricity systems in the region by 2030 (Miketa and Merven, 2013). For example, Tanzania’s Rural Energy Agency and Rural Energy Fund have identified off-grid, solar-based technologies as a key driver of electrification in the country. Solar energy has, indeed, been prized as an effective measure to combat energy poverty, with off-grid solar-based systems providing electricity to around 15 per cent of the country’s population (Bailey et al., 2012; ODI, 2016; Prinsloo, 2016).
More broadly, rooftop solutions are also adequate for most residential and commercial operations, and crucial empowerment channels for all consumers, providing the ability to become prosumers. The potential for micro-grid systems to promote local economic development and contribute to users’ income should also be investigated. Promoting the ownership and productive uses of off-grid systems, while desirable, does require different public programmes from simple energy provision. Additional, short-term government programmes, such as user training, skills development (notably for operation and maintenance), cooperation schemes and entrepreneurship support are necessary to enhance the reliability and sustainability of the systems (particularly in the long run) and trigger the productive usages of energy access (Feron, 2016). Furthermore, such technologies constitute major manufacturing

157
r e g i o n a L i n t e g r a t i o n i n s o u t h e r n a f r i c a
opportunities for the region (see Montmasson-Clair et al, 2017, for more details on the potential in the South African context), echoing the recommendation made earlier.
The economic sustainability of such systems, particularly for poor rural populations, often requires some public support, at least to cover both the initial investment and the operation and maintenance of the systems or for subsidising private investment in rural electrification (Ngoepe et al, 2016). The SADC, as part of the financial integration leg of the Market and Investment Framework introduced earlier, should look at funding models for embedded generation. Financial schemes, such as Botswana’s Rural Electrification Collective Scheme (simultaneously combining cost recovery mechanisms with pro-poor financial incentives; see Jain, Jain and Dhafana, 2014, and Vyas, 2011, for more information) or South Africa’s framework (INEP, FBE and VAT exemption on paraffin) can be established to assist low-income communities.
In this respect, the SADC needs to play a stronger role in effectively securing funding for energy projects in the region. There is currently limited support for bankable project preparation and a lack of capacity to initiate, implement and manage innovative projects. The SADC could actively drive fundraising for strategic and/or cutting-edge projects, notably by bundling similar small projects together for funding applications. The creation of a regional one-stop shop for potential project developers and investors would also help facilitate investment in the region. Such a clearing house could include the development and maintenance of a database covering all existing funding sources available to the region. The creation of a regional financing mechanism, including a regional fund, would also ease the implementation of multi-country, electricity-related projects in the region.
Fostering the development of human capabilities
The development of regional human capabilities is the third key avenue for regional integration. Given the nascent nature of energy regulation in the region and the rapidly evolving techno-economic environment in the energy space, the presence of well-capacitated and diverse teams

C o m p e t i t i o n a n d R e g u l a t i o n f o R i n C l u s i v e g R o w t h
158
and stakeholders with up-to-date knowledge, skills and competences is at the core of a successful regional integration.
The policy mandate to create a regional market for skills and competences is clear, as formulated by the RISDP, the SADC Regional Industrial Policy Framework and the Post-2015 Inclusive and Sustainable Industrial Development agenda.
Some capacity building and experience sharing is organised at the regional level, through the SADC, the SAPP and the RERA. Through the SAPP, the region hosts several technical sub-committees (on markets, planning, operating issues and environmental matters). In addition, experience-sharing workshops are regularly hosted with the support of international partners. Examples included an Energy Management and IPP Framework workshop in June 2015; a joint IRENA-SAPP workshop on Renewable Energy Zoning in the region (2014); workshops on the integration of renewable energy sources to the interconnected power grid (2014 and 2015); a workshop on a Framework for Open Access to the Transmission Grid (2014); a World Bank workshop on Water and Energy Nexus in the Zambezi Basin; and Training on Equator Principles and Due Diligence in 2014.
The RERA is also facilitating capacity-building activities. As part of an initiative to establish a regional platform for sustainable long-term capacity building for RERA’s members, commissioners, and other technical and support staff, a RERA Training Needs Assessment was conducted with support from USAID, leading to the development of training curricula and modules for RERA. In addition, the European Union is supporting a four-year technical assistance programme to develop regulatory frameworks and strengthen local capacity, particularly with regard to renewable energy and energy efficiency. The IRENA is providing support to RERA as part of the Regulatory Empowerment Project to improve the governance of electricity planning and the integration of renewable energy (Magombo, 2016).
Furthermore, the Energy Thematic Group was created, based on the recommendations of a review of the 2006 Windhoek Declaration on a New Partnership between the SADC and the international cooperating

159
r e g i o n a L i n t e g r a t i o n i n s o u t h e r n a f r i c a
partners. It is a multi-stakeholder group, including the SADC Secretariat, SADC subsidiary organisations, international cooperating partners, the Southern African Research and Documentation Centre, the private sector, and multilateral and bilateral financial institutions. The Energy Thematic Group serves as a technical coordination and advisory group, and acts as a forum for dialogue, networking, partnership building and the creation of shared understanding between the main regional partners (Moser, 2015). However, the absence of labour and civil society representatives in the group is a key hindering factor to inclusive governance in the sector.
Against that mandate, little progress has been made to develop national and regional experts as well as the capacities of stakeholders. There is notably limited capacity and awareness of available energy resources and technologies (particularly renewable energy and energy efficiency), and their techno-economic possibilities. Similarly, knowledge on the socio-environmental impacts and acceptability of various technologies is strongly lacking. Such a situation is correlated to the lack of expertise at vocational and university levels in the region. Outside of South Africa, there is little research and development capacity, particularly due to a dearth of funding. At the same time, regional cooperation between research institutions appears limited. Overall, the scale and reach of the existing initiatives remain too small to address the lack of experience sharing and capacity building (SADC and UNIDO, 2014).
In addition, most capacity-building programmes target existing human resources in the sector, higher education institutions and decision-makers. There is very little investment in building the capacity of communities or building a network of community practitioners, especially those engaged in the delivery of decentralised electricity systems. The result is that communities have little or no role in decision-making about the electricity systems being planned and delivered, and are not included in any governance structures. This oversight needs to be addressed if electricity sustainability (particularly electricity equity) is to be achieved. There are examples of community-based electricity systems in the region – for example in Tanzania – that can form the basis
C o m p e t i t i o n a n d R e g u l a t i o n f o R i n C l u s i v e g R o w t h
160
of a region-wide community network of learning.The fiasco of the Grand Inga project in the DRC, often described
as a ‘white elephant’, illustrates the lack of capacity to deliver large-scale projects. In 2016, the World Bank announced it had suspended its financial support to the project. The main reasons behind this decision revolve around the lack of transparency and independence, the failure to observe international good practice in terms of governance, high risks in terms of fiduciary responsibilities, and a lack of institutional capacity for implementation and technical design capacities (Fabricius, 2016). In South Africa, Eskom’s extreme difficulty in delivering the two large-scale coal-fired power plants, Medupi and Kusile, on time and on budget, is another example of the lack of internal capacity (Yelland, 2016).
Most SADC’s frameworks, plans and strategies also emphasise the need to build data and information databases and repositories to improve evidence-based decision- and policy-making. This is notably the case of the SADC Regional Strategy for Increasing Energy Access and its Action Plan discussed earlier. A number of areas are generally considered in this respect, namely the collection of baseline data and information on the current state of play, the access to up-to-date information on academic and professional knowledge (from a policy, regulatory, socio-economic, technical and technological perspective), and the development of forecasting and planning capabilities.
Information and data on energy, like many other topics, remain scarce and of poor quality in the region. As illustrated by the data discrepancies on energy losses, this poses significant challenges for decision-making in both policy and investment circles.
Policy implications
The lack of representativity of the regional institutions and governance structures, particularly the absence of labour unions and civil society, is a key obstacle to achieving inclusive growth in the sector. Significant effort must be directed towards broadening the inclusivity of multi-stakeholder institutions, like the Energy Thematic Group, and the genuine engagement with local stakeholders of regulatory institutions.

161
r e g i o n a L i n t e g r a t i o n i n s o u t h e r n a f r i c a
More broadly, inclusive regionalism (also known as new regionalism) should be actively pursued, through the involvement of a wide range of stakeholders and the creation of more networked forms of governance (see Muller, Chikozho and Hollingworth, 2015, for more details on such approaches).
Such a process should be complemented by a bottom-up, grassroots approach that prioritises capacity-building activities that are aligned to the needs of specific institutions and stakeholders, while considering their position in the regional arena (AfDB, 2013). This should be targeted particularly at community and civil society levels to foster inclusive governance in the region.
A regional cooperative framework should be established to assist with developing the ‘human infrastructure’ of the energy sector, as proposed by the African Development Bank (AfDB, 2013). The SAPP could act as the implementing agency in project development while, in the long term, the RERA could check and monitor national compliance.
Such a cooperative framework should include the development of regional knowledge programmes, through the harmonisation of regional curricula at tertiary institutions and centres of excellence, as well as the facilitation of the mutual recognition of (vocational) certifications. Establishing regional educational, training and electricity institutions, through the enhancement of existing national institutions, such as the South African Renewable Energy Technology Centre, which trains wind-turbine service technicians locally, as opposed to sending them abroad for training, or recruiting experts from developed countries, are other examples.
Moreover, the region should facilitate and organise enhanced cooperation between research and development institutions on energy issues. This could take the form of exchange programmes, joint research projects and/or knowledge-sharing workshops. Additionally, more efforts are required to engage and experiment with community-based initiatives. As raised earlier, the rollout of small-scale power solutions is a crucial pathway to empower communities in a sustainable fashion.
The SADC, through the SAPP and the RERA, should also play a

C o m p e t i t i o n a n d R e g u l a t i o n f o R i n C l u s i v e g R o w t h
162
central role in building capacity in countries and institutions requiring assistance to adapt to and implement regional standards. Regional institutions should foster experience and skills sharing in the region, particularly technical and non-technical capacity building of power pool member countries. This could take the form of an extensive platform for regional workshops, with the aim of bringing experts in particular fields to train and engage in knowledge sharing with local experts.
The SADC should also engage in lesson-drawing activities, borrowing or improving on ideas from other African regional economic zones, such as the Economic Community of West African States (ECOWAS), which has embarked on various capacity-building initiatives. These have included regional assessments of human infrastructural needs and subsequently developing tailor-made programmes for specific sectors and technologies (AfDB, 2013).
The SADC should spearhead negotiations for the creation of a regional free movement area to facilitate the mobility of local skills and expertise in the region. In this respect, the SADC should conduct an assessment of skills needed and a mapping of skills that are already available in the region. Furthermore, the SADC should consider the possible deployment of available skills from other industries.
A number of data- and information-related initiatives are also required to improve the state of knowledge about regional dynamics. The necessity to improve mapping tools for needs assessment and diagnostic (such as systems losses) is apparent in the region, as is enhancing monitoring and evaluation tools to assess the needs of populations in terms of energy sustainability. The SADC should develop a one-stop information system providing insight on planned and potential energy-generation projects along with the various sources of funding available for project conception, to feasibility studies and implementation phases. Under the auspices of the SADC, member states should develop country reports on the state of electricity sustainability in the region.
Regionally integrated, sector-specific, capacity-building initiatives, involving the multiple stakeholders mentioned, are of vital importance for infrastructure project development and implementation. Sustained

163
r e g i o n a L i n t e g r a t i o n i n s o u t h e r n a f r i c a
capacity building must occur, ensuring that human capital is up-to-date with technological and policy advancements, especially since the SADC’s access to competent skills and expertise could shape the energy landscape of the region.
CONCLUSION
The road to energy sustainability in southern Africa remains long and difficult. Countries, while diverse and facing unique challenges and circumstances, all remain far from achieving their potential and harnessing the synergies between the challenges of electricity security, electricity equity and environmental sustainability. Whereas these dimensions have been considered as conflicting and impeding one another, the co-benefits existing between them, as illustrated by the rollout of decentralised solar-based systems, constitute an opportunity for the region.
Southern Africa is a rich region with a vast array of energy resources. Unfortunately, these remain largely untapped, mainly due to a lack of regional integration. The deepening of regional energy integration in the SADC region indeed offers a platform to fast-track progress towards electricity sustainability. Existing initiatives, structured around the SAPP and the RERA, notably provide the necessary building blocks for regional integration to help countries meet their energy challenges. However, this task cannot be left to utilities and regulatory bodies alone. Many avenues are available for regional institutions to play a driving and supporting role to achieve the inclusive governance of the sector and leverage the countries’ vast experience. Indeed, regional integration is not an end in itself but a means to achieving a sustainable development pathway in the region.
Ultimately, regional integration remains conditioned on the willing-ness and engagement of member countries and national institutions, as well as robust, inclusive and transparent governance systems. The task at hand is evidently complex and ambitious, but the long-term benefits associated with inclusive regional integration are at the core of southern Africa’s prosperity.
Or in the words of Tanzania’s Haya proverb: ‘Many hands make light work.’

C o m p e t i t i o n a n d R e g u l a t i o n f o R i n C l u s i v e g R o w t h
164
NOTES
1 This chapter is extracted from a Trade and Industrial Policy Strategies (TIPS) Working Paper, initially supported and funded by the United Nations Conference on Trade and Development (UNCTAD) and the Department of Trade and Industry (the dti) of the Republic of South Africa. 2 The list of SAPP members is as follows: Botswana Power Corporation (BPC), Botswana (OP); Electricidade de Moçambique (EDM), Mozambique (OP); Hidroeléctrica de Cahora Bassa (HCB), Mozambique (IPP); Mozambique Transmission Company (MOTRACO), Mozambique (ITC); Electricity Supply Corporation of Malawi (ESCOM), Malawi (NP); Empresa Nacional de Electricidade de Angola (ENE), Angola (NP); Rede Nacional de Electricidade de Angola (RNT), Angola (NP); Eskom, South Africa (OP); Lesotho Electricity Corporation (LEC), Lesotho (OP); NamPower, Namibia (OP); Société Nationale d’Electricité (SNEL), DRC (OP); Swaziland Electricity Company (SEC), Swaziland (OP); Tanzania Electricity Supply Company (TANESCO), Tanzania (NP); ZESCO, Zambia (OP); Copperbelt Energy Corporation (CEC), Zambia (ITC); Lunsemfwa Hydro Power Company (LHPC), Zambia (IPP); Zimbabwe Electricity Supply Authority (ZESA), Zimbabwe (OP). Note that OP stands for operating member, NP stands for non-operating member, ITC stands for independent transmission company, and IPP stands for independent power producer. 3 In the energy space, a prosumer is an entity that both consumes and produces energy (generally electricity).4 To achieve modern access to energy services, three incremental levels must be met: (1) basic human needs (electricity for lighting, health, education, communication and community services, modern fuels and technologies for cooking and heating); (2) productive uses (electricity, modern fuels and other energy services to improve productivity through notably mechanisation, irrigation and transport); and (3) modern society needs (modern energy services for many more domestic appliances, increased requirements for cooling and heating [space and water] and private transportation) (AGECC, 2010).5 Energy intensity is a measure of the energy efficiency of a nation’s economy. It is the ratio between the consumption of energy and the gross domestic
165
r e g i o n a L i n t e g r a t i o n i n s o u t h e r n a f r i c a
product of a country. Carbon intensity applies the same reasoning to CO2 emissions (or greenhouse gas emissions in some cases). The two are highly correlated in countries where energy is generated through carbon-intensive processes, such as coal-fired electricity. The use of low-carbon power generation technologies (such as hydropower) helps reduce the carbon intensity but does not have an impact on the energy intensity. A low energy intensity indicates a high degree of efficiency in using energy to produce goods and services, irrespective of the source. By contrast, a low carbon intensity results from both a high degree of efficiency in using energy to produce goods and services and the use of low-carbon production processes.6 Transmission losses technically range from 4 to 8 per cent. However, they can be higher due to a multitude of reasons, such as the rollout and maintenance of transmission and distribution lines (quality, distance, size and operating hours) and associated systems (conductors and transformers).7 The members of the RERA are as follows: Instituto Regulador do Sector Eléctrico (IRSE), Angola; Lesotho Electricity and Water Authority (LEWA), Lesotho; Malawi Energy Regulatory Authority (MERA), Malawi; Conselho Nacional de Electricidade (CNELEC), Mozambique; Electricity Control Board (ECB), Namibia; National Energy Regulator of South Africa (NERSA), South Africa; Swaziland Energy Regulatory Authority (SERA), Swaziland; Energy and Water Utilities Regulatory Authority (EWURA), Tanzania; Energy Regulation Board (ERB), Zambia; Zimbabwe Energy Regulatory Authority (ZERA), Zimbabwe. The DRC does not have a fully- fledged regulator yet. The Botswana Energy Regulatory Authority, created in 2016, is not yet a member of RERA. 8 The RERA has the following objectives:
• capacity building and information sharing, ie, facilitate electricity regulatory capacity-building among members at both a national and regional level through information sharing and skills training;
• facilitation of electricity policy, legislation and regulations, ie, facilitate harmonised policy, legislation and regulations for cross-border trading, focusing on terms and conditions for access to transmission capacity and cross-border tariffs; and
• regional regulation cooperation, ie, deliberate and make recommen-

C o m p e t i t i o n a n d R e g u l a t i o n f o R i n C l u s i v e g R o w t h
166
dations on issues that affect the economy (Sichone, 2015).9 A VPP is not a physical power station and makes extensive and sophisticated use of information technology, advanced metering, automated control capabilities and electricity storage to match short-interval load fluctuations. It aims to integrate the operation of supply- and demand-side assets to meet customer demand for energy services in both the short and long term. It also makes use of long-term load reduction achieved through energy efficiency investments, distributed generation and verified demand response on an equal footing with supply expansion (SADC and SARDC, 2016).10 Cumulation generally refers to rules of origin, the restrictions in trade agreements that define how much value a country must add to a product for that product to be said to have originated in that country. Cumulation of rules of origin allows for the value added by certain third countries to count as local value added. For example, a product that is made in South Africa, using components from Botswana, and exported to the European Union could count a portion of those Botswanan components as ‘locally- made’, because all three are party to an Economic Partnership Agreement that allows for some cumulation of origin (Wood, 2017).11 Trading is facilitated by SAPP pricing arrangement, set out in 13 detailed schedules in the operating agreement. The schedules cover four broad types of transaction: (1) firm power contracts of varying duration; (2) non-firm power contracts of varying duration; (3) mutual support contracts, such as operating reserve, emergency energy and control area services; and (4) scheduled outage energy, energy banking and wheeling. With support from Sweden, SAPP developed the Ancillary Services and Transmission Pricing System, the implementation of which was phased in over a three-year period starting in 2011. Ancillary services are essential for the reliability and security of power system operation in any competitive electricity market environment.
REFERENCES
ABB (2012) Vital HVDC link delivers clean power for South Africa and exports for Mozambique. Available at: http://www.abb.co.za/cawp/seitp202/ 5e628740c00f1d4cc1257a83003afded.aspx [Accessed 25 April 2017.]

167
r e g i o n a L i n t e g r a t i o n i n s o u t h e r n a f r i c a
AfDB (2013) Energy Sector Capacity Building Diagnostic and Needs Assessment Study. Tunis: African Development Bank.
African Union (2015) Agenda 2063. Available at: https://www.au.int/web/en/agenda2063 [Accessed 24 April 2017].
AGECC (2010) Energy for a Sustainable Future: Summary report and recommendations. New York: United Nations.
Bailey, M, Henriques, J, Holmes, J and Jain, R (2012) Providing Village-Level Energy Services in Developing Countries. Cambridge: The Smart Villages, Trinity College.
Creamer, T (2015) SADC ministers target 2019 for electricity surplus, cost-reflective tariff, Engineering News.
Cuamba, BC, Dos Santos Cipriano, A, Henrique, R and Turatsinze, J (2013) Investment Incentives for Renewable Energy in Southern Africa: The case of Mozambique. Maputo, Mozambique: The International Institute for Sustainable Development.
Das Nair, R, Montmasson-Clair, G and Ryan, G (2014) Regulatory entities capacity building project review of regulators orientation and performance: Review of regulation in the electricity supply industry. Johannesburg/Pretoria: University of Johannesburg/Trade & Industrial Policy Strategies.
DoE (2016) Annual Performance Plan, 2016/17. Pretoria: Department of Energy, South Africa.
Eberhard, A, Shkaratan, M, Rosnes, O and Haakon, V (2011) Africa’s Power Infrastructure: Investment, integration, efficiency. Washington, DC: World Bank.
Economic Consulting Associates (2009) The Potential of Regional Power Sector Integration. South African Power Pool (SAPP): Transmission and trading case study. Washington DC: Energy Sector Management Assistance Program.
Eskom (2017) Eskom signs electricity sales agreement with NamPower. Available at: http://www.eskom.co.za/news/Pages/Marr23.aspx [Accessed 24 April 2017].
Eskom (NDa) Kusile Power Station Project. Available at: http://www.eskom.co.za/ Whatweredoing/NewBuild/Pages/Kusile_Power_Station.aspx [Accessed 25 April 2017].
Eskom (NDb) Medupi Power Station Project. Available at: http://www.eskom.co.za/Whatweredoing/NewBuild/MedupiPowerStation/Pages/Medupi_Power_Station_Project.aspx [Accessed 25 April 2017].
Fabricius, P (2016) Inga dream again deferred, Institute for Security Studies.

C o m p e t i t i o n a n d R e g u l a t i o n f o R i n C l u s i v e g R o w t h
168
Available at: https://issafrica.org/iss-today/inga-dream-again-deferred [Accessed 25 April 2017].
Feron, S (2016) Sustainability of off-grid photovoltaic systems for rural electrification in developing countries: A review, Sustainability, 8: 1326. Available at: https://doi.org/doi:10.3390/su8121326 [Accessed 25 April 2017].
Hansen, T (2016) The rise of HDVC and promise of supergrids: Electric light and power. Available at: http://www.elp.com/articles/powergrid_international/print/volume-21/issue-12/features/the-rise-of-hvdc-and-promise-of-supergrids.html [Accessed 17 April 2017].
IDC (2013) Developing a vibrant ESCo market: Prospects for South Africa’s energy efficiency future. Johannesburg: Industrial Development Corporation.
IEA (2014a) Africa Energy Outlook: A focus on energy prospects in sub-Saharan Africa. Paris: International Energy Agency.
IEA (2014b) Africa Energy Outlook: A focus on energy prospects in sub-Saharan Africa. World Energy Outlook Special Report. Paris: International Energy Agency.
IEA (2015) World Energy Outlook Special Report: Energy and climate change. Paris: International Energy Agency.
IEA (2016) World Energy Outlook 2016. Paris: International Energy Agency.IRENA (2012) Mozambique’s Renewables Readiness Assessment 2012. Abu Dhabi:
International Renewable Energy Agency.Jain, PK, Jain, P and Dhafana, P (2014) Addressing barriers to off-grid rural
electrification in Africa: The Botswana and Namibia experience, Journal of Energy and Power Engineering, 8: 1351–1359.
Jindal Africa (ND) https://www.jindalafrica.com/countries/botswana/mmamabula-energy-project [Accessed 15 November 2017].
Karhammar, R (2014) Regional Energy Cooperation in Africa and Possible Entry Points for the new Regional Results Strategy. Stockholm: Swedish International Development Cooperation Agency (Sida).
Le Cordeur, M (2017) Major push to electrify households living in the dark, Fin24. Available at: http://www.fin24.com/Budget/major-push-to-electrify-households-living-in-the-dark-20170222 [Accessed 28 February 2017].
Madakufamba, M (2010) Expanding energy generation capacity in SADC: Challenges and opportunities for power sector infrastructure development, Energy Policy Brief No. 1, Southern African Research and Documentation Centre (SARDC), Harare.

169
r e g i o n a L i n t e g r a t i o n i n s o u t h e r n a f r i c a
Magombo, G (2016) Update on regional regulatory initiatives, Fourth high-level meeting of regional regulatory associations of emerging markets, Milan, 3 November.
Mathews, C (2017) ‘Western Power Corridor pact can be revived,’ says Reuel Khoza, Business Day. Available at: https://www.businesslive.co.za/bd/companies/energy/2017-02-21-western-power-corridor-pact-can-be-revived-says-reuel-khoza/ [Accessed 24 April 2017].
Miketa, A and Merven, B (2013) Southern African Power Pool: Planning and prospects for renewable energy. Adu Dhabi: International Renewable Energy Agency.
Mills, G (2016) The deficits behind Zambia’s power problems, Daily Maverick.Montmasson-Clair, G (2017) Electricity supply in South Africa: Path dependency
or decarbonisation? Pretoria: Trade & Industrial Policy Strategies (TIPS).Montmasson-Clair, G and Das Nair, R (2015) Channelling economic regulation
to stimulate inclusive growth: Lessons from South Africa’s renewable energy experience. Paper presented at the biennial conference of the Economic Society of South Africa, University of Cape Town, Cape Town.
Montmasson-Clair, G and Ryan, G (2014) Lessons from South Africa’s renewable energy regulatory and procurement experience, Journal of Economic and Financial Sciences, 7: 507–526.
Montmasson-Clair, G, Wood, C, Mudombi, S and Deonarain, B (2017) A green economy industry and trade analysis: Assessing South Africa’s potential. Pretoria: Department of Environmental Affairs, Department of Trade and Industry, Department of Science and Technology, United Nations Environment Programme and United Nations Industrial Development Organization.
Moser, W (2015) The SADC Energy Thematic Group. Presentation on the occasion of the RERA Annual Conference and General Meeting at Royal Swazi Spa, Ezulwini Valley, Swaziland, 23–27 November 2015.
Muller, M (2013) The regulation of network infrastructure beyond the Washington consensus, Development Southern Africa, 13(4–5).
Muller, M, Chikozho, C and Hollingworth, B (2015) Water and regional integration: The role of water as a driver of regional economic integration in southern Africa. Pretoria: Water Research Commission.
Mutanga, S and Simelane, T (2015) Electricity Generation: A driver of SADC regional integration? Berlin: Economic Policy Forum.
Narula, K and Reddy, BS (2016) A SES (sustainable energy security) index for developing countries, Energy, 94: 326–343.

C o m p e t i t i o n a n d R e g u l a t i o n f o R i n C l u s i v e g R o w t h
170
Nexant (2009) SAPP Regional Generation and Transmission Expansion Plan Study Final Report, Volume 1, Executive Summary. Harare: Southern Africa Power Pool.
Ngoepe, T, Fisker Henriksen, T, Patton Power, A, Panulo, B, Scholtz, L and Gulati, M (2016) Switching on finance for off-grid energy. Cape Town: Bertha Centre for Social Innovation and Entrepreneurship and WWF-SA.
ODI (2016) Accelerating access to electricity in Africa with off-grid solar. Off-grid solar country briefing: Tanzania. London: Overseas Development Institute.
Prinsloo, C (2016) Power and Private Sector Participation in Tanzania’s Renewable Energy Sector. Johannesburg: South African Institute of International Affairs (SAIIA).
Promethium Carbon (2016) Electricity Market Reform in Southern Africa. Johannesburg: Promethium Carbon.
REN21 (2015) SADC Renewable Energy and Energy Efficiency Status Report. Paris: Renewable Energy Policy Network for the 21st Century.
RERA (2016) Technical Report: RERA Publication on Electricity Tariffs and Selected Performance Indicators for the SADC Region 2014. Gaborone: USAID Southern African Trade Hub/Regional Electricity Regulators Association of Southern Africa.
SADC (1996) Protocol on Energy. Maseru: Southern African Development Community.
SADC (2010) SADC Regional Energy Access Strategy and Action Plan. Gaborone: Southern African Development Community.
SADC (2012) Regional Infrastructure Development Master Plan (RIDMP): Energy Sector Plan. Gaborone: Southern African Development Community.
SADC (2015) Regional Indicative Strategic Development Plan, 2015–2020. Gaborone: Southern African Development Community.
SADC (2016) Renewable Energy and Energy Efficiency Strategy and Action Plan: REEESAP 2016–2030. Gaborone: Southern African Development Community.
SADC and SARDC (2016) SADC Energy Monitor 2016: Baseline study of the SADC energy sector. Gaborone and Harare: Southern African Development Community and Southern African Research and Documentation Centre.
SADC and UNIDO (2014) Proposed SADC Centre for Renewable Energy and

171
r e g i o n a L i n t e g r a t i o n i n s o u t h e r n a f r i c a
Energy Efficiency (SACREEE). Gaborone and Vienna: Southern African Development Community and United Nations Industrial Development Organization.
Santley, D, Schlotterer, R and Eberhard, A (2014) Harnessing African Natural Gas: A new opportunity for Africa’s energy agenda? Washington DC: World Bank.
SAPP (2015) 2015 Annual Report. Harare: Southern African Power Pool.SAPP (2017) SAPP Annual Report 2016. Harare: Southern African Power Pool.SAPP (2018) SAPP Annual Report 2017. Harare: Southern African Power Pool.Scott, A (2015). Building electricity supplies in Africa for growth and universal
access. Background paper for Power, People, Planet: Seizing Africa’s energy and climate opportunities. London and Washington DC: New Climate Economy. Available at: http://newclimateeconomy.report/misc/working-papers [Accessed 10 January 2019].
Sichone, EC (2015) Developing a regional regulatory capacity-building programme: The case of RERA.
Sichone, EC (2016) Creation of multinational electricity markets by furthering cross border trading of electricity, 2016 African Forum for Utility Regulators (AFUR) Workshop.
Shihepo, T (2017) NamPower, Eskom in R7 billion power deal, The Southern Times.TIPS (2013) Options for Managing Electricity Supply to Aluminium Plants.
Commissioned for the Economic Development Department [EDD] by the Employment Promotion Programme (EPP) Phase III of the Development Policy Research Unit [DPRU] at the University of Cape Town. Pretoria: Economic Development Department.
UNEP (2012) Financing Renewable Energy in Developing Countries: Drivers and barriers for private finance in sub-Saharan Africa. Geneva: The United Nations Environment Programme Finance Initiative (UNEP FI).
UNEP and AfDB (2017) Atlas of Africa Energy Resources. Nairobi: United Nations Environment Programme.
United Nations (2015) Sustainable Development Goals: 17 Goals to Transform our World. Available at: http://www.un.org/sustainabledevelopment/energy/ [Accessed 24 April 2017].
Vanheukelom, J and Bertelsmann-Scott, T (2016) The Political Economy of Regional Integration in Africa: The Southern African Development Community (SADC) Report. Maastricht: ECDPM.

C o m p e t i t i o n a n d R e g u l a t i o n f o R i n C l u s i v e g R o w t h
172
Vyas, Y (2011) Terminal Evaluation of the Renewable Energy-based Rural Electrification Programme for Botswana. Houston, Texas: UNDP.
WEC (2013) World Energy Trilemma: 2013 energy sustainability index. London: World Energy Council.
WEC (2016) World Energy Trilemma: 2016 energy sustainability index. London: World Energy Council.
Wilkinson, K (2015) Did 34% of households have access to electricity in 1994? Mail & Guardian, 14 May.
Wood, C (2017) A South African Strategy for Green Trade. Pretoria and London: Trade & Industrial Policy Strategies (TIPS) and Green Economy Coalition.
World Bank (2017) Botswana: Morupule B Generation and Transmission Project. Available at: http://projects.worldbank.org/P112516/botswana-morupule-b-generation-transmission-project?lang=en [Accessed 25 April 17.]
Yelland, C (2016) Medupi, Kusile, and the massive cost/time overrun, Daily Maverick. Available at: https://www.dailymaverick.co.za/article/2016-07-07-medupi-kusile-and-the-massive-costtime-overrun/#.WPnARtKGPIU [Accessed 24 April 17].

173
h o w r o o f t o p p v c a n e n h a n c e e n e r g y s e c u r i t y f o r h o u s e h o L d s
5
How rooftop PV can enhance energy security for households
across the SADC
Shannon Knight and Noxolo Mahlalela
INTRODUCTION
Electricity security is a concern in the Southern African Development Community (SADC), with less than a third of the total SADC population having access to electricity. Innovative solutions are required to address the energy crisis in the SADC. The region enjoys abundant sunshine, which can be used to ameliorate the situation. This chapter examines the use of small-scale embedded generation (SSEG) in the form of solar photovoltaic (PV) rooftop systems1 to assist households and businesses across the SADC region to enhance energy security.
Energy security can be defined as ‘the uninterrupted availability of energy sources at an affordable price’ (International Energy Agency [IEA], ND). Energy security is a prerequisite for economic development and thus a focus for developing countries around the world.
Green energy, using low-carbon energy solutions, has long been acknowledged internationally as a solution to energy poverty and climate change (UNEP, 2011). Renewable energy technologies can assist countries to increase access to electricity, to reduce price volatility, to provide secure, reliable and affordable electricity, and contribute towards social and economic development.

C o m p e t i t i o n a n d R e g u l a t i o n f o R i n C l u s i v e g R o w t h
174
There are many renewable energy sources2 – solar, wind, marine, hydro, geothermal and biomass – and renewable energy technologies have become more attractive options across the world for a number of reasons. Renewable energy never runs out, is environmentally friendly in terms of emissions, is available almost everywhere on earth – unlike fossil fuels – is easily deployed and, in recent years, the costs have fallen dramatically. In addition, renewable energy technologies have advanced, making them more efficient and reliable.
Although this chapter focuses on small-scale embedded generation (SSEG) – and rooftop solar PV in particular – there are many other renewable energy options that can be used to address the electricity crisis. Embedded generation (also known as distributed generation or distributed energy) refers to power generation at the point of consumption. SSEG pertains to power generation under one megawatt (1 000 kilowatt), which is located on residential, commercial or industrial sites where the electricity generated is also consumed. This contrasts with large-scale generation units that generate significant amounts of power, typically in the multi-megawatt range. The majority of SSEG electricity is consumed directly on site, however, when production exceeds consumption, electricity is exported to the grid.
This chapter firstly examines the relationship between access to electricity and development, which clearly illustrates the benefits of extending access to electricity. It then examines the global development of SSEG and solar PV capacity, starting with the alternative policy approaches available to governments. Selected country experiences are explored, with a focus on leading countries and a case study of South Africa. This is followed by an examination of how rooftop PV could help to resolve the energy crisis in the SADC, the solar resources available in SADC member states and the impact of SSEG on energy security. Lastly, the chapter looks at the policy status as of 2017 with respect to SSEG in particular, and renewable energy in general, in each SADC state and some best practices from international and SADC experiences.

175
h o w r o o f t o p p v c a n e n h a n c e e n e r g y s e c u r i t y f o r h o u s e h o L d s
Electricity and development
Electricity is an important prerequisite in any development plan as it underpins economic growth. Countries with low levels of GDP per capita and high levels of poverty tend to be those that lack access to reliable and affordable electricity services (Karekezi et al, 2012:160; Castellano et al, 2015). This is most pronounced in Africa and South Asia, where the number of people who lack access to reliable electricity supply are the greatest (IEA, 2016a). Currently, a shortage of reliable electricity supply and a lack of infrastructure to generate electricity hinders economic development within the SADC. As a result, most SADC member states experience regular electricity crises and outages.
From an electricity-access perspective, the situation in the SADC is dire. In 2014, about 67 per cent of the entire SADC population did not have access to electricity (IEA, 2016a). Table 5.1 shows the proportion without access to electricity and the average number of outages experienced per month. The SADC countries are not homogenous in terms of access and outages, with nearly all citizens of the Seychelles and Mauritius enjoying access to electricity, while over 80 per cent of the populations in Malawi, Madagascar, Lesotho, the DRC and Angola do not have access. Note that when we refer to the energy crisis in the SADC, we refer to the aggregate situation and not the situation in each country.
There is a strong link between electrification and growth. As illustrated in Figure 5.1, countries with electrification rates of less than 80 per cent of the population have consistently lower levels of GDP per capita. Countries such as Malawi, Lesotho, the DRC, Zambia and Tanzania, with electrification rates below 50 per cent, have lower levels of GDP per capita, while those with electrification rates above 80 per cent, such as South Africa and the Seychelles, have higher levels of GDP per capita.
Similarly, there is a clear link between the quality of electricity supply and GDP (Castellano et al, 2015:8). This emphasises the critical role of both availability and reliability of supply in promoting

C o m p e t i t i o n a n d R e g u l a t i o n f o R i n C l u s i v e g R o w t h
176
development. Lack of reliable electricity supply has a significant impact on productive employment, income generation and job security. It is estimated that in sub-Saharan Africa (SSA), businesses lose the equivalent of 8.3 per cent of their annual sales as a result of electrical outages (World Bank, 2016b).
Table 5.1: Access to electricity across the SADC, 2014
Source: Total population from SADC Statistics Yearbook 2014; population without access to electricity from the International Energy Agency (IEA) electricity access database; average number of outages per month from World Development Indicators database.
Total population (millions)
Population without access to electricity
Proportion Average number of outages per month
Malawi 15.8 14.7 93% no data
Madagascar 22.4 20.5 92% 6.7
Lesotho 1.9 1.7 91% 4.1
DRC 69.8 61.5 88% 12.3
Angola 19.8 16.2 82% 4.7
Tanzania 47.9 36.3 76% 8.9
Zambia 15 11.3 75% 5.2
Namibia 2.2 1.6 73% 0.6
Mozambique 25 16.4 65% 1.6
Zimbabwe 13.4 7.2 54% 6.7
Botswana 2.2 1 48% 4.1
Swaziland 1.1 0.4 41% 1.8
South Africa 54 7.6 14% 0.9
Seychelles 0.1 0 2% no data
Mauritius 1.3 0 0% 1.2
Total SADC 292 196.6 67%
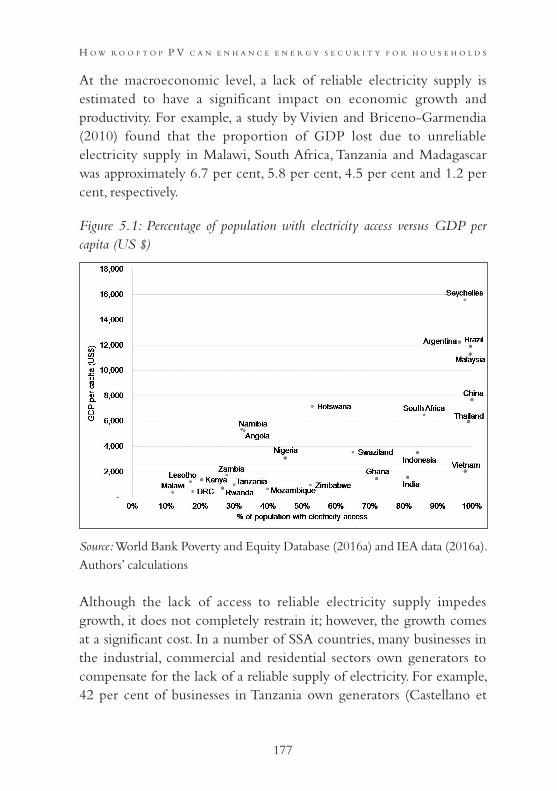
177
h o w r o o f t o p p v c a n e n h a n c e e n e r g y s e c u r i t y f o r h o u s e h o L d s
At the macroeconomic level, a lack of reliable electricity supply is estimated to have a significant impact on economic growth and productivity. For example, a study by Vivien and Briceno-Garmendia (2010) found that the proportion of GDP lost due to unreliable electricity supply in Malawi, South Africa, Tanzania and Madagascar was approximately 6.7 per cent, 5.8 per cent, 4.5 per cent and 1.2 per cent, respectively.
Figure 5.1: Percentage of population with electricity access versus GDP per capita (US $)
Source: World Bank Poverty and Equity Database (2016a) and IEA data (2016a). Authors’ calculations
Although the lack of access to reliable electricity supply impedes growth, it does not completely restrain it; however, the growth comes at a significant cost. In a number of SSA countries, many businesses in the industrial, commercial and residential sectors own generators to compensate for the lack of a reliable supply of electricity. For example, 42 per cent of businesses in Tanzania own generators (Castellano et

C o m p e t i t i o n a n d R e g u l a t i o n f o R i n C l u s i v e g R o w t h
178
al, 2015:8). On average, power from electric generators is four times as expensive as grid power (Castellano et al, 2015:8), but for many businesses, grid power is intermittent and, in some cases, entirely unavailable, making the additional cost of generator power a necessary and standard cost of doing business.
The extensive use of generators in SSA countries distorts the cost of doing business. As a result, businesses that operate in the region have considerably higher relative electricity expenses than their counterparts in other regions. In addition, many enterprises that do business in other parts of the world, never take off in SSA because local electricity costs make them uncompetitive (Castellano et al, 2015:9).
As noted earlier, countries with high levels of poverty tend to be those that lack access to electricity. This is illustrated in Figure 5.2.
Figure 5.2: Percentage of population living in poverty3 versus percentage of population with electricity access
Source: World Bank Poverty and Equity Database (2016a) and IEA data (2016a). Authors’ calculations

179
h o w r o o f t o p p v c a n e n h a n c e e n e r g y s e c u r i t y f o r h o u s e h o L d s
The correlation between electricity access and poverty is supported by a number of World Bank studies. For instance, a study by Barnes et al (2010) found that increased access to electricity contributes to monetary gains among the poor and leads to a better quality of life, such as an improved diet and food intake levels, and the ability to afford better health and educational facilities.
Electricity can contribute to enhancing food security among the poor through the use of technologies for irrigation and water pumping, which have the potential to ensure a supply of food throughout the year and produce additional income for households (Karekezi et al, 2012). Electricity can also provide a reliable and sustainable source of energy for household cooking. In many poor countries, biomass, used mainly for cooking, accounts for over 90 per cent of household energy use. While traditional fuels such as wood, agricultural residues or manure can be collected locally, considerable time and effort may be spent collecting these. As traditional fuels become scarcer, more time is spent collecting fuel, leaving less time for income-generating activities (Karekezi et al, 2012:166). Enhancing access to modern forms of household energy is important because of its potential to increase household income levels.
Electricity can facilitate access to educational media in schools and in households. It provides the opportunity to use sophisticated equipment for teaching, allowing access to specialised teaching materials and courses, which can increase the use of distance-learning modules (Mapako, 2010). In addition, it provides several health benefits, including a greater use of more advanced medical equipment, the provision of medical services at night and the ability to store vaccines and medicines.
It is important to emphasise that access to electricity constitutes only part of the desired policy objective of reducing poverty. It is necessary to create the conditions for economic growth and improve social equality, but electricity, on its own, is not sufficient to move households out of poverty. It can help drive economic growth by improving productivity and by increasing employment options in rural and urban areas, by expanding the range of services and manufacturing opportunities, and providing mechanical power and illumination. Prioritising access to
C o m p e t i t i o n a n d R e g u l a t i o n f o R i n C l u s i v e g R o w t h
180
electricity for commercial activities, therefore, could increase employment opportunities, which would contribute to income generation among the poor.
Global development of rooftop PV
Electricity systems have long been characterised by vertically integrated utilities with large-scale and dispatchable generators. Such systems benefit from economies of scale, holistic system planning and investment certainty, but suffer from monopolistic supply structures, with reduced levels of innovation, lower levels of service quality and a lack of price and customer competition.
However, the role and potential of electricity systems has evolved with the splitting up of integrated utilities into separate network businesses, and enhancing private and competitive operations through the integration of large shares of variable renewable generators, such as rooftop PV systems at the distribution level. As variable renewables increase at the distribution level, electricity will start to flow back into the transmission system. The aggregation of small-scale market participants can play a significant role in providing a reliable supply of electricity. A higher level of integration between distribution and transmission systems can potentially increase reliability, reduce generation costs at the transmission level and reduce network losses (Volk, 2013:85).
Traditional energy systems have been described as ‘linear and static’ by the Africa Progress Panel (APP) (2017:18) and it is key to transform them into systems that are resilient and diverse, with multiple options for electricity access. These multiple options involve extending the grid within a country and across national borders, diversifying the energy mix, and installing mini-grids4 and solar household systems, which can be grid-connected or standalone. The literature reveals that solar PV is playing an important and large part in this transformation. As one commentator noted, ‘[r]enewable and PV in particular is changing the traditional view of the electricity supply chain – moving from delivery of a centralized source of energy to one that is decentralised and bi-directional’ (Salvoldi, 2015).

181
h o w r o o f t o p p v c a n e n h a n c e e n e r g y s e c u r i t y f o r h o u s e h o L d s
There are two key approaches that have been followed internationally to develop grid-connected solar programmes. These are utility or third-party programmes and customer-driven programmes (Garg, 2014:26). In the category of utility/third-party driven programmes, projects are undertaken by utilities or third-party developers to address regulatory and policy requirements such as renewable purchase obligations. Typically, these projects are megawatt scale and there is a focus on cost optimisation. If third parties develop these projects, they typically enter long-term power-purchase agreements with the utility. Customers ultimately pay for the cost of procurement.
In the category of customer-driven programmes, projects are undertaken by consumers on their own premises, due to the creation of facilitating policies and regulations by governments and regulators. These programmes refer to SSEG, and Garg (2014:26) notes that these programmes have become increasingly popular because of the decreased costs of solar PV, fiscal incentives and the increasing costs of grid-based conventional electricity.
Most international solar PV markets are a combination of large megawatt solar plants and SSEG on customer’s premises. To encourage the uptake of SSEG, governments have a basket of incentive policies. According to Song et al (2016:10–11) policies used by governments to incentivise the installation of solar PV systems can be grouped into two broad categories: (1) those that help investors to reduce the investment threshold, and (2) those that improve the solar PV investment return.
In the category of helping investors to reduce the investment threshold, examples include the introduction of laws to boost and facilitate the application of SSEG installations, or financial support measures such as subsidising PV installations to reduce the initial capital outlay and the capital cost over the life of the system. Other financial support measures include low interest loans, public guarantees and tax abatement policies.
In the category of improving the PV investment return, net-metering5 and net-FiT policies are included, where utilities purchase excess electricity exported to the grid. Alternatively, a PV electricity grant can be used to encourage distributed PV installation. This is used to encourage

C o m p e t i t i o n a n d R e g u l a t i o n f o R i n C l u s i v e g R o w t h
182
self-consumption of PV electricity. Indeed, around the world there are a number of schemes in place to encourage the uptake of SSEG by electricity customers. Some schemes are essentially the same but are called different names in different places, while other schemes have the same names but are subtly or overtly different. However, what these schemes have in common is that they are used to encourage investments in solar PV (or other renewable energy technologies) by allowing electricity customers (both households and businesses) that instal SSEG to be compensated for any electricity they supply to the grid.
Net-metering and net-FiT are two of the most popular com-pensation mechanisms. Note that electricity consumed from the grid is referred to as imports, whilst electricity fed onto the grid is referred to as exports. Also note that a net-metering or net-FiT customer is still considered to be an electricity consumer and not a producer (such as an independent power producer or IPP). Under a net-metering or net-billing scheme, customers with SSEG receive credits for excess electricity exported to the grid (ie, the amount they produce above the amount they consume), which can be used to offset consumption in other billing periods. Under net-metering, the import rate and export rate are the same (ie, customers typically receive credit at the level of the retail electricity price). However, under net-billing, the export rate is lower than the import rate (so customers typically receive credit for excess power at a rate that is lower than the retail electricity price) However, as mentioned earlier, different jurisdictions may apply these terms in different ways (Ren21, 2016:267). A single bidirectional meter is needed to measure both energy usage and any exports (Salvoldi, 2015).
A feed-in policy (feed-in tariff or feed-in premium) is one that typically guarantees SSEG customers specified payments per unit over a fixed period, normally around 20 years. Numerous options exist for defining the level of incentive, such as whether the payment is structured as a guaranteed minimum price (eg a FiT), or whether the payment floats on top of the wholesale electricity price (eg a feed-in premium) (Ren21, 2016:266). Typically, the export rate is initially set at a higher

183
h o w r o o f t o p p v c a n e n h a n c e e n e r g y s e c u r i t y f o r h o u s e h o L d s
Figure 5.3: Global capacity of solar PV and rooftop PV cost
Source: Capacity from Ren21 (2016:62); rooftop PV cost from Fu et al (2016:v)
Note: The rooftop PV cost is for a residential installation of 5.6 kW; capacity refers to all solar PV installations and not just rooftop PV
price than what the utility pays for energy to encourage uptake. As with net-metering, a single bidirectional meter is needed to measure both energy usage and any exports (Salvoldi, 2015).
Globally, installed solar PV capacity has been growing exponentially over the last decade, and in 2015, installed capacity was 227 gigawatts; another 50 gigawatt of capacity was added in 2015, which is nearly 10 times the size of the cumulative world capacity a decade earlier (Ren21, 2016:60). Until recently, demand was concentrated in the developed world, but now capacity additions in emerging economies across the world are contributing significantly to global growth. This market expansion is due ‘largely to the increasing competitiveness of solar PV, as well as to new government programmes, rising demand for electricity and improving awareness of solar PV’s potential as countries seek to alleviate pollution and CO2 emissions’ (Ren21, 2016:60; emphasis

C o m p e t i t i o n a n d R e g u l a t i o n f o R i n C l u s i v e g R o w t h
184
added). Figure 5.3 shows global capacity over the last decade and roof-top PV prices from 2009. As prices have come down, capacity has grown exponentially.
Figure 5.3 shows the total solar PV capacity installed and does not distinguish between rooftop and other installations. But country specific data illustrate that there is significant rooftop PV and other small-scale solar PV installations as a proportion of the total installed solar PV capacity. For example, in Germany in 2012, 60 per cent of its installed capacity was on rooftops – 9 per cent (1–10 kilowatts) on private buildings, 26 per cent (10–100 kilowatts) on social, commercial and agricultural buildings, and 24 per cent (above 100 kilowatts) on large commercial buildings. And in the United States, almost 30 per cent of their installed solar PV capacity is on residential buildings, with the average size of these installations between 2 and 5 kilowatts (Garg, 2014:26).
Figure 5.4: Solar PV capacity/capita and PV penetration
Source: IEA PVPS National Survey Reports6

185
h o w r o o f t o p p v c a n e n h a n c e e n e r g y s e c u r i t y f o r h o u s e h o L d s
Currently, over 35 years into the history of net-metering, there are net-metering or feed-in tariff policies in place in 103 countries.7 There are government programmes in 44 of the 49 high-income countries, 31 of the 44 upper-middle-income countries, 24 of the 36 lower-middle-income countries and four of the 17 low-income countries reviewed in the Ren21 Renewables 2016 Global Status Report (Ren21, 2016:119–121). Today, the leaders in SSEG in terms of PV capacity/capita are Germany followed by Italy and Belgium. Figure 5.4 shows solar PV capacity/capita and PV penetration, that is, the proportion of solar PV generated electricity in the total electricity produced among the top 18 countries globally.
It is worthwhile examining the brief histories of the rooftop PV experiences in Germany, Italy, Japan, the United States and China, after which a detailed case study of the South African experience will follow. South Africa is currently in the midst of having net-metering tariffs developed and approved, which makes this case study particularly interesting and relevant.
Germany
Despite not being known as a sunny location, Germany is the world leader in solar installations. It has the highest PV capacity per capita and, at the end of 2016, the total nominal PV power installed in Germany was 41 gigawatts. On weekends, the power supply from PV can reach up to 50 per cent of momentary national power supply, and on weekdays, 35 per cent (Wirth, 2017:6).
This can be explained by public support for ‘“de-fossilizing” Germany’s electricity sector’ (Weiss, 2014:40) and enabling legislation. In 1991, the Grid Feed-In Law was passed, and the very successful ‘The Thousand Solar Roofs Programme’ was formulated. This programme was the first major solar installation initiative in the world, and it subsidised up to 60 per cent of the solar PV system’s costs. The programme was carefully monitored and issues such as financing barriers, grid technical standards and incentive levels were addressed in subsequent phases (Garg, 2014:31).

C o m p e t i t i o n a n d R e g u l a t i o n f o R i n C l u s i v e g R o w t h
186
The Renewable Energy Sources Act (EEG) was enacted in 2000 and has been revised a number of times to accommodate the unexpected growth in installations. Essentially, the German programme consists of FiTs, which are fixed for 20 years, for PV installations of a range of sizes, from rooftop PV to utility-scale installations. Transmission system operators (TSOs) are required to purchase all power produced and then on-sell the power on wholesale markets. A renewables levy is charged to most customers (heavy users in trade-sensitive areas are partially exempt), which is then passed on to the TSO (Weiss, 2014:1).
In 2012, the new EEG law came into effect with the aim of transitioning the industry to a ‘new, incentive free policy paradigm’ (Song et al, 2016:6). Changes comprised a cap on total installed capacity, the reduction of the FiT and a limit to the amount of electricity exported to the grid.
Italy
Italy has the second largest PV capacity in the EU at 18.9 gigawatts, which amounted to 9 per cent of national electricity generation at the end of 2015. Italy implemented its first PV incentive policy, the ‘Photovoltaic Roofs’ programme, in 2001. The programme provided financial support, up to 75 per cent of the total capital costs of installing a PV system with peak power between 1 and 20 kilowatts8 (Song et al, 2016:7).
Since 2001 a number of additional PV incentive policies have been implemented, including a FiT scheme introduced in 2005 giving PV owners the option of selling the electricity exported to the grid. A net-metering scheme was also introduced for systems with a peak power up to 20 kilowatt peak. In 2009 the government extended the net-metering scheme to PV systems up to 200 kilowatts, ensuring PV system owners receive the same price for the electricity produced and consumed from the grid. Under the FiTs scheme, the PV system owner receives a credit for the value of the electricity if there is an excess of electricity fed onto the grid. PV system owners also receive a premium FiT on the total electricity produced by the PV system (Greenpeace and European Photovoltaic Industry Association [EPIA] 2011:53; Song et al, 2016:7).

187
h o w r o o f t o p p v c a n e n h a n c e e n e r g y s e c u r i t y f o r h o u s e h o L d s
Japan
Japan was one of the first countries to develop and apply solar PV. In 1994, the Japanese government introduced a national subsidy for residential buildings programme, which involved government subsidising up to 50 per cent of the costs of installing a PV system for systems with an installed capacity of less than 5 kilowatts. However, over time the profitability of PV electricity generation decreased as a result of the decreasing value of the PV installation subsidy and the government’s failure to follow up with new subsidy policies (Song et al, 2016:5).
In 2009, the government made efforts to revive the PV energy sector through the reinstatement of the national subsidy for residential PV systems, along with a new programme to purchase surplus PV electricity. By the end of 2009, almost 99 per cent of the PV systems installed in Japan were grid connected, distributed applications, mainly residential PV systems (Greenpeace and EPIA, 2011:54).
United States
With the development of PV technology and to promote the application of building integrated PV systems, the US government launched the ‘10 Million Solar Roofs Programme’ in 2010 (Song et al, 2016:9). This programme involved consumer rebates for the purchase and installation of rooftop PV systems.
During 2008 and 2009, the government also introduced approximately 40 new solar-incentive programmes across 19 states. The solar-incentive programmes included production incentives, FiTs and renewable energy credit (REC) purchase programmes. In addition, local governments introduced property-assessed clean energy (PACE) programmes, which offered loans to property owners to help pay for PV systems (Greenpeace and EPIA, 2011:54).
China
The Chinese government has relied on a range of policy instruments to promote solar PV development, including the Renewable Energy Law
C o m p e t i t i o n a n d R e g u l a t i o n f o R i n C l u s i v e g R o w t h
188
(REL) enacted in 2005. The REL set a national target for renewable energy development, in which grid companies were mandated to purchase all renewable electricity at a price higher than coal-fired electricity. A specific fund was also put in place to provide additional financial support for renewable energy development (Song et al, 2016:7).
In 2009, the government attempted to elevate China’s solar rooftop programme with a number of measures, including the ‘Golden Sun’ programme, where it committed to undertake 50 per cent of the investment costs for on-grid PV systems, and 70 per cent of the costs for off-grid PV systems.
The implementation of installation subsidies, provided by the solar roof and Golden Sun programmes, has contributed to the rapid growth of China’s PV industry; the cumulative installed capacity increased from 300 megawatt in 2009 to 17 800 megawatt in 2013 (Greenpeace and EPIA, 2011:55).
South Africa
Over the last decade or so there has been increased interest in SSEG in South Africa. This is due to the decreasing price of solar PV rooftop systems, increases in electricity prices and the electricity supply crises of 2008 and 2018, which resulted in ‘load shedding’. As a result, electricity consumers started to instal rooftop PV in increasing numbers, and in September 2016 it was estimated that there was over 200 ̨megawatt installed over thousands of installations (Spencer, 2016). Municipalities across South Africa have had requests for consumers with rooftop PV to connect to the grid and feed excess energy onto the grid. In August 2016, official data showed that there were 621 installations across the country connected to the grid, totalling 38 megawatts at an average size of a 62 kilowatt peak (Gross, 2017).
The connection of SSEG systems to the national grid has proved to be complex territory for municipalities. Municipalities need to ensure that the grid is stable and that safety standards are upheld, which means that consumers who want to connect to the grid have to comply with certain standards, which adds to the cost of a system. At the same time, the

189
h o w r o o f t o p p v c a n e n h a n c e e n e r g y s e c u r i t y f o r h o u s e h o L d s
municipalities realise that if enabling policies are not in place, consumers will connect to the grid via unofficial channels, which has happened to a certain (unknown and unquantified) extent in South Africa. To date, 25 of South Africa’s 184 municipalities that are licensed to on-sell electricity keep track of existing installations, 18 have an official application programme and 12 have approved SSEG tariffs in place (Gross, 2017).
The SSEG tariff design, in terms of setting the import and export tariff to the correct level, is critical to ensure that municipalities do not resist putting enabling policies in place to allow electricity consumers to connect their rooftop PV systems to the grid. For many South African municipalities, revenue from electricity sales is an important component of their income and has multiple uses. It is used to maintain and operate the grid, cross-subsidise tariffs from different sets of users (for instance, from industries to households), subsidise indigent tariffs and finance other service delivery where revenues do not cover costs (Janisch et al, 2012). Thus municipalities may be resistant to consumers installing SSEG systems as this reduces their electricity sales. However, there are opportunities for municipalities to reduce costs (less bulk power purchases from Eskom and a reduction in technical losses) plus municipalities can on-sell the excess electricity that is fed onto the grid from the SSEG customers, at an increased margin, to other customers (provided the export tariff is lower than the bulk electricity purchase price from Eskom). Setting the correct level of SSEG tariffs ensures that allowing rooftop PV customers to connect to the grid has only the desired impact on municipal finances. Carefully designed tariffs can help to achieve revenue neutrality, while still ensuring a positive business case for those electricity consumers who are considering installing solar PV.
In South Africa, there has been regulatory uncertainty at a national level as municipalities and consumers wait for guidance from the National Energy Regulator of South Africa (NERSA). NERSA issued a consultation paper in February 2015 and another in April 2018 which was subsequently withdrawn, but to date regulatory rules are still to be published. However, the South African Local Government Association (SALGA) has a number

C o m p e t i t i o n a n d R e g u l a t i o n f o R i n C l u s i v e g R o w t h
190
of guiding principles on SSEG, and (as discussed earlier) has assisted a number of municipalities in the design of SSEG tariffs. SALGA’s guiding principles to municipalities include (1) municipalities should minimise illegal or informal connections by providing a sufficient incentive to formally connect to the grid in terms of a decent export tariff; (2) solar PV uptake should be encouraged by lowering the administrative burden to potential installers, providing security of investment in the form of a guaranteed tariff and providing low overhead costs for any new equipment required by customers, such as meters; (3) the costs to the municipality should be limited by ensuring that the export tariff is not too high and that grid costs are covered fairly by all users, regardless of whether they are SSEG customers; and (4) municipalities should aim to decrease peak consumption by designing tariffs that provide an incentive for the timely use of electricity (Ferry, 2015).
HOW ROOFTOP PV CAN ASSIST IN SOLVING THE ENERGY CRISIS IN THE SADC
The discussion thus far illustrates that developed countries with enabling policies in place are at the forefront of SSEG worldwide. And this is despite the fact that these countries enjoy far less sunshine than do SADC countries. Figure 5.5 shows solar resources for the top five European countries, as well as for the 15 SADC countries. What is immediately clear is that the SADC’s solar resource potential is far greater than that of Switzerland, Belgium and Germany. Spain and Italy have better solar resources than the three aforementioned countries, however the majority of the SADC countries still enjoy more sun than Spain and Italy.
The impact of a rooftop PV programme depends on the solar resource potential in a particular area; the technical potential of a system in terms of how many kilowatt hours of electricity it can produce, given the available solar resources and the performance of that particular system; and the economics of the programme in terms of whether it makes financial sense to both the SSEG customer and the utility/municipality. The economics is dependent on the regulations and policies that are in place.

191
h o w r o o f t o p p v c a n e n h a n c e e n e r g y s e c u r i t y f o r h o u s e h o L d s
Figure 5.5: Average annual electricity production from a 1 kW system (kWh)
Source: Solar generation data from the PVGIS-CMSAF solar radiation database9
It is useful to revisit the definition of energy security when assessing how a rooftop PV programme can improve it. It is defined as ‘the uninterrupted availability of energy sources at an affordable price’, and thus combines the concepts of uninterrupted supply and cost-effectiveness. Solar PV goes some way to address these elements, however it must be stressed again that it would be most effective as a basket of alternatives that governments can use to improve access and affordability issues in their respective countries.
Regarding the concept of uninterrupted supply, solar PV generates electricity during sunlight hours, and thus without battery storage (which may, however, become a reality in the future) it is confined to certain hours of the day. Figure 5.6 shows solar PV output over a typical 24-hour period, with the consumption profile of a typical household. Thus during sunlight hours those households and businesses with rooftop PV are ensured an uninterrupted supply of electricity, provided the correct size of PV system is installed. In addition, if excess electricity is generated

C o m p e t i t i o n a n d R e g u l a t i o n f o R i n C l u s i v e g R o w t h
192
and fed onto the grid, this can be sold on to other customers which, in turn, impacts those customers’ access to uninterrupted power.
Figure 5.6: Electricity generated and consumed for a household on a typical summer day
Source: Chart was generated using a model developed by the authors to determine the financial impact of SSEG on municipalities in summer; PV electricity was generated using data for a 2-kWp system installed in Pretoria, and consumption is based on load profiles generated using Eskom data for a fictional customer.
The element of cost effectiveness depends on the initial investment required by the electricity customer who chooses to instal rooftop PV, plus the tariffs that are put in place. As discussed in the South African case study earlier, it is a delicate balancing act for municipalities to design tariffs at the correct level so as to incentivise PV uptake while ensuring minimal impact on municipal finances. Thus, rooftop PV means greater security of electricity supply for those customers that have installed it, plus fewer blackouts for these and other customers (as demand from

193
h o w r o o f t o p p v c a n e n h a n c e e n e r g y s e c u r i t y f o r h o u s e h o L d s
Figure 5.7: Electricity generated and consumed for a small business on a typical summer day
Source: Chart was generated using a model developed by the authors to determine the financial impact of SSEG on municipalities in summer; PV electricity was generated using data for a 10-kWp system installed in Pretoria, and consumption is based on load profiles generated using Eskom data for a fictional customer.
the utility is reduced and total available supply is increased). Thus the increased uptake of rooftop PV across the SADC will help to address the SADC’s energy crisis. As discussed earlier, greater security of electricity supply will also contribute to economic development, productive employment, job security and income generation. In addition, it will contribute to enhancing food security among the poor through technologies that can be used for irrigation and water pumping, while providing a reliable and sustainable source of energy for household cooking. Increased security of electricity supply will also provide educational and health benefits to the poor.
From the perspective of government and regulators, electricity generated by solar PV is a reliable, cost-effective and clean solution to

C o m p e t i t i o n a n d R e g u l a t i o n f o R i n C l u s i v e g R o w t h
194
an energy crisis, and is accessible to a large number of people. If it is properly planned and implemented, it can help solve energy shortages at both household and business levels. Governments need to decide on an appropriate roll-out model to ensure that it is financially and technically feasible, and that the sector is sustainable in the long-run and able to self-replicate (Garg, 2014:112).
For rooftop owners, whether they are households or businesses, the key benefits of installing a rooftop PV system include using an idle rooftop space to generate electricity, savings on utility bills or earning additional income if exports exceed imports (and payments to customers are allowed under the relevant scheme). However, there are a number of considerations that face a rooftop owner. One is the financial viability of the PV system: is there a positive business case for the electricity customer who is contemplating installing solar PV? Another consideration is the stability of the grid in terms of whether it is able to accommodate PV connections. In addition, there are several practical considerations such as whether permission is required to instal the system, whether there are third parties available to instal and maintain the system and whether there are any other technical aspects that need to be taken into account (Garg, 2014:113–114).
Rooftop PV is most beneficial to utilities when there is a good match between consumption peaks and solar peaks, especially if the utility is currently facing power shortages in peak demand periods. Because rooftop PV injects power at the ‘tail-end’ of a distribution system – that is, at the point of consumption – it also helps in voltage regulation and loss reduction. However, there are some issues that a utility needs to monitor closely, such as the impact on revenues, the stability of the grid and safety issues, especially if the uptake of rooftop PV is significant. Despite these challenges, Garg (2014:116) suggests that ‘(i)n the long run, it makes sense for the utilities to be willing participants in this market rather than view themselves as victims of this expanding global phenomenon’.
195
h o w r o o f t o p p v c a n e n h a n c e e n e r g y s e c u r i t y f o r h o u s e h o L d s
POLICY OPTIONS AND CURRENT POLICIES IN THE SADC
Clear measures are crucial for creating a successful renewable energy policy which offers long-term security of supply and stability. Greenpeace and EPIA (2011) have developed key recommendations for policy-makers to implement adequate support schemes for rooftop PV. One of the recommendations put forward is using FiTs or similar mechanisms. FiT laws introduce the obligation for utilities to conclude purchase agreements for solar electricity generated by PV systems. In markets where FiTs were introduced as reliable and predictable market mechanisms, they have proven their ability to develop a sustainable rooftop PV industry that has progressively reduced costs towards grid parity. In order to be sustainable, it is critical that FiTs are guaranteed for a significant period of time – at least 20 years – without any possibility of retroactively reducing them.
It is important to promote the development of a sustainable rooftop PV market by assessing profitability to the electricity customer on a regular basis. A critical aspect of sustainable development is ensuring adequate levels of profitability. All available support schemes (including FiTs, tax rebates and investment subsidies) must be taken into account when calculating the return on a rooftop PV investment. With the ongoing decrease in installed rooftop PV system costs and the increase in conventional electricity prices, Greenpeace and EPIA (2011) suggest that the use of financial incentives should be phased out progressively, as competitiveness is reached. Therefore, a roadmap to grid parity should be defined for every country.
All SADC member states have introduced specific policies to encourage renewable energy development, and many have FiT or net-metering policies in place. This section summarises the incentive policies for SSEG in place in the various SADC member states. An area for further research is how successful these policies have been, and what is the actual uptake of rooftop PV in the SADC member countries. Table 5.2 summarises the existing SSEG incentive policies in place and the following discussion provides further detail.

C o m p e t i t i o n a n d R e g u l a t i o n f o R i n C l u s i v e g R o w t h
196
Table 5.2: Renewable energy and SSEG policies in place in SADC member states
Source: Adapted from Ren21 (2015)
Angola
The government of Angola recently approved the National Strategy for New Renewable Energy with the objective of diversifying investment in renewables. Some of the goals set forth in the strategy include developing the use of renewable energy technologies connected to the grid and promoting private and public investment in renewable energy technologies (Angola Energy, 2017). With respect to SSEG, the strategy includes provision for establishing subsidised feed-in tariffs for renewable energies, of up to 10 megawatts, connected to the grid; taking into account the applicable tax system, the type of financing
SSEG policy
Country Renewable energy policy Feed-in tariff Net-metering
Angola X X –
Botswana X X –
DRC X – –
Lesotho X – X
Madagascar X – –
Malawi X X –
Mauritius X X –
Mozambique X X –
Namibia X X X
Seychelles X – –
South Africa X – X
Swaziland X – –
Tanzania X X –
Zambia X – –
Zimbabwe X X X

197
h o w r o o f t o p p v c a n e n h a n c e e n e r g y s e c u r i t y f o r h o u s e h o L d s
and respective interest rates. It is envisaged that these subsidised tariffs will be decreased to ensure the sustainability and competitiveness of renewable energy in the future. In addition, there are provisions for the establishment of renewable energy IPPs and a tender process will be launched to issue licences for the construction of PV power plants connected to the grid, with a total capacity of 100 megawatts, 10 megawatts per year over 10 years.
Botswana
In 2010, the Department of Energy Affairs in Botswana commissioned a study on renewable energy FiTs, identifying significant potential for generating power from solar PV, in addition to other renewable energy technologies. However, the launch of the renewable-energy FiT programme was delayed and few details about the policy have been announced (Beetz, 2015). Nonetheless, Botswana’s National Development Plan 2017–2023 outlines the country’s commitment to improved energy access through the increased supply and availability of electricity. Given the planned structure of FiTs and its inclusion of small-scale generation (≥ 5 MW), the policy could positively impact decentralised generation and community participation in the country (Nganga, Wolhert and Woods, 2013:77).
Democratic Republic of Congo
The Democratic Republic of Congo is looking into developing and promoting the use of renewable energy resources, such as solar PV, through its development programme which is to be fully implemented by 2030. However, apart from the above, there is no clear policy supporting the development and implementation of rooftop solar PV (Kusakana, 2016).
Lesotho
The government of Lesotho developed the Lesotho Energy Policy 2015–2025. One of the objectives in the power generation sub-policy is to develop indigenous renewable energy resources (Lesotho Energy Policy,

C o m p e t i t i o n a n d R e g u l a t i o n f o R i n C l u s i v e g R o w t h
198
2015:11). With respect to rooftop PV SSEG, supporting strategies in the policy include encouraging the participation of the general public in large, mini and micro-solar power; the development of a power purchase agreement framework that will enable the private sector to participate as IPPs in mini or micro solar; and the introduction of a net-metering system (Lesotho Energy Policy, 2015:11).
Madagascar
Madagascar’s Tax Code of 2015 includes a number of fiscal incentives for small and large-scale investments in the production and distribution of renewable energy, including a reduction in corporate income tax equivalent to 50 per cent of the renewable energy investment undertaken; and a VAT exemption for equipment used for the production of renewable energy. The list of products exempted from VAT includes solar PV panels, wind-power generators, and hydropower generators (IEA, 2016b).
Malawi
The Malawi Energy Regulatory Authority (MERA) introduced a FiT policy as part of its efforts to promote renewable technologies. MERA developed a guiding framework on FiTs for electricity generation from various renewable energy sources to promote private and small-scale participation in energy production and supply, and also to boost the development of renewable energy sources (Mwagomba, 2015:5). The policy has been designed in such a way that it enables power producers to sell generated electricity to a distributor at a predetermined fixed tariff for a given period of time.
Mauritius
In 2010, the Small Scale Distributed Generation (SSDG) scheme was launched in Mauritius. The SSDG scheme is a FiT scheme developed to support the deployment of small-scale renewable energy installations up to 2 MW of new electricity generation. The SSDG scheme is designed such that owners of small-scale solar PV installations are eligible to

199
h o w r o o f t o p p v c a n e n h a n c e e n e r g y s e c u r i t y f o r h o u s e h o L d s
export surplus electricity generated back to the grid in exchange for a FiT payment. If the amount of electricity exported to the grid is three times higher than the amount consumed on site, in the following year the generator will automatically be switched to the Greenfield tariff, which is 15 per cent lower than the regular FiT rate. FiTs are granted for a period of 15 years (IEA, 2018).
Mozambique
To support the development of renewable energy technologies, the Mozambique Ministry of Energy launched a renewable energy FiT scheme in 2014 (Beetz, 2015). The scheme targets small-scale solar PV projects of 10 megawatts or less connected to the main grid (World Bank, 2015).
Namibia
Namibia’s FiT programme, drafted in 2013, is intended primarily for small- to medium-sized businesses in the generation of power from various renewable energy sources up to the maximum of 5 megawatts per business (Shilamba, 2015). The FiT programme has a detailed tariff schedule with different tariffs for different facility sizes and for different renewable energy technology projects (Ren21, 2015:69). Namibia has also instituted net-metering, limited to facilities with a capacity of 500 kilovolt-amps (kVA) or lower. The net-metering rules were developed to promote sustainable energy sources, small-scale investments, value addition and electricity market development, and to contribute to reducing unemployment (Electricity Control Board, 2016).
Seychelles
The government of Seychelles, together with the United Nations Development Programme (UNDP) and the Global Environment Facility (GEF), developed the Grid-Connected Rooftop PV Systems Project to jumpstart the PV market in Seychelles (PV Project, 2017). The objective of the project is to increase the use of grid-connected PV systems as

C o m p e t i t i o n a n d R e g u l a t i o n f o R i n C l u s i v e g R o w t h
200
a means of generating electricity in selected islands of the Seychelles, with a focus on small-scale producers who are already connected to the grid (IEA, 2013). One of the major activities implemented under the project is the Financial Rebate Scheme. The Financial Rebate Scheme is designed to remove financial barriers that restrict the adoption of PV by households and small to medium enterprises (PV Project, 2017). In 2014, the scheme offered a 35 per cent rebate (based on the average cost of PV installed in the Seychelles) to all homeowners for the first 3 kilowatt peak of a system installed onto the rooftops of their homes. In 2015, this value was reduced to 25 per cent as the average cost of a PV installation dropped (PV Project, 2017). A 15 per cent financial rebate for commercial premises with installations up to 15 kilowatt peak was also introduced in 2015.
Swaziland
The Electricity Act in Swaziland allows for the supply of distributed renewable energy to the grid. However, there are currently no small-scale grid-connected PV systems in the country because of the absence of clear regulations and by-laws to guide and incentivise third party involvement in distributed PV. However, the Ministry of Natural Resources and Energy is working towards developing a FiT framework for small-scale distributed generation (IRENA, 2014:26).
Tanzania
In 2008, the Small Power Producers (SPP) framework was created in Tanzania to produce an enabling environment for private project development of projects up to 10 megawatts, through standardised power purchase agreements. SPPs can sell power to Tanzania’s main grid or isolated mini-grids, wholesale or retail (Energy and Water Utilities Regulatory Authority [EWURA] 2015). In 2015, EWURA approved the second generation SPP framework for Tanzania. There will be competitive bidding to establish tariffs for solar and wind projects and technology-specific FiTs for small biomass and hydro projects. In addition, for both calculated FiTs and competitively bid FiTs, the cost-

201
h o w r o o f t o p p v c a n e n h a n c e e n e r g y s e c u r i t y f o r h o u s e h o L d s
reflective tariffs will ensure the investor security by providing a fixed price for the duration of the small power purchase agreement, up to 25 years (EWURA, 2015).
Zambia
The government of Zambia offers tax incentives for small solar project developers, including VAT exemptions and tax holidays (Beetz, 2015).
Zimbabwe
Zimbabwe introduced FiTs for renewable energy plants up to 10 megawatts to promote on-grid and off-grid PV applications (Africa-EU Renewable Energy Cooperation Programme [RECP], 2016). Zimbabwe’s FiTs are based on a tariff close to the levelised cost of electricity (LCOE) for each technology. It includes purchase guarantees and a contract period of 25 years (Ren21, 2015:68). Tariffs vary according to the size of the facility and the technology. The Zimbabwe Energy Regulatory Authority (ZERA) has also drafted net-metering regulations intended to govern the generation of electricity from small-scale, grid-tied renewable generators like solar PV generators on rooftops (ZERA, 2016).
Policy support is key for the future development of the PV industry, for both the private investors and the governments involved. This chapter now outlines best practice by looking at the policies in place in leading solar PV countries. As discussed earlier, leading solar PV countries have implemented a number of policy incentives to encourage the uptake of SSEG by electricity customers. Regarding financial incentives, net-metering and net-FiT have been implemented in all of the leading PV countries, as have PV electricity grants. The latter aim to promote the self-consumption of PV electricity generated, while transmitting surplus electricity onto the grid (Song et al, 2016:10). Using electricity generated by PV systems cuts electricity bills, and the additional subsidy granted with the use of PV electricity enhances the return rate to investors.

C o m p e t i t i o n a n d R e g u l a t i o n f o R i n C l u s i v e g R o w t h
202
Countries have also enacted laws to encourage the uptake of PV systems. Although necessary, laws tend to be a weak policy tool as they do not create investment directly but rather give investors and households a guiding framework in which to take action (Song et al, 2016:11).
Investment programmes carried out by government or companies are strong policy tools. This is evidenced by the rapid increase in capacity after the rolling out of a PV programme by government (Song et al, 2016:11). However, this kind of tool has a limitation when extended to residential PV systems – the householder or building owner has to be persuaded to instal a PV system on the outside of their premises even though this does not produce direct profit and mars the appearance of the building. Financing incentives such as FiTs and PV electricity grants stimulate PV investment programmes because they ease the capital burden on government, in turn releasing more civilian capital to invest in PV systems (Song et al, 2016:11).
With the joint efforts of the leading countries in recent years, the cost of PV installations has dramatically reduced. Therefore, PV technology has become a significant and widely accepted source of renewable energy. Expensive initial investment for installation is no longer a major issue in many countries. To promote the rapid uptake of PV systems, government support to increase returns on investment, for example, FiTs and PV electricity grants, have progressively replaced government subsidies and have become the mainstream incentive policies implemented (Song et al, 2016:11).
CONCLUSION
Against the background of the energy crisis in the SADC, this chapter has explained how SSEG – and rooftop PV in particular – can be used to improve the situation for households and businesses. Access to electricity is critical for economic growth. The link between a lack of access and poverty further highlights the urgency to improve uninterrupted access to an affordable electricity supply to all SADC member states.
Renewable energy has the potential to improve the situation in the SADC, as well as contribute to a greener future with less reliance on fossil

203
h o w r o o f t o p p v c a n e n h a n c e e n e r g y s e c u r i t y f o r h o u s e h o L d s
fuels. It has the dual benefit of simultaneously addressing the problems of climate change and energy security. Rooftop PV, in particular, is an attractive option as prices have fallen and the technology has improved, and it provides electricity at the point of consumption, thus reducing transmission and distribution costs. International experience has shown a successful uptake is highly dependent on the policies and incentives that are put in place by governments. Flexibility in government programmes is also key, as the solar PV market matures and different issues emerge, the programme needs to be able to flex to accommodate the changing environment.
There are enabling policies in place in many SADC countries, but most have been introduced only recently. Further research is required to determine the uptake of rooftop PV in these countries to assess the effectiveness of any incentives put in place. At the same time, electricity access and power outages can be tracked to see if the energy security situation is improving.
NOTES
1 Rooftop solar PV systems refer to solar PV systems that are installed on rooftops and elevated areas on consumer premises. They can either be attached to the building or integrated into the building.2 Renewable energy includes solar (PV and CSP), wind (off-shore and on- shore), marine (wave, tidal, OTEC), hydro (storage dam, pumped storage, run of river), geothermal, biomass (biogas, dung, ethanol, gasifier, crop residue, firewood). Note that OTEC is ocean thermal energy conversion (Ramagoma and Adendorff, 2016).3 Poverty is defined using the World Bank’s Poverty headcount ratio, which is the percentage of the population living on less than US $3.10 a day at 2011 international prices. 4 A mini-grid is a system that combines generation capacity and a distribution network. It includes mini-grids that are unconnected to the main grid (ie,. off-grid) and systems that are connected but able to operate independently (APP, 2017:45).5 Note that gross-metering is also sometimes used, where all electricity

C o m p e t i t i o n a n d R e g u l a t i o n f o R i n C l u s i v e g R o w t h
204
generated is exported to the grid, and the household or business effectively becomes an IPP.6 Data obtained from: http://theconversation.com/factcheck-qanda-is- australia-the-world-leader-in-household-solar-power-56670 [Accessed 11 June 2017]. 7 Net-metering originated in the United States in the early 1980s when owners of small renewable power units wanted to use the electricity they produced at times other than when it was being produced. The first scheme was introduced in Minnesota before spreading across the United States, and the first schemes in Europe were set up in Denmark, Italy and Spain.8 kWp stands for kilowatt peak which is peak power, and it refers to the amount of electricity a certain solar panel is able to generate. The kWp value specifies the output power achieved by a solar panel under full solar radiation (under set Standard Test Conditions). Solar radiation of 1 000 watts/m2 is used to define standard conditions. (http://www.solar-is-future.com) 9 http://photovoltaic-software.com/pvgis.php [Accessed 11 June 2017].
REFERENCES
Angola Energy (2025, 2017) New renewables strategy. Available at: http://www.angolaenergia2025.com/en/conteudo/new-renewables-strategy [Accessed 18 June 2017].
Africa-EU Renewable Energy Cooperation Programme (RECP) (2016) Zimbabwe energy sector. Available at: https://www.africa-eu-renewables.org/market-information/zimbabwe/energy-sector/ [Accessed 14 June 2017].
Africa Progress Panel (2017) ‘Lights, power, action’: Electrifying Africa. Available at: http://www.africaprogresspanel.org/policy-papers/lights-power-action-electrifying-africa/ [Accessed 12 June 2017].
Barnes, DF, Hussain, A, Samad, H and Khandker, RS (2010) Energy access, efficiency and poverty: How many households are energy poor in Bangladesh?, Policy Research Working Paper No. 5332, World Bank, Washington DC.
Beetz, B (2015) Emerging markets attract most renewables investment. Available at: https://www.pv-magazine.com/2015/11/23/emerging-markets-attract-most-renewables-investment_100022084/ [Accessed 17 June 2017].
Castellano, A, Kendall, A, Nikomarov, M and Swemmer, T (2015) Powering

205
h o w r o o f t o p p v c a n e n h a n c e e n e r g y s e c u r i t y f o r h o u s e h o L d s
Africa. Available at: http://www.mckinsey.com/industries/electric-power-and-natural-gas/our-insights/powering-africa [Accessed 19 June 2017].
Electricity Control Board (2016) Government Gazette of the Republic of Namibia, Windhoek, 15 November 2016.
Energy and Water Utilities Regulatory Authority (EWURA) (2015) The second generation small power producers framework for Tanzania. Dar es Salaam: EWURA.
Ferry (2015) Guiding principles of municipal position on SSEG (SALGA NEC, 2014). Available at: http://cityenergy.org.za/uploads/resource_297.pdf [Accessed 18 June 2018].
Frank, S (2016) The competitive nature of rooftop PV in the African market. Available at: https://www.esi-africa.com/features/competitive-nature-rooftop-pv-african-market/ [Accessed 19 June 2017].
Fu, R, Chung, D, Lowder, T, Feldman, D, Ardani, K and Margolis, R, National Renewable Energy Laboratory (NREL) (2016) US solar photovoltaic system cost benchmark: Q1 2016. Available at: http://www.nrel.gov/docs/fy16osti/66532.pdf [Accessed 19 June 2017].
Garg, A (2014) Harnessing energy from the sun: Empowering rooftop owners. White paper on grid-connected rooftop solar photovoltaic development models.
Gross, C (2017) Update on PV rooftop developments in South Africa, GIZ/SALGA workshop on Solar Photovoltaic financial and socio-economic impact analysis, 23 March.
Greenpeace and European Voltaic Industry Association (EPIA) (2011) Solar Generation 6: Solar photovoltaic electricity empowering the world. Available at: http://www.greenpeace.org/international/Global/international/publications/climate/2011/Final%20SolarGeneration%20VI%20full%20report%20lr.pdf [Accessed 15 June 2017].
International Energy Agency (IEA) (2013) Seychelles: Grid-connected rooftop photovoltaic systems project 2010–2014. Available at: http://www.iea.org/policiesandmeasures/renewableenergy/. [Accessed 13 June 2017.]
International Energy Agency (IEA) (2016a) Electricity access database. Available at: http://www.worldenergyoutlook.org/resources/energydevelopment/energyaccessdatabase/ [Accessed 13 June 2017].
International Energy Agency (IEA) (2016b) Madagascar: Tax incentives for

C o m p e t i t i o n a n d R e g u l a t i o n f o R i n C l u s i v e g R o w t h
206
renewable energy. Available at: http://www.iea.org/policiesandmeasures/renewableenergy/ [Accessed 13 June 2017].
International Energy Agency (IEA) (2018) Mauritius: Small scale distributed generation (SSDG) (Feed-in tariff/Net metering scheme). Available at: https://www.iea.org/policiesandmeasures/renewableenergy/?country&country [Accessed 28 January 2019]
International Energy Agency (IEA) (ND) What is Energy Security? Available at: https://www.iea.org/topics/energysecurity/subtopics/whatisenergysecurity/ [Accessed 12 June 2017].
International Renewable Energy Agency (IRENA) (2014) Swaziland: Renewables readiness assessment. Available at: http://www.gov.sz/irena_rra_swaziland_2014.pdf [Accessed 13 June 2017].
Janisch, A, Euston-Brown, M and Borchers, M (2012) The potential impact of efficiency measures and distributed generation on municipal electricity revenue: Double whammies and death spirals. Available at: http://www.cityenergy.org.za/uploads/resource_23.pdf [Accessed 13 June 2017].
Karekezi, S, McDade, S, Boardmand, B and Kimani, J (2012) Energy, poverty and development. In Global Energy Assessment: Toward a sustainable future. Cambridge: Cambridge University Press and Laxenburg, Austria: International Institute for Applied Systems Analysis, pp. 151–190.
Kusakana, K (2016) A Review of Energy in the Democratic Republic of Congo. Available at: https://www.researchgate.net/publication/306380971_A_Review_of_Energy_in_the_Democratic_Republic_of_Congo [Accessed 13 June 2017].
Lesotho Energy Policy 2015–2025 (2015) Available at: http://www.solarthermalworld.org/sites/gstec/files/news/file/2016-03-10/lesotho_energy_policy_.pdf [Accessed 13 June 2017].
Mapako, M (2010) Energy, the Millennium Development Goals and the Key Emerging Issues. Pretoria: Department of Environmental Affairs.
Mwagomba, T (2015) Opportunities and challenges of developing geothermal in developing countries: A case of Malawi. World Geothermal Congress 2015, Melbourne, Australia, 19–25 April.
National Energy Regulator of South Africa (NERSA) (2015) Small-scale embedded generation: Regulatory rules, Discussion Paper, 24 February. Available at: http://www.nersa.org.za/Admin/Document/Editor/file/

207
h o w r o o f t o p p v c a n e n h a n c e e n e r g y s e c u r i t y f o r h o u s e h o L d s
Electricity/Consultation%20Paper%20Small%20Scale%20Embedded%20Gx.pdf. [Accessed 13 June 2017.]
Nganga, J, Wohlert, M and Woods, M (2013) Powering Africa through feed-in tariffs: Advancing renewable energy to meet the continent’s electricity needs. A study for the World Future Council (WFC), the Heinrich Böll Stiftung (HBS) and Friends of the Earth, England, Wales and Northern Ireland.
PV Project (2017) Seychelles Sslar PV rebate scheme. Available at: http://www.pvproject.sc/ [Accessed 13 June 2017].
Ramagoma, J and Adendorff, C (2016) Managing a transition to green energy sources: The perspectives of energy practitioners in the Southern African Development Community region, Journal of Energy in Southern Africa, 27(34).
Renewable Energy Policy Network for the 21st Century (REN21) (2015) SADC renewable energy and energy efficiency: Status report. Available at: http://www.ren21.net/status-of-renewables/regional-status-reports/#SADC [Accessed 19 June 2017].
Renewable Energy Policy Network for the 21st Century (REN21) (2016) Renewables 2016: Global status report. Available at: http://www.Ren21.net/wp-content/uploads/2016/06/GSR_2016_Full_Report.pdf [Accessed 13 June 2017].
Salvoldi, S (2015) Net-energy metering and FIT options for small scale embedded generation, SANEA 24–25 June 2015. Available at: http://www.sanea.org.za/CalendarOfEvents/2014/SANEALecturesJHB/Jun24/ShirleySalvoldi-Eskom.pdf [Accessed 19 June 2017].
Shilamba, PI (2015) Update on the current power supply situation and progress made on NamPower Projects and initiatives to ensure security of supply in Namibia, NamPower Centre Windhoek, Khomas Region, 13 April.
Song, A, Lu, L, Liu, Z and Wong, MS (2016) A study of incentive policies for building-integrated photovoltaic technology in Hong Kong, Sustainability, 8: 769.
Southern African Development Community (SADC) (2014) Statistics Yearbook 2014. Available at: http://www.sadc.int/information-services/sadc-statistics#Indicators [Accessed 19 June 2017].
Spencer, F (2016) The competitive nature of rooftop PV in the African market, 7 September 2016. Available at: https://www.esi-africa.com/competitive-nature-rooftop-pv-african-market/ [Accessed 28 January 2019].

C o m p e t i t i o n a n d R e g u l a t i o n f o R i n C l u s i v e g R o w t h
208
United Nations Environment Programme (UNEP) (2011) Towards a Green Economy: Pathway to sustainable development and poverty eradication. Kenya: UNEP
Vivien, F and Briceno-Garmendia, C (2010) Africa’s Infrastructure: A time for transformation. Washington DC: The International Bank for Reconstruction and Development and The World Bank.
Volk, D (2013) Electricity networks: Infrastructure and operations: too complex for a resource? International Energy Agency, Insights Series, OECD/IEA, Paris.
Weiss, J (2014) Solar energy support in Germany: A closer look. Prepared for the Solar Energy Industries Association. Cambridge, MA: The Brattle Group.
Wirth, H (2017) Recent facts about photovoltaics in Germany. Freiburg: Fraunhofer ISE. Available at: https://www.ise.fraunhofer.de/content/dam/ise/en/documents/publications/studies/recent-facts-about-photovoltaics-in-germany.pdf [Accessed 13 December 2018].
World Bank (2015) Mozambique energy sector policy Note. Energy Sector Policy Work, Republic of Mozambique. Available at: http://documents.worldbank.org/curated/en/135711468180536987/ACS17091-REVISED-PUBLIC-Mozambique-Energy-Sector-Policy-Note.pdf [Accessed 20 December 2018].
World Bank (2016a) Poverty and Equity Database. Available at: http://databank.worldbank.org/data/reports.aspx?source=poverty-and-equity-database [Accessed 13 June 2017].
World Bank (2016b) World Development Indicators Database. Available at: http://databank.worldbank.org/data/reports.aspx?source=2&series=IC.ELC.OUTG&country= [Accessed 15 June 2017].
Zimbabwe Energy Regulatory Authority (ZERA) (2016) Available at: http://www.zera.co.zw/ [Accessed 15 June 2017].

209
p L a n n i n g a c o u n t r y ’ s e n e r g y i n f r a s t r u c t u r e
6
Planning a country’s energy infrastructure: Emerging debates
from South Africa and their implications
Duncan Lishman, Paul Anderson and Dumakude Nxumalo1
INTRODUCTION
Energy is a critical element in the functioning of the economy, given its ubiquity in modern life. This ranges from supporting economic growth and development to influencing living standards through its impact on inflation and real household incomes. The relationship between energy and economic growth is an interdependent one, as greater economic activity tends to increase energy demand and affordable energy supply aids further economic development.
Market forces play an important role in pricing and allocating energy resources to users. However, there remains a need for policy-makers to maintain oversight and, where required, guide the nature, magnitude and timing of energy infrastructure investments. It is within this context that governments across the world develop long-term energy plans or outlooks. These can differ in scope depending on their purpose, but generally aim to provide a trajectory of the energy landscape 20 to 30 years into the future in an effort to guide and inform policy, and to assist in shaping the optimal mix of energy investments required.

C o m p e t i t i o n a n d R e g u l a t i o n f o R i n C l u s i v e g R o w t h
210
Towards the end of 2016, the South African government published for comment two such long-term energy plans: (1) the Integrated Energy Plan (IEP), which models the overall energy mix for the country up to 2050, and (2) the Integrated Resource Plan (IRP),2 which focuses specifically on the electricity sector. The publication of these two documents brought into sharp focus a number of key issues pertinent to the country’s energy path going forward. These issues are, of course, pertinent not only to South Africa’s energy path but also to those of other countries in the region and are likely to be of interest to regulators, policy-makers and practitioners. We therefore use South Africa’s experience as a case study, although we also refer to energy plans from other countries, particularly those on the African continent, including those published by Angola, Kenya, Rwanda and Tanzania.
This chapter uses the South African context to identify and examine four key areas of the debate around long-term energy planning. These are (1) the need to clearly establish the role and purpose of energy plans; (2) the manner and extent to which environmental considerations should be taken into account in determining the future energy mix; (3) the importance of inputs and assumptions used in the modelling process; and (4) the pertinent factors for comparing different generation technologies as economies shift their energy reliance away from carbon-intensive fuels.
Utility regulators can also provide valuable guidance on these issues. Although policy formulation is typically outside their remit, regulators are sector specialists and can provide input and guidance, which improves the ultimate accuracy and usefulness of the modelling contained in the plans. Energy plans can provide regulators with useful direction on priority areas for the development of the energy industry. Consideration of these issues will assist in developing energy plans that are better positioned to deliver sustainable energy infrastructure and services for the African continent that meet the demands of users.
211
p L a n n i n g a c o u n t r y ’ s e n e r g y i n f r a s t r u c t u r e
AN OVERVIEW AND AN AFRICAN PERSPECTIVE ON ENERGY PLANS
Why should a state plan for future energy infrastructure investments? Energy is critical for developing and modernising economies (International Atomic Energy Agency, ND; World Bank, 2017). Access to energy improves quality of life and forms the foundation of progress in many important areas of development (World Bank, 2009; 2017). Conversely, inadequate energy infrastructure and supply reduces productivity, employment and firm competitiveness, which ultimately constrain economic growth (World Bank, 2009). Even though much of the work in the energy sector can be left to market forces, there is a role for the state to play in (1) planning and guiding investments in generation, transmission and distribution over the medium to long term, and (2) establishing policy, which private and public players can act on to achieve energy goals.
Several reasons support a state undertaking long-term planning in the energy sector. First, the construction of generation assets is extremely capital intensive. For many generation technologies, the upfront capital cost constitutes the major component of the life-cycle levelised cost of electricity (LOCE) from the generating unit. For example, research by the International Energy Agency indicates that, for a coal plant, the upfront investment cost can constitute up to 50 per cent of the total lifetime cost, while for a nuclear plant and onshore wind, it is higher than 80 per cent and for solar PV, it can be upwards of 90 per cent (International Energy Agency, 2015). A summary of these capital intensities is shown in Figure 6.1. Furthermore, once built, these assets exist for a long time (often upwards of 30 years) and reflect a sunk cost, which cannot be easily recovered through resale of the underlying asset. The implication is that incurring these upfront capital costs, as well as their timing, has a material impact on electricity tariff paths over the life cycle of these plants. Therefore, getting both timing and technology choices right are critical for a country’s future energy path. In fact, the decisions around technology and timing are arguably the most important factors to ensuring sustainable and lowest-cost access to electricity for a country’s population.

C o m p e t i t i o n a n d R e g u l a t i o n f o R i n C l u s i v e g R o w t h
212
Figure 6.1: Capital intensity of different technologies as measured by the ratio of investment cost to total cost (for various discount rates)
Source: International Energy Agency (2015) Projected Costs of Generating Electricity, p. 123
Second, the lead times to build new energy generation assets are typically long. While renewables like solar PV and onshore wind typically have lead times of three to four years at most, coal and nuclear plants can extend from eight to 10 years (Synapse Energy Economics, 2012). This means that decisions around the building of new capacity need to be made well in advance of when capacity is actually needed. Careful long-term planning is necessary to match the demand and supply several decades into the future. If this planning is not undertaken sufficiently in advance, a country can be held hostage to a limited set of potentially suboptimal supply options, which can be brought on line within a shorter period of time. Worse still, a country could face energy shortages until supply catches up to demand, which may throttle growth and lead to a rapid escalation of tariffs as interim supply sources and new generation assets are rushed online.
Third, infrastructure investment decisions in the energy sector directly impact a range of national objectives such as access to energy, security

213
p L a n n i n g a c o u n t r y ’ s e n e r g y i n f r a s t r u c t u r e
of supply, cost of energy, reduction in emission levels, job creation and environmental considerations. Therefore, the choice of energy sources can affect society beyond merely the direct monetary cost of supply. This is something that market forces on their own, such as the relatively slow formation of price signals, may not provide private actors with sufficient incentive to address. As a result, government oversight is important to guide decisions in the energy sector that are socially beneficial, taking into account the externality effects, the policy imperatives and the aspirations of the country as a whole (World Bank, 2009).
Fourth, the various policy objectives impacted by energy investment decisions can be in competition with one another or even contradictory in nature. For example, the lowest cost option of supply may not deliver the greatest job-creation prospects or be the most environmentally friendly option. Guidance is, therefore, required on how best to balance and prioritise different policy imperatives. The state is typically responsible not only for the provision of affordable energy but also for other social goods and other aspects of society, such as economic development, job creation, public health and environmental protection. As a result, governments are well placed to provide this guidance and craft policy that deals appropriately with these trade-offs.
Fifth, energy sources are typically an array of various units of capacity, which can be geographically dispersed and situated a distance from the centres of demand. Planning can assist in organising these disparate production or generation assets, and how they connect to the existing grid or pipeline infrastructure.
Finally, governments can play an important role in the financing of energy infrastructure investments. The required investments can be massive and governments can assist either through the financing energy investments (directly or through state-owned companies) (World Bank, 2009) or by providing the policy environment necessary to attract private finance (Organization of American States, ND).
Coordinating policy objectives with energy investment decisions is, therefore, important to delivering good medium- to long-term energy outcomes, which may be defined as stable and low-cost tariff paths that

C o m p e t i t i o n a n d R e g u l a t i o n f o R i n C l u s i v e g R o w t h
214
fund socially desirable technology choices and meet the energy needs of a country. An energy plan that captures a country’s policy direction in its future investment schedule can lead to such desirable outcomes.
In terms of their elements, energy plans essentially model the energy demand and supply over a 20- to 30-year time horizon. This modelling often starts with the current energy usage levels and the mix by sector and takes prevailing policy as given. It then applies economic growth and anticipated structural changes to create a baseline in energy demand by energy source. It may also seek to measure other effects, such as greenhouse gas (GHG) emissions. The modelling will normally increase in complexity by incorporating the impact of certain policies or regulations, as well as including expectations about the supply side (for example, crude oil pricing). These factors are typically incorporated into different modelling scenarios to determine how that may impact on demand, energy supply mix, pricing and/or emissions. As circumstances change, the idea is to update the model periodically.
Understanding and forecasting how energy demand will evolve over time is crucial for correctly planning the energy supply mix that will service such demand. This situation points to a potential conundrum: it indicates why energy plans are important and necessary for achieving desirable energy futures but, at the same time, exposes the dangers in developing an energy plan with incorrect forecasts. It is critical to take sensitivities to demand forecasts into consideration – and what these imply for energy supply investments – when developing an energy plan.
But energy plans are not simply about matching energy supply with demand. They are also about properly understanding in which sectors of the economy energy demand will grow (and at what rate), and what sources of supply will be required to meet that demand. South Africa’s IEP, for instance, disaggregates demand based on sectors of the economy and the energy sources that service the demand in these sectors vary accordingly (SA Department of Energy, 2016a). At the time the IEP was published, South Africa faced an electricity supply surplus. An exacerbating factor in this regard was the anticipated reduction in the economic contribution of mining and industry, and

215
p L a n n i n g a c o u n t r y ’ s e n e r g y i n f r a s t r u c t u r e
an increasing contribution by the less energy-intensive services sector (Frost and Sullivan, 2017; De Vos and Loser, 2017). (South Africa’s net surplus position dissipated in 2018 through breakdowns and sub-optimal performance at several generating units of state-utility Eskom.)
Different energy plans can also highlight particular social values, often reflected in the type of energy investments to be made, as well as other policy objectives that underpin these investments. An economy that is built on baseload power from fossil fuels, which is required by climate change policies to lower its GHG emissions, will have different technologies in its energy plan from an economy that does not share the same policy objective.
A global review of energy planning reveals that many countries employ long-term energy outlooks. This can either be done for the energy sector as a whole or for individual subsectors (such as electricity, gas and liquid fuels). The general purpose of these outlooks is to inform energy policy – ie, the outlook on pricing or emissions on the current trajectory may be deemed unfavourable and this provides an indication that policy interventions may be required to change the trajectory. In some cases, the primary focus of these outlooks is to provide forecasts of the energy landscape (under various scenarios), with no policy goals formulated or direction given. In other instances, energy outlooks go further and provide policy recommendations and even the formulation of policy goals.
Although there are various ways in which energy planning documents can be put together, we broadly categorise these into two types: energy forecasts and energy plans.3 The approach taken by several countries in mapping their energy outlooks is classified and outlined briefly. (A summary table is provided in Appendix 6.1.)
As a type, energy forecasts are relatively agnostic to policy and tend to simply offer forecasts of future energy paths, based on various scenarios. In North America, the United States (US) has an Annual Energy Outlook, which models projections of domestic energy markets through to 2050 (US Energy Information Administration, 2017). This energy outlook is modelled annually and is done on a reference case

C o m p e t i t i o n a n d R e g u l a t i o n f o R i n C l u s i v e g R o w t h
216
of prevailing policy conditions, with several alternative scenarios that model differences in economic growth, oil prices, technological change, and emissions rules (US Energy Information Administration, 2017). In Canada, the National Energy Board provides regular projections of the country’s energy future. The latest reference case is based on a moderate view on expected energy prices and economic growth through to 2040. There are additional modelled scenarios based on differences in natural gas prices, no construction of new oil pipelines and varying degrees of liquefied natural gas (LNG) export volumes (National Energy Board, 2016).
In Europe, the Swedish Energy Agency provides a projection of four possible energy futures, supported by a change in society to 2035 and later to 2050. These do not represent any political decisions but provide projections based on what society may deem important regarding energy (SE Agency, 2016). The German Federal Ministry of Economics and Technology publishes a forecast of the energy industry’s development every few years. The latest reference scenario estimates developments based on expected economic, demographic and political change to 2035. Thereafter, trends are extrapolated through to 2050 (German Federal Ministry of Economics and Technology, 2014). The final modelled scenario is based on the aggressive pursuit of energy and climate protection goals (German Federal Ministry of Economics and Technology, 2014). And in the United Kingdom, the Department of Business, Energy and Industrial Strategy provides annual projections of energy demand and emissions. The latest projection models a reference scenario based on existing and agreed-to policies through to 2035. These scenarios are also modelled without climate change policies (UK Department of Business, Energy and Industrial Strategy, 2016). There are further scenarios based on differences in fossil-fuel prices and economic growth, as well as one that excludes planned policies.
In Australia, the Energy Market Operator presents 20-year outlooks for the gas and electricity markets annually. The latest outlooks are modelled on ‘weak’, ‘neutral’ and ‘strong’ scenarios, which, inter alia, have their basis in the relative strength of the economy, consumer
217
p L a n n i n g a c o u n t r y ’ s e n e r g y i n f r a s t r u c t u r e
confidence, population projections, and oil and gas prices through to 2035/36 (Australian Energy Market Operator, 2016).
As distinguished from energy forecasts, energy plans are plans in the true sense of the word, either directed towards implementing existing policy or defining/shaping policy going forward, or some combination of the two. The European Union (EU) has an energy plan with the overarching policy goal of reducing emissions in 2050 by 80 per cent of their 1990 levels, in what it terms a ‘decarbonisation’ strategy (European Commission, 2012). It uses as its reference case, current trends and the prevailing policy environment. In addition, it provides a set of specific scenarios, which incorporate events that may alter the EU’s ability to reach its emissions goals (for instance, a delay in the introduction of carbon capture and storage technology). Based on this modelling, the EU draws out implications for its policy goal of decarbonisation and then provides a discussion of policies and recommendations that may support this goal (European Commission, 2012). Therefore, this energy plan serves to track the likely energy trajectory against a clearly defined policy objective and offers specific recommendations as to how to redirect the energy trajectory towards the preferred path (where required).
In Africa, at least five energy plans are of particular interest. Rwanda’s Energy Sector Strategic Plan is not a long-term energy plan as it charts strategy for the sector through to 2017/18, but it is noteworthy given that the plan sets out target objectives, which follow from overarching policy goals set by the country’s Economic Development and Poverty Reduction Strategy and the National Energy Policy. Targets identified in the plan include: (1) increasing electric power equivalent installed capacity (generation and imports); (2) increasing access to grid electricity; (3) ensuring energy efficiency; (4) reducing carbon intensity; (5) ensuring 80 per cent of homes use clean cooking technology; (6) achieving the EAC Regional Integration Policy for the energy sector; and (7) ensuring infrastructure to accommodate petroleum strategic reserve requirements (Ministry of Infrastructure, Republic of Rwanda, 2015). The plan provides strategies for the challenges identified in the electricity, biomass and petroleum sectors. Project financing estimates

C o m p e t i t i o n a n d R e g u l a t i o n f o R i n C l u s i v e g R o w t h
218
are finally presented with the financing responsibilities individually split between the public and private sectors, development partners and district financing.
Angola’s Energy Long Term Vision 2025 is a policy document that envisions an increase in electrification from 30 per cent to 60 per cent of the population by 2025. The policy is predicated on strong demand growth through increased residential demand, the development of the services sector and industrialisation (República de Angola, 2017). A series of supply scenarios are developed, with the three options that presented the lowest overall cost – factoring in generation costs, investment, impact on transmission, and so on – being selected for further scrutiny. The energy supply path adopted is one that balances hydro and gas (República de Angola, 2017). The policy sets out financing principles, indicating where public funds are to be used and where the private sector is to play a role. Transmission and distribution costs are accounted for in the policy, and in locations where network extension is unfeasible, off-grid solutions are recommended (República de Angola, 2017).
Kenya’s Power Generation and Transmission Master Plan (PGTMP) sets out the expansion path of the Kenyan power system for the period 2015 to 2035 (Kenyan Ministry of Energy and Petroleum, 2016). Four demand scenarios are modelled and a corresponding generation mix is proposed, which identifies preferred technologies for base load, intermediate (mid-merit) and peaking power. The plan ultimately foresees an expansion of existing geothermal generation, supplemented by other renewable sources, including wind, biomass and solar plants (Kenyan Ministry of Energy and Petroleum, 2016). A small portion of the energy mix will be supplemented by electricity generation from coal and imports. Based on the results of the model, the plan recommends a particular transmission network. Finally, the plan provides guidance on the investments required to achieve the envisioned generation mix (Kenyan Ministry of Energy and Petroleum, 2016).
For Tanzania, the Power System Master Plan (PSMP) 2016 is an update of a 2008 plan, with an aim to increase electrification in the country from 41 per cent in 2015 to more than 50 per cent in 2020

219
p L a n n i n g a c o u n t r y ’ s e n e r g y i n f r a s t r u c t u r e
and 90 per cent in 2040 (Tanzanian Ministry of Energy and Minerals, 2016). Various demand forecasts are used as inputs into the generation and transmission planning. The plan considers generation mixes, which include hydro, thermal, coal, gas-fired, nuclear and import sources, and develops a transmission plan through to 2040 (Tanzanian Ministry of Energy and Minerals, 2016). The various technology mixes are ranked in terms of cost, energy balance and environmental impact. The Tanzanian plan also provides estimates for the investments needed for generation, transmission and distribution through to 2040.
In South Africa, the draft 2016 IEP assesses and models the overall energy sector (with the IRP having a similar approach for the electricity subsector only). The IEP models energy demand and the associated optimal supply mix over a 35-year time horizon to 2050, based on several scenarios. Within certain parameters, this supply mix aims to provide the least-cost energy system to meet the required demand. Under each of these scenarios, the draft IEP models energy demand by using current energy consumption trends for different sectors of the economy (agriculture, commerce, industry, residential and transport) and by taking into account assumptions around energy and vehicle efficiency and the penetration of electric vehicles in the transport sector. Given the energy demand forecast under each scenario, the draft IEP models the least-cost energy supply mix within certain parameters.4 This supply mix is modelled for the electricity and liquid fuel subsectors separately (inclusive of imports), and then aggregated up to provide a total energy system cost. The modelling outputs are not only presented in terms of the energy supply mix but also the other policy objectives, including employment opportunities, emissions and water consumption. The IRP proceeds on a similar basis. The plan concludes with a series of policy recommendations arranged by topic (SA Department of Energy, 2016a).
A pan-African perspective may be drawn from specific features of African energy plans. There are a number of identifiable features in the energy sector planning across African countries. One such feature is the policy priority to increase the level of electrification across African
C o m p e t i t i o n a n d R e g u l a t i o n f o R i n C l u s i v e g R o w t h
220
countries. This, together with an anticipation of relatively strong economic growth in certain countries, means that, for most African countries, it is necessary to greatly expand generation capacity and transmission networks over the next two decades.
In some respects, this context enhances the need for robust energy planning in African countries, particularly given the large investment decisions that are required. This context also translates into at least three noticeable features of African energy plans, which give them a different flavour to those of many developed countries. First, the need to introduce substantial new generation capacity means that the energy plans of African countries are clear in their intention to direct and shape the infrastructure investment decisions. An obvious focus of this planning process is to direct the size, technology and timing of new generation capacity that would be optimal for the country. In contrast, in many developed countries, energy planning is directed at providing a forecast of demand, supply and environmental impact based on various scenarios. In these countries, there is less of an imperative to increase generation capacity, which makes the need for an integrated energy plan that plots the path for these decisions less important.
Second, the focus on expanding generation capacity also means that the energy plans of many African countries contain specific elements that are not commonly found in the energy plans of developed countries. Countries such as Angola, Kenya and Rwanda deal with how generation technology (and related infrastructure) investments may be financed. In the case of Kenya, a chapter of the plan is dedicated to exploring the matter of funding the country’s favoured energy expansion plan.
Finally, the drive to increase electrification in African countries not only impacts the need for new generation capacity but also the need to expand the transmission and distribution network. For this reason, a number of African energy plans, such as those of Angola, Kenya, Rwanda and Tanzania, also include costs related to additions and upgrades to the network infrastructure (in conjunction with the introduction of new generation capacity). This is an element typically not found in the energy plans of developed countries. Again this may be because the expansion

221
p L a n n i n g a c o u n t r y ’ s e n e r g y i n f r a s t r u c t u r e
of already established transmission and distribution networks might not be as strong an imperative as it is in many African countries.
WHEN A PLAN COMES TOGETHER: EMERGING DEBATES IN ENERGY PLANNING
Although there are various ways in which energy outlooks can be and are ultimately put together, our experience in South Africa has highlighted a set of potential lessons that are likely to be of relevance to other countries compiling or updating their energy plans. The remainder of this chapter uses the South African context to identify and examine four key aspects of the debate around long-term energy planning, including the need for clarity about the ultimate role and purpose of a country’s energy plan; the manner and extent to which environmental considerations should be taken into account; the importance of the inputs and assumptions for the scenario modelling; and the pertinent factors that may inform the choice between different generation technologies as society moves away from fossil-fuel technologies.
Is there clarity regarding the role and purpose of a country’s energy plan?
It is evident that the choice of the role and purpose of an energy plan is open to policy-makers. But what the plan must ensure is that it has a clear purpose and that the underlying content of the document follows through on this purpose. We use the South African IEP as a case study in this regard, discussing a couple of key points that emerge.
First, what is the role and purpose of an energy plan in expressly shaping policy? Whether an energy plan is only intended to provide an energy outlook for the country or whether its role is also to shape and direct policy for the energy sector, it is imperative that its purpose is clear. Neither approach is clearly superior, as either option may be legitimate. However, clarity is required given that the purpose impacts on the content of the document, as well as its general standing in the broader energy policy context.
The purpose of a country’s energy plan has implications for the type of modelling and scenarios to be employed, as well as the extent

C o m p e t i t i o n a n d R e g u l a t i o n f o R i n C l u s i v e g R o w t h
222
to which the results are analysed and ultimately translated into concrete policy recommendations. For example, an energy plan that is intended to direct infrastructure investment decisions and shape energy policy will need to provide guidance on how potentially competing policy objectives should be prioritised, relative to one another, and, ultimately, what energy path is optimal. Energy plans with this purpose would also need to pay careful attention to the developed recommendations for these to usefully shape policy. In particular, recommendations may need to provide guidance on how to balance the competing policy objectives laid out in the energy plan and indicate the preferred trajectory for the country’s energy landscape. Recommendations should be clearly linked to the modelling results, focus on key issues and provide sufficient specifications to take the country towards this trajectory. On the other hand, if the purpose of a country’s energy plan is to provide an outlook on demand and supply under various scenarios rather than directly shape policy decisions, guidance on competing priorities and concrete recommendations may be less important.
In the case of South Africa’s IEP, criticism has been levelled at the plan’s possible ambiguity regarding its purpose and role. South Africa’s IEP does well in corralling various government policies into an overarching strategy for the energy sector.5 In this sense, the IEP serves as an organising device for a wide range of energy policy objectives relevant to the energy sector.6 The IEP then models, in some detail, outcomes of various energy paths for a range of scenarios against these identified policy objectives (South African Department of Energy, 2016a). Importantly, the IEP also describes its own role as providing the direction for the overall energy landscape and policy.
However, in a number of other important respects, the IEP is currently not fulfilling a significant function, beyond merely providing a trajectory of the energy landscape under various scenarios. For example, the bulk of the IEP relates to describing the modelling methodology and its results. No careful and thorough analysis is made of the main trends and the implications emanating from the results, nor is there clear guidance as to how competing policy objectives should be navigated when choosing

223
p L a n n i n g a c o u n t r y ’ s e n e r g y i n f r a s t r u c t u r e
the optimal energy mix. Further, although the IEP does conclude with a series of recommendations, the scope of these are overly broad and many of the recommendations are pitched at either too high a level or are too general to substantively shape policy direction.7 For the IEP, and similar types of plans, to fulfil its stated purpose more effectively, the focus should be on specific and concrete actions that move the country towards an optimal energy landscape.
Second, the hierarchy between a broad energy sector plan and other energy subsector plans should be made clear. South Africa’s IEP exists in a policy environment that has several sector-specific plans, which may overlap with the functions of the IEP; for example, the IRP exists to shape electricity generation; the Gas Utilisation Master Plan is there for the gas sector; the Liquid Fuel Infrastructure Roadmap maps liquid fuels; and then there is the Transport Master Plan. The National Energy Act acknowledges this situation, noting that ‘[t]he Integrated Energy Plan must inform and be informed by plans from all supply, production and demand sectors whose plans impact on or are impacted by the Integrated Energy Plan’8 [emphasis added].
Currently, the standing of the IEP vis-à-vis the other sector-specific energy plans is unclear, as they appear to vie for relevance in shaping policy. This confusion may be heightened as other sector-specific plans relating to gas and transport are developed further. Therefore, the roles of these various plans need to be well defined. It is important that each plan has a specific and defined purpose and that the roles of the sector-specific plans do not duplicate that of the IEP, and that the hierarchy of the plans is worked out and clearly articulated.
How can energy plans appropriately take into account environmental considerations?
Society continues to place increasing emphasis on the environmental impact of energy choices. This is most apparent from the widespread acceptance that climate change is influenced by human activity and that this requires different energy choices going forward.9 Broadly speaking, there are two ways in which the modelling contained in

C o m p e t i t i o n a n d R e g u l a t i o n f o R i n C l u s i v e g R o w t h
224
energy plans have accounted for this social valuation: emissions limits and externality pricing.
Emissions limits can play an important role in energy planning and feature in the energy models of several countries. These limits are quantitative restrictions on GHGs and other air pollutants released into the atmosphere. They tend to be notional, in that they are typically not binding on the countries that agree to them and, instead, act as aspirational targets. The Paris Agreement, signed in 2015, is a recent example of a prominent global agreement to counter the effects of climate change by, inter alia, seeking commitments from signatories to curb emissions (United Nations, 2015).10 In effect, the agreement attempts to introduce an emissions limit for all signatory countries – albeit non-binding, they are specifiable for each party to the agreement. A three-speed approach is envisaged: developed countries are prompted to take the lead in economy-wide emissions reduction targets (United Nations, 2015); developing countries are permitted more time to reach their peaks (but required to rapidly reduce emissions thereafter) (United Nations, 2015); and the least developed and small island developing countries are only required to communicate their plans for reducing emissions (United Nations, 2015).
Several countries have incorporated emissions limits into their energy plan modelling. For instance, the EU’s energy plan has the overarching policy goal of an 80 per cent reduction in 1990-level emissions by 2050 and the plan’s forecasts are used to check progress against this target and makes recommendations on how to meet the decarbonisation objectives (European Commission, 2012). The US Annual Energy Outlook includes carbon dioxide emission limits in its modelling (US Energy Information Administration, 2017). The energy plans of Angola and Tanzania consider the level of carbon dioxide emissions associated with different generation scenarios (Tanzanian Ministry of Energy and Minerals, 2016; República de Angola, 2017). Rwanda’s energy plan has specifically set out ‘carbon intensity reduction targets’ of 10 per cent by 2018 and 25 per cent by 2025 (although they do not appear to play a role in the modelling ultimately) (Ministry of Infrastructure, 2015).

225
p L a n n i n g a c o u n t r y ’ s e n e r g y i n f r a s t r u c t u r e
Similarly, South Africa’s IEP takes into account South Africa’s policy position on reduced emissions by imposing emission constraints in each modelled scenario, which informs the recommended generation mix (SA Department of Energy, 2016).11 12 These are based on the Peak-Plateau-Decline (PPD) emissions limits from the National Climate Change Response White Paper. Except for the Environmental Awareness scenario (which uses the PPD lower bound), all scenarios in the IEP are based on the PPD upper bound (SA Department of Energy, 2016a). This envisages emissions reductions of 34 per cent below the expected emissions level in 2020, and 42 per cent below the expected level by 2025 (SA Department of Energy, 2016b).13
Externalities are a common yet powerful insight in economics. The basic notion is that undertaking a particular activity can generate costs (or benefits) for others or society as a whole that are not fully captured in the price or cost of the initial activity. In the absence of well-defined property rights, any negative externalities (that is, the costs imposed on others from undertaking a particular activity) generated by the activity will go unpriced and too much of the activity will occur relative to a situation in which a monetary cost is attached to that externality.14 This is precisely the basis for countries having begun to contemplate, and in certain cases introduce, taxes on the emissions from burning various fossil fuels as sources of energy. Primary among these is carbon dioxide emissions, which countries such as Finland, Poland, Sweden and Japan are trying to combat through carbon taxes (World Bank, 2015).
In the case of South Africa’s IEP, certain externalities are explicitly priced as part of the overall energy systems cost. These are carbon dioxide, sulphur dioxide, nitrogen oxide, mercury and particulate matter (South African Department of Energy, 2016a). Including the cost of these externalities in this way not only influences the overall cost of the energy mix but also plays a direct role in determining the energy mix. In other words, the externality costs are modelled in the IEP as actual monetary costs to be taken into account in meeting the model’s least-cost constraint for determining the energy mix.15 These costs are reflected in Figure 6.2.
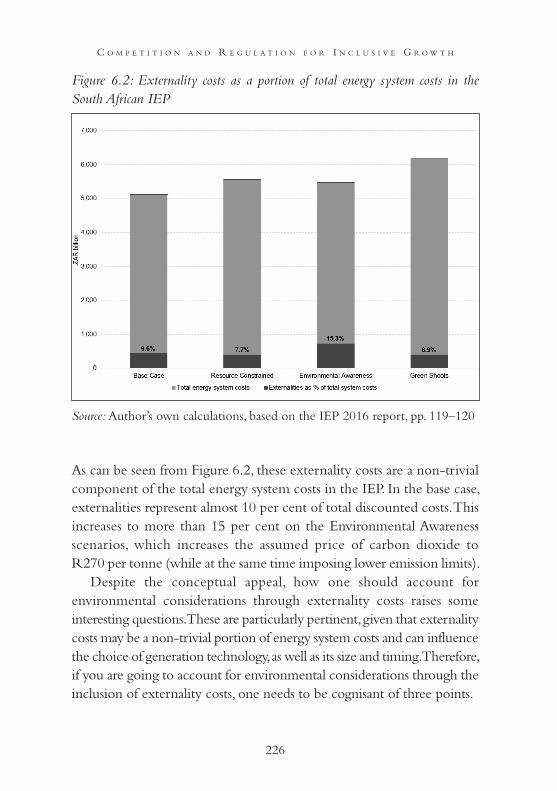
C o m p e t i t i o n a n d R e g u l a t i o n f o R i n C l u s i v e g R o w t h
226
Figure 6.2: Externality costs as a portion of total energy system costs in the South African IEP
Source: Author’s own calculations, based on the IEP 2016 report, pp. 119–120
As can be seen from Figure 6.2, these externality costs are a non-trivial component of the total energy system costs in the IEP. In the base case, externalities represent almost 10 per cent of total discounted costs. This increases to more than 15 per cent on the Environmental Awareness scenarios, which increases the assumed price of carbon dioxide to R270 per tonne (while at the same time imposing lower emission limits).
Despite the conceptual appeal, how one should account for environmental considerations through externality costs raises some interesting questions. These are particularly pertinent, given that externality costs may be a non-trivial portion of energy system costs and can influence the choice of generation technology, as well as its size and timing. Therefore, if you are going to account for environmental considerations through the inclusion of externality costs, one needs to be cognisant of three points.

227
p L a n n i n g a c o u n t r y ’ s e n e r g y i n f r a s t r u c t u r e
First, from a conceptual perspective, it may not always be useful to include externality costs as direct monetary costs in the scenario modelling (at least not in all scenarios). There could be an element of double counting in including both emissions limits and externality costs in the modelling. Given that emission limits are included as binding constraints in the IEP’s modelling, externality costs are not required for emission targets to be met. It may actually be inappropriate to include both externality costs and emission limit constraints in the modelling exercise. If emissions limits are the ultimate objective of policy and act as a binding constraint within the model, the value of including externality costs diminishes (especially when they are not explicitly priced in the real world). It would seem that many countries exclude non-monetary externalities for this reason. For example, the US Annual Energy Outlook does not include externalities but does have carbon dioxide emission limits in place (US Energy Information Administration, 2017).
Also, modelling non-monetary externalities may not be reflected in real-world decisions. There is a question about how useful it is to be modelling an optimal energy mix that is shaped by costs that do not transpire in the real world. Given that the commissioning of new generation capacity and electricity tariff paths going forward will be shaped by actual monetary costs incurred, there is an artificiality to modelling a different energy mix based on hypothetical externality costs. This is because it is not a prediction of what will happen in the real world as no actual price signals will exist to steer the energy mix. To be sure, should a carbon tax (or any other externality tax) be introduced in a country, it would seem legitimate to account for the cost of this tax as part of the energy system cost because this would be a cost actually faced by firms and consumers. Therefore, where externalities are priced in as a component of the cost of supply in an energy plan, it should be recognised that direct policy intervention will be required to move a country towards the optimal energy mix as actual price signals alone will not achieve this.
Second, all externalities – positive and negative – should ideally be taken into account if an approach to pricing externalities in the model were to be adopted, although we acknowledge that this is a challenging

C o m p e t i t i o n a n d R e g u l a t i o n f o R i n C l u s i v e g R o w t h
228
exercise and not always possible. Aside from the emissions impact of fossil fuels, other energy technologies can also generate negative externalities, such as grid balancing costs for renewable energy (SA Department of Energy, 2016c), radioactive waste disposal and decommissioning costs for nuclear energy (where not factored into the sale price of electricity), and environmental costs in the case of shale gas extraction (Barth, 2013).16
By only taking into account emissions from the burning of fossil fuels, the relative size of other technologies in the energy mix will be too great.
Third, there can be significant uncertainty and room for subjectivity in the pricing of non-monetary externalities, which brings into question the reliability of any modelling results upon which they are based. For example, a report on externalities, which served as an input into the IEP, is explicit on the impact that pricing externalities can have on energy technology choices: ‘externalities can change the cost ordering of energy technology choices’ (SA Department of Energy, 2016c). Of great concern, therefore, is the accuracy of the costs associated with these externalities. As the authors point out in their conclusions to the externalities work, ‘the [externality] estimates presented here are based on best available but limited evidence. So the actual monetary values presented here would require significantly more research before they could be used in other policy work’ [emphasis added] (SA Department of Energy, 2016c).
In conclusion, the potential material impact of externality costs to overall energy system costs would suggest that the approach to including non-monetary externalities in energy plans should be carefully thought through. This is particularly so given the uncertainty about the precise costs of these externalities and the apparent room for error in estimating them. In some cases, the energy planner may want to make a choice of emissions or externality prices. But at the very least, an energy plan should include scenarios with and without these externality costs so that it is possible to gauge their impact on the energy mix predicted and overall energy system costs. It is important to understand the extent of trade-off (between cost and environmental protection) that may be implicit in least-cost modelling, which includes externality costs as part of the cost base.

229
p L a n n i n g a c o u n t r y ’ s e n e r g y i n f r a s t r u c t u r e
How important is the accuracy of inputs and assumptions for the modelling of energy scenarios?
The importance of the modelling inputs for the scenarios contemplated in an energy plan cannot be underestimated. The well-worn modelling adage of ‘garbage in, garbage out’ is apt when considering both the accuracy of the information/inputs and the appropriateness of the information/input choices. Consider the costs of a particular electricity generation technology, for instance. Both the decision about what comparators should be used and the decision as to the accurate value of the underlying cost data are important for ensuring conclusions from the modelling are robust. It is important to recognise that energy planning has, in a sense, ‘winners’ and ‘losers’. Those stakeholders that may consider themselves to have ‘lost’ in the energy planning process will have a strong incentive to challenge the validity of the modelling and its underlying assumptions. This suggests that accurate and appropriate modelling inputs are not merely ‘nice to haves’ but are fundamental to ensuring the energy planning process is useful.
It is, therefore, necessary to ensure the modelling decisions made (be they assumptions or choices of input data) can be defended. Regulators can play a crucial role in this regard. With their sector expertise and access to detailed information, regulators can play a key role in supplying and checking detailed assumptions and input data used in the modelling process.
In giving force to the importance of modelling inputs, it is worthwhile to include two elements in the energy planning process that give transparency to the modelling. All modelling assumptions must be identifiable, evidence based and testable. Particularly important are the cost and technical assumptions relating to technologies (discussed later), as these determine the mix and timing of investments. For example, South Africa’s IRP imposes seemingly artificial constraints on the generation capacity of wind and solar PV technologies that can be added to the grid each year.17 However, the basis for this constraint is not articulated and, as a result, the assumptions have been contested – most prominently by the South Africa’s Council for Scientific and Industrial Research

C o m p e t i t i o n a n d R e g u l a t i o n f o R i n C l u s i v e g R o w t h
230
(CSIR). The CSIR suggests that the generation mix changes dramatically when the constraint on renewables is lifted, to the extent that the need for new nuclear power (which forms a large part of the IRP’s future installed capacity) falls away entirely. Further, a draft of the plan should be made available for public comment. Society as a whole is affected by the implications of the planning and, therefore, should be given an opportunity to comment. In South Africa, civil society inputs have been vital in identifying important issues, which will hopefully propel the plans towards better planning and eventual policy. However, there is uncertainty around some of the data sources used in the underlying cost and technical assumptions for the different energy sources in the modelling.
What informs the debate between generation technologies?
The increased focus and social value placed on environmental priorities evidently requires a migration away from carbon-rich fossil fuels like coal to cleaner technologies. In the absence of any short- to medium-term breakthroughs in carbon capture and storage (CCS) technology, this implies a migration to other technologies over time. The key questions for energy planners in this situation are: what are these technologies and what size should they account for in the energy supply mix? Two important features of this debate in South Africa have been (1) the cost assumptions about these technologies that is used in the energy modelling and (2) the extent to which these technologies can serve in each other’s stead.
The costs assumed for supply sources in energy plans are critically important in determining the overall electricity generation mix. In South Africa’s energy plans, there has been substantial debate about the roles of renewable and nuclear energy in the electricity supply mix and the cost level at which these technologies enter the modelling. Noteworthy concerns within this debate have focused on appropriate cost comparators for nuclear generation and the learning rates applicable to renewable technologies. This ultimately leads to a comparison of the cost of different generation technologies relative to one another.

231
p L a n n i n g a c o u n t r y ’ s e n e r g y i n f r a s t r u c t u r e
Common cost comparisons include overnight capital costs and the levelised cost of electricity (LCOE) (US Energy Information Administration, 2013),18 both of which could give rise to varying estimates. For example, South Africa’s Department of Energy commissioned a ‘hybrid cost’ study on nuclear energy as an alternative to an EPRI study for cost benchmarks in compiling its energy plans. The department’s study incorporated lower costs from facilities operated in Asian countries. The key question in such a case becomes which costs are more appropriate to use in the modelling, a situation made more challenging when different technology costs are compared to one another.
Renewable energy cost estimates are further complicated by deciding on the appropriate learning rate to be used, that is, the reduction in costs as manufacturers of the technologies accumulate experience.19
Falling costs for renewable energy sources under the successive phases of the Renewable Energy Independent Power Producer Procurement (REIPPP) Programme indicate the importance of assumptions about learning rates (as shown in Figure 6.3), as it can strongly influence the relative cost of different technologies used in the modelling.
Given the debate surrounding the costs of nuclear and renewables, and the importance of these costs in determining the least-cost energy mix, it is critical that energy plans carefully consider the assumptions made in this regard and ensure the cost and technical assumptions are robust, grounded in reliable research and up to date.
A testament to how cost assumptions are continually shifting is the recent decision by the South African Minister of Energy to place a tariff cap of 77 cents per kWh on renewable technologies under the latest window of the REIPPP. This is considerably lower than the IRP’s assumption of 93 cents for solar PV, a point that is made even starker when considering the R1.20 per kilowatt hour for nuclear (as seen in Figure 6.3) (Groenewald, 2017).

C o m p e t i t i o n a n d R e g u l a t i o n f o R i n C l u s i v e g R o w t h
232
Figure 6.3: Average REIPPP tariffs over successive bid windows in South Africa (rand/kWh)
Source: Authors’ own construction, based on CSIR information (CSIR, 2017a; 2017b)
A few other issues may also be relevant in considering the cost comparison of different technologies. It should be considered whether the different energy systems modelled in a plan conform to the same system adequacy metrics and that these are in line with existing metrics for a country’s electricity supply. Without taking this into account, the risk may be that one is not comparing like energy mixes and there may be other costs, which need to be incurred, that are not adequately accounted for in the energy plan.
The role of transmission and distribution infrastructure as an additional source of costs should also be taken into account. While all three other African countries whose energy plans we have considered – Angola, Kenya and Tanzania – take into account transmission and distribution costs in some way, this is currently missing in South Africa’s

233
p L a n n i n g a c o u n t r y ’ s e n e r g y i n f r a s t r u c t u r e
plans, as well as in other jurisdictions (República de Angola, 2017; Kenyan Ministry of Energy and Petroleum, 2016; Tanzanian Ministry of Energy and Minerals, 2016). Were an energy plan to foresee that numerous generation assets could be added that were geographically dispersed and far away from the existing grid and major centres of energy demand, it would seem important to take transmission and distribution infrastructure into account as a source of costs for the energy system. This may be particularly pertinent when considering renewable technologies as a large portion of the energy mix.
With respect to the interchangeability of different power sources, historically South Africa’s generation mix has been dominated by coal plants providing base load supply. Renewable energy sources (in the form of wind and solar power) have been introduced relatively recently to serve as what can be best described as supplementary sources of supply. As environmental concerns make traditional fossil-fuel plants less attractive, and as the cost of renewable technologies falls, a debate has emerged about the extent to which renewables can be used in the generation mix to meet demand going forward. Focus has been placed on whether renewable sources of supply – in the form of solar and wind – can form a larger part of the grid’s overall installed capacity. In both the IEP and IRP of 2016, new nuclear generation capacity is modelled as an important part of the country’s future energy path as the base-load technology to replace the coal fleet as it is retired from service.20
However, there appears to be an implicit trade-off between nuclear and solar/wind technologies in the case of both the IEP and IRP. When the IEP relaxes its presumption of its 9.6 gigawatt nuclear build programme and models all technology choices on a least-cost basis, the IEP requires less nuclear and further in the future. In its place, additional solar, wind and gas generation capacity is required.
As for the IRP 2016, the base case imposes an annual build constraint on wind and solar PV technology. Justification for the imposition of this constraint has not been clearly articulated, though it presumably rests on difficulties relating to technical issues to do with energy supply from renewable sources. When the CSIR removes this build constraint and

C o m p e t i t i o n a n d R e g u l a t i o n f o R i n C l u s i v e g R o w t h
234
remodels the generation mix on a least-cost basis, it finds that no new nuclear generation capacity is required and, instead, more than 70 per cent of generation capacity is envisaged to be renewable technology by 2050 (with the energy mix also containing coal, hydro and gas) (CSIR, 2017a; 2017b).
These results bring into sharp focus the debate regarding the degree to which wind and solar technologies can serve as part of the generation mix and, correspondingly, the extent to which new nuclear generation is required. It is ultimately a technical question – and one outside the scope of this chapter – as to the degree to which nuclear and renewable technologies can be considered as interchangeable with one another. Chief among the technical issues raised with renewable technologies like wind and solar PV is their supply variability and their impact on power system stability. In the case of both these issues, the CSIR has proposed ways in which these technical aspects can be addressed for a power grid with a large proportion of renewable capacity (CSIR, 2017b). What is apparent is that there are differing opinions on the matter in a debate that is still ongoing (CSIR, 2017b; Porter, 2017; Yelland, 2017).21
While the debate continues, for South Africa the 2017 High Court judgment in Earthlife Africa and Another v Minister of Energy and Others22
brought a temporary stay to the country’s nuclear procurement programme. Apart from the effect of the High Court’s decision, the updated draft IRP released in August 2018 removes the need for additional nuclear capacity. Against this backdrop of energy technology tussles, what is evident is that the country does not require immediate investment decisions, given that South Africa currently finds itself with a surplus of installed electricity supply. With a backdrop of weak economic growth and more supply coming online as units at Medupi and Kusile power stations are completed, this imbalance is unlikely to be upset soon. South Africa therefore has a window of opportunity to finalise its energy investment plans as these debates unfold. In light of the importance of decisions about energy investment technologies, it is important this window be used to ensure that appropriate planning decisions are made. This includes careful examination of the assumptions and reasoning

235
p L a n n i n g a c o u n t r y ’ s e n e r g y i n f r a s t r u c t u r e
underpinning any proposed decisions for either nuclear or renewable investments, and to ensure some resolution is reached about what are the ‘right’ energy planning decisions.
CONCLUSION
This chapter has explored the nature and role of energy planning, not only as laid out in South Africa’s recently published energy plans but also in its commonplace practice in various other countries. While having regard for energy plans in general, we have relied on the South African context in particular to identify key issues in energy planning that are likely to be important for shaping future energy developments. First, energy plans need not prescribe infrastructure decisions and directly shape policy as is clear from the approach taken by several jurisdictions, including the United States, Australia and Canada. But where a plan is designed to offer policy inputs, careful attention must be paid to its design. What all energy plans should share is clarity of role and purpose, as this defines what the plan should look like and shapes its content.
Next, it is evident that the future energy mix will shift markedly away from fossil fuels as concerns about climate change become more pressing. Plans that build in emissions limits and/or externality costs attempt to grapple with what this future energy mix will look like, and this is laudable. When using any of these measures in the modelling, it should be ensured that the corresponding energy paths charted are ones that could emerge with existing or planned policies in place.
The importance of the modelling inputs to an energy plan should not be underestimated. Choices regarding assumptions and input data are crucial to ensure that accurate and useful modelling results are obtained. Regulators can assist in this regard, given their sector expertise and access to detailed information from sector participants.
Which energy generation technologies are the heirs-apparent as countries move away from fossil fuels in response to environmental considerations? This is a crucial question and one that does not yet appear to have a clear and immediate answer. Further developments in

C o m p e t i t i o n a n d R e g u l a t i o n f o R i n C l u s i v e g R o w t h
236
the debate will, hopefully, clarify issues related to the degree to which renewable technologies, such as wind and solar PV, can serve in the generation mixes of countries going forward.
NOTES
1 The views expressed in this chapter are the authors’ own and not necessarily those of their employer.
2 The IRP has subsequently been updated with the publication of a revised draft version for public comment in August 2018. We have noted material differences in the update, where relevant.3 Naturally, some plans can have elements of more than one type; for ease of taxonomy we have tried to identify each plan’s dominant type.4 These parameters include the imposition of the 9.6 GW nuclear-build programme and adherence to emission limits that do not allow carbon- emitting energy sources once the scenario’s specified emission limit is reached.5 This is consistent with the National Energy Act that requires the IEP to take into account other government policies and plans. Section 6(3) (a) of the National Energy Act requires that the IEP ‘take account of plans relating to transport, electricity, petroleum, water, trade, macro-economy energy infrastructure development, housing, air quality management, greenhouse gas mitigation within the energy sector and integrated development plans of local and provincial authorities’.6 The IEP synthesises these wide-ranging government policies into eight policy objectives: (1) ensure security of supply; (2) minimise the cost of energy; (3) promote job creation and localisation; (4) minimise environmental impacts; (5) minimise water consumption; (6) diversify supply sources; (7) promote energy efficiency; and (8) promote energy access. See IEP 2016 report (SA Department of Energy, 2016a).7 This includes recommendations like the call for electricity generation to be obtained through a competitive bidding process, or general references that wind and solar should play a more meaningful role in the generation mix (SA Department of Energy, 2016).8 Section 6(3)(b) of the National Energy Act.

237
p L a n n i n g a c o u n t r y ’ s e n e r g y i n f r a s t r u c t u r e
9 Environmental considerations also matter in relation to energy choices when it comes to pollution (air, noise, water and light), geological stability (in the case of shale gas extraction for example), avian migratory patterns (in the case of wind energy), etc.10 That is, to reach the global peak for emissions as soon as possible, with nationally determined contributions. See Paris Agreement, Article 4(13) and 4(16)–4(19).11 See, for instance, National Climate Change Response White Paper, p. 25. (Department of Environmental Affairs, 2011)12 The emissions levels take into account carbon, nitrous oxide, sulphur oxide, particulate matter and mercury.13 South Africa’s GHG emissions are expected to reach global peak between 2020 and 2025, and decline thereafter. 14 Conversely, positive externalities lead to ‘too little’ of an activity given that the value of the activity is lower than it ought to be if the indirect benefits were to be taken into account.15 That the IEP 2016 includes the externality costs on this basis is evident from its description that ‘[t]he mix of generation capacity technologies by 2050 is considerably more diverse than the current energy mix, across all scenarios. The main differentiating factors between the scenarios are the level of demand, constraints on emission limits and the carbon dioxide externality costs’ (IEP 2016 report, p. 114).16 A supporting document to the IEP notes that water ‘over-use’ is a further negative externality of shale gas extraction. Furthermore, the IEP notes that it includes ‘water use’ as an externality in the model, priced at the ‘true water cost’. But at no point does the document clarify or provide any further information on this. In any event, the use of water is an input cost that would likely be included as part of overall technology costs, regardless of whether externalities are priced in the model. Potentially the contamination of water resources in the extraction of shale gas is the type of negative externality that is being proposed.17 The updated draft IRP of August 2018 removed these constraints.18 LCOE takes account of capital costs as well as other costs and effectively represents the average revenue necessary to recoup investment and operating

C o m p e t i t i o n a n d R e g u l a t i o n f o R i n C l u s i v e g R o w t h
238
costs for a given technology. This can be derived with the following variables: (1) capital costs; (2) charge factors; (3) fixed and variable operations and maintenance costs; (4) lifetime of plant; and (5) fuel costs.19 Learning rates are particularly relevant for renewable energy given that commercial power production from these technologies is relatively new compared to established technologies like coal and nuclear.20 The IEP adopts in all four of its main scenarios the implementation of a 9.6 GW nuclear-build programme (between 2026 and 2031) as a given assumption; and in the IRP 2016, nuclear features as the predominant source of new supply.21 The United States is currently covering similar ground following the publication of a research article suggesting that, in the future, the US grid could be sustained successfully using renewable energy, a conclusion that has been called into question. See Porter (2017).22 Earthlife Africa Johannesburg and Another v Minister of Energy and Others 9529/2015) [2017] ZAWCHC 50, 2017.
REFERENCES
Australian Energy Market Operator (2016) National Electricity Forecasting Report 2016. Available at: https://www.aemo.com.au//media/Files/Electr icity/NEM/Planning_and_Forecasting/NEFR/2016/2016-National-Electricity-Forecasting-Report-NEFR [Accessed 3 October 2017].
Barth, J (2013) The economic impact of shale gas development on state and local economies: Benefits, costs and uncertainties, New Solutions, 23(1).
Council for Scientific and Industrial Research (CSIR) (2017a) Least Cost Electricity Mix for South Africa: Optimisation of the South African power sector until 2050. Available at: http://www.crses.sun.ac.za/files/news/CSIR_BischofNiemz_pp.pdf [Accessed 3 October 2017].
Council for Scientific and Industrial Research (CSIR) (2017b) Formal comments on the Integrated Resource Plan (IRP): Updated assumptions, base case and observations 2016. Pretoria: CSIR.
Department of Environmental Affairs (2011) National Climate Change Response White Paper.
De Vos, D and Loser, N (ND) The importance of sensible future energy

239
p L a n n i n g a c o u n t r y ’ s e n e r g y i n f r a s t r u c t u r e
planning. Available at: https://www.businesslive.co.za/bd/opinion/2017-05-15-the-importance-of-sensible-future-energy-planning/ [Accessed 3 October 2017].
European Commission (2012) Energy roadmap 2050. Available at: https://ec.europa.eu/energy/sites/ener/files/documents/2012_energy_roadmap_2050_en_0.pdf [Accessed 3 October 2017].
Frost and Sullivan (2017) South African electricity market: Adaptive power generation models will become essential. Available at: https://ww2.frost.com/news/press-releases/south-african-electricity-market-adaptive-power-generation-models-will-become-essential/ [Accessed 3 October 2017].
Geo-Energy (2016) Baseload renewables: The important facts. Available at: http://geo-energy.org/reports/2016/Baseload%20Summit%20Factsheet_May%209%202016.pdf [Accessed 3 October 2017].
German Federal Ministry of Economics and Technology (2014) Development of Energy Markets: Energy Reference Forecast. Available at: http://www.bmwi.de/Redaktion/Migration/DE/Downloads/Publikationen/entwicklung-der-energiemaerkte-energierefere [Accessed 3 October 2017].
Groenewald, Y (2017) Renewable producers will sign, despite renegotiations – Kubayi, fin24. Available at: http://www.fin24.com/Economy/Eskom/renewable-producers-will-sign-despite-renegotiations-kubayi-20170901 [Accessed 3 October 2017].
International Atomic Energy Agency (ND) Integrated Energy Planning for Sustainable Development. Available at: https://www.iaea.org/OurWork/ST/NE/Pess/assets/IEPSD%20Brochure%20WEB.pdf [Accessed 3 October 2017].
International Energy Agency (2015) Projected Costs of Generating Electricity. Paris: International Energy Agency.
Kenyan Ministry of Energy and Petroleum (2016) Development of a Power Generation and Transmission Master Plan, Kenya Long Term Plan, 2015–2035, Volume I: Main Report. Available at: http://www.erc.go.ke/index.php?option=com_content&view=article&id=167&Itemid=680. [Accessed 3 October 2017.]
Matek, G (2015) The benefits of baseload renewables: A misunderstood energy technology, The Electricity Journal, 28(2).
Ministry of Infrastructure, Republic of Rwanda (2015) Energy Sector Strategic

C o m p e t i t i o n a n d R e g u l a t i o n f o R i n C l u s i v e g R o w t h
240
Plan, 2013/14–2017/18. Available at: http://mininfra.gov.rw/fileadmin/user_ upload/new_tender/Energy_Sector_Strategic_Plan.pdf [Accessed 3 October 2017].
National Energy Board (2016) Canada’s Energy Future 2016: Energy supply and demand provides projections to 2040. Available at: https://www.neb-one.gc.ca/nrg/ntgrtd/ftr/2016/2016nrgftr-eng.pdf [Accessed 3 October 2017].
Organisation of American States (ND) Government’s role in the electricity sector, The Renewable Energy Policy Manual. Available at: https://www.oas.org/dsd/publications/Unit/oea79e/ch08.htm [Accessed 3 October 2017].
Porter, E (2017) Fisticuffs over the route to a clean-energy future, New York Times. Available at: https://nytimes.com/2017/06/20/business/energy-environment/renewable-energy-national-academy-matt-jacobson.html?smid=tw-share&referer= [Accessed 3 October 2017].
República de Angola, Ministério da Energia e Águas (2017) Angola Energia 2025: Angola Power Sector Long Term Vision. Available at: http://www.angolaenergia2025.com/sites/default/files/editor/livro_angola_energia_2025_baixa.pdf [Accessed 3 October 2017].
Royal, T (2017) What is holding renewable back? Available at: http://energypost.eu/holding-renewable-energy-back/ [Accessed 3 October 2017].
SA Department of Energy (2016a) Integrated Energy Plan 2016. Pretoria: Department of Energy.
SA Department of Energy (2016b) Integrated Resource Plan (IRP 2016 update). Pretoria: Department of Energy.
SA Department of Energy (2016c) IEP 2016: Annexure C1 – Energy system externalities in South Africa (Vivid Economics). Pretoria: Department of Energy.
SE Agency (2016) Four Futures: The energy system beyond 2020. Available at: https://energimyndigheten.a-w2m.se/Home.mvc?ResourceId=5603 [Accessed 3 October 2017].
Synapse Energy Economics, Inc. (2012) The Hidden Costs of Electricity: Comparing the hidden costs of power generation fuels. Cambridge, MA: Synapse Energy Economics, Inc.
Tanzanian Ministry of Energy and Minerals (2016) The Power System Master Plan 2016 Update. Available at: http://www.ewura.go.tz/wp-content/uploads/2017/01/Power-System-Master-Plan-Dec.-2016.pdf [Accessed 3

241
p L a n n i n g a c o u n t r y ’ s e n e r g y i n f r a s t r u c t u r e
October 2017].UK Department of Business, Energy and Industrial Strategy (2016) Updated
Energy and Emissions Projections 2016. Available at: https://www.gov.uk/government/uploads/system/uploads/attachment_data/file/599539/Updated_energy_and_emissions_projections_2016.pdf [Accessed 3 October 2017].
United Nations (2015) Paris Agreement. Available at: http://unfccc.int/files/essential_background/convention/application/pdf/english_paris_agreement.pdf. [Accessed 3 October 2017.]
US Energy Information Administration (2013) Levelized Cost of Electricity and Levelized Avoided Cost of Electricity Methodology Supplement. Available at: https://www.eia.gov/renewable/workshop/gencosts/pdf/methodology_supplement.pdf [Accessed 3 October 2017].
US Energy Information Administration (2017) Annual Energy Outlook 2017 with projections to 2050.
Wagner (2016) Surplus from and storage of electricity generated by intermittent sources. Available at: https://link.springer.com/content/pdf/10.1140/epjp/i2016-16445-3.pdf. [Accessed 3 October 2017.]
World Bank (2009) Energy Strategy Approach Paper Sustainable Development Network. Available at: http://siteresources.worldbank.org/EXTESC/Resources/Approach-paper.pdf . [Accessed 3 October 2017.]
World Bank (2015) State and Trends of Carbon Pricing. Available at: http://documents.worldbank.org/curated/en/636161467995665933/pdf/99533-REVISED-PUB-P153405-Box393205B.pdf [Accessed 3 October 2017].
World Bank (2017) Energy: Overview. Available at: http://www.worldbank.org/en/topic/energy/overview [Accessed 3 October 2017].
Yelland, C (2017) The end for ‘baseloadism’ in South Africa, MoneyWeb, 2 August. Available at: https://www.moneyweb.co.za/news/south-africa/the-end-for-baseloadism-in-south-africa/ [Accessed 3 October 2017].

C o m p e t i t i o n a n d R e g u l a t i o n f o R i n C l u s i v e g R o w t h
242
APPENDIX 6.1: SUMMARY OF ENERGY OUTLOOKS FOR VARIOUS OTHER COUNTRIES
Country Basic overview Modelling
US • Annual Energy Outlook 2017
• Provides an outlook of domestic energy markets to 2050
• Prepared by the US Energy Information Administration and is updated annually
‘Modelled projections of what may happen given certain assumptions and methodologies.’
The following scenarios are modelled:(1) Reference case: Trend improvements in known technologies, along with a view of economic and demographic trends. It assumes that current laws and regulations affecting energy are unchanged. Brent crude price is US $109/barrel and 2.2% annual growth.
(2)(a) High oil price case
(2)(b) Low oil price case:
(3)(a) High oil and gas resource and technology case
(3)(b) Low oil and gas resource and technology case
(4)(a) High economic growth cases
(4)(b) Low economic growth cases
(5) Clean Power Plan (CPP) is not implemented

243
p L a n n i n g a c o u n t r y ’ s e n e r g y i n f r a s t r u c t u r e
EU • Energy Roadmap 2050
• Provides results of decarbonisation objectives to 2050
• Prepared by the European Commission
‘The scenarios in this “Energy Roadmap 2050” explore routes towards decarbonisation
of the energy system.’
The following scenarios are modelled:
(0) Reference case: 1.7% pa on average for 2010–2050. US $106/barrel in 2030 and US $127/barrel in 2050 (in year 2008 dollars). This case assumes policies adopted before March 2010.
Reference includes sensitivities: (1) higher GD growth, (2) lower GDP growth, (3) higher energy import prices and (4) lower energy prices.
(1) Updated reference case: It includes policies adopted or proposed post 2010. There are additional policies for energy efficiency, infrastructure, internal market, nuclear energy taxation and transport. Nuclear technology assumptions were updated after Fukushima.
(2) High energy efficiency
(3) Diversified supply technologies
(4) Higher renewable energy
(5) Delayed carbon capture and storage
(6) Low nuclear
Australia • National Electricity Forecasting Report and National Gas Forecasting Report
• Projections are up to 2035/-36
• Projections are made by the Australian Energy Market Operator and is provided annually
‘forecasts explore a range of sensitivities that represent the probable pathway for Australia across weak, neutral (considered the most likely), and strong economic and consumer
outlooks’
The following scenarios are modelled:(1) Weak
(2) Neutral
(3) Strong

C o m p e t i t i o n a n d R e g u l a t i o n f o R i n C l u s i v e g R o w t h
244
Country Basic overview Modelling
Canada • Canada’s Energy Future 2016 – Energy Supply and Demand
• Provides projections to 2040.
• Projections are provided by the National Energy Board and have been produced regularly since 1967.
This report, which centers on a baseline projection, also outlines alternate projections for higher and lower energy prices, and alternate market access and energy infrastructure assumptions, and then goes on to explore the important long-term implications of these energy market uncertainties’
The following scenarios are modelled:
(1) Reference case: outlook based on a moderate view of future energy prices and economic growth. Oil production leads this growth, with production reaching 963 103 m3/d (6.1 MMb/d) by 2040, a 56 per cent increase from 2014
(2)(a) Higher oil and natural gas prices
(2)(b) Lower oil and natural gas prices
(3) No new major oil pipelines are built over the projection period
(4)(a) Higher LNG exports (volumes) from Canada
(4)(b) No LNG exports from Canada
Germany • Development of Energy Markets – Energy Reference Forecast
• Projection to 2035 and 2050
• German Federal Ministry of Economics and Technology and is published every few years
‘Reference Forecast and Trend Scenario, the goals of the German Government’s Energy Concept will, for the most part, not be achieved. The Target Scenario shows what would be required in order to attain the energy and climate protection objectives
defined in the Energy Concept’
The following scenarios are modelled:
(1) Reference scenario: forecast based on energy-sector developments based on expected economic, demographic, and political changes

245
p L a n n i n g a c o u n t r y ’ s e n e r g y i n f r a s t r u c t u r e
Country Basic overview Modelling
Germany These were the sensitivities:
(1)(a) higher energy prices, (1)(b) lowerenergy prices; (2)(a) higher costs for renewables (2)(b) higher costs for renewables; (3) enforced international climate protection (p. 35).
(2) Trend scenario
(3) Target scenario
UK • Updated Energy and Emissions Projections 2016
• Projections of energy demand and emissions to 2035
• Provided by the Department of Business, Energy and Industrial Strategy and is published annually
‘The projections bring together statistical and modelled information from a wide variety of different sources’
The following scenarios are modelled:
(1) Reference: existing and agreed government policies implemented but no new policies introduced. The electricity generation sector only reflects current policy up to 2020. Beyond 2020, the electricity generation scenario includes assumptions that go beyond current policy.
(2) Baseline case: excludes the impact of climate change policies brought since the 2009 Low Carbon Transition Plan8 (LCTP)
(3)(a) Low and high fossil fuel price
(3)(b) High fossil fuel price
(4)(a) Low economic growth;
(4)(b) High economic growth
(5) Scenario excludes planned policies
Sweden • Four Futures – The Energy System Beyond 2020
• Provides projections to 2035 and to 2050
The scenarios are not routes charted according to political considerations, but are a results of changes in society, supported by the population, politicians and the wider
world’
The following scenarios are modelled:1) Forceful2) Tied together

C o m p e t i t i o n a n d R e g u l a t i o n f o R i n C l u s i v e g R o w t h
246
Country Basic overview Modelling
Sweden • Provided by the Swedish Energy Agency
3) Expressive4) Lively
Angola • Angola Energy 2025 – Angola Power Sector Long Term Vision
• Aims to develop the Angolan electricity sector by 2025
• Prepared by Ministéerio Da da Energia E e ÁAguas (Ministry of Energy and Water), Angola
‘This document assesses the main long term options, and establishes the government’s atlas and vision for development of the electricity sector in the 2018–2025 horizon, identifying priority investments in generation, transmission and interconnection, as well as the distribution and network expansion model
up until 2025.’
The following macro-scenarios are modelled:
(1) Investment in hydropower (H): Focus on competitiveness and greater national incorporation of large hydropower projects, limiting new generation based on natural gas.
(2) Investment in gas (G): Focus on having higher guaranteed power and minimising investments in the 2025 horizon, maintaining only the construction of the large hydropower projects already decided.
(3) Hydropower and gas balance (HG): This scenario balances the focus on hydroelectric power with natural gas.
(4) Diversification (D): Focus on a higher diversification of the Angolan energy mix, taking advantage of the new refinery’s coke production in order to create a new primary energy source. The remaining necessary power would also focus on diversification, with a balance between gas and hydropower.

247
p L a n n i n g a c o u n t r y ’ s e n e r g y i n f r a s t r u c t u r e
Country Basic overview Modelling
Kenya • Development of a Power Generation and Transmission Master Plan,
• Kenya – Long Term Plan – 2015–2035
• Provides the respective long term plan (LTP) for the period 2015 (base year) to 2035.
• Prepared by the Ministry of Energy and Petroleum, Kenya
‘The identification and analysis of suitable expansion paths of the Kenyan power system for the long term period 2015 to 2035, complying with the defined planning criteria and framework.’
With regard to demand the following scenarios were modelled:
(1) Reference scenario
(2) Vision scenario
(3) Low scenario
(4) Energy efficiency
Rwanda • Energy Sector Strategic Plan
• Plans for 2013/14–2017/18
• Prepared by the Ministry of Infrastructure, Rwanda
‘The main objective of the Rwandan Energy Sector Strategic Plan (ESSP) is to ensure effective delivery of the set targets in the energy sector, as set out under the EDPRS-II and to guide in the implementation of the National Energy Policy (EP). The ESSP thus functions as a detailed plan that serves to translate the policy directives and principles into concrete measures necessary to reach medium-term targets, reflecting current resource constraints and risk/uncertainties. The ESSP also contains high-level target objectives, and a monitoring framework with key performance indicators and interim milestones.’
The following scenarios are developed for on-grid demand and supply projections to 2017/18 (similar off-grid demand and supply projections are not made):
Likely demand: where demand is 377 MW and supply 444 MW
Optimistic demand: where demand is 473 MW and supply 563 MW

C o m p e t i t i o n a n d R e g u l a t i o n f o R i n C l u s i v e g R o w t h
248
Country Basic overview Modelling
Tanzania • Power System Master Plan – 2016 Update
• Reflects and accommodates recent developments in the economy, including development in the gas subsector as well as government policy guidelines
• Prepared by the Ministry of Energy and Minerals, Tanzania
‘The overall objective of the plan is to reassess short-term (2016–2020), mid-term (2021–2025) and long term (2026–2040), generation and transmission plans requirements and the need for connecting currently off-grid regions, options for power exchanges with neighbouring countries, and
increased supply of reliable power.’
The following power development scenarios are modelled:
(1) Gas: 50%; Coal: 25%; Hydro: 20%; Renewables: 5%
(2) Gas: 40%; Coal: 35%; Hydro: 20%; Renewables: 5%
(3) Gas: 35%; Coal: 40%; Hydro: 20%; Renewables: 5%
(4) Gas: 25%; Coal: 50%; Hydro: 20%; Renewables: 5%
(5) Gas: 50%; Coal: 35%; Hydro: 10%; Renewables: 5%
(6) Gas: 40%; Coal: 30%; Hydro: 20%; Renewables: 10%

249
h o u s e h o L d t i p p i n g p o i n t s i n t h e f a c e o f r i s i n g e L e c t r i c i t y t a r i f f s
7
Household tipping points in the face of rising electricity tariffs1
Angelika Goliger and Aalia Cassim
INTRODUCTION
Since 2008 electricity prices have increased substantially and will have to continue to rise to ensure Eskom’s sustainability. Though critical, electricity spend is a relatively small proportion of a household’s total consumption expenditure so demand has not been significantly affected by electricity price increases to date. This chapter explores the ability of households in South Africa to make alternative energy and/or energy efficient investments to reduce their electricity demand. It is found that middle-income households will be the most vulnerable to rising tariffs due to their limited ability to invest in technologies that significantly reduce their electricity usage. Assuming that 20 per cent of households that can afford to invest in particular technologies do so, about a quarter of total residential electricity sales could potentially go off-grid under the base-case tariff scenario by 2030.
Between 2008/09 and 2016/17, electricity prices increased on average by 11.1 per cent per year, in real terms.2 For Eskom to be financially sustainable, electricity tariffs will have to continue to rise (Molefe, 2016). This implies that municipalities – who purchase bulk electricity from Eskom – will also have to increase their tariffs. While electricity spend is a relatively small proportion of a household’s total consumption expenditure (2.3 per cent of average expenditure in 2010) (StatsSA 2012),

C o m p e t i t i o n a n d R e g u l a t i o n f o R i n C l u s i v e g R o w t h
250
it is critical for lighting, cooking and heating. Consequently, household demand for electricity has been relatively inelastic to date (Inglesi-Lotz and Blignaut, 2011). Nevertheless, electricity price increases combined with relatively high inflation, high unemployment and eroded disposable incomes will result in households having to make decisions about their electricity consumption.
One important household decision revolves around reducing electricity usage and improving energy efficiency, such as reducing the geyser temperature and switching off non-essential appliances. However, many households have already adopted this behaviour (Department of Energy, 2014) and there are limits to the benefits that it can provide. Another decision is whether to replace existing electrical appliances with non-electric ones, or ones that consume significantly less energy. While many households have already invested in some technologies, such as CFLs (Department of Energy, 2014), there is still potential for further investments in LEDs, solar water heaters and gas appliances. Poorer households may have to return to more basic forms of energy generation such as wood and paraffin. A third option involves cutting other expenditure. While households may choose to limit their expenditure in other areas to make allowances for rising electricity costs, this has limitations and is likely to be pursued only after other electricity cost-saving measures have been implemented. Finally, the only real choice for some households may be meter tampering and illegal connections. Non-technical load losses are quite prevalent in some municipalities and Eskom has highlighted that harsh economic conditions have led to high levels of electricity theft (Eskom, 2014). Tariff increases coupled with slow economic growth will likely exacerbate this issue. However, the increased introduction of prepaid meters and more frequent meter inspections may curb this behaviour to some extent (Maphaka, Naidoo and Moodley, 2010).
While these decisions will have some positive impact on household disposable income and/or the environment, they could have negative consequences. As households use less electricity or choose not to pay, electricity revenues at municipalities and Eskom will be affected.

251
h o u s e h o L d t i p p i n g p o i n t s i n t h e f a c e o f r i s i n g e L e c t r i c i t y t a r i f f s
This chapter examines the impact of household decisions around mitigating the effect of rising electricity tariffs. It starts by looking at the economics literature on the elasticity of demand for electricity, the impact of rising tariffs on households and their investment in electricity efficiency, electricity tipping points, as well as Eskom and municipal tariff price paths. This is followed by an analysis of the effect of tariff increases on households and their potential to reduce their electricity consumption through particular investment decisions. These findings are then used to determine the potential loss in the demand for electricity that municipalities and Eskom could experience. The chapter concludes with some recommendations. It must be noted that the nature of this research requires the use of a number of assumptions and caveats, which are highlighted throughout the chapter.
LITERATURE REVIEW
This chapter examines how sensitive households are to increases in the cost of electricity, relative the costs of off-grid investments. It follows on from work by Boonzaier et al (2015), which assessed the potential for large industrial, mining and commercial customers to generate their own electricity. While there have been a few studies calculating the elasticity of demand for electricity, including the Department of Energy’s Integrated Resource Plan, many are outdated and use data points from the years of the electricity and financial crisis. Inglesi and Pouris (2010) used the Engle-Granger methodology to model electricity demand with data from 1980 until 2007 and found that in the short term, companies’ demand for electricity is influenced by economic and population growth, while in the longer term, income and the price of electricity are larger determinants. In 2014, Inglesi-Lotz concluded that households would increasingly focus on demand-side management or turn to other sources of cheaper energy, depending on the level of household income. All these studies recommended that changing levels of elasticity or tipping points should be examined in more detail.
There have been international and local studies on low-income households and investments in energy efficiency as a way to improve

C o m p e t i t i o n a n d R e g u l a t i o n f o R i n C l u s i v e g R o w t h
252
household welfare. One study commissioned for the European Parliament analysed the impact of energy efficiency on low-income households across Europe (Ugarte et al, 2016). It found that the rise in energy poverty is largely due to a lack of investment in energy efficiency and appropriate social welfare, particularly in Eastern Europe. Overall, it was concluded that energy efficiency policies that target low-income households have positive social impacts and are more effective in reducing energy poverty than only using social policies. The importance of information campaigns and the introduction of tax credits for energy efficiency investments were highlighted.
Ameli and Brandt (2014) explored why households often do not invest in energy efficiency, despite the positive impacts on household welfare. Using the Organisation for Economic Co-operation and Development’s (OECD) survey data, they found that a household’s likelihood to invest in electricity efficient technologies depends largely on home ownership, income, social context and the household’s energy practices. They found that households tend to put more weight on the high up-front costs of investing in energy efficiency investments than the long-term positive financial impacts. However, this survey was done in high-income countries where electricity tariffs have not risen as sharply as they have in South Africa.
In South Africa, the Department of Energy (2012) highlighted that almost three-quarters of households in the poorest quintile are energy poor and that even 12 per cent of those in the richest quintile are also energy poor. Continued tariff increases will exacerbate this situation. At the same time, they also found that only 20 per cent of households were aware of how they could save electricity. A National Economic Development and Labour Council (NEDLAC, 2010) study looked at subsidy support for poor households in the light of the imminent tariff increases at the time, with little focus on technology choices that could reduce the negative impact of tariff increases.
However, there is scope for improved energy efficiency in South Africa. Altman et al (2008) evaluated the impact of load shedding during 2008 and 2009. They found that there was significant scope for energy

253
h o u s e h o L d t i p p i n g p o i n t s i n t h e f a c e o f r i s i n g e L e c t r i c i t y t a r i f f s
efficiency improvements by households and industry and that savings of between 15 and 20 per cent were possible. The study also revealed that higher income groups had more opportunities to save power by using solar panels, geyser blankets, low-energy lights, gas heating/cooking, micro wind turbines, etc. Franks (2014) conducted a survey of township residents and suggested that if poor households faced above inflation tariff increases in the future, paraffin use would rise. However, it is unlikely that households would stop using electrical appliances that they had already purchased given the sunk cost.
If households were to switch to renewable technologies, this could have implications for municipal incomes. However, a study of the Drakenstein Municipality (Kritzinger and Meyer, 2015), which installed rooftop PV for residential and industrial use, found that private PV installation would probably have less of an impact on municipal income than commonly believed in the short term. But a breakthrough in the cost and practicality of battery storage technology could be a leap enabler, leading to a large increase in self-sufficient, off-grid consumers. This study did not look at the combined impacts of the adoption of other less expensive off-grid technologies.
The Financial and Fiscal Commission (Peters, ND), a South African public body, evaluated the impact of electricity price increases on municipal tariffs and revenues. Using municipal data from Treasury, their modelling found that there is a negative relationship between electricity tariff increases and municipal expenditure and revenue. Peters highlighted the fact that this was concerning as municipalities have grown reliant on their electricity tariff profits to fund other non-electricity related activities. Government needs to manage the risk associated with higher electricity tariffs, particularly with regard to their impact on municipalities, given that many municipalities are already in a precarious financial position.
This chapter builds on this earlier research into the elasticity of demand and ‘tipping points’ and includes other tipping points into the analysis. To date there has been little local empirical research on the ability of households to switch to renewable technologies, largely

C o m p e t i t i o n a n d R e g u l a t i o n f o R i n C l u s i v e g R o w t h
254
because the price of renewables has been prohibitive for households. However, given the electricity price trajectory and the falling cost of alternatives, it is useful to revisit this question. This study brings these considerations together and aggregates the household level results to determine the impact on electricity providers’ sales.
TARIFF PATHS
About 75 per cent of households get their electricity from municipalities, while the remainder (generally low-income households) are Eskom customers (Eskom, 2016). Municipal customers tend to face higher electricity tariffs (Figure 7.1), due to the additional cost of distribution. Further, municipalities make use of cross-subsidies to support lower-income households.
Figure 7.1: Average tariffs for municipal and Eskom3 customers in 2015 by LSM group, R/kWh (nominal)
Source: NERSA, Eskom and own calculations
Over the eight years up to 2017, electricity tariffs increased significantly. Looking forward, this research looks at two tariff scenarios: a baseline-

255
h o u s e h o L d t i p p i n g p o i n t s i n t h e f a c e o f r i s i n g e L e c t r i c i t y t a r i f f s
tariff and a high-tariff scenario (Figure 7.2). The lower baseline scenario assumes that electricity tariffs will increase by 10 per cent per annum, in nominal terms, between 2017 and 2021, and from 2022, it is assumed that tariffs will grow by the rate of inflation. Under the high tariff scenario, it is assumed that tariffs will grow by 15 per cent per annum, in nominal terms, between 2017 and 2021 – thereafter also growing by inflation.
Figure 7.2: Impact of tariff scenarios on Eskom’s average residential tariffs, R/kWh (real)
Source: Eskom and own calculations
IMPACT OF RISING TARIFFS ON HOUSEHOLD INCOME
In this section, the electricity tariff increase scenarios described above are applied to average household electricity expenditure, for each income decile, obtained from the 2010/2011 Income and Expenditure Survey. This provides projections of future household spend on electricity per decile, on the assumption that household electricity demand, as well as household

C o m p e t i t i o n a n d R e g u l a t i o n f o R i n C l u s i v e g R o w t h
256
income growth, stays constant over the period of analysis. Household income is also assumed to grow at a constant and homogenous rate.
Table 7.1: Comparison of tariffs faced by residential customers, R/kWh (real)
Source: NERSA, Eskom and own calculations
Figure 7.3 illustrates electricity expenditure as a proportion of house-hold expenditure for income deciles 2 to 10 for 2005, 2011 (both actual) and 2030 (projected).4 In all deciles (see note 6), the electricity spend almost doubles by 2030, however, lower income households are the most affected because electricity represents a larger proportion of their expenditure basket. For example, households in decile 2 spent 4.5 per cent of their total household income on electricity in 2011. By 2030, this will rise to 8.1 per cent in the baseline tariff scenario. It must be noted that only the direct impact of electricity price increases are considered and does not include the ‘triple effect’ of an increase in food, transport and electricity costs, as highlighted by Franks (2014). The significant future increase in electricity expenditure implies that households will gradually start looking at ways to reduce their electricity use and their electricity bill, if they have not begun to do so already.
The ability of households to invest in alternative technologiesThe second aspect of this study looks at the ability of households – this time grouped by Living Standard Measures (LSM) (South African Advertising Research Foundation, 2012) – to invest in a particular basket of appliances/technologies that would reduce household reliance on the grid. LSM income levels correlate closely with income deciles as per
Country 2015 2030 (projected)
Eskom baseline 0.87 1.18
Municipal baseline 1.05 1.42
Eskom high 0.87 1.48
Municipal high 1.05 1.77

257
h o u s e h o L d t i p p i n g p o i n t s i n t h e f a c e o f r i s i n g e L e c t r i c i t y t a r i f f s
the Income and Expenditure Survey (StatsSA, 2008). Data on average household electricity consumption by LSM were obtained from Eskom and it was assumed that household electricity consumption would stay constant over the whole period of analysis. Feasibility assessments for each of the selected technologies5 were conducted under the various tariff scenarios, which included operating, maintenance and replacement costs.6 Individually, these technologies have a positive net value under all electricity tariff scenarios – even in 2016, the first year of investment. In other words, in 2016 it already made financial sense to invest in these technologies/appliances because the electricity cost savings outweighed the investment costs over these appliances useful life. Next, these technologies were grouped into four distinct ‘baskets’ from which households could choose.
Figure 7.3: Electricity expenditure as a percentage of household income by decile, under the baseline tariff scenario
Source: IES (2005 and 2011) and own calculations
While these investments would yield a positive net present value, it does not imply that all households could afford to invest in all baskets. For the purposes of this analysis, it was assumed that households would only begin to invest in these technologies when the investment costs

C o m p e t i t i o n a n d R e g u l a t i o n f o R i n C l u s i v e g R o w t h
258
in the first year of investment are equal to or less than 5 per cent of annual household income (per LSM group) in a particular year. In other words, it was assumed that households would be willing to bear slightly higher expenditure in the initial years, within limits, in return for future savings. For example, if the initial year of investment was 2017 and the net cost of investment in Basket 2 equated to 6.3 per cent of a household’s income in that year, it was assumed that the household would not invest. But if in 2019 it costs 4.9 per cent of the household income to invest, the household would choose to invest in Basket 2 in that year.
Table 7.2: Description of technology baskets and their impact on household electricity consumption7
Source: Own calculations
Consequently, one can determine the electricity tariff tipping points of various LSM groups. As municipal tariffs are higher than Eskom’s tariffs for middle- to high-income households, municipal customers are likely to reach tipping points earlier. It was assumed that only households in LSM 1 to LSM 6 would select Basket 1 because it is more suited to low-income households. Note: a limitation of this study is that each
Basket Contents KWh savings p.aAverage avoided electricity costs per household p.a. (Rands)
1 Gas hotplate; 5 LEDs; Gas heater
1 878 2 539
2 Four-plate gas stove and oven; 10 LEDs, 2 gas heaters
4 852 6 560
3 Four-plate gas stove and oven, 10 LEDs, 2 gas heaters; Solar Water Heater
6 875 9 213
4 Solar PV 6 300 8 518

259
h o u s e h o L d t i p p i n g p o i n t s i n t h e f a c e o f r i s i n g e L e c t r i c i t y t a r i f f s
LSM group is represented by a household with an average income for that LSM. Households at the upper and lower ends of that same LSM group will have different tipping points.
Table 7.3 illustrates the tipping points under two extreme tariff scenarios: (1) Eskom tariffs under a base path and (2) municipal tariffs under a high-tariff path.
Table 7.3: Household tipping points per basket under low- and high-tariff scenarios
Source: Own calculations
Table 7.3 shows that the tipping point for many low-income households has already been, or will soon be, reached.8 It is likely that many of these households have already made investments in Basket 1 type-goods. Tipping points for higher income households, however, will be reached within the next few years. This means that municipalities are probably already facing a decline in electricity sales to high-income households. This is corroborated by the Financial and Fiscal Commission’s study. Lower tariffs faced by Eskom customers delay the tipping points by
Eskom base tariff (low scenario)
Municipal high tariff (high scenario)
Basket 1 • From 2017: LSM 1–6 can afford to invest
• From 2018: LSM 1–6 can afford to invest
• From 2017: LSM 7–10 can afford to invest
Basket 2 • From 2030: LSM 6 can afford to invest
• From 2020: LSM 6 can afford to invest
• From 2029: LSM 5 can afford to invest
• From 2034: LSM 4 can afford to invest
Basket 3 • From 2023: LSM 7–10 can afford to invest
• From 2018: LSM 7–10 can afford to invest
Basket 4 • From 2024: LSM 7–10 can afford to invest
• From 2018: LSM 7–10 can afford to invest

C o m p e t i t i o n a n d R e g u l a t i o n f o R i n C l u s i v e g R o w t h
260
between four to six years.Under a high-tariff scenario, household electricity expenditure can
be so high that even low-income households (in LSM 4, LSM 5 and LSM 6) will view Basket 2 as relatively affordable. Middle-income households (particularly in LSM 5 and LSM 6) will be the most vulnerable to rising electricity tariffs. This is because they are unlikely to invest in Basket 1 because their electricity usage is too high (or they have a preference for appliances beyond those available in Basket 1), yet Baskets 3 and 4 are prohibitively expensive.
IMPLICATIONS FOR BROADER ELECTRICITY DEMAND
This section translates the above findings at an aggregate level. Altman et al (2008) concluded that, while at an individual household level electricity consumption is fairly small, at aggregate, household electricity consumption is significant. Although the average household in a particular LSM may be able to afford a specific basket, it is unlikely that all households in that LSM will decide to invest in a basket.9 For the sake of simplicity, this research assumed that for each basket, 20 per cent of those households that could afford it would invest. As baskets 2, 3 and 4 are generally affordable for households with a higher income, this assumption implies that 60 per cent of higher income households would choose to invest in one basket or another.10 Overall, this assumption translates to 35 per cent of all households in South Africa choosing to invest in one basket or another and 65 per cent of households that would not invest in any technology at all (Figure 7.4).
The formula that was used to determine the implications of the above findings and assumptions on broader energy demand was as follows: average electricity saved per household per basket x number of households in each LSM group x 20 per cent (uptake assumption) x (proportion of Eskom customers + proportion of municipal customers) equals total electricity demand that could potentially go off-grid.
We find that 26.4 per cent of total residential electricity sales could go off grid, assuming that 35 per cent of households will invest in some

261
h o u s e h o L d t i p p i n g p o i n t s i n t h e f a c e o f r i s i n g e L e c t r i c i t y t a r i f f s
basket or other. As a proportion of Eskom and municipal sales,11 23.4 per cent and 27.3 per cent of sales, respectively, are likely to go off-grid by 2030 (Figure 7.5). The bulk of the shift will come from LSM 6 to LSM 10.12 The impact of this is then compared with Eskom’s and the municipalities’ aggregate electricity sales.
Figure 7.4: Forgone residential electricity sales due to a 20% uptake, as a % of electricity sales
Source: Own calculations
From Figure 7.5, it can be seen that the impact of a 20 per cent uptake by households represents a relatively small proportion of Eskom’s total electricity sales (1.7 per cent). For municipalities, the impact is nearly four times larger. They stand to lose 6.4 per cent of their sales to off-grid investments, in the baseline scenario.

C o m p e t i t i o n a n d R e g u l a t i o n f o R i n C l u s i v e g R o w t h
262
Figure 7.5: The size of the impact of uptake in 2030 relative to total Eskom and municipal electricity sales in 2015 (GWh) – baseline scenario
Source: own calculations
CONCLUSION
This study analyses the effect that future increases will have on household disposable income and the options available to households that can mitigate this impact from an investment perspective. Further, an attempt is made to quantify the impact on municipalities and Eskom as residential customers move off the grid. It is found that even if electricity tariffs follow a moderate tariff path, if households continue to consume electricity at current levels, their disposable income will be significantly affected, with electricity expenditure almost doubling by 2030 in many instances.
Looking at the ability of households to reduce their electricity consumption through investments in ‘off-grid’ appliances and technologies, it is determined that tipping points will be reached for many households within the next few years, under a baseline path, as the relative costs of these investments fall. A high tariff path will accelerate this process. Middle-income households (LSM 5 and LSM 6 in particular) will be the most vulnerable to rising tariffs. This is due to

263
h o u s e h o L d t i p p i n g p o i n t s i n t h e f a c e o f r i s i n g e L e c t r i c i t y t a r i f f s
their higher levels of electricity consumption, yet lower average income which limits their ability to invest in progressive technologies.
Using various assumptions, it is determined that the above tipping points could reduce total residential electricity sales by 26.4 per cent, under the baseline scenario. Eskom could lose 1.7 per cent of its own residential sales, while municipalities could lose 6.4 per cent of their residential sales. The bulk of electricity sales will be lost in LSM 6 through to LSM 10. While the impact on total electricity sales may not be very significant on its own, it should be seen in a broader context: the bulk of the impact on electricity sales will come from commercial and industrial customers. They have the scale and financial ability to undertake these investments – more so than households.
This should be viewed as an opportunity for municipalities to broaden their revenue streams and possibly invest in renewable strategies. Eskom, on the other hand, needs to reconsider its current structure. At the same time, consideration needs to be given to those households that are vulnerable to rising electricity tariffs, particularly the middle-income groups. Investments in off-grid technologies should be encouraged through information campaigns, as should initiatives such as the replacement of geysers with solar water heaters by insurance companies.
NOTES
1 The views expressed in this paper are the personal views of the authors.2 Own calculation based on NERSA decisions.3 Based on tariff blocks.4 It is assumed that real income increases by around 2 per cent a year in real terms from 2011. Decile 1 is excluded from the analysis because electricity xpenditure data for this decile are unreliable and inconsistent.5 LED light bulbs, gas heater, solar water geyser, two-burner gas stove, four- burner gas stove and oven, and a rooftop solar PV. Price and product information was obtained from the websites of major retailers, such as Game and Makro, as well as businesses specialising in the installation of solar water heaters and rooftop PVs.

C o m p e t i t i o n a n d R e g u l a t i o n f o R i n C l u s i v e g R o w t h
264
6 For example, purchase of gas, the replacement of light bulbs, annual maintenance of a solar PV system, etc.7 The kWh savings in Table 7.2 incorporates many assumptions around household usage of appliances; eg, it was assumed that household’s use a gas heater for an average of five hours per day for three months of the year. 8 It must be noted that municipalities have lower tariffs for low-income households (through cross-subsidies), which accounts for the delayed tipping point for low-income households under the municipal tariff scenario. 9 This may be for various reasons such as: a household is at the lower end of the income bracket of the LSM; safety concerns (eg, gas usage); building/ sectional title regulations; a lack of knowledge of technologies; other expenditure priorities, etc.10 For example, for LSM 9, it is assumed that 20 per cent of households will invest in Basket 2 only, another 20 per cent in Basket 3 and 20 per cent in Basket 4. Therefore, this implies that the remaining 40 per cent of households in this LSM will not invest in any basket, even though it makes financial sense.11 Data obtained from Ms F Salie.12 Low-income households represent roughly a third of total electricity consumption – the remainer is consumed by households in LSMs 7 to 10.
REFERENCES
Altman, M, Davies, R, Mather, A, Fleming, D and Harris, H (2008) The impact of electricity price increases and rationing on the South African economy (Final report to the National Electricity Response Team (NERT), Economic Impact Task Team, July.) Available at: http://www.hsrc.ac.za/uploads/pageContent/3022/IND-STUD022_Altman%20etal_Economic%20Impact%20of%20Electricity%20Price%20Increases%20and%20Rationing_July08%20v5.pdf [Accessed 15 May 2017].
Ameli, N and Brandt, N (2014) Determinants of Households’ Investment in Energy Efficiency and Renewables: Evidence from the OECD survey on household environmental behaviour and attitudes.
OECD Economics Department Working Papers ECO/WKP(2014)61. Available at: http://www.oecd.org/officialdocuments/publicdisplaydocument

265
h o u s e h o L d t i p p i n g p o i n t s i n t h e f a c e o f r i s i n g e L e c t r i c i t y t a r i f f s
pdf/?cote=ECO/WKP(2014)61&docLanguage=En [Accessed 15 May 2017].Boonzaier, W, Goliger, A, Makrelov, K and McMillan, L (2015) The tipping
point: The impact of rising electricity tariffs at firm and sector level. Paper presented at the biennial conference of the Economic Society of South Africa, University of Cape Town, 2–4 September.
Department of Energy (2012) A survey of energy-related behaviour and perceptions in South Africa: The residential sector. Available at: http://www.energy.gov.za/files/media/Pub/Survey%20of%20Energy%20related%20behaviour%20and%20perception%20in%20SA%20-%20Residential%20Sector%20-%202012.pdf [Accessed 15 May 2017].
Department of Energy (2014) South Africa’s Energy Efficiency Targets: First Annual Monitoring Report. Available at: http://www.energy.gov.za/EEE/reports/First-Annual-Monitoring-Report.pdf [Accessed 15 August 2016].
Eskom (ND) Tariff history 2009/10–2015/16. Available at: http://www.eskom. co.za/CustomerCare/TariffsAndCharges/Pages/Tariff_History.aspx [Accessed July 2016].
Eskom (2014) Eskom’s energy and revenue loss management. Available at: http://www.ee.co.za/article/eskoms-energy-revenue-loss-management.html [Accessed 15 May 2017].
Eskom (2016) Integrated Report 2015/16. Available at: http://www.eskom.co.za/IR2015/Documents/EskomIR2015single.pdf. [Accessed 12 August 2016].
Franks, L (2014) The impact of rising electricity tariffs on the urban poor. Available at: https://open.uct.ac.za/bitstream/handle/11427/9136/thesis_ebe_2014_franks_l.pdf?sequence=1 [Accessed 15 May 2017].
Inglesi-Lotz, R and Blignaut, J (2011) Estimating the price elasticity of demand for electricity by sector in South Africa, South African Journal of Economic and Management Sciences, 14(4): 449–465. Available at: https://repository.up.ac.za/bitstream/handle/2263/17734/Inglesi-Lotz_Estimating%282011%29.pdf?sequence=1&isAllowed=y [Accessed 15 August 2016].
Inglesi-Lotz, R and Pouris, A (2010) Forecasting electricity demand in South Africa: A critique of Eskom’s projections, South African Journal of Science, 106(1/2), Art. #16, 4 pages. Available at: http://www.sajs.co.za/system/tdf/publications/pdf/16-716-1 PB.pdf?file=1&type=node&id=32792&force= [Accessed 12 May 2016].

C o m p e t i t i o n a n d R e g u l a t i o n f o R i n C l u s i v e g R o w t h
266
Kritzinger, K and Meyer, I (2015) Solar photovoltaic research: Drakenstein Municipality. Available at: http://awsassets.wwf.org.za/downloads/solar_photovoltaic_research_drakenstein_municipality___karin_kritzinger_and_imke_meyer__.pdf [Accessed August 2016].
Maphaka, M, Naidoo, S and Moodley, V (2010) Energy Losses Management Programme: Eskom distribution. Available at: http://www.ameu.co.za/Portals/16/Conventions/Convention%202010/Papers/Overview%20of%20the%20Eskom%20Energy%20Losses%20Management%20Programme%20-%20Maboe%20Maphaka%20EON%20Consulting%20and%20Eskom.pdf [Accessed August 2016].
Molefe, B (Eskom) (2016) Eskom notes NERSA decision on its RCA submission, media release. Available at: http://www.eskom.co.za/news/Pages/Mar1B.aspx [Accessed 15 May 2017].
NEDLAC (2010) A study into approaches to minimise the impact of electricity price increases on the poor. Available at: http://new.nedlac.org.za/wp-content/uploads/2014/10/electricity-tariffs.pdf [Accessed August 2016].
NERSA (2015) Approved local authority tariffs 2009/10–2015/16. Available at: http://www.nersa.org.za/ContentPage.aspx?PageId=303 &PageName=Local%20Authorities [Accessed August 2016].
Peters, S (ND) The impact of electricity price increases on municipalities. Available at: http://www.ffc.co.za/docman-menu-item/commission-submissions/2015-2016-technical-report/834-2015-2016-tr-chapter-10-impact-of-electricity-price-increases-on-municipalities/file [Accessed August 2016].
Salie, F (2016) e-mail, 8 September 2016.South African Advertising Research Foundation (2012) SAARF Segmentation
Tools. Available at: http://www.saarf.co.za/lsm-presentations/2012/LSM%20Presentation%20-%20February%202012.pdf [Accessed August 2016].
Statistics South Africa (StatsSA) (2008) Income and Expenditure Survey 2005/06. Available at: https://www.datafirst.uct.ac.za/dataportal/index.php/catalog/331 [Accessed August 2016].
Statistics South Africa (StatsSA) (2012) Income and Expenditure Survey 2010/11. Available at: https://www.datafirst.uct.ac.za/dataportal/index.php/catalog/316 [Accessed August 2016].
Ugarte, S, Van der Ree, B, Voogt, M, Eichhammer, W, Ordonez, J, Reuter, M,

267
h o u s e h o L d t i p p i n g p o i n t s i n t h e f a c e o f r i s i n g e L e c t r i c i t y t a r i f f s
Schlomann, B, Lloret, P and Villafafila, R (2016) Energy efficiency for low-income households. European Parliament’s Committee on Industry, Research and Energy (ITRE). Available at: http://www.europarl.europa.eu/RegData/etudes/STUD/2016/595339/IPOL_STU(2016)595339_EN.pdf [Accessed May 2017].

C o m p e t i t i o n a n d R e g u l a t i o n f o R i n C l u s i v e g R o w t h
268
Bas
ket
Con
tent
sK
Wh
savi
ngs
p.a
% o
f ave
rage
hou
seho
ld c
onsu
mpt
ion
by L
SM
12
34
56
78
910
1G
as h
otpl
ate;
5 L
EDs;
G
as h
eate
r1
878
112%
93%
82%
64%
49%
31%
24%
22%
14%
9%
2Fo
ur-p
late
gas
sto
ve
and
oven
; 10
LED
s, 2
gas
he
ater
s
4 85
228
9%23
9%21
1%16
4%12
6%81
%63
%56
%36
%23
%
3Fo
ur-p
late
gas
sto
ve
and
oven
, 10
LED
s, 2
gas
he
ater
s; S
olar
Wat
er H
eate
r
6 87
540
9%33
9%29
8%21
3%16
3%11
5%90
%79
%51
%33
%
4So
lar
PV
6 30
037
5%31
1%27
3%21
3%16
3%10
5%82
%72
%47
%30
%
Bas
ket
Con
tent
sK
Wh
savi
ngs
p.a
Ave
rage
ele
ctri
city
cos
ts @
mun
icip
al ta
rrif
f sce
nari
o (R
ands
)
12
34
56
78
910
1G
as h
otpl
ate;
5 L
EDs;
G
as h
eate
r1
878
1 50
21
972
1 97
21
972
1 97
22
779
3 30
53
305
3 30
53
305
2Fo
ur-p
late
gas
sto
ve
and
oven
; 10
LED
s, 2
ga
s he
ater
s
4 85
23
882
5 09
55
095
5 09
55
095
7 18
18
540
8 54
08
540
8 54
0
3Fo
ur-p
late
gas
sto
ve
and
oven
, 10
LED
s,
2 ga
s he
ater
s; S
olar
W
ater
Hea
ter
6 87
55
500
6 39
47
219
7 21
97
219
10 1
7512
100
12 1
0012
100
12 1
00
4So
lar
PV
6 30
05
040
6 61
56
615
6 61
56
615
9 32
411
088
11 0
8811
088
11 0
88
Tabl
e 7.
1A: D
escri
ptio
n of
tech
nolo
gy b
aske
ts an
d th
eir i
mpa
ct on
hou
seho
ld e
lectri
city
cons
umpt
ion
Sour
ce: E
skom
dat
a an
d ow
n ca
lcul
atio
ns
APPENDIX
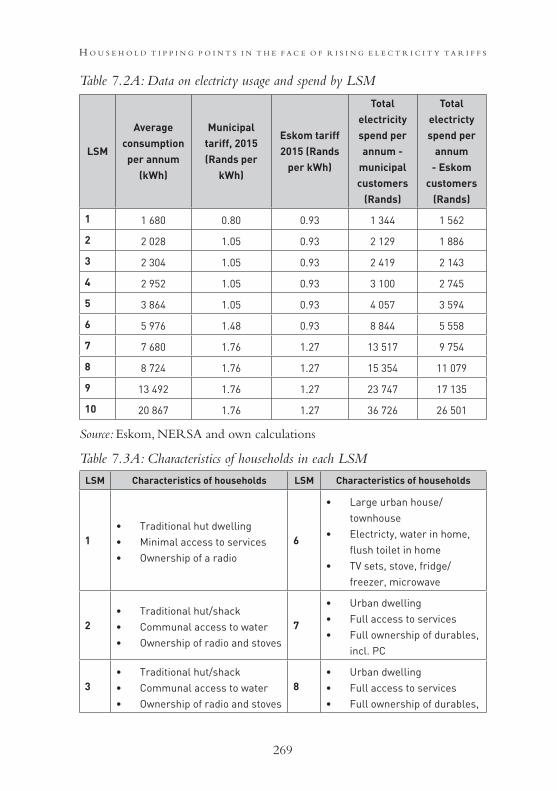
269
h o u s e h o L d t i p p i n g p o i n t s i n t h e f a c e o f r i s i n g e L e c t r i c i t y t a r i f f s
LSM
Average consumption per annum
(kWh)
Municipal tariff, 2015 (Rands per
kWh)
Eskom tariff 2015 (Rands
per kWh)
Total electricity spend per annum -
municipal customers
(Rands)
Total electricty spend per
annum - Eskom
customers (Rands)
1 1 680 0.80 0.93 1 344 1 562
2 2 028 1.05 0.93 2 129 1 886
3 2 304 1.05 0.93 2 419 2 143
4 2 952 1.05 0.93 3 100 2 745
5 3 864 1.05 0.93 4 057 3 594
6 5 976 1.48 0.93 8 844 5 558
7 7 680 1.76 1.27 13 517 9 754
8 8 724 1.76 1.27 15 354 11 079
9 13 492 1.76 1.27 23 747 17 135
10 20 867 1.76 1.27 36 726 26 501
LSM Characteristics of households LSM Characteristics of households
1• Traditional hut dwelling• Minimal access to services• Ownership of a radio
6
• Large urban house/townhouse
• Electricty, water in home, flush toilet in home
• TV sets, stove, fridge/freezer, microwave
2• Traditional hut/shack• Communal access to water• Ownership of radio and stoves
7
• Urban dwelling• Full access to services• Full ownership of durables,
incl. PC
3• Traditional hut/shack• Communal access to water• Ownership of radio and stoves
8• Urban dwelling• Full access to services• Full ownership of durables,
Table 7.3A: Characteristics of households in each LSM
Table 7.2A: Data on electricty usage and spend by LSM
Source: Eskom, NERSA and own calculations

C o m p e t i t i o n a n d R e g u l a t i o n f o R i n C l u s i v e g R o w t h
270
LSM Characteristics of households LSM Characteristics of households
4
• Traditional hut/shack• Electricity, communcal access
to water, non-flush toilets• TV sets, electric hotplates
9• Urban dwelling• Full access to services• Full ownership of durables
5
• House• Electricity, water on plot,
flush toilet outside• TV sets, stove, fridge, hi-fi
10• Urban dwelling• Full access to services• Full ownership of durables
Source: South African Audience Research Foundation (SAARF)
2005 2006 2007 2008 2009 2010 2011 2012 2013 2014 2015
Baseline scenario
0.57 0.57 0.57 0.63 0.70 0.70 0.78 0.82 0.83 0.83 0.87
High scenario
0.57 0.57 0.57 0.63 0.70 0.70 0.78 0.82 0.83 0.83 0.87
2016 2017 2018 2019 2020 2021 2022 2023 2024 2025 2026
Baseline scenario
0.89 0.92 0.96 1.00 1.04 1.09 1.10 1.11 1.12 1.13 1.14
High scenario
0.89 0.97 1.05 1.14 1.24 1.36 1.37 1.38 1.40 1.41 1.42
2027 2028 2029
Baseline scenario
1.15 1.16 1.17
High scenario
1.44 1.45 1.46
Table 7.4A: Real average prices for Eskom’s residential customers (R/kWh sold)
Source: Eskom (up to 2015) and own calculations

271
c o s t r e f L e c t i v e p r i c e r e g u L a t i o n o f p e t r o L e u m : Z a m b i a
8
Cost reflective price regulation of petroleum: The case for Zambia
Deborah Bwalya and Lungisani Zulu
INTRODUCTION
Petroleum plays a pivotal role in the economic development of every developing country and Zambia is no exception. The price of these commodities is of interest to key stakeholders in the sector: the government, seeking revenue; oil marketing companies requiring an acceptable return on their capital investment; industry players needing reliability and price stability; and consumers and the general public who ultimately rely on a pricing structure in line with inflation and affordability. Balancing the competing interests of the various stakeholders becomes imperative. It is postulated that optimum price/rate design should result in the delivery and allocation of essential commodities, together with the effectiveness of revenue requirements for all stakeholders, as well as predictability, efficiency, fairness, simplicity, lack of controversy and transparency.
This chapter focuses on the models of price regulation of petroleum by the regulator, the Energy Regulation Board (ERB), in a country characterised by periodic shortages and allegations of a lack of transparency in pricing. It analyses the two principal models used in the regulation of the retail price of petroleum products – the Cost Plus Model and the Uniform Pump Price mechanism – and considers the case for cost-reflective pricing. We argue that while the regulatory body

C o m p e t i t i o n a n d R e g u l a t i o n f o R i n C l u s i v e g R o w t h
272
has attempted to follow cost-reflective pricing in the regulation of retail prices, that principle is not strictly followed, mainly as a result of the government’s desire to minimise price instability at the cost of providing subsidies. This results in a lack of transparency in the regulation of petroleum products. With regard to the Uniform Pump Price mechanism, although the same can be rationalised on numerous grounds, there is no empirical evidence that the benefits of such a measure outweigh the costs involved.
THE ROLE OF PETROLEUM IN ZAMBIA
Petroleum products are important drivers of the economy the world over. For Zambia, like any developing country, petroleum products – principally petrol, diesel and kerosene – are used to fuel industrial activity both at the micro level (eg, small shops use kerosene for lighting) and the macro level (to drive engines that dig copper). Petroleum products are also useful at the domestic level to fuel the automobiles used by the majority of the middle class, especially in a setting where public transport sectors are not well-developed.
For developing countries, access to gas and petroleum play an additional role of stimulating development in less developed/rural areas. Once a fuel station is opened in a rural area, it not only serves its primary function of providing fuel, but it also results in the mushrooming of other industries such as guest houses, entertainment venues and employment opportunities for the local population. In addition, local tourism may be enhanced. Petroleum is an important factor in social interactions and, without fuel, many social amenities cannot be properly exploited.
Politically, petroleum- and gas-related issues have been known to usher in new governments and result in the exit of others. In Zambia, the acute shortages of commodities, including fuel, have been blamed for the loss of power by the former ruling party, the UNIP, in 1991.
Petroleum is, therefore, important economically, socially and politically. Like Khan (2013), we believe that oil is a commodity with

273
c o s t r e f L e c t i v e p r i c e r e g u L a t i o n o f p e t r o L e u m : Z a m b i a
huge strategic importance to all countries in the world including, and especially, a developing country like Zambia. The pivotal role played by the petroleum industry in any country explains why there is a high degree of regulation in the industry, the world over, Zambia being no exception.
THE REGULATOR OF GAS AND PETROLEUM PRICES IN ZAMBIA
In Zambia, regulation of the gas and petroleum industry is undertaken by the ERB. The ERB is responsible for the regulation of fuel prices in Zambia, pursuant to the provisions of two pieces of legislation. First, the ERB is created by section 3 of the Energy Regulation Act, Chapter 436 of the Laws of Zambia. The functions of the ERB are provided under section 6 of the Act, which states that the ERB’s mandate is to:
• (a) monitor the efficiency and performance of undertakings, having regard to the purposes for which they were established;
• (b) receive and investigate complaints from consumers on price adjustments made, or services provided, by any undertaking, and regulate such adjustments and services by the attachment of appropriate conditions to licences held by undertakings;
• (c) receive and investigate complaints concerning the location or construction of any common carrier or any energy or fuel facility or installation or the carrying out of any works by any undertaking, and regulate such location and construction by the attachment of appropriate conditions to licences held by undertakings;
• (d) in conjunction with the Zambia Competition Commission established by the Competition and Fair Trading Act, monitor the levels and structures of competition within the energy sector with a view to promoting competition and accessibility to any company or individual who meets the basic requirements for operating as a business in Zambia;
• (e) in conjunction with the Zambia Standards Bureau established

C o m p e t i t i o n a n d R e g u l a t i o n f o R i n C l u s i v e g R o w t h
274
by the Standards Act, design standards with regard to the quality, safety and reliability of supply of energy and fuels;
• (f) in conjunction with other government agencies, formulate measures to minimise the environmental impact of the production and supply of energy and the production, transportation, storage and use of fuels and enforce such measures by the attachment of appropriate conditions to licences held by undertakings; and
• (g) make recommendations to the Minister as to the measures to be taken through regulations to be made under this Act.
The ERB may also exercise such other powers and functions as may be imposed by other laws.
Second, the Petroleum Act, Chapter 435 of the Laws of Zambia, also confers powers on the ERB. This Act makes provisions for regulating the importation, conveyance and storage of petroleum and other inflammable oils and liquids and other incidental matters. In terms of section 3 of the Petroleum Act, the minister responsible for energy is empowered to make regulations for the following purposes:
• (a) prohibiting the importation or exportation of petroleum except to such ports or places and in such quantities and subject to such conditions as may be prescribed;
• (b) regulating the transport of petroleum whether by railway, road or inland navigation;
• (c) regulating the quantity of, mode of storage of, and the receptacles in which petroleum may be carried in any vessel, cart, truck, or other vehicle, and the quantities to be contained in such receptacles;
• (d) regulating the storage of petroleum and providing for the licensing of places in which petroleum is stored;
• (e) prescribing the powers and duties of officers appointed for the purposes of this Act;
• (f) providing for the search and inspection of any ship, vessel, vehicle, building or place in which petroleum is stored or carried

275
c o s t r e f L e c t i v e p r i c e r e g u L a t i o n o f p e t r o L e u m : Z a m b i a
or in which there may be reason to believe that petroleum is stored or carried;
• (g) prescribing the fees to be paid for any licence or permit issued or examination or other thing done under this Act;
• (h) generally for carrying out the purposes of this Act.
The regulations under the Petroleum Act are enforced by the ERB.We consider two of the principal ways in which the ERB regulates or
has regulated pump prices: the Cost Plus Model and the Uniform Pump Price mechanism. The Cost Plus Model for setting pump prices was imposed by the ERB in 1998 and was briefly abandoned in 2004 for the import parity pricing (IPP) methodology, which was adopted primarily as a way of improving operational efficiencies at the Indeni Petroleum Refinery Company – Zambia’s only refinery – by benchmarking it with other international refineries. The IPP was in use until 2008 when there was a shift back to the Cost Plus Model following a public outcry on the frequency of the monthly price adjustments under the IPP methodology. Since 2008, the Cost Plus Model has been used for setting pump prices in Zambia. Another fuel price regulation mechanism that has been adopted by the ERB is the Uniform Pump Price system. This was implemented following a government policy directive in September 2010 and requires that fuel prices be the same at all retail sites in the country. The Uniform Pump Price is managed through a transport cross- subsidy mechanism.
The question is whether these two mechanisms for the regulation of fuel prices followed cost reflective pricing principles. Before delving into the details of what the two mechanisms entail, it is important to address the issue of what cost reflective pricing really means, as well as the two closely related principles of efficiency and transparency.
WHAT IS COST REFLECTIVE PRICING?
Cost reflective pricing is the term employed when the price of a product or a service reflects its cost of production. In relation to petroleum products, cost reflective pricing means that the cost of fuel paid by the

C o m p e t i t i o n a n d R e g u l a t i o n f o R i n C l u s i v e g R o w t h
276
consumer should reflect the actual cost of procuring or producing the commodity. The government or other industry intermediaries must not subsidise the cost. Cost reflective pricing has several benefits. Where a consumer values a product/service more than its cost of production, the consumer will purchase the product/service. This is a net benefit to society because the production resources used are less than the consumer benefits gained. Where a consumer does not value a product/service more than its cost of production, the consumer will not purchase that product/service. This avoids a net loss to society. By sending signals about production costs, cost reflective prices allow both consumers’ and producers’ of resources to be allocated to activities that have the greatest net benefit to society. This maximisation of welfare makes the prices efficient.
Other ancillary principles of cost reflective pricing are transparency and efficiency. Transparency requires the regulator to regulate the price at cost reflective margins in an open manner. Transparency ensures that any changes in the prices must be predictable and based on known benchmarks capable of independent calibration. Efficiency entails that the regulator must promote competitive business practices, which enhance and encourage efficiency as opposed to encouraging inefficiency. Indeed, cost reflective pricing is one of the premises of competition law, since it promotes market efficiencies. In Zambia, the Consumer Protection and Competition Commission Act 24 of 2010 prohibits the sale of goods at less than cost price. Section 10(1) provides, ‘A vertical agreement between enterprises is prohibited per se, and void, to the extent that it involves re-sale price maintenance.’ Section 16 provides:
An enterprise shall refrain from any act or conduct if, through abuse or acquisition of a dominant position of market power, the act or conduct limits access to markets or otherwise unduly restrains competition, or has or is likely to have adverse effect on trade or the economy in general. (2) For purposes of this Part, ‘abuse of a dominant position’ includes… ‘(g) selling goods below their marginal or variable cost’.

277
c o s t r e f L e c t i v e p r i c e r e g u L a t i o n o f p e t r o L e u m : Z a m b i a
It is thus safe to conclude that cost reflective pricing is not only an economically sound principle, but also under competition law, a legal requirement.
PRICE REGULATION AND THE ERB
The ERB regulates the market players by setting ceilings for the retail price at which petroleum products are sold. This is regardless of whether the petroleum product has been imported as a finished product (currently it is estimated that half of the country’s fuel is imported) or whether the product is procured as crude (refined at Indeni Petroleum Refinery), which accounts for the other half of the country’s fuel needs. The ERB does not regulate the wholesale price at which a distributor may choose to sell to another business.
There are essentially three categories of licensees regulated by the Board: (1) oil market companies that hold a distribution licence; (2) companies that hold retailing licences and which sell the commodity to the public at a pump station; and (3) oil transporters that hold petroleum product transportation licences. Vertical integration is allowed – a company can hold all these licences. Within this regulated industry, the profit margins of the petroleum licences are regulated by the ERB and a company cannot exceed the set margins, but can recover any lower margin.
The wholesale price build up
The ERB uses the Cost Plus Model to determine the wholesale price of all the refined products at the Indeni Petroleum Refinery and the pump prices for petrol, diesel and kerosene. To arrive at these prices, the model takes into account the attendant costs incurred along the petroleum supply chain from the port of discharge in Dar es Salaam to the refinery, where the feedstock is processed, up to the Ndola Fuel Terminal where the product is stored and sold. Table 8.1 provides the different cost elements up to the wholesale price; the ERB’s explanation for each component is presented in the relevant note.

C o m p e t i t i o n a n d R e g u l a t i o n f o R i n C l u s i v e g R o w t h
278
Table 8.1: Cost elements in the wholesale price of petroleum products
Source: ERB website: www.erb.zm accessed on 16 February 2016
The pump price build-up
The build-up to the pump constitutes the terminal fee, respective statutory excise duty on the different products, the oil marketing companies’ (OMCs), the dealer’s and transporter’s margins – which are all determined by the ERB – the ERB’s fees of 0.7 per cent of turnover, the strategic reserves fund (for infrastructure development in the sector
Cost element Unit cost Basis
Cost-insurance-freight1 (US$/MT) As agreed by the parties Contract/Supplier invoice
Ocean losses2 0.30% Best practice
Wharfage charges3 1.25% Tanzanian Harbour Authority
Finance charges4 4.00% Financier
Collateral manager5 (US$/MT) 0.39 Stock monitoring agreement
Insurance6 0.15% Insurer
TAZAMA storage fee7 (US$/MT) 2.00 TAZAMA
TAZAMA pumping fee8 (US$/MT) 54.00 Approved ERB pumping tariff
TAZAMA pipeline losses9 1.48% Determined by ERB
Agency fee10 (US$/MT) 5.00 Agency agreement
Refinery fee11 (US $/MT 60.38 Approved ERB processing fee
Refinery processing losses12 9% Determined by ERB
Terminal losses13 (LPG, Petrol, Diesel/Kero/Jet A1)
1%, 0.5%, 0.3% Best practice

279
c o s t r e f L e c t i v e p r i c e r e g u L a t i o n o f p e t r o L e u m : Z a m b i a
and procurement of strategic reserves) and VAT on products. Table 8.3 gives an outline of these costs up to the pump.
Table 8.2: Cost elements in the pump price
Source: ERB website: www.erb.zm accessed on 16 February 2016
Uniform Pump Price (UPP) System
The ERB implemented the Uniform Pump Pricing in September 2010 following a government policy directive. The Uniform Pump Pricing requires that fuel prices be the same at all retail sites in the country and this is managed through a transport cross-subsidy mechanism. The OMCs or independent dealers delivering fuel to retail sites within the Copperbelt are required to remit the transport differential for each litre of fuel into the Uniform Pump Pricing fund. Those delivering fuel to sites out of the Copperbelt are refunded the transport differential for
1 Wholesale price to oil marketing companies a
2 Terminal fee K0.025/litre b
3 Excise duty (incl.) road levy c
4 Ex Refinery Gate D=(a+b+c)
5 Transport margin (To LSK) K0.20/litre E
6 Transport claim/charge =ve/-ve F
7 OMC margin K0.42/litre g
8 15 days stock cost-line - H
9 TOTAL (Excl VAT) J =(d+e+f+g+h)
10 Dealer Margin K0.28/litre K
11 PRICE TO DEALER L=(j+k)
12 ERB Fees 0.7% M
13 Strategic Reserves Fund K0.15/litre N
14 Price before VAT Q=(l+m+n)
15 VAT 16% R
16 UNFORM PUMP PRICE K/litre S=(q+r)

C o m p e t i t i o n a n d R e g u l a t i o n f o R i n C l u s i v e g R o w t h
280
each litre of fuel. The operation of the Uniform Pump Pricing since 2010 has meant that the country now has the same price for fuel at all retail sites in country. The government established the Uniform Pump Pricing fund, administered by the ERB, to facilitate the cross-subsidisation of ‘rural’ consumers by ‘urban’ consumers. An independent manager was engaged to verify the remittances and claims on the fund.
MOVEMENT OF FACTORS BETWEEN 2011 AND 2016
Figures 8.1 and 8.2 present a synopsis of the trends in the cost of fuel at the international market and exchange rates compared to the domestic pump prices, as regulated by the ERB.
Figure 8.1: Trends in domestic fuel pump price, January 2011–February 2016
Source: ERB website: www.erb.zm [Accessed 16 February 2016]

281
c o s t r e f L e c t i v e p r i c e r e g u L a t i o n o f p e t r o L e u m : Z a m b i a
Figure 8.2: Trends in domestic fuel pump price, 2000–2014
Source: ERB website: www.erb.zm [Accessed 16 February 2016]
Note: Prices used are end year prices
ANALYSIS OF THE ERB’S PRICE REGULATION IN THE LIGHT OF COST REFLECTIVE PRICING PRINCIPLES
The ERB reviews the retail prices of petrol every six weeks, a period that is supposed to coincide with a new cargo of crude oil procured. As a rule, the ERB will only adjust the price if the cost margins escalate beyond a 2.5 per cent threshold. However, in practice, the ERB usually does not adjust the price as often as every six weeks as Figure 8.1 clearly shows. The reason is not because the 2.5 per cent threshold is not breached – as it often is breached on account of exchange rate fluctuations – but because price instability is not favoured for political and economic reasons. When the exchange rate fluctuations (ZMW/US $) result in exchange losses, which affect the ability to finance new shipments, these losses are then met by the government, which is a form of subsidy. It must be noted that officially, the government terminated the policy of fuel subsidisation in May 2013, however, a subsidy still subsists in the form of financing losses for the procurement of fuel. It does not favour the government to pass on every cost to the consumer for fear of the political instability that comes with constant changes in the price

C o m p e t i t i o n a n d R e g u l a t i o n f o R i n C l u s i v e g R o w t h
282
of fuel. Indeed, the practice of compensation or price adjustment is not confined to the developing world – examples can be observed in Europe, where analysts have explored how to level the playing field between the United Kingdom and European Union diesel prices for hauliers and have proposed methods of compensation (McKinnon, 2007).
It appears that in Zambia, the concept of ‘rockets and feathers’ is present. This concept was first identified in an investigation into different phenomena in the United States that had the potential to impact pump prices (Deck and Wilson, 2004). The ‘rockets and feathers’ model postulates that retail prices rise faster than they fall, which has been proven by empirical studies in the United States and elsewhere. From various newspaper articles, it does appear that the Zambian public generally views the ERB with suspicion when prices do not fall quickly enough, especially when world prices are generally low.
World Bank research on developing countries’ reactions to fluctuations in crude oil prices since 2009 has summarised price control mechanisms and their respective advantages and disadvantages (Kojima, 2013). With price ceilings, some advantages are that there is scope for price competition. Divergence from ceilings suggests emerging competition. There is less need to get the prices ‘exactly right’ than controlling price levels. Potential problems are posed in that if price ceilings are too high, there is little incentive to improve efficiency. If they are too low, the fuel business may cease to be financially viable. With price levels, there is greater control but there is no scope for price competition. With price control at the retail level, it is easy for consumers to check compliance. However, more assumptions are needed to calculate prices than controlling retail prices. Compliance is more difficult to monitor because the number of points to be checked is the largest at the retail level.
With price control at the wholesale level or elsewhere upstream of retail, an advantage is that this is more transparent because of a greater correlation with benchmark international prices, and it is easier to monitor compliance because there are fewer points of sale. However, if competition is inadequate, margins could grow and retail prices

283
c o s t r e f L e c t i v e p r i c e r e g u L a t i o n o f p e t r o L e u m : Z a m b i a
could be markedly higher than otherwise. If upstream prices are set too low, oil companies may try to recover losses by increasing retail prices to compensate.
With uniform prices, the advantages include a sense of national unity: one country, one price. And it is easy for consumers to check compliance. However, freight equalisation introduces additional scope for inefficiency as well as corruption. The size of cross-subsidisation could become very large, to the point of making the cost of compliance unacceptably high. Finally, with price control in the form of pricing by location, costs are better reflected. However, consumers in remote areas may compare themselves to those in major cities and feel a sense of injustice. If costs of serving remote areas are too high, some remote areas may not be served.
What is lacking in the Zambian experience is empirical evidence to justify that the benefits of the adopted price regulation mechanisms outweigh the cost. Without such empirical evidence, it will always be a challenge to gauge the sustainability of the adopted measure.
CONCLUSION AND IMPLICATIONS FOR THE FUTURE
This chapter has shown that while the ERB does attempt to follow cost reflective pricing in general through its Cost Plus Model for retail price regulation, cost reflective pricing is not currently being strictly implemented in Zambia. Although to a much lesser extent than prior to May 2013, the government still subsidises the cost of fuel on behalf of the consumer to avoid price instability, which is inevitable where cost reflective pricing is followed strictly. The ERB still maintains the price despite substantial changes in the procurement cost as fuel price stability is often favourable for political expediency and the cost differential is met by the government. While the ERB has a clear benchmark about how prices are supposed to be set, transparency in the regulation of the cost of fuel remains low because the set prices are not capable of independent calibration by consumers and industry players, which is a hallmark of transparency.

C o m p e t i t i o n a n d R e g u l a t i o n f o R i n C l u s i v e g R o w t h
284
As feared by other authors, the Uniform Pump Price, although justifiable for a number of reasons, does not encourage efficiency on the part of the oil dealers. It is not only inherently anticompetitive but also results in subsidisation of the cost of fuel by one set of consumers (that is, those closest to the source). While it is easy to rationalise such subsidisation, there is lack of empirical evidence that, as a whole the country, is better off than if each consumer paid only the cost to supply them, as opposed to the cost for supplying everyone else in the country.
Cost reflective pricing is, thus, not currently implemented in Zambia. The distribution and sale of petroleum products is highly regulated. The Petroleum Act mandates that all OMCs should obtain a license and the ERB endorses and implements government policy. Currently, the Cost Plus Model sets pump prices and OMCs are not able to sell beyond the price set by the ERB. The second level of regulation is the Uniform Pump Price, whereby the OMCs effectively subsidise the transport cost of supply in areas far from the refinery, which prevents an inaccessibility to fuel in the rural and underdeveloped areas, where transportation is costly. At present, this regulation protects the consumer and the economy from price fluctuations, which could create instability.
The distribution value chain in Zambia is not the only model. In other countries there may be more players (that is, wholesalers, independent retailers and independent distributors). Some research suggests that where there are more players, regulation may be detrimental to the consumer price. A World Bank comparative study (Kojima, 2013) points out the danger of subsidies, which may disadvantage certain players and may ultimately lead to shortages, strife and inefficiencies. The report encourages the play of free market forces to promote sustained economic development and efficiency.
The question is: At what point should principles of free and fair competition and the imposition of cost reflective pricing prevail over regulation? Achieving the balance for a developing country, which does not produce fuel, is not an easy task. However, a balance should always be

285
c o s t r e f L e c t i v e p r i c e r e g u L a t i o n o f p e t r o L e u m : Z a m b i a
struck by using empirical evidence, which clearly shows that leaning in one direction is better than the other. As a general rule, free competition and cost reflective pricing are principles that underlie a free market economy, growth, development and prosperity.
The rationale behind the imposition of uniform pump prices is to create equality across the country, where it would otherwise have been too expensive to invest or set up a filling station, as a stimulus for development. Though noble, there is a need for research to establish empirical evidence that the benefits of the Uniform Pump Pricing outweigh its costs.
The Cost Plus Model, as implemented by the ERB, ensures predictability of prices and stability in the face of the volatility of exchange rates (and other factors that are beyond the control of developing countries). Instability could be detrimental to growth and the attraction of much needed foreign indirect investment, but does this policy result in a serious drain on the national resources with the ensuing danger of restricting government’s ability to purchase fuel due to fiscal deficits?
One suggestion would be to explore an interim solution of imposing cost reflective pricing in areas where consumers can afford it (in urban areas and on industrial players). The regulation that is intended to create favourable conditions for development in underprivileged areas could remain in place to promote economic empowerment, but free market forces could be at play where this is more appropriate. Although the cost of business may increase, the converse effect would be that consumers would benefit when crude oil prices are lower. Further, competition, profitability and productivity are currently being distorted due to fuel subsidies. Where profit-making entities are forced to factor cost reflective prices of fuel products into their business models, and consumers in urban areas who have access to employment and markets to support the informal sector no longer benefit from subsidies, the positive impact on the fiscal deficit may lead to a beneficial outcome in the long term. Consistent with the above suggestion, there is also a need to examine the concept of targeted subsidisation, whereby areas for development

C o m p e t i t i o n a n d R e g u l a t i o n f o R i n C l u s i v e g R o w t h
286
might benefit from much-needed subsidies, whereas those with deeper pockets would pay a cost reflective price.
NOTES
1 The cost-insurance-freight (CIF) of the petroleum feedstock cargo is the landed cost of the cargo at the port of Dar es Salaam. The quantities of the constituent components of the petroleum feedstock, which include crude oil, condensate, naphtha and gas oil, are multiplied by the unit costs to derive the total monetary cost of the feedstock. The information is obtained from the supplier’s invoice, which is based on the contract between government and the oil supplier and ultimately used to develop a profitability statement.2 The 0.3 per cent ocean loss is based on international best practice. This is the acceptable loss incurred in the loading and offloading of petroleum feedstock and petroleum products from a vessel.3 The Tanzania Harbour Authority levies a statutory charge on the importation of petroleum and petroleum products. At present, this is 1.25 per cent of the CIF Dar es Salaam cost.4 A financing charge of 4 per cent to cover the cost of financing the cargo, particularly the letter of credit (LC) costs, and the cost of refinancing for liabilities that remain undischarged after payment has been effected through the LC.5 Collateral management fees are set at US $0.39/MT. The financier employs the services of a collateral manager to secure their interests. The financier usually holds the petroleum feedstock and petroleum products as collateral, so the collateral manager has to manage the stocks. The basis for providing the fees is stipulated in the Stock Monitoring Agreement signed between the collateral manager, the financier and the government agent.6 The insurance costs are set at 0.15 per cent of CIF. The insurance covers the cost of insuring the feedstock from Dar es Salaam to Ndola.7 TAZAMA charges US $2/MT/month to the importer for any petroleum feedstock quantities that are stored at the Dar es Salaam tank farm on the last day of the month. The amount was agreed on between TAZAMA and the government.8 TAZAMA charges US $54.00/MT to the importer for transporting

287
c o s t r e f L e c t i v e p r i c e r e g u L a t i o n o f p e t r o L e u m : Z a m b i a
petroleum feedstock through the pipeline from the Dar es Salaam tank farm to the Refinery in Ndola.9 Consumption and losses for TAZAMA are currently set at 1.48 per cent. he losses comprise of consumption at 0.83 per cent based on the consumption level of 10 litres/MT of petroleum feedstock for the pumping engines at the pumping stations and allowable losses at 0.65 per cent.10 The government appointed TAZAMA as agents to discharge specific duties in the procurement of petroleum feedstock. The agency fee is currently US $5/MT, the fee is agreed between the government and TAZAMA. The key function of the agent, among others, is to ensure compliance by the supplier to the terms and conditions of the supply contract.11 Indeni Petroleum Refinery charges a processing fee of US $60.38/MT to the importer for refining (processing) petroleum feedstock.12 Some petroleum feedstock quantities are lost during the refining process due to normal processing losses and consumption, as some quantities are consumed as fuel in the process. The consumption and losses figure is set at 9 per cent – 8.4 per cent relates to consumption with the balance of 0.6 per cent relating to losses.13 These are terminal losses as prescribed by international norms. A loss level of 0.5 per cent is allowed for petrol, while a loss level of 0.3 per cent has been allowed for kerosene and jet A-1, diesel and heavy fuel oil (HFO) to cover handling and storage losses. A loss of 1.5 per cent is provided for liquefied petroleum gas (LPG).
REFERENCES
Deck, CA and Wilson, BJ (2004) Economics at the pump, Regulation 27(1): 22–29.
Khan, ASZ (2013) Oil and Economy: Factors influencing crude oil prices and the significance of these on the global economy. Available at: http://dx.doi.org/10.2139/ssrn.2303840 [Accessed 10 January 2019].
Kojima, M (2013) Petroleum product pricing and complementary policies experience of 65 developing countries since 2009, World Bank Working Research Paper No. 6396, The World Bank Sustainable Energy Department, Oil, Gas and Mining Unit Reference WPS6396.
McKinnon, AC (2007) Increasing fuel prices and market distortion in a domestic

C o m p e t i t i o n a n d R e g u l a t i o n f o R i n C l u s i v e g R o w t h
288
road haulage market: The case of the United Kingdom, European Transport, 35:5–26.
Legislation
The Consumer Protection and Competition Commission Act 24 of 2010, Zambia.
The Petroleum Act, Chapter 435 of the Laws of Zambia.The Energy Regulation Act, Chapter 436 of the Laws of Zam

289
e f f e c t s o f c o m p e t i t i o n o n c e m e n t p r i c e s a n d p r o d u c t i v i t y
9
The effects of competition on cement prices and the productivity of cement producers in Ethiopia1
Tesfaw Wondimu Tefera and Simon Roberts
INTRODUCTION
Cement is a basic input for infrastructural development and particularly important for the construction of housing and transport infrastructure. Thus, a competitive price and sustainable supply of cement are very important for growth and development. At the same time, cement is capital-intensive and requires large-scale factories for efficient production and it is relatively expensive to transport. This implies that the industry is concentrated, with relatively few large producers, and limited competitive discipline from imports.
These characteristics mean that if producers compete or collude, this will have a huge impact on prices. At the same time, the magnitude of investments and the linkages with infrastructure indicate a role for industrial policy in supporting investments.
There have been significant changes in cement production in Ethiopia since 2001. Prior to this, there were only two small-scale cement plants (Dire Dawa Cement and Mugher Cement) both belonging to the government. They had a combined installed capacity of 700 000 tonnes. There was a very low demand for cement given the overall depressed economy of the country (Oqubay, 2015). As economic growth increased,

C o m p e t i t i o n a n d R e g u l a t i o n f o R i n C l u s i v e g R o w t h
290
so did the demand for cement and, in 2004, the government started significant infrastructure projects resulting in a construction industry boom. These projects included hydropower dams, a huge housing programme, water plants and road infrastructure. The sustained growth of the construction industry, linked to the overall improvement of the Ethiopa’s economy, along with shortages of a power supply to cement producers, caused a scarcity of cement from 2007 to 2011 and resulted in high prices.
Since 2012, there has been a substantial growth in cement production with the entry of small and medium-sized companies, followed by Dangote Cement which became operational in 2015. Production exceeded local demand and there were exports to neighbouring countries like Djibouti, Kenya, Somaliland and South Sudan. The government then banned additional new investment in the sector, fearing excess supply.
This chapter analyses the changes, focusing on the period from 2009 to 2016, to assess the way in which competition changed with entry and the impact on productivity. We also consider the role of the government’s industrial policies regarding the sector.
Background on the cement industry in Ethiopia
The first cement manufacturer in Ethiopia was established in 1938 in the city of Dire Dawa, with a production capacity of 30 000 tonnes per annum. It was a government-owned company, later privatised in 2005, and now called National Cement. In about 1965, another state-owned plant, Addis Ababa Cement, came into operation with a production capacity of 70 000 tonnes per annum. In 1984, Mugher Cement was established by the state, and between 1984 and 1990, two production lines of Mugher Cement became operational, with a combined install production capacity of 600 000 tonnes of clinker annually. Addis Ababa Cement operated under Mugher Cement until it was shut down in 1992 because it was in the centre of the city and emitted pollution. When cement demand increased, the government established Messebo Cement, which became operational in 2001 with

291
e f f e c t s o f c o m p e t i t i o n o n c e m e n t p r i c e s a n d p r o d u c t i v i t y
a starting production capacity of 600 000 tonnes of cement per annum (Oqubay, 2015).
From 2004, the construction industry grew too rapidly for cement production to keep pace, and severe shortages of cement were observed until 2011. The severe shortage meant very high cement prices. To alleviate this shortage and to reduce the high prices, in 2007 the government allowed the private sector to import cement, although the effectiveness of this measure was undermined by the shortage of foreign currency. The price of cement reached its highest level of US $24 per 50 kilograms around 2008/09 in the retail market. The cement supply continued to lag behind the required demand in local production until 2011 (MoI, 2014a). High prices and under-supply meant that infrastructure was expensive, even though investment in this area was a key part of the government’s strategy.
To change this challenging situation, the government provided incentives to the private sector and strengthened the state-owned Mugher Cement as a ‘centre of excellence’ for newer cement businesses, by providing technical assistance and upskilling staff. The incentives included investment promotion, access to mining resources, duty-free imports of capital goods and 15 per cent duty-free for spare parts, loans of approximately 70 per cent of the investment cost with a subsidised interest rate of 5 per cent, and access to development land on which to build factories, with low-priced, long-term lease agreements (Oqubay, 2015).
A number of private local and foreign investments in the industry were attracted, resulting in many small- and medium-sized cement companies. There were also two very large investments by Derba and Dangote, which became operational in 2012 and 2015, respectively. Existing companies also increased their capacity, with Messebo and Mugher each raising their production capacity to 2.2 million tonnes per annum.
The result was 21 cement producers by 2016. Four of these are large producers with installed cement production capacity above 2 million tonnes per annum; while the rest are small- and medium-

C o m p e t i t i o n a n d R e g u l a t i o n f o R i n C l u s i v e g R o w t h
292
sized cement companies with vertical shaft vertical shift kiln technology kiln technology, including clinker grinding facilities (Global Cement Report, 2013).
The substantial investments meant that, by 2016, capacity far exceeded demand. According to the Chemical and Construction Inputs Industry Development Institute (CCIIDI) (2016), the total installed production capacity at end of 2016 was close to 15.6 million tonnes, but the actual production was 8.16 million tonnes. This suggests poor coordination in terms of investment strategies and inefficiencies, as the plants operated below capacity. In particular, there are questions about the small plants that are not as energy-efficient.
Despite the large number of producers, the largest five cement producers combined accounted for nearly 80 per cent of the total installed cement production capacity in 2016, meaning that the industry is still oligopolistic in nature. In terms of geography, three of the major producers, namely Dangote, Derba and Mugher, which accounted for 55 per cent of the production in 2016, are in one location (Mugher), where there is significant availability of raw material and which is close to Addis Ababa, where cement demand is the greatest. The other two of the top five companies, Messebo and National Cement, are located in Mekelle and Dire Dawa, respectively, which are 700 and 560 kilometres from Addis Ababa.
Competition did not exist when only two small-scale, state-owned and one endowment-holding cement manufacturers (Mugher Cement, Dire Dawa Cement and Messebo Cement)2 dominated the Ethiopian market. The cement market became more competitive with the establishment of small-scale plants and then the entry of Derba Cement and Dangote Cement in 2012 and 2015, respectively. With over-capacity since 2015, the government has banned cement imports and new cement investment in the sector to safeguard against further oversupply and to encourage the exploitation of economies of scale (CCIIDI, 2016). In 2015, the government adopted the Cement Industry Development Strategy (CIDS), set to run until 2025, to increase the capacity utilisation and efficiency of the sector, and to decrease the price of cement.

293
e f f e c t s o f c o m p e t i t i o n o n c e m e n t p r i c e s a n d p r o d u c t i v i t y
Assessing market outcomes
Measuring market concentration requires defining the extent of the market in product and geographic terms. Cement is a relatively homogeneous product with specifications varying in the percentage and composition of clinker, which impacts on the strength and the speed of setting. However, cement is costly to transport with a low value-to-weight ratio and, therefore, there can be quite small geographic markets. Typically, markets are defined by competition economists in terms of the pricing power that could be exerted by a hypothetical monopolist. This is the so-called SSNIP test, which considers the profitability of a small but significant non-transitory increase in price, in a given area, or whether such an increase would not be profitable because consumers can turn to alternative sources of supply from further afield (Massey, 2000).
Since cement is relatively homogenous, the main aspect for consideration in a market definition is the geographic scope, especially given that cement is a bulky product with significant transport costs. As such, it is important to assess transport costs, the location of supply and of demand, as well as barriers to imports. Prices charged in different locations enable a comparison of prices and the mark-ups of cement in apparently more and less competitive markets, along with transport costs and flows. There may also be different customer segments, such as the market that caters for large construction projects and the market that sells to smaller customers.
Market dominance can also be measured directly by mark-ups over costs. In the Ethiopian cement industry, the main production cost (which is variable) is the energy cost. Energy costs are especially important as fuel is imported from abroad and incurs high inland transport costs. The cost of energy for the Ethiopian cement industry is 40 to 50 per cent of the total production cost, which is very high compared to the international standard of 30 to 40 per cent.
Production costs are also linked to the implementation of modern technologies, the realisation of economies of scale and improved production efficiencies. Competition means that high-cost businesses

C o m p e t i t i o n a n d R e g u l a t i o n f o R i n C l u s i v e g R o w t h
294
will go out of business. Given the energy intensity of cement production, productive efficiencies relate, to a large degree, to cement manufacturers investing in energy-efficient technologies. We consider the impact of competition on investment in upgrading technologies and the realisation of production efficiencies, as reflected in energy efficiency. This can be measured by coal consumption per tonne of clinker production. There are economies of scale in upgrading to more efficient kilns, with the minimum efficient scale internationally at more than one million tonnes per annum (Ellis and Singh, 2010).
Capacity utilisation is the other key impact on capital productivity. Higher capacity utilisation is generally cited as an improvement in the company’s efficiency, as it may be the product of an aggressive marketing strategy, better maintenance of the plant and quality control measures. Generally, the higher the capacity utilisation, the higher the industry’s productivity.
Approach
The primary data on the output of individual companies, the gate price and coal consumption of each company were collected through questionnaires. The questionnaire comprised three parts: (1) background information of the company; (2) quantitative data, including output, sales revenue and price; and (3) more qualitative data that helped to analyse how the companies perceive the competitive circumstances, and their understanding of the aspects of competitiveness. Qualitative information, such as investment decisions, perceptions of competition, government policy impacts and challenges faced by the industry, provided descriptions of events but also a thorough understanding of the cement industry.
The effect of competition on productivity and price was assessed in both qualitative and quantitative terms. The price of cement was measured in four different regions in Ethiopia. The first region has the largest cement company (near Mugher) and is the biggest cement market (Addis Ababa). The second is far from the major cement market and has few cement producers (Dire Dawa). The third region has only one producer (Mekelle), while the fourth (Bahir Dar) has no cement

295
e f f e c t s o f c o m p e t i t i o n o n c e m e n t p r i c e s a n d p r o d u c t i v i t y
producer and relies on supplies being transported to it from the other regions. These regions help us to assess how transport costs and company concentration rate has affected the price and mark-up of cement in Ethiopia.
The aggregate and individual output of each cement company since 2012 was analysed, along with the capacity utilisation of each company over time, as well as the investment costs in new technology and machinery. This is related to efficiency (measured in terms of costs and energy use) and concentration over the last five years. Data was collected on nine selected cement companies in Ethiopia, including the major companies and some small- and medium-sized companies for comparison.
OVERVIEW OF THE ETHIOPIAN CEMENT INDUSTRY
Construction industry activity, cement consumption and production
The demand for cement is dependent on construction activity. From 2004 to 2016, the Ethiopian construction industry had sustained growth of around 13 per cent per annum, with it surpassing 20 per cent in 2014 (Oqubay, 2015). Construction growth is also closely related to the Ethiopian government’s economic strategy to expand infrastructure, and build low-cost and reasonably priced houses for society (Ferede and Kebede, 2015).
As a consequence of the construction industry’s growth, the consumption of cement also increased from around 1.4 million per tonne in 2004 to 8.1 million per tonne in 2016 (Figure 9.1). This has been underpinned by GDP growth, per capita income growth, political stability, high population growth (2.6 per cent), the fast expansion of urbanisation (4.3 per cent per annum), accelerated growth of infrastructure and the ambition of attaining middle-income country status by 2025 (MoI, 2014c).
Following the boom of the construction industry in 2004, there was a severe shortage of cement supplies until 2011, and consequently the

C o m p e t i t i o n a n d R e g u l a t i o n f o R i n C l u s i v e g R o w t h
296
price of cement reached record highs of US $400 per tonne in 2007/08 (Figure 9.2), equivalent to US $20 per 50-kilogram bag. Because of this severe shortage and price hike, the government was forced to import cement between 2006 and 2011. For example, in a single year (2007/08), Ethiopia imported about 1.4 million tonnes of cement (Figure 9.1), mainly from Pakistan, China, Egypt and Oman and transacted through government-owned and private companies.
Figure 9.1: Local production, importation and exportation of cement, tons
Source: Questionnaire (2016), CSA reports on large- and medium-scale manufacturing and electricity survey from 2003-2014, and MoI (2014c).
However, since 2012, the situation has changed due to the expansion of existing companies and new entrants into the cement industry. The capacity of the industry increased from 1.5 million tonnes in 2004 to 15.6 million tonnes in 2016 (CCIIDI, 2015). In particular, major investments were made between 2010 to 2016 by Dangote Cement and Derba Cement, to achieve economies of scale and reach capacities of 2.5 million tonnes and 2.3 million tonnes, respectively.
The impressive recorded growth established Ethiopia as the third largest cement producer in sub-Saharan Africa, after Nigeria and South Africa. However, the per capita consumption of cement in Ethiopia is still low (at 80 kilograms in 2016) compared to the average international
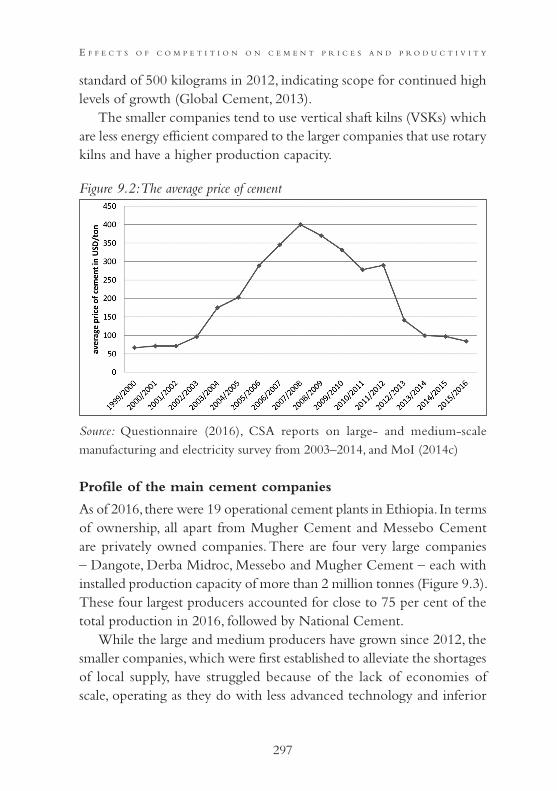
297
e f f e c t s o f c o m p e t i t i o n o n c e m e n t p r i c e s a n d p r o d u c t i v i t y
standard of 500 kilograms in 2012, indicating scope for continued high levels of growth (Global Cement, 2013).
The smaller companies tend to use vertical shaft kilns (VSKs) which are less energy efficient compared to the larger companies that use rotary kilns and have a higher production capacity.
Figure 9.2: The average price of cement
Source: Questionnaire (2016), CSA reports on large- and medium-scale manufacturing and electricity survey from 2003–2014, and MoI (2014c)
Profile of the main cement companies
As of 2016, there were 19 operational cement plants in Ethiopia. In terms of ownership, all apart from Mugher Cement and Messebo Cement are privately owned companies. There are four very large companies – Dangote, Derba Midroc, Messebo and Mugher Cement – each with installed production capacity of more than 2 million tonnes (Figure 9.3). These four largest producers accounted for close to 75 per cent of the total production in 2016, followed by National Cement.
While the large and medium producers have grown since 2012, the smaller companies, which were first established to alleviate the shortages of local supply, have struggled because of the lack of economies of scale, operating as they do with less advanced technology and inferior
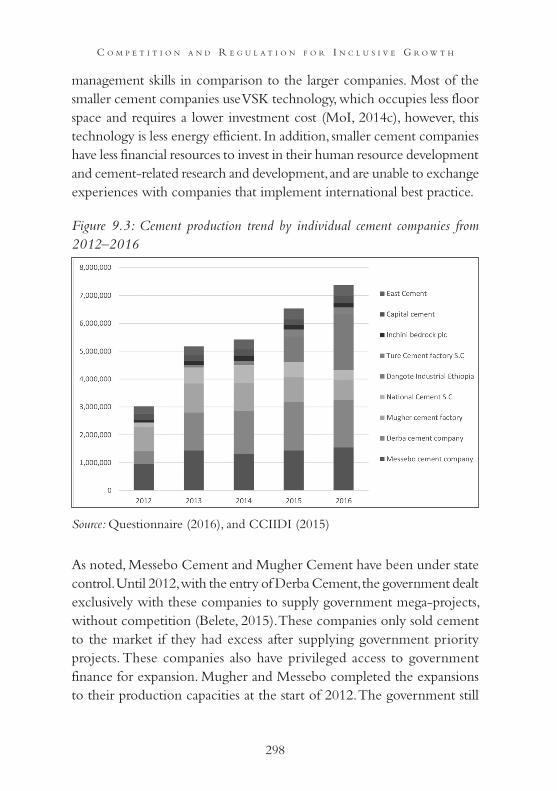
C o m p e t i t i o n a n d R e g u l a t i o n f o R i n C l u s i v e g R o w t h
298
management skills in comparison to the larger companies. Most of the smaller cement companies use VSK technology, which occupies less floor space and requires a lower investment cost (MoI, 2014c), however, this technology is less energy efficient. In addition, smaller cement companies have less financial resources to invest in their human resource development and cement-related research and development, and are unable to exchange experiences with companies that implement international best practice.
Figure 9.3: Cement production trend by individual cement companies from 2012–2016
Source: Questionnaire (2016), and CCIIDI (2015)
As noted, Messebo Cement and Mugher Cement have been under state control. Until 2012, with the entry of Derba Cement, the government dealt exclusively with these companies to supply government mega-projects, without competition (Belete, 2015). These companies only sold cement to the market if they had excess after supplying government priority projects. These companies also have privileged access to government finance for expansion. Mugher and Messebo completed the expansions to their production capacities at the start of 2012. The government still

299
e f f e c t s o f c o m p e t i t i o n o n c e m e n t p r i c e s a n d p r o d u c t i v i t y
uses these companies to supply cement for ongoing public housing and infrastructure projects. However, the entry and growth of Derba and Dangote, along with smaller companies, has meant that, while still oligopolistic, the concentration levels have declined substantially.
Table 9.1: Profile of the top five cement companies
Company Company description
1 Dangote Cement
Largest cement factory with an installed production capacity of 2.5 million tonnes per annum, with the latest technology and a large-scale rotary kiln, it was established in 2015 by a Nigerian businessman, Aliko Dangote, with an investment capital of US $133 million. The capacity utilisation of the company was 80% (2016). The company has its own transport fleet, which helps it to supply the untapped market in remote and neighbouring country border areas. The company has been exporting cement to Kenya. Recently, it set up a packaging plant at a cost of US $21.5 million (Global Cement, 2017).
2 Derba Midroc Cement
The second largest cement factory in Ethiopia is part of the Midroc conglomerate group owned by Sheik Mohamed Al Amoudi, an Ethiopian by birth. The company was established in 2012 with an installed production capacity of 2.3 million tonnes per annum, and an investment capital of US $158 million. The company uses modern technology with large-scale rotary kilns and its capacity utilisation improved from 55% in 2013 to 71.3% in 2016. The company is one of the main drivers in the reduction of the cement price in Ethiopia; when they entered the market, prices were slashed by nearly half. Derba has its own fleet and promised door-to-door delivery in a matter of five to seven days of order within a radius of about 350 km from the plant (located quite near to Addis Ababa). Since 2013, the company exports mainly to Kenya and Djibouti.
3 Messebo Cement
Total installed production of 2.2 million tonnes per annum. The company was established in 1997 as one of the subsidiaries of the EFFORT. It is located in Mekelle, which is 760 km from the main cement market in Addis Ababa. To be competitive and environmentally friendly, in 2014 the company took the initiative to substitute some of its energy fuel with biomass.

C o m p e t i t i o n a n d R e g u l a t i o n f o R i n C l u s i v e g R o w t h
300
Source: CCIIDI (2015); Questionnaire (2016); MoI (2014c); Oqubay (2015)
Given the high volume and low value nature of cement, selecting the appropriate geographical location to situate a cement company is crucial, because overland transport costs in Ethiopia are significant. The three largest factories, namely Dangote, Derba and Mugher, which together account for more than 55 per cent of the total capacity, are concentrated in one area, ie, Mugher, largely because of the availability of raw materials and the area’s proximity to the main market of Addis Ababa (see Figure 9.4). Only a few factories, namely Messebo in the north at Mekelle, National Cement in Dire Dawa, and some smaller factories in the east, are located further away from Addis Ababa. These suppliers are affected significantly by transport costs to Addis Ababa. Because of this, in 2017 Messebo Cement established a milling plant close to Addis Ababa,3 and National Cement focused to an extent on exporting to nearby neighbouring countries rather than competing in the local, central market.4
Industrial policy instruments to promote the cement industry
The government of Ethiopia has played a key role through its industrial policy in the development of the cement industry, with direct and indirect interventions. Direct interventions included providing long-term
Company Company description
4 Mugher Cement
The oldest and state-owned cement enterprise. In 2012 it established a new plant close to Addis Ababa, with an installed production capacity of 1.4 million tonnes per annum, meaning that its total production capacity is 2.2 million tonnes. It is the only company that trains cement technicians up to college level in its institute. It changed to a coal-fired plant to shift the energy usage from heavy furnace oil, to reduce energy costs.
5 National Cement
It is the fifth largest company located in the city of Dire Dawa. The company started the business by acquiring Dire Dawa Cement Company in 2005. In 2013, the company expanded to a production capacity of 1.2 million tonnes per annum. Because of its geographical location, the company is positioned to export to Somalia and Djibouti, which it has done since 2013.

301
e f f e c t s o f c o m p e t i t i o n o n c e m e n t p r i c e s a n d p r o d u c t i v i t y
loans through the Development Bank of Ethiopia, incentives, allowing the importation of capital goods duty-free, expanding state-owned enterprises, providing access to factory land at low prices, exemption from income tax and facilitating access to quarry sites (for limestone, clay, gypsum and pumice) with very low royalty fees (Oqubay, 2015). On the other hand, the demand for cement is driven by government programmes for housing and infrastructure.
Figure 9.4. Location of the five main cement plants
Source: MoI
ANALYSIS OF COMPETITION, PRICING AND PRODUCTIVITY IN THE CEMENT INDUSTRY
The changes brought about by the entry of new producers and the expansion of existing plants completely transformed Ethiopia’s cement industry from 2011, when there were effectively only two state-owned producers (Messebo and Mugher) of significant scale. Prices reduced

C o m p e t i t i o n a n d R e g u l a t i o n f o R i n C l u s i v e g R o w t h
302
from above US $14 in 2011 to between US $5 and US $8 per 50-kilogam bag (Figure 9.5). To analyse the effect of competition, price is considered in more detail for the four selected major regions of Addis Ababa, Bahir Dar, Mekelle and Dire Dawa.
Competition and pricing in regional markets
Addis Ababa is the capital city and the largest market with a number of major producers in its proximity. Bahir Ðar, the capital city of Amhara regional state, is located in the north-west part of Ethiopia, 560 kilometres from Addis Ababa, and there is no cement plant in the region or near this area. Mekelle is the capital city of Tigray regional state, located in the northern part of Ethiopia, 780 kilometres from Addis Ababa, and this is where the Messebo Cement factory (one of the biggest cement companies, owned by the EFFORT) is located. Dire Dawa is located in the eastern part of Ethiopia, 560 kilometres from Addis Ababa, and it has two medium-sized cement manufacturers (National and Ture Cement).
Figure 9.5: Monthly average cement price by locations, US $ per 50 kg
Source: CSA reports on large- and medium-scale manufacturing and electricity survey from 2009–2016.

303
e f f e c t s o f c o m p e t i t i o n o n c e m e n t p r i c e s a n d p r o d u c t i v i t y
A temporary shut-down in 2015 (due to a technical problem at Derba and Mugher Cement) indicates the importance of having sufficient capacity to meet demand in local markets, as there was a short-term price hike to US $10 in Addis Ababa and Bahir Dar. Prices in Dire Dawa and Mekelle fell to almost US $4 in 2016.
The entry of new producers is reflected in the changes in the concentration ratio (measured in terms of national installed capacity). Measured in terms of the share of the largest two producers (the CR2) concentration reduced from 0.90 before 2011 to 0.31 in 2015 when Dangote’s plant came into production. Overall, the industry is still highly oligopolistic, however, with the four largest companies accounting for approximately 60 per cent in 2015–2017 (Table 9.2).
The difference in prices between locations – with prices in Addis Ababa and Bahir Dar at times being as much as 50 per cent higher than in Dire Dawa – points to important local market dynamics, with higher levels of concentration than at the national level, which need to be analysed.
Table 9.2: Concentration ratios based on installed production capacity
Source: Questionnaire (2016)
Addis Ababa
Three major cement factories (Mugher, Derba and Dangote) operate within a range of 150 kilometres of Addis Ababa, as well as many medium and small cement plants. As most construction activity takes place in this area, it is the main cement market. However, the price of cement in Addis Ababa has generally been higher than that in Mekelle and Dire
Concentration ratio
Before 2011 2012–2014 2015–2017
Largest single factory, CR1 0.53 0.18 0.16
Largest two factories, CR2 0.90 0.35 0.31
Largest three factories, CR3 0.95 0.52 0.45
Largest four factories, CR4 – 0.61 0.59

C o m p e t i t i o n a n d R e g u l a t i o n f o R i n C l u s i v e g R o w t h
304
Dawa, where other major producers are located, although not as high as in Bahir Dar, where there is no local cement plant. The concentration ratio has also decreased over time (Table 9.3).
Table 9.3: Concentration ratio in Addis Ababa region based on installed production capacity
Source: Questionnaire (2016)
Even though most of the cement suppliers are located around Addis Ababa, many of them are small and their market shares are insignificant and, because of this, the market structure is oligopolistic. Prices in Addis Ababa are highly correlated between Addis Ababa and Mekelle (with a correlation coefficient of 0.92) and with the price in Dire Dawa (with a price correlation of 0.95). The main reason for higher prices in Addis Ababa is that while there are several producers, the size of the market means that supplies also have to come from other regions. This also helps the inefficient small local cement producers to sustain the higher prices. The Addis Ababa market thus includes ‘imports’ from other regions at a delivered price to the capital city and we need to take the transport costs into account in an exercise in geographic market definition (Massey, 2000) (Table 9.4). If we consider the price of cement from Mekele on a delivered basis, including the transport costs, the actual price in Addis Ababa is higher suggesting that, apart from the supply shortage in 2015, Mekele suppliers do not set the price in Addis (see Figure 9.6). It should be noted, however, that cement suppliers may well be able to get lower costs for bulk transport, than the standard rates recorded in Table 9.4.
Concentration ratio in Addis Ababa
Size of factories 2012–2014 2015–2017
CR1 0.38 0.29
CR2 0.73 0.56
CR3 0.83 0.81
CR4 0.95 0.9

305
e f f e c t s o f c o m p e t i t i o n o n c e m e n t p r i c e s a n d p r o d u c t i v i t y
Table 9.4: Average land transport cost between Addis Ababa and the main regional cities, US $ pre-tonne (per 50-kg bag computed in brackets)
Source: Federal Transport Minister
Figure 9.6: Monthly average cement prices in US $ per 50 kg in Addis Ababa and Mekelle regions
Source: CSA reports on large- and medium-scale manufacturing and electricity survey from 2009-2016; Own computation based on transport costs
Year Addis Ababa to Mekele (780 km)
Mekele to Bahir Dar (610 km)
Bahir Dar to Addis Ababa (560 km)
Addis Ababa to Adama (100 km)
Addis Ababa to Dire Dawa (560 km)
2012 50.4 (2.53) 39.0 (1.95) 37.6 (1.88) 6.7 (0.34) 37.6 (1.88)
2013 48.7 (2.44) 37.1 (1.86) 35.0 (1.75) 6.3 (0.32) 35.0 (1.75)
2014 45.3 (2.26) 35.4 (1.77) 32.5 (1.63) 5.8 (0.29) 32.5 (1.63)
2015 42.1 (2.11) 33.4 (1.67) 30.2 (1.5) 5.4 (0.27) 30.2 (1.5)
2016 39.9 (1.99) 31.2 (1.56) 28.6 (1.43) 5.1 (0.26) 28.6 (1.43)

C o m p e t i t i o n a n d R e g u l a t i o n f o R i n C l u s i v e g R o w t h
306
Transport costs are lower from Dire Dawa, but are still substantial at between US $1.43 to US $1.88 per 50kg bag. Taking into account these transport costs, we get delivered prices in Addis Ababa which are in line with the prices recorded for the capital city’s market (Figure 9.7).
Figure 9.7: Monthly average cement prices in US $ per 50 kg in the Addis Ababa and Dire Dawa regions
Source: CSA reports on large- and medium-scale manufacturing and electricity survey from 2009–2016; Own computation based on transport costs.
The analysis indicates that despite more competitors in the Addis Ababa region, the supply from Dire Dawa (and to a lesser extent from Mekelle) has been important in keeping down prices in Addis Ababa. The cement market in Addis Ababa, therefore, should not be seen as a separate market in competition terms but should include supplies from Dire Dawa (and perhaps Mekelle) as marginal sources of supply. This does raise the question as to why plants in Addis Ababa have not expanded to meet the local demand, at prices that are in line with those in the other regions (that is, excluding transport costs).

307
e f f e c t s o f c o m p e t i t i o n o n c e m e n t p r i c e s a n d p r o d u c t i v i t y
Mekelle
The price of cement in Mekelle is lower than in Addis Ababa, but higher than in Dire Dawa throughout the period, while being highly correlated with these regions. However, using the SSINP price test, if cement prices in Mekelle increased by 5–10 per cent, customers would not source cement from Addis Ababa or Dire Dawa given the high transport costs and already low price in Mekelle. Geographic market definition is not symmetric.
The market in Mekelle is, therefore, effectively a monopoly (with only one producer and no effective competitive constraints from other regions). However, the price is lower than prices in Addis Ababa, which has many cement producers. This is because there is a substantial surplus of local supply over demand, and Messebo Cement (located in Mekelle) is a relatively low-cost producer. It appears that Messebo has priced its cement to compete in markets situated further away, including Addis Ababa. In effect, while appearing to be a monopoly, Messebo does not discriminate against local customers who obtain an ‘export’ price for sales to the Addis Ababa market.
Dire Dawa
Since 2013, the price of cement in Dire Dawa has been lower than in any of the other three regions. The maximum cement price was US $5.35 per 50 kilograms in 2015, and the minimum price was US $4.4 per 50 kilograms in 2016 (Figure 9.5). National Cement (previously Dire Dawa Cement) was the only producer in the region until 2013, when Ture Cement became operational and the price decreased to US $5.2 resulting in Dire Dawa being cheaper relative to the other regions.
Although the prices in Dire Dawa are correlated with the other regions, as in Mekelle, the transport costs and low prices in Dire Dawa mean that consumers would not readily turn to alternative regions for a competitive supply if prices in Dire Dawa increased by a SSNIP of 5–10 per cent. There are two cement producers in Dire Dawa that also export to neighbouring countries, which means they have promoted efficiencies, as discussed below. As a result, the cement market in Dire

C o m p e t i t i o n a n d R e g u l a t i o n f o R i n C l u s i v e g R o w t h
308
Dawa is very competitive in pricing outcomes, despite being a duopoly.
Bahir Dar
For purposes of comparison, the price of cement in Bahir Dar is also considered. As there is no cement producer in this region, the supply of cement to the Bahir Dar market either comes from Mekelle (Messebo Cement) or from Addis Ababa (Derba Cement and Dangote Cement). As expected, prices are closely correlated with these regions. Computing the price in Mekelle, plus the transport cost from Mekelle to Bahir Dar, gave a maximum price of US $8.4 per 50 kilograms in 2012, and a minimum price of US $6.06 per 50 kilogram, which is lower than the actual prices recorded in Bahir Dar. Similarly, computing prices in Addis Ababa, plus the transport cost from Addis Ababa to Bahir Dar, gave a maximum price US $10.13 per 50 kilogram in 2012 and a minimum price of US $6.76 per 50 kilogram in 2016, making the price higher in Addis Ababa than in Bahir Dar. Thus, it would appear that Bahir Dar is supplied mainly by Mekelle.
Competition and the cost of production
The interaction of competition and company investment decisions have played an important part in lowering costs of production and sustaining more competitive prices. The production costs of Ethiopian cement producers roughly halved from 2012 to 2016 (Table 9.5). This occurred for two main reasons. First, with the entry of new, large-scale producers in 2012, there was competitive pressure on companies to decrease production costs and realise efficiencies as prices came down. Second, the cost of energy decreased, including because of the adoption of more efficient, larger-scale production technologies.
The most significant decreases in the costs of production occurred in the largest cement companies (Messebo, Derba and Dangote), aside from Mugher, which combine economies of scale, modern technology and efficient energy usage (see Table 9.5). Messebo Cement recorded the lowest cost throughout and achieved cost reductions from an average of US $86.3 per tonne in 2012 to US $35.7 per tonne in

309
e f f e c t s o f c o m p e t i t i o n o n c e m e n t p r i c e s a n d p r o d u c t i v i t y
2016. This is because the company uses very efficient technology and has also pioneered the blending of biomass with coal to lower its energy costs. Its cost-efficiency is also essential as it is located in Mekelle, far from the main Addis Ababa market, requiring it to be able absorb higher transport costs and yet still compete in Addis Ababa.
Table 9.5: Production costs (excluding transport cost) of cement, US $ per ton of cement
Source: Own computation based on companies’ information collected through Questionnaire (2016)
Similarly, by 2016 Derba Cement had decreased its production costs to US $38.3 per tonne, while Dangote Cement started its operations at low costs. On the other hand, some of the small- and medium-sized cement companies that operate in the Addis Ababa surrounds are not as cost-efficient. This is because most of them are small- and medium-sized businesses with VSKs, which are not energy-efficient. In effect, the higher prices in Addis Ababa appear to cover the relative cost inefficiencies of some of the plants in the region.
The cost of production in the cement industry is related mostly to the cost of energy. For a long time, Ethiopian cement companies have used imported heavy fuel oil (HFO). With the increasing price of HFO, the government encouraged a shift to coal, which is also imported.
Company 2012 2013 2014 2015 2016
Messebo Cement Factory 86.3 72.6 61.7 37.4 35.7
Derba Cement plc 90.9 76.6 65.7 40.0 38.3
Dangote Cement 42.3 41.2
National Cement plc 107.7 96.5 88.6 54.8 54.9
Mugher Cement factory 123.8 125.8 121.5 119.0 93.5
East Cement plc 99.0 92.6 85.0 52.3 57.7
Inchini Bedrock plc 103.4 96.5 88.8 57.4 60.3

C o m p e t i t i o n a n d R e g u l a t i o n f o R i n C l u s i v e g R o w t h
310
This shift has underpinned lower production costs, aside from Mugher Cement, which continued to use HFO and, as late as 2016, recorded much higher production costs.
The evidence that competition has spurred cost reductions is evident when price mark-ups over costs are considered. When the cement market became competitive after 2012, the price of cement decreased to the extent that profit mark-ups were squeezed from 20 per cent in 2012 to just 7 per cent in 2016 (Figure 9.8). This incentivised the decreasing costs observed above.
Figure 9.8: Average mark-ups, as percentage of revenue
Source: Own calculation from questionnaire data (2016)
Cement is a high consumer of energy, especially in the pyro-processing system (the process of clinker production, which involves the preheaters/precalciners, kilns and coolers) which accounts for close to 93 per cent of the total energy consumption of the plant. Pyro-processing is the most important process in cement manufacturing because strength and other properties of cement depend on the quality of clinker produced.
To evaluate the efficiency of the cement industry, the quantity of energy per tonne of clinker or cement can be compared to international benchmarks. At the international benchmark, the energy required for the production of one kilogram of clinker is 2 750 kilojoules or 0.11 kilograms of coal (Choate, 2003).

311
e f f e c t s o f c o m p e t i t i o n o n c e m e n t p r i c e s a n d p r o d u c t i v i t y
The efficiency of the Ethiopian cement industry has improved over time, but efficiency is still lower than the international standard. In 2012, on average 0.23 kilograms of coal or 5 750 kilojoules were required to produce a kilogram of clinker. This was reduced to 0.17 kilograms of coal or 4 250 kilojoules in 2016; however, it remains above the benchmark (Table 9.6). The larger producers have got close to the international benchmarks led by Messebo Cement, which achieved 0.13 kilograms of coal per kilogram of clinker in 2016, followed by Derba Cement at 0.14 kilograms and Dangote Cement at 0.15 kilograms (Table 9.6).
Table 9.6: Coal consumption in kg per kilogram of clinker production (coal kg/kg of clinker)
Source: Own computation based on data from questionnaire (2016)
By comparison, the smaller cement companies are relatively inefficient. Inchini Bedrock Cement consumed 0.24 kilograms of coal per kilogram of clinker in 2012, and only slightly decreased this to 0.22 kilograms of coal per kilogram of clinker in 2016. Similarly, National Cement and East Cement consumed 0.25 kilograms and 0.23 kilograms of coal per kilogram of clinker in 2012, and only slightly decreased this to 0.20 kilograms and 0.21 kilograms per kilogram of clinker, respectively, in 2016. As noted, this poor performance is mainly due to the continued use of small-scale VSKs.
The cost of energy per tonne of clinker production depends on the quantity used and on the changing price of coal. The efficiencies
Company 2012 2013 2014 2015 2016
Messebo Cement Factory 0.20 0.18 0.16 0.15 0.13
Derba Cement 0.21 0.19 0.17 0.16 0.14
Dangote Cement – – – 0.17 0.15
East Cement 0.23 0.23 0.22 0.21 0.21
National Cement 0.25 0.24 0.23 0.21 0.20
Inchini Bedrock 0.24 0.24 0.23 0.22 0.22

C o m p e t i t i o n a n d R e g u l a t i o n f o R i n C l u s i v e g R o w t h
312
combined with the costs of imported coal reducing from US $151 per tonne of coal in 2012 to US $87 per tonne in 2015 – albeit rising slightly once again to US $96 in 2016 (Table 9.7) – yielded the lower energy costs per tonne of clinker for each producer, recorded in Table 9.8.
Table 9.7: Coal prices, US $ per ton of coal
Source: Ethiopian Customs and Revenue
In general, the efficiency of Ethiopian cement companies has improved substantially over time, alongside increased competition and the government’s shift in policy encouraging the use of coal (even while coal is imported). The companies realised that the efficiencies required major investments, given the capital-intensive nature of cement production and the importance of achieving economies of scale. The two biggest Ethiopian cement plants, Dangote and Derba, invested US $133 million and US $158 million, respectively, in their facilities (CCIIDI, 2015). Each of the four largest producers have plants with more than two million tonnes capacity, resulting in lower unit costs of production than the smaller plants and higher profit margins, which enable returns on the investment, assuming that the plants run at high capacity (see Appendix, Table 9.1A). From 2012, Derba and Messebo showed a trend of increasing sales volume and output, to reach 1.64 million tonnes and 1.55 million tonnes of production, respectively, in 2016. Dangote ramped up production quickly from 0.93 million tonnes in 2015 when is began its operations, to 2.04 million tonnes in 2016.
Imported quantity, tonnes CIF value in US $ Unit price in US $
2012 282 655 42 746 160 151
2013 291 932 41 119 940 141
2014 345 892– 46 639 978 135
2015 514,703 44 871 794 87
2016 570 738 54 857 323 96

313
e f f e c t s o f c o m p e t i t i o n o n c e m e n t p r i c e s a n d p r o d u c t i v i t y
Tabl
e 9.
8: C
linke
r pro
ducti
on a
nd co
st of
ene
rgy
per t
on o
f clin
ker
Clin
ker
prod
ucti
on in
tons
and
cos
t of e
nerg
y, p
er to
n of
clin
ker,
US$
Com
pany
2012
2013
2014
2015
2016
Clin
ker
tons
Cos
t/to
nne
Clin
ker
tons
Cos
t/to
nne
Clin
ker
tons
Cos
t/to
nne
Clin
ker
tons
Cos
t/to
nne
Clin
ker
tons
Cos
t/to
nne
Dan
gote
--
--
--
691
612
14.8
14.4
Mes
sebo
662
960
30.2
890
817
25.4
1 09
0 18
921
.613
.11
225
772
12.5
Der
ba32
7 22
61.
897
7 16
026
.81
094
395
23.0
246
625
14.0
1 22
5 77
213
.4
Mug
her
636
620
49.5
782
045
50.3
789
047
48.6
705
984
47.7
544
616
37.4
Nat
iona
l C
emen
t13
4 28
037
.713
9 18
533
.848
7 47
831
.053
1 13
419
.281
0 19
219
.2
Inch
ini
Bed
rock
63 7
0036
.297
560
33.8
112
838
31.1
103
811
20.1
11 4
191
21.1
East
C
emen
t15
9 65
034
.723
3 25
032
.424
4 40
029
.727
7 00
018
.330
6 92
020
.2
Sour
ce: O
wn
com
puta
tion
base
d on
com
pany
info
rmat
ion
colle
cted
thr
ough
que
stio
nnai
re (
2016
)

C o m p e t i t i o n a n d R e g u l a t i o n f o R i n C l u s i v e g R o w t h
314
The improvements are associated with higher capacity utilisation by the large producers. In 2016, Dangote, Derba and Messebo utilised 81.6 per cent, 71.3 per cent and 70.5 per cent of their capacity, respectively (Appendix, Table 9.1A). High capacity utilisation means that the companies are using technically efficient technology, have better maintenance capabilities and can support more effective marketing strategies and management systems, so that the unit costs of the product are lower. Capacity utilisation is also associated with energy efficiency.
However, Mugher Cement and National Cement have shown a decreasing trend, with production far below capacity, at just 0.71 million tonnes and 0.36 million tonnes, respectively, in 2016. There are many reasons for a decreasing trend of production output and sales volume at Mugher Cement. First, the company did not change their energy source from HFO to coal until 2016, which made it uncompetitive in the cement market. Second, frequent electricity interruptions, significant staff turnover and quality failures5 contributed to low production. Third, Mugher Cement was established more than 30 years ago and has the oldest plant, operating outdated technology.
Similarly, National Cement acquired the oldest plant, Dire Dawa Cement in 2005, which, like Mugher Cement, used outdated technology. As a result, there were cost inefficiencies. However, in 2016 the company upgraded by establishing a new cement plant and abandoning the old one, so it is expected to improve in the coming years.6 This shows that competition has driven the adoption of more current technology and power efficiency in this and other plants.
Restructuring is an essential part of the process of competitive rivalry. Messebo and later Mugher invested US $71 and US $77 million, respectively, to upgrade their plants to meet the threat of new entrants, Derba and Dangote, head on. Internationally, the minimum efficient production output a cement plant needs to accomplish – while taking full advantage of economies of scale with regard to costs and supplies – is about one million tonnes every year (Ellis and Singh, 2010). The smaller cement plants were established when the country faced acute cement shortages, and they use VSKs which consume more energy per

315
e f f e c t s o f c o m p e t i t i o n o n c e m e n t p r i c e s a n d p r o d u c t i v i t y
unit of output. Now producers face the challenge of restructuring as larger producers realise lower costs, and some of the smaller plants have shifted from cement production to gypsum and other construction input material production.
Industrial policy can play a role in restructuring, as it can support the large-scale investments and the shift to modern production techniques and technology. Large cement producers can also access finance for expansion and modernisation. Of course, the closure of small cement producers is not an easy as it has employment implications, however, there are many more employment opportunities in the construction business, in which cement is a key input.
CONCLUSION
The cement industry is central to Ethiopian economic development, given the importance of infrastructure expansion, including the many private and government mega projects. With growth in infrastructure development and the investment in cement production, the Ethiopian cement industry grew so rapidly that the country was the third largest producer in sub-Saharan Africa in 2017. This study has highlighted the interplay between competition and government’s industrial policy, which supported investment in the industry through incentives and credit, to realise economies of scale and efficient production.
Competition was non-existent in the Ethiopian cement market for many years when two state-linked companies (Mugher and Messebo) dominated the cement industry. The companies were the exclusive suppliers of cement for government’s mega projects without competitive procurement. Therefore, these companies were not concerned about productive efficiency as long as they sold their products at a high mark-up. Although a few small-scale cement companies became operational in 2005, their market share was insignificant and they did not have the capacity to compete with large-scale producers. This inefficient industry was sustained as prices of cement were very high because of the imbalance between supply and demand as production capacity was too low to meet the growing demand.

C o m p e t i t i o n a n d R e g u l a t i o n f o R i n C l u s i v e g R o w t h
316
After 2012, this situation changed as the government opened the market to new entrants, including the two large cement producers, Dangote and Derba, which become operational in addition to the smaller competitors. Our findings show that the cement market became relatively competitive in terms of market outcomes (and not simply the number of competitors), such that the price of cement decreased significantly.
The findings show that there have been significant changes in terms of low-cost production, more efficient utilisation of energy and better performance in capacity utilisation, as observed in the newly established, large-scale cement companies. However, there has been a need to restructure the older and smaller cement companies that use small-scale kilns with inefficient technology that is not cost efficient.
There are important implications for other developing countries. To ensure a competitive industry, there needs to be investment in energy- efficient and large-scale production, coupled with effective rivalry to ensure production efficiencies and lower prices to the buyers in the economy. Sourcing low-cost energy (coal in the case of Ethiopia, as well as biomass) is also important, which means sourcing low-cost import, rather than supporting high-cost local sources. Achieving competition and a competitive industry is easier with larger demand. This suggests that regional integration to ensure larger regional markets must be part of the picture.
NOTES
1 This chapter is based on Tesfaw Wondimu’s dissertation titled ‘The effect of competition on productivity and price of cement manufacture in Ethiopia’, in partial fulfilment for the MPhil in Industrial Policy at University of Johannesburg in 2017, under the supervision of Simon Roberts.2 Messebo Cement is owned by the Endowment Fund for the Rehabilitation of Tigray (EFFORT).3 In the questionnaire, the company indicates that the reason for not fully utilising their capacity is that they are located away from the main market and, as a result, they are planning to set up a milling plant closer to the market in Addis Ababa.

317
e f f e c t s o f c o m p e t i t i o n o n c e m e n t p r i c e s a n d p r o d u c t i v i t y
4 Interview with the Marketing Manager of National Cement, 5 January 2017.5 The company identified the main challenges in the questionnaire, 2016, which includes lack of management commitment in implementing different cost reduction systems. 6 Interview with Production Manager and Human Resource Manager of National Cement, 4 January 2017.
REFERENCES
Belete, KM (2015) The State of Competition and the Competition Regime of Ethiopia: Potential gaps and enforcement challenges. Addis Ababa, Ethiopia: Organization for Social Science Research in Eastern and Southern Africa (OSSREA).
Chemical and Constructions Inputs Industry Development Institute (CCIIDI) (2015) Annual Cement Report. Addis Ababa, Ethiopia: CCIIDI.
Chemical and Constructions Inputs Industry Development Institute (CCIIDI) (2016) Annual Cement Report. Addis Ababa, Ethiopia: CCIIDI.
Choate, WT (2003) Energy and Emission Reduction Opportunities for the Cement Industries. Laurel, MD: BCS Inc.
Ellis, K and Singh, R (2010) Assessing the Economic Impact of Competition. London: Overseas Development Institute.
Ferede, T and Kebede, S (2015) Economic growth and employment patterns, dominant sector, and firm profiles in Ethiopia: Opportunities, challenges and Prospects. R4D Working Paper. Bern: Swiss Programme for Research on Global Issues for Development, University of Bern.
Global Cement (2013) Global Cement Report 10th edition. Available at: www.globalcement.com [Accessed 10 January 2018].
Global Cement (2017) Global Cement Report 12th edition. Available at: www.globalcement.com [Accessed 10 January 2018].
Massey, P (2000) Market definition and market power in competition analysis: Some practical issues, Economic and Social Review, 31(4): 309–328.
Ministry of Finance and Economic Development (MoFED) (2014) Growth and Transformation Plan: Annual Progress Report for F.Y. 2012/13. Addis Ababa: MOFED.
Ministry of Industry (MoI) (2014a) Cement Industry Report. Addis Ababa: MoI.Ministry of Industry (MoI) (2014b) The Annual Report of the Manufacturing

C o m p e t i t i o n a n d R e g u l a t i o n f o R i n C l u s i v e g R o w t h
318
Industry. Addis Ababa: MoI.Ministry of Industry (MoI) (2014c) Ethiopian Cement Development Strategy
Document 2015–2025. Addis Ababa: MoI.Oqubay, A (2015) Made in Africa: Industrial Policy in Ethiopia. New York: Oxford
University Press.

319
e f f e c t s o f c o m p e t i t i o n o n c e m e n t p r i c e s a n d p r o d u c t i v i t y
APPE
ND
IX
Tabl
e 9.
1A: T
he in
vestm
ent c
apita
l, sa
les, a
ctual
pro
ducti
on a
nd d
esig
n ca
pacit
y of
eac
h ce
men
t com
pany
Sour
ce: Q
uest
iona
ire
(201
6)
Nam
e of
the
co
mpa
ny
Pro
duct
ion
capa
city
in
Mt
Inve
stm
ent
capi
tal i
n m
illi
on
US
$
Act
ual p
rodu
ctio
n of
cem
ent
in m
illi
on t
onne
s (M
t) a
nd a
nnua
l sal
es in
US
$
2012
2013
2014
2015
201
6
Mt
Sal
esM
tS
ales
Mt
Sal
esM
tS
ales
Mt
Sal
es
Dan
gote
In
dust
rial
E
thio
pia
2.5
133
––
––
––
0.93
99 1
75 1
96.8
22.
0419
9 15
0 88
2.35
Mes
sebo
C
emen
t F
acto
ry2.
271
(exp
)0.
952
118
488
075
1.44
148
142
693.
550.
803
73 6
19 7
66.7
1.44
135
109
875.
11.
5512
7 71
6 72
1.84
Der
ba
Cem
ent
plc
2.3
158
0.45
50 4
40 3
81.6
41.
414
6 14
3 28
5.5
1.54
155
101
481.
842.
0720
8 89
8 90
0.82
1.64
150
481,
476.
33
Mug
her
Cem
ent
Fac
tory
2.2
77 (e
xp)
0.85
105
116
498.
11.
0511
6 85
4 12
7.3
1.01
108
125
235.
10.
8989
540
882
.44
0.71
63 4
96 3
83.1
7
Nat
iona
l C
emen
t S
C1.
230
.1 (e
xp)
0.17
21 5
36 8
84.7
50.
575
68 6
00 3
87.1
0.64
366
488
448
.88
0.54
54 1
48 0
38.5
90.
3634
677
855
.7
Ture
Dir
e D
awa
Cem
ent
Fac
tory
SC
0.3
16.6
––
0.1
7 22
9 95
9.1
0.16
10 9
31 7
15.6
0.25
18 3
24 6
590.
2113
758
150
.11
Inch
ini
Bed
rock
plc
0.3
9.67
0.1
1 36
1 05
0.5
0.15
12 6
84 8
67.9
0.17
416
274
565
.20.
1610
469
394
.74
0.17
610
886
165
.44
Cap
ital
C
emen
t 0.
6–
0.21
24 7
71 2
31.5
30.
2120
833
232
.90.
2523
944
687
.80.
2120
840
284
.90.
2421
047
879
.71


321
c a r t e L e n f o r c e m e n t : a d o p t i o n o f a L e n i e n c y p r o g r a m m e i n K e n y a
10
Cartel enforcement: Adoption of a leniency programme in Kenya
Barnabas Andiva and Edith Masereti
INTRODUCTION
Cartels are considered to be the most egregious contraventions of competition laws worldwide. Cartels occur when competing firms agree, directly or indirectly, to cooperate and coordinate with the aim of controlling/fixing prices, output, allocating markets or excluding entry into a market. Competition agencies use a number of hard and soft enforcements tools to fight cartels. These include financial sanctions and prosecutions of the directors of the concerned undertakings and a self-reporting mechanism in exchange for amnesty, otherwise known as leniency.
Leniency programmes have been found to be one of the most effective tools in cartel enforcement and have been introduced by authorities around the world over the past two decades. A leniency programme publicly commits the authority to provide a partial or total exoneration from the penalties, which would otherwise be applicable to a cartel member, where the leniency applicant is the first to report the cartel to the authority and assists in providing evidence enabling the prosecution of the other cartel members (Curiso, 2010). The overall objective of a leniency programme, therefore, is to improve the level of compliance with competition laws through increased detection of cartels.

C o m p e t i t i o n a n d R e g u l a t i o n f o R i n C l u s i v e g R o w t h
322
In Kenya, guidelines have been set by the Competition Authority of Kenya (the authority) pursuant to section 89(A) of the Competition Act 10 of 2012. The leniency is applicable only in respect of the alleged restrictive agreements, practices and decisions under sections 21 and 22 of the Competition Act. A restrictive trade practice refers to an agreement or concerted practice among competing firms or a decision by an association of firms, to coordinate their practices, in such a way that it leads to the prevention, distortion or lessening of competition. The practices need not have been entered into in Kenya, as long as they have had an effect in Kenya. As of 2018, the Authority has not yet received any leniency applications nor prosecuted any party based on leniency applications. The cartels that have been uncovered by the Authority have been mainly through reporting by third parties though the latest cartel was uncovered through market sector screening.
This chapter starts by assessing the foundations for an effective leniency programme in a country such as Kenya. It assesses the challenges to implementing leniency in terms of the Kenyan Competition Act and the approach taken in the guidelines. It then goes on to consider the scope of the guidelines followed by a critical reflection on how the Competition Authority can address the challenges. It concludes by considering the way forward for Kenya.
BENEFITS AND CORNERSTONES OF AN EFFECTIVE LENIENCY PROGRAMME
The main benefits of running an effective leniency programme can be summarised as follows. First, deterrence is achieved when a leniency programme makes cartel membership less attractive as there is an increased risk that one of the cartel participants will report the existence of the cartel. Cartels are founded on mutual consent and trust but when there is a likelihood or suspicion of one of the cartel members ‘selling out’ the rest, then cartel formation or continued existence is undermined. The leniency programme, by incentivising firms to come clean, thus has a preventive dimension in that it implants mistrust within cartels.

323
c a r t e L e n f o r c e m e n t : a d o p t i o n o f a L e n i e n c y p r o g r a m m e i n K e n y a
Second, an effective leniency programme aids the detection and cessation of cartels as there is an increased likelihood of the cartel being reported and, thereafter, appropriate remedies being imposed by the competition agency. It can lead cartel members, in some cases, to confess their conduct even before an investigation is opened. In other cases, it can induce firms that are already under investigation to abandon the cartel and race to be first to provide evidence against the other cartel members and, thereby, qualify for leniency. Given the fact that some investigative techniques, such as consensual monitoring or the compulsion of sworn testimony, may be limited or non-existent in jurisdictions where hardcore cartel activity is not a criminal offence, leniency programmes can potentially be used in any jurisdiction in which such conduct is treated as a criminal, civil or administrative offence.
Leniency programmes aid the imposition of substantial sanctions as they are useful in getting the ‘smoking gun’ or first-hand direct ‘insider’ information or evidence that might otherwise be difficult to obtain. With this piece of evidence, competition agencies are better able to punish co-conspirators in a cartel. The evidence is essential in calculating the appropriate financial penalties as competition agencies are in a better position to estimate the overcharge or consumer harm.
Leniency programmes facilitate international cooperation in cartel investigations, as many leniency programmes require the leniency applicant to state in which other jurisdictions leniency has been sought and provide a waiver allowing communication between those competition agencies.
Ultimately consumers are the beneficiaries from leniency programmes as markets are more likely to be competitive and responsive to the forces of demand and supply, which translates into an achievement of various efficiencies, including allocative and dynamic efficiencies.
Adopting and implementing an effective leniency programme is founded on three prerequisites or cornerstones, which are essential and must be in place before a jurisdiction can successfully implement a leniency programme. First, the jurisdiction’s antitrust laws must provide the threat of severe sanctions for those who participate in hardcore cartel

C o m p e t i t i o n a n d R e g u l a t i o n f o R i n C l u s i v e g R o w t h
324
activity and fail to self-report. Second, organisations must perceive a high risk of detection by antitrust authorities if they do not self-report. Third, there must be transparency and predictability to the greatest extent possible throughout a jurisdiction’s cartel enforcement programme, so that companies can predict with a high degree of certainty how they will be treated if they seek leniency and what the consequences will be if they do not.
These three major cornerstones – severe sanctions, a heightened fear of detection and transparency in enforcement policies – are the indispensable components of every effective leniency programme (Hammond, 2004).
Cartel activity is the result of a balance of probabilities between the returns from the cartel and the probability and sanctions from being caught, compared with the returns from competitive conduct. Therefore, a leniency programme is likely to be successful if the penalties imposed on cartelists who do not apply for leniency are significant and predictable to a degree. If sanctions are inadequate, cartel participants will not come forward as the benefits from leniency are likely to be less than the costs of not coming forwards.
Sanctions vary across countries. In countries where cartels are criminal offences, criminal prosecutions of directors and managers of the cartelists’ undertakings can be a substantial threatened penalty. However, there are other jurisdictions that do not have individual liability and these jurisdictions will rely solely on financial penalties to sanction cartel conduct, meaning that the financial penalties must be severely punitive if they are to attract leniency applicants. The penalties must be sufficiently punitive that they will not be viewed simply as a tax or a cost of doing business. The United States and Canada, for example, impose fines up to 30 per cent or more of the revenue generated by the sale of the price-fixed product or service during the entire duration of the conspiracy.
Anticartel enforcement must be sufficiently effective for cartel members to believe that there is a significant risk of being detected and punished if they do not apply for leniency. Competition agencies,

325
c a r t e L e n f o r c e m e n t : a d o p t i o n o f a L e n i e n c y p r o g r a m m e i n K e n y a
therefore, have to demonstrate a commitment to vigorous investigation of cartels using robust investigatory powers. This is necessary to create an environment in which business executives perceive a high risk of being detected and prosecuted if they enter into or continue to participate in cartel activity.
There must be transparency and certainty in the operation of a leniency policy. A leniency applicant needs to be able to predict, with a high degree of certainty, how it will be treated if it reports anticompetitive conduct and what the consequences will be if it does not come forward. Therefore, competition agencies should ensure that their leniency policies are clear, comprehensive, regularly updated, well publicised, coherently applied, and sufficiently attractive for the applicants in terms of the rewards that may be granted.
CHALLENGES WITH THE IMPLEMENTATION OF A LENIENCY PROGRAMME IN KENYA
These identified cornerstones are a prerequisite for implementation of an effective leniency programme. However, there are challenges, which might be jurisdiction specific and can undermine the effective implementation of a leniency programme. In the specific case of Kenya, these challenges are as follows, which we believe reflect challenges that many developing countries face.
Weaknesses in the legal framework
The Competition Act 12 of 2010, which was promulgated in August 2011, forms the basis for anticartel enforcement and anticompetitive market conduct in Kenya. The subsequent amendment of the Act in 2014 provided for leniency in section 89A. The Act has two major weaknesses in regard to sanctions and coverage of the leniency programme, which are likely to undermine the effective implementation of a leniency programme.
In terms of sanctions, these are captured under sections 21(9) (criminal sanctions) and 36 of the Act (administrative sanctions). The criminal sanctions under section 21(9) specify a fine not exceeding

C o m p e t i t i o n a n d R e g u l a t i o n f o R i n C l u s i v e g R o w t h
326
10 million Kenyan shillings, a jail term of five years or both. In addition, the Authority requires cooperation with the Office of the Director of Public Prosecutions (ODPP) to prosecute criminal offences. While criminal sanctions on individuals raises the potential sanctions, which can be faced by those engaged in cartel conduct, there are practical challenges as there is no formal agreement between the authority and the ODPP, and it is not even clear that the ODPP will recognise leniency granted by the authority.
Section 36 of the Act provides for the administrative sanctions that may be imposed by the authority, which include a financial penalty. The section is, however, silent on the amount of the financial penalty to be imposed. In the absence of such a specification, it appears that 10 million Kenyan shillings (about US $100,000) is the maximum penalty that can be impose on cartel activity, which is far too little to be a deterrence given the typical profits from cartel conduct.
The scope of leniency, as provided for by the Act, is also very wide and may be subject to misinterpretation. Section 89A of the Act reads that the authority may operate a leniency programme where an undertaking voluntarily discloses the exercise of an agreement or practice that is prohibited under this Act and cooperates with the authority in the investigations of the conduct. This can be interpreted as an undertaking that contravenes any section of the Act and not only cartel conduct where there is the rationale of prosecuting the other parties to the conduct.
The lack of specificity of this part makes it awkward to implement a leniency programme without narrowing the scope of coverage to cartels in line with best practice through the appropriate guidelines. Indeed, the authority has noted that many legal practitioners have actually approached it for leniency on matters such as mergers consummated without the authority’s approval. The Act does already empower the authority to enter into settlement agreements with undertakings on terms agreed upon by the parties, under section 38. There is a risk of undertakings confusing settlements with application for leniency.

327
c a r t e L e n f o r c e m e n t : a d o p t i o n o f a L e n i e n c y p r o g r a m m e i n K e n y a
Visibility
The Act was operationalised in August 2011 with the establishment of the Competition Authority, which then had a skeleton staff and other challenges associated with new establishment, including low visibility and resource constraints. In the Authority’s first strategic plan, which ran from the financial year of 2013/14 to 2016/17, visibility was noted as one of the challenges in order to raise awareness of competition law. Visibility is achieved through a mix of hard and soft enforcement initiatives and advocacy.
From inception, the authority has been successful in busting cartels in the retail market, outdoor advertising and insurance sectors. All these cases were concluded through settlements with the parties agreeing to pay financial penalties, among other conditions. The cumulative amount of all penalties imposed on the parties is approximately 12 million Kenyan shillings. Other cartel cases are at various stages of completion. Through this initiative, the authority has received publicity as these decisions were gazetted and publicised in the media and have been discussed at various forums. However, the authority has not yet reached the level at which it can be considered to be an effective deterrence in that cartel members believe that there is a very high chance of being detected.
As noted earlier, in the absence of a robust history of vigorous investigations and sanctioning of cartels, implementing leniency programme might face challenges as the cartelist will weigh the chances of being detected against self-confessing. Cartel members may also elect to end the collusion quietly before detection. It may be that the authority is still relatively young and has not build enough of a track record of busting cartels, along with insufficient penalties, to successfully implement a leniency programme.
Investigation challenges
A leniency programme is ineffective unless cartels are detected and punished. A 2004 survey of developing country competition agencies found that almost everyone felt the absence of a competition culture,

C o m p e t i t i o n a n d R e g u l a t i o n f o R i n C l u s i v e g R o w t h
328
both among other parts of government and the public at large. This is evident in Kenya as the law came into force in 2010, so it is relatively new within the business community.
The business community has a set of practices that are entrenched. This means that collusive practices are likely to be pervasive because many firms do not accept that these practices are now illegal. The business community, such as the Kenya Association of Manufacturers, would prefer the authority to put more emphasis on supervision and compliance than on investigation and compliance because of the level of ignorance among the business community regarding the law.
Further raising the challenges of the business culture are already existing laws that have infringed the Competition Act, for example, in the energy sector where there are price formulae for petroleum products that consequently encourage price fixing.
On the other side, the dynamism of markets, especially involving the new economy, means that authority staff require considerable skills to collect and analyse the necessary information to effectively investigate and sanction cartels.
SCOPE OF THE GUIDELINES
While the law provides for the guidelines to apply to a wide range of conduct prohibited under sections 21 and 22 of the Act, the text of the guidelines addresses only horizontal agreements (ie, agreements between competitors), decisions by trade associations and concerted practices by competitors. This leaves an ambiguity regarding vertical restrictive practices.
A leniency application will be accepted in circumstances where the Authority (1) has no knowledge of the contravention; (2) has knowledge but lacks sufficient information to start an investigation; or (3) has commenced investigations but requires additional evidence to penalise the offenders. To qualify for leniency, the applicant is required to:
• provide full and truthful information;• provide total and expeditious cooperation;

329
c a r t e L e n f o r c e m e n t : a d o p t i o n o f a L e n i e n c y p r o g r a m m e i n K e n y a
• keep the application process confidential and not alert cartel members or third parties that it has applied for leniency; and
• immediately cease the prohibited conduct.
The identity of the applicant for leniency shall be kept confidential throughout all stages of the procedure.
If the authority determines that the application qualifies for leniency, conditional leniency is granted. Conditional leniency, which precedes permanent leniency, is provisionally granted at the initial stages of the application, pending the authority’s final determination. Once the authority has finalised its investigations, it will determine whether full leniency is granted upon conclusion of the investigation and a leniency agreement may be entered into between the parties.
A leniency agreement shall cover the applicant’s directors and employees as long as they respect the obligations to cooperate with the authority. Leniency is granted on a first-come basis, with the first-through-the-door applicant obtaining a 100 per cent reduction in penalties and immunity from prosecution for the offending conduct. Subsequent applicants may be granted reduced penalties on a sliding scale, at the authority’s discretion.
The sliding scale works as follows: second-through-the door may be given up to 50 per cent reduction in penalties; third-through-the door up to 30 per cent reduction in penalties; and any subsequent applicant who provides useful information, up to 20 per cent reduction on penalties. In relation to the imprisonment punishment, the guidelines provide that the authority shall engage with the Director of Public Prosecutions accordingly.
This is designed to ensure that an applicant does not suffer double jeopardy. It is expected that, as part of the leniency application or discussions process, an applicant should aim to obtain appropriate assurances from the authority that it shall procure the Director of Public Prosecutions not to take any further adverse action or prosecution against the applicant if it complies with the leniency terms. If permanent leniency is not granted, the authority is at liberty to impose penalties

C o m p e t i t i o n a n d R e g u l a t i o n f o R i n C l u s i v e g R o w t h
330
against the applicant in accordance with the Act. However, according to the guidelines, the authority may also consider a settlement agreement (if any) proposed by the undertaking concerned. Under the Act, the authority is authorised to enter into a settlement agreement with an undertaking in relation to a prohibited activity, which agreement may include (1) damages to the complainant or (2) an agreed pecuniary penalty. Where a party is not sure whether the guidelines apply to particular conduct, it may make an anonymous enquiry, seeking clarity from the authority.
PROPOSED MEASURES TO ADDRESS CHALLENGES
The challenges highlighted earlier are common to many young jurisdictions as they endeavour to strengthen their competition enforcement as elucidated in June 2016, the OECD roundtable that discussed the challenges to which amnesty/leniency programmes are exposed and proposals for improvements. The challenges can be mitigated by deliberate measures in the short and long run. We propose that these measures include, but not be limited to: amending the existing law; developing and improving the guidelines; and fostering cooperation agreements with government agencies and stakeholders.
Amendment to the law
The authority, through engagement with the requisite government agencies, has amended the Act (section 36) to address the identified areas of weaknesses. This includes increasing financial penalties, pegged at a percentage of the turnover of the infringing undertakings. This is in line with international best practice, makes the process of determining financial penalties relatively more predictable and will increase penalties and hence deterrence.
The authority has further developed a fining and settlement guideline aimed at achieving transparency, predictability and consistency to the process of arriving at the financial penalties to be imposed. The amendment of section 36 will further enhance the application of the fining and settlement guideline. The guideline adopts four stages to

331
c a r t e L e n f o r c e m e n t : a d o p t i o n o f a L e n i e n c y p r o g r a m m e i n K e n y a
arrive at the appropriate financial penalty:
1. determining the relevant (affected) turnover;2. establishing the period of the contravention;3. establishing the base percentage; and4. adjusting the base percentage for aggravating and mitigating
factors.
The aggravating factors identified in the guideline are recidivism, non-cooperation, period of contravention, the sector in which the contravention occurs, especially if it involves vulnerable consumers, and the type of agreement – whether vertical or horizontal. The mitigating factors identified include cooperation, first-time offenders and the ability to pay the financial penalty. The aggravating and mitigating factors are scored and adjusted to the base percentage to arrive at the relevant percentage to be charged.
There are further issues that need to be addressed.
Relationship between administrative, criminal and civil actions
A key concern for potential leniency applicants is the scope of application of the leniency programme across different adjudicatory institutions. The question is whether the leniency agreement negotiated with the authority can and will protect the applicant from administrative actions only, or also from criminal actions initiated by the prosecutor and/or civil actions brought by affected customers.
The effectiveness of a leniency programme depends to a large extent on the ability to offer the right coverage to leniency applicants so that the risks from using self-incriminatory evidence provided by the applicant as the basis for other criminal/civil actions is minimised. To this end, the guidelines need to offer a clear position regarding the connection between administrative, criminal and civil proceeding, as well as the use of evidence obtained through the leniency application in front of other adjudicatory institutions. This includes the coverage of individuals by the leniency agreement, to incentivise cooperation and potentially enable

C o m p e t i t i o n a n d R e g u l a t i o n f o R i n C l u s i v e g R o w t h
332
individuals to come forward if companies do not decide to approach the authority.
The introduction of an individual leniency programme creates a race between the company and its employees, especially in jurisdictions that have individual criminal liability. Some jurisdictions, most notably the United States and the United Kingdom, operate leniency programmes for individuals in addition to the corporate leniency programmes. If the corporation is first to qualify, its employees and directors are covered under its immunity. However, if a company fails to report a cartel that an employee has conveyed, only the employee will benefit from individual immunity (OECD, 2012).
A jurisdiction with individual criminal liability must ensure that its leniency programme also offers protection against criminal sanctions for the relevant personnel. Otherwise, a company, acting through its officers who may have been implicated in the cartel, would be much less likely to come forward under leniency (OECD, 2009). A leniency policy in a jurisdiction with criminal liability is unlikely to work unless it provides for immunity/leniency for the applicant corporation’s employees.
Limitation of the right to revoke conditional leniency to enhance legal certainty
While the authority should have the right to revoke the protection of the corporate conditional leniency, this shall be limited to serious cases of non-compliance with the cooperation requirement. Especially in the beginning of a leniency programme, the authority needs to build up credibility with potential applicants and, hence, the guidelines should refer to this possibility but limit it to serious breaches.
Extension of the period when leniency applications might be admissible
The guidelines should be flexible on the timelines of receiving applications. Authorities have an incentive to receive leniency applications until the moment the matter has been adjudicated. Even cases in which the authority has some evidence of collusion are susceptible to be lost.

333
c a r t e L e n f o r c e m e n t : a d o p t i o n o f a L e n i e n c y p r o g r a m m e i n K e n y a
To this end, it would be better to explicitly enable applicants to apply for leniency for as long as new and valuable evidence can be introduced in the file.
Disqualification of coercers, cartel initiators or ringleaders from leniency applications
While excluding coercers and others might have a deterrent impact on cartel formation, potential applicants might fear being falsely accused by other cartel members, even by second applicants who want to benefit from a full exemption by disqualifying the first at the door. To this end, the guideline should endeavour to clarify that only irrefutable evidence of these conducts will disqualify their application, as well as the fact that the burden of proof will lie with whoever alleges such grounds for disqualification.
Potential disclosure of the identity of leniency applicants
To fully mitigate against the potential risk of disclosure of the identity of the leniency applicants, all aspects of confidentiality have to be considered in the guidelines. Confidential handling of leniency applications is key to assure the success of the programme as it strengthens the incentives for leniency applicants to come forward. An applicant may be concerned about disclosure of their identity or the information provided within the leniency application given: (1) potential civil damage actions in Kenya and other countries and (2) ‘reputational damage’ in the business community.
Information contained in documents and statements produced within a leniency application typically include evidence and admissions that would not have been obtained through a regular investigation. Since such admissions will not be available from the other cartel members, the leniency applicant may be disadvantaged, unless the information they supply is treated confidentially. Therefore, competition agencies have generally argued in favour of protecting leniency applications against potential benefits of disclosure. Leniency applications bring many cases to light in the first place and enable authorities to gather valuable information for

C o m p e t i t i o n a n d R e g u l a t i o n f o R i n C l u s i v e g R o w t h
334
private enforcement – even beyond the leniency statements themselves (Hammond, 2004). Even when the European Union decided to strengthen civil damage actions for antitrust infringements, the European Commission maintained that leniency statements or verbatim quotations from leniency statements should be exempted from the disclosure of evidence (European Union, 2014).
Confidentiality should, therefore, be considered at all levels during the process of application and the subsequent processes. During the application and investigation stage, the identity of the leniency applicant should not be disclosed to anyone outside the authority without prior consent. In practical terms, this implies that the leniency applicant might be subjected to the same investigation procedures as other cartel members.
The authority may even aim to protect the identity of the applicant during the prosecutorial stage. This approach would require the authority to gather incriminating evidence from the applicant in the same way as from any other cartel member. This would allow the authority to avoid referring explicitly to the information provided in the leniency application.
Generally, jurisdictions struggle to balance due process against the protection of leniency applicants. For instance, the European Union informs defendants of the applicant’s identity at the statement of objections (ICN, 2006) and follows regular access-to-file procedures (with possible confidential handling of business secrets and other confidential information). However, with views to the confidentiality of any self-incriminating evidence provided by the applicant, access to corporate statements submitted by leniency applicants is available only to defendants at the EU Competition Commission’s premises, without the possibility to make a copy of any sort.
Finally, there might be a risk that other defendants could deliberately leak confidential information obtained during discovery to negatively affect the applicant. The authority could potentially address this concern by requiring defendants to sign a statement committing to use the information provided by the leniency applicant only for the exercise of
335
c a r t e L e n f o r c e m e n t : a d o p t i o n o f a L e n i e n c y p r o g r a m m e i n K e n y a
its defence rights in connection with the investigation, and to treating all information confidentially. This statement could provide for a fine in the case of non-compliance.
Following the final court or administrative ruling, some authorities such as the EU Competition Commission publish the identity of the applicant. However, they will continue to treat any self-incriminating evidence of the applicant confidential to seal them from subsequent civil action claims. In the United States, proffers are protected only to a limited extent from disclosure in court ruling. The guidelines should, therefore, be clear on whether to conceal the identity of the applicant after all the processes are concluded or not.
Ability and scope of cooperation with other competition authorities for the purpose of multi-jurisdictional cartels
The guidelines should clarify whether the applicants can waive confidentiality for the purpose of enabling the authority to coordinate with authorities from other jurisdictions. This is crucial since the first applicants to leniency programmes may be international firms participating in multi-jurisdictional cartels and also in view of the regional integration and the need for cross-border cooperation between various competition agencies.
A waiver of confidentiality in a cartel investigation constitutes a consent from a leniency applicant to waive the confidential protection of its application in order to allow the agency to share such information with other competition agencies. As a general rule, competition agencies would not disclose the identity or any other information obtained from the applicant with their counterparts. However, in multi-jurisdictional cartel investigations, a waiver can be extremely helpful to obtain relevant evidence across jurisdictions and successfully prosecute all the cartel members.
The key element of waivers is that the receiving authority shall treat the information with the same level of confidentiality as the one providing it. The exchanged information cannot include privileged information such as information protected by attorney–client confidentiality. Finally,

C o m p e t i t i o n a n d R e g u l a t i o n f o R i n C l u s i v e g R o w t h
336
while the waiver must always be consensual on the side of the leniency applicant (ICN, 2006), competition agencies may strongly encourage or even require that a leniency applicant provides a waiver.
Cooperation framework with other government bodies
The authority has developed a number of cooperation agreements with sector regulators, including the Communication Authority of Kenya, Kenya Civil Aviation Authority and the Central Bank of Kenya, and is in the process of developing MoUs with the Public Procurement Oversight Authority and the Office of the Director of Public Prosecutions, among others. These cooperation agreements are aimed at bridging the information asymmetry gap and defining the working relationships of these institutions, especially in regard to information exchange and confidentiality so as to strengthen cartel investigations and sanctioning.
Cooperation with the Office of the Director of Public Prosecutions is key with regard to the speedy prosecution of cartel cases, which will ultimately achieve the deterrence effect. Cooperation with the Public Procurement Oversight Authority is vital in pursuing bid-rigging cartels, which milk the economy of millions of shillings.
The authority has already secured the cooperation of the Directorate of Criminal Investigations and criminal investigations officers from the police are seconded to the authority to strengthen its the investigations capacity.
CONCLUSIONS AND THE WAY FORWARD
Leniency programmes have been identified as a powerful enforcement tool against cartels. To implement a successful leniency programme, Kenya needs to put in place the cornerstones of an effective leniency programme as well as several other factors.
The amendments to the Act have been identified as key to the effective implementation of the leniency programme and should, therefore, be comprehensive to address all the weaknesses that might undermine the authority’s enforcement initiatives. A financial penalty based on the relevant turnover and the duration of the conduct is essential for effective deterrence.

337
c a r t e L e n f o r c e m e n t : a d o p t i o n o f a L e n i e n c y p r o g r a m m e i n K e n y a
The authority needs to be seen to be aggressively engaged in pursuing cartels in the economy. This can be achieved through capacity-building to strengthen cartel detection, investigation and sanctioning. The authority should further prioritise sectors with the aim of optimally using resources to achieve the greatest impact.
Cooperation with sector regulators and other government bodies is equally key in achieving an effective leniency programme. The cooperation will ensure that the various statutes are consistent with each other and aid the flow of information for detection purposes.
The cooperation, especially with the Office of the Director of Public Prosecutions will ensure that cartel cases are prosecuted in the Kenyan law courts, which is necessary to achieve deterrence, especially with the criminal sanctions.
Engagement with stakeholders is important to raise awareness of the leniency guidelines to the business community, trade associations and other parties who may be the likely beneficiaries of the leniency programme. The guidelines, therefore, should be comprehensive and simplified so that the predictability and transparency aspects are achieved.
The authority should also continue building visibility and credibility through both hard and soft enforcement initiatives. These include publishing the authority’s decisions in the Kenya Gazette and daily publications and media briefs, aggressive pursuance of cartels, and holding training and sensitisation sessions with the consumers, among others.
Lastly, leniency needs to reflect the fact that many cartels in Kenya are likely to have a cross-border and/or regional dimension. This includes consistency with international practice, such that leniency applicants for international cartels apply in Kenya as well as other jurisdictions. This is important as one country cannot rely on another’s anticartel proceedings, given the trend to restrict information originating, ultimately, from leniency applicants. This does not mean simply copying international practice, but also developing leniency guidelines that are reflective of the peculiarities of the Kenyan economy and cognisant of the business culture.

C o m p e t i t i o n a n d R e g u l a t i o n f o R i n C l u s i v e g R o w t h
338
REFERENCES
Borrell, JR (GiM XREAP), Jiménez, JL and Garcia, C (2012) Evaluating antitrust leniency programmes. Document de Treball, XREAP2012-01. Xarxa de Referéncia en Economica Aplicada.
Clarke, J and Evenett, S (2002) The Deterrent Effects of National Anti-Cartel Laws: Evidence from the international vitamins cartel. Working paper 131, Regulation.
Competition Authority of Kenya (2016) Leniency Programme Guidelines – Kenya.
Curiso (2010) The Leniency Programmes: Adjustments of Domestic Law to EU Regulations
European Union (2014) Directive 2014/104/EU of the European Parliament and of the Council of 26 November 2014 on certain rules governing actions for damages under national law for infringements of the competition law provisions of the Member States and of the European Union, Official Journal of the European Union: 2014 L 349/1.
Evenett, S, Levenstein, M and Suslow, V (2001) International Cartel Enforcement: Lessons from the 1990s, Policy Research Working Paper Series 2680. Washington, DC: The World Bank.
Hammond, S (2004) Dispelling the myths surrounding information sharing. Speech presented before the ICN Cartels Workshop, Sydney, Australia, 20–21 November 2004.
ICN (2006) Waivers of Confidentiality in Cartel Investigations – Explanatory Note, p. 3. Point 34 Leniency Notice 2006.
Kitzmuller, M and Licetti, M (2012) Competition Policy: Encouraging thriving market for development (30 September). View Point Public Policy for the Private Sector Series, No 331, Finance and Private Sector Development.
Levenstein, M and Suslow, V (2004) Contemporary international cartels and developing countries: Economic effects and implications for competition policy, Antitrust Law Journal, 71(3): 801–52.
OECD (2009) Organisation for Economic Co-operation and Development (OECD), Session I: Using Leniency to Fight Hard Core Cartels, Issues Paper, 2009 Latin American Competition Forum, Seventh Meeting 9-10 September 2009, Santiago, Chile.
OECD (2012) Competition Committee, Directorate for Financial and

339
c a r t e L e n f o r c e m e n t : a d o p t i o n o f a L e n i e n c y p r o g r a m m e i n K e n y a
Enterprise Affairs, Organisation for Economic Co-operation and Development (OECD), Leniency for Subsequent Applicants: Policy Roundtable, DAF/COMP(2012)25, October.
World Bank Group (2013) Available at: SSRN: http://ssrn.com/abstract=2310917.
US Department of Justice (2008) Frequently asked questions regarding the Antitrust Division’s Leniency Programme and Model Leniency Letters, Point 32.

341
o v e r c h a r g e e s t i m a t e s i n t h e s o u t h a f r i c a n r e i n f o r c i n g b a r c a r t e L
11
Overcharge estimates in the South African reinforcing bar cartel1
Pamela Mondliwa and Reena Das Nair
INTRODUCTION
The South African Competition Commission has had much success in uncovering and prosecuting cartels in various markets since its inception and particularly since the introduction of the Corporate Leniency Policy (CLP) in 2004. The public, however, is more interested in whether successful prosecution of these cartels translates to more competitive outcomes in markets. Hence there is pressure on competition authorities to quantify the impact of their interventions in markets, and authorities around the world increasingly are attempting to quantify the benefits of interventions for consumers, or conversely, the harm caused by anticompetitive conduct. As the Competition Act regards cartels as per se violations, there has been little written on the harm caused by South African cartels. Cartel overcharges thus far have only been estimated for the concrete pipes, wheat flour, cement and bitumen cartels and all studies have been done in the last five years.2 Cartel overcharge estimates are not only important to quantify the impact of the Commission’s work in markets but also serve as useful indicators for victims of cartel conduct to claim damages against the cartelists.
In South Africa, there have been very few, if any, damages claims, even though the Act makes provision for these. This limits the strong potential deterrence effect that damages claims could have on anticompetitive

C o m p e t i t i o n a n d R e g u l a t i o n f o R i n C l u s i v e g R o w t h
342
conduct. One of the ways that competition authorities contribute to improved competitive outcomes is by deterring companies from engaging in anticompetitive conduct such as cartels. The ability to deter future engagement in anticompetitive conduct and to eliminate financial gain or benefit from non-compliance is key to successful competition policies (Darji, Grimbeek and Muzata, 2012). Deterrence is to a large extent based on the threat of costs of engaging in cartels vis-á-vis the expected benefits of the conduct. For the threat of the cost of engaging in the cartel to be credible, it requires that there is a high probability of detection and that the sanctions outweigh the benefits.
The Corporate Leniency Policy and general investigative procedures have made headway in increasing the likelihood of detection and reducing the duration of cartels. However, when it comes to the sanctions, the focus has been limited largely to the appropriate design of administrative penalties. Though the penalties are a very important tool for deterrence, they are unlikely to completely remove the gains from anticompetitive conduct, particularly when the penalties are capped. Literature on optimal deterrence emphasises the need to reclaim the net cartel gains, once the cartel has been detected (Connor, 2014). Damage claims are a useful mechanism for victims of the cartel conduct to reclaim the overcharge and the threat of damage claims over and above the administrative penalties will likely mean that the cost of engaging in anticompetitive conduct, such as cartels, outweighs the gains from the conduct.
The size of the cartel harm is positively related to the size of the cartelised market, the duration of the conduct and the size of the cartel overcharge. Two of these factors are readily available when the cartel case is finalised, however the size of the overcharge is not. The legal costs associated with damage claim actions and the uncertainty on the size of the overcharge may leave cartel victims unsure of the benefits of pursuing these actions. Thus the estimations of the cartel overcharges will encourage firms to pursue damages.
This chapter attempts to calculate cartel overcharges and damages in the previously cartelised reinforcing steel bar (rebar) market in South

343
o v e r c h a r g e e s t i m a t e s i n t h e s o u t h a f r i c a n r e i n f o r c i n g b a r c a r t e L
Africa, where a cartel operated between 1999 and 2008. It explores the possible counterfactual scenarios used to determine what prices would be in a non-collusive setting and applies the ‘difference-in-difference’ methodology to determine what the overcharge may be. This chapter firstly reflects on theoretical approaches to estimating cartel overcharges, damage and impact assessments. Thereafter, it gives the background to the rebar cartel in South Africa and estimates the actual overcharge and associated damages. Finally, it highlights the inherent difficulties in interpreting results of such analyses and provides some conclusions.
APPROACHES TO DAMAGES ESTIMATIONS AND IMPACT ASSESSMENTS
A cartel is an explicit agreement between two or more similar, independent firms to fix prices jointly, limit production or share markets or customers between them. The expectation is that these agreements will raise prices above the competitive level. The difference between the cartel price and the competitive or counterfactual price is known as the cartel overcharge or mark-up. Cartel overcharges are calculated to estimate the harm that the cartel causes and, as stated earlier, are used as a basis for calculating fines and damages. There are a number of methodologies that can be used to calculate cartel overcharges and there is extensive literature on the various methods of calculations, including the pros and cons of each (Verboven and Van Dijk, 2009; OXERA, 2009; Davies and Ormosi, 2010).
These methods can be grouped into three main categories: (1) comparator based, (2) financial-performance based and (3) market-structure based (OXERA, 2009). The comparator-based method is often adopted by competition authorities. It uses either cross-sectional comparisons, time-series comparisons or a combination of both approaches in so-called ‘difference-in-differences’ models (Hüschelrath, Müller and Veith, 2013).
Cross-sectional comparisons conduct the assessment by comparing different geographic or product markets, while time-series comparisons analyse prices before, during and/or after an infringement, often referred

C o m p e t i t i o n a n d R e g u l a t i o n f o R i n C l u s i v e g R o w t h
344
to as the before-and-after method. There are difficulties in undertaking cross-sectional comparisons, especially comparing outcomes in different geographic markets. Differences in outcomes may be due to reasons other than the competition concern evaluated, for instance, due to different market environments, cost structures or policy contexts in different countries (OECD, 2016). These need to be accounted for in such analyses. The difference-in-difference method assesses the change in price for a cartelised market over time, and compares this change against the change in price in a non-cartelised market over the same time period. Financial performance-based models use financial information and could include event studies where financial market data are used to measure the effect of an economic event on the market valuation of a firm (Davies and Ormosi, 2010). Market structure methods apply industrial organisation structural models to simulate the counterfactual price. There is no one-size-fits-all method and when selecting a method for a study, careful consideration must be given to the input requirements versus data availability, conceptual complexity, technical complexity and the applicability of the underlying assumptions to a particular case.
Recently there have been a number of studies that seek to give an impression of ‘typical’ cartel overcharges. These studies are often in the form of surveys of cartel overcharges over different countries and products. The international averages are widely reported on and typically range from 0 per cent to 70 per cent with the median at 18 per cent of the cartel price and the mean/average at 20 per cent of the cartel price (Hüschelrath et al, 2013). Although the South African Competition Commission has successfully prosecuted a number of cartels since its inception, the cartel overcharge has been calculated in only very few cases. Khumalo, Mashiane and Roberts (2014) estimated cartel overcharges at between 21 per cent and 57 per cent for concrete pipes in KwaZulu-Natal and 16.5 per cent in Gauteng. Mncube (2014) calculated the white bread flour cartel overcharge at 23.7 per cent in the Western Cape and 13.1 per cent in Gauteng province. Boshoff (2015) conducted his assessment for bitumen and found that the cartel

345
o v e r c h a r g e e s t i m a t e s i n t h e s o u t h a f r i c a n r e i n f o r c i n g b a r c a r t e L
overcharge was between 18 and 20 per cent. These are all cartels that took place around the same time as the rebar cartel.
BACKGROUND TO THE CARTEL
Rebar market
Historically, there have been only four producers of rebar in South Africa: ArcelorMittal South Africa (AMSA), Cape Gate (Pty) Ltd, Scaw Metals Group and Cape Town Iron and Steel Works (Cisco) (Department of Mineral Resources, (2011), jointly referred to as the ‘steel mills’. In 2011 (after the explicit cartel presumably ceased operating), Cisco exited the market and SA Metal Group entered the market for the production of rebar. The steel mills were involved in more than one level of the value chain. Rebar is produced in a two-step process, where scrap or iron ore is converted into billets and the billets are cut in the form of the reinforcing bars (ArcelorMittal, 2012). Once the rebar is produced, it is sold to downstream firms who further cut, bend and instal the rebar to reinforce concrete in construction projects (ArcelorMittal, 2011) (Figure 11.1).
All the producers of rebar, except for AMSA, process scrap steel in an electric arc furnace; AMSA uses both iron ore and scrap processed in a blast furnace in the Newcastle plant and an oxygen furnace in the Vereeniging plant. As a consequence of conversion methodologies, AMSA has a different cost structure to the rest of the producers.
Estimated rebar production capacity for the steel mills is around 200 000 tonnes per annum for AMSA and 180 000 tonnes per annum each for Scaw, Cape Gate and Cisco. SA Metals entered at 54 000 tonnes per annum.3 However, it is noteworthy that the mills can substitute between rebar and wire-rod production with relative ease. Thus the rebar production capacity could be a construct of the cartel. There is excess capacity of rebar production in South Africa, resulting in exports of approximately 30 per cent of total production.
The industry was relatively stable during the cartel period, with entry and exit occurring only after the cartel presumably ceased. Also,

C o m p e t i t i o n a n d R e g u l a t i o n f o R i n C l u s i v e g R o w t h
346
there appears to have been little change in production capacity of the existing mills, aside from debottlenecking efforts. In 2001, Scaw built a new furnace, which increased its output by 20 per cent to its present capacity. One would expect more competitively priced input costs due to the excess supply of scrap steel.
Figure 11.1: Rebar industry structure
The rebar cartel
The alleged cartel began in 1999 and presumably ended after the Competition Commission’s dawn raid in June 2008, although we exclude data post 2006 (discussed below). The cartel was primarily a price-fixing cartel in contravention of section 4(b)(i) of the Competition Act, however, it had elements of market allocation (section 4(b)(ii)), and the mills had vertical agreements with the steel merchants to induce merchants not to import cheaper steel into the country (Njisane, 2011). The Commission found that representatives of the long steel mills attended formal and informal meetings at which levels of prices and discounts were discussed and agreed on. The steel mills had a long-standing arrangement that AMSA, as the market leader, would

347
o v e r c h a r g e e s t i m a t e s i n t h e s o u t h a f r i c a n r e i n f o r c i n g b a r c a r t e L
announce the prices for various long steel products and other mills would follow the price increases (Nontombana and Lesofe, 2010). There was, effectively, one delivered price in the domestic market, despite the different locations of the rebar producers and other long steel products, such as sections, being priced on an ex-works basis. Cape Gate has plants in Johannesburg and Vanderbijlpark; AMSA has long steel plants in Newcastle and Vereeniging; Scaw has a plant in Germiston and Cisco had a plant in Cape Town. Johannesburg, Vander-bijlpark, Germiston and Vereening are in the inland region, while Newcastle is approximately 280 kilometres away and Cape Town is approximately 1 400 kilometres from this region.
In addition to the price fixing, there was a general understanding between the mills that certain customers belonged to certain mills and that targeting a ‘traditional’ customer of another mill would result in retaliation against the offender. This constituted dividing markets by allocating customers.
The Commission also found that the steel mills reached agree-ments regarding the supply of long steel products to downstream contractors/merchants who had been awarded contracts to supply such products to three large construction projects. In this regard, the mills agreed to allocate to each other, equal shares of the steel required for each project.
The stability of a cartel is dependent on the ability of the members to monitor one another to ensure that all parties are adhering to the agreement and to detect cheaters so as to punish them. The rebar cartel members are likely to have overcome this challenge by exchanging information through the industry association, the South African Iron and Steel Institute (SAISI). The association operated in such a manner that all its members submitted highly disaggregated information on output, which was combined by SAISI and then supplied monthly to all members in an aggregated form. The information disseminated by SAISI to long steel producers was broken down by product by Harmonised System (HS) tariff code.4 The members also supplied information regarding the programmes on capital expenditure twice a year. From this, individual

C o m p e t i t i o n a n d R e g u l a t i o n f o R i n C l u s i v e g R o w t h
348
members were able to keep track of their market share and could easily detect cheating.
The exchange of detailed information through the SAISI platform may have allowed mills to monitor market shares of their competitors and, together with market intelligence, permitted mills to see who had deviated from the collusive agreements. The information exchange through SAISI thus may have facilitated the various agreements reached by the mills.
The leniency process revealed that there were punishment mechanisms for players that did not adhere to the agreements. If it were found that a steel mill was selling to a customer of another mill, the other mill would retaliate by targeting a customer of the cheating mill. This sort of behaviour would persist for a period until the mills met and attempted to sort out the issue. At times the mills would engage in price wars in an attempt to take customers from the cheating mill. The above interactions show that there seemed to be the constant threat of price wars if the mills did not stick to agreed prices or allocated/ traditional customers.
ESTIMATING THE CARTEL OVERCHARGE
The counterfactual
In our view, the appropriate method used to estimate the counterfactual price during the cartel period is a comparison with the export price rather than the actual costs of production. This is because the decision is not between producing the rebar or not, it is between selling it into the domestic market or the export market. Importantly, it is not assumed that the domestic market would have been as competitive as the ‘world’ market for rebar but for the cartel, rather the export price is used as the opportunity cost and, thus, the comparator for a difference-in-difference analysis. In other words, we do not simply assume that because this industry exports product that the domestic price should be the export price. If the market behaves in a fashion similar to aggressive price or Bertrand competition, then it is indeed possible that the domestic

349
o v e r c h a r g e e s t i m a t e s i n t h e s o u t h a f r i c a n r e i n f o r c i n g b a r c a r t e L
price would have been very similar to the export price. If, however, the competitive dynamics in the domestic market are better approximated by Cournot competition, then a premium above the export price can be expected to have existed during the cartel.
The deep-sea export price is the opportunity cost of domestic sales because South African rebar producers can divert sales volumes from one market to the other. The product specifications are exactly the same and South African rebar producers are already exporting significant volumes. Thus the product is both acceptable on the world markets and customer or trader relationships already exist. Also, it is the deep-sea export price, as opposed to Africa overland export prices, ie, the opportunity cost of domestic sales because the overland exports are more akin to the domestic market, with the only difference being that they cross political boundaries.
For the deep-sea export price to be a legitimate opportunity cost, it should always be, at most, equal to the domestic price. If this were not the case and there were many instances in which the export price was higher than the domestic price without simple explanations, it is likely that there are differences between the two markets in respect of product characteristics, such as quality, or transaction characteristics, such as contractual terms or requirements. Firms may also be willing to offer a company a discounted price that is less than they might have been able to receive elsewhere, to earn goodwill with that company, which will yield returns in the long run.
The only times when the export price was above the domestic price in the South African rebar market was when a price war broke out between cartel members at the end of 2001 and beginning of 2002, and when domestic price increases were unable to keep up with unprecedented increases in the world price in 2008. The first instance – the price war – supports the use of the export price as the opportunity cost because the domestic price would have been dropped to a very low level to punish the firm suspected of cheating on the cartel agreement. The second instance could be a combination of contractual price stickiness and rebar suppliers not wanting to alienate construction firms with whom

C o m p e t i t i o n a n d R e g u l a t i o n f o R i n C l u s i v e g R o w t h
350
they have long-term relationships. The second instance of relatively low domestic prices thus does not undermine the use of the export price as the opportunity cost. Excluding these two periods from our estimate of the counterfactual price would increase the overcharge, however, we leave them in and note that this makes our overcharge estimate more conservative. Figure 11.2 shows the total volumes of rebar output by South African producers, divided into domestic and export sales. The data used to produce this were the total output data collected by SAISI, which was ended in June 2008, and the export volumes from Quantec. Total output grows steadily over the period, with the only significant deviation coming with the shut down for the December holidays each year. Exports as a percentage of total output fluctuates somewhat, but is above 10 per cent of output in every month of the period but one, and is, on average, 30 per cent of total output. It seems then that domestic producers are able to, and have, changed the actual and relative export volumes from month to month. During the cartel, this was likely to be done to ensure that the agreed domestic price was achieved. In a counterfactual competitive market, however, firms would just as easily have moved sales between domestic and export customers to maximise profits – whichever form of competition is assumed. The use of the deep-sea export price rather than a build-up of the costs of production thus seems to be a credible basis for calculating the counterfactual price.
Given that the relevant benchmark has been selected to be the opportunity cost of deep-sea exports, the question of the counterfactual price then turns to whether or not there would have been a premium charged above this price in the domestic market. The issue here is that the competitive dynamics in the domestic market are likely to be very different to those of the export market, and thus the prices that result in these markets may be somewhat different (see, for example, Baker and Ignjatovic, 2011). Indeed, it has been argued in excessive prices cases – such as Harmony/Mittal5 and Sasol Polymers6 – that such price differentiation is necessary where there are high fixed costs and the domestic market is too small for the firm to achieve economies of scale

351
o v e r c h a r g e e s t i m a t e s i n t h e s o u t h a f r i c a n r e i n f o r c i n g b a r c a r t e L
(see, for example, Calcagno and Walker, 2010). While this latter argument does not seem to be plausible, given that there are a number of firms supplying the market rather than a ‘struggling’ monopoly, economic theory would suggest that our a priori expectations cannot be that prices would necessarily fall to the export price.
Figure 11.2: Rebar domestic and export sales volumes, January 2005–June 2008
Source: Authors’ calculations with underlying data from Quantec and SAISI
As described, during the cartel there were four firms of similar capacity, three of which had the same production process. AMSA used a different production process, which allowed it to combine scrap and virgin steel in varying proportions, depending on prevailing prices. AMSA was also the largest corporate in the industry with various other iron and steel products and the ability, or perhaps just the perceived ability, to expand rebar output without much difficulty. There is thus some evidence that the counterfactual dynamic might have been a Cournot oligopoly or tacit collusion with a price leader.

C o m p e t i t i o n a n d R e g u l a t i o n f o R i n C l u s i v e g R o w t h
352
There are also very good arguments in support of using Bertrand competition in the construct of the counterfactual. The cartel operated primarily as a price-fixing cartel, which would suggest that the strategic variable of interaction might be price and, hence, a form of Bertrand competition might have existed, but for the cartel. However, there were elements of quantity fixing or market allocation and the behaviour of the cartelists appeared to be monitored through the information exchange of sales volumes. Thus quantity could also be regarded as an important variable for interaction, suggesting that Cournot competition may have existed, but for the cartel. We note that Cournot competition is predicated on firms’ ability to accurately predict their competitors’ supply into the market in order for them to decide on their own profit-maximising quantity to supply. Given that product sold onto the export market is identical to that sold on the domestic market, it is difficult to predict a competitor’s supply into the domestic market, even if capacity and total output information is perfectly known. If the degree of volatility in the supply to the export market during the cartel is indicative of what the volatility might have been in the counterfactual world, then it is difficult to see how firms would have been able to make these predictions accurately.
We do, however, also know that firms tended to follow AMSA’s pricing during the cartel. It is possible, then, that this would have continued after the end of the cartel. This conscious price parallelism might be thought of as a form of tacit collusion. Though the information exchange framework maintained by SAISI was ended in June 2008, with the end of the cartel itself, firms might still be incentivised to price in a similar way to the existing arrangement by following AMSA. Post-cartel there may be discounting, however, this may not result in vigorous price competition between firms that would drive all the way to the export price.
We acknowledge that the firms’ ability to discount on certain projects or to certain customers, without being monitored by competitors, or having to offer the same discounts to other customers may impede the firms’ ability to maintain some infinite Bertrand-type game, but the same

353
o v e r c h a r g e e s t i m a t e s i n t h e s o u t h a f r i c a n r e i n f o r c i n g b a r c a r t e L
could be argued for a price-leadership model. Discounting will make any infinite Bertrand game reduce to the same result as a one-shot game for as long as firms have excess capacity.
Firms, indeed, had excess capacity during the cartel, even after taking exports into account. The industry only started producing at capacity in some months in 2007 and 2008. Even in these months, however, there were exports that could have been diverted to the domestic market. These exports can be thought of as excess capacity to supply the domestic market when considering the Bertrand model of competition. Although it is not, and cannot be, a definitive conclusion, it seems that the counterfactual form of competition would have been tacit collusion with price leadership, with AMSA as the price leader. However, given that this conclusion cannot be definitive, we present mark-ups for both the price leadership model and Bertrand competition, with excess capacity of a homogenous product as a robustness check.
In the Bertrand counterfactual, it would be expected that the price would have been very close to costs or, in our analysis, very close to the opportunity cost of the deep-sea export price.
Data used
The estimates of the cartel overcharge are based on comparisons of domestic prices with those of export prices. The domestic price is sourced from producer data, net of volume and settlement discounts, and cross checked against customer data. These data were obtained through various investigations by the Competition Commission of South Africa and hence the underlying individual data are confidential. The domestic price data are monthly measures of rebar in rand per tonne.
The export price data were calculated from volume and value of rebar exports collected by Quantec. It was assumed that the products recorded as H72142000 and H72131000 according to the harmonised system were all rebar exports. The data were collected and aggregated for export destinations, which would require seaborne trade. Thus this excluded exports to Namibia, Botswana, Zimbabwe, Mozambique,

C o m p e t i t i o n a n d R e g u l a t i o n f o R i n C l u s i v e g R o w t h
354
Lesotho, Swaziland, Malawi and Zambia from the data. The reason for this exclusion was that suppliers from South Africa have transport advantages that allow them to price in these destinations similarly to their South African prices. Put differently, these destinations are in the same relevant competition market as South Africa, despite political boundaries. Indeed, many are even within the SADC free trade region. The accuracy of the Quantec data were cross checked against various producers’ export prices, as well as historic confidential data collected from the Harmony Mittal7 case. The export data are in rand per tonne and monthly for the period January 2005 to June 2012 and annual prices from 1999 to 2004 (monthly data were not available from Quantec before January 2005).
Description of the data and preliminary observations
Figure 11.3 shows the domestic and deep-sea export prices from November 1999 to June 2012. It seems that the domestic price was consistently above the export price until late 2006 and 2007 when they seem to be broadly similar. For most of 2008, the domestic price was below the export price. For the period after 2009 it seems that the export price and the domestic price were, on average, very similar. There are distinct short periods where one is larger than the other in this later period, however no pattern seems to emerge.
The first interesting observation to make from Figure 11.3 is a price war that occurred in late 2001 and early 2002. The export data available for exports are only annual data, but even so, it is evident that the domestic price is low relative to the export price during these few months. Confidential monthly data from the Harmony Mittal case show that export prices peaked in late 2001 and early 2002 but domestic prices, rather uncharacteristically, did not follow suit. In fact, the export price was significantly above the domestic price, a fact that has been lost with the annual export price in Figure 11.3. This was the only instance in which the export price was above the domestic price before late 2006.
Various industry participants recollect that the price war was
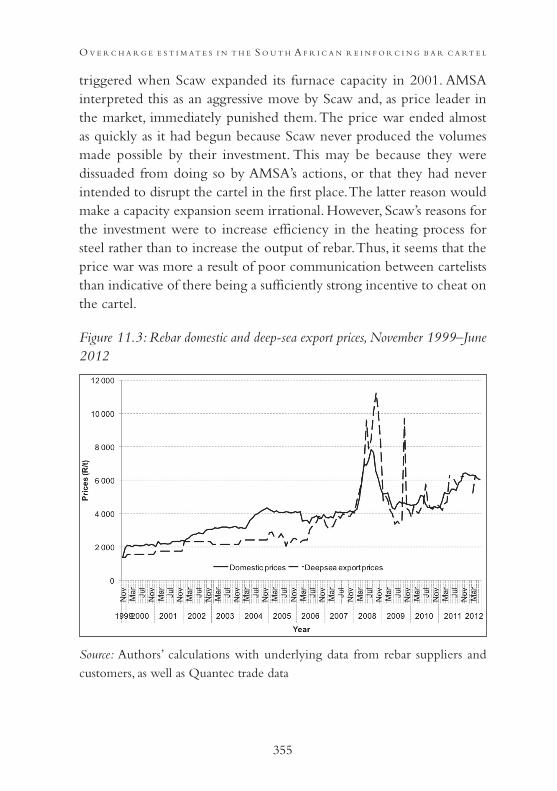
355
o v e r c h a r g e e s t i m a t e s i n t h e s o u t h a f r i c a n r e i n f o r c i n g b a r c a r t e L
triggered when Scaw expanded its furnace capacity in 2001. AMSA interpreted this as an aggressive move by Scaw and, as price leader in the market, immediately punished them. The price war ended almost as quickly as it had begun because Scaw never produced the volumes made possible by their investment. This may be because they were dissuaded from doing so by AMSA’s actions, or that they had never intended to disrupt the cartel in the first place. The latter reason would make a capacity expansion seem irrational. However, Scaw’s reasons for the investment were to increase efficiency in the heating process for steel rather than to increase the output of rebar. Thus, it seems that the price war was more a result of poor communication between cartelists than indicative of there being a sufficiently strong incentive to cheat on the cartel.
Figure 11.3: Rebar domestic and deep-sea export prices, November 1999–June 2012
Source: Authors’ calculations with underlying data from rebar suppliers and customers, as well as Quantec trade data

C o m p e t i t i o n a n d R e g u l a t i o n f o R i n C l u s i v e g R o w t h
356
Figure 11.4: Rebar domestic price premium, domestic prices over export prices, November 1999–June 2012
Source: Authors’ calculations with underlying data from rebar suppliers and customers as well as Quantec trade data
The second event, partially evident from Figure 11.3, and the focal point of this chapter, is the presumed ending of the formal cartel in June 2008. It is only partially evident because there are a number of other forces acting on the market in and around this period. The first is a somewhat prolonged spike in the world price of rebar for most of 2008. Domestic prices also spiked in the same period, but to a lesser extent. The reason for this may be because of price fluctuation limits in domestic contracts, together with a weakening cartel, which was then discovered in the middle of the year. There had also been a boom in the construction sector, which ended after 2008. In addition to these changes in the market, the competition authorities had put an end to a number of cartels in the construction industry.
The problems involved in interpreting Figure 11.3 are somewhat resolved in Figure 11.4, which shows the proportional difference

357
o v e r c h a r g e e s t i m a t e s i n t h e s o u t h a f r i c a n r e i n f o r c i n g b a r c a r t e L
between the domestic and export prices (the domestic price premium). Also presented in Figure 11.4 is the 12-month rolling average of the domestic price premium. This was done to smooth out the volatility in the monthly data.
Figure 11.4 shows that a large premium was enjoyed by the cartel until 2006 when the premium declined markedly. In 2007, the premium was also very low indicating that the cartel was losing its effectiveness prior to the leniency application. Going into 2008, the premium continued to fall, however this must be viewed in light of the large increases in actual prices. The world price was at record highs, as was the domestic price. Firms would have been making significant profits even though the domestic price was less than the export price. Firms would have known that the spike would be short lived and, hence, may have been somewhat accommodating to large domestic customers with whom a long-term relationship was more valuable than extra short- term profits.
The world price plummeted from its highs in late 2008 and bottomed out in mid-2009. The domestic price also fell sharply, but in early and mid-2009 it was once again at a premium to the export price. This continued on aggregate for most of 2009 and the first half of 2010, however there seems to have been a large degree of instability over this period. The average premium during this time is similar to the premium enjoyed in 2006 and 2007 when the cartel seems to have lost its potency. By the latter half of 2010 to the end of our dataset in June 2012, the premium normalised to marginally above zero on aggregate.
The result was that domestic prices were above their benchmark immediately following the break-up of the cartel, which is not an unusual finding. Cartelists are able to use information learnt during the cartel to achieve a certain degree of coordination. In the absence of effective monitoring and punishment mechanisms, however, these post-cartel premiums disappear. This is at least a plausible explanation for the evolution of the rebar price premium in this instance.

C o m p e t i t i o n a n d R e g u l a t i o n f o R i n C l u s i v e g R o w t h
358
Cartel overcharge estimates
Even though the formal cartel was presumed to have ended in June 2008 following the raid, we also exclude data post 2006 to avoid the effects of the commodity boom and that the counterfactual price during the cartel would have been the deep-sea export price. The cartel overcharge would then be calculated as the average premium of the domestic price over the deep-sea export price for the period to May 2006. This produces an average premium of 43.2 per cent as our estimate of the cartel overcharge.
Table 11.1 presents a number of results based on alternative assumptions for different sensitivity analyses.
Table 11.1: Cartel overcharge estimate with sensitivities*
*The October 2009 premium of –52% was excluded as an outlier. It is likely to be a data error as the export price spiked for just the month of October 2009.
Source: Authors’ calculations
The two forms of competition presented in Table 11.1 are Bertrand competition where prices fall to cost, and price leadership (PL) where firms are able to maintain some positive margin by following AMSA as the price leader. The assumptions made in the Bertrand calculations is that price would fall to deep-sea export prices, and so estimates in that column are the average of the domestic premium above deep-sea exports for the relevant period. The assumption made in the price leadership column is that the post-cartel period is indicative of the counterfactual mark-up that would have been achieved through price leadership as opposed to through the cartel. The estimates in this column are, thus, the difference between the averagepremium during the cartel and the average premium after the cartel.
Cartel mark-up (Bertrand)
Cartel mark-up (PL)
Strict definition 34.2% 31.4%
Excluding 2008 36.8% 29.2%
Excluding June 2006 to Dec 2008 43.2% 35.7%

359
o v e r c h a r g e e s t i m a t e s i n t h e s o u t h a f r i c a n r e i n f o r c i n g b a r c a r t e L
The ‘strict definition’ defines the cartel as ending in June 2008. The Bertrand estimate is, thus, for the period from November 1999 to June 2008. The price leadership estimate is the premium from November 1999 to June 2008 less the average premium from July 2008 to June 2012.
The row called ‘Dropping 2008’ treats the 2008 year as an anomaly given the spike in the world price and the less than commensurate spike in the domestic price. Therefore, the Bertrand estimate is ended at December 2007 and the price leadership estimate is the difference between the premium to December 2007 and the premium from January 2009 to June 2012.
The row called ‘Dropping June 2006 to Dec 2008’ treats the 2008 year as an anomaly, as well as the June 2006 to December 2007 period as a period in which the cartel was ineffective. There is no strong evidence that the cartel was losing effectiveness other than the fact that margins diminished as a result of domestic prices not increasing while export prices did increase. The Bertrand estimate is calculated as the average premium to May 2006 and the price leadership estimate is calculated as the difference in the average premium to May 2006 and the average premium from January 2009 to June 2012.
Note that in all the price leadership estimates presented in Table 11.1, the October 2009 premium was dropped as an outlier. This has the effect of increasing the estimate of the average premium in the post-cartel period and, hence, reducing the price leadership estimates by 1.3 per cent for the strict definition and 1.6 per cent for the other two estimates. For this reason, we believe this to be the conservative approach. The treatment of this outlier has no effect on the Bertrand estimates because this method does not take into account any post- cartel mark-up.
Valuing the cartel overcharge
The economic literature is comfortable with estimating cartel overcharges in percentage terms. This is because it is the best means of understanding the cartel’s effectiveness in increasing prices. A damages estimation then

C o m p e t i t i o n a n d R e g u l a t i o n f o R i n C l u s i v e g R o w t h
360
takes the overcharge results and applies this to the transactions that took place during the cartel period. A fully comprehensive (but near impossible) damages analysis would also take into consideration those transactions that never took place by virtue of the price premium, which would have taken place but for the price. A second complication arises where the cartel output is sold to end consumers via one or a number of intermediate customers. These may be firms that use the product as an input in their own production process or simply distributors and retailers. The issue here is that some of the cartel overcharge is absorbed by the intermediary firms and consumers don’t pay the full brunt of the overcharge.
We have conveniently, but we think reasonably, assumed away both these complicating factors for the purposes of our rebar damages estimation. Rebar demand arises from major construction projects, where it is a relatively minor cost component in the overall cost of a project. It seems unlikely then that demand for rebar would be significantly diminished, or even diminished at all, by the cartel overcharges. As such the quantity sold under the cartel is likely to be a good proxy for the quantity sold in the counterfactual.
Again, our dismissal of pass-through effects stems from the nature of the transactions in this industry. Suppliers of large construction projects price projects to fully pass on input costs. Where projects are forecasted to take a long time to construct, the contract includes escalation clauses for input costs to mitigate the risk of increased input prices over the construction period. Admittedly, these clauses are not only to protect the construction firm from increasing input costs, but also to protect the customer from the construction firms’ attempts to add margin onto inputs used in the construction process. It seems likely then that construction firms are able to pass through the entire cartel price to the end consumer. The full burden of the rebar cartel thus fell on consumers of construction projects.
Given the simplifying assumptions explained earlier, we performed a straight-forward calculation of quantity multiplied by overcharge to estimate the damages, shown in Table 11.2. The domestic volume data
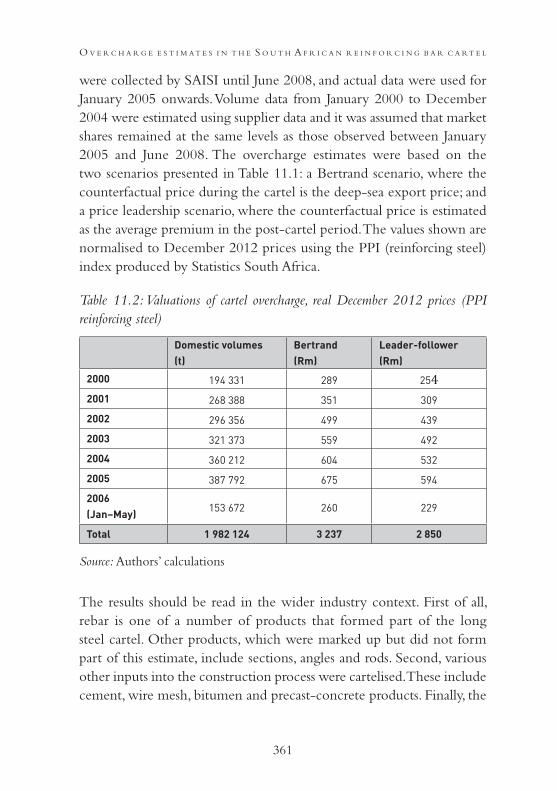
361
o v e r c h a r g e e s t i m a t e s i n t h e s o u t h a f r i c a n r e i n f o r c i n g b a r c a r t e L
were collected by SAISI until June 2008, and actual data were used for January 2005 onwards. Volume data from January 2000 to December 2004 were estimated using supplier data and it was assumed that market shares remained at the same levels as those observed between January 2005 and June 2008. The overcharge estimates were based on the two scenarios presented in Table 11.1: a Bertrand scenario, where the counterfactual price during the cartel is the deep-sea export price; and a price leadership scenario, where the counterfactual price is estimated as the average premium in the post-cartel period. The values shown are normalised to December 2012 prices using the PPI (reinforcing steel) index produced by Statistics South Africa.
Table 11.2: Valuations of cartel overcharge, real December 2012 prices (PPI reinforcing steel)
Source: Authors’ calculations
The results should be read in the wider industry context. First of all, rebar is one of a number of products that formed part of the long steel cartel. Other products, which were marked up but did not form part of this estimate, include sections, angles and rods. Second, various other inputs into the construction process were cartelised. These include cement, wire mesh, bitumen and precast-concrete products. Finally, the
Domestic volumes (t)
Bertrand (Rm)
Leader-follower (Rm)
2000 194 331 289 2542001 268 388 351 309
2002 296 356 499 439
2003 321 373 559 492
2004 360 212 604 532
2005 387 792 675 594
2006 (Jan–May)
153 672 260 229
Total 1 982 124 3 237 2 850

C o m p e t i t i o n a n d R e g u l a t i o n f o R i n C l u s i v e g R o w t h
362
downstream construction sector, which used all these cartelised products as inputs, itself operated as a cartel. The rebar damages estimate of between R2 850 million and R3 237 million is simply one, relatively small, component of the overall damages ultimately paid by customers of construction projects.
PROBLEMS WITH INTERPRETATION8
As is the case in a number of other intermediate industrial product markets in South Africa, different levels of the long steel product value chains have been characterised by collusive activity. A network of mutually reinforcing agreements and relationships has historically existed between members of the long steel value chain, ranging from input material scrap to the end use of rebar and reinforcing mesh in construction projects. Further, many of the players in the long steel value chain are vertically integrated from the level of rebar production right through to construction. The Competition Commission has referred at least five cases in the long steel value chain to the Competition Tribunal.
In scrap, a key input into long steel production in South Africa, the same long steel producers implicated in this cartel were part of a cartel that fixed purchase prices of scrap and allocated which scrap suppliers they would buy from. Agreement was reached between the long steel producers and five of the largest scrap suppliers (New Reclamation Group, Universal Recycling, Ton Scrap, Ben Jacobs and Rand Scrap), which effectively resulted in the exclusion of the smaller scrap producers.
In a further downstream level, the rebar produced by the long steel producers is cut, bent into the desired shape and installed in construction projects. A number of corporate leniency applications were brought to the Commission by Murray and Roberts, implicating companies in cartel activity in rebar and reinforcing mesh for construction projects. The firms implicated in the rebar-related cartel included Reinforcing Steel Contractors (a subsidiary of the construction firm Murray and Roberts), Reinforcing Mesh Solutions (a subsidiary of the construction firm WBHO), Steeledale (a subsidiary of the construction firm Aveng)

363
o v e r c h a r g e e s t i m a t e s i n t h e s o u t h a f r i c a n r e i n f o r c i n g b a r c a r t e L
and a number of smaller players that were not affiliated with large construction firms. These firms allocated construction projects, fixed prices and discount bands, and allocated customers in a number of regions in South Africa. Allocations were based mainly on market share, and cover pricing was used to ensure that the selected member won the project it was allocated. Similarly, in the mesh cartel case, for which there has been a Tribunal finding, reinforcing mesh producers BRC Mesh (a subsidiary of the construction firm Murray and Roberts), Steeledale (a subsidiary of the construction firm Aveng), Reinforcing Mesh Solutions (a subsidiary of the construction firm WBHO) and a producer unaffiliated with a construction company, Vulcania Solutions, were found to have fixed price lists, discounts to customer groupings and allocated customers and projects.
Yet another cartel in roof bolts for mining reveals participation by the same main players (Murray and Roberts’ affiliate, RSC Ekusasa, and Aveng’s affiliate, Duraset) and other players (Dywidag Systems International and Videx Wire Products). Here, the firms rigged tenders from mines so that that each player maintained their traditional customer base.
These pervasive and multilevel cartels, often with firms from the same group implicated, raise two important issues. First, it would appear somewhat unusual and, indeed, counterintuitive that cartel members at one level of the value chain would allow and – from what is evident in the long steel value chain – actively participate in agreements and arrangements at other levels. After all, an upstream monopolist would want to ensure a competitive customer base in downstream markets so as to maximise their profits, with as little buyer power constraining their pricing as possible. From the perspective of downstream firms, the ideal situation is a number of suppliers of input products competing down the price. But the widespread cartel conduct at almost every level of the long steel value chain, anchored by key vertically integrated players, suggests that the motive for such behaviour is likely to be a desire to ensure overall governance of the value chain by these players. By tying up key inputs and key customers in a web of cartel activities, new entrants

C o m p e t i t i o n a n d R e g u l a t i o n f o R i n C l u s i v e g R o w t h
364
would find it very difficult to enter the long steel value chain, thus ensuring the market positions of the existing main players.
Second, and of significance to the results in this chapter, is the ‘noise’ these multiple cartels create when interpreting estimates of overcharges. Given the numerous cartels, both upstream and downstream from rebar production, it is difficult to attribute changes in the market dynamics following the end of the rebar cartel solely to this event. The scrap, mesh and installation of rebar in construction project cartels, all allegedly came to an end around the same time as the rebar production cartel. The effects may be the result of a combination of these dynamics. For example, evidence of new entry in long steel production may be the result of easier access to scrap following the desolation of the scrap cartel.
In addition to the above, clean interpretation of the evidenced results is made difficult because of the following simultaneous events:
• The presumed end of the formal cartel was during the crescendo of the construction boom which began in 2007 and turned sharply downwards in early 2009, although, we exclude the data post 2006 as a result of the commodity boom.
• Electricity load shedding by utility company Eskom would have meant that plants could not run at full capacity throughout the year (Tyrer, 2008).
• The mothballing of Cisco in 2011, with the simultaneous entry of SA Metals, which had a net reduction in industry capacity of approximately 130 000 tonnes per annum.
• AMSA had plant shutdowns at the beginning of 2011 and in August 2011 which resulted in a massive reduction in domestic supply.9
• The long-term nature of contracts in the industry, which are typically 12 to 18 months, would exacerbate the lagged outcome. The difference in lead times on orders placed and actual delivery, alternatively, the difference between when contracts were won and when revenue was booked against them (which may be

365
o v e r c h a r g e e s t i m a t e s i n t h e s o u t h a f r i c a n r e i n f o r c i n g b a r c a r t e L
some time after the contract is done) may also be why there are some lagged effects.
CONCLUSION
Deterrence is an important aspect of the work of competition authorities and much has been done to refine the investigative procedures, the design of administrative penalties and the Corporate Leniency Policy to detect and deter cartels. However, the opportunity for deterrence from damage claims has not been fully exploited in South Africa. Thus far, no South African court has awarded damage claims for harm suffered from anticompetitive conduct, even though there have been some attempts to seek compensation. There is a need to provide support and encouragement to victims of anticompetitive conduct to claim damages. Traditionally in competition law, administrative penalties are viewed as a deterrence mechanism while damage claims are regarded as a compensation mechanism for victims of anticompetitive conduct. However, damage claims do assist competition authorities with deterrence because an appropriately calculated cartel overcharge and damage claim can reclaim most of the cartel profits. Thus, if there is a high likelihood of being caught and damages being awarded, cartels would be less attractive to firms and there would be more vigilance with compliance.
The calculation of cartel overcharges assists the victims of anticompetitive behaviour to take decisions about seeking compensation. There is some miscommunication about the harm of cartels in markets. For example, in the construction industry where cover pricing was prevalent, most customers understood that it was necessary to allow the construction firms to plan projects and stay on supplier lists and that this type of conduct did not result in overcharges. However, the parties to the conduct effectively substituted practical cooperation for the risks of competition and, consequently, distorted competition in the tender process. Such conduct undermines the benefits to the clients of receiving competitively priced bids (Khumalo, Njisane and Nqojela, 2010). These overcharge calculations are also not just useful to those

C o m p e t i t i o n a n d R e g u l a t i o n f o R i n C l u s i v e g R o w t h
366
harmed by anticompetitive conduct but are also a useful way of showing the impact of the work done by the competition authorities on the wider economy.
In this chapter, we measured the cartel overcharge in percentage terms and the consequent damages in rand terms in the reinforcing steel-bar market, a market in which a cartel operated between 1999 and 2008. We did this by applying the ‘difference-in-difference’ methodology, with our primary comparison being the cartelised rebar domestic price over the export rebar price. The results were presented for two counterfactual scenarios, the leader–follower model of competition and Bertrand competition as a robustness check. We found that the cartel mark-ups were as high as 43.2 per cent for the Bertrand counterfactual and 35.7 per cent for the price leadership counterfactual. The leader–follower overcharge was calculated by taking the difference between the prices during and after the cartel. This speaks directly to the impact of the interventions of the Competition Commission.
We applied the overcharge results to the transactions that took place during the cartel to get a valuation of the overcharge, in other words, an estimate of the damages that could be claimed from the cartelists. This value amounts to R3.2 billion under the Bertrand counterfactual and R2.8 billion under the leader–follower counterfactual. Given that the demand for rebar is a derived demand and the cost thereof is a small proportion of the construction projects, it is unlikely that the higher prices dissuaded customers from new construction projects. So the quantity that was consumed under the cartel is a good proxy for the quantity that would have been sold without the cartel.
We acknowledge the inherent difficulties in interpreting the results of the analyses, particularly in industries such as steel, where there are cartels in multiple levels of the value chain, considerable ‘noise’ given external shocks, and where cartel behaviour is so entrenched that conduct may persist well after the ‘formal’ cartel ends. However, to address some of these issues, we showed results for the strict cartel period, as well as the cartel period taking out the years with anomalies.

367
o v e r c h a r g e e s t i m a t e s i n t h e s o u t h a f r i c a n r e i n f o r c i n g b a r c a r t e L
NOTES
1 The views in this chapter are solely the authors’ own. The chapter is based on work previously done by the authors in collaboration with Andrew Sylvester.2 The Competition Commission may have conducted more impact assessments but these listed studies are the only ones available in the public domain.3 AMSA and Scaw capacity figures are estimated based on production volumes from SAISI over time. Cape Gate capacity sourced from website: http://www.capegate.co.za/aboutus.asp. Accessed 15 September 2011. Cisco capacity sourced from Who Owns Whom Report, 2010, Basic Iron and Steel Industries, Except Steel Pipe and tube Mills.4 This is the system used in trade data to categorise products to a high degree of specificity.5 Competition Tribunal case no. 13/CR/FEB04 6 Competition Tribunal case no. 48/CR/AUG107 Competition Tribunal case no. 13/CR/FEB048 This section draws from Das Nair, Khumalo and Roberts (2012).9 See http://www.intranews.co.za/clippings/Mittal%20furnace%20shut- down%20hits%20industry%20hard.pdf
REFERENCES
ArcelorMittal (2011) Domestic steel market overview. Investor Session: Cape Town & Johannesburg. Available at: https://arcelormittalsa.com/Portals/0/September%202011%20-%20%E2%80%9CEconomic%20overview%20and%20its%20impact%20on%20steel%20consuming%20sectors%E2%80%9D.pdf [Accessed 14 April 2019].
ArcelorMittal (2012) ArcelorMittal Newcastle Works. Available at: https://arcelormittalsa.com/Portals/0/Newcastle%20Works%20Presentation%20 %20Investec%20(4June2012).pdf [Accessed 14 April 2019].
Baker, S and Ignjatovic, B (2011) Exporting at a discount: Collusive dumping or oligopolistic competition? Available at: http://www.compcom.co.za/fifth-annual-conference-on-competition-law-economics-and-policy-in-south-africa/ [Accessed 2 November 2011].

C o m p e t i t i o n a n d R e g u l a t i o n f o R i n C l u s i v e g R o w t h
368
Boshoff, WH (2015) Illegal cartel overcharges in markets with a legal cartel history: Bitumen prices in South Africa, South African Journal of Economics, 83(2): 220–239.
Calcagno, C and Walker, M (2010) Excessive pricing: Towards clarity and economic coherence, Journal of Competition Law and Economics, 6(4): 891–910.
Connor, JM (2014) Price-Fixing Overcharges, 3rd edition. Available at: SSRN: http://dx.doi.org/10.2139/ssrn.2400780 [Accessed 6 August 2014].
Darji, R, Grimbeek, S and Muzata, G (2012) The impact of antitrust fines on firm valuation in South Africa: The case of Pioneer Foods, Tiger Brands and Sasol chemical industries. Centre for Competition, Regulation and Economic Development Working Paper Series No 2012/5. Available at: http://www.competition.org.za/working-papers/ [Accessed 27 May 2014].
Das Nair, R, Khumalo, J and Roberts, S (2012) Steel, cement and fertiliser: Corporate cartels in intermediate industrial products, New Agenda, South African Journal of Social and Economic Policy, 45, First Quarter.
Davies, SW and Ormosi, PL (2010) Assessing Competition Policy: Methodologies, gaps and agenda for future research, Centre for Competition Policy Working Paper 10–19. Available at: http://competitionpolicy.ac.uk/documents/107435/107587/Working_Paper_10-19.pdf [Accessed 26 May 2014].
Department of Mineral Resources (2011), South African Steel Producers’ Handbook. Handbook H3/2011. Available at: http://www.dmr.gov.za/LinkClick.aspx?fileticket=XcYm78qEVRc%3D&portalid=0 Accessed 14 April 2019].
Hüschelrath, K, Müller, K and Veith, T (2013) Concrete shoes for competition: The effect of the German cement cartel on market price, Journal of Competition Law and Economics, 9(1): 97–123.
Khumalo, J, Mashiane, J and Roberts, S (2014) Harm and overcharge in the South African precast concrete products cartel, Journal of Competition Law and Economics, nhu005.
Khumalo, J, Njisane, Y and Nqojela, P (2010) Cover pricing in the construction industry: Understanding the practice within a competition context. Presented at The Fourth Annual Competition Commission, Competition Tribunal and Mandela Institute Conference on Competition Law, Economics and Policy in South Africa, Johannesburg, 2 September.

369
o v e r c h a r g e e s t i m a t e s i n t h e s o u t h a f r i c a n r e i n f o r c i n g b a r c a r t e L
Mncube, L (2014) The South African wheat flour cartel: Overcharges at the mill, Journal of Industry, Competition and Trade, 14(4): 487–509.
Njisane, Y (2011) Rebar Cartel, Competition News, March: 6–7.Nontombana, N and Lesofe, I (2010) Do cartelists change behaviour post-
investigations? Presented at the Fourth Annual Competition Commission, Competition Tribunal and Mandela Institute Conference on Competition Law, Economics and Policy in South Africa, Johannesburg, 2 September.
OECD (2016). Reference guide on ex-post evaluation of competition agencies’ enforcement decisions. Available at: http://www.oecd.org/daf/competition/Ref-guide-expost-evaluation-2016web.pdf. Accessed 14 April 2019].
OXERA (2009) Quantifying antitrust damages: Towards non-binding guidance for courts. Study prepared for the European Commission, December.
Quantec (ND) Trade Statistics. Available at: http://www.quantec.co.za/ [Accessed 27 May 2014].
Scallan, A, Mbikiwa, M and Blignaut, L (2013) Compensating for harm arising from anti-competitive conduct: Follow-on damages litigation, class actions, the relationship between public and private enforcement and models for quantifying harm. Presented at the Seventh Annual Competition Commission, Competition Tribunal and Mandela Institute Conference on Competition Law, Economics and Policy in South Africa, Johannesburg, 5–6 September 2013.
Tyrer, L (2008) Steel producers’ results raise the bar for 2008, Engineering News. Available at: http://www.engineeringnews.co.za/article/steel-producers-results-raise-the-bar-for-2008-2008-02-29 [Accessed 27 May 2014].
Verboven, F and Van Dijk, T (2009) Cartel damages claims and the passing-on defence, Journal of Industrial Economics, 57(3): 457–491.


371
c o m p e t i t i o n a s s e s s m e n t i n m a L a w i t r a n s p o r t s e c t o r
12
Competition assessment in Malawi transport sector
Competition and Fair Trading Commission, Malawi
INTRODUCTION
The transport sector plays a crucial role in Malawi’s economic development, especially in view of the country’s landlocked position. The country has relatively high transport costs, as it is an importer of liquid fuels. It was against this background that the Competition and Fair Trading Commission (CFTC) of Malawi conducted a study into the transport sector to establish the level of competition and its effect on transport costs. The study was conducted in the cities of Lilongwe and Blantyre through interviews with regulators, operators and consumers across different modes of transport for freight and passenger carriage. Relevant literature was also reviewed. The transport sector is clearly critical in terms of its implications for economic activity. At the same time, there are overlapping issues of regulation, licencing and competition, which impact on the sectors overall performance and market outcomes.
Previous research on the transport sector in Malawi and its neighbours in southern Africa has recognised that both regulatory and infrastructure developments, as well as competition between transport service providers, are important in reducing transport costs (see Ncube, Roberts and Vilakazi, 2015; Teravaninthorn and Raballand, 2009). This is recognised as being particularly important in the case of road transportation of goods and passengers in Malawi, where road routes

C o m p e t i t i o n a n d R e g u l a t i o n f o R i n C l u s i v e g R o w t h
372
account for approximately 70 per cent of internal freight traffic, more than 90 per cent of the country’s international freight traffic and 99 per cent of passenger traffic (Lall, Wang and Munthali, 2009; Ministry of Transport and Public Works, 2015).
High transport costs, particularly for road transportation of passengers and goods, have been linked to high fuel prices in recent years in Malawi. The Ministry of Transport has estimated that transport costs account for about 56 per cent of the costs of imports and exports in Malawi (Helema, 2015). Publicly available information suggests that fuel costs in Malawi are among the highest in the southern African region (Helema, 2015).
Table 12.1: Logistics Performance Index scores and rankings, 2014
Source: World Bank (2014)
Interestingly, the World Bank (2015) indicates that Malawi ranks second behind South Africa in terms of the overall Logistics Performance Index (LPI) scores and above its neighbouring countries of Mozambique,
Malawi Mozambique South Africa Tanzania ZambiaScore Rank Score Rank Score Rank Score Rank Score Rank
Overall LPI2.81 73 2.23 147 3.43 34 2.33 138 2.46 123
Customs2.79 62 2.26 126 3.11 42 2.19 135 2.54 86
Infrastructure3.04 48 2.15 135 3.20 38 2.32 114 2.31 115
International shipments 2.63 108 2.08 154 3.45 25 2.32 137 2.13 152
Malawi Mozambique South Africa Tanzania Zambia
Score Rank Score Rank Score Rank Score Rank Score Rank
Logistics quality and competence
2.86 70 2.10 153 3.62 24 2.18 145 2.47 114
Tracking and tracing 2.63 100 2.08 152 3.30 41 2.11 150 2.47 120
Timeliness 2.99 100 2.74 134 3.88 33 2.89 107 2.91 105

373
c o m p e t i t i o n a s s e s s m e n t i n m a L a w i t r a n s p o r t s e c t o r
Tanzania and Zambia (Table 12.1). Malawi seems to perform well in terms of customs procedures and road infrastructure measures, as well as logistics quality. However, Malawi ranks relatively poorly on international shipments, which may be partly due to the fact that the country is landlocked and, as such, has to rely on the logistics systems of other countries, including efficiencies at ports, to facilitate shipments. It is worth noting that there is a strong presence of sophisticated global players in forwarding and logistics operations in Malawi, which may explain the relatively strong scores in terms of the performance of its logistics systems overall.
More recent studies in the region have identified competition and regulatory issues as concerns in the SADC road-freight sector, including the Malawian market, and have focused less on infrastructural constraints. Ncube et al (2015) considered the competitive dynamics in road-freight transportation in Malawi, Tanzania and Zambia, through an evaluation of the transportation of fertiliser in each country. They found that outcomes in the transport sector were driven by a range of factors such as the availability of return loads for transporters, price regulations for transport through the state, for instance, in the transportation of subsidised fertiliser, and the bargaining power of user groups relative to one another. In Malawi, they found that the transport sector is concentrated in terms of a few large transporters, although there are many owner-operators as well, and costs for transport within the country are especially high (Ncube et al, 2015).
A primary driver of transport sector outcomes in Malawi is the fuel price. From various interviews, including those with various transporters of goods and passengers, operators cited high and rising fuel prices as a primary influence on transport prices and thus the cost of goods and services.
Malawi imports fuel from international markets and, thus, is directly affected by the global oil price, which has declined significantly (by around 50 per cent) since mid-2014 in US dollar terms. However, the local currency has depreciated substantially (Figure 12.2) and there are apparently high domestic taxes on fuel relative to other countries

C o m p e t i t i o n a n d R e g u l a t i o n f o R i n C l u s i v e g R o w t h
374
and high costs of transporting fuel by road. The fuel price in Malawi was regulated on an import parity basis, where a formula is applied to determine local prices using the values of three components: (1) the In Bond Landed Cost (IBLC), (2) taxes and levies, and (3) industry margins (World Bank, 2015). This was changed in November 2011, following fuel shortages earlier that year, to provide greater incentives to fuel importers. The formula means that there is a full pass through of international prices and exchange rate changes to the local price. However, the price levels are also affected by transport costs from the coast.
Figure 12.1: Brent crude oil monthly price, 2010–2015
Source: www.indexmundi.com
The CFTC’s market inquiry assessed the responsiveness of minibus and bus fares to reductions in the fuel price. They found that bus and minibus fares for passenger transportation were not affected positively by fuel-price reductions. The bus and minibus operators were reluctant to reduce fares as they were uncertain of what would happen to the fuel price in the next period. They said that it would not make business sense to adjust bus fares downwards every time the fuel price fell since other cost parameters remained stable or were adjusted upwards. This is contrary to the assertion that fuel is the main cost for the transporters.
The transportation of goods is also affected by the relative trade

375
c o m p e t i t i o n a s s e s s m e n t i n m a L a w i t r a n s p o r t s e c t o r
position of Malawi. The large trade deficit means that there are limited backhaul loads (or return loads) for transporters bringing products into Malawi (Figure 12.3). In effect, the transport cost is, therefore, placed disproportionately on the import leg.
Figure 12.2: Malawi kwacha per US $, 2010–2015
Source: Reserve Bank of Malawi
The National Transport Policy recognises the centrality of road transport services as part of Malawi’s intermodal transport system (Ministry of Transport and Public Works, 2004). However, in the various sections of the policy framework there is limited reference to principles of competitive rivalry between operators and mechanisms for encouraging both price and quality-based transport service competition. Encouraging greater rivalry between operators, and removing regulatory and market conduct constraints to this, is consistent with a renewed emphasis in the SADC and other regional bodies on regulating for quality-based competition by harmonising standards and rules, such as those pertaining to overloading, transit bonds, border management and charges, and rules preventing corruption (Bingandadi, 2011). We now consider the market structure and competition in each of the main transport modes for freight and passengers.

C o m p e t i t i o n a n d R e g u l a t i o n f o R i n C l u s i v e g R o w t h
376
Figure 12.3: Malawi trade balance, 2010–2015
Source: Reserve Bank of Malawi
KEY ISSUES IN FREIGHT TRANSPORTATION BY ROAD
The transportation of goods by road, both within Malawi and across national borders, is critical to economic growth and trade with international partners. The main sea ports through which goods are imported or exported by road are Beira (Mozambique), Durban (South Africa) and Dar es Salaam (Tanzania). Nacala port (Mozambique) is more important in terms of transportation by rail. The primary domestic route for the movement of goods is between the two main cities of Lilongwe in the central region and Blantyre in the southern region.
Road freight in Malawi is characterised by a close interaction between the roles of freight-forwarding agents and trucking companies. Forwarding agents typically act as the intermediary between the users of transport services and the truck operators, particularly for larger clients, and are involved in procuring trucking services on behalf of clients as well.
Most clearing and forwarding agents interviewed provide a range of logistics services, including customs clearing, warehousing, arranging or providing transport using their own or outsourced fleets, and facilitating

377
c o m p e t i t i o n a s s e s s m e n t i n m a L a w i t r a n s p o r t s e c t o r
the shipment of goods for both domestic and international consignments. Other market participants also provide complex supply chain and project management services, as well as depot facilities with the capability of handling specialised services such as fumigation and the storage of clients’ tobacco stock, given the importance of tobacco exports for Malawi’s economy. A wider range of services allows the agent to offer a one-stop shop for clients in terms of transporting goods, effectively facilitating an end-to-end service solution from the factory gate until the product is delivered to its destination.
In terms of medium- to large-sized freight forwarders, there are approximately eight forwarding agents in Lilongwe and six in Blantyre. These firms service ‘blue-chip’ clients and handle more than 300 loads (12.2-metre container equivalent) a year. It is estimated that there are around 150 registered clearing and forwarding agents in Malawi. Most market participants interviewed indicated that the major players at this level included Bridge Shipping, UTI, Combine Cargo, Transmaritime, Manica, Bollore Africa Logistics and CWT-ASI. Overall, in terms of the number of forwarding agents, there appear to be many competitors. However, it appears that concentration in this market is greater when looking at companies with specialised capabilities, or those that focus on specific routes or types of goods. For example, some firms are able to conduct in-house warehousing and blending on behalf of tobacco company clients looking to export produce, while others specialise in the importation of goods and smaller packages, and may have smaller export divisions than others.
Forwarding agents in Malawi seem to be organised in one of two main industry associations – the Clearing and Forwarding Agents Association of Malawi (CAFAAM) and the Indigenous Customs Clearing and Forwarding Association (ICCFA). It appears that the largest freight forwarders are mostly members of the former, which assists its members in terms of aggregating and presenting complaints and concerns of the industry to government and agencies in Malawi and other countries such as Mozambique.
For typical contracts, such as for tobacco industry clients, forwarding

C o m p e t i t i o n a n d R e g u l a t i o n f o R i n C l u s i v e g R o w t h
378
firms submit bids to clients containing their rates, previous experience, service levels, average transit times and various key performance indicators, which are then assessed by the clients. In terms of the rates charged, these are based on various factors such as port charges, and previous rates charged, although some components such as fuel and tyres, which constitute the transport costs, are the responsibility of the transporter.
Some of the largest trucking companies with bases in Malawi are Siku Transport, R Gaffar Transport and JJ Transport. According to the Transporters Association of Malawi, there are between 100 and 200 trucking companies in Malawi, and interviews with market participants indicated that there were high levels of competition at the trucking level of the supply chain. The two main sources of increased competition, identified in the interviews, are the influx of small Malawian operators (with between one and 15 trucks) in the past three to four years, and the growth in the participation of Mozambican truckers, particularly on the Malawian cross-border routes. The small Malawian operators are said to have lower overheads and a lower cost base and, as such, are able to challenge incumbent operators using lower rates.
Apparently, trucking companies from Mozambique have been charging much lower rates than Malawian truckers. A transporter with operations in both countries gave an example of the route from Blantyre to Beira, where Malawian transporters in 2016 were charging approximately US $75/tonne compared to US $65/tonne offered by Mozambican truckers.
Trucking companies indicated that truckers from Mozambique, and to a lesser extent South Africa, have several key advantages over the operators in Malawi in terms of the costs of fuel and tyres. The fuel price in Malawi has been about 30 per cent higher than in Mozambique and other neighbouring countries due to local taxes, as well as transport costs. Malawian truckers also have to incur a 25 per cent duty on imported tyres, applicable since 2012/13, plus the excise duties charged to tyre retreading companies. In Mozambique, transporters can import parts and tyres on a duty-free basis.

379
c o m p e t i t i o n a s s e s s m e n t i n m a L a w i t r a n s p o r t s e c t o r
Trucking companies also noted high relative toll charges applicable between Mozambique and Malawi. Specifically, the distance and the route between the ports in Mozambique to the main cities in Malawi are such that the transporter has to travel a longer proportion of the distance inside Mozambique and the tolls payable by the Malawian transporters are higher than those on Mozambican transporters. Additional fees in Mozambique include the transit bond (Contramarca), which was introduced about three years ago and amounts to around US $150 per truck, and takes some time to clear with the relevant authorities. The effect of this bond is that every consignment imported into Mozambique or that travels through it to another country needs to be cleared and assigned a ‘contramarca number’ before it is dispatched, and this process may also be delayed by a number of days. These cumulative fees and tolls are said to affect the outcomes for Malawian transporters – one example, given by a transporter, is that a Mozambican trucker will pay around US $66 per trip for a journey to Malawi from Beira, whereas a Malawian transporter pays around US $250 in tolls and fees, plus US $30 in port fees. Differences in prices may also reflect the limited availability of return loads for transporters in Malawi and for cross-border transit. Mozambican operators also benefit from connections and access to loads at the ports.
Information gathered from the interviews indicated that the lower rates in the market on each route tend to be those charged by Mozambican transporters (see Table 12.2, which draws on interview with both transporters and users). It is curious in the data provided that routes from Malawian cities to Johannesburg and Beira seem to carry relatively similar rates, despite the fact that Johannesburg is almost 1 000 kilometres further. In effect, backhauls to Johannesburg (for Malawian exports) are relatively cheap at just US $0.04 per tonne per kilometre.
It is also not clear why apparently lower costs in Mozambique have not driven the prices on Beira routes to much lower levels. This outcome is not consistent with the claims of greater competition in

C o m p e t i t i o n a n d R e g u l a t i o n f o R i n C l u s i v e g R o w t h
380
Mozambique, and suggests possible anticompetitive conduct in trucking in Mozambique. Interestingly, the domestic rate between Blantyre and Lilongwe is significantly higher than the various cross-border rates provided, which is consistent with findings by Lall et al (2009) and suggests there may be issues with local competition in trucking inside Malawi, contrary to what was reported by market participants.
Table 12.2: Transport rate estimates for various routes, 2015
Source: Interview data and authors’ own calculations
Note: Rates for a 30-tonne load truck. US $ per truck or trip
Competition assessment on freight transportation by road
There appears to be a degree of segmentation in terms of competition. Smaller transporters compete to a greater extent in terms of price and may be less concerned with aspects of the quality of service, such as the maintenance of vehicles, the installation of sophisticated tracking systems and adherence to axle load limits. For larger operators servicing large clients or agents, reputation and reliability become important differentiators.
The influx of new domestic and international trucking operators appears to have introduced greater price competition, according to interviews with market participants. However, the impact on local
Rate (US $) Distance Rate (US $/tonne/km)
Lilongwe to Beira 1 700–2 500944
0.06–0.09
Beira to Lilongwe 3 100–4 000 0.12–0.15
Lilongwe to Jhb 2 000–2 2001 863
0.04
Jhb to Lilongwe 3700 0.07
Blantyre to Beira 1 950–2 250664
0.10–0.12
Beira to Blantyre
Lilongwe to Durban 3 600 2 400 0.05
Blantyre to Lilongwe 1 500 360 0.15

381
c o m p e t i t i o n a s s e s s m e n t i n m a L a w i t r a n s p o r t s e c t o r
transport rates does not appear to reflect greater competition. This aspect, in so far as it relates to foreign transporters, is due to the continued application of the rules against cabotage, which prevent foreign firms from transporting cargo between two points within a foreign country (Ward and Barreto, 2011). This rule is designed to protect local transporters and the transport association has lobbied to ensure it is firmly enforced. Cabotage is still prohibited in almost all the SADC countries, including Malawi.
As may be expected, the local transporter association wishes to limit local competition from foreign entrants. The role of the forwarders’ associations, namely CAFAAM and ICCFA, is also of concern as they are involved in agreeing tariffs to be charged in the market as a whole, ostensibly to avoid destructive undercutting or overcharging by individual agents. Coordination between clearing agents through the association is also likely to lead to adverse outcomes for transporters where the agents act jointly as a monopsony buyer of trucking services. These practices are prohibited under the Competition and Fair Trading Act of 1998, which prohibits collusive conduct in general. Furthermore, section 34(1)(b) prohibits an association from making any recommendations to its members in terms of ‘the prices charged or to be charged by such members or any such class of members or to the margins included in the prices or to the pricing formula used or to be used in the calculation of those prices’.
PASSENGER TRANSPORTATION BY ROAD
Passenger transportation by road in Malawi comprises a combination of the services provided by minibus, bus and taxi operators. There are competition issues in each of these segments, which are reviewed in this section.
Minibus operators
It is notable that prior to the market inquiry on which this chapter is based, the CFTC intervened in the passenger transportation sector where the Minibus Owners Association of Malawi (MOAM) was involved in the setting of prices to be charged in the market. The intervention

C o m p e t i t i o n a n d R e g u l a t i o n f o R i n C l u s i v e g R o w t h
382
increased awareness of the competition law and prohibited practices among the market participants and the general public.
Minibuses operate within a set of rules administered by the Directorate of Road Traffic, among other government departments that relate to licensing and registration, as well as the conduct of operators. The licensing provisions for registering a new vehicle for operation as a passenger transport vehicle do not appear to be restrictive, although there are certain renewal fees and annual registrations with which drivers and owners are required to comply.
Minibuses are required to operate within a 150-kilometre radius of the major cities and are restricted from travelling long-distance routes, given the safety concerns that have arisen in the past. This restriction, which has been in place for approximately eight years, was apparently lobbied for by the industry association, MOAM, and is enforced (somewhat) by the traffic and law enforcement agencies.
Minibuses operate on a queuing system at the depots, on a first-come first-served basis. Passengers typically board the vehicle from the front of the queue. In this context, it emerged from the interviews that the price paid by each passenger in this system is effectively the same, although the association argued that there could be some discounting to gain passengers, and that prices were not centrally determined.
Notwithstanding the CFTC’s earlier intervention, minibus fares appear to be the same across different routes in Lilongwe and Blantyre. According to the association, this is the result of competition and a function of various other features of the market. First, new operators in the market are said to observe what other operators are charging and will align their pricing accordingly. Second, some operators do apparently charge higher rates in the market, particularly during peak hours. Furthermore, operators are free to adjust their own prices when there are fuel-price increases, although the association stated that most do not adjust prices in response to minor shifts in the fuel prices, which is a key cost-driver for them.
The association also noted that ‘call boys’, located at depots, dictate terms when it comes to the prices and loading of passengers, which

383
c o m p e t i t i o n a s s e s s m e n t i n m a L a w i t r a n s p o r t s e c t o r
operators have not been able to address. This practice appears to enforce a particular price in the market. Furthermore, for most commuters within cities, particularly over short distances, minibuses are one of the few options for reaching different destinations.
Buses
Large buses in Malawi typically operate longer distance routes between the main towns and cities and are, thus, distinct from the services of the minibuses. The bus subsector in Malawi consists of around 80 companies, including a few large fleet operators, and companies that may have only one or two buses on Malawian routes.
Generally, the market for bus services has three main segments: (1) the high-end or executive coach services, (2) the deluxe or mid-range services, and (3) the lower-end or commuter services. Features of the executive coach service include non-stop travel between cities, hostesses, drinks and snacks, greater leg room, toilet facilities and entertainment such as movies. The main rivals operating in the segment include the National Bus Company, Premier Bus Services and Ampex. Fares for this category ranged between K8 500 to K9 500 for travel between Blantyre and Lilongwe. Rivals monitor one another closely in this market and offer similar services and packages.
In the deluxe segment, routes may include a few short stops, covering a wider passenger catchment area than only the two main cities of Blantyre and Lilongwe. Available amenities on this service are generally less than those in the executive coach segment. The fares charged for a journey from Blantyre to Lilongwe (with stops) were approximately K6 000, and operators included Ampex, Premium Bus Services, National Bus, UDK, Cititours, Zonobia and Matours Bus Company.
The commuter buses operate on routes between the main trading towns and extend to rural areas. All the dominant companies that offer executive coach and deluxe services also offer commuter services. The smaller players compete with them. Bus fares in this category are around K3 500 for a journey beginning in Blantyre and terminating in Lilongwe. These operators use queuing systems at bus terminals and the

C o m p e t i t i o n a n d R e g u l a t i o n f o R i n C l u s i v e g R o w t h
384
bus only leaves the terminal or depot once it is full, which may imply long waiting times for customers. One important aspect is that customers tend to choose those buses that are nearest to being filled at the depot; and there may be three or four buses parked in the front of the queues from which customers can choose.
In both deluxe and commuter bus categories, the operators are scheduled to use the bus terminals existent in all major cities. Surprisingly, these terminals are controlled by the National Bus Company, which is also an operator in all segments of the big bus subsector. The competitors are of the view that the way the company manages the terminals, queues and the queuing charges (equivalent to one passenger’s fare to the final destination of the bus) are designed to limit competition in favour of itself.
The controlling of key infrastructure by the National Bus Company and its jurisdiction to collect queuing fees from fellow competitors appear to distort competition in the big bus passenger subsector (deluxe and commuter segments). This has forced some buses to operate outside of the terminal in Blantyre as a result of disputes over access. Since these buses do not drive around the cities seeking out customers, having access to a passenger depot is important. These developments call for the CFTC to investigate issues of access to depots and terminals. One way would be to assess the rates charged by the National Bus Company for access to the facilities to see how these relate to the charges, if any, that the company applies to its own vehicles.
Taxis
Taxi services were not assessed in detail. However, it is clear from the available information that the association of taxi operators, in cooperation with tourism and airport authorities, has agreed flat rates that are charged for major routes within cities and from the airports to the inner city. This raises obvious competition concerns regarding possible cartel conduct.

385
c o m p e t i t i o n a s s e s s m e n t i n m a L a w i t r a n s p o r t s e c t o r
COMPETITION ANALYSIS OF PASSENGER AND FREIGHT TRANSPORTATION BY RAIL
Rail transport services in Malawi are provided by one operator –Central and East African Railways (CEAR). Rail in Malawi is currently undergoing a revival under the 20-year concession agreement with CEAR signed in 1999, which includes additional investment in infrastructure. A further 30-year concession agreement and the MoU signed with Vale Logistics Limited in 2011 aims to develop the Nacala Corridor to facilitate both passenger and goods transportation to the port in Mozambique. The project included the construction of a new line connecting Moatize coal mine in Mozambique with Nacala port through Malawi (JICA, 2012).
Prices for rail transport from Nacala port to different cities in Malawi indicate that rates going to the port (export rates) from Malawi tend to be lower than rates coming to Lilongwe and Blantyre from Nacala (Table 12.3). As with road freight, the differential may reflect the trade imbalance where the demand for imports and their transportation is higher than for exports. Comparison with rates from an earlier study (JICA, 2012) indicate that the rates have increased significantly over three years.
The increases by CEAR are attributed to the need to recoup investments made, particularly in higher-specification trains, as well as the cost of diesel fuel. It is anticipated that the increased investment will draw customers from the share held by road transport given constraints in the overall trade volumes. The types of customers that are likely to be attracted by an improved rail offering are sugar exporters and fertiliser importers. In effect, rail is a natural monopoly and plays a role in regulating and constraining market power while ensuring return on investment. There is some competition between rail and road for the carriage of goods in practice and some customers report that they are beginning to split loads between road and rail.

C o m p e t i t i o n a n d R e g u l a t i o n f o R i n C l u s i v e g R o w t h
386
Table 12.3: CEAR rail transportation rates (US $) for main routes, 2015
Source: CEAR, and authors’ own calculations
Note: Rate for a 12.2-metre container (payload approximately 28 tonnes) is used for comparison with the solid bulk ‘light’ rate, which is for loads of no more than 28.5 tonnes. This allows for some comparability between container and bulk rates. Furthermore, this also allows for some comparisons to be made with the rates charged by road transporters, which typically involve transporting similar payloads on approximately 30-tonne flat-bed trucks.
COMPETITION ANALYSIS OF PASSENGER AND FREIGHT TRANSPORTATION BY AIR
The Department of Civil Aviation in Malawi is responsible for the implementation of government policy with respect to aviation, including overseeing the airport operations and regulation of the sector. The facilities at the major airports, on the air side, are managed by the department, which includes management of concession agreements for passenger and cargo handling, navigation and slot allocation, fuel supply, catering and fire services; while the Airport Developments Limited (ADL) handles the land side and manages the infrastructure and buildings, housing, freight tenant leases, and the car park and terminal facilities. It is also a signatory of certain commercial agreements.
On the land side, it appears most services are provided by a single operator or provider, although there is no regulation that stipulates that
Rail distance
Rail container 12.2 m – heavy
Rail solid bulk (< 28.5 t)
Rail solid bulk – JICA (2012)
Nacala to Blantyre 800 3 295 2 228 1 731
Blantyre to Nacala 800 1 912 1 423 884
Nacala to Lilongwe 4 088 2 734 2 230
Lilongwe to Nacala 1 646 1 742 1 121
Lilongwe to Blantyre 883

387
c o m p e t i t i o n a s s e s s m e n t i n m a L a w i t r a n s p o r t s e c t o r
there should be only one provider. Key services are provided through a state-owned concessionaire, Lilongwe Handling Company (LHC). These include passenger and ground handling services. Air Cargo Limited (ACL), which is also owned by the state, deals with cargo handling and mail services under a five-year concession agreement. The agreements held with these entities are usually extended when their term expires, without advertising in some cases for alternative providers to bid.
A commonly stated constraint for airlines and service providers in Malawi’s main airports is that demand in terms of the volumes of air traffic to and from Malawi for both cargo and passenger transport is low. This means that the volumes handled are so limited that it would not be feasible to have multiple operators providing any given service, bearing in mind that investments in the air industry tend to be bulky and expensive, thus requiring high economies of scale to be viable.
Fuel supply for the main airports appears to be the only service that is provided by a private concessionaire not linked to government. Puma Energy is responsible for the supply of fuel to the Kamuzu and Chileka international airports under five-year agreements, and the company owns the requisite infrastructure such as tanks and piping. The ADL has sought to bring in rival suppliers. About two years ago, Total looked into entering the market to supply jet fuel in Malawi. However, the firm was apparently deterred by the fact that they would have to invest in their own additional infrastructure, an investment they could not justify given the level of traffic. The outcome is that the price of jet fuel is said to be one of the highest in the region, and airlines have expressed concerns about this.
Overall, the arrangements by which a single operator is responsible for supplying a particular service, particularly state-owned entities, necessitate a cautious approach to regulation. As stated earlier, since this industry exhibits natural monopoly characteristics, it is critical that regulatory oversight is effective, but ensuring that the provider has sufficient incentive to maintain high levels of performance at prices that bear a reasonable relation to costs. This extends beyond the standard fees and tariffs charged by the department in this case, such as landing and

C o m p e t i t i o n a n d R e g u l a t i o n f o R i n C l u s i v e g R o w t h
388
air navigation fees, parking and security tariffs, and passenger services taxes. The oversight should also ensure that the various concessionaires charge fees that can be justified by their costs and encourage profit maximisation through minimising costs rather than charging monopoly rents (Mondliwa and Roberts, 2013).
Passenger transportation
As of 2016, there were six airlines operating international (regional) route-pairings that included one of the main airports in Malawi, namely, Malawian Airlines, Ethiopian Airlines, Kenya Airways, South African Airways (SAA), Proflight and Fastjet. The entry of the latter two regional low-cost carriers (LCC) has been significant in providing consumers with alternatives in the market, often with lower fares. For instance, the entry of Malawian Airlines and Fastjet triggered a huge fare reduction by the main historic players, such as SAA and Kenya Airways.
Competition in Malawian air travel must be viewed in the context of regional rivalry between carriers, given an especially small local market in Malawi. An important requirement is to make sure that entry requirements for new entrants are, as far as possible, simple and relatively affordable to comply with in a reasonable period of time. At present the department’s process for the registration of new airlines in Malawi includes acquiring an air service licence, an air operator’s certificate, financial evaluation, airline experience, a suitable level of available personnel and the overall business plan of the applicant. Several of these requirements are statutory or subject to international conventions and, as such, cannot be sidelined.
Freight transportation
Currently, international air cargo services are provided by SAA, Kenya Airways and Emirates for heavy cargo. There are also specialised cargo carriers operating in the market – such as DHL. Limited cargo can be carried in passenger planes and the majority of cargo is transported by road, at least within the region. Dynamics in the market for cargo

389
c o m p e t i t i o n a s s e s s m e n t i n m a L a w i t r a n s p o r t s e c t o r
transportation are influenced by the capacity of airlines to carry cargo and by the rates they charge.
Rates for cargo transportation are recommended by the International Air Transport Association (IATA) although several airlines undercut this rate and offer different rates in the market. As in road transport, rates tend to be asymmetric on inbound versus outbound routes. One example given is that the general cargo rate to London from Malawi is around US $4/kilogram while the inbound rate from London is approximately US $10/kilogram or more.
Rivalry in air transport cargo requires openness in terms of maintaining low barriers to entry for carriers wishing to operate on these routes. Regulators are required to balance the interests and incentives of private investors and the state as shareholders of an airline (Malawian Airlines), versus those of the public at large as actual (and potential) customers of air travel in Malawi – to the extent that increased regional rivalry brings down transport costs for consumers. Regulators also need to ensure that entry to this market by airlines is not impeded by regulation that is unduly onerous or restrictive. To the extent that this is possible, the CFTC should involve itself in the process of improving regulations in this regard.
INLAND WATER TRANSPORT
Lake Malawi is an important route for inland water transportation in Malawi as it borders Malawi, Mozambique and Tanzania. It has four operational ports, namely Chilumba, Nkhata Bay, Chipoka and Monkey Bay. All these ports can be accessed by road, while Chipoka is the only one with links to the railway system.
Service delivery at these facilities is maintained by private enterprises. Malawi Shipping Company (MSC) is responsible for shipping services while Malawi Ports Company (MPC) is responsible for the management of the four ports (Ministry of Transport and Public Works, 2015). Both MSC and MPC operate under a 35-year concession agreement and are owned by the same majority shareholder, which raises serious questions about whether they compete with each other. MSC is

C o m p e t i t i o n a n d R e g u l a t i o n f o R i n C l u s i v e g R o w t h
390
the only provider of floating deck maintenance facilities, that is, dry dock vessel maintenance on the lake. There are also Mozambican and Tanzanian vessels operating on the lake that make use of MSC maintenance facilities.
To access various port services, operators pay fees, including berthing fees, storage fees, parking fees, and fees for the provision of water and electricity to MPC. Fuel is provided at the ports by different fuel companies, including Total and Puma Energy.
Freight transportation
Marine vessels are licensed to operate on different routes along the lake by the Department of Marine Services. Some vessels are restricted to a radius around a particular port on the basis of vessel capacity, the availability of safety equipment, the sanitary facilities and the navigational equipment with which the vessel is equipped, and catering capacity, among other factors. Not all vessels are licensed to travel across the lake to Mozambique or Tanzania – currently a Mozambican-registered vessel is permitted to cross the lake on the basis of an agreement between the governments of these countries. The agreements are tied with cabotage restrictions, although there are some allowances in terms of a certain volume of cargo or passengers given the lack of capacity in terms of vessels between the three countries to meet demand. Currently MV Chambo holds the rights for this form of cabotage.
The main cargo vessels operating on the lake are owned by MSC and it has no significant competitors in terms of the operation of cargo vessels. The main cargo route for the MSC vessels terminates at Chipoka, which connects to both rail and road networks that allow for connections to Lilongwe, Blantyre and Nacala.
The MSC’s three main cargo vessels – Katundu, Karonga and Viphya Tug/Pontoon – together account for approximately 70 per cent of the capacity on the lake, measured in terms of vessel load capacity. The main MSC container vessel, MV Katundu, handles 750 tonnes; MV Karonga can handle approximately 300 tonnes and Viphya Tug, a third barge and tug vessel, can load approximately 600 tonnes. Most small-scale rivals

391
c o m p e t i t i o n a s s e s s m e n t i n m a L a w i t r a n s p o r t s e c t o r
operate passenger and not cargo vessels on the lake. There are only a few other small vessels involved in the transportation of light cargo, as well as those such as MV Illala which can carry both passengers and cargo.
Fares charged by the MSC for cargo services are determined by the company, although they do notify the ministry when changes are proposed. It appears that MSC has the advantage of a economies of scale as the only operator and has the scope to reduce its fees.
Passenger transportation
The MSC faces some competition from small vessel operators in passenger transportation. According to the department, the MSC has lost customers in recent times to smaller passenger vessel operators that charge lower fares on the same routes. The MSC has the advantage of economies of scale as the major operator, which gives it scope to reduce its fees, and it has responded to competition in the market through its pricing. This demonstrates the importance of reducing barriers to entry to encourage rivals so that passengers can benefit from lower prices, including from incumbents.
Competition probably takes place in localised geographic markets surrounding the major inland ports. While the current levels of competition may be undermined by the fact that the MSC is both an operator and a provider of key services and infrastructure in the market, there does not seem to be cause for further intervention in terms of passenger transportation on the lake. It may suffice for the authorities to ensure that the terms and rules of access granted to rival operators, particularly small operators, are no less favourable than those which the MSC applies to its own vessels, unless reasonable cause can be shown for any differentiation. This would require an assessment of the current terms of access of each operator to key services in the market, and of any issues or complaints that have arisen regarding the quality of access or denial of access that has prejudiced rival operators.
Provision of shipping and port services on Lake Malawi
Competition concerns in port services relate primarily to the manner

C o m p e t i t i o n a n d R e g u l a t i o n f o R i n C l u s i v e g R o w t h
392
in which the concessionaire is regulated to ensure that rivals are not impeded from entering or competing across the various services provided. Given the high fixed cost of port facilities, as well as vessels, and low passenger and freight volumes on the lake, it is not surprising in this type of market to find only a few players (or even a single player) involved in providing maintenance services, for instance, a floating dock. In theory at least, this is needed for operators to be able to achieve economies of scale and sufficient returns on their investments.
The entry of alternative service providers of port and shipping services may not serve the intended purpose in any event as it appears that MSC’s customers, such as cargo vessel operators wishing to access different ports, are not likely to choose the port that they will use on the basis of it being the most cost effective or efficient service provider. Their choices are more likely to be made on the basis of the vessel’s licensed routes and, importantly, the destination port of the cargo.
Specifically, rivalry could be stimulated if new service providers were allowed to enter and were given an assurance that if they performed well in a particular period at a port, they would earn the right to operate at another port in subsequent periods. This could generate quality-based competition with incentives for providers to maintain high efficiencies and safety records, which are important given that price is not likely to be the most critical factor in an operator’s choice of ports.
This scenario implies a greater role for the department in regulating aspects of the concessionaries market conduct that could affect the potential for greater rivalry, which is a key objective of the department. The regulators should also ensure that the MSC charges fair prices and provides standard maintenance services to its competitors. The MSC’s ability to manipulate rival access is likely to affect their rivals’ costs or reduce their revenues, which is consistent with prohibited practices under section 33 of the Competition and Fair Trading Act as it is concerned with the refusal to deal.
CONCLUSION AND RECOMMENDATIONS
A number of conclusions can be drawn from this study. Increased

393
c o m p e t i t i o n a s s e s s m e n t i n m a L a w i t r a n s p o r t s e c t o r
competition does bring benefits in terms of improved services and lower prices. However, there are areas of transport services where natural monopoly characteristics mean that regulation is required. Regulators also have an important role to play in ensuring that potential entrants are not unnecessarily impeded by incumbents and that rules do not foster collusion. As such, this chapter provides important insights which point to the role of competition alongside effective regulation in improving market outcomes in a developing country context. It highlights that the sector is one to which competition authorities need to pay attention.
In road freight, which is the single most important for the Malawian economy, the greater number of competitors has not resulted in the more competitive pricing that one would expect. There are also indications of the coordinated conduct facilitated by associations in freight forwarding or brokering, such as the CAFAAM and the ICCFA, who were involved in agreeing tariffs. The CFTC should investigate and take necessary the measures to curb this apparent cartel conduct.
In road passenger transport, there are also a number of concerns. In bus transportation, the ability of the National Bus Company to leverage its control over access to key infrastructure to the disadvantage of its rival operators is an issue, which relates also to the role of national and local government in setting the rules for the management of terminals. There are also concerns in the taxis industry, where operators, in cooperation with tourism and airport authorities, appear to have agreed charges on services to and from the airports.
There are natural monopoly features in rail and marine transportation, as expected. The competition authority has an important role to engage with the responsible regulators to ensure that the terms and conditions of access to key infrastructure by the concessionaires are fair and that market power is not abused.
In air transport, there are similar concerns about the extent to which monopoly concessionaires in airport services can exert market power. It is important to ensure that the terms of access to various facilities are fair, including prices that reflect costs and not monopoly mark-ups. There has been little competition between airlines but this has improved.

C o m p e t i t i o n a n d R e g u l a t i o n f o R i n C l u s i v e g R o w t h
394
Here, policy and regulations (including those on bilateral agreements) should allow for more airlines, particularly smaller ones, to enter the Malawian market.
REFERENCES
Bingandadi, L (2011) Presentation on progress and status of implementation of road infrastructure, transport and traffic sector policies, legal, regulations, technical standards in SADC. Presentation for the USAID trade hub workshop on the road freight transport services sector in the SADC, 27–28 September 2011.
Helema, I (2015) Malawi’s fuel price world’s highest, The Nation, 29 January. Available at: http://mwnation.com/malawis-fuel-price-worlds-highest/ [Accessed 25 April 2017].
Japan International Cooperation Agency (JICA) (2012) Draft Final Report: Project for the study on development of the Sena Corridor in the Republic of Malawi.
Lall, S, Wang, H and Munthali, T (2009) Explaining high transport costs within Malawi: Bad roads or lack of trucking competition, World Bank Policy Research Working Paper No. 5133.
Mondliwa, P and Roberts, S (2013) Concept Paper: Reviewing regulation and regulators in the context of economic development in South Africa.
National Transport Policy, Malawi, 2004Ncube, P, Roberts, S and Vilakazi, T (2015) Competition in the SADC road
freight sector: A case study of fertilizer transportation in Malawi, Tanzania and Zambia. CCRED Working Paper No. 3/2015.
Ministry of Transport and Public Works (2004) Malawi National Transport Policy, Ministry of Transport and Public Works.
Ministry of Transport and Public Works (2015) Malawi National Transport Master Plan Final Report, Ministry of Transport and Public Works.
Teravaninthorn, S and Raballand, G (2009) Transport Prices and Costs in Africa: A review of the main international corridor. Washington DC: World Bank.
Ward, N and Barreto, E (2011) Technical Report: Road freight transport services diagnostic study. Gaborone: USAID Southern African Trade Hub.
World Bank (2015) Malawi Economic Monitor: Managing fiscal pressures. Washington DC: World Bank.
395
s p e c t r u m p o L i c y f o r c o m p e t i t i o n a n d d e v e L o p m e n t
13
Spectrum policy for competition and development: A comparative study of approaches and outcomes in Africa
Genna Robb
INTRODUCTION
As the demand for mobile broadband grows, so too does the demand for radio frequency spectrum. The greater the volumes and speed of data being transmitted over mobile networks; the more spectrum operators require. In many countries, this has led to the demand for spectrum from mobile operators outstripping its supply. ‘Market-based’ mechanisms for spectrum management, such as spectrum auctioning, pooling, leasing and trading, have been hailed as the solution to this problem, as they put a market-related value and opportunity cost on spectrum, such that it is more likely to find its way to those users who will use it most efficiently. Auctions are also more transparent and less vulnerable to lobbying than the more traditional beauty contest approach.
Over the course of 20 years, spectrum auctions have evolved from a relatively simple means of price discovery into complex processes, which attempt to meet a wide range of objectives, some of which can be conflicting. Revenue generation and efficiency are generally of concern and in theory should be well-aligned, as the operator who is prepared to pay the most for the spectrum should have the highest valuation for it. However, authorities in search of high auction revenues may be

C o m p e t i t i o n a n d R e g u l a t i o n f o R i n C l u s i v e g R o w t h
396
tempted to set high reserve prices, which could deter or, in extreme cases, prevent participation.
Another important concern, which has been increasingly taken into account when designing spectrum auctions, is the need to ensure that they promote rather than stifle competition. This can conflict with revenue generation goals since the firms that are able to bid the highest for spectrum are usually the largest operators, so auctions that generate high spectrum prices may exclude smaller players. Measures to ensure competition is not harmed include auctioning spectrum in small lots, spectrum set-asides for new entrants and spectrum caps to ensure that no operator is able to monopolise access to spectrum in a particular band or across bands. These have been used with varying success internationally.
In Africa, relatively few countries have implemented market-based mechanisms for spectrum assignment (spectrum auctions have been held or proposed in Senegal, Nigeria, Ghana, Mozambique and South Africa). Only a handful of countries have licensed spectrum in the 700/800 megahertz and 2 600 megahertz bands which have been identified as ideal for ‘4G’ or LTE networks. Therefore, most countries in Africa still have to determine how best to go about assigning this new and valuable spectrum for mobile use. Competition concerns are highly relevant, as many countries have relatively uncompetitive mobile markets, dominated by one or two large incumbents. In this context, lessons from past experience can be useful to help in the design of spectrum assignment processes in order to balance competing objectives and avoid the possible pitfalls.
This chapter reflects on the theory and experience with different mechanisms for spectrum assignment to provide insights into how the available approaches can best be adapted to the relevant context. It provides a brief discussion of the economics of market-based mechanisms for spectrum assignment before presenting a review of international experience, which focuses on the success of the various approaches in meeting different objectives, particularly the promotion of competition. The chapter then reflects on past spectrum assignments in Africa –

397
s p e c t r u m p o L i c y f o r c o m p e t i t i o n a n d d e v e L o p m e n t
particularly on how and where 4G spectrum has been assigned – before considering the African experience and contrasting the competition outcomes across the five countries that have attempted a spectrum auction. Finally, it concludes with recommendations for best practice in the future assignment of spectrum.
OPTIONS FOR SPECTRUM ASSIGNMENT: THE ECONOMICS OF MARKET-BASED MECHANISMS
Mobile operators require access to spectrum in order to be able to operate their networks. Different frequencies have different characteristics and there are specific frequency bands which have been earmarked internationally for mobile use. The number of such bands has increased over time as mobile operators have faced increasing demand for services, particularly high-speed broadband services. How the identified mobile bands should be divided up and assigned to particular operators has been the subject of debate and the approaches taken have changed over time.
The Federal Communications Commission (FCC) in the United States first licensed spectrum for mobile use through an auction process in 1994, with the UK’s Ofcom following suit with its 3G auction in 2000. Since then, auctions have become the most common means of assigning spectrum, due to their attractive characteristics. A well-designed auction is likely to be efficient, which is why they are generally favoured by economists (Cramton, 2002). An auction should ensure that there is price discovery, even where the regulator has imperfect information on how operators value the spectrum. This ensures that spectrum goes to the market participants that will use it most efficiently. In theory, auctions also provide an equal opportunity for all potential market participants to acquire spectrum. In short, ‘the most beneficial advantages of auctions have been their transparency, for all stakeholders, in arriving at explainable outcomes and using the market’s knowledge to arrive at a better appreciation of the value of spectrum’ (OECD, 2014).
On the other hand, beauty contests (the usual alternative to market-based mechanisms where the government or regulator decides which
C o m p e t i t i o n a n d R e g u l a t i o n f o R i n C l u s i v e g R o w t h
398
operators will be assigned spectrum, based on a set of criteria) tend to be slow and wasteful and vulnerable to lobbying by market participants (Cramton, 2002). They also lack transparency around why a particular applicant has been chosen over another and the regulator with imperfect information may not be able to identify the ‘best’ potential licensee. For these reasons, auctions have become a popular mechanism for allowing the market, instead of policy-makers, to determine the best assignment of spectrum and ensuring that operators pay a market-related price for the valuable resource.
While under the right circumstances, auctions can be extremely efficient, there are also ways in which they can give rise to competition concerns. Where there is one or more large incumbent, there may be a concern that the ‘deep pockets’ of these operators will advantage them at the expense of entrants, or even allow them to manipulate the auction process to exclude entrants and smaller rivals, for instance, by buying up all the spectrum and leaving none for competitors. Operators may also have an incentive to collude to divide the spectrum among themselves while paying a lower price than if they were to participate in a competitive manner. A well-designed auction should account for these possibilities and aim to encourage all operators to compete and invest in improving the quality of their service to gain more market share (Cramton et al, 2011). However, this can be difficult to achieve in practice.
As alluded to earlier, a regulator has a number of objectives when conducting a spectrum auction. The regulator aims to facilitate price discovery and ensure the spectrum is ultimately assigned to operators that will use it efficiently. At the same time, it must pay attention to preventing collusion and attracting entrants to the process. There may also be public service obligations around coverage and access, which the regulator must consider. From a pure competition perspective, the success of an auction is determined by its ability to achieve competitive outcomes and to attract a number of players, ideally including new entrants, to the auction. There have been attempts to design different auction mechanisms that can more effectively and simultaneously

399
s p e c t r u m p o L i c y f o r c o m p e t i t i o n a n d d e v e L o p m e n t
meet multiple objectives (such as effective price discovery, enhanced competition, investment incentives and public interest objectives). This has resulted in auction design becoming more complex over time.
There are two main categories of auction. The first is the ascending auction in which the price of the product rises as competitors bid. The final price is determined when there are no more bids offered. This can be either a simple or simultaneous round auction in which either one or several spectrum packages are auctioned at the same time. The main advantage of ascending auctions is that the process is transparent and that the spectrum is likely to be awarded to the bidder who values it most. However, this approach can tend to favour large operators with deep pockets. Ascending auctions can deter entrants from participating as they believe they will not be able to out-bid large incumbents. This will have the effect of lessening the competitiveness of the auction. For this reason, regulators may decide to auction several similar packages of spectrum at the same time and apply spectrum caps to prevent excessive spectrum concentration.
The transparency of ascending auctions can also create another problem, as it makes it relatively easy for operators to collude. Bidders can signal to others during early rounds which packages they prefer and then punish firms that do not comply by bidding up the price on those packages they know the deviating firm prefers (Klemperer, 2002).
The second category is the sealed-bid auction, in which bidders anonymously make final price offers for spectrum. The benefit of this method is that it is difficult for the bidders to collude as there is little opportunity to signal to each other their preferences. It also provides little opportunity for the incumbents to punish non-compliant firms. New entrants are also more likely to participate as they have a higher chance of being successful. This means that the final price may be lower than it would under an ascending auction, which must be traded off against the possible competitive benefits of the approach.
Hybrid auctions can also be developed in which elements of more than one auction type are used, such as a hybrid of the ascending and sealed-bid auctions (called an Anglo-Dutch auction). In this case, an

C o m p e t i t i o n a n d R e g u l a t i o n f o R i n C l u s i v e g R o w t h
400
ascending auction is used until a small number of bidders remain and thereafter the sealed-bid auction is used. The sealed-bid auction stage creates uncertainty about the identity of the eventual winner, which makes the auction more attractive to entrants, and makes it difficult for any collusion to take place. An Anglo-Dutch auction is more efficient than a pure sealed-bid auction due to the ascending stage of the auction.
What is clear from this is that the most appropriate type of auction will differ depending on the context and the objectives to be achieved, and that careful design is necessary to meet these requirements. In the following section, we consider international experience with spectrum auctions and competition.
INTERNATIONAL EXPERIENCE WITH MARKET-BASED MECHANISMS AND COMPETITION
A number of 3G auctions1 took place in Europe in the early 2000s, beginning with the United Kingdom in 2000. The different approaches taken in these auctions and the results achieved provide a number of useful insights in terms of auction design. The UK market at the time consisted of four incumbent mobile operators, and five licences were made available by auction, with no bidder allowed to purchase more than one licence. Sharing of licences between two or more bidders was also prohibited. The fact that one more licence was offered than existing incumbents meant that entrants were encouraged to participate as they had a realistic opportunity to win the last licence. A total of 13 operators participated (the highest number of bidders in any of the European auctions that took place during this time), nine of which were entrants. In this context, an ascending auction was less problematic from an entry-deterrence perspective and the auction appears to have been successful in generating competition and encouraging entrants and smaller firms to participate. However, as this was the first auction in Europe, the auction benefited from considerable uncertainty around operators’ spectrum valuations, which may have enhanced the competitiveness of the process.
The Netherlands auction took place two months after the UK auction,

401
s p e c t r u m p o L i c y f o r c o m p e t i t i o n a n d d e v e L o p m e n t
but was not so successful. The Netherlands followed the ascending auction design used in the United Kingdom and also offered five licences, although in a context in which there were five strongly established incumbent operators. Only one entrant competed in the process and it dropped out a week prior to the auction following threats of legal action from one of the incumbents. The remaining entrants partnered with the incumbents rather than bidding independently. Klemperer (2002) argues that an Anglo-Dutch auction would have worked better in this case as the uncertainty of the sealed bid stage would have drawn more entrants. The bidders would have also bid higher prices, knowing that they faced greater competition from these entrants.
The Italian auction which took place in October 2000 attempted to modify the UK design by stating that if there was a greater number of licences than serious bidders, the regulator would reduce the number of available licences. Six bidders entered the auction but one dropped out two days before it. Arguably, it was too clear in advance which operators would win the licences, and so entrants were deterred and encouraged to partner with incumbents rather than compete with them. Competition, in this case, was not robust and revenue received from the process was less than the amount anticipated by the government; only slightly above the reserve price.
In Switzerland, an ascending auction was used to sell four licences. There was significant interest initially but the number of bidders reduced, possibly deterred by the larger resources of the stronger players. To encourage entrants, the government allowed for joint-bidding, which had the effect of reducing the bidders to only four. Having set the reserve price low, the auction brought a fraction of the anticipated revenue and was uncompetitive.
What is apparent from these experiences is the importance of getting the right design for each auction, bearing in mind the structure and economic circumstances in each country at the time of the auction. Achieving the goals of encouraging entrants, reducing the likelihood of collusion and ensuring that a market-related price is ultimately determined requires careful balancing.
C o m p e t i t i o n a n d R e g u l a t i o n f o R i n C l u s i v e g R o w t h
402
There are a number of ways in which auctions can be designed to promote procompetitive outcomes. To reduce the ability of firms to collude, regulators can restrict bidders to bidding only round numbers to reduce the chance of them signalling their preferences to one another. Past auctions have shown that some operators use the last digits of the bid amount to signal lot preferences (Klemperer, 2002). Anonymous bidding keeps the number of bidders confidential to increase uncertainty among the bidders and, thus, reduce the ability to collude. The lots sold at auctions can also be disaggregated to reduce the possibility of collusion. Where lots are particularly large, operators may collude to acquire the lot and thereafter split it between themselves (if this is permitted from a regulatory perspective).
Spectrum caps protect competition by limiting the amount of spectrum that one operator can hold, thus ensuring that operators cannot monopolise or hoard scarce spectrum resources. They have been used in a number of countries (OECD, 2014) and may be either band specific and/or cap the overall amount held. For instance, an Austrian multiband auction that took place in October 2013, limited the amount of spectrum a participant could win to no more than 2x35 megahertz of spectrum in bands below 1 gigahertz, 2x20 megahertz in the 800 megahertz band and 2x30 megahertz in the 900 megahertz band. Additionally, the total spectrum any one operator could win was 2x70 megahertz (GSMA, 2015). Arguably, this cap was too weak, potentially allowing a single operator to obtain over half of the available sub-1 gigahertz spectrum and two operators to acquire all the spectrum on offer (Frontier Economics, 2014). As of 2015, in India, no operator can hold above 50 per cent of spectrum in any frequency band or more than 25 per cent of the total spectrum available (Economic Times, 2015).
In considering how to assign portions of 800 megahertz and 2 600 megahertz spectrum, Ofcom (the UK regulator) considered the impact of the assignments on competition (Ofcom, 2012). It was aware that that spectrum is a critical asset for wholesalers and, therefore, the planned assignment of spectrum, which was likely to be the last for the foreseeable future, could have serious implications for competition

403
s p e c t r u m p o L i c y f o r c o m p e t i t i o n a n d d e v e L o p m e n t
in the sector. After applying merger-control criteria to the national wholesale market, Ofcom concluded that, to preserve competition and mitigate any possible negative impacts on consumers, it was important to reach an outcome to the auction that ensured at least four credible national wholesalers: two infrastructure-based wholesalers (Everything Everywhere and Vodafone/O2), and four services-based wholesale players (Everything Everywhere, Vodafone, O2, 3). Arguably, even two wholesale infrastructure players may be too few to ensure robust competition.
To ensure that the auction did not reduce competition, Ofcom implemented a basket of measures, including a sub-1 gigahertz safeguard cap of 2x27.5 megahertz, as well as an overall spectrum cap of 2x10⁵ megahertz per operator. Ofcom considered that, in this case, spectrum caps would help to ensure that a sufficient number of independent spectrum licence holders could compete in the UK mobile market. Reserve prices would be set by reference to estimated market value with a discount. Finally, one spectrum portfolio would be reserved for a fourth national wholesaler.
The use of spectrum caps has become less popular and some have even been removed as additional spectrum is allocated for mobile and assigned. In the United States, the FCC decided to eliminate the use of spectrum caps in 2003, with the option to reinstate them if required in particular cases. The decision was made to promote greater spectral efficiency as a smaller numbers of operators with larger proportions of spectrum are able to take advantage of economies of scale and may, therefore, invest more (Moore, 2010).
As also highlighted by Ofcom, in the light of the emerging demands for wider channel bandwidths for Long-Term Evolution (LTE) services, it may result in higher efficiency to assign larger portions of spectrum to a smaller number of operators, as long as this does not result in a lessening of competition. If competition is reduced, however, this may be counter-productive since operators face less incentive to invest and lower prices to customers.
An alternative to spectrum caps can be to set aside spectrum for
C o m p e t i t i o n a n d R e g u l a t i o n f o R i n C l u s i v e g R o w t h
404
new entrants. This may attract more bidders to the auction and, hence, generate higher revenues (Cramton, 2002). In the United Kingdom, in a 3G auction described earlier, the licence that held the largest amount of spectrum was set aside for an entrant. Canada has also taken this approach, with some success. In March 2015, the authorities announced a plan to auction spectrum for Advanced Wireless Services (AWS) in the bands 1 755–1 780 megahertz and 2 155–2 180 megahertz, setting aside 60 per cent of the total 50 megahertz available for companies that were already providing wireless services but with less than 10 per cent of national market share and less than 20 per cent of market share by province. A sealed-bid auction was used and the spectrum packaged into blocks. A new entrant, Wind Mobile, paid the reserve price for the spectrum and was able to extend its holdings by 180 per cent (Industry Canada, 2015).
Set-asides are not without their challenges. In Ghana, in 2012, the National Communications Authority (NCA), in alignment with the government’s local content policy, awarded Broadband Wireless Access (BWA) licences in the 2 600 megahertz spectrum band exclusively to three wholly Ghanaian-owned companies – Surfline Communications, Blu Telecoms and Goldkey Telecoms – at a cheaper price of US $6 million, compared to the US $25 million at which the 2G and 3G licences had previously been sold. Of the three operators, only two are still operational and they have been slow to deploy 4G services. By contrast, MTN Ghana, the dominant player in the market, was able to provide 2G and 3G services to the whole country within the prescribed period (Ametorgoh, 2015). The United Kingdom has also had a problematic experience with set-asides for entrants, including bankruptcy and delays in using spectrum – a risk when dealing with smaller players (Cramton, 2002). These examples highlight the risk of using a set-aside policy.
Another approach to lowering barriers to auction participation for new or smaller players is to offer the spectrum for sale in smaller packages in a so-called package clock or combinatorial clock auction. This makes it more affordable for smaller firms to acquire spectrum, and allows larger firms to bid for a number of packages to create a larger overall

405
s p e c t r u m p o L i c y f o r c o m p e t i t i o n a n d d e v e L o p m e n t
assignment. Firms may bid on generic small lots (say 2x5 megahertz), and then the assignment of particular channels to specific operators would happen at a later stage, such that the spectrum purchased can be assigned as efficiently as possible (Cramton, 2013). Spectrum caps are a useful complement to this type of auction, to ensure that larger firms do not buy up a large proportion of the available spectrum. This approach has advantages in that it does not rely on the regulator to decide what packages will be attractive to operators, but allows the auction to facilitate the makeup of packages. It also avoids the potentially inefficient setting-aside of spectrum to be assigned to firms that will not make good use of it, while still providing smaller firms with the opportunity to acquire small portions of spectrum. However, it can be complicated to implement.
International experience has, therefore, advanced a number of ways in which spectrum auctions can be designed to promote competition, although in some cases this has to be balanced against what is likely to result in the most efficient use of spectrum. Critically, what will work best depends on the particular market structure and market dynamics, as well as the economic circumstances. Past experience, however, provides a great deal of guidance in terms of the advantages and disadvantages of different approaches, and their potential pitfalls.
Spectrum assignment in Africa
In Africa, most countries have licensed at least the 900 megahertz, 1 800 megahertz and 2 100 megahertz bands to mobile operators. Table 13.1 shows that, in addition to this, seven countries (Ghana, Nigeria, Senegal, Kenya, Rwanda, Tanzania and Uganda) have licensed ‘digital dividend’ spectrum in the 800 megahertz band, two of which (Ghana and Senegal) awarded the spectrum through an auction or partial auction process. Spectrum in the 700 and 800 megahertz band is referred to as ‘digital dividend’ spectrum since it has been made available for mobile use through the migration of broadcasting services from traditional analogue to digital technology. Senegal and South Africa also attempted to license spectrum in the 700 megahertz band through an auction process, but did

C o m p e t i t i o n a n d R e g u l a t i o n f o R i n C l u s i v e g R o w t h
406
not ultimately do so. In the higher frequency bands, Nigeria and South Africa have both awarded spectrum in the 2 300 megahertz band to a single operator, Nigeria via auction and South Africa to the fixed-line incumbent. Ghana, Nigeria and Uganda have awarded spectrum in the 2 600 megahertz band, Ghana and Uganda through a non-competitive licensing process, and Nigeria through another spectrum auction.
The highest price on a US $ per megahertz per capita basis was achieved by Ghana, which awarded 800 megahertz using an auction with a high reserve price and sold only one lot to the largest operator. Senegal also achieved a relatively high price for the 800 megahertz and 1 800 megahertz spectrum, which it licensed to the incumbent operator following an unsuccessful auction. Kenya achieved the lowest (known) price for 800 megahertz spectrum. After initially assigning spectrum in the 800 megahertz band only to the largest operator, Safaricom, the regulator split the available spectrum equally between the three operators (Telegeography, 2015a; GSMA, 2016).The price paid by the Ghanaian operator was four times higher than that paid by the Kenyan operators, but the Kenyan authority was able to award three times as much spectrum as the Ghanaian authority. Prices paid for the higher frequency (2 300 megahertz and 2 600 megahertz) spectrum were generally much lower, possibly reflecting its lower value. Information on the price paid was not available for Rwanda, Tanzania and Uganda.
Table 13.1: Spectrum assignments in Africa
Band Country Details of awardCost (US $ per MHz per capita)
700 MHz
SenegalAttempted to auction 700 MHz but did not ultimately license it
(see below)
N/A
South Africa
Attempted to auction 700 MHz as part of four packages
including 800 MHz and 2.6 Gz, but did not ultimately license it
(see below)
0.08 (based on total spectrum for sale and reserve prices for each
lot)

407
s p e c t r u m p o L i c y f o r c o m p e t i t i o n a n d d e v e L o p m e n t
Band Country Details of awardCost (US $ per MHz per capita)
800 MHz
GhanaAuction – one lot of
2x10 MHz sold0.12
NigeriaUsed for CDMA historically, now being used for LTE as
CDMA operator bought by MTNN/A
800 MHz
SenegalAuction failed, incumbent awarded 2x10 MHz (plus 2x10 Mhz of 1 800 Mhz)
0.08
Kenya2x10 MHz awarded to each
of three operators for US $25 million
0.03
Rwanda
Unclear, but at least one
wholesale operator appears to have been assigned spectrum
Unknown
TanzaniaUnclear, but at least one
operator (Smile) is operating an LTE network on 800 MHz
Unknown
UgandaUnclear but according to
the regulator, 2x30 MHz has been assigned
Unknown
2 300 MHz
NigeriaAuction – 1x30 MHz awarded
to one operator0.004
South AfricaTDD awarded to fixed
line incumbentN/A
2 600 MHz
Ghana, Ghana – awarded to small
operators with limited success0.02
NigeriaAuction – 6 2x5 Mhz lots awarded to one operator
0.01
UgandaUnclear, but according to
the regulator, 2x60 MHz has been assigned
Unknown
Source: Various press reports and author’s own analysis
Note: Spectrum costs in US $/MHz per capita may not be comparable due to differences in assignment, licence term and purchasing power parity, among other factors

C o m p e t i t i o n a n d R e g u l a t i o n f o R i n C l u s i v e g R o w t h
408
Figure 13.1 illustrates the price of the cheapest 1 gigabyte mobile data bundle in a range of African countries. The bars highlighted in black represent countries which have licensed 800 megahertz spectrum. Strikingly, these countries are clustered at the lower end of the chart suggesting that there is a correlation between countries that have licensed spectrum and countries with cheap mobile data. However, in the longer term, spectrum assignments can have an important impact on competition between operators and, hence, on price, quality and investment levels. We deal with the potential competition implications of African spectrum auctions in the next section.
Figure 13.1: Cheapest price for 1GB basket by country, US $ per GB
Source: Author’s own analysis of Research ICT Africa dataset. Available at: https://researchictafrica.net/data/ here
Spectrum auctions and competition
As alluded to earlier, there have not been a large number of spectrum auctions in Africa. Those that have taken place have met with mixed

409
s p e c t r u m p o L i c y f o r c o m p e t i t i o n a n d d e v e L o p m e n t
results. In late 2015, Senegal’s 4G spectrum auction was suspended after the Regulation Authority of Posts and Telecoms (Autorité de Régulation des Télécommunications et des Postes, ARTP) announced that they had received no bids from operators (Telegeography, 2016). The operators boycotted the auction claiming that the reserve price had been set too high, at US $49.86 million. The ARTP registered its concern with the ‘collective and coordinated non-participation of the operators’. Subsequently, the incumbent, Sonatel, was licensed with 2x10 megahertz of 800 megahertz and 2x10 megahertz of 1 800 megahertz for a price of US $53.8 million. The other operators did not receive any spectrum.
As noted above, the Senegalese regulator was able to collect a relatively high price on a per megahertz per capita basis. However, as illustrated in Table 13.1, only 29 per cent of the spectrum on offer was ultimately licensed. In addition, the fact that only the largest operator was able to obtain spectrum could have implications for the ability of its smaller rivals to compete. Figure 13.2 illustrates that, between 2013 and 2016, the market share of Sonatel, in terms of total subscribers, slowly fell as the share of its two rivals increased. This seems to indicate that so far at least, there has not been a negative impact on the ability of rivals to compete (although it is possible that their share could have grown faster had they had access to more spectrum). However, given that the auction was held only in late 2015, it is also likely that 2016 is too soon to see any competition effects of the asymmetric assignment.
From Figure 13.3, we can see that mobile data prices in Senegal fell dramatically between Q3 2014 and Q1 2017, with a fall of more than 50 per cent between Q4 2016 and Q1 2017. As illustrated in Figure 13.1, Senegal now has among the lowest mobile data prices in Africa. We cannot account for all the factors that could have impacted on prices, however, it seems that so far the assignment of spectrum has coincided with a major decline in mobile data prices.

C o m p e t i t i o n a n d R e g u l a t i o n f o R i n C l u s i v e g R o w t h
410
Table 13.2: Spectrum auctions in Africa
Country Spectrum for auction
Auction details Established MNOs and market shares
Auction outcome
Senegal 700 MHz
800 MHz 1 800 MHz
3 2x10 MHz blocks of 800 MHz
4 2x5M Hz blocks of 700 MHz
2 2x10 Mhz blocks of
1 800 MHz
Reserve price of US $49.86
million
Sonatel/Orange – 57%
Tigo – 23%
Sudatel/Expresso
Telecom – 20%
Collective boycott by operators –
possible collusion
Eventually 2x10 MHz of 800 MHz and 2x10 MHz of 1 800 MHz licensed to Sonatel for
US $53.8 million
Nigeria 2 300 MHz 30 MHz nationally
Computerised ascending clock
auction
2 prequalified bidders
Reserve price US $23 million
MTN – 39%
Airtel – 23%
Globacom – 23%
Etisalat – 15%
Bitflux purchased the spectrum for US $23.25 million
2 600 MHz 14 lots available MTN acquired 6 lots or 30 MHz
Other operators cited high reserve
price
Ghana 800 MHz Two lots available,
reserve price of US $67.5 million
each
MTN – 50%
Vodafone – 17%
Airtel – 16%
Glo Mobile – 1.4%
Expresso – 0.2%
MTN acquired 1 lot of 2x10 MHz at the reserve price

411
s p e c t r u m p o L i c y f o r c o m p e t i t i o n a n d d e v e L o p m e n t
Source: Various media reports
Nigeria held a spectrum auction in 2016, which attracted only one bidder, MTN. MTN was able to purchase six of the 14 lots at the reserve price of US $16 million per lot, and is to be licensed with 30 megahertz in the 2.5 gigahertz band (Mobile World Live, 2016). MTN is the largest operator in Nigeria with a market share of 39 per cent in terms of subscribers (Nigeria Bureau of Statistics, 2016). It appears that the main reasons for the non-participation in the auction include the reserve price, which may have been set too high – other operators cited this – combined with economic conditions in Nigeria and the cost of rolling out networks (All Africa, 2016a). Again, a substantial portion of the offered spectrum was not acquired and only the largest operator received spectrum in the auction. Compared to Senegal, Nigeria has seen a more extensive reduction in the market share of the largest operator
Country Spectrum for auction
Auction details Established MNOs and market shares
Auction outcome
Mozambique 800 MHz 6 2x5 MHz lots, 1 withheld to
restrict supply Reserve price US $30 million
each
mCel – 29%
Vodacom – 23%
Movitel – 38%
No spectrum was licensed
South Africa 700 MHz, 800 MHz,
2 600 MHz
Multi-round ascending
auction with reserve price and spectrum
cap
Five packages on offer
combining 700/800 MHz
with 2 600 MHz
Vodacom – 43%
MTN – 36%
Cell C – 17%
Telkom Mobile – 4%
Regulator’s ITA challenged by government in courts and
process stopped pending hearing

C o m p e t i t i o n a n d R e g u l a t i o n f o R i n C l u s i v e g R o w t h
412
between 2013 and 2017, largely in response to the expansion of a smaller operator, Globacom. Mobile data prices in Nigeria have also fallen to very low levels.
Ghana held an LTE auction in 2015, which attracted four bidders for the 800 megahertz spectrum. The largest operator with 50 per cent of mobile data subscribers, MTN Ghana, was awarded one of the two lots of 2x10 megahertz (Telegeography, 2015b). The reserve price set was US $67.5 million. The auction and high reserve price were controversial, but after the limited success of licensing 2 600 megahertz spectrum to smaller operators a few years previously (as discussed earlier), the Ghanaian authority may have wanted to ensure the spectrum went to a player that would be able to invest in its network (Ghana Business News, 2017). The Ghanaian auction produced the highest price per megahertz per capita of any of the assignment processes for which we have pricing data. However, again it was only partially successful, assigning only half of the available spectrum and only to the largest operator.
Unlike Senegal and Nigeria, Ghana’s mobile data market shares remained extremely stable between 2013 and 2017, with MTN slightly increasing its market share to over 50 per cent. In spite of this, mobile data prices fell between Q2 2014 and Q1 2017, particularly from Q3 2016 onwards. Ghana now has the third lowest mobile data prices in Africa. This is interesting given that it appears (on the basis of market shares) to be a less competitive market than the other countries discussed so far.
Mozambique attempted to hold an auction for five 2x5 megahertz blocks of 800 megahertz spectrum in 2013 (six blocks were available, but one was withheld to restrict supply) (Song, 2017). The reserve price was high at US $30 million per block or US $0.10 per megahertz per capita. None of the mobile operators chose to participate in the auction and the spectrum was left unlicensed. Like in Ghana, mobile operator market shares in Mozambique have been quite stable over time, with the share of the largest operator, Movitel, increasing slightly. At the same time, mobile data prices have fallen steadily.

413
s p e c t r u m p o L i c y f o r c o m p e t i t i o n a n d d e v e L o p m e n t
In July 2016, the Independent Communications Authority of South Africa (ICASA) published an invitation to apply to participate in a spectrum auction for four predetermined lots of 700/800 megahertz spectrum bundled with 2 600 megahertz spectrum, each with a reserve price of R3 billion or around US $214 million.2 Each operator was eligible to purchase only one lot and there are four existing mobile operators in South Africa. If all four lots had been sold at the reserve price, this would have implied a price per megahertz per capita of US $0.07. The Information Technology Association of South Africa (ITA) was challenged by the Department of Telecommunications and Postal Services on various grounds and it postponed the auction pending a review hearing. The spectrum therefore remains unassigned. One of the reasons the government cited as motivation for blocking the ITA is that the reserve price is ‘onerous’ and would favour large players (All Africa, 2016b). Meanwhile, operators are forced to work within their existing spectrum assignments to provide LTE services.
The market share of South Africa’s largest operator, Vodacom, decreased slightly from 2013 to 2016, while the share of smaller rival, Cell C, increased. Overall, however, the market remains dominated by the large operators – Vodacom and MTN – with Cell C and Telkom Mobile struggling to compete effectively. In terms of pricing, the price of mobile data fell until Q1 2016, before it started to rise again. South Africa has relatively expensive mobile data compared to the other countries in the sample.
It is difficult to draw conclusions from such a diverse set of experiences; however, the discussion does suggest a number of important factors to bear in mind when deciding spectrum policy. Before summarising these, it is important to note that we have presented a rather simplistic overview of competitive dynamics in each country and that there is likely to be a great deal of important nuance relevant to each experience, which we have not been able to cover here. In particular, we have not been able to compile data on the speed and quality of mobile data offerings in each country, which would be an important additional factor to consider when trying to explain the trends observed.

C o m p e t i t i o n a n d R e g u l a t i o n f o R i n C l u s i v e g R o w t h
414
Figure 13.2: Mobile data market shares in Senegal, Nigeria, Ghana, Mozambique and South Africa, 2013–2017
Source: Regulator statistics, operator annual reports, media reports and author’s calculations
Note: Reported shares are based on operator subscriber numbers, except those marked with * which are based on mobile data subscriptions and ** which are based on active mobile subscriber numbers.
In terms of the mechanism for spectrum assignment, it seems that countries that have used an auction approach have generally received higher revenue from the process, but have been able to assign less

415
s p e c t r u m p o L i c y f o r c o m p e t i t i o n a n d d e v e L o p m e n t
spectrum and spectrum has been left unassigned in all cases (again, this is based on a small sample of countries). This is not optimal from an efficiency perspective and may suggest that reserve prices have been set too high in some cases. On the other hand, where spectrum has been assigned on a non-competitive basis at much lower prices, spectrum may have been undervalued to some extent, and, based on the principles outlined earlier, may have resulted in spectrum being used less efficiently than would be optimal. There is a lack of transparency in the assignment process in some cases (Rwanda, Uganda and Tanzania), which makes it difficult to assess the process from a competition perspective. However, mobile data prices in these countries are also low.
Figure 13.3: Cheapest price for 1 GB basket by country, Q2 2014–Q1 2017, US $ per GB
Source: Author’s own analysis of Research ICT Africa dataset, available here
What is clear from the data presented is that countries that have assigned more spectrum (particularly the attractive 800 megahertz spectrum)

C o m p e t i t i o n a n d R e g u l a t i o n f o R i n C l u s i v e g R o w t h
416
seem to have cheaper data prices on average. This is merely an observed correlation, and there could be other factors driving the result, but it does concur with the intuitive argument that regulators should seek to assign as much spectrum as possible to mobile operators (while attempting to do so in a procompetitive way) to bring about increases in the quantity and speed of data, which can be carried on the mobile networks at a lower cost.
What is striking from the examples presented, is that data prices have fallen even where conditions do not appear to be optimally competitive, suggesting either (or both) that market shares are not adequately accounting for competitive conditions in these countries, or that competition is not the only factor driving data prices. Where 4G spectrum has been assigned to one large operator, this does not appear to have had a negative impact on competition or led to higher pricing; however, sufficient time may not have passed in some cases for such effects to be observed.
LESSONS FOR SPECTRUM ASSIGNMENT FOR COMPETITION
It is clear from the discussion that while spectrum auctions are theoretically the most efficient way to assign spectrum, their success or failure is highly dependent on the detail of their design and the context of the relevant market. International experience illustrates that in some instances, auctions are effective at meeting some objectives and not others. The experience of African countries, in particular, suggests that reserve prices may have been set at a high level with the objective of maximising revenue rather than ensuring participation and competition. By contrast, non-competitive assignment may be more effective at ensuring all available spectrum is assigned and shared among operators. However, beauty contests lack transparency, as we have seen in the examples of Uganda, Rwanda and Tanzania, which is also problematic from a competition perspective. Where spectrum has been assigned by non-competitive means, it is also possible that an important national resource has been undervalued.

417
s p e c t r u m p o L i c y f o r c o m p e t i t i o n a n d d e v e L o p m e n t
Where auctions are used in future, it will be important to design the process carefully to promote both competition and price discovery, and particularly to ensure that reserve prices are realistic and do not deter participation and entry. It is also important to balance the encouragement of entry with ensuring spectrum is efficiently used. Ghana’s example illustrates that it can be difficult to achieve both simultaneously. In this context, auctioning multiple small lots and setting affordable reserve prices may be the best approach to optimising participation, while still ensuring an efficient outcome.
The foregoing discussion highlights most critically the importance of licensing as much spectrum as possible to lower operators’ costs and encourage falling mobile data prices. On the face of it, it seems that even where spectrum has been awarded to only one large operator, this has not had an adverse effect on competition. While this may suggest that it does not matter much how you assign spectrum as long as it goes to operators that will use it effectively, for the longer term it is still important to avoid creating positions of entrenched dominance, which will be hard to reverse and may result in undermining gains to consumers. The example of South Africa, with an entrenched duopoly and relatively high mobile data prices, bears this out.
NOTES
1 This section is based on Klemperer (2002), which summarises the details of a number of 3G auctions between 2000 and 2002.2 Government Gazette No.40145, 15 July 2016.
REFERENCES
All Africa (2016a) Nigeria: The untold story of NCC’s 2 600 MHz spectrum auction, 20 October 2016. Available at: https://allafrica.com/stories/2016 10200936.html [Accessed 20 December 2018].
All Africa (2016b) South Africa: Why Minister Siyabonga Cwele is suing ICASA, 11 August. Available at: https://allafrica.com/stories/201608120770.html [Accessed 10 January 2017].
Ametorgoh, M (2015) The battle for spectrum 800 MHz blocks, GhanaWeb.

C o m p e t i t i o n a n d R e g u l a t i o n f o R i n C l u s i v e g R o w t h
418
Available at: https://www.ghanaweb.com/GhanaHomePage/NewsArchive/The-battle-for-spectrum-800MHz-blocks-397655 [Accessed 20 December 2018].
Bauer, JM (2002) A comparative analysis of spectrum management regimes. Telecommunications Policy Research Conference, Arlington, Virginia. Available at: https://www.researchgate.net/publication/228870144_A_comparative_analysis_of_spectrum_management_regimes [Accessed 20 December 2018].
Cramton, P (2002) Spectrum auctions. In M Cave, S Majumdar and I Vogelsang (eds) Handbook of Telecommunications Economics. Amsterdam: Elsevier Science BV, Chapter 14, pp. 605–639.
Cramton, P (2013) Spectrum auction design, Review of Industrial Organization, 42: 2. Cramton, P, Kwerel, E, Rosston, G and Skrzypacz, A (2011) Using spectrum
auctions to enhance competition in wireless services, Journal of Law and Economics, 54: 167–188. Available at: http://www.cramton.umd.edu/papers2010-2014/cramton-kwerel-rosston-skrzypacz-spectrum-auctions-and-competition.pdf [Accessed 18 January 2019].
Economic Times (2015) Spectrum cap: Telecom Commission approves Trai’s recommendations, 24 November. Available at: https://telecom.economictimes.indiatimes.com/news/spectrum-cap-telecom-commission-approves-trais-recommendations/49830959 [Accessed 20 December 2018].
Frontier Economics (2014) Critique of Ofcom’s international benchmarking analysis: Response to Ofcom’s document: Update on European auctions since Ofcom’s consultation on annual licence fees for 900 MHz and 1 800 MHz spectrum’. Available at: https://www.ofcom.org.uk/__data/assets/pdf_file/ 0037/84997/frontier_economics_-_critique_of_ofcoms_international_benchmarking_analysis.pdf [Accessed 20 June 2017].
Ghana Business News (2017) 4G spectrum pricing: Politics vs industry, consumer interest, 12 January. Available at: https://www.ghanabusinessnews.com/2017/01/12/4g-spectrum-pricing-politics-vrs-industry-consumer-interest/ [Accessed 20 December 2018].
GSMA (2015) Spectrum for new entrants, lessons learned. Available at: https://www.gsmaintelligence.com/research/?file=3f4ec58d 593cdd88d2a7e71995e82733&download [Accessed 20 December 2018].
GSMA (2016) The Mobile Economy: Africa 2016. Available at:

419
s p e c t r u m p o L i c y f o r c o m p e t i t i o n a n d d e v e L o p m e n t
https://www.gsmaintelligence.com/research/?file=3bc21ea879a 5b217b64d62fa24c55bdf&download [Accessed 20 December 2018].
Industry Canada (2015) Auction of spectrum licences for advanced wireless services in the bands 1755–1780 MHz and 2155–2180 MHz (AWS-3). Available at: http://www.ic.gc.ca/eic/site/smt-gst.nsf/eng/h_sf10917.html [Accessed 20 June 2017].
Klemperer, P (2002) What really matters in auction design, Journal of Economic Perspectives, 16(1): 169–189. Available at: http://cramton.umd.edu/econ415/klemperer-what-really-matters-in-auction-design-jep-2002.pdf [Accessed 18 January 2019].
Mobile World Live (2016) Nigeria’s spectrum auction draws just one bidder, 24 May 2016. Available at: https://www.mobileworldlive.com/featured-content/home-banner/sole-qualified-bidder-for-nigeria-spectrum-auction-may-be-mtn/ [Accessed 18 January 2019].
Moore, L (2010) Spectrum policy in the age of broadband: Issues for Congress. Congressional Research Service. Available at: https://apps.dtic.mil/dtic/tr/fulltext/u2/a514136.pdf [Accessed 20 December 2018].
Nigeria Bureau of Statistics (2016) Nigerian Telecommunications (Services) Sector Report Q1 2016. Available at: https://nigerianstat.gov.ng/download/402 [Accessed 18 January 2018].
OECD (2014) New approaches to spectrum management, OECD Digital Economy Papers, No. 235. Available at: https://www.oecd-ilibrary.org/ science-and-technology/new-approaches-to-spectrum-management_ 5jz44fnq066c-en [Accessed 20 December 2018].
Ofcom (2012) Second consultation on assessment of future mobile competition and proposals for the award of 800 MHz and 2.6 GHz spectrum and related issues. Annex 6: Revised Competition Assessment. Available at: https://www.ofcom.org.uk/__data/assets/pdf_file/0021/58314/2nd_condoc_annex_6.pdf [Accessed 18 January 2019].
Song, S (2017) The failure of spectrum auctions in Africa: Many possibilities, 21 April 2017. Available at: https://manypossibilities.net/2017/04/the-failure-of-spectrum-auctions-in-africa/ [Accessed 20 December 2018].
Telegeography (2015a) Safaricom asked to return 5 MHz of 800 MHz spectrum, 17 December 2015. Available at: https://www.telegeography.com/products/commsupdate/articles/2015/12/17/safaricom-asked-to-

C o m p e t i t i o n a n d R e g u l a t i o n f o R i n C l u s i v e g R o w t h
420
return-5mhz-of-800mhz-spectrum/ [Accessed 18 January 2019].Teleography (2015b) MTN Ghana wins spectrum in 800 MHz band, 3
December 2015. Available at: https://www.telegeography.com/products/commsupdate/articles/2015/12/03/mtn-ghana-wins-spectrum-in-800mhz-band/ [Accessed 20 December 2018].
Telegeography (2016) Senegal’s incumbent cellcos ‘boycott’ 4G licence tender; ARTP invites bids from new entrants, 19 January 2016. Available at: https://www.telegeography.com/products/commsupdate/articles/2016/01/19/senegals-incumbent-cellcos-boycott-4g-licence-tender-artp-invites-bids-from-new-entrants/ [Accessed 18 January 2019].

421
r e g u L a t i n g f o r t h e g r o w t h o f m o b i L e f i n a n c i a L s e r v i c e s
14
Regulating for the growth of mobile financial services: A case study of
Kenya, Tanzania and Uganda1
Anthea Paelo
BACKGROUND
Mobile money has been a fast-growing phenomenon in developing countries around the world but particularly in East Africa. For instance, in Kenya, in 2017, about 75 per cent of the population had a mobile money account, while in Uganda and Tanzania, the mobile money penetration rate was 44 per cent and 59 per cent, respectively (The World Bank, ND). The experience in each of the countries, however, has been different. Kenya’s growth has been rapid and significant since the introduction of service in 2007. Growth in Tanzania, on the other hand, took off to a slow start with several commentators prematurely stating that the mobile money services had failed in Tanzania (Roberts, Macmillan and Lloyd, 2016). The service, however, began to see astronomical growth from 2011 onwards. In Uganda, the growth of mobile money subscribers, as well as the adoption of new and innovative products, have lagged behind its counterparts.
Mobile money is an electronic wallet service which allows users to send, receive and store money using their mobile phone. A subscriber is able to transform cash into e-value via an agent and is then able to transfer this e-value to another subscriber via a mobile phone. The

C o m p e t i t i o n a n d R e g u l a t i o n f o R i n C l u s i v e g R o w t h
422
mobile money can be used to purchase airtime, pay bills, utilities and other items or simply be withdrawn by the recipient, also through an agent. The term mobile money is used to refer to a number of distinct but related services offered over a mobile digital platform, including mobile money transfer, mobile payment and mobile banking. Mobile money transfer (MMT) is the basic transfer of mobile money between two mobile money subscribers over a mobile network (Roberts et al, 2016). This is the most common use of mobile money in sub-Saharan Africa. Mobile payment refers to the transfer of mobile money for the purchase of goods or services. Payments such as these are usually made for utilities such as electricity and water, school fees and to merchants (Roberts et al, 2016). Mobile banking, on the other hand, is the use of mobile devices to access banking services such as deposits, withdrawals, loans, savings, account transfers, bill payments and inquiries. For a subscriber to access these services, they require an account at a bank.
Mobile money is lauded, largely because it provides a secure, cheap and convenient means by which to send and receive money (Klein and Mayer, 2011). Rather than send money long distances via a bus, as is often the case in developing countries, the money is sent via a mobile phone. More important, however, is the ability for the service to draw more people into the financial system. Mobile money services in some countries have expanded to provide key financial services such as insurance, savings and credit. In regions such as sub-Saharan Africa, which has some of the lowest rates of financial inclusion globally, savings and credit provided through the more easily accessible mobile money platform are critical for achieving poverty reduction and more inclusive economic growth (Demirgüç-Kunt et al, 2015).
Studies have shown that in countries where there has been successful penetration of mobile money services, there has been an increase in financial inclusion. In Uganda, for instance, according to a recent FinScope Study, non-bank formal financial inclusion grew from 7 per cent in 2009, when mobile money was first introduced, to 58 per cent in 2017 (Economic Policy Research Centre, 2013; Financial Sector Deepening Uganda, 2018). In Tanzania, between 2011 and 2017, the

423
r e g u L a t i n g f o r t h e g r o w t h o f m o b i L e f i n a n c i a L s e r v i c e s
percentage grew from 17 per cent to 47 per cent (World Bank, ND). In 2014, largely due to mobile money, sub-Saharan Africa had only 17 per cent of the world’s unbanked population compared to the 31 per cent in South Asia and 24 per cent in East Asia and Pacific (Demirgüç-Kunt et al, 2015).
Considering the benefits that mobile money and mobile financial services can provide for economic development, it is in the best interests of developing economies to support and promote this growth. Despite this realisation, there have been large disparities in the growth and development of the mobile financial services sectors in different countries. Two of the main factors that affect the outcome of the sector are the structure and the regulatory frameworks governing each sector. By using a case study approach, this chapter aims to show how differences in structure and regulation can affect the levels of adoption and availability of services in the sector. Three East African countries are used for this analysis: Kenya, Uganda and Tanzania. The countries are chosen for the high levels of maturity of the sector and because, as neighbours, there should be little disparity in their experiences.
The chapter discusses how the structure of the sector, as well as regulation, can influence the growth of the sector. It then provides a cross-country analysis of the sectors in each of three countries by considering their profiles, legal systems, structure and trends. Thereafter, it compares prices across countries and concludes with some recommendations.
FACTORS THAT AFFECT UPTAKE OF MOBILE MONEY SERVICES
Four main factors have been identified as critical for the success of mobile money: (1) light regulation; (2) poor infrastructure; (3) concurrent growth of mobile money subscribers and the number of agents; and (4) ignition and explosion must happen soon after the launch (Evans and Pirchio, 2014). Of the four factors, regulation has proved to be the most problematic. Due to the disruptive and fast-changing nature of the sector, there is a need for the constant development of regulation to govern the sector. However, as Evans and Pirchio (2014) highlight, the regulation

C o m p e t i t i o n a n d R e g u l a t i o n f o R i n C l u s i v e g R o w t h
424
required for a successful mobile money sector needs to be responsive but also light. Heavy regulation has been shown to discourage mobile network operators (MNOs) from investing sufficiently into providing the service.
Additionally, regulating this sector needs to take into consideration its structure. The structure of the mobile money sector reflects that of the telecommunications industry in that it is often highly concentrated and characterised by network effects and high costs of entry (Bourreau and Valletti, 2015; Sitbon, 2015). This has important implications for price and incentives to innovate. The following section discusses how these two areas can affect the growth and development of the mobile money sector.
Regulatory framework of the mobile money sector
The regulatory framework governing the mobile money sector in a country has a significant impact on the success of mobile money and, hence, financial inclusion. Evans and Pirchio (2014), in a study that investigates the factors that contribute to the success of mobile money, found that all but one of the eight countries with successful mobile money regimes had light regulation. Heavy regulation has been suggested to reduce incentives on the part of the MNOs to continue investment as they may not have the opportunity to achieve compensation from the investment (Robb and Vilakazi, 2016). Light touch regulation refers to regulations with fewer restrictions on the kind of institution allowed to provide mobile money services. In such a framework, mobile money services can be provided by mobile money operators or third parties through MNOs rather than through banks. The regulatory framework in such cases usually include a ‘know your customer’ (KYC) requirement to reduce fraud, as well as the removal of agent exclusivity (Bourreau and Valletti, 2015).
Currently, two main models of mobile financial services exist – bank-led and MNO-led. Some variations such as a joint venture or partnership between financial institutions and the MNO or even a third-party-led model can be used. In the bank-led model, the contractual relationship is

425
r e g u L a t i n g f o r t h e g r o w t h o f m o b i L e f i n a n c i a L s e r v i c e s
with a licensed financial institution rather than with the MNO (USAID, 2010). Mobile financial services are often additional services provided by the bank. A customer must have an account with the bank to access these services.
Mobile money sectors that follow the bank-led model are often governed by heavy regulation. In order to access financial services using this model, a customer must have an account with a bank or other financial institution, which is subject to financial regulation and has in place measures to mitigate financial and security risks. The challenge with this model is that in developing countries, with a low number of bank account holders, increased access to financial services is limited (USAID, 2010). In addition, banks are also generally slow to innovate and develop products that meet the needs of the population (Hernandez, Bernstein and Zirkle, 2011). This is the model employed in Nigeria and South Africa, resulting in the failure to ignite the mobile money sectors in these countries (Evans and Pirchio, 2014).
With the MNO-led model, customers are able to access financial services, such as cash transfer and payments, through a mobile phone without opening a formal account at a financial institution. Because the mobile money provider is not a financial institution in this model, it is not subject to the financial regulation and restrictions that are present in the bank-led model. The model is subject to light regulation and is more easily accessible to poorer populations due to limited bureaucracy and the widespread use of mobile phones (Suárez, 2015). It may, however, be vulnerable to a number of financial and security risks as it is not subject to the same financial restrictions as in the bank-led model.
The MNO-led model is the one deployed in Kenya, Tanzania and to a certain extent in Uganda. In both Kenya and Tanzania, MNOs and non-bank third parties are able to provide mobile money transfer services independently of financial institutions. Although the mobile money providers make use of bank accounts to store e-money received from customers, there is no need to create a bank account on the behalf of each customer (Blechman, 2016).
The model used in Uganda, however, includes aspects of the MNO-

C o m p e t i t i o n a n d R e g u l a t i o n f o R i n C l u s i v e g R o w t h
426
and bank-led models – the mobile money provider can provide this service only in partnership with a bank or financial institution (Macmillan, Paelo and Paremoer, 2016). The financial institution is required to obtain a ‘no objection’ letter, which permits them to provide mobile money services in partnership with the third-party mobile money provider. The mobile money provider is, in effect, indirectly regulated through the partner bank. While less stringent than the bank-led model, some of the disadvantages in the bank-led model appear here. Because banks are conservative by nature, they are often slow to accept new products and services; yet the mobile money provider requires the bank partner to be receptive to the new product as they are the ones that can apply and gain approval for the implementation of the service from the central bank (Hernandez et al, 2011; Macmillan et al, 2016).
The models used to provide services beyond money transfer, such as savings and credit, differ slightly. The provision of savings and credit is within the auspices of financial institutions. Therefore, non-bank mobile money providers need to partner with banks in order to provide this service (Blechman, 2016). In Kenya, Safaricom and the Commercial Bank of Africa (CBA) partnered to provide M-Shwari and savings and loans services available over the M-PESA mobile money service. Safaricom later partnered with KCB to provide these services in a product called KCB M-PESA. In Tanzania, Vodacom and CBA also partnered to provide this service with their M-Pawa product. In Uganda, MTN also partnered with CBA to provide these services using MoKash.
It is also possible for an MNO to partner with a non-bank lender to provide credit (Blechman, 2016). However, because the lender is not a financial institution regulated by the financial sector regulator, it is only able to provide credit and not savings accounts. For example, in all three countries, Airtel Money has partnered with Jumo, a microfinance lender, to provide mobile credit products with the exclusion of savings products. In Tanzania, the product is called Timiza, in Kenya, Kopa Cash and in Uganda, Wewole.
Banks may also provide financial services via MNOs, although this

427
r e g u L a t i n g f o r t h e g r o w t h o f m o b i L e f i n a n c i a L s e r v i c e s
is not classified under mobile money and, instead, falls under mobile banking. The service is available to bank account holders and may be accessed using Unstructured Supplementary Service Data (USSD) on mobile networks such as is the case with the Co-operative Bank of Kenya’s MCo-op Cash (Blechman, 2016).
A more interesting variation of the above models is where a bank chooses to launch a mobile banking service independently of other MNOs by obtaining a telecommunications licence and operating as a mobile virtual network operator (MVNO). In Kenya, Equity Bank created its own MVNO, Equitel, and distributed its own SIM cards through which their subscribers are able to access mobile transfer series, as well as loans through their Eazzy Loans product (Blechman, 2016). Subscribers are able to apply for loans and access services through the SIM card’s toolkit menu. The subscriber, however, is required to have an Equity Bank account in order to access these services.
Structure of the mobile money sector
The structure of the mobile money sector in each country is critical for understanding the competitive dynamics and pricing and innovation in turn. The telecommunications industry is generally highly concentrated and characterised by network effects and high costs of entry (Bourreau and Valletti, 2015; Sitbon, 2015). Network effects occur when additional value from a product is obtained when there is an additional user or subscriber. MNOs often set different rates for On-net and Off-net calls, charging subscribers higher prices for communication made to users on a different network. A subscriber thus derives greater benefits from being part of a network with the majority of subscribers as the costs involved in using telecommunication services are much less. This means that a firm with first mover advantages is able to benefit from these network effects and continuously gain more subscribers due to its larger customer base. Such a firm is thus able to gain significant power from their traditional voice and text service, which they are then able to leverage into the mobile money industry, especially since the network effects are similar in the mobile money sector.

C o m p e t i t i o n a n d R e g u l a t i o n f o R i n C l u s i v e g R o w t h
428
Additionally, the mobile money sector is a two-sided market. Two-sided markets occur when two different sets of users interact through the same platform and for which the decisions of one user group affect the outcomes faced by the other group (Rysman, 2009). The different user groups derive benefits from being connected using the same platform, as is the case in the mobile money sector (Armstrong, 2006).
In the mobile money sector, agents and subscribers form the two sides of the market or platform. The increase in the number of agents on one side of the market results in the increase of subscribers on the other side of the market. A platform is only successful if it attracts both agents and subscribers simultaneously (Evans and Pirchio, 2014). Agents play an important role in facilitating the actual transfer of mobile money services and are thus critical for the success of a mobile money service. Therefore, a mobile money provider that is able to attract both subscribers and agents almost simultaneously is most likely to gain substantial market power. This combined with the network effects therein could result in the creation of dominant players.
The structure of the mobile money sectors in Kenya, Tanzania and Uganda reflect that of the telecommunications sector and are highly concentrated, with different competitive dynamics, as explained below. Kenya is largely a monopoly with one MNO, Safaricom M-PESA, having close to 80 per cent of the market share in terms of the value of transactions. In Uganda, the sector is largely a duopoly with MTN Mobile Money and Airtel Money each having over 40 per cent of the market share, while in Tanzania, the sector is largely a triopoly with Vodacom M-PESA, Tigo Pesa and Airtel Money having a similar market share.
Kenya
There are about five main mobile money providers in Kenya: M-PESA, Airtel Money, Equitel Money, Mobikash and Mobile Pay. M-PESA has the bulk of the market share in terms of active subscribers, number of transactions, value of transaction and agents, which, as mentioned earlier, makes it a virtual monopoly (Figure 14.1).

429
r e g u L a t i n g f o r t h e g r o w t h o f m o b i L e f i n a n c i a L s e r v i c e s
Figure 14.1: Market share of mobile money providers in Kenya, 2017
Source: Communications Authority of Kenya (2018)
In terms of active mobile money subscribers, M-PESA has about 78 per cent of the market share, followed by Airtel Money with 9 per cent (Figure 14.1). Equitel Money has a market share of 6 per cent while Mobikash and Mobile Pay each have less than 1 per cent of the remaining market share. In terms of usage and agents, M-PESA maintains its dominance in the market with at least 75 per cent market share. Equitel comes second in terms of usage with market shares of at least 18 per cent. Airtel Money and Mobikash have 12 per cent and 8 per cent respectively in terms of number of agents. Equitel, as mentioned earlier, uses a different model. It is a bank that acquired a telecommunications licence in order to provide mobile money services. Each Equitel mobile money subscriber is also an active bank account holder, which might explain the service’s high number and value of transactions despite its low number of active subscribers.
Mobile money providers in Kenya began to offer mobile financial services as early as 2012. M-PESA was the first to launch such services, starting with the launch of its M-Shwari service offering, which allowed customers to save, earn interest and access loans (Di Castri, Gidvani and Muthiora, 2014). The service was launched in partnership with

C o m p e t i t i o n a n d R e g u l a t i o n f o R i n C l u s i v e g R o w t h
430
the Commercial Bank of Africa (CBA). In 2012, Airtel Money users could receive short-term loans from Faulu microfinance immediately on their phones with a product called ‘Kopa Chapaa’. In 2015, M-PESA launched a similar product but in partnership with KCB bank called KCB-MPESA.
As of 2018, mobile money subscribers in Kenya have access to services that enable them to make bill payments to several merchants, pay utilities, acquire insurance, savings and credit, transfer cash between e-wallets and bank accounts, and conduct international transfers. In 2016, Safaricom introduced a product specifically targetted at the poor called M-PESA Kadogo, which allows subscribers to carry out transactions below KShs 100 (about US $1) for free (Safaricom, NDb). In 2017, mobile money providers opened up their application platform interfaces (APIs) to enable aggregators and third-party applications to easily design applications that are connected to the M-PESA platform. Using the new API, third parties can easily access automated payment receipt processing, disbursements and payment reversals (Safaricom, NDa). Also in 2017, Airtel launched another savings and credit product called M-Fanisi in partnership with Maisha Microfinance Bank (Kariuki, 2017).
Tanzania
There are six mobile money providers in the market: Vodacom M-PESA, Tigo Pesa, Airtel Money, Halopesa, Ezy Pesa (Zantel Z-Pesa) and TTCL (Tanzania Telecommunications Company Ltd). Halopesa, Ezy Pesa and TTCL’s low market share, however, makes the market a virtual triopoly. The National Microfinance Bank (NMB) also provides a service called ‘Pesa Fasta’ through which customers can send money via a mobile phone to any person in the country who does not have a bank account (InterMedia, 2013). Vodacom was the first to launch its mobile money service, M-PESA, in 2008 (Di Castri and Gidvani, 2013). Zantel followed in the same year with the launch of Z-Pesa. Tigo launched Tigo Pesa in 2010. Zantel later relaunched its mobile money platform as Ezy Pesa in 2012. In 2016, both TTCL and Halotel launched their mobile money products, TTCL Pesa and Halopesa (Mirondo, 2016; Telecompaper, 2016).

431
r e g u L a t i n g f o r t h e g r o w t h o f m o b i L e f i n a n c i a L s e r v i c e s
Figure 14.2: Market share of mobile money providers by number of subscribers in Tanzania, 2018
Source: Tanzania Communications and Regulatory Authority (2018)
Despite its late entry in 2010, Tigo Pesa has competed actively and at the moment has the second highest market share in terms of active mobile subscribers – 32 per cent. This share is estimated to be higher if mobile money revenues are considered. The operator’s incentivisation of agents are said to have played a big role in this quick growth (Roberts et al, 2016).
Besides money transfer, customers are able to pay bills for utilities such as electricity, water and school fees using mobile money. In September 2014, Lipa Kwa M-PESA was launched by Vodacom to enable merchant payments on the Tigo Pesa platform. Merchant payments, however, do not seem to have taken off in Tanzania. Tigo and Vodacom now also provide insurance services. In 2012, Tigo launched a life and hospitalisation insurance product through a third party, Bima, which is underwritten by Golden Crescent Assurance. Premiums are automatically deducted from Tigo Pesa accounts. Vodacom also had a health insurance product but uptake has been slow.
In 2016, Vodacom and CBA launched a product called M-Pawa, which enables saving and borrowing via a mobile phone. Although the

C o m p e t i t i o n a n d R e g u l a t i o n f o R i n C l u s i v e g R o w t h
432
customer registers for the product via a mobile phone, a true bank deposit account is opened once the process is completed. From 2016, customers could also access international money transfer services through Tigo or Vodacom. Tigo customers in Tanzania could transfer cash to Tigo Cash accounts in Rwanda, while Vodacom customers in Tanzania could transfer cash to M-PESA accounts in Safaricom. In August 2015, Tigo partnered with WorldRemit to allow its subscribers to send and receive remittances internationally.
Uganda
In Uganda, the market is dominated by two MNOs: MTN and Airtel. The other mobile money providers in the country however also include Africell Money, M-Sente and Safaricom’s M-PESA. MTN has the largest market share of about 54% followed by Airtel with 25% market share (Figure 14.3). However, by actual usage, MTN’s market share is substantially higher (Macmillan et al, 2016).
Though mobile money is still primarily used as a person-to-person domestic remittance service, the range of services has expanded to include remote purchase of airtime, bill payments for utilities, solar power products, school fees, university fees, taxes, parking, insurance premiums, national lottery, pay-TV services payments, the bulk payment of salaries, international remittances and savings. The majority of utility payments are carried out using MTN mobile money services, which facilitate an average of 71.4 per cent of the utility payments monthly (MTN, 2015). However, person-to-person remittance is still by far the most important service, accounting for 90 per cent of MTN’s mobile money revenue in 2015 (Macmillan et al, 2016).
Mobile banking services such as microloans are now available from MTN mobile money services. In August 2016, MTN launched MoKash in partnership with the Commercial Bank of Africa (CBA) through which subscribers can open a savings account and apply for loans. Airtel Money also launched a credit product in partnership with Jumo called Wewole. In December 2015, MTN Uganda signed a memorandum with Safaricom in which MTN subscribers could receive transfers from

433
r e g u L a t i n g f o r t h e g r o w t h o f m o b i L e f i n a n c i a L s e r v i c e s
M-PESA subscribers in Kenya. MTN Uganda subscribers could also receive transfers from MTN Rwanda (Dignited, 2016). These, however, were only inbound transfers. In November 2016, MTN mobile money subscribers could also send mobile money to M-PESA customers in Kenya and MTN Rwanda customers. In 2018 MTN mobile money introduced MomoPay, a service that allows subscribers to pay for goods and services for free using mobile money (Olupot, 2018).
Figure 14.3: Market share of mobile money providers in Uganda, 2017
Source: Twaweza (2018)
COMPARATIVE ANALYSIS
Adoption of services
In terms of the rate of penetration of mobile money services, Kenya, as the first country to embrace mobile money, is leading with a 132 per cent of the adult population having access to these services (Figure 14.4). Uganda follows with a 109 per cent penetration rate as of 2017. The rate of growth dropped between 2013 and 2016 probably due to the disconnection of subscribers who had not yet registered their SIM cards as per KYC requirements issued by the Communications

C o m p e t i t i o n a n d R e g u l a t i o n f o R i n C l u s i v e g R o w t h
434
Authorities in the respective countries (Tanzania Communications and Regulations Authority, 2013; The Star, 2013; Macmillan et al, 2016). Tanzania’s penetration rate has been lagging behind the other two countries, however, this is probably because Tanzania’s adult population is much larger than Kenya’s or Uganda’s.
Figure 14.4: Mobile money penetration rate, 2011–2017
Source: Author’s calculation based on population data from the World Bank and mobile money data from countries’ respective Central Banks
Note: Mobile penetration rate is measured as the number of mobile money subscribers as a percentage of the adult population.
In 2014, the mobile money penetration rate in Tanzania experienced a spike most likely due to the implementation of interoperability between the three main players, Vodacom M-PESA, Tigo Pesa and Airtel Money. Importantly, this shows the significance of interoperability for increased penetration and financial inclusion. Admittedly, the data only reflect subscribers for mobile money transfer and not savings and credit, but access and usage of mobile money transfers improve access to the other financial services.

435
r e g u L a t i n g f o r t h e g r o w t h o f m o b i L e f i n a n c i a L s e r v i c e s
Figure 14.5: Number of transactions per subscriber, 2011–2017
Source: Central Banks of Kenya, Tanzania and Uganda
In terms of the number of transactions per subscriber, Kenya has been leading consistently, a sign of the maturity of the market and growth of the mobile money ecosystem. (Figure 14.5). Usage in Tanzania was growing steadily until about 2014, coinciding with an introduction of a mobile money tax of 0.15 per cent on mobile money transfers above TZS 30 000 (approximately US $19) in 2013. This was later replaced with a 10 per cent excise duty in 2014 (Deloitte, 2015). The addition of taxes appears to have contributed to a significant drop in the usage of mobile money services in Tanzania, which has a clear impact on financial inclusion goals. There is a need, therefore, to weigh the needs of the government in terms of increasing their tax base and the potential negative effects in terms of retarding the growth of financial inclusion in the country.
The trend in growth is similar in Uganda in that there was growth in the number of transactions per subscriber until 2013 after which growth dropped to a consistent level. The trend in both Uganda and Tanzania may be due to the rapid growth in the number of subscribers in the market. Unlike Kenya which had already achieved a certain amount of

C o m p e t i t i o n a n d R e g u l a t i o n f o R i n C l u s i v e g R o w t h
436
maturity, even in the number of subscribers, Tanzania and Uganda were at earlier stages of growth in the mobile money cycle. The growth in number of subscribers, therefore, outpaced growth in usage in terms of number of transactions per user.
In terms of the value of subscribers, Kenya continues to lead with the highest value of transactions per subscriber (Figure 14.6). The trend for all three countries, however, is a continuous decline in value of transactions. This might be as a result of the rapid adoption of the service by even the formerly financially excluded and the growing comfort of users in transacting with smaller amounts.
Figure 14.6: Value of transactions per subscriber in US $, 2011–2017
Source: Central Banks of Kenya, Tanzania and Uganda
Prices and rates comparison
In terms of prices charged for mobile money transfers, comparisons were made for three tiers of transfer: US $5, 15 and 150 for 2016 and 2017 (Table 14.1). The prices were converted from the local currencies of each country to US dollars to facilitate the comparison.

437
r e g u L a t i n g f o r t h e g r o w t h o f m o b i L e f i n a n c i a L s e r v i c e s
Table 14.1: Comparison of On-net mobile transfer charges, June 2017
Source: Safaricom M-PESA, Vodacom-Pesa and MTN Uganda websites
Table 14.1 shows that overall Tanzania has the highest charges for transfer for every tier of On-net mobile money transfer. However, this might be due to the fact that a greater proportion of the charges received with agents. For all three tiers, the percentage of Tanzania’s cash-out fees as a proportion of the total fees charges is over 80 per cent (Table 14.2). Additionally, increases in price between 2016 and 2017 in Tanzania have largely been due to an increase in cash-out fees rather than in transfer fees with reductions ion transfer fees happening for the US $5 and US $15 tier amounts.
This fee structure, in which mobile operators pay their agents premium commissions, appears to have a strategy on the part of the mobile money providers expand their network and mobile money offering (Roberts et al, 2016). The strategy appears to have worked. Between 2008 and 2010 the level of penetration was relatively low, with just over one million subscribers at the end of 2010 (Roberts et al, 2016). However, between
Kenya Tanzania Uganda
2017 2016%
Change2017 2016
% Change
2017 2016%
ChangeUS $5 MMT
Transfer 0.15 0.11 36% 0.14 0.15 –7% 0.28 0.31 –10%
Cash-out 0.27 0.27 0% 0.73 0.59 24% 0.25 0.27 -7%
Total 0.41 0.39 5% 0.87 0.74 18% 0.53 0.58 -9%
US $15 MMT
Transfer 0.39 0.25 56% 0.16 0.17 –6% 0.28 0.34 –18%
Cash-out 0.27 0.27 0% 0.91 0.74 23% 0.42 0.37 14%
Total 0.66 0.53 25% 1.07 0.91 18% 0.70 0.71 -1%
US $150 MMT
Transfer 0.98 0.97 1% 0.68 0.59 15% 0.56 0.43 30%
Cash-out 1.73 1.62 7% 3.42 2.70 27% 3.52 1.78 98%
Total 2.71 2.59 5% 4.10 3.29 25% 4.09 2.22 84%

C o m p e t i t i o n a n d R e g u l a t i o n f o R i n C l u s i v e g R o w t h
438
2011 and 2012, the number of subscribers experienced a significant jump of about 2.5 million active subscribers. This coincided with a sharp increase in the number of agents from just over 8 000 to close to 30 000 (Roberts et al, 2016).
Table 14.2: Cash-out fees as a percentage of the total mobile money transfer fee, June 2017
Source: Based on author’s own calculations
Kenya’s rates are the lowest overall. However, the proportion distributed as agents’ commission in the cash-out rate appears to be the lowest among the three countries. Additionally, increases in prices – even when substantial such as the 25 per cent for US $15 transfer amount – did not result in an increase in agents’ commission. Although a 5 per cent increase in price for the transfer of US $150 was shared with agents in 2017 (Table 14.1), the resultant cash-out fee made up only 64 per cent of the total fee compared to the 83 per cent and 86 per cent in Tanzania and Uganda, respectively (Table 14.2).
Uganda has some of the highest Off-net prices in the region. In 2016, it cost US $2.59 to transfer US $15, at least two-and-a-half times the amount charged in Tanzania or Kenya. Similarly, to transfer US $150, it cost US $5.18 in Uganda compared to the US $4.1 and US $4.5 in Tanzania and Kenya, respectively (Figure 14.4). Off-net rates for the US $5 and US $15 tiers were reduced in 2016 but the increase it seems to have been compensated for by the increase in the transfer charge for US $150 (Figure 14.4).
Kenya Tanzania Uganda
US $5 MMT 66% 84% 47%
US $15 MMT 41% 85% 60%
US $150 MMT 64% 83% 86%
Average 57% 84% 64%

439
r e g u L a t i n g f o r t h e g r o w t h o f m o b i L e f i n a n c i a L s e r v i c e s
Figure 14.7: Comparison of Off-net mobile transfer charges in US $, June 2017
Source: Author’s calculations based on information from MTN Uganda, Vodacom Tanzania and Safaricom Kenya websites
A comparison of the percentage difference in Off-net and On-net rates clearly displays the effect of significant market power in the mobile money sector. Off-net prices are at least 47 per cent higher than On-net of the chosen categories in Uganda and Kenya where there is no interoperability. The difference in rates for the US $5 is highest in Kenya with a 79 per cent difference in rates while in Uganda for the US $150 amount, the difference in Off-net and On-net rates is as much as 73 per cent.
While it has been argued that the interoperability may reduce incentives for firms to invest and grow, the Tanzanian case study has shown that there is still room for growth and that mobile money penetration may even increase with interoperability.

C o m p e t i t i o n a n d R e g u l a t i o n f o R i n C l u s i v e g R o w t h
440
Figure 14.8: Percentage difference between Off-net and On-net MMT rates, June 2017
Source: Author’s calculations based on information from MTN Uganda, Vodacom Tanzania and Safaricom Kenya websites
Evolution of competition in mobile banking and payments
In all three countries, mobile money has evolved from mobile money transfer to the provision of savings, credit, bill and merchant payments, insurance as well as mobile banking (Roberts et al, 2016). Although the vast majority of transactions is still person-to-person transfer, consumers are beginning to make use of the other services available through mobile money.
As a number of these services were traditionally accessed through financial institutions such as banks, the increased availability of such services from mobile money providers has created competitors for banks in this space. While banks are able to provide similar services to their customers through mobile banking, they are still faced with a number of challenges. First, mobile banking services are only available to bank account holders, who form a small proportion of the adult population (Demirgüç-Kunt et al, 2015). The requirements for obtaining a bank account remain restrictive in terms of cost, the required documentation and the necessity to go to a bank to open an account.

441
r e g u L a t i n g f o r t h e g r o w t h o f m o b i L e f i n a n c i a L s e r v i c e s
Second, banks are often dependent on MNOs to provide mobile banking services. The most common means by which mobile banking services are available is by the use of USSD mechanism on a mobile phone. Because MNOs own this infrastructure, banks or their customers are required to pay for use of these services. To the extent that mobile banking and mobile financial services are competitors, this may provide MNOs with an incentive to either refuse to provide essential USSD services to banks or to do so on unfavourable payment and service terms. In a market such as mobile money with few MNOs with significant amounts of market power, such a scenario is not only possible but has also been seen in countries such as Zimbabwe (Robb and Vilakazi, 2016).
In countries such as Kenya, the Competition Authority has tried to level the playing field by compelling Safaricom to disclose all banking service charges. It also reached an agreement with Safaricom in which the USSD prices for financial transactions would be reduced from between Sh2 and Sh5 per USSD session, and occasionally as high as Sh10, down to just Sh1 (about US $0.01) (Nkhonjera, 2017).
To overcome this dependency on a rival for access to essential telecommunications infrastructure, one of the banks in Kenya, Equity Bank, set up an MVNO, Equitel, to provide mobile money services (Mzekandaba, 2015). Additionally, the Equity Bank developed an innovative ultra-thin SIM card, about 0.1 millimetres in width, to enable a user to place it directly over a customer’s existing SIM card. The innovative SIM card enables a user to make calls, send texts, use data and mobile money services. Although the innovation faced resistance from Safaricom as an incumbent, it received regulatory approval and was in use in July 2015. Because Equitel is essentially a bank-led model, in order to register for the service, you need to have an Equity Bank account. A non-account holder can download the Eazzy app on a smartphone and is able to open an Equity Bank account without going to the branch and then make use of mobile money services (Karuga, 2015; Wainaina, 2016). This innovation has given Equitel an edge over other competitors. Figure 14.1 shows that in terms of number and value of transactions, Equitel has managed to acquire at least 20 per cent market share.

C o m p e t i t i o n a n d R e g u l a t i o n f o R i n C l u s i v e g R o w t h
442
The competitive dynamics in Tanzania are also interesting. The country has three main players with relatively similar market shares. Vodacom entered the market and enjoyed agent exclusivity for only two years before it was prohibited in 2010 (Roberts et al, 2016). Later with the help of sector regulators, Tigo and Airtel negotiated an interoperability deal in 2014, which Vodacom joined in February 2016. Despite concerns on the part of the MNOs that interoperability would restrict their ability to extract rewards from their significant investments and thus dampen their enthusiasm to invest, Tanzania’s case study has been one of dynamic rivalry.
In Uganda, there’s been a lag in terms of the introduction of innovative products, some of which have already been introduced in the other East African countries. The lack of a National Payment Act appears to have slowed down the process by which the MNOs can receive approval for the introduction of key products, including savings credit and remittance (Macmillan et al, 2016).
CONCLUSION
Growth in mobile money has been significant globally but none so much as in East Africa. Kenya has stood out while Tanzania has also shown phenomenal growth, despite a slow start. The case studies used have served to illustrate the importance of clear and responsive regulation.
The structure of the different countries varies. In Kenya, the mobile money sector is a virtual monopoly with Safaricom having almost 90 per cent of the market share. The Ugandan market, on the other hand, is a duopoly and the Tanzanian market, a triopoly. The Kenyan market, despite the presence of one player with significant market power, has been largely innovative and competitive, particularly in deepening mobile money to provide more mobile financial services but also in banks providing more rivalry to traditional MNO mobile money providers.
The presence of a national payments systems, as well as an active competition authority in Kenya, has resulted in increased transparency and cheaper pricing for the use of mobile money services. The effect of Safaricom’s dominance, however, is still apparent in its Off-net pricing.

443
r e g u L a t i n g f o r t h e g r o w t h o f m o b i L e f i n a n c i a L s e r v i c e s
The Ugandan case study has shown that while there has been an increased uptake of services, the slow development and implementation of regulation appears to be impeding the provision of more innovative services. The lack of competition law in Uganda also seems to have resulted in the MNOs charging high prices to consumers and in dominant players acting anticompetitively towards rivals.
In Tanzania, clear regulation has allowed for the introduction of new and innovative products. The presence of interoperability has also made the use of mobile money services more convenient and possibly contributed to the increase in mobile money subscribers. There may, however, be a need to look into pricing and transparency to make mobile money services more accessible for all.
In terms of prices, Tanzania has the highest prices overall, although this is largely because the majority of rates charged are distributed to agents as commission. Kenya has the lowest prices in the region but provides its agents with less compensation by comparison. In Uganda, the Off-net fees are significantly higher than the On-net fees, illustrating the effect of significant market power on the part of the dominant player. Despite reductions in prices, Uganda still has the highest difference between On-net and Off-net prices, which is not explained by the majority of the rate charged going to agents.
The three case studies show that there is no one-size-fits-all solution to creating a competitive and dynamic sector. There is a need for active telecommunications, finance and competition regulators. The competition regulator in Kenya has played a significant role in reducing prices for third-party mobile money and mobile banking providers. The Tanzanian approach, particularly with regard to interoperability, shows the value of cooperation between the different regulators to ensure better consumer welfare outcomes. The model used in Tanzania of providing majority compensation to agents played a significant role in mobile money penetration and is a strategy that can be developed to influence the growth of the sector. The slow and inflexible regulatory system in Uganda may have contributed to the slow introduction of products. Additionally, the lack of competition law or authority may be

C o m p e t i t i o n a n d R e g u l a t i o n f o R i n C l u s i v e g R o w t h
444
allowing for the excessive pricing of products, particularly with regards to Off-net pricing.
This study shows that for the mobile money sector to continue to deepen so that financial inclusion grows, regulation should not only be light but also flexible and responsive to allow for the introduction of new products. It also highlights the need for competition regulation, given the nature of the sector and the tendency towards anticompetitive behaviour, to allow for more reasonable pricing to facilitate access to financial services.
NOTES
1 This work is based on the research supported in part by the National Research Foundation of South Africa (Grant Number: 113029).
REFERENCES
Armstrong, M (2006) Competition in two-sided markets, The RAND Journal of Economics, 37(3): 668–691.
Bank of Uganda (2011) Bank of Uganda Annual Supervision Report. Available at: https://www.bou.or.ug/bou/bou-downloads/asr/2011/Dec/Annual_Supervision_Report_2011.pdf [Accessed 29 June 2017].
Bank of Uganda (2012) Bank of Uganda Annual Supervision Report. Available at: https://www.bou.or.ug/bou/bou-downloads/asr/2012/Dec/Annual-Supervision-Report-2012.pdf [Accessed 29 June 2017].
Bank of Uganda (2013) Bank of Uganda Annual Supervision Report. Available at: www.bou.or.ug [Accessed 29 June 2017].
Bank of Uganda (2014) Bank of Uganda Annual Supervision Report. Available at: www.bou.or.ug [Accessed: 29 June 2017].
Bank of Uganda (2015) Bank of Uganda Annual Supervision Report. Available at: www.bou.or.ug [Accessed 29 June 2017].
Blechman, JG (2016) Mobile credit in Kenya and Tanzania: Emerging regulatory challenges in consumer protection, credit reporting and use of customer transactional data, The African Journal of Information and Communication (AJIC), 17: 61–88. Available at: http://creativecommons.org/licenses/by/4.0 [Accessed 7 June 2017].
Bourreau, M and Valletti, T (2015) enabling digital financial inclusion through

445
r e g u L a t i n g f o r t h e g r o w t h o f m o b i L e f i n a n c i a L s e r v i c e s
improvements in competition and interoperability: What works and what doesn’t? CGD Policy Paper 065, June 2015. Available at: http://www.cgdev.org/sites/default/files/CGD-Policy-Paper-65-Bourreau-Valletti-Mobile-Banking.pdf [Accessed 7 June 2017].
Communications Authority of Kenya (2018) Second Quarter Sector Statistics Report for the Financial Year 2017/18. Available at: http://aptantech.com/wp-content/uploads/2018/04/Sector-Statistics-Report-Q2-2017-18.pdf [Accessed 27 June 2017].
Deloitte (2015) Digital inclusion and mobile sector taxation in Tanzania. Available at: https://www.gsma.com/mobilefordevelopment/wp-content/uploads/2015/01/Digital-inclusion-mobile-sector-tax-Tanzania.pdf [Accessed 4 October 2017].
Demirgüç-Kunt, A, Klapper, L, Singer, D and Van Oudheusden, P (2015) The Global Findex Database 2014: Measuring financial inclusion around the world, World Bank Policy Research Working Paper No. 7255, (April), pp. 1–88. doi: 10.1596/1813-9450-7255.
Di Castri, S and Gidvani, L (2013) Mobile money in Tanzania, GSMA. Available at: https://www.gsma.com/mobilefordevelopment/wp-content/uploads/2014/03/Tanzania-Mobile-Money-infographic-GSMA-MMU.pdf [Accessed 29 June 2017].
Di Castri, S, Gidvani, L and Muthiora, B (2014) The Kenyan journey to digital financial inclusion, GSMA. Available at: https://www.gsma.com/mobilefordevelopment/wp-content/uploads/2014/09/MMU_2014_Kenya-Pathway_Infographic_Web.pdf [Accessed 27 June 2017].
Dignited (2016) MTN Uganda opens up Mobile Money transfers to Kenya and Rwanda, Dignited. Available at: http://www.dignited.com/21325/mtn-uganda-mtn-mobile-money-kenya-rwanda/ [Accessed 5 July 2017].
Economic Policy Research Centre (2013) FinScope III Survey Report Findings: Unlocking barriers to financial inclusion.
Evans, DS and Pirchio, A (2014) An empirical examination of why mobile money schemes ignite in some developing countries but flounder in most, Review of Network Economics, 13(4): 397–451. doi: 10.1515/rne-2015-0020.
Financial Sector Deepening Uganda (2018) Finscope Uganda, Topline Findings. Kampala: Financial Sector Deepening Uganda.
FinMark Trust (2015) FinScope Consumer Survey, Zimbabwe 2014.

C o m p e t i t i o n a n d R e g u l a t i o n f o R i n C l u s i v e g R o w t h
446
Johannesburg: FinMark Trust.Hernandez, J, Bernstein, J and Zirkle, A (2011) The regulatory landscape for
mobile banking. Work in progress, for discussion purposes.InterMedia (2013) Mobile money in Tanzania: Use, barriers and opportunities.
Available at: http://www.intermedia.org/wp-content/uploads/FITS_Tanzania_FullReport_final.pdf [Accessed 29 June 2017].
Kariuki, J (2017) M-Fanisi issues 20,000 mobile loans in pilot phase, Business Daily. Available at: https://www.businessdailyafrica.com/corporate/companies/4003102-4117764-7x18b7z/index.html [Accessed 18 February 2019].
Karuga, E (2015) What is Equitel and how does it work? Available at: http://blog.calculator.co.ke/what-is-equitel-and-how-does-it-work/ [Accessed 9 October 2017].
Klein, M and Mayer, C (2011) Mobile banking and financial inclusion: The regulatory lessons. The World Bank Policy Research Working Papers, No. WPS5664. Washington DC: World Bank. doi: 10.1596/1813-9450-5664.
Macmillan, R, Paelo, A and Paremoer, T (2016) The ‘evolution’ of regulation in Uganda’s mobile money sector, The African Journal of Information and Communication, 17, (AJIC Thematic Issue: Economic Regulation, Regulatory Performance and Universal Access in the Electronic Communications Sector). Available at: http://creativecommons.org/licenses/by/4.0 [Accessed 9 October 2017].
Mirondo, R (2016) TTCL to start money transfer services, The Citizen. Available at: https://www.thecitizen.co.tz/News/TTCL-to-start-money-transfer-services/1840340-3179844-b4mhfb/index.html [Accessed 9 October 2017].
MTN (2015) MTN Uganda is the leading financial services provider with its mobile money offering. Media release: Kampala. Available at: https://www.mtn.co.ug/new-world/Documents/2015/Oct/Mobile%20Money%20Thematic%20-%20Press%20Release.pdf [Accessed 9 October 2017]
Mzekandaba, S (2015) Kenya’s Equity Bank launches ultra-thin SIM tech, Web IT. Available at: http://www.itweb.co.za/index.php?option=com_content&view=article&id=144828 [Accessed 9 October 2017].
Nkhonjera, M (2017) Competition Authority of Kenya (CAK) rules on USSD pricing, CCRED Quarterly Review. Available at: https://www.competition.

447
r e g u L a t i n g f o r t h e g r o w t h o f m o b i L e f i n a n c i a L s e r v i c e s
org.za/review/2017/4/12/competition-authority-of-kenya-cak-rules-on-ussd-pricing [Accessed 19 September 2017].
Olupot, NE (2018) MTN Uganda launches MomoPay to enable a cashless society, PC Tech Magazine. Available at: https://pctechmag.com/2018/08/mtn-uganda-launches-momopay-to-enable-a-cashless-society/ [Accessed 18 February 2019].
Robb, G and Vilakazi, T (2016) Mobile payments markets in Kenya, Tanzania and Zimbabwe: A comparative study of competitive dynamics and outcomes, The African Journal of Information and Communication, 17(17): 9–37. Available at: http://creativecommons.org/licenses/by/4.0 [Accessed 6 February 2017].
Roberts, S, Blechman, J and Odhiambo, F (2016) A comparative study of competition dynamics in mobile money markets across Tanzania, Uganda and Zimbabwe: Tanzania Country Paper. CCRED unpublished report, Johannesburg.
Roberts, S, Macmillan, R and Lloyd, K (2016) A comparative study of competition dynamics in mobile money markets across Tanzania, Uganda and Zimbabwe. CCRED unpublished report, Johannesburg.
Rysman, S (2009) The economics of two-sided markets, The Journal of Economic Perspectives, 23(3): 125–143.
Safaricom (NDa) M-PESA API. Available at: https://www.safaricom.co.ke/personal/m-pesa/do-more-with-m-pesa/m-pesa-api [Accessed 5 July 2017].
Safaricom (NDb) M-PESA Kadogo. Available at: https://www.safaricom.co.ke/personal/m-pesa/do-more-with-m-pesa/m-pesa-kadogo [Accessed 5 July 2017].
Sitbon, E (2015) Addressing competition bottlenecks, Journal of Payments Strategy & Systems, 9(3): 340–354.
Suárez, SL (2015) Poor people’s money: The politics of mobile money in Mexico and Kenya, Telecommunications Policy, 40(10): 945–955. doi: 10.1016/j.telpol.2016.03.001.
Tanzania Communications Regulatory Authority (2013) SIM Card Registration. Available at: https://www.tcra.go.tz/images/Press Release/simCardRegPresRelease2013.pdf [Accessed 18 February 2019].
Tanzania Communications Regulatory Authority (2018) Quarterly Communications Statistics Report: October–December 2017

C o m p e t i t i o n a n d R e g u l a t i o n f o R i n C l u s i v e g R o w t h
448
Quarter. Available at: https://www.tcra.go.tz/images/documents/telecommunication/CommStatDec16.pdf [Accessed 18 February 2019].
Telecompaper (2016) Halotel launches money transfer service, Available at: https://www.telecompaper.com/news/halotel-launches-money-transfer-service--1167462 [Accessed 18 February 2019].
The Star (2013) Two million SIM cards turned off, The Star. Available at: https://www.the-star.co.ke/news/2013/01/12/two-million-sim-cards-turned-off_c725135 [Accessed 18 February 2019]
Twaweza (2018) Under pressure? Ugandans’ opinions and experiences of poverty and financial inclusion. Available at: www.twaweza.org/sauti [Accessed 18 February 2019].
USAID (2010) FS Series #9: Enabling mobile money interventions: Primer, diagnostic checklist and model scopes of work. Prepared by Chemonics International Inc. for the United States Agency for International Development (USAID) Financial Sector Knowledge Sharing Project.
Wainaina, E (2016) I opened an Equity Bank account from my smartphone. Here is how it went, techweez. Available at: http://www.techweez.com/2016/11/25/equity-bank-equitel-account/ [Accessed 9 October 2017].
World Bank (ND) DataBank. Washington, DC: World Bank. Available at: http://databank.worldbank.org/data/home.aspx [Accessed 4 October 2017].].

449
p r o c e d u r a L i n n o v a t i o n i n c o m p e t i t i o n L a w f o r s m a L L e c o n o m i e s
15
Procedural innovation in competition law for small economies
Rory Macmillan
INTRODUCTION
There is considerable debate about how competition policy and law, as developed in larger, wealthier, more industrialised economies, should be applied in smaller, poorer, less industrialised countries (OECD, 2003; Bakhoum, 2012; Drexl et al, 2012; Fox, 2012; Gal and Fox, 2014; Gerber, 2014). Some question whether small countries have specific characteristics and face particular problems resulting from their scale, which merit an ‘adapted’ approach to competition law (OECD, 2003). Most of the discussion has concerned the economic substance of competition law introduced pursuant to agreements on trade or with facilitation of multilateral agencies and networks promoting ‘international best practices’. Even the way economics can be used in competition law is under discussion (Gerber, 2014).
This chapter does not evaluate the merits of substantive economic paradigms in different contexts. It is interested, rather, in whether there may be a procedural dimension that is also worth exploring when considering how best to develop small countries’ competition regimes. In particular, it looks into how procedural innovations might supplement classic models of enforcement and approval processes to strengthen the impact of resource-strapped competition authorities.

C o m p e t i t i o n a n d R e g u l a t i o n f o R i n C l u s i v e g R o w t h
450
The chapter begins by recalling the challenges facing competition authorities in developing and particularly small economies. The requirements of the economic and legal expertise and procedures designed for the adversarial nature of enforcement make for a particularly heavy weight. The chapter then explores how alternative mechanisms are sometimes used in the general justice system and in competition law in larger developed markets, resulting in a wider distribution of roles and responsibilities rather than focusing all in the primary authority itself. It concludes by asking whether such mechanisms might usefully be employed in small countries to supplement classic authority-centric processes. Drawing on examples from the author’s experience arbitrating and mediating competition-related cases, it is concluded that if credible enforcement can be demonstrated as a backdrop, such methods could be useful in reducing the burden on authorities. This, in turn, may allow them to concentrate better on strengthening the enforcement regime itself and the other classic means of administering competition policy.
CHALLENGES FACING COMPETITION AUTHORITIES IN SMALL ECONOMIES
Being a competition authority is generally challenging, but all the more so in small economies, and this for a number of reasons.
Economies of scale
The small scale of the market may limit the potential for effective competition to develop in some sectors, placing the very usefulness of competition law in question (Sokol, Cheng and Lianos, 2013). It may be difficult to attract new entrants to challenge incumbents in sectors traditionally dominated by one or a small number of firms, resulting in more entrenched market dominance.
Suppliers may find that they are too small to be economically viable in goods and services that are affected by economies of scale. Even where competition is viable in parts of the value chain, other parts may need forms of resource sharing that might be regarded as unlawful restraints on competition in larger economies. A small economy may

451
p r o c e d u r a L i n n o v a t i o n i n c o m p e t i t i o n L a w f o r s m a L L e c o n o m i e s
lack diversification, perhaps having only a small number of exports. The challenges posed by international export cartels may also make small countries more protective of their national industries.
Competition economics and law requires technical expertise that is usually difficult to find in a small country, so authorities often lack the human resources necessary to run an effective competition regime (Gal and Fox, 2015). They may have as many economists and lawyers per head of population as larger ones, but there will be fewer of them – yet there are economies of scale in building an effective competition regime. Specialisation needs sufficient numbers to work, so in small economies, there are more generalists.
It is not only the competition authority that needs to grapple with sophisticated law and economics; this impediment to building expertise also arises in the businesses and their advisers, who have to understand what they are and are not allowed to do. Even where businesses are motivated to review their practices against the norms of competition law, they may lack the resources to do so effectively.
Thus, while the application of competition policy norms may require expertise and experienced judgement to tailor internationally recognised approaches to the situation at hand, there may be even less such expertise and experienced judgement available. Attracting talent and integrating it into the competition authority’s processes is a challenge, but also a high priority.
Relationships and culture
In small countries, the chances are higher that individuals – particularly leaders – know one another, have worked or trained together, come from the same community or are part of the same religious group. Such informal relationships, both within and outside the workplace, may produce a tendency to resolve issues through informal means, which are not aligned with best international practices in competition law, including bargaining between competitors or between authorities and the firms under their jurisdiction.
In some cases, cronyism may protect an established political-economic

C o m p e t i t i o n a n d R e g u l a t i o n f o R i n C l u s i v e g R o w t h
452
order. Of course, one of the intended benefits of competition policy can be to loosen the drag of such bonds on economic performance. In other cases, competition laws may pose a disruptive challenge, not only to existing economic interests and restraints on trade, but also to the very manner of handling power and discord. Where customs of collaboration, which do not correspond to modern competition principles, are deeply embedded in social, cultural and political norms and behaviour, this may be particularly threatening.1 Where competition policy is intended to change such community, religious, kinship, tribal or other customs, it can face difficulties from a perception that it is challenging the very fabric of the society itself (Fikentscher, 2001; Hazel, 2015).
There may be times when it is more effective for contentious matters to be resolved through negotiation rather than full enforcement. Sometimes it may even be better for the competition authority to be politically shielded by sharing some of the responsibility for reaching the outcome, whether with the parties involved or with internationally acknowledged experts.
Prioritisation challenges
Competition law aims to effect changes in behaviour and to instil a culture that is expected to lead to better economic performance. Competition authorities pursue this in reliance upon an economic analysis of markets, an assessment of market power and the collection of a body of evidence, through inquiry or investigation, sufficient to justify an enforcement or approval decision that will withstand scrutiny. The method aims to create incentives for behaviour against a backdrop of official coercion. Even where private parties have a right of redress in respect of harm caused by anticompetitive behaviour, this is viewed as a mechanism to further the policy objective of deterrence (even to the point that damages may be tripled to achieve the underlying deterrence goal).
In many small economies, where markets have not been subject to competition law in the past, the very idea that horizontal and vertical restraints on trade and abuse of dominance are unlawful, may be unfamiliar. The competition authority needs, then, to invest major

453
p r o c e d u r a L i n n o v a t i o n i n c o m p e t i t i o n L a w f o r s m a L L e c o n o m i e s
effort in developing the awareness of economic actors affected by such norms, that is, through establishing a history of successful cases and through advocacy.2
At one level, much of competition law is intuitive, such as bid rigging, price fixing and abuse of dominance, which are easily recognised as schoolyard bullying. However, as soon as one delves beneath the obvious, much becomes very unclear.3 In many situations, the question of whether market conduct is anticompetitive may not have an obvious answer (or worse, the intuitive answer may be economically incorrect).
Providing training and awareness raising to industry on the nuances is important but insufficient to have far-reaching effects on behaviour. To bring home the economic paradigm of the competition law to business actors, there is nothing like a flagship case, the pursuit and resolution of which will have recognisable welfare benefits for consumers, illustrate the nature of anticompetitive practices, demonstrate the punitive consequences of carrying them out and, ultimately, deter such behaviour.
This means selecting cases in a sector of the economy that is widely used by consumers, which may be in consumer retail distribution and sales of goods, or sales of services that are widely used. Facing resource limitations, competition authorities in developing countries and small economies may pursue horizontal restraints, particularly hard-core violations such as price fixing, at the expense of abuse of dominance, which may be harder to prove. Such prioritisation issues are not unique to developing countries, but may be more challenging for them to address.4
Weakness in sector-specific regulation may also result in competition authorities being expected to take a lead in regulating prices and other activities that are not central to their role in improving competitiveness across the economy. Similarly, authorities that are driven by complaints processes may be unable to exercise the discretion they wish in selecting the cases that will influence behaviour (for example, see Kovács and Reindl, 2013). This may leave them with sparse resources for reforming regulatory systems that restrict competition and identifying anticompetitive conduct and enforcing against it.

C o m p e t i t i o n a n d R e g u l a t i o n f o R i n C l u s i v e g R o w t h
454
The combination of these factors puts pressure on authorities that are trying to focus on a small number of landmark cases that send clear messages. As these are particularly resource-consuming, this may mean resolving the less high-profile cases more efficiently, with less demand on the authority’s economic and legal resources. If classical methods of pursuing competition law’s objectives cannot be used across the board, one might consider what complementary mechanisms might be employed, whether to improve the messaging of the high-profile cases or to cope with the larger number of others.
Tensions among underlying goals
The competition authority may be expected to focus on the structure of, and behaviour in, markets according to well-established economic notions of market definition, market power, horizontal and vertical restraints, abuse of dominance and remedies. But it may also find itself playing a wider role.
The function and perception of competition law may depend on the context in which competition policy has been introduced, and the underlying values of the society. The goals of competition law in a primarily agrarian or community-based economy, such as in some South Pacific nations, may differ from those where competition law is introduced in the transition away from command-and-control management of the economy, such as in Eastern European countries (Roberts, Tapia and Ybar, 2013).
These may be different in turn where the dominant political theme concerns economic inclusion of hitherto excluded groups (Chua, 1998). Competition law may have the aim of lowering barriers to participation and growth in the market as a means of broadening the distribution of wealth, forming part of a broader inclusiveness agenda (Soto, 1989; Fox, 2008).
The legislature may seek to encourage growth of small and medium enterprises, which might be expected to generate innovation, give greater attention to customers’ needs and maintain or create employment (for instance, Kaira, 2013). It may thus have a fundamental poverty

455
p r o c e d u r a L i n n o v a t i o n i n c o m p e t i t i o n L a w f o r s m a L L e c o n o m i e s
reduction agenda at heart. Intensifying the degree of business rivalry may have the aim of
ensuring consumer surplus is not transferred to the hands of large, dominant firms or cartels. Yet if the focus is on economic efficiency, there may be a need to reach or maintain scale to reduce costs, increase efficiency or (particularly in small economies) enhance bargaining power with foreign suppliers or buyers.
Not all of these objectives sit well together. Tensions may arise among diverse goals that lie behind the introduction of competition policy. If the applicable competition law allows the ‘public interest’ as a justification for decisions, the competition authority may come under pressure to use it. The authority’s role as a technical analyst of whether a transaction harms competition (and if it does, whether it may be justified by efficiency gains or other benefits that will be passed through to consumers) may give way to a larger role as arbitrator of whether competition policy should be applied at all in face of other competing policy objectives. The competition authority may become ‘the social shock absorber, the mechanism that absorbs the tensions between these goals’ (Kovacic, ND.).
The extent to which the competition authority will follow a narrow technical economic approach or have to weigh broader considerations will depend not only on its legislative mandate but also on the other institutions arrayed around it. Where robust ministries and agencies are present, it may find itself with a narrower focus, its zone of activity constrained by the bustling institutional pressures of fellow agencies.
Developing countries, particularly small economies, may not have well-resourced ministries and agencies which, by their very presence, would leave the competition authority with space to focus only on its narrow legislative mandate. In the absence of these, a competition authority may find itself taking a broader role, resolving conflicting visions of the economy and how competition should best serve the population’s aspirations for economic participation, innovation and growth.
In this sense, ‘[w]hat becomes key for the competition agency is to

C o m p e t i t i o n a n d R e g u l a t i o n f o R i n C l u s i v e g R o w t h
456
engage in a continuing discussion with the larger society, with public officials, about the appropriate focus of competition law, to continually define and redefine the aims of the law’ (Kovacic, ND). This broader role may require mediating among the different interests and arbitrating among the different objectives that led to the competition law in the first place. While this could result in uncertainty in markets as to how a competition authority will use its powers, or even what law will apply over the long term, such debate over and refinement of economic policy may be necessary where a sufficient consensus on such matters has not emerged.
Addressing challenges sustainably using integrated procedures
That these challenges make competition law difficult to administer does not make them arguments against competition law. Rather, these challenges illustrate the difficulties it may face and may support stronger engagement efforts and assistance from beyond the country’s shores (Licetti, 2013; Aydin and Büthe, 2015). Extensive assistance is available, with various institutions helping to build competition capabilities in many countries.5
However, it seems insufficient only to argue for greater resources for and assistance to competition authorities. Even where considerable thought goes into technical assistance,6 advisory assistance is likely to be inadequate for long-term development. For instance, long-term assistance might generally be more valuable than short-term assistance (Sokol and Stiegert, 2007; FTC, 2008). Yet even with donor support, it is difficult for small economies to attract expertise over the long term with the desired impact, or to integrate such expertise as its own. An economy that is unsustainably dependent on external support may never become capable of continuously managing the complexity of modern competition law.
Between well-developed economic theory and practice, on the one hand, and the reality of application in small, developing countries, on the other, lies an all-but-inevitable gap due to the lack of resources to meet the challenges (and, perhaps to some degree, different economic

457
p r o c e d u r a L i n n o v a t i o n i n c o m p e t i t i o n L a w f o r s m a L L e c o n o m i e s
considerations that apply in such economies). That gap may not be sustainably or affordably bridged through consultant advisers. It is worth exploring whether the gap can be reduced through sustainable procedures – whether short- or long-term interventions – that are integrated into the authority’s practices and that yield desirable outcomes.
EXPERIENCE IN LARGER ECONOMIES
Advanced jurisdictions have made considerable progress in using mechanisms other than the direct exercise of the competition authority’s administrative powers and judicial proceedings to address competition problems. These are explored below, before turning to their potential employment in small economies.
Role of business in enforcement
The classic enforcement mechanism in many countries for pursuing competition problems begins with the competition authority carrying out a market investigation and, depending on its prosecutorial discretion and powers, proceedings leading to fines and other remedies. Structural and behavioural commitments may be given as part of a negotiated settlement between the competition authority and the entity facing investigation. However, the publicly funded investigation or prosecutorial process bears considerable risk in terms of the cost of pursuing an action, gaps in evidence and uncertainty of outcome.
Public enforcement is increasingly complemented by the right of private parties to bring private actions for damages – not only to give them direct redress but also to amplify enforcement as a public benefit.7
Europe’s Directive on Antitrust Damages, introduced in 2014, seeks to ensure that ‘anyone who has suffered harm caused by an infringement of competition law … can effectively exercise the right to claim full compensation’.8 In some countries, the scope for private action is amplified by other recent measures on collective redress in competition matters, among others (for example, EC (2013)).
The provision of private party enforcement rights is not merely about providing access to justice. It is effectively a form of liberalisation

C o m p e t i t i o n a n d R e g u l a t i o n f o R i n C l u s i v e g R o w t h
458
of central state control over administration of a public policy objective. Into the coercive (in the case of full enforcement) or negotiated (in the case of settlements) process, the aggrieved party may pitch their case and directly influence outcomes. Such procedures and rights thus leverage the interests of directly affected private parties and share with them the burden of pursuing a public good. It may reduce the demand on resources borne by the public agency.
Sharing responsibility for enforcing competition law with those having an incentive to do so (as well as the courts, which may not be well qualified to administer it) has its risks and disadvantages. At the same time, though, as is often the case with liberalisation, it offers an opportunity for innovation. In particular, making parties more responsible for pursuing outcomes opens up the possibility of using different mechanisms to resolve the problems between the parties themselves rather than merely imposing top-down punishments.
Collective private actions schemes
Even where enforcement action has been taken and a business has been found to have infringed the competition laws, innovations in reducing the administrative burden of processing claims are being made. For instance, in the United Kingdom, the Consumer Rights Act 2015 provides for voluntary alternative dispute resolution procedures to facilitate negotiations between aggrieved parties and a company that has violated competition laws.
Similarly, the UK’s Competition and Markets Authority (CMA) is authorised to certify voluntary redress schemes and an opt-out collective actions regime. The redress is decided by a board chaired by a lawyer and including an economist, an industry figure and a representative of the aggrieved parties. The CMA is providing incentives to ‘nudge’ businesses to use such schemes, offering reduced fines for those that do (CMA, 2015).
Using mediation to resolve private actions
The burden of resolving competition claims may be shared further

459
p r o c e d u r a L i n n o v a t i o n i n c o m p e t i t i o n L a w f o r s m a L L e c o n o m i e s
using consensus-oriented methods like mediation. Mediation is a process in which a trained neutral person, or a team of them, assists parties in negotiating a matter. At its core, while the mediator manages the process, the parties determine what they agree to voluntarily. It is typically confidential by agreement of the parties, but need not be so. A skilled mediator actively and realistically explores with the parties the underlying interests, the issues to be resolved, the possibilities for agreement and the consequences if they fail to agree. Mediation offers a focused process that accelerates and deepens understanding of the issues and the parties’ respective interests, gives greater control over procedure and adds creativity to the process.
This idea is not new – the OECD has been considering how mediation can be used over many years.9 Although not widely used internationally (ICN, 2007), mediation is common in the United States, where private right of redress has long been a key part of the antitrust regime.
Where aggrieved parties are entitled to bring an action against an entity that has engaged in anticompetitive practices, mediation may be a particularly useful remedy (Blanke and Nazzini, 2009). In such cases, it may reduce the burden on the court system. Even where such parties can only bring complaints to the competition authority, whose sole or primary procedural channel is to carry out an investigation, mediation might be employed to resolve the matter earlier and with less cost than a full investigation.
Mediation should not be regarded as only useful in minor cases. It has been useful in hard-core cartel cases. Israel sometimes employs mediation techniques in cartel cases, using a judge as a confidential facilitator to reach a settlement (ICN, 2008). Where there are tensions among underlying policy issues, particularly where technology and behaviour is outpacing the law, mediation can be a helpful procedure. In the 2012 US e-book case, in which three e-book retailers claimed that they had been forced out of business by price fixing by Apple and five major publishing companies,10 the court ordered mediation among the parties. High-profile cases have been resolved with the

C o m p e t i t i o n a n d R e g u l a t i o n f o R i n C l u s i v e g R o w t h
460
assistance of mediators in the United States, such as in cartel cases against Apple, Google, Intel and Adobe regarding hiring of Silicon Valley employees.
Using mediation to negotiate commitments
Mediation can also be useful in implementing conditions that achieve a more competitive market as opposed to merely resolving the matter between an infringing and an aggrieved private party. Commitments may be given by the merging parties or a party under investigation as part of a settlement in an investigation or during enforcement proceedings, or in connection with approval of a merger, cartel exemption or leniency proceeding.11 In securing commitments, the competition authority can apply behavioural and structural remedies that lead to market-led outcomes and changes in commercial practices. These remedies can include processes that shift the burden of ensuring procompetitive behaviour to the parties involved.
These commitments have to be negotiated and, in many cases, negotiation can be helped along through mediation. Mediation offers a space for creativity, which can be valuable in the competition context. The involvement of a disinterested but curious and proactive third party mediator can change perspectives about the nature of the solutions the parties are pursuing.
For example, in the enforcement context, the United States v Microsoft antitrust action, brought by the US Department of Justice and 20 states, offers an example of complex antitrust mediation (Microsoft, 2000–2014). Microsoft was alleged to maintain its operating system monopoly unlawfully through exclusionary, anticompetitive and predatory conduct infringing section 2 of the US Sherman Act. The court ordered that Microsoft, the Department of Justice and the states enter into mediation proceedings to seek a settlement. Mediation with Judge Richard Posner did not produce a settlement over four months, but subsequent mediation by two other experienced mediators, Eric Green and Jonathan Marks, did. This was achieved over the course of three weeks, albeit after extensive preparatory work.12

461
p r o c e d u r a L i n n o v a t i o n i n c o m p e t i t i o n L a w f o r s m a L L e c o n o m i e s
Mediation’s usefulness is not restricted to adversarial situations. It is helpful in many negotiating circumstances, including merger approvals. In the merger between American Airways and US Airways, mediation was used to find solutions to Department of Justice concerns (Bloomberg, 2013; Travelpulse, 2013).
Using mediation to implement commitments
In many cases where there are concerns as to market power and control over a bottleneck resource or service, negotiation between the competition authority and the business in question may result in the business undertaking to negotiate with third parties. For example, in a merger, the combination of physical or intellectual property rights that are essential to the business of other firms may create such market power that there is a risk of excessive pricing or exclusionary conduct. It is common in merger approvals to secure the parties’ commitments to negotiate with third parties to grant them access to these assets.
Monitoring compliance with such obligations to negotiate presents a problem. It is desirable that commercial interests lead to a voluntarily negotiated outcome, yet where the party obligated to negotiate controls access to a valuable resource, there may be imbalanced bargaining power. This may lead to failed negotiations or outcomes that do not achieve the desired competitive conditions. The negotiations are also occurring in the shadow of the coercive power of the state that is compelling them. The competition authority also does not know what degree or timing of intervention may be required, if any. It may have to deploy a high level of expertise at short notice, creating a contingent demand on its resources.
In merger cases, the European Commission (EC) will sometimes ensure that mediation is part of implementing the remedy applied as a condition to merger approval. In the DONG/Elsam/Energi E2 case (EC, 2004), the EC accepted DONG’s commitment to a mediation process to resolve disputes arising from the implementation of its commitment to make natural gas available by auction to third-party competitors in Denmark under a gas release programme. It also employed a monitoring

C o m p e t i t i o n a n d R e g u l a t i o n f o R i n C l u s i v e g R o w t h
462
trustee arrangement. If a third-party competitor had reasons to believe that DONG was failing to comply with its commitments, the monitoring trustee could be instructed by the EC to act as a mediator to attempt to settle the dispute amicably.
Under the arrangement in DONG, the monitoring trustee would be allowed to appoint further professionals to assist, and would make a proposal as to who should bear the costs of the mediation procedure, which would take into account general mediation standards. The mediation would involve an exchange of written observations and then negotiations between the parties. If agreement was not reached, the monitoring trustee was empowered to recommend a solution, which would become binding upon DONG and the third party. The parties could oppose the recommendation in which case, the EC would decide the matter.
In such cases, instead of merely applying the threat of investigation and penalties with possibly endless litigation for non-compliance, a process is established whereby the post-merger entity must engage in a structured and facilitated negotiation process that is designed with incentives to reach a negotiated outcome.
Although it will not always succeed, mediation has generally been shown to improve the probabilities of achieving agreement, or at least to narrow the issues, allowing for more efficient resolution. It would be naïve to think that mediation can replace the threat of enforcement action. If it can be difficult to reach agreement on commitments that make a merger acceptable, it will be all the more challenging to reach settlements in cartel or abuse of dominance cases.13
But overall, the benefits of mediation can reduce the burden of resorting to the full duration of expensive confrontation with coercive power by the competition authority. It is being used because it offers procedural efficiency gains, that is, where remedies can be better implemented with it than without.
Using trustees to monitor implementation of commitments
Another means of ensuring implementation of commitments to nego-

463
p r o c e d u r a L i n n o v a t i o n i n c o m p e t i t i o n L a w f o r s m a L L e c o n o m i e s
tiate with third parties in several jurisdictions, including the United States, Canada and the EC, has been to employ monitoring trustees. These are used commonly, for example, to ensure compliance with ‘hold separate’ obligations and divestiture and other commitments in mergers (for example, ICN (2006)). To ensure that such obligations to negotiate would realise the procompetitive outcomes sought, the EC has required disputes over negotiations and agreements with the third-party beneficiaries to be supervised by a trustee (and as discussed further below, failures to agree and implementation disputes resolved by arbitration).14
In doing so, essentially, the authority delegates a circumscribed part of the function of monitoring compliance to a third party.
An example of this is in the German merger of Telefonica/EPlus (as in similar earlier cases in Austria and Ireland). In order to mitigate the adverse effect on competition of consolidation, the EC required the merged entity to offer competitors access to its network capacity. While not amounting to divestment, this would make a concentrated resource more widely available among competitors.
To implement this, Telefonica committed to appoint an experienced, skilled ‘monitoring trustee’, which would be independent of Telefonica and without conflict of interest. Telefonica was required to remunerate the monitoring trustee ‘in a way that does not impede the independent and effective fulfilment of its mandate’. Telefonica had to propose the individual to the EC for its approval. The role of the monitoring trustee was to supervise the implementation of the network capacity sharing arrangement, facilitate negotiations and report to the EC on progress and compliance.
Telefonica was required to cooperate with the monitoring trustee, provide it with information exchanged with third-party service providers requesting MVNO access, as well as ‘full and complete’ access to Telefonica’s books and records, personnel, facilities, sites and technical information necessary to fulfil its duties, including offices on Telefonica’s premises. Telefonica was even required to pay for any advisers the monitoring trustee would require for the performance of its duties.
The approach allows the EC in effect to leave parties more room

C o m p e t i t i o n a n d R e g u l a t i o n f o R i n C l u s i v e g R o w t h
464
to resolve issues but with a delegated supervision and facilitation mechanism, the cost of which is borne by the parties. This reduces the burden on the EC in following detailed implementation of undertakings by making parties more responsible for the process and cost of ensuring compliance. There may be scope for using such mechanisms at a smaller scale in small economies.
Using arbitration to resolve competition disputes
Arbitration is now widely recognised as a legitimate means of resolving disputes over competition matters.15 Arbitration is a process whereby a third-party neutral, usually chosen by the parties, renders a decision after considering submissions from disputing parties according to an applicable law. In most countries’ commercial arbitration processes (and those recognised by conventions on recognition and enforcement of awards), the parties’ role in consenting to the arbitration, selecting the arbitrators, framing the scope of the arbitration and establishing various procedural parameters is central to the process.
In plain commercial arbitration, where the only involvement of the state is in enforcing the agreement to arbitrate and the award itself, much of the discussion in the competition law context has revolved around arbitrability, and the extent to which parties should be allowed to agree to determine their conflicts through their own chosen arbitrators. This use of arbitration is an alternative to the courts hearing actions brought by aggrieved parties seeking redress for harm caused by competition law infringements (discussed earlier under ‘Enforcement through private right of redress’).
There is now extensive literature on the interaction between arbitration proceedings and the residual review powers of national courts (Blanke and Landolt, 2011; Landolt, 2012). It has not really been driven as a tool for better implementing competition law; indeed, arbitration had to ‘make its case’ before it became a trusted means of resolving disputes involving competition law. But now, the reality is that where arbitrators are making competition law decisions, the national competition authority bears a lighter burden. There is little sign that

465
p r o c e d u r a L i n n o v a t i o n i n c o m p e t i t i o n L a w f o r s m a L L e c o n o m i e s
arbitrators are carrying out their role in a manner that is undermining the competition law regime. On the contrary, the availability of party-trusted arbitrators to handle such cases widens the available resources for ensuring that competition law is implemented.
Using arbitration to enforce commitments
Arbitration-type procedures can also be used as a tool to advance competition law objectives by including it in remedies for potential ongoing competition disputes over compliance with commitments. In granting its approval to mergers and acquisitions, the EC has often used arbitration as a mechanism to guarantee implementation of a remedy where market consolidation reduces competition or creates or increases market power.
Arbitration is a sufficiently ‘heavy’ process, involving extensive written and oral submissions on procedure and the merits, factual and expert evidence, hearings and challenges that it is often preceded by escalated negotiation procedures. A ‘fast-track’ dispute resolution procedure was established in the German Telefonica/E-Plus case mentioned earlier, for situations where service providers requesting access claimed that Telefonica was not complying with its obligations to negotiate elements of the required access to its network capacity. If there was a dispute, there would be a focused negotiation process, including escalation to CEO level, to resolve the issue.
If this did not result in settlement, then the parties’ dispute would be referred to arbitration under the auspices and rules of the German Institution of Arbitration. An expedited arbitration process would follow, with either a sole arbitrator appointed by the parties or a three arbitrator tribunal, consisting of one appointed by each party and the chairperson appointed by the two party-appointed arbitrators.
The EC would be permitted to participate in the arbitration by receiving the parties’ arbitration submissions, all orders and awards of the tribunal, filing amicus curiae briefs and sending representatives to the hearing to question the parties, witnesses and experts. The tribunal would be able to make preliminary rulings and final awards in order

C o m p e t i t i o n a n d R e g u l a t i o n f o R i n C l u s i v e g R o w t h
466
to require Telefonica to comply with the sharing requirements. A six-month time frame would apply to such an arbitration process.
By setting such a procedure in place, the EC thus secured assurance that the cost and effort of resolving ongoing competition problems resulting from market concentration would be borne by the parties. The Commission preserved the power to influence outcomes through its participation in the arbitration.
The EC’s view of arbitration as a mechanism for resolving disputes in the context of competition law exemptions has gone ‘from distrust to embrace’ (Komninos, 2001), and it has used it in a number of cases.16 Arbitration is now being employed as part of a competition remedy across multiple platforms, such as intellectual property licensing arrangements, access to technical interfaces, access to infrastructure, supply and purchasing relationships, termination of exclusive or long-term contractual arrangements, and anticompetitive distribution arrangements (Blanke, 2006). For example, in the media merger between BskyB/Kirch Pay TV in 2000, the Commission addressed its concerns over dominance in the German pay-TV market and digital interactive TV services by requiring the merged entity to provide interoperability to competing technical platforms with its own set-top boxes, and to grant non-discriminatory licences for set-top-box hardware manufacturers. Disputes with the third parties over such arrangements were required to be resolved by arbitration.
The benefits of arbitration in such circumstances are a combination of speedier resolution and access to expert decision-makers without requiring the EC itself to be closely at hand to monitor every detail of every interaction with a company’s competitors. It decentralises the monitoring and enforcement from the EC to the parties and arbitrators.
This reflects a broader trend in the EC’s approach to incentivising private actors to play a significant role in the enforcement of competition law, as evidenced in its promotion of private enforcement actions in the area of competition law (Ysewyn, 2006). There is also considerable opportunity for the use of arbitration in remedies at national levels.17

467
p r o c e d u r a L i n n o v a t i o n i n c o m p e t i t i o n L a w f o r s m a L L e c o n o m i e s
PROSPECTS FOR SMALL ECONOMIES
One of the most common barriers to doing business in small developing economies is investor uncertainty, in particular, a lack of certainty in the legal process. Companies regularly identify enforcement of their rights as being a major obstacle to conducting business in surveys and studies such as the World Bank’s Doing Business reports. The courts may be overwhelmed, lack expertise or be corrupt, or a combination of these.
Where these problems have plagued small countries, progress has often been made in the general justice system through the introduction of alternative dispute resolution schemes (for example, IFC, 2010). The establishment of mediation and expert adjudication procedures, training staff to become mediators, and building a dispute resolution community and advocacy have combined to resolve large numbers of outstanding cases.
Regulated industries have also been a field for innovation in procedures, including in competition matters. Competition disputes arise extensively in regulated industries such as telecommunications, electricity, gas, rail and transport networks, and payment systems platforms. Many sector regulators have substantial competition powers, sometimes they are even more powerful than the competition authority.18 (In some cases, competition authorities and sector regulators may have overlapping ex post powers to enforce remedies and obtain commitments in case of infringement proceedings, highlighting the important relationship between the competition authority and the sector regulator.)19 Competition issues that regularly arise include refusal to deal, access to essential facilities, abuse of dominance, margin squeeze, predatory pricing, as well as cartels. In such industries, competition issues are increasingly resolved by mediation, expert adjudication and arbitration where businesses fail to agree on a negotiated solution.20
There is no particular reason why such mechanisms, which work in the general justice system and for competition-related matters in regulated industries, should not play a role in competition matters more generally. Indeed, as discussed below, some positive experiences in small
C o m p e t i t i o n a n d R e g u l a t i o n f o R i n C l u s i v e g R o w t h
468
countries suggest that they can be a beneficial supplement to the coercive processes of the competition authority and the courts.
Using mediation to negotiate competitive outcomes
Negotiation over competition matters between businesses and between authorities and businesses is part and parcel of the business of a competition authority. As discussed earlier, competition authorities regularly negotiate with businesses in connection with infringements and with merger, cartel exemption and leniency programme approvals. In each of these cases, the authority is typically aiming to address issues of market structure or conduct with a view to providing for a more competitive environment. In each case, the competition authority uses its leverage in the process to extract the undertakings to enhance competition in the desired way. The business agrees to them because they are better than (in negotiation jargon) its ‘best alternative to a negotiated agreement’ or BATNA.
In merger cases, some authorities can be quite proactive in seeking structural and behavioural commitments. Some regulators have been criticised for pressing well beyond their statutory remits in requiring merger undertakings, obtaining results that they would not have had the power to impose in agency-initiated proceedings (Beard et al, 2015).
Such cases may be criticised as a misuse of the bargaining power of a mighty government bearing down on a business. Yet, the threat or initiation of an investigation or enforcement action or the denial of a merger application might actually restore some bargaining power, which the authority otherwise lacks due to insufficient resources or a weak enforcement regime.
These situations can create a polarised stand-off between the authority and businesses involved and, as a result, opportunities for negotiated outcomes (that is, negotiated between the authority and the businesses) may be lost. Or the authority may find it is ineffective in negotiations due to the relationships or culture involved. Furthermore, as discussed earlier, the authority negotiating with the businesses may find that it is not only confronting problems of market conduct and

469
p r o c e d u r a L i n n o v a t i o n i n c o m p e t i t i o n L a w f o r s m a L L e c o n o m i e s
structure according to narrowly defined questions of economic analysis but is also working out how tensions among values should be resolved in the outcome.
Here, experience suggests that procedures such as mediation can support the negotiation process, ensuring that all relevant considerations are voiced, helping reach agreement more quickly and firmly, allowing businesses to move forward with their plans, while obtaining the assurances required to obtain the desired competitive market.
For example, mediation was employed in two cases in small South Pacific island nations concerning the dominance of telecommunications operators. In Fiji, the government, Vodafone, Cable & Wireless and Telecom Fiji had reached an impasse over the operators’ market power and performance in their respective relevant markets (mobile, international and fixed-line services) and over the government’s plans to liberalise these markets. Litigation ensued and blocked the government’s liberalisation efforts, but also created uncertainty for the operators as to their future operating environment and the government’s market interventions. The mediation (the author acted as mediator), sponsored by a multilateral donor, brought together the government and the operators and resulted in a settlement on numerous questions of market structure and conduct. The mediation process involved a few short visits to the country by the mediator and a four-day mediation conducted at ministerial and CEO level.
It is important to be clear about how mediation can fit in. When referred to as a form of ‘alternative dispute resolution’, it would be a mistake to think that it is an alternative in the complete sense, in other words, that it can dispense with classic administrative or judicial processes. Mediation can be effective only where a negotiated outcome, which addresses the competition problem, is preferable to each party’s best alternative. To secure redress and have a hope of influencing future behaviour, there needs to be genuine bargaining leverage, that is, it needs to occur against a backdrop of a credible threat of enforcement. Thus mediation is not a replacement for a robust enforcement regime, but is a supplement to it.

C o m p e t i t i o n a n d R e g u l a t i o n f o R i n C l u s i v e g R o w t h
470
Its benefit is that, where resources are limited or where the legal position is not clear, mediation may be more effective in resolving other cases or narrowing the issues in dispute. By facilitating a structured exchange on the parties’ interests, objectives and available alternative options, mediation may enable agreement to be reached where otherwise it would take more time or not be achieved at all. To the extent this liberates the demands on the authority, this could then, in turn, reinforce its enforcement capability.
Using arbitration for competition disputes in small countries
Experience suggests that there is real scope for resolving competition matters through arbitration in small economies. Arbitration mechanisms can be adopted that bring in the necessary expertise for the case at hand – using a suitable blend of foreign and domestic inputs – with appropriate funding.
There are further lessons from competition disputes in regulated sectors. In the small island nation of Trinidad and Tobago, the Tele-communications Authority of Trinidad & Tobago (TATT) has responsi-bility for resolving competition disputes in the telecommunications sector. TATT established a dispute resolution scheme providing for disputes between service providers to be resolved by arbitration and mediation. The authority would handle the exchange of pleadings between the parties all the way through complaint, response and reply. Within three months, TATT would notify the parties of its choice of persons to be appointed to a dispute resolution panel to hear the dispute, giving directions for the conduct of the proceedings. The parties are given an opportunity to object to the choice of panel members and directions.
This process has been used with some success. At an early stage of its existence, Digicel, a new entrant in the telecommunications sector, brought an abuse of dominance claim (among others) before the authority against the Cable & Wireless-owned incumbent. The panel in the dispute, which the author of this paper chaired, included a professor of technology at the local Trinidad university and a respected economist

471
p r o c e d u r a L i n n o v a t i o n i n c o m p e t i t i o n L a w f o r s m a L L e c o n o m i e s
at a local bank. The panel heard the dispute in much the same manner as an arbitration panel would, except that the terms of reference were set by TATT.
The process was not costly in view of the scale of issues at stake (the costs, including panel fees and expenses, were borne by the parties) and the matter was decided in less than six months, more quickly than any alternative method available (Macmillan et al, 2006). Subsequent disputes have also been handled successfully under this mechanism.
The advantage of this approach is that the parties are allowed enough involvement to influence key issues, strengthening their confidence in the decision-maker’s substantive technical or economic expertise and ability to manage a complex dispute process fairly, while at the same time achieving a balance of international and local expertise – all at a reasonable cost. TATT did not face demands on its resources that it was unable to meet, and was able to navigate a particularly contentious situation by ensuring a professionally managed process.
Using arbitration for competition appeals in small economies
The use of arbitration-type mechanisms may also extend to handling appeals from an authority’s decisions. In regulated sectors, arbitration is used in several small countries to appeal competition decisions. Again in telecommunications, for example, appeals of competition decisions of the Bahraini Telecommunications Regulatory Authority (TRA) are decided by arbitration between the TRA and the operator concerned. The TRA and the operator each appoints an arbitrator, and the two arbitrators together select a chairman and the panel hears and decides the dispute.21 Several proceedings have been successfully handled under this mechanism.
In Oman, disputes, including on competition matters, between the Omani Telecommunications Regulatory Authority (TRA) and telecommunications operators are subject to arbitration in a similar manner. The author’s experience – sitting as arbitrator in a case brought by Omantel against the Omani TRA – suggests that it is entirely possible to carry out effective proceedings that bring in the necessary subject

C o m p e t i t i o n a n d R e g u l a t i o n f o R i n C l u s i v e g R o w t h
472
matter expertise without burdening the state’s judicial resources. Papua New Guinea’s National Information and Communications Technology Act 2009 also provides for appeals to an international arbitrator who may sit with a resident member. This has been quite effective at times in resolving competition problems.
Areas for exploration
The examples discussed barely scrape the surface of the possible. Already, the usefulness of innovative mechanisms has had a major impact, both in general justice systems of large and small countries as well as in competition regimes of large jurisdictions. Surely there is scope for experimenting with these in competition law in smaller countries.
Various key questions need to be considered in developing this approach. To the extent that the success of using such mechanisms lies in their deployment of international expertise, issues of cost, reliability, continuity, legitimacy and perception must be addressed.
That an international mediator or arbitrator will cost more than staff of the average national competition authority is not the point. The fact is that a certain level of expertise is required, and that this has a cost to it. Realistically, the alternative facing a given authority may be to enlist experts behind the scenes as advisers at similar cost to it. In such cases, the advisers may write a report, which is then adopted by the authority. Where the competition issue is substantial and the cost of mediation or arbitration can be borne by the interested parties without weakening an aggrieved party’s access to redress (as in the examples given earlier), the cost may not be an impediment to realising the benefits. In some cases, mediation in particular can make for large cost savings through avoided protracted legal proceedings, with their endless procedural wrangling and evidentiary submissions.
In jurisdictions still grappling with the complexity of competition economics and law, and the risks of substantive and procedural error, there is likely to be concern about entrusting important matters to private persons such as mediators and arbitrators. However, the real concern may be the inverse. If the funding can be secured to engage

473
p r o c e d u r a L i n n o v a t i o n i n c o m p e t i t i o n L a w f o r s m a L L e c o n o m i e s
experienced experts, these will bring strong substantive and procedural skills and should enhance the results. Indeed, a certain shyness common among inexperienced national competition authorities in small countries often leads to a lack of openness, which can weaken the process and the result. In both mediation and arbitration procedures, the concerned parties may have greater assurance over their ability to influence the process and outcome, and thus reduce the uncertainties they face as to how the competition authority will decide matters. It may make for better results in which businesses can have greater confidence.
Concerns may arise about keeping tight control in the competition authority, with its direct statutory legitimacy, over the formation and continuity of the application of competition policy. There may also be discomfort about outsourcing the statutory responsibility to foreigners, who are not merely writing reports to be adopted by the authority but also taking on a direct dispute resolution role. However, these concerns may be overstated. As the real desire is often to achieve a workable outcome that is suitable to the situation, it can be surprising how quickly stakeholders accept – sometimes with relief – the involvement of external mediators or arbitrators.
This may support policy objectives to attract foreign investment as well. Foreign investors may have more confidence in a national competition regime that recognises the shortcomings of administrative resources and judicial processes for reaching outcomes. By providing processes that seek to deliver a result more quickly, giving the investor assurance of being heard, there may be greater certainty of and trust in the quality of the result.
Indeed, the insistence on a single agency’s monopoly control over the business of regulating competition may itself, particularly where resources are constrained, cause a bottleneck that liberalisation can unlock. The value of precedent in emerging countries’ competition law regimes may not be as important as a deeper understanding of the dynamics of markets and the nature of competition.
A concern arises as to whether external neutrals will have

C o m p e t i t i o n a n d R e g u l a t i o n f o R i n C l u s i v e g R o w t h
474
the sensitivities to local issues that might drive a politically aware competition authority. Working through the tensions between the political objectives and socio-economic values that lie behind the given country’s competition law may be difficult (see earlier section entitled ‘Tensions among underlying goals’). However, mediation in particular is ideally suited to bring such concerns into the room, ensuring that stakeholders’ interests are voiced and understood. Mediation methods can enable a dialogue between policy-makers and market participants about how competition law is to be applied.22
Foreign arbitrators may be less subject to political influence – if their remuneration is suitably structured to preserve independence. Thus, there may be less openness in a narrow arbitration setting to apply ‘public interest’ exceptions or other vague grounds for exemptions. Still, if arbitrations are managed in a way that ensures that important public concerns are fully expressed, there is every reason to think that a panel will give it due consideration. Providing (as in the Trinidad and Tobago case discussed earlier) that a panel includes local nationals can help ensure that local sensitivities are heard and understood.
The procedural ideas discussed in this chapter do not necessitate a long-term dependency on foreign experts. Indeed, the flexibility to involve local nationals outside the competition authority, such as from the local legal community or university, can help nurture local expertise. For example, time may allow nationals, who have acted as counsel in cases, to assume the role of a neutral.
Timing issues will also arise, particularly as to when in a process it is best to turn to mediation or arbitration. In the case of mediation, in complex cases, there can be major sequencing issues. Mediation may be premature until key issues have crystallised to the degree that parties can make realistic, informed assessments of their prospects through regulatory and adjudicative proceedings, that is, the BATNA. So, for instance, it is possible that decisions on relevant market definition – and even the existence of market dominance – may be helpful before seeking to resolve a dispute over a claim concerning abuse of dominance,

475
p r o c e d u r a L i n n o v a t i o n i n c o m p e t i t i o n L a w f o r s m a L L e c o n o m i e s
exclusionary practices or excessive pricing. Until then, both parties may face too wide a range of potential outcomes to be ready to seek to resolve the matter in meditation.
These factors can mean that there may be significant toing and froing with the judicial and regulatory authorities as the backdrop to the mediation process. Power imbalances are a common issue and mediators must be alert to these. For there to be a good prospect of reaching a settlement in a dispute, sometimes one party’s power in the market may have to be counterbalanced by the other party’s power in the legal or regulatory proceedings. This may mean that the case has proceeded to the stage at which the weaker party in the market has a real prospect of winning in the court or before the regulator.
The backdrop of ongoing litigation is common in mediation, but the proactive nature of regulation makes it all the more important that the mediator tailor the process to the unfolding judicial or regulatory proceeding. In some cases, a judge or regulator might even have a role in the mediation itself.23
This means that the conventional view, which emphasises separation of mediation from judicial and regulatory processes, may not hold in all situations. The great advantage of mediation is its adaptability to situations. The development of parallel mediation accompanying arbitration could be built into regulatory and judicial proceedings, with useful interplay between the adjudicatory/regulatory function of the regulator or court, on the one hand, and the exploratory/facilitative function of the mediator, on the other.
Competition cases attract significant media scrutiny. The temptation of journalists to cast the narrative in terms of the good guys and the bad guys leads to caricatures of unaccountable monopolies run by fat cats, and regulators as weak-willed, incompetent mandarins. The principle of transparency of public agency decision-making makes it important to disclose the outcomes reached and the reasons for them. Nevertheless, the opportunity to resolve competition matters in the privacy of a mediated process can allow space to get to the core of the issues at stake and make it possible to achieve agreement.

C o m p e t i t i o n a n d R e g u l a t i o n f o R i n C l u s i v e g R o w t h
476
This discussion would not be complete without returning to the subject of technical assistance. A key question will be whether multilateral and bilateral agencies will provide support to small countries in developing legislation and regulations that enable the use of such procedures, and even fund some of the mechanisms. The World Bank, for instance, has funded legislation and regulations that allow such mechanisms in regulated sectors, as well as even mediations themselves.
Procedural innovations may be useful for one-off interventions or for ongoing matters. When a competition authority exacts structural or behavioural undertakings in connection with merger proceedings or enforcement action settlements, it effectively takes on an ex ante function. Trustees, such as discussed under ‘Monitoring/divestiture trustees’ above, can remain involved for a significant period, similar to a sector regulator with competition responsibilities. There is a host of learning from regulators on the use of mediation, expert adjudication, full arbitration and other procedural innovation in numerous sectors (for example, Macmillan (2010)).
Cultivating communities and groups of experienced experts, who combine the substantive economic and legal knowledge with dispute-resolution skills, will be important. This may go further, to the point of building dedicated teams of experts ready to be deployed to assist, embedding local officials within such teams on a rotational basis. This may bolster capacity to resolve critical issues well, without having to bet the farm, while also building doctrinal continuity in support. It would be worth experimenting through further technical assistance to see how these ideas could be brought to fruition.
Technical assistance should not be the primary means of supporting such procedural innovations. Where cases are going to address important segments of the economy, there are often significant sums at stake. Procedures providing for the use of such mechanisms and the powers to ensure the parties will bear the costs, including making advances on such costs, may suffice.

477
p r o c e d u r a L i n n o v a t i o n i n c o m p e t i t i o n L a w f o r s m a L L e c o n o m i e s
CONCLUSION
This chapter has not argued that the challenges faced by small countries require adapting the substantive economics of competition policy in small or developing countries. Nor is it suggesting that competition authorities should be any less vigorous in deploying the coercive powers available to them in investigations and enforcement proceedings, or deciding on merger, cartel exemption and leniency programme approvals.
Rather, the chapter suggests that competition authorities complement their array of traditional powers by adding methods aimed at achieving results faster and with less cost. This has had a major impact in general justice systems, as well as in competition disputes in regulated sectors, as illustrated by the examples provided. The chapter has explored how an approach that places less emphasis on classic procedures for implementing competition norms can promote the desired competitive outcomes. Not only does there appear to be scope for employing procedures such as mediation and arbitration, but by lightening the burden on the competition authority, these may actually make the authority’s classic decision-making processes more effective.
NOTES
1 Familiar accounts of the formal and informal relations of Japanese Keiretsu and Korean Chaebol are but one example of this. In the author’s experience in the South Pacific islands, for example, cultural norms may facilitate the sorts of communications and collaborations that might elsewhere be regarded as horizontal cartels.2 The International Competition Network refers to advocacy as ‘activities conducted by the competition agency related to the promotion of a competitive environment by means of nonenforcement mechanisms, mainly through its relationships with other governmental entities and by increasing public awareness of the benefits of competition’ (Sánchez Ugarte et al, 2002).3 For example, there is an extensive literature on the boundaries of appropriate conduct on the part of industry forums or professional associations.4 Problems arising from dominance are often just as, if not more, pressing in developing countries compared with cartel cases due to historical origins of

C o m p e t i t i o n a n d R e g u l a t i o n f o R i n C l u s i v e g R o w t h
478
large companies, many of which were previously state-owned (Tapia and Roberts, 2013). 5 Technical assistance and advice is being provided by organisations such as the World Bank, the International Competition Network, UNCTAD, the UK Department for International Development and Consultative Group to Assist the Poor (CGAP).6 For discussions of technical assistance, see, FTC (2009) and Nicholson et al, 2007. 7 For instance, Europe has seen a shift from full reliance on public enforcement towards allowing private claims to resolve competition problems. The competition provisions of the Treaty for the European Union (Articles 101 and 102) are directly applicable and produce direct effects in national laws. This allows for national courts and agencies to enforce competition law in stand-alone claims brought as a ‘follow-on’ after the European Commission has found an infringement to have occurred.8 Preamble to Directive 2014/104, paragraph 12.9 See section 3 of OECD, 2010. See also, Nazzini (2009). 10 The five publishing companies were Macmillan, Hachette, HarperCollins, Simon & Schuster, and Penguin. See Albanese (2014). 11 See, for example, Article 9 of EU Regulation 1/2003.12 The settlement terms included protection of equipment manufacturers and software developers from coercion or retaliation by Microsoft, giving them freedom to decide on using non-Microsoft middleware products and onfigure PCs accordingly, preventing Microsoft from ongoing exclusionary behaviour and discriminatory use of Microsoft’s intellectual property licences. Eventually, all of the 20 states agreed to the terms (Green, 2006)13 The European Commission struggled to reach settlements with Google and Gazprom, for instance. (See EC (2015)) 14 For example, in the UK merger of T-Mobile/Orange, the European Commission required a monitoring trustee when it gave its approval on condition that T-Mobile would provide certain forms of access to its network (EC, 2010). 15 For example, in the United States, Mitsubishi in 1985, and in Europe, Eco Swiss in 1999.

479
p r o c e d u r a L i n n o v a t i o n i n c o m p e t i t i o n L a w f o r s m a L L e c o n o m i e s
16 When the Commission approved the merger of telecommunications providers Telia/Sonera, they were required to offer competitors wholesale fixed and mobile network services and international wholesale roaming on the mobile networks in Sweden and Finland. A fast-track arbitration procedure was agreed to apply to disputes relating to the merged entity’s offer. Commission decision of 10 July 2002, OJ C201, 24.8.2002, at p. 19. Similarly, in connection with the merger of Vodafone Airtouch/Mannesmann, the merged entity undertook to provide roaming on services and to make certain standards and SIM cards available to its competitors. A fast-track arbitration procedure was approved for resolution of disputes between the merged entity and such competitors. Commission decision of 12 April 2000, OJ C141, 19.5.2000, p. 19.17 For example, the Australian Competition and Consumer Commission (ACCC) uses expert adjudication procedures to resolve disputes between businesses over compliance with undertakings (ICN, 2005).18 For example, fines for anticompetitive practices under Kenya’s Information and Communications Act may amount to 10 per cent of turnover, compared to less than US $100 000 under the Competition Act.19 For a discussion of this relationship, see Dunne, 2015.20 For example, the UK’s Financial Services (Banking Reform) Act 2013 created a Payment Systems Regulator (PSR) with the power to require an operator of a payment system to grant others access to it. The PSR’s Powers and Procedures Guide makes clear that parties to commercial disputes over access to payment systems must seek to resolve their dispute by commercial means before raising it with the PSR.21 Bahrain Telecommunications Act, section 68.22 In the United Kingdom, a mediation approach was used to consider the interests of financial institutions in sector reform. The Centre for Effective Dispute Resolution (CEDR) 2014 ‘Dialogue with the regulator’ brought together financial regulators and financial institutions.23 This occurred in the MasterCard/Visa case in the United States. See Green, (2006: 1194).

C o m p e t i t i o n a n d R e g u l a t i o n f o R i n C l u s i v e g R o w t h
480
REFERENCES
Albanese, A (2014) Judge orders mediation in latest e-book price-fixing suit, Publishers Weekly, 14 August. Available at: http://www.publishersweekly.com/pw/by-topic/digital/content-and-e-books/article/63679-judge-orders-mediation-in-latest-e-book-price-fixing-suit.html [Accessed 15 October 2017].
Aydin, U and Büthe, T (2015) Success and limits of competition law and policy in developing countries: Explaining variations in outcomes, exploring possibilities and limits. Paper for the Kenan/Rethinking Regulation Workshop, Duke University, 4 May. Available at: http://kenan.ethics.duke.edu/wp-content/blogs.dir/2/files/2015/04/AydinButhe_SuccessAndLimits_2015-04-27.pdf [Accessed 15 October 2017].
Bakhoum, M (2012) A dual language in modern competition law? ‘Efficiency approach’ versus ‘development approach’ and implications for developing countries, World Competition, 34(3): 495–522.
Beard, TR, Ford, GS, Spiwak, LJ and Stern, M (2015) Eroding the Rule of Law: Regulation as cooperative bargaining at the FCC. Phoenix Center Policy Paper No. 49, October. Available at: http://www.phoenix-center.org/pcpp/PCPP49Final.pdf [Accessed 15 October 2017].
Blanke, G (2006) The Use and Utility of International Arbitration in EC Commission Merger Remedies: A novel supranational paradigm in the making. Groningen: Europa Law Publishers.
Blanke, G and Landolt, P (eds) (2011) EU and US Antitrust Arbitration: A handbook for practitioners. Alphen aan den Rijn, Netherlands: Kluwer Law International.
Blanke, G and Nazzini, R (2009) Litigating, arbitrating and mediating competition law disputes. An Update, International Arbitration Attorney. Available at: https://apps.americanbar.org/buslaw/committees/CL150011pub/materials/articles/iclg-2009.pdf [Accessed 15 October 2017].
Bloomberg Business (2013) AMR, US Airways, U.S. Agree to Mediator in Antitrust Case, 29 October 2013. Available at: www.bloomberg.com/news/articles/2013-10-29/amr-us-airways-u-s-agree-to-mediator-in-antitrust-case [Accessed 15 October 2017].
BskyB/Kirch Pay TV in 2000, Commission decision of 21 March 2000, OJ C110, 14.4.2000
Chua, AL (1998) Markets, democracy and ethnicity: Towards a new paradigm

481
p r o c e d u r a L i n n o v a t i o n i n c o m p e t i t i o n L a w f o r s m a L L e c o n o m i e s
for law and development, 108, Yale Law Journal, 1. Available at: https://digitalcommons.law.yale.edu/cgi/viewcontent.cgi?referer=https://www.google.com/&httpsredir=1&article=1340&context=fss_papers [Accessed 10 January 2019].
Competition and Markets Authority (CMA) UK (2015) Guidance on the approval of voluntary redress schemes for infringements of competition law. Available at: https://www.gov.uk/government/uploads/system/uploads/attachment_data/file/453925/Voluntary_redress_schemes_guidance.pdf [Accessed 15 October 2017].
Drexl, J, Bakhoum, M, Fox, EM, Gal, MS and Gerber, DJ (2012) Competition Policy and Regional Integration in Developing Countries. Cheltenham: Edgar Elgar Publishing.
Dunne, N (2015) Competition Law and Economic Regulation: Making and managing markets. Cambridge: Cambridge University Press.
European Commission (EC) (2004) European Commission, Decision on merger of DONG/Elsam/Energi E2 (COMP/M.3868). Available at: http://ec.europa.eu/competition/mergers/cases/decisions/m3868_20060314_20600_en.pdf [Accessed 15 October 2017].
European Commission (EC) (2010) European Commission, Decision on Merger of T-Mobile/Orange (COMP/M.5650).
European Commission (EC) (2013) European Commission Recommendation on Common Principles for Injunctive and Compensatory Collective Redress Mechanisms in the Member States concerning Violations granted under EU Law, Official Journal of the European Union, 26 July.
European Commission (EC) (2015) European Commission Statement of Objections to Google on 15 April 2015 (Commission press release IP/15/4780, MEMO/15/4782 and STATEMENT/15/4785) and to Gazprom on 22 April 2015 (Commission press release IP/15/4828, MEMO/15/4829 and STATEMENT/15/4834).
Eco Swiss, Case C-126/97, [1999] ECR I-3055, ECJ, 1 June 1999.Fikentscher, W (2001) Market Anthropology and Global Trade, 1(1) Gruter
Institute Working Papers on Law, Economics and Evolutionary Biology 1.Fox, EM (2008) Antitrust, economic development and poverty: The other path.
In H Qaqaya and G Lipimile (eds) The Effects of Anticompetitive Business Practices on Developing Countries and their Development Prospects. Geneva: UNCTAD.

C o m p e t i t i o n a n d R e g u l a t i o n f o R i n C l u s i v e g R o w t h
482
Available at: http://unctad.org/en/Docs/ditcclp20082_en.pdf [Accessed 15 October 2017].
Fox, EM (2012) Competition, development and regional integration: In search of a competition law fit for developing countries. Economics Research Paper Series, s. 2-3.
FTC (2008) A conference on charting the future course of international technical assistance, Sponsored by the Federal Trade Commission and the Department of Justice. Available at: http://www.justice.gov/sites/default/files/atr/legacy/2008/09/08/236894.pdf [Accessed 15 October 2017].
FTC (2009) Charting the Future Course of International Technical Assistance at the Federal Trade Commission and U.S. Department of Justice, Issued by The Federal Trade Commission Staff and U.S. Department of Justice, October 2009.
Gal, MS and Fox, EM (2014) Drafting Competition Law for Developing Jurisdictions: Learning from experience, New York University Law and Economics Working Papers 4-2014. Available at: http://lsr.nellco.org/cgi/viewcontent.cgi?article=1378&context=nyu_lewp [Accessed 15 October 2017].
Gal, MS and Fox, EM (2015) Drafting competition law for developing jurisdictions: Learning from experience. In MS Gal, M Bakhoum, J Drexl, EM Fox and DJ. Gerber, Economic Characteristics of Developing Jurisdictions: Their implications for competition law. Cheltenham: Edward Elgar Publishers.
Gerber, DJ (2014) Adapting the Role of Economics in Competition Law: A developing country dilemma. Available at: http://papers.ssrn.com/sol3/papers.cfm?abstract_id=2426359 [Accessed 15 October 2017].
Green, ED (2006) Re-examining mediator and judicial roles in large, complex litigation: Lessons from Microsoft and other megacases, 86 Boston University Law Review, 1171. Available at: https://pdfs.semanticscholar.org/7478/cdfda6c83668d394fd049f27ef483c3760b1.pdf [Accessed 15 October 2017].
Hazel, DR (2015) Competition in context: The limitations of using competition law as a vehicle for social policy in the developing world, Houston Journal of International Law, 37.
International Competition Network (ICN) (2005) Merger Remedies Review Project, Report for the fourth ICN annual conference, Bonn, June. Available at: http://www.internationalcompetitionnetwork.org/uploads/library/
483
p r o c e d u r a L i n n o v a t i o n i n c o m p e t i t i o n L a w f o r s m a L L e c o n o m i e s
doc323.pdf [Accessed 15 October 2017].International Competition Network (ICN) (2006) Examples of Legislative Text,
Rules, and Practices that Conform to Selected ICN Guiding Principles and Recommended Practices for Merger Notification and Review Procedures. Available at http://www.internationalcompetitionnetwork.org/uploads/library/doc325.pdf [Accessed 15 October 2017].
International Competition Network (ICN) (2007) Interaction of Public and Private Enforcement in Cartel Cases, Report to the ICN annual conference, Moscow, May. Available at: http://www.internationalcompetitionnetwork.org/uploads/library/doc349.pdf [Accessed 15 October 2017].
International Competition Network (ICN) (2008) Cartel Settlements, Report to the ICN Annual Conference, Kyoto, Japan, April. Available at: http://www.internationalcompetitionnetwork.org/uploads/library/doc347.pdf [Accessed 15 October 2017].
International Finance Corporation (IFC) (2010) Alternative Dispute Resolution Program (ADR) in the Western Balkans: Giving mediation a chance. Available at: http://www.ifc.org/wps/wcm/connect/ 991 f510047e98d59a52ebd6 f97 f e9d91/Pub l i c a t i onBa l k an s GivingMediationaChanceADRStory.pdf?MOD=AJPERES [Accessed 15 October 2017].
Kaira, T (2013) The role of SMMEs in the formal and informal economy in Zambia: The challenges involved in promoting them and including them in competition regulation. In D Lewis (ed.) Building New Competition Law Regimes: Selected essays. Cheltenham: Edward Elgar Publishing.
Komninos, AP (2001) Arbitration and the modernisation of European Competition Law enforcement. In C-D Ehlermann and I Atanasiu (eds) European Competition Law Annual 2001: Effective private enforcement of EC Antitrust law. London: Bloomsbury.
Kovács, C and Reindl, AP (2013) The evolution of the Hungarian competition regime: 2 decades of dynamic change and continuity. In D Lewis (ed.) Building New Competition Law Regimes: Selected essays. Cheltenham: Edward Elgar Publishing.
Kovacic, W (ND) Presentation of history of competition law. Available at: http://www.internationalcompetitionnetwork.org/uploads/library/doc938.pdf [Accessed 15 October 2018].

C o m p e t i t i o n a n d R e g u l a t i o n f o R i n C l u s i v e g R o w t h
484
Landolt, P (2012) Arbitration and Antitrust: An overview of EU and national case law, e-Competitions, 13 April.
Licetti, MM (2013) Combating Cartels in Developing Countries: Implementation challenges on the ground, Competition Policy International. Available at: https://www.competitionpolicyinternational.com/assets/Uploads/CartelSeptember1.pdf [Accessed 15 October 2018].
Macmillan, R (2010) The Liberalisation of ICT Dispute Resolution, Trends in Telecommunication Reform, Chapter 2, International Telecommunications Union.
Macmillan, R et al (2006) Decision No. 2 of 2006. Available at: http://www.macmillankeck.pro/media/pdf/Trinidad%20and%20Tobago%20Arbitration%20Decision%2016082006.pdf [Accessed 15 October 2018].
Microsoft (2000–2014) United States v. Microsoft Corp., 87 F. Supp. 2d 30 (D.D.C. 2000); United States v. Microsoft Corp., 253 F.3d 34 (D.C. Cir. 2001); United States v. Microsoft Corp., 231 F. Supp. 2d 144 (D.D.C. 2002); Massachusetts v. Microsoft Corp., 373 F.3d 1199 (D.C. Cir. 2004); Complaint, Microsoft, 87 F. Supp. 2d 30 (Civ. No. 98-1232). Available at: http://www.usdoj.gov/atr/cases/f1700/1763.htm; Motion of Defendant Microsoft Corp. To Consolidate, Microsoft, 87 F. Supp. 2d 30 (Civ. No. 98-1232), 1998 WL 34201999; Proposed Final Judgment, Microsoft, 231 F. Supp. 2d 144 (Civ. No. 98-1232). Available at: http://www.usdoj.gov/atr/cases/f9400/9462.htm; Revised Proposed Final Judgment, Microsoft, 231 F. Supp. 2d 144 (Civ. No. 98-1232). Available at: http://www.usdoj.gov/atr/cases/f9400/9495.htm; and Competitive Impact Statement, Microsoft, 231 F. Supp. 2d 144 (Civ. No. 98-1232) Available at: http://www.usdoj.gov/atr/ cases/f9500/9549.htm [Accessed 15 April 2018].
Mitsubishi v Soler Chrystler-Plymouth, 473 U.S. 614 (USSC, 1985).Nazzini, R (2009) Litigating, arbitrating and mediating competition law
disputes, CDR News, 6 February. Available at: www.cdr-news.com/categories/arbitration/litigating-arbitrating-and-mediating-competition-law-disputes#specificsiii [Accessed 15 October 2018].
Nicholson, M, Sokol, D and Stiegert, K (2006) Technical Assistance for Law and Economics: An empirical analysis in antitrust/competition policy, University of Wisconsin Law School Research Paper No. 1025. Available at: http://papers.ssrn.com/sol3/papers.cfm?abstract_id=917909 [Accessed 15 October 2018].

485
p r o c e d u r a L i n n o v a t i o n i n c o m p e t i t i o n L a w f o r s m a L L e c o n o m i e s
OECD (2003) Global Forum on Competition, Competition Policy and Small Economies. Available at: http://www.oecd.org/daf/competition/prosecutionandlawenforcement/2486724.pdf [Accessed 15 October 2018].
OECD (2010) Hearings, Arbitration and Competition. Available at: www.oecd.org/competition/abuse/49294392.pdf [Accessed 15 October 2018].
Roberts, S, Tapia, J and Ybar, M (2013) The same and the other: A comparative study of abuses of dominance in Chile and South Africa. Centre for Competition, Regulation and Economic Development, University of Johannesburg, Working Paper 2/2013. Available at: http://static.squarespace.com/static/52246331e4b0a46e5f1b8ce5/t/52d8f04ee4b049910d1d4d0a/1389949006793/CCE%20Working%20Paper%2002-%202013%20Chile_SouthAfrica.pdf [Accessed 15 October 2018].
Sánchez Ugarte, F, et al (2002) Advocacy and Competition Policy. Report by the ICN Advocacy Working Group for the ICN Conference in Naples, Italy.
Sokol, DD and Stiegert, K (2007) An Empirical Evaluation of Long Term Advisors and Short Term Interventions in Antitrust Technical Assistance and Capacity Building, Global Competition Law Centre. Available at: http://ssrn.com/abstract=1095884 [Accessed 15 October 2018].
Sokol, DD, Cheng, TK and Lianos, I (2013) Competition Law and Development. Stanford, CA: Stanford University Press.
Soto, H de (1989) The Other Path: The invisible revolution in the Third World. New York: Harper and Row.
Tapia, J and Roberts, S (2013) Abuses of dominance in developing countries: A view from the South, with an eye on telecommunications. In M Gal, J Drexl, E Fox, D Gerber and M Bakhoum (eds) The Economic Characteristics of Developing Jurisdictions and their Implications for Competition Law. Cheltenham: Edward Elgar Publishers.
Travelpulse (2013) American, US Airways agree to mediation with DOJ over merger. Available at: www.travelpulse.com/news/airlines/american-us-airways-agree-to-mediation-with-doj-over-merger.html [Accessed 15 October 2018].
Ysewyn, J (2006) Private enforcement of competition law in the EU: Trials and tribulations. 19 SPG International Law Practicum, 14, 15.


487
c o n c L u s i o n
Conclusion
Building institutions for competition enforcement and regional integration
in southern Africa
Mark Burke, Tamara Paremoer, Thando Vilakazi and Tatenda Zengeni
INTRODUCTION
Nine countries in southern Africa are part of a global trend in which countries have established regimes with authorities to enforce competition law. Over the past 20 years, competition authorities have become operational in Botswana, Malawi, Mauritius, Namibia, South Africa, Swaziland, Tanzania, Zambia and Zimbabwe. Increasingly, competition policy is regarded as an important facilitator of economic integration in the context of regional trade and development blocks such as the Southern African Development Community (SADC) (Bakhoum, 2012). The adoption of specific competition policy provisions by regional organisations, such as the 2009 Declaration on Regional Cooperation in Competition and Consumer Policies1 adopted by SADC countries, is indicative of this trend.
This chapter examines the competition law enforcement record of authorities in southern Africa in the context of regional industrial development and integration, highlighting both the challenges of doing so with limited capacity and in relatively small economies with low levels of development. It draws on a number of studies undertaken by the Centre for Competition Regulation and Economic Development

C o m p e t i t i o n a n d R e g u l a t i o n f o R i n C l u s i v e g R o w t h
488
(CCRED). Insights from these studies enabled the authors to map the key competition issues arising from increasing integration of markets in the southern African region and efforts to modernise, upgrade and diversify economies through industrial policy. The review of competition research and value chain studies on southern Africa found that firms are playing an important role in the process of economic integration of the region. In the process, however, there have been examples of firms exporting restrictive business practices such as collusion and raising barriers to entry to ensure that they entrench their market power and protect local markets from competitors.
Competition authorities in the region have to implement their enforcement mandate with limited experience and resources, against powerful interests. In 2016, the nine competition authorities had a total staff complement of 472 members and a combined budget of US $38.1 million to exercise their mandate. In addition, the research points to issues in existing legislative frameworks and institutional designs that may also constrain effective competition enforcement. The aim is to identify and select key issues for further study to understand the institutional development needs of competition authorities into the future.
Publicly available data were collated and verified with competition authorities to establish their enforcement record over the period 2014–2016. Interviews with senior leaders and managers from competition authorities aided in identifying the state of capacity in competition authorities in the context of their institutional designs and legislative frameworks, with a view to identifying the key constraints they face in enforcing competition law. The review of institutional designs and legislative frameworks involved document analysis of the relevant legislation for each country.
KEY FACTORS SHAPING THE EMERGENCE OF COMPETITION REGIMES IN SOUTHERN AFRICA
The competition regimes of the nine countries that are the focus of this study are developing in a particular regional context, characterised by specific challenges that influence their evolution. These countries have

489
c o n c L u s i o n
diverse resource endowments with relatively small economies (Table C.1). In thinking about competition policy in southern Africa, we need to be mindful of the particular challenges that each country faces. There are some common concerns across the region, notwithstanding the differences across countries. These include the small size of domestic markets, low levels of industrialisation and diversification, high levels of concentration and, in many countries, a history of systematic exclusion of the majority of the population from full and meaningful economic participation.
Table C.1: Country populations, economic output and growth
CountryPopulation, 2015 (million)
GDP, 2015 (current US $ billion)
Average GDP Growth (2011–2015)
Botswana 2.3 14.4 4.7%
Malawi 17.2 6.4 4.1%
Mauritius 1.3 11.7 3.6%Namibia 2.5 11.5 5.5%South Africa 55.0 314.6 2.1%Swaziland 1.3 4.1 2.9%Tanzania 53.5 45.6 6.8%
Zambia 16.2 21.2 5.2%
Zimbabwe 15.6 14.4 6.3%
Source: World Bank Development Indicators
The need for a coherent approach to competition enforcement in the context of small regional markets
In an increasingly integrated world, business practices (including restrictive practices) can be exported into new markets entered by multinational firms. Closer scrutiny is required of mergers and acquisitions in countries in the region, which may on the surface appear to be efficiency enhancing and unproblematic. Regional markets in key sectors are already concentrated and there is limited potential competition from firms that may operate in adjacent or neighbouring

C o m p e t i t i o n a n d R e g u l a t i o n f o R i n C l u s i v e g R o w t h
490
country markets, partly because many of the same firms are present across countries.
Dominant firms can further reinforce their market power by lobbying strongly for regulatory provisions to block entrants and protect the positions of the insiders. They can also exploit their insider information and ability to mount arguments for their interests, such as through the policy research that they commission. The implication is that economies with higher levels of concentration and higher barriers to entry may need stronger policies towards abuse of dominance (Vickers, 2007). That said, the dominance debate is more nuanced in smaller economies that have to consider the efficiency benefits of concentration, which allows firms to exploit economies of scale in smaller markets. Concentrated industries may generate productive efficiencies and lower the unit costs of production, partly explaining why many industries in small economies tend towards monopoly and oligopoly (Gal, 2003).
Closer regional integration is regarded as vital for enabling industrialisation, despite the challenges to promoting competition in smaller economies. The SADC Regional Industrialisation Strategy and Roadmap regards industrialisation as a function of diversification and structural transformation (SADC, 2015). This strategy calls on countries to elevate the role of competitiveness as a driver of economic development.
Competition and regional industrial development
Regional industrial development, understood broadly, entails the formation of linkages within and across value chains and industries. Potential gains arise from shared production, transfer of skills and technology, and market development between countries (Fessehaie, Roberts and Takala-Greenish, 2015). In southern Africa, links already exist between countries and these have grown considerably since the early-2000s, although primarily based on goods exported from South Africa to neighbouring countries. The share of South Africa’s manufactured exports (excluding basic chemicals and basic metals) to the SADC grew from 18 per cent in 2000 to 28 per cent in 2014 (Fessehaie,

491
c o n c L u s i o n
Roberts and Takala-Greenish, 2015). In retail and consumer goods, these flows between countries mainly comprise ‘intra-company’ shipments of products from distribution centres of retail groups in South Africa to stores located throughout the region (Paelo and Vilakazi, 2017).
Different countries have focused their economic policy towards diversifying production activities from mining-related exports and developing local production capacity for consumer goods. For example, Zambia has focused on growing its non-copper merchandise exports into the region, including electrical equipment and machinery, sulphur, animal feed and residues from the food industry since the early 2000s (World Bank, 2014). The country is also focused on growth in food products such as sugar exports (World Bank, 2014). However, the existence of a monopoly producer of household and industrial sugar upstream has raised concerns regarding the high price of sugar as an input to downstream sugar confectionery, beverages and related products. As such, the development of the downstream industries is constrained, despite the fact that Zambia is considered an internationally competitive, low-cost producer of sugar with a level of output that far exceeds domestic demand (Chisanga and Sitko, 2013; Fessehaie et al, 2015). Notably, this example demonstrates the important link between competition policy and industrial development.
The dimensions of competitive interaction between firms are different across countries, but there are common themes that emerge in different country markets. There is ample evidence that various cartels involving notionally South African firms have actually stretched across the Southern African Customs Union (SACU) and other SADC countries (Roberts, Simbanegavi and Vilakazi, 2017). The cement cartel uncovered in South Africa affected all of the SACU and specific country markets were allocated to different producers. Similarly, collusive arrangements in scrap metal, construction, concrete pipes and culverts, pilings, steel products and industrial gases all affected at least two countries in southern Africa (Kaira, 2015; Roberts et al, 2017). More broadly, the fact that country markets in southern Africa are relatively small and the presence of high-scale economies in the production of certain goods

C o m p e t i t i o n a n d R e g u l a t i o n f o R i n C l u s i v e g R o w t h
492
mean that firms organise production and distribution on a regional level. As such, competition enforcement should consider issues at a regional level, as outcomes in one country may, in fact, be the result of broader anticompetitive arrangements at a regional level.
Presence of related firms in different country markets
The presence of related firms that are part of multinational groups in different country markets across the region presents obstacles to competition across borders. In several industries, including sugar, cement and poultry, which are generally characterised by significant scale economies, firms are both vertically and horizontally present across several southern African countries. This can either be through subsidiary firms in the same industry or through close partners in different countries supplying similar or competing products or inputs. The value chains of firms, therefore, stretch across borders. Governance of value chains at a regional level means control of key inputs and facilities, and often the entire regional market and the ability to develop competitive strategies at this level.
An example of this is Lafarge Cement’s presence in several countries in southern and East Africa (Mbongwe et al, 2014). The firm has been investigated for collusive conduct and/or excessive pricing of cement in multiple countries, and has largely ‘exported’ anticompetitive conduct and practices, not only from the South African market where there was a cartel, but from its larger European holding company as well. Similarly, large South African producers in poultry and sugar effectively control the regional market, and in both sectors there is a history of close coordination between producers (Bagopi et al, 2016; Chisanga et al, 2016).
Barriers to entry and competition concerns at multiple levels of the value chain
Large multinational firms operating across the region generally enjoy the benefits of being integrated through the value chain and being present in different geographic markets. In this context, it is important

493
c o n c L u s i o n
to note the specific challenges that dominance and extensive vertical integration present within a value chain. Notably, vertical integration can be efficiency-enhancing to the extent that it enables firms to rationalise operations and to eliminate double-margins throughout the value chain. However, firms seeking to compete in these (concentrated) markets are generally required to enter at multiple levels of the value chain, and thus at far greater expense. The poultry value chain is an important example of this. Firms may need to enter at breeding, feed production and broiler production to be effective rivals (Bagopi et al, 2016; Ncube et al, 2016a). This is a structural feature of certain markets, particularly in agro-processing, which cannot easily be addressed.
Other barriers include high capital investment costs, poor connectedness of new firms throughout the value chain for key inputs and distribution, and the lack of access to effective routes to market (Ncube et al, 2016a). Changing these dynamics across countries requires coordinated policies that are sector-specific, in conjunction with competition law enforcement, to reduce strategic and structural barriers. Understanding who governs the value chain and the terms of access to it is, therefore, just as important as understanding constraints to greater efficiency such as poor border controls.
ANALYSIS OF COMPETITION LAW ENFORCEMENT AND CAPACITY IN SOUTHERN AFRICA
The institutional capacities of competition jurisdictions are reviewed in terms of institutional designs, organisational capacity and emerging strategic practices. Many of the insights on the experiences of different competition authorities draw from the detailed interviews conducted with authority representatives. Institutional design is considered in the context of competition law enforcement for the period 2014–2016.
Record of competition law enforcement
Given the range of related competition issues raised earlier, it is important to assess the actual record (and limitations) in terms of competition enforcement to address these.

C o m p e t i t i o n a n d R e g u l a t i o n f o R i n C l u s i v e g R o w t h
494
Restrictive business enforcement cases
This section provides an analysis of all restrictive business practice (RBP) enforcement cases, which the authorities initiated and/or completed over the three-year period from 2014 to 2016. The dataset was compiled from publicly available sources. The different competition authorities reviewed their respective case lists and confirmed that the database included all relevant cases from their respective jurisdictions during this period.2
Table C.2: Enforcement cases in SADC, 2014–20163
Contravention
Bot
swan
a
Mal
awi
Mau
riti
us
Nam
ibia
Sout
h
Afr
ica
Swaz
iland
Tanz
ania
Zam
bia
Zim
babw
e
TOTA
L
Abuse of dominance 20 6 22 4 33 2 7 2 5 104
Cartel 15 3 6 3 69 6 3 105
Exemption 3 4 6 13
Failure to meet merger conditions 1 1 2
No information 1 36 37
Not a competition issue 1 1 2
Prior implementation 4 7 1 16 1 29
Retail price maintenance 3 3
TOTAL 38 18 33 7 154 3 30 6 6 295
Source: Competition authority data
In total, 295 enforcement cases were identified over the three-year period (Table C.2). The RBP case load is split evenly between abuse of dominance (104 cases) and cartel cases (105 cases), although authorities have achieved more success in the prosecution of cartel cases than abuse cases during this period. Notably, the data include

495
c o n c L u s i o n
cases that were initiated (either by third-party complainants or the competition authorities), although not all cases were successfully prosecuted or led to a finding against companies. Many, in the case of cartels, were also concluded through settlement agreements with the respondents.
South Africa accounts for 154 (52 per cent) of all enforcement cases over the period, followed by Botswana with 38 cases, Mauritius with 33, Tanzania with 30, Malawi with 18 and Namibia, Zambia, Zimbabwe, Swaziland and Tanzania with fewer than 10 cases each. An evaluation of the case load by type of conduct, however, reveals an interesting pattern. Although South Africa accounts for most of the collusion cases (66 per cent of all collusion cases), abuse of dominance is more evenly spread between South Africa (32 per cent of abuse cases), Botswana (19 per cent) and Mauritius for (21 per cent) (Figure C.1). The comparatively large number of abuse cases in Botswana and Mauritius relative to South Africa and relative to recorded cartel cases in each country, supports the proposition that concentration and anticompetitive conduct by dominant firms may be more pronounced in smaller economies.
A breakdown of enforcement cases by sector (Figure C.2) shows a large number of enforcement cases in basic goods or services such as food and beverages (the sector with the highest number of cases), healthcare and financial services.4 The large numbers of cases in food value chains is concerning given consumption growth in the region for processed foods, and concerns around agricultural sustainability and food security. Furthermore, sectors that provide the backbone for economic growth and integration, such as construction, transport, business services and telecommunications, are also characterised by a relatively large number of competition concerns. Wholesale and retail trade, which is a critical route to market for consumer goods, is also among the top 10 sectors by number of cases.

C o m p e t i t i o n a n d R e g u l a t i o n f o R i n C l u s i v e g R o w t h
496
Figure C.1: Comparison of case load per country, 2014–2016
Source: Competition authority data
It is important to note that, because the number of cases is heavily influenced by South Africa (see Figure C.3), the sector breakdown is necessarily also influenced by the strategic decision of the Competition Commission of South African (CCSA) to prioritise certain sectors. In the 2015/16 financial year, the CCSA prioritised telecommunications, waste management, broadcasting, transport, healthcare, grocery retail and food (particularly fresh produce). Figure C.3 clearly shows that South Africa accounts for most of the cases in construction and transport, for example. Interestingly, it is only in food and beverages that all countries have recorded enforcement cases, indicating that industrial and competition policy should continue to focus on facilitating entry and lowering barriers to entry in the agro-processing sector.

497
c o n c L u s i o n
Figure C.2: Breakdown of enforcement cases by sector
Source: Competition authority data
Figure C.3: Country contribution to enforcement cases by sector
Source: Competition authority data

C o m p e t i t i o n a n d R e g u l a t i o n f o R i n C l u s i v e g R o w t h
498
Merger cases
Over the period 2014–2016,5 1 595 merger cases were identified across the eight jurisdictions in southern Africa evaluated in this study (Figure C.4). We note that the compulsory notification of mergers in most regimes imposes an obligation on firms to notify merger activity and ensures that cases are brought to authorities proactively.6 Finalised merger cases are also heavily weighted towards South Africa (Figure C.4), which accounted for 1 090 (68 per cent) of all merger cases over the three years. Though there are some concerns about the completeness of the data reported for other jurisdictions (see endnote 3), the large number of cases in South Africa is consistent with it being the largest economy in the region.
Figure C.4: Finalised merger cases, 2014–2016
Source: Competition authority data
The aggregate merger activity is broken down by sector to identify whether there are some parts of the economy where merger activity (and associated concentration of industries) is more prevalent (Figure C.5).7 The largest category – business services, financial intermediation,

499
c o n c L u s i o n
insurance and real estate – accounts for approximately 33.4 per cent of mergers over the period. Most of the mergers in this sector are property mergers and many of the acquiring firms in the property mergers are institutional investors such as banks and pension funds. Consolidation in ownership of commercial property (including, in some of the cases reported here, shopping malls, offices and commercial farming land) requires more careful analysis as the decisions of property owners often directly affect routes to market for consumer goods, through shopping malls.
Figure C.5: Finalised mergers by sector, 2014–2016
Source: Competition Authority data
The second largest category in terms of the absolute number of mergers is wholesale and retail trade, followed by manufacturing. There were 169 mergers in wholesale and retail trade over the period, and 31 of these were mergers related to vehicle dealerships. Due to the multinational nature of retail firms, a particular retail merger is often notified in a number of jurisdictions in southern Africa.

C o m p e t i t i o n a n d R e g u l a t i o n f o R i n C l u s i v e g R o w t h
500
There are also quite a large number of supermarket mergers in the period, with at least 17 identified across all jurisdictions in the three-year period. Seven of these mergers involved the Spar Group, potentially signifying a move from standalone/privately branded retailers to a more corporate format. Both of the retail mergers in Namibia were acquisitions by Sefalana Cash & Carry and the data also show the continued expansion of Choppies, the Botswana-based retailer, into South Africa, Tanzania and Zambia. The merger data thus confirm the increasing importance of formal, corporatised supermarkets as a route to market across the region.
The mergers in the manufacturing sector cover a broad range of subsectors, including packaging material (17 of 146 manufacturing mergers), chemical products (13 of 146 manufacturing mergers) and automotive components (eight of 146 manufacturing mergers). An area for further research is the seemingly large number of mergers in the packaging sector and its effect on the bargaining power of small and new entrants in the fast-moving consumer goods sector (including processed food and cosmetics).
Mergers in the agricultural sector also show interesting trends worth noting for further evaluation. For example, there are six seed mergers out of a total of 53 mergers in the agricultural sector over the period. Surprisingly, five of these mergers took place in one jurisdiction: Zimbabwe (four in 2015 and one in 2014).
Legislation and enforcement outcomes
The design of legislation can affect the number and type of cases that are taken on by authorities, along with patterns of growth in the economy. In some cases, the specific wording and structure of the legislation can constrain the ability to take on and successfully prosecute certain abuse of dominance cases, for example. This section does not aim to provide a detailed review of all aspects of legislation, but rather highlights key issues in the restrictive business practices and merger legislation, as well aspects that vary or are common between countries.

501
c o n c L u s i o n
Key issues in restrictive business practice legislation
The framing of legislation on unilateral conduct (abuse of dominance) sets the legal hurdle that has to be met. Formulations broadly differ between those that specify that dominant firms have a special obligation not to prevent, lessen or distort competition (following the EU approach) and the wording of the South African law, which provides that the effects of the specific conduct must outweigh its technological or efficiency benefits. In developing countries, where there are more likely to be entrenched dominant firms, given the small size of domestic markets, it is less likely that an authority can easily demonstrate the economic effects of the conduct in undermining what are probably only potentially efficient entrants and smaller rivals. In other words, fair competition may be distorted by the arrangements of the dominant firm but it is speculation as to how significant the impact has been as there has not been a period of competition against which to compare.
The existence of an overwhelmingly dominant undertaking in an industry for a significant period of time also means entry is less likely, even though prices are set above competitive levels, because of other entry-deterring strategies employed by the incumbent firm, including investments in excess capacity or developing a reputation for aggressive actions to undermine rivals. This is an ‘effect’ of the dominance, although it cannot necessarily be demonstrated (as in entry may never have been attempted given the strength of the incumbent).
There are also differences in setting the threshold for dominance. Botswana, Namibia, Tanzania, South Africa and Zambia all use market shares to define a dominant position. For instance, in South Africa and Namibia, a firm is dominant if it has a market share above 45 per cent. However, both of these countries also have an intermediary threshold of between 35 per cent and 45 per cent market share, wherein the firm has to demonstrate that it does not have market power; and below 35 per cent where it can be shown that the firm has market power. In Zambia, there is a single threshold percentage, which is relatively less difficult to implement or prove.
Malawi, Swaziland and Zimbabwe do not have specific thresholds for

C o m p e t i t i o n a n d R e g u l a t i o n f o R i n C l u s i v e g R o w t h
502
a dominant position in the legislation. The implication of not having a market threshold can be assessed in the case of Swaziland and Zimbabwe, where it is possible that a firm with a low market share of, say, 10 per cent can be prosecuted if the competition authorities can prove that it has market power. In Zimbabwe this relates to the ability of an enterprise to profitably raise (or lower) or maintain prices above a competitive level for a product or service for a sustained period of time. To some degree this increases the burden of proof for the authority in terms of showing the existence of market power. However, it is effectively not different from the approach in South Africa and Namibia where, in any event, there would have to be evidence led to demonstrate significant market power if the firm has a low market share. The absence of a clear threshold does mean that this exercise would have to be conducted for all cases of potential abuse of dominance, even where a firm clearly has very high market shares.
Tanzania is slightly different from the other countries since a firm has to meet two conditions to be considered dominant, that is, it has to have market power and it has to have a market share in excess of 35 per cent. This implies that a firm with market power and a market share of, say, 30 per cent (considered dominant in Zambia) is not considered to be dominant in Tanzania. A firm with a market share of 60 per cent without market power being demonstrated is also not considered dominant in Tanzania, although it would be in most other countries. Botswana, Mauritius and Zambia are the only countries that have a definition that includes collective dominance in their Acts, where three or more firms control sales or market share above a threshold of about 60 per cent or more.
Authorities in many countries in the region use primarily effects-based approaches that focus on the economic impact that conduct has on consumers and competition to determine whether dominant firms are harming competition. One would expect developing countries to apply form-based tests, given a low industrial base, more entrenched quasi monopolies and high barriers to entry, implying that abuse of dominance is more widespread and damaging (Roberts, 2010).

503
c o n c L u s i o n
Cartels and corporate leniency
Corporate leniency programmes or policies (CLPs) for collusion were being applied by five of the nine countries, namely, Botswana, Mauritius, South Africa, Swaziland and Zambia, as of June 2017. However, only in South Africa was the programme well established, having been introduced in 2004. South Africa has had major successes in terms of increases in the initiation and prosecution of cartel cases through firms coming forward to admit to cartel violations in exchange for leniency (Muzata, Roberts and Vilakazi, 2017). Namibia and Tanzania were drafting leniency programmes in 2017, while Malawi and Zimbabwe did not have programmes. The Zimbabwe authority noted that a key factor that it would consider in introducing a CLP is whether the level of fines for cartels – which are exceptionally low in Zimbabwe – could be increased to increase the effectiveness of a CLP. This is because firms are more likely to face an incentive to come forward to settle matters if they consider that the probability of getting caught is high, and if fines from not settling cases are perceived to be high.
Most jurisdictions (Botswana, Mauritius, Namibia, Tanzania, South Africa and Zambia) apply a cap on penalties of up to 10 per cent of the turnover of the enterprise. Malawi and Zimbabwe have very low caps on financial penalties of US $689 and $5 000, respectively. In Malawi, Swaziland and Zimbabwe, fines may be accompanied by personal criminal liability, of a maximum of 5 years’ imprisonment in the case of Malawi, although in practice this has not occurred. Overall, however, the international literature suggests that penalties are not nearly high enough across most jurisdictions to effectively deter cartel conduct.
A number of cartel cases prosecuted by the authority in Malawi involve industry associations and industry-level agreements on prices, such as in the minibus taxi industry, and, most recently, issues to do with logistics service providers following a market inquiry in transport conducted by the authority.8

C o m p e t i t i o n a n d R e g u l a t i o n f o R i n C l u s i v e g R o w t h
504
Cases with international firms and the prominence of South African firms
The majority of authorities interviewed pointed to the fact that a large proportion of merger cases with which they have dealt concern South African companies or acquirers. In Malawi, the most cases have involved firms from South Africa, followed by Mauritius-registered companies and those from Kenya.9 Botswana has also experienced a high number of mergers involving South African firms. About 75 per cent of merger cases overall involve foreign firms, including some acquiring firms from Mauritius. Some of the ‘Mauritian’ entities are, in fact, South African companies with subsidiaries registered there. In Swaziland, around half of cases involve acquisitions by foreign firms, although many firms present in Swaziland are in any case present in South Africa.10
Similarly, the Zimbabwe authority has dealt with acquisitions by foreign firms, primarily from South Africa and some from Mauritius, as firms increasingly invest strategically in the country.11
There is an increasing trend of cases involving international firms (not primarily from South Africa), and there is limited involvement of South African firms in RBP cases. As Mauritius offers significant tax benefits to firms registered there, the number of cases with international firms and dimensions has also risen. RBP cases with international dimensions include those recent cases involving Western Union, for example. Similarly, for Tanzania, while there is still a significant proportion of acquiring firms that originate from South Africa, there is, in fact, a large portion of mergers that involve firms from Mauritius and neighbouring Kenya. A large number of cases relate to financial services and insurance, which includes acquisitions by large financial services companies registered in Mauritius.
Merger regulation
Most countries define a merger notification threshold based on the combined assets or turnover of the companies, although there are exceptions. Malawi and Swaziland are the only countries that do not have a monetary merger notification threshold thus requiring that the

505
c o n c L u s i o n
authority be notified of all mergers. Malawi relies on detecting mergers that take place through intelligence gathered and monitoring of the market. This can sometimes lead to problems where parties approached to notify a merger may contest the role of the authority to intervene or the need to notify.12 Mauritius does not have a monetary threshold but uses a market-share threshold, which is potentially challenging to enforce as firms can make arguments regarding the definition of economic markets.
Indications from interviews conducted are that authorities are regularly adapting their approach to merger evaluation to improve the efficiency in the process and as the need arises internally. The South African authority reviewed its service standards in 2015 due to growing volumes in the number of notifiable mergers and the increasing complexity of investigations, thus basically allowing more time for large mergers while maintaining a fast-tracking system for non-problematic cases. Similarly, Zambia issued merger guidelines that clarify a two-phase process of assessing merger applications starting with phase one, which is conducted by the commission’s management in the first 35 calendar days after notification and through which non-problematic cases are fast-tracked for approval by the commission’s full board. The second phase is for mergers that raise competition concerns and require more time for investigation. In Botswana, the Competition Authority introduced a ‘fast-track system’ in 2014, in which they conduct a preliminary assessment of merger applications to determine whether they raise competition concerns. Applications that do not raise clear competition concerns (for example, where horizontal mergers do not result in a combined market share exceeding 10 per cent) are fast-tracked and completed within 14 days. Fast-tracking of merger decisions in this way is done in almost all of the authorities to free up resources for the assessment of more complex merger applications.
Almost all authorities consider in some form various public-interest factors in assessing mergers, although these factors may not be explicitly stated in a separate public-interest clause. In most cases, authorities are required to bear in mind (along with competition tests)

C o m p e t i t i o n a n d R e g u l a t i o n f o R i n C l u s i v e g R o w t h
506
whether a merger is likely to have an effect on employment (losses). In Zimbabwe, the Competition Act takes a broader view of public interest, as it recognises that any prohibited conduct, which is to the detriment of free competition, is regarded as being contrary to public interest.
Institutional design
Institutional design encompasses a range of dimensions, including the goals of competition law, enforcement models, powers, structures and instruments (Jenny, 2016). There is significant variation in the institutional designs in the countries under review, notwithstanding a number of dominant features that emerge from the analysis. This section draws attention to the enforcement models adopted, mandates and leadership structures of the competition authorities in the nine countries.
Table C.3: Key dimensions of institutional design
Jurisdictions Enforcement model Mandates Leadership structure
Botswana Integrated Agency Competition Multimember board
Malawi Integrated AgencyCompetition & consumer protection
Multimember board
Mauritius Integrated Agency Competition Multimember board
Namibia Integrated Agency Competition Multimember board
South Africa Bifurcated Agency Competition Unitary executive
Swaziland Integrated AgencyCompetition & consumer protection
Multimember board
Tanzania Bifurcated AgencyCompetition & consumer protection
Multimember board
Zambia Bifurcated AgencyCompetition & consumer protection
Multimember board
Zimbabwe Integrated AgencyCompetition & consumer protection
Multimember board
Source: Authors’ compilation

507
c o n c L u s i o n
Enforcement models
There are two main enforcement models that underpin the design of competition policy implementation in the region, each with its specific strengths and weaknesses. In the Integrated Agency Model, the competition authority investigates and adjudicates cases, whereas in the Bifurcated Agency Model, the competition authority conducts the investigation and brings it before a specialised competition adjudication institution.
It is argued that the main advantage of the Integrated Agency Model is administrative efficiency and the level of competition expertise in decision-making (Trebilcock and Iacobucci, 2010; Jenny, 2016). Since Integrated Agencies tend to be headed by multimember boards, there is a perception that such agencies have higher levels of accountability and greater consistency and continuity of decision-making (Trebilcock and Iacobucci, 2010). A key weakness of this approach is the lack of separation between investigation and adjudication, which raises concerns about due process.
There are also a few risks associated with this model that relate to the relationship between the board that takes decisions and the investigatory arm that undertakes the investigation. Decision-makers who have not participated in the investigation may not fully know or understand the results and implications of the investigation, compared to investigators who spend considerable time investigating the matter. Furthermore, significant differences between the approach and vision of the board and that of the investigatory arm towards enforcement can limit the nature and quality of feedback from the board to the investigatory arm and this can lead to an ineffective process or use of resources (Jenny, 2016).
The Integrated Agency Model has been adopted by six of the nine countries in this review. A number of concerns, in four themes, have been raised by competition authorities in regard to this model. First, competition authorities interviewed have expressed concerns about the risk to due process inherent in the conflation of the investigative and adjudication functions. To this extent, three jurisdictions are considering changing the Integrated Agency Model. The establishment

C o m p e t i t i o n a n d R e g u l a t i o n f o R i n C l u s i v e g R o w t h
508
of a Competition Review Panel is under consideration as part of the review of the Competition Act in Namibia, which would have the effect of separating the adjudication from the investigation function. Proposals for the establishment of Competition Tribunals in Botswana and Swaziland have been made as part of the review of their respective competition legislation.
Second, the ‘“Chinese wall” separating corporate governance and adjudication is too thin – in one instance, the commission oversees corporate governance in regard to priorities, budgets and capacity issues and, in another, it has to perform an adjudication role.’13 The conflation of the governance and adjudication functions in the board of the competition authority has the potential to impact the adjudicative function of the institution. Tensions arising from differences in positions and opinions on the governance of the competition authority risk spilling over into the execution of the adjudicative function, notwithstanding efforts to adhere to the highest standards of professional conduct by board members.
Third, the Integrated Agency Model works well when the requisite competition expertise is available to exercise the adjudication function. The same could be said of the need for expertise in birfurcated models with a tribunal structure. In jurisdictions with a relatively short history of competition enforcement, such expertise is likely to be in short supply.
Box 1: Challenging the Integrated Agency Model
In the collusion case the Botswana Competition Authority brought against Car World Auto Craft Shop (Pty) Ltd and Auto Tronics (Pty) Ltd, the authority was
accused of violating the principle of natural justice. The respondents challenged the legality of the commission presiding over the case on the basis that the same commission members were the board members of the Competition Authority. The
case against the respondents was withdrawn on other procedural grounds (the respondents were not served with notices to inform them that they were being
investigated), and the matter was settled out of court.
Source: Botswana Competition Authority (2015). Annual Report 2014/15

509
c o n c L u s i o n
Therefore, appointees to the boards of competition authorities may not always have the specialised skills required for deciding cases involving complex economic analysis and legal argument.
The fourth concern is of a practical nature and results from board members serving in a part-time capacity. Board members have to juggle the schedules and priorities of full-time professional responsibilities with their part-time obligations as board members of competition authorities. In some instances, jurisdictions have had to resort to the establishment of sub-committees and other alternative arrangements to expedite decision-making (including round-robin decision-making), especially in merger cases in which decisions are time-bound by law.
In jurisdictions such as South Africa, Tanzania and Zambia, the Bifurcated Agency Model has been adopted. The main motivation for the adoption of this model, in which the prosecutorial and adjudicative functions are separated, is the perception that impartiality in proceedings is better protected. Furthermore, the separation is better able to avoid the confirmation bias whereby a competition authority, which acts as investigator and adjudicator, may be tempted to confirm and justify, as an adjudicator, its decisions to prosecute (Jenny, 2016). In the case of South Africa, advantages of this model include respect for due process, and rigour and independence in decision-making. The drawback of employing this model is the time it takes to complete, hear and decide cases and the costs of running two institutions (Jenny, 2016). In this regard, the CCSA has noted with concern the ‘challenge of cases taking too long to be heard on the merits as more and more parties resort to technical challenges as a delaying tactic or in an endeavour to squash cases’ (Competition Commission of South Africa, 2015:12).
Mandates
Competition authorities in five out of the nine jurisdictions are obliged to execute multiple mandates. That is, competition authorities in Malawi, Swaziland, Tanzania, Zambia and Zimbabwe have consumer protection as an additional mandate, whereas Botswana, Mauritius, Namibia and South Africa have a single competition mandate.

C o m p e t i t i o n a n d R e g u l a t i o n f o R i n C l u s i v e g R o w t h
510
In exploring the key themes relevant to the integration of competition and consumer protection, Fels and Ergas (2014) point to the complementarities of competition enforcement and consumer protection. They argue that competition policy aims to protect and, where appropriate, extend the range of choices for consumers, while consumer policy seeks to enhance the quality of that choice through the fairness and integrity of market processes. They highlight several potential benefits that can be realised by integrating competition and consumer policy, including developing and sharing expertise across these two areas and the gains from seeing competition and consumer policy instruments as part of a common portfolio of tools tailored to the specific needs of markets. They caution, however, that consumer policy may find it difficult to attract the necessary attention when integrated into an agency responsible for competition policy.
In resource-constrained environments, the pursuit of multiple mandates places an onerous burden on young competition authorities. For instance, it took the Swaziland Competition Commission about five years to operationalise its consumer protection mandate with the appointment of staff to take forward this function in 2017. In the case of the Zimbabwe Competition and Tariff Commission, the authority dealt with only 10 consumer protection cases in the first decade of its existence, and despite having the statutory powers to fix prices in the market, has not exercised this authority (UNCTAD, 2013). Zimbabwe is now in the process of establishing a separate Consumer Protection Commission in terms of the draft Consumer Protection Bill, published in 2014.
Leadership structure
With the exception of South Africa, all jurisdictions have multimember boards responsible for the governance and oversight of the competition authority. Other authorities with a Bifurcated Agency Model, such as Tanzania and Zambia, also have boards.
Multimember boards have members from different backgrounds with diverse expertise, are considered less likely to be captured by specific

511
c o n c L u s i o n
interests, and are more likely to withstand abrupt policy shifts in the wake of a change in power (Jenny, 2016; Kovacic and Mariniello, 2016). Leaders of competition authorities interviewed acknowledge that diverse expertise is an advantage, but note that competition expertise is even more important given the short supply of such expertise in jurisdictions with relatively new competition regimes. Moreover, the executive directors who communicate the vision and priorities of the board and who, at the same time, have to make sure that the secretariat performs in line with expectations, play a critical coordinating function. They have to be adept at managing downwards by ensuring that the performance of the secretariat meets the expected standards of the board, and managing upwards by translating the resource needs of the secretariat to the board.
Organisational capacity
In total, the competition authorities in the nine countries under review had a staff complement of 472 in 2016 of which nearly a third are economists and a fifth are lawyers (Table C.4).14 Competition authorities identify staff capacity limitations, both in terms of overall staff and the relevant expertise and experience, as a key constraint to their effectiveness. This is consistent with the findings of a study on competition policy and enforcement by the World Bank (2016), in collaboration with the African Competition Forum.
In some jurisdictions vacancy rates are very high. The Swaziland Competition Commission currently has a total staff establishment of 39 but 22 of these positions are vacant due to a shortage of funding. Other jurisdictions with high vacancy rates are Zambia (67 per cent) and Zimbabwe (48 per cent). It is worth pointing out that all of these jurisdictions also have responsibility for consumer protection. It is unlikely that the relevant expertise will be available to fill such high numbers of vacant positions which points to the need for strategies whereby competition authorities develop and grow their own human resource capabilities.
The other key observation made by competition authorities is the need for developing the economic analysis and investigative capacity

C o m p e t i t i o n a n d R e g u l a t i o n f o R i n C l u s i v e g R o w t h
512
of staff. Competition authorities expressed the need to expose their staff to learning opportunities to enhance their technical and economic analysis, especially in regard to merger and market analysis. Furthermore, their staff need to strengthen their investigative capacity with a specific focus on detecting infringements, managing investigations and handling evidence. Competition authorities have to train their staff in the economic analysis and investigative competencies required to support effective enforcement. One respondent noted that, ‘[T]he capacity situation is aggravated by the fact that competition is not considered a substantive subject in the country’s universities. Therefore, the officers recruited are hardly equipped analytically to deal with competition law enforcement. The Commission, therefore, depends on on-the-job training.’15
Table C.4: Staff and revenue, 2016
Jurisdictions Yearoperationalised
Total staff
Economists Lawyers Revenue(US $ million)No. % No. %
Botswana 2011 33 5 15% 4 12% 2.2
Malawi 2013 19 7 37% 2 11% 0.8
Mauritius 2009 20 6 30% 6 30% 1.0
Namibia 2008 35 8 23% 7 20% 2.7
South Africa 1999 197 64 32% 60 30% 21.7
Swaziland 2010 17 4 24% 5 29% 0.7
Tanzania 2007 57 8 14% 7 12% 3.1
Zambia 1997 67 33 49% 4 6% 3.3
Zimbabwe 1998 27 12 44% 3 11% 2.6
472 147 31% 98 21% 38.1
The Competition Commission of South Africa accounts for 56 per cent of the total revenue of US $38.1 million in 2016. Malawi and Swaziland have revenues of less than US $1 million. All other countries have revenue of less than US $3.5 million. A deeper analysis of costs and allocation of
Source: Competition authorities and annual reports

513
c o n c L u s i o n
funds is required to understand how efficiently competition authorities utilise their funds, however there are indications from the interviews that some authorities are severely under-resourced in this regard.
Strategic organisational practices
Strategy practices in organisations are those coherent clusters of activities that reflect a specific strategic disposition (Rasche and Chia, 2009), and include activities involved in direction setting, resource allocation and monitoring and control (Jarzabkowski, 2003). This section focuses on strategic planning, prioritisation and cross-border collaboration as key strategic organisational practices.
Strategic planning
Strategic planning is a widely established practice in the competition authorities under review. All the competition authorities, except Mauritius, have formal strategic plans that set out priorities over a planning horizon of between three to five years and annual plans in which the longer-term goals are translated into short-term objectives. The authority in Mauritius plans to adopt a more formal strategic planning process with a longer-term planning horizon to deal with the process of transitioning towards greater levels of prioritisation and specialisation.16
A noticeable trend in the selection of goals and objectives is that competition authorities tend to become more externally oriented as their strategies evolve. The first strategic plans tend to be focused on internal priorities such as increasing staff morale, aligning organisational structure and work processes, and developing IT and data management systems. The second generation plans focus on the external environment towards effective enforcement and improving competition outcomes in the economy. Interviews with leaders of competition authorities indicate that acting against collusion in the form of cartels and bid-rigging, strengthening enforcement in RBP cases, especially abuse of dominance, and targeting high-impact sectors are some of the key goals and priorities of competition authorities.
A further observation is that competition authorities tend to link their

C o m p e t i t i o n a n d R e g u l a t i o n f o R i n C l u s i v e g R o w t h
514
priorities more explicitly to national goals and outcomes as the strategies mature over time. For example, the Namibian Competition Commission aims to make a contribution to the achievement of competitive markets in line with the country’s Vision 2030. The Competition Commission of South Africa seeks to contribute to a growing and inclusive economy in support of South Africa’s National Development Plan.
Prioritisation
Prioritisation is ‘a process of deciding what type of activities, enforcement actions, advocacy initiatives, or in general competition policy measures a competition agency might pursue in a given period of time’ (UNCTAD, 2013:4). Prioritisation is predicated on competition agencies being able to make choices about what they regard as strategically important or not in respect of achieving the desired competition policy goals. There are a number of well-recognised motivations and criteria for prioritisation, including the limited resources available to authorities, the need to focus on contraventions that are more egregious, and the need to prioritise infringements that impact more vulnerable groups such as low-income consumers (Wils, 2011; Mkwananzi, Makhaya and Roberts, 2012; Jenny, 2013).
Notably, only the Competition Commission of South Africa has adopted a formal prioritisation framework. The prioritisation framework of the authority has its origins in the first strategic planning process of 2006 (Competition Commission of South Africa, 2006). The CCSA decided to adopt a more proactive approach to competition enforcement and to develop a methodology that would enable it to prioritise sectors and cases. The first iteration of the CCSA’s prioritisation framework involved undertaking an assessment of the relationship between competition policy and the government’s broader national policy objectives; explaining how prioritising of certain sectors or complaints will improve the effectiveness of the organisation; reviewing experience of other jurisdictions regarding prioritisation; and recommending sectors based on identified prioritisation criteria.

515
c o n c L u s i o n
Table C.5: Examples of strategy evolution in competition authorities
1st Generation Strategy 2nd Generation Strategy
Namibian Competition Commission,2011–2015
Namibian Competition Commission,2015–2019
• Operationalise compliance
• Research and development
• Stakeholder partnering and relationships
• Building and developing organisational capacity and capability to realise mandate
• Ensure effective enforcement of the Competition Act as a contribution to creating competitive markets in line with Vision 2030
• To expand the scope of competition regulation and strengthen the quality thereof
• To enhance competition advocacy towards the fulfilment of sound competition principles and practices
• To conduct action-oriented research on competition in support of evidence-based competition regulation and policy
• To develop the Commission as a centre of operational excellence in competition regulation
Competition Commission of South Africa, 2006–2009
Competition Commission of South Africa,2009–2014
• Increase staff morale and motivation
• Align organisational structure and work processes to the strategy
• Defining and clarifying the Commission’s approach and methodology
• Establish the Commission as a centre of information, knowledge and expertise
• Ensure effective advocacy and communication
• Achieve demonstrable competitive outcomes in the economy
• Improve competitive environment for economic activity
• Realise a high-performance competition regulatory agency
Source: Namibian Competition Commission, 2015; Competition Commission of South Africa, 2015

C o m p e t i t i o n a n d R e g u l a t i o n f o R i n C l u s i v e g R o w t h
516
The approach set out in the discussion document was formalised in a Framework for Prioritising Sectors and Cases (Competition Commission of South Africa, 2007).
This is not to say that other competition authorities in the region do not prioritise. Competition authorities have developed informal prioritisation practices. For instance, the Competition Commission of Mauritius (CCM) has informally identified the banking, insurance, distribution (retail), construction and food sectors as priority sectors, given their impact in society generally and the economy specifically, while the Swaziland Competition Commission has identified the liquid petroleum gas, bread, fast-moving consumer goods and the forestry sectors as the focus. Some jurisdictions have specifically prioritised cartel conduct. The Competition and Fair Trading Commission of Malawi has identified cartel conduct as a priority, while the competition authorities in Botswana, Tanzania and Zambia have identified bid-rigging as a key priority.
In South Africa, formal prioritisation of sectors has had significant benefits. Prioritisation has contributed to the development of sector expertise in the organisation. Staff have developed specific sector expertise by collecting information and researching specific sectors over time, thus developing knowledge and understanding of the dynamics of specific markets, competitors and competition issues. In addition, the ability to prioritise is of benefit as the organisation develops the capacity to make choices about competing demands within the organisation’s prioritisation framework (Burke, 2016).
Cross-border collaboration
Cooperation in the SADC takes place under the auspices of the Declaration on Regional Cooperation in Competition and Consumer Policies signed by member states in September 2009.17 The declaration provided for the establishment of a standing Competition and Consumer Policy and Law Committee (CCOPOLC) to implement the system of cooperation. Collaboration in the SADC has been given a major boost, at least in terms of setting up the framework under which collaboration can take place, following the signing of an agreement among competition

517
c o n c L u s i o n
authorities on cooperation in the field of competition policy, law and enforcement in May 2016.18 This agreement committed authorities to the establishment of a Joint Working Committee that will be responsible for developing an annual work plan of activities. This paved the way for the adoption by authorities of cooperation frameworks on mergers and cartel investigations. A Mergers Working Group and a Cartels Working Group was established in December 2016 at an Extraordinary Meeting of the SADC CCOPOLC held in Swaziland. The Mergers Working Group, chaired by Botswana, will take forward existing cooperation in merger regulation taking place between competition authorities, including information sharing and investigative processes. The Cartels Working Group is chaired jointly by Zambia and South Africa, and focuses on promoting effective cartel investigations with consistent outcomes in the context of national laws.19
Competition authorities from Malawi, Mauritius, Swaziland, Zambia and Zimbabwe are subject to the rules of the COMESA Competition Regulations.20 Article 6 of the regulations established the COMESA Competition Commission (CCC) to promote competition within the Common Market through monitoring and investigating anticompetitive practices of undertakings and mediating disputes between member states concerning anticompetitive conduct. The commencement of the enforcement of the regulations created a regional legal framework for regulating competition that applies to cross-border transactions, which are beyond the jurisdictional scope of national competition laws. The CCC has entered into MoUs with several national competition authorities to facilitate and promote the harmonisation of competition laws to promote effective enforcement. MoUs cover cooperation on investigations and capacity-building.
At the bilateral level, competition authorities have entered into MoUs to promote and strengthen cooperation. For instance, the Malawi authority has entered into formal MoUs with those in Zambia and Tanzania. The multilateral and bilateral activities have bolstered cross-border collaboration between competition authorities, which the authorities describe as very supportive. However, representatives of

C o m p e t i t i o n a n d R e g u l a t i o n f o R i n C l u s i v e g R o w t h
518
competition authorities interviewed note that they are keen to strengthen cooperation, especially in follow-on cases where an infringement has been found in one country in the case of firms with a regional presence. An additional dimension of this would be coordination at a regional level of major investigations and investigation strategies, such as for dawn raids at the premises of large multinational companies.
TOWARDS BUILDING EFFECTIVE INSTITUTIONS FOR COMPETITION ENFORCEMENT AND REGIONAL INTEGRATION IN SOUTHERN AFRICA
This chapter has focused on the challenges of competition enforcement in younger jurisdictions in southern Africa that share concerns about high levels of concentration, weak transport links and other barriers to entry, which also limit integration. Recent studies on value chains in the region suggest a range of common issues that restrict the ability to create more competitive regional value chains. A specific focus is on competition and the role of competition law enforcement in ‘unlocking’ markets through dealing with strategic barriers to entry in particular. Anticompetitive conduct restricts entry and participation in value chains. These compound issues relating to high logistics costs and non-tariff barriers, for example, which increase costs and market access significantly. In essence, an agenda for enhancing regional economic integration cannot be considered without addressing these related issues and including effective competition enforcement as part of the main considerations.
Large firms, often with operations across the region, can leverage control of access to inputs and integration along the value chain to undermine competition in regional markets. Understanding who governs the value chain, and the terms of access to it, is therefore important. With that being said, efficient logistics is critical for broadening geographic markets to which firms can feasibly sell and produce (beyond political borders) and enabling contestation of concentrated country markets by other regional producers. This should be a central outcome of any strategy for enhancing regional integration and industrial development.
The competitive outcomes of interventions by governments have

519
c o n c L u s i o n
had mixed results in that some strategies have increased investment and productivity, as in Zambia’s sugar industry, although it has also meant the entrenchment of a dominant position by the lead firm. There is, therefore, an important role for competition agencies to intervene through ex post enforcement and pre-emptively to influence policies that have the potential to limit rivalry in markets. In this particular example, the development of downstream sugar confectionary and beverage production has been stifled by high prices for sugar from Zambia Sugar (Das Nair et al, 2017).
Drawing from the analysis, an important first recommendation is that policies to integrate and invest in regional industrial development, including the recent SADC Regional Industrialisation Roadmap, should incorporate more concrete measures to increase the capacity of competition authorities to deal with anticompetitive conduct. This includes a focus on conduct that has cross-border dimensions. The indications from the various interviews conducted as part of this study are that the level of cooperation between authorities has increased significantly in recent years from a low base. Some of this growth has come from being able to compare and contrast their respective activities with those of other authorities in the region, and to share insights.
Whereas many authorities were constrained in their early years of existence by the challenges of developing and capacitating a new enforcement agency, several of them have started to develop enforcement track records, albeit largely constrained in terms of staff and financial resources. The record of enforcement in South Africa has been strong relative to other countries, also reflecting the larger size of the economy compared to neighbouring countries. Botswana, Mauritius and Tanzania have also been relatively strong in the period from 2014 to 2016. The comparatively large number of abuse of dominance cases in Botswana and Mauritius, relative to recorded cartel cases in each country, supports the proposition that concentration and anticompetitive conduct by dominant firms may be more pronounced in smaller economies. Importantly, a large number of violations are in basic goods or services such as food and beverages, healthcare and financial services.
Notably, consolidation in food and beverages and financial services

C o m p e t i t i o n a n d R e g u l a t i o n f o R i n C l u s i v e g R o w t h
520
is also increasing and the largest number of mergers occur in these two areas. There have also been many cases in sectors that are critical for economic growth and integration, such as construction, transport, business services and telecommunications. To the extent that cases in different countries involve South African multinationals, there is a role for greater cooperation between agencies. Furthermore, issues relating to competition violations outside of the home country of a company need to be considered as part of the strategies envisaged through regional industrial development policies between countries. As described through various examples in earlier sections, control and abuse of market power in different value chains undermine efforts to develop domestic producers and suppliers capable of integrating into wider value chains.
Even as authorities increase cooperation between them, there are important institutional constraints and challenges on their ability to prosecute cases successfully. Information gathered through the interviews with the authorities and using publicly available information help to identify issues that relate to the institutional design of competition agencies, and also practical challenges in enforcing the laws as they are. There are challenges in terms of the following:
The conflation of governance, investigative and adjudication functions, which many of the countries are seeking to address through legislative amendments.
The presence of diverse boards of authorities is an advantage in terms of bringing experiences of people from different sectors in the economy, although this makes it especially difficult to coordinate meetings of the board for decision-making on cases and the boards may lack a technical understanding of competition matters.
Authorities face a challenge in terms of limited budgets, and have all identified a need to continue efforts to train staff to improve the quality of economic analysis, investigation and information gathering. Existing capacity can be bolstered by means of the establishment of a regional facility through which expertise in economic analysis and competition law can be made available to competition authorities on a case-by-case basis.
The region has authorities at different stages. Some have been

521
c o n c L u s i o n
established for around 20 years and others are very young. These differences are also reflected in the number of investigations taken on and in the evolution of authorities’ strategic objectives over time. As authorities reach a certain level of ‘maturity’, it appears that organisational strategic goals are increasingly focused outward, in aligning the work of the authority with national economic policies and strategies, while the early years involve objectives to build capacity and organisational systems internally with some external advocacy. However, almost all agencies apply some form of formal strategic planning and prioritisation (even if only for fast-tracking less problematic cases), although there is significant variance in the issues prioritised. Further research is necessary to gain a deeper understanding of the interrelationship between competition and industrial policy in practice, and the role and capacities of competition authorities to contribute to effective competition enforcement, such that it supports economic development of the region.
NOTES
1 See http://www.sadc.int/files/4813/5292/8377/SADC_Declaration_on_ Competition_and_Consumer_Policies.pdf 2 Data for Swaziland was not confirmed by the authority, although publicly available information is used nonetheless. The South African authority only confirmed merger cases. 3 ‘No information’ refers to instances where there is no information available publicly to confirm the type of infringement; and ‘not a competition issue’ refers to instances where the case was actually evaluated by the authority but the authority found it to be outside its jurisdiction.4 Note that the relevant sectors could not be determined for 58 cases. These were excluded from the analysis in Figure C.2 and Figure C.3. 5 Information on mergers in Mauritius could not be verified and is excluded from this analysis. Data for mergers in Tanzania and Malawi were collected from publicly available information and is much lower than expected. 6 This obligation to notify mergers, combined with the fact that firms have an interest in ensuring the approval of a merger, means that merger

C o m p e t i t i o n a n d R e g u l a t i o n f o R i n C l u s i v e g R o w t h
522
assessment is frequently a ‘learning ground’ for young authorities to develop their understanding of markets and competition assessment. 7 The sector classification is derived from descriptions provided by authorities where available and supplemented with internet searches on the activities of the merging parties. 8 Interview with Competition and Fair Trade Commission of Malawi.9 Interview with Competition and Fair Trade Commission of Malawi.10 Interview with Swaziland Competition Commission.11 Interview with Zimbabwe Competition and Tariff Commission. 12 Interview with Competition and Fair Trade Commission of Malawi.13 Interview with Thula Kaira, former CEO of the Botswana Competition Authority. The authority’s role also includes acting as the first appellate body. 14 This also reflects authorities having a consumer protection mandate where investigators are required and not necessarily specific legal or economic expertise.15 Interview with Competition and Fair Trade Commission of Malawi.16 Interview with Competition Commission of Mauritius.17 See http://www.sadc.int/files/4813/5292/8377/SADC_Declaration_on_ Competition_and_Consumer_Policies.pdf18 See http://www.nacc.com.na/cms_documents/cad_sadc_mou_26may16_ gaborone.pdf; see also Vilakazi (2016).19 See http://www.compcom.co.za/wp-content/uploads/2016/01/SADC- Competition-Committee-media-statement-final-14-dec-2016.pdf20 http://www.comesa.int/competition/wp-content/uploads/2014/ 06/2012_Gazette_Vol_17_Annex_12-COMESA-Competition- Regulations-as-at-December-2004.pdf
REFERENCES
Bagopi, E, Chokwe, E, Halse, P, Hausiku, J, Kalapula, Humavindu, M and Roberts, S (2016) Competition, agro-processing and regional development: The case of the poultry sector in South Africa, Botswana, Namibia and Zambia. In S Roberts (ed) Competition in Africa. Cape Town: HSRC Press.
Bakhoum, M (2012) Introduction. In J Drexl, M Bakhoum, E Fox, M Gal and D Gerber (eds) Competition Policy and Regional Integration in Developing Countries.

523
c o n c L u s i o n
Cheltenham: Edward Elgar Publishers.Burke, M (2016) Strategy implementation insights from the Competition
Commission South Africa. Unpublished MA Research Report. Graduate School of Governance, University of the Witwatersrand, Johannesburg, South Africa.
Chisanga, B, Gathiaka, J, Nguruse, G, Onyancha, S and Vilakazi, T (2016) Agricultural development, competition and investment: The case of sugar in Kenya, South Africa, Tanzania and Zambia. In S Roberts (ed) Competition in Africa. Cape Town: HSRC Press, pp. 41–65.
Chisanga, B and Sitko, N (2013) The National consumption requirement study for edible oils in Zambia. Paper for Zambia National Farmers’ Union prepared by Indaba Agricultural Policy Research Institute (IAPRI). Available at: http://www.znfu.org.zm/download/file/fid/588 [Accessed 6 May 2017].
Competition and Consumer Protection Commission of Zambia (CCPC) (2013) Competition and Consumer Protection News, April–June, No. 6.
Competition Commission of South Africa (2006) Strategy, 2006–2009. Unpublished report. Pretoria: Competition Commission South Africa.
Competition Commission of South Africa (2007) Framework for prioritising sectors and cases. Unpublished report. Unpublished Report. Pretoria: Competition Commission South Africa.
Competition Commission South Africa (2015) Strategic Plan, 2015–2020. Available at: http://www.compcom.co.za/wp-content/uploads/2015/03/Strategic-Plan-2015-2020_Signed.pdf [Accessed 6 May 2017].
Das Nair, R and Chisoro, S (2015) The Expansion of Regional Supermarket Chains: Changing models of retailing and the implications for local supplier capabilities in South Africa, Botswana, Zambia, and Zimbabwe. UNU-WIDER Working Paper No. 2015/114.
Das Nair, R, Mondliwa, P and Roberts, S (2012) Economic Expert Report: Assessment of alleged charging of an excessive price for propylene and polypropylene by Sasol Chemical Industries. Available at: http://www.comptrib.co.za/publications/case-documents/competition-commission-and-sasol-chemical-industries/ [Accessed 6 May 2017].
Das Nair, R and Mondliwa, P (2017) Excessive pricing under the spotlight: What is a competitive price? In J Klaaren, S Roberts and I Valodia (eds)

C o m p e t i t i o n a n d R e g u l a t i o n f o R i n C l u s i v e g R o w t h
524
Towards the Development of Competition and Regulation in Southern Africa, Chapter 5. Johannesburg: Wits University Press.
Das Nair, R, Nkhonjera, M, Ncube, P and Ziba, F (2017) Growth and Development in the Sugar to Confectionary Value Chain. CCRED Working Paper, CCRED, University of Johannesburg
Fels, A and Ergas, H (2014) Institutional Design of Competition Authorities. OECD Competition Committee, 17–18 December 2014, Doc DAF/COMP/WD(2014)85. Available at: http://www.oecd.org/daf/competition/changes-in-competition-institutional-design.htm [Accessed 6 May 2017].
Fessehaie, J, Roberts, S and Takala-Greenish, L (2015) Key findings from case studies of mining capital equipment, infrastructure inputs and soy agro-processing in Southern Africa and implications for regional industrial development agenda. TIPS and CCRED research report submitted to the Department of Trade and Industry.
Fessehaie, J, Das Nair, R, Ncube, P and Roberts, S (2015) Growth promotion through industrial strategies: A study of Zambia, International Growth Centre Working Paper.
Foster, V and Briceño-Garmendia, C (2010) Africa’s infrastructure: A time for transformation. Africa Development Forum. Washington DC: The World Bank.
Fox, EM (2007) Economic development, poverty, and antitrust: The other path, Southwestern Journal of Law and Trade in the Americas, 13: 101–125.
Fox, EM (2012) Competition, development and regional integration: In search of a competition law fit for developing countries. New York: New York University School of Law, Law & Economics Research Paper Series, Working Paper No. 11-04.
Gal, M (2003) Competition Policy for Small Market Economies. Boston, MA: Harvard University Press.
Gal, M, Bakhoum, M, Drexl, J, Fox, E and Gerber, D (eds) (2015) The Economic Characteristics of Developing Jurisdictions: Their implications for competition law. Cheltenham: Edward Elgar Publishing.
Gerber, D (2010) Global Competition: Law, markets and globalisation. Oxford: Oxford University Press.
International Competition Network (2009) Seminar on Competition

525
c o n c L u s i o n
Agency Effectiveness. Summary report. Brussels: Competition Policy Implementation Working Group. Available at: http://ec.europa.eu/competition/information/icn_seminar_2009/report_final_version.pdf [Accessed 1 March 2015]
Jarzabkowski, P (2003) Strategic practices: An activity theory perspective on continuity and change, Journal of Management Studies, 40(1): 23–55.
Jenny, F (2013) Priority setting and discretionary powers of competition authorities. Presentation to Roundtable on Priority Setting and Resource Allocation as Tool for Agency Effectives, UNCTAD, Geneva, 9 July.
Jenny, F (2016) The institutional design of competition authorities. In F Jenny and Y Katsoulacos (eds) Competition Law Enforcement in BRICS and in Developing Countries. Springer International: AG Switzerland.
Kaira, T (2015) A cartel in South Africa is a cartel in a neighbouring country: Why has the successful cartel leniency policy in South Africa not resulted into automatic cartel confessions in economically interdependent neighbouring countries? Paper presented at the Annual Competition and Economic Regulation Week 2015, Victoria Falls, Zimbabwe.
Kovacic, W and Lopez-Galdos, M (2016) Lifecycles of competition systems: Explaining variation in the implementation of new regimes, Law and Contemporary Problems, 79: 85–122.
Kovacic, W and Mariniello, M (2016) Competition Agency Design in Globalised Markets. E15 Expert Group on Competition Policy and the Trade System. International Centre for Trade and Sustainable Development. Available at: http://e15initiative.org/wp-content/uploads/2015/09/E15-Competition-Kovacic-and-Mariniello-FINAL.pdf [Accessed 13 June 2017].
Lewis, M (2013) Sweet Nothings. The human cost of a British sugar giant avoiding taxes in southern Africa. Johannesburg: ActionAid.
Mbongwe, T, Nyagol, BO, Amunkete, T, Khumalo, J, Humavindu, M, Nguruse, G and Chokwe, E (2014) Understanding competition at the regional level: An assessment of competitive dynamics in the cement industry across Botswana, Kenya, Namibia, South Africa, Tanzania and Zambia. Pretoria: African Competition Forum.
Mkwananzi, W, Makhaya, G and Roberts, S (2012) How should young institutions approach enforcement? Reflections on South Africa’s experience, South African Journal of International Affairs, 19(1): 43–64.
C o m p e t i t i o n a n d R e g u l a t i o n f o R i n C l u s i v e g R o w t h
526
Mondliwa, P and Roberts, S (2014) Excessive pricing and industrial development: The recent Competition Tribunal finding against Sasol Chemical Industries. Available at: http://pmg-assets.s3-website-eu-west-1.amazonaws.com/140826pcti.pdf [Accessed 13 June 2017].
Muzata, T, Roberts, S and Vilakazi, T (2017) Penalties and settlements for South African cartels: An economic review. In J Klaaren, S Roberts and I Valodia (eds) Towards the Development of Competition and Regulation in Southern Africa. Johannesburg: Wits University Press.
Namibian Competition Commission (2015) To Safeguard and Promote Competition in the Namibian Market: Strategic Plan 2015–2020. Available at: http://www.nacc.com.na/cms_documents/af9_strategic_plan.pdf [Accessed 13 June 2017].
Ncube, P, Roberts, S and Vilakazi, T (2016a) Regulation and rivalry in transport and supply of fertilizer industry in Malawi, Tanzania and Zambia. In S Roberts (ed.) Competition in Africa: Insights from key industries. Cape Town: HSRC Press.
Ncube, P, Nkhonjera, M, Paremoer, T and Zengeni, T (2016b) Competition, Barriers to Entry and Inclusive Growth: Agro-processing, Centre for Competition, Regulation and Economic Development Working Paper No. 2016/3, CCRED, University of Johannesburg.
Organisation for Economic Co-operation and Development (OECD) (2002) Report on the nature and impact of hard core cartels and sanctions against cartels under national competition laws, OECD Report No. DAFFE/COMP(2002)7.
Ottow, A (2015) Market and Competition Authorities: Good agency principles. Oxford: Oxford University Press.
Paelo, A and Vilakazi, T (2017) Competition in road transportation between Malawi, Mozambique, South Africa, Zambia and Zimbabwe, UNU-WIDER Working Paper.
Rasche, A and Chia, R (2009) Researching strategy practices: A genealogical social theory perspective, Organisation Studies, 30(7): 713–734.
Roberts, S (2010) Competition policy, competitive rivalry and a developmental state in South Africa. In O Edigheji (ed) Constructing a Democratic Developmental State in South Africa: Potentials and challenges. Pretoria: HSRC Press, pp. 222–237.

527
c o n c L u s i o n
Roberts, S, Simbanegavi, W and Vilakazi, T (2017) Competition, regional integration and inclusive growth in Africa: A research agenda. In J Klaaren, S Roberts and I Valodia (eds) Towards the Development of Competition and Regulation in Southern Africa. Johannesburg: Wits University Press.
SADC (2015) SADC Industrialisation Strategy and Roadmap, 2015–2063. Available at: https://www.tralac.org/images/docs/7932/sadc-industrialisation-strategy-and-roadmap-2015-2063.pdf [Accessed 13 June 2017].
Singh, A (2002) Competition and competition policy in emerging markets: International and developmental dimensions, G-24 Discussion Paper Series, Issue 18. United Nations Conference on Trade and Development and Center for International Development, Harvard University.
Trebilcock, M and Iacobucci, E (2010) Designing competition law institutions: Values, structures, and mandates, Loyola University Chicago Law Journal, 41(3): 455–471.
UNCTAD (2013) Prioritization and Resource Allocation as a Tool for Agency Effectiveness. Intergovernmental Group of Experts on Competition Law and Policy, Thirteenth Session. Geneva, 8–12 July 2013. Available at: http://unctad.org/meetings/en/SessionalDocuments/ciclpd20_en.pdf [Accessed 13 June 2017].
Vickers, J (2007) Competition law and economics: A mid-Atlantic viewpoint, European Competition Journal, 3: 1–15.
Vilakazi, T (2016). Editor’s Note, CCRED Quarterly Review. Available at: http://www.competition.org.za/review/2016/6/7/editors-note-sadc-competition-authorities-sign-mou-for-cooperation-on-competition-issues [Accessed 6 May 2017].
Wils, W (2011) Discretion and prioritisation in public antitrust enforcement, in particular EU antitrust enforcement. World Competition Law and Economics Review, 34: 353–382.
World Bank (2014) Promoting trade and competitiveness: What can Zambia do?, Zambia Economic Brief. Washington, DC: World Bank Group.
World Bank (2016) Breaking Down Barriers: Unlocking Africa’s potential through vigorous competition policy. Washington, DC: World Bank Group.


529
i n d e x
Index
3G 397, 400, 404
Abuja Treaty 62, 64
Addis Ababa Cement 290, 292, 294, 299–
300, 302–308
Advanced Wireless Services (AWS) 404
Africa Progress Panel (APP) 180
Africa-EU Renewable Energy
Cooperation Programme [RECP] 201
African Development Bank (AfDB) 161
African Union (AU) 62, 64
Africell Money 432
Air Cargo Limited (ACL) (Malawi) 387
Airport Developments Limited (ADL)
(Malawi) 386–387
Airtel Money 426, 428–430, 434
Airtel 410, 432, 442
American Airways 461
American Soda Ash 71
Anglo-Dutch auction see spectrum
auction, sealed–bid
Angola 81, 130, 132, 139, 142, 153–155,
175–176, 196–197, 218, 220, 224, 232, 246
Angola’s Energy Long Term Vision 218
Annual Energy Outlook (US) 215, 224,
227, 242
Anticartel law/enforcement 70, 88,
321–337
Anticompetitive
agreements 67, 78
behaviour 444, 452
conduct 66, 68, 79, 325, 341–342, 365–
366, 379, 453, 460, 492, 495, 517–519
distribution 466
mergers 67–68, 74, 84, 88
practices 101, 107, 115–116, 453, 459, 517
Apple 459–460
Arab Magreb Union (AMU/UMA) 62
Arbitration 464–467, 470–477
ArcelorMittal South Africa (AMSA) 345–
347, 351–353, 355, 358, 364
Ariel 28
Auction
ascending 399–401
hybrid 399–400
multiband 402
sealed-bid 399–400, 404
Australia 72, 100, 216, 235, 243
Bahir Dar 294, 302–305, 308
Beira 376, 378, 379–380

C o m p e t i t i o n a n d R e g u l a t i o n f o R i n C l u s i v e g R o w t h
530
Belgium 70, 185, 190
Bertrand competition 348, 352–353,
358–359, 366
‘Best alternative to a negotiated agreement’
(BATNA) 468, 474
BHP Billiton see South32
Bifurcated Agency Model 507, 509–510
Binding commitments 85–86
Biodiversity, permit(s) 37, 42–43
Biomass 130, 135, 156, 174, 179, 200,
217–218, 299, 309, 316
Blueprint Strategy and Policy 20
Botswana 23–25, 38, 71, 98, 130, 132–133,
143, 153, 157, 197, 359, 487, 489, 494–
495, 501–506, 508–509, 512, 516, 519
Botswana’s National Development Plan
197
Broadband Wireless Access (BWA)
(Ghana) 404
Cabotage 381, 390
Canada 70, 100, 216, 235, 244, 324, 404, 463
Cape Gate (Pty) Ltd 345
Cape Town Iron and Steel Works (Cisco)
71, 345
Carbon capture and storage (CCS) 230
Cartel(s) 68–93, 321–337, 341–366, 455,
459–460, 491–492, 494–495, 503, 513, 516
cement 491
conduct 324, 326, 341–342, 384, 393,
503, 516
corporate leniency see corporate
leniency
cross-border 69–71, 73, 88
domestic 69, 73
export 68, 72–73, 451
international 68, 70
overcharge(s) 341–344, 348–353, 358–
362, 365–366
prosecution 341, 503
rebar 342–343, 345–350, 352, 358–364,
366
Cartelised market 342, 344
Cartelist(s) 324, 327, 341, 352, 355, 357,
361, 366
Cement Industry Development Strategy
(CIDS) (Ethiopia) 292
Cement 289–316, 491
cartel(ised) 71, 341, 361, 491–492
import 292, 296, 304
Center for Competitive Analysis 31, 42
Central African Economic and Monetary
Community (CEMAC) 62
Central Bank of Kenya 336
Centre for Competition Regulation and
Economic Development (CCRED) 487
Chemical and Construction Inputs
Industry Development Institute
(CCIIDI) (Ethiopia) 292
China 33, 35, 155, 185, 187–188, 296
Clearing and Forwarding Agents
Association of Malawi (CAFAAM) 377,
381, 393
Climate Change Adaptation Strategy 147
Climate change 139, 173, 203, 215, 216,
223–224, 235
policies 215–216
Coal 128, 132, 139–141, 153, 160, 188,
211–212, 219, 230, 248, 233, 294, 309,
311–312, 316
Colgate-Palmolive 28–31
COMESA Competition Commission
(CCC) 80–83, 517
COMESA Competition law 80
COMESA Competition Regulations 80,
517

531
i n d e x
Commercial Bank of Africa (CBA) 426,
430–432
Common Market for Eastern and South
Africa (COMESA) 37, 62, 65, 80–83,
86, 517
Communication Authority of Kenya 336
Community of Sahel-Saharan States
(CEN–SAD) 62
Competition and Consumer Policy and
Law Committee (CCOPOLC) 81, 88,
516–517
Competition and Fair Trading Act
(Malawi) 107, 110–111, 113–115, 273,
381, 392
Competition and Fair Trading
Commission (CFTC) 101–103, 107–118
Competition and Fair Trading
Commission (CFTC) of Malawi 371,
381,384, 389, 393, 516
Competition and Markets Authority
(CMA) (UK) 458
Competition and Tariff Commission
(Zimbabwe) 510
Competition Appeal Court (CAC) 76, 90
Competition Authority of Kenya 322, 327
Competition authority/authorities 393,
441–442, 450–457, 459–464, 467–468,
472–477, 505, 507–510
Competition Commission of Mauritius
(CCM) 516
Competition Commission of South Africa
(CCSA) 29, 75–77, 88, 90, 341, 344, 353,
362, 366, 496, 509, 512, 514
Competition law enforcement 90–92,
487–488, 493, 512, 518
Competition law 67, 70–88, 276–277,
327, 365, 381, 443, 449–458, 464–466,
472–474, 487, 493–496, 520
Competition policy (Malawi) 107
Competition policy 59, 65–68, 74, 77, 79,
84–85, 89, 91, 449–452, 454–455, 473,
477, 487, 489, 491, 496, 507, 510–511,
514, 517
Competition principles 108, 117–118, 452,
515
Competition regulation 444, 515
Competition Tribunal 76, 90, 362
Construction industry (Ethiopia) 290–295
Consumer Rights Act (UK) 458
Continental Free Trade Area 60, 64
Corporate Leniency Policy (CLP) 341–
342, 365
Corporate Leniency programme(s) 332,
503
Cosmetic, Toiletry and Fragrance
Association of South Africa (CTFA) 43
Cosmetics industry 16, 19–21, 23–3840–50
Cost Plus Model 271, 275, 277, 283–285
Cost reflective pricing 271–272, 275–277,
281–285
Council for Scientific and Industrial
Research (CSIR) (South Africa) 229–
230, 233–234
Cournot competition 349, 352
Dangote Cement 290, 292, 296, 299,
308–309, 311
Dar es Salaam 277, 376
Data
collection 21–22, 142, 295
input 229, 235
mobile 408–409, 412–417, 488
qualitative 21, 294
quantitative; 21–22, 294
Day-Ahead Market (DAM) 152
Declaration on Regional Cooperation in

C o m p e t i t i o n a n d R e g u l a t i o n f o R i n C l u s i v e g R o w t h
532
Competition and Consumer Policies 81,
487, 516
Deindustrialisation 15, 17–18
Democratic Republic of Congo (DRC) 19,
22–24, 80–81, 130–131, 133–135, 139,
143, 153, 160, 175–176
Department of Business, Energy and
Industrial Strategy 216
Department of Civil Aviation (Malawi) 386
Department of Energy (South Africa) 214,
219, 222, 225, 228, 231, 250, 252
Department of Energy Affairs (Botswana)
197
Derba Cement 292, 296, 298, 308–309,
311, 319
Detergent(s) 20–21, 29, 32, 40
Digicel 470
Digital dividend see spectrum, digital
dividend
Dire Dawa Cement (see also National
Cement) 289, 292, 300, 307, 314, 319
Directive on Antitrust Damages (EU) 457
Domestic economy 16, 77
DONG 461–462
Dow Chemicals 33
Durban 376
EAC Regional Integration Policy 217
East African Community (EAC) 62, 65,
81–86
East African Community Competition
Authority (EACCA) 82, 86
East African Court of Justice (EACJ) 82–83
East African Power Pool 134
East Cement 309, 311, 313
Economic Community of Central African
States (ECCAS/CEEAC) 62, 98
Economic Community of West African
States (ECOWAS) 63, 98, 162
Economic Development and Poverty
Reduction Strategy (Rwanda) 217
Economic development 62, 65, 92, 118,
141, 156, 173, 175, 193, 209, 213, 271,
284, 315, 371, 423, 490, 521
Economic, growth 15–19, 44, 51, 65–66,
125, 130, 138, 175, 177, 179, 202, 209,
211, 214, 216, 220, 234, 250, 376, 422,
495, 520
Economic, integration 60–62, 64–65,
487–488
Economic transformation 16, 19–20
Economy
diversifying 16, 18, 62, 87, 491
domestic 15–16, 52, 68, 68, 72–73,
77–78, 347–354, 356–359, 501
Education 159, 161, 179, 193
Electricity Act (Swaziland) 200
Electricity
centralised 137, 156
crisis 126, 174,
demand 154, 183, 249, 251, 255–256,
259–260
equity 128, 130, 134, 136, 138–139, 143,
159, 163
security 128–130, 134, 139, 143, 163,
173
supply 128, 136, 139, 175–177, 178–180,
182, 188, 191–193, 197, 202, 214, 230,
232, 234
sustainability 124, 129–130, 139–140,
143–145, 152–153, 159, 162–163
tariff 211, 227, 249, 250–255, 257–258,
260, 262–263
Electrification, rural 156–157
Electrification 135–136, 156–157, 175,
218–220

533
i n d e x
Electronic money see mobile money
Emissions
CO2 142, 183, 225
limits 217, 224–227, 235
Energy and Water Utilities Regulatory
Authority (EWURA) (Tanzania)
200–201
Energy Market Operator (Australia) 216,
243
Energy Regulation Board (ERB) (Zambia)
165, 271–285
Energy Sector Strategic Plan (Rwanda)
217, 247
Energy Thematic Group 158–160
Energy
crisis 173–175, 193–194, 202
diversity 139–141
efficiency 249–253, 292, 294, 297–298,
309, 314
equity 127
forecast(s) 215–217
forecast 214–217, 219–220, 243–244
industry 123, 125–127, 147–149, 162,
210–213, 216, 219
mix 227–228, 230, 232–233, 235
nuclear 230–231, 233–235
plans 209–211, 213–217, 220–224,
227–233, 235
policy 222, 148
poverty 136–137, 156, 173, 252
regional integration 126–127, 163
renewable see energy, sustainability
security 123–124, 126–127, 140, 173–
174, 191, 203, 212–213
solar 134, 139, 156, 163, 174, 181–183–
191, 194–195, 197–201, 203, 233–236,
253, 258, 263, 268, 432
sustainability 143, 150, 159, 162–163,
186–187, 196–202, 230, 233
wind 134, 156, 174, 198, 200, 211–212,
218, 229, 233–234, 253
Equitel 427–429, 441
Equity Bank 427, 441
Eskom 126, 139, 141, 153–154, 189, 215,
249–251, 254–257, 259–263
Ethanol Company (ETHCO) 104
Ethiopia 64, 83, 289–290, 294–297, 299–
300, 302, 316
EU Competition Commission 335
European Commission (EC) 461–466
European Photovoltaic Industry
Association [EPIA] 186–188, 195
European Union (EU) 31, 37, 104, 217, 243
Expansion Plan 144
Export diversification 19, 22
Ezy Pesa 430
Federal Communications Commission
(FCC) (US) 397, 403
Fiji 469
Financial and Fiscal Commission (South
Africa) 253
Financial penalties 323–324, 327, 330–331
Financial Rebate Scheme 200
Food security 179, 193, 495
Fossil fuels 123, 215, 225, 228, 230, 235
Framework for Open Access to the
Transmission Grid 158
Free Basic Energy (FBE) 136, 157
Free trade area (FTA) 59–61, 65, 86, 89
Gas Utilisation Master Plan (South Africa)
223
German Federal Ministry of Economics
and Technology 216, 244
Germany 23–24, 33, 70, 184–185, 244–245

C o m p e t i t i o n a n d R e g u l a t i o n f o R i n C l u s i v e g R o w t h
534
Ghana 396, 404–407, 412, 414
Globalisation 20, 41, 44, 61, 74
Good Manufacturing Practice (GMP) 36
Grand Inga project 160
Greenfield tariff 199
Greenhouse gas emission (GHG) 214–215
Greenpeace 186–188, 195
Grid Feed-In Law 185
Gross domestic product (GDP) 18–19, 65,
70, 175, 177, 295, 489
H&R South Africa (Pty) Ltd 39
Halopesa 430
Harmonised System (HS) 20, 27, 347
Harmony Mittal case 354
Heavy fuel oil (HFO) 309–310
High-voltage direct current (HVDC) 155
Horizontal agreements 328, 331
Horizontal restraints 68, 452–454
Hotels 49–50, 52–53
Hydroelectric 130–131, 133, 139, 246
Hydropower 125, 128, 131, 139–140, 156,
198, 246, 290
Illovo Sugar (Malawi) 101, 104, 111, 116
Import duties 33, 37, 39
Import Licensing Act 114
Import parity pricing (IPP) (Zambia) 275
Import substitution 16, 19–20, 22
Import duties 33, 37, 39
In Bond Landed Cost (IBLC) 374
Inchini Bedrock Cement 311
Inclusive and Sustainable Industrial
Development agenda 158
Indeni Petroleum Refinery Company 275
Independent Communications Authority
of South Africa (ICASA) 413
Independent power producers (IPPs) 126,
148–150
India 33, 72, 99, 155, 402
Indigenous Customs Clearing and
Forwarding Association (ICCFA)
(Malawi) 377, 381, 393
Industrial Development Corporation
(IDC) 42, 54
Industrial development 15–17, 151, 487,
490–491, 518–520
Industrial policy 60, 289, 300, 315, 488, 521
Industrialisation 15, 18–19, 44, 51, 126,
218, 489–490
Inga Reservoir 133
Institutional design 89–90, 488, 493, 506, 520
Integrated Agency Model 507–508
Integrated Energy Plan (IEP) (South
Africa) 210, 214, 219, 221–223, 225–226,
228, 233
Integrated National Electrification
Programme (INEP) 136, 157
Integrated Resource Plan (IRP) 210, 219,
233, 229, 233–234
Intergovernmental Authority on
Development (IGAD) 63
International Air Transport Association
(IATA) 389
International Energy Agency (IEA) 127,
133, 173, 175
International Renewable Energy Agency
(IRENA) 134, 156, 158
International Standard Industrial
Classification (ISIC) 20
Irrigation 179, 193
Israel 459
Italy 185–186, 190
Japan 70, 185, 187, 225,
Johnson & Johnson 28, 30–31, 46

535
i n d e x
Kariba Dam 133
Karonga Business Association 101
Karonga 101–102, 104, 109, 111–115, 390
KCB 426, 430
Kenya Airways 388
Kenya Association of Manufacturers 328
Kenya Civil Aviation Authority 336
Kenya 83–85, 98, 104, 210, 220, 232, 247,
290, 299, 322, 325, 336–337, 405–406,
421, 423, 425–430, 433, 435–439, 441–
443, 504
Kenyan Competition Act 322
Kenyan Ministry of Energy and Petroleum
218, 233
Kusile 139, 160, 234
Lafarge Cement 71, 492
Leniency (programmes) (Kenya) 321–337
Leniency applications (Kenya) 328–331,
333–335
Lesotho Electricity Company 154
Lesotho Energy Policy 197–198
Lesotho 71, 98, 131, 139, 142, 175, 197–
198, 354
Levelised cost of electricity (LCOE) 201,
231
Lilongwe Handling Company (LHC) 387
Liquefied natural gas (LNG) 216, 244
Liquid Fuel Infrastructure Roadmap
(South Africa) 223
Living Standard Measures (LSM) (South
Africa) 256–263, 268–270
Logistics Performance Index (LPI) 372
Madagascar 83, 98, 175–177, 196, 198
Malawi Energy Regulatory Authority
(MERA) 165, 198
Malawi Ports Company (MPC) 389–390
Malawi Shipping Company (MSC)389–392
Malawi Stock Exchange 104
Malawi 23–24, 130, 132, 134–135, 143,
154–155, 175, 354, 373, 379, 487, 489,
494–495, 501, 503–506, 509, 512
aviation 386–389, 393
bus service 383–384
competition policy 107, 517
electricity access 175–177
forwarding agents 377
National Transport Policy 375
passenger transport381–384
rail service 385
sugar industry 101–118
taxi service 384
transport sector 371–392
water transport 389–392
Manufacture, soaps and detergents 21–23,
26–30, 32–34, 36, 50
Manufacturing 15, 17–21, 27–32, 43, 45–46,
50–53, 78, 104–105, 109, 151, 156–157,
310, 499–500
constraints 39
contract 43, 50–51, 53
employment 17
industry 18, 21, 28–32, 36–42, 46, 50–52,
78, 104–105, 109, 151,179, 231, 292–
294, 310, 490, 499–500
light 15, 19–20, 49
Market and Investment Framework for
SADC Power Projects 148–149
Market
direct 50, 53
dominant 501–502
international 20, 88, 280, 373
regional 20, 44, 51–52, 54, 146, 150–152,
154–155, 158, 302, 316, 489, 492, 518
Massmart (Walmart) 75, 77

C o m p e t i t i o n a n d R e g u l a t i o n f o R i n C l u s i v e g R o w t h
536
Mauritius 83, 98, 104, 176, 196, 198, 487,
489, 494–495, 502–506, 509, 512–513,
517, 519
Mediation 458–477
Medupi 160, 234
Mekelle 292, 294, 300, 302–309
Merger(s) 73–77, 326, 403, 460–463, 465–
466, 468, 476–477, 489, 498–505, 509,
512, 517, 520–521
anti-competitive 67–68, 84
cross-border 73–75, 84, 88
regulation 504–505
Messebo Cement 290, 292, 297–300, 302,
307–309, 311, 316, 319
Microsoft 460
Minibus Owners Association of Malawi
(MOAM) 381–382
Ministry of Industry and Trade 101–102,
109
Mmamabula Power Station 153
Mobile banking 422, 427, 432, 440–441,
443
Mobile broadband 395, 397, 404
Mobile money 421–444
providers 425–426, 428–433, 437, 440, 442
subscribers 421–423, 429–430, 433, 443
transfer (MMT) 422, 437–438, 440
Mobile network operators (MNOs) 410–
411, 424–428, 432, 441–443
Mobile operators 395, 397, 400, 405, 412–
413, 416, 437
Mobile virtual network operator (MVNO)
427, 441, 463
Monitoring trustees 463
Monopoly 102, 104–105, 114, 307, 351,
385, 387, 393, 428, 442, 460, 473,
490–491
Mozambique 19, 23–25, 71, 104, 130–132,
134–135, 138–139, 186, 196, 199, 353, 372,
377–380, 385, 389, 390, 396, 411–412, 414
M-PESA 426, 428–434
MTN 404, 407, 410–413, 426, 428, 432–433
Mugher Cement 289–292, 297–298, 303,
309–310, 314, 319
Nacala 385–386, 390
Nacala port 376, 385
Nambian Competition Commission
(NCC) 75–76
Namibia 23–25, 38, 71, 75–77, 98, 130–133,
136, 139, 153, 176, 196, 199, 353, 487,
489, 494–495, 500–503, 506, 508–509,
512
NamPower 153–154
National Adaption Strategy (NAS) 107
National Bus Company (Malawi) 383–384,
393
National Cement (previously Dire Dawa
Cement) 290, 292, 297, 300, 307, 309,
311, 313–314, 319
National Climate Change Response White
Paper (South Africa) 225
National Communications Authority
(NCA) (Ghana) 404
National Economic Development and
Labour Council (NEDLAC) 252
National Energy Act (South Africa) 223
National Energy Board (Canada) 216, 244
National Energy Policy (Rwanda) 217, 247
National Energy Regulator of South
Africa (NERSA) 189
National Export Strategy (Malawi) 103
National Export Strategy (NES) 103
National Information and
Communications Technology Act
(Papua New Guinea) 472

537
i n d e x
National Microfinance Bank (NMB)
(Tanzania) 430
National Strategy for New Renewable
Energy 196
Natural ingredients 31, 33, 37, 42, 51–5
Nchalo Sugar Estate 104
Netherlands 400–401
Nigeria 98, 296, 396, 405–407, 410–412,
425
North American Free Trade Area
(NAFTA) 88
Nuclear plants 211–212
Ofcom (UK) 397, 402–403
Office of the Director of Public
Prosecutions (ODPP) 326
Omnia 33
Organic products See Natural ingredients
Organisation for African Unity (OAU) 62
Organisation for Economic Co-operation
and Development’s (OECD) 70, 74, 252,
330, 332, 459
Packaging 35–36, 40, 44–46, 49–50, 53
Paris Agreement 224
Peak-Plateau-Decline (PPD) 225
Petroleum 217, 271–277, 284, 328, 516
Petroleum Act 274–275, 284
Petroleum jelly 31, 33, 39, 54
Photovoltaic (PV) rooftop systems 173,
186
Post-apartheid 16
Power Generation and Transmission
Master Plan (PGTMP) (Kenya) 218
Power System Master Plan (PSMP)
(Tanzania) 218
Press Cane Limited 104
Procter & Gamble 28, 30, 46
Property-assessed clean energy (PACE)
187
Public interest objective(s) 88, 399
PV industry 188, 195, 201
systems 180–181, 186–189, 195, 199–202
Raw material(s) 32–33, 37, 39, 41, 104, 292,
300
Rebar (reinforcing steel bar) 342–349,
351–357, 360–366
cartel 343, 345–347, 360, 364
Reckitt Benckiser 29, 51
Regional Economic Communities (RECs)
64–65, 81
Regional economic integration 60–65, 158
Regional Electricity Regulators
Association of Southern Africa (RERA)
145–146, 150, 155, 158, 161, 163, 165
Regional Electricity Regulators
Association of Southern Africa (RERA)
158, 161, 163
Regional Energy Access Strategy and
Action Plan (REASAP) 125
Regional energy integration 124–127, 151,
163
Regional integration 60–61, 66, 69, 77, 82,
124, 126, 128–129, 145, 149–150, 152,
154, 157–158, 163, 316, 335, 490, 518
Regional Trade Agreements (RTAs) 60–63,
66–67
Regionalism
economic 79
inclusive/new 161
open 60
Regulation Authority of Posts and
Telecoms (Autorité de Régulation des
Télécommunications et des Postes
(ARTP) (Sengel) 409

C o m p e t i t i o n a n d R e g u l a t i o n f o R i n C l u s i v e g R o w t h
538
Regulatory Empowerment Project 158
Reinforcing Mesh Solutions 362–363
Reinforcing Steel Contractors 362
Renewable Energy and Energy Efficiency
Strategy and Action Plan (REEESAP)
126, 147
Renewable energy credit (REC) 187
Renewable Energy Independent Power
Producer Procurement (REIPPP)
(South Africa) 231–232
Renewable Energy Law (REL) 187–188
Renewable Energy Sources Act (EEG) 186
Renewable energy technologies 144, 173–
174, 196–197, 199, 128, 132, 138
Renewable Energy Zoning 158
Resilience 139–140
Restrictive business practice (RBP) 494,
504, 513
Retail 38, 43–50, 103, 271, 277, 279–283,
291, 327, 453, 491, 495–496, 499–500
merger 499
price(s) 271, 277, 494
trade 495, 499
Revised Regional Indicative Strategic
Development Plan (RISDP) 126, 158
Rooftop PV 174, 180, 184–195, 198–199,
202–203, 253
Rural Electrification Collective Scheme 157
Ruutos 50
Rwanda 83, 98, 210, 220, 247, 405–406,
415–416, 432–433
SA Metal Group 345
SAD Protocol on Energy 125
SADC Centre for Renewable Energy and
Energy Efficiecy (SACREEE) 126
SADC Regional Energy Access Action
Plan 147–148
SADC Regional Industrial Policy
Framework 158
SADC Regional Industrialisation Strategy
and Roadmap 490
SADC Regional Strategy for Increasing
Energy Access and its Action Plan 160
Safaricom 406, 426, 428, 430, 432, 441–442
Sanctions
administrative 326
criminal 325–326, 332, 337
SAPP Energy Efficiency Framework 147
SAPP Regional Generation and
Transmission 144
Sasol 33, 39, 54, 72, 350
Scaw Metals Group 345–347, 355
Senegal 98, 396, 405–412
Seychelles 83, 85, 98, 175–176, 196,
199–200
Shale gas 228, 237
Short-Term Energy Market (STEM) 152
Simama General Dealers 101–102, 104,
109–110–116
Skills, shortage 40, 51
Small economies 449–457, 464, 467, 470–
471, 487, 489–490
Small Power Producers (SPP) 200
Small Scale Distributed Generation
(SSDG) 198
Small-Scale Embedded Generation (SSEG)
173–174, 181–182, 185, 188–190, 195–
196, 198, 201–202
Smart Grid Concept Paper 147
Soaps and detergents 16, 19–53
Society of Cosmetic Chemists of South
Africa (COSCHEM) 40
Solar PV 174, 180–191, 193–194, 197–199,
201, 203, 211–212, 229, 231, 233–234,
236, 264, 268

539
i n d e x
Sonatel 409–410
South Africa 16–17, 19–28, 30–31, 33,
35–36, 38–43, 46–47, 49, 51–54, 59–60,
71–72, 75–77, 80, 90, 92, 98, 104, 118–
121, 124, 126, 130–135, 137–139, 141,
143, 151–153, 159 –160, 176–177, 185,
188–189, 196, 214, 219, 221, 230, 234,
236, 249, 252, 260, 296, 341, 343, 345,
354, 362–363, 365, 372, 376, 378, 396,
405–407, 411, 413–414, 417, 425, 487,
489–491, 494–496, 498, 500–504, 506,
509–510, 512, 514–517, 519
South African Airways (SAA) 388
South African Iron and Steel Institute
(SAISI) 347–348, 350, 352
South African Local Government
Association (SALGA) 189–190
South African Renewable Energy
Technology Centre 161
South Korea 35
South32 (formerly BHP Billiton) 138
Southern African Customs Union (SACU)
60–61, 63, 491
Southern African Development
Community (SADC) 15, 19–20, 27, 31,
37, 53, 63, 65, 79–82, 88, 90, 98, 124–126,
130, 133–135, 143, 145, 147–150,
152–153, 155–163, 173–176, 190, 193,
195, 202–203, 354, 373, 375, 381, 487,
490–491, 516–517, 519
Southern African Power Pool (SAPP)
124, 129, 134–135, 137, 142–143, 145,
149–150, 152, 155, 158, 163
Southern African Research and
Documentation Centre 159
Spectrum
assignment 396, 405, 414–416
auction 397–398, 406, 409, 411, 413
cap(s) 396, 399, 402–403, 405, 411
digital dividend 405–406
SSNIP 293, 307
State action 78–79
Statistics South Africa 21, 361
Strategic planning 513–514, 521
Structural change 16, 214
Structural transformation 16, 19, 490
Sub-Saharan Africa (SSA) 176–178
Sugar 101–118
Supermarket
chains 20, 31, 43–45, 500
mergers 500
Sustainability
economic 157
environmental 127–128, 130, 139, 143, 163
Sustainable energy 125–127, 147, 199, 210
Swaziland Competition Commission
510–511, 516
Swaziland Electricity Company 154
Swaziland 24, 71, 75, 83, 92–93, 98, 104,
131, 139, 143, 176, 196, 200, 354, 487,
489, 494–495, 501–504, 506, 508–509,
512, 517
Switzerland 33, 70, 190, 401
Tanzania Telecommunications Company
Ltd (TTCL) 430
Tanzania 19, 71, 75, 84, 92–93, 98, 104, 130,
132, 175–177, 196, 200, 210, 218–220,
224, 232–233, 248, 372–373, 389–390,
405–407, 415–416, 421, 423, 425–426,
428, 430–439, 442–443, 487, 489,
494–495, 500–504, 506, 509–510, 512,
516–517, 519
Target Market Model Design 148–149
Telecommunication(s) 424, 427–428, 441,
443, 467, 469–471, 495–496, 520

C o m p e t i t i o n a n d R e g u l a t i o n f o R i n C l u s i v e g R o w t h
540
Telecommunications Authority of Trinidad
& Tobago (TATT) 470–471
Telecommunications Regulatory Authority
(TRA) (Bahraini) 471
Telefonica 463, 465–466
Tigo Pesa 428, 430–431, 434
Trade
deficit 19–20, 22, 26, 51, 53, 375
surplus 20, 22
Trade Kings Limited 29, 35, 41, 51
Transmission system operators (TSOs) 186
Transport Master Plan (South Africa) 223
Transporters Association of Malawi 378
Treaty on the Functioning of the European
Union (TFEU) 72
Tripartite Free Trade Area (TFTA) 59–60,
65–66, 73, 77, 79–80, 84, 86–92
Trucking company (Malawian) 378–380
Trucking company (Mozambican) 378–380
Uganda 82, 98, 405–407, 415–416, 421–423,
425–426, 428, 432–440, 442–443
Umoyo 32, 42
Unemployment 17, 199, 250
Uniform Pump Price 271–272, 275, 279,
284–285
Unilever 28–30, 31, 41
UNIP (Zambia) 272
United Kingdom 24, 33, 216, 282, 332,
400–401, 404, 458
United Nations (UN) 224
United States of America 24–25, 70,
72, 100, 104, 184–185, 187, 204, 215,
235, 238, 282, 324, 332, 335, 397, 403,
459–460, 463
Unstructured Supplementary Service Data
(USSD) 427, 441
Uranium 132
US Airways 461
US Annual Energy Outlook 224, 227
US Department of Justice 70, 460
USAID 158
Value chain 16, 20–21, 32–34, 42, 44, 67,
78, 284, 345, 362–364, 366, 450, 488,
492–493, 518
cosmetics and soaps 32, 34, 43
food 495
Vertical integration 46, 277, 493
Vertical restraint 78
Vertically integrated utilities 180
Virtual power plant (VPP) 147, 166
Vita Life 31
Vitafro 31
Vodacom 411, 413, 426, 428, 430–434, 442
Walmart 75, 77
Webb-Pomerene Act 72
West African Economic and Monetary
Union (UEMOA) 63
West African Monetary Zone (WAMZ) 63
West African Power Pool 134
Wholesalers 49, 102, 109, 111–112, 114–
117, 120–121, 284, 402–403
World Bank 139, 158, 160, 178–179, 203,
284, 372, 476, 478
World Energy Council (WEC) 127, 143
World Trade Organization (WTO) 60,
63, 66
Zambia 16–19, 20–27, 29–33, 35–44, 48,
51–54, 71, 75, 83, 98, 104, 130–131,
133, 135, 139, 154, 175–176, 196, 201,
271–276, 282–284, 354, 372–373, 487,
489, 491, 494–495, 500–503, 505–506,
509–512, 516–517, 519

541
i n d e x
Zambia Bureau of Standards (ZABS)
37–39, 45
Zambia Competition Commission 273
Zambia Sugar 519
Zambian Customs and Excise Tariff Guide
33
ZESCO (Zambia) 154
Zimbabwe 16, 23–25, 71, 83, 92–94, 98,
104, 130–134, 139, 143, 176, 196, 201,
353, 441, 487, 489, 494–495, 500–504,
506, 509–512, 517
Zimbabwe Energy Regulatory Authority
(ZERA) 201
Zimbabwe Power Corporation (a
subsidiary of the Zimbabwe Electricity
Supply Authority) 154