Comparison between artificial neural network and response surface methodology in the prediction of...
14
Comparison between artificial neural network and response surface methodology in the prediction of the parameters of heat set polypropylene yarns Mehran Dadgar a , Seyed Mohammad Hosseini Varkiyani a * and Ali Akbar Merati b a Textile Engineering Department, Amirkabir University of Technology, Tehran, Iran; b Advanced Textile Materials and Technology Research Institute (ATMT), Amirkabir University of Technology, Tehran, Iran (Received 27 February 2014; accepted 12 May 2014) In the present paper, a response surface model has been introduced to predict the geometrical parameters of heat set polypropylene pile yarns. The input factors of the presented model include yarn twist, initial yarn count, time, and temperature of heat setting and the response factors are yarn count, yarn shrinkage, crimp contraction and packing factor after the heat setting process. To analyse the effect of this process on the yarn parameters, the dry heat setting process has been applied to all samples at different times and temperatures using an oven equipped with air circulation because of better accuracy and control of temperature. The obtained results showed that there is a positive relation between time and temperature and output parameters. Finally, the predicting equations discussions about the optimum points for maximum shrinkage and interactions of parameters have been presented. Hence, due to some disability of the RSM method, an ANN model has been designed to predict the parameters at higher accuracy. The results of the accomplished ANN model represent a higher prediction correlation coefficient compared to RSM. Keywords: heat setting; shrinkage; response surface method; polypropylene Introduction Heat setting is a term used in the textile industry to describe a thermal process that takes place mostly in either a steam atmosphere or a dry heat environment. The effect of the process gives fibers, yarns or fabric dimensional stability and, very often, other desirable attributes like higher volume, wrinkle resistance, or temperature resistance (Rudolf, Geršak, & Smole, 2012). Commercial use of heat setting in the textile industry (Rudolf et al., 2012; Shen, Chen, Ding, & Dai, 2011) especially for carpet pile yarns that are mainly made of acrylic, nylon, polypropylene, and polyester performs an important role in the quality of textile products because it can remove different stresses that textile processes exert on textile goods during spinning, weaving, and finishing (Statton, Hearle, & Miles, 1971). Additionally, the time–temperature relationship in the heat setting process varies depending on the polymer type, the fabric weight and its construction (Horrocks, Anand, & Anand, 2000). Of course, besides decreasing the yarn stress, better appearance is another desirable outcome (Baxley & Miller, 1991). Heat setting is categorized into three types, temporary, semi-permanent, and permanent (Gupta, 2002). The differences are carried out in the required levels of energy to reverse them to their reference set states. In fact, the textile materials will receive the lowest level of energy after permanent heat setting. In recent years, there has been an increasing amount of literature on the heat setting process. All researches in this field could be classified into three groups; (a) those researches focused on the effect of this process on the polymer structure and morphological points of view, (b) those papers focused on the physical and mechanical properties, and (c) those studies focused on the prediction of goods specification after heat setting. As an example (group a), several attempts have been made to investigate the effects of the heat setting process on yarn structural properties (Baxley & Miller, 1991; Cullerton, Ellison, & Aspland, 1990; Everaert, Vanneste, & Ruys, 1999; Lindberg, Køpke, & Fløisand, 1964; Pal, Mehta, & Gandhi, 1989; Shishoo & Olofsson, 1969; Vasanthan, 2004). These researches are generally based on the analysis of DSC, XRD and FTIR results. These results show that the heat setting process leads to some desired inner structural changes. Simal and Martin (1998) worked on Nylon 6 and 6.6 fibers submitted to thermal annealing in a wide range of temperatures at inert atmosphere and slack conditions. They analyzed the structural changes made by the heat settings process using various techniques including differential scanning calorimetric analysis, wide- and small-angle X-ray scattering, and birefringence. The results revealed different recrystallization responses of the fibers to the applied thermal annealing and consequently different shrinkage mechanisms. The existence of the nuclei *Corresponding author. Email: [email protected] © 2014 The Textile Institute The Journal of The Textile Institute, 2014 http://dx.doi.org/10.1080/00405000.2014.924656
Transcript of Comparison between artificial neural network and response surface methodology in the prediction of...

Comparison between artificial neural network and response surface methodology in theprediction of the parameters of heat set polypropylene yarns
Mehran Dadgara, Seyed Mohammad Hosseini Varkiyania* and Ali Akbar Meratib
aTextile Engineering Department, Amirkabir University of Technology, Tehran, Iran; bAdvanced Textile Materials and TechnologyResearch Institute (ATMT), Amirkabir University of Technology, Tehran, Iran
(Received 27 February 2014; accepted 12 May 2014)
In the present paper, a response surface model has been introduced to predict the geometrical parameters of heat setpolypropylene pile yarns. The input factors of the presented model include yarn twist, initial yarn count, time, andtemperature of heat setting and the response factors are yarn count, yarn shrinkage, crimp contraction and packing factorafter the heat setting process. To analyse the effect of this process on the yarn parameters, the dry heat setting processhas been applied to all samples at different times and temperatures using an oven equipped with air circulation becauseof better accuracy and control of temperature. The obtained results showed that there is a positive relation between timeand temperature and output parameters. Finally, the predicting equations discussions about the optimum points formaximum shrinkage and interactions of parameters have been presented. Hence, due to some disability of the RSMmethod, an ANN model has been designed to predict the parameters at higher accuracy. The results of the accomplishedANN model represent a higher prediction correlation coefficient compared to RSM.
Keywords: heat setting; shrinkage; response surface method; polypropylene
Introduction
Heat setting is a term used in the textile industry todescribe a thermal process that takes place mostly ineither a steam atmosphere or a dry heat environment.The effect of the process gives fibers, yarns or fabricdimensional stability and, very often, other desirableattributes like higher volume, wrinkle resistance, ortemperature resistance (Rudolf, Geršak, & Smole, 2012).Commercial use of heat setting in the textile industry(Rudolf et al., 2012; Shen, Chen, Ding, & Dai, 2011)especially for carpet pile yarns that are mainly made ofacrylic, nylon, polypropylene, and polyester performs animportant role in the quality of textile products becauseit can remove different stresses that textile processesexert on textile goods during spinning, weaving, andfinishing (Statton, Hearle, & Miles, 1971). Additionally,the time–temperature relationship in the heat settingprocess varies depending on the polymer type, the fabricweight and its construction (Horrocks, Anand, & Anand,2000). Of course, besides decreasing the yarn stress,better appearance is another desirable outcome (Baxley& Miller, 1991). Heat setting is categorized into threetypes, temporary, semi-permanent, and permanent(Gupta, 2002). The differences are carried out in therequired levels of energy to reverse them to theirreference set states. In fact, the textile materials willreceive the lowest level of energy after permanent heatsetting.
In recent years, there has been an increasing amountof literature on the heat setting process. All researches inthis field could be classified into three groups; (a) thoseresearches focused on the effect of this process on thepolymer structure and morphological points of view, (b)those papers focused on the physical and mechanicalproperties, and (c) those studies focused on theprediction of goods specification after heat setting.
As an example (group a), several attempts have beenmade to investigate the effects of the heat setting processon yarn structural properties (Baxley & Miller, 1991;Cullerton, Ellison, & Aspland, 1990; Everaert, Vanneste,& Ruys, 1999; Lindberg, Køpke, & Fløisand, 1964; Pal,Mehta, & Gandhi, 1989; Shishoo & Olofsson, 1969;Vasanthan, 2004). These researches are generally basedon the analysis of DSC, XRD and FTIR results. Theseresults show that the heat setting process leads to somedesired inner structural changes. Simal and Martin(1998) worked on Nylon 6 and 6.6 fibers submitted tothermal annealing in a wide range of temperatures atinert atmosphere and slack conditions. They analyzed thestructural changes made by the heat settings processusing various techniques including differential scanningcalorimetric analysis, wide- and small-angle X-rayscattering, and birefringence. The results revealeddifferent recrystallization responses of the fibers to theapplied thermal annealing and consequently differentshrinkage mechanisms. The existence of the nuclei
*Corresponding author. Email: [email protected]
© 2014 The Textile Institute
The Journal of The Textile Institute, 2014http://dx.doi.org/10.1080/00405000.2014.924656

crystallites at temperatures of heat treatments above120°C was found as a main cause for the Nylon 6 fiberto undergo less shrinkage than the Nylon 6.6 fiber.
In other series of papers (group b) (Crawshaw,2002; Gao et al., 2011; Gupta, 2002; Gupta & Kumar,1981a, 1981b, 1981c, 1981d), Gupta and Kumarconducted a comprehensive research on the effect of theheat set process on mechanical properties of nylon yarns(Gupta & Kumar, 1981a, 1981b, 1981c, 1981d). Guptahas reported that the heat setting process led tosignificant improvement in the physical and mechanicalproperties of the yarns (Gupta, 2002). Kish, Shoushtari,and Kazemi (2000) applied a linear regression toestablish a relation between elongation, load and drawratio after cold drawing and heat setting ofpolypropylene filaments. The shrinkage rate of thefinished product is the simplest measure to determine theoptimum time–temperature relationship in the heatsetting process. It has been declared that if the heatsetting process is done correctly, the samples show aresidual shrinkage of less than 1% after 5 min immersionin boiling water (Crawshaw, 2002). Pelisser, Neto,Rovere, and Pinto (2010) investigated the effect ofdifferent geometric polypropylene and synthetic fibers onplastic shrinkage cracking of cement. Samui, Prakasan,Chakrabarty, and Mukhopadhyay (2011) investigatedhysteresis characteristics of high modulus low shrinkagepolyester tire yarn and cord (Lin, 2007; Samuels, 1974;Sarkeshick, Tavanai, Zarrebini, & Morshed, 2009). Hui,Run-jia, Wei, and Qi-jun (2011) worked on thecharacterization of high modulus and low shrinkagepolyester technical yarns using the simulation-curingmethod.
Other researchers (group c) tried to predict yarnparameters after the heat setting process using artificialintelligence (Behera & Guruprasad, 2012; Çeven &Ozdemir, 2007; Lin, 2007; Majumdar, Majumdar, &Sarkar, 2005; Yel & Yalpir, 2011). Lin (2007) predictedthe shrinkages of warp and weft yarns in the finishedwoven fabrics using ANNs. Çeven and Ozdemir (2007)investigated the effect of twist level and pile length ofchenille yarns using the fuzzy system. In this study, theyarns were immersed in boiling water for 15 min andthen their shrinkages were measured. They reported thatthe chenille yarns with higher twist levels and shorterpile lengths enjoy lower shrinkage values, and the yarncount has a significant effect on its shrinkage.
As can be seen, most studies in the field of heatsetting process have only focused on the changes thatoccur in physical and mechanical properties or thepolymer structures after the process, especially for Nylonand PET. However, it seems that no attempts have beenmade to comprehensively investigate the prediction of allthe main parameters of heat set polypropylene BCFyarns and draw the optimum points for achieving the
goal. So in the present paper, the effect of the heatsetting process parameters of time and temperature onthe geometry of polypropylene yarns with different twist,count, and crimp contractions have been investigatedbased on the response surface method. One of RSMcapabilities is assigning equations to help responseprediction. Additionally, the ANN is used to predict theyarn parameters. Consequently, a comparison ofpredicting accuracy using ANN and RSM is discussed inthis article.
Materials and methods
Response surface methodology
Response surface methodology (RSM) is a combinationof mathematical and statistical techniques that is usefulfor empirical modeling and optimizing the effects ofseveral independent variables on the response(Montgomery, 1984; Myers & Anderson-Cook, 2009).The effects of the five independent processingparameters namely, yarn twist (TPM-(Twist per meter)),initial yarn count (YC1-(Tex)), crimp contraction(CC1-(%)), time of heat setting (Time-(Second)),temperature of heat setting (Temp-(°C)) on yarn count(YC2-(Tex)), yarn shrinkage (SH-(%)), and crimpcontraction (CC2-(%)) were investigated using RSM.FFD are response surface designs, specially employed torequire only three levels, coded as −1, 0, and +1,according to Equation (1) (Nasouri, Bahrambeygi, Rabbi,Shoushtari, & Kaflou, 2012).
Xi ¼ Pi � ½PHi þ PLi�=2½PHi � PLi�=2 ; (1)
where, PHi and PLi refer to the high and low levels ofthe variables Pi (i = 1,2,3), respectively.
All of the historical experiments (N = 73) in thisstudy are obtained from the laboratory tests. Thestatistical software package, Design-Expert (Version8.0.3, Stat-Ease, Inc., Minneapolis, MN, USA, 2010)was used for the regression analysis of the experimentaldata, and to plot the response surface graphs. Thecorresponding actual values and the coded designexperiments for each variable are listed in Table 1.
When there are two levels for each parameter, it isbetter to use the linear model, but by increasing levels tothree or more, a quadratic model or higher could bemore useful. For instance, the influence of the variableson the results “Y” in the case of two factor interactionswas adjusted using Equation (2).
Y ¼ b0 þX
biX þX
bijXiXj þ e ! ði; j ¼ 1; 2Þ: (2)
In the above equation, b0 is an independent termaccording to the mean value of the experimental plan, biis the regression coefficient that explains the influence
2 M. Dadgar et al.

Table 1. Measured values for all parameters, before and after heat setting process.
Sample code Shrinkage YC2* PF1* PF2* CC1* CC2*Yarn count_Twist_Temp_Time % Tex – – % %
150_0_23_0** 0 150 0.38 0.38 1.80 1.80150_0_130_600** 5.66 154 0.38 0.32 1.80 4.44150_60_23_0** 0 152 0.38 0.45 1.80 1.80150_60_130–600** 5.05 156 0.38 0.43 1.80 4.01150_95_23_0 0 155 0.38 0.57 1.80 1.99150_95_130_600 4.64 158 0.38 0.55 1.80 3.83150_120_23_0** 0 156 0.38 0.64 1.80 1.99150_120_130_600 4.23 159 0.38 0.58 1.80 2.82150_155_23_0** 0 159 0.38 0.68 1.80 1.59150_155_130_600** 3.03 161 0.38 0.66 1.80 2.42150_195_23_0** 0 160 0.38 0.75 1.80 1.60150_195_130_600** 2.42 161 0.38 0.73 1.80 2.21150_215_23_0** 0 162 0.38 0.77 1.80 1.20150_215_130_600** 2.43 163 0.38 0.76 1.80 2.21184_0_23_0** 0 184 0.32 0.32 1.20 1.20184_0_60_60** 0 184 0.32 0.32 1.20 1.20184_0_90_90** 0.51 189 0.32 0.29 1.20 1.30184_0_120_120** 1.26 196 0.32 0.29 1.20 1.50184_0_150_150** 5.8 235 0.32 0.27 1.20 1.60184_40_23_60** 0 184 0.32 0.33 1.20 2.30184_40_60_90** 0.11 185 0.32 0.34 1.20 2.31184_40_90_120** 0.04 185 0.32 0.35 1.20 2.34184_40_120_150 1.38 197 0.32 0.35 1.20 2.40184_40_150_30 1.42 197 0.32 0.37 1.20 2.60184_80_23_90** 0 184 0.32 0.37 1.20 3.11184_80_60_120** 0.12 185 0.32 0.38 1.20 3.20184_80_90_150** 0.16 186 0.32 0.39 1.20 3.34184_80_120_30 0.35 188 0.32 0.41 1.20 3.32184_80_150_60 2.41 206 0.32 0.43 1.20 3.36184_80_150_120** 4.27 222 0.38 0.46 1.20 3.37184_80_150_190** 7.23 248 0.38 0.46 1.20 3.38184_80_150_600** 6.82 244 0.38 0.54 1.20 3.41184_80_160_600** 11.38 284 0.38 0.56 1.20 3.42184_120_23_120 0 184 0.32 0.57 1.20 3.98184_120_60_150** 0 184 0.32 0.58 1.20 4.00184_120_90_30 0.16 186 0.32 0.58 1.20 4.10184_120_120_60** 0.58 190 0.32 0.59 1.20 4.30184_120_150_90** 4.77 226 0.32 0.60 1.20 4.20184_160_23_150** 0 184 0.32 0.63 1.20 1.50184_160_60_30** 0 184 0.32 0.63 1.20 4.40184_160_90_60 0.08 185 0.32 0.73 1.20 4.50184_160_120_90** 1.07 194 0.32 0.75 1.20 4.51184_160_150–120** 4.84 227 0.32 0.78 1.20 4.54184_160_160_3600 10.84 280 0.38 0.72 1.20 5.70224_0_23_0** 0 224 0.38 0.37 2.40 2.40224_0_130_600** 5.45 228 0.38 0.29 2.40 6.71224_0_130_600** 5.07 288 0.38 0.27 2.40 8.08224_60_23_0 0 226 0.38 0.48 2.40 2.59224_60_130_600** 4.85 233 0.38 0.41 2.40 6.06224_95_23_0** 0 226 0.38 0.56 2.40 2.38224_95_130_600** 4.83 235 0.38 0.50 2.40 5.84224_120_23_0** 0 229 0.38 0.63 2.40 2.56224_120_130_600** 4.44 239 0.38 0.60 2.40 5.19224_155_23_0** 0 232 0.38 0.69 2.40 2.18224_155_130_600** 3.23 241 0.38 0.66 2.40 3.42224_195_23_0** 0 239 0.38 0.76 2.40 1.98224_195_130_600** 3.04 244 0.38 0.72 2.40 3.81224_215_23_0** 0 237 0.38 0.77 2.40 1.79224_215_130_600** 2.63 243 0.38 0.74 2.40 3.20
(Continued)
The Journal of The Textile Institute 3

of the variables in their linear form, bij is the regressioncoefficient of the interaction terms between variables,and ε is the error.
For instance, in a system involving three significantindependent variables X1, X2, and X3, the mathematicalrelationship between the response and these variablescan be approximated by the quadratic polynomialEquation (3), (Rabbi, Nasouri, Bahrambeygi, Shoushtari,& Babaei, 2012):
SRSM ¼ b0 þX3
i¼1
biXi þX3
i¼1
biiX2i þ
X2
i¼1
X3
j¼iþ1
bijXiXj þ e;
(3)
where, SRSM is the predicted response, Xi, Xj areindependent variables, β0 is the offset term, βi is the ithlinear coefficient, βii is the ith quadratic coefficient, βij isthe ijth interaction coefficient, and ε is the error.
The equations were validated by the statistical testscalled the ANOVA analysis. The quality of the fit of theregression model was expressed by the coefficient ofdetermination R2 and Adj-R2 in Equations (4) and (5),respectively (Körbahti & Rauf, 2008).
R2 ¼ 1� SSresidualSSmodel þ SSresidual
; (4)
adj� R2
¼ 1� SSresidual=DFresidual
ðSSmodel þ SSresidualÞ=ðDFmodel þ DFresidualÞ :(5)
The terms SS and DF correspond to the sum of squaresand degrees of freedom, respectively.
ANN methodology
ANN is an information processing system that roughlyreplicates the behavior of a human brain by emulatingthe operations and connectivity of biological neurons.On the other hand, ANN cannot create an equationsimilar to RSM, but it works as the human brain doesand it estimates the response based on the trained data inthe inquired range. The human brain is composed of3–4 billion nerve cells, called neurons, and these areinterconnected to form the biological neural network.The structure of the ANN includes weight, bias, andtransfer function. Parallel connections between artificialneurons generate a layer. The ANN represents a networkwith several numbers of layers consisting of parallelelements, artificial neurons with different types ofconnections between layers, and a transfer function ineach layer. In general, ANN is a parallel interconnectedstructure consisting of: input layer of neuron (inputvariables), a number of hidden layers, and output layer(response or responses). According to Kolmogorov’stheorem, ANN with a single hidden layer should becapable of approximating any function to any degree ofaccuracy (Chattopadhyay & Guha, 2004).
The experimental design
The samples consisting of (150, 184, 224, 278) Texpolypropylene yarns (144 filaments, trilobal filament,MFI 25, at a production speed of 2500 m/min) wereproduced by a Swisstex BCF spinning machine. In BCFspinning, 2.3% color master batches and 1% of UVstabilizer were added to granules to increase the stabilityof yarn to the sunlight. Afterwards, the samples weretwisted (0, 40, 60, 80, 95, 120, 155, 160, 195, 215 TPM)
Table 1. (Continued).
Sample code Shrinkage YC2* PF1* PF2* CC1* CC2*Yarn count_Twist_Temp_Time % Tex – – % %
278_0_23_0 0 278 0.38 0.31 2.79 2.79278_60_23_0** 0 279 0.38 0.45 2.79 2.40278_60_130_600** 4.44 292 0.38 0.37 2.79 7.10278_95_23_0** 0 280 0.38 0.56 2.79 2.39278_95_130_600** 4.05 294 0.38 0.48 2.79 4.87278_120_23_0** 0 287 0.38 0.64 2.79 2.61278_120_130_600** 3.23 296 0.38 0.51 2.79 4.64278_155_23_0** 0 291 0.38 0.69 2.79 2.58278_155_130_600 2.02 299 0.38 0.64 2.79 3.60278_195_23_0 0 300 0.38 0.76 2.79 2.19278_195_130_600 2.02 303 0.38 0.74 2.79 2.61278_215_23_0** 0 302 0.38 0.77 2.79 1.80278_215_130_600** 2.23 305 0.38 0.76 2.79 2.42
*(1): Before heat set; (2): After heat set; YC1: yarn count before heat setting; CC1: Crimp contraction before heat setting; PF1: Packing factor beforeheat setting; CC2: Crimp contraction after heat setting; PF2: Packing factor after heat setting; YC2: yarn count after heat setting.**Data which used for training the ANN model.
4 M. Dadgar et al.

and heat set at different time and temperatures. The heatsetting process was carried out using an oven. Theseranges have also been used in other researches (Everaertet al., 1999; Gupta, 2002; Sarkeshick et al., 2009;Statton et al., 1971). Yarn count (Denier), crimpcontraction (%), and packing factor (%) were measuredbefore and after heat setting for all samples. However,the twist level was measured only before the process andthis measurement procedure is reversed for yarnshrinkage. Yarn count, crimp contraction, and shrinkagewere measured according to ASTM D 1907–1, DIN53840-2, and DIN 53840, respectively. The imageprocessing technique was used to evaluate the packingfactor of different samples (Salehi & Johari, 2011) andthe number of images were selected using availableequations in the literature (Leaf, 1987). Based onstatistical data, average of 16, 65, 35, 14 samples testedand reported for measuring the yarn count, crimpcontraction, packing factor, and shrinkage, respectively.In addition, design of experiments summarized as “Yarncount_Twist_Temp_Time” (Table 1).
As mentioned, the input parameters of the RSMmodel should be independent, so the packing densitywas not mentioned as input parameters of RSM becauseof its dependency to twist. Statistical significance wasanalyzed using analysis of variance and the Duncan test.
Results and discussions
RSM modeling and analyzing
Choosing the regression model is based on the softwaresuggestion, which is based on the model significances.The values of p-values less than 0.05 indicate that themodel terms are significant, whereas, the values greaterthan 0.05 are not significant. The model p-values(<0.0001) suggested that the obtained experimental datahave good agreement with the model. The regressionequation obtained from the ANOVA showed the R2
values for all predictions (Table 2). However, since themodel equations in this case include additional termsbecause of the different level of independent variables,the adjusted R2 for the degrees of freedom (Adj-R2) waschosen to be examined as well. Adj-R2 is much lesssensitive to the degrees of freedom and cannot beaffected as seriously by including more terms in themodel, while it is always lower than R2. Therefore, it is
a better criterion of the goodness of fit to use the Adj-R2
value for the response. Subsequently, the Design ofExpert software used and Equations (6)–(9) depicted therelationships between inputs and outputs and details ofstatistical data are presented in Table 2.
Y ¼ �12:46683þ 0:03195�M þ 0:059075 � Tþ 0:018341� I þ 1:09555� X � 4:28498� C;
(6)
D ¼ þ1:69� 7:22�M þ 7:57� T � 2:46� I þ 1:60� X � 0:70� C þ 0:62�M � T � 8:30�M � Iþ 0:63�M � X � 1:55�M � C þ 6:72� T � I� 0:21� T � X þ 0:77� T � C � 0:97� X � C;
(7)
F ¼ þ0:34401þ ð2:27325E � 003Þ �M � ð2:21982E� 004Þ � T þ ð7:81787E � 006Þ � I � 3:53483E� 004� X þ 0:023763� C;
(8)
Sh ¼ �0:036393� 5:75405E � 003�M þ 0:023006� T þ ð2:39634E � 003Þ � I � 0:011016� Xþ 1:07223� C:
(9)
In these and next equations; X, C, P means the yarncount, crimp contraction, packing factor before heatsetting, respectively and Y, D, F present the mentionedparameters after heat setting. I, T, M, and Sh are the heatsetting time, heat setting temperature, yarn twist, andshrinkage. These equations can present the relationshipbetween parameters. The coefficient of each parametershows the importance role of that parameter. As aninstance, Equation (6) depicts that increasing secondaryyarn count is dependent to YC1, temperature of heatsetting, twist of yarns, and time of heat settingrespectively, while if all parameters assumed to be fixed,increasing the crimp contraction can decrease thesecondary yarn count. There is the same interpretation ofother equations. As another example, in Equation (9),crimp contraction, heat setting temperature, and heatsetting time are causative parameters for increasing theshrinkage, respectively, while the YC1 and twist (TPM)can show decreased effect on the shrinkage in constantcondition.
Table 2. Details of statistical data of RSM model.
Factor Model typeModelF values
Model p-valueprob > F
ModelR-squared
Model adjustedR-squared
ANOVAR-squared
ANOVA adjustedR-squared
Yarn count Linear vs. mean 224.03 <0.0001 0.9468 0.9425 0.9412 0.9394Crimp contraction Two factor interaction 32.26 <0.0001 0.4144 0.3679 0.7574 0.7339Packing factor Linear vs. mean 172.66 <0.0001 0.9320 0.9266 0.9320 0.9266Shrinkage Linear vs. mean 71.95 <0.0001 0.8510 0.8391 0.8004 0.7943
The Journal of The Textile Institute 5

The ANOVA analysis of the optimization study forevery parameter indicated that the model term hassignificant (p < 0.05) or not significant value (p > 0.05).
The final regression models, after removing the notsignificant parameters, in terms of actual factors, arepresented as Equations (10)–(13).
Figure 1. An example of 3D graph of parameter relationships. (a) Prediction of yarn count after heat setting based on time andtemperature. (b) Prediction of yarn crimp contraction after heat setting based on twist of yarn and time. (c) Prediction of packingfactor after heat setting based on temperature and twist of yarn. (d) Prediction of shrinkage after heat setting based on temperatureand twist of yarn.
6 M. Dadgar et al.

Y ¼ �3:80338þ 0:022138� I þ 1:04851� X ; (10)
D ¼ �0:27233þ 0:027193�M þ ð6:47856E � 003Þ� I þ 1:27753� C � ð3:49162E � 005Þ �M � I� 0:011589�M � C;
(11)
F ¼ þ0:29720þ ð2:30687E � 03Þ �M ; (12)
Sh ¼ �0:036393� 5:75405E � 003�M þ 0:023006� T þ ð2:39634E � 003Þ � I � 0:011016� Xþ 1:07223� C;
(13)
Figure 1 shows the 3D plots of the responses at differenttime, TPM, yarn counts, and crimp contraction. Thepictograph trends are the same in all ranges of constantparameters from minimum to maximum while the rateand onset point has changed. In this research, the basicfigures have been reported as an examples ofrelationships between parameters.
In the literature, (Dadgar, Hosseini-Varkiyani, Merati,& Sarkheyli, 2013; Sarkeshick et al., 2009) mentionedincreasing secondary yarn count, while other researchesdid not suggest an equation or optimization method withregard to other parameters. In fact, in Figure 1(a) whenshrinkage occurred, the assumed shape of cylindricalyarns or filaments was reshaped to another cylindricalshape with shorter high and larger diameter. Thisresulted is a useful outcome, especially for technicianswho would like to achieve a better pin-point effect incarpet manufacturing. For instance, if customers areinterested in having a better pin-point effect for carpetpile yarns, it would be possible for a higher yarn countor higher filament count in a constant yarn count to
establish a better pin-point effect. Figure 1(b) depicts theincreasing values of crimp contraction while TPMdecreases and time increases in constant temperature.Moreover, this confirms the literature knowledge (Hearle,El-Behery, & Thakur, 1959), while the related Equations(10)–(13) depicted the importance of every factor.Figure 1(c) shows the packing factor changes after heatsetting while temperature and twist are changing.Temperature has a positive effect on increasing the rateof shrinkage at a constant rate of twist per meter.Figure 1(d) presents the trend of shrinkage vs. thetemperature and TPM shows increasing the shrinkagevalues while TPM decreases and temperature increases.In comparison, the high level of twist at high levels oftemperature (for instance 160°C) results in highershrinkage. On the other hand, a high level of twistprevents shrinking. This phenomenon is related to thehigher rate of compactness in the yarns structure at ahigh level of twist. Using industrial explication of thiseffect is important for engineers who are interested inachieving a better pin-point effect on the surface ofmanufactured carpets. In this case, attention to the levelof twist is necessary. The obtained equation could drawa guideline for establishing point of views directedtowards the goal.
Optimum point for maximum level of relaxation innumerical method
The last step of the RSM study was to obtain a desiredarea in the design space. Numerical optimizations searchthe design space, using the model that was created in theanalysis to find factor settings that meet the defined goal.Desirability is simply a mathematical method to find theoptimum and it is also an objective function that ranges
Figure 1. (Continued).
The Journal of The Textile Institute 7

from zero outside of the limits to one at the goal.Figure 2 shows the 3D graph of desirability for thesolutions found via numerical optimization. It can beseen that the numerical optimization finds a point that
maximizes the desirability function. In this work, ourgoal is to maximize polymer relaxation in the heatsetting process, which could be achieved in themaximum level of shrinkage. This goal is arranged with
Figure 2. The 3D graph of desirability, regard to the desirability of 0.872.
Table 3. Assigned constraints for parameter.
Constraints
Name GoalLower Upper Lower Upper
Importancelimit limit weight weight
TPM is in range 0 215 1 1 3Temp is in range 23 160 1 1 3Time is in range 0 3600 1 1 3YC1 is in range 150 280 1 1 3CC1 minimize 1.2 2.7 1 1 3YC2 minimize 150 305 1 1 3PF2 maximize 0.2735 0.785 1 1 3CC2 minimize 1.195219 8.080808 1 1 3Sh maximize 0 10.84336 1 1 3
Table 4. Optimized conditions.
Number TPM Temp Time YC1 CC1 YC2 PF2 CC2 Sh Desirability
1 211.48 159.99 2848.61 150.0 1.20 216.53 0.787 0.837 9.59 0.87
Figure 3. Schematic of the topology of the network includes of hidden and output layer.
8 M. Dadgar et al.

Table 5. Weights and bias obtained in training ANN.
Input weight matrix0.37615 −0.42239 −0.47319 2.596649 −4.330630.747087 0.014367 −0.16517 −0.5076 0.5619020.043034 0.1307 0.171994 5.463446 −1.494580.167633 −2.10681 −9.85746 −1.30321 2.211606
−0.08526 −0.35866 0.745428 0.301702 −2.1169Layer weight matrix0.180303 0.050221 1.216595 −0.4186 0.439675
−0.14251 1.752288 1.725788 −0.02142 2.078352−2.36661 0.649724 2.813846 0.210115 3.618948−0.67623 0.15338 0.385686 −0.92948 0.546908Bias matrix
b(1,1) b(2,1)1.929944 0.1392460.012595 −0.419490.31568 0.336366
−5.67885 0.360996
Figure 4. Details of ANN prediction for first output (YC2; yarn count after heat setting). (a) Regression plot of experimentalresults and model output. (b) Experimental results and model output for predicting yarn count (YC2).
The Journal of The Textile Institute 9

regard to the usage of the heat set yarns (that are goingto be used as pile carpets), so the pin-point effectand lowest level of shrinkage on the carpetfinishing process is necessary. Initial parameterconstraints for the optimization set are as: TPM(minimize), Temp(minimize), Time(minimize), YC1(is inrange), CC1(minimize), YC2(minimize), PF2(maximize),CC2(minimize), Sh(maximize). These sets are applied sothat the minimum energy is used to obtain a cost benefitprocess. Thus, it is important to understand how muchdesirability could be achieved by assigning the lowestcost. Results show that 0.595 of desirability is achievedfrom the total desirability value (1). This value could notsatisfy the necessary desirability, so it must recalculateby assigning more energy. In this step, constraints areassigned again according to Table 3. In this case, TPM,temperature, time, and YC1 are chosen in the range,
initial crimp contraction, secondary crimp contraction,secondary yarn count are chosen as minimum, andshrinkage and packing factor are chosen as maximum.For example, crimp contraction is set to minimumbecause if it is set to maximum, it will need the most airpressure in the texturizing unit. Maximizing shrinkageand the packing factor follow as the final goal.Consequently, the achieved desirability is 0.872 thatcould be suitable for this manufacturing goal. At adesirability of 0.872, yarn parameters and processconditions are suggested in Table 4.
ANN modeling and analyzing
In this work, the RSM method helps to find equationsbetween the input and outputs. While it has two negative
Figure 5. Details of ANN prediction for second output (packing factor2, yarn packing factor after heat setting). (a) Regression plotof experimental results and predicted data. (b) Trend of “test data” and “model targets” for predicting packing factor (PF2).
10 M. Dadgar et al.
points: (a) because of the compulsion to use independentparameters as input parameters, the crimp contractionwas removed from input items, (b) the R2 was good inorder to understand the trend or find the equation, butfor accurate prediction it is necessary to find a bettercorrelation (especially for predicting crimp contraction).Thus, multi-layer perceptron ANN with one hidden layerwas utilized according to Kolmogorov’s theorem. For alldata-sets, the hyperbolic tangent sigmoid transferfunction (Equation (14)) in the hidden layer and a lineartransfer function (Equation (15)) in the output node wasemployed (Chattopadhyay & Guha, 2004).
TðxÞ ¼ 1� e�2x
1þ e�2x; (14)
LðxÞ ¼ x: (15)
The experimental data were divided into two groups oftraining and test with 80 and 20% samples, respectively.The ANN was trained using the scaled conjugategradient back propagation algorithm (trainscg). In orderto determine the optimum number of neurons in thehidden layer, a series of topologies were used, in whichthe number of neurons varied from 2 to 20. Eachtopology was repeated ten times to avoid random
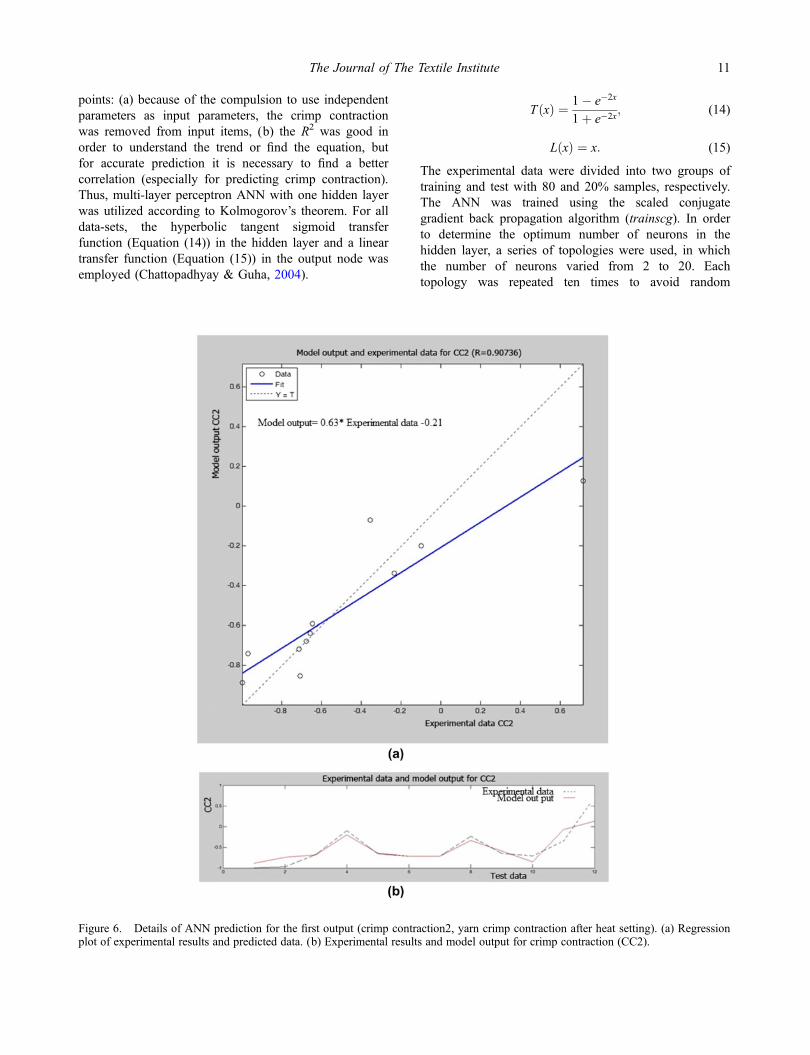
Figure 6. Details of ANN prediction for the first output (crimp contraction2, yarn crimp contraction after heat setting). (a) Regressionplot of experimental results and predicted data. (b) Experimental results and model output for crimp contraction (CC2).
The Journal of The Textile Institute 11
correlation due to random initialization of the weightsand bias. The optimal architecture of the ANN modeland its parameter variation were determined based on theminimum value of the mean square error (MSE) of thetraining and testing sets (Kasiri, Aleboyeh, & Aleboyeh,2008). MSE measures the performance of the networkaccording to Equation (16).
MSE ¼ 1
N
Xi¼N
i¼1
ðSANNÞi � ðSexpÞi� �2
; (16)
where N is the number of data points, (SANN)i is theANN prediction, (Sexp)i is the experimental response, andi is an index of data.
The optimal architecture of the ANN model and itsparameter variation were determined based on theminimum value of the MSE of the training andprediction set. In the optimization of the neural network,two neurons were used in the hidden layer as an initialestimate. The relation between MSE (network error) andnumber of neurons in the hidden layer shows that theMSE achieved a minimum of about five neurons. Hence,we used the two-layered perceptron neural network (withfive artificial neurons in the hidden layer) for modelingheat set yarn parameters. The schematic of ANN hasbeen depicted in Figure 3. The ANN was trained up to1500 cycles to obtain optimum weights and bias. Theweights and bias of ANN for modeling the heat set yarn
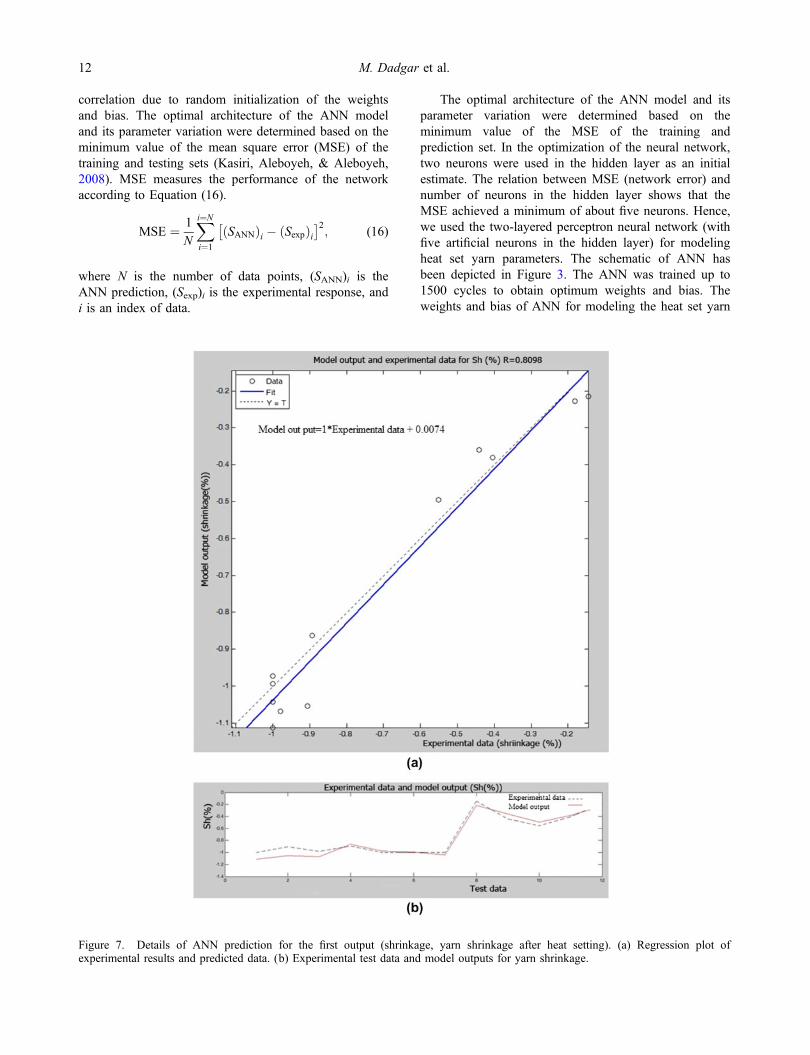
Figure 7. Details of ANN prediction for the first output (shrinkage, yarn shrinkage after heat setting). (a) Regression plot ofexperimental results and predicted data. (b) Experimental test data and model outputs for yarn shrinkage.
12 M. Dadgar et al.

parameters are given in Table 5, while IW is inputweights, LW is layer weights, and b is bias values.
Figures 4–7 show a comparison betweenexperimental test result values and predicted valuesusing the neural network model. Figure 4(a), depictedthe confirmation of experimental data and model results(for the yarn count after heat setting) and shows goodcorrelation, and this trend have been depicted inFigure 4(b). Also next Figures (5–7) depicted the sameconcept for packing factor after heat setting, crimpcontraction after heat setting, and shrinkage, respectively.Finally, the summary of all these pictures has beendepicted in Table 6.
The average of R2 value was 0.96, which indicatesthat the model shows a good fit with experimental data(Table 6). Both RSM and ANN models (Tables 2 and 6respectively) show a good relationship between theexperimental and predicted response values while ANNcan support all parameters with higher accuracy thanRSM.
Proficiency of models
Table 7 depicted the comparison between results of RSMand ANN model. As it could be seen, the ANN modelhas more capability to predict every parameter. RSMprediction is good except for the crimp contraction,while ANN can predict all parameters competently.
Conclusion
Heat setting is a prevalent method in carpet pile yarnproduction. Heat setting gives an attractive appearance tothe carpet surface in comparison to shedding surface.This effect appears due to the greater dense structure ofyarn, which is the allegory of changing the yarngeometrical structure after shrinkage. Predicting the yarn
geometrical parameters was the goal of this paper whichis carried out on the basis of some input parameters.Yarn count, crimp contraction, packing factor, and twistwere measured before heat setting and yarn count, yarnshrinkage, crimp contraction, and packing factor weremeasured after heat setting with the help of the RSMmethod. A response surface model based on the FFDtechnique was used for modeling and predicting theresponses. These results show that increasing the yarncount and TPM as inputs of the model, yarn count willincrease as outputs. Again upward values for crimpcontraction have an increasing trend for the shrinkageafter heat setting. In addition, increasing the twist andlowest level of yarn count, the trend to maximum crimpcontraction will perceive. Finally, numerical optimizationhas been performed by considering the desirabilityfunction to access the region in the design space thatintroduced maximum relaxation rate. Due to weaksupport of the RSM correlation coefficient to theprediction model, an ANN was used for modeling andpredicting. The configuration of the ANN giving thesmallest MSE was a two-layer ANN with tangentsigmoid transfer function at the hidden layer with fiveneurons, linear transfer function at the output layer, andthe scaled conjugate gradient back propagation trainingalgorithm. The ANN model shows higher regressioncoefficient than the RSM model. Therefore, the obtainedresults indicate that the performance of ANN was betterthan RSM.
ReferencesBaxley, R., & Miller, R. (1991). Effects of suessen heat setting
variables on streaks in finished nylon carpet. TextileResearch Journal, 61, 697–704.
Behera, B., & Guruprasad, R. (2012). Predicting bendingrigidity of woven fabrics using adaptive neuro-fuzzyinference system (ANFIS). The Journal of The TextileInstitute, 103, 1205–1212.
Çeven, E. K., & Ozdemir, O. (2007). Using fuzzy logic toevaluate and predicte chenille yarn’s shrinkage behaviour.Fibres and Textiles in Eastern Europe, 15, 55–63.
Chattopadhyay, R., & Guha, A. (2004). Artificial neuralnetworks: Applications to textiles. Textile Progress, 35(1),1–46.
Crawshaw, G. H. (2002). Carpet manufacture (Vol. 2).Sawston: Wronz Developments Christchurch.
Cullerton, D. L., Ellison, M. S., & Aspland, J. R. (1990).Effects of commercial heat setting on the structure andproperties of polyester carpet yarn. Textile ResearchJournal, 60, 594–606.
Table 6. Results of ANN prediction.
Normalized values YC2 Packing factor after heat setting Crimp contraction after heat setting Shrinkage Average
MSE 0.003652 0.014296 0.044678 0.005306 0.016983RMSE 0.060433 0.119565 0.211372 0.07284 0.116053R2 0.99515 0.9883 0.90736 0.98098 0.96
Table 7. Comparison between results of RSM and ANN.
RSM ANNFactor R-squared R-squared
Yarn count 0.9412 0.99515Crimp contraction 0.7574 0.90736Packing factor 0.9320 0.9883Shrinkage 0.8004 0.98098Average 0.85775 0.967948
The Journal of The Textile Institute 13

Dadgar, M., Hosseini-Varkiyani, S.-M., Merati, A. A., &Sarkheyli, A. (2013). Comparison of mamdani and sugenofuzzy inference system in prediction of residualfrieze effect of frieze carpet yarns. Tekstilna Industrija, 61,16–25.
Everaert, V., Vanneste, M., & Ruys, L. (1999). Techniques forthe evaluation of fiber heat setting in pp and pa carpetyarns (pp. 33–36). Unitex.
Gao, S.-Y., Huang, L.-Q., Wang, X.-L., Xie, Q., Yu, J.-Y., &Sun, D.-M. (2011). The influences of heat treatment on theshrinkage and tensile property of one-step process poy/fdypolyester combined yarn. Donghua Daxue Xuebao (ZiranBan), 37, 267–271.
Gupta, V. (2002). Heat setting. Journal of Applied PolymerScience, 83, 586–609.
Gupta, V., & Kumar, S. (1981a). The effect of heat setting onthe structure and mechanical properties of poly (ethyleneterephthalate) fiber. I: Structural changes. Journal ofApplied Polymer Science, 26, 1865–1876.
Gupta, V., & Kumar, S. (1981b). The effect of heat setting onthe structure and mechanical properties of poly (ethyleneterephthalate) fiber. II: The elastic modulus and itsdependence on structure. Journal of Applied PolymerScience, 26, 1877–1884.
Gupta, V., & Kumar, S. (1981c). The effect of heat setting onthe structure and mechanical properties of poly(ethyleneterephthalate) fiber. III: Anelastic properties and theirdependence on structure. Journal of Applied PolymerScience, 26, 1885–1895.
Gupta, V., & Kumar, S. (1981d). The effect of heat setting onthe structure and mechanical properties of poly (ethyleneterephthalate) fiber. IV: Tensile properties other thanmodulus and their dependence on structure. Journal ofApplied Polymer Science, 26, 1897–1905.
Hearle, J., El-Behery, H., & Thakur, V. (1959). The mechanicsof twisted yarns: Tensile properties of continuous-filamentyarns. Journal of the Textile Institute Transactions, 50,T83–T111.
Horrocks, A. R., Anand, S., & Anand, S. C. (2000). Handbookof technical textiles (Vol. 12, pp. 126–132). Cambridge:CRC Press.
Hui, C., Run-jia, H., Wei, T., & Qi-jun, X. (2011).Characterization of high modulus and low shrinkagepolyester technical yarn by simulation curing method.Synthetic Fiber in China, 11, 009.
Kasiri, M., Aleboyeh, H., & Aleboyeh, A. (2008). Modelingand optimization of heterogeneous photo-fenton processwith response surface methodology and artificial neuralnetworks. Environmental Science & Technology, 42, 7970–7975.
Kish, M. H., Shoushtari, S. A., & Kazemi, S. (2000). Effectsof cold-drawing and heat-setting on the structure andproperties of medium speed spun polypropylene filaments.Iranian Polymer Journal, 9, 239–248.
Körbahti, B. K., & Rauf, M. (2008). Response surfacemethodology (RSM) analysis of photoinduceddecoloration of toludine blue. Chemical EngineeringJournal, 136, 25–30.
Leaf, G. (1987). Practical statistics for the textile industry:Part II. Manchester: The Textile Institute.
Lin, J.-J. (2007). Prediction of yarn shrinkage using neuralnets. Textile Research Journal, 77, 336–342.
Lindberg, J., Køpke, V., & Fløisand, G. (1964). Heat setting ofprotein and cellulosic fibers. Textile Research Journal, 34,23–28.
Majumdar, A., Majumdar, P., & Sarkar, B. (2005). Applicationof an adaptive neuro-fuzzy system for the prediction ofcotton yarn strength from hvi fibre properties. The Journalof The Textile Institute, 96, 55–60.
Montgomery, D. C. (1984). Design and analysis of experiments(Vol. 7). New York, NY: Wiley.
Myers, R. H., & Anderson-Cook, C. M. (2009). Responsesurface methodology: Process and product optimizationusing designed experiments (Vol. 705, pp. 232–237).Hoboken, NJ: Wiley.
Nasouri, K., Bahrambeygi, H., Rabbi, A., Shoushtari, A. M., &Kaflou, A. (2012). Modeling and optimization ofelectrospun pan nanofiber diameter using response surfacemethodology and artificial neural networks. Journal ofApplied Polymer Science, 126, 127–135.
Pal, S., Mehta, Y., & Gandhi, R. (1989). Effects of heat settingon tensile and dye sorption characteristics of anionicmodified pet-a comparison with normal pet. TextileResearch Journal, 59, 734–738.
Pelisser, F., Neto, A. B., Rovere, H. L. L., & Pinto, R. C. d. A.(2010). Effect of the addition of synthetic fibers to concretethin slabs on plastic shrinkage cracking. Construction andBuilding Materials, 24, 2171–2176.
Rabbi, A., Nasouri, K., Bahrambeygi, H., Shoushtari, A. M., &Babaei, M. R. (2012). Rsm and ann approaches for modelingand optimizing of electrospun polyurethane nanofibersmorphology. Fibers and Polymers, 13, 1007–1014.
Rudolf, A., Geršak, J., & Smole, M. S. (2012). The effect ofheat treatment conditions using the drawing process on theproperties of pet filament sewing thread. Textile ResearchJournal, 82, 161–171.
Salehi, M., & Johari, M. S. (2011). Study of fiber packingdensity of lyocell ring‐spun yarns. The Journal of TheTextile Institute, 102, 389–394.
Samuels, R. J. (1974). Structured polymer properties: Theidentification, interpretation, and application of crystallinepolymer structure. New York, NY: Wiley.
Samui, B. K., Prakasan, M. P., Chakrabarty, D., &Mukhopadhyay, R. (2011). Hysteresis characteristics ofhigh modulus low shrinkage polyester tire yarn and cord.Rubber Chemistry and Technology, 84, 565–579.
Sarkeshick, S., Tavanai, H., Zarrebini, M., & Morshed, M.(2009). An investigation on the effects of heat-settingprocess on the properties of polypropylene bulkedcontinuous filament yarns. The Journal of The TextileInstitute, 100, 128–134.
Shen, F. L., Chen, G. Q., Ding, J. Z., & Dai, J. Y. (2011).Effect of heat-setting temperature on the structure andperformance of ultra-fine denier pet full drawing yarn.Advanced Materials Research, 197, 1276–1280.
Shishoo, R., & Olofsson, B. (1969). The effects of heat-settingon the geometry and shear behaviour of dacronpolyester-fibre and nylon fabrics. The Journal of TheTextile Institute, 60, 211–222.
Simal, A. L., & Martin, A. R. (1998). Structure of heat-treatednylon 6 and 6.6 fibers. I. The shrinkage mechanism.Journal of Applied Polymer Science, 68, 441–452.
Statton, W., Hearle, J., & Miles, L. (1971). The setting of fibresand fabrics (pp. 342–349). England: Merrow.
Vasanthan, N. (2004). Effect of heat setting temperatures ontensile mechanical properties of polyamide fibers. TextileResearch Journal, 74, 545–550.
Yel, E., & Yalpir, S. (2011). Prediction of primary treatmenteffluent parameters by fuzzy inference system (FIS)approach. Procedia Computer Science, 3, 659–665.
14 M. Dadgar et al.