
Common Technology Strategy (CONTEST
53
Common Technology Strategy (CONTEST) CONTEST D1-01 Page 1 of 53 Version 1.0.0 CONTEST D1-01 (COmmoN TEchnology STrategy) WP1: Customer Experience Framework Strategic Theme: Solutions For Excellent Customer Experience Type of document: Report
Transcript of Common Technology Strategy (CONTEST
Common Technology Strategy (CONTEST)
CONTEST D1-01 Page 1 of 53 Version 1.0.0
CONTEST D1-01 (COmmoN TEchnology STrategy)
WP1: Customer Experience Framework
Strategic Theme: Solutions For Excellent Customer Experience
Type of document: Report

Common Technology Strategy (CONTEST)
CONTEST D1-01 Page 2 of 53 Version 1.0.0
Document history: Document version no
Revision description Revision Responsible Revision Date
0.1 Table of content Ståle Njå 08.06.2009 0.2 Transfer of text from ppt
presentations Ståle Njå 10.06.2009
0.5 First draft Ståle Njå 18.06.2009 0.98 Internal review Tarald Trønnes & Ståle Njå 30.06.2009 0.99 Official version for
CONTEST review Tarald Trønnes 25.07.2009

Common Technology Strategy (CONTEST)
CONTEST D1-01 Page 3 of 53 Version 1.0.0
Executive summary
Brands are built through the sum of all experiences a customer has with a company through all its touch points. The value of the total experience received is what is compared with price when receiving offers from competing brands. Delivering the best customer experience throughout the life cycle is one of the strategic ambitions for the Telenor Group. Most Telenor companies have major Customer Experience projects ongoing, but during 2008 none of the Telenor companies were systematically monitoring the Telenor experience across all touch points. Therefore Group Business Development and Research has developed a systematic breakdown of the customer experience into the most important experience drivers of all touch points. Each experience driver is linked to a measurable performance indicator, which can be used as a KPI for organizations, teams and individuals. This document describes the framework structure, how to measure and build the customer experience index to monitor progress. It also describes how to use the framework for working systematically with customer experience. In order to compare between countries – some elements need to be common for all participating markets. Due to local market differences, the framework needs local adaptation before taken into use. Customer experience performance ranges, target values and costs are subject to local estimations. The Customer Experience Measurement and KPI Framework is recommended, but not mandatory to implement. A draft implementation overview is included.

Common Technology Strategy (CONTEST)
CONTEST D1-01 Page 4 of 53 Version 1.0.0
List of contents:
EXECUTIVE SUMMARY ..................................................................................................................... 3
1. INTRODUCTION ......................................................................................................................... 6
1.1. BACKGROUND ............................................................................................................ 6 1.2. PURPOSE ..................................................................................................................... 7 1.3. SCOPE LIMITATIONS ................................................................................................... 7 1.4. DEFINITIONS ............................................................................................................... 8
2. CUSTOMER EXPERIENCE MEASUREMENT FRAMEWORK .................................................. 9
2.1. INTRODUCTION TO THE FRAMEWORK ......................................................................... 9 2.1.1 Principles for the framework ........................................................................................... 9 2.1.2 Process for developing the framework ............................................................................ 9 2.1.3 How to model the experience? ....................................................................................... 9 2.1.4 Framework structure ......................................................................................................10
2.2. CUSTOMER TOUCH POINTS........................................................................................ 11 2.2.1 The Media experience ...................................................................................................12 2.2.2 The 1:1 Dialogue experience .........................................................................................13 2.2.3 The Web experience .....................................................................................................15 2.2.4 The Point of Sales experience .......................................................................................17 2.2.5 The Product & Service experience ................................................................................19 2.2.6 The Payment experience ...............................................................................................23 2.2.7 The Customer Service experience ................................................................................25 2.2.8 The On site Support experience ....................................................................................28 2.2.9 The Device experience ..................................................................................................29
2.3. HOW TO MEASURE .................................................................................................... 30 2.3.1 Principles for measuring ................................................................................................30 2.3.2 Measurement methods ..................................................................................................30 2.3.3 Metric scoring ................................................................................................................31 2.3.4 Translation of metric score into a Customer Experience score ......................................31 2.3.5 Aggregation into the Customer Experience Index ..........................................................33
3. HOW TO USE THE FRAMEWORK ...........................................................................................36
3.1. FRAMEWORK ADAPTATION TO LOCAL MARKET........................................................ 36 3.1.1 Mandatory elements ......................................................................................................36 3.1.2 Adjustable elements ......................................................................................................36
3.2. CUSTOMER EXPERIENCE PERFORMANCE ASSESSMENT ............................................ 37 3.2.1 Driver performance analysis ..........................................................................................37 3.2.2 Driver importance analysis ............................................................................................37 3.2.3 Defining Reference Experience .....................................................................................37 3.2.4 Gap analysis ..................................................................................................................37
3.3. ACTION PRIORITIZATION .......................................................................................... 39 3.4. ACTION IMPLEMENTATION ....................................................................................... 39 3.5. CUSTOMER EXPERIENCE PERFORMANCE MONITORING ............................................ 40 3.6. PERFORMANCE ANALYSIS ........................................................................................ 40 3.7. KPI SETTING ............................................................................................................ 41 3.8. MAINTENANCE OF THE FRAMEWORK ........................................................................ 42
4. HOW TO IMPLEMENT THE FRAMEWORK ..............................................................................43
4.1. DRAFT IMPLEMENTATION PLAN ................................................................................ 43 4.2. PROJECT RESOURCES ................................................................................................ 44
ANNEX 1. MINIMUM RECOMMENDED SET OF PERFORMANCE INDICATORS .......................45
ANNEX 2. MEASUREMENT FRAMEWORK DETAILS .................................................................47

Common Technology Strategy (CONTEST)
CONTEST D1-01 Page 5 of 53 Version 1.0.0
ANNEX 3. REQUIREMENTS FOR CE DASHBOARD ...................................................................48
ANNEX 4. BUSINESS TOUCH POINTS ........................................................................................50
ANNEX 5. NET PROMOTER SCORE (NPS) .................................................................................51

Common Technology Strategy (CONTEST)
CONTEST D1-01 Page 6 of 53 Version 1.0.0
1. Introduction
Telenor has a strategic ambition of delivering “the best customer experience throughout the life-cycle” in all our markets within 2011. Group Business Development & Research is monitoring efforts across the Telenor OpCos in achieving this ambition.
1.1. Background Based on a high level Customer Experience assessment in 2008, Telenor Group Business Development& Research decided to focus on ”Measurement & KPI Framework” as one of two key Customer Experience initiatives for 2009. The project report 1.0 was due June 2009.
Varying CE Focus
Silo thinking – no CE DNA
Technical Solutions
Missing CE KPIs
Resource allocation
Identified challenges
Low OpCo Synergies
Process improvement, Training, KPIs…
CE awareness, Team empowerment, Storytelling,..
CE Team way of work, Project prioritization, ROI,…
Process improvement, Training, KPIs…
CE awareness, Team empowerment, Storytelling,..
CE Team way of work, Project prioritization, ROI,…
Best Practice Sharing
Global Coordination CE activities
OSS
Measurement & KPI Framework
2 implemented concepts
Device & SIM Network CRM
Best Practice Sharing
Global Coordination CE activities
OSS
Measurement & KPI Framework
2 implemented concepts
Device & SIM Network CRM
Figure 1. Telenor 2008 Customer Experience Challenges and activities
The project is a joint effort between Operations and Markets and is a part of a larger set of deliverables within the strategic Customer Experience Theme.
CONTEST Stategic Theme : Solutions for
Excellent Customer Experience
CONTEST Stategic Theme : Solutions for
Excellent Customer Experience
MarketsCustomer Experience Excellence
MarketsCustomer Experience Excellence
Improvement Concepts
Experience Measurement Framework
Maturity Assessment
KPI Dashboard Operational Support Systems
CRM
Network
Device and SIM
Figure 2. Global Coordination Customer Experience Activities 2009

Common Technology Strategy (CONTEST)
CONTEST D1-01 Page 7 of 53 Version 1.0.0
1.2. Purpose The purpose of the Customer Experience Measurement Framework is to:
• Identify the main drivers of Customer Experience • Establish a systematic way of monitoring the customer experience • Identify the customer importance of the experience drivers • Identify areas of under- and possibly over-performance • Provide meaningful and actionable KPIs • Monitor improvement to stimulate organization • Enable benchmarking
The results of Customer Experience actions are not directly traceable in existing KPIs and performance measures. It is therefore important to establish a set of measurements to monitor progress. This will justify the efforts taken and motivate the whole organization to improve the customer experience throughout the life cycle.
1.3. Scope limitations In order to manage to deliver, the following limitations to the Customer Experience Measurement Framework have been defined:
Out of Scope Explanation
Root causes of bad experiences
The framework is a tool for monitoring the performance of the touch point – not for debugging the customer journey to find the root cause for the bad problem. A much more detailed analysis is needed to identify and rectify root causes.
Actions to improve customer experience
The framework is not identifying and defining a set of actions to improve the touch point performance.
Segmentation tool
The tool is not intended for clustering customers into segments according to experience preferences. A much more detailed study of customer needs is needed to build a need-based segmentation model.
The total experience
It is not possible to cover 100% of the customer experience in such a framework. There are always challenges occurring in-between touch points or as a result of inconsistency between touch points. Detailed customer journey mapping is needed to make this happen.
Business decision maker experience (see Annex 4)
Business users will be covered by this framework, but taking business decision makers and business solutions into account will require a completely different driver structure and a new set of touch points.
Segment specific weighting
In reality, every segment has different expectations to each driver and ideally each parameter should be weighted by the importance to the corresponding segment. This increases complexity by the number of segments, so this version will only use segment neutral scoring/weighting. By collecting segment information, the results can be presented by segment.
Figure 3. Limitations of the project

Common Technology Strategy (CONTEST)
CONTEST D1-01 Page 8 of 53 Version 1.0.0
1.4. Definitions
Term Definition
Customer Experience The internal and subjective response customers have to any direct or indirect contact with a company
Customer Touch point Any occasion where the customer gets an conscious or sub-conscious experience of interacting with a company
Experience Driver A significant factor affecting the experience in a positive or negative way
Metric A measurable performance indicator
Score A number derived from a given performance of a metric
Weight A factor used for increasing importance of drivers with higher value to the customer
Customer Experience score
The CE score is what each metric is converted to before being put into the framework. Range is -100 to +100. CE scores are also calculated for touch points and sub touch points based on the relative importance and CE scores of the underlying factors.
Customer Experience Index
The CE index is calculated based on the relative importance and CE scores of the different touch points. Range is -1000 to + 1000.
Customer Journey Mapping
Customer Journey Mapping (CJM) is a tool for visualizing how customers interact with organizations across multiple channels and touch points. It provides a map of the interactions that take place and of the emotions created at each touch point.
Customer Experience Maturity Level
An indication on the maturity of a company in working with Customer Experience Differentiation.
The Telenor Experience
A well defined blueprint experience as defined by the company based on brand- values, differentiators and strategy.
Figure 4. Definitions of used terms

Common Technology Strategy (CONTEST)
CONTEST D1-01 Page 9 of 53 Version 1.0.0
2. Customer Experience Measurement Framework
2.1. Introduction to the framework
2.1.1 Principles for the framework
Measurements can be used in many ways e.g. to confirm hypothesis’, monitor areas of focus, monitor progress in a defined direction etc. The following principles have been defined to ensure a common understanding of the framework design. The Customer Experience Framework should:
Be an “objective” measurement reflecting the customer’s mind as close as possible not colored by the company’s strategy.
Be as holistic and universal as possible to support global implementation but allow for 20-
30% local adaptation Make every experience count as the total Customer Experience is the sum of all conscious
and sub-conscious impressions
The framework should give the honest customer feedback to the actions performed through the strategy and actions of the company.
2.1.2 Process for developing the framework
The project used the following approach developing the framework:
Identify relevant
customer touch points
Identify CE drivers and
metrics
Prioritize drivers and
define metrics
Define principles for scoring and aggregation
Figure 5. Process for developing the framework
The framework has been developed by Group Business Development & Research in cooperation with Accenture. The driver structure has been reviewed by Kyivstar, Digi and Telenor Denmark.
2.1.3 How to model the experience?
The Customer Experience can be broken down in different ways, e.g.: A set of customer journeys Customer lifecycle Experience drivers Customer touch points
Customer touch points was chosen because
It is closest to how the customers’ think and hence easier for them to relate to It minimizes the duplication of items in the tree structure It simplifies the matching of KPIs with responsibilities within the Telenor organizations
The main weakness of the touch point approach is that a customer journeys often goes across touch points and defects occur in between the touch points. I.e. customer care promised that the on-site support agent will call within 2 days and then he doesn’t. Which touch point has low performance?

Common Technology Strategy (CONTEST)
CONTEST D1-01 Page 10 of 53 Version 1.0.0
However, drawing all journeys and incorporating all the sub-journey within and measuring their performance is far to complicated at the current maturity level of Telenor. By implementing the framework Telenor will be able to systematically fix the basics and identify the main challenges. In order to deep-dive into the processes and understand the root cause of malfunctioning touch points and journeys, tools like Customer Journey Mapping will be used.
2.1.4 Framework structure
The framework breaks down the customer experience through customer touch points. Each touch point is broken down to a set of sub-touch points (e.g. Customer care consist of IVR, agent, etc.). For each sub-touch point, a set of factors driving the positive or negative experience of that sub touch point have been identified. These factors are called Customer Experience Drivers. The performance of each driver can be assessed through measurable indicators named CE Metrics. The target is to build a Customer Experience index reflecting the customers’ impression of all sub-experiences by aggregating the performance indicators. This will require weighting the factors according to the customers’ importance.
133
28
9
CE indexCE index
Touch point 1Touch point 1
Sub-
touch point 1
Sub-
touch point 1
CE driver 1CE driver 1
CE driver nCE driver n
CE metricCE metric
Sub-Touch point n
Sub-Touch point n
Touch point nTouch point n
Figure 6. Framework structure
The numbers in the figure above reflect the number of touch points, sub touch points and drivers/metrics currently in the framework. This is only an indication, as the tree structure is subject to local adaptation. On the next pages, each touch point is presented with its sub touch points, experience drivers and metrics. The recommended KPIs (“minimum set”) and other performance indicators (“full set”) are distinguished this way:
Recommended KPIs (“minimum set”)Recommended KPIs (“minimum set”) Performance indicator (“full set”)Performance indicator (“full set”)
Figure 7. Color codes of minimum and full set of metrics
A list of the minimum recommended set of performance indicators can be found in Annex 1. For more details on the framework, please look at the excel document included in Annex 2.

Common Technology Strategy (CONTEST)
CONTEST D1-01 Page 11 of 53 Version 1.0.0
2.2. Customer touch points The Telenor customer experience is built on experiences from 9 defined touch points, shown in the figure below. Not all touch points are equally relevant to all OpCos, for example will the On-site support experience typically be more important for those OpCos that offer fixed line and internet services. On the sub touch point level the need for local adaptation is even more relevant.
The Customer Service experience
The Customer Service experience
The Media experience
The Media experience
The 1:1 Dialogue experience
The 1:1 Dialogue experience
The Web experience
The Web experience
The Point of Sales experience
The Point of Sales experience
The Product & Service experience
The Product & Service experience
Customer touch point
The Payment experience
The Payment experience
The On site support experience
The On site support experience
The Device experience
The Device experience
Customer Experience
Customer Experience
Figure 8. Customer touch points
Price was not included as an own touch point because this is the factor which the total experience is evaluated against (value for money). Reputation was also considered as an own touch point, but elements of reputation are covered in the Media experience. Both price and reputation are measured and followed up in the Telenor Brand Tracker.

Common Technology Strategy (CONTEST)
CONTEST D1-01 Page 12 of 53 Version 1.0.0
2.2.1 The Media experience
The Media experience reflects the customer’s impression of the company’s market communication and how the company is referred to in media. This is divided into the sub touch points Media coverage and Advertising. Media coverage is defined by how the company is mentioned in the press and how it is referred to on Internet forums and blogs (Facebook, Twitter etc). Advertising covers promotions through TV, radio, cinema, newspapers, magazines etc. The most important is to capture the subjective impression the customer has whether our messages to him are understandable and relevant.
The Customer Service experience
The Customer Service experience
The Media experience
The Media experience
The 1:1 Dialogue experience
The 1:1 Dialogue experience
The Web experience
The Web experience
The Point of Sales experience
The Point of Sales experience
The Product & Service experience
The Product & Service experience
Customer touch point
AdvertisingAdvertising
Sub touch point CE driver CE Metric
The Payment experience
The Payment experience
The On site support experience
The On site support experience
Media coverage
Media coverage
The Device experience
The Device experience
Customer Experience
Customer Experience
DesirabilityDesirability
Ease of responding/Actionable
Ease of responding/Actionable
Clear and understandable communication
Clear and understandable communication
RelevanceRelevance
Tone of voiceTone of voice
Look & FeelLook & Feel
Positive/negative news in press
Positive/negative news in press
Recommendations through forums/blogs
Recommendations through forums/blogs
Attractiveness/desirability rating by customer
Attractiveness/desirability rating by customer
Ease of responding/actionable rating by customer
Ease of responding/actionable rating by customer
% positive articles of total articles% positive articles of total articles
Clear and understandable comm. rating by customer
Clear and understandable comm. rating by customer
Relevance rating by customerRelevance rating by customer
Tone of voice rating by customerTone of voice rating by customer
Look & Feel rating by customerLook & Feel rating by customer
% positive recommendations of total% positive recommendations of total
Figure 9. The Media experience

Common Technology Strategy (CONTEST)
CONTEST D1-01 Page 13 of 53 Version 1.0.0
2.2.2 The 1:1 Dialogue experience
The 1:1 Dialogue experience reflects the customer’s impression of how the company communicates directly with each individual customer. Sub touch points are Direct Marketing, Telemarketing and General Messages. Direct Marketing can be electronic or paper based newsletters or offers delivered by eMail/Internet/SMS/MMS and mail (physical letters) respectively. The main satisfaction driver here is whether our offers are seen as useful or not.
The Customer Service experience
The Customer Service experience
The Media experience
The Media experience
The 1:1 Dialogue experience
The 1:1 Dialogue experience
The Web experience
The Web experience
The Point of Sales experience
The Point of Sales experience
The Product & Service experience
The Product & Service experience
Customer touch point
Direct Marketing
Direct Marketing
Sub touch point CE driver CE Metric
The Payment experience
The Payment experience
The On site support experience
The On site support experience
TelemarketingTelemarketing
General messages
General messages
The Device experience
The Device experience
Customer Experience
Customer Experience
FrequencyFrequency
Ease of responding/Actionable
Ease of responding/Actionable
Usefulness for customerUsefulness for customer
Clear and understandable communication
Clear and understandable communication
DesirabilityDesirability
Look & FeelLook & Feel
Frequency rating by customerFrequency rating by customer
Ease of responding/actionable rating by customer
Ease of responding/actionable rating by customer
Usefulness rating by customerUsefulness rating by customer
Clear and understandable comm. rating by customer
Clear and understandable comm. rating by customer
Attractiveness/desirability rating by customer
Attractiveness/desirability rating by customer
Look & Feel rating by customerLook & Feel rating by customer
Figure 10. The 1:1 Dialogue– Direct Marketing experience

Common Technology Strategy (CONTEST)
CONTEST D1-01 Page 14 of 53 Version 1.0.0
Telemarketing is outgoing calls from the company to customers. The main satisfaction driver is the treatment received from the agent and to which degree the call was annoying the customer.
The Customer Service experience
The Customer Service experience
The Media experience
The Media experience
The 1:1 Dialogue experience
The 1:1 Dialogue experience
The Web experience
The Web experience
The Point of Sales experience
The Point of Sales experience
The Product & Service experience
The Product & Service experience
Customer touch point
Direct Marketing
Direct Marketing
Sub touch point CE driver CE Metric
The Payment experience
The Payment experience
The On site support experience
The On site support experience
TelemarketingTelemarketing
General messages
General messages
The Device experience
The Device experience
Customer Experience
Customer Experience
Speech claritySpeech clarity
Appropriate timing and frequency
Appropriate timing and frequency
Usefulness for customerUsefulness for customer
Agent knowledgeAgent knowledge
Agent treatmentAgent treatment
Clear and understandable communication
Clear and understandable communication
DesirabilityDesirability
Speech clarity rating by customerSpeech clarity rating by customer
Timing & frequency rating by customerTiming & frequency rating by customer
Attractiveness/desirability rating by customer
Attractiveness/desirability rating by customer
Usefulness rating by customerUsefulness rating by customer
Agent knowledge rating by customerAgent knowledge rating by customer
Agent treatment rating by customerAgent treatment rating by customer
Clear and understandable comm. rating by customer
Clear and understandable comm. rating by customer
Figure 11. The 1:1 Dialogue– Telemarketing experience
General messages could be various retention, confirmation and maintenance messages, welcome or birthday greetings etc. The most important is whether the message is really useful for the customer.
The Customer Service experience
The Customer Service experience
The Media experience
The Media experience
The 1:1 Dialogue experience
The 1:1 Dialogue experience
The Web experience
The Web experience
The Point of Sales experience
The Point of Sales experience
The Product & Service experience
The Product & Service experience
Customer touch point
Direct Marketing
Direct Marketing
Sub touch point CE driver CE Metric
The Payment experience
The Payment experience
The On site support experience
The On site support experience
TelemarketingTelemarketing
General messages
General messages
The Device experience
The Device experience
Customer Experience
Customer Experience
Clear and understandable communication
Clear and understandable communication
Usefulness for customerUsefulness for customer
FriendlinessFriendliness
Frequency (all messages)Frequency (all messages)
Clear and understandable comm. rating by customer
Clear and understandable comm. rating by customer
Usefulness rating by customerUsefulness rating by customer
Friendliness rating by customerFriendliness rating by customer
Frequency rating by customerFrequency rating by customer
Figure 12. The 1:1 Dialogue– General messages experience

Common Technology Strategy (CONTEST)
CONTEST D1-01 Page 15 of 53 Version 1.0.0
2.2.3 The Web experience
The Web experience reflects the customer’s impression of the company’s web sites. Sub touch points are Site performance, Site relevance and Usability. Site performance is driven by reliability and speed, and the most critical point for the customer is the waiting time to download different pages. Site relevance is customers’ impression of the correctness and completeness of the information and that the right functions and features are offered. The comprehensiveness of the information is considered as most important satisfaction driver.
The Customer Service experience
The Customer Service experience
The Media experience
The Media experience
The 1:1 Dialogue experience
The 1:1 Dialogue experience
The Web experience
The Web experience
The Point of Sales experience
The Point of Sales experience
The Product & Service experience
The Product & Service experience
Customer touch point Sub touch point CE driver CE Metric
The Payment experience
The Payment experience
The On site support experience
The On site support experience
Site relevanceSite relevance
UsabilityUsability
The Device experience
The Device experience
Customer Experience
Customer Experience Information completenessInformation completeness
FunctionalityFunctionality
Web site reliabilityWeb site reliability
Web site speedWeb site speed
Information accuracyInformation accuracy
Information currencyInformation currency
Comprehensiveness and thoroughness of info rating by customer
Comprehensiveness and thoroughness of info rating by customer
Function & features rating by customerFunction & features rating by customer
% hits when web site is unavailable% hits when web site is unavailable
Time to download "reference" page(s)Time to download "reference" page(s)
Accuracy of info/data rating by customer
Accuracy of info/data rating by customer
Currency / real-time / up-to-date publication of info rating by customer
Currency / real-time / up-to-date publication of info rating by customer
Site performance
Site performance
Figure 13. The Web– Site performance and Site relevance experience

Common Technology Strategy (CONTEST)
CONTEST D1-01 Page 16 of 53 Version 1.0.0
Usability is the main driver for the web experience, and will be emphasized when it comes to measuring. Most important is to capture intuitiveness of navigation and if the customer is able to solve his/her problem or task efficiently.
The Customer Service experience
The Customer Service experience
The Media experience
The Media experience
The 1:1 Dialogue experience
The 1:1 Dialogue experience
The Web experience
The Web experience
The Point of Sales experience
The Point of Sales experience
The Product & Service experience
The Product & Service experience
Customer touch point
Site performance
Site performance
Sub touch point CE driver CE Metric
The Payment experience
The Payment experience
The On site support experience
The On site support experience
Site relevanceSite relevance
UsabilityUsability
The Device experience
The Device experience
Customer Experience
Customer Experience
Ease of buyingEase of buying
Information presentationInformation presentation
InteractivenessInteractiveness
Ease of navigationEase of navigation
Degree of task solvedDegree of task solved
Ease of buying rating by customerEase of buying rating by customer
Information presentation rating by customer
Information presentation rating by customer
Interactiveness rating by customerInteractiveness rating by customer
Ease of navigation rating by customerEase of navigation rating by customer
“Task solved” rating by customer“Task solved” rating by customer
Ease of other key/frequent task
Ease of other key/frequent task
Ease of conducting other key/frequent task rating by customer
Ease of conducting other key/frequent task rating by customer
Figure 14. The Web– Usability experience
Common Technology Strategy (CONTEST)
CONTEST D1-01 Page 17 of 53 Version 1.0.0
2.2.4 The Point of Sales experience
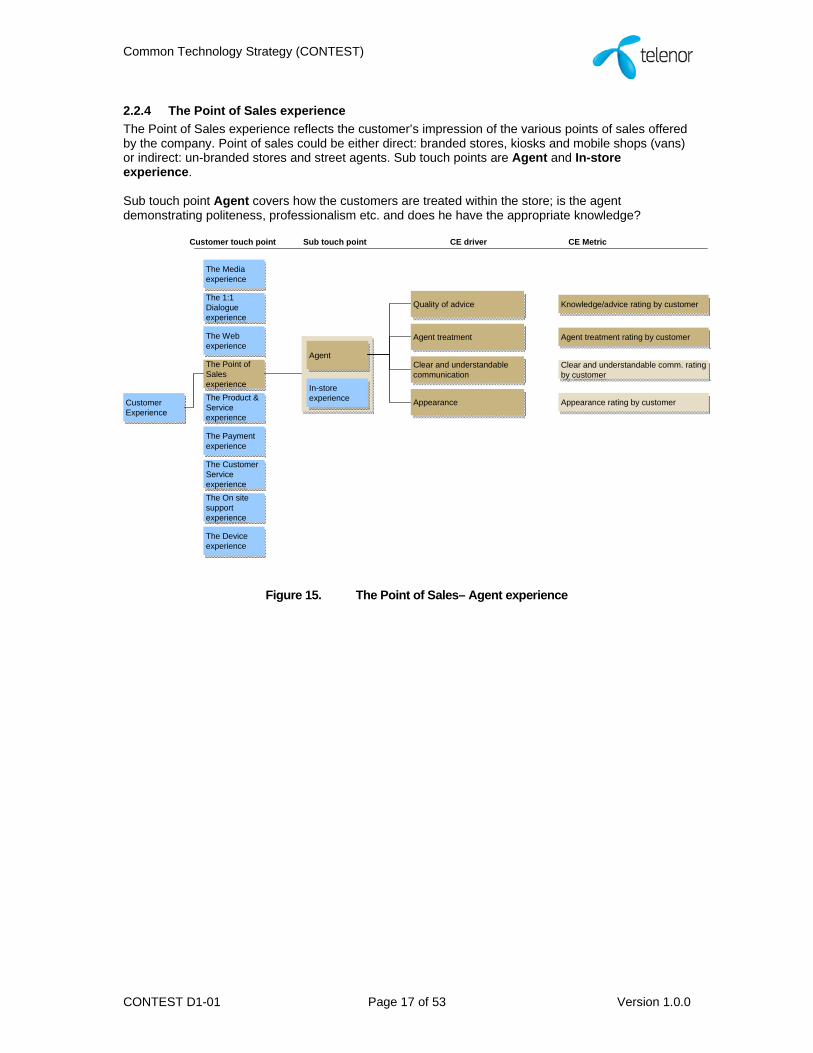
The Point of Sales experience reflects the customer’s impression of the various points of sales offered by the company. Point of sales could be either direct: branded stores, kiosks and mobile shops (vans) or indirect: un-branded stores and street agents. Sub touch points are Agent and In-store experience. Sub touch point Agent covers how the customers are treated within the store; is the agent demonstrating politeness, professionalism etc. and does he have the appropriate knowledge?
The Customer Service experience
The Customer Service experience
The Media experience
The Media experience
The 1:1 Dialogue experience
The 1:1 Dialogue experience
The Web experience
The Web experience
The Point of Sales experience
The Point of Sales experience
The Product & Service experience
The Product & Service experience
Customer touch point
AgentAgent
Sub touch point CE driver CE Metric
The Payment experience
The Payment experience
The On site support experience
The On site support experience
In-store experience
In-store experience
The Device experience
The Device experience
Customer Experience
Customer Experience
Quality of adviceQuality of advice
Agent treatmentAgent treatment
Clear and understandable communication
Clear and understandable communication
AppearanceAppearance
Knowledge/advice rating by customerKnowledge/advice rating by customer
Agent treatment rating by customerAgent treatment rating by customer
Clear and understandable comm. rating by customer
Clear and understandable comm. rating by customer
Appearance rating by customerAppearance rating by customer
Figure 15. The Point of Sales– Agent experience

Common Technology Strategy (CONTEST)
CONTEST D1-01 Page 18 of 53 Version 1.0.0
The In-store experience consists of several elements that in sum form the impression of a store visit. The most important satisfaction drivers are considered to be the overall “look & feel” of the store and how easy it is to obtain the visit’s objective (buy, repair, obtain info etc).
The Customer Service experience
The Customer Service experience
The Media experience
The Media experience
The 1:1 Dialogue experience
The 1:1 Dialogue experience
The Web experience
The Web experience
The Point of Sales experience
The Point of Sales experience
The Product & Service experience
The Product & Service experience
Customer touch point
AgentAgent
Sub touch point CE driver CE Metric
The Payment experience
The Payment experience
The On site support experience
The On site support experience
In-store experience
In-store experience
The Device experience
The Device experience
Customer Experience
Customer Experience
Store layoutStore layout
Store InteractivityStore Interactivity
Availability and opening hours
Availability and opening hours
Waiting time in storeWaiting time in store
Store Look & FeelStore Look & Feel
Product & Service relevanceProduct & Service relevance
Store layout rating by customerStore layout rating by customer
Store interactivity rating by customerStore interactivity rating by customer
Usefulness of product/service rating by customer
Usefulness of product/service rating by customer
Store availability rating by customerStore availability rating by customer
Waiting time rating by customerWaiting time rating by customer
Store Look & Feel rating by customerStore Look & Feel rating by customer
Clear pricing signageClear pricing signage
Ease of completing taskEase of completing task
Pricing comprehension and acceptability rating by customer
Pricing comprehension and acceptability rating by customer
Ease of completing task rating by customer
Ease of completing task rating by customer
Figure 16. The Point of Sales– In-store experience

Common Technology Strategy (CONTEST)
CONTEST D1-01 Page 19 of 53 Version 1.0.0
2.2.5 The Product & Service experience
The Product and Service experience reflects the customer’s impression of how well the different products and services work in terms of e.g. delivery, service quality and ease of use. Sub touch points are Delivery, Voice, Messaging, Small screen Internet/WAP, Broadband, VAS / 3.party and Roaming. There will be a good mix of technical measurements and customer perception of the products and services. One could consider including Quality of Instructions either under device or relevant service experiences. Delivery covers both delivery of services and physical packages. Key driver for the delivery experience is instant activation of the most important services.
The Customer Service experience
The Customer Service experience
The Media experience
The Media experience
The 1:1 Dialogue experience
The 1:1 Dialogue experience
The Web experience
The Web experience
The Point of Sales experience
The Point of Sales experience
The Product & Service experience
The Product & Service experience
Customer touch point
DeliveryDelivery
Sub touch point
Timely physical deliveryTimely physical delivery
Branded & intuitive physical packaging
Branded & intuitive physical packaging
CE driver CE Metric
% of package deliveries by committed date and time
% of package deliveries by committed date and time
Intuitive-ness of unwrapping experience rating by customer
Intuitive-ness of unwrapping experience rating by customer
% trouble tickets of total physical deliveries
% trouble tickets of total physical deliveries
The Payment experience
The Payment experience
The On site support experience
The On site support experience
VoiceVoice
MessagingMessaging
Small screen Internet / WAP
Small screen Internet / WAP
VAS / 3. partyVAS / 3. party
RoamingRoamingThe Device experience
The Device experience
BroadbandBroadband
Quick SIM activationQuick SIM activation
Quick broadband activationQuick broadband activation
Time from purchase to first useTime from purchase to first use
Time from purchase to first useTime from purchase to first use
% of service deliveries by committed date
% of service deliveries by committed date
% trouble tickets of total service deliveries
% trouble tickets of total service deliveries
Timely delivery other services
Timely delivery other services
Service delivery right first time
Service delivery right first time
Physical delivery right first time
Physical delivery right first time
Customer Experience
Customer Experience
Perceived SIM replacement time rating by customer
Perceived SIM replacement time rating by customerSpeed of SIM replacement Speed of SIM replacement
Figure 17. The Product & Service– Delivery experience
Common Technology Strategy (CONTEST)
CONTEST D1-01 Page 20 of 53 Version 1.0.0
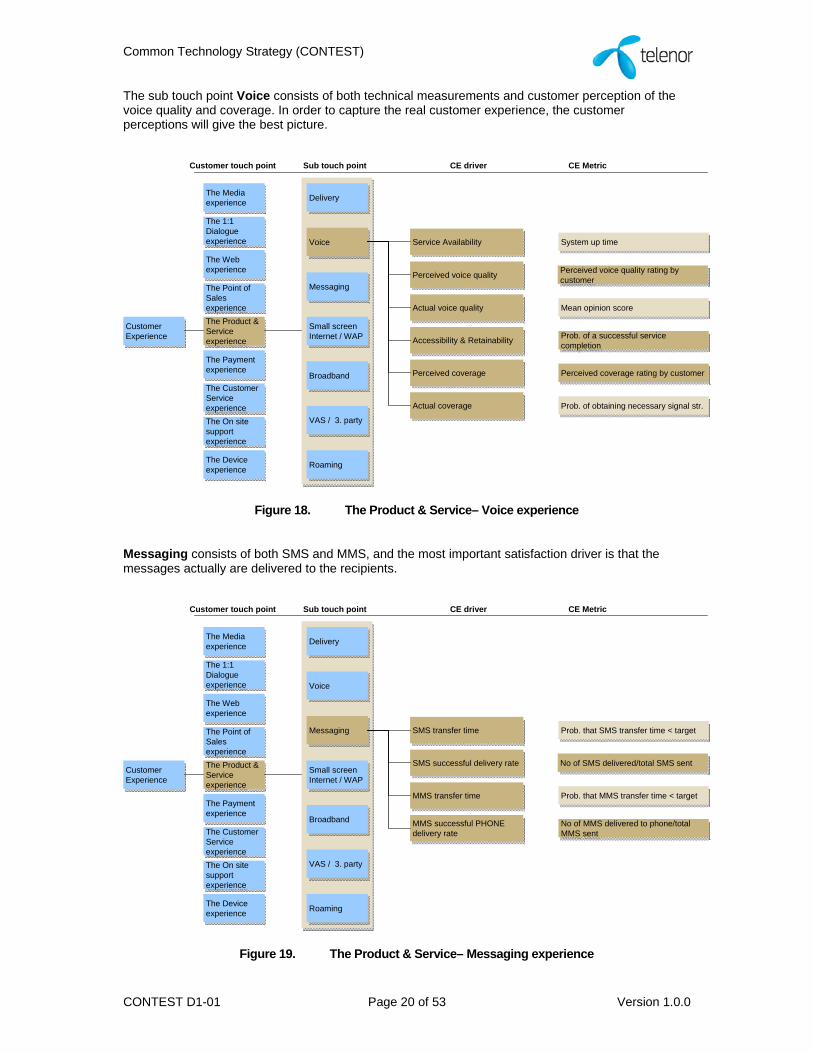
The sub touch point Voice consists of both technical measurements and customer perception of the voice quality and coverage. In order to capture the real customer experience, the customer perceptions will give the best picture.
The Customer Service experience
The Customer Service experience
The Media experience
The Media experience
The 1:1 Dialogue experience
The 1:1 Dialogue experience
The Web experience
The Web experience
The Point of Sales experience
The Point of Sales experience
The Product & Service experience
The Product & Service experience
Customer touch point
DeliveryDelivery
Sub touch point
Actual coverageActual coverage
CE driver CE Metric
Prob. of obtaining necessary signal str.Prob. of obtaining necessary signal str.
The Payment experience
The Payment experience
The On site support experience
The On site support experience
VoiceVoice
MessagingMessaging
Small screen Internet / WAP
Small screen Internet / WAP
VAS / 3. partyVAS / 3. party
RoamingRoamingThe Device experience
The Device experience
BroadbandBroadband
Service AvailabilityService Availability
Actual voice qualityActual voice quality
System up time System up time
Mean opinion scoreMean opinion score
Prob. of a successful service completion
Prob. of a successful service completion
Perceived coverage rating by customerPerceived coverage rating by customer
Accessibility & RetainabilityAccessibility & Retainability
Perceived coveragePerceived coverage
Customer Experience
Customer Experience
Perceived voice quality rating by customer
Perceived voice quality rating by customerPerceived voice qualityPerceived voice quality
Figure 18. The Product & Service– Voice experience
Messaging consists of both SMS and MMS, and the most important satisfaction driver is that the messages actually are delivered to the recipients.
The Customer Service experience
The Customer Service experience
The Media experience
The Media experience
The 1:1 Dialogue experience
The 1:1 Dialogue experience
The Web experience
The Web experience
The Point of Sales experience
The Point of Sales experience
The Product & Service experience
The Product & Service experience
Customer touch point
DeliveryDelivery
Sub touch point CE driver CE Metric
The Payment experience
The Payment experience
The On site support experience
The On site support experience
VoiceVoice
MessagingMessaging
Small screen Internet / WAP
Small screen Internet / WAP
VAS / 3. partyVAS / 3. party
RoamingRoamingThe Device experience
The Device experience
BroadbandBroadband
SMS transfer timeSMS transfer time
MMS transfer timeMMS transfer time
Prob. that SMS transfer time < targetProb. that SMS transfer time < target
Prob. that MMS transfer time < targetProb. that MMS transfer time < target
No of MMS delivered to phone/total MMS sent
No of MMS delivered to phone/total MMS sent
MMS successful PHONE delivery rate
MMS successful PHONE delivery rate
Customer Experience
Customer Experience
No of SMS delivered/total SMS sentNo of SMS delivered/total SMS sentSMS successful delivery rateSMS successful delivery rate
Figure 19. The Product & Service– Messaging experience

Common Technology Strategy (CONTEST)
CONTEST D1-01 Page 21 of 53 Version 1.0.0
Small screen Internet/WAP means browsing through a mobile device (not laptop). Main satisfaction drivers are speed and stability of service, but also the usefulness of the operator portal.
The Customer Service experience
The Customer Service experience
The Media experience
The Media experience
The 1:1 Dialogue experience
The 1:1 Dialogue experience
The Web experience
The Web experience
The Point of Sales experience
The Point of Sales experience
The Product & Service experience
The Product & Service experience
Customer touch point
DeliveryDelivery
Sub touch point
Content and FeaturesContent and Features
CE driver CE Metric
Rating of right content/features on operator portal by customer
Rating of right content/features on operator portal by customer
The Payment experience
The Payment experience
The On site support experience
The On site support experience
VoiceVoice
MessagingMessaging
Small screen Internet / WAP
Small screen Internet / WAP
VAS / 3. partyVAS / 3. party
RoamingRoamingThe Device experience
The Device experience
BroadbandBroadband
SpeedSpeed
Ease of useEase of use
Time to download a reference wap-page
Time to download a reference wap-page
Ease of use rating by customerEase of use rating by customer
Perceived coverage rating by customerPerceived coverage rating by customer
Visual quality rating of operator portal by customer
Visual quality rating of operator portal by customer
Perceived coveragePerceived coverage
Portal Look & FeelPortal Look & Feel
Customer Experience
Customer Experience
Prob. of a successful service completion
Prob. of a successful service completionAccessibility & RetainabilityAccessibility & Retainability
Figure 20. The Product & Service– Small screen Internet/WAP experience
Broadband can be either mobile or fixed broadband. An important satisfaction driver for mobile broadband besides speed and stability is the customers’ impression of the coverage.
The Customer Service experience
The Customer Service experience
The Media experience
The Media experience
The 1:1 Dialogue experience
The 1:1 Dialogue experience
The Web experience
The Web experience
The Point of Sales experience
The Point of Sales experience
The Product & Service experience
The Product & Service experience
Customer touch point
DeliveryDelivery
Sub touch point
Portal relevancePortal relevance
CE driver CE Metric
Interest match rating of Operator portal by customer
Interest match rating of Operator portal by customer
The Payment experience
The Payment experience
The On site support experience
The On site support experience
VoiceVoice
MessagingMessaging
Small screen Internet / WAP
Small screen Internet / WAP
VAS / 3. partyVAS / 3. party
RoamingRoamingThe Device experience
The Device experience
BroadbandBroadband
Ease of getting startedEase of getting started
Accessibility & RetainabilityAccessibility & Retainability
% of customers in contact with Customer Service
% of customers in contact with Customer Service
Prob. of a successful service completion
Prob. of a successful service completion
Perceived coverage rating by customerPerceived coverage rating by customer
Prob. of obtaining necessary signal str.Prob. of obtaining necessary signal str.
Perceived coveragePerceived coverage
Actual coverageActual coverage
Customer Experience
Customer Experience Time to download a reference web-
page
Time to download a reference web-pageSpeedSpeed
Figure 21. The Product & Service– Broadband experience

Common Technology Strategy (CONTEST)
CONTEST D1-01 Page 22 of 53 Version 1.0.0
For sub touch point VAS/3.party services, the most frequent used services should be included (needs to be specified by each OpCo). Most important driver is the overall satisfaction with the service. The scope of Roaming is our customers abroad (not international roamers in our network). Most important to capture is whether the customers are relevantly informed about the roaming services and especially about prices (negative experiences due to bill shocks are covered under touch point Payment experience).
The Customer Service experience
The Customer Service experience
The Media experience
The Media experience
The 1:1 Dialogue experience
The 1:1 Dialogue experience
The Web experience
The Web experience
The Point of Sales experience
The Point of Sales experience
The Product & Service experience
The Product & Service experience
Customer touch point
DeliveryDelivery
Sub touch point CE driver CE Metric
The Payment experience
The Payment experience
The On site support experience
The On site support experience
VoiceVoice
MessagingMessaging
Small screen Internet / WAP
Small screen Internet / WAP
VAS / 3. partyVAS / 3. party
RoamingRoamingThe Device experience
The Device experience
BroadbandBroadband
Service "Start-up"Service "Start-up"
Ease of useEase of use
Ease of getting started rating by customer
Ease of getting started rating by customer
Ease of use rating by customerEase of use rating by customer
Price transparency rating by customerPrice transparency rating by customer
Perceived quality rating by customerPerceived quality rating by customer
Price transparencyPrice transparency
Accessibility & RetainabilityAccessibility & Retainability
Customer Experience
Customer Experience
Service satisfaction rating by customerService satisfaction rating by customerService QualityService Quality
Figure 22. The Product & Service– VAS/3.party and Roaming experience

Common Technology Strategy (CONTEST)
CONTEST D1-01 Page 23 of 53 Version 1.0.0
2.2.6 The Payment experience
The Payment experience reflects the customer’s impression of paying for services through one of the two sub touch points Top-up or Invoice. Top-up consists of both scratch cards and eLoad for prepaid subscribers. The availability of scratch cards and eLoad is critical for the top up experience. When the customer finds a top up opportunity, the intuitiveness of use is the key driver.
The Customer Service experience
The Customer Service experience
The Media experience
The Media experience
The 1:1 Dialogue experience
The 1:1 Dialogue experience
The Web experience
The Web experience
The Point of Sales experience
The Point of Sales experience
The Product & Service experience
The Product & Service experience
Customer touch point
Top upTop up
Sub touch point CE driver CE Metric
The Payment experience
The Payment experience
The On site support experience
The On site support experience
InvoiceInvoice
The Device experience
The Device experience
Customer Experience
Customer Experience
Price transparency eLoadPrice transparency eLoad
Ease of use scratch cardEase of use scratch card
Availability Top-upAvailability Top-up
Variety scratch cardVariety scratch card
Look & Feel scratch cardLook & Feel scratch card
Price transparency scratch card
Price transparency scratch card
Ease of use eLoadEase of use eLoad
Price transparency eLoad rating by customer
Price transparency eLoad rating by customer
Ease of use of scratch card rating by customer
Ease of use of scratch card rating by customer
Ease of use of eLoad rating by customer
Ease of use of eLoad rating by customer
Availability of top-up rating by customerAvailability of top-up rating by customer
Variety scratch card rating by customerVariety scratch card rating by customer
Look & Feel rating by customerLook & Feel rating by customer
Price transparency scratch card rating by customer
Price transparency scratch card rating by customer
Speed of eLoad transactionSpeed of eLoad transaction Av. time from order to transaction completed
Av. time from order to transaction completed
Figure 23. The Payment– Top up experience
Common Technology Strategy (CONTEST)
CONTEST D1-01 Page 24 of 53 Version 1.0.0
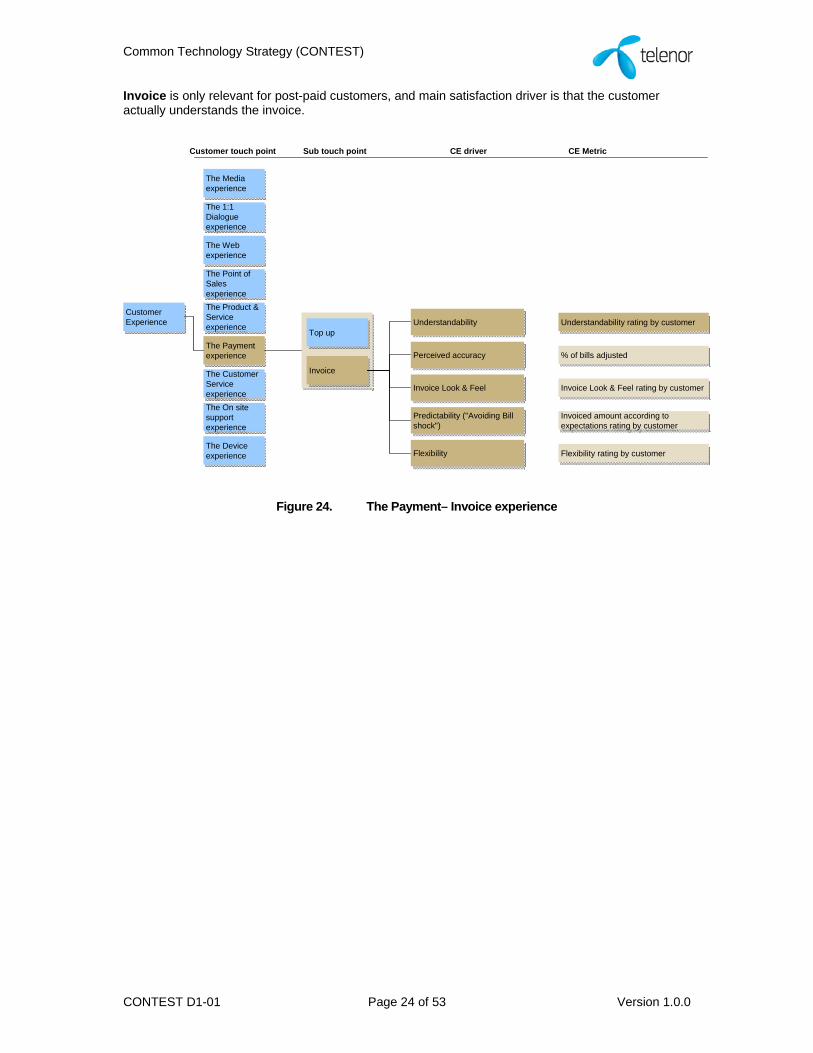
Invoice is only relevant for post-paid customers, and main satisfaction driver is that the customer actually understands the invoice.
The Customer Service experience
The Customer Service experience
The Media experience
The Media experience
The 1:1 Dialogue experience
The 1:1 Dialogue experience
The Web experience
The Web experience
The Point of Sales experience
The Point of Sales experience
The Product & Service experience
The Product & Service experience
Customer touch point
Top upTop up
Sub touch point CE driver CE Metric
The Payment experience
The Payment experience
The On site support experience
The On site support experience
InvoiceInvoice
The Device experience
The Device experience
Customer Experience
Customer Experience
FlexibilityFlexibility
UnderstandabilityUnderstandability
Perceived accuracyPerceived accuracy
Invoice Look & FeelInvoice Look & Feel
Predictability ("Avoiding Bill shock")
Predictability ("Avoiding Bill shock")
Flexibility rating by customerFlexibility rating by customer
Understandability rating by customerUnderstandability rating by customer
% of bills adjusted% of bills adjusted
Invoice Look & Feel rating by customerInvoice Look & Feel rating by customer
Invoiced amount according to expectations rating by customer
Invoiced amount according to expectations rating by customer
Figure 24. The Payment– Invoice experience
Common Technology Strategy (CONTEST)
CONTEST D1-01 Page 25 of 53 Version 1.0.0
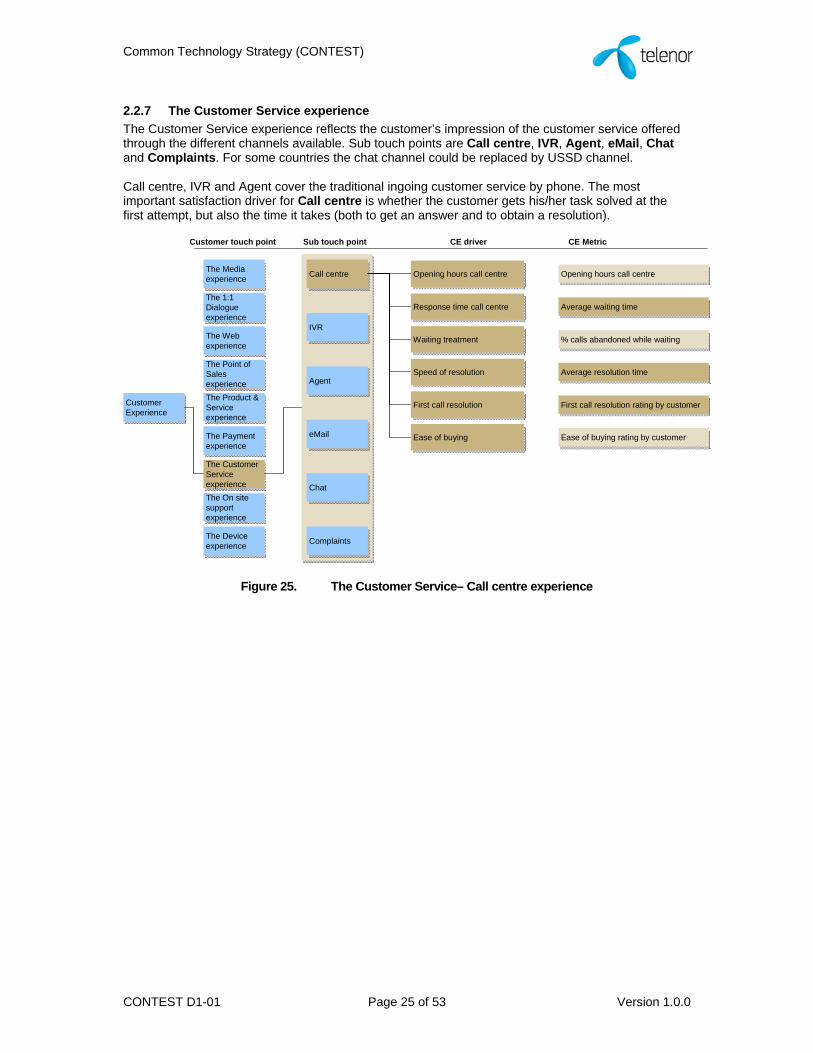
2.2.7 The Customer Service experience
The Customer Service experience reflects the customer’s impression of the customer service offered through the different channels available. Sub touch points are Call centre, IVR, Agent, eMail, Chat and Complaints. For some countries the chat channel could be replaced by USSD channel. Call centre, IVR and Agent cover the traditional ingoing customer service by phone. The most important satisfaction driver for Call centre is whether the customer gets his/her task solved at the first attempt, but also the time it takes (both to get an answer and to obtain a resolution).
The Customer Service experience
The Customer Service experience
The Media experience
The Media experience
The 1:1 Dialogue experience
The 1:1 Dialogue experience
The Web experience
The Web experience
The Point of Sales experience
The Point of Sales experience
The Product & Service experience
The Product & Service experience
Customer touch point
Call centreCall centre
Sub touch point CE driver CE Metric
The Payment experience
The Payment experience
The On site support experience
The On site support experience
IVRIVR
AgentAgent
eMaileMail
ComplaintsComplaintsThe Device experience
The Device experience
ChatChat
Customer Experience
Customer Experience
First call resolutionFirst call resolution
Ease of buyingEase of buying
Opening hours call centreOpening hours call centre
Response time call centreResponse time call centre
Waiting treatmentWaiting treatment
Speed of resolutionSpeed of resolution
First call resolution rating by customerFirst call resolution rating by customer
Ease of buying rating by customerEase of buying rating by customer
Opening hours call centreOpening hours call centre
Average waiting timeAverage waiting time
% calls abandoned while waiting% calls abandoned while waiting
Average resolution timeAverage resolution time
Figure 25. The Customer Service– Call centre experience

Common Technology Strategy (CONTEST)
CONTEST D1-01 Page 26 of 53 Version 1.0.0
Call centre, IVR and Agent cover the traditional ingoing customer service by phone. The most important for IVR is the intuitiveness of navigation through the menus and that the customer actually is capable of solving his/her task completely within the IVR. Agent covers how the customers are treated; is the agent demonstrating politeness, professionalism etc. and does he/she have the appropriate knowledge.
The Customer Service experience
The Customer Service experience
The Media experience
The Media experience
The 1:1 Dialogue experience
The 1:1 Dialogue experience
The Web experience
The Web experience
The Point of Sales experience
The Point of Sales experience
The Product & Service experience
The Product & Service experience
Customer touch point
Call centreCall centre
Sub touch point CE driver CE Metric
The Payment experience
The Payment experience
The On site support experience
The On site support experience
IVRIVR
AgentAgent
eMaileMail
ComplaintsComplaintsThe Device experience
The Device experience
ChatChat
Customer Experience
Customer Experience Transfer to multiple peopleTransfer to multiple people
Agent treatmentAgent treatment
Ease of navigationEase of navigation
IVR resolution degreeIVR resolution degree
Tone of voiceTone of voice
Quality of advice/answerQuality of advice/answer
Average no. of transfers for resolutionAverage no. of transfers for resolution
Agent treatment rating by customerAgent treatment rating by customer
Ease of navigation rating by customerEase of navigation rating by customer
IVR resolution degree rating by customer
IVR resolution degree rating by customer
Tone of voice rating by customerTone of voice rating by customer
Knowledge/advice rating by customerKnowledge/advice rating by customer
Figure 26. The Customer Service– IVR and Agent experience

Common Technology Strategy (CONTEST)
CONTEST D1-01 Page 27 of 53 Version 1.0.0
EMail means customer service via eMail. If relevant, the drivers for eMail can also be used for mail and fax. Main satisfaction driver is whether a complete resolution is obtained, and of course how long time it takes. Chat means live chat through the company’s web site, and has the same satisfaction drivers as eMail.
The Customer Service experience
The Customer Service experience
The Media experience
The Media experience
The 1:1 Dialogue experience
The 1:1 Dialogue experience
The Web experience
The Web experience
The Point of Sales experience
The Point of Sales experience
The Product & Service experience
The Product & Service experience
Customer touch point
Call centreCall centre
Sub touch point CE driver CE Metric
The Payment experience
The Payment experience
The On site support experience
The On site support experience
IVRIVR
AgentAgent
eMaileMail
ComplaintsComplaintsThe Device experience
The Device experience
ChatChat
Customer Experience
Customer Experience
Clear and understandable comm.
Clear and understandable comm.
LanguageLanguage
eMail resolutioneMail resolution
Speed of resolutionSpeed of resolution
Clear and understandable comm.
Clear and understandable comm.
Speed of resolutionSpeed of resolution
Clear and understandable comm. rating by customer
Clear and understandable comm. rating by customer
Tone of voice/language rating by customer
Tone of voice/language rating by customer
Email resolution rating by customerEmail resolution rating by customer
Average resolution timeAverage resolution time
Clear and understandable comm. rating by customer
Clear and understandable comm. rating by customer
Average resolution timeAverage resolution time
LanguageLanguage Tone of voice/language rating by customer
Tone of voice/language rating by customer
Chat resolutionChat resolution Chat-session resolution rating by customer
Chat-session resolution rating by customer
Figure 27. The Customer Service– eMail and Chat experience
Complaints are placed under Customer Service, even though it is not necessarily the Customer Service organization that handles the complaints. Most important is to keep number of complaints as low as possible, and to solve complaints quickly.
The Customer Service experience
The Customer Service experience
The Media experience
The Media experience
The 1:1 Dialogue experience
The 1:1 Dialogue experience
The Web experience
The Web experience
The Point of Sales experience
The Point of Sales experience
The Product & Service experience
The Product & Service experience
Customer touch point
Call centreCall centre
Sub touch point CE driver CE Metric
The Payment experience
The Payment experience
The On site support experience
The On site support experience
IVRIVR
AgentAgent
eMaileMail
ComplaintsComplaintsThe Device experience
The Device experience
ChatChat
Customer Experience
Customer Experience
Resolution timeResolution time
Approval of customer's complaint
Approval of customer's complaint
Ease of complainingEase of complaining
Average resolution timeAverage resolution time
Average approval %Average approval %
Ease of complaining rating by customerEase of complaining rating by customer
Complaint quantityComplaint quantity No. of complaints divided by customer base
No. of complaints divided by customer base
Figure 28. The Customer Service– Complaints experience

Common Technology Strategy (CONTEST)
CONTEST D1-01 Page 28 of 53 Version 1.0.0
2.2.8 The On site Support experience
The On site Support experience reflects the customer’s impression of the installation or repair support offered by agents at home or at the office. Sub touch points are Order experience and Agent. The On-site Support experience will typically be more relevant for those OpCos that offer fixed line and Internet services. Order experience means the process from setting up an agreement with an agent until the job is done. Agent covers how the customers are treated; is the agent demonstrating politeness, professionalism etc. and is he able to solve the problem/task.
The Customer Service experience
The Customer Service experience
The Media experience
The Media experience
The 1:1 Dialogue experience
The 1:1 Dialogue experience
The Web experience
The Web experience
The Point of Sales experience
The Point of Sales experience
The Product & Service experience
The Product & Service experience
Customer touch point
Order experience
Order experience
Sub touch point CE driver CE Metric
The Payment experience
The Payment experience
The On site support experience
The On site support experience
AgentAgent
The Device experience
The Device experience
Customer Experience
Customer Experience
First visit resolutionFirst visit resolution
Agent treatmentAgent treatment
Available hours for visitAvailable hours for visit
Speed of resolutionSpeed of resolution
Informative communicationInformative communication
Meet up at the appointed time
Meet up at the appointed time
AppearanceAppearance
First visit resolution rating by customerFirst visit resolution rating by customer
Agent treatment rating by customerAgent treatment rating by customer
Appearance rating by customerAppearance rating by customer
Availability rating by customerAvailability rating by customer
Average resolution time (by inquiry type)
Average resolution time (by inquiry type)
Communication rating by customerCommunication rating by customer
Punctuality rating by customerPunctuality rating by customer
Figure 29. The On site support experience

Common Technology Strategy (CONTEST)
CONTEST D1-01 Page 29 of 53 Version 1.0.0
2.2.9 The Device experience
The Device experience reflects the customer’s impression of how well the device interacts with the company’s services. Device in this setting could mean mobile phones or modems, hence only one sub touch point: Phone/modem. One could consider including Quality of Instructions either under device or relevant service experiences. Modems normally have some form of instructions from the operator/ISP. The key customer satisfaction driver is how well the device interacts with the company’s services.
The Customer Service experience
The Customer Service experience
The Media experience
The Media experience
The 1:1 Dialogue experience
The 1:1 Dialogue experience
The Web experience
The Web experience
The Point of Sales experience
The Point of Sales experience
The Product & Service experience
The Product & Service experience
Customer touch point
Phone / Modem
Phone / Modem
Sub touch point CE driver CE Metric
The Payment experience
The Payment experience
The On site support experience
The On site support experience
The Device experience
The Device experience
Customer Experience
Customer Experience
Easy to get device repairedEasy to get device repaired
Ease of use service on device
Ease of use service on device
Pre-installed settings & software
Pre-installed settings & software
Range of devices availableRange of devices available
Speed of replacementSpeed of replacement
Easy to get device repaired rating by customer
Easy to get device repaired rating by customer
Ease of use services on device rating by customer
Ease of use services on device rating by customer
% of most common settings and software pre-installed
% of most common settings and software pre-installed
Device range rating by customerDevice range rating by customer
Perceived replacement time rating by customer
Perceived replacement time rating by customer
Figure 30. The Device experience

Common Technology Strategy (CONTEST)
CONTEST D1-01 Page 30 of 53 Version 1.0.0
2.3. How to measure
2.3.1 Principles for measuring
There are primarily three types of measurements to be performed:
Customer perception, which must be gathered by asking the customers through customer surveys
Actual performance, which can be gathered by system reports, technical measurements or mystery shopping (not possible for all metrics).
Customer importance, which can be gathered by customer survey, correlation- or conjoint analysis.
The measurements that depend on the customer perception should be executed as close in time to the customer interaction as possible, in order to best capture the customers’ real experience. This means that customers who browse the web sites should get a pop-up web survey, customers who visit stores should be interviewed outside the store and customers who have been in contact with Customer Service by phone should be contacted within e.g. a week. It’s not possible to always follow this principle and a pragmatic approach is needed. One should be aware that satisfaction varies over time and can be quite volatile. Despite a lot of problems the customer can be extremely satisfied at the end. If you want to track your real performance, you will need to track satisfaction through various stages of the experience journey. Regarding frequency of the customer perception and actual performance measurements, some general principles should be followed. The measurements should be:
• frequent enough to not lose momentum in the management’s CE focus • frequent enough to motivate all employees for improvement efforts • rare enough to see changes in the scores, enabling the organization to perform actions to
influence the score • rare enough to make the cost manageable
Based on these criteria, the project recommends quarterly measurements.
2.3.2 Measurement methods
Which methods to be used in measuring the customer experience should be evaluated carefully: benefits vs. cost/ease of implementation. The number of different measurement methods should also be kept to a minimum to reduce consolidation efforts. Measurement methods need to be evaluated and chosen by the various implementation projects due to local conditions. The excel spreadsheet proposes a measurement method for each metric, and the table below gives an overview of the distribution. Be aware that the methods are not verified with the relevant departments in order to check if it is possible to perform the measurement, this has to be done in the implementation projects.
Measurement method Number in full set Number in minimum setCustomer survey (phone) 69 22 Customer survey (phone)/ Mystery shopping 3 2 Customer survey (face-to-face)/ Mystery shopping 12 4 Web pop-up survey 10 4 Collect info 1 0 System report 16 7 Tech measure 16 8 System report + tech measure 3 2 Brand Tracker 1 1 External report 2 0 SUM 133 50
Figure 31. Overview of all measurement methods

Common Technology Strategy (CONTEST)
CONTEST D1-01 Page 31 of 53 Version 1.0.0
2.3.3 Metric scoring
Customer surveys Each metric must be scored in a way that enables aggregation of the scores. A scale must be defined for each metric, and the number of answer options should be both large enough to enable relevant analyses (e.g. regression analyses) and small enough in such a way that the customer is able to separate between the options. The scale should be a ”number scale” rather than a ”verbal scale” because it will be easier to standardize the answering options across all OpCos. For questions to be answered by the customers, the project recommends a scale of 1 to 6, e.g. where 1 = “extremely poor” and 6 = “extremely good” This scale forces the customer to take a standpoint because there is no ”neither … nor” category. It could be beneficial to vary the score options in order to not bore the customer during the survey, but such details will be evaluated in the pilot implementation. System reports and Tech measures Metrics that will be measured technically or by system reports are straight forward, as they require time or percentage scales. Other measurements Some metrics require own scales like the Mean Opinion Score and the “collect info” type of metrics. If scoring scales do not exist, they have to be defined.
2.3.4 Translation of metric score into a Customer Experience score
In order to make the scores of each metric easier to understand, compare and communicate (e.g. if different scales are used), the scores should be ”normalized” into a given Customer Experience scoring range. Customers face both negative and positive experiences. Intuitively, a negative experience should give a negative score and a positive experience should give a positive score. Consequently, a neutral score should not drive the score in any direction. Using a scale from ”–” to ”+” will immediately give an indication of whether the customer has an overall positive or negative experience with the company. In addition, a scale ranging from ”–” to ”+” will possibly motivate employees more because no one wants to be responsible for a negative score. The normalized CE score could therefore range from – 100 to + 100. Customer surveys The translation of the scales used for the customer surveys is straight forward; we use a linear translation as shown in the table:
Recommended scale – 1-6 Brand Tracker scale – 1-7
1 -100 1 -100
2 -60 2 -66,67
3 -20 3 -33,33
4 20 4 0
5 60 5 33,33
6 100 6 66,67
7 100
Figure 32. Translation of survey scores to CE scores

Common Technology Strategy (CONTEST)
CONTEST D1-01 Page 32 of 53 Version 1.0.0
System reports, Tech measures and other measurements For the metrics generated by system reports or technical measures, the translation needs to be defined metric by metric. There will be significant differences in how the score of each metric will be perceived by the customer. Hence, each metric must be treated individually in order to translate the scores into a CE score. While a score of 95% for deliveries of services on committed date could be considered as a great experience, a score of 95% for successful voice service completion could be evaluated as a bad experience. For both percentage and time scales, one have to assess what performance the customer will consider as:
Extremely poor Very poor Fairly poor/slightly negative Fairly good/acceptable Very good Extremely good
…and translate this into a -100 to + 100 range as shown in the figure below. In this example a score of ca 40% is considered as extremely bad and 80% as extremely good. The concrete distribution between -100 and + 100 needs to be defined for each metric. The scoring thresholds are locally dependant and needs to be defined by the local OpCo with input from Group Business Development & Research during the implementation project.
Extremely bad
0 100%
Extremely good
- 100 + 100
Figure 33. Translation of percentage scale to CE scores
For some metrics both actual performance and customer perception can be measured. By plotting the results, good insights of customer expectations can be derived. For some metrics S-curves can be found which can be used when defining ranges and translation of scales. However it is quite extensive research to define this for every metric. One should start with looking for S-curves for only those parameters driving the biggest costs or which are of highest importance to the customer.

Common Technology Strategy (CONTEST)
CONTEST D1-01 Page 33 of 53 Version 1.0.0
20
30
40
50
60
70
80
90
85 86 87 88 89 90 91 92 93 94 95 96 97 98 99 100
Satisfaction cliff
Call setupperception
%
Call setup success rate % KPI
Figure 34. Example of S-curve
2.3.5 Aggregation into the Customer Experience Index
The metrics scores will be aggregated into a Customer Experience index which reflects the overall customer experience with the company. This will be the weighted sum of all the touch point experiences. In the calculations, separate touch point scores and sub touch point scores will also be derived in order to help understanding the underlying elements of the CE index.
133
28
9
CE indexCE index
Touch point 1Touch point 1
Sub-
touch point 1
Sub-
touch point 1
CE driver 1CE driver 1
CE driver nCE driver n
CE metricCE metric
Sub-Touch point n
Sub-Touch point n
Touch point nTouch point n
Figure 35. Framework structure
In order to aggregate the scores of each metric, each CE driver (metric) needs to be weighted relative to the other CE drivers. The weighting of the different CE drivers should ideally incorporate the relative importance from the customer’s perspective. Various approaches to define the importance of the different drivers are:
Asking the customers Analysis of correlation with overall satisfaction or touch point satisfaction Conjoint analysis
In addition, relative importance between the different touch points and sub touch points must also be derived. When defining the weighting, one should also take into account the frequency of customer interactions in the touch points and sub touch points.

Common Technology Strategy (CONTEST)
CONTEST D1-01 Page 34 of 53 Version 1.0.0
To define (and update) the importance of all the various factors in the measurement framework requires a more comprehensive and complex survey than the regular quarterly measurements. The project recommends that this is done every 12th to 24th months. General weighting principles:
• Scores should be weighted according to customer importance • A (sub) touch point with many customer interactions is more important than a (sub) touch
point with few interactions • All scores count - regardless of importance
In order to ease the implementation of the framework, a simplified approach for weighting between the various factors should be used. Each factor should be evaluated and given an importance of high, medium or low, and then translated into a number scale before calculating the index. Weighting of experience drivers within each sub touch point
• Evaluate the relative importance of each CE driver for the customer • Score each CE driver with importance High, Medium or Low according to insight from
Customer Surveys, Correlation analysis or Conjoint analysis
Sub touch pointSub touch point
CE driver ACE driver A
CE driver BCE driver B
Figure 36. Weighting of drivers within a sub touch point
Keeping the weighting relative within a sub-touch point makes it manageable both for customer surveys and when deciphering correlation data. Weighting within and between touch points
Evaluate the relative importance of each (sub) touch point for the customer Score each (sub) touch point preliminary with importance High, Medium or Low (N/A if the
touch point or sub touch point is not relevant for the OpCo) according to insight from Customer Surveys, Correlation analysis or Conjoint analysis
Evaluate how often the customer on average is exposed for each (sub) touch point, and if necessary adjust the score
o Ex: If one sub touch point is defined as Medium important to a customer, but the interactions (through the sub touch point) occur weekly – the importance of the sub touch point could be increased to High
Touch pointTouch point
Sub touch point ASub touch point A
Sub touch point BSub touch point B
Figure 37. Weighting within and between touch points
Aggregation rules

Common Technology Strategy (CONTEST)
CONTEST D1-01 Page 35 of 53 Version 1.0.0
The weight (high/medium/low) of each driver, sub touch point and touch point needs to be translated into a scale. The CE index is then calculated based on the relative importance between the factors like shown in the figure below. Suggested weight “translation“:
• High = 4 • Medium = 2 • Low = 1 • N/A = 0
The figure below shows an example of aggregation of driver scores up to the Customer Experience index. The following calculations are being done:
1. CE scores for sub touch points A, B, C and D are calculated based on the corresponding CE drivers
2. CE scores for touch points TP-I and TP-II are calculated based on the CE scores for sub touch points A/B (TP-I) and C/D (TP-II) respectively
3. The Customer Experience index is calculated based on the CE scores for touch point TP-I and TP-II
Customer Experience Index
Touch point Weight Score
Sub touch point Weight Score Driver Weight Score
TP-I High 42,2A High 56,1
E High 90F Medium 80G Medium -20H Low 25
B Low -13,3I High -60
471,9 J High 15K N/AL Low 60
TP-II Medium 57,1C Medium 88,0
M High 85N Low 100
D High 41,7O High 50P Medium 25
Figure 38. Aggregation model
The most commonly used range of satisfaction scores etc is a range of 0 – 100. As discussed earlier in the document, we have extended the CE score to reach from -100 to + 100. One of the most important objectives of the framework is to motivate the whole organization to improve the customer experience. Hence the range of the CE index could be expanded in such a way that the changes made not only show up as a decimal change. This can be solved by increase the scale of the aggregated index to go from -1000 to +1000, so that even minor improvements will improve the score. This is done in the example above. The framework will develop over time as the local OpCo will want to include more metrics. As neutral score and N/A are 0, new entries can be included along the way. If new entries generate a discontinuous graph, one could consider using the first value of the entry in all previous calculations, or generate a system for phasing in the new measurements. It is recommended to store all raw performance data, translated scores, translation rules and aggregated scores over time in order to enable backwards calculation and correlation analysis.
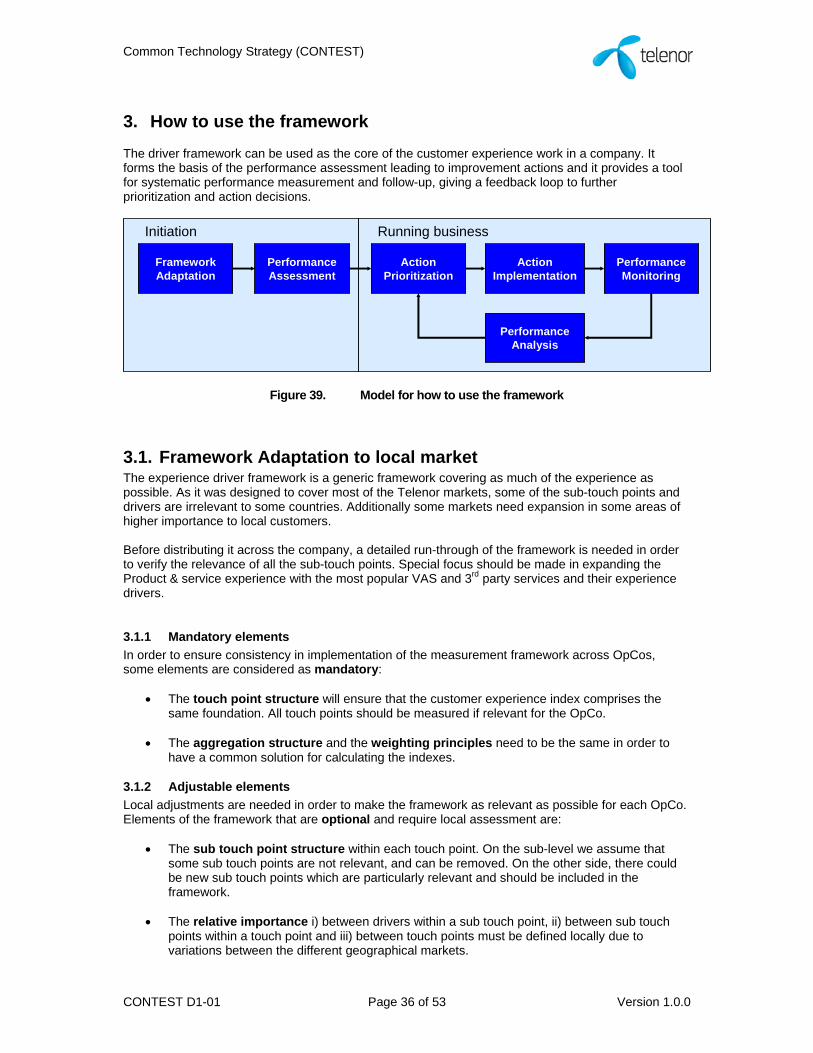
Common Technology Strategy (CONTEST)
CONTEST D1-01 Page 36 of 53 Version 1.0.0
3. How to use the framework
The driver framework can be used as the core of the customer experience work in a company. It forms the basis of the performance assessment leading to improvement actions and it provides a tool for systematic performance measurement and follow-up, giving a feedback loop to further prioritization and action decisions.
FrameworkAdaptation
PerformanceAssessment
Action Prioritization
Action Implementation
Performance Monitoring
Performance Analysis
Initiation Running business
Figure 39. Model for how to use the framework
3.1. Framework Adaptation to local market The experience driver framework is a generic framework covering as much of the experience as possible. As it was designed to cover most of the Telenor markets, some of the sub-touch points and drivers are irrelevant to some countries. Additionally some markets need expansion in some areas of higher importance to local customers. Before distributing it across the company, a detailed run-through of the framework is needed in order to verify the relevance of all the sub-touch points. Special focus should be made in expanding the Product & service experience with the most popular VAS and 3rd party services and their experience drivers.
3.1.1 Mandatory elements
In order to ensure consistency in implementation of the measurement framework across OpCos, some elements are considered as mandatory:
The touch point structure will ensure that the customer experience index comprises the same foundation. All touch points should be measured if relevant for the OpCo.
The aggregation structure and the weighting principles need to be the same in order to
have a common solution for calculating the indexes.
3.1.2 Adjustable elements
Local adjustments are needed in order to make the framework as relevant as possible for each OpCo. Elements of the framework that are optional and require local assessment are:
The sub touch point structure within each touch point. On the sub-level we assume that some sub touch points are not relevant, and can be removed. On the other side, there could be new sub touch points which are particularly relevant and should be included in the framework.
The relative importance i) between drivers within a sub touch point, ii) between sub touch
points within a touch point and iii) between touch points must be defined locally due to variations between the different geographical markets.

Common Technology Strategy (CONTEST)
CONTEST D1-01 Page 37 of 53 Version 1.0.0
Target values must be defined locally because customer expectations and perception of
what is “good enough” will vary across the markets.
The scoring scales should ideally be similar across the OpCos. Because we want existing surveys to be re-used, the existing scoring scales may vary. This will be solved by translation of the existing scales into normalized CE scores. The translation of each metric into the CE score must be defined by each OpCo.
3.2. Customer Experience Performance Assessment The framework is a good tool for making a thorough assessment of the customer experience we are currently giving, of what would be an excellent experience and identifying our largest gaps.
3.2.1 Driver performance analysis
Collect systematically how we currently deliver on each of the experience drivers. Identify the performance (preferably measure), which processes, systems, features, resources we use to deliver the experience. Also collect information on what is preventing us from improving that experience.
3.2.2 Driver importance analysis
Investigate the customer importance of the various experience drivers. Combine existing customer insight we have on the expectations to this experience with additional surveys or correlation analysis. It is vital that we prioritize according to the customers preferences and not internal beliefs built throughout many years of operation. Customer importance results may differ significantly with “existing truths” in the company.
3.2.3 Defining Reference Experience
For each of the drivers, identify what would be the reference experience for the customer: What would be the best possible - even world class experience? Which solution/actions/resources would be needed for implementing this? What would be the cost? Would it really impress the customer (high “WOW-factor”)?
3.2.4 Gap analysis
Analyze our current performance vs. the excellent experience. Identify the major performance gaps. Analyze the effort vs. impact (cost vs. benefit) of closing the various gaps: Effort What will it take to improve the performance?
o complexity o manpower o capex o opex o time
The attached spreadsheet has used the following simplification when estimating the costs/efforts:
Figure 40. Simple effort scale
EffortLow Medium High
Mindset/culture change Requires training,
manpower, project cost No CAPEX required
Requires process changes and possible IS/IT changes
Pronounced increase of OPEX
CAPEX less than USD1M
Requires process changes and IS/IT changes
Significant increase of OPEX CAPEX (over USD1M)

Common Technology Strategy (CONTEST)
CONTEST D1-01 Page 38 of 53 Version 1.0.0
Impact What effect will the improvement have on the customer base?
o How many users are in contact with the touch point / sub-touch point o What is the frequency of the experience? o What is the importance of the touch point to the customers o How large is the GAP? o How big is the “WOW!-factor”?
Build a visualization incorporating insight of effort vs. impact.
Effort of improvement **
Customer Impact*
HighMediumLow
High
Medium
Low
1
2
63
4
5Improvement areas
1. Product & Services
2. Retail
3. 1:1 dialogue
4. Complaint handling
5. Customer Service
6. Web
7. On site support
8. Payment
9. Media
GAP
High
Medium
Low
7 8
9
Figure 41. Example of visualization of Effort vs. Impact analysis (Illustrative)

Common Technology Strategy (CONTEST)
CONTEST D1-01 Page 39 of 53 Version 1.0.0
3.3. Action prioritization When prioritizing, customer importance is naturally imperative. Additionally, one must secure that the prioritization is aligned with brand and segment strategies. Also there will be capex and opex limitations capping the activity level.
Segment strategies
Segment strategies
Resource Limitations
Resource Limitations
Brand Strategy
Brand Strategy
GAP analysis
GAP analysis
PrioritizationPrioritization
Quick winsQuick wins Prioritized implementation plan
Prioritized implementation plan
Figure 42. Factors affecting the prioritization of improvement actions
In order to secure realistic plans and commitment to the plans, the prioritization should be made by a cross-functional team consisting of all parties involved in implementation. This will enable common understanding of the transfer of resources to areas most important to the customers. The gap analysis will give a long list of improvement areas for prioritization. Prioritizing between single items on the list is challenging. It is therefore recommended to agree on overall prioritization principles before going into detailed prioritization Example of prioritization principles:
1) Implement all low-cost actions immediately 2) Close biggest gaps of high importance to Customer 3) Close biggest gaps of the defined Telenor Experience 4) Identify drivers where you effectively can deliver delight! 5) When capex limitations: Focus on consumer initiatives first year – then business 6) If segment conflict – improve active consumers before basic segment
In the early phase of formalizing the customer experience work, it is also important to produce success stories to use in the process of changing the culture of the company. A list of quick win implementation – easy to communicate - success stories should be prioritized. The output of the prioritization process should be a detailed implementation short term plan and an updated mid-term Customer Experience roadmap. It should describe the resources and actions needed to deliver the Telenor Experience across all touch points.
3.4. Action Implementation All actions are implemented by the line organization. The implementation project should consist of a cross functional team co-coordinating the efforts of each line unit in implementing the improvement actions. The team should report progress to the management team on a regular basis.

Common Technology Strategy (CONTEST)
CONTEST D1-01 Page 40 of 53 Version 1.0.0
3.5. Customer Experience Performance Monitoring Periodic tracking of experience driver performance will visualize the positive and negative impact of all customer activities of the company. Additionally, it will
Identify areas of under-performance Identify areas of over-performance Provide meaningful and actionable KPIs Enable benchmarking
Often, experience projects are hard to relate to specific business cases with ROI, so documentation of progress in other ways become critical to continued allocation of resources. Measuring progress motivates people, so ensure starting measuring early. Depending on complexity the lead time for implementing the measurements is significant, so in order to track the results of the initial actions, systematic measurements should be initiated early. A lot of performance indicators are already being monitored regularly. Start by collecting information from existing performance measurements, use them to build the measurement collection structure, and then plan implementation of the remaining performance indicators of the framework. Ensure funding and operational model providing periodic measurements.
3.6. Performance Analysis The scores and indexes should be presented in a management CE dashboard1 or report together with other relevant information affecting the customer experience from the Brand Tracker, Net Promoter Score2, Employee Net Promoter Score and Dealer Net Promoter Score etc. The measurements will reveal areas of over- and underperformance. Analyze root causes for underperformance and investigate the resources spent in areas of over performance. Re-allocate resources to areas of underperformance. Note that the framework only gives top level performance indicators; it is not intended for identifying root causes. When troubleshooting problem areas, more detailed analysis is needed. There are several sources of additional information:
• The full set of performance indicators can be used • Customer Journey Mapping • Customer Call centre feedback • System performance reports • Process performance reports
When evaluating the improvement areas there will generally be more actions than resources available and a re-prioritization is needed (see chapter 3.3). Make sure that the performance, actions and results are monitored and discussed in management meetings. Involve management actively in revise spending vs. performance, stop/start activities, revision of strategy and re-allocation of resources. Below is an example of a high level visualization to use in management meetings.
1 For more information about CE dashboard see Annex 3 2 For more information on Net Promoter Score see Annex 5 and www.netpromoter.com.

Common Technology Strategy (CONTEST)
CONTEST D1-01 Page 41 of 53 Version 1.0.0
Overperformance
Possible overperformance
Possible underperformance
Severe underperformance
Severe underperformance
Overperformance
Possible overperformance
Possible underperformance
Severe underperformance
Severe underperformance
Performance index
Customer Impact*
HighMediumLow
High
Medium
Low
Touchpoint
1. Product & Services
2. Retail
3. 1:1 dialogue
4. Complaint handling
5. Customer Service
6. Web
7. On site support
8. Payment
9. Media
HighcostLow
cost
1
2
6
3
45
7
8
9
Figure 43. Visualization of Touch point Performance vs. Customer Impact
Demonstrating progress (or lack of it) will motivate the organization for further improvements. It is important to link performance changes to implemented actions. The direct link between actions and results will motivate the organization and fuel the project with more momentum and possibly funds.
3.7. KPI setting By breaking down the experience into tangible touch points and experience drivers, many employees will see their role in delivering the total experience. By systematic measuring and communicating progress (or lack of it) the organization will be motivated for further improvements. Systematic measurements also enable assigning detailed KPIs to units or individuals responsible for specific parts of the experience.
When the measurement framework is up and running the main challenge is to set appropriate target values for the different metrics. It is important to identify what the customers consider as good enough, in order to invest up to the right level.
20
30
40
50
60
70
80
90
85 86 87 88 89 90 91 92 93 94 95 96 97 98 99 100
Satisfaction cliff
Call setupperception
%
Call setup success rate % KPI Figure 44. Example of S-curve

Common Technology Strategy (CONTEST)
CONTEST D1-01 Page 42 of 53 Version 1.0.0
For some internal performance indicators (from technical measures or system reports), measuring customer perception vs. actual performance enable detection of satisfaction cliffs through so-called S-curves. The satisfaction cliff starts where a small increase in actual performance makes a significant impact on the customer perception. The cliff ends where a small increase in actual performance only makes a small impact on the customer perception. This is the point to stop further investments, and where the KPI target value should be set. For performance indicators where there is not possible to measure both actual performance and customer perception (indicators measured only by customer surveys), S-curves are not available. Then other criteria must be used for defining the range and target values of the metric:
What is a negative experience, neutral and positive experience? What is considered over performance?
The limits should be based on customer insight, actual experiences, best practices and benchmarking within and outside the Telenor Group. In order to secure focus, the metrics can be used as KPIs either standalone for the teams / individuals in charge of the specific experience, or for multiple teams all playing a major part of a process delivering that experience. How to set the KPIs:
• Define reference levels for each touch point reflecting e.g. the target “Digi Experience” • Select and assign the most important KPIs to responsible functional units • Secure Cross functional cooperation by sharing same KPIs across units delivering on same
process • Identify individual teams responsible for certain experience drivers and assign KPIs to them • Employees not having direct impact on front lines should receive internal customer
“Experience KPIs” in order to understand the importance of customer experience • Include at least 1 experience KPI in all bonus schemes
A dashboard or management report with the highlights of the work should be developed to enable top management involvement. A holistic view of touch point performance will enable reallocating funds across divisions in order to improve where it matters the most to the customers.
3.8. Maintenance of the framework The framework should be owned by the head of customer experience. There should be a defined process for updating the framework. In order to support comparable results, changes should be carefully introduced. The proposed maintenance plan is: Update of performance measurements Quarterly Update of customer importance of drivers 12-24 months Update of target values & KPIs Annual Driver structure of CE Index Minor adjustments quarterly, revision bi-yearly Action planning and prioritization Minor adjustments quarterly, major revision yearly

Common Technology Strategy (CONTEST)
CONTEST D1-01 Page 43 of 53 Version 1.0.0
4. How to implement the framework
The implementation of the framework is not mandatory at the time of writing (June 2009). All Telenor OpCos are free to use the framework in the way they want. However, to get value from the implementation through benchmarking, best practice sharing etc. one should strive to make the implementation as similar to other countries as possible (see chapter 3.1.1 for mandatory elements).
4.1. Draft implementation plan A detailed implementation plan will be developed in co-operation with the pilot OpCo. The following is a draft only, and meant as a basis for discussion. The pilot implementation project could consist of the following steps:
Plan project
Adapt framework
to local market
Design process
Execute measure-
ments
Implement process
Verify framework
Assess performance
Figure 45. High level implementation plan
PHASE ACTION Plan project Detailed project planning
Adapt framework to local market
Adjust framework to local market conditions (touch points, drivers) Define relevant metrics to be measured and translate into CE score Define frequency and measurement methods Build aggregation model
Assess performance
Driver performance analysis Define importance/weighting of drivers and touch points Define experience excellence Gap analysis
Design process Define routines for how to use the framework in OpCo
Execute measurements
What is measured today and can be re-used? Identify and specify needs for new measurements Plan and execute customer surveys Work with relevant departments to specify system reports and
technical measurements
Implement process
Incorporate results of customer surveys and internal measurements in framework
Implement processes for taking action and follow-up (collecting data, analysis, prioritization and execution)
Verify framework
Test framework in different settings (CE team, management meetings etc)
Adjust if necessary
Figure 46. Draft implementation plan

Common Technology Strategy (CONTEST)
CONTEST D1-01 Page 44 of 53 Version 1.0.0
4.2. Project resources The implementation projects should be headed by a local project manager with a local project team supported by Group Business Development & Research (GBD&R). In order to ensure that the pilot implementation meets the required objectives and ensure continuity from developing the framework to implementation, GBD&R will play a more important role in the pilot project than for the other OpCos. The degree of involvement has to be discussed in further details in co-operation with the selected pilot OpCo. Typical contributions in the pilot implementation project will be:
OpCo contribution Group contribution
Project Manager with small team Expert resources on demand Funding of surveys Some IS development
Customer Experience Expertise Co-project management Workshop Facilitation Process design Dashboard development
Figure 47. Proposed OpCo and Group contribution

Common Technology Strategy (CONTEST)
CONTEST D1-01 Page 45 of 53 Version 1.0.0
Annex 1. Minimum recommended set of performance indicators
Customer touch point Sub touch point CE driver CE metric / performance indicator
The Media experience Advertising Clear and understandable comm.
Clear and understandable comm. rating by customer
The Media experience Advertising Relevance Relevance rating by customer
The 1:1 dialogue experience Direct Marketing Usefulness for customer Usefulness rating by customer
The 1:1 dialogue experience Telemarketing Agent treatment Agent treatment rating by customer
The 1:1 dialogue experience Telemarketing Appropriate timing and frequency Timing & frequency rating by customer
The 1:1 dialogue experience General messages Usefulness for customer Usefulness rating by customer
The Web experience Site performance Web site speed Time to download "reference" page(s)
The Web experience Site relevance Information completeness Comprehensiveness and thoroughness of info rating by customer
The Web experience Usability Ease of navigation Ease of navigation rating by customer
The Web experience Usability Degree of task solved "Task solved" rating by customer
The Web experience Usability Ease of buying Ease of buying rating by customer The Point of Sales experience Agent Quality of advice Knowledge/advice rating by customer The Point of Sales experience Agent Agent treatment Agent treatment rating by customer The Point of Sales experience
In store experience Store Look & Feel Store Look & Feel rating by customer
The Point of Sales experience
In store experience Ease of completing task Ease of completing task rating by customer
The Product & Service experience Delivery Quick SIM activation Time from purchase to first use The Product & Service experience Delivery Quick broadband activation Time from purchase to first use The Product & Service experience Voice Perceived voice quality Perceived voice quality rating by customer The Product & Service experience Voice Accessibility & Retainability Prob. of a successful service completion The Product & Service experience Voice Perceived coverage Perceived coverage rating by customer The Product & Service experience Messaging SMS successful delivery rate No of SMS delivered/total SMS sent The Product & Service experience Messaging
MMS successful PHONE delivery rate
No of MMS delivered to phone/total MMS sent
The Product & Service experience
Small screen internet/WAP Speed Time to download a reference wap-page
The Product & Service experience
Small screen internet/WAP Accessibility & Retainability Prob. of a successful service completion
The Product & Service experience
Small screen internet/WAP Content and Features
Rating of right content/features on operator portal by customer
The Product & Service experience Broadband Speed Time to download a reference web-page The Product & Service experience Broadband Accessibility & Retainability Prob. of a successful service completion The Product & Service experience Broadband Perceived coverage Perceived coverage rating by customer The Product & Service experience
VAS/3. party services Service Quality Service satisfaction rating by customer
The Product & Service experience Roaming Price transparency Price transparency rating by customer
The Payment experience Top-up Availability Top-up Availability of top-up rating by customer
The Payment experience Top-up Ease of use scratch card Ease of use of scratch card rating by customer
The Payment experience Top-up Ease of use eLoad Ease of use of eLoad rating by customer
The Payment experience Invoice Understandability Understandability rating by customer

Common Technology Strategy (CONTEST)
CONTEST D1-01 Page 46 of 53 Version 1.0.0
The Customer Service experience Call centre Response time call centre Average waiting time The Customer Service experience Call centre Speed of resolution Average resolution time The Customer Service experience Call centre First call resolution First call resolution rating by customer The Customer Service experience IVR Ease of navigation Ease of navigation rating by customer The Customer Service experience IVR IVR resolution degree IVR resolution degree rating by customer The Customer Service experience Agent Quality of advice/answer Knowledge/advice rating by customer The Customer Service experience Agent Agent treatment Agent treatment rating by customer The Customer Service experience eMail eMail resolution Email resolution rating by customer The Customer Service experience eMail Speed of resolution Average resolution time The Customer Service experience Complaints Complaint quantity No. of complaints divided by customer base The Customer Service experience Complaints Resolution time Average resolution time The On site support experience
Order experience Speed of resolution Average resolution time (by inquiry type)
The On site support experience Agent First visit resolution First visit resolution rating by customer The On site support experience Agent Agent treatment Agent treatment rating by customer
The Device Experience Phone / modem Ease of use service on device
Ease of use services on device rating by customer
The Device Experience Phone / modem Pre-installed settings & software
% of most common settings and software pre-installed

Common Technology Strategy (CONTEST)
CONTEST D1-01 Page 47 of 53 Version 1.0.0
Annex 2. Measurement framework details
The full breakdown of the Customer Experience driver structure is included in the Excel sheet below.
CE Measurement Framework_v1.0
Column names and descriptions from the excel deliverable: Column Column name Description
A Customer touch point Any occasion where the customer gets an conscious or sub-conscious experience of interacting with the company
B Relative Imp between/within TP
Proposed relative importance i) between touch points and ii) of sub touch points within touch point (High - Medium - Low)
C Sub touch point Break down of touch point into sub touch points (or categories/processes)
D CE driver category Categorization of CE drivers
E CE driver Driver for a good or bad customer experience. Most important drivers have bold text.
F Relative Imp. within sub-TPProposed relative importance of CE driver within sub touch point (High - Medium - Low)
G Cost of improvement of driver
High level assessment of cost of improving the experience driver (High - Medium - Low)
H KPI = 1 indicates the project's proposed minimum set of metrics (=KPIs)
I Sum Number of KPIs pr touch point and sub touch point
J CE metric / performance indicator Metric for measurement of CE driver
K How to measure? Proposed measurement method for this metric
L Metric scale Scale for scoring the metric M Freq. Proposed frequency of measurement N CE metric description High level description of metric
O Project comments Comments from the project
P Sonofon comments Comments from the Sonofon
Q Digi comments Comments from the Digi

Common Technology Strategy (CONTEST)
CONTEST D1-01 Page 48 of 53 Version 1.0.0
Annex 3. Requirements for CE dashboard
A Customer Experience dashboard with the highlights of the work should be developed to enable top management involvement. This will be the responsibility of GBD&R. Purpose of a Customer Experience dashboard:
• Give local management a single view of • The development of the Total Experience seen from the Customers view • The factors driving the overall OpCo CE scores
• Identify areas of improvement • Possible underperformance • Possible over performance
• Identify and assign responsibility for actions/further analysis • Assist in prioritization of actions
There is currently (June 2009) an ongoing project in Telenor Group developing a corporate dashboard. The Customer Experience dashboard should be integrated in this solution, and below is an example of how this could be done:
Telenor CE Index
POS
Media
1:1 Dialogue
Web
Products
PaymentCustomer
Care
On Site Support
Device
500
600
Top 3 experiences
Web ease of use 90
Care Agent knowledge 86
Employee Satisfaction
Bottom 3 experiences
Service activation -59
Price perception -70
Handset repair -90
Top 3 achievements
Agent attitude +15
Retail atmosphere +10
Net Promoter Score: 10%
Employee Satisfaction: 50%
Dealer Satisfaction: 10%
Experience
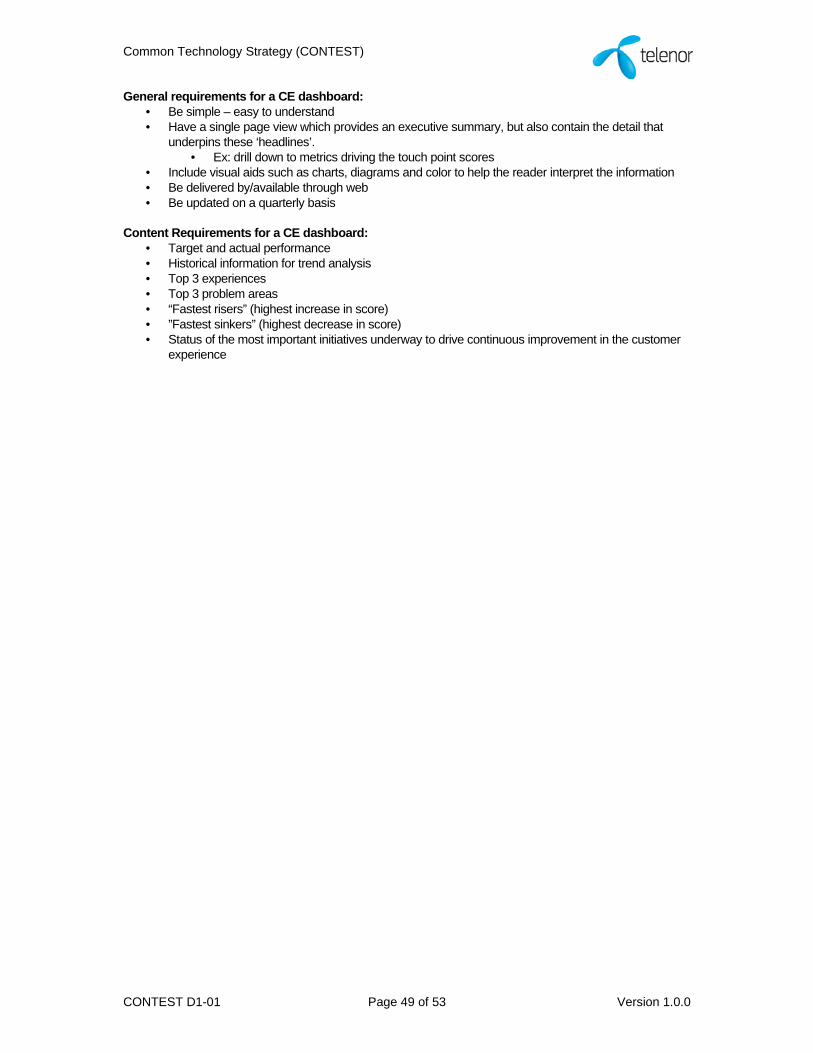
Common Technology Strategy (CONTEST)
CONTEST D1-01 Page 49 of 53 Version 1.0.0
General requirements for a CE dashboard: • Be simple – easy to understand • Have a single page view which provides an executive summary, but also contain the detail that
underpins these ‘headlines’. • Ex: drill down to metrics driving the touch point scores
• Include visual aids such as charts, diagrams and color to help the reader interpret the information • Be delivered by/available through web • Be updated on a quarterly basis
Content Requirements for a CE dashboard:
• Target and actual performance • Historical information for trend analysis • Top 3 experiences • Top 3 problem areas • “Fastest risers” (highest increase in score) • ”Fastest sinkers” (highest decrease in score) • Status of the most important initiatives underway to drive continuous improvement in the customer
experience

Common Technology Strategy (CONTEST)
CONTEST D1-01 Page 50 of 53 Version 1.0.0
Annex 4. Business touch points
There are other touch points and CE drivers for the business segment, and the business segment has for this reason been defined as out of scope for 1st half 2009.
Customer experience
Customer experience
The Solutions experience
The Solutions experience
The Media experience
The Media experience
The Sales force experience
The Sales force experience
The Web experience
The Web experience
The Procurement experience
The Procurement experience
The Delivery experience
The Delivery experience
Customer Touch point
The Support experience
The Support experience
The Business centre experience
The Business centre experience
The Invoice experience
The Invoice experience
• A completely separate “tree structure” (see figure) is needed to handle the business segment:– In order to capture the experience of Decision makers
and Operations and Maintenance personnel
– Due to complex solution selling
– Due to different channels and touch points
• Recommendation approved in SteCom meeting 06.05.2009: – Business users are treated as consumers (e.g. through an
own segment)
– Business (Decision makers/Operations & Maintenance personnel) is out of scope during 1st half 2009
ILLUSTRATIVEILLUSTRATIVE

Common Technology Strategy (CONTEST)
CONTEST D1-01 Page 51 of 53 Version 1.0.0
Annex 5. Net Promoter Score (NPS)
A simplified approach to measure the customer experience is to use a well known CE index. The project recommends implementing Net Promoter Score (NPS) as a starting point for measuring CE. The purpose of NPS implementation will be to benchmark OpCos:
• Between each other • Against competitors/industry leaders • Against other industries
The NPS question will be integrated as part of the Brand Tracker from Q3 2009. On the next pages, some PowerPoint slides presenting different external customer experience indexes and arguments for choosing NPS are pasted:
56 00 Month 0000
Several indexes for measuring Customer Experience or Customer Satisfaction exist…
• There are many Customer Experience or Customer Satisfaction indexes available, nearly every consultancy firm has its own model
• Common for these models is that none of them are perfect!
• Among the most recognized and most used models are:– American Customer Satisfaction Index (ACSI)
– Net Promoter Score (NPS)
– JDPower Customer Satisfaction Index (CSI)
– Forrester CxPi
• A high level assessment of these four models is presented on the next slide

Common Technology Strategy (CONTEST)
CONTEST D1-01 Page 52 of 53 Version 1.0.0
57 00 Month 0000
Overview of four recognized indexes that are regularly published
There is a difference between customers saying they will advocate you and them actually advocating you
There is no distinction made between customers who score 0 and those that score 6 (see explanation)
NPS is easy to implement, requires only one question
Forrester research (2008) states that there is a high degree of correlation between good customer experience and consumers' likelihood to recommend companies across 12 industries
Since NPS scores are calculated real-time, less backward-looking than other indexes
Helps companies gauge customer loyalty
Score is calculated by taking the percentage of customers who are promoters (those who are highly likely to recommend your company/products), and subtract the percentage who are detractors (those who are less likely to recommend your company/products)
Net Promoter Score (NPS)
Quite new index (2007), limited historic information available
Scores are made public on their website, so easy access to information
Less backward-looking than some other approaches
Measures the Customer Experience based on three drivers; usefulness, ease to work with and enjoyability
Consumers are only asked to rate organizations they have interacted witrhthe last 90 days (banks etc), 30 days (retailers) or firms that are primary providers (cell phone service providers)
Forrester CxPi
Information can be up to two years old based on lag between surveying customers about publishing reports
Most prominent and well-known customer satisfaction measurement system
Large number of companies and industries assessed
Measures customer satisfaction across a broad range of industries and companies
Provides customer satisfaction scores only to companies that agree to participate in their study
JD Power and Associates
Information is backward-looking, albeit more current than other companies due to the fact results are published quarterly
Scores are made public on their website, so easy access to information
Large number of companies and industries assessed
Survey 80,000 U.S. residents annually to gauge satisfaction about their goods and services
Publish results quarterly
Gauge 200 companies in 43 industries
American Customer Satisfaction Index (ACSI)
WeaknessesStrengthsOverviewIndex
58 00 Month 0000
• Simple & intuitive to explain and understand
- It creates a common language across the organisation that everybody (CEO or cashier) can understand and talk about
- Easier to include one metric in the balance score card
- Keeps the organisation focused, one metric one number to track
• Relatively cheap to implement• Provides a good benchmark to other
industries• Effective as diagnostic tool for a suite of
other consultancy/analytical services
Advantages
• There is a difference between customers saying they will advocate you and them actually advocating you
• There is no distinction made between customers who score 0 (termed brand “terrorists”) and those that score 6 – they are all detractors in NPS. But really you need to pay attention to those that score 0
• There can be wild volatility in the scores from month to month driven by market factors
Disadvantages
The project recommends using Net Promoter Score (NPS) as the overall CE metric due to ease of implementation and the benchmark opportunities
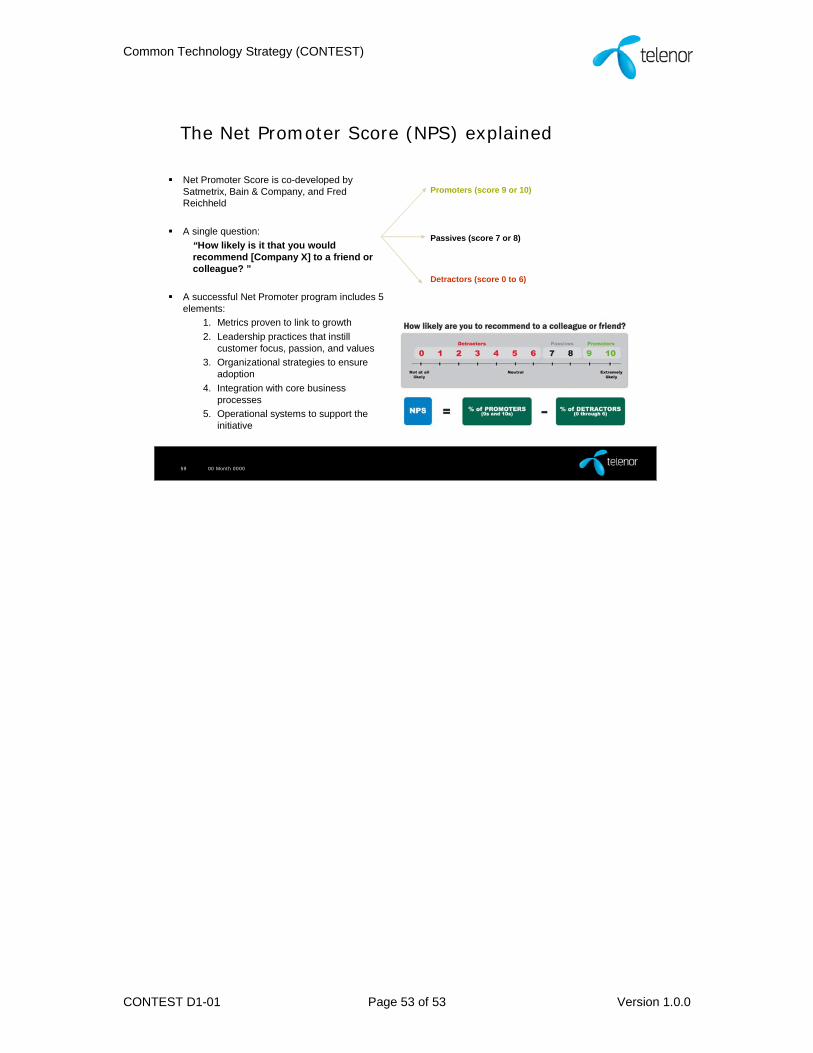
Common Technology Strategy (CONTEST)
CONTEST D1-01 Page 53 of 53 Version 1.0.0
59 00 Month 0000
Net Promoter Score is co-developed by Satmetrix, Bain & Company, and Fred Reichheld
A single question:
“How likely is it that you would recommend [Company X] to a friend or colleague? ”
A successful Net Promoter program includes 5 elements:
1. Metrics proven to link to growth
2. Leadership practices that instillcustomer focus, passion, and values
3. Organizational strategies to ensure adoption
4. Integration with core business processes
5. Operational systems to support the initiative
Promoters (score 9 or 10)
Passives (score 7 or 8)
Detractors (score 0 to 6)
The Net Promoter Score (NPS) explained