Combating the Harm Effect of Climate Change on Wheat Using Irrigation Water Management
21
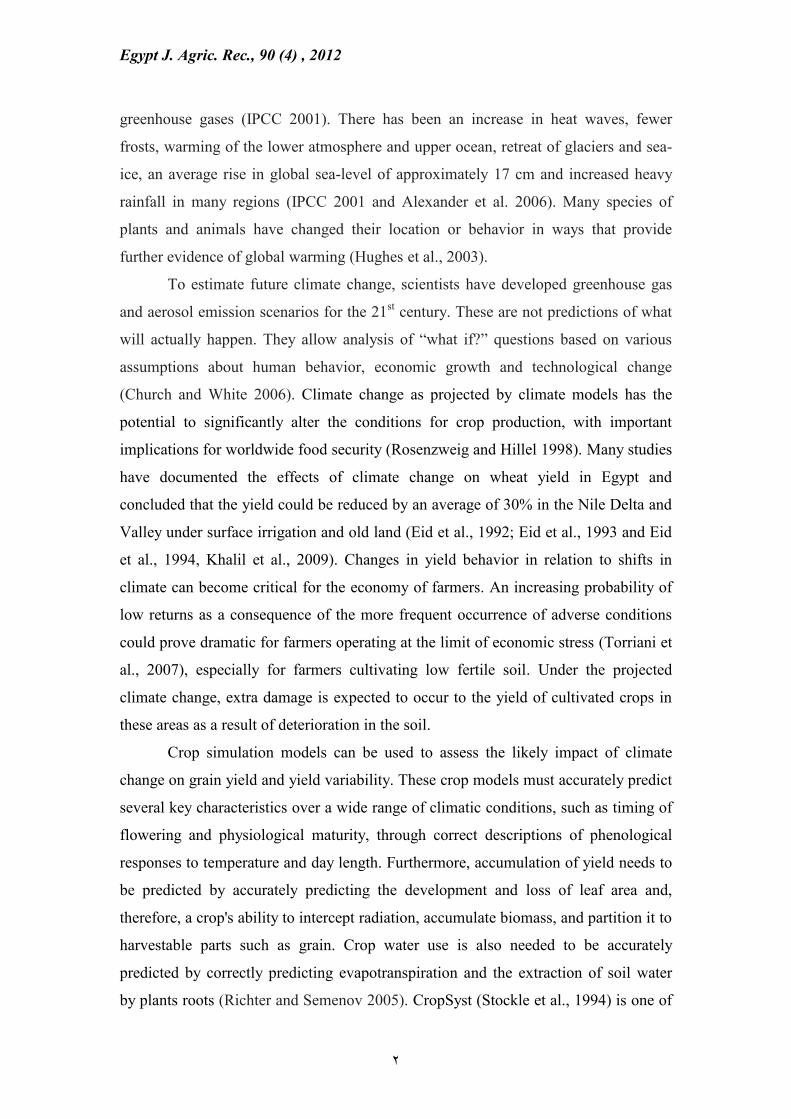
Egypt J. Agric. Rec., 90 (4) , 2012 1 Combating the Harm Effect of Climate Change on Wheat Using Irrigation Water Management Samiha Ouda 1 , M. A. A. Abdrabbo and Tahany Nor El din 3 1 Water Requirements and Field Irrigation Research Department; Soils, Water and Environment Research Institute; Agricultural Research Center; Egypt 2 Central Laboratory for Agricultural Climate; Agricultural Research Center; Egypt 3 Crop Physiology Research Department; Field Crops Research Institute; Agricultural Research Center; Egypt Abstract The effect of climate change on wheat grown under sprinkler irrigation was studied using previous data of two growing seasons, i.e. 2008/09 and 2009/10. These data was used to calibrate CropSyst model. Furthermore, a field experiment conducted at El-Bosaily farm El-Behira Governorate in 2010/11 growing season. The data of this experiment was used to validate the CropSyst model. The treatments of the experiment validation experiment composed of two wheat cultivars (Sakha 94 and Sakha 93) and four irrigation treatments (0.6, 0.8, 1.0 and 1.2 of ETc). Four climate change scenarios (A1, A2, B1 and B2) were used to assess the consequences of climate change on wheat yield in four time slices (2040, 2060, 2080 and 2100). A new irrigation schedule developed by BIS model was used to save irrigation water and improve water productivity under climate change conditions. The results showed that CropSyst model was able to predict wheat yield with high degree of accuracy for both calibration and validation procedures. The results also indicated that, in general, the yield of both cultivars will be decrease under climate change; however the reduction was lower for Sakha 93, compared by Sakha 94. The lowest reduction in the yield of both cultivars occurred in 2040 under B2 climate change scenario; whereas the highest yield losses were obtained in 2100 under A2 climate change scenario. The application of the new irrigation schedule under climate change conditions saved irrigation water by 6, 27 and 39% under irrigation with 0.8, 1.0 and 1.2 of ETc , respectively. Furthermore, it increased water productivity under the four climate change scenarios, compared with irrigation amount resulted from 0.8, 1.0 and 1.2 of ETc , for both wheat cultivars. Moreover, Sakha 93 gave the highest water productivity. Our results suggested that if we want to reduce yield losses for wheat under climate change conditions and save significant amounts of irrigation water, Sakha 93 should be cultivated and BIS model should be used to schedule irrigation. Key words: CropSyst model, climate change scenarios, BIS model, water productivity. Introduction The Earth has warmed by 0.7˚C on average since 1900 (Jones and Moberg 2003). Most of the warming since 1950 is due to human activities that have increased
Transcript of Combating the Harm Effect of Climate Change on Wheat Using Irrigation Water Management
Egypt J. Agric. Rec., 90 (4) , 2012
1
Combating the Harm Effect of Climate Change on Wheat Using Irrigation
Water Management
Samiha Ouda1, M. A. A. Abdrabbo and Tahany Nor El din
3
1 Water Requirements and Field Irrigation Research Department; Soils, Water and Environment
Research Institute; Agricultural Research Center; Egypt 2 Central Laboratory for Agricultural Climate; Agricultural Research Center; Egypt
3 Crop Physiology Research Department; Field Crops Research Institute; Agricultural Research
Center; Egypt
Abstract
The effect of climate change on wheat grown under sprinkler irrigation was
studied using previous data of two growing seasons, i.e. 2008/09 and 2009/10. These
data was used to calibrate CropSyst model. Furthermore, a field experiment
conducted at El-Bosaily farm El-Behira Governorate in 2010/11 growing season. The
data of this experiment was used to validate the CropSyst model. The treatments of
the experiment validation experiment composed of two wheat cultivars (Sakha 94 and
Sakha 93) and four irrigation treatments (0.6, 0.8, 1.0 and 1.2 of ETc). Four climate
change scenarios (A1, A2, B1 and B2) were used to assess the consequences of
climate change on wheat yield in four time slices (2040, 2060, 2080 and 2100). A new
irrigation schedule developed by BIS model was used to save irrigation water and
improve water productivity under climate change conditions. The results showed that
CropSyst model was able to predict wheat yield with high degree of accuracy for both
calibration and validation procedures. The results also indicated that, in general, the
yield of both cultivars will be decrease under climate change; however the reduction
was lower for Sakha 93, compared by Sakha 94. The lowest reduction in the yield of
both cultivars occurred in 2040 under B2 climate change scenario; whereas the
highest yield losses were obtained in 2100 under A2 climate change scenario. The
application of the new irrigation schedule under climate change conditions saved
irrigation water by 6, 27 and 39% under irrigation with 0.8, 1.0 and 1.2 of ETc,
respectively. Furthermore, it increased water productivity under the four climate
change scenarios, compared with irrigation amount resulted from 0.8, 1.0 and 1.2 of
ETc, for both wheat cultivars. Moreover, Sakha 93 gave the highest water
productivity. Our results suggested that if we want to reduce yield losses for wheat
under climate change conditions and save significant amounts of irrigation water,
Sakha 93 should be cultivated and BIS model should be used to schedule irrigation.
Key words: CropSyst model, climate change scenarios, BIS model, water
productivity.
Introduction
The Earth has warmed by 0.7˚C on average since 1900 (Jones and Moberg
2003). Most of the warming since 1950 is due to human activities that have increased
Egypt J. Agric. Rec., 90 (4) , 2012
2
greenhouse gases (IPCC 2001). There has been an increase in heat waves, fewer
frosts, warming of the lower atmosphere and upper ocean, retreat of glaciers and sea-
ice, an average rise in global sea-level of approximately 17 cm and increased heavy
rainfall in many regions (IPCC 2001 and Alexander et al. 2006). Many species of
plants and animals have changed their location or behavior in ways that provide
further evidence of global warming (Hughes et al., 2003).
To estimate future climate change, scientists have developed greenhouse gas
and aerosol emission scenarios for the 21st century. These are not predictions of what
will actually happen. They allow analysis of “what if?” questions based on various
assumptions about human behavior, economic growth and technological change
(Church and White 2006). Climate change as projected by climate models has the
potential to significantly alter the conditions for crop production, with important
implications for worldwide food security (Rosenzweig and Hillel 1998). Many studies
have documented the effects of climate change on wheat yield in Egypt and
concluded that the yield could be reduced by an average of 30% in the Nile Delta and
Valley under surface irrigation and old land (Eid et al., 1992; Eid et al., 1993 and Eid
et al., 1994, Khalil et al., 2009). Changes in yield behavior in relation to shifts in
climate can become critical for the economy of farmers. An increasing probability of
low returns as a consequence of the more frequent occurrence of adverse conditions
could prove dramatic for farmers operating at the limit of economic stress (Torriani et
al., 2007), especially for farmers cultivating low fertile soil. Under the projected
climate change, extra damage is expected to occur to the yield of cultivated crops in
these areas as a result of deterioration in the soil.
Crop simulation models can be used to assess the likely impact of climate
change on grain yield and yield variability. These crop models must accurately predict
several key characteristics over a wide range of climatic conditions, such as timing of
flowering and physiological maturity, through correct descriptions of phenological
responses to temperature and day length. Furthermore, accumulation of yield needs to
be predicted by accurately predicting the development and loss of leaf area and,
therefore, a crop's ability to intercept radiation, accumulate biomass, and partition it to
harvestable parts such as grain. Crop water use is also needed to be accurately
predicted by correctly predicting evapotranspiration and the extraction of soil water
by plants roots (Richter and Semenov 2005). CropSyst (Stockle et al., 1994) is one of

Egypt J. Agric. Rec., 90 (4) , 2012
3
these models that could be used along with a set of daily weather data spanning a
reasonable number of years to assess the impact of climate change on agriculture
(Tubiello et al., 2000; Torriani et al., 2007). The application of such models allows
the simulation of many possible climate change scenarios from only a few
experiments for calibration.
The objectives of this paper were: (i) to calibrate CropSyst model for wheat
grown in El-Behira governorates using previous field data; (ii) To validate CropSyst
model for field data experiment of wheat in the same governorate; (iii) to determine
yield losses under four climate change scenarios; (iv) to use BIS model to develop
new irrigation schedules under current climate and use it to run CropSyst model to
mange water more efficiently.
Materials and Methods
Previous data for wheat yield and consumptive use was obtained for 2008/09
and 2009/10 growing seasons. These data was used for calibrating the CropSyst
model. In addition, a field experiment was conducted in 2010/11 to collect the data
needed for validating the model.
1. The previous field data for calibration
Two field experiments were conducted at Aly Mobarak experimental farm of
the South Tahrir Research station, Egypt, during winter seasons of 2008/09 and
2009/10. Aly Mobarak experimental farm represents newly reclaimed sandy soil of
El-Bustan area at El-Behira governorate. Four irrigation treatments were used, i.e. I1:
Irrigation with 0.6 ETc, I2: Irrigation with 0.80 ETc, I3: Irrigation with 1.00 ETc and
I4: Irrigation with 1.20 ETc). The treatments were arranged in a randomized complete
block design with four replicates. Wheat cultivar Giza 168 was planted on 25th
of
November in the both growing seasons under sprinkler irrigation. All optimum
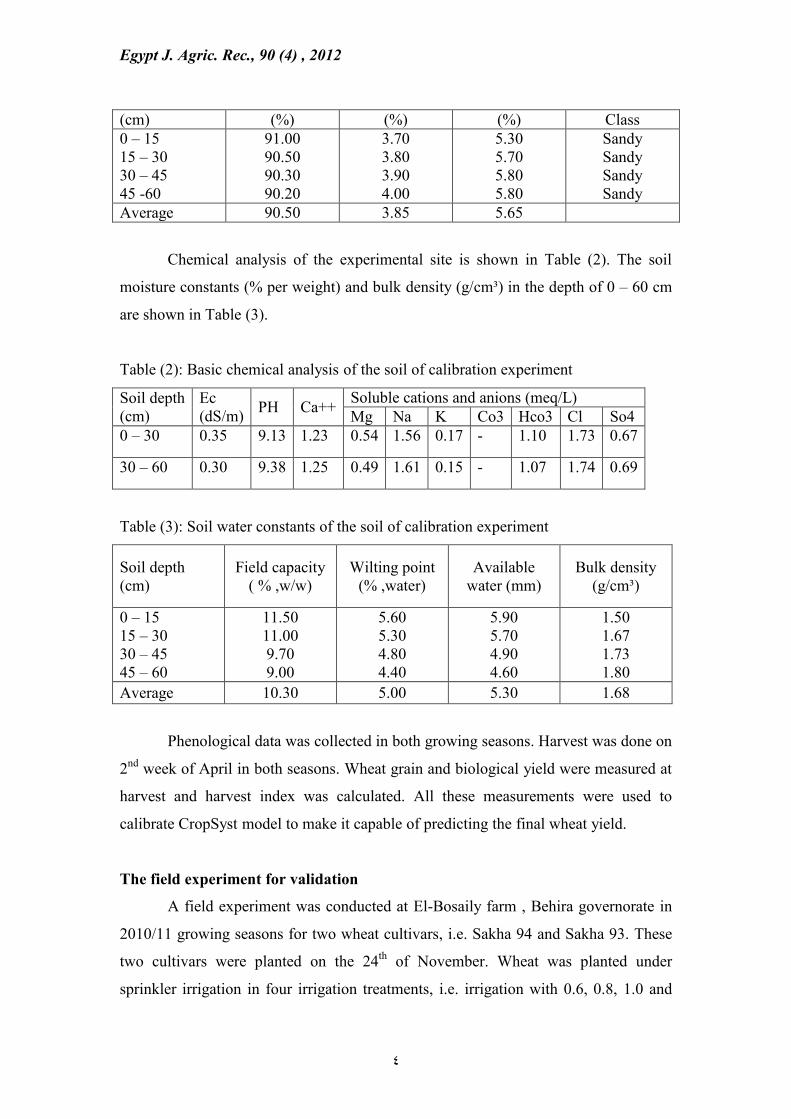
agricultural practices were preformed. Soil mechanical analysis according to (Piper,
1950) of the site of calibration experiment in the depth of the 0-60 cm is shown Table
(1)
Table (1) soil mechanical analysis of the soil of calibration experiment
Soil depth Sand Silt Clay Texture
Egypt J. Agric. Rec., 90 (4) , 2012
4
(cm) (%) (%) (%) Class
0 – 15
15 – 30
30 – 45
45 -60
91.00
90.50
90.30
90.20
3.70
3.80
3.90
4.00
5.30
5.70
5.80
5.80
Sandy
Sandy
Sandy
Sandy
Average 90.50 3.85 5.65
Chemical analysis of the experimental site is shown in Table (2). The soil
moisture constants (% per weight) and bulk density (g/cm³) in the depth of 0 – 60 cm
are shown in Table (3).
Table (2): Basic chemical analysis of the soil of calibration experiment
Soil depth
(cm)
Ec
(dS/m) PH Ca++
Soluble cations and anions (meq/L)
Mg Na K Co3 Hco3 Cl So4
0 – 30 0.35 9.13 1.23 0.54 1.56 0.17 - 1.10 1.73 0.67
30 – 60 0.30 9.38 1.25 0.49 1.61 0.15 - 1.07 1.74 0.69
Table (3): Soil water constants of the soil of calibration experiment
Soil depth
(cm)
Field capacity
( % ,w/w)
Wilting point
(% ,water)
Available
water (mm)
Bulk density
(g/cm³)
0 – 15
15 – 30
30 – 45
45 – 60
11.50
11.00
9.70
9.00
5.60
5.30
4.80
4.40
5.90
5.70
4.90
4.60
1.50
1.67
1.73
1.80
Average 10.30 5.00 5.30 1.68
Phenological data was collected in both growing seasons. Harvest was done on
2nd
week of April in both seasons. Wheat grain and biological yield were measured at
harvest and harvest index was calculated. All these measurements were used to
calibrate CropSyst model to make it capable of predicting the final wheat yield.
The field experiment for validation
A field experiment was conducted at El-Bosaily farm , Behira governorate in
2010/11 growing seasons for two wheat cultivars, i.e. Sakha 94 and Sakha 93. These
two cultivars were planted on the 24th
of November. Wheat was planted under
sprinkler irrigation in four irrigation treatments, i.e. irrigation with 0.6, 0.8, 1.0 and

Egypt J. Agric. Rec., 90 (4) , 2012
5
1.2 of ETc. All optimum agricultural practices were preformed Table (4) and (5)
showed the mechanical and chemical analysis of the experimental site.
Table (4): Mechanical analysis of the soil of the site of validation experiment.
Soil Depth Clay % Silt % Fine Sand % Coarse Sand %
10-30 18.4 40.6 29.5 11.5
30-60 17.5 42.4 30.9 9.2
60-90 17.4 40.6 30.4 11.6
Table (5): Chemical analysis of the soil of the site of validation experiment.
Depth
(cm) SP pH
ECe
(dS/m)
meq/l
Cations Anions
Ca++
Mg++
Na+
K+
Cl-
CO3--
HCO3-
SO4--
10-20 33 7.75 1.25 2.80 2.15 6.69 0.9 4.50 - 1.90 6.14
20-30 33 7.75 1.50 4.00 2.37 7.15 1.50 6.75 - 1.33 6.94
30-40 32 7.70 1.40 3.20 4.00 5.93 0.88 5.85 - 1.90 6.26
Maximum leaf area index (at anthesis) was measured. The date of
phenological stages was measured in the field. At harvest, grain and biological yield
were measured and harvest index was calculated.
2. CropSyst model
2.1. Model description
The Crop model (Stockle et al., 1994) objective is to serve as an analytical
tool to study the effect of cropping systems management on crop productivity and the
environment. For this purpose, CropSyst simulates the soil water budget, soil-plant
nitrogen budget, crop phenology, crop canopy and root growth, biomass production,
crop yield, residue production and decomposition, soil erosion by water, and pesticide
fate. These are affected by weather, soil characteristics, crop characteristics, and
cropping system management options including crop rotation, variety selection,
Egypt J. Agric. Rec., 90 (4) , 2012
6
irrigation, nitrogen fertilization, pesticide applications, soil and irrigation water
salinity, tillage operations, and residue management.
The water budget in the model includes rainfall, irrigation, runoff,
interception, water infiltration and redistribution in the soil profile, crop transpiration,
and evaporation. The nitrogen budget in CropSyst includes nitrogen application,
nitrogen transport, nitrogen transformations, ammonium absorption and crop nitrogen
uptake. The calculation of daily crop growth, expressed as biomass increase per unit
area, is based on a minimum of four limiting factors, namely light, temperature, water,
and nitrogen. Pala et al., (1996) suggested that minor adjustments of some of these
parameters, accounting for cultivar-specific differences, are desirable whenever
suitable experimental information is available. Details on the technical aspects and
use of the CropSyst model have been reported elsewhere (Stockle et al., 1994; Stockle
and Nelson 1994).
2.2. Model calibration
After each growing season, input files required by CropSyst model for El
Behira location and wheat crop were prepared and use to run the model. For each
treatment one management file was prepared represent each irrigation treatment. The
date of each phenological stage was used to calculate growing degree days for that
stage. Total biomass, grain yield, total and seasonal evapotranspiration, computed
from the soil-moisture measurements from all the treatments, were used for model
calibration. The values of the crop input parameters were either taken from the
CropSyst manual (Stockle and Nelson, 1994) or set to the values observed in the
experiments. The calibration consisted of slight adjustments of selected crop input
parameters to reflect reasonable simulations. These adjustments were around values
that were either typical for the crop species or known from previous experiences with
the model.
2.3. Model validation
The CropSyst model was validated using the field experiment data. It was
validated for grain and biological yield.
Egypt J. Agric. Rec., 90 (4) , 2012
7
2.4. Goodness of fit
To test the goodness of fit between the measured and predicted data, percent
difference between measured and predicted values of grain and biological yield in
each growing season were calculated. In addition, root mean square error (Jamieson et
al., 1998), which describes the average difference between measured and predicted
values, was calculated. Furthermore, Willmott index of agreement was calculated,
which take a value between 0.0-1.0 and 1.0 means perfect fit (Willmott, 1981).
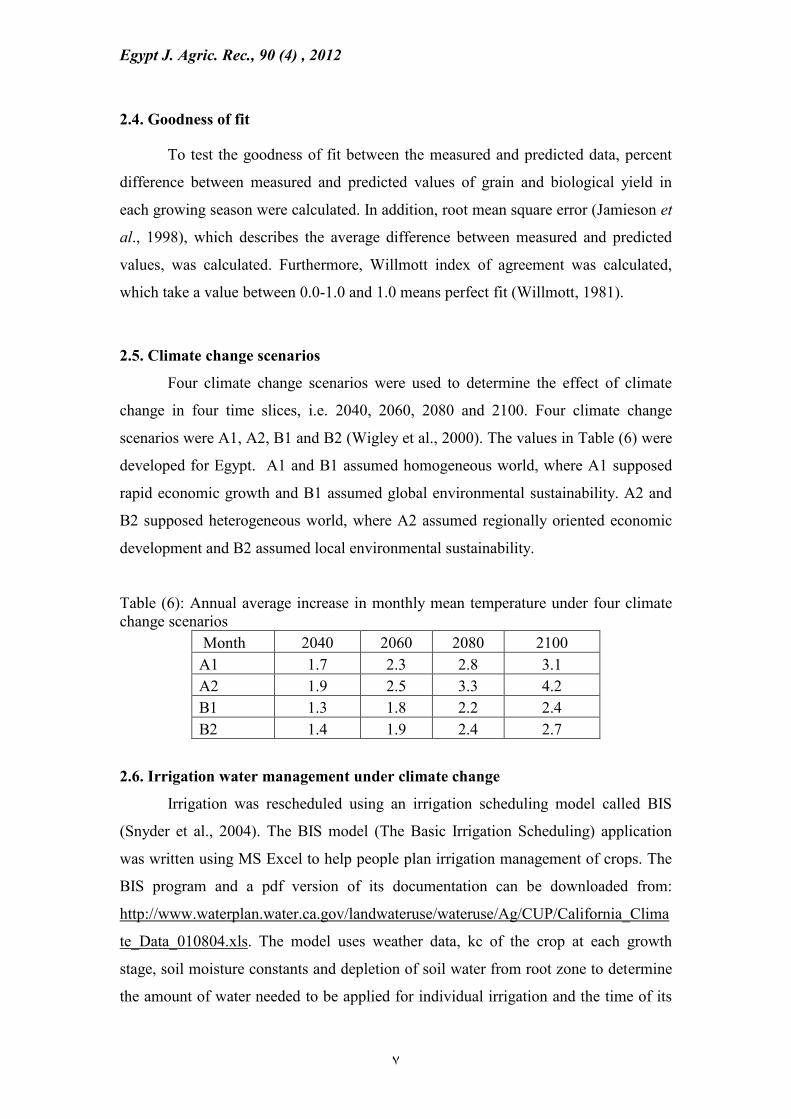
2.5. Climate change scenarios
Four climate change scenarios were used to determine the effect of climate
change in four time slices, i.e. 2040, 2060, 2080 and 2100. Four climate change
scenarios were A1, A2, B1 and B2 (Wigley et al., 2000). The values in Table (6) were
developed for Egypt. A1 and B1 assumed homogeneous world, where A1 supposed
rapid economic growth and B1 assumed global environmental sustainability. A2 and
B2 supposed heterogeneous world, where A2 assumed regionally oriented economic
development and B2 assumed local environmental sustainability.
Table (6): Annual average increase in monthly mean temperature under four climate
change scenarios
Month 2040 2060 2080 2100
A1 1.7 2.3 2.8 3.1
A2 1.9 2.5 3.3 4.2
B1 1.3 1.8 2.2 2.4
B2 1.4 1.9 2.4 2.7
2.6. Irrigation water management under climate change
Irrigation was rescheduled using an irrigation scheduling model called BIS
(Snyder et al., 2004). The BIS model (The Basic Irrigation Scheduling) application
was written using MS Excel to help people plan irrigation management of crops. The
BIS program and a pdf version of its documentation can be downloaded from:
http://www.waterplan.water.ca.gov/landwateruse/wateruse/Ag/CUP/California_Clima
te_Data_010804.xls. The model uses weather data, kc of the crop at each growth
stage, soil moisture constants and depletion of soil water from root zone to determine
the amount of water needed to be applied for individual irrigation and the time of its
Egypt J. Agric. Rec., 90 (4) , 2012
8
application. The model was run using the required input for wheat planted current
weather conditions. A new irrigation schedule was developed. The total amount of
water for each schedule was calculated and compared with the amount of water
measured in the field. CropSyst model was run using the new schedule and the effect
of it on saving irrigation water was assessed.
2.7. Water productivity
Water productivity was calculated for wheat cultivars under the four irrigation
treatments. Furthermore, it was calculated under climate change scenarios and under
using the new irrigation schedule. Water productivity (WP, kg/mm) values were
calculated by the following equation (Pala et al., 1996).
WP = Grain yield (kg)/Irrigation amount (mm)
Results and Discussion
1. CropSyst calibration
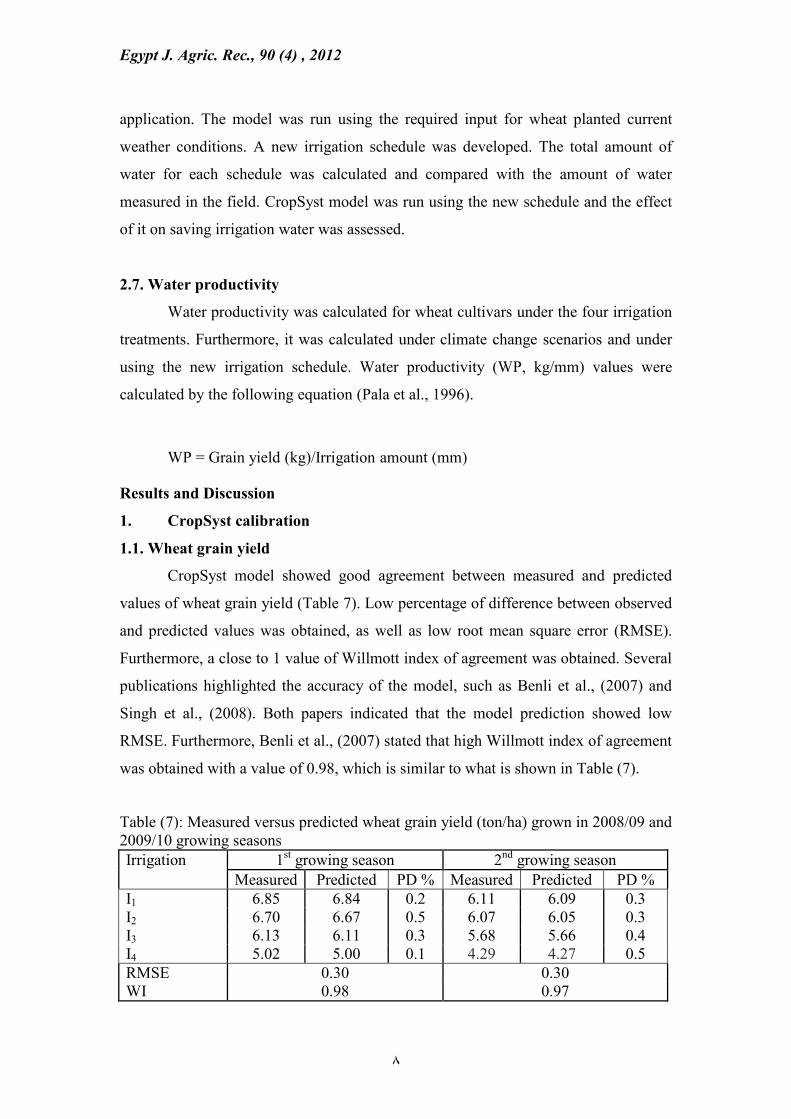
1.1. Wheat grain yield
CropSyst model showed good agreement between measured and predicted
values of wheat grain yield (Table 7). Low percentage of difference between observed
and predicted values was obtained, as well as low root mean square error (RMSE).
Furthermore, a close to 1 value of Willmott index of agreement was obtained. Several
publications highlighted the accuracy of the model, such as Benli et al., (2007) and
Singh et al., (2008). Both papers indicated that the model prediction showed low
RMSE. Furthermore, Benli et al., (2007) stated that high Willmott index of agreement
was obtained with a value of 0.98, which is similar to what is shown in Table (7).
Table (7): Measured versus predicted wheat grain yield (ton/ha) grown in 2008/09 and
2009/10 growing seasons
Irrigation 1st growing season 2
nd growing season
Measured Predicted PD % Measured Predicted PD %
I1 6.85 6.84 0.2 6.11 6.09 0.3
I2 6.70 6.67 0.5 6.07 6.05 0.3
I3 6.13 6.11 0.3 5.68 5.66 0.4
I4 5.02 5.00 0.1 4.29 4.27 0.5
RMSE 0.30 0.30
WI 0.98 0.97

Egypt J. Agric. Rec., 90 (4) , 2012
9
I1=Irrigation with 1.20 ETc; I3=Irrigation with 1.00 ETc; I5=Irrigation with 0.80 ETc; I7= Irrigation
with 0.60 ETc; PD%=Percent difference between measured and predicted yield; RMSE= Root mean
square error; WI= Wilmot index of agreement.
1.2. Wheat biological yield
With respect to wheat biological yield, the model over-predicted its values
under some of the irrigation treatments, where the percentage of change between
observed and predicted values were between -0.45% and +1.54% in the first growing
season. In the second growing season, the value was between -2.51% and +0.60%.
Root mean square error was 0.39 and 0.34 ton/ha for the first and second growing
season, respectively. In addition, Willmott index of agreement was close to 1, i.e. 0.97
and 0.98% (Table 8). Benli et al., (2007), stated that RMSE represented 21% of the
observed average, whereas Willmott index of agreement between the observed and
simulated biomass was 0.76, reasonably close to 1.
Table (8): Measured versus predicted wheat biological yield (ton/ha) grown in
2008/09 and 2009/10 growing seasons
Treatments 1st growing season 2
nd growing season
Measured Predicted PD % Measured Predicted PD %
I1 26.43 26.31 -0.45 27.14 26.46 -2.51
I2 24.38 24.73 +1.44 21.21 20.87 -1.60
I3 23.16 22.63 -2.29 20.09 20.21 +0.60
I4 19.00 19.29 +1.54 16.57 16.44 -0.78
RMSE 0.39 0.34
WI 0.97 0.98 I1=Irrigation with 1.20 ETc; I3=Irrigation with 1.00 ETc; I5=Irrigation with 0.80 ETc; I7= Irrigation
with 0.60 ETc; PD%=Percent difference between measured and predicted yield; RMSE= Root mean
square error; WI= Wilmot index of agreement.
2. CropSyst validation
Validation of CropSyst model for the two cultivars showed good agreement
between measured and predicted grain and biological wheat yield. This agreement
was reflected by low percentage of difference between measured and predicted values
of grain and biological yield, low mean square error and high Willmott index of
agreement (Table 9 and 10).
Regarding to Sakha 94, the root mean square error was low, i.e. 0.46 and 0.43
ton/ha for grain and biological yield, respectively. Willmott index of agreement was
0.96 and 0.95 for grain and biological yield, respectively (Table 9). Singh et al.,
(2008) indicated that CropSyst model was more appropriate than CERES-Wheat in

Egypt J. Agric. Rec., 90 (4) , 2012
11
predicting growth and yield of wheat under different N and irrigation application
situations, where RMSE was 0.36 ton/ha compared with 0.63 ton/ha for CERES-
Wheat.
Table (9): Measured versus predicted wheat grain and biological yield for Sakha 94.
Irrigation
treatment
Grain yield (ton/ha) Biological yield (ton/ha)
Measured Predicted PD % Measured Predicted PD %
I1 4.8 4.77 0.63 16.8 16.71 0.54
I2 5.8 5.78 0.34 19.1 19.02 0.42
I3 7.0 6.95 0.71 26.3 26.15 0.57
I4 6.9 6.87 0.43 21.4 21.33 0.33
RMSE 0.46 0.43
WI 0.96 0.95 I1= irrigation with 0.6 of ETc; I2=irrigation with 0.8 of ETc; I3= irrigation with 1.0 of ETc; I4=
irrigation with 1.2 of ETc; RMSE= Root mean square error; WI= Willmott index of agreement; PD% =
percent difference between measured and predicted values.
With respect to Sakha 93, the root mean square error was low, i.e. 0.31 and
0.28 ton/ha for grain and biological yield, respectively. Willmott index of agreement
was 0.97 for both grain and biological yield, respectively (Table 10). Lobell and
Ortiz-Monasterio (2006) stated that CERES-Wheat model was able to predict wheat
yield for the different irrigation trials quite well with a RMSE of 0.23 ton/ha.
Furthermore, Singh et al., (2008) reported that RMSE between observed and predicted
biomass by CropSyst was 1.27 ton/ha as compared to 1.94 ton/ha between observed
and predicted biomass by CERES-Wheat.
Table (10): Measured versus predicted wheat grain and biological yield for Sakha 93.
Irrigation
treatment
Grain yield (ton/ha) Biological yield (ton/ha)
Measured Predicted PD % Measured Predicted PD %
I1 5.4 5.36 0.74 18.7 18.62 0.43
I2 5.9 5.87 0.51 20.4 20.33 0.34
I3 7.3 7.26 0.55 27.8 27.74 0.22
I4 7.9 7.84 0.76 27.2 26.99 0.77
RMSE 0.31 0.28
WI 0.97 0.97
Egypt J. Agric. Rec., 90 (4) , 2012
11
I1= irrigation with 0.6 of ETc; I2=irrigation with 0.8 of ETc; I3= irrigation with 1.0 of ETc; I4=
irrigation with 1.2 of ETc; RMSE= Root mean square error; WI= Willmott index of agreement; PD% =
percent difference between measured and predicted values.
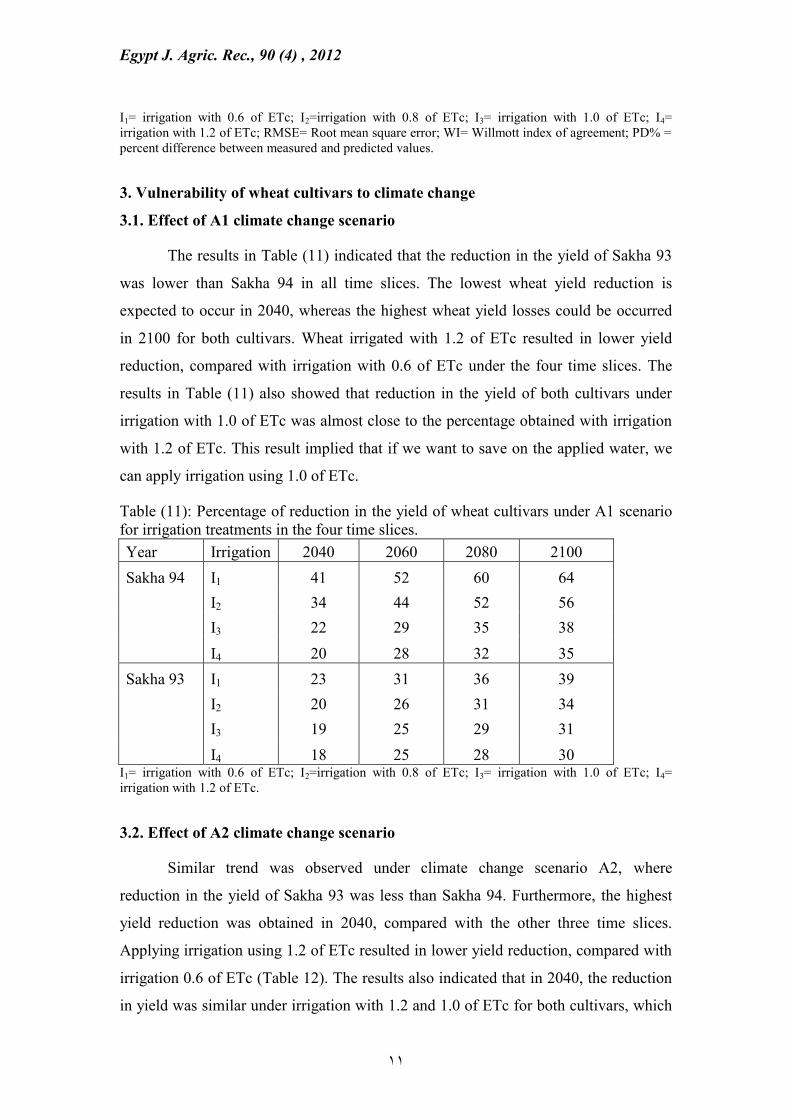
3. Vulnerability of wheat cultivars to climate change
3.1. Effect of A1 climate change scenario
The results in Table (11) indicated that the reduction in the yield of Sakha 93
was lower than Sakha 94 in all time slices. The lowest wheat yield reduction is
expected to occur in 2040, whereas the highest wheat yield losses could be occurred
in 2100 for both cultivars. Wheat irrigated with 1.2 of ETc resulted in lower yield
reduction, compared with irrigation with 0.6 of ETc under the four time slices. The
results in Table (11) also showed that reduction in the yield of both cultivars under
irrigation with 1.0 of ETc was almost close to the percentage obtained with irrigation
with 1.2 of ETc. This result implied that if we want to save on the applied water, we
can apply irrigation using 1.0 of ETc.
Table (11): Percentage of reduction in the yield of wheat cultivars under A1 scenario
for irrigation treatments in the four time slices.
Year Irrigation 2040 2060 2080 2100
Sakha 94 I1 41 52 60 64
I2 34 44 52 56
I3 22 29 35 38
I4 20 28 32 35
Sakha 93 I1 23 31 36 39
I2 20 26 31 34
I3 19 25 29 31
I4 18 25 28 30 I1= irrigation with 0.6 of ETc; I2=irrigation with 0.8 of ETc; I3= irrigation with 1.0 of ETc; I4=
irrigation with 1.2 of ETc.
3.2. Effect of A2 climate change scenario
Similar trend was observed under climate change scenario A2, where
reduction in the yield of Sakha 93 was less than Sakha 94. Furthermore, the highest
yield reduction was obtained in 2040, compared with the other three time slices.
Applying irrigation using 1.2 of ETc resulted in lower yield reduction, compared with
irrigation 0.6 of ETc (Table 12). The results also indicated that in 2040, the reduction
in yield was similar under irrigation with 1.2 and 1.0 of ETc for both cultivars, which

Egypt J. Agric. Rec., 90 (4) , 2012
12
implied that irrigation with 1.0 could save irrigation water without any more yield
reduction. Ouda et al., (2010) incorporated A2 scenario in CropSyst model and
reported that wheat yield could be reduce by 31% in 2038.
Table (12): Percentage of reduction in the yield of wheat cultivars under A2 scenario
for irrigation treatments in the four time slices.
Year Irrigation 2040 2060 2080 2100
Sakha 94
I1 38 55 71 79
I2 31 47 64 73
I3 20 31 40 52
I4 20 29 37 45
Sakha 93
I1 21 32 46 56
I2 19 28 38 47
I3 18 26 33 43
I4 18 26 32 39 I1= irrigation with 0.6 of ETc; I2=irrigation with 0.8 of ETc; I3= irrigation with 1.0 of ETc; I4=
irrigation with 1.2 of ETc.
3.3. Effect of B1 climate change scenario
The yield of Sakha 94 is expected to be reduced by 55% in 2100 when
irrigation was applied with 0.6 of ETc under B1 climate change scenario. Whereas,
the reduction in the yield of Sakha 93 was 32% under the same irrigation treatment.
The reduction in the yield of Sakha 93 was similar under irrigation with 1.2 and 1.0 of
ETc.
Table (13): Percentage of reduction in the yield of wheat cultivars under B1 scenario
for irrigation treatments in the four time slices.
Year Irrigation 2040 2060 2080 2100
Sakha 94
I1 32 42 48 55
I2 26 35 40 47
I3 17 23 28 30
I4 15 21 26 28
Sakha 93
I1 17 23 28 32
I2 15 21 24 28
I3 14 19 24 26
I4 14 19 23 25 I1= irrigation with 0.6 of ETc; I2=irrigation with 0.8 of ETc; I3= irrigation with 1.0 of ETc; I4=
irrigation with 1.2 of ETc.
3.4. Effect of B2 climate change scenario
Egypt J. Agric. Rec., 90 (4) , 2012
13
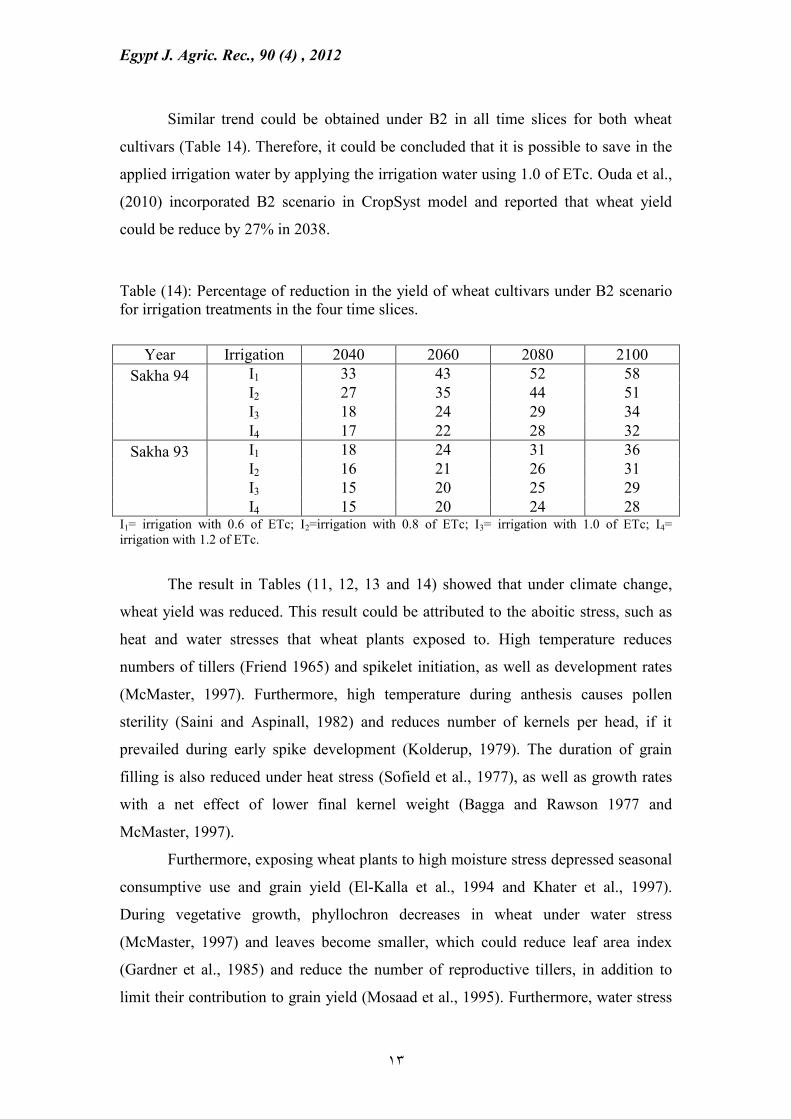
Similar trend could be obtained under B2 in all time slices for both wheat
cultivars (Table 14). Therefore, it could be concluded that it is possible to save in the
applied irrigation water by applying the irrigation water using 1.0 of ETc. Ouda et al.,
(2010) incorporated B2 scenario in CropSyst model and reported that wheat yield
could be reduce by 27% in 2038.
Table (14): Percentage of reduction in the yield of wheat cultivars under B2 scenario
for irrigation treatments in the four time slices.
Year Irrigation 2040 2060 2080 2100
Sakha 94
I1 33 43 52 58
I2 27 35 44 51
I3 18 24 29 34
I4 17 22 28 32
Sakha 93
I1 18 24 31 36
I2 16 21 26 31
I3 15 20 25 29
I4 15 20 24 28 I1= irrigation with 0.6 of ETc; I2=irrigation with 0.8 of ETc; I3= irrigation with 1.0 of ETc; I4=
irrigation with 1.2 of ETc.
The result in Tables (11, 12, 13 and 14) showed that under climate change,
wheat yield was reduced. This result could be attributed to the aboitic stress, such as
heat and water stresses that wheat plants exposed to. High temperature reduces
numbers of tillers (Friend 1965) and spikelet initiation, as well as development rates
(McMaster, 1997). Furthermore, high temperature during anthesis causes pollen
sterility (Saini and Aspinall, 1982) and reduces number of kernels per head, if it
prevailed during early spike development (Kolderup, 1979). The duration of grain
filling is also reduced under heat stress (Sofield et al., 1977), as well as growth rates
with a net effect of lower final kernel weight (Bagga and Rawson 1977 and
McMaster, 1997).
Furthermore, exposing wheat plants to high moisture stress depressed seasonal
consumptive use and grain yield (El-Kalla et al., 1994 and Khater et al., 1997).
During vegetative growth, phyllochron decreases in wheat under water stress
(McMaster, 1997) and leaves become smaller, which could reduce leaf area index
(Gardner et al., 1985) and reduce the number of reproductive tillers, in addition to
limit their contribution to grain yield (Mosaad et al., 1995). Furthermore, water stress

Egypt J. Agric. Rec., 90 (4) , 2012
14
occurs during grain growth could have a sever effect on final yield compared with
stress occurred during other stages (Hanson and Nelson, 1980).
4. Irrigation water management under climate change
BIS model was run for wheat under a new irrigation schedule was developed.
CropSyst model was run using the new irrigation schedule under the four climate
change scenarios. The results revealed that wheat yield was not changed when the
model was run using the new irrigation schedule under climate change. However,
irrigation water saving was attained.
The results in Table (15) showed that the applied irrigation amount with the
BIS model was higher than the applied irrigation amount using o.6 of ETc. The
simulation of wheat yield under the new schedule indicated that irrigation water
saving could be attained for irrigation with 0.8, 1.0 and 1.2 of ETc. The saved
irrigation amounts were 6, 27 and 39% under irrigation with 0.8, 1.0 and 1.2 of ETc,
respectively (Table 15). These results implied that the growing plants did not make
use of all the applied irrigation water and a certain percentages of that applied water
will be lost in the soil for deep peculation. Under climate change conditions, the
growth of the growing plants is expected to be limited due to the abiotic stress
prevailed, which will reduce the above ground biomass and consequently root water
uptake. Thus, a large amount of the applied irrigation water will be lost.
Table (15): Percentage of difference between measured and predicted irrigation
amounts applied to wheat cultivars (averaged) for the two cultivars.
Irrigation
I1 I2 I3 I4
Amount % Amount % Amount % Amount %
A1 +179 +22 -60 -6 -364 -27 -635 -39
A2 +179 +22 -60 -6 -364 -27 -635 -39
B1 +179 +22 -60 -6 -364 -27 -635 -39
B2 +179 +22 -60 -6 -364 -27 -635 -39 I1= irrigation with 0.6 of ETc; I2=irrigation with 0.8 of ETc; I3= irrigation with 1.0 of ETc; I4=
irrigation with 1.2 of ETc; A1, A2, B1 and B2= four climate change scenarios.
5. Water productivity
The simulation of the application of the new irrigation schedule revealed that
the applied irrigation amount using BIS model not only saved water but also increased

Egypt J. Agric. Rec., 90 (4) , 2012
15
water productivity under the four climate change scenarios, compared with irrigation
with 0.8 of ETc for the two wheat cultivars. Sakha 93 gave remarkable higher water
productivity, compared with Sakha 94 (Table 16). This result implies that Sakha 93
posse trait of yield stability under abiotic stress. The results also showed that the
highest water productivity will be occurred in 2040 under B1 climate change scenario
and it will decline with increasing time slices.
Table (16): Water productivity (kg/mm) of wheat under irrigation with 0.8 of ETc
versus the new irrigation schedule.
Scenario
Year
Sakha 94 Sakha 93
WPCC WPNS WPCC WPNS
A1 2040 2.72 2.87 6.61 6.99
2060 2.31 2.44 6.07 6.41
2080 1.97 2.09 5.68 6.01
2100 1.80 1.91 5.45 5.76
A2 2040 2.83 2.99 6.71 7.09
2060 2.16 2.29 5.93 6.27
2080 1.47 1.55 5.08 5.37
2100 1.09 1.15 4.35 4.60
B1 2040 3.05 3.22 7.00 7.40
2060 2.68 2.84 6.56 6.94
2080 2.47 2.61 6.26 6.62
2100 2.17 2.30 5.94 6.28
B2 2040 3.00 3.17 6.91 7.31
2060 2.66 2.82 6.53 6.91
2080 2.31 2.44 6.07 6.41
2100 1.99 2.11 5.71 6.04
A1, A2, B1, and B2= four climate change scenarios; WPCC= water productivity under climate change;
WPNS= water productivity under the new irrigation schedule.
Regarding to irrigation amount with 1.0 of ETc, water productivity will
increase when the new irrigation schedule will be used under the four climate change
scenarios for both cultivars. However, water productivity will be the highest under B1
climate change scenario and for Sakha 93 in 2040 (Table 17).
Table (17): Water productivity (kg/mm) of wheat under irrigation with 1.0 of ETc
versus the new irrigation schedule.

Egypt J. Agric. Rec., 90 (4) , 2012
16
Scenario
Year
Sakha 94 Sakha 93
WPCC WPNS WPCC WPNS
A1 2040 3.99 5.46 5.73 7.83
2060 3.61 4.93 5.28 7.22
2080 3.34 4.56 4.99 6.82
2100 3.18 4.35 4.82 6.59
A2 2040 4.07 5.57 5.80 7.93
2060 3.50 4.79 5.18 7.08
2080 3.05 4.18 4.68 6.41
2100 2.38 3.25 3.99 5.46
B1 2040 4.26 5.83 6.04 8.25
2060 3.96 5.41 5.68 7.77
2080 3.69 5.04 5.38 7.36
2100 3.53 4.82 5.21 7.12
B2 2040 4.20 5.74 5.96 8.14
2060 3.87 5.30 5.61 7.67
2080 3.61 4.93 5.28 7.22
2100 3.35 4.59 5.01 6.85
A1, A2, B1, and B2= four climate change scenarios; WPCC= water productivity under climate change;
WPNS= water productivity under the new irrigation schedule.
Similar trend was observed under irrigation with 1.2 of ETc, where Sakha 93
gave the highest water productivity under B1 climate change scenarios in 2040 (Table
18).
Table (18): Water productivity (kg/mm) of wheat under irrigation with 1.2 of ETc
versus the new irrigation schedule.
Scenario
Year
Sakha 94 Sakha 93
WPCC WPNS WPCC WPNS
A1 2040 3.70 6.07 5.11 8.39
2060 3.33 5.46 4.69 7.69
2080 3.14 5.15 4.47 7.34
2100 3.02 4.96 4.34 7.12
A2 2040 3.71 6.09 5.13 8.42
2060 3.28 5.38 4.63 7.60
2080 2.92 4.79 4.23 6.94
2100 2.51 4.11 3.76 6.17
B1 2040 3.92 6.43 5.37 8.81
2060 3.66 6.01 5.07 8.32
2080 3.44 5.64 4.81 7.90
2100 3.31 5.42 4.66 7.65
B2 2040 3.83 6.29 5.27 8.65

Egypt J. Agric. Rec., 90 (4) , 2012
17
2060 3.61 5.92 5.01 8.23
2080 3.33 5.46 4.69 7.69
2100 3.16 5.18 4.49 7.37
A1, A2, B1, and B2= four climate change scenarios; WPCC= water productivity under climate change;
WPNS= water productivity under the new irrigation schedule.
Conclusion
Rapid changes of climate may seriously inhibit the ability of some crops to
survive or to achieve the desired yield in their current region. Sustainable land and
water management combined with innovative agricultural technologies could mitigate
climate change and help poor farmers adapt to its impacts. New knowledge,
technology and policy for agriculture have never been more critical, and adaptation
and mitigation strategies must urgently be applied to national and regional
development programs. Our results showed that the lowest yield reduction was
obtained for Sakha 93 using irrigation with either 1.0 or 1.2 of ETc under B1 climate
change scenario in 2040. Our results also implied that Sakha 93 was tolerant to the
aboitic stress of climate change compared with Sakha 94 under the four climate
change scenarios. The highest reduction in wheat yield was obtained under A1
climate change scenario in 2100 for the two cultivars (Tables 11-14). The results in
these tables also revealed that irrigation with 0.6 of ETc gave the highest yield
reduction for both cultivars and under the four climate change scenarios.
Under climate change conditions, achieving greater water productivity is the
primary challenge for scientists in agriculture. Therefore, changing irrigation schedule
could provide a cheap and easy to implement irrigation management techniques to
relief the harm effect of climate change, with no additional economic costs. Our
results showed that the application of the new irrigation schedule could save a
remarkable amount of irrigation water (Table 15) and increases water productivity
(Tables 16-18).
In conclusion, to manage water more efficiently for wheat under climate
change conditions, the following procedures should be taken into account:
1. Development of data base to classify the available wheat cultivars according
to their ability to tolerate abiotic stress such as, heat and water stresses, in
addition to document how efficient these cultivars in using irrigation water
under climate change conditions. Our results showed that Sakha 93 is tolerant

Egypt J. Agric. Rec., 90 (4) , 2012
18
to heat and water stresses and has use water more efficiently, compared with
Sakha 94.
2. Effect of adaptation strategy, such as changing irrigation schedule, on
reducing the climate change risks should be taken into account during the
management of irrigation water. Our results showed that considerable
irrigation amount could be saved, if irrigation was scheduled using BIS model.
3. Finally, our results suggested that if we want to reduce yield losses for wheat
under climate change conditions and save significant amounts of irrigation
water, Sakha 93 should be cultivated and BIS model should be used to
schedule irrigation.
Acknowledgment
This study part of the activities of " Impacts of Climate Change on Water
Management in Egypt project" funded by Science and Technology Development
Fund, Egypt .
References
Alexander, L., X. Zhang, T. C. Peterson, and others, 2006: Global observed changes
in daily climate extremes of temperature and precipitation. J. Geophys. Res.,
111, D05109.
Bagga, A. K. and I. M. Rawson. 1977. Contracting responses of morphologically
similar wheat varieties to temperature appropriate to warm temperature
climates with hot summers: A study in controlled environment. Aust. J. Agric.
Res. 40:965-80.
Benli, B., M. Pala, C. Stockle, T. Oweis. 2007. Assessment of winter wheat
production under early sowing with supplemental irrigation in a cold highland
environment using CropSyst simulation model. Agric. Mang. Water. 3:45-54.
Church, J. A. and N. J. White, 2006. A 20th
century acceleration in global sea-level
rise. Geophysical Research Letters, 33, L01602.
Eid, H. M., N. A. Anton, and A. M. Tarrad 1994. Comparative study on Egyptian
wheat varieties and their response to high temperatures. Annals of Agric. Sci.
Moshtohor Vol. 32 (1) 143-154.
Eid, H. M., N. G. Ainer, M. A. Rady and W. M. Rizk. 1993. Impact of Climate
change on simulated wheat yield and water needs. 1st. Conf. Egypt. Hung. Env.
Egypt, 1993, p.309-312.
Eid, H. M., N. G. Ainer, K. M. R. Yousef, M. A. M. Ibrahim, and G. M. Gad El-Rab.
1992. Climate change crop modeling study on wheat. 5th
Egypt Bot. Conf. Siant
Cather.
El-Kalla, S.E., Leilah, A.A., Basiony, A.H., Hussien S.M. 1994. Effect of Irrigation
and foliar nutrition treatments on growth and yield of some wheat cultivars
Egypt J. Agric. Rec., 90 (4) , 2012
19
under El-Arish area condition. 6th
conf. Agron., Fac. Agric., Al-Azhar Uni.,
Egypt.
Friend, D. J. C. 1965. Ear length and spikelets number of wheat grown at different
temperatures and light intensities. Cand. J. Bot. 43:343-353.
Gardner, F.P., Pearce, R.B., Mitchell, R.L. 1985. Physiology of crop plants. Iowa State
University Press. Ames.
Hanson, A.D., Nelson E.C. 1980. The biology of crop production. New York
Academic Press.
Hughes, T. P., A. H. Baird, D. R. Bellwood, M. Card, S. R. Connolly, C. Folke, R.
Grosberg, O. Hoegh-Guldberg, J. B. C. Jackson, J. Kleypas, J. M. Lough, P.
Marshall, M. Nystrom, S. R. Palumbi, J. M. Pandolfi, B. Rosen, and J.
Roughgarden, 2003: Climate Change, Human impacts, and the Resilience of
Coral Reefs. Science, 301, 929-933.
IPCC, 2001: Summary for Policymakers: Climate Change 2001: The Scientific Basis,
Contribution of Working Group I to the 3rd
Assessment Report of the
Intergovernmental Panel on Climate Change. J. T. Houghton, Y. Ding, D. J.
Griggs, M. Noguer, P. J. Van Der Linden, and D. Xioaosu, Cambridge
University Press, Cambridge, 944pp.
Jamieson, P.D., J. R. Porter, J. Goudriaan, J.T. Ritchie, H. van Keulen, and W. Stol.
1998. A comparison of the models AFRCWHEAT2, CERES-Wheat, Sirius,
SUCROS2 and SWHEAT with measurements from wheat grown under
drought. Field Crops Res. 55:23–44.
Jones, P. D. and A. Moberg, 2003: Hemispheric and large-scale surface air
temperature variations: An extensive revision and an update to 2001. J. Climate,
16, 206-223.
Khalil, F.A., H. Farag, G. El Afandi, and S. A. Ouda. 2009. Vulnerability and
adaptation of wheat to climate change in Middle Egypt. 13th
Conference on
Water Technology. Hurghada, Egypt. 12-15 March.
Khater, A.N, Abdel Maksoud, H.H., Eid, H.M. 1997. Response of some wheat
cultivars and their water relations to different irrigation level in Middle Delta.
Egypt , J. Appl. Sci.11(2):15-29.
Kolderup, I. 1979. Application of different temperatures in three growth phases of
wheat. II. Effects on ear size and seed setting. Acta. Agric. Scand. 29:11-116.
Lobell, D. B. and J. I. Ortiz-Monasterio. 2006. Evaluating strategies for improved
water use in spring wheat with CERES. Agric. Wat. Manag. 84:249-258.
McMaster, G.S. 1997. Phonology, development, and growth of wheat (Triticum
aestivum L.) shoot apex: A review. Advaces in Agron. 59:63-118.
Mosaad, M.G., Ortiz-Ferrara, G., Mahalak-Shmi, V. 1995. Tiller development and
contribution to yield under different moisture regimes in two Triticum species.
J. Agron. 174: 173-180.
Ouda, S. A., M. Sayed, G. El Afandi and F.A. Khalil. 2010. Developing an
adaptation strategy to reduce climate change risks on wheat grown in sandy
soil in Egypt. 10th
International Conference on Development of Dry lands. 12-
15 December. Cairo, Egypt.
Egypt J. Agric. Rec., 90 (4) , 2012
21
Pala, M., Stockle, C.S., Harris, H.C., 1996. Simulation of durum wheat (Triticum
turgidum ssp Durum) growth under different water and nitrogen regimes in a
Mediterranean environment using CropSyst. Agric. Sys. 51 (2), 147–163.
Piper, C. S. (1950): Soil and plant analysis. Univ. of Adelaid. Australia.
Richter, G. M. and Semenov, M. A. 2005. Modelling impacts of climate change on
wheat yields in England and Wales: Assessing drought risks. Agricultural
Systems 84(1): 77-97.
Rosenzweig C, Hillel D. 1998. Climate change and the global harvest. Oxford
University Press, New York.
Saini, H. S. and D. Aspinall. 1982. Sterility in wheat (Triticum aestivum L.) induced
by water stress or high temperature: Possible mediation by abscisic acid. Aust.
J. Plant Physio. 9:529-537.
Singh, A. K., R. Tripathy and U. K Chopra. 2008. Evaluation of CERES-Wheat and
CropSyst models for water-nitrogen interactions in wheat crop. Agric. Wat.
Mang. 95(7):776-786.
Snyder R.L., Organ, M., Bali, K. and Eching, S. 2004. Basic irrigation scheduling
BIS.http://www.waterplan.water.ca.gov/landwateruse/wateruse/Ag/CUP/
California_Climate_Data_010804.xls.
Sofield, I. L. T. Evans and I. F Wardlaw. 1977. The effect of temperature and light on
grain filling in wheat. R. Soc. N. Z. Bull. 12:909-915.
Stockle, C. O., S. Martin and G. S. Campbell. 1994. CropSyst, a cropping systems
model: water/nitrogen budgets and crop yield. Agricultural Systems. 46:335-
359.
Stockle, C.O., Nelson, R., 1994. Cropping Systems Simulation: Model Users Manual
(Version 1. 02. 00) Biological Systems Engineering Department, Washington
State University, p. 167.
Torriani, D.S., P. Calanca, S. Schmid, M. Beniston, J. Fuhrer. 2007. Potential effects
of changes in mean climate and climate variability on the yield of winter and
spring crops in Switzerland. Clim Res 34:59–69
Tubiello, F.N., M. Donatelli, C. Rosenzweig, C.O. Stockle. 2000. Effects of climate
change and elevated CO2 on cropping systems: model predictions at two Italian
sites. Eur J Agron 13:179–189.
Wigley, T.M.L., S.C.B. Raper, M. Hulme and S.J. Smith, 2000. The Magicc/Scengen
Climate Scenario Generator Version 2.4: Technical Manual. C.F:
http://www.cru.uea.ac.uk.
Willmott, C.J. 1981. On the validation of models. Phys. Geogr. 2:184–194.
إدارة مياه الري عن طريق القمح تغير المناخ على الضرر الناتج من تأثير التغلب على
3, تهانى نور الدين 2محمد عبد ربه , 1سميحة عوده البيئهو معهد بحوث األراضى والمياه -قسم بحوث المقننات المائية و الرى الحقلى 1 المعمل المركز للمناخ الزراعى 2 معهد بحوث المحاصيل الحقلية -ا المحاصيل الحقلية قسم بحوث فسيولوجي3
http://www.waterplan.water.ca.gov/landwateruse/wateruse/Ag/CUP/%20California_Climate_Data_010804.xls
Egypt J. Agric. Rec., 90 (4) , 2012
21
الملخص العربى
تمت دراسة تأثير تغير المناخ على القمح المنزرع تحت الري بالرش باستخدام بيانات سابقه لموسمين الزراعه
ستخدمت هذه البيانات لمعايرة نموذج 2002/2010و 2002/2002 ثم تم إجراء تجربه حقليه فى. CropSystوا
كانت المعامالت التجربية عبارة عن صنفين من . إلستخدام بياناتها فى التحقق من صحة التنبؤ 2010/2011موسم
واستخدمت أربعة (. من البخر نتح 1.2و 1.0و 0.2و 0.0)وأربع معامالت الري ( 23وسخا 29سخا )القمح
فترات رفى المناخ على محصول القمح فى أربعتغياللتقييم آثار B2)و B1و A2و A1)سيناريوهات للتغير فى المناخ
وكمحاولة لتحسين إدارة المياه تحت التغير فى المناخ تم محاكاة تأثير (. 2100و 2020و 2000و 2090)زمنية
أظهرت . فى محاولة لتوفير كمية مياه الري وتحسين كفاءة استخدام المياه BISتغييرجدول الرى عن طريق إستخدام نموذج
كان قادرا على التنبؤ بمحصول القمح بدرجة عالية من الدقة لكال من إختبارى المعايرة CropSystأن نموذج النتائج
وأشارت النتائج أيضا إلى أنه بوجه عام ان محصول صنفى القمح سوف يتأثر بالتغير فى . والتحقق من صحة التنبؤ
وان اقل نقص فى المحصول تم التنبؤ به فى سنة . 29خا مقارنة بس 23المناخ، ولكن األنخفاض كان أقل بالنسبة لسخا
كما أظهرت . 2100فى سنة A2 أما اكبر نقص فى المحصول تم التنبؤ به تحت سيناريو. B2 سيناريوتحت 2090
٪ تحت الري مع 32و 22و 0النتائج ان إستخدام جدول الرى الجديد تحت ظروف تغير المناخ ادى الى توفير بنسبة
كما ان كفاءة استخدام المياه ارتفعت بعد استخدام جدول الرى الجديد . من البخر نتح على التوالي 1.2و 1.0و 0.2
من البخر نتح ، لكال 1.2و 1.0و 0.2تحت سيناريوهات تغير المناخ األربعة، مقارنة بقيمتها عند إستخدام كميات المياه
وعلى ذلك انه إذا كنا نريد الحد من . على كفاءة استخدام المياهأ 23الصنفين من القمح على حد سواء بينما أعطى سخا
نقص محصول القمح في ظل ظروف التغيرات المناخية وتوفير كميات كبيرة من مياه الري فاننا نوصى بزراعته الصنف
.لعمل جدولة للري BISمع استخدام نموذج 23سخا