COMBATING DUMPING OF USED VEHICLES - Centre for ...
132
CLUNKERED A ROADMAP FOR AFRICA AND SOUTH ASIA COMBATING DUMPING OF USED VEHICLES
-
Upload
khangminh22 -
Category
Documents
-
view
2 -
download
0
Transcript of COMBATING DUMPING OF USED VEHICLES - Centre for ...

CLUNKERED
A ROADMAP FOR AFRICA AND SOUTH ASIA
COMBATING DUMPING OF USED VEHICLES


Centre for Science and Environment
CLUNKERED
A ROADMAP FOR AFRICA AND SOUTH ASIA
COMBATING DUMPING OF USED VEHICLES
Writer: Anumita Roychowdhury
Research: Priyanka Chandola, Shambhavi Shukla and Vivek Chattopadhyaya
Editor: Archana Shankar
Cover and design: Ajit Bajaj
Production: Rakesh Shrivastava and Gundhar Das
© 2018 Centre for Science and Environment
This publication is not for sale. Material from this publication can be used, but with acknowledgement.
Maps in this report are indicative and not to scale.
Citation: Anumita Roychowdhury, 2018, Clunkered: Combating Dumping of Used Vehicles—A Roadmap for Africa
and South Asia, Centre for Science and Environment, New Delhi.
Published byCentre for Science and Environment41, Tughlakabad Institutional Area, New Delhi 110 062
Phones: 91-11-40616000
Fax: 91-11-29955879
E-mail: [email protected]
Website: www.cseindia.org
We are grateful to the Swedish International Development Cooperation Agency (SIDA) for institutional support.

3
SECTION 1: Why this study? 5
SECTION 2: Motorization riding high on used-vehicle import 20
SECTION 3: Polluted air and public-health imperatives 34
SECTION 4: Setting the terms for used-vehicle import 51
SECTION 5: Setting the terms for used-vehicle export 92
SECTION 6: Next steps and the global mechanism 106
Annexure 113
References 115
Contents


5
CLUNKERED
Global motorization is rapid and explosive. As many as 2 billion vehicle tailpipes spew noxious pollutants and heat-trapping gases across the world. But as newer vehicles are inflating the global rolling stock every year, huge numbers are also becoming old and obsolete. In 2013, about 40 million vehicles a year were estimated to be approaching their end-of-life, representing 4 per cent of total global automobile ownership that needed to be scrapped.1 The number of vehicles approaching their end-of-life will increase further as, according to the International Energy Agency, with growing economy and aspirations the global four-wheeler fleet is expected to double by 2050. Also, as the latent demand for cars is getting stimulated across the developing world, many old, used and close-to-being-scrapped vehicles are finding their way to low- and middle-income country markets, with serious public health consequences. Growing economy is also inflating the demand for freight and transport vehicles. Even in transitional economies, vehicles last longer than their economic life.
The concern around this continuous flow of discarded, old, used and cheap vehicles from high-income to low-income countries of Africa, Asia and Latin America remains neglected in the national and global strategies for air pollution control and climate mitigation. This is leading to an enormous pile-up of clunkers in importing markets that have very little wherewithal to address air pollution, climate and other environmental impacts. These countries are becoming scrap yards for old vehicles from advanced economies. While advanced economies have the capacity to deal with the accompanying problems of vehicles changing several hands within their domestic markets, poorer economies do not.
Low- and middle-income countries that do not have their own vehicle-manufacturing base and strong environmental safeguards are most vulnerable to the unregulated and uncontrolled import of used vehicles. But as the pressure is increasing to meet clean air standards as well as the Nationally Determined Contribution (INDC) commitments to reduce pollution and greenhouse gas emissions, developing countries are beginning to frame regulations to reduce vehicular emissions.2 However, constraints of poorer economies, low level of affordability of consumers, lure of cheap vehicles, lack of clean automotive fuels and weak emissions regulations have created conditions and incentives for the trade of used vehicles and uncontrolled dumping.
This study has therefore become necessary to understand the imperatives of both the importing as well as exporting countries to find the possible solutions based on shared responsibility. It is clear that only unilateral action in vehicle-importing countries will not provide the full range of solutions. Equally, effective steps are needed in exporting countries to stop very old, used and damaged vehicles from entering the international trade. This will have to be further supported by stronger national regulations complemented by multilateral dialogue and action.
This essentially demands moving away from the conventional linear economy of production and disposal to a well-governed global circular economy around the use and disposal of vehicles. The system, while extracting maximum value of the products during use, must also recover and regenerate products and materials at the end-of-service life. But this will have to be integrated with the global value chain and supply chain with clear sets of shared responsibilities.
SECTION 1: Why this study?

6
CLUNKERED
But this conversation is still weak. It is therefore important to explore the possibilities of integrating this agenda with the global multilateral platforms, free trade zones and other international forums and blocks.
To understand this better and inform the governments in importing countries of Africa and South Asia as well as to inform the global multilateral discussion on this matter, Centre for Science and Environment has carried out this comparative analysis of local imperatives and regulatory approaches to addressing used vehicle trade in Africa and South Asia that are most vulnerable to end-of-the-pipe trade.
This conversation within the global South has become important to enable learning from each other. While there is a common pattern in the different measures adopted with varying degrees of stringency—such as fixing the age for vehicle import, tax measures to make imports more expensive, linking emissions standards and requirement of electric mobility with import and improving their national emissions regulations—there are several local challenges and experiences that require deeper understanding.
Similarly, exporting countries that are tightening the noose around old and derelict vehicles within their domestic market through scrappage, end-of-life programmes and manufacturers’ responsibility need to share responsibility to ensure that their domestic policies do not lead to mindless environmental dumping of clunkers in the low-income countries and they also frame policies to prevent entry of old and damaged vehicles from entering the international market.
For this assessment, periodic round-table discussions have been organized with the concerned regulators and stakeholders from different countries of Africa and South Asia to review the issues, status, draw a roadmap and gain local insight in a participatory manner (see Annexure: CSE consultation on the issue of vehicle import). Research on this matter is limited. In Africa, United Nation Environment Programme’s (UNEP) Partnership for Clean Fuels and Vehicles has taken the lead to assess this problem. But the overall conversation on this matter in all vulnerable regions and among vehicle-exporting countries is still inadequate. This study hopes to inform and broaden the debate and deepen the action.
The key highlights of this study and findings are as follow.
How do clunkers flow? The direction of this trade typically flows from high-income countries to low-income countries, which have a higher demand for used and cheap vehicles. Cheaper cost, lower depreciation costs and richer variety of brands that are otherwise not available at affordable prices locally incite trade in used vehicles. Stronger emission-regulations for new as well as in-use vehicles in the high-income countries of Japan, US and Europe are responsible for higher turnover and renewal of their domestic fleet. This reduces the average age of vehicles in these countries and creates a huge stock of disposable used vehicles for trading. The direction of this intercontinental trade is largely towards Africa, Asia and several countries of Latin America.
Globally, it is not possible to estimate the actual quantum of used vehicle imports as data bases for used vehicles is not maintained separately. But studies exist to show that in countries of Africa 80–90 per cent of the imported vehicles are used and old vehicles. While most of the old and used cars are coming from the

7
CLUNKERED
US, Europe and Japan, the profile of the country of origin changes in the case of commercial vehicles and two-wheelers. Most commercial vehicles in Africa come from China, Japan and to some extent India, followed by other countries. Anecdotal evidence and information available from the national governments in Africa also suggest trucks and buses are comparatively of newer vintage than cars. Most two-wheelers are expected to be new vehicles and come largely from India and China. But within African countries there can be further trading of used vehicles.
South Asian market reflects another pattern where the trade flow is largely confined within the contiguous geographical region of Asia. India and Japan dominate this trade in South Asia. Thus, development in emissions regulations in the vehicle producing countries of Asia can have significant impact on upward harmonization of emissions regulations across the larger region.
Used vehicles can worsen public health risk: This discussion on used vehicle import has become important as air pollution and public health risk is increasing in South Asia and Africa. The 2016 database of the World Health Organization (WHO) on particulate pollution shows that South Asia is among the most polluted regions in the world. Other than the Maldives, all cities in this region have particulate levels that are significantly higher than the annual WHO PM10 guideline. The cities of Africa have also started to breach the WHO guidelines and in some cases by several times.
According to the newly released The State of Global Air 2018 by Boston-based Health Effect Institute, the highest concentrations of population-weighted annual average particulate matter in 2016 were in countries in North Africa. Non-communicable diseases affected by air pollution are rising. This is expected to get worse with ageing of population, underlying disease conditions and wide prevalence of poverty. Over the past 25 years, health burden in low- and middle-income countries has increased for those aged 50–69 years—increasing, for example, by 24 per cent in India, from 9.1 million to 11.3 million life years lost. In South Asia, in addition to India, Bangladesh and Pakistan are most vulnerable.
This makes emissions from old and polluting vehicles a serious concern. They are adding hugely to toxic exposure as vehicles emit close to the breathing zone of people. Available and limited studies in some cities of Africa and South Asia show that vehicles are among the key sources of exposure. As most of the importing countries do not have clean automotive fuels or improved vehicle emissions standards with robust emission-inspection systems, visible toxic emissions are very high. A quick review of the global emissions factors for different generations of vehicle technologies show that old vehicles with uncontrolled emissions can emit 16 times more particulate matter and more than vehicles meeting Euro IV emissions standards. This leads to an enormous lock-in of pollution in the accumulating fleet of old and used vehicles.
Increased climate risk: Even though the level of overall heat-trapping CO2 emissions in low- and middle-income countries is lower than the world average, vehicles are among the rapidly growing source. Old, ill-maintained and often malfunctioning vehicles that are getting dumped from the developed world become energy guzzlers and emit high amounts of heat-trapping gases. This cheap import also pushes the market towards bigger engines that undercut the fuel economy advantage of small vehicles that otherwise typically dominate several developing markets.

8
CLUNKERED
Most of these countries have made INDC commitments to reduce greenhouse gas emissions from the transport sector. But if the vulnerability to short-lived climate forcers like black carbon is considered, these regions are susceptible to rapidly rising diesel black carbon as well. This will get further aggravated by dumping of diesel vehicles that are being rapidly discarded from the advanced markets due to huge concerns around very high real-world emissions. Several countries in Europe have planned to phase out diesel cars. These discarded cars will eventually get dumped in the importing countries and add to the black carbon emissions. The International Panel on Climate Change (IPCC) has taken on board black carbon emissions as a short-lived climate forcer. The Working Group I contribution to the IPCC Fifth Assessment Report (AR5 WGI) has for the first time has included estimates of global warming potential of black carbon that is 900 times higher than CO2 in a comparable timeframe of 100 years. The Climate and Clean Air Coalition (CCAC) is addressing this problem by promoting soot-free buses in Africa and Bangladesh. But such initiatives can be undermined if the risk from dumping of old diesel vehicles is not addressed. Countries like Nigeria have succeeded in controlling dieselization by pricing diesel fuel higher than petrol. Similarly, Sri Lanka has implemented a deliberate import and taxation policy to discourage import of diesel cars and promote cleaner hybrids, electric and petrol cars. But other countries may not be able to resist dieselization.
Weak environmental safeguards increase vulnerability: It is becoming increasingly difficult for vehicle-importing countries to control inflow of very old vehicles as most countries have not adopted clean fuel and vehicle standards. Even though Africa has seen good progress over time—with about 11 countries, including Morocco, Mauritius, Kenya, Uganda, Tanzania, Rwanda, Burundi, Ghana, Mozambique, Malawi and Zimbabwe having adopted 50 ppm sulphur fuels and a few more in the pipeline—the large part of Africa still has fuel with sulphur levels up to 2,500–10,000 ppm sulphur. While Morocco is the first country in Africa to adopt ultra-low sulphur (10 ppm fuel), Mauritius and East African countries have similar plans.3 Without the fuel it is difficult to fix a lower age for vehicle import and fix emission standards at Euro IV levels for imported vehicles.
There are a few others who are poised to make the transition. Fuel quality is not uniform in South Asia. Ensuring uniform quality of fuel needs to be accelerated.
Even those who have fixed the age as well as introduced 50 ppm sulphur fuel, like Kenya, find it difficult to adopt commensurate Euro IV emission standards as availability of cheap and very old used vehicles undercuts such initiatives. Also, as is evident from the experience of several countries, there is a serious problem of inflow of very old vehicles through their porous borders. This therefore requires harmonized action across the African continent on age, fuel quality and emission standards.
Need for tighter regulations and checks on cheap imports have also become necessary in countries that are planning to build local manufacturing and assembly capacity. Countries like Nigeria that are deliberately developing the industrial policy to promote the automotive industry and assembly are more strident in imposing effectively high import taxes to lower import of vehicles and promote import of fully or semi-knocked-down kits for vehicle assembly in the country. This has created stronger incentives for regulating imports. The growing interest towards developing a local manufacture and assembly base

9
CLUNKERED
can deliver on its intended objective only if the new manufacturing is linked with at least Euro IV emission standards. This will also require appropriate fuel pricing to discourage dirtier fuels. Nigeria is a unique country that has priced petrol fuel much cheaper than diesel fuel, which has prevented dieselization of cars in Nigeria. It has also taken steps to ban import of polluting two-stroke engines. Such measures have helped avoid further increase in risks.
It is also not easy for most vehicle-importing countries to implement emissions-based imports as seen in the case of Mauritius, which was the first country in the region to implement the CO2 levy/rebate scheme in July 2011. In July 2016, this scheme was suspended because it became increasingly difficult to verify the documents that made dubious claims about CO2 emissions from old an used vehicles. As a result sale of used vehicles, despite their getting lower rebate, increased and exceeded new vehicle sale. The government started to lose revenue. It also became increasingly difficult to compare CO2 standards from the different countries of origin. This also led to litigation. Thus, this programme had to be suspended and replaced with a tax system linked to engine size. Clearly, greater sophistication in regulatory tools in importing countries is often constrained by regulatory and technical capacity. This will have to be complemented by development of simpler methods of verification and monitoring as well as global harmonization of standards across markets. Emissions-based taxation, which is an important step forward in developing countries, needs to be enabled with global harmonization of emissions standards, test procedures and labelling programmes.
There is now considerable talk in several countries such as Mauritius, Ethiopia and Nigeria in Africa and Sri Lanka, Bhutan, Nepal and Myanmar to leverage import policies to promote electric mobility, especially in the para-transit and two-wheeler segments. This is an important opportunity that needs to be enabled to leapfrog. This may need to be evaluated in the context of energy access.
Also, as the experience of different countries show, only fiscal measures to make old-vehicle import more expensive does not work effectively. Even after loading them with higher taxes they still remain cheaper than the newer vehicles. Fiscal strategy will have to be combined with additional measures of eliminating the old fleet from the import stream and linking with improved emission standards.
Countries in South Asia on the other hand show a different trajectory. Unlike Africa, the international vehicle trade is largely confined to a geographically contiguous region and market of Asia. The countries of South Asia are largely importing vehicles from vehicle-producing countries within Asia, including India, Japan and China. Local regulations are strong drivers within these countries. Nepal and Bhutan have completely banned used-vehicle imports while Sri Lanka and Bangladesh have restricted import to three and five years respectively. Nepal has mandated Euro III emissions standards for all imports and is planning to graduate to Euro IV emissions standards very soon. Sri Lanka has further implemented tax measures very effectively to encourage cleaner technologies of hybrids, petrol and electric vehicles and discourage the use of diesel cars. With this they have effectively changed the market.
India, which is a major vehicle-producing country in South Asian region, has already banned import of used vehicles that do not meet the local emissions standards to protect its own vehicle industry. It has introduced Euro IV fuel

10
CLUNKERED
quality and emissions standards nation-wide in 2017 and is scheduled to implement 10 ppm sulphur fuels and Euro VI emissions standards nation-wide in 2020. This along with new developments in China open up a big opportunity in South Asia to make a quick shift to tighter emission standards. Upward regional harmonization is therefore critical to address this issue.
Given the wide gamut of challenges, current action in importing countries has limited impacts. It is toughest for these countries, especially in the Africa region, to impose an outright ban on import of old vehicles as consumer interest in cheap vehicles is very strong and often politically sensitive. Most of these countries also require appropriate technical and administrative capacity to have a system for verification of imported vehicles based on emissions and safety status of vehicles as well as to establish manufacturers’ or dealers’ responsibility. Mauritius has done that to some extent. This therefore requires participation of exporting countries to address the problem together. Common criteria will have to established for deciding the economic life of used vehicles that can be allowed for trading during the transition phase towards a total ban. It also needs consumer and public awareness.
Need strategy for recycling scrapped vehicles in importing countries: In the current linear process of produce, use and dispose, end-of-the pipe junk vehicles are rapidly accumulating in low-income vehicle-importing countries. After their use is maximized, they are abandoned or informally recycled for the secondary spare-parts market. There is a considerable thriving trend in used spare parts.
Governments in Africa and most of South Asia have not even begun to quantify the amount of scrapping that will be required in the years to come. In India, which does not import used vehicles but uses its own old vehicles more intensely, it is estimated that in 2015 over 20 million accumulated vehicles required scrapping or recycling. This is an enormous amount that can overstress the informal recycling and scrapping facilities in the country and burden the environment if more formal policies do not evolve to create appropriate infrastructure.
Most vehicle-importing countries have not even evaluated the magnitude of end-of-life vehicles that they will have to dispose of. This is significant and must be accounted for in planning. But this will also require an understanding of what obsolescence is in a used-vehicle market. Illustratively, India—a vehicle-producing country but being a poorer economy it uses up most of the lifespan of vehicles within the domestic market, with a small number of used vehicle flowing out to the neighbouring countries—has estimated obsolescence of vehicles that require final disposal. Surveys to estimate obsolescence rates of vehicles have shown that two-wheelers are likely to get obsolete at 10 years, followed by cars at 15 years, three-wheelers at 15 years, commercial passenger vehicles at 12 years and commercial goods vehicles at 11 years.4 Thus, the lifespan of vehicles in developing country is much longer than in developed country.
Informal processing in South Asia and Africa is happening without any regulation and planning. As experienced in India, there is huge requirement of land for recycling and scrapping activities that most governments are not even planning for or cannot find. India has recently come up with a guidance document and is working on the scrappage and end-of-life regulations. This is a lesson for importing countries in Africa and South Asia. In Africa,

11
CLUNKERED
informal scrappage of vehicles and recycling of scrapped material has started. Currently, there is uncoordinated recycling of iron and steel, aluminium, and plastic components of ELVs in Nigeria, for instance.5 The informal waste collectors go to different mechanic workshops, collecting and buying disassembled and removed scrap components. They supply these scraps to the smelting companies. The materials in most cases are down cycled. But, as is also evident in South Asia, there is need for deliberate policy to first create incentives to ensure that adequate infrastructure has been created for scrapping and recycling. This also requires formal scrappage and end-of-life policies so that the requisite infrastructure can be created and formal financing is made available.
Also, as the vehicle-importing markets begin to improve their emission regulations and put harsher age caps on vehicle imports, better vehicle technologies will begin to penetrate these markets. As a result, the existing market in reuse of spare parts from the older vintage of vehicles will begin to get obsolete and will require the ultimate meltdown and recycling. As very old vintage vehicles cannot be passed on any further, they will need the final burial in these low-income countries.
Low- and middle-income importing countries will require support not only for infrastructure for end-of-life vehicles, but also to establish extended responsibilities of manufacturers and dealers to take care of the final disposal of the products as in developed world. But it has not been possible to figure out the mechanism for enabling this.
High-income importing countries are better prepared: It is a myth that only low- and middle-income countries import used vehicles. In fact, in rich countries like Australia and New Zealand, where vehicle manufacturing has not taken off for various local industrial and fiscal policies, vehicle-import dominates, including the import of used vehicles. But these countries have very tight age caps—as low as one year in Australia, with rigorous inspection and other requirements. These models can be referred to for the development of a protocol for the management of used-vehicle import.
Imperatives of exporting countries Strong environmental safeguards in high-income countries retiring more vehicles: Increasingly, much larger numbers of used vehicles are likely to retire early or get pushed out before their useful economic life is exhausted in advanced markets as environmental regulations get tougher. Consulting firm Ricardo-AEAT estimated, based on vehicle scrappage rates, in 2015 that in the European Union (EU), 94 per cent of the cars have a second life, 87 per cent have a third life and about 27 per cent have a fourth life. A fourth life, however, is not common because of the scrappage rate.6 A large number of older vehicles find their way to the international market. Experts have observed that international trade in used vehicles between high- and low-income countries work like ‘substitute for an explicit “cash for clunkers” programme’. It lessens the number of vehicles that need to be scrapped in exporting countries.7
Periodic and expensive vehicle-inspection tests, such as the Shaken programme in Japan, incentivize people to replace vehicles faster. High disposable income leads to quicker consumer decision to replace vehicles. Several programmes that discourage old and polluting vehicles in city centres, phase out older diesel vehicles, or provide economic stimulus package to replace old cars are creating

12
CLUNKERED
a large pool of used vehicles not wanted within the high-income countries and are thus crowding in low- and middle-income countries.
Typically, in all advanced markets, legislative framework is emerging to scrap old vehicles and recycle end-of-life (ELV) vehicles. Once a vehicle is identified as ELV, it is de-registered, that is required to be scrapped and undergo recycling through appropriate processes within the country. Currently, ELV recycling systems exist in EU, Japan, Korea, China and Taiwan. The European Union, Japan and Korea have also adopted the extended producer responsibility principle, designed to recover used-car parts, scrap metal, batteries, etc.
Export of used vehicles lowers/avoids scrappage costs in advanced markets: Used-vehicle trade has created a stronger incentive for not implementing several end-of-life regulations for older vehicles within the domestic market of high-income countries. It is more lucrative and cost effective to export used vehicles than scrap them.
It is often observed that exporting countries may find it to their advantage to export old and used vehicles as it might be more cost effective than scrapping within their domestic market. Also the cost benefits of scrappage programmes are often doubtful. Some studies have established that the cash for clunker programmes in the US have not resulted in any significant economic savings or environmental benefits. However, there is value in estimating the recovery of material from the clunkers that can improve resource efficiency of the overall economy.
Moreover, scrappage programmes need to be properly designed to legally ensure that vehicles identified for scrappage are fully destroyed. Otherwise, the programme can have unintended consequences of encouraging the grey market in used-vehicle import. Anecdotal reports and media reports point towards illegal shipment of scrapped vehicles to Africa and Eastern Europe from Germany and other EU countries. This is because the German programme on scrapped vehicles requires that scrapped vehicles be sent to junkyards but does not legally require to provide proof that the scrapped vehicles are fully destroyed. This encourages illegal exports. In contrast, in the US, the cash-for-clunkers scheme requires dealers to destroy old engines and the ways to do so are also specified.
To this is added a long supply chain of vehicle trans-shipment to re-export hubs in the Middle East and elsewhere, where vehicles are stripped off of the advanced emissions control systems coming from advanced markets. The information on this is very vague and therefore it is difficult to assess the status of emission-control systems in imported vehicles. This has no oversight programme and is extra-jurisdictional and difficult to monitor. Large numbers of vehicles that get damaged in accidents or have manufacturing defects and been recalled in advanced markets are also exported out. Even in South Asia, a grey market has evolved around the porous borders through which sizeable numbers of used vehicles find their way to Nepal and Bangladesh.
No criteria for screening vehicles for export As of now there are no clear and uniform criteria to classify grossly polluting and damaged vehicles based on age, mileage and vintage based on emission standards and remaining economic life of the vehicles that can be barred from export. It is important to make a distinction between old and polluting vehicles and used vehicles. As the 2017 UNEP assessment shows, advanced markets have high replacement rates and as a result substantial useful economic life

13
CLUNKERED
of vehicles remains—used vehicles are thus traded internally as well as are exported. There is, for example, a significant amount of trade in used vehicles within Europe and India.
It is not yet clear how the economic life of vehicles can be defined and fixed for the purpose of international trade. This is a relative concept associated with local income levels, usage patterns, and obsolescence rates linked to technical criteria of emissions and safety. In high-income countries, often vehicles are discarded much before the economic life is exhausted. For international trade therefore, uniform technical criteria are needed to define the minimum economic life that should be ensured before vehicles are allowed to be exported. If this is done along with improved fuel quality and emissions standards in importing countries, the benefits from younger recycled stock can be leveraged for better benefits. If exporting countries allow derelict and old vehicles to infiltrate markets, importing countries will find it harder to block them as consumer demands will sway towards cheaper vehicles and undercut all policy initiatives.
The way forwardCoordinated action based on shared responsibility is needed in vehicle importing as well as exporting countries to prevent dumping of clunkers in the poor world. The majority of the importing countries that are extending the life of vehicles much beyond their legally acceptable useful life are accumulating enormous clunkers. Countries will have to invest in huge capacities and preparedness to deal with the country’s post-consumer waste. If the scope for recycling and reuse is not done properly it can impose huge systemic costs on the economy and environment.
Action in vehicle-importing countriesNeed harmonized action on age caps, fiscal measures and other import criteria: When the capacity in most importing countries to technically assess the roadworthiness and emission performance of each imported vehicle is extremely weak, the most immediate and feasible strategy is to adopt an age cap to weed out extremely polluting, unsafe and uneconomical vehicles. A complete ban on used vehicles may not be possible in many importing countries immediately. But an age cap will allow use of a substantial part of the remaining useful economic life of the younger imported fleet while eliminating the highly polluting ones. But the ultimate objective should be to ban import of used vehicles. But well-established criteria will have to be adopted by exporting and importing countries to screen vehicles based on age, emissions and safety performance, history of accident, damage and recall.
So far only four countries in Africa and three countries in South Asia have succeeded in completely banning the import of used vehicles. As many as 25 countries in Africa and most in South Asia have imposed age restrictions. But age restriction is widely divergent—from three to 15 years. It needs to be harmonized to below three to five years. Divergent age caps create the scope of leakages through porous borders and re-export.
Moreover, the fiscal strategy of imposing higher tariff on older vehicles will have to be designed for effective reduction in import of old and polluting vehicles. It should not create perverse incentive for older vehicles over newer ones. Even after an ambitious hefty tax their price remains low compared to that of newer vehicles. Thus, eliminating very old vehicles from the market is critical to make fiscal measures work.

14
CLUNKERED
Countries will have to align their strategies. Harmonized action will help create bottom-up pressure on the international market and also plug leakages.
Harmonize emission standards and fuel quality at the minimum level of Euro IV with 50 ppm sulphur fuels: There is growing consensus among the regulators as well as multilateral agencies such as UNEP that for global trade in vehicles Euro IV equivalent should be minimum harmonized standards for both import and export. This by default eliminates all vehicles that are lesser than Euro IV from the export stream. It will also help to stabilize prices for the acceptable fleet in the international market and not undercut regulatory action in importing countries that are trying to establish an age cap as well as minimum emissions standards. Global exporters will have to follow the age cap and emission standards requirements for international trade and this will have to be multilaterally established for a harmonized approach. Importing countries cannot gain from regulatory restrictions on age to bring cleaner, younger and more fuel-efficient vehicles if fuel quality and emissions standards do not improve. Currently, the newer imported vehicles are stripped off the improved and advanced emissions control systems as requisite fuels are not available in most importing countries.
Eleven countries in Africa have adopted cleaner fuels (low sulphur 50 ppm). The countries include Morocco, Mauritius, Kenya, Uganda, Tanzania, Rwanda, Burundi, Ghana, Mozambique, Malawi and Zimbabwe. While Morocco is the first country in Africa to adopt ultra-low sulphur (10 ppm) fuel, Mauritius and East African countries have similar plans.7 There are a few others who are poised to make the transition. Fuel quality is also not uniform in South Asia. Ensuring uniform quality of fuel needs to be accelerated.
Several countries in Africa and South Asia are also developing their own manufacturing and assembly capacity. Some countries such as Nigeria and Sri Lanka have already begun to adopt a restrictive import policy in terms of higher import tariffs to stave off influx of cheap and old vehicles. But this will also require emissions and safety standards and quality control for domestic production. Domestic regulations can then become the basis of import as is the practice in India.
Fuel economy measures need to be combined with improvement in emissions standards and fuel quality: This is needed to prevent trade-off between fuel efficiency and higher emissions. This is particularly important now as several exporting countries are phasing out diesel cars to combat air pollution. These are all likely to find their way to importing countries that do not have clean diesel. Countries like Mauritius that had implemented CO2 emissions-based import without clean diesel and commensurate emission standards could have become vulnerable to a large influx of diesel vehicles. But this did not happen because of a very narrow gap between diesel and petrol prices, higher tax on bigger engines and consumer preference for petrol vehicles. But this may not be the case in other countries. The discarded diesel fleet will lock in toxic pollution and heat-trapping black carbon, and cause more illness in the developing world.
Implement inspection system for emissions, roadworthiness and safety in importing countries: Increasingly, several countries such as Uganda, Kenya, Nigeria, Sri Lanka and Bangladesh among others have begun to set-up vehicle inspection centres for on-road emission and roadworthiness tests. But this will

15
CLUNKERED
have to be organized at a different level—at the point of entry and subsequently periodically.
Need harmonized protocol for vehicle registration and verification systems: Regulation of import will require protocol for vehicle registration, and checking of authentic documents on emissions and safety status of vehicles to be obtained from dealers and sellers. It needs to record date of manufacturing, original emissions standards, export certification system, chassis details, fuel type, status of official emissions and safety inspection at the time of export, and other relevant detail based on a clear protocol. Centre for Science and Environment has reviewed the vehicle registration system in cities like Addis Ababa and Abuja and found that such details are not recorded.
The exporting countries will also have to maintain transparent and publicly available database on the emissions and safety and inspection status of vehicles. The entire dealership chain will have to be made accountable and responsible to follow the protocol. Importing countries may increasingly show interest in linking imports with emissions and fuel economy status of vehicles. Countries need explicit systems of oversight and monitoring as well as accountability of dealers. These systems should be developed further and replicated. Exporting countries have a role to play in addressing these challenges and creating transparent information for the supply chain.
Enable scrappage and end-of-life regulations and implementation in importing countries: Low- and middle-income countries will have to deal with the final disposal of the fleet as these vehicles cannot be reused or resold anywhere else. The costs of disposal and recycling rest on these countries and place enormous economic burden on them. Importing countries so far have not accounted for such costs. Moreover, the potential of recovering valuable material—an important part of a circular economy—remains underutilized.
This will have to be part of shared responsibilities. The importing companies as well as exporting governments through bilateral and multilateral arrangements need to create a mechanism to support scrapping and recycling in the low-income countries. This will require common set of criteria for the region to declare end-of-life of vehicles for recycling. Most countries in Africa and South Asia do not have adequate inspection system for road worthiness, emissions and safety. This often makes arbitrary cut off of age the decisive factor to scrap vehicles.
This sector will require legal support for end-of-life and dismantling and implementation procedure for de-registering a vehicle to qualify as an ELV and disposal. In India for instance, unless it is declared so, it cannot be traded as scrap according to the Motor Vehicles Act 1956 and successive amendments.8 This poses an obstacle to the few formal recyclers in the ELV industry. Governments will have to develop a legislative framework, recycling infrastructure upgrading existing value chains, incentive structures to salvage reusable ELV parts, and effective collection and channelization mechanisms that leverage the informal sector. Dealers need to be an important link between consumers and manufacturers or consumers and dismantlers.
The used-vehicle market has its own demand for appropriate spare parts for the makes and models being imported. Even this trade will have to be organized more efficiently to service the entire value chain spread across continents. This

16
CLUNKERED
is volatile as renewal of the on-road fleet makes older spare parts obsolete. Manufacturers and dealers will have to maintain a critical mass of service components and spare parts in these markets.
Need consumer information and incentive for informed choice: Consumers in importing countries of Africa largely depend on the internet for purchase decisions. For instance, according to UNEP in Nigeria, internet-based sales account for 90 per cent of total purchases.9 Several trade websites have mushroomed but are not certified by the governments. It is difficult to find websites that sell certified used vehicles or official websites that give out credible information status of certification, safety, road worthiness, emissions and fuel economy in exporting countries.
For informed consumer choices access to public available databases must be ensured. Advanced countries, for instance, have web-based consumer information systems for consumers. The US EPA’s Green Vehicle Guide provides detailed user-friendly information about green vehicles.10 Its ‘SmartWay vehicle’ or vehicle fuel economy labels provide information on fuel economy, fuel costs and environmental impacts. This includes information on energy impact score, GHG score, EPA smog rating and safety-related information like Crash Test Results etc. The US government’s National Motor Vehicle Title Information System (NMVTIS)11 is designed to protect consumers from fraud and unsafe vehicles and to keep stolen vehicles from being resold. The Federal Trade Commission’s (FTC) Used Car Rule requires dealers to display a Buyers Guide in every used car they offer for sale, and to give it to buyers after the sale.
Websites in Japan approved by the Japan government’s Ministry of Economy Trade and Industry—such as the Japan Used Motor Vehicle Exporters Association12—provide approved information from Japanese automakers. They provide details necessary to buy a vehicle, including emissions, fuel economy and safety as well as other details.
In Europe, the New Car Assessment Programme (NCAP) is a vehicle-safety rating system. This safety rating is determined from a series of vehicle tests, designed and carried out by Euro NCAP. These tests represent, in a simplified way, important real-life accident scenarios that could result in injured or killed car occupants or other road users.
The challenge is to find a global mechanism for integrating these databases to inform the global supply chain and further integrate such databases with the protocol of vehicle registration for export and import.
Promote shared responsibility of the exporting countries to filter out old and damaged vehicles from export: Action on used and old vehicle trade cannot be addressed only with unilateral measures in importing countries. The trade pressure from exporting countries can be intense and if these countries are not made accountable and responsible for the circular economy. As more and more importing countries begin to put barriers to trade in used vehicles, the export will also fall drastically. For instance, in the US, they found that countries that have preventive barriers to used vehicle imports were associated with 67 per cent fewer US exports to that country.13 Emissions in importing countries can be hugely avoided if these vehicles are scrapped rather than exported. The emissions caused by these vehicles are higher when they have had little maintenance and belong to larger engines and higher weight categories.14
17
CLUNKERED
Need stringent measures in exporting countries for verification of vehicles for safety, emissions and road worthiness: Currently there is little incentive in exporting countries to have foolproof and robust systems to intercept all end-of-life vehicles, vehicles with compromised safety and emissions performance or accident-affected vehicles to stop them from entering the international market. Strong exit rules are needed to verify, inspect, certify and codify in a transparent manner any vehicle before it is exported. That the vehicle and chassis identification number are not tampered with must be ensured. All end-of-life vehicles, damaged vehicles and vehicles with compromised emissions and safety features need to be barred from export.
There must be an online database for verification by the importing countries, dealers and consumers. It is important to establish through a multilateral process the essential documents that all exporters and importers will have to display during exit, entry and registration. Anecdotal reports suggest that during the entire process of transshipment, there is considerable stripping of vehicles in re-exporting zones in the Middle East and elsewhere to take out the advanced emissions-control systems that are not appropriate for the importing countries which do not have appropriate fuels. It is not known what happens to the safety gears in the vehicles. There is also no clarity on how this supply chain should be monitored. Monitoring the supply chain is needed to assess the status of safety gadgets in the vehicle. The dealer’s chain will have to be made accountable.
Need accountability and adaptation of Extended Producer Responsibility for global supply chain: How can the approach of establishing manufacturers’ and dealers’ responsibility and Extended Producer Responsibility (EPR) that makes the manufacturer or importer of vehicles responsible for the entire life cycle of the product work in vehicle-importing countries? The EPR strategy has been adopted by high-income countries where manufacturers are required to reduce the overall environmental footprint of their products by reducing the use of toxic and hazardous substances; by increasing the use of recycled constituents; and enhancing the ease of disassembly among others.15 The producers also have to provide for the take back, recycling and final disposal of the product, within the domestic economy.16
How can this idea be taken forward for the importing countries? Of course, this will have to be read with the rider that this should not work as extra jurisdictional reach of other governments and undermine sovereignty. But there has to be a global mechanism to identify the responsibility and participation of stakeholders including consumers, producers, recyclers, dealers, in the global supply chain. There is useful experience in Mauritius in the way they have established the procedure for warranty and guarantee with the suppliers as well as certification agencies in the country of origin. This will have to be resolved through intergovernmental consultation. The way producers are establishing collection and recycling facilities in their respective domains similar efforts will have to be made as part of shared responsibility in the importing countries.
Thus, governments through a bilateral and multilateral process, and manufacturers and dealers will have to support establishment systems for monitoring on-road performance and end-of-life and recycling facilities in importing countries.

18
CLUNKERED
Leveraging multilateral forums to govern international trade in used vehiclesMitigation of this problem through shared responsibility is important as for a considerable part of the life span of the vehicles produced in high income countries continue to emit in low income countries. There is no clear multilateral forum that has explicitly taken this issue on board. Even though there is global concern over ‘environmental dumping’ of high-polluting vehicles to the least well-off economies, there is no clear template to define and address the problem. The question and solution are still exploratory.
Leveraging trade forums: Literature hints at discussions on used vehicle import in the World Trade Organization (WTO). This is evident from the review carried out by the Global Fuel Economy Initiative in 2013 in the context of import of used vehicles to Mexico from the US.17 This has highlighted that though several countries have already put up import barriers to used vehicles without any significant opposition to such measures or attempt to block such measures in the WTO.
The grounds for discrimination against the importation of second-hand vehicles given particularly by Latin American countries have included safety and environmental concerns, and problems with valuation and protection against fraud and corruption. Colombia has cited Article XX (b) of GATT 1994, which allows general exceptions for countries to accomplish ‘non-economic’ objectives including the safety and health of human, plant and animal life. To justify domestic protectionist policies in WTO, Brazil has cited customs valuation concerns and the potential for fraud, and ‘negative impacts for the environment and public safety arising from the commercialization of used consumer goods in the domestic market’.18 Brazil has also pointed out that such policies were common to many WTO members and bans should not be considered as distorting trade.
India has fought used-vehicle import very hard during 2007–09 to protect its own industry and has its policy to ban such import and make it a legal requirement that all imported vehicles meet the current emissions standard in force in India.
However, as the experience of Mexico has shown, importing countries can come under pressure in free trade zones such as NAFTA where a unilateral decision to impose an age-based ban may become difficult. After signing NAFTA, Mexico had gone for a policy reversal in which 10–fifteen-year-old vehicles from US and Canada were allowed once again to the detriment of the environment. Thus, a roadmap for circular economy will have to be included in all trade negotiations.
Multilateral environmental forums: Multilateral environmental forums on climate change such as UNFCCC need to explore the possibility of facilitating dialogue and decisions on the framework that should govern used-vehicle trade. The Partnership for Clean Fuels and Vehicles (PCFV) of the UNEP is currently evaluating used-vehicle trade to chart the roadmap for action. It may be taken forward to influence multilateral strategies and national policies to set the terms of global trade. This trade has huge implications for climate impacts as old vehicles with highly inefficient engines and malfunction incite energy guzzling and lock in CO2 and black carbon. Moreover, cheap used vehicles allow the market to shift steadily towards bigger vehicles that undermines the inherent advantage of the small-car market of South Asia and Africa.

19
CLUNKERED
International cooperation: Yet another platform that needs to be explored and leveraged is the international forums and blocks of governments. Some international forums such the G8, G20 and BASIC have begun to place the sustainability agenda on the table as well as the importance of integrating the framework of the circular economy for the security of supply of resources and environmental sustainability.
The G20 for example is more explicit in its discussions. It has started the discussion on developing frameworks to enhance circular economy, sustainable production and consumption. Circular economy is now getting linked with the 2030 Agenda for Sustainable Development and the Paris Agreement. It is expected to bring more transparency across global supply chains and facilitate financing for establishing circular supply chains.19 A policy brief of the G20 group states that G20 governments should support transparency across global supply chains regarding the origins and content of circular products and materials by supporting development of standards and labels as part of ‘sharing economy’ or ‘collaborative economy’. It states that countries require agreed common framework of indicators to monitor the performance of countries and companies worldwide20 to respect resource-efficient principles. This requires knowledge sharing among countries to ensure circular trading in goods that are not hazardous.21 Multilateral platforms can develop a common framework of indicators to monitor the circular economy performance of companies worldwide and look at performance and life expectancy of products as the original ones.
Such discussions create the opportunity for including used vehicles in the trade and multilateral negotiations on circular and hazardous trade.
Involve manufacturers and dealers: Manufacturers and dealers are involved in global supply chains. These complex chains need transparency regarding the origin and content of circular products and materials and collaboration among different industries along the supply chains. Governments can support the development of labelling and declaration of content of products and materials and ensure resource-efficient supply chains. In Europe, companies such as Volvo, Toyota and Volkswagen as well as others have started to take the responsibility for the final disposal of their products. It will be worth exploring how manufacturers or their franchisee or dealers can replicate such systems globally.

20
CLUNKERED
Motorization in Africa Motorization in Africa is in its early stages of growth and the baseline stock is still much lower than that in rapidly growing developing countries. According to Deloitte’s 2016 Africa Automotive Insights report, there are 42.5 million vehicles in use in Africa in 2014. This has increased to 45 million as per International Organization of Motor Vehicle Manufacturers (OICA) 2015 data. South Africa has the highest share with 21.4 per cent, followed by Egypt with 12.8 per cent, Algeria with 12.4 per cent and Nigeria with 8.4 per cent (see Graph 1: Vehicles in use in Africa, 2015).
Graph 1: Vehicles in use in Africa, 2015
South Africa 21.4%
Egypt 12.8%
Algeria 12.4%
Nigeria 8.4%
Morocco 8.0%
Libya 6.1%
Congo Kinshasa 4.2%
Tunisia 3.2%
Kenya 3.1%
Ivory Coast 2.1%
Zimbabwe 2.1%
Angola 2.0%
Ghana 2.0%
Other African countries 12.2%
Source: Computed by Centre for Science and Environment from International Organization of Motor Vehicle Manufacturers
(OICA) 2015.
A 2014 World Bank estimate shows that the vehicle ownership rate in Africa is still much lower than the world average and that in high-income countries. In 2012, the only countries exceeding 50 cars per 1000 people included South Africa, Botswana, Mauritius and Namibia. According to OICA, vehicle ownership is expected to increase by 31 per cent.1 OICA, 2015 data shows increasing vehicle ownership in a few countries, including Libya, Mauritius, South Africa and Botswana (see Graph 2: Top ten African countries with total number of registered vehicles and Graph 3: Vehicles per thousand in different countries of Africa).2
Key urban centres are witnessing rapid increase. In Kenya, where nearly 30 per cent of all vehicles in the country are in its capital city Nairobi alone, the car fleet is estimated to double in just six years.3 In Lagos, Nigeria, it is estimated that if the ownership rates grow from 0.05 to 0.06 per capita in 2010–25, there will be an 80 per cent increase in vehicle numbers.4 In Ethiopia’s capital Addis Ababa, even if the base numbers are small the fleet has increased by 6.6 per cent in 2015 as compared to 2014.5
SECTION 2: Motorization riding high on used-vehicle import

21
CLUNKERED
Without its own well-established vehicle-manufacturing base, Africa has become hugely dependent on vehicle imports. South Africa has some manufacturing base while Nigeria and Ethiopia are setting up their assembly capacity.
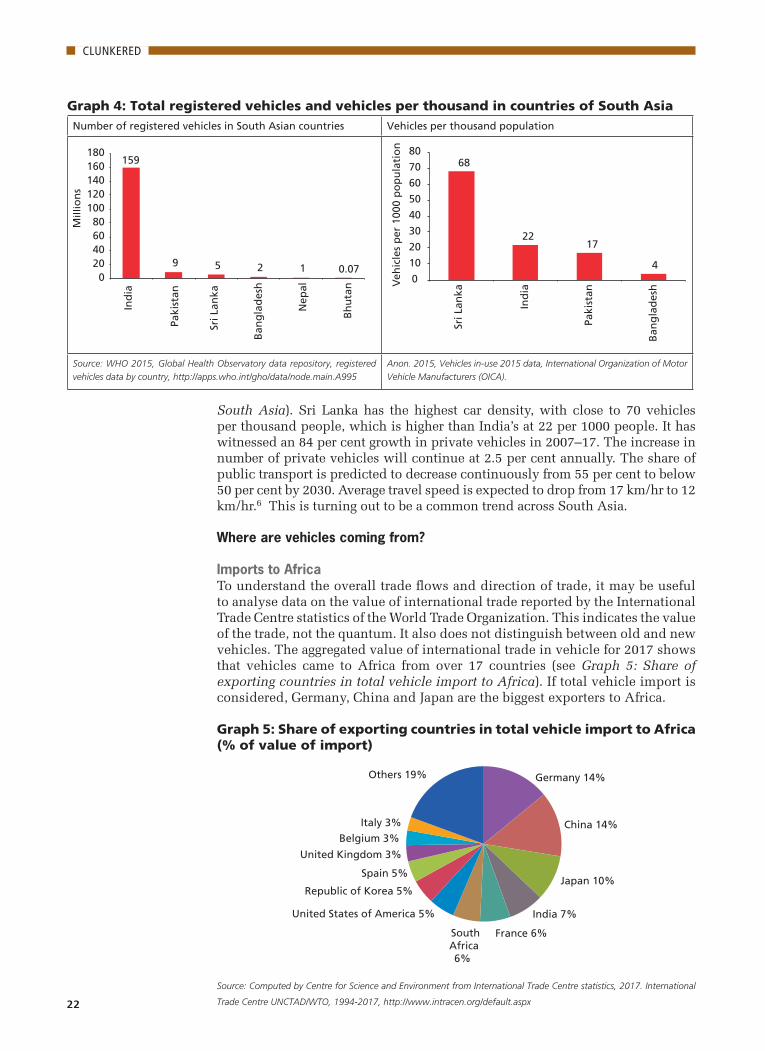
Motorization in South Asia South Asia is also motorizing rapidly. India is the largest and most populous country in South Asia; in terms of absolute numbers the total registered vehicles surpasses that in all other countries. But in relation to the respective population size, the vehicle density is already high in other countries of South Asia (see Graph 4: Total registered vehicles and vehicles per thousand in countries of
99,0
9,92
3
73,0
8,53
9
70,3
7,95
4
57,9
1,44
6
35,5
3,49
7
32,8
6,42
1
20,1
1,97
2
17,3
5,33
9
15,4
5,90
3
15,3
2,08
0
0
20,00,000
40,00,000
60,00,000
80,00,000
1,00,00,000
1,20,00,000
South Africa
Algeria Egypt Nigeria Libya Morocco Kenya Tunisia Burkina Faso
Ghana
1 2 3 4 5 6 7 8 9 10
Tota
l reg
iste
red
veh
icle
s (i
n n
um
ber
s)
Country rank
Graph 2: Top ten African countries with total number of registered vehicles
Graph 3: Vehicles per thousand in different countries of Africa
Source: WHO, 2013
Source: Anon. 2015, Vehicles in-use 2015 data, International Organization of Motor Vehicle Manufacturers (OICA).
436
186
176
173
140
129
104
63
60
44
41
35
32
30
27
27
25
23
23
21
16
15
14
14
13
12
10
8 7 6 3 2 0
50
100
150
200
250
300
350
400
450
500
Lib
ya
Mau
riti
us
Sou
th A
fric
a
Bo
tsw
ana
Alg
eria
Tun
isia
Mo
rocc
o
Egyp
t
Zim
bab
we
Sen
egal
Ivo
ry C
oas
t
An
go
la
Gh
ana
Ken
ya
Mas
agas
car
Tog
o
Co
ng
o K
insh
asa
Ben
in
Zam
bia
Nig
eria
Bu
rkin
a Fa
so
Cam
ero
on
Lib
eria
Mo
zam
biq
ue
Ug
and
a
Mal
i
Mau
rita
nia
Mal
awi
Tan
zan
ia
Bu
run
di
Sud
an
Eth
iop
ia
Veh
icle
s p
er 1
000
po
pu
lati
on
22
CLUNKERED
South Asia). Sri Lanka has the highest car density, with close to 70 vehicles per thousand people, which is higher than India’s at 22 per 1000 people. It has witnessed an 84 per cent growth in private vehicles in 2007–17. The increase in number of private vehicles will continue at 2.5 per cent annually. The share of public transport is predicted to decrease continuously from 55 per cent to below 50 per cent by 2030. Average travel speed is expected to drop from 17 km/hr to 12 km/hr.6 This is turning out to be a common trend across South Asia.
Where are vehicles coming from?
Imports to AfricaTo understand the overall trade flows and direction of trade, it may be useful to analyse data on the value of international trade reported by the International Trade Centre statistics of the World Trade Organization. This indicates the value of the trade, not the quantum. It also does not distinguish between old and new vehicles. The aggregated value of international trade in vehicle for 2017 shows that vehicles came to Africa from over 17 countries (see Graph 5: Share of exporting countries in total vehicle import to Africa). If total vehicle import is considered, Germany, China and Japan are the biggest exporters to Africa.
Graph 5: Share of exporting countries in total vehicle import to Africa (% of value of import)
Germany 14%
China 14%
Japan 10%
India 7%
France 6% SouthAfrica 6%
United States of America 5%
Republic of Korea 5%
Spain 5%
United Kingdom 3%
Belgium 3% Italy 3%
Others 19%
Source: Computed by Centre for Science and Environment from International Trade Centre statistics, 2017. International
Trade Centre UNCTAD/WTO, 1994-2017, http://www.intracen.org/default.aspx
Graph 4: Total registered vehicles and vehicles per thousand in countries of South Asia Number of registered vehicles in South Asian countries Vehicles per thousand population
159
9 5 2 1 0.07 0
20 40 60 80
100 120 140 160 180
Ind
ia
Paki
stan
Sri L
anka
Ban
gla
des
h
Nep
al
Bh
uta
n
Mill
ion
s
68
22 17
4 0
10
20
30
40
50
60
70
80
Sri L
anka
Ind
ia
Paki
stan
Ban
gla
des
hVeh
icle
s p
er 1
000
po
pu
lati
on
Source: WHO 2015, Global Health Observatory data repository, registered
vehicles data by country, http://apps.who.int/gho/data/node.main.A995
Anon. 2015, Vehicles in-use 2015 data, International Organization of Motor
Vehicle Manufacturers (OICA).

23
CLUNKERED
Direction of trade changes depending on the vehicle segments as well (see Graph 6: Share of exporting countries in vehicle segment-wise import to Africa).7 The maximum cars come from Germany, Japan, India, Korea and the US (see first graph in Graph 6). While most of the cars come from the high-income countries, the share of China and India increases in import of commercial vehicles and two-wheelers. Most motorized two-wheeled vehicles are from China (62 per cent) and India (26 per cent). Japan, South Africa and China dominate import of goods vehicles in the region. In the public-transport segment, the highest share is that of Japan at 33 per cent, followed by China at 25 per cent and India at 14 per cent. Public-transport vehicles are those that can accommodate over 10 people. Smaller ones are popular largely as para-transit vehicles in the informal sector that meet considerable travel demand.
Graph 6: Share of exporting countries in vehicle segment-wise import to Africa (% of value of import)
Car imports in Africa in 2017 (% of value of import) Two-wheeler imports in Africa in 2017 (% of value of import)
Germany 19%
Japan 13%
India 9%
Republic of Korea 8% United States of
America 8%
France 7% Spain 5%
United Kingdom 5%
Belgium 4% Czech Republic 3%
Turkey 3% South Africa 3%
Others 13%
China 62%
India 26%
Japan 3% Germany 2%
Austria 1% Other 6%
Goods-vehicle imports to Africa in 2017 (% of value of import)
Public-transport vehicle imports to Africa in 2017 (% of import)
South Africa 16%
China 15%
Japan 14%
Germany 10% Thailand 6%
Belgium 5%
India 4% Italy 4%
United Kingdom 3% Spain 3%
Italy 2%
United States of America 1%
Others 17%
Japan 33%
China 25% India 14%
South Africa 5%
Republic of Korea 4%
Egypt 3% Germany 3%
Turkey 3% Brazil 2%
United States of America 2%
Others 6%
Source: Computed by Centre for Science and Environment from International Trade Centre statistics, 2017. International Trade Centre UNCTAD/WTO,
1994-2017, http://www.intracen.org/default.aspx

24
CLUNKERED
Imports to South AsiaVehicle-importing countries of South Asia show a very distinct trend from Africa. It is dominated by vehicle flow within contiguous regions (see Graph 7: Where are the vehicles are coming from in South Asian countries?).
If total vehicle imports in five importing countries in South Asia are considered (Bhutan, Bangladesh, Nepal, Pakistan and Sri Lanka), the biggest exporters are vehicle-producing countries in Asia at closer geographical proximity, which includes India, Japan and China. This region does not attract long-distance intercontinental trade in vehicles. In Bhutan and Nepal, import is predominantly from India—71 per cent of the value of import in Bhutan and 90
Graph 7: Where are the vehicles are coming from in South Asian countries?Total vehicle imports in Bhutan in 2012 (% of value of import) Total vehicle imports in Bangladesh in 2015 (% of value of
import)
India 71%
Japan 10%
Thailand 8%
Republic of Korea 8% Others 3%
India 45%
Japan 33%
China 11%
Thailand 2%
Singapore 1% Others 8%
Total vehicle imports in Sri Lanka in 2016 (% of value of import) Total vehicle imports in Nepal in 2015 (% of value of import)
India 42%
Japan 39%
China 8%
Germany 3%
Thailand 2% Others 6%
India 90%
Japan 3% China 3%
Thailand 2% Others 2%
Total vehicle imports in Pakistan in 2016 (% of value of import)
Japan 50%
China 19%
Thailand 17%
Indonesia 3%
Germany 2% Singapore 2% Others 7%
Source: Computed by Centre for Science and Environment from
International Trade Centre statistics. International Trade Centre UNCTAD/
WTO, 1994-2017, http://www.intracen.org/default.aspx

25
CLUNKERED
per cent in Nepal. In Bangladesh and Sri Lanka, India’s share in import is about 45 to 42 per cent respectively. In Bangladesh, the share of Japan is significant at 33 per cent and in Sri Lanka 39 per cent. In Pakistan, on the other hand, half of import value is from Japan, followed by China at 19 per cent and Thailand at 17 per cent. The rest of the share in South Asia is shared by Thailand, Korea, Singapore and Indonesia. A minuscule amount comes from Germany.
Among these five countries, there is further variation in the relative share of countries of origin depending on vehicle segments (see Graph 8: Share of exporting countries in segment-wise import of vehicles to South Asia).
In Bhutan, for which the latest available data is for 2012, cars are seen to come from a much wider spectrum of countries than other countries. About 46 per cent of cars come from India, followed by 21 per cent from Japan and 16 per cent each from Korea and Thailand. But in the case of two-wheelers, 91 per cent are from India. However, 54 per cent of public-transport vehicles are from China and 39 per cent from India. But 100 per cent of goods vehicles are from India. Similarly, import from India dominates vehicle import into Nepal. In 2015, 82 per cent of cars, 97 per cent of two-wheelers, 91 per cent of goods
Graph 8: Share of exporting countries in segment-wise import of vehicles to South Asia
i. Bhutan in 2012Segment-wise import of vehicles in Bhutan in 2012
Car imports in Bhutan (2012) (% of value of import) Two-wheeler imports in Bhutan in 2012 (% of value of import)
India 46%
Japan 21%
Republic of Korea 16%
Thailand 16% Others 1%
India 91%
China 4%
Others 5%
Goods-vehicle imports to Bhutan in 2012 (% of value of import)
Public-transport-vehicle imports to Bhutan in 2012 (% of import)
India 100% China 54%
India 39%
Japan 7%
Source: Computed by Centre for Science and Environment from International Trade Centre statistics, 2012.

26
CLUNKERED
ii. Bangladesh (2015)Car imports in Bangladesh in 2015 (% of value of import) Two-wheeler imports in Bangladesh in 2015 (% of value of
import)
Japan 72%
India 18%
Thailand 3% United Kingdom 2%
Germany 1% Others 4%
India 95%
Others 5%
Goods-vehicle imports to Bangladesh in 2015 (% of value of import)
Public-transport-vehicle imports to Bangladesh in 2015 (% of import)
India 78%
Japan 8%
China 7%
Thailand 5% Others 2%
Japan 78%
India 12%
Others 10%
Source: Computed by Centre for Science and Environment from International
Trade Centre statistics, 2015.
iii. Sri Lanka (2016)Car imports in Sri Lanka in 2016 (% of value of import) Two-wheeler imports in Sri Lanka in 2016 (% of value of
import)
Japan 65%
India 21%
Germany 7%
United Kingdom 2%
Malaysia 1% Others 4%
India 97%
China 2% Malaysia 1%

27
CLUNKERED
Goods-vehicle imports to Sri Lanka in 2016 (% of value of import)
Public-transport vehicle imports to Sri Lanka in 2016 (% of import)
India 56% Japan 27%
Thailand 9%
China 6% Others 2%
Japan 57% India 26%
China 16%
Others 1%
Source: Computed by Centre for Science and Environment from International Trade Centre statistics, 2016.
iv. Nepal (2015)Car imports in Nepal in 2015 (% of value of import) Two-wheeler imports Nepal in 2015 (% of value of import)
India 82%
Japan 8%
Sudan 2%
Republic of Korea 2% Others 6%
India 97%
China 2% Others 1%
Goods-vehicle imports to Nepal in 2015 (% of value of import) Public-transport-vehicle imports to Nepal in 2015 (% of import)
India 91%
Thailand 9%
India 66%
Japan 33%
Others 1%
Source: Computed by Centre for Science and Environment from International Trade Centre statistics, 2015.
28
CLUNKERED
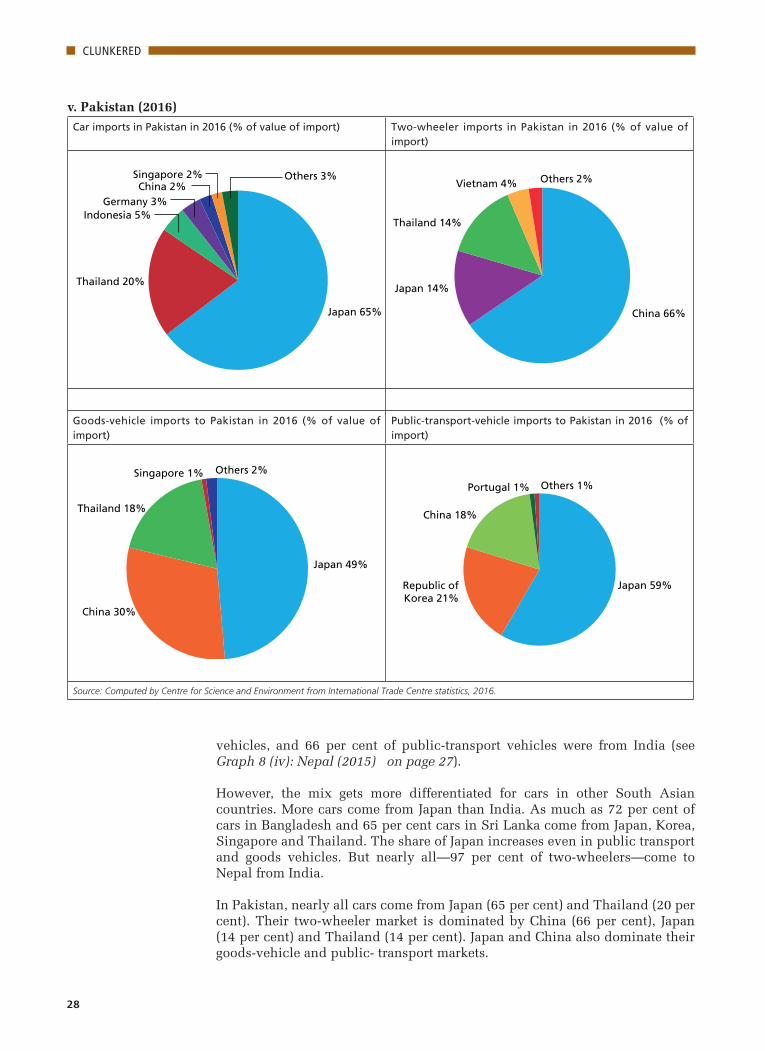
v. Pakistan (2016)Car imports in Pakistan in 2016 (% of value of import) Two-wheeler imports in Pakistan in 2016 (% of value of
import)
Japan 65%
Thailand 20%
Indonesia 5% Germany 3%
China 2% Singapore 2% Others 3%
China 66%
Japan 14%
Thailand 14%
Vietnam 4% Others 2%
Goods-vehicle imports to Pakistan in 2016 (% of value of import)
Public-transport-vehicle imports to Pakistan in 2016 (% of import)
Japan 49%
China 30%
Thailand 18%
Singapore 1% Others 2%
Japan 59% Republic of Korea 21%
China 18%
Portugal 1% Others 1%
Source: Computed by Centre for Science and Environment from International Trade Centre statistics, 2016.
vehicles, and 66 per cent of public-transport vehicles were from India (see Graph 8 (iv): Nepal (2015) on page 27).
However, the mix gets more differentiated for cars in other South Asian countries. More cars come from Japan than India. As much as 72 per cent of cars in Bangladesh and 65 per cent cars in Sri Lanka come from Japan, Korea, Singapore and Thailand. The share of Japan increases even in public transport and goods vehicles. But nearly all—97 per cent of two-wheelers—come to Nepal from India.
In Pakistan, nearly all cars come from Japan (65 per cent) and Thailand (20 per cent). Their two-wheeler market is dominated by China (66 per cent), Japan (14 per cent) and Thailand (14 per cent). Japan and China also dominate their goods-vehicle and public- transport markets.
29
CLUNKERED
Thus, the share of intercontinental trade is very limited in this region. Only Germany has a small foothold in car market of Bangladesh. This is different from the experience of Africa, which is a nodal point of intercontinental trade.
As the trade is much more contained and originates largely in a small number of countries in Asia, including Japan, India and China, harmonization of emissions and fuel-quality standards across the region can help the entire region to leapfrog quickly. Japan is already the frontrunner. China has graduated to Euro V emissions and is poised to phase in Euro VI soon. India, which has already moved to Euro IV vehicle emissions nation-wide in 2017, is now poised to go directly to Euro VI emission standards in 2020. This means Euro VI-compliant fuel and vehicles will be available more widely in the region. This is an opportunity for vehicle-importing countries to harmonize their standards and imports with the improved standards.
Trade in used vehiclesCurrent databases on international trade in vehicles do not differentiate between new and used vehicle streams. Estimates of international trade in used-vehicle trade are not easy to come by. Information is fragmented and scattered and discontinuous and is largely available from expert studies, consultant reports and limited official databases. This makes assessment of direction, composition and quantum of trade difficult. Often data from different sources are not comparable. Yet the jigsaw of this data gives fair idea about what is going on. Broadly, there are several layers in the used-vehicle trade, including: i) Domestic market within a countryii) Trade within countries of contiguous geographies, and iii) Intercontinental trade.
The first layer is domestic trade within the national boundary of individual countries. This is common and widespread. Vehicles change several hands in domestic markets. It has been estimated in Ricardo-AEAT, 2015 that in the EU, for instance, as much as 94 per cent of the cars have a second life, 87 per cent have a third life and about 27 per cent have a fourth life. But fourth life is not common because of the higher scrappage rate of older vehicles.8 Even in high-income countries, income disparity creates demand for used vehicles within the domestic market. However, high-income countries normally have the requisite policies in place to address their emissions, fuel efficiency and safety aspects. However, a number of these older vehicles find their way into the international market.
The second layer is the trade in used vehicles of varying age and vintage within the geographies that are largely contiguous to major vehicle-producing countries. This is, for instance, evident in the EU. The United Nations Environment Programme (UNEP) has reported that about 60 per cent of EU trade in used cars is towards other EU countries. Germany and Spain are significant exporters to Eastern Europe and Caucasus, while also sending out a large fleet to other continents of Central Asia and Africa.9 A significant number of vehicles from the US flow to its immediate neighbour Mexico. A similar trade pattern is also evident in South Asia.
The third layer is largely intercontinental trade in used vehicles that predictably flows from high-income countries of the US, EU, Japan and South Korea to low-income vehicle-importing countries in Africa, Asia and Latin America. According to the 2016 working paper ID-044 of the Office of Industries of the United States International Trade Commission, the top five passenger-vehicle-

30
CLUNKERED
exporting countries are Canada, Japan, Korea, Mexico and the United States. Used vehicles travel widely as is evident from data from the Japan Export Vehicle Inspection Centre that identifies the top ten destinations across Asia, Africa and Latin America, as reported by UNEP.10
Not only is trade in used vehicles on the rise—it was valued at over US $17.6 billion in 2014—it is also a substantial part of the export earnings of vehicle-exporting countries. In Japan, used-vehicle export in 2014 was 7 per cent of vehicle exports by value. The quantum of this trade is significant.11 Used-vehicle exports from North America largely originate from the US and Canada; the US is the largest exporters of used vehicles that accounted for an estimated 14 per cent of total US vehicle exports by value in 2014.12 The value of used vehicle exports from these two countries is over US $10 billion annually.13 Exports of used passenger vehicles originating in Japan, Canada, the United States, Korea and Mexico in 2014 was estimated to be 6 per cent of the value of their total passenger vehicle exports that year.14 Thus, there is considerable economic stake in this trade in vehicle producing countries.
Map 1: Direction of trade from high-income countries to Africa
Source: Ariadne Baskin 2018, Africa Used Vehicle Report, Paper presented at the Africa Clean Mobility Week, Nairobi,
12–16 March 2018.
Table 1: Indicators for Ethiopia, Kenya and NigeriaIndicator (unit) Ethiopia Kenya Nigeria Year
Fleet size 587,400 1,300,000 3,590,000 2015
Sales of new vehicles (per annum) 18,000 19,523 26,400 2015
Commercial vehicles (% new sales) 16 86 29 2015
Passenger vehicles (% new sales) 84 14 71 2015
New vehicles (% new sales) 15 20 10 2015
Second-hand vehicles (% new sales) 85 80 90 2015
Motorization rate (per 1000 people) 2 28 20 2014
Source: Deloitte Africa Automotive Insights Report, 2016. https://www2.deloitte.com/content/dam/Deloitte/za/Documents/manufacturing/ZA_Deloitte-Africa-
automotive-insights-Ethiopia-Kenya-Nigeria-Apr16.pdf

31
CLUNKERED
That vehicle import is hugely dominated by used vehicle is evident from data from the Deloitte Africa Automotive Insights Report, 201615 for the major countries of Ethiopia, Kenya and Nigeria. The share of used vehicles is 80–90 per cent of the total imported fleet. In Kenya, the share of commercial vehicles in new sales is the highest at 86 per cent. But in Ethiopia and Nigeria, the share of passenger vehicles in new sales is as much as 84 per cent and 71 per cent respectively (see Table 1: Indicators for Ethiopia, Kenya and Nigeria).
Used vehicles in South Asia It is more difficult to assess the trade in used vehicles in South Asia. Anecdotal data from local officials and markets show that there is huge influx of used vehicles from Japan, Singapore etc. However, the experience of the two transition economies of China and India is expected to be different. Available information shows that there is no legal export of used vehicles from China.
In India, given the nature of the market with much lower income profile of vehicle users, vehicles are used more intensely and last longer in the used-vehicle market within the country. Some reconditioned and used vehicles may get traded as part of the grey market through its porous borders. But there does not seem to be any large-scale legal overseas trade in used vehicles. India also does not allow import of used vehicles. It has, however, a thriving market in recycled and reusable vehicle components and this trade is directed towards other South Asian countries and even to Africa to cater to the new fleet that has been exported.
Detailed data on the share of used vehicles in vehicle imports in South Asia is not available. As in Africa, used vehicles dominate the car market of South Asia. Japan, Thailand, Singapore, Korea and to some extent Germany dominate this market. Market information and anecdotal data from dealers and others also shows that there is a grey market in used vehicles through the porous borders.
How is used vehicle trade organized? This part of the supply chain, of international trade in used vehicles, is not well documented. Fragmented information shows that cars are imported through independent dealerships. Or Original Equipment Manufacturers (OEMs) such as Toyota and Hyundai sell their brands through designated dealers. One set of independent dealers brings these cars from OEM dealers in South Africa, Dubai, America etc. There is also a chain of dealers and sub-dealers. Sub-dealers source cars from OEM-appointed dealers but they handle a much smaller market share—about 10 per cent. But dealers also bring cars that are not supported by OEMs and thus create a grey market.
Countries are connected by both the sea route and inland route. For example, in addition to direct shipments to Nigeria, the Port of Cotonou in neighbouring Benin is a key transit point for second-hand vehicles destined for the Nigerian market. It is estimated that 85 per cent of Benin’s used-vehicle imports end up in Nigeria. There are anecdotal evidences on stripping yards in Japan and Europe where vehicles are stripped off of the emissions-control systems but it is not clear how are they refurbished for markets with lower environmental safeguards.
The formal trade in new vehicles is governed by the bilateral trade agreement. A review of some agreements between India and countries of Africa show vehicles are listed as a permissible item.

32
CLUNKERED
Used-vehicle import in high-income countriesIt is erroneous to think that used vehicles are imported only by low- and middle-income countries. In fact, high-income countries without a substantial vehicle-manufacturing industry of their own also import used vehicles. Australia and New Zealand are good example.
Australia had an automobile industry that is now closed. Even though it had the key players, including Ford, Toyota and now General Motors’ Holden, its automobile plants have been closing over the last several decades. It is said that the government has not come up with any favourable policy to protect automakers against the high Australian dollar, production costs and a shrinking domestic market. There are some small players, including Kenworth, a subsidiary of Paccar, and Iveco.16
As a result, vehicle import has become very important in the country. It has also led to the import of used vehicles. In 2018, the government further reformed the laws on car importation that are likely to have huge impacts. It has been reported that from 2018 onwards, private citizens can import brand-new cars and avoid tariffs on imported used cars and save over local dealers.17
This will open up the domestic markets of dozens of countries around the world to private Australian buyers. Private buyers can purchase and import cars from countries with comparable standards to Australia. It is reported that Japan and the UK have been approved.
The import rules say that cars must be no older than 12 months old, and must have no more than 500 km on the odometer. The price difference won’t be enough to justify importing cheaper cars, but just below Australia’s circa $64,000 Luxury Car Tax threshold (and beyond) there will be some bargains, with countries like the UK and Japan both selling identical cars at a significant discount to Australian dealers. There will be an ‘Australia tax’ on cars.18 Used cars will also become far easier to import with the amendment of the Customs Tariff Act 1995 to remove a $12,000 special duty that applies to used imports. That tariff apparently was applied consistently. Cars that are imported will have a specific plate affixed and their details added to a new register as well as the traditional blue-slip inspection and registration process.19
Similarly, New Zealand has become a major importer of used vehicles mainly because there is no car-manufacturing industry.20 It had assembling facilities based on import of completely knocked-down units. The government had also imposed high import duties on import of fully built cars, both new and second hand, to protect domestic assembly. However, New Zealand being a high-income country, its consumer demand was more aspirational and the high import duties led to a huge demand for better imported and branded cars than assembled cars. Imported cars here were more expensive that locally assembled ones.
Even for distributors, importing fully built cars is more convenient than assembling cars. During the 1980s and 1990s the government had relaxed import duties, which led to a massive import of second-hand cars from Japan. New Zealanders reportedly prefer Japanese cars over European models, either for cultural or technical reasons. Based only on import of vehicles New Zealand’s per capita ownership is 774 vehicles per 1,000 people, as opposed to 591 in Japan, where most of the cars come from.

33
CLUNKERED
However, New Zealand has also faced problems with import of second-hand vehicles as they also end up getting damaged vehicles or vehicles facing recalls in their home country. The New Zealand government has enforced verification, inspection and a system of database management to monitor imports. Also, end-of-life recyclers operate. Import regulations do not stop imports of second-hand vehicles but focus on quality benchmarks.
Important to set terms for this tradeIn low- and middle-income vehicle-importing countries of Africa and South Asia, motorization is riding high on used-vehicle imports. Incentives for old and used vehicles are strong for various reasons. Studies have shown that on average a vehicle’s price depreciates faster in a high-income country than in a low-income one. Used vehicles from a high-income country can be sold in low-income countries for higher price, indefinitely extending the lifetime of the imported fleet. Also, it is said that repairs in low-income countries tend to be cheaper because of the lower cost of labour there, holding down maintenance costs overall.21 The low income countries also get a wider choice of brands at cheaper prices.22 Thus, limited number of brands in domestic markets, price differentials and differing depreciation rates incite demand and trade in used vehicles. They also push up average age of vehicles in importing countries. High-income exporting countries with high motorization rates, vehicle stocks and high rate of vehicle replacement have become consistent and large suppliers of old vehicles.
But this trade needs regulation to ensure that very old, gross polluters and damaged and unsafe vehicles do not penetrate these markets and trade. It is argued that with proper regulation it is possible to source through international trade quality vehicles that are sometime better than what is locally produced. But importing countries are often not in a position to take advantage of advanced vehicles from exporting countries as they do not have requisite fuels.
On the other hand, exporting countries that have stronger regulations for vehicle inspection, extended manufacturer responsibility, scrappage and end-of-life of vehicles are not vigilant and do not have strong enough regulations for filtering export of used vehicles.
It is important to review the regulatory landscape in both exporting and importing countries as this trade has huge implications for local pollution, health risk and energy security.

34
CLUNKERED
A global conversation on import of used vehicles has become so important is because of the rate at which urban air pollution is growing across developing Asia and Africa. A vast majority of cities are caught in a toxic web as their air quality continues to worsen and fails to meet health-based standards. The capacity to monitor and assess the pollution problem remains weak and available data allows only a fragmented picture of the status of air quality in most of the cities. Some of the worst cases of air pollution are found in these cities.
The 2016 WHO database on particulate pollution shows that cities of Africa have already begun to breach the WHO guidelines and in many cases by several times. Cameroon, Nigeria, Uganda, Senegal, Egypt and Mauritius are among the worst affected by particulate matter less than 10 micron size (PM10) and particulate matter less than 2.5 micron size (PM2.5). Not a single city in the African continent has PM10 levels that have not breached the WHO annual guideline for PM10. In fact, PM10 levels have gone up to 30 times higher than the WHO annual PM10 guideline of 20 microgramme per cum (µg/m3) in Onitsha in Nigeria, 8.5 times the annual guideline in Uganda, and almost nine times the guideline in Egypt (see Graph 9: PM10 levels in cities of Africa).
SECTION 3: Polluted air and public-health imperatives
Graph 9: PM10 levels in cities of Africa
105 14
1
33 66
52
60 13
1
20
373
88
594
52
141
33
119
85
24
170
35
167
179
61
47
21 58
90
0
100
200
300
400
500
600
700
An
nu
al P
M10
co
nce
ntr
atio
n
in m
icro
gra
mm
e p
er c
um
Baf
ou
ssam
(C
amer
oo
n)
Bam
end
a (C
amer
oo
n)
Nai
rob
i (K
enya
)
Bu
chan
an (
Lib
eria
)
San
niq
uel
lie (
Lib
eria
)
An
tan
ariv
o (
Mad
agas
car)
Co
rom
and
el (
Mau
riti
us)
Mid
lan
ds
(Mau
riti
us)
Ab
a (N
iger
ia)
Ab
akal
iki (
Nig
eria
)
On
itsh
a (N
iger
ia)
Orl
u (
Nig
eria
)
Dak
ar (
Sen
egal
)
Erm
elo
(So
uth
Afr
ica)
Har
teb
eesp
oo
rt (
Sou
th A
fric
a)
Joh
ann
esb
urg
(So
uth
Afr
ica)
Mid
dle
bu
rg (
Sou
th A
fric
a)
Kam
pal
a (U
gan
da)
Mo
rog
oro
(Ta
nza
nia
)
Del
ta r
egio
n (
Egyp
t)
Gre
ater
Cai
ro (
Egyp
t)
Cas
abla
nca
(M
oro
cco
)
Mek
nes
(M
oro
cco
)
Safi
(M
oro
cco
)
Sou
sse
(Tu
nis
ia)
Tun
is (
Tun
isia
)
City (Country)
Source: WHO air quality database, 2016

35
CLUNKERED
Only two or three cities comply with the WHO annual PM2.5 guideline. The highest levels of PM2.5 are in cities in Cameroon (13.2 times the guideline), Uganda (10.4 times the guideline) and Egypt (7.6 times the guideline) (see Graph 10: PM2.5 levels in cities of Africa). It may however be noted that WHO’s new air-quality database released in May 2018 also mentions that air quality data in the Africa region is very weak and could be obtained only for eight out of 47 countries.1
Another area of concern is South Asia, among the most polluted in the world. Other than the Maldives, all the cities in this region, spread across different countries, have PM10 levels significantly higher than the annual WHO PM10 guideline. The highest levels are in the Indian capital Delhi, where levels are up to 11.5 times the annual WHO guideline, followed by Narayanganj in Bangladesh, where the levels are 9.6 times the guideline. Dhaka, Chittagong and Khulna in Bangladesh and Kathmandu in Nepal are also among the most polluted in the region (see Graph 11: PM10 levels in South Asia).
Similarly, none of the cities in the subcontinent that are tracked by the WHO meets the WHO annual guideline of PM2.5 concentration. Delhi has the highest levels of PM2.5 concentration, 12.2 times the WHO guideline, followed by Narayanganj in Bangladesh with levels 10.6 times the guideline (see Graph 12: PM2.5 levels in South Asia). In the database released by the WHO in 2018,
Graph 10: PM2.5 levels in cities of Africa
67
132
17
9 10
37
67
10
49
28
66
16
34
16
60
41
13
104
23
71 76
26
29
9
25
38
0
20
40
60
80
100
120
140 B
afo
uss
am (
Cam
ero
on
)
Bam
end
a (C
amer
oo
n)
Nai
rob
i (K
enya
)
Bu
chan
an (
Lib
eria
)
San
niq
uel
lie (
Lib
eria
)
An
tan
ariv
o (
Mad
agas
car)
Co
rom
and
el (
Mau
riti
us)
Mid
lan
ds
(Mau
riti
us)
Ab
a (N
iger
ia)
Ab
akal
iki (
Nig
eria
)
On
itsh
a (N
iger
ia)
Orl
u (
Nig
eria
)
Dak
ar (
Sen
egal
)
Erm
elo
(So
uth
Afr
ica)
Har
teb
eesp
oo
rt (
Sou
th A
fric
a)
Joh
ann
esb
urg
(So
uth
Afr
ica)
Mid
dle
bu
rg (
Sou
th A
fric
a)
Kam
pal
a (U
gan
da)
Mo
rog
oro
(Ta
nza
nia
)
Del
ta r
egio
n (
Egyp
t)
Gre
ater
Cai
ro (
Egyp
t)
Cas
abla
nca
(M
oro
cco
)
Mek
nes
(M
oro
cco
)
Safi
(M
oro
cco
)
Sou
sse
(Tu
nis
ia)
Tun
is (
Tun
isia
)
An
nu
al P
M2.
5 co
nce
ntr
atio
n
in m
icro
gra
mm
e p
er c
um
City (Country)
Source: WHO Air quality database, 2016
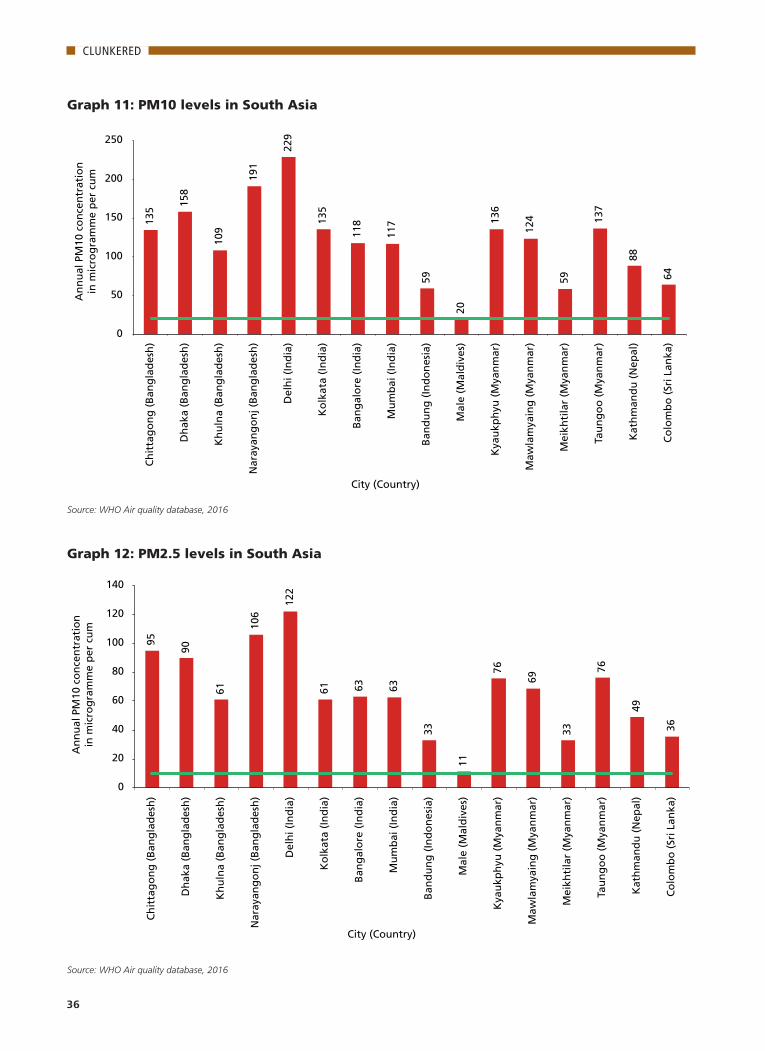
36
CLUNKERED
Graph 11: PM10 levels in South Asia
135
158
109
191
229
135
118
117
59
20
136
124
59
137
88
64
0
50
100
150
200
250 C
hit
tag
on
g (
Ban
gla
des
h)
Dh
aka
(Ban
gla
des
h)
Kh
uln
a (B
ang
lad
esh
)
Nar
ayan
go
nj (
Ban
gla
des
h)
Del
hi (
Ind
ia)
Ko
lkat
a (I
nd
ia)
Ban
gal
ore
(In
dia
)
Mu
mb
ai (
Ind
ia)
Ban
du
ng
(In
do
nes
ia)
Mal
e (M
ald
ives
)
Kya
ukp
hyu
(M
yan
mar
)
Maw
lam
yain
g (
Mya
nm
ar)
Mei
khti
lar
(Mya
nm
ar)
Tau
ng
oo
(M
yan
mar
)
Kat
hm
and
u (
Nep
al)
Co
lom
bo
(Sr
i Lan
ka)
An
nu
al P
M10
co
nce
ntr
atio
n
in m
icro
gra
mm
e p
er c
um
City (Country)
Source: WHO Air quality database, 2016
Graph 12: PM2.5 levels in South Asia
95
90
61
106
122
61
63
63
33
11
76
69
33
76
49
36
0
20
40
60
80
100
120
140
Ch
itta
go
ng
(B
ang
lad
esh
)
Dh
aka
(Ban
gla
des
h)
Kh
uln
a (B
ang
lad
esh
)
Nar
ayan
go
nj (
Ban
gla
des
h)
Del
hi (
Ind
ia)
Ko
lkat
a (I
nd
ia)
Ban
gal
ore
(In
dia
)
Mu
mb
ai (
Ind
ia)
Ban
du
ng
(In
do
nes
ia)
Mal
e (M
ald
ives
)
Kya
ukp
hyu
(M
yan
mar
)
Maw
lam
yain
g (
Mya
nm
ar)
Mei
khti
lar
(Mya
nm
ar)
Tau
ng
oo
(M
yan
mar
)
Kat
hm
and
u (
Nep
al)
Co
lom
bo
(Sr
i Lan
ka)
An
nu
al P
M10
co
nce
ntr
atio
n
in m
icro
gra
mm
e p
er c
um
City (Country)
Source: WHO Air quality database, 2016

37
CLUNKERED
expansion of air-quality monitoring in South Africa has brought several more South African cities to the forefront.
Public health challengeAccording to the newly released The State of Global Air 2018 by the Boston-based Health Effects Institute, the highest concentrations of population-weighted annual average particulate matter in 2016 were in countries of North Africa (e.g. Niger at 204 µg/m3 and Egypt at 126 µg/m3), West Africa (e.g. Cameroon at 140 µg/m3 and Nigeria at 122 µg/m3). However, longer-term trends suggest a decline in PM2.5 exposures in Nigeria over the last 26 years, with limited evidence pointing to general decline in mineral dust emissions and open burning. But Nigeria is still at the top of the chart in terms of population-weighted annual average PM2.5 (see Graph 13: Population-weighted annual average PM2.5—Global scenario).
The State of Global Air 2018 also found that long-term exposure to outdoor and indoor air pollution contributed to 6.1 million premature deaths from stroke, heart attack, lung cancer, and chronic lung disease and to a loss of 106 million life years worldwide in 2016. That makes air pollution the fourth highest cause of death among all health risks, after high blood pressure, diet and smoking. India and China together have the highest numbers of deaths due to particulate matter. These critical numbers of Global Burden of Disease (GBD analysis also
Graph 13: Population-weighted annual average PM2.5—Global scenario
Pop
ula
tio
n-w
eig
hte
d a
nn
ual
ave
rag
e PM
2.5
(µg
/m3 )
125
100
75
50
25
WHO interim target 1
WHO interim target 2
WHO interim target 3
WHO guideline value
2010 2011 2012 2013 2014 2015 2016
Nigeria
Bangladesh
India
Pakistan
China
Global
IndonesiaRussiaEuropean UnionJapan
Brazil
United States
Source: The State of Global Air, 2018, Health Effects Institute, US.

38
CLUNKERED
highlight the critical interplay between the trends in population structure, especially ageing of population, underlying disease, and economic factors, and air pollution levels in developing countries. Large-scale urban poverty further intensifies the effects.
The developing world of Africa and South Asia are in the grip of a double burden of disease. While the impact of communicable disease is still large, the burden of non-communicable diseases (NCDs) that are also largely affected by air pollution, are rising steadily. The African region reports one of the highest death rates from NCDs. Air pollution can exacerbate this. In Sub-Saharan Africa (SSA), NCDs are expected to surpass infectious diseases by 2030. NCDs are estimated to account for 24 per cent of all deaths in Nigeria.2 The incidence of cancer is increasing in all regions.
Adverse impacts of air pollution will be enhanced by the ageing of population. The elderly experience the greatest loss of healthy life-years due to NCDs that are affected by particulate matter. Among those 70 years or older, for example, PM2.5-attributable ischaemic heart disease alone accounted for 16.2 per cent of life-years lost in China, 17.8 per cent in India, and over 20 per cent in parts of SSA and North Africa and the Middle East in 2016. Over the past 25 years, this burden in low- and middle-income countries has increased for those aged 50–69 years. In India, for example, it has increased by 24 per cent, from 9.1 million to 11.3 million life-years lost. In the Indian subcontinent, in addition to India, Bangladesh and Pakistan are most vulnerable (see Graph 14: Number of deaths attributable to PM2.5 in 2016 in Africa and Asia).
New data from WHO, released in May 2018, shows that age standardized deaths
Graph 14: Number of deaths attributable to PM2.5 in 2016 in Africa and Asia
1034
420
1075
039
1086
87
4578
3
1245
77
6888
7
3734
2
6509
2106
1
1431
4
0
200000
400000
600000
800000
1000000
1200000
Ind
ia
Ch
ina
Ban
gla
des
h
Jap
an
Paki
stan
Nig
eria
Eth
iop
ia
Ken
ya
Sou
th A
fric
a
Tan
zan
ia
Nu
mb
er o
f d
eath
s
SOURCE: The State of Global Air, 2018, Health Effects Institute, US

39
CLUNKERED
per 100,000 people due to ambient air pollution is 78 in low- and middle-income countries of Africa—this is third globally, after the Southeast Asia region, which includes South Asia (90) and East Mediterranean at 85.
The UN Economic Commission of Africa has estimated that the cost of air pollution in a number of African cities can be as high as 2.7 per cent of GDP3 (see Graph 15: Healthy Life Years lost due to air pollution in Africa and Asia). In 2012 WHO estimated that there were 176,000 deaths per year in Africa due to outdoor air pollution and an estimated 600,000 deaths per year from indoor air pollution.4 Premature deaths in Africa are lower than the world average. But data is also a barrier. The University of Nairobi has estimated that the economic loss per year in Kenya of vehicle emissions is 115 billion KSh from illnesses and deaths.5 The World Bank’s The Little Green Data Book 2015 states that 94 per cent of population is exposed to PM2.5 exceeding WHO guidelines. The 2016 edition of the book The Little Green Data Book 2016 states that 100 per cent of the Nigerian population is exposed to PM2.5 levels exceeding WHO guidelines. Air pollution damage costs about 1.2 per cent of their Gross National Income.6
Vehicles pose a special challengeWhile the cities of Asia and Africa are extremely vulnerable to air pollution, especially to emissions from ageing and outdated vehicle technologies, the spotlight on health impact of vehicular pollution in Africa and South Asia is particularly important as this region is most vulnerable to import of old and used vehicles of the world.
Vehicles are among the most rapidly growing source of pollution across Asia and Africa and pose a very complex challenge. These are responsible for very
Graph 15: Healthy Life Years lost due to air pollution in Africa and Asia
2925.2
1469.2
2650.9
232.1
2906
2153.6 1940
803.5
1490.9 1409
0
500
1000
1500
2000
2500
3000
3500
Ind
ia
Ch
ina
Ban
gla
des
h
Jap
an
Paki
stan
Nig
eria
Eth
iop
ia
Ken
ya
Sou
th A
fric
a
Tan
zan
ia
Ag
e-st
and
ard
ized
DA
LYs/
100,
000
SOURCE: The State of Global Air, 2018, Health Effects Institute, US

40
CLUNKERED
high exposure as vehicular emissions take place in the breathing zone of people. People living or working in close proximity to heavily polluted roadway have very high level of exposure. Vehicles emit tiny and toxic particles and deadliest carcinogens. Studies show how traffic related air pollution is associated with increased risk of pre-term births,7 smaller brain size, low-birth weights8 among infants and increased risk of heart disease. In fact, a 2017 UNICEF report mentions that air pollutants inhaled during pregnancy can cross the placenta and affect the developing brain of a foetus, with potentially lifelong effects.9
Studies by the US-based non-profit Health Effects Institute show that in densely populated developing Asian cities, as much as 50 per cent of population lives or works near roadsides. The maximum effect of vehicular pollution is up to 500 metres from a roadside. There can therefore be tangible health benefits from reduction in vehicular emissions.
There is very little assessment of the health impact of vehicular pollution in cities of Africa and South Asia.
A limited study in 2005 by the Lagos Metropolitan Area Transport Authority confirmed that transport is the major cause of air pollution in the city. Another EIA study carried out by Mechelec Construction (Nigeria) in 1996 on behalf of the Lagos Urban Transport Project (LUTP) revealed that the road traffic is the major source of air pollution in the city.
An older study of the University of Lagos10 in 2002 examined the environmental implication of imported used vehicles. They analysed the data of 12 years (1988–2000) and found that the increasing number of used cars and their incomplete combustion are responsible for high level of carbon monoxide, nitrogen oxides, sulphur dioxide, benzpyrene, aldehydes, ketones, chlorinated organic compounds, ozonides and peroxides, and carbon compounds containing nitrogen such as peracetyl nitrides.
The carbon monoxide emission of used vehicles was much higher than that in new ones. The trend estimated showed the difference in different pollutants between used and new vehicles in Nigeria (see Graph 16: Estimated emissions from old and new vehicles in Nigeria in 1988–2000).
The Centre for Science and Environment estimated, on the basis of data provided
Graph 16: Estimated emissions from old and new vehicles in Nigeria in1988–2000
NOx (new)CO (new)
CO (used)
HC (new)
HC (used)
NOx (used)
Gra
ms
per
ave
rag
e m
ile
3,000,000
2,500,000
2,000,000
1,500,000
1,000,000
500,000
0
1988 1989 1990 1991 1992 1993 1994 1995 1996 1997 1998 19999 2000
Source: University of Lagos, Nigeria, 2002

41
CLUNKERED
by Addis Ababa Transport Authority, the trend in pollution load from Nthe increasing vehicle numbers in Ethiopia. Currently, the share of personal vehicles is comparatively lower. Heavy-duty vehicles dominate—they account for over half—both particulate and nitrogen oxide load from vehicles (freight and buses) that run on diesel. The share of personal vehicles though comparatively small is growing (see Graph 17: Trend in Particulate matter emission load from vehicles in Ethiopia and Graph 18: Nitrogen oxide load from vehicles in Ethiopia). The total pollution load from all vehicles has increased by 5.4 times in 2002–15.
Several cities in India have carried out studies on the impact of vehicular pollution, especially on the vulnerable groups like traffic policemen. In
Graph 17: Trend in particulate emission load from vehicles in Ethiopia (2002–15)
0
500
1,000
1,500
2,000
2,500
3,000
Bef
ore
200
2
2002
-03
2003
-04
2004
-05
2005
-06
2006
-07
2007
-08
2008
-09
2010
-11
2011
-12
2012
-13
2013
-14
2014
-15*
PM e
mis
sio
ns
in t
on
nes
Vehicle with machinery Liquid cargo Tractor Trailer Other Motorcycle Field vehicle Dual purpose vehicles Dry cargo (>=10 quintals) Dry cargo (<=10 quintals) Bus (> 11 seats) Bus (< 12 seats) Bajaj Automobles
Source: CSE estimation based on data provided by Addis Ababa Transport Authority
Graph 18: Trend in nitrogen oxide emission load from vehicles in Ethiopia (2002–15)
0 10,000 20,000 30,000 40,000 50,000 60,000 70,000
Bef
ore
200
2
2002
-03
2003
-04
2004
-05
2005
-06
2006
-07
2007
-08
2008
-09
2010
-11
2011
-12
2012
-13
2013
-14
2014
-15*
NO
x em
issi
on
s in
to
nn
es
Vehicle with machinery Liquid cargo Tractor
Trailer Other Motorcycle
Field vehicle Dual purpose vehicles Dry cargo (>=10 quintals)
Dry cargo (<=10 quintals) Bus (> 11 seats) Bus (< 12 seats)
Bajaj Automobles
Source: CSE estimation based on data provided by Addis Ababa Transport Authority
42
CLUNKERED
Sprinkling of local health studies in vehicle-importing countries
Very few local studies have been carried out on the health impact of air pollution in vehicle-importing countries of Africa and South Asia. But a sprinkling of studies, which are fairly old, provide some evidence at the early stages of growth. This is only expected to get worse with time and rising pollution.
Addis Ababa: Older studies in Addis Ababa show that of the top 20 leading causes of outpatient visit by region in all health centres and hospitals of Addis Ababa, acute respiratory infections is of prime concern. Cases of acute respiratory infection increased from 1,48,000 in 2006–07 to 2,07,000 in 2007–08. The primary cause is attributed to emissions from vehicles.1 Another study has identified more than 18 air pollutant elements in highly polluted area affected by traffic air pollution.2
Ghana: In Ghana, acute respiratory illness is among the top 10 causes of out-patient hospital visit.3
Nigeria: A Nigerian study by Delta State University on ambient particulate pollution and health impact in Nigerian cities (2001–06) has found significant prevalence of cough, catarrh, eye infection, asthma, chronic bronchitis etc. linked to traffic pollution.4
Colombo: Colombo, a coastal city with lot less pollution than most of Asia and Africa, has also reported health impacts. A 1999 study by the Faculty of Medicine, University of Colombo, found a significant association between ambient air pollution (SO2 and NOx) and acute childhood wheezing episodes in Colombo. Children experiencing wheezing (and requiring nebulization) were observed and found to be statistically significant.5 Children required more frequent medical visits and school absenteeism had become common. Senior citizens often experience difficulties in breathing, coughing and chest tightness. Another 2005 study found nearly 20 per cent of asthma cases that could be attributed to PM10. Studies attribute Rs 22–17 billion to health damage cost owing auto diesel emissions in Colombo. Diesel vehicles were responsible for 96 per cent of SO2 and 89 per cent of PM10 from the transportation sector.6
Kathmandu: A survey by Clean Energy Nepal and Environment and Public Health Organization in 2003 found patients with respiratory illnesses in emergency departments of major hospitals in Kathmandu increasing. Most patients are in the 51–75 age group. The Ministry of Environment, Science and Technology (MoEST) estimated in 2005 that the valley’s air pollution resulted in approximately 1,600 premature deaths per year. The Clean Energy Nepal further estimated that the total benefit of reducing valley’s PM10 levels to 50 μg/m3 would amount to US$1.86 billion per year.7 A study published in Atmospheric Pollution Research in 2009 found high density traffic areas and road intersections of the valley severely polluted by PM10 that can be considered as ‘hazardous’ in comparison with the MoPE’s benchmark of 425 μg/m3.8
A 2009 study by Stockholm Environment Institute found that the number of in-patients in three major hospitals in Kathmandu
Mumbai, on two high-density traffic areas, the incidence of cough, bronchitis and cardio-respiratory disorders were higher, cardiac toll had increased and cancer deaths had remained the same. Automobile exhaust added significantly to mortality and morbidity.11 In Kolkata, lung volumes and flow rates were significantly more affected among students in schools along roads than rural controlled group.12 Commuter exposure to VOCs especially BTX travelling in passenger cars (with and without catalytic converters) along two congested urban routes found that the mean in-vehicle benzene concentration was reduced to from 712 µg/m3 to 112.4 µg/m3 after the introduction of catalytic converters. The in-vehicle concentration varied with engine type and age of the vehicle.13 In Chennai, traffic police, bus drivers, and auto-shop workers were, significantly, associated with lower haemoglobin levels.14 In Hyderabad, traffic police was found to have increased oxidative stress, lung damage and respiratory problems.15 Studies also show significant increase in chromosomal aberrations among traffic police.16 In Amritsar, a study found increased chromosomal aberrations due to occupational exposure to polluted air and automobile exhausts.17 In Jaipur, a study on traffic policemen found reduced lung function due to traffic pollution.18

43
CLUNKERED
valley suffering from COPD had significantly increased between 1992 and 2003. Increase is highest during winter.9
Dhaka: According to a World Bank study, air pollution kills 15,000 Bangladeshis each year. Bangladesh could save $200 million–800 million per year, about 0.7–3 per cent of its gross national product, if air pollution in the country’s four major cities was reduced. Around 6.5 million people in those cities suffer each year. Vehicular air pollution is a major cause of respiratory distress in urban Bangladesh. According to the National Institute of Diseases of Chest and Hospital (NIDCH), nearly seven million people in Bangladesh suffer from asthma; more than half of them are children.10
A study by researchers from BUET (2010) assessed how the exposure in Dhaka’s air affects the pulmonary system of traffic police. Around two-thirds of the traffic police working for more than 10 years were found to be in a potentially alarming state and needed immediate treatment.11
Sources: 1. Alok Tiwari 2011, ‘Urban Air Pollution Caused by Automobiles in Addis Ababa, Ethiopia and its Health Consequences’,
The IUP Journal of Environmental Sciences, vol. V, no. 3, August. 2. Awoke Taddesse Hailu et al. 2013, ‘Investigation of Traffic air Pollution in Addis Ababa City around Selected Bus Stations
using Instrumental Neutron Activation Technique’, International Journal of Basic and Applied Science, Vol. 1, No. 3, January.
3. Isaac Adams et al. 2004, The Burden of Diseases, Bulletin of Health Information, Vol. 1, No. 1, October, p. 7.4. S. Efe 2008, ‘Spatial distribution of particulate air pollution in Nigerian cities: Implications for human health’, Journal of
Environmental Health Research, vol. 7, no. 2. 5. Senanayake et al. 1999.6. Sunil Chandrasiri 2006.7. Dieter Schwela 2009, ‘A Strategic Approach for Air Pollution Reduction in Kathmandu Valley’, Stockholm Environment
Institute, York. 8. Ahmad Kamruzzaman Majumder et al. 2012, ‘Assessment of occupational and ambient air quality of traffic police
personnel of the Kathmandu valley, Nepal; in view of atmospheric particulate matter concentrations (PM10), Atmospheric Pollution Research, Vol. 3. No. 1.
9. Dieter Schwela 2009, ‘A Strategic Approach for Air Pollution Reduction in Kathmandu Valley’, Stockholm Environment Institute, York.
10. Shakeel Ahmed Ibne Mahmood, 2011, Air pollution kills 15,000 Bangladeshis each year: The role of public administration and governments integrity, Journal of Public Administration and Policy Research Vol. 3(4), pp. 129-140, May 2011, http://www.academicjournals.org/article/article1380025870_Mahmood.pdf
11. Rahman Muhammad Ashiqur et al, 2010, Assessing the Impact of Exposure to Polluted Air on the Pulmonary Systems of Service Personnel Using a Peak Flow Meter, Dhaka, Australian Journal of Basic and Applied Sciences, 4(11): 5533-5549, http://www.ajbasweb.com/old/ajbas/2010/5533-5549.pdf
Special health concerns around emissions from older vehiclesThe import of cheaper used vehicles has implications for higher emissions and fuel consumption. Used-vehicle import also brings vehicles with compromised safety and emission features. Such granular studies are not available for African countries. But evaluation of the vehicle import trend and policy in Mexico city has thrown up insightful data (see Box: Evidence of high emissions from used-vehicle import in Mexico). This shows how older fleet increases the overall emissions.
The levels of pollution from older vehicles, especially those without or with damaged emission-control systems, are significantly higher than new vehicles meeting improved emission standards. Emission profiling of older used vehicles have not been carried out in any African country. To understand the difference, it is possible to compare the data set on emission factors. On-road vehicles meeting different emission norms are tested in labs to arrive at actual emission levels called emission factors that reflect the pollution level caused by the vehicle during on-road operation. Country-specific emission factors are generated from time to time. But these are few and far between in the developing world as such studies are resource intensive.

44
CLUNKERED
A cursory compilation and review of emission factors from international literature as well as expert bodies like the International Council on Clean Transportation (ICCT) however can indicate the emission benefit from replacing an older vehicle with a new vehicle meeting the Euro IV emission norm. Euro IV is a 13-year-old norm in Europe. Currently India and other developing countries are following this norm. Since in Africa the Euro IV norm is being proposed as a minimum harmonized requirement for both local production as well as vehicle import, it is possible to compare emissions factors of pre-Euro norm levels as well as other stages of Euro norms to indicate replacement benefits.
Many vehicles that are 25 years or more of age and were produced before emission norms were made mandatory (i.e. vehicles produced pre-Euro norms or before 1992) may still be in operation and are termed uncontrolled-emission vehicles. An uncontrolled-emission diesel light-duty vehicle replaced with a Euro IV (2005) car emits eight times less PM. Similarly, compared to a Euro I (introduced in 1993 in Europe) vehicle a Euro IV (2005) vehicle emits three times less and a Euro II (1996) vehicle emits two times less.
Currently, Euro VI norms are applicable in Europe. If a Euro I (1993) vehicle is replaced with a Euro VI vehicle, PM emissions reduce by 50 times; similarly a Euro II (1996) vehicle replaced with a Euro VI vehicle achieves a PM reduction of 42 times. This builds the case for an emission norm-linked vehicle-replacement policy and emphasizes the need to set an emission-norm roadmap in vehicle-importing countries.
The following information shows how replacing older vehicles with a new ones has the potential to clean up the fleet (see Graph 19: Comparison of particulate emission factors of Euro IV diesel light-duty vehicles with uncontrolled and lower level of standards and Graph 20: Comparison of particulate emission factors of Euro IV diesel heavy-duty vehicles with uncontrolled and lower level of standards).
Dieselization in Africa: An emerging threat Within the context of used-vehicle import, it is important to understand the state of dieselization in Africa. There are special concerns around the toxicity
Evidence of high emissions from used-vehicle import in Mexico
Studies carried out UC Berkeley and UCLA researchers1 have shown that after Mexico allowed import of ten–fifteen-year-old vehicles from the US and Canada under the free trade agreement in 2005–08, the average age of vehicles in the US was 8.8 years. But during the same period the average age of vehicles in Mexico was 11.4 years.
The traded vehicles emitted higher level of local pollutants than the vehicle stock in the US – the difference ranging from 4 per cent for carbon monoxide to 22 per cent for nitrogen oxide. The traded vehicles emitted more than the vehicle stock in the US but also less than the average Mexican vehicles. On an average, weight of traded vehicles has been found to be heavier. Average weight of vehicles that entered Mexico was 3708 pounds in contrast to average weight of 3516 pounds for the US vehicles. Emissions vary across columns by 20 to 30 per cent.2
Sources: 1. Lucas W. Davis and Mathew E. Kahn, 2011,’ Cash for Clunkers? The Environmental Impact of Mexico’s Demand for
Used Vehicles’, ACCESS.2. Ibid.

45
CLUNKERED
of diesel emissions. The International Agency for Research on Cancer (IARC) of the WHO has reclassified diesel exhaust as a Group 1 carcinogen. Diesel exhaust is now in the same class as deadly carcinogens such as asbestos, arsenic and tobacco for their strong link with lung cancer. Diesel vehicles also emit several times higher particulate matter and nitrogen oxides than petrol vehicles. Moreover, the new science has now implicated black carbon, the dark fraction of particulate matter, for enhancing climate impacts as well. Most of the diesel particulate core is the dark matter that absorbs light and heat and warms up the climate and fouls up our lungs.
High black-carbon emissions from the explosive increase in diesel vehicle
Graph 19: Comparison of particulate emission factors of Euro IV diesel light-duty vehicles with uncontrolled and lower level of standards
0.2403
0.0775 0.0643
0.0429 0.0310
0.0015 0.0015 0.0000
0.0500
0.1000
0.1500
0.2000
0.2500
0.3000
Uncontrol Euro 1 Euro 2 Euro 3 Euro 4 Euro 5 Euro 6
Die
sel L
igh
t d
uty
veh
icle
(PM
in g
m/ k
m)
Eight times higher than Euro IV standards
Thrice the Euro IV standard
Twice the Euro IV standard
1.4 times higher than Euro IV standard
Graph 20: Comparison of particulate emission factors of Euro IV diesel heavy-duty vehicles with uncontrolled and lower level of standards
0.7028
0.3734
0.1880 0.1841
0.0448 0.0445 0.0046
0.0000
0.1000
0.2000
0.3000
0.4000
0.5000
0.6000
0.7000
0.8000
Uncontrol Euro 1 Euro 2 Euro 3 Euro 4 Euro 5 Euro 6
Die
sel b
us
(PM
gm
/km
)
16 times higher than Euro IV standard
Eight times higher than Euro IV standard
Four times higher than Euro IV
About four times higher vs Euro IV
Source: Based on ICCT data

46
CLUNKERED
numbers, use of high- sulphur diesel, outdated vehicle technology and expansion in road-based freight traffic have added to the local health as well as global climate risks. Black carbon is also co-emitted with a range of other toxic and warming gases. This link between local and global impact of diesel particulate now changes the geo-politics around the diesel emissions mitigation as the policies and action on diesel transport varies widely across vehicle-producing and vehicle-importing nations in developed and developing countries.
As high-income counties are now more focused on phasing out diesel cars from city centres and are even planning a complete ban on diesel cars in future, there are additional concerns that a huge fleet of discarded diesel cars and SUVs from these countries will get dumped in Africa, adding hugely to their toxic risk.
Diesel consumption in the region is largely driven by the high share of commercial, freight and public transport that predominantly uses diesel and is not easily substitutable. The share of cars is still comparatively lower but due to price difference in favour of diesel the share of diesel cars is increasing in the region. The comparative share of diesel is very high in countries with a huge difference in prices. In several countries, including Angola, Madagascar and others, the share of diesel in total fuel consumption varies by 70–80 per cent. But countries with similar prices for diesel and petrol have lower consumption of diesel. For instance, in Botswana, Namibia, Lesotho etc., where the prices for petrol and diesel are the same or have very little difference, the share of diesel consumption is around 50–55 per cent. In fact, Nigeria is the best-practice country in terms of fuel pricing; the price of petrol is kept effectively cheaper than that of diesel. In 2016, while diesel prices were 61 US cents per litre, petrol prices were 43 cents per litre. This helped eliminate dieselization of cars and kept the share of diesel consumption substantially lower. The share of diesel consumption in total fuel consumption is only 16 per cent.19
Data from studies carried out by Demiss Alemu of the Addis Ababa Institute of Technology and the Federal Transport Authority in 2012 show that dieselization is pushing the light-duty vehicles market towards bigger engine size that increases diesel consumption and emissions.
Analysis of the data shows that the country has more petrol light-duty vehicles in smaller engine size ranging from less than 1,000 cc to 1,801 and 2000 cc (more in the 1001–1300 cc category) compared to diesel light-duty vehicles. Diesel light-duty vehicles are more in the bigger-engine size in the range 2001–2500 cc to over 2500 cc category. Ninety-five per cent of the diesel light-duty vehicles are in the 2,001–2500 cc and greater than 2500 cc category. In contrast, only 26 per cent of petrol light-duty vehicles are in bigger engine category (see Graph 21: Distribution of petrol and diesel light-duty vehicles by engine size in Ethiopia).
Further, there has been a steady increase in the share of diesel light-duty vehicles in the bigger engine size. The share in 2001–2,500 cc category has increased from 6.9 per cent in 2005 to 23.3 per cent in 2008 and 37.3 per cent in 2010. However, although light-duty vehicles in the greater than 2,500 cc category are still the highest among all the engine categories, they show a gradual decline over the years (see Graph 22: Change in share of light-duty vehicles in different engine categories over time [2005–10]).
Ethiopia, like other African countries, is dieselizing without clean diesel. This has serious implications for their air quality and public health.

47
CLUNKERED
Used vehicles and heat-trapping gasesThere are also serious concerns around the impact of motorization on energy security and heat-trapping gases. There is very little information available on the state of fuel economy of very old used vehicles. The literature sometime mentions that fuel efficiency of the vehicles may improve with age and usage. Some experts say that for a well-maintained vehicle, there could be little
Graph 21: Distribution of petrol and diesel light-duty vehicles by engine size in Ethiopia
17.4%
49.1%
4.5%
5.7%
0.7%
1.8%
0.2%
2.7%
37.3%
23.2%
57.3%
0%
10%
20%
30%
40%
50%
60%
70%
80%
90%
100%
Petrol Diesel
≤ 1000 cc 1001-1300 cc 1301-1800 cc 1801-2000 cc 2001-2500 cc ≥ 2500 cc
Graph 22: Change in share of light-duty vehicles in different engine categories over time (2005–10)
7.3 0.0 3.3 0.0
17.4 0.0
65.6
0.4
78.2
0.1
49.1
4.5
11.1
0.4
9.7
0.6
5.7
0.7
9.3
0.1
2.8
0.4
1.8
0.2
2.6
6.9
1.6
23.3
2.7
37.3
4.1
92.3
4.4
75.7
23.2
57.3
0%
10%
20%
30%
40%
50%
60%
70%
80%
90%
100%
Petrol Diesel Petrol Diesel Petrol Diesel
2005 2008 2010
≤ 1000 cc 1001-1300 cc 1301-1800 cc 1801-2000 cc 2001-2500 cc ≥ 2500 cc
Source for Graphs 21 and 22: CSE based on data from Demiss Alemu 2015, Baseline Setting for Vehicle Fuel Efficiency Improvement and CO2 Emission, Paper
presented at the Stakeholder Workshop on air quality and transportation challenges in Ethiopia and agenda for Clean Air Action Plan, Ministry of Environment
and Forest, Federal Democratic Republic of Ethiopia and Centre for Science and Environment, Addis Ababa, 8 September 2015.

48
CLUNKERED
variation and improvement in fuel consumption with age and an engine overhaul would result in an increase in fuel efficiency to the level it was earlier (before the repair or maintenance). Further, vehicle usage, driving and route characteristics, tyre pressure, passenger load and travel speed are other parameters that influence the vehicle fuel efficiency of on-road vehicles.
The UNEP background paper on used-vehicle import states that not all used vehicles are equally detrimental to air quality and fuel economy; used imported vehicles can be much cleaner and more energy efficient than existing stock. In fact, research conducted by the European Commission suggests that the majority of benefits in terms of fuel economy accrue to second owners of ‘young used’ (four–nine-year-old) cars.20 Therefore, imported newer used vehicles have the potential to reduce emissions rather than the older used vehicles already in operation in low-income countries and with increased replacement overall emissions may reduce.
The ICCT explains that one of the key factors for fuel economy to remain constant or improve is reduced friction. This is especially pronounced for the first 5000–10,000 miles, but it actually continues for as long as the vehicle lasts, although the impacts decrease logarithmically. This is engine friction, transmission friction, axles, wheel bearings, pumps—anything that rotates. It also applies to tyres, but when the tyres get replaced it goes back to higher friction. So tyres are not part of the assessment.21
Also, malfunctions can reduce fuel economy. Newer vehicles rarely malfunction and are usually fixed when they do, but the older the vehicle gets, the more
Sidestepping polluting technologies with alternative fuel programmes
African countries have very limited alternative fuel programmes even though the fuel-substitution strategy is attractive in the developing world to circumvent the poor-quality mainstream fuels of petrol and diesel. Switching to cleaner fuels in the existing fleet can help lower emissions. There are a few prominent fuel-substitution programmes in Africa. These include the Compressed Natural gas (CNG) programme in Nigeria and Egypt and ethanol-blending programme in Ethiopia.
Nigeria has the world’s ninth largest gas reserve. The Nigerian Gas Company (NGC) proposed the use of CNG as vehicular fuel in 1988 and introduced it in 1989. According to the Nigeria Independent Petroleum Company (NIPCO), over 4,000 vehicles had converted to CNG in Benin and over 500 CNG vehicles are also operating in Lagos. The launch of the Clean Energy Transport Scheme involves introduction of CNG-run vehicles and retrofitting of diesel engine to CNG. In Benin City of Edo state, over 50 per cent of taxi operators have converted to CNG. Use of natural gas instead of petrol translated into significant savings for taxi drivers in the area as Green Gas refuels over 4000 taxis and cars with natural gas and this is growing on a daily basis. According to UNEP estimates, if 40 per cent of vehicles in Nigeria switch to CNG, the government will save 28 per cent of foreign exchange spent on the import of 1.02 billion litres of fuels per year.1
Ethiopia, on the other hand, has adopted ethanol as a biofuel strategy in 2007 and produces biofuels from domestic resources as an import-substitution measure. Since October 2009, 5 per cent ethanol is being blended with petrol and the ratio has been increased to 10 per cent now. While the E5 blending started with one sugar factory and one blender company (Fincha and Nile Petroleum), E10 blending started March 2011 with two sugar factories and three blender campaniles (Fincha, Metehara and Nile Petroleum, Oil Libya and NOC). It is estimated that Ethiopia has saved around US $38.9 million over the past six years due to ethanol blending with petrol. Future plans are to increase the share of ethanol in blended fuel to 25 per cent and support the development of alternative fuels such as jatropha.
A similar fuel-substitution programme in Asian countries—including India, Bangladesh and Pakistan—has shown a substantial improvement in emissions. However, such programmes will have to be guided with adequate quality-control and emissions monitoring so that quality retrofits are possible.

49
CLUNKERED
malfunctions occur and the less likely it is for the owner to fix it. And it really is mostly malfunction, not maintenance, that influences fuel economy. For example, a common perception is that a dirty air filter will reduce fuel economy. This was true back in the days before oxygen sensors, as a dirty air filter would restrict air flow and cause the engine to run rich, reducing fuel economy. But oxygen sensors pick up the air restriction and open the throttle a little wider to compensate, maintaining air/fuel ratio and fuel economy.22
The US EPA provides fuel economy labels for used vehicles. The EPA indicates on its website, ‘As a vehicle’s fuel economy changes very little over a typical 15-year life with proper maintenance, the original EPA fuel economy estimate remains the best indicator of a used vehicle’s average gas mileage.’
Not much information is available about the fuel economy profile of the vehicular fleet. The study by Alemu of the Addis Ababa Institute of Technology shows that 0.3 million light-duty vehicles emit about 2.3 million tonnes of CO2 per year. A study was done to set a baseline and develop a national vehicle database for indicating the fuel economy trend. The average fuel economy for light-duty vehicles in Ethiopia was found to be 8.4 l/100 km in 2005 and 2008 respectively and 7.9 l/100 km in 2010 with corresponding CO2 emissions of 217, 221 and 212 g CO2/km respectively.
Fuel economy slightly decreased to 7.9 l/100 km in 2010 with a corresponding increase in CO2 emission to 212 g CO2/km. Contrary to what is known from literature and experience, diesel light-duty vehicles in Ethiopia were found to have poorer fuel economy compared to petrol counterparts and emitted more CO2 than petrol-fuelled vehicles. Alemu explained that these results are in a lower regime when compared to what is reported in the literature. This is because imported used vehicle have relatively larger share of vans, SUVs and pick-ups in the total import of light duty vehicles (see Graph 23: Comparative average vehicle CO2 emissions in Ethiopia and other countries).
Graph 23: Comparative average vehicle CO2 emissions in Ethiopia and other countries
Gra
ms
CO
2 p
er k
ilom
eter
(N
EDC
tes
t cy
cle)
Solid dots and lines: actual dataHollow dots and dashed lines: nearest targets enactedSmaller hollow dots and dotted lines: proposed targets
United StatesChileEthopia
CaliforniaSouth Korea
China
Japan
European Union
270
250
230
210
190
170
150
130
110
90
2002 2004 2006 2008 2010 2012 2014 2016 2018 2020 2022
Australia
Source: International Council on Clean Transportation
50
CLUNKERED
Used-vehicle import is steadily increasing the average mass of vehicles in the markets of importing countries as bigger engines dominate trade. This is noticeable across Africa and South Asia.
The countries of Africa and South Asia will have to adopt improved emissions standards and fuel economy-labelling together. Otherwise there can be a serious trade off. This is evident in the Mauritian market, where considerable emphasis has been put on CO2 and fuel economy-based vehicle import without commensurate improvement in vehicle standards. Nearly 68 per cent of its vehicular stock is dieselized today.
Environmental and fiscal regulations related to emissions of local pollution as well as heat-trapping gases from vehicles will have to improve significantly across Africa and South Asia to offset the negative impacts of import of used vehicles.

51
CLUNKERED
There is clearly a strong correlation between income levels of countries and average age of vehicles. The poorer the country, the higher is the average age of vehicles and vice versa. In the US, UK, Japan, Germany and France, countries with high per capita gross domestic product (GDP), the average age of light-duty vehicles is less than eight years, with exception of the US, where the average age is higher. But in countries of Africa and South Asia, with lower per capita GDP, the average age of vehicles is in the range of 12–17 years. This brings out the high import dependence on used vehicles in these countries and the fact that these vehicles also stay on the road for much longer period of time (see Graph 24: Relation between per capita income and average age of cars in high- and low-income countries)
Experts point out that as the majority of importing countries have adopted minimal policies on emissions and fuel standards and fuel economy standards to regulate their respective vehicle imports, the current international trade
SECTION 4: Setting the terms for used-vehicle import
0.0
10000.0
20000.0
30000.0
40000.0
50000.0
60000.0
70000.0
0.0
2.0
4.0
6.0
8.0
10.0
12.0
14.0
16.0
18.0
20.0
USA Germany United Kingdom
Japan France Sri Lanka Bhutan Nigeria Kenya Ethiopia Uganda
Average age of cars (in years) GDP per capita (current US$) in 2016
Graph 24: Relation between per capita GDP and average age of cars in high- and low-income countries
Data compiled from:
• The World Bank, GDP per capita (current US$), https://data.worldbank.org/indicator/NY.GDP.PCAP.CD
• Vehicles Getting Older: Average Age of Light Cars and Trucks in U.S. Rises Again in 2016 to 11.6 Years, IHS Markit Says, http://news.ihsmarkit.com/press-
release/automotive/vehicles-getting-older-average-age-light-cars-and-trucks-us-rises-again-201
• Average age of road vehicles per country, European Environment Agency 2016, https://www.eea.europa.eu/data-and-maps/daviz/average-age-of-road-
vehicles-6#tab-chart_1
• Average age of passenger cars in use in Japan from fiscal year 2007 to 2016 (in years), Statista – The Statistics Portal, https://www.statista.com/
statistics/680051/japan-passenger-car-average-age/
• Rahul Goel 2015, Assessment of motor vehicle use characteristics in three Indian cities, http://www.urbanemissions.info/wp-content/uploads/docs/2015-
06-TRD-India-Three-Cities-Veh-Characteristics.pdf
• Motorists in Asia replace their cars twice as often than motorists in the US, Sun Star, http://www.sunstar.com.ph/article/25473/
• Deloitte Africa Automotive Insights, https://www2.deloitte.com/content/dam/Deloitte/za/Documents/manufacturing/ZA_Deloitte-Africa-automotive-
insights-Ethiopia-Kenya-Nigeria-Apr16.pdf
• UNEP 2017, Used Vehicle Global Overview, https://www.unece.org/fileadmin/DAM/trans/doc/2017/itc/UNEP-ITC_Background_Paper-Used_Vehicle_
Global_Overview.pdf
• Jayaweera, Don S. Vehicle Inspection and Maintenance Policies and Programme – Sri Lanka, http://www.un.org/esa/gite/iandm/jayaweerapaper.pdf
• National Transport Policy of Bhutan 2017 – Policy Protocol Report (Final Draft), http://www.moic.gov.bt/wp-content/uploads/2017/08/Draft-Final-PPR.pdf
(average age of taxis)

52
CLUNKERED
in used vehicles between rich and poor countries has virtually reduced to an informal ‘cash for clunker’ programme ‘where rich countries send used cars to poor countries and poor countries send cash to rich countries’.1
Low environmental safeguards enhancing vulnerabilityAfrica region: There is a considerable time lag in enforcement of improved emission standards for vehicles and fuel quality across the Africa region. These standards are not yet uniformly harmonized across the continent—this is blocking emission standards-based vehicle production and import in the region. On-road emissions monitoring is also weak.
UNEP has tracked the evolution in fuel quality and emission standards—it shows wide variance in the current standards across the Africa region. The constraint of poor fuel quality does not allow immediate harmonization of vehicle emission standards for either vehicle import or local production at the level of Euro IV emissions standards. However, there has been considerable progress in bringing 50 ppm sulphur fuels in South and East Africa that opens up the opportunity to introduce Euro IV emissions standards (see Map 2: Africa progressing towards low-sulphur diesel and Map 3: Very few African countries have emission standards for vehicles).
In southern Africa, Botswana, Lesotho, Malawi, Mozambique, Namibia, South Africa, Swaziland, Zambia and Zimbabwe have fuel quality with diesel sulphur levels in the range of 50–500 ppm.2 Among these countries, Botswana, Lesotho, Namibia, South Africa and Swaziland are aiming for 10 ppm sulphur fuels. But the timeline is not clear. In West Africa, nearly all the countries have diesel sulphur in the range of 1,000–10,000 ppm.3 In East Africa, Kenya, Uganda, Rwanda, Burundi and Tanzania have moved to 50 ppm since 2015. Morocco and Mauritius have met
Map 2: Africa progressing towards low-sulphur diesel
Source: Jane Akumu 2018, Progress towards cleaner fuels and vehicles in Africa, Paper presented at the Africa Clean Mobility Week, Nairobi, 12–16 March
2018.

53
CLUNKERED
50 ppm sulphur fuels. Morocco is also the first country to adopt 10 ppm sulphur fuel. Nigeria has taken out the notification for 50 ppm sulphur diesel.
As fuel quality is languishing in most of the continent, progress on emission standards is slow. As of now, Algeria, Egypt and Rwanda have emission standards below Euro III.
Without the requisite fuel quality, it is not possible to link vehicle import with emission standards. Also, countries cannot take advantage of the newer fleet from the advanced markets as the poor-quality fuel will not allow operation of advanced emission-control systems. This is leading to massive downgrading and stripping of vehicle technology in the region.
South Asia: In South Asia, all the countries besides India, including Sri Lanka, Nepal, Bangladesh, Pakistan, Myanmar and Bhutan, are vehicle-importing countries. Some countries, including Sri Lanka and Pakistan, are now actively looking at promoting local assembly of vehicles.
Until recently, there was a considerable time lag in vehicle technology and fuel quality in this region. Vehicle-importing as well as vehicle-exporting countries were way down on the technology ladder. This has resulted in considerable flow of old and polluting vehicles towards the importing countries. But this scenario is changing rapidly now. India, as a vehicle-producing country, has graduated to Euro IV emission standards and is poised to move directly to Euro VI emissions standards by 2020. Nepal has already moved to Euro III emissions standards and is planning to align with India on Euro IV and Euro VI standards. Bangladesh that has adopted Euro I emission standards for diesel light-duty and heavy-duty vehicles and Euro II for petrol and CNG light-duty and heavy-duty vehicles is also contemplating a similar move.4 Sri Lanka, and Bhutan are using innovative policies for a quick makeover.
Map 3: Very few African countries have emission standards for vehicles
Source: Jane Akumu 2018, Progress towards cleaner fuels and vehicles in Africa, Paper presented at the Africa Clean Mobility Week, Nairobi, 12–16 March 2018.

54
CLUNKERED
These countries are simultaneously adopting several strategies to address vehicle imports that present a learning curve. But it is clear that only further tightening of the emissions regulations and benchmarks can help to reduce the vulnerability of these two regions and stem the tide of environmental dumping.
Key approaches to regulate vehicle importSeveral regulations have evolved in Africa and South Asia that include fixing of age to ensure newer fleet is imported, fiscal measures to make import of vehicles more expensive and discourage very old vehicles, and emission-based taxation to import cleaner and more fuel-efficient vehicles.
UNEP has done extensive classification of countries by type of measures they have adopted in Africa (see Table 2: Vehicle-import regulations in Africa).
Table 2: Vehicle-import regulations in Africa
Banned Restricted by ageIncremental tax or additional
excise duty on ageNo import restrictions
No punitive import tariffs
No data
Egypt Algeria < 3 years Kenya > 3 years Burkina Faso Benin Comoros
Morocco Angola < 3 years Cape Verde > 4 years Burundi Botswana South Sudan
South Africa Chad < 3 years Sierra Leone > 4 years CAR Burkina Faso Sao Tome and Principe
Sudan Mauritius < 3 years Ghana > 5 years Côte d’Ivoire Burundi
Seychelles < 3 years Tunisia > 5 years Djibouti Cameroon
Gabon < 4 years Uganda > 5 years EQ. Guinea CAR
Libya < 5 years Zimbabwe > 5 years Ethiopia Chad
Mozambique < 5 years Tanzania > 8 years Gambia Congo
Niger < 5 years Côte d’Ivoire >10 years Ghana Comoros
Tunisia < 5 years Gambia > 10 years Guinea-Bissau Djibouti
Cameroon < 7 years Liberia > 10 years Madagascar DRC
Congo < 7 years Mali > 10 years Malawi Egypt
Guinea < 8 years Rwanda > 10 years Mali EQ. Guinea
Lesotho < 8 years Somalia Gabon
Kenya < 8 years South Sudan Guinea
Mauritania < 8 years Sierra Leone Libya
Namibia < 8 years Tanzania Madagascar
Reunion < 8 years Togo Malawi
Senegal < 8 years Zambia Mauritania
Benin < 10 years Mozambique
DRC < 10 years Niger
Eritrea < 10 years Namibia
Liberia < 12 years Reunion
Nigeria < 15 years Senegal
Swaziland < 15 years Seychelles
Somalia
South Sudan
Swaziland
Togo
Zambia
Source: Ariadne Baskin 2018, Africa Used Vehicle Report, Paper presented at the Africa Clean Mobility Week, Nairobi, 12–16 March 2018.

55
CLUNKERED
Imposing age restriction on importsFixing the age of vehicles for import and combining it with tax measures is the most common strategy. In Africa, while four countries, including Egypt, Morocco, South Africa and Sudan, have banned used-vehicle imports, another 25 countries have imposed age restrictions on vehicles. Age restrictions are three to 15 years (see Graph 25: Age-based used-vehicle imports by different countries). Algeria, Angola, Chad, Mauritius and Seychelles have capped the age at three years. Gabon, Libya, Mozambique, Niger and Tunisia have an age cap of five years and less. Lesotho, Kenya, Mauritania, Namibia and Senegal have capped the age at eight years. Benin and the Democratic Republic of Congo have capped it at ten years, and Liberia, Benin, Nigeria and Swaziland have capped age at 15 years.
Age-based taxation on imports A large group of countries have linked higher taxes with age of vehicles. The objective of such incremental measures is to discourage import of very old vehicles and promote use and purchase of newer vehicles. This is also combined with vehicle inspection and pre-import inspection programmes.
These initiatives in different countries have thrown up different lessons and results.
Country-wise approach to regulate vehicle importWhile broad approaches and strategies are common across the two regions, the specific country experiences have thrown up a wide gamut of lessons. Sharing these lessons is important as the countries are on their way to further refine their strategies to chart the future roadmap. In this review of country experiences, CSE has also put a more in-depth spotlight on Nigeria and Ethiopia (see Boxes: Spotlight on Nigeria and Spotlight on Ethiopia).
Graph 25: Age-based used-vehicle imports by different countries
3 3 3 3 3 4
5 5 5 5
7 7 8 8 8 8 8 8 8
10 10 10
12
15 15
0
2
4
6
8
10
12
14
16 A
lger
ia
An
go
la
Ch
ad
Mau
riti
us
Seyc
hel
les
Gab
on
Lib
ya
Mo
zam
biq
ue
Nig
er
Tun
isia
Cam
ero
on
Co
ng
o
Gu
inea
Leso
tho
Ken
ya
Mau
rita
nia
Nam
ibia
Sen
egal
Reu
nio
n
Ben
in
DR
C
Erit
rea
Lib
eria
Nig
eria
Swaz
ilan
d
Ag
e o
f ve
hic
le
Country
North
South
West
East
Central
Source: Ariadne Baskin 2018, Africa Used Vehicle Report, Paper presented at the Africa Clean Mobility Week, Nairobi, 12–16 March 2018.

56
CLUNKERED
UgandaThere are over 1.5 million vehicles in Uganda of which nearly 30 per cent are motorcycles.5 Over 85–95 per cent are used vehicles from Japan and Europe and are more than 10 years old.6 Uganda does not have major vehicle assembling plants, only small ones.
Uganda has made four strategic interventions to improve their vehicle fleet— imposition of environment levy on used vehicles and higher taxes on bigger engines; vehicle-emission inspection; vehicle-age restriction; and pre-shipment inspection.7
Environment levy and higher taxes on older engines: The environment levy is designed to discourage importation of very old vehicles. It was started eight years ago, in 2010, and has been progressively revised. Used vehicles that are five to 10 years and above 10 years are required to pay 35 per cent and 50 per cent of cost, insurance and freight (CIF) value respectively as environmental levy. Goods vehicles (3.5 tonnes and above) are exempt. The environment levy favours import of less than five-year-old vehicles. Goods vehicles are excluded from the environment levy which is the biggest emitter, mainly because Uganda is a landlocked country without sea link and is heavily dependent on roadways.
Environment levy seems to have made some impact. In 2014–15, out of 51,629 imported vehicles, more than half (35,901) were used vehicles. But in 2015–16, the number of used vehicles came down to 18,922.8
However, according to Ronald Amanyire, Secretary, National Road Safety Council, Ministry of Works and Transport, Uganda, ‘The policy in place to reduce importation of old vehicles is fiscal and may not necessarily achieve the objective of reducing importation of used vehicles over time. The policy is more of a tax policy to increase revenue to finance all government programmes.’ Amanyire added that reduction in number of old vehicles imported and purchased by consumers do not necessarily lead to any significant corresponding increase in purchase of new vehicles. Affordable price of older vehicles remains a strong incentive.9
Officials observe that even if 50–100 per cent levy is imposed, an old vehicle remains cheaper than a new one. For instance, while used cars cost USh 10–20 million, a new car would be around USh 65 million.10 Nathan Tumushabe, Senior Inspector of Vehicles, Ministry of Works and Transport, and Jennifer Kutesakwe, Senior Environment Inspector, National Environment Management Authority (NEMA), Uganda, say that new vehicles are still too expensive for most Ugandans to afford.11
Vehicle age: Uganda is also considering age restriction for vehicle import. The Traffic and Road Safety Act 1998 (Amendment) Bill 2018 proposes an eight-year age restriction from the date of manufacture and revision of environment levy. There was a discussion in Parliament to lower the age to eight years. Vehicle importers, transport associations and the general public protested. So a compromised position of graduated reduction was expected. The Parliament has now fixed 15-year age cap for vehicle import.
Vehicle emission inspection: Uganda has re-established mandatory vehicle inspection. Based on the NEMA/Uganda National BS guidelines, roadworthiness tests and emission standards enforcement is carried out. All vehicles come for inspection. At present emission results are not used to fail or pass a vehicle

57
CLUNKERED
as almost all vehicles are likely to fail. The purpose is to gather data to inform further policy decisions on vehicles, including vehicle age, fuel standard, maintenance procedure regimes etc. The regulation is yet to be enforced.
Pre-shipment inspection: The additional step is to introduce pre-Export Verification of Conformity (PVoC). The new pre-import new standard US845 specifies safety and performance characteristics of vehicles and their inspection and testing for roadworthiness. The PVoC requires exporters to apply for assessment of their exports for conformity with the new standard. A certificate of conformity (CoC) is issued to the exporters on passing the test and is valid for a year to be followed by another roadworthiness test.12 Three firms are currently engaged for pre-shipment inspection of vehicles. Inspection is done in the country of origin as per the given manual of the Uganda standards, EAC standards, and international safety standards. A certificate of conformity and a certificate of roadworthiness and radiation levels is issued. Defaulters are fined 15 per cent of the CIF value.13
The problem of used-car import is increasingly drawing political attention in the country. Uganda’s Environment Minister Frank Tumwebaze has been quoted in the media stating, ‘The vehicles imported are largely old used vehicles with an average age of 16 years and instead of crushing them in Japan they say let us send them to countries like Uganda.’14
Lesson from Uganda: The learning from Uganda is that import taxes need to be designed more effectively in combination with age restrictions to make a difference. Otherwise, the tax measure will only degenerate to a revenue-generating strategy. Tax measures on their own cannot make new vehicles competitive. It is important to eliminate the old stream through regulations.
Kenya A combination of age restriction and incremental tax has helped increase the overall price of imported vehicles and reduce demand. There are serious concerns regarding used-vehicle imports. Officials also point out that the older vehicles not only have higher emissions but also have poor safety standards that lead to accidents. Muitungu Mwai, Principal Compliance and Monitoring Officer and In Charge Air Quality Section, National Environment Management Authority, Kenya, says that used cars have lower power than newer ones, higher fuel consumption, higher exhaust emissions and higher operating costs, and create huge demand for second-hand spare parts that also drain scarce foreign exchange. These vehicles require frequent maintenance, repairs and replacement to restore them to near optimal conditions.15
Age restriction: Kenya does not allow import of vehicles older than eight years. This is enforced by the Kenya Customs Department as per the KS 1515:2000 quality standard of the Kenya Bureau of Standards. Kenya imposes incremental tax based on age of vehicles. Ayub Macharia, Director, Ministry of Environment and Natural Resources, Kenya, said that there was no import of used cars by the government.
Import tax policy: In September 2015, Kenya adopted an age-based taxation scheme for import of second-hand vehicles. Under this law, vehicles less than three years will pay 1,50,000 Kenyan Shilling (KSh) and more than three-year-old vehicles 2,00,000 Ksh. Peter Odhengo, Senior Policy Analyst, National Treasury Kenya, said that the roll-out of a new tax regime for imported used cars in 2015 has caused a massive retail price increase and the price increase resulted in

58
CLUNKERED
depressing the vehicles market in Kenya. The new taxes, which came into force in December 2015 following the amendment of the excise duty law, increased the prices of smaller vehicles and cut the cost of the luxury ones by up to 1.27 million KSh.16 According to the Kenya Auto Bazaar Association, the higher taxes will increase the prices of the models by 1,45,000–3,64,000 KSh.17
Overall, five types of taxes are imposed on imported vehicles, including import duty (25 per cent of the CIF of the vehicle), excise duty (20 per cent of the CIF value plus import duty), VAT (16 per cent of the CIF value plus import duty plus excise duty), Import Declaration Fee (IDF) 2.25 per cent of the CIF value or KSh 5000 whichever is higher is payable. CIF is the customs value of the vehicle that includes the cost, insurance and freight paid for the vehicle. The CIF value of the vehicle is also deduced from the current retail selling price (CRSP) of the vehicle.18
Lesson from Kenya: While age regulations and increased taxes helped lower import of older vehicles, they still require a longer term strategy of improving emissions standards for vehicles (commensurate with the 50 ppm sulphur fuels already in place) for more sustained gains. At the same time, along with other countries, it needs to push for regional harmonization of rules related to vehicle import so that local action is not undercut by the grey market through its porous borders.
Used cars will begin to cost more if the regional air-pollution deal calling for lower age limit for import of used vehicles, and imposing minimum agreed emission standards and improved fuel quality at the regional level comes through. The President of Kenya, Uhuru Kenyatta, was reported saying at the United Nations Environment Assembly conference that he would host the East African Framework Agreement on Air Pollution and push for its implementation.19
Mauritius Mauritius has adopted diverse strategies to regulate vehicle import, including age limit, emissions-based and engine size-based taxation. It has also adopted regulatory mechanisms for oversight and accountability that offer a rich learning curve.
Age cap and number controls: Mauritius has imposed age limit on all imported used vehicles. While used imported cars, SUVs and jeeps are required to be between 18 months and four years old, age limit for double cabs, 2 x 4 or 4 x 4, is between 18 months and three years. The age of goods vehicles cannot exceed six years; vans carrying goods and up to seven passengers four years; buses three years and motorcycles less than one year without any permission for resale. The reason for minimum age limit of 18 months is mainly to protect the new car industry.
There is as well quantitative control on imports of used vehicles. In case of cars, an individual is allowed one car every five years. A taxi owner is allowed one car every four years. There is no restriction on an authorized dealer. Motorcycles have a total import restriction for resale—only one motorcycle of less than a year as a gift or resettlement is allowed. For vans, buses, lorries and trucks, one vehicle every five years for each vehicle category respectively is allowed. This helps to also control the total volume of vehicles in this land-constrained country.20
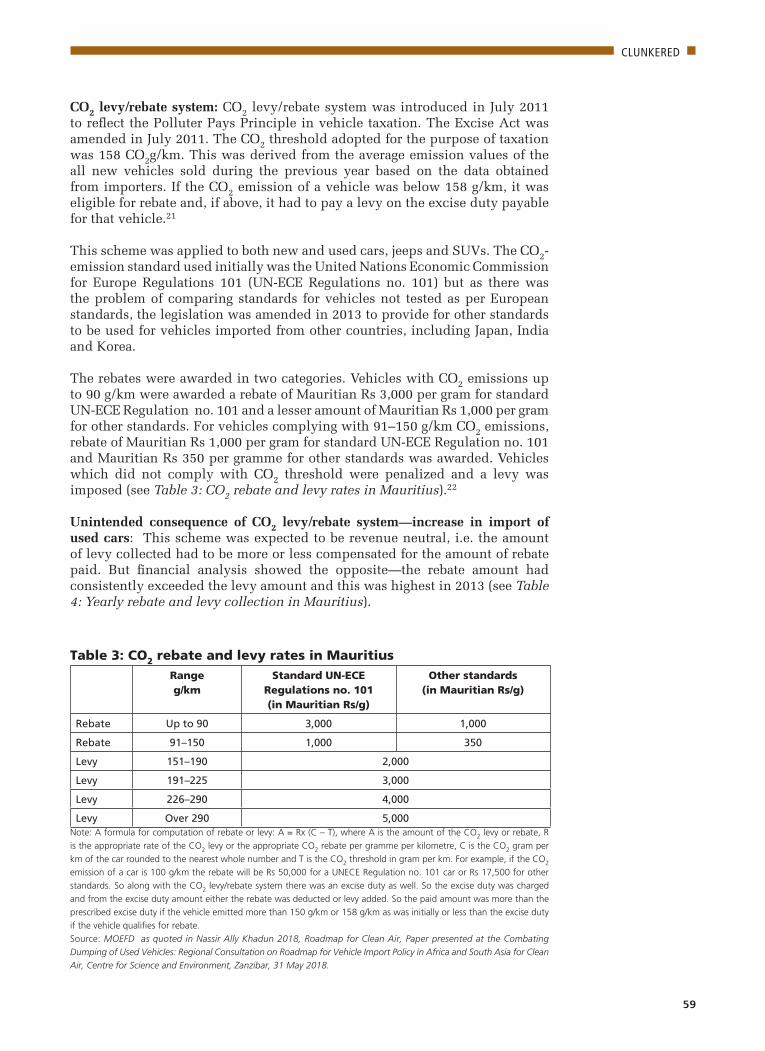
59
CLUNKERED
CO2 levy/rebate system: CO2 levy/rebate system was introduced in July 2011 to reflect the Polluter Pays Principle in vehicle taxation. The Excise Act was amended in July 2011. The CO2 threshold adopted for the purpose of taxation was 158 CO2g/km. This was derived from the average emission values of the all new vehicles sold during the previous year based on the data obtained from importers. If the CO2 emission of a vehicle was below 158 g/km, it was eligible for rebate and, if above, it had to pay a levy on the excise duty payable for that vehicle.21
This scheme was applied to both new and used cars, jeeps and SUVs. The CO2-emission standard used initially was the United Nations Economic Commission for Europe Regulations 101 (UN-ECE Regulations no. 101) but as there was the problem of comparing standards for vehicles not tested as per European standards, the legislation was amended in 2013 to provide for other standards to be used for vehicles imported from other countries, including Japan, India and Korea.
The rebates were awarded in two categories. Vehicles with CO2 emissions up to 90 g/km were awarded a rebate of Mauritian Rs 3,000 per gram for standard UN-ECE Regulation no. 101 and a lesser amount of Mauritian Rs 1,000 per gram for other standards. For vehicles complying with 91–150 g/km CO2 emissions, rebate of Mauritian Rs 1,000 per gram for standard UN-ECE Regulation no. 101 and Mauritian Rs 350 per gramme for other standards was awarded. Vehicles which did not comply with CO2 threshold were penalized and a levy was imposed (see Table 3: CO2 rebate and levy rates in Mauritius).22
Unintended consequence of CO2 levy/rebate system—increase in import of used cars: This scheme was expected to be revenue neutral, i.e. the amount of levy collected had to be more or less compensated for the amount of rebate paid. But financial analysis showed the opposite—the rebate amount had consistently exceeded the levy amount and this was highest in 2013 (see Table 4: Yearly rebate and levy collection in Mauritius).
Table 3: CO2 rebate and levy rates in MauritiusRangeg/km
Standard UN-ECE Regulations no. 101(in Mauritian Rs/g)
Other standards(in Mauritian Rs/g)
Rebate Up to 90 3,000 1,000
Rebate 91–150 1,000 350
Levy 151–190 2,000
Levy 191–225 3,000
Levy 226–290 4,000
Levy Over 290 5,000Note: A formula for computation of rebate or levy: A = Rx (C – T), where A is the amount of the CO2 levy or rebate, R
is the appropriate rate of the CO2 levy or the appropriate CO2 rebate per gramme per kilometre, C is the CO2 gram per
km of the car rounded to the nearest whole number and T is the CO2 threshold in gram per km. For example, if the CO2
emission of a car is 100 g/km the rebate will be Rs 50,000 for a UNECE Regulation no. 101 car or Rs 17,500 for other
standards. So along with the CO2 levy/rebate system there was an excise duty as well. So the excise duty was charged
and from the excise duty amount either the rebate was deducted or levy added. So the paid amount was more than the
prescribed excise duty if the vehicle emitted more than 150 g/km or 158 g/km as was initially or less than the excise duty
if the vehicle qualifies for rebate.
Source: MOEFD as quoted in Nassir Ally Khadun 2018, Roadmap for Clean Air, Paper presented at the Combating
Dumping of Used Vehicles: Regional Consultation on Roadmap for Vehicle Import Policy in Africa and South Asia for Clean
Air, Centre for Science and Environment, Zanzibar, 31 May 2018.
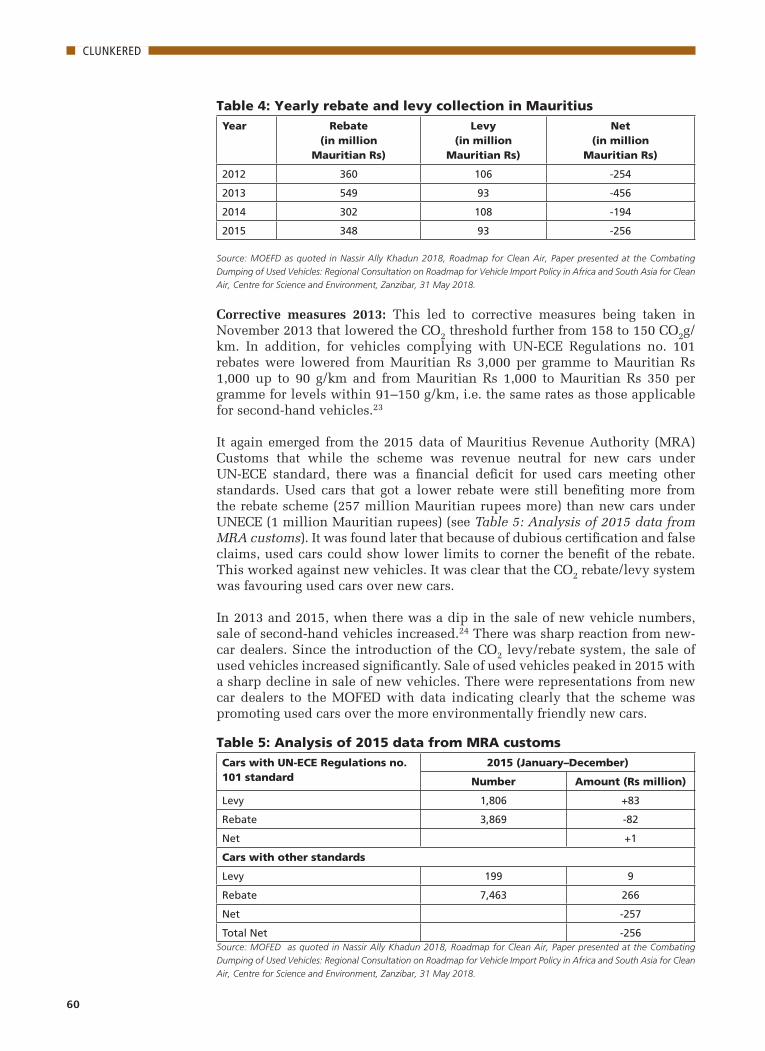
60
CLUNKERED
Corrective measures 2013: This led to corrective measures being taken in November 2013 that lowered the CO2 threshold further from 158 to 150 CO2g/km. In addition, for vehicles complying with UN-ECE Regulations no. 101 rebates were lowered from Mauritian Rs 3,000 per gramme to Mauritian Rs 1,000 up to 90 g/km and from Mauritian Rs 1,000 to Mauritian Rs 350 per gramme for levels within 91–150 g/km, i.e. the same rates as those applicable for second-hand vehicles.23
It again emerged from the 2015 data of Mauritius Revenue Authority (MRA) Customs that while the scheme was revenue neutral for new cars under UN-ECE standard, there was a financial deficit for used cars meeting other standards. Used cars that got a lower rebate were still benefiting more from the rebate scheme (257 million Mauritian rupees more) than new cars under UNECE (1 million Mauritian rupees) (see Table 5: Analysis of 2015 data from MRA customs). It was found later that because of dubious certification and false claims, used cars could show lower limits to corner the benefit of the rebate. This worked against new vehicles. It was clear that the CO2 rebate/levy system was favouring used cars over new cars.
In 2013 and 2015, when there was a dip in the sale of new vehicle numbers, sale of second-hand vehicles increased.24 There was sharp reaction from new-car dealers. Since the introduction of the CO2 levy/rebate system, the sale of used vehicles increased significantly. Sale of used vehicles peaked in 2015 with a sharp decline in sale of new vehicles. There were representations from new car dealers to the MOFED with data indicating clearly that the scheme was promoting used cars over the more environmentally friendly new cars.
Table 4: Yearly rebate and levy collection in Mauritius Year Rebate
(in million Mauritian Rs)
Levy (in million
Mauritian Rs)
Net(in million
Mauritian Rs)
2012 360 106 -254
2013 549 93 -456
2014 302 108 -194
2015 348 93 -256
Source: MOEFD as quoted in Nassir Ally Khadun 2018, Roadmap for Clean Air, Paper presented at the Combating
Dumping of Used Vehicles: Regional Consultation on Roadmap for Vehicle Import Policy in Africa and South Asia for Clean
Air, Centre for Science and Environment, Zanzibar, 31 May 2018.
Table 5: Analysis of 2015 data from MRA customsCars with UN-ECE Regulations no. 101 standard
2015 (January–December)
Number Amount (Rs million)
Levy 1,806 +83
Rebate 3,869 -82
Net +1
Cars with other standards
Levy 199 9
Rebate 7,463 266
Net -257
Total Net -256Source: MOFED as quoted in Nassir Ally Khadun 2018, Roadmap for Clean Air, Paper presented at the Combating
Dumping of Used Vehicles: Regional Consultation on Roadmap for Vehicle Import Policy in Africa and South Asia for Clean
Air, Centre for Science and Environment, Zanzibar, 31 May 2018.

61
CLUNKERED
The reversal—introduction of excise duty restructure linked with engine size: A Committee was formed to look into the scheme for revenue neutrality and whether the threshold should be lowered further and also to look into the merit of abolishing the CO2 rebate while keeping the CO2 levy as was the case in South Africa and the UK. It was found that on the basis of dubious certification, used cars could show lower emission limits to get the benefit of the rebate.
It was also found that different standards for CO2 emissions were used for the purpose of taxation and there was no formal arithmetical equivalence to compare those standards, and unreliable CO2 values were used for computation of the levy or rebate.
The Budget of July 2016 led to the suspension of the CO2based scheme due to operational and litigation glitches, which hindered its proper functioning. This suspension will remain valid until a harmonized CO2 measurement becomes effective under the World Harmonized Light Vehicles Test Procedure.
After the suspension of the CO2 levy/rebate scheme, the government restructured the excise duty based on engine capacity to control fuel guzzling (see Table 6:
Table 6: Rates of duty before 2016–17 Budget and excise duty rates before and after 2016–17 Budget in MauritiusType of car and cylinder capaci-ty (cc)
Rates prior to 2016–17 Budget Rates of excise duty after 2016– 17 Budget
Excise duty Registration duty Road tax
Conventional cars
Up to 550 cc 15% New and imported second-hand motor cars (first entry in Mauritius) pay the same rate depending on the cylinder capacity, ranging from Rs 3,300 to Rs 1,95,000.1
All cars (excluding hybrid and electric cars)Rs 3500 to Rs 13,000 yearly depending on a cylinder capacity (company pays an additional amount Rs 1000/ Rs 2000)
0%
551–1,000 cc 55% 45%
1,001–1,600 cc 55% 50%
1601–2,000 cc 75% 75% (no change)
> 2,000 cc 100%2 100% (no change)
Hybrid cars
< 550 cc 15% 50% of normal rate depending on engine capacity and age3
50% of normal rate depending on engine capacity
25%551–1,600 cc 55%
1,600–2,000 cc 75% 45%
> 2,000 cc 100%4 70%
Electric cars
Up to 180 Kw 25% 25.5 to 70 Kw Rs 8100
70.1 to 95 Kw Rs 16,300
95.1 to 125 Kw Rs 26,000
125.1 to 150 Kw Rs 32,000
150.1 to 180 Kw Rs 39,000
>180 Kw Rs 97,500
50% of normal rate 0%
> 180 Kw 25% 25% (no change)
1 Subsequent transfer of vehicles on the local market depreciating rate
2 Plus CO2 rebate if the CO2 emission is less than 150 g/km. CO2 levy if the CO2 emission is more than 150 g/km
3 Subsequent transfer of vehicles on the local market: depreciating rate
4 Plus CO2 rebate if the CO2 emission is less than 150 g/km. CO2 levy if the CO2 emission is more than 150 g/km
Source: MOEFD as quoted in Nassir Ally Khadun 2018, Roadmap for Clean Air, Paper presented at the Combating Dumping of Used Vehicles: Regional
Consultation on Roadmap for Vehicle Import Policy in Africa and South Asia for Clean Air, Centre for Science and Environment, Zanzibar, 31 May 2018.
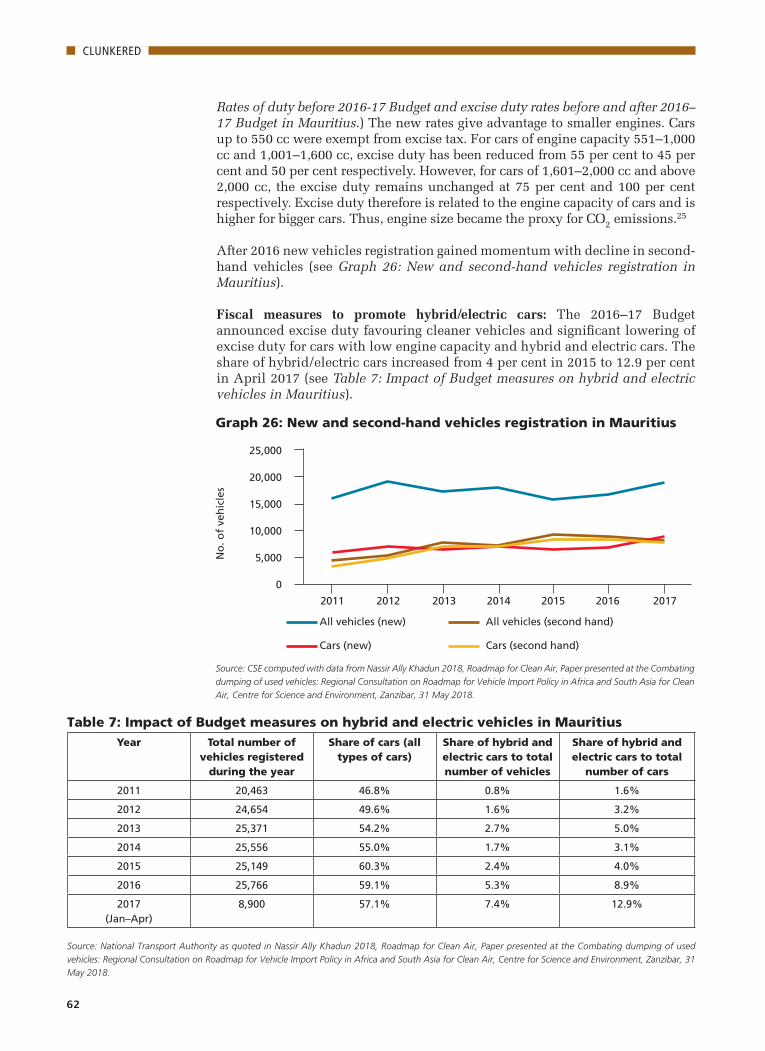
62
CLUNKERED
Rates of duty before 2016-17 Budget and excise duty rates before and after 2016–17 Budget in Mauritius.) The new rates give advantage to smaller engines. Cars up to 550 cc were exempt from excise tax. For cars of engine capacity 551–1,000 cc and 1,001–1,600 cc, excise duty has been reduced from 55 per cent to 45 per cent and 50 per cent respectively. However, for cars of 1,601–2,000 cc and above 2,000 cc, the excise duty remains unchanged at 75 per cent and 100 per cent respectively. Excise duty therefore is related to the engine capacity of cars and is higher for bigger cars. Thus, engine size became the proxy for CO2 emissions.25
After 2016 new vehicles registration gained momentum with decline in second- hand vehicles (see Graph 26: New and second-hand vehicles registration in Mauritius).
Fiscal measures to promote hybrid/electric cars: The 2016–17 Budget announced excise duty favouring cleaner vehicles and significant lowering of excise duty for cars with low engine capacity and hybrid and electric cars. The share of hybrid/electric cars increased from 4 per cent in 2015 to 12.9 per cent in April 2017 (see Table 7: Impact of Budget measures on hybrid and electric vehicles in Mauritius).
Table 7: Impact of Budget measures on hybrid and electric vehicles in MauritiusYear Total number of
vehicles registered during the year
Share of cars (all types of cars)
Share of hybrid and electric cars to total number of vehicles
Share of hybrid and electric cars to total
number of cars
2011 20,463 46.8% 0.8% 1.6%
2012 24,654 49.6% 1.6% 3.2%
2013 25,371 54.2% 2.7% 5.0%
2014 25,556 55.0% 1.7% 3.1%
2015 25,149 60.3% 2.4% 4.0%
2016 25,766 59.1% 5.3% 8.9%
2017(Jan–Apr)
8,900 57.1% 7.4% 12.9%
Source: National Transport Authority as quoted in Nassir Ally Khadun 2018, Roadmap for Clean Air, Paper presented at the Combating dumping of used
vehicles: Regional Consultation on Roadmap for Vehicle Import Policy in Africa and South Asia for Clean Air, Centre for Science and Environment, Zanzibar, 31
May 2018.
Graph 26: New and second-hand vehicles registration in Mauritius
Source: CSE computed with data from Nassir Ally Khadun 2018, Roadmap for Clean Air, Paper presented at the Combating
dumping of used vehicles: Regional Consultation on Roadmap for Vehicle Import Policy in Africa and South Asia for Clean
Air, Centre for Science and Environment, Zanzibar, 31 May 2018.
25,000
20,000
15,000
10,000
5,000
0
2011 2012 2013 2014 2015 2016 2017
No
. of
veh
icle
s
All vehicles (new) All vehicles (second hand)
Cars (new) Cars (second hand)

63
CLUNKERED
Other fiscal measures promoting cleaner vehiclesWhile new and imported used cars (first entry in Mauritius) have to pay the same registration duty depending on the engine capacity ranging from Mauritian Rs (MUR) 3,300 to MUR 1,95,000 (depreciating rate on subsequent transfer of vehicles in the local market), the registration duty for hybrid cars was 50 per cent of the normal rate depending on the engine capacity and age (depreciating rate on subsequent transfer of vehicles in the local market) and for electric cars from 25.5 kW up to 180 kW ranged from MUR 8,100 to MUR 39,000 and MUR 97,500 for electric cars more than 180 kW.
The registration duty has been reduced for electric cars with engine power up to 180 kW and fewer thresholds/bands of engine power (13 bands of engine power revised to only six bands). To promote hybrid cars, excise duty was lowered on all engine categories from 55 to 25 per cent for up to 1,600 cc hybrid cars, from 75 to 45 per cent for 1,601–2,000 cc cars and from 100 per cent to 70 cc for above 2,000 cc hybrid cars. The government has exempted all electric cars up to 180 kW of excise duty (it was 25 per cent earlier) and there is no change (25 per cent) for electric cars above 180 kW.26
The structure of the road tax also favours vehicles of low engine capacity as well as hybrid and electric vehicles.
Setting systems for verification for imported vehicles: Mauritius has set up an elaborate system for checks and verification that presents a good learning curve in the region. For second-hand vehicle import, a series of documents are required—including import permit; inspection certificate from a competent authority to certify that the vehicle has been inspected not earlier than two months prior to shipment, the vehicle is not stolen, roadworthiness and usability of the vehicle and the auction grade where the vehicle is imported from Japan; a document from the exporting country certifying that the vehicle is not stolen; a deregistration certificate and an export certificate issued by the official registration body; and a certified copy of the original auction sheet for second-hand vehicles from Japan to protect consumers.
Obligation of vehicle dealers and accountability: Mauritius has also detailed the legal obligation of the car dealers that helps improve accountability. Authorized dealers need to be registered and licensed with the Ministry of Industry, Commerce and Consumer Protection, own a showroom for display of cars, provide the Ministry with a bank guarantee or security for an amount of MUR 2.5 million (approx. US $75,000), allow purchasers to test drive vehicles, produce vehicle inspection certificate to purchasers, hold spare parts and repair facilities for vehicles imported and sold, enter into a sale agreement with the purchaser setting a warranty period for the car sold and submit to the relevant Ministry a certified copy of the sale agreement within three days showing that the agreement has been executed. Its up to the authorized dealer to effect all the repairs free of charge and provide any purchaser a vehicle in a good roadworthiness state otherwise the Ministry has the power to compensate the purchaser from the bank guarantee.
A lot of attention has been given to extending consumer protection from import of damaged vehicles. This became necessary when it was detected after the tsunami in Japan, when many cars affected by flooding were recovered, washed, drained and exported from Japan. To counter such problems, warranties are asked for from the competent certification authorities in exporting countries.

64
CLUNKERED
They have to give a guarantee of US $1,00,000 to state that the certificate issued is a genuine and credible one.27
Lessons from Mauritius: Mauritius throws up important lessons. It has simultaneously imposed age cap, restraints on frequency of vehicle purchase, and emissions-based taxation that was subsequently replaced by engine size-based excise tax. Yet, among these progressive measures, emissions-based taxation faced barriers. It led to unintended consequences of pushing up sale of older and used vehicles even though the rebates were lower for these vehicles compared to newer vehicles. First of all there was technical and administrative challenge of enforcing emissions-based taxation as the emissions standards of different countries of origin was not directly comparable. Imposition of emissions-based taxation requires globally harmonized systems to enable comparability of emissions standards in exporting countries. It is not often within the management capability of importing countries such as Europe and Japan to establish technically sophisticated systems to govern such imports. Documentation to enable implementation of such system is also extremely complex. This led to enormous leakages, especially while importing used vehicles, as dubious certificates made false claims of fuel economy or CO2 emissions. This increased sales of used vehicles, leading huge fiscal deficit instead of keeping the programme revenue neutral. Also, the subsequent engine size-based regulations has been found to be more transparent, viable and easily enforceable within the administrative capacity.
In future, with global harmonization of regulations, it might still be possible to revert to CO2- or fuel economy-based regulations. But this requires a word of caution. Only CO2-based regulations without commensurate improvement in emissions standards for vehicles may lead to market distortion in favour of diesel cars. Mauritius could avoid such a pitfall as the price gap between petrol and diesel fuels is very narrow, taxes on bigger engines are much higher and consumer preference is in favour of petrol cars. But this may not be the case in other countries.
Yet another lesson from Mauritius is its effort to set up elaborate institutional processes to establish accountability of the car dealers and a verification process to ensure roadworthy vehicle imports.
Ghana Challenge of used vehicle trade: Used-vehicle import far exceeds new-vehicle import. In 2015–17, out of the total 336,947 vehicles imported, about 221,096 (65.62 per cent) were used vehicles. In 2017, the revenue accrued from vehicle import accounted for more than half of the total revenue mobilized by the Customs Division of the Ghana Revenue Authority.28 The Ghana Revenue Authority Customs Division is responsible for imposing import duties/taxes on vehicles in accordance with the revised Harmonized System and Customs Tariff Schedules—2012.29
Officials point out that most of the used vehicles that find their way into Ghana are salvaged vehicles that are accident prone and have less efficient engines. They are often refurbished by the local mechanics to look as good as new vehicles. The influx of these salvaged vehicles cause traffic congestion in cities of Accra, Kumasi and Secondi Takoradi.
According to the Ghana Revenue Authority, most vehicles lack proper documentation as they are smuggled into the country through unapproved

65
CLUNKERED
routes. Vehicles imported temporarily are mostly not re-exported but fictitiously registered; vehicles in transit to neighbouring countries make a U-turn and end up being registered in the country.30 People take advantage of the 90-day protocol of Economic Community of West African States (ECOWAS)—under which imported used vehicles are allowed to operate for 90 days only after which they are either returned to their country of origin or if they would like to remain in Ghana they have to pay customs duty—but this does not happen, to evade tax payment. ECOWAS has allowed this to enable interregional transit of vehicles. Media reports that vehicles are deliberately brought from Nigeria, Togo and Benin and not sent back at the end of the three-month ECOWAS Protocol, with Ghana license plates are used illegally.31 Apparently, people buy overage or accident-affected cars of the make, model and type that are not more than ten years old and neatly cut off the VIN of car and weld it on the old car so as to avoid overage penalties.
Age restriction: The Customs Act 2015 (ACT 891) is the law governing importation of vehicles into Ghana. Sections 55–61 of the Customs Act 2015 (ACT 891) constitutes the principal legislation governing vehicle import. The age of a vehicle imported under the law is calculated from the year the vehicle was manufactured. In June 1998, the government of Ghana had placed a ban on the importation of vehicles over ten years old.
Penalty system: Following the amendment of Customs Excise and Preventive Service (CEPS) Act 634 in 2002, the ban was lifted and replaced with the imposition of high import penalty on cars exceeding ten years old. The penalties were further increased in 2015. Penalties are imposed on some category of overage vehicles in addition to any applicable duties and taxes (see Table 8: Penalties on importation of overage vehicles in Ghana). Although the purpose of the amendment (penalties on used vehicles importation) was to deter buyers/consumers, it rather gave them an even greater freedom than the total ban on the importation of used cars older than 10 years.32
Tax according to engine size: Ghana has also introduced higher import taxes on vehicles with bigger engines. Tax is higher on cars exceeding 1,900 cc engine category (ranging from 5 per cent, 10 per cent and 20 per cent). They also have an age-based taxation system for imported vehicles. In addition, a 0.5 per cent of ECOWAS levy is charged on vehicles. Import duty is dependent on the vehicle fuel type and engine capacity (see Table 9: Vehicles with higher engine capacities attract higher duty rates in Ghana).
Emmanuel Appoh, Head of Environmental Quality Department, Standards, Compliance and Enforcement Division, Environmental Protection Agency, Ghana, said that the tax regime has helped reduce import of conventional vehicles and more vehicles less than 10 years are being imported by the private sector. An Economic Community of West African States (ECOWAS) levy of 0.5 per cent is also charged on imported vehicles and vehicle with higher engine capacity pay more taxes. The ECOWAS communiqué is destined to bring down the import of vehicles of less than eight years. However there is no regulation on importation of used engines and other spare parts.33
Ghana has implemented the ECOWAS low-sulphur-fuel initiative as a mechanism to reduce sulphur levels in fuels since September 2017.
Lesson from Ghana: The experience of Ghana shows that penalty on overage vehicles without actual age restriction may not be very effective in curtailing

66
CLUNKERED
Table 8: Penalties on importation of overage vehicles in GhanaS. no. Vehicle type Penalty
1. Car
a. Age does not exceed 10 years Nil
b. Age exceeds 10 years but does not exceed 12 years 5% of CIF value
c. Age exceeds 12 years but does not exceed 15 years. 20% of CIF value
d. Age exceeds 15 years but does not exceed 25 years 50% of CIF value
e. Age exceeds 25 years but does not exceed 35 years 70% of CIF value
f. Age exceeds 35 years 100% of CIF value
2. Commercial vehicles—bus, coach or van
a. Age does not exceed 10 years Nil
b. Age exceeds 10 years but does not exceed 12 years 2.5% of CIF value
c. Age exceeds 12 years but does not exceed 15 years 10% of CIF value
d. Age exceeds 15 years but does not exceed 20 years 20% of CIF value
e. Age exceeds 20 years but does not exceed 25 years 50% of CIF value
3. Commercial vehicles—truck, lorry or tipper truck
a. Age does not exceed 10 years Nil
b. Age exceeds 10 years but does not exceed 12 years 5% of CIF value
c. Age exceeds 12 years but does not exceed 22 years 10% of CIF value
d. Age exceeds 22 years 30% of CIF value
Pages 108–09 (date of gazette notification: 18 May 2015)
The age of a vehicle shall be calculated from the year in which the vehicle was first manufactured
No person shall import a right-hand steering vehicle into the country unless otherwise authorized by the Minister of Transport
Under the current law (Act 634) any vehicle that remains un-entered and un-cleared within 60 days after discharge or in case of overland vehicle, from the date it crossed the national border into Ghana shall be forfeited to the state
Table 9: Vehicles with higher engine capacities attract higher duty rates in Ghana S. no. Vehicle type Import duty
1. Car
Petrol cars
Cylinder capacity not exceeding 1,000 cc 5%
Cylinder capacity exceeding 1,000 cc and up to 3,000 cc 10%
Cylinder capacity exceeding 3,000 cc 20%
Diesel cars
Cylinder capacity not exceeding 1,500 cc 5%
Cylinder capacity exceeding 1,500 cc and up to 2,500 cc 10%
Cylinder capacity exceeding 2,500 cc 20%
2. Goods vehicles
All trucks, including all off-highway dumpers 5%
Special purpose vehicles (towing trucks, crane trucks, fire-fighting vehicles, drilling rig trucks, cesspool/cesspit emptier, etc.)
5%
All vehicles when imported knocked-down (CKD) for assembly industry 5%
3. Machinery and equipment
All earth-moving equipment such as bulldozers, excavators, forklifts, graders, backhoe load-ers
5%
Source for Tables 8 and 9: Baba Bukari Musah 2018, Import Vehicle Policy Related Initiatives of Ghana, Paper presented at the Combating Dumping of Used
Vehicles: Regional Consultation on Roadmap for Vehicle Import Policy in Africa and South Asia for Clean Air, Centre for Science and Environment, Zanzibar, 31
May 2018.

67
CLUNKERED
import of very old vehicles. However tax measures have helped reduce import of very old vehicles to some extent. But the grey market can undercut such efforts. Moreover, documentation of vehicles remains dubious and therefore proper verification becomes a challenge. This is a learning that is emerging across Africa.
Rwanda In Rwanda, excluding motorcycles, 56.7 per cent of all vehicles are pre-1999 and 77.2 per cent are pre-2005.34
Fiscal strategy: There is no age restriction on imported vehicles. In order to discourage old vehicles, car depreciation factor is applied on taxes. Rwanda implemented the East African Community (EAC) depreciation schedule through a free-on-board depreciation rate ranging from 20 per cent for two-year-old cars, 75 per cent for nine-year-old cars and 80 per cent for 10-year-old or more cars.35
This strategy has helped make older cars more expensive. This for instance has resulted in doubling of the price of most preferred Toyota cars. The Rwanda Revenue Authority noted a drop in car import by around 20 per cent after introduction of this system. New vehicles with engine capacity less than 1,500 cc pay a 5 per cent tax; vehicles with engine capacity 1,500 cc pay, those with 1,500 cc and 2,500 cc capacity pay 10 per cent, and those with over 2,500 cc engine capacity pay 15 per cent. Despite the heavy tax burden slapped on used cars, demand is still high.36
Vehicle inspection: The law also mandates that all vehicles need to undergo emissions inspection at vehicle inspection centre. All commercial and public transport vehicles have to undergo inspection twice a year and other vehicles—such as private, public and even utilities—do so once a year. Non-compliant vehicles are not allowed to ply.37
Lessons from Rwanda: It is clear that taxes will have to be progressively revised to moderate the demand. Fiscal measures will have to be backed by age restrictions. Rwanda needs to consider more stringent measures to control used- vehicle import as it is also planning to set up its local assembly of vehicles. It is reported that companies like Volkswagen have plans to set up a local assembly plant.
Zimbabwe Zimbabwe’s vehicular fleet size in 2016 was 1.2 million. Vehicles are imported largely from Japan, Europe and UK.38 During 2000–17, Zimbabwe reduced imports that resulted in a shift to imports of second-hand vehicles at the expense of the local assemblers and local component manufacturers. Second-hand vehicles hampered local industry. Affordable price is the reason for influx of second-hand vehicles. While the price of importing a second-hand vehicle is in the range of US $3,000–7000, the price of a new vehicle of the same make is in the range of US $10,000–20,000. The new-vehicle market has shrunk from 20,000 vehicles per year in 1997 to less than 3,154 in 2017.39 Thus, local manufacturing is nearly decimated.
Age restriction: In 2011, a ban on aged vehicles was initially mooted in view of safety and environmental considerations, on vehicles over five years old but this could not be implemented due to public pressure.40
Fiscal strategy: The charges levied on vehicle imports include customs duty, surtax and VAT. Vehicles with large engine capacity have to pay high customs

68
CLUNKERED
duty—86 per cent customs duty for vehicle of less than 1,500 cc capacity and 96 per cent for those exceeding 1,500 cc capacity. Other measures include appointment of international certification agency Bureau Veritas to conduct the Consignment Based Conformity Assessment (CBCA) in order to reduce hazardous and substandard imported products and improve customs duty collection. Bureau Veritas has been appointed by the Ministry of Industry and Commerce of Zimbabwe for the verification and assessment of conformity of goods in exporting countries. Since 27 July 2015 all products (including automotive and transportation and others) regulated by the Ministry of Industry and Commerce exported into Zimbabwe must be accompanied by a CBCA certificate.41
Promoting local industry: The Zimbabwe Motor Industry Development Policy (ZMIDP) aims to encourage both local and foreign direct investment in the local automotive assembly and components manufacturing to 10 per cent of total foreign direct investment by 2026 and exports to be 50 per cent of total local production by 2026. It seeks to increase capacity utilization of car assemblers from the current levels which is less than 10 per cent to 100 per cent of installed capacity by 2026. ZMIDP is also looking at getting banks to offer credit terms to buyers for locally made new vehicles.42
Lessons from Zimbabwe: The key lesson here is that countries that are promoting local vehicle assembly as an economic measure for investment and job creation will have to protect this market from import of old and used vehicles. Moreover, both local assembly and imports will have to be linked to improved emissions standards, fuel quality and quality control. Yet another lesson is that one of the toughest barriers to reducing import of very old vehicles is consumer pressure as there is strong demand for very cheap vehicles. This will require significant public awareness.
Côte d’Ivoire During 2010–17, Côte d’Ivoire registered 0.45 million vehicles. As much as 89 per cent of these were used vehicles. According to Gnamien Stéphane Meney, Ministry of Environment, and Dembélé Diakaridja, Ministry of Transport, Côte d’Ivoire, the age-wise vehicle import data of 2010–17 shows that 31 per cent of vehicles are in the age group of zero to five years, followed by 14 per cent in the age bracket of six to ten tears. But 55 per cent are over ten years old.43 This is threatening the air quality of its city of Abidjan.
Age restriction: On 6 December 2017, Côte d’Ivoire adopted two decrees— Decree No. 2017-792 limiting the age of imported second-hand vehicles and Decree No. 2017-793 fixing the operating periods of vehicles used for public or private transport of persons or goods. The two decrees limit the age of imported used vehicles to five years from the date of registration. This also specifies the average operating period of vehicle at seven years from the first date of entry into circulation. This will come into effect from July 2018.44 Kone Nagnonta, Head of the Bureau Summary Report and Statistics, Ministry of Transport, Côte d’Ivoire, said that the age limit for commercial vehicle segments are as follows—taxis (five years), mini buses with nine to 34 seats (seven years), trucks and buses (ten years), and tourist vehicles (five years). Earlier, the average age of imported used vehicles was about fifteen years.45
Fiscal strategy: In Côte d’Ivoire, import of vehicles is governed by a law that imposes a contributory fee (US $300) on road safety, congestion and pollution from vehicles. This contributory fee is imposed on ten-year-old passenger and

69
CLUNKERED
freight vehicles with total permissible gross weight less than or equal to 4 tonnes and 15 years for goods vehicles with a gross vehicle weight of more than 4 tonnes.46 Vehicles over ten years old are also charged extra duty.47
Vehicle inspection: There is an obligation on vehicles traveling in Côte d’Ivoire to undergo a technical inspection to guarantee the safety status of goods and people. This is a pre-importation inspection for road worthiness.
Lesson from Côte d’Ivoire: This is a unique example in which the government has linked an additional fee on import of old vehicles to the guiding principles of road safety, congestion and pollution. These operative principles have helped impose stronger tax measures to curtail import of very old vehicles. Yet another important progressive step is the government’s decision in 2012 to keep the price of diesel and petrol the same. It is also recognized that diesel vehicles are more polluting.
Tanzania According to 2016 registration data, Tanzania has a registered vehicular fleet of about 0.3 million excluding motorcycles and tricycles. Of these, only 4.5 per cent are new vehicles. About 12.4 per cent vehicles are one to eight years old and 83 per cent vehicles are over eight years old.48
Age restriction: Tanzania has not enforced age restriction yet.
Fiscal strategy: Tanzania has adopted the policy of additional excise duty that increases with age of vehicles. For instance, vehicles aged eight to ten years pay 15 per cent additional excise duty; those over 10 years pay 30 per cent; and used imported buses over five years old pay 10 per cent. This is also backed by the two-slab taxation based on engine size. Vehicles up to 1000 cc do not pay excise duty. But thereafter, vehicles with engine capacity below 2,000 cc pay 5 per cent and those exceeding 2,000 cc pay 10 per cent (see Table 10: Tax rates for imported vehicles in Tanzania).
Vehicle registrations show a marked decline after 2014 in Tanzania (see Graph 27: Import of vehicles excluding motorcycles and tricycles for five years [2012–16] in Tanzania).49
Lessons from Tanzania: Tanzania is another country that has adopted fiscal measures without age restriction. It seems to have had some impacts on import. To maximize impacts, combining age restrictions with harsher fiscal measures will help. Otherwise, as seen in other countries, very cheap old vehicles will always undercut market for new and cleaner vehicles.
Mozambique Age restriction: The government is finding it increasingly difficult to impose restrictive policies on used-vehicle import as this draws public opposition. In the absence of adequate public-transport policy, dependence on small vehicles and cars is enormous. A law was introduced in 2007 to discourage old and used vehicle import but there was public opposition. Officials feel that in the absence of public transport, it is not possible to prohibit importation of vehicles, even used vehicles, which even with an extra tax are cheaper than new vehicles.
Fiscal strategy: Mozambique has adopted single-window clearance for customs and importation of goods in 2011. The tax on used vehicles varies from 5 per cent to 20 per cent. There is no age limit on vehicles but an extra tax is

70
CLUNKERED
Table 10: Tax rates for imported vehicles in TanzaniaS. no. Tax Amount
1. Import duty 25%
2. VAT 18%
3. Excise duty based on engine capacity
3a Cylinder capacity less than 1,000 cc 0%
3b Cylinder capacity exceeding 1,000 cc but not exceeding 2,000 cc 5%
3c Cylinder capacity exceeding 2,000 cc 10%
4 Additional excise duty on imported used vehicles
4a Imported vehicles, excluding agricultural tractors, from eight years of age but not more than 10 years, counted from the year of manufacture
15%
4b Imported vehicles aged 10 years or more, counted from the year of manufacture 30%
4c Used buses more than five years old from the year of manufacture 10%
5 Excise duty on imports of used vehicles spare parts
5a Imported used spare parts for vehicles and motorcycles 25%
Source: Stephen Samwel Malekano et al. 2018, Tanzania, Paper presented at the Combating Dumping of Used Vehicles: Regional Consultation on Roadmap
for Vehicle Import Policy in Africa and South Asia for Clean Air, Centre for Science and Environment, Zanzibar, 31 May 2018.
Graph 27: Import of vehicles excluding motorcycles and tricycles for five years (2012–16) in Tanzania
Source: Stephen Samwel Malekano et al. 2018, Tanzania, Paper presented at the Combating Dumping of Used Vehicles:
Regional Consultation on Roadmap for Vehicle Import Policy in Africa and South Asia for Clean Air, Centre for Science
and Environment, Zanzibar, 31 May 2018.
Table 11: Vehicle taxation for imported vehicles in MyanmarEngine Displacement
Custom duty(in per cent)
Special goods tax(in per cent)
Commercial tax(in per cent)
1500 cc 30 - 5
1,501–1,800 cc 30 20 5
1,801–2,000 cc 30 20 5
2,001–4,000 cc 40 30 5
> 4,000 cc 40 50 5
Source: Soe Tun, 2017, Automobile Industry in Myanmar, Myanmar Automobile Manufacturer and Distributor
Association (MAMDA)
80,000
70,000
60,000
50,000
40,000
30,000
20,000
10,000
0
2012 2013 2014 2015 2016
No
. of
veh
icle
s
Private cars/vans imported Buses imported
Lorries imported

71
CLUNKERED
imposed from seven years onwards to discourage importation of used vehicles. They have a stratified tax system based on engine size. Bigger engines attract higher taxes.50
Lesson from Mozambique: Like other countries, Mozambique is facing the dilemma of public aspiration that blocks action on very old and cheap cars. It is, however, important that the government has recognized the link between the lack of public transport and increased dependence on old and cheap cars for personal travel and therefore public opposition to harsh measures against used-vehicle import. In fact, the government is encouraging import of three-wheelers from India and China to increase public-transport service. An affordable train service has been introduced for workers this year.
Zambia: Vehicle-import policy status for ZambiaIn Zambia, Road Traffic Act no. 11 of 2002 provides for two types of registration processes—temporary for vehicles imported and manufactured in Zambia, and permanent registration for all vehicles in Zambia. Zambia currently has no vehicle-manufacturing plant. So all vehicles registered are imported either brand new or used. Zambia currently has a total vehicle population of around 748,468 (public and private) as at first quarter, 2018. This excludes the vehicles for the government and intelligence wings. About 85 per cent of these registered vehicles are imported used vehicles. Vehicles are brought into the country either by individuals or motor-vehicle dealers. Vehicle and trailer registration requires recording of details in the national vehicle register.
Vehicle import is regulated by organizations such as the Zambia Bureau of Standards (ZABS), which regulates the road worthiness of vehicles before shipment by appointed agencies, for example JEVIC, Zambia Revenue Authority (ZRA) for taxation purposes, INTERPOL for clearance of vehicle for lawful entry, Road Transport and Safety Agency (RTSA) for examination, registration and licensing of vehicles and Zambia Environmental Management Agency (ZEMA) for environmental pollution (carbon emissions surtax).
The import requirements vary for new and used vehicles. For new vehicles invoice, road manifest or bill of lading as the case may be, export bill of entry from the country of export is required. The valuation of new vehicles is based on the World Trade Organization Agreement valuation method and duties and taxes are applied on an ad valorem basis. New vehicles have to pay import duty; import VAT, excise duty and vehicle registration fee.
In the case of used vehicles, in addition to invoice, road manifest or bill of lading as the case may be, export bill of entry from the country of export, JEVIC Inspection Certificate required by the Zambia Bureau of Standards and Interpol Clearance are also required. The duties and taxes on used vehicles are specific and based on the age and type of vehicles. The tax amounts are legislated and therefore known to the importer and customs broker. In addition, vehicle registration fee and carbon emissions surtax are also payable.
Demand for used vehicles is high because of limited disposal income and lack of vehicle-assembly plants. Cheaper used vehicles allow households/businesses to own vehicles. According to the Nkanga Shimwandwe, Deputy Commissioner, Customs Services, Zambia Revenue Authority, Chrispin Simwanza, Principal Inspector and Head—Air and Noise, Zambia Environmental Management Agency, and Joseph Mumba, Principal Registration Officer, Road Transport and Safety Agency, Zambia, ownership of used vehicles has high maintenance costs

72
CLUNKERED
due to frequent breakdowns. This compromises road safety as these vehicles are often not roadworthy. There is also the propensity to wrongly declare the age of the motor vehicle to lower tax rates.51
Currently, older vehicles attract higher duties and taxes. The feeling is that short-term policy options need to be micro-finance facilities to enable public and private entities to procure new vehicles, strengthening pre-shipment road worthiness assessments. This requires changes in the current import duty and excise tax treatment for imported vehicles. This should be further supported by age cap on imported vehicles. The medium to long-term policy options are strengthening of public transport system, introduction of non-motorized transport system and incentives for establishment of vehicle-assembly plant. Therefore implementation of clean vehicle importation policy is important for cleaner environment and improved road safety. This will require clarity, efficiency and transparency, and reduce corruption in vehicle importation.52
Lesson from Zambia: The experience of Zambia brings out the importance of linking tax measures with age cap. Currently they have imposed higher taxes on older vehicles which is a right principle. But without a robust monitoring system and weak documentation the system can be compromised by underreporting age of vehicles. Enforcement is a challenge. Moreover, as the officials point out, it is also important to come up with fiscal incentive structures to encourage people to buy newer vehicles that are more expensive.
Swaziland Fiscal measures: Swaziland has imposed a three and six per cent levy on used non-Southern African Customs Union (SACU) vehicles imported from Dubai and those subsequently shipped elsewhere in the Middle East and Asia.
This levy to be implemented in April has been imposed on all vehicle import from outside the region in terms of Legal notice number 35 of 2018. Three per cent levy of the total value will be imposed on six- to ten-year-old vehicle and a six per cent levy on 11–15-year-old vehicles. According to vehicle dealers, the levy will increase the vehicle prices and lead to a drastic decline in Dubai-vehicle sales as buyers will prefer SACU-produced vehicles.53
South AsiaAmong the countries of South Asia, Afghanistan, Bangladesh, Bhutan, Myanmar, Maldives, Nepal, Sri Lanka and Pakistan are vehicle-importing countries. These countries have limited vehicle-assembly capacity. India is a vehicle-producing country and an exporter of fuel and vehicles. The South Asian market is unique as it is confined to the contiguous geography of Asia. Japan, China and India are key exporters in this region. India and China do not export used vehicles legally. But anecdotal evidences suggest that there is grey market in used vehicles from India through its porous borders to neighbouring countries.
Improvement in emissions regulations in the key exporting countries of Asia. India, China and Japan can thus have profound impacts on markets across South Asia and rest of Asia. Japan is already a frontrunner in vehicle technologies. India and China are also quickening steps to meet the Euro VI benchmark. This creates enormous opportunity for the rest of the region to align and allow upward harmonization and counter the threat of dumping.
All countries in South Asia have already begun to take effective steps to regulate and improve the benchmark for vehicle import to reduce emissions
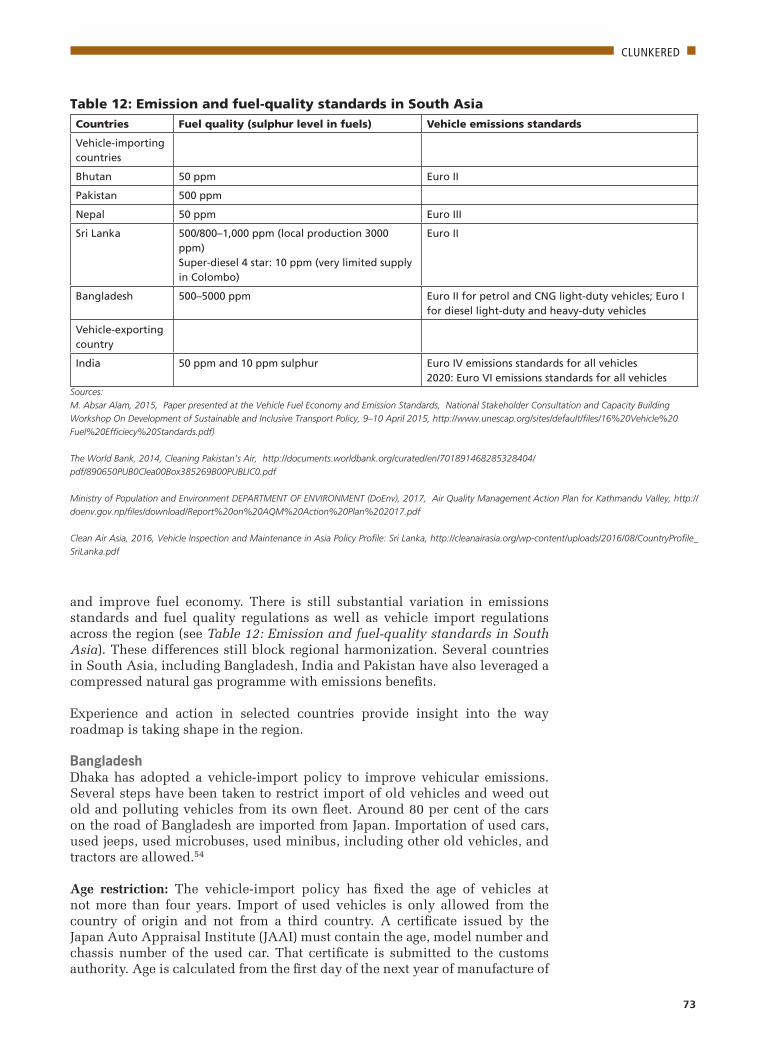
73
CLUNKERED
and improve fuel economy. There is still substantial variation in emissions standards and fuel quality regulations as well as vehicle import regulations across the region (see Table 12: Emission and fuel-quality standards in South Asia). These differences still block regional harmonization. Several countries in South Asia, including Bangladesh, India and Pakistan have also leveraged a compressed natural gas programme with emissions benefits.
Experience and action in selected countries provide insight into the way roadmap is taking shape in the region.
Bangladesh Dhaka has adopted a vehicle-import policy to improve vehicular emissions. Several steps have been taken to restrict import of old vehicles and weed out old and polluting vehicles from its own fleet. Around 80 per cent of the cars on the road of Bangladesh are imported from Japan. Importation of used cars, used jeeps, used microbuses, used minibus, including other old vehicles, and tractors are allowed.54
Age restriction: The vehicle-import policy has fixed the age of vehicles at not more than four years. Import of used vehicles is only allowed from the country of origin and not from a third country. A certificate issued by the Japan Auto Appraisal Institute (JAAI) must contain the age, model number and chassis number of the used car. That certificate is submitted to the customs authority. Age is calculated from the first day of the next year of manufacture of
Table 12: Emission and fuel-quality standards in South AsiaCountries Fuel quality (sulphur level in fuels) Vehicle emissions standards
Vehicle-importing countries
Bhutan 50 ppm Euro II
Pakistan 500 ppm
Nepal 50 ppm Euro III
Sri Lanka 500/800–1,000 ppm (local production 3000 ppm)Super-diesel 4 star: 10 ppm (very limited supply in Colombo)
Euro II
Bangladesh 500–5000 ppm Euro II for petrol and CNG light-duty vehicles; Euro I for diesel light-duty and heavy-duty vehicles
Vehicle-exporting country
India 50 ppm and 10 ppm sulphur Euro IV emissions standards for all vehicles2020: Euro VI emissions standards for all vehicles
Sources:
M. Absar Alam, 2015, Paper presented at the Vehicle Fuel Economy and Emission Standards, National Stakeholder Consultation and Capacity Building
Workshop On Development of Sustainable and Inclusive Transport Policy, 9–10 April 2015, http://www.unescap.org/sites/default/files/16%20Vehicle%20
Fuel%20Efficiecy%20Standards.pdf)
The World Bank, 2014, Cleaning Pakistan’s Air, http://documents.worldbank.org/curated/en/701891468285328404/
pdf/890650PUB0Clea00Box385269B00PUBLIC0.pdf
Ministry of Population and Environment DEPARTMENT OF ENVIRONMENT (DoEnv), 2017, Air Quality Management Action Plan for Kathmandu Valley, http://
doenv.gov.np/files/download/Report%20on%20AQM%20Action%20Plan%202017.pdf
Clean Air Asia, 2016, Vehicle Inspection and Maintenance in Asia Policy Profile: Sri Lanka, http://cleanairasia.org/wp-content/uploads/2016/08/CountryProfile_
SriLanka.pdf

74
CLUNKERED
Spotlight on Nigeria
The challenge of used-vehicle import: Till 2013, Nigeria had about 5.7 million registered vehicles and was fourth in Africa,
after South Africa, Algeria and Egypt.1 One third of country’s vehicles are concentrated in Lagos state alone. A 2016 report of
PricewaterhouseCoopers Limited (PwC), called Africa’s Next Automotive Hub, shows that only 11 per cent of second-hand cars are
equal to or less than five years old; 26 per cent are in the age bracket of 6–11 years; 50 per cent are in the 12–18 years age bracket
and 13 per cent are over 19 years. Thus, overall 89 per cent are over five years old.
Used-vehicle import is also pushing the market more towards larger and older vehicles that guzzle more fuel. Vehicle-segment-
wise analysis of used vehicles data by PwC shows 35 per cent are large cars, 24 per cent SUVs, 22 per cent small cars and the
remaining are pickup and commercial vehicles. Even though the majority of cars come from the US, Japanese cars dominate.
The large number of old and used vehicles have aggravated the problem of pollution and road safety in cities of Nigeria. In fact,
as per the records of the Federal Road Safety Corps, Nigeria (FRSC), and as shared by Efosa Peter Osawe, Corps Safety Engineering
Officer, there are evidences at FRSC to prove that these old vehicles represent 80 per cent of the vehicles involved in road traffic
crashes. Many of them are with faults that were recalled in the countries of origin. This requires serious attention as Nigeria is
motorizing steadily.
Nigeria is an important example in Africa that, though swamped with imported old vehicles, is gearing up to control this flow
effectively to build its own industry. In 2012, as per the records of the Nigerian Customs Service, over 75 per cent of its vehicles
were imported used vehicles.2 This influx had led to shutting down of 75 per cent of car and truck assembly plants in the country.3
Increasing manufacturing costs and customer demand for cheaper and a variety of brands were responsible.
Nigeria anticipates that the growing demand for imported vehicles in the populous country can have destabilizing effect on their
balance of payments. This needs to be offset by setting up vehicle-manufacturing facilities. Nigeria had started to promote local
assembly during the 1970s and 1980s, when the Federal government set up state-owned plants across the country. It drew up
agreements with European carmakers such as Peugeot Nigeria Ltd, Styer Nigeria Ltd and National Truck Manufacturers, Volkswagen
of Nigeria, Leyland Nigeria Ltd etc. But during 1990 and 2013, this process declined, coinciding with growing oil imports. This led
to the government divesting its interest in several companies, undermining local assembly. There is a new policy now to revive
the local car industry.4 A PwC study in 2016 has projected that Nigeria will generate 6 million new cars by 2050, when consumer
preference for new cars will increase and as a result demand for used car import will decline—from 70 per cent of import currently
to 35 per cent in 2028, and die out by 2034.5 Used cars, or Tokundo, will however continue to dominate until 2025.
Step towards local manufacturing: The government of Nigeria is now adopting strategies to build the local assembly. The
government has approved the New Automotive Industry Development Plan to curtail total dependence on import.6 The three
existing auto clusters in Nigeria are Lagos-Ogun-Oyo, Kaduna-Kano and Enugu-Anambra. Nigeria has also set up state-of-the-art
vehicle test centres with the help of the Automotive Research Association of India, where automotive products can be tested to
confirm with standards and vehicle homologation. The NADDC is collaborating with the standards organization of Nigeria to
develop 200 vehicle safety and component standards and also align with ISO quality certification. It is also setting up auxiliary
industry. They are also revamping the vehicle roadworthiness inspection system.
Tightening of tax measures for vehicle import: One of key strategies to support this initiative is to adopt tougher policies on
vehicle import. The Nigerian government is increasing the cost of import. Fiscal policy is being designed so that it helps create an
environment in which existing assembly plants survive and grow, and incentivizes incorporation of local components. The fiscal
measures, which include a sliding scale of tariffs and levies, came into effect in July 2014 for import substitution. The NADP sets
the tariff at a maximum of 70 per cent (35 per cent duty plus 35 per cent levy) for fully built-up cars and 35 per cent duty without
levy for commercial vehicles in the first place. This level is expected to decrease only after the sector grows competitive. Completely
knocked down parts (CKD) and semi-knocked down parts (SKD) for assembling will be charged 0 per cent, and 5–10 per cent duty7
(see Table: Progressive change in import tariff, 2014–15 to 2017–18). Previously, importers and car dealers paid 20 per cent duty
along with a 2 per cent levy on cars. As much as 70 per cent tariff on fully built imported vehicles has been implemented in January
2015. Vehicle purchase credit is also being promoted to encourage purchase of locally assembled new vehicles.
Fiscal measure makes impact on vehicle imports: During the last three years, vehicles imported from Europe, Asia and the
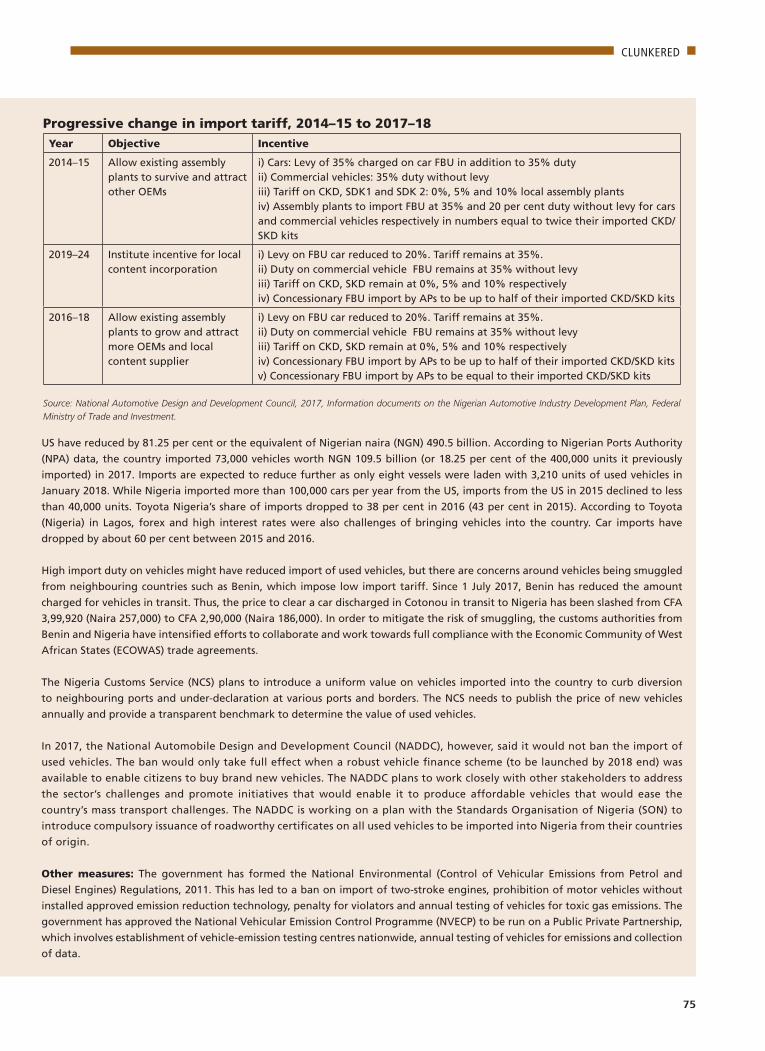
75
CLUNKERED
US have reduced by 81.25 per cent or the equivalent of Nigerian naira (NGN) 490.5 billion. According to Nigerian Ports Authority
(NPA) data, the country imported 73,000 vehicles worth NGN 109.5 billion (or 18.25 per cent of the 400,000 units it previously
imported) in 2017. Imports are expected to reduce further as only eight vessels were laden with 3,210 units of used vehicles in
January 2018. While Nigeria imported more than 100,000 cars per year from the US, imports from the US in 2015 declined to less
than 40,000 units. Toyota Nigeria’s share of imports dropped to 38 per cent in 2016 (43 per cent in 2015). According to Toyota
(Nigeria) in Lagos, forex and high interest rates were also challenges of bringing vehicles into the country. Car imports have
dropped by about 60 per cent between 2015 and 2016.
High import duty on vehicles might have reduced import of used vehicles, but there are concerns around vehicles being smuggled
from neighbouring countries such as Benin, which impose low import tariff. Since 1 July 2017, Benin has reduced the amount
charged for vehicles in transit. Thus, the price to clear a car discharged in Cotonou in transit to Nigeria has been slashed from CFA
3,99,920 (Naira 257,000) to CFA 2,90,000 (Naira 186,000). In order to mitigate the risk of smuggling, the customs authorities from
Benin and Nigeria have intensified efforts to collaborate and work towards full compliance with the Economic Community of West
African States (ECOWAS) trade agreements.
The Nigeria Customs Service (NCS) plans to introduce a uniform value on vehicles imported into the country to curb diversion
to neighbouring ports and under-declaration at various ports and borders. The NCS needs to publish the price of new vehicles
annually and provide a transparent benchmark to determine the value of used vehicles.
In 2017, the National Automobile Design and Development Council (NADDC), however, said it would not ban the import of
used vehicles. The ban would only take full effect when a robust vehicle finance scheme (to be launched by 2018 end) was
available to enable citizens to buy brand new vehicles. The NADDC plans to work closely with other stakeholders to address
the sector’s challenges and promote initiatives that would enable it to produce affordable vehicles that would ease the
country’s mass transport challenges. The NADDC is working on a plan with the Standards Organisation of Nigeria (SON) to
introduce compulsory issuance of roadworthy certificates on all used vehicles to be imported into Nigeria from their countries
of origin.
Other measures: The government has formed the National Environmental (Control of Vehicular Emissions from Petrol and
Diesel Engines) Regulations, 2011. This has led to a ban on import of two-stroke engines, prohibition of motor vehicles without
installed approved emission reduction technology, penalty for violators and annual testing of vehicles for toxic gas emissions. The
government has approved the National Vehicular Emission Control Programme (NVECP) to be run on a Public Private Partnership,
which involves establishment of vehicle-emission testing centres nationwide, annual testing of vehicles for emissions and collection
of data.
Progressive change in import tariff, 2014–15 to 2017–18Year Objective Incentive
2014–15 Allow existing assembly plants to survive and attract other OEMs
i) Cars: Levy of 35% charged on car FBU in addition to 35% dutyii) Commercial vehicles: 35% duty without levyiii) Tariff on CKD, SDK1 and SDK 2: 0%, 5% and 10% local assembly plantsiv) Assembly plants to import FBU at 35% and 20 per cent duty without levy for cars and commercial vehicles respectively in numbers equal to twice their imported CKD/SKD kits
2019–24 Institute incentive for local content incorporation
i) Levy on FBU car reduced to 20%. Tariff remains at 35%.ii) Duty on commercial vehicle FBU remains at 35% without levy iii) Tariff on CKD, SKD remain at 0%, 5% and 10% respectivelyiv) Concessionary FBU import by APs to be up to half of their imported CKD/SKD kits
2016–18 Allow existing assembly plants to grow and attract more OEMs and local content supplier
i) Levy on FBU car reduced to 20%. Tariff remains at 35%.ii) Duty on commercial vehicle FBU remains at 35% without levy iii) Tariff on CKD, SKD remain at 0%, 5% and 10% respectivelyiv) Concessionary FBU import by APs to be up to half of their imported CKD/SKD kitsv) Concessionary FBU import by APs to be equal to their imported CKD/SKD kits
Source: National Automotive Design and Development Council, 2017, Information documents on the Nigerian Automotive Industry Development Plan, Federal
Ministry of Trade and Investment.

76
CLUNKERED
Emissions standards and fuel quality: Nigeria has come up with a notification to introduce 50 ppm sulphur diesel and 150 ppm
sulphur gasoline. This is likely to be implemented in 2019. But a unique strategy in Nigeria is that diesel fuel is priced higher than
gasoline fuel. This has worked effectively to stop dieselization of cars.
Lessons from Nigeria: Nigeria sets a clear example of ramping up tighter controls on imports as it has explicitly linked the
objective of promoting its own vehicle industry, primarily to protect its balance if payment. Nigeria has an additional advantage
in its oil and gas reserves. Thus, developing its oil and vehicle industry works for its economy. The industrial policy has therefore
encouraged tougher import taxes that have helped to reduce imports substantially.8 But as the lesson from across Africa has shown,
it is important to adopt tighter emission standards and fuel quality at the early stages of industrial development and motorization.
Even though Nigeria has framed notification to introduce 50 ppm sulphur fuel, its implementation is getting delayed. Without the
fuel it will not be possible to adopt tighter emissions standards.
Nigeria also sets the example of taking additional measures to ban more polluting technologies like two-stroke engines. This has
helped to avoid enormous pollution.
Spotlight on Ethiopia
Ethiopia is another example of a country promoting local assembly and manufacturing of vehicles but has not yet framed a
deliberate policy to curtail vehicle import.
As much as 85 per cent of imported vehicles that come largely via the Gulf States, through the Port of Djibouti, are old and used
vehicles. Motorization is riding high on these vehicles. Ethiopia has little less than one million vehicles. Nearly 70 per cent of the
vehicle fleet is six to over 15 years old. According to the data shared by the Addis Ababa Transport Authority with the Centre for
Science and Environment, vehicle numbers have increased by six times since 2002 from a small base level. About 35.6 per cent of
cars are more than 10 years old (see Graph: Age profile of vehicles in Ethiopia).
According to Nigussie Kebede, Director for Urban and Rural Transport Service Support, Federal Transport Authority Ethiopia,
the vehicle fleet consists of very old vehicles and without adequate maintenance. On an average, vehicles being imported in the
country are 20 or more years old. The age of most of the national fleet is believed to be 30 or more years. However, most of the
public-transport buses are new; even trucks are of a newer vintage.
Age restriction: Currently, there is no age limit for vehicles being imported in Ethiopia. The Ethiopian Revenues and Customs
Authority (ERCA) is currently working on new version of tariff tax proposal has proposed limit for imported vehicles. The Ministry
Age profile of vehicles in Ethiopia Age-wise registered vehicle fleet Age-wise registered car fleet
0-1 years 7%
1-2 years 11%
2-3 years 13%
3-4 years 13%
4-5 years 14%
5-7 years 14%
7-9 years 17%
>= 10 years 12% 0-1 years 5%
1-2 years 9%
2-3 years 9%
3-4 ye10% ars
4-5 years 10%
5-7 years 11%
7-9 years 11%
>= 10 years 35%
Source: CSE analysis of 2014–15 vehicle registration data from Addis Ababa Transport Authority

77
CLUNKERED
Another good practice has been to price diesel fuel higher than gasoline. This has discouraged dieselization. This is an important
strategy as the massive diesel car phase out in Europe is likely to lead to massive influx in this part of the world.
Sources:
1. Anon. 2015, The African & Nigerian Automotive Industry-Market Report 2015, XCom Africa
2. WHO 2016, Global Health Data Repository, http://apps.who.int/gho/data/node.main.A995 as accessed on 20 June 2016
3. WHO 2016, Global Health Data Repository, http://apps.who.int/gho/data/node.main.A995 as accessed on 20 June 2016
4. PricewaterhouseCoopers Limited, 2016 Africa’s next automotive hub, 2016, Nigeria Automotive Industry, https://www.pwc.com/ng/en/assets/pdf/africas-
next-automotive-hub.pdf
5. PricewaterhouseCoopers Limited, 2016 Africa’s next automotive hub, 2016, Nigeria Automotive Industry, https://www.pwc.com/ng/en/assets/pdf/africas-
next-automotive-hub.pdf
6. National Automotive Design and development Council, 2017, Information documents on the Nigerian Automotive Industry Development Plan, Federal
Ministry of Trade and Investment
7. Automotive Design and development Council, 2017, Information documents on the Nigerian Automotive Industry Development Plan, Federal Ministry of
Trade and Investment.
8. National Automotive Design and development Council, 2017, Information documents on the Nigerian Automotive Industry Development Plan, Federal
Ministry of Trade and Investment.
of Transport has submitted a proposal to limit the vehicle age to a maximum of eight years to reduce air pollution and public
health impacts. The proposal also aims to ban import of any vehicle and engine whose manufacturers have stopped production.
Fiscal strategy: Even though Ethiopia is among the few countries that have started to assemble new vehicles, imported vehicles
outnumber new assembled vehicles. Current tax measures are not designed to provide incentives for newly assembled vehicles
over imported vehicles.
According to experts, the excise tax on import of vehicle parts and additional excise tax after assembly makes locally assembled
vehicles more expensive. For example, a brand new 2014 Lifan 520 model is sold for 288,000 Br (Ethiopian Birr) while a 1989 to
1990 Toyota Corolla locally dubbed Weyane DX model is sold for 2,90,000–3,20,000 Br. Similarly, a 2014 Lifan 620 model is sold for
4,18,000 Br while a Toyota Corolla Executive model is sold for almost the same price.
Endale Yimer, Senior Tariff Classification Expert, Ethiopian Revenues and Customs Authority (ERCA), confirms that currently
Ethiopian tax policy encourages import of used cars because new cars have higher taxation than used ones. This tax strategy is very
different from Nigeria’s, which is also promoting its own vehicle manufacturing and for that is making import of vehicles more
expensive.
The total tax systems have a cumulative effect. The cost of a vehicle till Ethiopia’s border is cost plus insurance and freight (CIF).
Therefore, the total payment made for import of new vehicles is the sum of five types of taxes: Customs amount (CIF multiplied
by customs rate), excise tax (sum of CIF and customs multiplied by the excise rate), VAT amount (sum of CIF, customs and excise
tax multiplied by VAT rate), sur tax (sum of CIF, customs amount, excise tax and VAT multiplied by sur tax rate) and withholding
tax (CIF multiplied by withholding rate). But in the case of import of used cars, depreciation amount (in years) is deducted, which
makes imported used cars cheaper. For example, in the case of a car that is less than or two year old, 10 per cent is deducted from
the CIF; two years and less than three years and greater than three years, the depreciation amount is 20 per cent and 30 per cent.1
This clearly shows that depreciation amount increases with vehicle age and hence preference for used cars by Ethiopian importers.
The vehicle taxation parameters include vehicle type, manufacturing year, engine capacity and loading and seating capacity. There
is however no tax for local vehicle manufactures. The government collects 40 per cent of the total tax revenue from used cars.2
According to Yimer, both new and old cars are charged 35 per cent custom duty, the only difference being the depreciation cost,
which is higher (US $150) in the case of new cars and less (US $100) for old cars. This policy needs a relook.
The ERCA’s new version of tariff tax proposal has proposed three-level tax rate structure—higher rate for used vehicles, medium
for new vehicles and a lower rate for electric/solar and locally assembled vehicles. There are plans to impose mandatory certificate
requirement for imported vehicles.3

78
CLUNKERED
However, import tax measures have certain good elements. It prioritizes public transport over personal vehicles and therefore
taxes cars higher than public transport and freight vehicles. The custom duty is same for all vehicles. Excise tax increases with
increase in engine capacity and type of vehicle (see Table: Tax rate for imported vehicles in Ethiopia).
Emissions standards and fuel quality: Ethiopia is developing draft emission standards for vehicles. This will address the issues
of fuel quality, type and age of vehicles. The sulphur content in diesel is lowered from time to time but is still very high. The
maximum allowable sulphur in diesel fuel is 500 ppm and in gasoline 1,000 ppm. Quicker introduction of 50 ppm sulphur fuels will
enable harmonization (see Table: Progress towards implementing cleaner vehicular fuels). It is possible to design a fiscal strategy to
meet the cost of import of improved fuel quality. Local assembly plants should be encouraged to manufacture vehicles complying
with improved emissions standards.
Vehicle inspection: Efforts are being made in Ethiopia to organize vehicle-inspection centres to address the problem of in-use
emissions. The Road Transport Authority under the Ministry of Infrastructure in Ethiopia is the nodal agency responsible for
Tax rate for imported vehicles in Ethiopia (in per cent) No Goods/ Items Customs
duty %Excise tax
%Import Sur
tax %VAT % With holding
%
1. Public transport
Less than 15 and greater or equal to 10 seats
15 or more seats
35
10
-
-
-
-
15
15
3
3
Passenger cars less than 10 seats
2. Cylinder capacity not exceeding 1300 cc 35 30 10 15 3
3. Cylinder capacity 1300 cc but less than 1800 cc
35 60 10 15 3
4. Cylinder capacity exceeding 1800 cc and not exceeding 3000 cc
35 100 10 15 3
5. Electric/ battery vehicles 35 30 10 15 3
Trucks
6. Cargo vehicles (based on weight) up to 1500 kg
35 - - 15 3
7. Cargo vehicles >1500 kg 10 - - 15 3
8. Heavy-duty, 5-20 tonne 10 - - 15 3
Source: Ethiopian Revenues and Customs Authority
chassis. Import Tax Rate on used vehicles imported in Bangladesh from Japan consists of import tax (0–40 per cent) and VAT (15 per cent). An infrastructure development surcharge of 2.5 per cent is levied on imports. Also, excise taxes are levied on vehicles. Duty-free importation of one used vehicle is allowed only for diplomats and privileged persons. All other Bangladesh nationals and foreigners have to pay duties to import a used vehicle.55
Nationals returning to Bangladesh after ten years or more are regarded as ‘returning nationals’ and are eligible for importing one vehicle duty-free if the vehicle has been with the owner for at least two years. Consideration is given to the special circumstances of returning individuals and their likely contribution towards nation building. Returning nationals are also exempt from Bangladesh sales tax charges on a vehicle that has been owned by them for at least a year prior to its import and is used for personal purposes (see Box: Detailed vehicle

79
CLUNKERED
vehicle inspection. According to the Authority, regulations for all vehicles are required to undergo annual technical inspection at
a designated vehicle-inspection centre, where vehicle roadworthy tests are conducted along with exhaust emissions measurement
against the standard set by the Authority.
Lesson from Ethiopia: Promotion of local manufacturing and assembly will require control on import of old vehicles. This will
also require improved emissions standards and fuel quality to get commensurate benefits. Promoting local manufacturing without
improved emissions standards and controls on used vehicle import will not provide environmental benefits. The good practice in
Ethiopia is that their taxes are differentiated according to engine size; and cars are taxed higher than the public transport and
freight. Ethiopia is also considering moving to electric mobility especially for two-wheelers quite early on. Two-wheeler numbers
have begun to grow only now. This is an opportunity to link it with electric mobility. Ethiopia’s hydropower makes such an
initiative carbon neutral.Sources:
1. Endale Yimer, 2018, General Overview of Import Vehicle Policy and Taxation Systems of Ethiopia, Paper presented at the Training Workshop on Clean Air Action
Planning Strategies for Cities of Ethiopia, Nigeria and Kenya, Nimli, 5–9 February 2018.
2. Yehalem Tesera et al 2018, Roadmap for Clean Air, Paper presented at the Combating Dumping of Used Vehicles: Regional Consultation on Roadmap for Vehicle
Import Policy in Africa and South Asia for Clean Air, Centre for Science and Environment, Zanzibar, 31 May 2018.
3. Ibid.
Tax rate for imported vehicles in Ethiopia (in per cent) No Goods/ Items Customs
duty %Excise tax
%Import Sur
tax %VAT % With holding
%
1. Public transport
Less than 15 and greater or equal to 10 seats
15 or more seats
35
10
-
-
-
-
15
15
3
3
Passenger cars less than 10 seats
2. Cylinder capacity not exceeding 1300 cc 35 30 10 15 3
3. Cylinder capacity 1300 cc but less than 1800 cc
35 60 10 15 3
4. Cylinder capacity exceeding 1800 cc and not exceeding 3000 cc
35 100 10 15 3
5. Electric/ battery vehicles 35 30 10 15 3
Trucks
6. Cargo vehicles (based on weight) up to 1500 kg
35 - - 15 3
7. Cargo vehicles >1500 kg 10 - - 15 3
8. Heavy-duty, 5-20 tonne 10 - - 15 3
Source: Ethiopian Revenues and Customs Authority
Progress towards implementing cleaner vehicular fuelsAverage sulphur
content of imported gasoline in ppm
Minimum ppm
Maximum ppm
2004 610 40 900
2005 150 40 900
2006 560 200 900
2007 750 700 900
2008 391 40 800
2009 380 40 900
2010 120 40 900
2011 244 40 600
2012 550 400 1000
2013 395.6 37 1000
2014 204.75 32 1000
2015 217.5 40 900
Average sulphur content of imported diesel in ppm
Minimum ppm
Maximum ppm
2004 9,130 7,000 9,900
2005 6,100 3,100 9,700
2006 4,990 1,400 9,500
2007 4,480 2,800 4,800
2008 4,410 4,000 9,300
2009 4,770 3,800 4,900
2010 4,580 3,400 5,000
2011 4,690 4,000 5,000
2012 4,750 4,700 4,800
2013 1,855 243 4,800
2014 805 269 1,800
2015 925 245 1,850
Source: Manaye Balcha 2015, Transport fuel quality specification, Paper presented at the Stakeholder Workshop on Air quality and transportation challenges
in Ethiopia and agenda for Clean Air Action Plan, Ministry of Environment and Forest, The Federal Democratic Republic of Ethiopia and Centre for Science and
Environment, Addis Ababa, 8 September.
import regulations in Bangladesh). These conditions have made a significant impact.
Supportive action for on-road vehicles: Action on vehicle import is supported by a range of other measures. Bangladesh has taken action to remove old and polluting vehicles from its fleet in its capital Dhaka, with impressive results. It is estimated that a ban on highly polluting three-wheelers with two-stroke engines or baby taxis led to an estimated reduction of 40 per cent of particulate emissions from the transport sector.56 It has since 2002 banned trucks older than 25 years and buses older than 20 years in domestic market.
Emissions standards and fuel quality: Benefits from the five-year cap on imported vehicles can be maximized if national emissions standards for vehicles and fuels become tighter. Otherwise, the emissions from the less than

80
CLUNKERED
Detailed vehicle import regulations in Bangladesh
Motor cars of any engine capacity, microbuses, minibuses and jeeps, old vehicles and tractors are importable under the following conditions:1
• No vehicle shall be over five years old in the case of shipment; • Old vehicles shall be importable only from the country of its origin. Old vehicles shall not be importable from any
third country except those which were used personally and are to be used personally. In the case of import from a third country, a certificate of registration and certificate of cancellation of registration (from the country of use) will need to be submitted to the customs authority;
• A certificate containing age, model number and chassis number of the old car will have to be submitted to the custom authority from the Japan Auto Appraisal Institute (JAAI) in the case of import of cars from Japan, and from the recognized Automobile Association in the case of import of old cars from other countries;
• To determine the date/age of an imported old car, the date/age is calculated from the first day of the next year of manufacture of chassis;
• In the case of imported cars from Japan, date of manufacture shall be determined after examining the chassis book published by the Japan Automobile Association; for imported vehicles from other countries date of manufacture will be determined by examining the chassis book published by the concerned government-approved Automobile Association. No old car or vehicle shall be importable from a country that does not publish chassis books;
• With respect to catalytic converters in petrol-driven cars and connection of diesel particulate filter in diesel-driven cars, action shall be taken as per S.R.O.29-law/2002 dated 16 February 2002 issued by the Ministry of Environment and Forest;
• No car shall be importable without seat belt; • Windshield glass and window glasses on both sides of the driver’s seat must be transparent so that inside of the car
is visible. • Three-wheeler vehicles of two-stroke engine (tempo, auto rickshaw etc.) are banned for import.
Source:
1. Import Policy Order 2015-2018, Ministry of Commerce, Government of the People’s Republic of Bangladesh, http://mincom.portal.gov.bd/sites/
default/files/files/mincom.portal.gov.bd/page/e177ee18_f389_4f9e_a40c_57435cfac5b2/Import%20Policy.pdf
five-year-old vehicles from the advanced markets will be grossly compromised. According to the current roadmap, Bangladesh will introduce 50 ppm sulphur fuels in 2023. Currently, the diesel fuel quality is 500 ppm and this is linked with Euro I standards57 (see Table 13: Vehicular emission standards in Bangladesh).
However, Bangladesh has taken strident steps to expand its CNG and LPG programme. In fact, CNG is one of the most successful programmes, with over 70 per cent of the city’s fleet running on clean fuel. Studies carried out in
Table 13: Vehicular-emission standards in BangladeshVehicle type Present 2018 2020
Light-duty diesel vehicles withGVW≤ 2,500 kg
EURO I EURO II EURO III
All cars and light-duty diesel vehicles with GVW: 2,500–3,500 kg
EURO I EURO II EURO III
Light-duty petrol and CNG vehicles withGVW≤ 2,500 kg
EURO II EURO III EURO IV
All cars and light-duty petrol and CNG vehicles with GVW: 2,500–3,500 kg
EURO II EURO III EURO IV
All commercial diesel vehicles > 3,500 kg EURO I EURO II EURO III
All commercial CNG vehicles > 3,500 kg EURO II EURO III EURO IV
Source: Noor E. Alam, 2018 Paper presented at the UNEP workshop, Challenges in implementing stricter vehicle emission
standards in Bangladesh, Bangladesh, March 2018.
81
CLUNKERED
Dhaka have already shown that the CNG programme has helped prevent 4,260 premature deaths annually in the city. The health-cost saving is close to 1 per cent of the GDP; 5,000 vehicles have now been moved to LPG.58
Lesson from Bangladesh: Bangladesh has taken progressive steps to eliminate very old vehicles from its imported fleet. This is backed by age regulations of commercial vehicles in the domestic market. However, Bangladesh is not being able to get the full benefit of lowering the age of import to five years as it has not yet adopted tighter emissions standards for vehicles and fuels. The natural gas vehicle programme has given it a substantial advantage to improve emissions. But this will require strong quality control.
Bhutan Even though Bhutan is a small landlocked hill country located in a pristine environment, its capital city Thimpu is facing air pollution problem due to the valley effect. As of April 2018 Bhutan has 94,956 vehicles—this number is rising rapidly. Between1997 and 2017, the vehicular fleet increased by 577 per cent. Personal cars and two-wheelers are 65 per cent and 11 per cent of the total fleet respectively—together they add up to 76 per cent. According to the Bhutan Transport 2040 Integrated Strategic Vision 2011 document, the vehicle fleet is projected to increase substantially by 2040. Vehicle category-wise projection conducted by Grütter Consulting in 2017 shows a sharp increasing trend in passenger cars followed by heavy-duty vehicles greater than 7.5 tonnes; the data shows that passenger cars are the second highest emitter of PM, NO2 and SO2, after heavy-duty vehicles.
Bhutan aims to reduce annual average levels of all air pollutants to below the WHO guidelines by 2025. Accordingly, emissions of SO2, NOs, and PM from vehicles are proposed to be reduced by 65–95 per cent of 2015 emissions levels by 2030, and CO2 emissions from the transport sector by 25 per cent by 2030. Bhutan is in the process of designing a low-carbon vehicle strategy and tap international climate finance to assist in its implementation.
Banned used-vehicle import: Bhutan has been the first country among the vehicle-importing countries in the region to take an early decision in 1999 to ban import of second-hand vehicles regardless of the origin in view of rising emissions and risk of Bhutan becoming a junkyard of used vehicles.59 Before 1999, second-hand vehicles could be bought from India and other countries. From 1994, reconditioned vehicles mostly from Japan started coming into the country. In 1999, second-hand/reconditioned vehicle import regardless of the country of origin was banned. With regard to two-wheelers, only four-stroke two-wheelers are allowed; three-wheelers and tempos are not registered in the country. Bhutan also regulates the age of the on-road fleet. The age limit for commercial vehicles, including high-end buses, is 14 years and for other buses and taxis it is nine years.60
However, in 2013, the government made an exception to allow import of certain vehicles meant for public use and those that came as grant assistance such as second-hand ambulances, fire-fighting vehicles and garbage trucks that were less than 10 years old. Further, in 2014, partial modification was done and the government approved import of used electric Nissan Leaf vehicles with mileage less than 30,000 km that can be used as taxis.61
Certain exemptions have been made in the case of foreign diplomats and employees of international organizations, who may bring in their used vehicles

82
CLUNKERED
on their transfer to Bhutan, subject to re-export on repatriation. Under certain conditions, Bhutanese nationals temporarily stationed abroad would be permitted to bring in the used vehicles if they have worked in a third country for a period of at least two years. The vehicle must be procured and registered in the Bhutanese national’s name in the country of residence at least one year prior to its import into Bhutan; the vehicle procured abroad is new, not second hand; and duty and sales tax applicable shall be payable.62 Only new vehicles can be registered in the country; used vehicles registered in another country cannot be registered in Bhutan (see Box: Import regulations and new proposals in Bhutan).
According to the 2016 Bhutan Trade Statistics, Bhutan imports diesel fuel and new passenger cars, transport goods vehicles from India; and cars and commercial vehicles from Japan, Korea and Thailand. Bhutan imports dominant model vehicles from India (Maruti, Tata, Mahindra, Ford, Nissan etc.), Japan (Toyota, hybrids, power tillers, earth moving machines), South Korea (Hyundai, Kia, Sorento), China (pickups and buses), Vietnam (power tillers) and Thailand (pickups and vehicle parts). It has taken very important steps and has shown how import regulations can be used to stop import of used vehicles and also leverage it to promote electric mobility in the country.
The next steps for Bhutan are implementation of the National Transport Policy,
Import regulations and new proposals in Bhutan
Tax according to engine size: The available information on Bhutan’s import regulations for vehicles show that Bhutan has elaborate duties and taxes according to the engine size of cars.1 • Engine capacity up to 1500 cc: 45 per cent customs duty, 45 per cent sales tax and 10 per cent green tax.• Engine capacity 1500 –1799 cc: 50 per cent customs duty, 50 per cent sales tax and 15 per cent green tax.• Engine capacity 1799 –2500 cc: 50 per cent customs duty, 50 per cent sales tax and 20 per cent green tax.• Engine capacity 2500–3000 cc: 50 per cent customs duty, 50 per cent sales tax and 25 per cent green tax.• Engine capacity above 3000 cc: 100 per cent customs duty, 50 per cent sales tax and 30 per cent green tax.• Vehicles imported from India are exempt from customs duty.
Second hand vehicles that are allowed limited entry and are running in the country requires to pay an additional 5 per cent green tax on fuel that is embedded in the price of every litre of petrol and diesel to support the government’s policy of clean and sustainable transportation system.
Electric and hybrid cars: For hybrid cars of up to 1500 cc, a sales tax of 20 per cent, another 20 per cent customs duty and 5 per cent green tax, totalling 45 per cent is levied. It increases by five per cent for every higher engine specification.2
New proposal on differential taxes, tax exemptions on electric and hybrid vehicles. Measures such as high ‘feebates’ or fuel surcharge being explored to disincentivize private diesel vehicles.3
Vehicle inspection: All in-use vehicles are subjected to bi-annual emissions testing. These include smoke density tests in diesel vehicles and idling carbon monoxide and hydrocarbon in petrol vehicles. Auditing of emission testing centres is carried out regularly. Efforts are being made to link test data with vehicle registration data to identify and track vehicles that have not been tested yet. This will require proper vehicle registration at ports of entry.
Sources:
1. Japanese Car Trade.com, 2017-18, Bhutan Import Regulation for Japan Used Cars, https://info.japanesecartrade.com/content-item/514-bhutan-
import-regulation-for-japan-used-cars
2. Cars. BT, 2015, Vehicle Import Tax, http://cars.bt/newcars/vehicle-import-tax/
3. Karma Pemba, 2018, Sharing Bhutan’s Experience on Regulations of Vehicle Import, Banning of Used Vehicles: Impact, Lessons and Next Steps,
Paper presented at the Combating Dumping of Used Vehicles: Regional Consultation on Roadmap for Vehicle Import Policy in Africa and South Asia
for Clean Air, Centre for Science and Environment, Zanzibar, 31 May 2018.

83
CLUNKERED
promotion of eco-friendly vehicles (start with replacement of 300 taxis with EV taxis), implementation of low-carbon vehicle strategy, implementation of the revised Surface Transport Act, and tightening of standards.
Emission standards and fuel quality: Bhutan has just mooted the proposal to import only diesel and gasoline fuels with less than 50 ppm sulphur in line with the Indian fuel and vehicle standard in 2018 and subsequently fuel quality with less than 10 ppm sulphur in 2020 when India will also make the transition to Euro VI level. It will also implement new vehicle-emission standards for gasoline and diesel vehicles in the near future.63
Bhutan has already increased the sales tax and import tax by 50 per cent so that the cost of importing and owning a car becomes expensive for customers. The final revised national transport policy proposes phasing out of old vehicles. Bhutan will also frame appropriate regulations related to end-of-life of vehicles, which would include process of disposal of vehicles once they reach their end of life.64
Lesson from Bhutan: Very early on, Bhutan acknowledged its geographical constraint and the high risk from motorization in the landlocked valleys that are hugely vulnerable to pollution and congestion. Despite being a small country, it incorporated several progressive elements and aside from adopting stringent measures to control vehicle import—Bhutan banned import of used vehicles early in its growth—also took steps to align the emission-standards roadmap with the tighter emission standards in vehicle-producing countries in the region as well as evolve an incentive policy for electric vehicles. It adopted a holistic approach, with these strategies also linked with the integrated mobility strategies in which tax measures are being used to discourage personal vehicle ownership and particularly import of diesel cars. This combination of measures is an important learning curve in the region.
Nepal Nepal is motorizing rapidly and the trend has picked up since 2012. It has a registered vehicle fleet of 2.78 million (as of 2016–17). Motorcycles constitute 79 per cent of the total vehicles. Though the country is dependent on imported vehicles, it has taken effective steps to reduce import of used vehicles (see Box: Regulations on vehicle import in Nepal).
Ban on used vehicle import: Nepal had initially banned import of five-year-old vehicles. Subsequently, used-vehicle import was banned under the Financial Act in 2012. Only new vehicles complying with Euro III emission standard are allowed to be imported.65 All imported vehicles have to meet the Nepal Vehicle Mass Emission Standard. The government is now considering banning import of vehicles not meeting Euro IV emissions standard. The Nepal Automobile Dealers Association supports this move and predicts a 5 per cent increase in vehicle price.66
Nepalese citizens returning after completing their tenure in Nepalese diplomatic mission abroad and foreign diplomatic staff member working in Nepal are allowed to import personal used vehicles with official permission. According to information available from Nepal Customs, other Nepalese citizens are not allowed to import personal used vehicle in Nepal.
Fiscal strategy: Nepal imposes high import duty (288 per cent) on cars, making the import of cars expensive.67 High import duty on vehicles is a major source

84
CLUNKERED
of revenue for the government. Nepal is also making vehicle import more expensive.
Emission standards and fuel quality: Nepal has taken the progressive step forward by linking Euro III emission standards with vehicle import and is now considering moving to Euro IV emissions standards. Its fuel quality supply is linked to that in India. Since April 2017, the Nepal Oil Corporation (NOC) has been supplying Euro IV fuel and from 2020, NOC may supply Euro VI fuel.
Promoting electric vehicles: The current tax system gives concession to electric vehicles. The government has exempted VAT on import of electric three-wheelers, battery, electric motor and chassis. It has exempted components and parts required for converting to electric three-wheeler, catalytic converters, magnetizers and machines and equipment for battery recycling plant from full custom duty. It also allows partial custom duty exemption to hybrid vehicles (25 per cent), large buses with over 40 seats (95 per cent) and components for use in manufacturing electric rickshaws.
Regulations on vehicle import in Nepal
30 August 1999 (Nepal Gazette Part 49 Supplement 21 (A+1)• Registration of new two-stroke engine vehicles banned• Registration and transfer of title of diesel powered three-wheelers banned • 99 per cent custom duty and 100 per cent Value Added Tax (VAT) waived for entrepreneurs importing gasoline
powered 10–14 seater bus by displacing diesel three-wheelers
23 December 1999 Nepal Gazette Part 49 Pre-Supplement 38 (A+3) • Introduction and enforcement of Nepal Vehicle Mass Emission Standard 1999 (Equivalent to Euro I) except for
tractors, power tiller, dozer, loader, dumper, crane, roller and excavator
11 August 2000 Government Notification • Restriction on import of used items including machineries and their parts, engine pumps and piston heads
23 October 2000 • In-use Vehicle Emission Standard (Green Sticker Standard)
10 November 2000 (Nepal Gazette Part 50 Supplement 41) • Ban on operation of all types of vehicles in Nepal made prior to 1980 with effect from 16 November 2001• Ban on operation of two-stroke engine based vehicle and petrol or diesel fuelled three-wheelers inside Kathmandu
valley with effect from 16 November 2001 • Ban on operation of diesel three-wheelers all over Nepal
13 August 2012• Nepal Vehicle Mass Emission Standard 2012 (Equivalent to Euro III)
14 March 12016 • Strategic work plan for development of road, rail and transport for prosperous Nepal (2016–21), which included all
public vehicles to be scrapped within two years, that is 14 March 2018 and 20 per cent of all vehicles plying in the country to be converted to environment-friendly vehicles
22 February 2018• Revision of In-use Vehicle Emission Standard with effect from August 2018
Source: Ram Chandra Poudel 2018, Nepalese Experience on Management of Motor Vehicles, Paper presented at the Combating Dumping of Used
Vehicles: Regional Consultation on Roadmap for Vehicle Import Policy in Africa and South Asia for Clean Air, Centre for Science and Environment,
Zanzibar, 31 May 2018.

85
CLUNKERED
Vehicle inspection and certification for vehicle import: The Motor Vehicle and Transport Management Act 1993 mandates provision of type approval and conformity of production prior to vehicle import. Road-worthiness tests are carried out for assembled vehicles. At present there is no pre-shipment inspection done for imported new vehicles. Import is permitted upon submission of type approval and conformity of production certificates issued by a competent authority in the manufacturing country. Rule 39 (2) of the MVTMR mandates biannual road tests for public vehicles. This includes examination of the vehicle body, windows, seats, windscreen, headlights, sidelights, back lights and other lights, starting, pick-up and general tuning of engine, steering, brakes, gears, tyres, wheels, springs, tie-rod, noise and emissions.
System for verification of vehicles: Under the provisions of Finance Act-temporal for vehicle import, only an authorized dealer can import vehicles from the country of manufacture or from an authorized dealer in another country. If a vehicle is not being imported directly from the manufacturer, the importer should furnish a tripartite agreement between the manufacturer, exporting dealer and importer.
Strategic programmes for promoting environment friendly vehicles: Nepal is planning to promote its national industry. Government or government-owned entities will buy vehicles giving priority to national products, making at least 20 per cent of all vehicles environment friendly by 2020. Income tax, custom, VAT, excise duty and rebates will be designed accordingly and provide for exemptions under the Finance Act. It is also looking at tests, registration and operation, priority sector for bank credit, and cooperation between public, private and cooperatives for building green transport modes like ropeways, charging stations for electric vehicles and parking lots with solar-powered charging facilities for electric vehicles, and promotion of battery recycling industry. Strategies also include pollution tax on battery, separate lanes for cycles, conversion of old vehicles into electric vehicles and public transportation.68
Lesson from Nepal: Nepal has taken important parallel steps of banning import of used vehicles while linking improved emissions standards of Euro III with vehicle imports. It is now moving towards Euro IV emissions standards. Simultaneously, it is encouraging import of electric and hybrid vehicles and local assembly of electric vehicles. There are official plans to develop physical infrastructure and human resource for effective implementation and monitoring of existing standards and policies. There are plans to establish Mass Emission Lab to conduct tests on random sample of imported vehicles, and setting up of central database connecting emission testing centres. This is to be supported by seven vehicle fitness test centres across the country. More incentives and promotional steps are to be taken for import and production of electric vehicles and simplification of the testing and registration of such vehicles. There is official recognition of the importance of awareness raising programmes for transport entrepreneurs and the general public.
PakistanPakistan’s import policy order (2012–15)69 is a comprehensive policy for import of used vehicles, but its implementation has become complicated due to several import schemes. Import of all types of vehicles are regulated by the Used Vehicles Import Policy (see Box: Detailed regulations for vehicle import to Pakistan).

86
CLUNKERED
Age restriction: Pakistan has banned import of old used vehicles. The age limit for cars is three years and for buses, vans, trucks, pickups and SUVs (sport utility vehicles), including 4 x 4s, is five years. Import of used cars is allowed under only in the following schemes—bringing the vehicle into the country on transfer of residence from another country, and sending a vehicle as a gift to a family member residing in Pakistan (once in two years).
In 2011–12, import of used cars had reached an all-time high of 57,000 cars due to the relaxation in age limit from three to five years. In the subsequent year, however, the age limit was reduced to three years and imports dropped to 45,000 cars in 2012–13 and 29,000 in 2013–14.70
Lesson from Pakistan: Pakistan has demonstrated very effective application of age restriction on imported vehicles. It will benefit further from this strategy if improved emission standards of at least Euro IV level and commensurate fuel quality are adopted simultaneously. The advantage that Pakistan has over most other countries in South Asia is its extensive natural-gas-vehicle programme.
Sri LankaSri Lanka is heavily dependent on vehicle import as it does not have a local vehicle manufacturing industry nor a petroleum resource base. There is one small refinery that caters to about 35 per cent of the local demand. Sri Lanka, an island country, is motorizing rapidly. As of 2017, it has an active vehicle fleet of 5 million. Personal vehicles alone have increased by 83 per cent since 2000.71 Two-wheelers are 52 per cent of the fleet. Of 150 billion passenger-km per year every year, 94 per cent is by road, which contributes about 40 per cent of the greenhouse gas emissions72 and a significant amount of local air pollutants.According to Thusitha Sugathapala of the University of Moratuwa, Sri Lanka,
Detailed regulations for vehicle import to Pakistan
The following rules are implemented under the Used Vehicles Import Policy in Pakistan:• No used vehicles are allowed to be imported into Pakistan except through the following schemes:
o Personal baggage schemeo Transfer of residence scheme ando Gift scheme
• Age limit of three years to be continued in the case of cars• Age limit of five years to be continued in the case of buses, vans, trucks, pick-ups and SUVs, including 4 x 4 vehicles• Special Purpose Vehicles of the following HS codes older than five years shall be imported into Pakistan by the end-
user as specified in the Import Policy Order:o Prime movers of 280 HP and above (HS Code 8701.2040)o Concrete mixer lorries (HS Code 8705.4000)o Dumpers designed for off highway use (HS Code 8704.1090) ando Other (HS Code 8705.9000) including water sprinklers shall be maintained
• In addition to the aforementioned, the following are the conditions associated with the policy:o The Federal Board of Revenue issues a yearly schedule of import duties of all types of vehicles in US dollar
terms on 30 June of each yearo No relaxation regarding age and applicable duty is granted under any circumstanceo Ministry of Commerce has defined standard operating procedures (SOPs) under Import Policy Order for used
cars to prevent misuse of the facilityo The policy does not preclude import of brand new CBU (Completely Build Units) by individuals other than
expatriate Pakistanis on payment of prescribed import duty
Source: Ministries of Industry and Production, Government of Pakistan, 2016, Automotive Development Policy (ADP) 2016- 21, http://boi.gov.pk/boi/
userfiles1/file/AutoPolicy/APCompressed.pdf, as accessed on 24 April 2018.

87
CLUNKERED
who works with the government on key fuel-efficiency and pollution-related policies in the transport sector, the transport sector is heavily influenced by fiscal policies related to the import of vehicles as well as fuels.
Sri Lanka has designed its import policy to combat growing dieselization and import of very old second-hand vehicles. Diesel vehicles are 45 per cent of the total fleet of four-wheelers. Studies in Sri Lanka have attributed Rs 22–17 billion to health damage cost owing auto diesel emissions in Colombo. Diesel vehicles were responsible for 96–89 per cent of sulphur dioxide and particulate matter from the transportation sector. There were also concerns around growing import dependence on oil.
Sri Lanka has therefore adopted a series of tax and other regulatory measures to change the market towards cleaner vehicles. In the first phase it banned import of two-stroke powered two-wheelers and launched mandatory annual vehicle-emission testing programme in 2008. It also initiated conversion of three-wheelers to LPG/electric. It has started construction of a refinery that can produce Euro IV compatible diesel fuels.
Age cap in Sri Lanka: Sri Lanka has fixed the age for vehicle import—three years for passenger cars and three- and two-wheelers, and five years for vans, buses and lorries. Previously, second-hand vehicles imported for personal use had an age restriction of four years while those for business use had five years. Sri Lanka has also tried an age cap of two years for second-hand vehicles from Japan. All vehicles have to undergo roadworthiness inspection testing, and vehicles that fail must either be repaired or be taken off the road. In other words, very old used vehicles are not allowed in Sri Lanka.
While this age cap is expected to bring improved vehicle technology of Euro III or Euro IV and even better technology from Japan, the lack of commensurate fuel-quality locally constraints the potential of emissions benefits (see Table 14: Permitted age limits for import of used vehicles in Sri Lanka).73
Fiscal measures in Sri Lanka: The most strategic measure is the taxation policy, which is differentiated according to age, fuels, engine size and vehicle type. The 2018 Budget proposal (effective from November 2017) has adopted the policy vision that by 2040 all vehicles will be powered by renewable energy. By 2025, all government vehicles will be either electric vehicles or hybrid. Carbon tax will be imposed on all ICE/hybrid vehicles while electric vehicles will be exempt. Taxes will be imposed proportional to engine capacity; the larger the capacity range, the higher the rate.
Tax rates will increase for three age ranges: < 5 years; 5–10 yrs; > 10 years. Similarly, import tax for electric vehicles will be reduced; electric three-wheelers will be promoted; 50 e-buses will be procured for government-owned bus operators, and solar electric charging stations are proposed.74
Accordingly, several changes have been brought about in the tax regime. Prior to 2015, nine taxes and levies were in effect. Post 2015, further rationalization has been followed to simplify the tax system to three tax items (applied on FOB).
The new tax system for light-duty vehicles is proportional to engine capacity (on a linear scale)—higher rates for higher capacity ranges (see Table 15: Change in taxes based on fuel and engine capacity since 2015 in Sri Lanka).
Sri Lanka has adopted higher tax for diesel cars as compared to petrol cars

88
CLUNKERED
Table 14: Permitted age limits for import of used vehicles in Sri LankaDescription of vehicle Specifications Age limit (in years)
Road tractors (prime movers) 5
Agricultural tractors 10
Buses (10–12 passengers, including driver) 3 ½
Buses (13–24 passengers, including driver) 5
Buses (25 and above, including driver) 10
Motor cars 3
Trishaws 2
Sports utility vehicles (jeeps) 3
All-terrain vehicles (beach bikes) 3
Dual-purpose vehicles (vans) 4
Single cabs 4
Double cabs 4
Ambulances 3
Hearses 3
Motor homes 3
Lorries/trucks GVW less than 5MT
4
Lorries/trucks GVW above 5MT 10
Refrigerated trucks GVW less than 5MT
4
Refrigerated trucks GVW over 5MT 10
Milk bowsers GVW less than 5MT
5
Milk bowsers GVW over 5MT 10
Garbage trucks GVW less than 5MT
5
Garbage trucks GVW over 5MT 10
Crane lorries 10
Mobile drilling derricks 7
Fire-fighting vehicles 7
Concrete mixer lorries 10
Mobile workshops 7
Gully bowsers 7
Concrete pump trucks 10
Motor bikes 3
Source: Sri Lanka Customs, 2017, Moto Vehicle Unit, http://www.customs.gov.lk/declaration/mvu

89
CLUNKERED
and hybrid cars. Overall hybrid-petrol, petrol and diesel vehicles attract 58 per cent, 253 per cent and 345 per cent, respectively, in excise tax. Fully electric vehicles are levied at 25 per cent. Revised excise taxes are to focus on cc and kwh car ratings by 2018. While maintaining an effective gap between diesel and petrol vehicle taxes, tax on petrol vehicles has been revised upwards. Taxes are smallest on hybrids but it was still raised (see Table 16: Differentiated taxes on hybrid and non-hybrid cars in Sri Lanka).75
The tax regime has dramatically altered the market and reduced the share of diesel cars drastically while increasing the share of electric and hybrid cars (see Graph 28: Impact of fiscal policies on car market: Emergence of hybrid and electric vehicles).
Tax measure for electric vehicles: Electric vehicles are exempt from taxation. Three-wheelers attract 120 per cent, and electric vehicles 20 per cent (for vehicles < 3 years old) and 30 per cent (for vehicles > 3 years old). E3 vehicles attract 12.5 per cent (for vehicles < 3 years old) and 20 per cent (for vehicles > 3 years old). The tax on three wheelers has been increased to promote electric three wheelers. For two-wheelers, tax will be proportional to the engine capacity when the age < 3 years old. The rate depends on engine-capacity range, in increasing steps. The amount is fixed per vehicle when the age > 3 years. Tax on electric vehicles is to be lowered. Fully electric vehicles are levied at 25 per cent. Revised excise taxes are to focus on cc and kwh car ratings by 2018 (see
Table 15: Change in taxes based on fuel and engine capacity since 2015 in Sri Lanka
Engine capacity (CC) Total tax (% of FOB): 2015–17 (before 2015)
Gasoline Diesel Hybrid
< 1,000 195 (180) 245 (245) 97 (77)
1,000–2,000 205 (191.6) 270 (262.6) 117 (104.9)
2,000–2,500 265 (247.5) 297.5 (287.5) 178.5 (143.5)
> 2,500 295 (267.5) 337.5 (347.5) 228.5 (188.5)
Source: Thusitha Sugathapala, 2018, Sri Lanka (Developing Fuel Economy Policies in Sri Lanka – Status and Challenges,
Paper presented at Asia Pacific Clean Air Partnership Joint Forum and Clean Air Week, Bangkok, 20 May 2018.
Table 16: Differentiated taxes on hybrid and non-hybrid cars in Sri LankaEngine capacity Hybrid Non-hybrid
< 1000 cc 70% or Rs 1250 (US $8.5)/cm3 150% or Rs 1750 (US $12)/cm3
1,000–1,500 cc 90% or Rs 2000 (US $14)/cm3 160% or Rs 2750 (US $18)/cm3
1,500–1,600 cc 90% or Rs 3500 (US $24)/cm3 160% or Rs 4000 (US $27)/cm3
1,600–1,800 cc 90% or Rs 4000 (US $27)/cm3 160% or Rs 4500 (US $30)/cm3
1,800–2,000 cc 125% or Rs 4500 (US $30)/cm3 160% or Rs 5500 (US $37)/cm3
2,000–3,000 cc 150% or Rs 5000 (US $34)/cm3 220% or Rs 6000 (US $40)/cm3
Other 200% or Rs 5500 (US $37)/cm3 250% or Rs 6000 (US $40)/cm3
Source: Sugath Yalegama, 2017, An overview of policies on car importation and their effects – Case of Sri Lanka, Ministry
of National Policies and Economic Affairs, Sri Lanka, https://www.unece.org/fileadmin/DAM/trans/doc/2017/itc/UNEP_15_
An_overview_of_policies_on_car_importation_Sri_Lanka.pdf, Paper presented at the conference on Ensuring Better Air
Quality and Reduced Climate Emissions through Cleaner Used Vehicles, Geneva.

90
CLUNKERED
Table 17: Differentiated taxes on electric vehicles in Sri Lanka).
Lessons from Sri Lanka: There are several important lessons. Sri Lanka’s vehicle-import policy is backed by a comprehensive policy and roadmap to promote clean fuel, technology and renewable energy. The import taxes have been effectively designed to discourage polluting vehicles and fuels like diesel and promote petrol and hybrids. This has succeeded in changing the market around. There are evidences to prove the impact that shows that the share of diesel cars has dropped while share of petrol and hybrid cars have increased.
Sri Lanka has taken an early lead to promote electric mobility for both personal as well as public transport, which is a win-win. It has seen dramatic shifts in the market because of the tax measures. However, Sri Lanka is still facing a serious barrier in terms of improving its fuel quality even though it has made attempts to import 10 ppm sulphur fuels in small quantities to take advantage of lower international prices of crude oil.
Myanmar
Graph 28: Impact of fiscal policies on car market: Emergence of hybrid and electric vehicles
0
10,000
20,000
30,000
40,000
50,000
60,000
2008 2009 2010 2011 2012 2013 2014 2015 2016 2017
Nu
mb
er o
f Fi
rst
Reg
istr
atio
n (
Car
s)
Year
Diesel Petrol Hybrid Electric
Source: Thusitha Sugathapala, 2018, Sri Lanka (Developing Fuel Economy Policies in Sri Lanka—Status and Challenges, Paper presented at the Asia Pacific Clean
Air Partnership Joint Forum and Clean Air Week, Solutions Landscape for Clean Air —United Nations Conference Center, Bangkok, 20 May 2018.
Table 17: Differentiated taxes on electric vehicles in Sri Lanka< 50 kW 30% of Rs 15,000 (US $100)/kWh
50–100 kW 40% of Rs 25,000 (US $170)/kWh
100–200 kW 50% of Rs 40,000 (US $270)/kWh
> 200 kW 50% of Rs 55,000 (US $370)/kWh
Source: Sugath Yalegama, An overview of policies on car importation and their effects – Case of Sri Lanka, Ministry of
National Policies and Economic Affairs, Sri Lanka, https://www.unece.org/fileadmin/DAM/trans/doc/2017/itc/UNEP_15_
An_overview_of_policies_on_car_importation_Sri_Lanka.pdf

91
CLUNKERED
Vehicle fleet in Myanmar is dominated by imported used vehicles. Myanmar has about 550,000 imported passenger cars and 350,000 trucks and buses. About 90 per cent of these vehicles are from Japan.76 Car import has picked up since 2011.77 As much as 98 per cent of cars are used cars.
Age restriction: The import rules have been recently revised to allow passenger cars manufactured only in 2016 or later to be brought into the country and trucks and buses manufactured only in 2014 or later to be brought in. The new guidelines have also allowed import of engines manufactured in 2009 or later. Fire trucks and ambulances manufactured in 2007 or later can be imported as long as they are left-hand drive. For heavy equipment such as excavators, bulldozers, wheel loaders and other big machines, only those that are 15 years old or less will be allowed to be brought into the country.78
Fiscal measures: The tax structure for vehicles in Myanmar is linked to the engine size—bigger engines attract higher taxes (see Table 18: Vehicle taxation for imported vehicles in Myanmar). In addition, the registration tax is also stratified according to the engine displacement. The lowest slab is 30 per cent for engine size less than 1,350 cc; 50 per cent up to 2,000 cc; 80 per cent for engine size up to 5,000 cc and 100 per cent for engine size above 5,000 cc. Electric vehicles get preference and draw only 1 per cent taxation.
This quick review of country-wise experience shows that most common strategies that have nearly uniformly been adopted by most countries include age restriction and taxation linked to engine size. But some countries have also moved forward to adopt additional stringent measures, including banning of used vehicle import, linking imports with improved emissions standards and promotion of electric vehicles. This emerging learning curve generates confidence that part of Africa and South Asia are already on their way to finding effective solutions.
Table 18: Vehicle taxation for imported vehicles in MyanmarEngine displacement Custom duty
(in per cent)Special goods tax
(in per cent)Commercial tax
(in per cent)
1,500 cc 30 - 5
1,501–1,800 cc 30 20 5
1,801–2,000 cc 30 20 5
2,001–4,000 cc 40 30 5
> 4,000 cc 40 50 5
Source: Dr Soe Tun, Automobile Industry in Myanmar, Myanmar Automobile manufacturer & Distributor Association
(MAMDA), 2017.

92
CLUNKERED
SECTION 5: Setting the terms for used-vehicle export
Export of used vehicles is a significant part of the international trade of several advanced countries, including the US, EU, Canada and Japan. In 2014, for instance, used vehicles made up 14 per cent of US vehicle export. It is often argued that used-vehicle trade may have created a stronger incentive for not implementing several end-of-life regulations for older vehicles in advanced countries. It is more lucrative and cost effective to export used vehicles than scrap them.
The literature shows that in the Netherlands there is often a preference for export than end-of-life (ELV) of vehicles. The ratio of [export]/[ELV] increased from 0.3 in 2000 to 1 in 2007, up to 1.4 in 2012 and stabilized around 1.2 in 2013–14. Especially during 2000–08, there was a shift from ELV to export.1 Instead of more old vehicles being scrapped, they were exported. This was also encouraged by the opening up of east European markets.2 Used-car exports from Germany is two-thirds of all used-car exports within the EU. It is said that exports had declined significantly in 2009 when the German scrappage scheme was implemented.3 Similarly, in the US, the proximity of the Mexican market makes it relatively easy and cheap to sell second-hand vehicles instead of scrapping them.4
It is, however, important to make a distinction between old, polluting vehicles and used vehicles. Advanced markets have high replacement rates and therefore for a substantial part of useful economic life of vehicles they are eligible for trading within the domestic market as well as for export. But vehicles that are old, damaged and polluting qualify for scrapping.
There are several issues to be addressed. How can exporting countries take the responsibility of disposing of old and polluting vehicles within the domestic market and restrict them from entering the international market? What criteria need to be applied to screen vehicles for export? There is need for clear international mechanism and harmonized protocol to uniformly report emissions, fuel economy and safety status of vehicles, accident and recall records of the vehicles, and a system to make different standards comparable for importing countries to take decisions.
Exporting countries themselves have adopted explicit regulations related to emission standards and labelling of vehicles, scrappage, end-of-life regulations and extended manufacturing responsibility. These regulations have strong bearing on the quantum and nature of vehicle exports, depending on how stringently they are implemented.
End-of-life regulations and used-vehicle exportMore used vehicles are likely to get pushed out from advanced markets in the future as the environmental regulations around old and polluting vehicles become tougher. Several countries are introducing regulations to scrap old vehicles, debar or disincentivize entry of old and polluting vehicles into city centres by coding them yellow, banning older diesel vehicles in the city or disincentivizing them with higher taxes. A strong vehicle inspection programme has been implemented to promote good maintenance and rejuvenate the heavy-duty fleet by re-powering older vehicles with new engines or retrofitting older vehicles with emission-control systems. Several European countries have enacted end-of-life regulations.

93
CLUNKERED
Globally, legislative framework for recycling of end-of-life vehicles (ELVs) has emerged mainly for light-duty vehicles. ELVs are deregistered cars that will undergo treatment/recycling through appropriate processes within the country of origin. Currently, legislative ELV recycling systems are established in the EU, Japan, Korea, and China. In the US, ELV recycling is managed under existing laws on environmental protection.5 The European Union, Japan and Korea have developed ELV recycling systems based on the extended producer responsibility principle, designed to recover used car parts, scrap metal, batteries, etc.6
A 2014 study has estimated generation of ELVs at 40 million per year globally, which is 4 per cent of total automobile ownership. In EU member states, Japan and Korea, reporting on the number of ELVs is mandatory under their legislative ELV recycling systems. But in other countries, the number of ELVs is usually reported by the recycling industry that processes and recycles the ELVs. Available data shows that deregistered automobiles can be more than ELVs because deregistered automobiles include used cars for export, unregistered cars used within private sites, or cars illegally dumped as waste.7
The number of vehicles that are deregistered annually in different countries is significant (see Table 19: Global and country/state estimates of automobile ownership and ELVs). In the EU it was estimated that in 2010 and 2020 14 million and 16.6 million cars were to be deregistered respectively.8 In China, with rapid motorization, the ELV generation is expected to be 99.5 million in 2020.9 In China, export of used vehicles is not legal.
Vehicle retirement Vehicle retirement programmes are varied in nature and structure (see Table 20: Summary characteristics of key vehicle retirement programmes in different countries). Vehicle replacement programme aim at eliminating targeted vehicles from the fleet. Mandatory programmes enforce the retirement of the vehicle even if some useful life remains. Retirement in these programmes is based on age and mileage of vehicles. Mandatory retirement is more common in developing countries, where age caps are enforced to get rid of the older fleet. Delhi, in India, for instance, has imposed mandatory age caps on commercial vehicles as well as personal vehicles within its local market.
Often, vehicle retirement programmes are adopted as economic stimulus for the industry to ramp up sales of new vehicles as in the US and Europe following the 2008 economic recession. The 2009 Car Allowance Rebate System or the Cash for Clunkers programme in the US is an example. Mexico implemented a vehicle renewal programme in 2009. In 2009 the Cash for Clunkers programme that provides incentives for scrapping old vehicles resulted in over three times the normal amount of cars being scrapped—more than dismantling companies could handle over the course of that year.
There is no clear definition for classifying high-emitting vehicles; it varies across regions and depends on fleet characteristics, age and mileage, and original emission standards. Stringency will depend on the target set by the governments to control emissions and fuel guzzling. Vehicle-retirement programmes have been more widely implemented for light-duty vehicles; there are very few for heavy-duty vehicles. These measures together generate a large pool of old and used vehicles not wanted in the domestic market of high-income countries and are crowding in the international market and low-income countries. These schemes need to be designed in a targeted manner to ensure that they remove all older vehicles and replace them with more efficient
94
CLUNKERED
and lower-emitting vehicles to reduce emissions of CO2 and local pollutants. Retiring vehicles that travel little provide minimal benefits.
Environmental benefits of these programmes are expected to be substantial. As new vehicles begin to meet substantially tighter emissions standards the older fleet becomes disproportionately responsible for much high emissions. According to the nonprofit International Council on Clean Transportation (ICCT)’s review of vehicle replacement programme,10 for example, as the Chinese Ministry of Environment Protection estimated in Beijing in 2011, ten-year-old or older vehicles (Euro 0 or Euro 1 equivalent) constituted just 15 per cent of the total vehicle fleet, but these caused 61 per cent of the NOx and 76 per cent of particulate matter emissions; around 50 per cent of the particulate matter and black carbon emissions came from high-emitting vehicles. ICCT’s estimate for India shows that pre-2003 vehicles are less than 23 per cent of the fleet but account for nearly half of the vehicular particulate matter and a third of NOx emissions in 2011.
Table 19: Global and country/state estimates of automobile ownership and ELVs of over 10,000,000 units and positive calculated ELV in 2010
Country/stateAutomobile ownership unitsa
De-registered automobiles (units/year) b
Number of ELVs (units/year) c
European Uniond 271,319,000 14,077,000 7,823,211
(Germany) (45,261,188) (2,570,137) (500,193)
(Italy) (41,649,877) (1,835,293) (1,610,137)
(France) (37,744,000) (2,002,669) (1,583,283)
(England) (35,478,652) (1,810,571) (1,157,438)
(Spain) (27,750,000) (996,718) (839,637)
Russian Federation 41,224,913 300,000 Not available
US 239,811,984 20,419,898 12,000,000
Canada 21,053,994 1,321,658 1,200,000
Brazil 32,100,000 1,058,064 1,000,000
Japan 75,361,876 4,080,000 2,960,000
China 78,020,000 6,000,000 3,506,000
Korea 17,941,356 849,280 684,000
Australia 15,352,487 600,311 500,000
Subtotal 792,185,610 57,921,599 29,673,211
Global total 1,016,763,420 15,805,275 40,176,051e
Note:
a. Data from Japan Automobile Manufacturer Association Inc. 2012 Values in () not included in total.
b. Indicates (number of automobiles without owner in the previous year + number of new automobiles in the market
this year)—number of automobiles without owners this year. Global total is a reference value since the estimated
number of deregistered automobiles (increase in the number automobiles with owners of the said year surpassed
the number of automobiles for sale in the same year) in some countries was negative. The number of automobiles in
Japan where the estimated umbers of deregistered buses and trucks was negative was from actual values in 2011.
EU number is estimate value of EU 25.
c. The number of ELVs is summarized from different sources.
d. EU + Liechtenstein, Norway
e. The subtotal of ELVs was multiplied with the ratio between the global total number of owned automobiles and
subtotal of the number owned automobiles in each country, excluding Russia.
Source: Shin-ichi Sakai et al. 2014, An international comparative study of end-of-life vehicle (ELV) recycling systems,
Journal of Material Cycles an Waste Management, February 2014.

95
CLUNKERED
The ICCT study has projected that the high emitters will become the largest contributor of particulate matter emissions globally by 2020 especially from Asia, Africa, and Latin America.11 Older vehicles also have outdated power train technologies that adversely affect the fuel consumption and CO2 emissions. The US and Germany have implemented vehicle replacement programme for fuel and CO2 savings.
The governments also provide subsidies for voluntary retirement of vehicles. According to the ICCT, fiscal incentive should be higher than the current market value of the vehicle to be replaced so that owners scrap it and buy new vehicle. In Mexico, a GIZ study has found that if the incentive is 70 per cent of the cost of the new vehicles, the vehicle owners will opt to purchase a new vehicle. However, these programmes are not permanent in nature and the quantum of incentive may even decline over time.
Complementary policies to support vehicle retirement Other complementary policies are being designed to discourage use of high-emitting vehicles and encourage owners to replace their vehicles. These include non-fiscal low-emission zones, age limits for vehicles, early action subsidies for retro fitment and repowering schemes, and schemes for operation exclusion. Establishment of low-emission zones offers serious restraint and incentive for disposing of old vehicles. For instance, Beijing, while offering subsidies for vehicle replacement, also restricted these vehicles from operating in low-emission zones of the city. In Europe, fees for entering low-emissions zones are differentiated based on vehicle emissions, whereby high emitters have to pay higher charges.
Table 20: Summary characteristics of key vehicle-retirement programmes in different countriesProgramme Vehicles targeted Approximate average
subsidy offeredComplementary policy
US: California—Carl Moyer programme
Multiple types, including on-road and off-road
US $28,000 per vehicle Mandatory upgrade of highly polluting vehicles
US: Consumer Assistance to Recycle and Save
Light-duty vehicles US $3,500–4,500 None
US: National Clean Diesel Campaign
Heavy-duty vehicles US $9,400 per vehicle spent for programme
None
Germany Scrappage Bonus Light-duty vehicles US $3,500 Low-emission zones
China: National vehicle scrappage programme
Light and heavy duty vehicle Varies by vehicle typeUS $980–2,940
Mandatory vehicle age limit
China: Local vehicle scrappage programme
Light and heavy duty vehicle Varies by vehicle type LDV: US $410–2,410HDV: US $1,330–2,100
Mandatory vehicle age limit and low emissions zones
Mexico: Programme to modernize Federal Road Transportation
Heavy-duty vehicles on federal highways
Up to 15 per cent of the cost of the replacement vehicle
None
Mexico City: Programme to replace microbuses with auto buses
City buses Up to US $7,700 None
Chile: Swap our trucks Heavy duty trucks US $8,000–24,000 depending on vehicle category
Ministerial decree to implement a low-emission zone to be implemented
Source: Francisco Prosada D.V. Wagner, G. Bansal, R. Fernandez, 2015, White Paper on Survey of best practices in reducing emissions through vehicles
replacement programme, International Council on Clean Transportation, mimeo, Washington.

96
CLUNKERED
These policies together are creating conditions for retiring the huge in-use fleet that if not fully scrapped will enter the international market. The approach, however, varies with the country.
JapanThe regulatory periodic vehicle inspection (fitness test) programme in Japan is called Shaken. After a vehicle turns three years old, it must get an inspection every two years. All new cars are sold with a three-year shaken (warrant of fitness). Consequently, most vehicles available in the used market are three, five, seven and nine years old as they are usually traded in or sold by the user when the shaken expires, not as a result of a failed test.12 Shaken is relatively expensive and together with rapid turnover of new models leads to large-scale retirement of vehicles. Reported estimates of the average inspection cost start at $1,000 and get as high as $2,500 per vehicle. Further renewals of the obligatory inspection certificates are required at two-year intervals.13
Many vehicle owners in Japan sell vehicles after five or seven years of usage, when the second or the third obligatory test under shaken is due or shaken expires. These second-hand or used vehicles have very poor market value within the domestic market and their export is increasing. The UNEP 2017 background paper on used vehicles states that strict regulations lead to a higher rate of depreciation in the value of automobiles in Japan than in countries with more lax regulations. This differential in depreciation rates creates the incentive for trade in used cars. 14
End-of-life and recycling system in Japan: The law for recycling and ELV rules was enforced in 2005 to address the shortage of landfill sites for disposal of discarded vehicle waste. This also led to hike in vehicle recycling fees. The law systematically defines vehicle recycling through specifications for car manufacturers and importers as well as customers and government requirements.15 Recycling is mandatory for all citizens and corporate entities and is governed by various laws.
The Japan Automotive Recycling System is designed to minimize illegal dumping possibilities by adopting a prior fee payment arrangement whereby the purchaser of a new vehicle must pay the recycling fee at the time of purchase, while the owner of an in-use vehicle must pay it at the time of the first periodic inspection.16
Moreover, ELVs are important for resources recycling in Japan. According to the Ministry of the Environment, the number of unlawful ELVs in Japan sharply declined from 126,000 units in August 2001 to only 35,064 in March 2007. The Shaken programme contributed to the decline.17
In Asia, both Japan and China have come up with end-of-pipe regulations (see Table 21: Comparison of end-of-life (ELV) management systems between China and Japan). But they have different levels of stringency.
A thriving trade has emerged in spare parts and components mined from scrapping and are an important export business in Japan. The used parts, removed from ELVs, are exported worldwide to wherever there are used-vehicle markets of Japanese vehicles. This is also needed to serve the overseas markets where used vehicles have been traded.18

97
CLUNKERED
The European Union European commission’s EOL Directive (2000/53/EC) lays down the reuse rates for scrap cars: 80 per cent for reuse and recycling; 85 per cent for reuse as a whole. These rates increased to 85 and 95 percent respectively as of 2015. Moreover, the European Union member states adopted Correspondents’ Guidelines No. 9 on Shipments of Waste Vehicles, to monitor. Improper vehicle dismantling and scrapping have adverse environmental impacts and valuable raw materials are lost, instead of being recycled. But it is important to get an insight into the operation of these systems to understand the imperatives of the used vehicle trade from countries of the European Union.
Germany The EOL Directive (2000/53/EC) requires 85 per cent reuse and 95 per cent recycling respectively. They are based on waste statistics that the Federal Statistical Office (Statistisches Bundesamt) as well as regional-state statistics agencies collected from the relevant companies, in accordance with the Environmental Statistics Act (Umweltstatistikgesetz). Based on this the UBA determines the scrap-car recovery rate for Germany and submits the German report in this regard to the European Commission.
It is said that Germany has consistently exceeded EU recovery rates with an 89.2 per cent reuse/recycling rate and a 92.9 per cent recovery rate in 2008. In 2010, more scrap cars were recovered than were handed over to dismantling companies, owing to back inventory from the Cash for Clunkers programme.20
The Germany bonus programme announced in 2009 was originally supported with €1.5 billion, subsidizing the purchase of 600,000 cars. Under the programme, the German government would pay to individuals to buy a new car meeting the then current emission standards as a replacement vehicle.21
Most scrapped cars are recycled in two stages. First, the cars are dismantled at one of around 1,300 certified dismantling centres, which drain all motor oil, antifreeze and other fluids from the cars and remove parts that contain pollutants such as lead batteries, spare parts and recyclable elements such as tyres and catalytic converters. The bodies are then shredded mechanically, with iron, aluminium and other metal scrap that is sold to scrap dealers, in some cases after undergoing additional processing. Scrap dealers melt down
Table 21: Comparison of end-of-life (ELV) management systems between China and JapanChina Japan
Government /involvement (through Act) Statute 307Law on ELV
End-of-life vehicle recycling law
Manufacturer involvement None Take back CFC, airbag unit, shredder dust
ELV age 10 years or 500,000 km Minimum three years, inspection once in two years
Recycling fee paid by Market-driven (collector pays last owner)
First owner, upon purchase
Operator size 367 recycling operators, one pilot recycling centre
5,000 recycling operators, 140 shredding and sorting plants
Effectiveness (recovery rate) 90 per cent 85 per ent
GDP per capita 7,536 33,994
Source: Proposed framework for end-of-life vehicle recycling system implementation in Malaysia, 11th Global Conference on Sustainable Manufacturing, 2013,
Berlin, Germany, https://depositonce.tu-berlin.de/bitstream/11303/4987/1/azmi_etal.pdf

98
CLUNKERED
the scrap into recyclable metal. 97 per cent of the metal in Germany’s scrap cars is recycled. This also generates shredding residues that need to be disposed of; these are composed of plastic, rubber, glass, residual metals, and other materials, including pollutants. 22
This process is governed by Directive 2000/53/EC. This law applies to cars, light-utility vehicles and three-wheel motor vehicles (excluding motor tricycles). The ELV regulation (a) requires automakers to take back scrap cars free of charge via a comprehensive network; (b) places restrictions on the use of mercury, cadmium, lead and hexavalent chrome in cars; (c) sets recovery rates; and (d) lays down technical requirements for scrap car reuse and recovery. Hence such cars may only be dismantled and scrapped by companies that have ELV regulation certification.
Used and scrapped car export from Germany is high: Over a million used cars are still exported from Germany each year, most to EU countries. According to the literature, a large share of these vehicles goes to West African nations and former Soviet bloc countries. Some of these cars are in good condition, while others are in relatively poor shape. It is often difficult to determine whether a given vehicle is usable or meant for the scrap heap. To address this issue, EU Member States have adopted Correspondents’ Guidelines No. 9 on Shipments of Waste Vehicles, which though not legally binding helps officials monitor export and improper disposing of cars to be scrapped that are disguised as used cars (particularly outside the EU).
It was reported that German authorities have discovered illegal schemes through which an estimated 50,000 scrapped vehicles have been exported to Africa and Eastern Europe. 23 Preventing the export of these vehicles to Africa and Eastern Europe will require much tighter export rules and stronger proof of scrapping. For instance in the US, the Cash for Clunkers Programme required dealers to destroy old engines by draining the motor oil and injecting instead sodium silicate. But the German programme largely required the scrapped vehicles to be only sent to junkyards. This can also become a loophole for leakages and illegal exports.24
SwedenAs in the other countries, it is not possible to get proper estimates of number of vehicles that are scrapped and recycled or exported. There is one study that has estimated that 7 per cent of total cars out of use are exported or left to rust; 2 per cent of cars out of use go directly to material handling facilities, where in line with Directive 2000/53/EC they are prepared for shredding, hazardous materials removal and de-pollution. The remaining cars (91 per cent of cars out of use go to dismantlers to recover components and materials for reuse and recycling.25
However, old scrapped vehicles can still be found in the open. If the last owner of the vehicle can be identified they could be forced to pay a high fine.26 A scrapping programme ended in 2007 in Sweden and was substituted by a programme in which the producer is mandated to, without any cost for the vehicle owner, take care of the scrapping of the vehicle. This aligns with EU-based directive 2000/53/EG (end-of-live vehicles directive). Authorized ‘Junk Yard’ issue a certificate of scrapping. The number of scrapped light duty vehicles since 2007 is in the range of 190,000/year. During the period of the scrapping programme, 250,000–300,000 vehicles were scrapped annually.
In Sweden recently there has been a proposal to introduce a revised scrapping

99
CLUNKERED
scheme. Depending upon the age and emission performance of the vehicle, it is proposed to pay a sum in the range of 5000–10,000 SEK (Swedish krona) to buy a new vehicle. It is also said that it is very time consuming and difficult to scrap a vehicle and earn some money out of the leftover. The information on legality of exporting used and scrapped vehicles from Sweden is not explicit and clear.
USThe US has implemented multiple programmes including Carl Moyer programme for on-road and off-road vehicles in California; Consumer Assistance to Recycle and Save (CARS) or cash for clunkers for light duty vehicles in the US, and National Clean Diesel Campaign Cash for heavy duty vehicles.
The first objective of the Cash for Clunkers was to provide temporary stimulus to counter the economic recession and provide financial incentives to car owners to trade in their old, less fuel-efficient vehicles and buy more fuel-efficient vehicles. The second was to improve the fuel efficiency of the existing stock of vehicles, in order to reduce emissions. This was administered by the National Highway Transportation Safety Administration (NHTSA) that allowed consumers to trade in older, less fuel-efficient vehicles for a voucher to be applied toward the purchase of newer, more fuel-efficient vehicles.27
After the ‘clunker’ was traded in at the dealership, its engine was destroyed, ensuring its permanent removal from the US vehicle fleet. Nearly 700,000 clunkers were traded in between 1 July 2009 and 24 August 2009 as part of the programme.28
An evaluation of this programme29 shows that the programme led to slight improvement in fuel economy, and some reduction in carbon emissions. The cost per tonne of carbon dioxide reduced from the programme suggests that the programme was not a cost-effective way to reduce emissions, but it was more cost effective than other environmental policies like the tax subsidy for electric vehicles or the tax credit for ethanol.30 Economically, about US $2.85 billion in vouchers provided by the programme had a small and short-lived impact on gross domestic product, ‘and essentially shifted roughly a few billion dollars forward from the subsequent two quarters following the program’. 31
These programmes are not likely to be continuous and frequent as there are both economic and environmental doubts about the real gains. Many economists have argued that the programme costs taxpayers $3 billion and that it did little to stimulate the US economy—even in the short run—because it helped foreign auto manufacturers at the expense of domestic manufacturers.32 Environmental gains are also small.33
Extended producer responsibility As the policies on circular economy is taking roots in the developed world, explicit rules are being laid out on extended producer responsibility to make the manufacturer or importers of vehicles responsible for the entire life cycle of the products. Manufacturers are required to reduce the overall environmental footprint of their products by reducing use of toxic and hazardous substances, increasing the use of recycled constituents, and enhancing ease of disassembly among others. The producers also have to provide for take back, recycling and final disposal of the product within the domestic economy.34
There is ‘Individual producer responsibility’ in which manufacturer or importer takes responsibility individually for its own products throughout the entire

100
CLUNKERED
life cycle including the collection and ‘end-of-life management’ through ‘take back’ or any other system. In ‘Collective Producer Responsibility,’ a number of producers, manufacturers, importers and other stakeholders come together as a consortium or establish an organization to take collective responsibility for the end-of-life management of products manufactured or imported. Nature of these interventions depends on the regulatory framework. This prescribes that the costs of managing post-consumer resources should be built into the cost of the product itself (see Box: Application of extended producer responsibility in exporting countries).
This progressive frame has a strong potential to inform the global circular economy. But it is not clear at this stage how its governing principles can be adopted for the international trade in used vehicles. How importers and manufacturers can be made responsible for imported products. But this needs to be assessed.
India India, as a vehicle-exporting country in developing South Asia, has a different set of experiences and approaches, and a different set of imperatives. Being a vehicle-producer, it has adopted firm rules to stave off used-vehicle import. Any vehicle imported to India will have to meet the same standards that are currently in force and will have to be homologated according to the existing rules in India.
Application of extended producer responsibility in exporting countries
A review by the Central Pollution Control Board, GIZ and Indian non-profit Chintan has documented the application of the principle of extended producer responsibility in different vehicle exporting countries.
Regulatory approachEurope: At the European level (EU) level, the end-of-life (ELV) Directive (2000/53/EC) mandates producer responsibility in which material and equipment manufacturers are obliged to use common component and material coding standards.
Germany: In Germany, extended producer responsibility obliges car manufacturers and importers to take back ELVs free of charge. In the Netherlands, a vehicle’s first owner pays a recycling fee to the manufacturer, seller or importer from whom he purchases the car. In Korea, producers and importers are held responsible for the use of hazardous substances, recyclability of materials, ELV collection and information exchange. They are legally required to provide technical support to scrap dealers and ELV recyclers and to pay for costs if they exceed the benefit of recycling.
South Korea: The provisions are laid out in Korea’s 2008 Act for Resource Recycling of Electrical and Electronic Equipment and EPR approach in its waste management policy. With the 2008 Act, this EPR approach has been developed into an ‘Integrated Product Policy’ that introduced an ‘eco assurance system’ that includes preventive actions such as environmentally friendly design and manufacture of products and follow-up management, i.e. environmentally sound waste management.
Japan: In Japan, the 2002 ELV Recycling Law provides for a ‘shared responsibility principle’ that obliges consumers to pay a fee when purchasing a new car or when handing in an old car bought before the law was enforced. The fee is deposited into a deposit management entity and operated by an electronic management system that confirms the actual ELV recycling. According to the Recycling Law, the responsibilities of automotive producers are the following: they should design for recycling; provide dismantling information to recycling operators; take back and recycle airbags, ASR and fluorocarbons; record waste recycling; specify the charging standard; and mark their name on the vehicle before selling it.
China: In China the ’Technology Policy for Auto Products Recycling’ (2006) stipulates the strengthening of automotive producers’ and importers’ responsibility but so far not much progress has been made in that regard; thus the majority

101
CLUNKERED
India has not yet adopted any scrappage or end-of-life regulations. But a large number of vehicles are scrapped and stripped in Delhi, Kolkata, Pune, Jamshedpur, Indore, Chennai and several other places by informal, unregulated clusters across the country that have turned into hubs for scrap metal and all sorts of recovered and refurbished automobile parts.35 India is working on a scrappage and recycling policy currently. This process got an impetus after the judiciary directed scrapping of 10-year-old diesel vehicles and 15-year-old petrol vehicles in cities like Delhi.
Estimates show that there were over 200 million motorized vehicles registered by 2015 and the sector is expected to grow at an average of 7 per cent for the next 20 years. This will require significant amounts of natural resources and can face resource restraints. Currently, the retired vehicles in India usually end up in the unorganized sector where after dismantling, auto components are either refurbished or sent for recycling. Material recovery remains low as workers lack both training and appropriate equipment needed to dismantle and recycle auto components. While some professional dismantling facilities exist, these are few and inadequate.36 India needs a national ELV management system and a viable financial model for ELV disposal and recycling that integrates consumers, collectors, recyclers and producers.37 (see Box: India: Framing scrappage and recycling strategy).
Being a vehicle producer, India requires its own end-of-life recycling and
of costs for recycling are borne by the recycling operators. In 2008 standards were proposed that make producers responsible for determining and marking the recoverability of different automobile parts.
US: In the US, there is no federal law governing EPR practices. The term usually used for EPR-related activities is ‘product stewardship’ that addresses producers, manufacturers, retailers, users and disposers alike and holds all these parties responsible for the reduction of a product’s impact on the environment.
Initiatives by manufacturers Some automobile manufacturing companies, such as BMW and Volkswagen in Germany and Toyota and Nissan in Japan, are known to facilitate the recycling and recovery of components from the ELVs of their own brand. Such companies either set up their own recycling plants or support recycling units. They also prescribe the procedure for handling and recycling their vehicles along with schematic diagrams in the form of brochures.
The BMW Group has established a ‘Recycling and Dismantling Centre’ in Munich, Germany, that serves as an authorized treatment facility and is also engaged in research and development for creating recycling concepts for future vehicles.
In 2007, the Volkswagen Group adopted a strategy. Volkswagen ELVs can be returned to a large number of take-back facilities operated by a Volkswagen subcontractor. All necessary information for dismantling and recycling is made available to the take-back facilities via the ‘International Dismantling Information System’. An online platform was established together with a large number of international car manufacturers.
Volkswagen provides information and works on technologies for both component dismantling and post-shredder treatment. It runs its own operations for reuse of components after treatment.
The Toyota Motor Car Company started a joint venture with Toyota Metal Company in 1993 to develop ASR recycling technology and built the first automobile recycling plant in 1998 in Japan. Nissan is working on the standardization of recycling technologies to incorporate them in the design stage. The US automotive industry has formed the Vehicle Recycling Partnership (VRP) in 1992. Under this partnership Ford, Chrysler and General Motors coordinate collaborative research programmes to promote sustainable ELV recycling in North America and globally.
Source: Ashish Chaturvedi et al, 2012, The Story of a Dying Car in India, GIZ and Chintan, New Delhi, http://www.chintan-india.org/documents/research_and_reports/ELV-Report.pdf, as accessed on 16 March 2018.

102
CLUNKERED
recovery policies. This will require intervention to create professional infrastructure for dismantling and recycling of components.
Diesel bans to lead to dumping of diesel vehiclesFollowing Dieselgate and mounting evidence on very high on-road emissions from diesel light-duty vehicles, policies are evolving rapidly to discourage and phase out old diesel cars in Europe, which has dieselized the most. British, German and French authorities have released emissions results. A large number of popular diesel car models have failed to meet the official limit and are emitting six to 12 times higher on road in real-world conditions. Europe has reported a slowdown in sales during 2017. According to the European Automobile Manufacturers Association (ACEA), sale of petrol-powered cars overtook those of diesel in the first quarter of 2017 for the first time since 2009.
This trend is getting sharper with time. Madrid and Athens are banning diesel cars entirely. The sale of diesel cars has crashed in the UK. In London, pre-Euro VI cars are not to be allowed inside the ultra-low emission zone in Central London. According to the Society of Motor Manufacturers and Traders (SMMT), since 2016 sales have dropped by down 11.5 per cent as pollution fears grow in the UK. In fact, the UK government has announced that it would ban all new petrol and diesel cars and vans from 2040. The mayors of Paris and Athens have planned to ban diesel-engine cars in city centres by 2025. Paris will phase out pre-2011 diesel cars by the end of the decade. Copenhagen’s mayor has announced plans to ban new diesel cars from entering the Danish capital. Diesel cars have lost market share even in Germany. The ICCT study links diesel emissions to 107,600 premature deaths globally in 2015. This push will get harder as countries take their climate commitments seriously.
India: Framing scrappage and recycling strategy
India is coming under pressure to deal with its ageing and old fleet. The Government of India is expected to issue its scrappage policy soon largely directed at the heavy-duty trucks and buses in which the replacement vehicle will comply with the upcoming Euro VI or Bharat Stage VI standards.
In the meantime, several city governments, including Delhi and the National Capital Region’s and Kolkata’s among others, have capped the age of targeted vehicles that can ply inside cities. Delhi does not allow more than 15-year-old commercial vehicles, 10-year-old diesel cars and 15-year-old petrol cars inside the city anymore. This has led to an enormous disposal problem. Measures targeted at addressing the older vehicles are creating a huge pool of old vehicles that if not properly addressed can become part of grey market.
The National Green Tribunal (NGT) has even directed other state governments to identify areas with less pollution where such older vehicles can be resold. But transporting pollution to clean environment is not a solution. Similarly, yet another directive from NGT has directed the Delhi government to find land for disposal. Even this is not an adequate solution if proper scrappage and recycling policies are not in place.
The government of Delhi has already issued a draft notification on scrappage to define more clearly the process of collecting, dismantling, recycling and reuse requirements. Widely abandoned junk vehicles on Delhi’s roads and in parking places is a serious problem. Several other state governments in India, including Karnataka’s and Maharashtra’s, have come up with green tax for older vehicles. But these are more revenue-generating initiatives than disincentives for older vehicles.
Currently, a huge informal market has emerged for scrapping and recycling of old vehicles and components. The vehicles that are not used anymore or are old or damaged are generally traded for scrap in India. They are currently treated

103
CLUNKERED
These policies will now lead to a huge heap in advanced markets of discarded diesel cars and SUVs that will get dumped in low-income countries. Cheaper imports are already pushing markets towards bigger diesel engines in the car and SUV market of Africa and South Asia that do not have clean diesel. This requires a strategy to prevent dumping of discarded diesel cars with toxic emissions in low-income countries.
Spotlight on heavy-duty vehiclesEvidently, scrappage and end-of-life regulations are comparatively weakly enforced in case of heavy duty vehicles. Most scrappage schemes target light duty vehicles. However, there are fewer scrappage schemes for trucks. International Energy Agency has listed some of the scrappage schemes for trucks (see Table 22: Scrappage schemes for trucks).38
Japan government’s policy is targeted at all types of four-wheel vehicles, including large vehicles and commercial vehicles, such as trucks and buses and is regulated.39
Available evidence shows that dismantling and recycling of end-of-life heavy-duty vehicles is still a small market compared to the volume of resale and export as that is currently commercially more viable. But this raises concern around the ultimate end of life recycling of these heavy vehicles.40 According to the literature, there are rarely specific EoL treatment facilities dedicated to heavy vehicles, unlike light vehicles. There are some dismantling facilities for heavy vehicles in Europe for re-manufacturing, refurbishing and reuse, which are operating well.41 The EoL management of heavy-duty vehicles is still small and poorly structured in Europe. This is often voluntary and not fostered by recycling targets or extended producer responsibility. 42
by a large, unaccounted informal sector. According to a report by Automotive Recycler’s Association’s report on end-of-life of vehicles, 2012, India houses well over 100,000 family-run units that are involved in dismantling old cars and motorcycles, and recovering parts for sale.1
Chintan, a non-government organization working for the welfare and rights of people engaged in informal recycling, conducted a fact-finding study in 2011 and reported that more than 3000 such units operate within Delhi. A more recent report titled ‘Analysis of ELV in India’, jointly drafted by GIZ, CPCB and Chintan Environmental Research and Action Group, provides an overview of the current ELV market in India.2
The informal sector primarily consists of traders, dismantlers, scrap dealers and recyclers. The report points out that this sector despite being informal in nature is highly specialized. For instance, there are traders who deal only in engines or steel rims or tyres. Parts sold as scrap have their dedicated markets. Some of the key challenges that the informal ELV market currently faces is related to space crunch. Shortage of space is a significant impediment towards business expansion. There is limited access to financial and technical assistance. Though there is a thriving recycled component market to serve markets where Indian vehicles go, sophisticated marketing is needed to link dismantled parts with suitable markets.
Even though the government has started policy formulation on formal scrappage systems, authorized systems are very few. Details of regulatory provisions regarding scrappage, end of life, their enforcement and reporting mechanisms and other related aspects are still awaited.
Sources:
1. Report On End-of-Life Vehicles Worldwide , Automobile Recycler’s Association. Accesses from: http://a-r-a.org/automotive-recycling-magazine/
report-on-end-of-life-vehicles-worldwide/
2. Chintan, GIZ and CPCB, 2015, Analysis of End of Life Vehicles ( ELVs ) Sector in India, Mimeo and Story of a Dying Car In India, 2013.

104
CLUNKERED
These overhauled vehicles are exported to developing countries that do not have the means to dismantle and recycle heavy vehicles properly at the end of their life-spans.
According to the Centre for Remanufacturing and Reuse in the UK, out of all heavy vehicles reaching their end of life, 50 per cent are reused or resold in other countries after major refurbishment, 43 per cent are re-manufactured to extend their lifespan in the UK, and 7 per cent are dismantled and recycled in the UK. In Sweden, approximately 50 per cent of trucks were estimated to be exported after five years of domestic use. These trucks are usually resold after five years of use to intermediaries who export to Eastern Europe and Africa. After five years in use, the original manufacturer warranty usually expires.43
There are limited elaborate end-of-life regulations for the heavy duty industries. According to studies, these are largely governed by cross-sector regulations, such as end of life for tyres, oil etc. Heavy-duty vehicles use more re-manufactured components, and components are four to five times more expensive.44 Heavy-duty spare parts handling and processing are very heterogeneous. Some components qualify for profitable re-manufacturing, including tyres, alternators and starters, which account for nearly 70 per cent of the re-manufactured market. But catalytic converters and pneumatic brakes are largely replaced by brand new parts.
Data on international trade in used heavy-duty vehicle is very limited. There is supposed to be a substantial trade in refurbished used vehicles and components. However, local data from countries in Africa show the average age of commercial and cargo vehicle are lower than that of personal cars. But the larger issue that needs to be addressed is managing their on-road emissions and EoL disposal to recover valuable material that otherwise is getting lost as these vehicles are not going through the end-of-life processing in advanced countries. Increasingly, policies on circular economy in Europe etc. will aim to recover material from this segment.
Export market in spare parts: As the export market in old and used vehicles is expanding, it is also leading to large-scale export of spare parts from developing
Table 22: Scrappage schemes for trucksCountry Scrappage scheme Year of operation Truck criteria Premium offered
Chile Cambia tu camión 2009 > 10t GVW; > 25 years old
US $9,000–22,000
China Old-Swap-New 2009–10 10–15 years old US $1,400–2,400
Colombia Renovación Vehicular 2013–18 > 20 years old US $24,600
Egypt Egypt Vehicle Scrapping and Recycling Programme
2011–21 > 19 years old US $700
Japan Vehicle replacement programme
2009–10 > 13 years old US $3,600–16,000
Mexico Esquema de Sustitución y Renovación Vehicular
2003–18 > 10 years old 15 per cent toward the trade in of a new HFT
Spain PIVE 1-8 2012–16 > 10-year-old LCVs only US $1,800
Source: OECD/IEA 2017, The Future of Trucks: Implications for energy and the environment, International Energy Agency, https://www.iea.org/publications/
freepublications/publication/TheFutureofTrucksImplicationsforEnergyandtheEnvironment.pdf

105
CLUNKERED
countries to meet the demand for appropriate spare parts for the makes and models being imported in developing countries. It is said that this trade will have to be more organized more efficiently to service the entire value chain spread across continents. This market will become more complex and volatile when import regulations will speed up renewal of the on-road fleet; faster and newer genres of vehicles will penetrate. Manufacturer-led dealerships will have to maintain a critical mass of service components and spare parts in these markets. As the experience in India shows, with growing sophistication in OEMs’ production, the scope of reusing parts from the older fleet gets limited and reduced. As a result, a large part of used spare parts that could be reused becomes scrap and waste and that reduces overall material efficiency.
Exporting countries need to be the partner in changeClearly, while exporting countries are increasingly tightening rules and regulations for old vehicles for their respective domestic markets, there will be a massive spillover of discarded vehicles in the international arena. These will continue to roll in the developing world and lock in enormous pollution and greenhouse gas emissions for an extended period of time, negating the effect of the stricter action in exporting countries. Finding and enabling solutions to prevent a massive spillover of discarded old vehicles in the international arena across geographies and markets therefore requires shared responsibility.

106
CLUNKERED
SECTION 6: Next steps and the global mechanism
The role of old and used vehicles in aggravating pollution, ill health and climate change risks along with safety hazards in the developing world requires global recognition and action. Importing countries as well as exporting countries need to act quickly to promote a well-governed circular economy around vehicles to prevent ‘environmental dumping’ of clunkers. But there is no clear template to define and address the problem. Used-vehicle trade is also coming in the way of recovering valuable materials from scrapped vehicles in this resource-constrained world.
Vehicle-importing countries have at least begun to discuss and shape regulations. They are putting up barriers of age cap, tax measures and minimal environmental and safety standards to stave off the dirtiest segments. But such unilateral action only on the part of the low-income countries will not help to address the problem.
An equally strong role will have to be played by the exporting countries to ensure that used vehicles meet the requisite emission requirements and safety standards and vehicles have adequate economic life left before they are exported to other countries. As UNEP says, ‘exporting countries will also have to strengthen their own recycling and reuse policies within the economy to ensure effective compliance to avoid dumping’.1
This will require international agreements and platforms to mediate and develop oversight and set guidance for global trade and establish accountability and responsibility. This is one of the weakest links in this trade. As Michael P. Walsh, chairperson of the working group set up under the aegis of the Partnership for Clean Fuels and Vehicles of UNEP to assess used vehicle trade, says, ‘It takes two to tango. Exporting countries must play an important role just as they must with hazardous waste. Exporting countries have the expertise and the technical capacity to distinguish between safe and relatively clean vehicles and those which are unsafe and highly polluting. On the other hand, some of the importing countries lack that capacity. Also in especially poor countries, there will likely be some demand for anything that will roll and the exporting countries cannot allow the citizens in those countries to be exposed to dirty, unsafe vehicles just as they can’t allow them to be recipients of hazardous waste.’
The way forwardCoordinated action based on shared responsibility is needed in vehicle-importing as well as -exporting countries to prevent dumping of clunkers in the poor world. The majority of importing countries extending the life of vehicles much beyond their legally acceptable useful life are accumulating enormous clunkers. Countries will have to invest in huge capacities and preparedness to deal with post-consumer waste. If the scope for recycling and reuse is not done properly it can impose huge systemic costs on the economy and environment.
Action in vehicle-importing countriesNeed harmonized action on age caps, fiscal measures and other import criteria: When capacity in most importing countries to technically assess roadworthiness and emission performance of each imported vehicle is weak, the most immediate and feasible strategy is to adopt an age cap to weed out extremely polluting, unsafe and uneconomical vehicles. A complete ban on

107
CLUNKERED
used vehicles may not be possible immediately in many importing countries immediately. But an age cap will allow utilization of a substantial part of the remaining useful economic life of the younger imported fleet while eliminating the highly polluting vehicles. But the ultimate objective should be to ban import of used vehicles. Well-established criteria will have to be adopted by exporting and importing countries to screen vehicles based on age, emissions and safety performance, history of accident, damage and recall.
So far only four countries in Africa and three countries in South Asia have succeeded in completely banning import of used vehicles. As many as 25 countries in Africa and most in South Asia have imposed age restrictions. But age restriction is widely divergent—from three to 15 years. This needs to be harmonized to below three to five years. Divergent age caps create scope for leakages through porous borders and re-export.
Further, the fiscal strategy of imposing higher tariff on older vehicles will have to be designed for effective reduction in import of old and polluting vehicles. It should not create a perverse incentive for older vehicles over newer ones. Even after an ambitious hefty tax their price remains low and attractive compared to newer vehicles. Thus eliminating very old vehicles from the market is critical to making fiscal measures work.
Countries will have to align their strategies. Harmonized action will help to create bottom-up pressure on the international market and also plug leakages.
Harmonize emissions standards and fuel quality at the minimum level of Euro IV with 50 ppm sulphur fuels: There is growing consensus among regulators as well as multilateral agencies such as UNEP that for global trade in vehicles, Euro IV should be the minimum harmonized standard for both import and export. This by default eliminates all vehicles that are lesser than the Euro IV from the export stream. It will also help stabilize prices for the acceptable fleet in the international market and not undercut regulatory action in importing countries that are trying to establish an age cap as well as minimum emission standards. Global exporters will have to follow the age cap and emission standards requirements for international trade and this will have to be multilaterally established for a harmonized approach. Importing countries cannot gain from regulatory restrictions on age to bring cleaner, younger and more fuel-efficient vehicles if fuel quality and emissions standards do not improve.
Several countries in Africa and South Asia are also developing their own manufacturing and assembly capacities and are adopting restrictive import policies in terms higher import tariffs to stave off influx of cheap and old vehicles. But this will also require emissions and safety standards and quality control for domestic production. Domestic regulations can then become the basis of import as is the practice in India.
Fuel economy measures need to be combined with improvement in emissions standards and fuel quality: This is needed to prevent trade-off between fuel efficiency and higher emissions. This is particularly important now as several exporting countries are phasing out diesel cars to combat air pollution. These are all likely to find their way to importing countries that do not have clean diesel. Countries like Mauritius that had implemented CO2 emissions-based import without clean diesel and commensurate emissions standard could have become vulnerable to a large influx of diesel vehicles. But this did not happen because of the very narrow gap between diesel and petrol prices, higher

108
CLUNKERED
tax on bigger engines and consumer preference for petrol vehicles. But this may not be the case in other countries. The discarded diesel fleet will lock in toxic pollution and heat-trapping black carbon and lead to more illness in the developing world.
Implement inspection system for emissions, roadworthiness and safety in importing countries: Increasingly, several countries such as Uganda, Kenya, Nigeria, Sri Lanka and Bangladesh have begun to set up vehicle inspection centres for on-road emission and roadworthiness tests. But the inspection centres will have to be organized at a different level—at the point of entry and subsequently periodically.
Need harmonized protocol vehicle registration and documentation systems: Regulation of import will require protocol for vehicle registration and checking of authentic documents on emissions and safety status of vehicles to be obtained from dealers and sellers. It needs to record date of manufacturing, original emission standards, export certification system, chassis details, fuel type, status of official inspection at the time of export, and other relevant details based on a clear protocol. CSE has reviewed the vehicle registration system in cities like Addis Ababa and Abuja and found that such details are not recorded.
The exporting countries will also have to maintain transparent and publicly available databases on the emissions and safety and inspection status of vehicles. The entire dealership chain will have to be made accountable and responsible to follow the protocol. Importing countries may increasingly show interest in linking imports with emissions and fuel economy status of vehicles. Countries need explicit systems of oversight and monitoring as well as accountability of dealers. These systems should be developed further and replicated. Exporting countries have a role to play in addressing these challenges and creating transparent information for the supply chain.
Enable scrappage and end-of-life regulations and implementation in importing countries: Low- and middle-income countries will have to deal with the final disposal of the fleet as these vehicles cannot be reused or resold anywhere else. The costs of disposal and recycling rest on these countries and place enormous economic burden on them. Importing countries so far have not accounted for such costs. Moreover, the potential of recovering valuable material—an important part of circular economy—remains underutilized.
This will have to be part of shared responsibilities. The importing companies as well as exporting governments through bilateral and multilateral arrangements need to create mechanism for supporting scrapping and recycling in the low-income countries. This will require a common set of criteria for the region to declare end-of-life of vehicles for recycling. Most countries in Africa and South Asia do not have an adequate inspection system for roadworthiness, emissions and safety. This often makes an arbitrary cut off of age the decisive factor to scrap vehicles.
This sector will require legal support for end of life and dismantling and de-registering a vehicle for it to qualify as an ELV and for its disposal. In India, for instance, unless it is declared so, a vehicle cannot be traded as scrap according to the Motor Vehicles Act 1956 and successive amendments.2 This poses an obstacle to the few formal recyclers in the ELV industry. The governments will have to develop a legislative framework, recycling infrastructure upgrading existing value chains, incentive structures to salvage reusable ELV parts,

109
CLUNKERED
and effective collection and channelization mechanisms that leverage the informal sector. Dealers need to be an important link between consumers and manufacturers or consumers and dismantlers.
The used-vehicle market has its own demand for appropriate spare parts for the makes and models being imported. Even this trade will have to be organized more efficiently to service the entire value chain spread across continents. This is volatile as renewal of the on-road fleet makes older spare parts obsolete. Manufacturers and dealers will have to maintain a critical mass of service components and spare parts in these markets.
Need consumer information and incentive for informed choice: Consumers in importing countries of Africa largely depend on the internet for purchase decisions. For instance, according to UNEP in Nigeria, internet-based sales account for 90 per cent of total purchases.3 Several trade websites have mushroomed but are not certified by the governments. It is difficult to find website that sell certified used vehicles or any official websites giving out credible information status of certification, safety, road worthiness, emissions or fuel economy in the exporting countries.
For informed consumer choice, access to public available databases must be ensured. Advanced countries, for instance, have web-based consumer information systems for consumers. The US EPA’s Green Vehicle Guide provides detailed user-friendly information about green vehicles.4 Its ‘SmartWay vehicle’ or vehicle fuel economy labels provide information on fuel economy, fuel costs and environmental impacts. This includes information on energy impact score, GHG score, EPA smog rating, safety-related information like Crash Test Results etc. The US government’s National Motor Vehicle Title Information System (NMVTIS)5 is designed to protect consumers from fraud and unsafe vehicles and to keep stolen vehicles from being resold. The Federal Trade Commission’s (FTC) Used Car Rule requires dealers to display a Buyers Guide in every used car they offer for sale, and to give it to buyers after the sale.
Websites in Japan, approved by the Japan Government’s Ministry of Economy, Trade and Industry-approved Japan Used Motor Vehicle Exporters Association (JUMVEA),6 provide approved information from Japanese automakers. They provide details necessary to buy the vehicle, including emissions, fuel economy, safety other details.
In Europe, New Car Assessment Programme (NCAP) is a vehicle-safety-rating system determined by a series of vehicle tests, designed and carried out by Euro NCAP. These tests represent, in a simplified way, important real-life accident scenarios that could result in injured or killed car occupants or other road users.
The challenge is to find a global mechanism for integrating these databases to inform the global supply chain and integrate with the protocol of vehicle registration for export and import.
Promote shared responsibility of the exporting countries to filter out old and damaged vehicles from export: Action on used and old vehicle trade cannot be addressed only with unilateral measures in importing countries. The trade pressure from exporting countries can be intense if these countries are not made accountable and responsible for a circular economy. As more and more importing countries begin to put barriers to trade in used vehicles, export will also fall drastically. For instance, in the US, they found that countries

110
CLUNKERED
that have preventive barriers to used-vehicle imports were associated with 67 per cent fewer US exports to that country.7 Emissions in importing countries can be hugely avoided if these vehicles are scrapped rather than exported. The emissions caused by these vehicles are higher when they have had little maintenance and belong to larger engines and higher weight categories.8
Need stringent measures in exporting countries for verification of vehicles for safety, emissions and road worthiness: Currently there is little incentive in exporting countries to have foolproof and robust systems to intercept all end-of-life vehicles, vehicles with compromised safety and emission performance or accident-affected vehicles to stop them from entering the international market. Strong exit rules are needed to verify, inspect, certify and codify in a transparent manner before any vehicle is exported. That the vehicle and chassis identification number is not tampered with must be ensured. All end-of-life vehicles, damaged vehicles and vehicles with compromised emissions and safety features need to be barred from export.
There has to be an online database for verification by the importing countries, dealers and consumers. It is important to establish through a multilateral process essential documents that all exporters and importers must display at the time of exit and entry and registration. There are anecdotal reports that suggest during the process of transshipment, there is considerable stripping of vehicles in re-exporting zones in the Middle East and elsewhere to remove advanced emission-control systems which are not appropriate for the importing countries that do not have appropriate fuels. It is not known what happens to the safety gears in the vehicles. There is no clarity on how this supply chain should be monitored. Monitoring the safety chain is needed to assess the status of safety gadgets in the vehicle. The dealer’s chains will have to be made accountable.
Need accountability and adaptation of Extended Producer Responsibility for global supply chain: How can the approach of establishing manufacturers’ and dealers’ responsibility and Extended Producer Responsibility (EPR) that makes the manufacturer or importer of vehicles responsible for the entire life cycle of the product work in vehicle-importing countries? A review of such a strategy by the Indian government9 shows that the EPR strategy has been adopted by high-income countries where manufacturers are required to reduce the overall environmental footprint of their products by reducing use of toxic and hazardous substances, increasing use of recycled constituents and enhancing ease of disassembly among other steps. Producers also have to provide for the take-back, recycling and final disposal of the product within the domestic economy.10
How can this be taken forward for importing countries? Of course, it will have to be read with the rider that this should not work as extra-jurisdictional reach of other governments and undermine sovereignty. But there has to be a global mechanism to identify the responsibility and participation of stakeholders, including consumers, producers, recyclers and dealers in the supply chain. There is useful experience in Mauritius in the way they have established the procedure for warranty and guarantee with the suppliers as well as certification agencies in the country of origin. This will have to be resolved through intergovernmental consultation. Just as producers are establishing collection and recycling facilities in their respective domains, similar efforts will have to be made as part of shared responsibility in importing countries.
Thus, governments, through bilateral and multilateral processes, as well as

111
CLUNKERED
manufacturers and dealers will have to support establishment of end-of-life and recycling facilities in importing countries.
Vehicle-importing countries need public transport strategies and vehicle-restraint policies to reduce inflow of used cars: The biggest advantage for vehicle-importing countries in Africa and South Asia is their strong legacy and baseline of public-transport use, walking and cycling. Close to 70–80 per cent of their daily travel trips are through these sustainable modes. In cities like Addis Ababa, the share of public transport, para-transit and walk trips is as high as 90 per cent. This needs celebration and protection. Globally, high-income vehicle-exporting countries with very high transport-energy intensity, are trying to adopt policies to reverse automobile dependence and increase share of sustainable modes. If vehicle-importing countries in the developing world succeed in protecting, modernizing and integrating public-transport systems with efficient last-mile connectivity in the early stages of motorization, they can avert the risk of car dependence and locking in of energy intensity and pollution. Such strategies can contribute significantly towards reducing car import.
Leveraging multilateral forums to govern international trade in used vehicles
Mitigation of this problem through shared responsibility is important as vehicles produced in high-income countries continue to emit for a considerable part of their lifespan in low-income countries. There is no clear multilateral forum that has explicitly taken this issue on board. Even though there is global concern over ‘environmental dumping’ of high-polluting vehicles to the least well-off economies, there is no clear template to define and address the problem. The question and solution are still exploratory.
Leveraging trade forums: Literature hints at discussions on used-vehicle import in the World Trade Organization (WTO). This is evident from the review carried out by the Global Fuel Economy Initiative in 2013 in the context of import of used vehicles to Mexico from the US.11 The review has highlighted that though several countries have already put up import barriers to used vehicles, there has been no significant opposition or attempt to block such measures in the WTO.
The grounds for discrimination against the import of second-hand vehicles given especially by Latin American countries have included safety and environmental concerns, and problems with valuation and protection against fraud and corruption. Colombia has cited Article XX (b) of GATT 1994, which allows general exceptions for countries to accomplish ‘non-economic’ objectives, including the safety and health of human, plant and animal life. To justify domestic protectionist policies in WTO, Brazil has cited customs valuation concerns and the potential for fraud, and ‘negative impacts for the environment and public safety arising from the commercialization of used consumer goods in the domestic market’.12 Brazil has also pointed out that such policies were common to many WTO Members and bans should not be considered as distorting trade.
India has fought the used-vehicle import very hard during 2007–09 to protect its own industry and has its policy to ban such import and make it a legal requirement that all imported vehicles meet the current emission standards in force in India.
However, as the experience of Mexico has shown, importing countries can come under pressure in free trade zones such as NAFTA, where a unilateral decision to impose an age-based ban may become difficult. After signing NAFTA, Mexico

112
CLUNKERED
had opted for a policy reversal in which 10–15-year-old vehicles from the US and Canada were allowed once again to the detriment of the environment. Thus, a roadmap for a circular economy will have to be included in all trade negotiations.
Multilateral environmental forums: Multilateral environmental forums on climate change such as UNFCCC need to explore the possibility of facilitating dialogue and decisions on the framework that should govern used-vehicle trade. The Partnership on Vehicles and Fuel Quality of the United Nations Environment Programme (UNEP) is currently evaluating used-vehicle trade to chart the roadmap for action. This may be taken forward to influence multilateral strategies and national policies to set the terms of global trade. This trade has huge implications for climate impacts as old vehicles with highly inefficient engines and malfunction incite energy guzzling and lock in CO2 and black carbon. Moreover, cheap used vehicles allow the market to shift steadily towards bigger vehicles, which undermines the inherent advantage of the small-car market of South Asia and Africa.
International cooperation: Yet another platform that needs to be explored and leveraged is international forums and blocks of governments. Some international forums such as G8, G20 and BASIC have begun to place the sustainability agenda on the table as well as the importance of integrating the framework of a circular economy for the security of the supply of resources and environmental sustainability.
G20, for example, is more explicit in its discussions. It has begun the discussion on developing frameworks to enhance a circular economy, sustainable production and consumption. Circular economy is now getting linked with the 2030 Agenda for Sustainable Development and the Paris Agreement. It is expected to bring more transparency across global supply chains and facilitate financing for establishing circular supply chains.13 A policy brief of the G20 group states that G20 governments should support transparency across global supply chains regarding the origins and content of circular products and materials by supporting development of standards and labels as part of ‘sharing economy’ or ‘collaborative economy’. It states that countries require an agreed common framework of indicators to monitor the performance of countries and companies worldwide14 to respect resource-efficient principles. This requires knowledge sharing among countries to ensure trading in goods is ‘circular’ and not hazardous.15 Multilateral platforms can develop a common framework of indicators to monitor the performance of the circular economy of companies worldwide, and look at the performance and life expectancy of products as the original ones.
Such discussions create the opportunity for including used vehicles in the trade and multilateral negotiations on circular and hazardous trade.
Involve manufacturers and dealers: Manufacturers and dealers are involved in global supply chains. This complex chain needs transparency regarding the origin and content of circular products and materials and collaboration among different industries along the supply chains. The governments can support the development of labelling and declaration of content of products and materials and ensure resource-efficient supply chains. In Europe, companies such as Volvo, Toyota and Volkswagen have begun to take the responsibility for the final disposal of their products. It will be worth exploring how manufacturers or their franchisees or dealers can replicate such systems globally.

113
CLUNKERED
Centre for Science and Environment has initiated region-wise consultation process in Africa and South Asia on the challenges and solutions for used vehicle import. Periodic consultations with the regulators and concerned stakeholders have been carried out in Nairobi, Delhi and Zanzibar to review the issues, status, roadmap and gain local insight in a participatory manner to chart a roadmap. This has helped to get deeper insight into the emerging issues and solutions needed at the national, regional and global level. Those who participated in this consultation process and have contributed deeply to the understanding of the issues are as follow:
Africa
Ethiopia Nigussie Kebede, Federal Transport AuthorityMeseret Abdissa Gossa, Ministry of Environment, Forest and Climate ChangeGossa Tefera Mekuria, Ministry of Finance and Economic CooperationEndale Yimer, Ethiopian Revenues and Customs AuthorityYehalem Tesera, Driver and Vehicle Licensing and Control Authority, Addis Ababa Road and Transport Office
Nigeria Anthonia A. Ekpa, Federal Ministry of Transportation Emmanuel Olukunle Ojo, Federal Ministry of Environment Efosa Peter Osawe, Federal Road Safety CorpsAbdulkadir Ibrahim, Federal Ministry of Transportation
KenyaAyub Macharia, Ministry of Environment and Natural ResourcesPeter Odhengo, The National TreasuryMuitungu Mwai, National Environment Management Authority
Mauritius Nassir Ally Khadun formerly with National Transport AuthorityBalram Asyrigadoo formerly with State Trading CorporationAjayedutt Juggurnath, Department of Environment, Ministry of Environment, Sustainable Development, Disaster and Beach Management
Uganda Ronald Amanyire, Ministry of Works and TransportNathan Tumushabe, Ministry of Works and TransportJennifer Kutesakwe, National Environment Management Authority
GhanaEmmanuel Appoh, Environmental Protection AgencyBaba Bukari Musah, Customs Division, Ghana Revenue Authority
ZimbabweAlpha Chikurira, Environmental Management Agency
ZambiaNkanga Shimwandwe, Zambia Revenue Authority
Annexure: CSE consultation on the issue of vehicle import

114
CLUNKERED
Chrispin Simwanza, Zambia Environmental Management AgencyJoseph Mumba, Road Transport and Safety Agency
Mozambique Anselmo Manuel Beula Fumo, Mozambique Revenue AuthoritySamson Cuamba, Ministry of Environment
Côte d’IvoireKone Nagnonta, Ministry of TransportGnamien Stéphane Meney, Ministry of EnvironmentDembélé Diakaridja, Ministry of Transport
Tanzania Stephen Samwel Malekano, Tanzania Revenue AuthorityJoseph Yongo, Tanzania Revenue AuthorityAli Bakari Ame, Tanzania Revenue Authority, ZanzibarRobert Marealle, Ministry of Works, Transport and Communications
ZanzibarAboud S. Jumbe, Department of EnvironmentSalim Hamad Bakar, Department of EnvironmentAli I. Badni, Zanzibar Environmental Management AuthorityHaidar Bakari Machano, Zanzibar Environmental Management AuthorityMgeni Khamis, Zanzibar Environmental Management Authority
South Asia Bhutan Karma Pemba, Road Safety and Transport Authority, Ministry of Information and Communications
NepalRam Chandra Poudel, Department of Transport Management, Ministry of Physical Infrastructure and Transport
Sri Lanka Thusitha Sugathapala, Department of Mechanical Engineering, University of Moratuwa
Multilateral body
United Nations Environment ProgrammeRob Jong, United Nations Environment ProgrammeJane Akumu, United Nations Environment Programme

115
CLUNKERED
References
SECTION 1: Why this study?1. Sakai et al. 2013
2. Several countries in Africa have prepared their INDC documents. For example, Federal Democratic Republic of Ethiopia Intended Nationally Determined Contribution (INDC) of the Federal Democratic Republic of Ethiopia, http://www4.unfccc.int/ndcregistry/PublishedDocuments/Ethiopia%20First/INDC-Ethiopia-100615.pdf
3. Anon. 2017, Four more countries in Africa switch to low sulfur fuels. United Nations Environment Programme. http://www4.unfccc.int/ndcregistry/PublishedDocuments/Ethiopia%20First/INDC-Ethiopia-100615.pdf
4. Central Pollution Control Board, Chintan, GIZ New Delhi, India 2015, Analysis of End of Life Vehicles ( ELVs ) Sector in India.
5. Recycle materials potential of imported used vehicles in Nigeria C.O.A. Agbo Department of Mechanical Engineering, University of Nigeria, Nsukka, Nigeria. Email: [email protected]; [email protected], file:///C:/Users/Anumita/Downloads/123551-338031-1-PB.pdf
6. Kris Vanherle (TML), Robert Vergeer (CE) 2016, Data gathering and analysis to improve the understanding of 2nd hand car and LDV markets and implications for the cost effectiveness and social equity of LDV CO2 regulations, Final Report for: DG Climate Action, European Commission, Brussels, https://ec.europa.eu/clima/sites/clima/files/transport/vehicles/docs/2nd_hand_cars_en.pdf, as viewed on 11 April 2018.
7. https://www.usitc.gov/publications/332/used_vehicle_wp_id-44_final_web_0.pdf
8. Anon. 2017, Four more countries in Africa switch to low sulfur fuels, United Nations Environment programme, https://www.unenvironment.org/news-and-stories/featured-article/four-more-countries-africa-switch-low-sulfur-fuels as viewed on 21 April 2018.
9. Central Pollution Control Board, Chintan, GIZ New Delhi, India 2015, Analysis of End of Life Vehicles ( ELVs ) Sector in India.
10. Rob de Jong, UNEP, Promoting Cleaner Used Vehicles in Africa, https://wedocs.unep.org/bitstream/handle/20.500.11822/25233/PromotingCleanerUsedVehicles.pdf?sequence=9&isAllowed=y
11. US EPA’s Green Vehicle Guide https://www.epa.gov/greenvehicles
12. US Government’s National Motor Vehicle Title Information System (NMVTIS) https://www.vehiclehistory.gov/
13. Japan Used Motor Vehicle Exporters Association, http://stock.jumvea.or.jp/stock-detail/japan-used-subaru-impreza-sedan-car-2937763.html
14. David Coffin, Jeff Horowitz, Danielle Nesmith, and Mitchell Semanik 2016, Working paper ID-044 of Office of Industries of United States International Trade Commission Examining Barriers to Trade in Used Vehicles. https://www.usitc.gov/publications/332/used_vehicle_wp_id-44_final_web_0.pdf

116
CLUNKERED
15. https://www.globalfueleconomy.org/media/45362/wp7_regulation_for_2nd-hand_vehicles-lr.pdf
16. Ministry of Environment and Forest and Climate Change and Central Pollution Control Board 2016, Guidelines for Environmentally sound management of end of life vehicles (ELVs), Government of India.
17. Ministry of Environment and Forest and Climate Change and Central Pollution Control Board 2016, Guidelines for Environmentally sound management of end of life vehicles (ELVs), Government of India.
18. Jorge Macias et al. 2013, Policy Handbook for the Regulation of Imported Second-Hand Vehicles, Mexico, Global Fuel Economy Initiative.
19. Ibid.
20. G20 insights policy brief, 24 May 2017 (last updated 16 October 2017), http://www.g20-insights.org/policy_briefs/contribution-g20-governments-can-make-support-circular-economy/The contribution G20 governments can make to support the circular economy
21. Ibid.
SECTION 2: Motorization riding high on used-vehicle import1. OECD/IEA 2014 as quoted in Hyacinthe Nare et al. 2017, Developing a
roadmap for the adoption of clean fuel and vehicle standards in Southern and Western Africa, International Council on Clean Transportation, Washington, p. 6.
2. Anon. 2015, Vehicles in-use 2015 data, International Organization of Motor Vehicle Manufacturers (OICA).
3. Priyanka Chandola 2015, Africa adopts continent-wide sustainable transport agenda, Down to Earth, http://www.downtoearth.org.in/news/africa-adopts-continent-wide-sustainable-transport-agenda-48089.
4. Anthony May et al. 2010, Urban Transport and Mobility, Background paper, International Transport Forum, Leipzig, 26–28 May 2010.
5. CSE based on data provided by the Addis Ababa Transport Authority.
6. Thusitha Sugathapala, 2018, University of Moratuwa, Developing Fuel Economy Policies in Sri Lanka – Status and Challenges, mimeo.
7. International Trade Centre UNCTAD/WTO, 1994-2017, http://www.intracen.org/default.aspx
8. Ibid.
9. Kris Vanherle (TML), Robert Vergeer (CE) 2016, Data gathering and analysis to improve the understanding of 2nd hand car and LDV markets and implications for the cost effectiveness and social equity of LDV CO2 regulations, Final Report for: DG Climate Action, European Commission, Brussels, https://ec.europa.eu/clima/sites/clima/files/transport/vehicles/docs/2nd_hand_cars_en.pdf, as viewed on 11 April 2018.
10. UNEP 2016 Executive summary,
11. https://www.unece.org/fileadmin/DAM/trans/doc/2017/itc/UNEP-ITC_Background_Paper-Used_Vehicle_Global_Overview.pdf
12. https://www.unece.org/fileadmin/DAM/trans/doc/2017/itc/UNEP-ITC_Background_Paper-Used_Vehicle_Global_Overview.pdf

117
CLUNKERED
13. David Coffin, Jeff Horowitz, Danielle Nesmith, and Mitchell Semanik 2016, Working paper ID-044 of Office of Industries of United States International Trade Commission Examining Barriers to Trade in Used Vehicles J https://www.usitc.gov/publications/332/used_vehicle_wp_id-44_final_web_0.pdf
14. Ibid.
15. https://www.unece.org/fileadmin/DAM/trans/doc/2017/itc/UNEP-ITC_Background_Paper-Used_Vehicle_Global_Overview.pdf
16. David Coffin, Jeff Horowitz, Danielle Nesmith, and Mitchell Semanik 2016, Working paper ID-044 of Office of Industries of United States International Trade Commission Examining Barriers to Trade in Used Vehicles, https://www.usitc.gov/publications/332/used_vehicle_wp_id-44_final_web_0.pdf
17. https://www2.deloitte.com/content/dam/Deloitte/za/Documents/manufacturing/ZA_Deloitte-Africa-automotive-insights-Ethiopia-Kenya-Nigeria-Apr16.pdf
18. Paul A. Eisenstein 2017, Australia’s 100-Year-Old Automobile Industry Just Closed Down, https://www.nbcnews.com/business/autos/australia-s-100-year-old-automobile-industry-just-closed-down-n812756, as viewed on 3 May 2018.
19. Campbell Simpson 2016, New And Used Cars Will Get A Lot Cheaper In Australia From 2018 Thanks To Parallel Imports, https://www.gizmodo.com.au/2016/02/new-and-used-cars-will-get-a-lot-cheaper-in-australia-from-2018-thanks-to-parallel-imports/ , as viewed on 3 May 2018.
20. Paul A. Eisenstein 2017, Australia’s 100-Year-Old Automobile Industry Just Closed Down.
21. Campbell Simpson 2016, New And Used Cars Will Get A Lot Cheaper In Australia From 2018 Thanks To Parallel Imports.
22. Paul A. Eisenstein 2017, Australia’s 100-Year-Old Automobile Industry Just Closed Down.
23. Campbell Simpson 2016, New and Used Cars Will Get a Lot Cheaper in Australia from 2018 Thanks to Parallel Imports.
24. Paul A. Eisenstein 2017, Australia’s 100-Year-Old Automobile Industry Just Closed Down.
25. Campbell Simpson 2016, New and Used Cars Will Get a Lot Cheaper in Australia from 2018 Thanks to Parallel Imports.
26. Automotive industry in New Zealand 2018, https://en.wikipedia.org/wiki/Automotive_industry_in_New_Zealand (as viewed on 3 May 2018).
27. Rob Maetzig 2017, How New Zealand buys and sells more than a million cars a year, https://www.stuff.co.nz/motoring/98011255/how-new-zealand-buys-and-sells-more-than-a-million-cars-a-year
28. UNEP-ITC 2017, Background Paper Used Vehicles Global Overview, https://www.unece.org/fileadmin/DAM/trans/doc/2017/itc/UNEP-ITC_Background_Paper-Used_Vehicle_Global_Overview.pdf as viewed on 3 May 2018).
29. Rob Stock 2018, Necessary, dirty and unlauded: The industry that scraps 150,000 cars a year, https://www.stuff.co.nz/business/money/102939132/

118
CLUNKERED
necessary-dirty-and-unlauded-the-industry-that-scraps-150000-cars-a-year as accessed on 3 May 2018.
30. Emma Hatton 2018, 50,000 NZ vehicles affected in airbag recall, https://www.radionz.co.nz/news/national/354074/50-000-nz-vehicles-affected-in-airbag-recall (as viewed on 3 May 2018).
31. List of countries by vehicles per capita 201/, https://en.wikipedia.org/wiki/List_of_countries_by_vehicles_per_capita as viewed on 3 May 2018
32. Tacy Neal 2018, Moves to close damaged vehicle import loophole, https://www.radionz.co.nz/news/national/349462/moves-to-close-damaged-vehicle-import-loophole (as viewed on 3 May 2018).
33. The Rise and Rise of New Zealand’s Used Imported Car Market, https://www.mta.org.nz/media/press-releases/the-rise-of-new-zealands-used-imported-car-market/
34. David Coffin, Jeff Horowitz, Danielle Nesmith, and Mitchell Semanik 2016, Working paper ID-044 of Office of Industries of United States International Trade Commission Examining Barriers to Trade in Used Vehicles. https://www.usitc.gov/publications/332/used_vehicle_wp_id-44_final_web_0.pdf
35. https://www.unece.org/fileadmin/DAM/trans/doc/2017/itc/UNEP-ITC_Background_Paper-Used_Vehicle_Global_Overview.pdf
SECTION 3: Polluted air and public-health imperatives1. New data from the World Health Organization (WHO), May 2018.
2. Anon. 2014, Non-communicable Diseases Country Profiles 2014, World Health Organization, Geneva, p.138.
3. Anon. 2009, Africa Review Report on Transport: A Summary, Sixth Session of the Committee on Food Security and Sustainable Development Regional Implementation Meeting for the Eighteenth Session of the Conference on Sustainable Development, United Nations Economic and Social Council Economic Commission for Africa, October 27–30, Addis Ababa, p. 3.
4. Anon. 2014, Burden of disease from household air pollution for 2012, World Health Organization.
5. Health Information Management at Kenyatta National Hospital as quoted in Anon. 2014, Health Report, University of Nairobi Enterprises and Services Limited submitted to Energy Regulatory Commission, Nairobi, p. 8.
6. Anon 2016, The Little Green Data Book, The World Bank, Washington, p. 157.
7. A.M. Padula et al. 2014, Traffic related air pollution and risk of preterm birth in the San Joaquin Valley of California, Annals of Epidemiology, December.
8. Marie Pedersen et al. 2013, Ambient air pollution and low birthweight: A European cohort study (ESCAPE), Lancet Respiratory Journal, 15 October 2013.
9. Nicholas Rees 2017, Danger in the air: How air pollution can affect brain development in young children, United Nations Children’s Fund, New York, p. 6.
119
CLUNKERED
10. A.B. Ajayi, O.O. Dosunmu 2002, Environmental hazards of importing used vehicles into Nigeria, Proceedings of International Symposium on Environmental Pollution Control and Waste Management 7–10 January 2002, Tunis (EPCOWM 2002), p. 521–32
11. Lung India, 1989, VII, No. 1
12. J Environ Sci Eng. 2005 Jul;47(3)
13. Science of the Total Environment Volume 372, Issues 2–3, 1 January 2007.
14. Toxicol Ind Health. 1996 Sep–Oct;12(5)
15. India in Environmental Pollution. 2000 Aug;109(2)
16. Indian J Med Res 130, November 2009
17. Int J Hum Genet, 6(2): 125–31 (2006)
18. India in J Asthma. 2009 Mar; 46(2)
19. International Council on Clean Transportation, 2017, Developing a roadmap for the adoption of clean fuel and vehicle standards in Southern and Western Africa
20. Batatunde Bakare 2016, Alternative Fuels: Compressed Natural Gas, UNEP
21. UNEP ITC 2017, Background Paper Used Vehicles Global Overview, https://www.unece.org/fileadmin/DAM/trans/doc/2017/itc/UNEP-ITC_Background_Paper-Used_Vehicle_Global_Overview.pdf as viewed on 11 April 2018.
22. Zifei Yang, International Council on Clean Transportation, May 2018.
23. Ibid.
SECTION 4: Setting the terms for used-vehicle imports1. Lucas W. Davis et al. 2011, Cash for clunkers? The environmental
impact of Mexico’s demand for used vehicles, ACCESS, https://www.accessmagazine.org/spring-2011/cash-clunkers-environmental-impact-mexicos-demand-used-vehicles/, as accessed on 7 April 2018.
2. Hyacinthe Nare et al. 2017, Developing a roadmap for the adoption of clean fuel and vehicle standards in Southern and Western Africa, International Council on Clean Transportation, https://www.theicct.org/sites/default/files/publications/Africa-Roadmap-Report_ICCT_28042017_vF.pdf, as accessed on 28 March 2018.
3. Ibid.
4. Noor E. Alam, Project Manager, Greater Dhaka Sustainable Urban Transport Project, Ministry of Road Transport and Bridges, Bangladesh, 2017, Challenges in implementing Stricter vehicle emission standards in Bangladesh, mimeo.
5. Nathan Tumushabe et al. 2018, Strategy of Environmental Levy on Used Vehicles, Vehicle Age Restriction and Vehicle Emissions Inspection, Paper presented at the Combating Dumping of Used Vehicles: Regional Consultation on Roadmap for Vehicle Import Policy in Africa and South Asia for Clean Air, Centre for Science and Environment, Zanzibar, 31 May 2018.
6. Frank Yiga 2018, Tax hikes for secondhand cars in Uganda, Deutsche Welle http://www.dw.com/en/tax-hikes-for-secondhand-cars-in-

120
CLUNKERED
uganda/a-43438412 as viewed on 18 April 2018.
7. Nathan Tumushabe et al. 2018, Strategy of Environmental Levy on Used Vehicles, Vehicle Age Restriction and Vehicle Emissions Inspection, Paper presented at the Combating Dumping of Used Vehicles: Regional Consultation on Roadmap for Vehicle Import Policy in Africa and South Asia for Clean Air, Centre for Science and Environment, Zanzibar, 31 May 2018.
8. Ibid.
9. Ronald Amanyire, 2016, Fiscal Policies to Reduce Import of Old Vehicles in Uganda,
Paper presented at the Regional Consultation on Air Quality, Clean Vehicles and Sustainable Mobility Roadmap, Centre for Science and Environment and National Environment Management Authority, Nairobi, 24–25 August 2016.
10. Solomon Arinatwe, 2018, Govt moves to ban ‘old’ car imports, Daily Monitor, http://www.monitor.co.ug/News/National/Govt-moves-ban--old--car-imports/688334-4375714-2r12tyz/index.html, as accessed on 15 April 2018.
11. Nathan Tumushabe et al. 2018, Strategy of Environmental Levy on Used Vehicles, Vehicle Age Restriction and Vehicle Emissions Inspection, Paper presented at the Combating Dumping of Used Vehicles: Regional Consultation on Roadmap for Vehicle Import Policy in Africa and South Asia for Clean Air, Centre for Science and Environment, Zanzibar, 31 May 2018.
12. Victor Kiprop 2017, Uganda tightens rules for used-car importation, The East African http://www.theeastafrican.co.ke/business/Kampala-rules-for-used-car-importation-/2560-4059794-oo5pnk/index.html as accessed on 30 March 2018.
13. Nathan Tumushabe et al. 2018, Strategy of Environmental Levy on Used Vehicles, Vehicle Age Restriction and Vehicle Emissions Inspection, Paper presented at the Combating Dumping of Used Vehicles: Regional Consultation on Roadmap for Vehicle Import Policy in Africa and South Asia for Clean Air, Centre for Science and Environment, Zanzibar, 31 May 2018.
14. Frank Yiga 2018, Tax hikes for secondhand cars in Uganda, Deutsche Welle http://www.dw.com/en/tax-hikes-for-secondhand-cars-in-uganda/a-43438412 as viewed on 18 April 2018.
15. Muitungu Mwai, 2018, Age Restriction and Higher Taxation for Used Vehicles: Impact and Next Steps, Paper presented at the Combating Dumping of Used Vehicles: Regional Consultation on Roadmap for Vehicle Import Policy in Africa and South Asia for Clean Air, Centre for Science and Environment, Zanzibar, 31 May 2018.
16. Peter O. Odhengo 2016, Vehicle Import Policy in Kenya: Measures Being Taken to Reduce Importation of Second Hand Vehicles, Paper presented at the Regional Consultation on Air Quality, Clean Vehicles and Sustainable Mobility Roadmap, Centre for Science and Environment and National Environment Management Authority, Nairobi, 24–25 August 2018.
17. Victor Juma 2017, KRA raises taxes on used Mercedes, Mazda imports,

121
CLUNKERED
Business Daily, https://www.businessdailyafrica.com/corporate/companies/KRA-raises-taxes-on-used-Mercedes--Mazda-imports/4003102-4073654-1uw9qsz/index.html as viewed on 25 March 2018.
18. Peter O. Odhengo 2016, Vehicle Import Policy in Kenya: Measures Being Taken to Reduce Importation of Second Hand Vehicles, Paper presented at the Regional Consultation on Air Quality, Clean Vehicles and Sustainable Mobility Roadmap, Centre for Science and Environment and National Environment Management Authority, Nairobi, 24–25 August 2018.
19. James Kariuki, 2017, Costly used vehicles in Uhuru age limit push, Business Daily, https://www.businessdailyafrica.com/economy/Costly-used-vehicles-in-Uhuru-age-limit-push/3946234-4216188-x7n3xwz/index.html, as accessed on March 31, 2018.
20. Nassir Ally Khadun 2018, Roadmap for Clean Air, Paper presented at the Combating Dumping of Used Vehicles: Regional Consultation on Roadmap for Vehicle Import Policy in Africa and South Asia for Clean Air, Centre for Science and Environment, Zanzibar, 31 May 2018.
21. Ibid.
22. Ibid.
23. Ibid.
24. Ibid.
25. Balram Asyrigadoo 2017, Mauritius, Paper presented at the Training Workshop on Clean Air Action Planning Strategies for Liveable Cities, Centre for Science and Environment, New Delhi, 17–21 January 2017.
26. Ibid.
27. Nassir Ally Khadun 2018, Roadmap for Clean Air, Paper presented at the Combating Dumping of Used Vehicles: Regional Consultation on Roadmap for Vehicle Import Policy in Africa and South Asia for Clean Air, Centre for Science and Environment, Zanzibar, 31 May 2018.
28. Baba Bukari Musah 2018, Import Vehicle Policy Related Initiatives of Ghana, Paper presented at the Combating Dumping of Used Vehicles: Regional Consultation on Roadmap for Vehicle Import Policy in Africa and South Asia for Clean Air, Centre for Science and Environment, Zanzibar, 31 May 2018.
29. Emmanuel Appoh 2016, Status of Vehicle Importation Policy and Taxation System in Ghana, Paper presented at the Regional Consultation on Air Quality, Clean Vehicles and Sustainable Mobility Roadmap, Centre for Science and Environment and National Environment Management Authority, Nairobi, 24–25 August 2016.
30. Baba Bukari Musah 2018, Import Vehicle Policy Related Initiatives of Ghana, Paper presented at the Combating Dumping of Used Vehicles: Regional Consultation on Roadmap for Vehicle Import Policy in Africa and South Asia for Clean Air, Centre for Science and Environment, Zanzibar, 31 May 2018.
31. Austin Brakopowers, 2017, GRA impounds 100 vehicles over duty evasion, readies to do more, https://www.myjoyonline.com/news/2017/october-5th/gra-impounds-100-vehicles-over-duty-evasion-readies-to-do-more.php, as accessed on 5 April 2018.
32. Baba Musah Bukari 2018, Import Vehicle Policy Related Initiatives of
122
CLUNKERED
Ghana, Paper presented at the Combating Dumping of Used Vehicles: Regional Consultation on Roadmap for Vehicle Import Policy in Africa and South Asia for Clean Air, Centre for Science and Environment, Zanzibar, 31 May 2018.
33. Emmanuel Appoh 2016, Status of Vehicle Importation Policy and Taxation System in Ghana, Paper presented at the Regional Consultation on Air Quality, Clean Vehicles and Sustainable Mobility Roadmap, Centre for Science and Environment and National Environment Management Authority, Nairobi, 24–25 August 2018.
34. Remy Norbert Duhuze 2018, Fuel and Vehicle Standards, Paper presented at the Africa Clean Mobility Week, Nairobi, 12–16 March 2018.
35. Dan Ngabonziza 2017, Car Imports To Rwanda Drop By 20% As High Taxes Bite, KT Press, May 26, http://ktpress.rw/2017/05/car-imports-to-rwanda-drop-by-20-as-high-taxes-bite/ as viewed on 26 March 2018.
36. Ibid.
37. Remy Norbert Duhuze 2018, Fuel and Vehicle Standards, Paper presented at the Africa Clean Mobility Week, Nairobi, 12–16 March 2018.
38. Alpha Chikurira 2016, Measures to Reduce Used Vehicle Imports in Zimbabwe, Paper presented at the Regional Consultation on Air Quality, Clean Vehicles and Sustainable Mobility Roadmap, Centre for Science and Environment and National Environment Management Authority, Nairobi, 24–25 August 2016.
39. Tatira Zwinoira, 2018, Govt moots second-hand vehicles ban, https://www.newsday.co.zw/2018/02/govt-moots-second-hand-vehicles-ban/News Day, as accessed on 3 March 2018.
40. Alpha Chikurira 2016, Measures To Reduce Used Vehicle Imports in Zimbabwe, Paper presented at the Regional Consultation on Air Quality, Clean Vehicles and Sustainable Mobility Roadmap, Centre for Science and Environment and National Environment Management Authority, Nairobi, 24–25 August 2016.
41. Ibid.
42. Tatira Zwinoira, 2018, Govt moots second-hand vehicles ban, https://www.newsday.co.zw/2018/02/govt-moots-second-hand-vehicles-ban/News Day, as accessed on 3 March 2018.
43. Gnamien Stéphane Meney et al. 2018, Vehicle Import Policy and Age Restriction: Impact, Lessons and Next Steps, Paper presented at the Combating Dumping of Used Vehicles: Regional Consultation on Roadmap for Vehicle Import Policy in Africa and South Asia for Clean Air, Centre for Science and Environment, Zanzibar, 31 May 2018.
44. Ibid.
45. Kone Nagnonta 2017, Head of the Bureau Summary Report and Statistics, Ministry of Transport, Côte d’Ivoire, Abidjan, December 11, personal communication.
46. Gnamien Stéphane Meney et al. 2018, Vehicle Import Policy and Age Restriction: Impact, Lessons and Next Steps, Paper presented at the Combating Dumping of Used Vehicles: Regional Consultation on Roadmap for Vehicle Import Policy in Africa and South Asia for Clean Air, Centre for Science and Environment, Zanzibar, 31 May 2018.

123
CLUNKERED
47. Kone Nagnonta et al 2017, Côte d’Ivoire, Paper presented at the India–Africa Training Workshop on Clean Air Action Planning Strategies, Centre for Science and Environment, New Delhi, 23–26 October, 2017.
48. Stephen Samwel Malekano et al. 2018, Tanzania, Paper presented at the Combating Dumping of Used Vehicles: Regional Consultation on Roadmap for Vehicle Import Policy in Africa and South Asia for Clean Air, Centre for Science and Environment, Zanzibar, 31 May 2018.
49. Ibid.
50. Anselmo Manuel Beula Fumo 2018, Mozambique, Paper presented at the Combating Dumping of Used Vehicles: Regional Consultation on Roadmap for Vehicle Import Policy in Africa and South Asia for Clean Air, Centre for Science and Environment, Zanzibar, 31 May 2018.
51. Nkanga Shimwandwe et al, 2018, Vehicle Import Policy Status for Zambia, Paper presented at the Combating Dumping of Used Vehicles: Regional Consultation on Roadmap for Vehicle Import Policy in Africa and South Asia for Clean Air, Centre for Science and Environment, Zanzibar, 31 May 2018.
52. Ibid.
53. Anon. 2018, Swaziland imposes 6 per cent levy on vehicles from Dubai https://www.journalducameroun.com/en/swaziland-imposes-6-percent-levy-on-vehicles-from-dubai/as viewed on 26 March 2018.
54. Japanese Car Trade.com, 2017-18, Import Rules and Regulations for Japanese Used Vehicles in Bangladesh, https://info.japanesecartrade.com/content-item/205-import-rules-and-regulations-for-japanese-used-vehicles-in-bangladesh, as accessed on 2 April 2018.
55. Noor E. Alam, Project Manager, Greater Dhaka Sustainable Urban Transport Project, Ministry of Road Transport and Bridges, Bangladesh, Challenges in implementing Stricter vehicle emission standards in Bangladesh, 2018, March, Bangkok.
56. Anon., 2002, Bangladesh: Reducing Emissions from Baby-Taxis in Dhaka, Joint UNDP/World Bank Energy Sector Management Assistance Programme (ESMAP), https://www.esmap.org/sites/default/files/esmap-files/Rpt_ESM2530Baby0taxis0253102.pdf, as accessed on 29 March 2018.
57. Clean Air Asia, 2016, Vehicle Inspection and Maintenance in Asia Policy Profile: BANGLADESH, http://cleanairasia.org/wp-content/uploads/2016/08/CountryProfile_Bangladesh.pdf
58. Zia Wadud 2008, CNG conversion of motor vehicles: Co-benefits in Dhaka, Bangladesh University of Engineering and Technology, presentation, mimeo, 12 November 2008.
59. National Council of Bhutan, May 2014, A Policy Review on Import of Secondhand Electric Vehicles, http://www.nationalcouncil.bt/assets/uploads/docs/download/2015/Final_Policy_review_on_Electric_cars.pdf, as accessed on 1 April 2018.
60. Karma Pemba 2018, Sharing Bhutan’s Experience on Regulations of Vehicle Import, Banning of Used Vehicles: Impact, Lessons and Next Steps, Paper presented at the Combating Dumping of Used Vehicles: Regional Consultation on Roadmap for Vehicle Import Policy in Africa and South Asia for Clean Air, Centre for Science and Environment,

124
CLUNKERED
Zanzibar, 31 May 2018.
61. National Council of Bhutan, May 2014, A Policy Review on Import of Secondhand Electric Vehicles, http://www.nationalcouncil.bt/assets/uploads/docs/download/ 2015/Final_Policy_review_on_Electric_cars.pdf, as accessed on 1 April 2018.
62. Simba Shipping, 2018, Rules and regulations, http://www.simbashipping.com/shipping-destinations/bhutan/shipping-rules/, as accessed on 2 April 2018.
63. Karma Pemba, 2018, Sharing Bhutan’s Experience on Regulations of Vehicle Import, Banning of Used Vehicles: Impact, Lessons and Next Steps, Paper presented at the Combating Dumping of Used Vehicles: Regional Consultation on Roadmap for Vehicle Import Policy in Africa and South Asia for Clean Air, Centre for Science and Environment, Zanzibar, 31 May 2018.
64. Ibid.
65. Chandra Man Shrestha 2017, Air Quality and Cleaner Used Vehicles Case of Nepal, Paper presented at the Conference on Ensuring Better Air Quality and Reduced Climate Emissions through Cleaner Used Vehicles, Geneva.
66. Anon., 2018, Imported vehicles to meet Euro IV norms, in The Himalayan, 2 March, https://thehimalayantimes.com/business/imported-vehicles-meet-euro-iv-norms/, as viewed on 15 March 2018.
67. Bibek Dangol 2017, Vehicle import tax and safety of the people, http://www.ourkirtipur.com.np/index.php/component/content/article/115-opinion/798-vehicle-import-tax-and-safety-of-the-people viewed on 18 April 2018.
68. Ram Chandra Poudel 2018, Nepalese Experience on Management of Motor Vehicles, Paper presented at the Combating Dumping of Used Vehicles: Regional Consultation on Roadmap for Vehicle Import Policy in Africa and South Asia for Clean Air, Centre for Science and Environment, Zanzibar, 31 May 2018.
69. Ministries of Industry and Production, Government of Pakistan, 2016, Automotive Development Policy (ADP) 2016-21, http://boi.gov.pk/boi/userfiles1/file/AutoPolicy/APCompressed.pdf, as viewed on 24 April 2018.
70. Mubarak Zeb Khan, 2015, Used cars import to continue under new auto policy in Dawn, Islamabad, https://www.dawn.com/news/1207405, as viewed on April 24, 2018.
71. Thusitha Sugathapala, 2018, Developing Fuel Economy Policies in Sri Lanka – Status and Challenges, Paper presented at the Asia Pacific Clean Air Partnership Joint Forum and Clean Air Week, 20th May 2018, and Solutions Landscape for Clean Air, United Nations Conference Center, Bangkok, Thailand, 19–23 March 2018.
72. Ibid.
73. Sri Lanka Customs, 2017, Moto Vehicle Unit, http://www.customs.gov.lk/declaration/mvu, as viewed on 4 April 2018.
74. Ibid.

125
CLUNKERED
75. Sugath Yalegama, An overview of policies on car importation and their effects - Case of Sri Lanka, Ministry of National Policies and Economic Affairs, Sri Lanka, https://www.unece.org/fileadmin/DAM/trans/doc/2017/itc/UNEP_15_An_overview_of_policies_on_car_importation_Sri_Lanka.pdf
76. January 2017, Myanmar restricts used car imports, ET Auto, https://auto.economictimes.indiatimes.com/news/passenger-vehicle/cars/myanmar-restricts-used-car-imports/56650239
77. Soe Tun, 2017, Automobile Industry in Myanmar, Myanmar Automobile manufacturer & Distributor Association (MAMDA), https://cloudcdn.taiwantradeshows.com.tw/2017/ampa/seminar/AMPA-Seminar-05.pdf
78. October 2017, New rules on imported vehicles coming in 2018, Myanmar Times, https://www.mmtimes.com/news/new-rules-imported-vehicles-coming-2018.html, as accessed on 14 March 2018.
SECTION 5: Setting the terms for used-vehicle export 1. https://ec.europa.eu/clima/sites/clima/files/transport/vehicles/docs/2nd_
hand_cars_en.pdf
2. Ibid.
3. Ibid.
4. https://www.globalfueleconomy.org/media/45362/wp7_regulation_for_2nd-hand_vehicles-lr.pdf
5. Shin-ichi Sakai et al. 2014, An international comparative study of end-of-life vehicle (ELV) recycling systems. Journal of Material Cycles and Waste Management. 16. 1-20. 10.1007/s10163-013-0173-2, https://www.researchgate.net/publication/262919160_An_international_comparative_study_of_end-of-life_vehicle_ELV_recycling_systems (as viewed on 11 April 2018).
6. Jeongsoo Yu et al. 2017, Environmental Impacts of Road Vehicles: Past, Present and Future, Latest trends and new challenges in end-of-life vehicle recycling, http://pubs.rsc.org/en/content/chapter/bk9781782628927-00174/978-1-78262-892-7 as accessed on 11 April 2018.
7. Shin-ichi Sakai et al 2014, An international comparative study of end-of-life vehicle (ELV) recycling systems. Journal of Material Cycles and Waste Management. 16. 1-20. 10.1007/s10163-013-0173-2. https://www.researchgate.net/publication/262919160_An_international_comparative_study_of_end-of-life_vehicle_ELV_recycling_systems, as accessed on April 11 2018.
8. Shin-ichi Sakai et al. 2014, An international comparative study of end-of-life vehicle (ELV) recycling systems, Journal of Material Cycles an Waste Management, February 2014.
9. Ibid.
10. Francisco Posada et al. 2015, Survey of Best Practices in Reducing Emissions through Vehicle Replacement Programs, The International Council on Clean Transportation, https://www.theicct.org/sites/default/files/publications/ICCT_HDVreplacement_bestprac_20150302.pdf, as

126
CLUNKERED
accessed on 10 April 2018.
11. Francisco Prosada, D.V. Wagner, G. Bansal, R. Fernandez, 2015, White Paper, Survey of best practices in reducing emissions through vehicles replacement programme, International Council on Clean Transportation, Washington, mimeo.
12. Ibid.
13. Jevic NZ Ltd 2006, Emissions Tail Pipe Test Trial Final Report, Japan Export Vehicle Inspection Center Company New Zealand Limited, https://www.transport.govt.nz/assets/Import/Documents/JEVIC-Emissions-Trial.pdf
14. UNEP ITC 2017, Background Paper, Used Vehicles Global Overview, https://www.unece.org/fileadmin/DAM/trans/doc/2017/itc/UNEP-ITC_Background_Paper-Used_Vehicle_Global_Overview.pdf as viewed on 11 April 2018.
15. Ibid.
16. Proposed framework for end-of-life vehicle recycling system implementation in Malaysia, 11th Global Conference on Sustainable Manufacturing, 2013, Berlin, Germany, https://depositonce.tu-berlin.de/bitstream/11303/4987/1/azmi_etal.pdf
17. Ibid.
18. Ibid.
19. Website of 3R Corporation, http://www.3-r.co.jp/contents/en/parts.html , as accessed on 16 April 2018.
20. Germany Environmental Protection Agency 2014, Product Stewardship and Waste Management: Scrap Cars, https://www.umweltbundesamt.de/en/topics/waste-resources/product-stewardship-waste-management/scrap-cars#textpart-1 as accessed on 16 April 2018.
21. Michael P. Walsh 2009, Car Lines, 2 April 2009, http://www.walshcarlines.com/pdf/nsl20092.pdf
22. UBA, Germany https://www.umweltbundesamt.de/en/topics/waste-resources/product-stewardship-waste-management/scrap-cars#textpart-3
23. Carter Dougherty (2009-08-07). ‘Driving Out of Germany, to Pollute Another Day’. The New York Times as viewed on 9 August 2009.
24. Ibid.
25. Michael Saidani, Bernard Yannou, Yann Leroy, François Cluzel, 2017 Heavy vehicles on the road towards the circular economy: Analysis and comparison with the automotive industry. Resources, Conservation and Recycling, Elsevier, 2017. HAL Id: hal-01571577 https://hal.archives-ouvertes.fr/hal-01571577 Submitted on 2 August 2017.
26. Lennart Erlandsson, 2018, Formerly with AVL, Sweden.
27. Ted Gayer and Emily Parker 2013, Cash for Clunkers: An Evaluation of the Car Allowance Rebate System, https://www.brookings.edu/wp-content/uploads/2016/06/cash_for_clunkers_evaluation_paper_gayer.pdf
28. Ibid.
29. Ibid.
30. Ibid.

127
CLUNKERED
31. Ibid.
32. Cash For Clunkers https://www.investopedia.com/terms/c/cash-for-clunkers.asp#ixzz5CGKSomyW
33. Ted Gayer and Emily Parker 2013, Cash for Clunkers: An Evaluation of the Car Allowance Rebate System, https://www.brookings.edu/wp-content/uploads/2016/06/cash_for_clunkers_evaluation_paper_gayer.pdf
34. Ministry of Environment and Forests and Climate Change and Central Pollution Control Board 2016, Guidelines for Environmentally sound management of end of life vehicles (ELVs), Government of India.
35. S.K. Ghosh 2017, Country Chapter State of the 3Rs in Asia and the Pacific: The Republic of India, United Nations Centre for Regional Development (UNCRD), http://www.uncrd.or.jp/content/documents/5688[1121]%20India.pdf, as accessed on 12 April 2018.
36. Niti Aayog 2017, Strategy Paper on Resource Efficiency June 2017, http://niti.gov.in/writereaddata/files/document_publication/Strategy%20Paper%20on%20Resource%20Efficiency.pdf (as viewed on 12 April 2018).
37. Ibid.
38. Report on End-of-Life Vehicles Worldwide, Automobile Recycler’s Association. Accesses from http://a-r-a.org/automotive-recycling-magazine/report-on-end-of-life-vehicles-worldwide/
39. Chintan, GIZ and CPCB, 2015, Analysis of End of Life Vehicles (ELVs) Sector in India, mimeo and Story of a Dying Car in India, 2013.
40. https://www.iea.org/publications/freepublications/publication/TheFutureofTrucksImplicationsforEnergyandtheEnvironment.pdf
41. 3R Policies, End of Life Recycling Law, http://www.meti.go.jp/policy/recycle/main/english/law/end.html, as viewed on 2 May 2018.
42. Michael Saidani, Bernard Yannou, Yann Leroy, François Cluzel, 2017 Heavy vehicles on the road towards the circular economy: Analysis and comparison with the automotive industry. Resources, Conservation and Recycling, Elsevier, 2017. HAL Id: hal-01571577 https://hal.archives-ouvertes.fr/hal-01571577 (submitted on 2 August 2017).
43. Ibid.
44. Ibid.
45. Ibid.
46. Ibid.
SECTION 6: Next steps and the global mechanism1. https://www.unece.org/fileadmin/DAM/trans/doc/2017/itc/UNEP-ITC_
Conference_on_Used_Vehicles_Concept_Note_v.2.1.pdf
2. Central Pollution Control Board, Chintan, GIZ New Delhi, India 2015, Analysis of End of Life Vehicles ( ELVs ) Sector in India.
3. Rob de Jong, UNEP, Promoting Cleaner Used Vehicles in Africa, https://wedocs.unep.org/bitstream/handle/20.500.11822/25233/PromotingCleanerUsedVehicles.pdf?sequence=9&isAllowed=y

128
CLUNKERED
4. US EPA’s Green Vehicle Guide https://www.epa.gov/greenvehicles
5. US Government’s National Motor Vehicle Title Information System (NMVTIS) https://www.vehiclehistory.gov/
6. Japan Used Motor Vehicle Exporters Association, http://stock.jumvea.or.jp/stock-detail/japan-used-subaru-impreza-sedan-car-2937763.html
7. Jeff Horowitz, Danielle Nesmith, and Mitchell Semanik 2016, Working paper ID-044 of Office of Industries of United States International Trade Commission Examining Barriers to Trade in Used Vehicles, https://www.usitc.gov/publications/332/used_vehicle_wp_id-44_final_web_0.pdf
8. https://www.globalfueleconomy.org/media/45362/wp7_regulation_for_2nd-hand_vehicles-lr.pdf
9. Ministry of Environment and Forest and Climate Change and Central Pollution Control Board 2016, Guidelines for Environmentally sound management of end of life vehicles (ELVs), Government of India.
10. Ibid.
11. Jorge Macias et al. 2013, Policy Handbook for the Regulation of Imported Second-Hand Vehicles, Mexico, Global Fuel Economy Initiative
12. Ibid.
13. G20 insights policy brief, 24 May 2017 (Last updated: 16 October 2017) http://www.g20-insights.org/policy_briefs/contribution-g20-governments-can-make-support-circular-economy/The contribution G20 governments can make to support the circular economy
14. Ibid.
15. G20 insights policy brief, 24 May 2017 (last updated: 16 October 2017), http://www.g20-insights.org/policy_briefs/contribution-g20-governments-can-make-support-circular-economy/The contribution G20 governments can make to support the circular economy.


Centre for Science and Environment41, Tughlakabad Institutional Area, New Delhi 110 062 Phones: 91-11-40616000Fax: 91-11-29955879 E-mail: [email protected] Website: www.cseindia.org